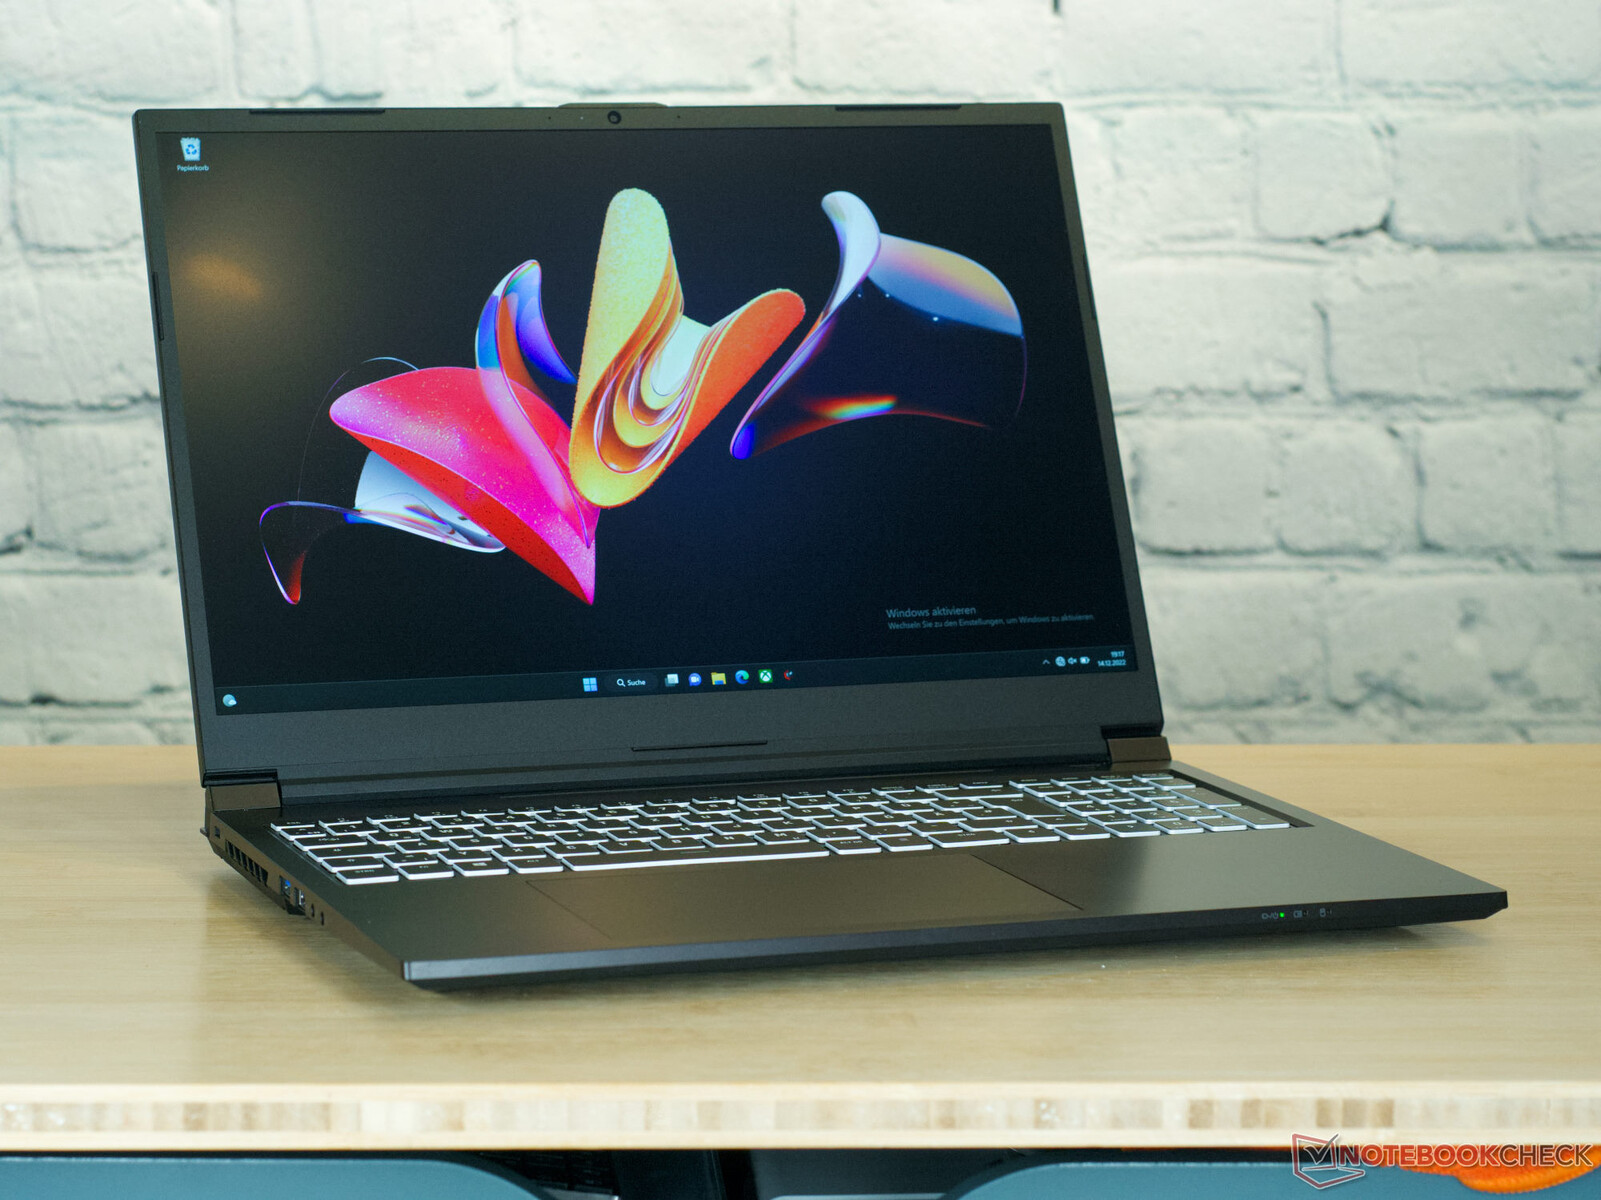
Test du Schenker XMG Focus 16 : Une machine de jeu assemblée en Allemagne
Les ordinateurs portables de Leipzig sont disponibles auprès du fabricant allemand d'ordinateurs, Schenker. Avec le XMG Focus 16, nous avons un ordinateur portable de jeu de milieu de gamme avec un écran de 16 pouces. Cet ordinateur portable est fiable, solide comme le roc, et possède le design caractéristique de Schenker. L'appareil a une apparence un peu carrée et non conventionnelle sans être trop voyant. Schenker a équipé le XMG Focus 16 d'un matériel puissant et d'un écran au format 16:10.
Nos concurrents ont été sélectionnés principalement dans la catégorie de prix des ordinateurs portables de jeu de milieu de gamme, tels que le Dell G16 7620 ou leLenovo Legion 5 Pro. Cependant, un ordinateur portable multimédia fin avec des spécifications similaires, leAsus Zenbook Pro 16Xest considérablement plus fin que les ordinateurs portables de jeu typiques, mais offre des niveaux de performance tout aussi élevés.
Comparaison avec les concurrents potentiels
Note | Date | Modèle | Poids | Épaisseur | Taille | Résolution | Prix |
|---|---|---|---|---|---|---|---|
| 87 % v7 (old) | 01/23 | Schenker XMG Focus 16 (i7-12700H, RTX 3060) i7-12700H, GeForce RTX 3060 Laptop GPU | 2.2 kg | 24.3 mm | 16.00" | 2560x1600 | |
| 88.4 % v7 (old) | 12/22 | Asus ZenBook Pro 16X OLED UX7602ZM-ME115W i9-12900H, GeForce RTX 3060 Laptop GPU | 2.4 kg | 19.5 mm | 16.00" | 3840x2400 | |
| 86.1 % v7 (old) | 10/22 | Dell G16 7620 i7-12700H, GeForce RTX 3060 Laptop GPU | 2.6 kg | 26.9 mm | 16.00" | 2560x1600 | |
| 89.5 % v7 (old) | 08/22 | Asus ROG Flow X16 GV601RW-M5082W R9 6900HS, GeForce RTX 3070 Ti Laptop GPU | 2.1 kg | 19.4 mm | 16.10" | 2560x1600 | |
| 88.7 % v7 (old) | 12/22 | Lenovo ThinkPad X1 Extreme G5-21DE003RGE i7-12700H, GeForce RTX 3060 Laptop GPU | 2.1 kg | 17.9 mm | 16.00" | 3840x2400 | |
| 87.9 % v7 (old) | 11/22 | Lenovo Legion Slim 7-16IAH 82TF004YGE i7-12700H, GeForce RTX 3060 Laptop GPU | 2.2 kg | 16.9 mm | 16.00" | 2560x1600 | |
| 86.6 % v7 (old) | 07/22 | Lenovo Legion 5 Pro 16IAH7H i7-12700H, GeForce RTX 3060 Laptop GPU | 2.6 kg | 27 mm | 16.00" | 2560x1600 |
Boîtier - noir, carré et beaucoup d'aluminium
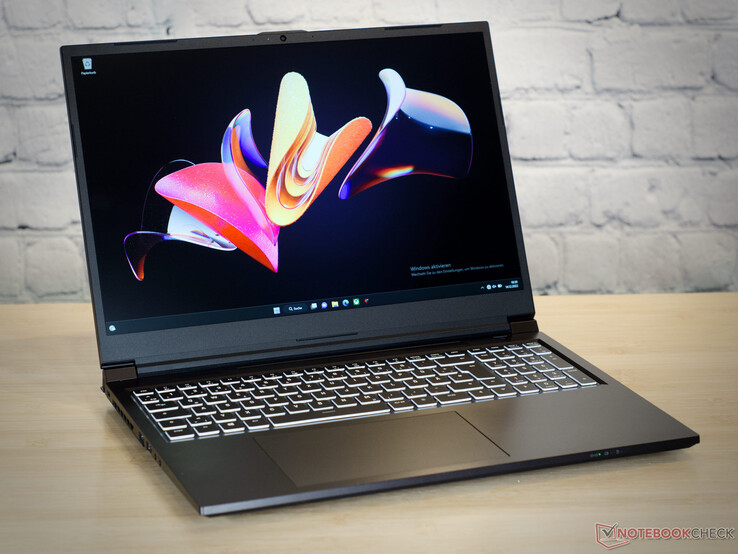
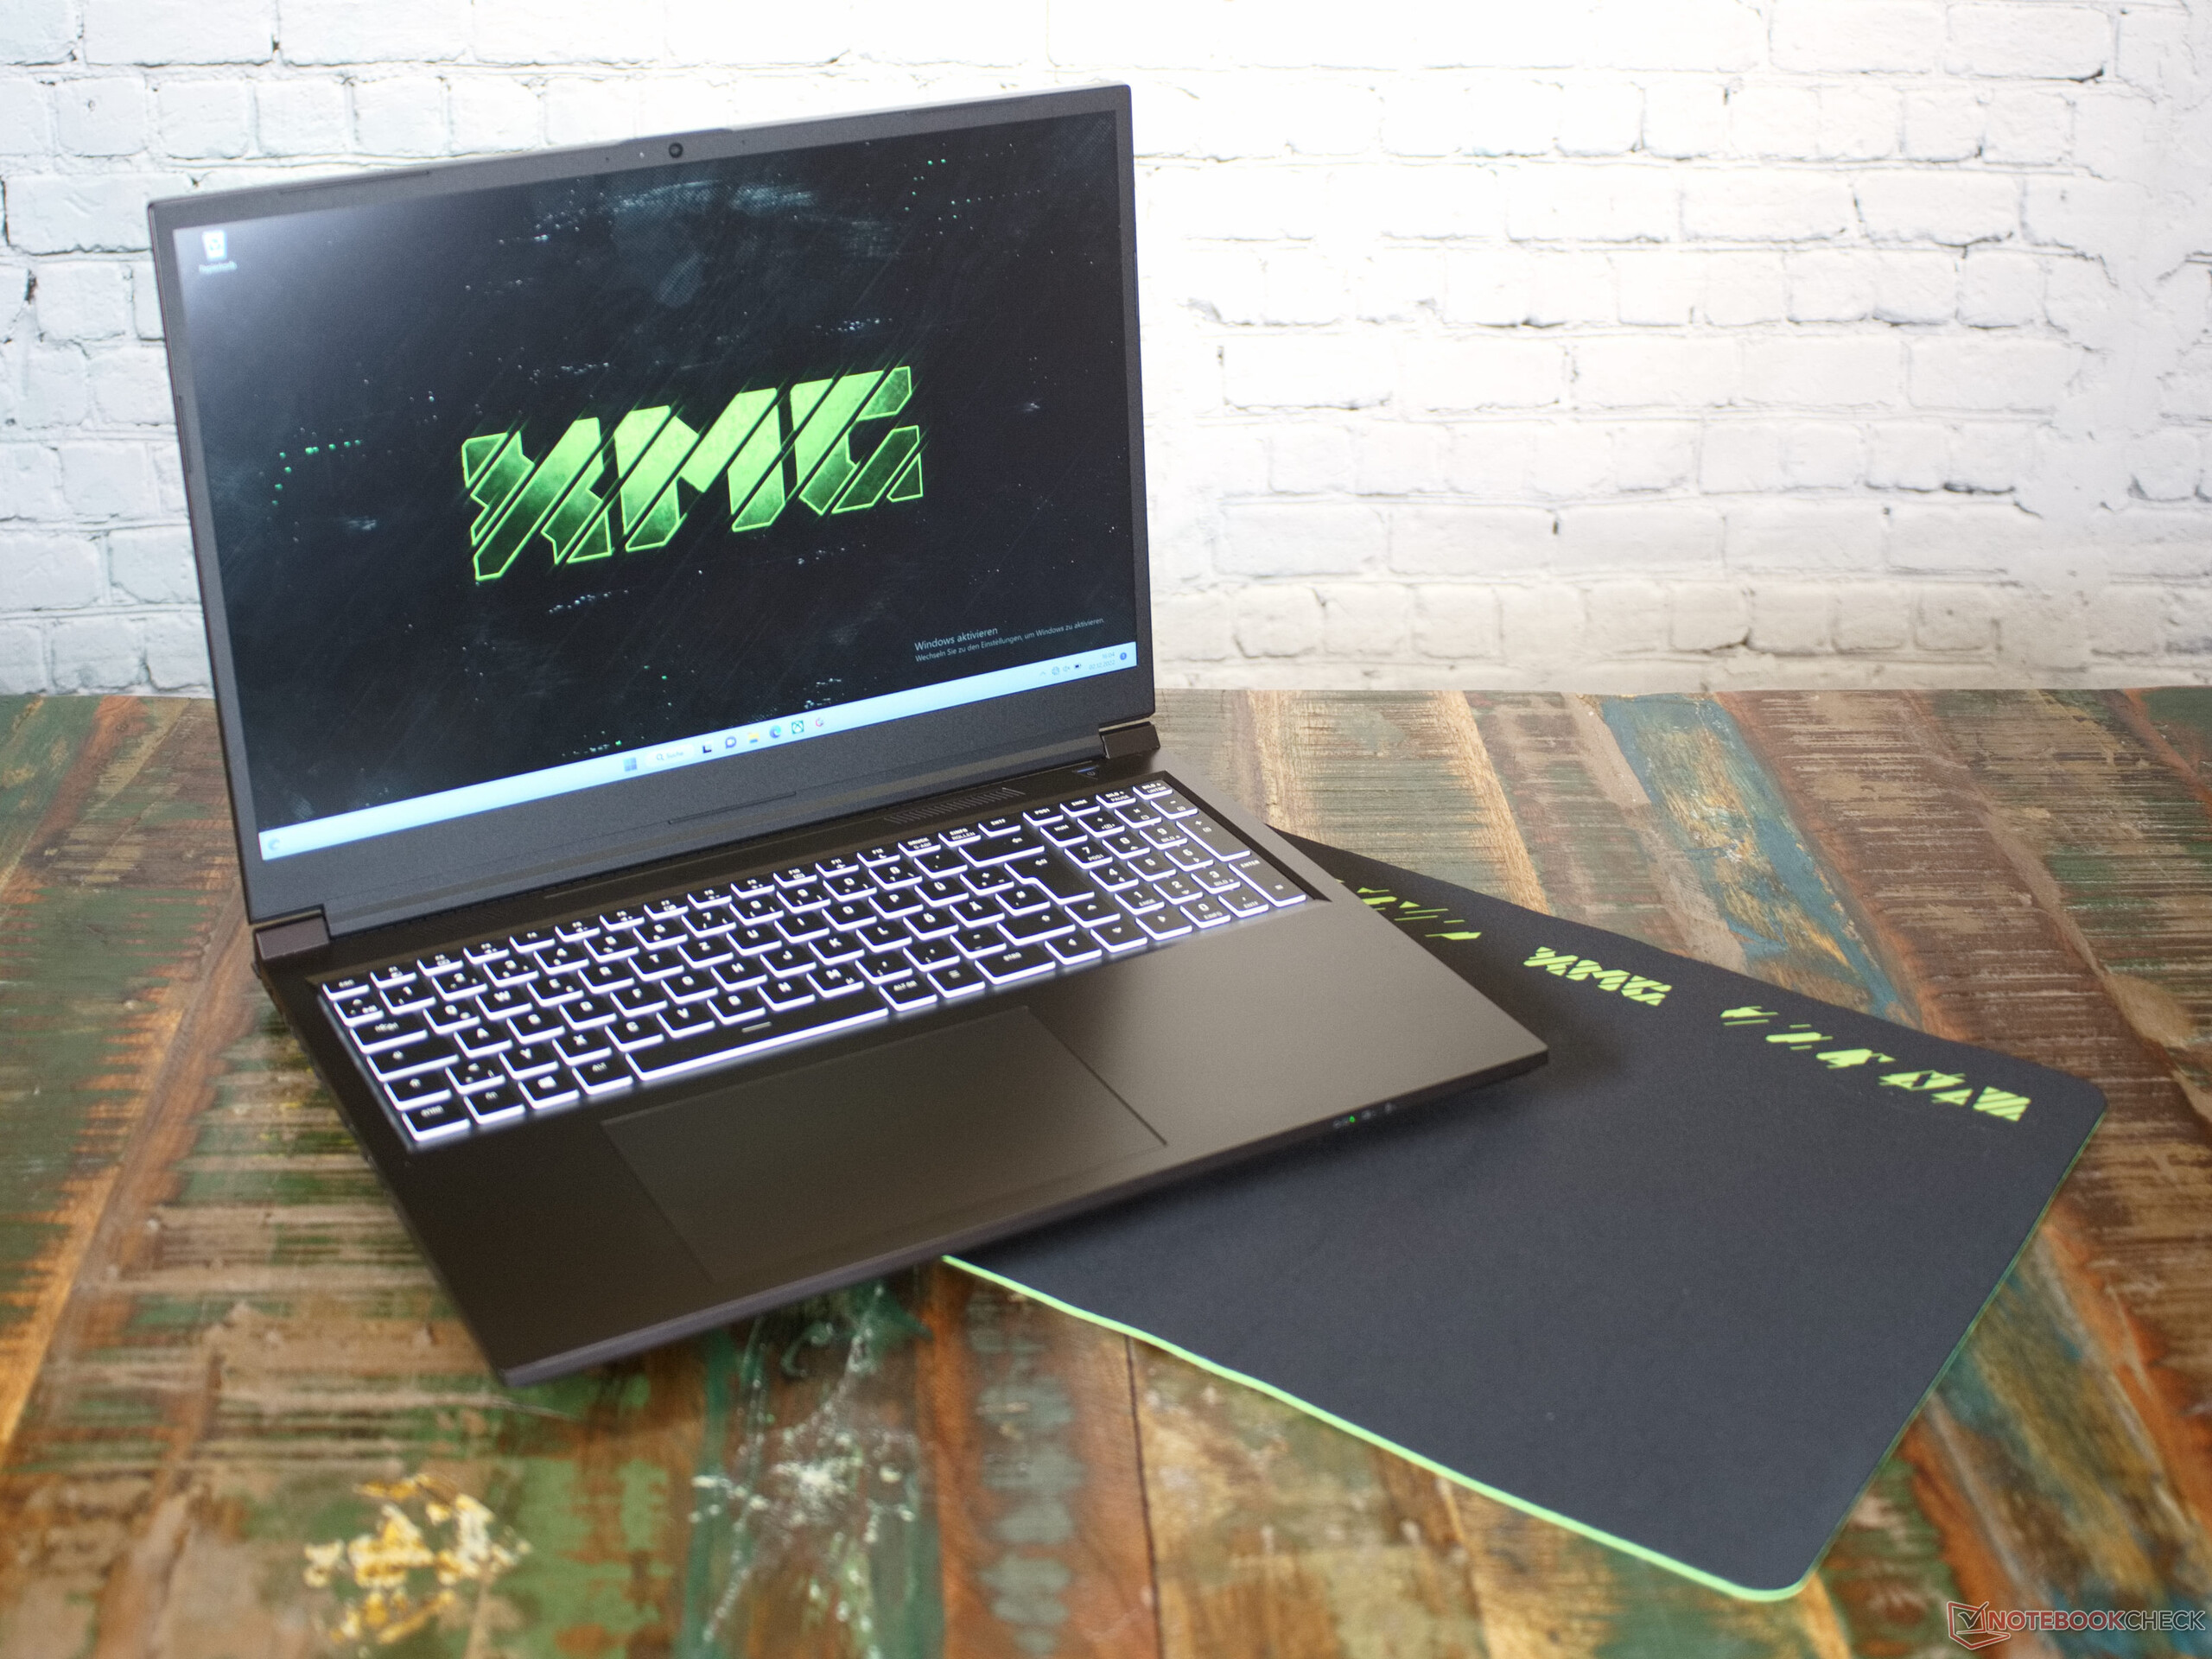
Le XMG Schenker Focus 16 est noir et blanc et est basé sur un barebone NP60PNP de Clevo. Le couvercle de l'écran - qui peut être ouvert à un angle de 130 ° - et le haut de la base sont en aluminium revêtu de noir, contrairement au couvercle de la base qui est en plastique noir. En ouvrant l'appareil, vous trouverez le type de clavier que l'on trouve généralement dans de nombreux ordinateurs portables Schenker et Clevo. Les touches individuelles ont des bords blancs et des surfaces de frappe noires. Comme la quasi-totalité des ordinateurs portables Schenker, le XMG Focus 16 a un design assez basique, mais il est de bonne qualité. Nous avons entre les mains un appareil confortable qui ne montre aucun signe de grincement et qui est doté d'une charnière stable.
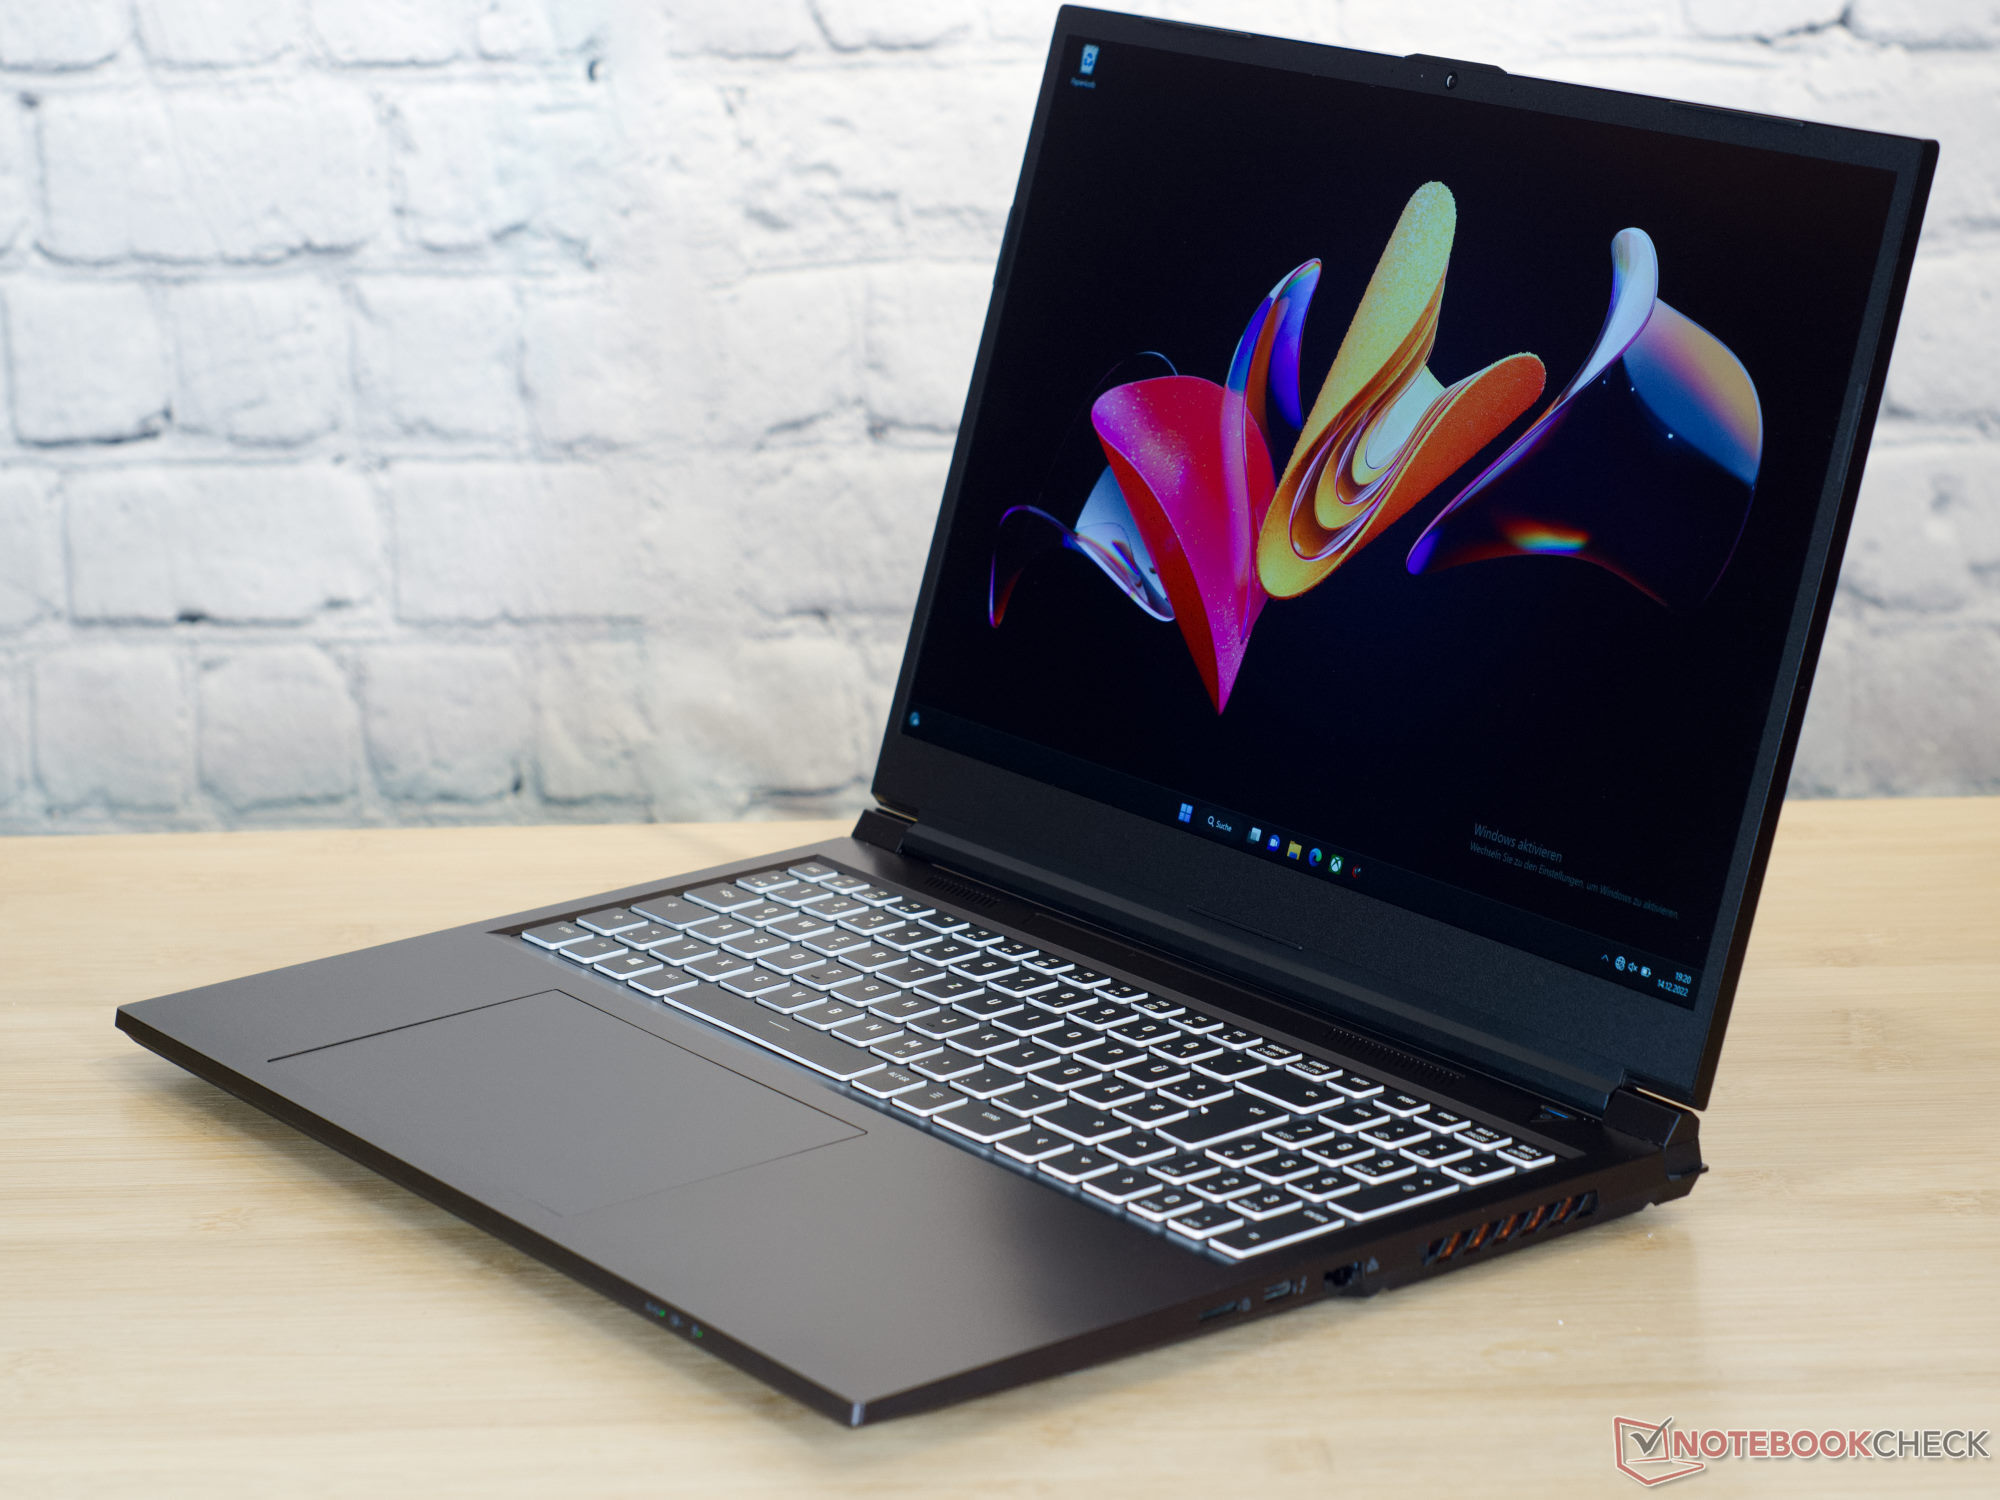

Avec un poids de 2,3 kg et une épaisseur de 2,4 cm, l'ordinateur portable de jeu ne se distingue pas de ses concurrents directs.
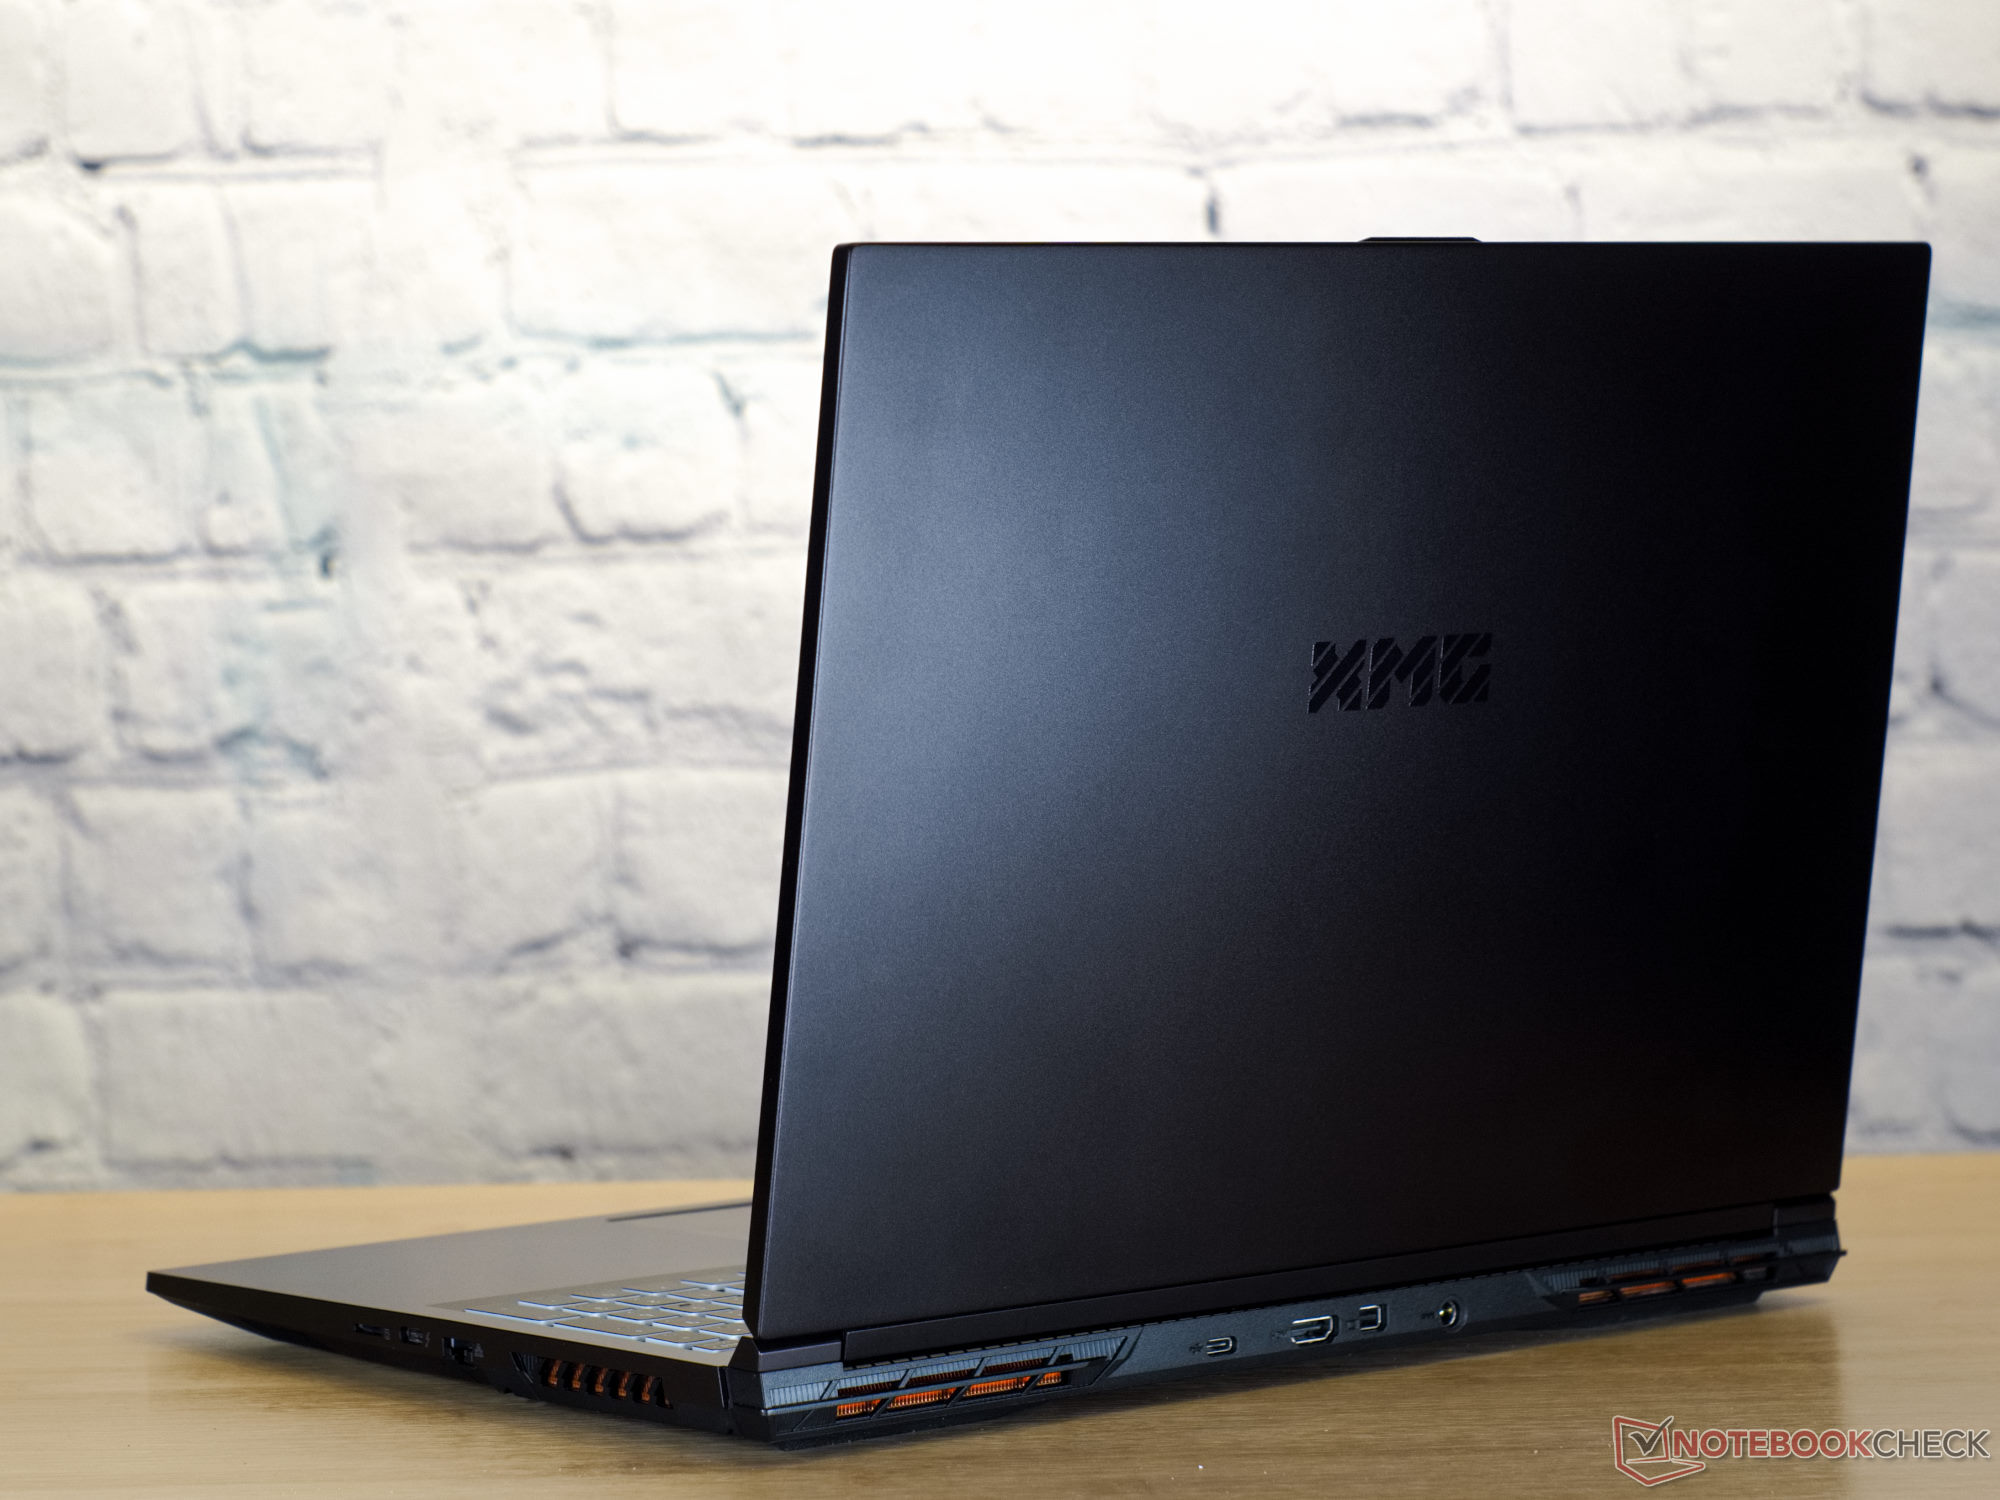
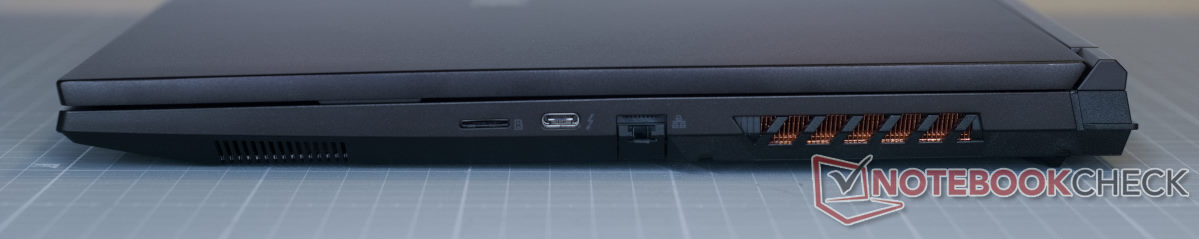
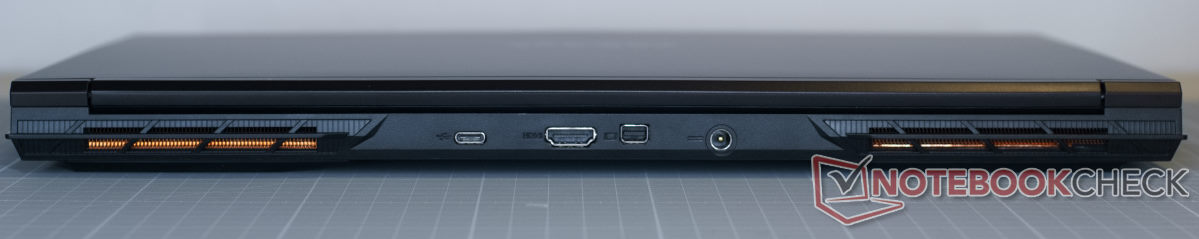
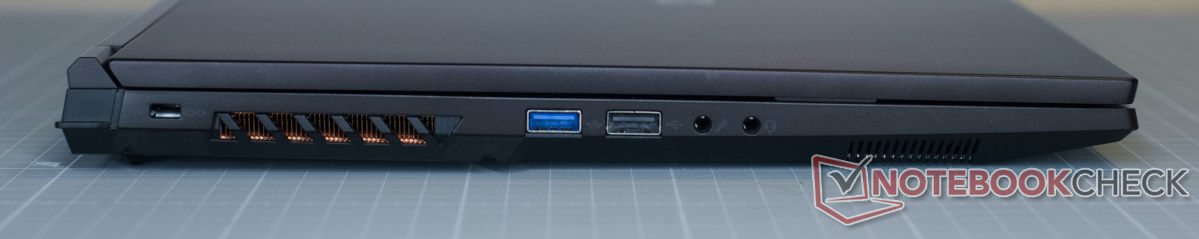
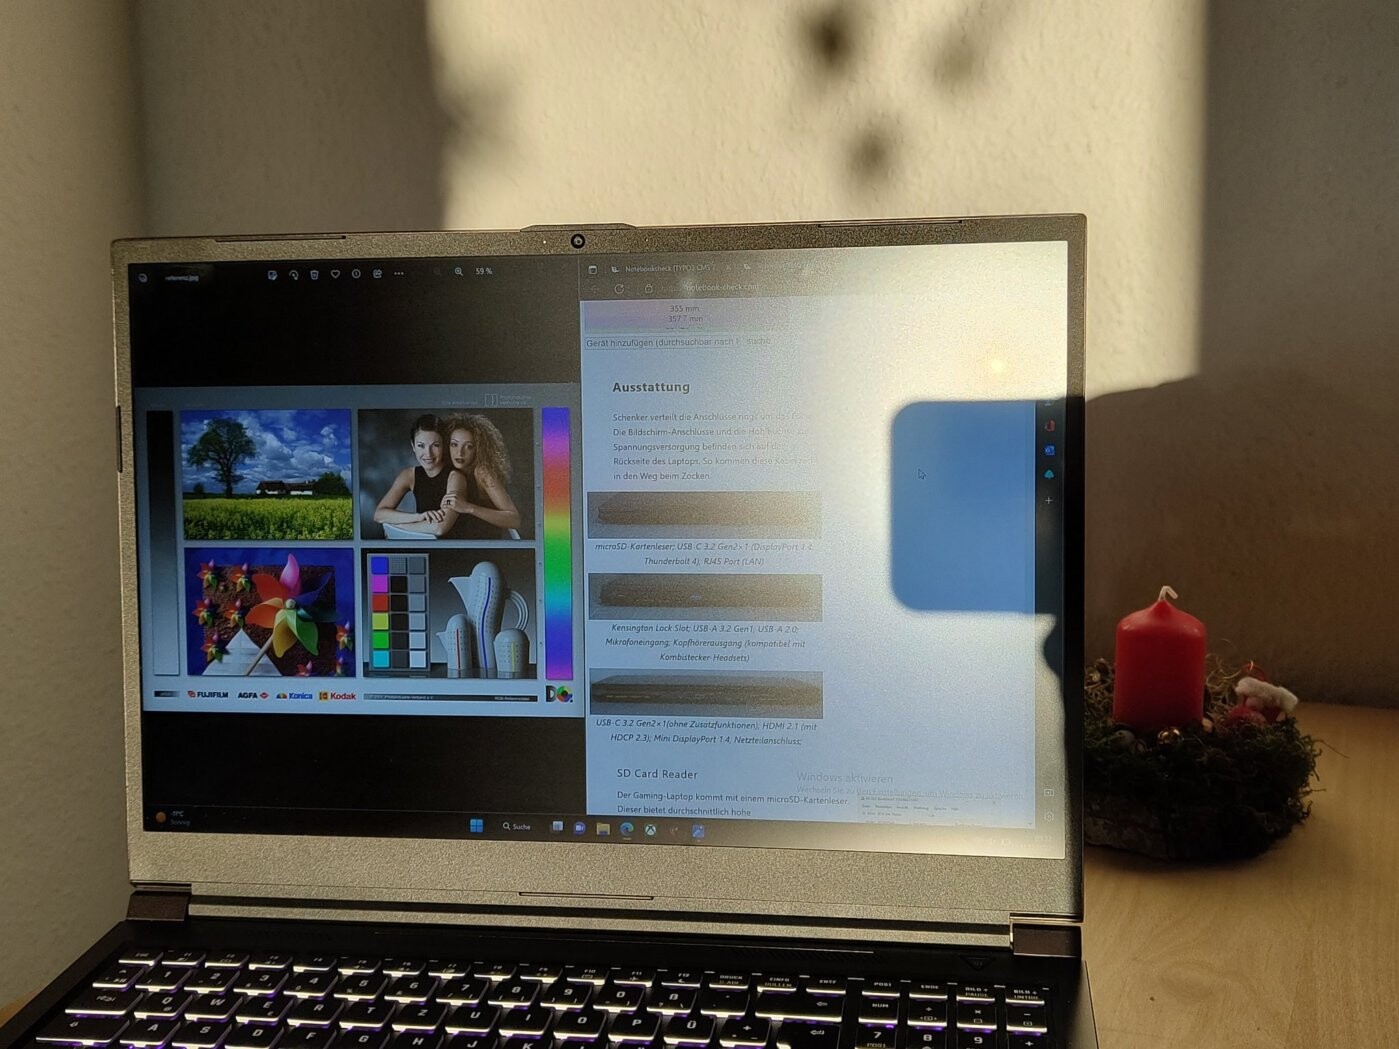
Caractéristiques - nombreux ports, vitesses de transfert élevées et WiFi 6E
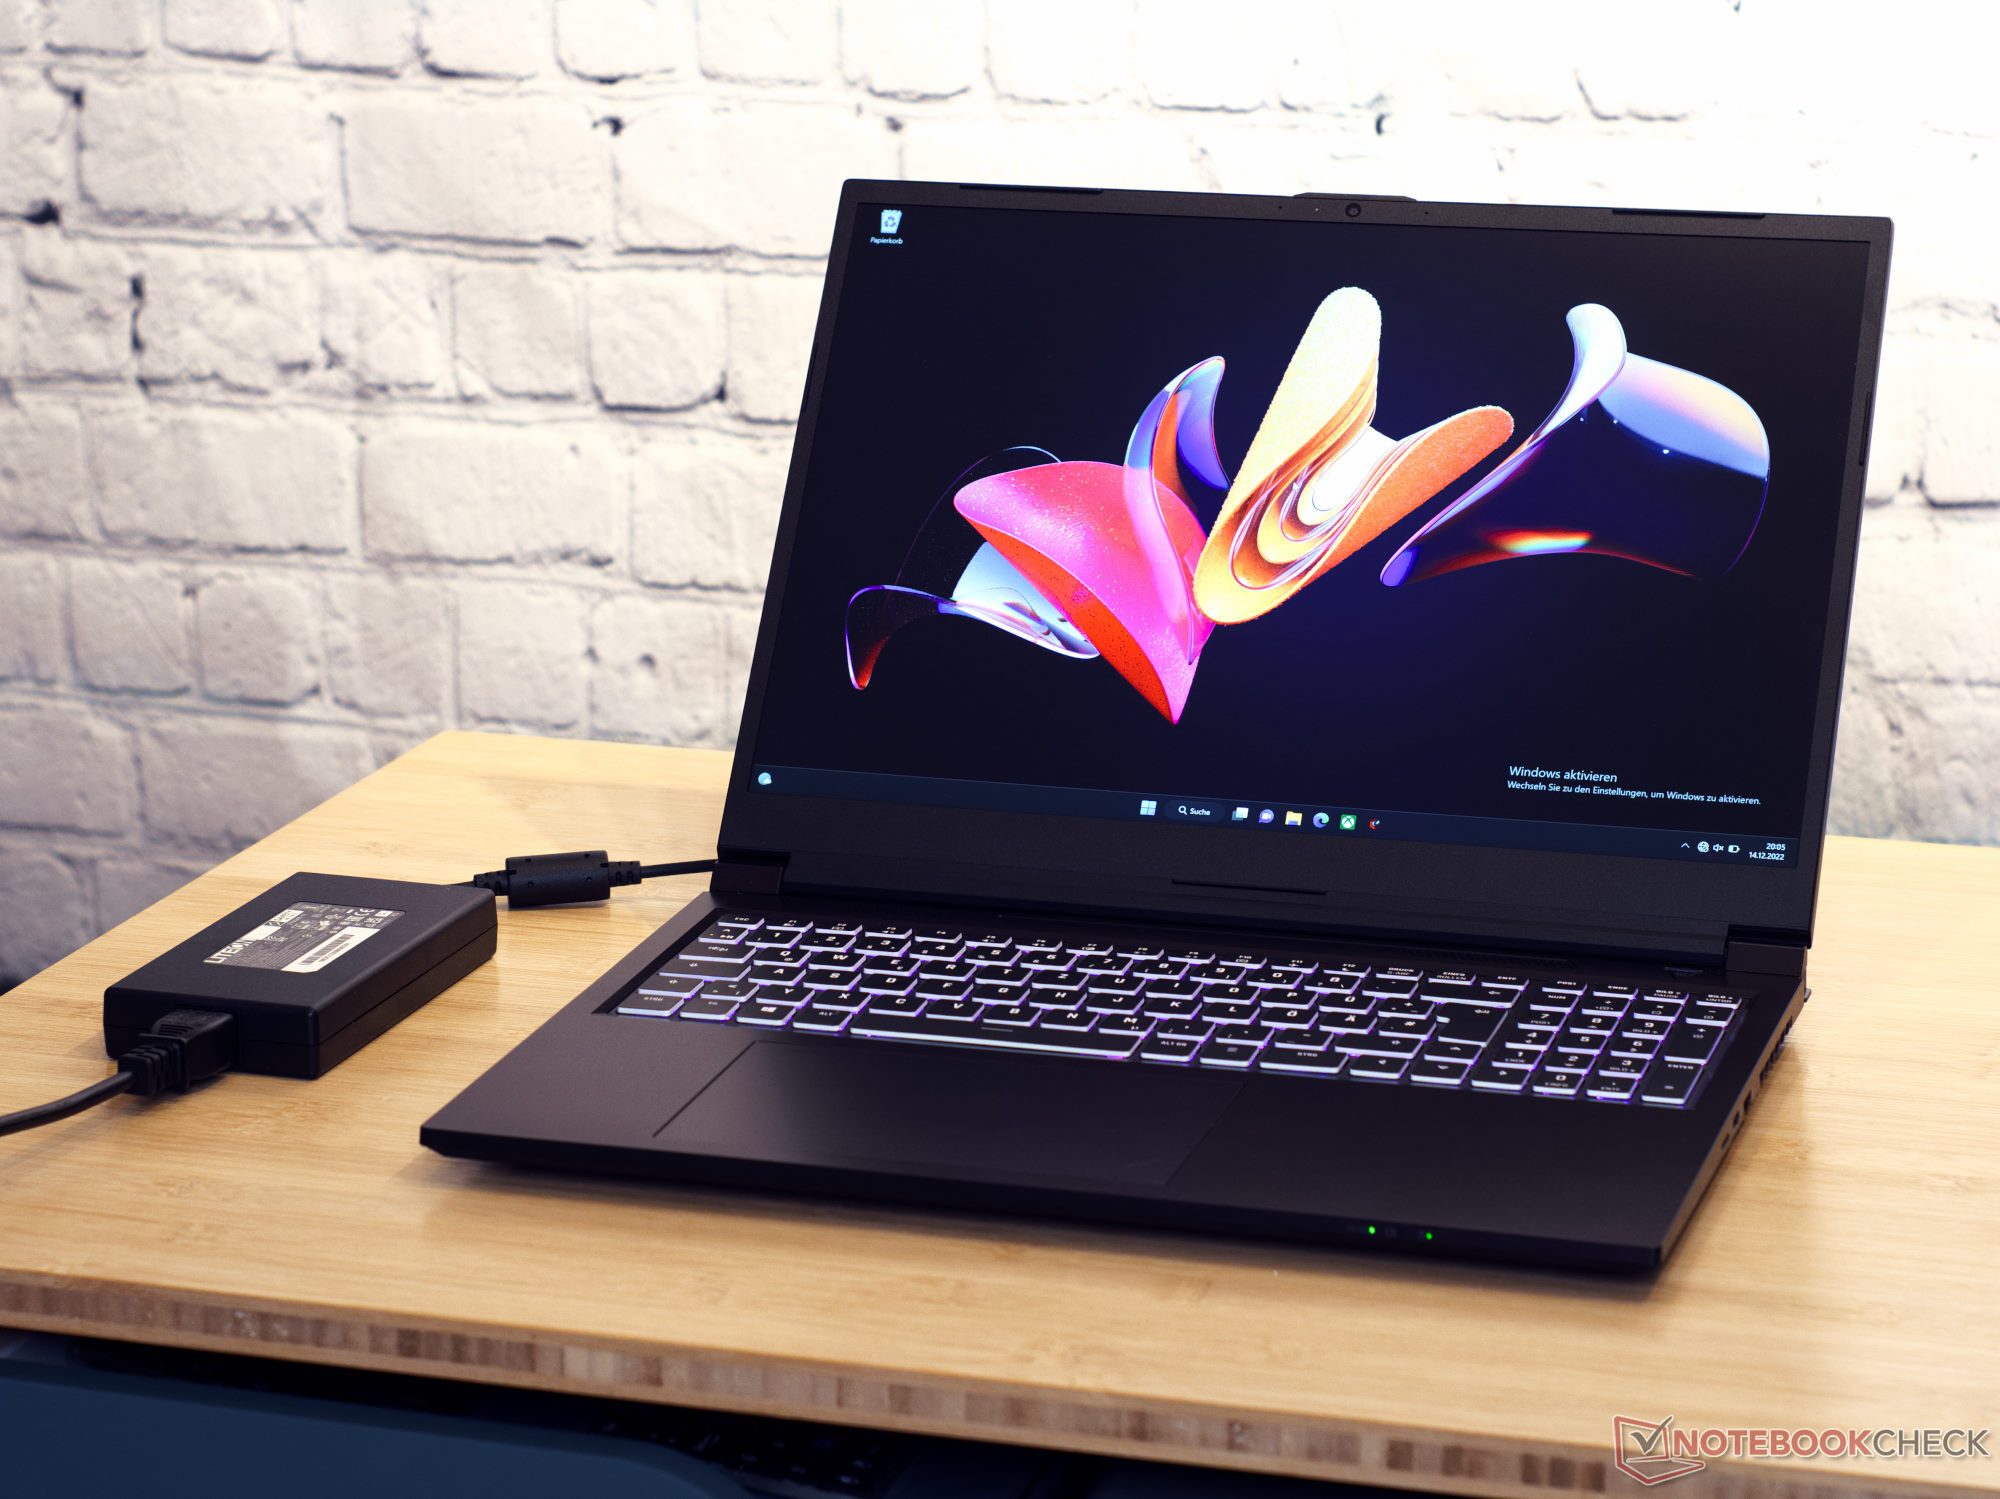
Schenker a placé les ports à divers endroits autour du Focus. Les ports d'affichage, la prise d'alimentation électrique ainsi qu'un port USB-C se trouvent à l'arrière de l'ordinateur portable. Cela permet de s'assurer que les câbles restent à l'écart lorsque vous jouez.
Lecteur de carte SD
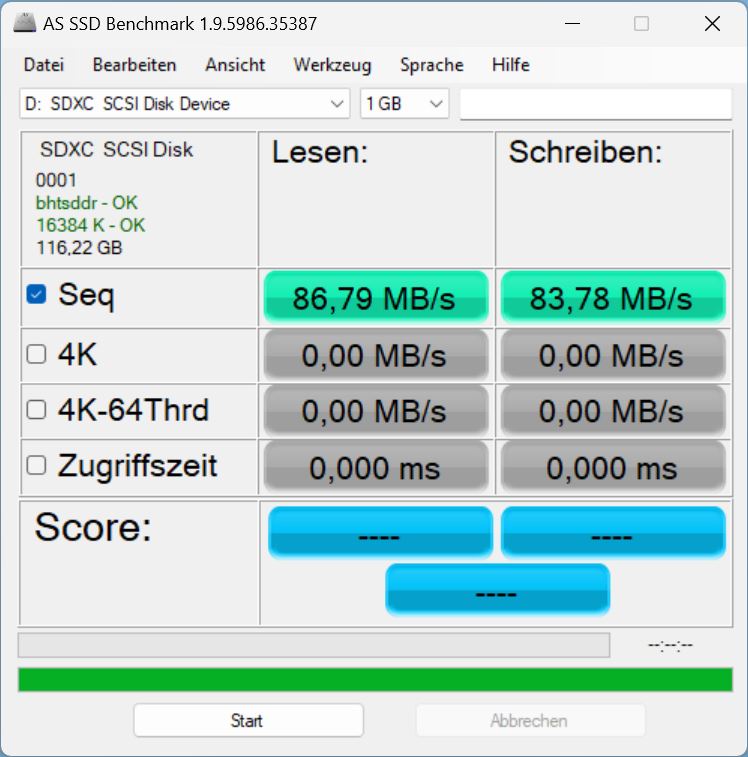
L'ordinateur portable de jeu est livré avec un lecteur de carte microSD.
En moyenne, celui-ci offre des vitesses de transfert élevées pour les connexions USB-3.0 au matériel. La connexion à notre AV PRO microSD 128 GB V60pourrait être plus rapide - ce qui est démontré par l'écran de lAsus Rog Flow.
| SD Card Reader | |
| average JPG Copy Test (av. of 3 runs) | |
| Asus ROG Flow X16 GV601RW-M5082W (AV Pro SD microSD 128 GB V60) | |
| Moyenne de la classe Gaming (20.9 - 210, n=55, 2 dernières années) | |
| Schenker XMG Focus 16 (i7-12700H, RTX 3060) (AV Pro SD microSD 128 GB V60) | |
| Asus ZenBook Pro 16X OLED UX7602ZM-ME115W (AV Pro SD microSD 128 GB V60) | |
| Lenovo ThinkPad X1 Extreme G5-21DE003RGE (AV Pro V60) | |
| Lenovo Legion Slim 7-16IAH 82TF004YGE | |
| maximum AS SSD Seq Read Test (1GB) | |
| Asus ROG Flow X16 GV601RW-M5082W (AV Pro SD microSD 128 GB V60) | |
| Moyenne de la classe Gaming (25.5 - 261, n=52, 2 dernières années) | |
| Lenovo Legion Slim 7-16IAH 82TF004YGE | |
| Schenker XMG Focus 16 (i7-12700H, RTX 3060) (AV Pro SD microSD 128 GB V60) | |
| Asus ZenBook Pro 16X OLED UX7602ZM-ME115W (AV Pro SD microSD 128 GB V60) | |
| Lenovo ThinkPad X1 Extreme G5-21DE003RGE (AV Pro V60) | |
Communication
La connexion WiFi est supérieure à la moyenne en termes de vitesse et de stabilité. Le module LAN Intel X211 montre ici tout son potentiel.
Webcam
Une webcam 720p typique se trouve à l'intérieur de l'ordinateur portable Schenker. Tout au plus, nous n'avons pu déterminer que des écarts de couleur relativement faibles. Sinon, la qualité d'image de la webcam est d'un niveau typique.


 GeForce RTX 3060 Laptop GPU, i7-12700H, Samsung SSD 980 Pro 1TB MZ-V8P1T0BW")
 GeForce RTX 3060 Laptop GPU, i7-12700H, Samsung SSD 980 Pro 1TB MZ-V8P1T0BW")
Sécurité
Le Schenker XMG Focus 16 possède une fente de sécurité Kensington. Sinon, toutes les normes sont respectées. TPM 2.0 (via Intel PTT) est à bord.
Extras
Schenker fournit une documentation complète avec tous ses ordinateurs portables. Dans la boîte, nous avons trouvé un CD avec des pilotes, une clé USB avec Windows préconfiguré ainsi qu'un grand tapis de souris avec le logo XMG.
Service
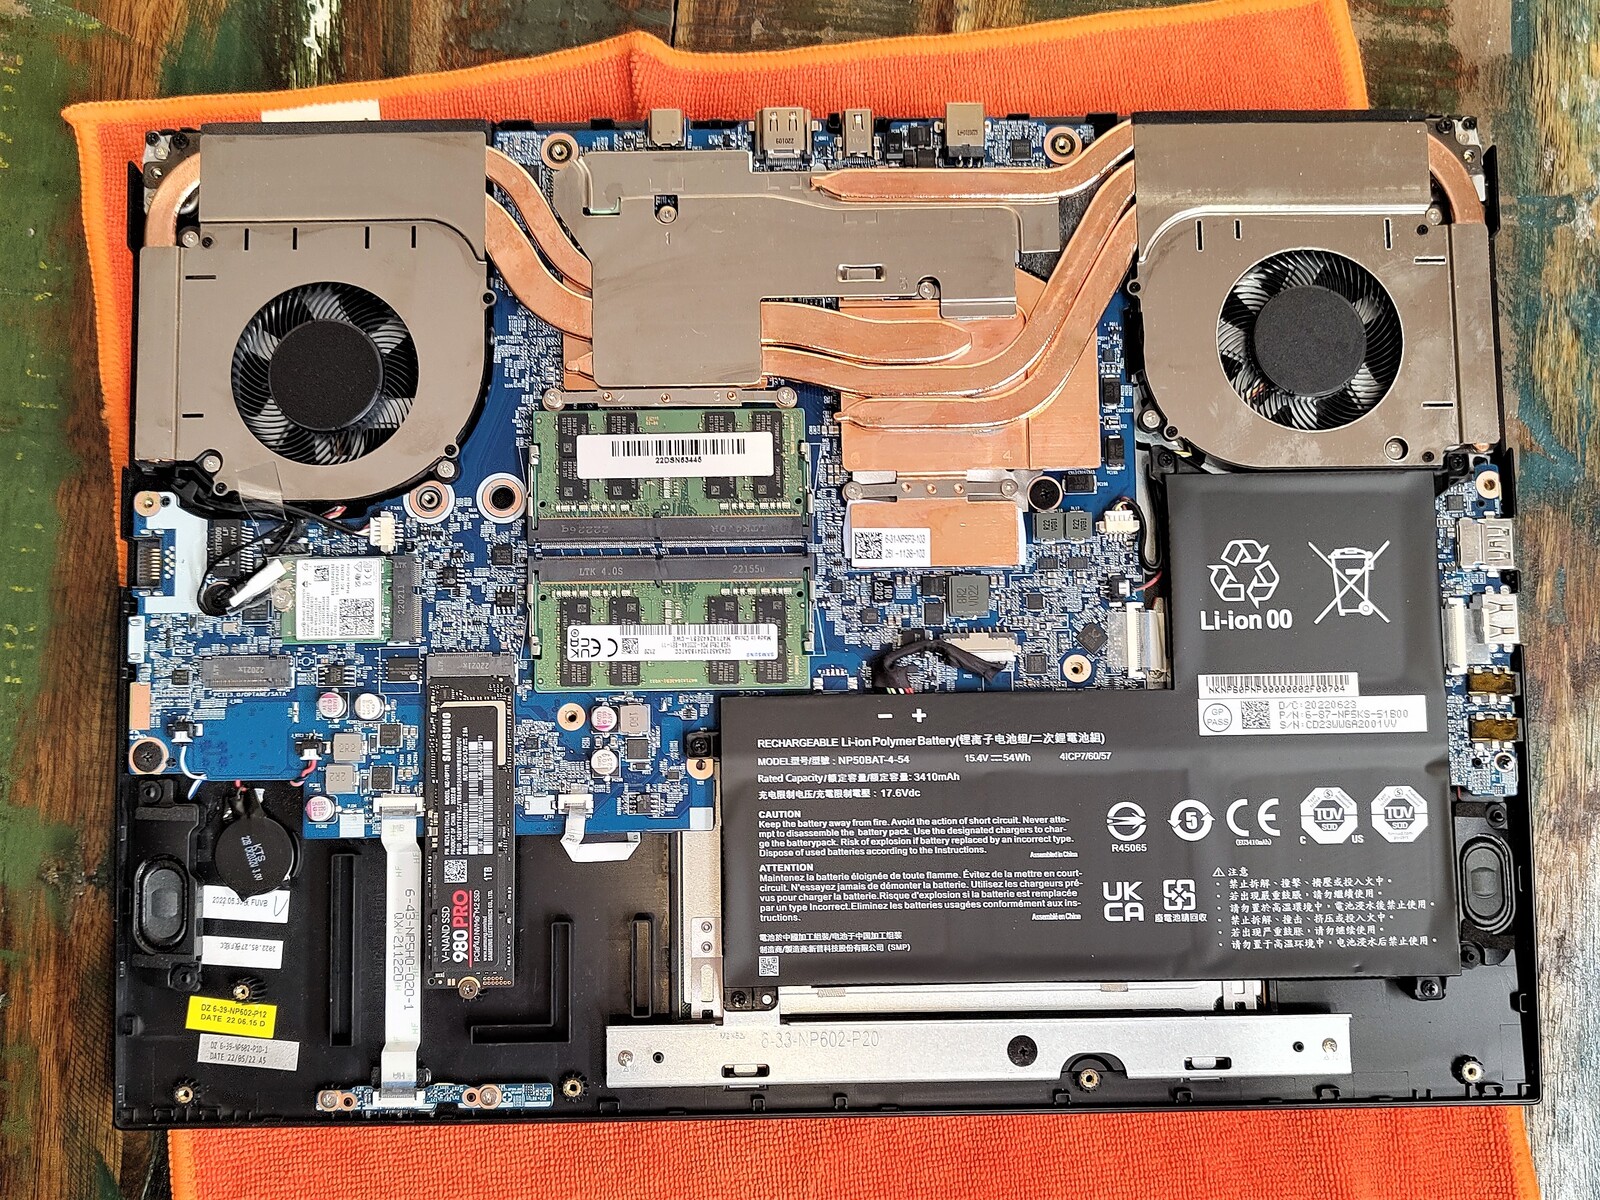
Treize vis cruciformes maintiennent le couvercle de la base fermement en place. Une fois ces vis retirées, le couvercle peut être facilement soulevé. À l'intérieur de l'ordinateur portable, nous trouvons deux emplacements de RAM (déjà occupés) et deux emplacements M.2 (dont un occupé). Toutes les autres pièces sont vissées mais pas collées.
Garantie
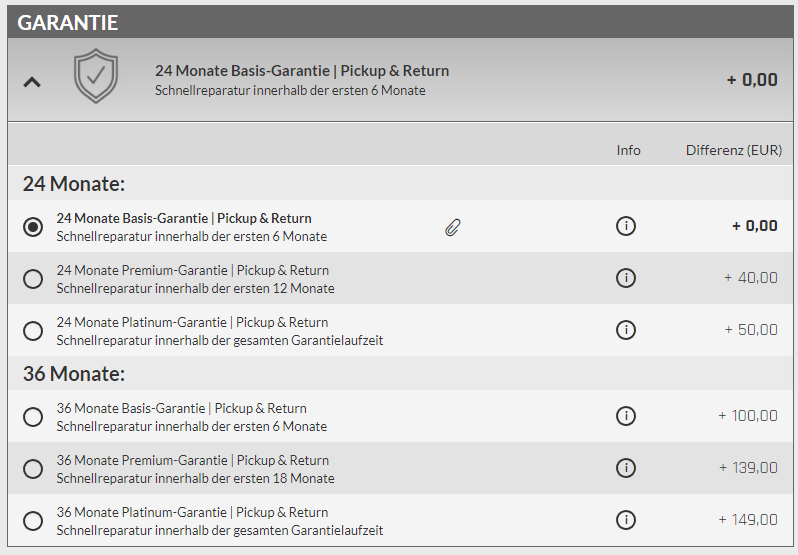
Les services de garantie fournis par Schenker dépendent des choix individuels effectués lors de l'achat de l'appareil. La garantie de base est de 24 mois et comprend à la fois un service d'enlèvement et de retour et un service de réparation rapide pendant les six premiers mois.
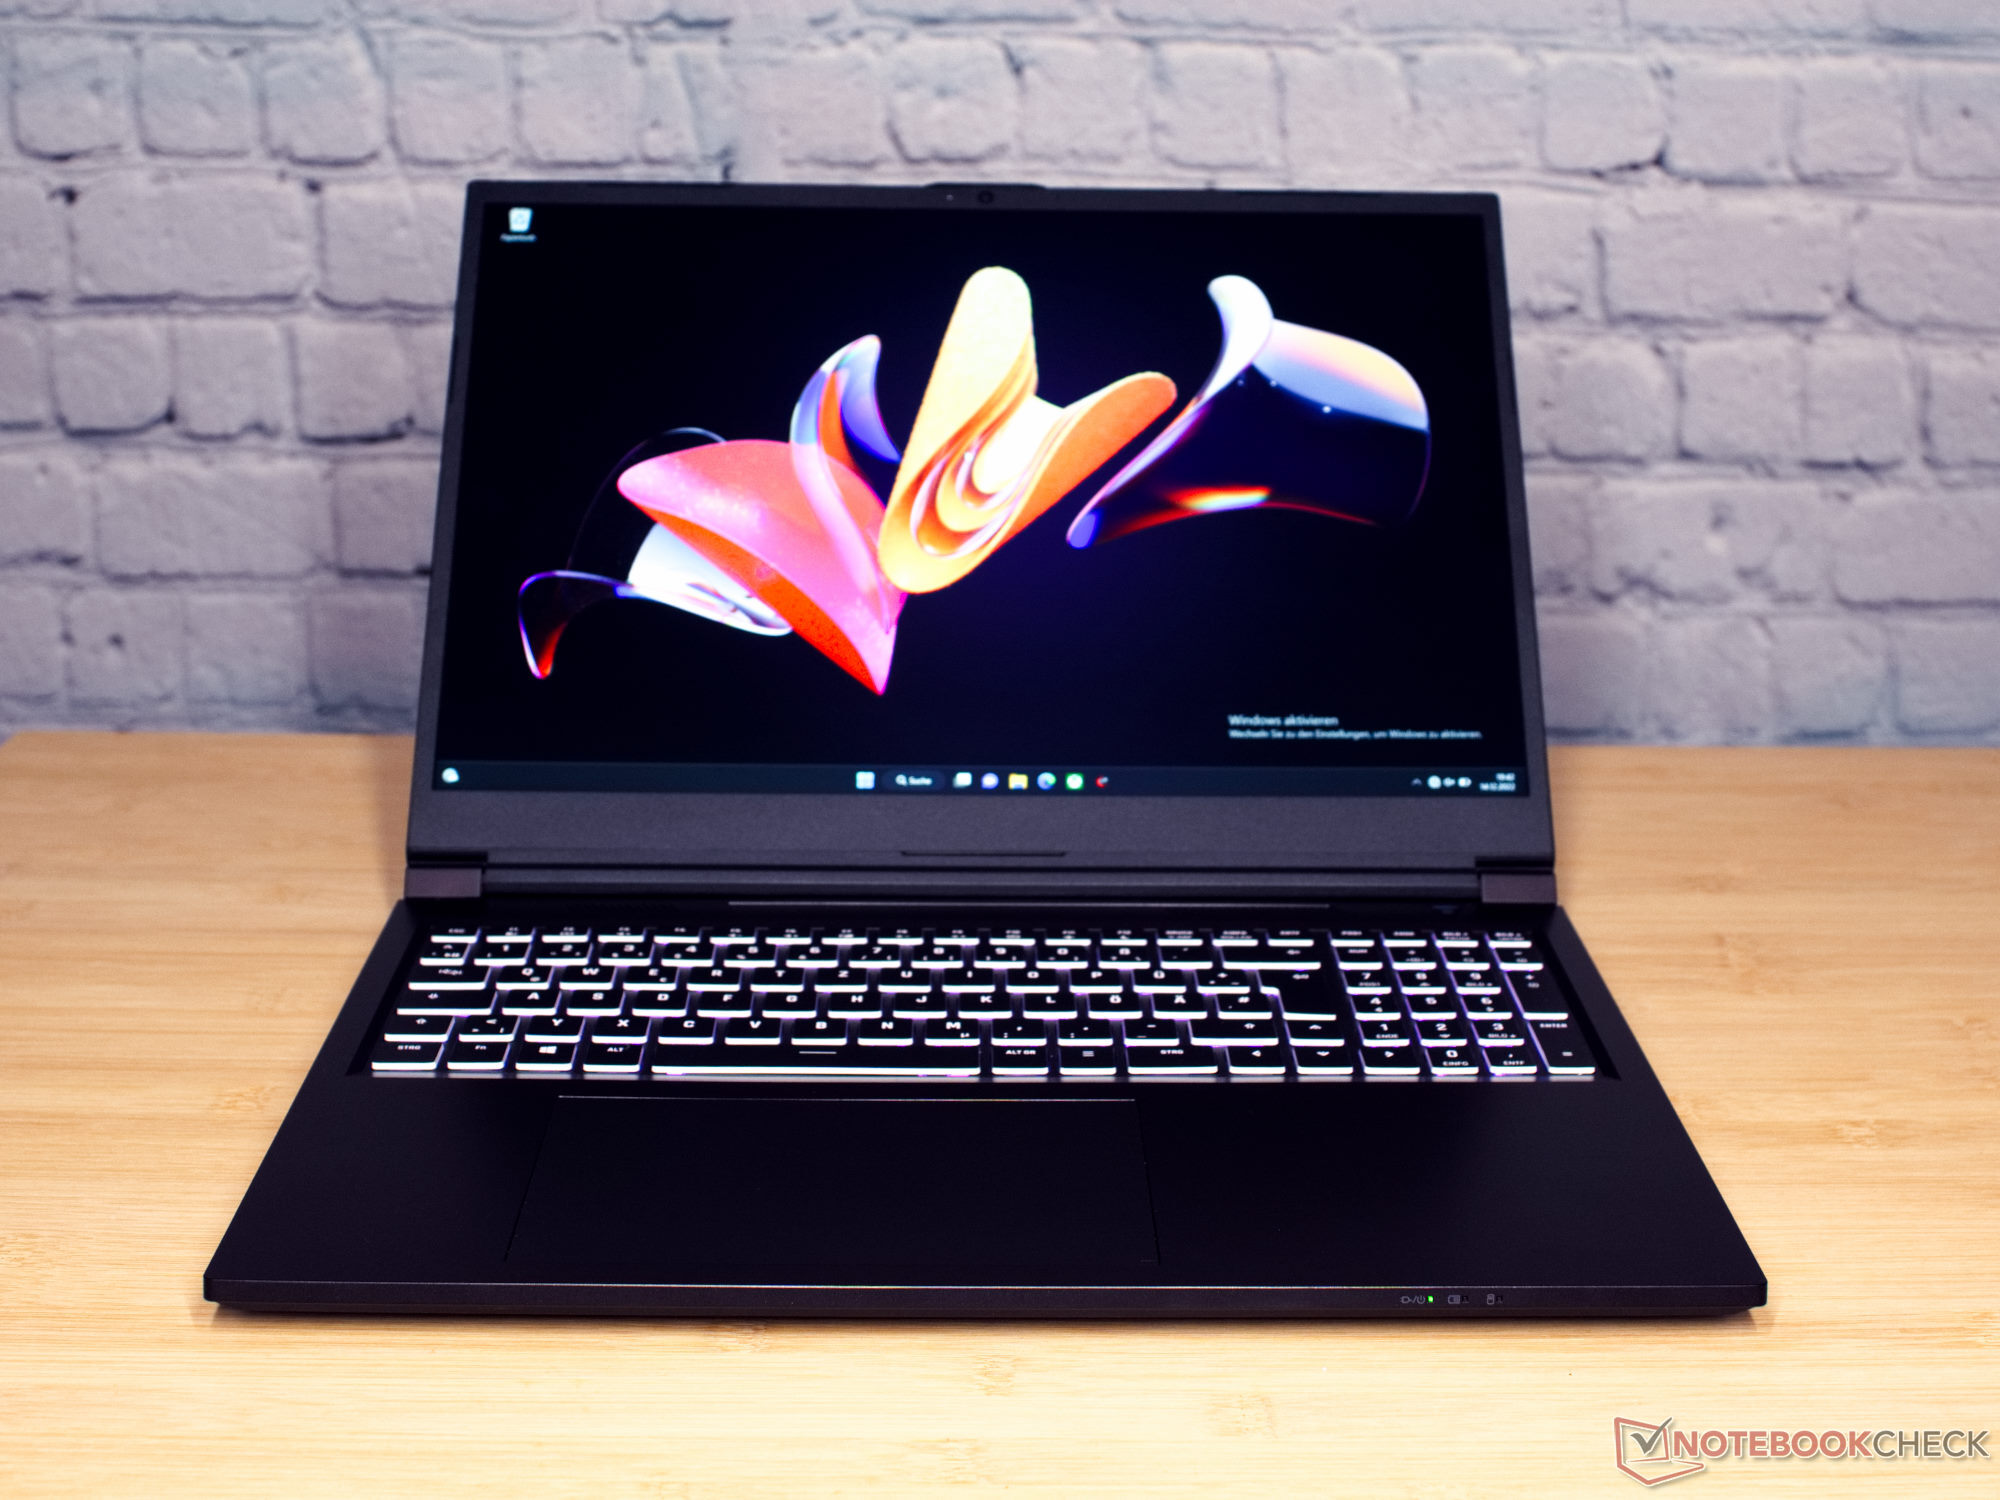
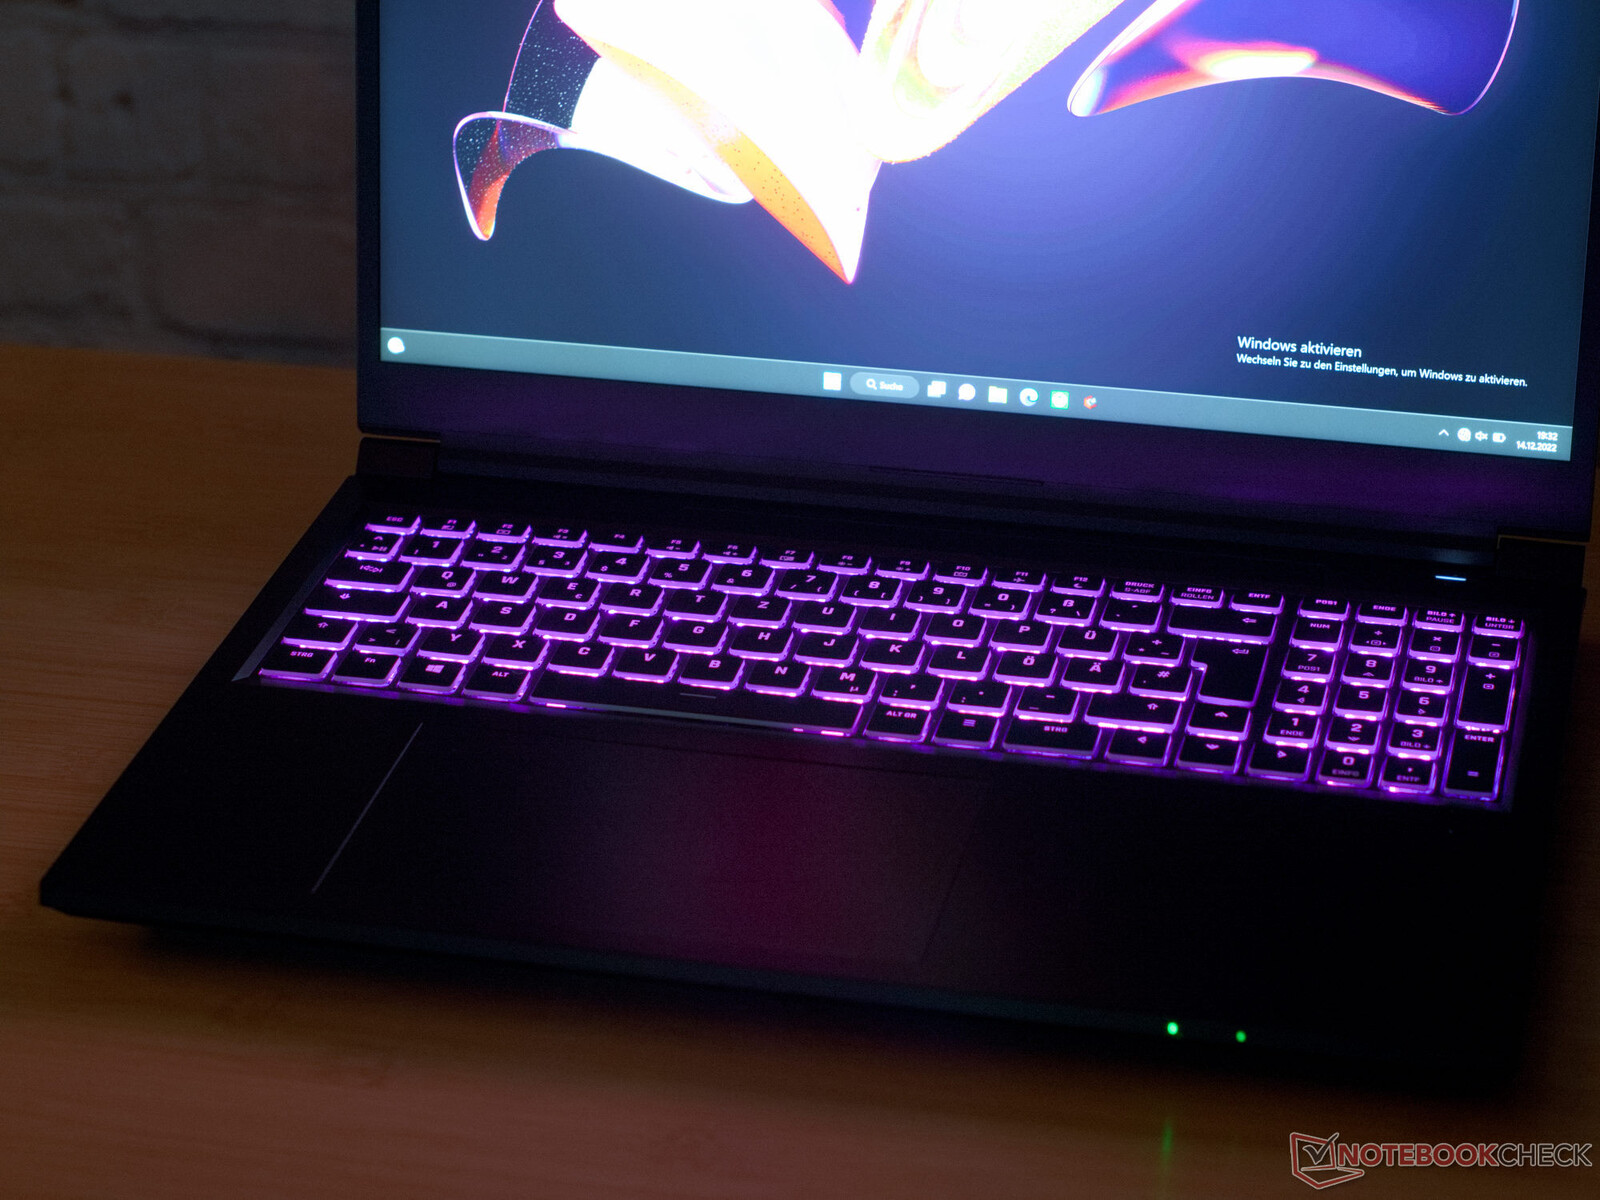
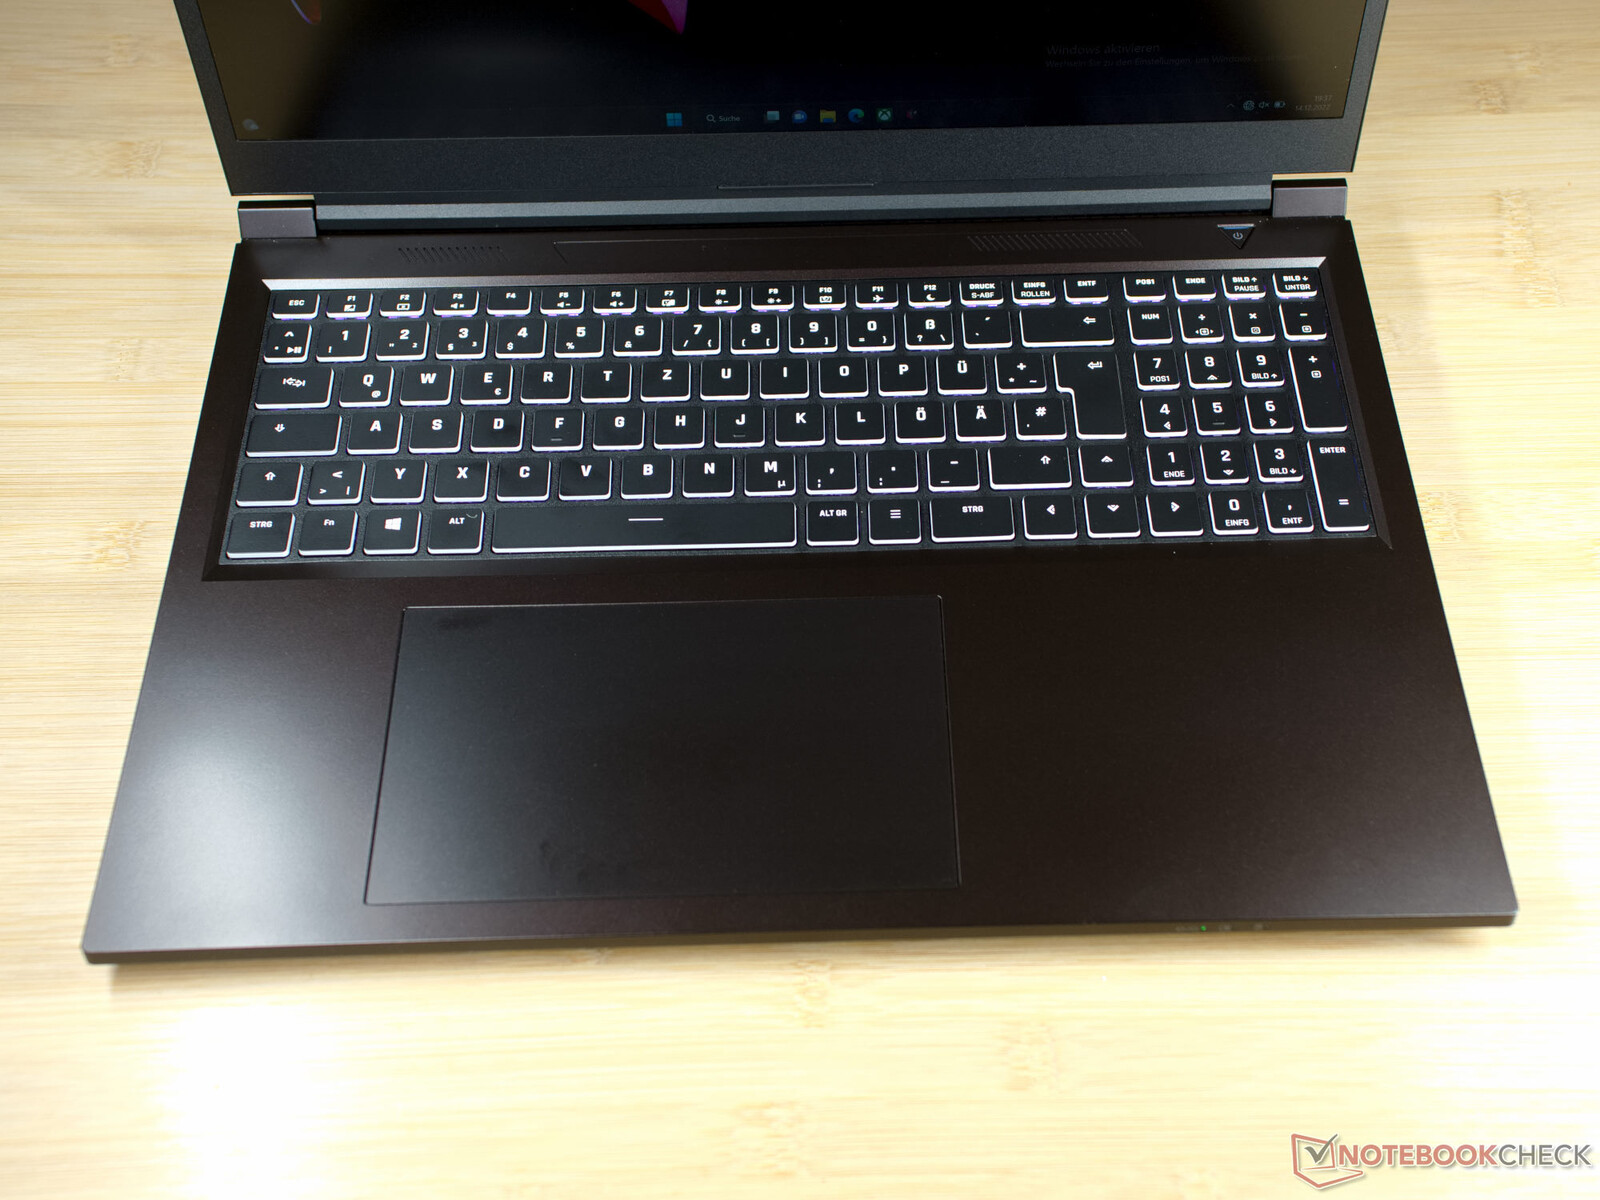
Dispositifs d'entrée - longue course des touches
Les caractères imprimés au laser du clavier sont faciles à lire avec une course des touches de près de 2 mm, ainsi que des touches fléchées de taille normale, un éclairage RVB et un clavier numérique. Sur demande, Schenker imprime au laser toutes les dispositions de clavier imaginables.
Avec ses 15 × 9 cm, le trackpad de l'ordinateur portable est très grand. Embarrassant pour Schenker : à la livraison, le câble plat du trackpad n'était pas correctement connecté, ce qui signifie que nous avons d'abord dû faire face à un trackpad peu réactif. Une fois ce faux pas réparé, le dispositif d'entrée a fonctionné au plus haut niveau.
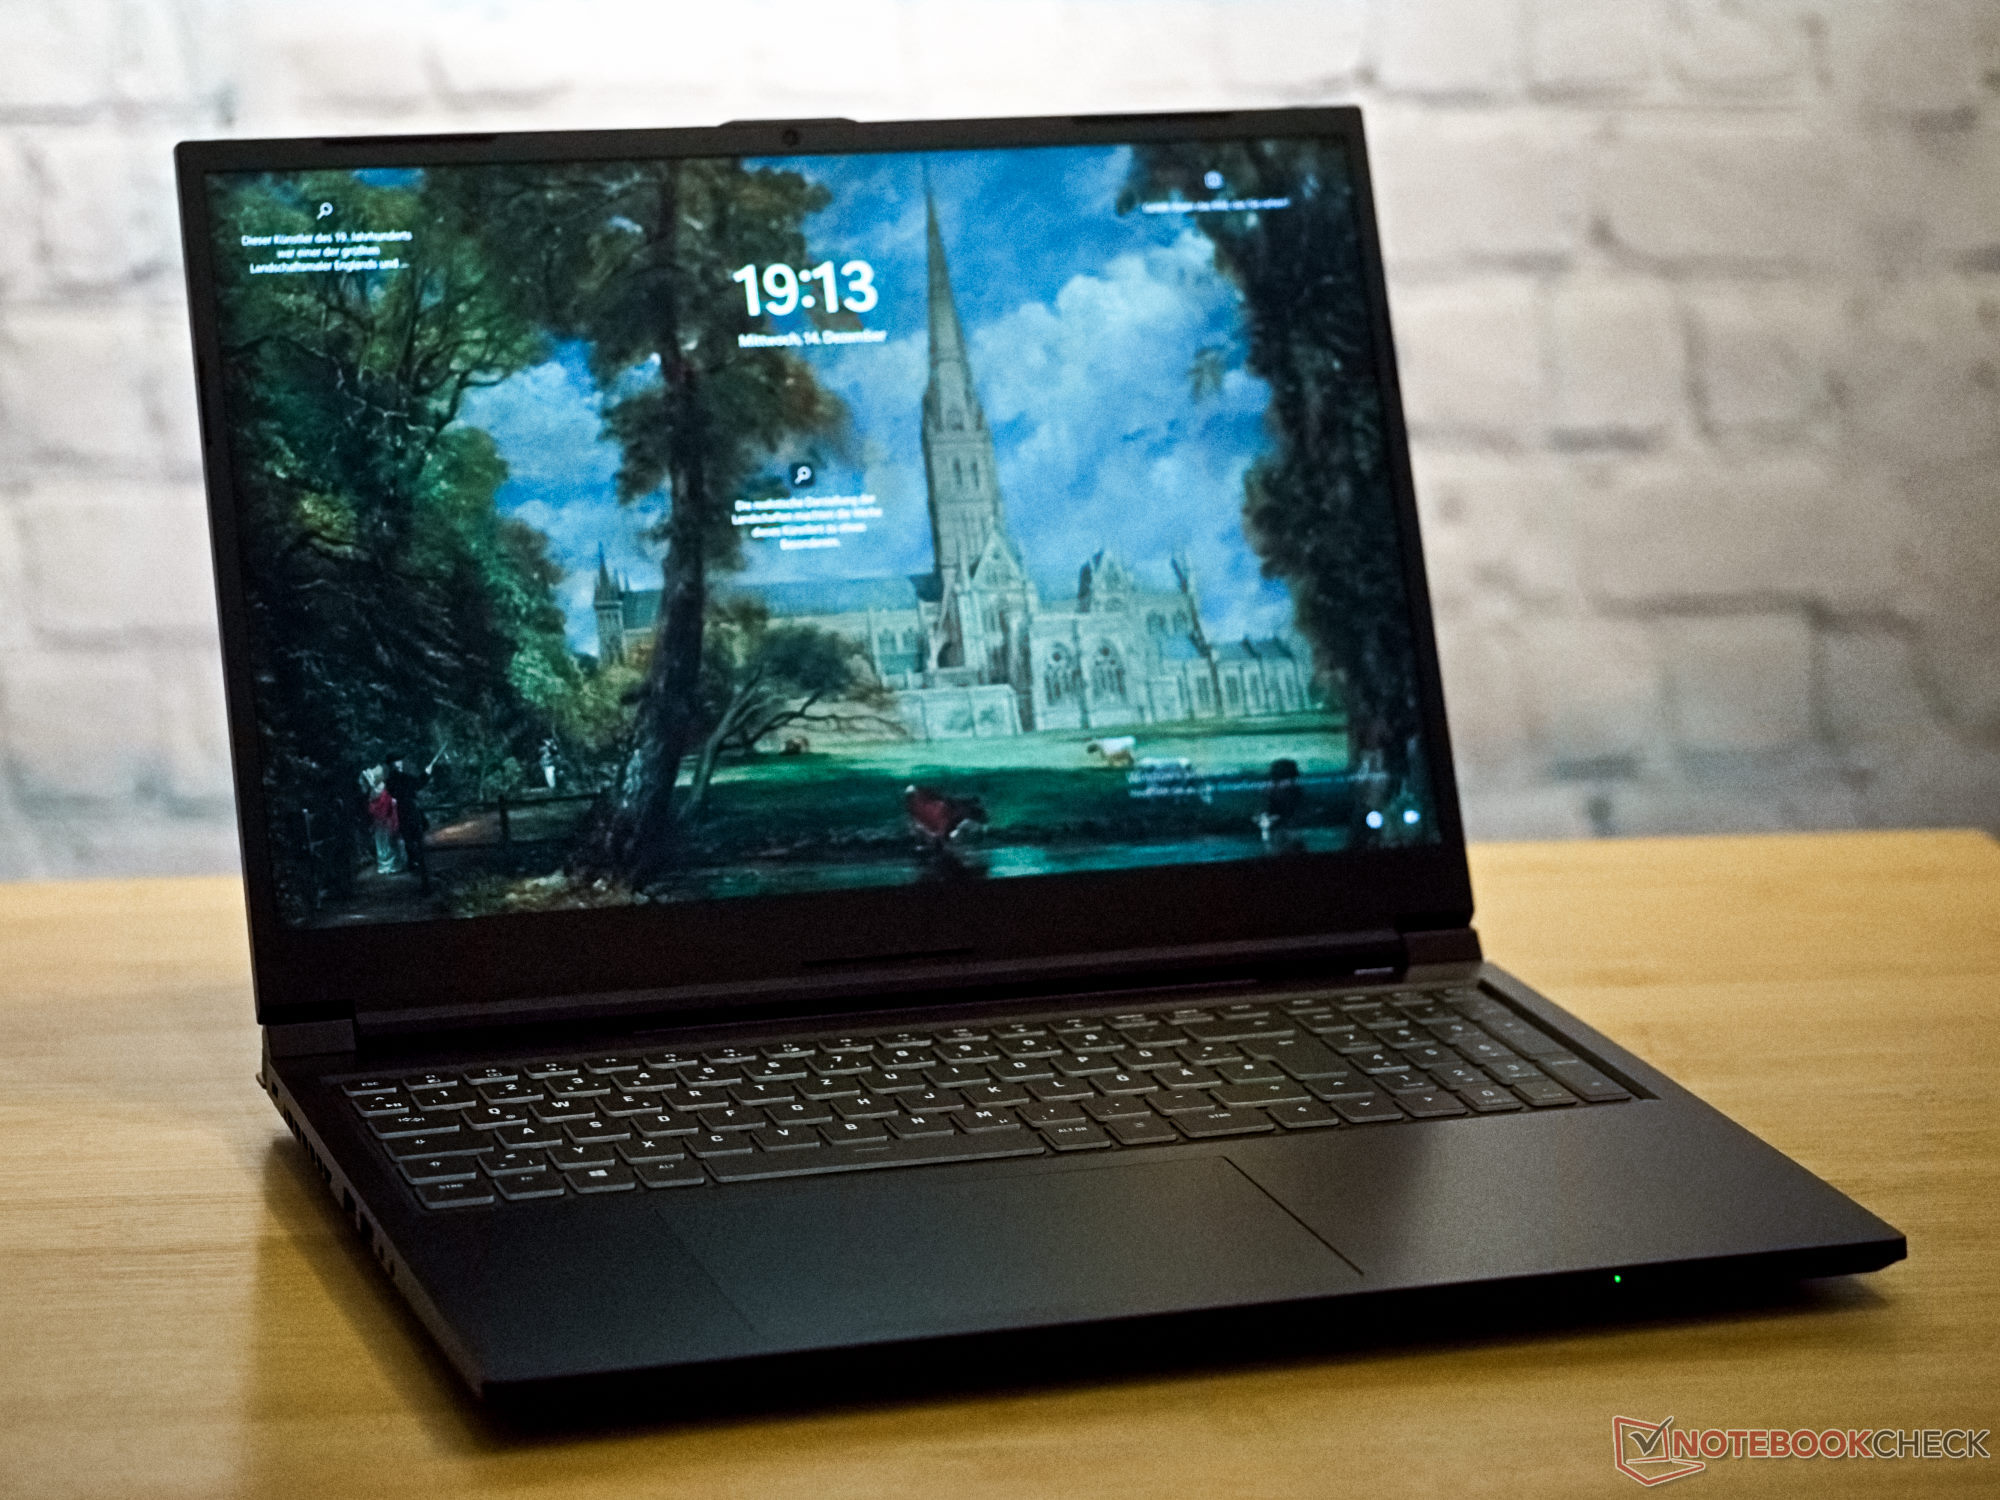
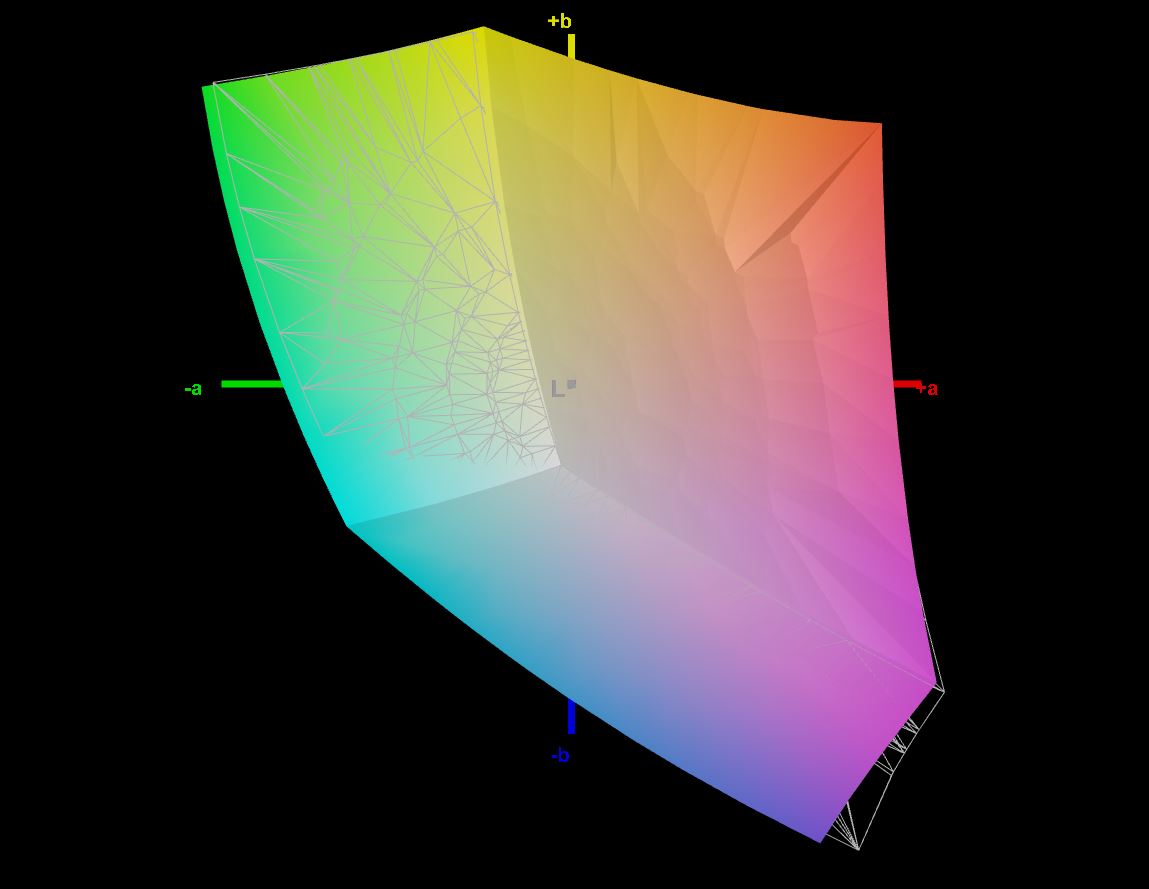
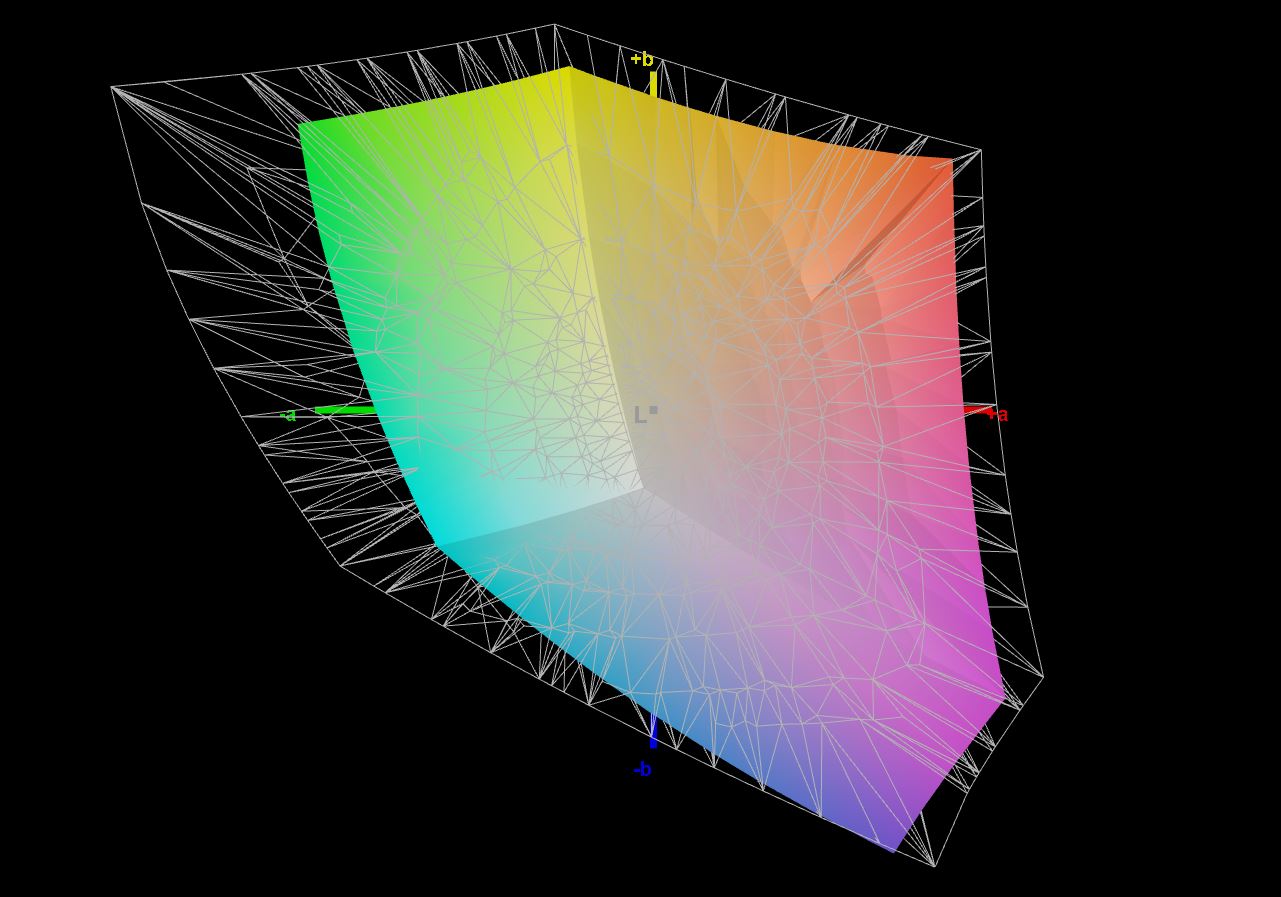
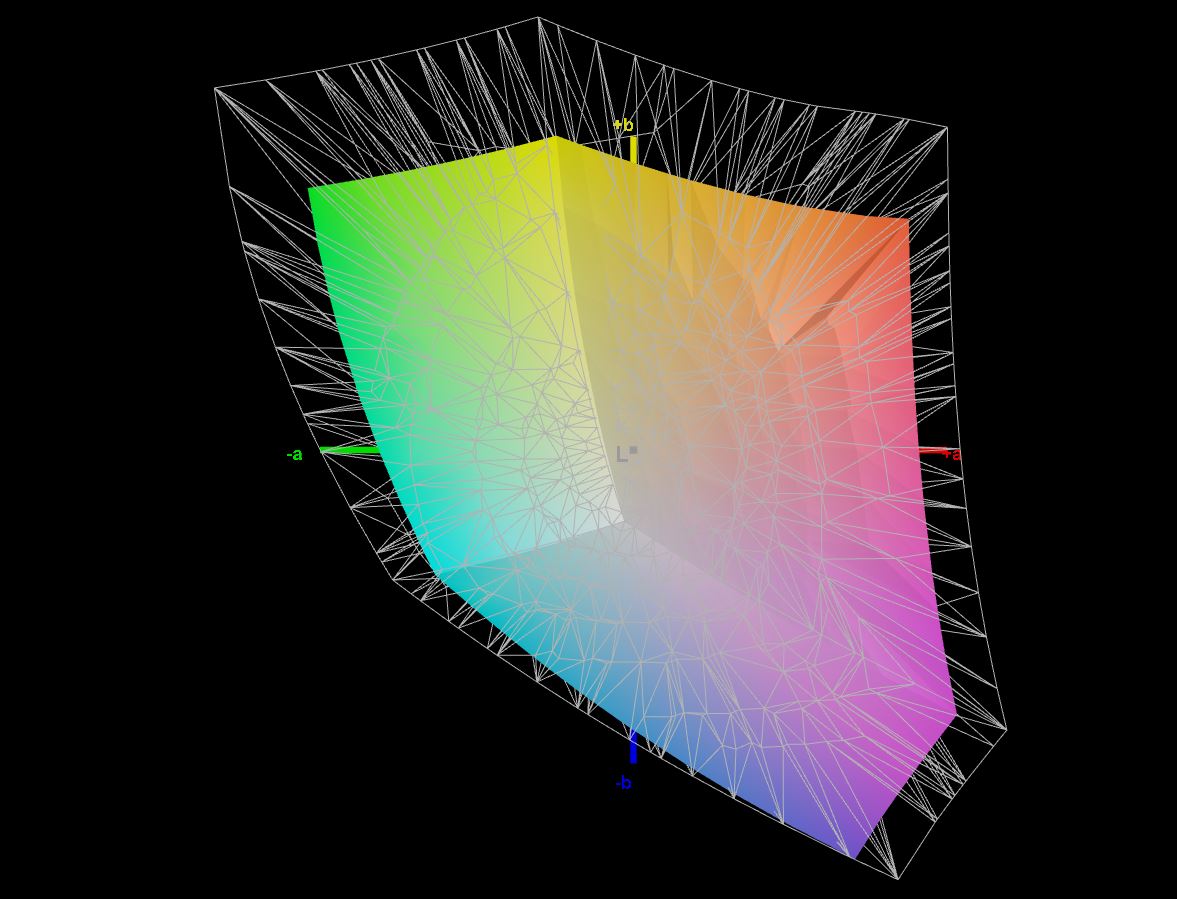
Affichage - Affichage 16:10 avec QHD+
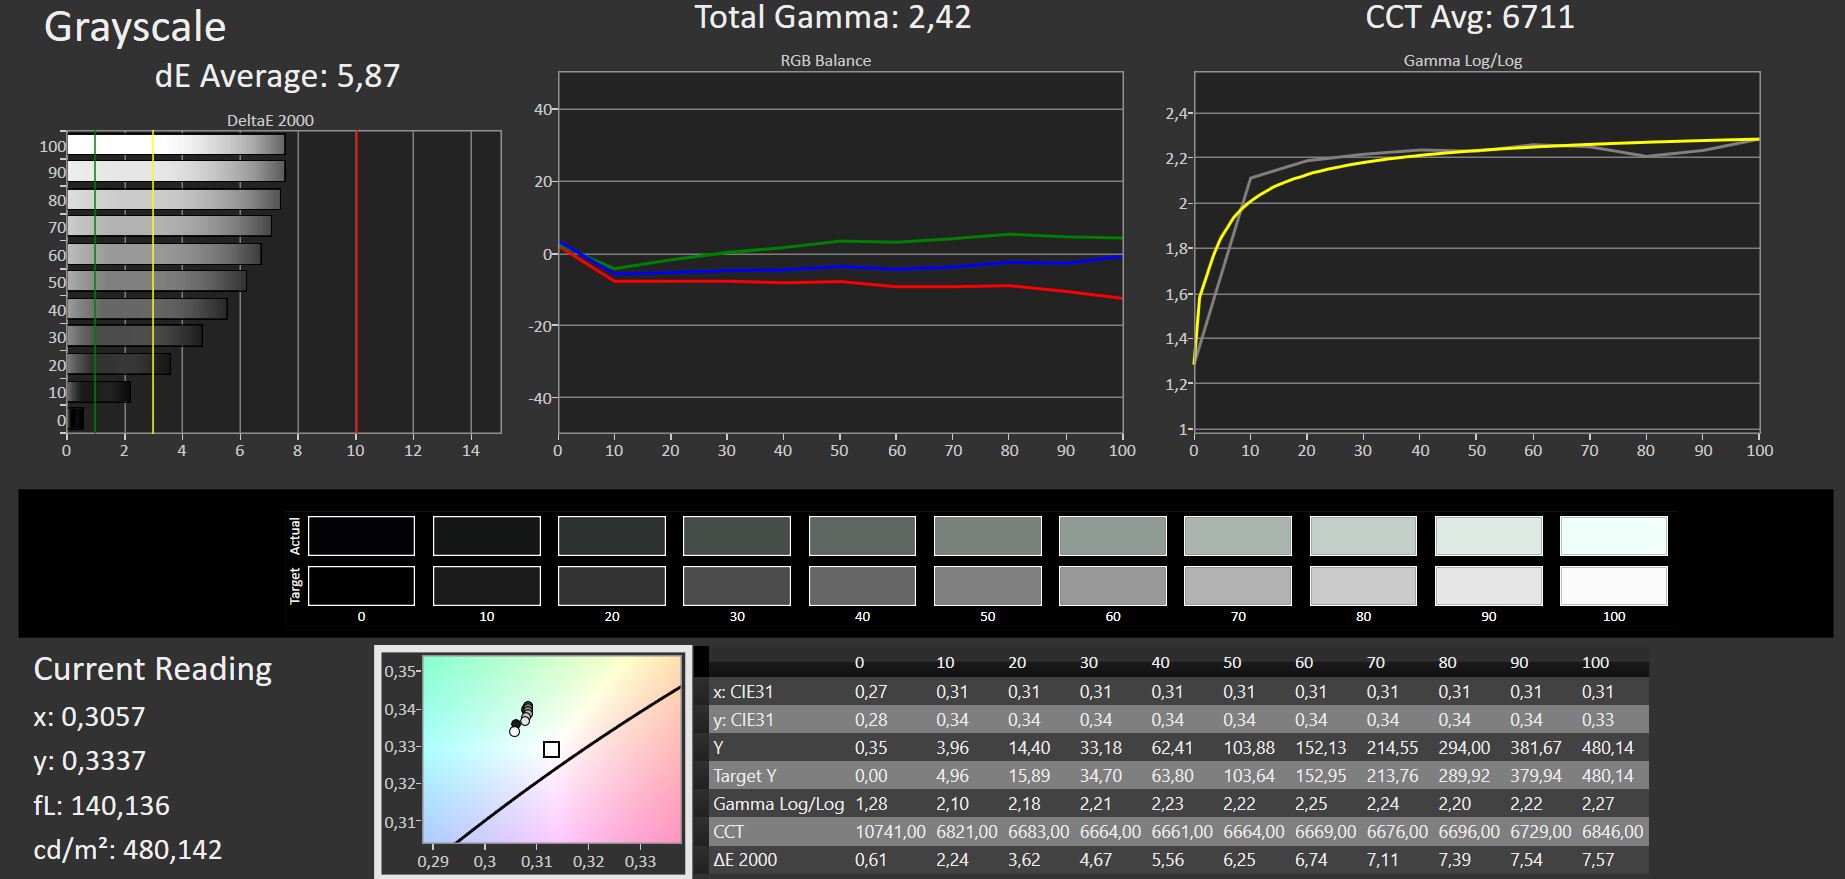
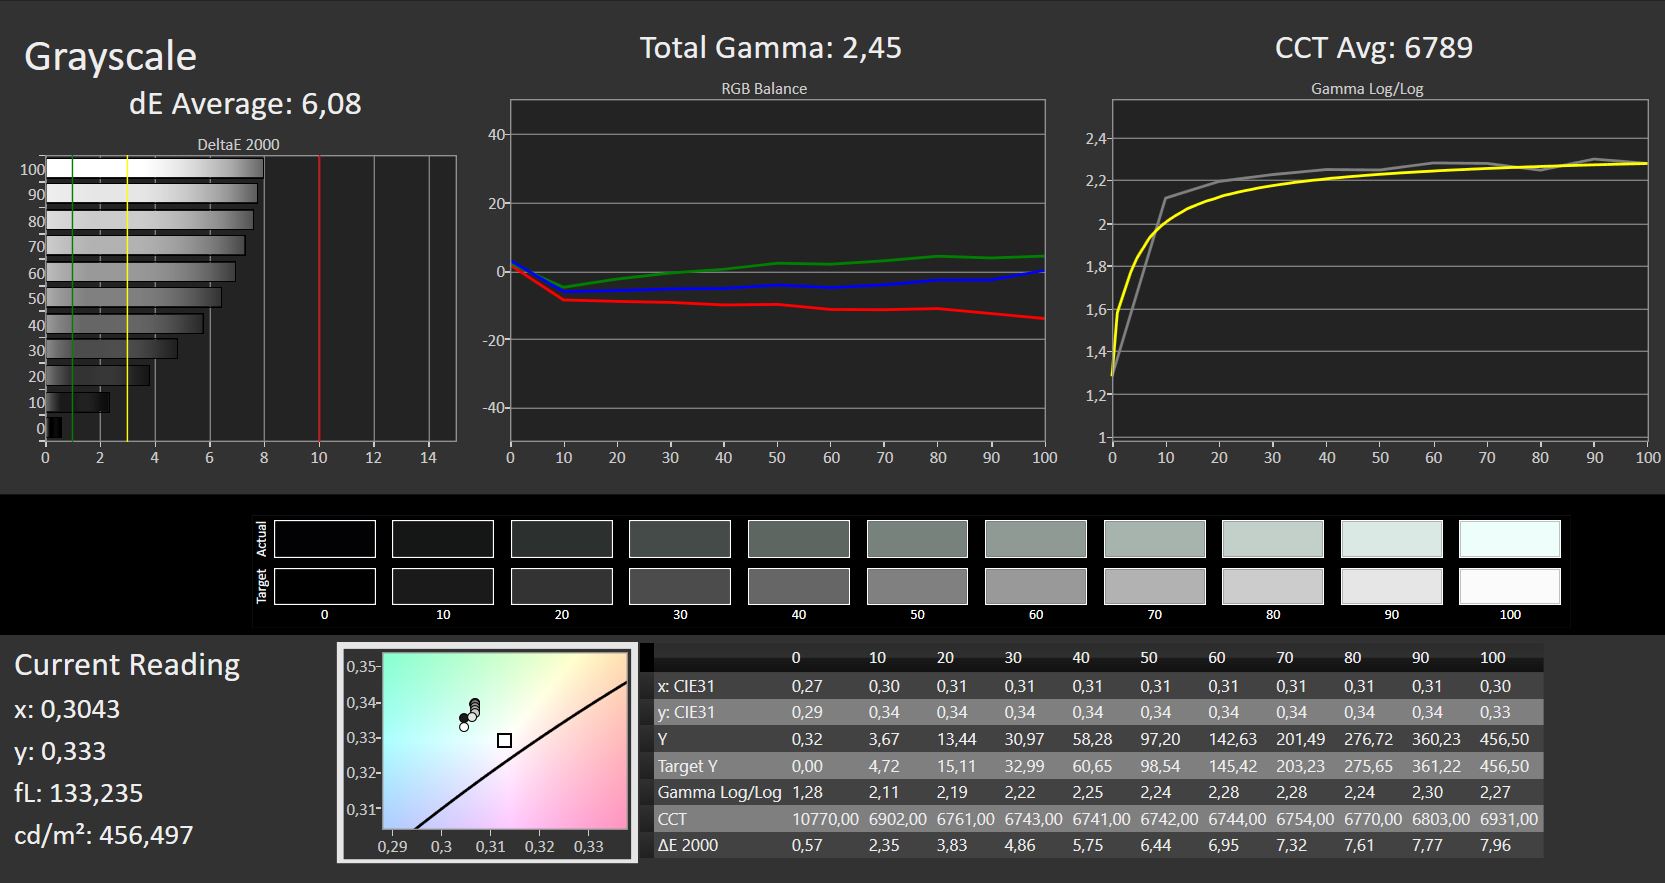
Avec un rapport d'aspect de 16:10, l'écran du XMG Focus 16 n'est pas exactement typique. Bien qu'il offre une résolution élevée de 2560 × 1600 pixels et un taux de rafraîchissement de 165Hz, le temps de réponse de cet écran lumineux de 450 cd/m² n'est pas aussi bas que ce que l'on pourrait attendre d'un ordinateur portable de jeu. Les niveaux de contraste, la couverture des couleurs, les niveaux de noir et l'éclairage peuvent être qualifiés de bons. Nous n'avons pas été en mesure de détecter la moindre fuite de lumière.
| |||||||||||||||||||||||||
Homogénéité de la luminosité: 89 %
Valeur mesurée au centre, sur batterie: 455 cd/m²
Contraste: 1438:1 (Valeurs des noirs: 0.32 cd/m²)
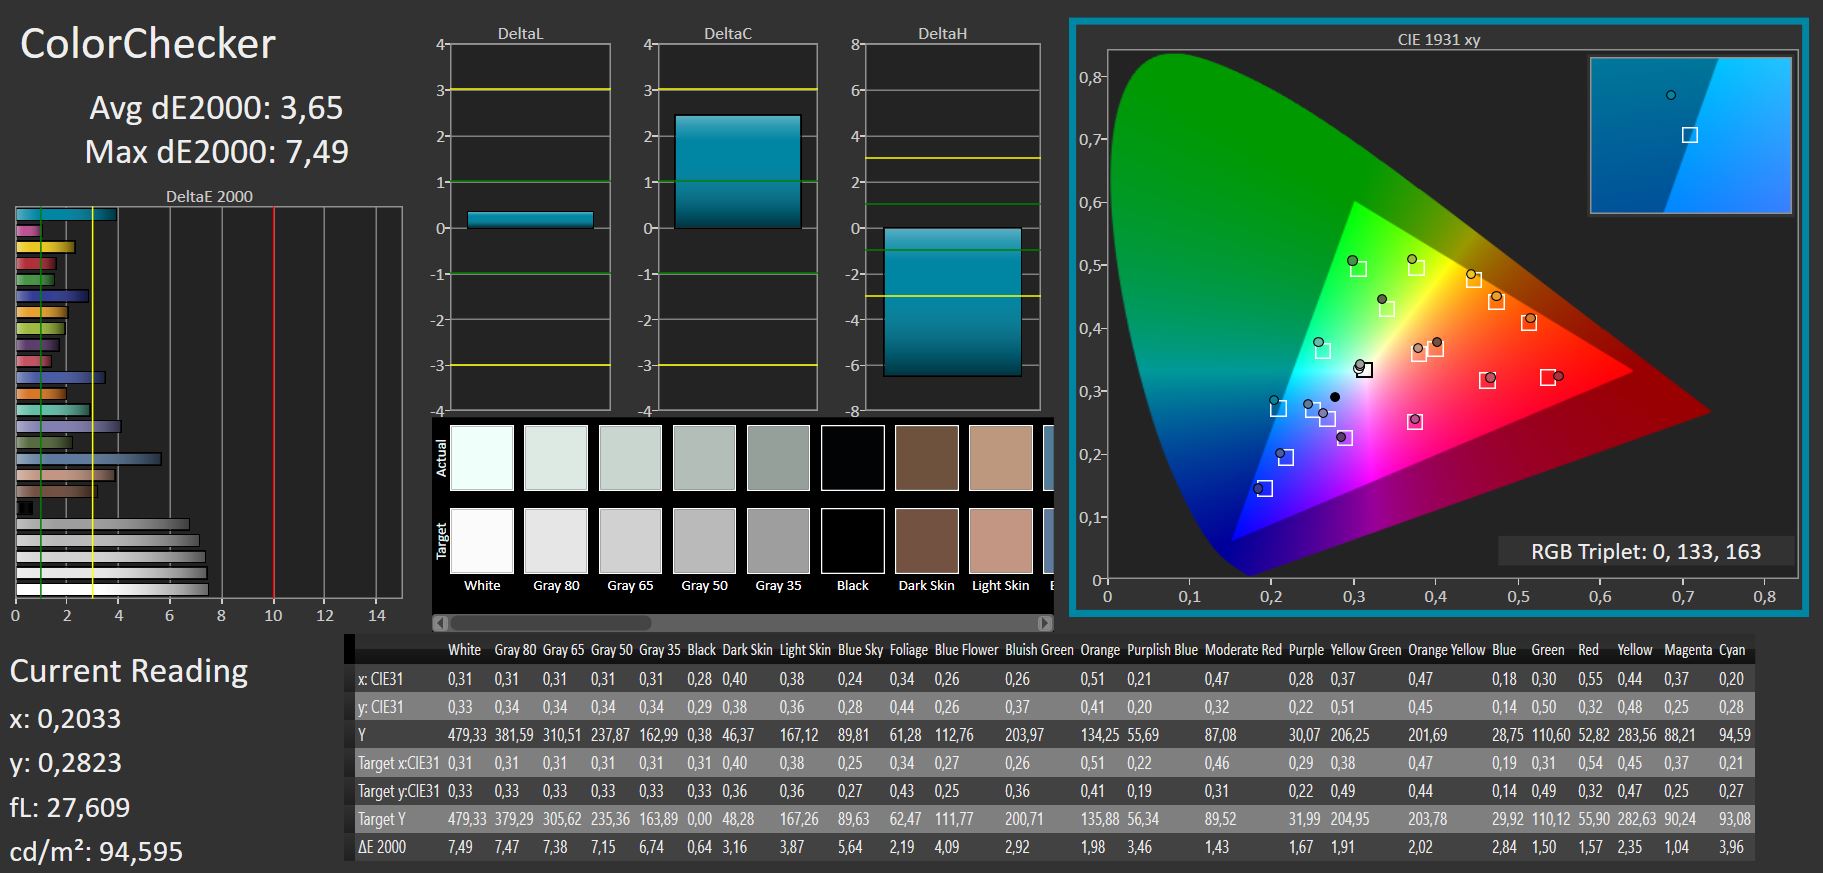
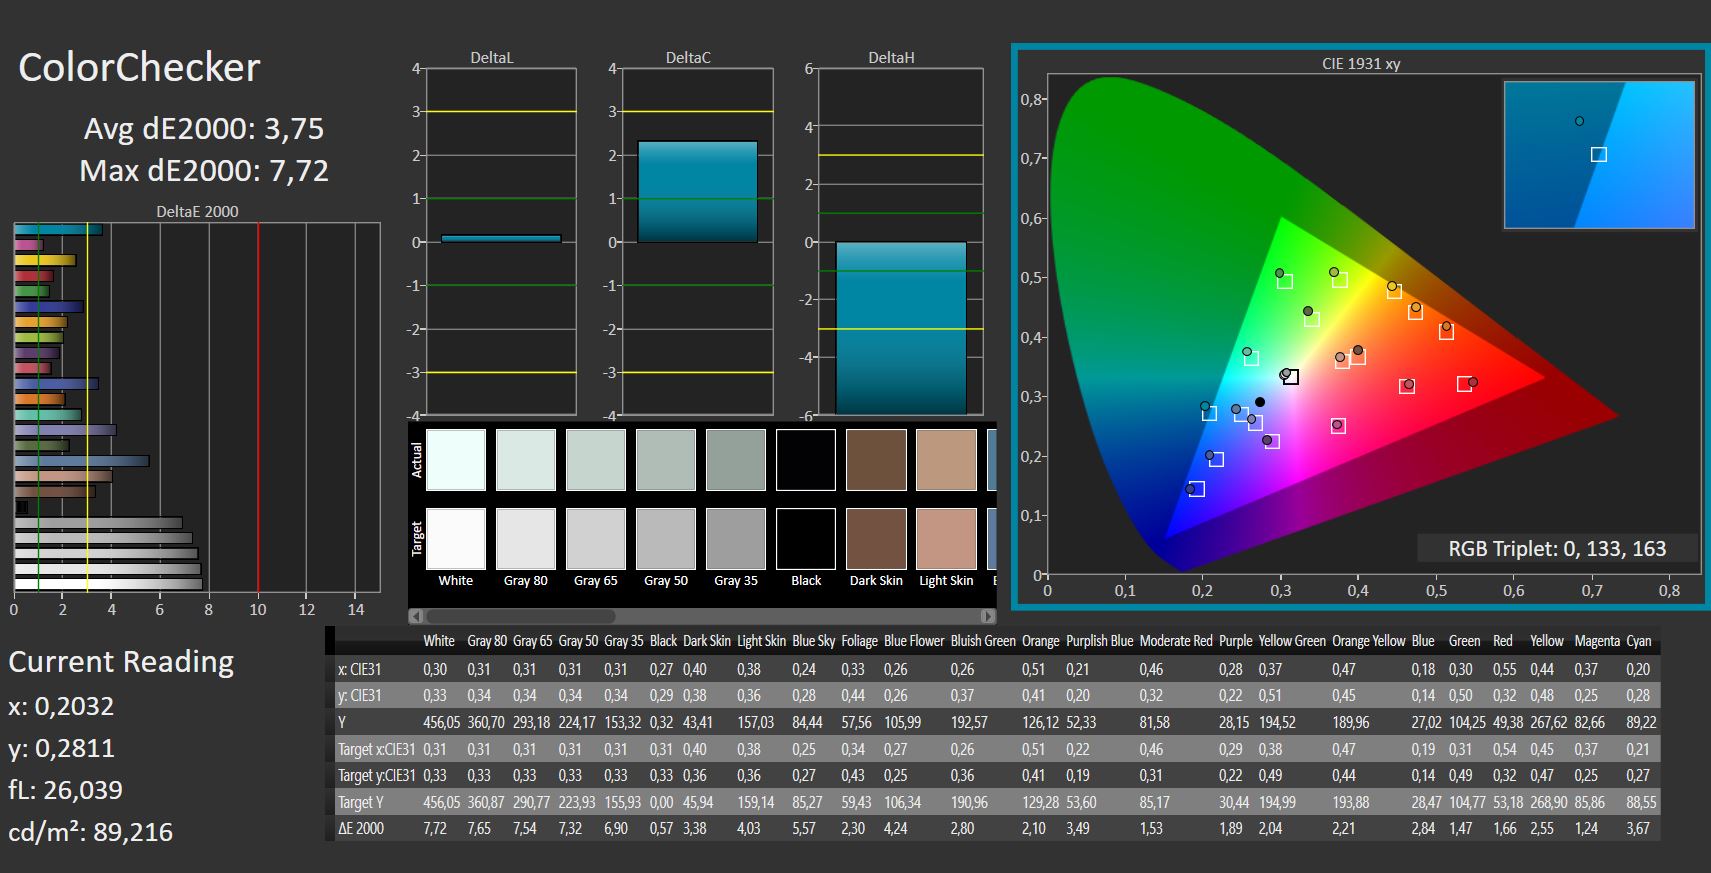
ΔE ColorChecker Calman: 3.65 | ∀{0.5-29.43 Ø4.73}
calibrated: 3.65
ΔE Greyscale Calman: 5.87 | ∀{0.09-98 Ø4.97}
70.6% AdobeRGB 1998 (Argyll 3D)
96.6% sRGB (Argyll 3D)
68.3% Display P3 (Argyll 3D)
Gamma: 2.42
CCT: 6711 K
| Schenker XMG Focus 16 (i7-12700H, RTX 3060) BOE NE16oQDM-NY1, IPS, 2560x1600, 16" | Dell G16 7620 BOE NE16QDM, IPS, 2560x1600, 16" | Asus ZenBook Pro 16X OLED UX7602ZM-ME115W Samsung SDC415D, OLED, 3840x2400, 16" | Asus ROG Flow X16 GV601RW-M5082W AUO B160QAN02.S, Mini LED, 2560x1600, 16.1" | Lenovo ThinkPad X1 Extreme G5-21DE003RGE LP160UQ1-SPB1, IPS, 3840x2400, 16" | Lenovo Legion Slim 7-16IAH 82TF004YGE MNG007DA1-G , IPS LED, 2560x1600, 16" | Lenovo Legion 5 Pro 16IAH7H BOE CCQ_NE160QDM_NY1, IPS, 2560x1600, 16" | |
|---|---|---|---|---|---|---|---|
| Display | 0% | 25% | 26% | 22% | 3% | 1% | |
| Display P3 Coverage (%) | 68.3 | 68.3 0% | 99.84 46% | 99.82 46% | 84.6 24% | 70.5 3% | 68.53 0% |
| sRGB Coverage (%) | 96.6 | 98 1% | 99.99 4% | 99.99 4% | 99.2 3% | 99.1 3% | 98.38 2% |
| AdobeRGB 1998 Coverage (%) | 70.6 | 70.5 0% | 88.9 26% | 90.21 28% | 97.7 38% | 72.8 3% | 70.45 0% |
| Response Times | 26% | 85% | 16% | -129% | 31% | 30% | |
| Response Time Grey 50% / Grey 80% * (ms) | 16.4 ? | 8.6 ? 48% | 2 ? 88% | 11 ? 33% | 46 ? -180% | 12 ? 27% | 14 ? 15% |
| Response Time Black / White * (ms) | 10.8 ? | 10.4 ? 4% | 2 ? 81% | 11 ? -2% | 19.2 ? -78% | 7 ? 35% | 6 ? 44% |
| PWM Frequency (Hz) | 59 ? | 7400 ? | |||||
| Screen | 15% | 21% | 52% | 23% | 19% | 17% | |
| Brightness middle (cd/m²) | 460 | 369.4 -20% | 346 -25% | 498 8% | 476 3% | 523 14% | 515 12% |
| Brightness (cd/m²) | 442 | 348 -21% | 354 -20% | 502 14% | 470 6% | 494 12% | 475 7% |
| Brightness Distribution (%) | 89 | 83 -7% | 96 8% | 94 6% | 90 1% | 90 1% | 85 -4% |
| Black Level * (cd/m²) | 0.32 | 0.32 -0% | 0.11 66% | 0.35 -9% | 0.4 -25% | 0.45 -41% | |
| Contrast (:1) | 1438 | 1154 -20% | 4527 215% | 1360 -5% | 1308 -9% | 1144 -20% | |
| Colorchecker dE 2000 * | 3.65 | 1.78 51% | 2.28 38% | 1.87 49% | 1.9 48% | 2.6 29% | 2.38 35% |
| Colorchecker dE 2000 max. * | 7.49 | 4.41 41% | 4.94 34% | 6.15 18% | 4.7 37% | 5 33% | 4.37 42% |
| Colorchecker dE 2000 calibrated * | 3.65 | 1.22 67% | 2.16 41% | 1.94 47% | 1.3 64% | 1 73% | 1.1 70% |
| Greyscale dE 2000 * | 5.87 | 3.2 45% | 1.64 72% | 3.15 46% | 2.4 59% | 3.3 44% | 2.71 54% |
| Gamma | 2.42 91% | 2.2 100% | 2.37 93% | 330.95 1% | 2.24 98% | 2.17 101% | 2.49 88% |
| CCT | 6711 97% | 6750 96% | 6384 102% | 7294 89% | 6377 102% | 6013 108% | 6117 106% |
| Moyenne finale (programmes/paramètres) | 14% /
14% | 44% /
33% | 31% /
41% | -28% /
1% | 18% /
17% | 16% /
15% |
* ... Moindre est la valeur, meilleures sont les performances
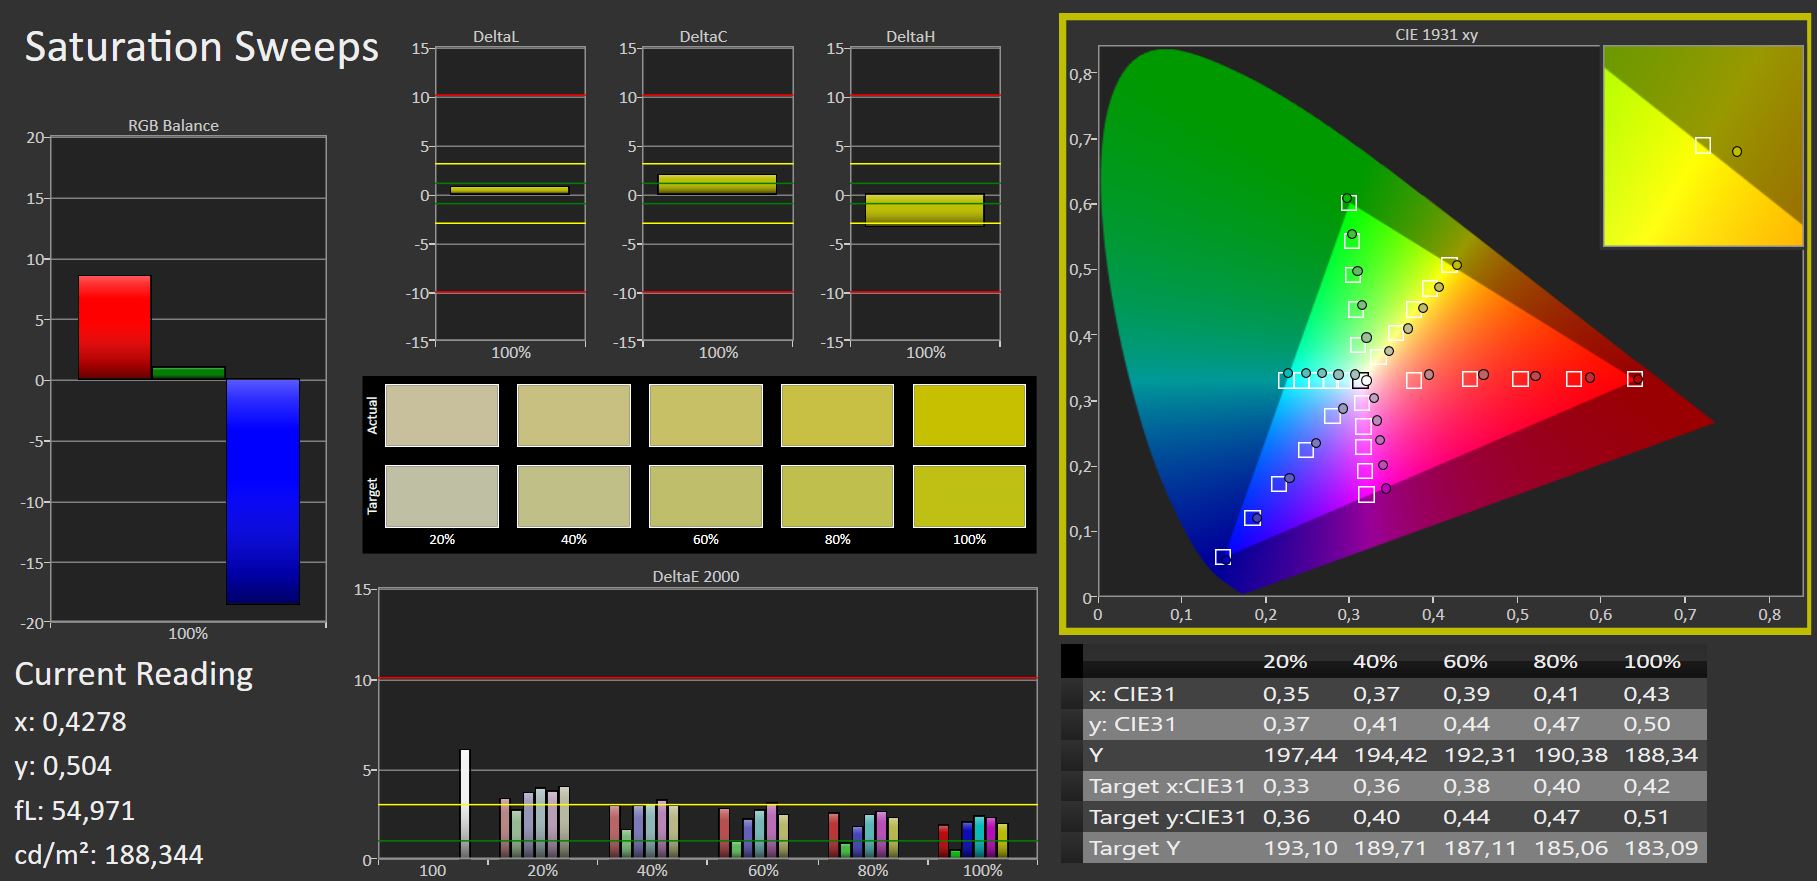
L'écran de l'ordinateur portable de jeu Schenker couvre 95 % de la plage sRGB, tandis que les plages AdobeRGB et DisplayP3 se situent autour de 70 %. La reproduction des couleurs est bonne si elle n'est pas exactement parfaite. Un ΔΕ de moins de 3 serait souhaitable, le Focus 16 parvenant à un ΔΕ moyen de 3,65. Ainsi, les écarts de couleur ex-works sont acceptables. Notre profil ICC n'a pas entraîné d'amélioration de la reproduction des couleurs.

Temps de réponse de l'écran
| ↔ Temps de réponse noir à blanc | ||
|---|---|---|
| 10.8 ms ... hausse ↗ et chute ↘ combinées | ↗ 5 ms hausse | 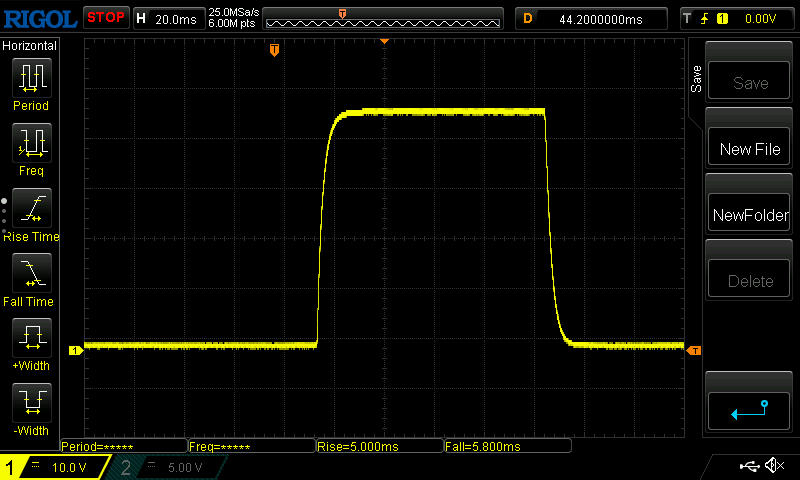 |
| ↘ 5.8 ms chute | ||
| L'écran montre de bons temps de réponse, mais insuffisant pour du jeu compétitif. En comparaison, tous les appareils testés affichent entre 0.1 (minimum) et 240 (maximum) ms. » 29 % des appareils testés affichent de meilleures performances. Cela signifie que les latences relevées sont meilleures que la moyenne (19.9 ms) de tous les appareils testés. | ||
| ↔ Temps de réponse gris 50% à gris 80% | ||
| 16.4 ms ... hausse ↗ et chute ↘ combinées | ↗ 7.4 ms hausse | 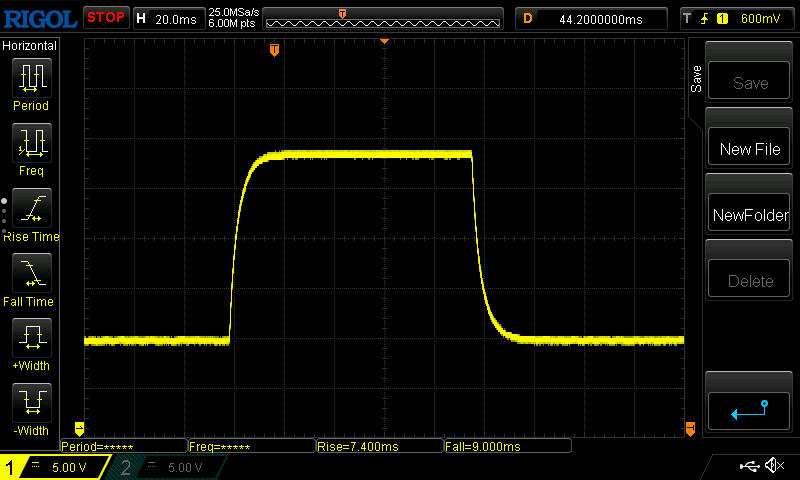 |
| ↘ 9 ms chute | ||
| L'écran montre de bons temps de réponse, mais insuffisant pour du jeu compétitif. En comparaison, tous les appareils testés affichent entre 0.165 (minimum) et 636 (maximum) ms. » 30 % des appareils testés affichent de meilleures performances. Cela signifie que les latences relevées sont meilleures que la moyenne (31.1 ms) de tous les appareils testés. | ||
Scintillement / MLI (Modulation de largeur d'impulsion)
| Scintillement / MLI (Modulation de largeur d'impulsion) non décelé | 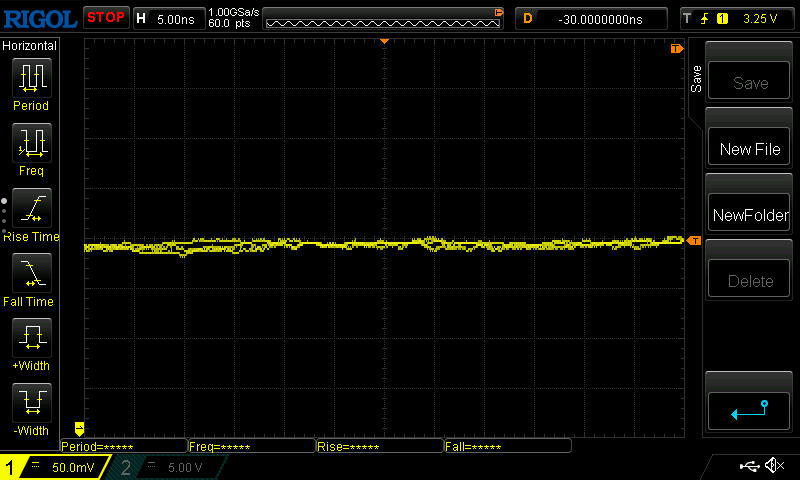 | ||
En comparaison, 52 % des appareils testés n'emploient pas MDI pour assombrir leur écran. Nous avons relevé une moyenne à 7798 (minimum : 5 - maximum : 343500) Hz dans le cas où une MDI était active. | |||
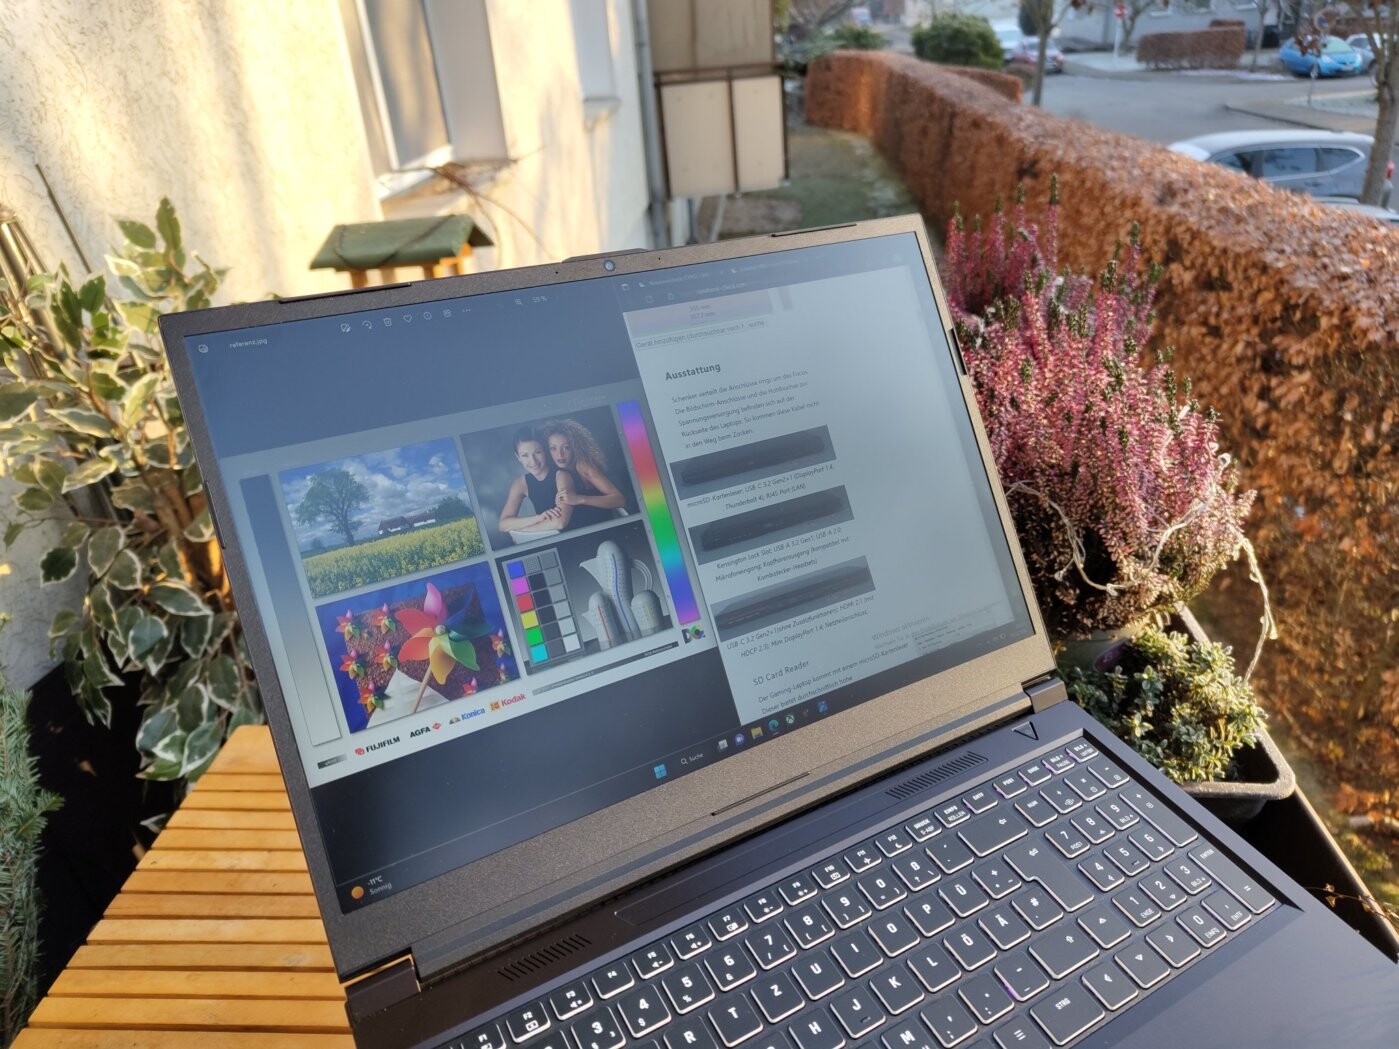
L'écran IPS sans scintillement a fait bonne impression en utilisation extérieure et sous différents angles. Ce n'est que lorsque le soleil éclairait l'écran mat sous un angle défavorable que nous avons rencontré des difficultés de lisibilité.

Performance - un peu au-dessus de la moyenne
Comme tous les ordinateurs portables Schenker, le XMG Focus 16 est également hautement personnalisable. Il est donc possible de sélectionner la mémoire vive, les différents disques durs et d'autres options dans le configurateur XMG Focus 16configurateur. Il n'est actuellement pas possible de choisir différents processeurs et GPU. Tous les appareils XMG Focus 16 sont livrés avec unIntel Core i7-12700Het d'unNvidia GeForce RTX 3060. De plus, notre appareil de test était équipé de 2×16GB DDR4 RAM et d'un 1TB Samsung NVMe SSD.
Tout cela signifie que nous avons un ordinateur portable qui devrait gérer la plupart des jeux modernes. Cependant, la RTX 3060 ne parvient pas toujours à atteindre plus de 60fps dans les paramètres graphiques les plus élevés et à la résolution native de l'appareil.
Contrôle des performances et conditions d'essai
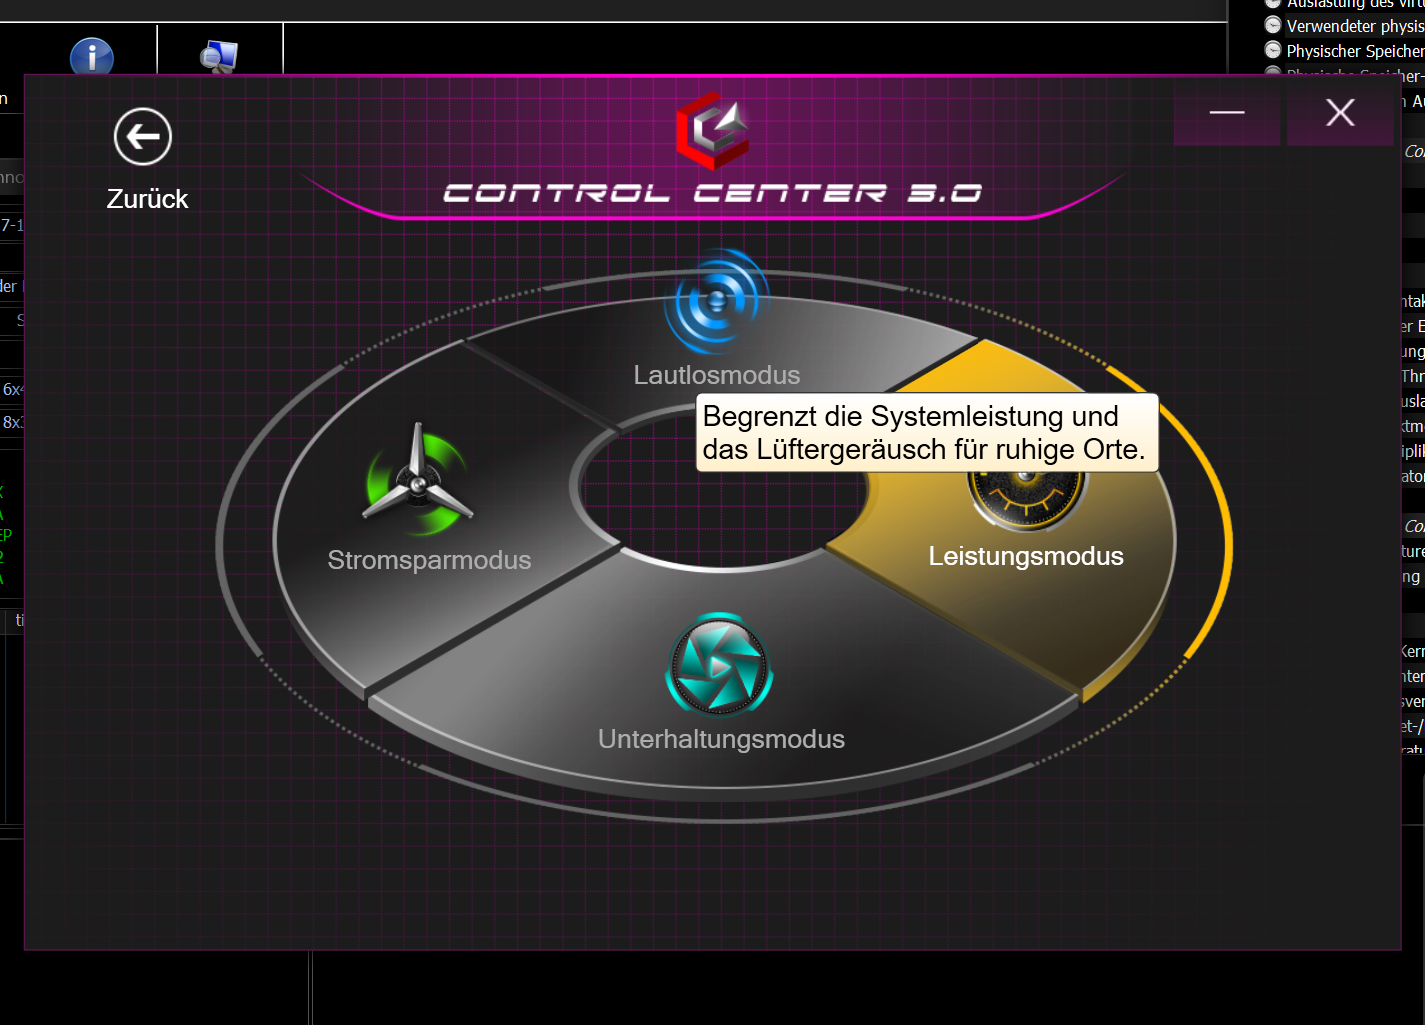
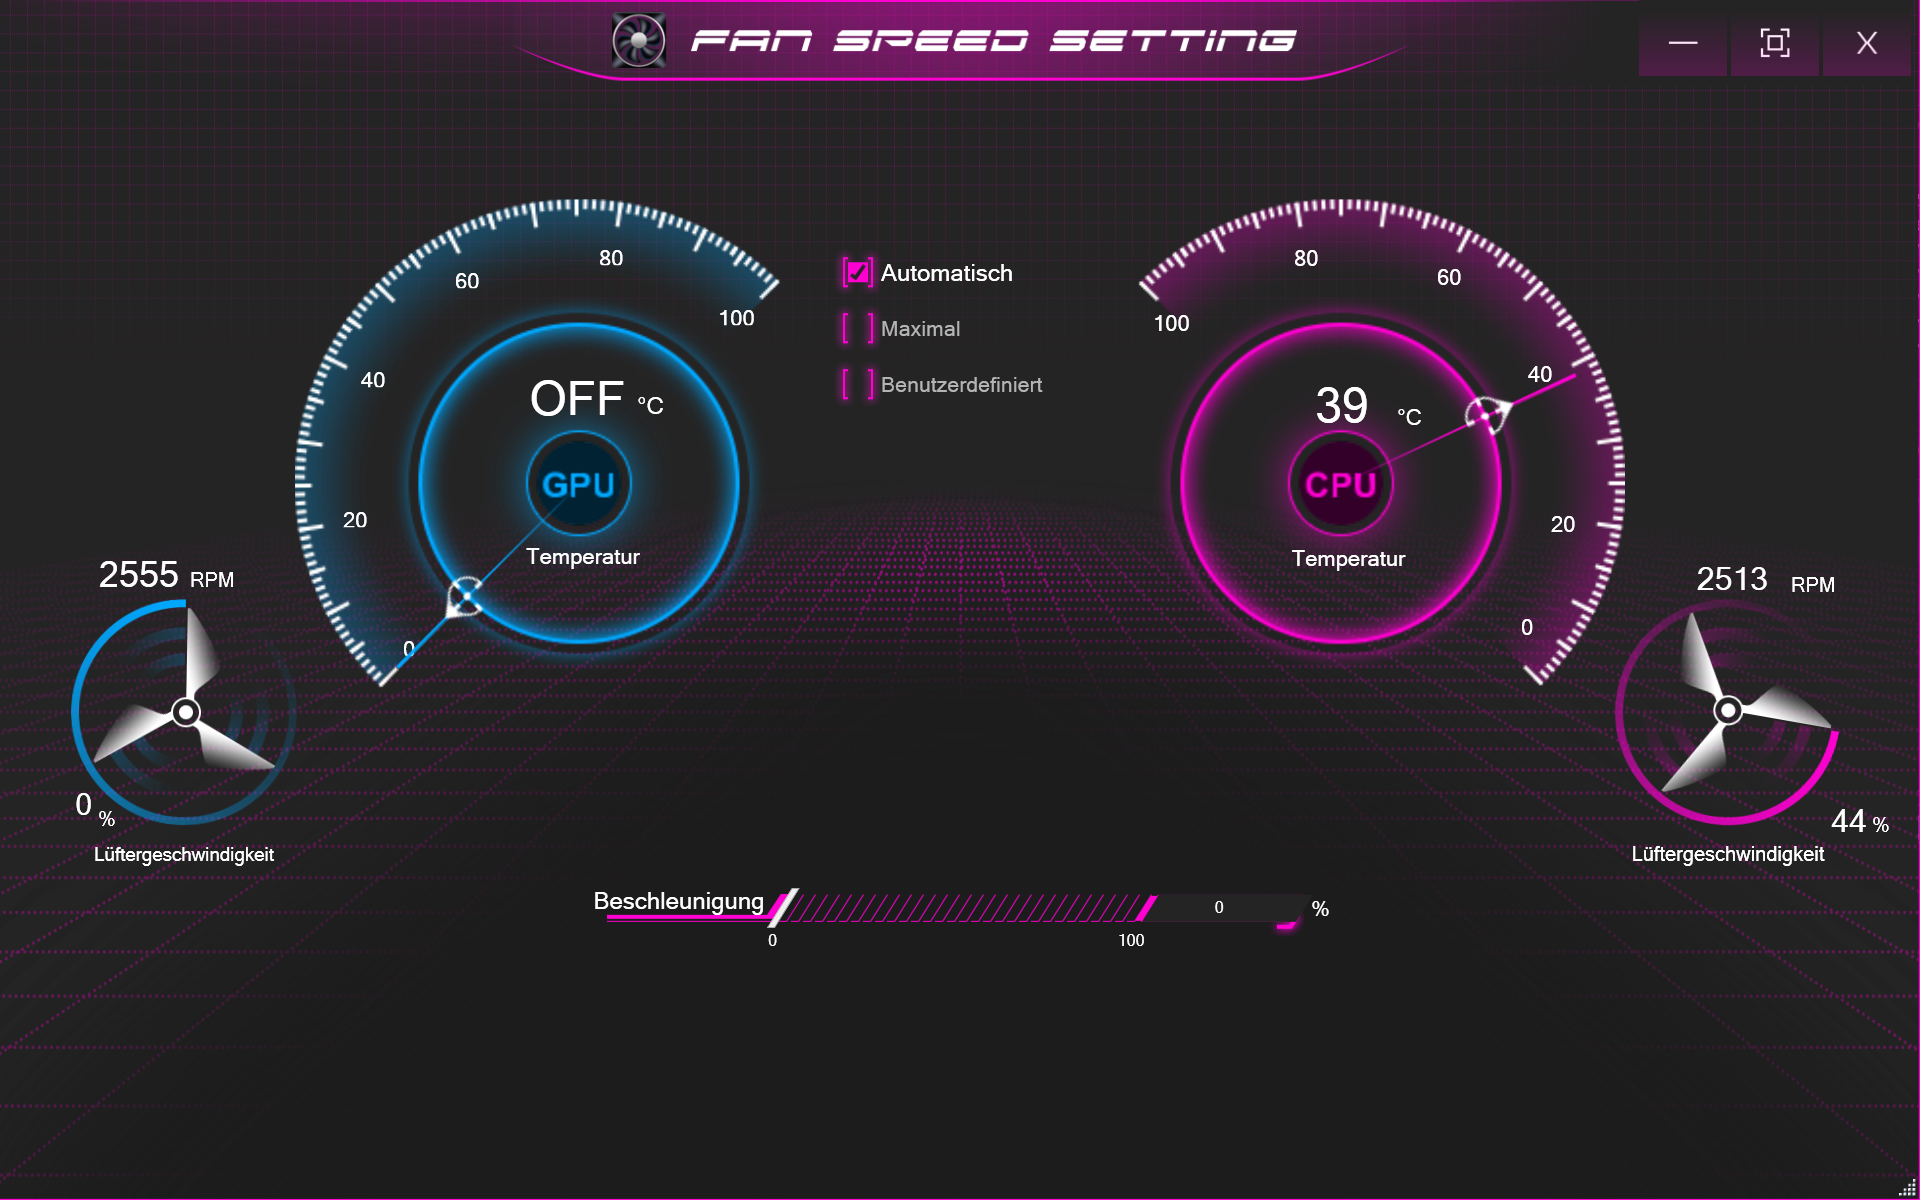
Le niveau de performance des portables Schenker actuels se règle via le Control Center 3.0. Vous y trouverez quatre choix de performances : du mode chuchotement au mode performance. La vitesse des ventilateurs, les limites de performance et les températures cibles sont spécifiées ici. Pour ceux qui aiment s'attaquer à ces paramètres, le Control Center offre également diverses options pour régler et surveiller la vitesse du ventilateur.
Celle-ci influe fortement sur les performances de l'ordinateur portable. En mode performance, 140 watts sont disponibles pour le CPU et le GPU. Lors des tests, nous avons observé un boost dynamique d'environ 25 watts. Le processeur seul peut fonctionner à une bonne puissance de 65 watts. En mode chuchotement ou en mode économie d'énergie, la consommation combinée de l'Intel Core i7 et de la Nvidia RTX 3060 tourne autour de 45 watts. Grâce aux différentes options de réglage du ventilateur, en mode économie d'énergie, la température du matériel augmente beaucoup plus lentement. De même, en mode batterie, nous avons mesuré une consommation d'énergie combinée d'environ 25 watts.
Analyse du journal
Processeur
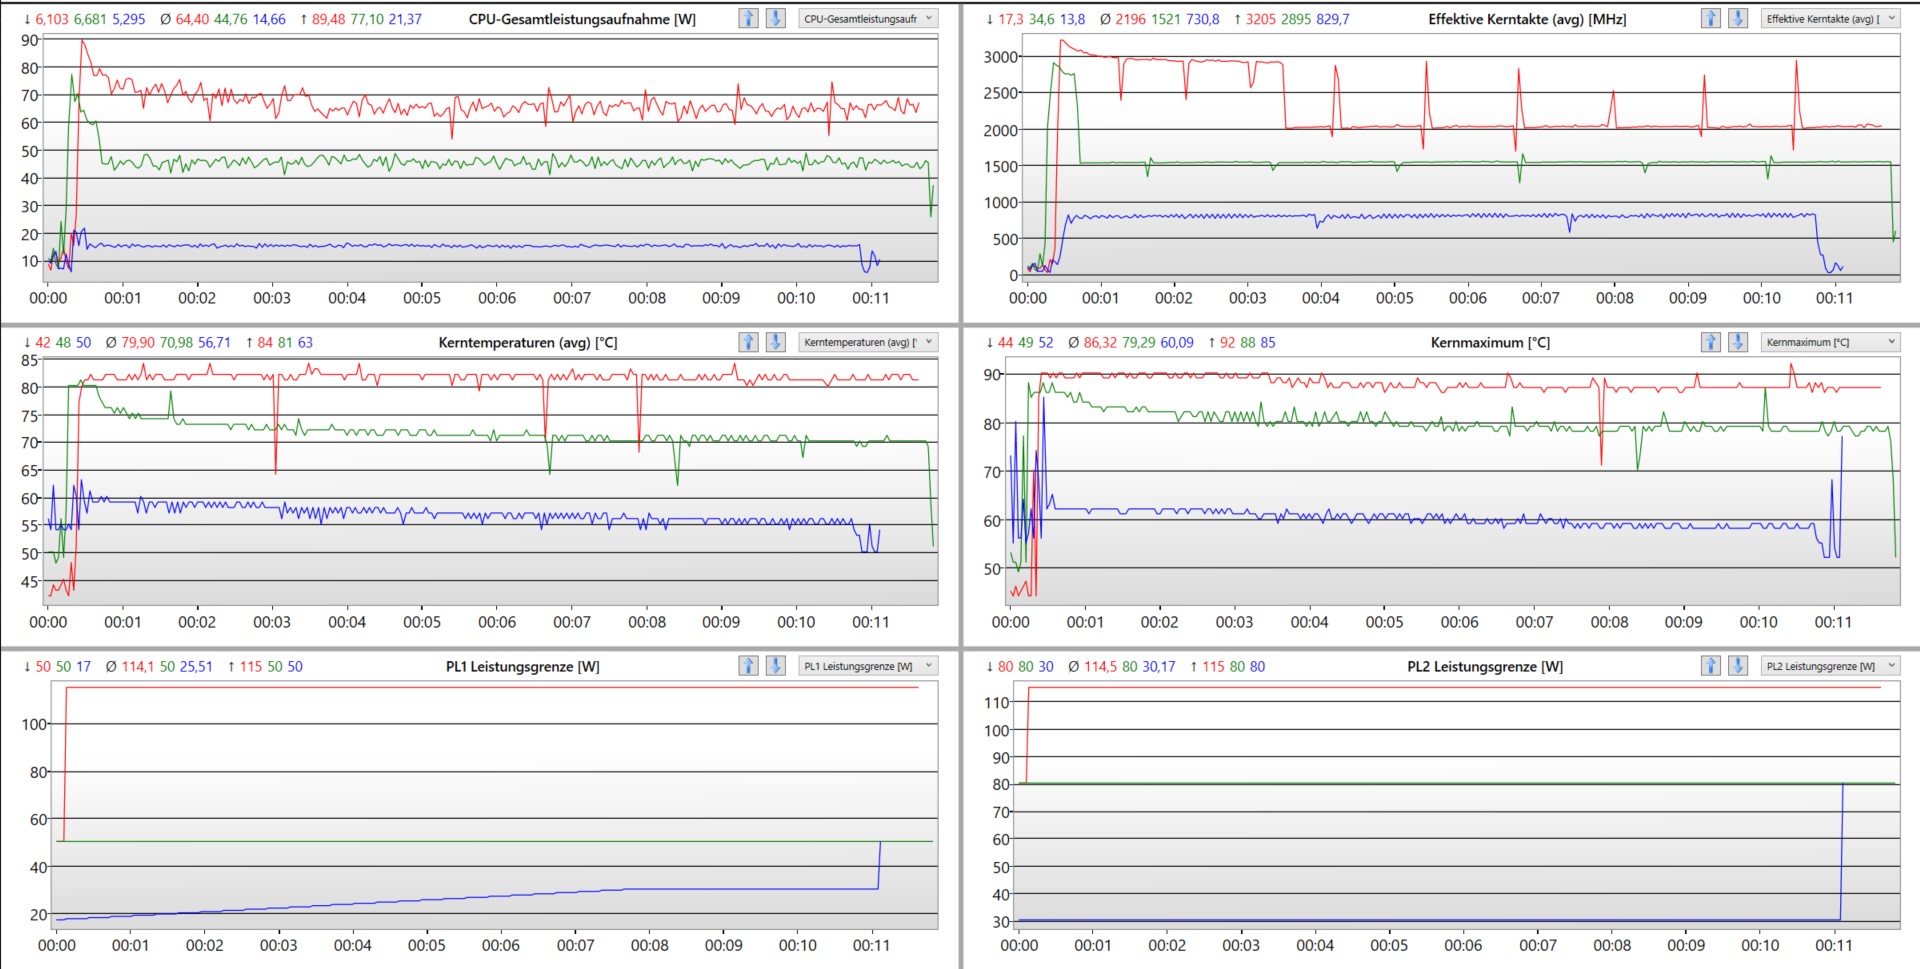
Le siteIntel Core i7-12700Hfait partie des processeurs les plus puissants de la génération Alder Lake d'Intel. Dans le Schenker XMG Focus 16, le processeur se comporte relativement bien sans atteindre ses meilleurs niveaux. Sur le long terme, le portable n'a pas supporté d'être poussé, les performances dans la boucle Cinbench ayant chuté au fil du temps de plus de 100 points.
En outre, les scores du processeur montrent que l'i7 de l'ordinateur portable de jeu se situe au milieu du peloton par rapport à ses concurrents. Néanmoins, ses performances sont supérieures à la performance moyenne d'unIntel Core i7-12700H. Toutefois, le 12700H donne le meilleur de lui-même dans le cadre de l'enquête sur les performances de l'ordinateur Lenovo Legion 5 Pro. Dans aucun ordinateur portable de notre base de données, le i7 n'est plus performant que celui du Legion. Nous avons déterminé une puissance relativement élevée de 105 watts pour PL2 dans le Schenker Laptop, mais seulement 65 watts pour PL1.
Cinebench R15 Multi sustained load
Cinebench R23: Multi Core | Single Core
Cinebench R20: CPU (Multi Core) | CPU (Single Core)
Cinebench R15: CPU Multi 64Bit | CPU Single 64Bit
Blender: v2.79 BMW27 CPU
7-Zip 18.03: 7z b 4 | 7z b 4 -mmt1
Geekbench 5.5: Multi-Core | Single-Core
HWBOT x265 Benchmark v2.2: 4k Preset
LibreOffice : 20 Documents To PDF
R Benchmark 2.5: Overall mean
| CPU Performance rating | |
| Moyenne de la classe Gaming | |
| Lenovo Legion 5 Pro 16IAH7H | |
| Asus ZenBook Pro 16X OLED UX7602ZM-ME115W | |
| Lenovo ThinkPad X1 Extreme G5-21DE003RGE | |
| Lenovo Legion Slim 7-16IAH 82TF004YGE | |
| Schenker XMG Focus 16 (i7-12700H, RTX 3060) | |
| Dell G16 7620 | |
| Moyenne Intel Core i7-12700H | |
| Asus ROG Flow X16 GV601RW-M5082W | |
| Cinebench R23 / Multi Core | |
| Moyenne de la classe Gaming (10488 - 40970, n=113, 2 dernières années) | |
| Lenovo Legion 5 Pro 16IAH7H | |
| Lenovo Legion Slim 7-16IAH 82TF004YGE | |
| Lenovo ThinkPad X1 Extreme G5-21DE003RGE | |
| Schenker XMG Focus 16 (i7-12700H, RTX 3060) | |
| Dell G16 7620 | |
| Asus ZenBook Pro 16X OLED UX7602ZM-ME115W | |
| Moyenne Intel Core i7-12700H (4032 - 19330, n=64) | |
| Asus ROG Flow X16 GV601RW-M5082W | |
| Cinebench R23 / Single Core | |
| Moyenne de la classe Gaming (1166 - 2356, n=113, 2 dernières années) | |
| Lenovo ThinkPad X1 Extreme G5-21DE003RGE | |
| Schenker XMG Focus 16 (i7-12700H, RTX 3060) | |
| Moyenne Intel Core i7-12700H (778 - 1826, n=63) | |
| Lenovo Legion Slim 7-16IAH 82TF004YGE | |
| Lenovo Legion 5 Pro 16IAH7H | |
| Dell G16 7620 | |
| Asus ZenBook Pro 16X OLED UX7602ZM-ME115W | |
| Asus ROG Flow X16 GV601RW-M5082W | |
| Cinebench R20 / CPU (Multi Core) | |
| Moyenne de la classe Gaming (4029 - 16108, n=112, 2 dernières années) | |
| Lenovo Legion 5 Pro 16IAH7H | |
| Lenovo ThinkPad X1 Extreme G5-21DE003RGE | |
| Lenovo Legion Slim 7-16IAH 82TF004YGE | |
| Dell G16 7620 | |
| Schenker XMG Focus 16 (i7-12700H, RTX 3060) | |
| Asus ZenBook Pro 16X OLED UX7602ZM-ME115W | |
| Moyenne Intel Core i7-12700H (1576 - 7407, n=64) | |
| Asus ROG Flow X16 GV601RW-M5082W | |
| Cinebench R20 / CPU (Single Core) | |
| Moyenne de la classe Gaming (442 - 895, n=112, 2 dernières années) | |
| Lenovo ThinkPad X1 Extreme G5-21DE003RGE | |
| Schenker XMG Focus 16 (i7-12700H, RTX 3060) | |
| Asus ZenBook Pro 16X OLED UX7602ZM-ME115W | |
| Moyenne Intel Core i7-12700H (300 - 704, n=64) | |
| Lenovo Legion Slim 7-16IAH 82TF004YGE | |
| Lenovo Legion 5 Pro 16IAH7H | |
| Dell G16 7620 | |
| Asus ROG Flow X16 GV601RW-M5082W | |
| Cinebench R15 / CPU Multi 64Bit | |
| Moyenne de la classe Gaming (1578 - 6271, n=113, 2 dernières années) | |
| Lenovo Legion 5 Pro 16IAH7H | |
| Lenovo Legion Slim 7-16IAH 82TF004YGE | |
| Lenovo ThinkPad X1 Extreme G5-21DE003RGE | |
| Schenker XMG Focus 16 (i7-12700H, RTX 3060) | |
| Dell G16 7620 | |
| Asus ZenBook Pro 16X OLED UX7602ZM-ME115W | |
| Moyenne Intel Core i7-12700H (1379 - 2916, n=70) | |
| Asus ROG Flow X16 GV601RW-M5082W | |
| Cinebench R15 / CPU Single 64Bit | |
| Moyenne de la classe Gaming (188.8 - 343, n=112, 2 dernières années) | |
| Asus ZenBook Pro 16X OLED UX7602ZM-ME115W | |
| Asus ZenBook Pro 16X OLED UX7602ZM-ME115W | |
| Lenovo ThinkPad X1 Extreme G5-21DE003RGE | |
| Schenker XMG Focus 16 (i7-12700H, RTX 3060) | |
| Lenovo Legion Slim 7-16IAH 82TF004YGE | |
| Moyenne Intel Core i7-12700H (113 - 263, n=65) | |
| Lenovo Legion 5 Pro 16IAH7H | |
| Dell G16 7620 | |
| Asus ROG Flow X16 GV601RW-M5082W | |
| Blender / v2.79 BMW27 CPU | |
| Moyenne Intel Core i7-12700H (168 - 732, n=63) | |
| Asus ROG Flow X16 GV601RW-M5082W | |
| Schenker XMG Focus 16 (i7-12700H, RTX 3060) | |
| Lenovo ThinkPad X1 Extreme G5-21DE003RGE | |
| Asus ZenBook Pro 16X OLED UX7602ZM-ME115W | |
| Dell G16 7620 | |
| Lenovo Legion Slim 7-16IAH 82TF004YGE | |
| Lenovo Legion 5 Pro 16IAH7H | |
| Moyenne de la classe Gaming (80 - 330, n=110, 2 dernières années) | |
| 7-Zip 18.03 / 7z b 4 | |
| Moyenne de la classe Gaming (33491 - 148086, n=111, 2 dernières années) | |
| Asus ZenBook Pro 16X OLED UX7602ZM-ME115W | |
| Lenovo Legion 5 Pro 16IAH7H | |
| Lenovo ThinkPad X1 Extreme G5-21DE003RGE | |
| Lenovo Legion Slim 7-16IAH 82TF004YGE | |
| Dell G16 7620 | |
| Schenker XMG Focus 16 (i7-12700H, RTX 3060) | |
| Asus ROG Flow X16 GV601RW-M5082W | |
| Moyenne Intel Core i7-12700H (22844 - 73067, n=63) | |
| 7-Zip 18.03 / 7z b 4 -mmt1 | |
| Moyenne de la classe Gaming (4199 - 7436, n=111, 2 dernières années) | |
| Lenovo ThinkPad X1 Extreme G5-21DE003RGE | |
| Asus ZenBook Pro 16X OLED UX7602ZM-ME115W | |
| Schenker XMG Focus 16 (i7-12700H, RTX 3060) | |
| Asus ROG Flow X16 GV601RW-M5082W | |
| Moyenne Intel Core i7-12700H (2743 - 5972, n=63) | |
| Lenovo Legion 5 Pro 16IAH7H | |
| Lenovo Legion Slim 7-16IAH 82TF004YGE | |
| Dell G16 7620 | |
| Geekbench 5.5 / Multi-Core | |
| Moyenne de la classe Gaming (6460 - 27010, n=111, 2 dernières années) | |
| Asus ZenBook Pro 16X OLED UX7602ZM-ME115W | |
| Lenovo Legion 5 Pro 16IAH7H | |
| Lenovo Legion Slim 7-16IAH 82TF004YGE | |
| Schenker XMG Focus 16 (i7-12700H, RTX 3060) | |
| Dell G16 7620 | |
| Lenovo ThinkPad X1 Extreme G5-21DE003RGE | |
| Moyenne Intel Core i7-12700H (5144 - 13745, n=64) | |
| Asus ROG Flow X16 GV601RW-M5082W | |
| Geekbench 5.5 / Single-Core | |
| Moyenne de la classe Gaming (986 - 2474, n=111, 2 dernières années) | |
| Asus ZenBook Pro 16X OLED UX7602ZM-ME115W | |
| Lenovo ThinkPad X1 Extreme G5-21DE003RGE | |
| Schenker XMG Focus 16 (i7-12700H, RTX 3060) | |
| Moyenne Intel Core i7-12700H (803 - 1851, n=64) | |
| Lenovo Legion Slim 7-16IAH 82TF004YGE | |
| Lenovo Legion 5 Pro 16IAH7H | |
| Dell G16 7620 | |
| Asus ROG Flow X16 GV601RW-M5082W | |
| HWBOT x265 Benchmark v2.2 / 4k Preset | |
| Moyenne de la classe Gaming (11.5 - 44.3, n=111, 2 dernières années) | |
| Lenovo Legion 5 Pro 16IAH7H | |
| Asus ZenBook Pro 16X OLED UX7602ZM-ME115W | |
| Dell G16 7620 | |
| Lenovo Legion Slim 7-16IAH 82TF004YGE | |
| Schenker XMG Focus 16 (i7-12700H, RTX 3060) | |
| Lenovo ThinkPad X1 Extreme G5-21DE003RGE | |
| Moyenne Intel Core i7-12700H (4.67 - 21.8, n=64) | |
| Asus ROG Flow X16 GV601RW-M5082W | |
| LibreOffice / 20 Documents To PDF | |
| Asus ROG Flow X16 GV601RW-M5082W | |
| Dell G16 7620 | |
| Moyenne de la classe Gaming (19 - 88.8, n=111, 2 dernières années) | |
| Moyenne Intel Core i7-12700H (34.2 - 95.3, n=63) | |
| Schenker XMG Focus 16 (i7-12700H, RTX 3060) | |
| Lenovo ThinkPad X1 Extreme G5-21DE003RGE | |
| Lenovo Legion 5 Pro 16IAH7H | |
| Lenovo Legion Slim 7-16IAH 82TF004YGE | |
| Asus ZenBook Pro 16X OLED UX7602ZM-ME115W | |
| R Benchmark 2.5 / Overall mean | |
| Dell G16 7620 | |
| Asus ROG Flow X16 GV601RW-M5082W | |
| Lenovo Legion 5 Pro 16IAH7H | |
| Moyenne Intel Core i7-12700H (0.4441 - 1.052, n=63) | |
| Lenovo Legion Slim 7-16IAH 82TF004YGE | |
| Schenker XMG Focus 16 (i7-12700H, RTX 3060) | |
| Lenovo ThinkPad X1 Extreme G5-21DE003RGE | |
| Asus ZenBook Pro 16X OLED UX7602ZM-ME115W | |
| Moyenne de la classe Gaming (0.3439 - 0.759, n=112, 2 dernières années) | |
* ... Moindre est la valeur, meilleures sont les performances
AIDA64: FP32 Ray-Trace | FPU Julia | CPU SHA3 | CPU Queen | FPU SinJulia | FPU Mandel | CPU AES | CPU ZLib | FP64 Ray-Trace | CPU PhotoWorxx
| Performance rating | |
| Moyenne de la classe Gaming | |
| Asus ROG Flow X16 GV601RW-M5082W | |
| Lenovo Legion Slim 7-16IAH 82TF004YGE | |
| Asus ZenBook Pro 16X OLED UX7602ZM-ME115W | |
| Schenker XMG Focus 16 (i7-12700H, RTX 3060) | |
| Dell G16 7620 | |
| Lenovo ThinkPad X1 Extreme G5-21DE003RGE | |
| Lenovo Legion 5 Pro 16IAH7H | |
| Moyenne Intel Core i7-12700H | |
| AIDA64 / FP32 Ray-Trace | |
| Moyenne de la classe Gaming (10227 - 85542, n=110, 2 dernières années) | |
| Lenovo Legion Slim 7-16IAH 82TF004YGE | |
| Lenovo ThinkPad X1 Extreme G5-21DE003RGE | |
| Asus ROG Flow X16 GV601RW-M5082W | |
| Schenker XMG Focus 16 (i7-12700H, RTX 3060) | |
| Dell G16 7620 | |
| Lenovo Legion 5 Pro 16IAH7H | |
| Lenovo Legion 5 Pro 16IAH7H | |
| Asus ZenBook Pro 16X OLED UX7602ZM-ME115W | |
| Moyenne Intel Core i7-12700H (2585 - 17957, n=64) | |
| AIDA64 / FPU Julia | |
| Moyenne de la classe Gaming (51376 - 238426, n=110, 2 dernières années) | |
| Asus ROG Flow X16 GV601RW-M5082W | |
| Lenovo Legion Slim 7-16IAH 82TF004YGE | |
| Schenker XMG Focus 16 (i7-12700H, RTX 3060) | |
| Lenovo ThinkPad X1 Extreme G5-21DE003RGE | |
| Dell G16 7620 | |
| Lenovo Legion 5 Pro 16IAH7H | |
| Lenovo Legion 5 Pro 16IAH7H | |
| Asus ZenBook Pro 16X OLED UX7602ZM-ME115W | |
| Moyenne Intel Core i7-12700H (12439 - 90760, n=64) | |
| AIDA64 / CPU SHA3 | |
| Moyenne de la classe Gaming (2180 - 9817, n=110, 2 dernières années) | |
| Lenovo Legion Slim 7-16IAH 82TF004YGE | |
| Schenker XMG Focus 16 (i7-12700H, RTX 3060) | |
| Lenovo ThinkPad X1 Extreme G5-21DE003RGE | |
| Dell G16 7620 | |
| Asus ZenBook Pro 16X OLED UX7602ZM-ME115W | |
| Asus ROG Flow X16 GV601RW-M5082W | |
| Lenovo Legion 5 Pro 16IAH7H | |
| Lenovo Legion 5 Pro 16IAH7H | |
| Moyenne Intel Core i7-12700H (833 - 4242, n=64) | |
| AIDA64 / CPU Queen | |
| Moyenne de la classe Gaming (49785 - 173351, n=101, 2 dernières années) | |
| Asus ZenBook Pro 16X OLED UX7602ZM-ME115W | |
| Asus ROG Flow X16 GV601RW-M5082W | |
| Lenovo Legion Slim 7-16IAH 82TF004YGE | |
| Schenker XMG Focus 16 (i7-12700H, RTX 3060) | |
| Lenovo ThinkPad X1 Extreme G5-21DE003RGE | |
| Dell G16 7620 | |
| Lenovo Legion 5 Pro 16IAH7H | |
| Moyenne Intel Core i7-12700H (57923 - 103202, n=63) | |
| AIDA64 / FPU SinJulia | |
| Moyenne de la classe Gaming (4424 - 33636, n=110, 2 dernières années) | |
| Asus ROG Flow X16 GV601RW-M5082W | |
| Lenovo Legion 5 Pro 16IAH7H | |
| Lenovo Legion 5 Pro 16IAH7H | |
| Dell G16 7620 | |
| Lenovo ThinkPad X1 Extreme G5-21DE003RGE | |
| Lenovo Legion Slim 7-16IAH 82TF004YGE | |
| Schenker XMG Focus 16 (i7-12700H, RTX 3060) | |
| Asus ZenBook Pro 16X OLED UX7602ZM-ME115W | |
| Moyenne Intel Core i7-12700H (3249 - 9939, n=64) | |
| AIDA64 / FPU Mandel | |
| Moyenne de la classe Gaming (25115 - 128721, n=110, 2 dernières années) | |
| Asus ROG Flow X16 GV601RW-M5082W | |
| Lenovo Legion Slim 7-16IAH 82TF004YGE | |
| Lenovo ThinkPad X1 Extreme G5-21DE003RGE | |
| Schenker XMG Focus 16 (i7-12700H, RTX 3060) | |
| Lenovo Legion 5 Pro 16IAH7H | |
| Lenovo Legion 5 Pro 16IAH7H | |
| Asus ZenBook Pro 16X OLED UX7602ZM-ME115W | |
| Dell G16 7620 | |
| Moyenne Intel Core i7-12700H (7135 - 44760, n=64) | |
| AIDA64 / CPU ZLib | |
| Moyenne de la classe Gaming (574 - 2531, n=110, 2 dernières années) | |
| Lenovo Legion 5 Pro 16IAH7H | |
| Lenovo Legion 5 Pro 16IAH7H | |
| Schenker XMG Focus 16 (i7-12700H, RTX 3060) | |
| Lenovo ThinkPad X1 Extreme G5-21DE003RGE | |
| Dell G16 7620 | |
| Asus ZenBook Pro 16X OLED UX7602ZM-ME115W | |
| Lenovo Legion Slim 7-16IAH 82TF004YGE | |
| Moyenne Intel Core i7-12700H (305 - 1171, n=64) | |
| Asus ROG Flow X16 GV601RW-M5082W | |
| AIDA64 / FP64 Ray-Trace | |
| Moyenne de la classe Gaming (5509 - 45446, n=110, 2 dernières années) | |
| Asus ROG Flow X16 GV601RW-M5082W | |
| Lenovo ThinkPad X1 Extreme G5-21DE003RGE | |
| Lenovo Legion Slim 7-16IAH 82TF004YGE | |
| Schenker XMG Focus 16 (i7-12700H, RTX 3060) | |
| Asus ZenBook Pro 16X OLED UX7602ZM-ME115W | |
| Dell G16 7620 | |
| Lenovo Legion 5 Pro 16IAH7H | |
| Lenovo Legion 5 Pro 16IAH7H | |
| Moyenne Intel Core i7-12700H (1437 - 9692, n=64) | |
| AIDA64 / CPU PhotoWorxx | |
| Asus ZenBook Pro 16X OLED UX7602ZM-ME115W | |
| Moyenne de la classe Gaming (12271 - 89891, n=110, 2 dernières années) | |
| Lenovo Legion Slim 7-16IAH 82TF004YGE | |
| Dell G16 7620 | |
| Lenovo Legion 5 Pro 16IAH7H | |
| Lenovo Legion 5 Pro 16IAH7H | |
| Moyenne Intel Core i7-12700H (12863 - 52207, n=64) | |
| Schenker XMG Focus 16 (i7-12700H, RTX 3060) | |
| Asus ROG Flow X16 GV601RW-M5082W | |
| Lenovo ThinkPad X1 Extreme G5-21DE003RGE | |
Performance du système
Si l'on ne peut pas accuser l'ordinateur portable Schenker de faiblesse dans le cadre d'une utilisation normale, une comparaison avec d'autres ordinateurs portables de jeu puissants montre que l'on peut faire mieux. Les résultats des tests PCMark10 et Crossmark sont légèrement inférieurs à la moyenne. Étant donné que les deux programmes de benchmark ne soumettent pas le SSD à un stress à long terme dans aucun des sous-tests, la mémoire DDR4 un peu plus lente et les performances comparativement faibles du processeur sont plus susceptibles d'être les coupables.
CrossMark: Overall | Productivity | Creativity | Responsiveness
| PCMark 10 / Score | |
| Moyenne de la classe Gaming (5828 - 11574, n=96, 2 dernières années) | |
| Lenovo Legion 5 Pro 16IAH7H | |
| Asus ZenBook Pro 16X OLED UX7602ZM-ME115W | |
| Lenovo Legion Slim 7-16IAH 82TF004YGE | |
| Lenovo ThinkPad X1 Extreme G5-21DE003RGE | |
| Moyenne Intel Core i7-12700H, NVIDIA GeForce RTX 3060 Laptop GPU (5986 - 8156, n=12) | |
| Dell G16 7620 | |
| Schenker XMG Focus 16 (i7-12700H, RTX 3060) | |
| Asus ROG Flow X16 GV601RW-M5082W | |
| PCMark 10 / Essentials | |
| Lenovo Legion 5 Pro 16IAH7H | |
| Asus ZenBook Pro 16X OLED UX7602ZM-ME115W | |
| Lenovo Legion Slim 7-16IAH 82TF004YGE | |
| Moyenne de la classe Gaming (8810 - 12600, n=100, 2 dernières années) | |
| Moyenne Intel Core i7-12700H, NVIDIA GeForce RTX 3060 Laptop GPU (9289 - 12144, n=12) | |
| Lenovo ThinkPad X1 Extreme G5-21DE003RGE | |
| Dell G16 7620 | |
| Schenker XMG Focus 16 (i7-12700H, RTX 3060) | |
| Asus ROG Flow X16 GV601RW-M5082W | |
| PCMark 10 / Productivity | |
| Moyenne de la classe Gaming (6845 - 18766, n=98, 2 dernières années) | |
| Asus ZenBook Pro 16X OLED UX7602ZM-ME115W | |
| Schenker XMG Focus 16 (i7-12700H, RTX 3060) | |
| Asus ROG Flow X16 GV601RW-M5082W | |
| Lenovo Legion Slim 7-16IAH 82TF004YGE | |
| Lenovo Legion 5 Pro 16IAH7H | |
| Lenovo ThinkPad X1 Extreme G5-21DE003RGE | |
| Moyenne Intel Core i7-12700H, NVIDIA GeForce RTX 3060 Laptop GPU (6161 - 10362, n=12) | |
| Dell G16 7620 | |
| PCMark 10 / Digital Content Creation | |
| Moyenne de la classe Gaming (7602 - 19657, n=98, 2 dernières années) | |
| Lenovo Legion 5 Pro 16IAH7H | |
| Dell G16 7620 | |
| Lenovo Legion Slim 7-16IAH 82TF004YGE | |
| Moyenne Intel Core i7-12700H, NVIDIA GeForce RTX 3060 Laptop GPU (8950 - 12554, n=12) | |
| Lenovo ThinkPad X1 Extreme G5-21DE003RGE | |
| Asus ZenBook Pro 16X OLED UX7602ZM-ME115W | |
| Schenker XMG Focus 16 (i7-12700H, RTX 3060) | |
| Asus ROG Flow X16 GV601RW-M5082W | |
| CrossMark / Overall | |
| Moyenne de la classe Gaming (1366 - 2409, n=98, 2 dernières années) | |
| Lenovo Legion Slim 7-16IAH 82TF004YGE | |
| Moyenne Intel Core i7-12700H, NVIDIA GeForce RTX 3060 Laptop GPU (1649 - 2017, n=11) | |
| Asus ZenBook Pro 16X OLED UX7602ZM-ME115W | |
| Dell G16 7620 | |
| Lenovo Legion 5 Pro 16IAH7H | |
| Lenovo ThinkPad X1 Extreme G5-21DE003RGE | |
| Asus ROG Flow X16 GV601RW-M5082W | |
| Schenker XMG Focus 16 (i7-12700H, RTX 3060) | |
| CrossMark / Productivity | |
| Moyenne de la classe Gaming (1386 - 2254, n=98, 2 dernières années) | |
| Lenovo Legion Slim 7-16IAH 82TF004YGE | |
| Moyenne Intel Core i7-12700H, NVIDIA GeForce RTX 3060 Laptop GPU (1536 - 1958, n=11) | |
| Lenovo Legion 5 Pro 16IAH7H | |
| Dell G16 7620 | |
| Asus ZenBook Pro 16X OLED UX7602ZM-ME115W | |
| Lenovo ThinkPad X1 Extreme G5-21DE003RGE | |
| Asus ROG Flow X16 GV601RW-M5082W | |
| Schenker XMG Focus 16 (i7-12700H, RTX 3060) | |
| CrossMark / Creativity | |
| Moyenne de la classe Gaming (1343 - 2729, n=98, 2 dernières années) | |
| Asus ZenBook Pro 16X OLED UX7602ZM-ME115W | |
| Lenovo Legion Slim 7-16IAH 82TF004YGE | |
| Moyenne Intel Core i7-12700H, NVIDIA GeForce RTX 3060 Laptop GPU (1816 - 2084, n=11) | |
| Dell G16 7620 | |
| Lenovo ThinkPad X1 Extreme G5-21DE003RGE | |
| Lenovo Legion 5 Pro 16IAH7H | |
| Schenker XMG Focus 16 (i7-12700H, RTX 3060) | |
| Asus ROG Flow X16 GV601RW-M5082W | |
| CrossMark / Responsiveness | |
| Lenovo Legion Slim 7-16IAH 82TF004YGE | |
| Lenovo Legion 5 Pro 16IAH7H | |
| Moyenne de la classe Gaming (1226 - 2334, n=98, 2 dernières années) | |
| Moyenne Intel Core i7-12700H, NVIDIA GeForce RTX 3060 Laptop GPU (1210 - 2207, n=11) | |
| Dell G16 7620 | |
| Asus ZenBook Pro 16X OLED UX7602ZM-ME115W | |
| Lenovo ThinkPad X1 Extreme G5-21DE003RGE | |
| Asus ROG Flow X16 GV601RW-M5082W | |
| Schenker XMG Focus 16 (i7-12700H, RTX 3060) | |
| PCMark 10 Score | 7134 points | |
Aide | ||
| AIDA64 / Memory Copy | |
| Moyenne de la classe Gaming (21750 - 129946, n=110, 2 dernières années) | |
| Asus ZenBook Pro 16X OLED UX7602ZM-ME115W | |
| Lenovo Legion 5 Pro 16IAH7H | |
| Lenovo Legion 5 Pro 16IAH7H | |
| Dell G16 7620 | |
| Moyenne Intel Core i7-12700H (25615 - 80511, n=64) | |
| Lenovo Legion Slim 7-16IAH 82TF004YGE | |
| Asus ROG Flow X16 GV601RW-M5082W | |
| Schenker XMG Focus 16 (i7-12700H, RTX 3060) | |
| Lenovo ThinkPad X1 Extreme G5-21DE003RGE | |
| AIDA64 / Memory Read | |
| Moyenne de la classe Gaming (22956 - 118858, n=110, 2 dernières années) | |
| Asus ZenBook Pro 16X OLED UX7602ZM-ME115W | |
| Dell G16 7620 | |
| Lenovo Legion 5 Pro 16IAH7H | |
| Lenovo Legion 5 Pro 16IAH7H | |
| Lenovo Legion Slim 7-16IAH 82TF004YGE | |
| Moyenne Intel Core i7-12700H (25586 - 79442, n=64) | |
| Asus ROG Flow X16 GV601RW-M5082W | |
| Schenker XMG Focus 16 (i7-12700H, RTX 3060) | |
| Lenovo ThinkPad X1 Extreme G5-21DE003RGE | |
| AIDA64 / Memory Write | |
| Moyenne de la classe Gaming (22297 - 135096, n=110, 2 dernières années) | |
| Asus ZenBook Pro 16X OLED UX7602ZM-ME115W | |
| Lenovo Legion 5 Pro 16IAH7H | |
| Lenovo Legion 5 Pro 16IAH7H | |
| Lenovo Legion Slim 7-16IAH 82TF004YGE | |
| Dell G16 7620 | |
| Asus ROG Flow X16 GV601RW-M5082W | |
| Moyenne Intel Core i7-12700H (23679 - 88660, n=64) | |
| Schenker XMG Focus 16 (i7-12700H, RTX 3060) | |
| Lenovo ThinkPad X1 Extreme G5-21DE003RGE | |
| AIDA64 / Memory Latency | |
| Lenovo Legion 5 Pro 16IAH7H | |
| Lenovo Legion 5 Pro 16IAH7H | |
| Asus ZenBook Pro 16X OLED UX7602ZM-ME115W | |
| Moyenne de la classe Gaming (75.3 - 259, n=110, 2 dernières années) | |
| Dell G16 7620 | |
| Lenovo Legion Slim 7-16IAH 82TF004YGE | |
| Asus ROG Flow X16 GV601RW-M5082W | |
| Schenker XMG Focus 16 (i7-12700H, RTX 3060) | |
| Lenovo ThinkPad X1 Extreme G5-21DE003RGE | |
| Moyenne Intel Core i7-12700H (76.2 - 133.9, n=62) | |
* ... Moindre est la valeur, meilleures sont les performances
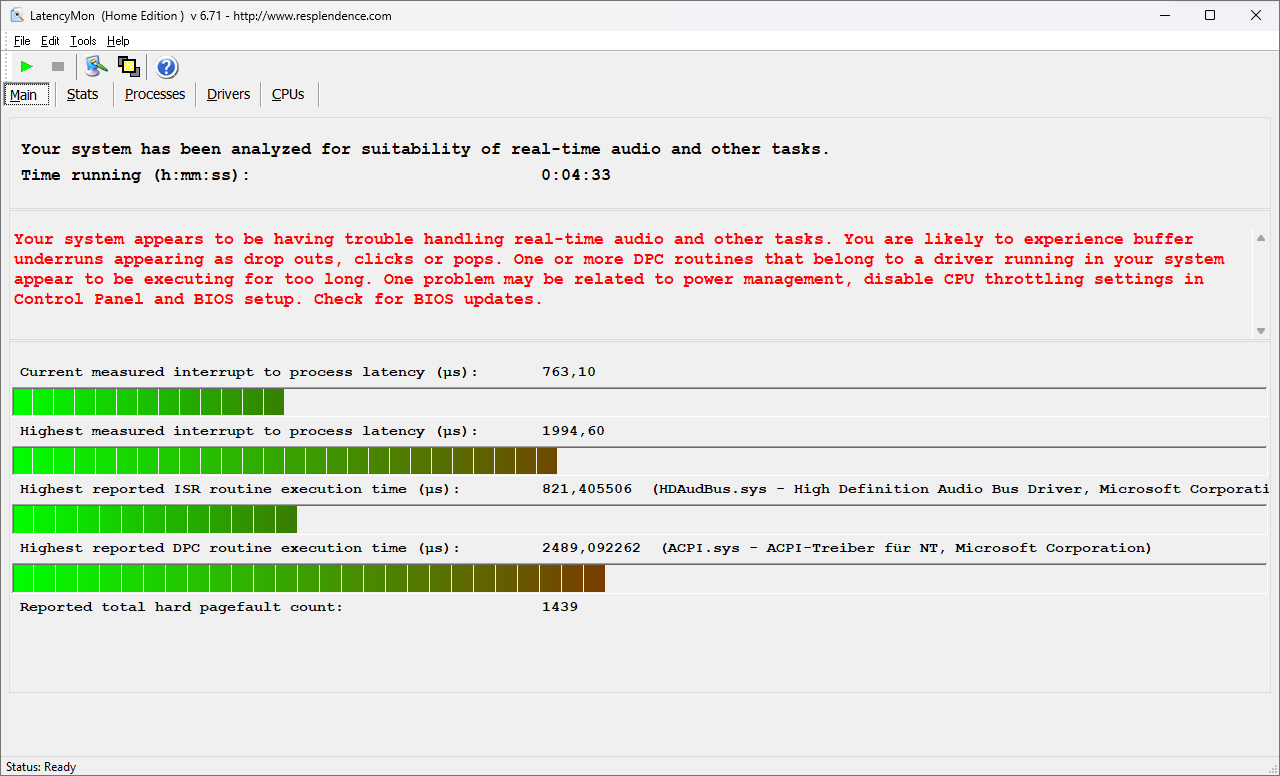
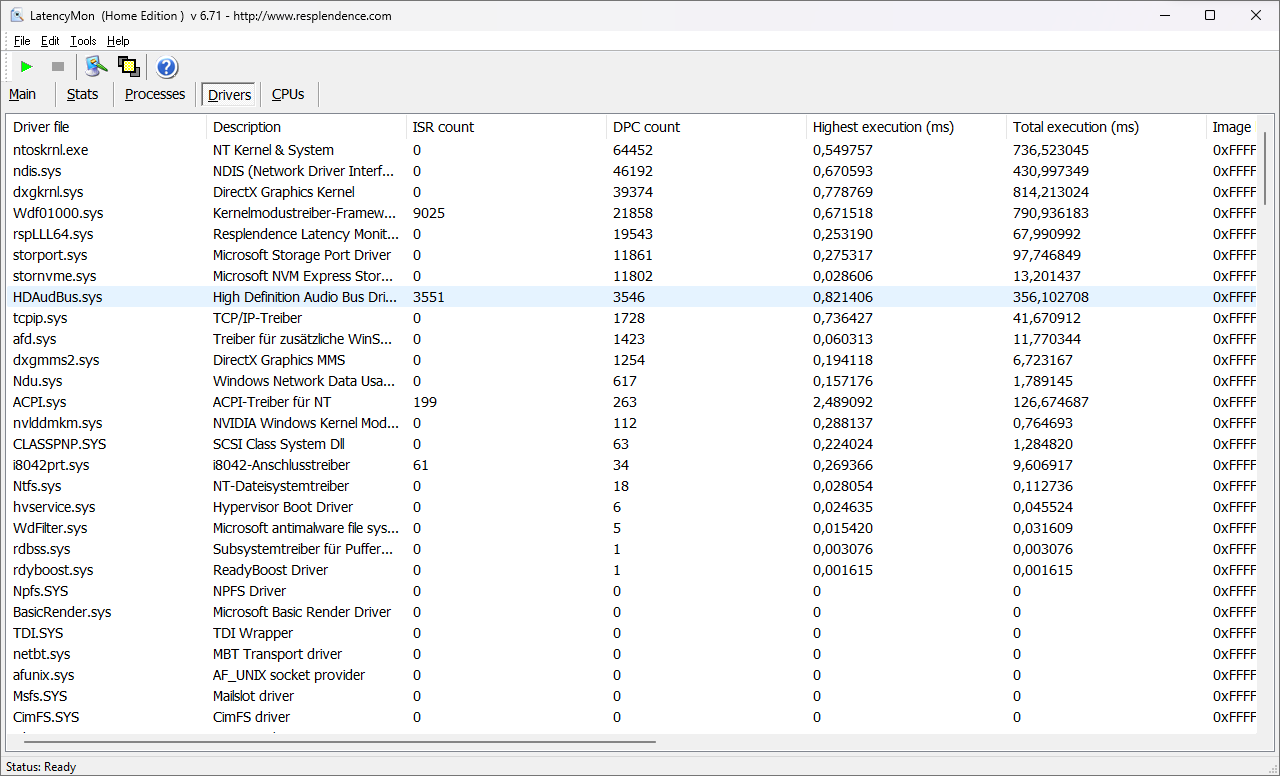
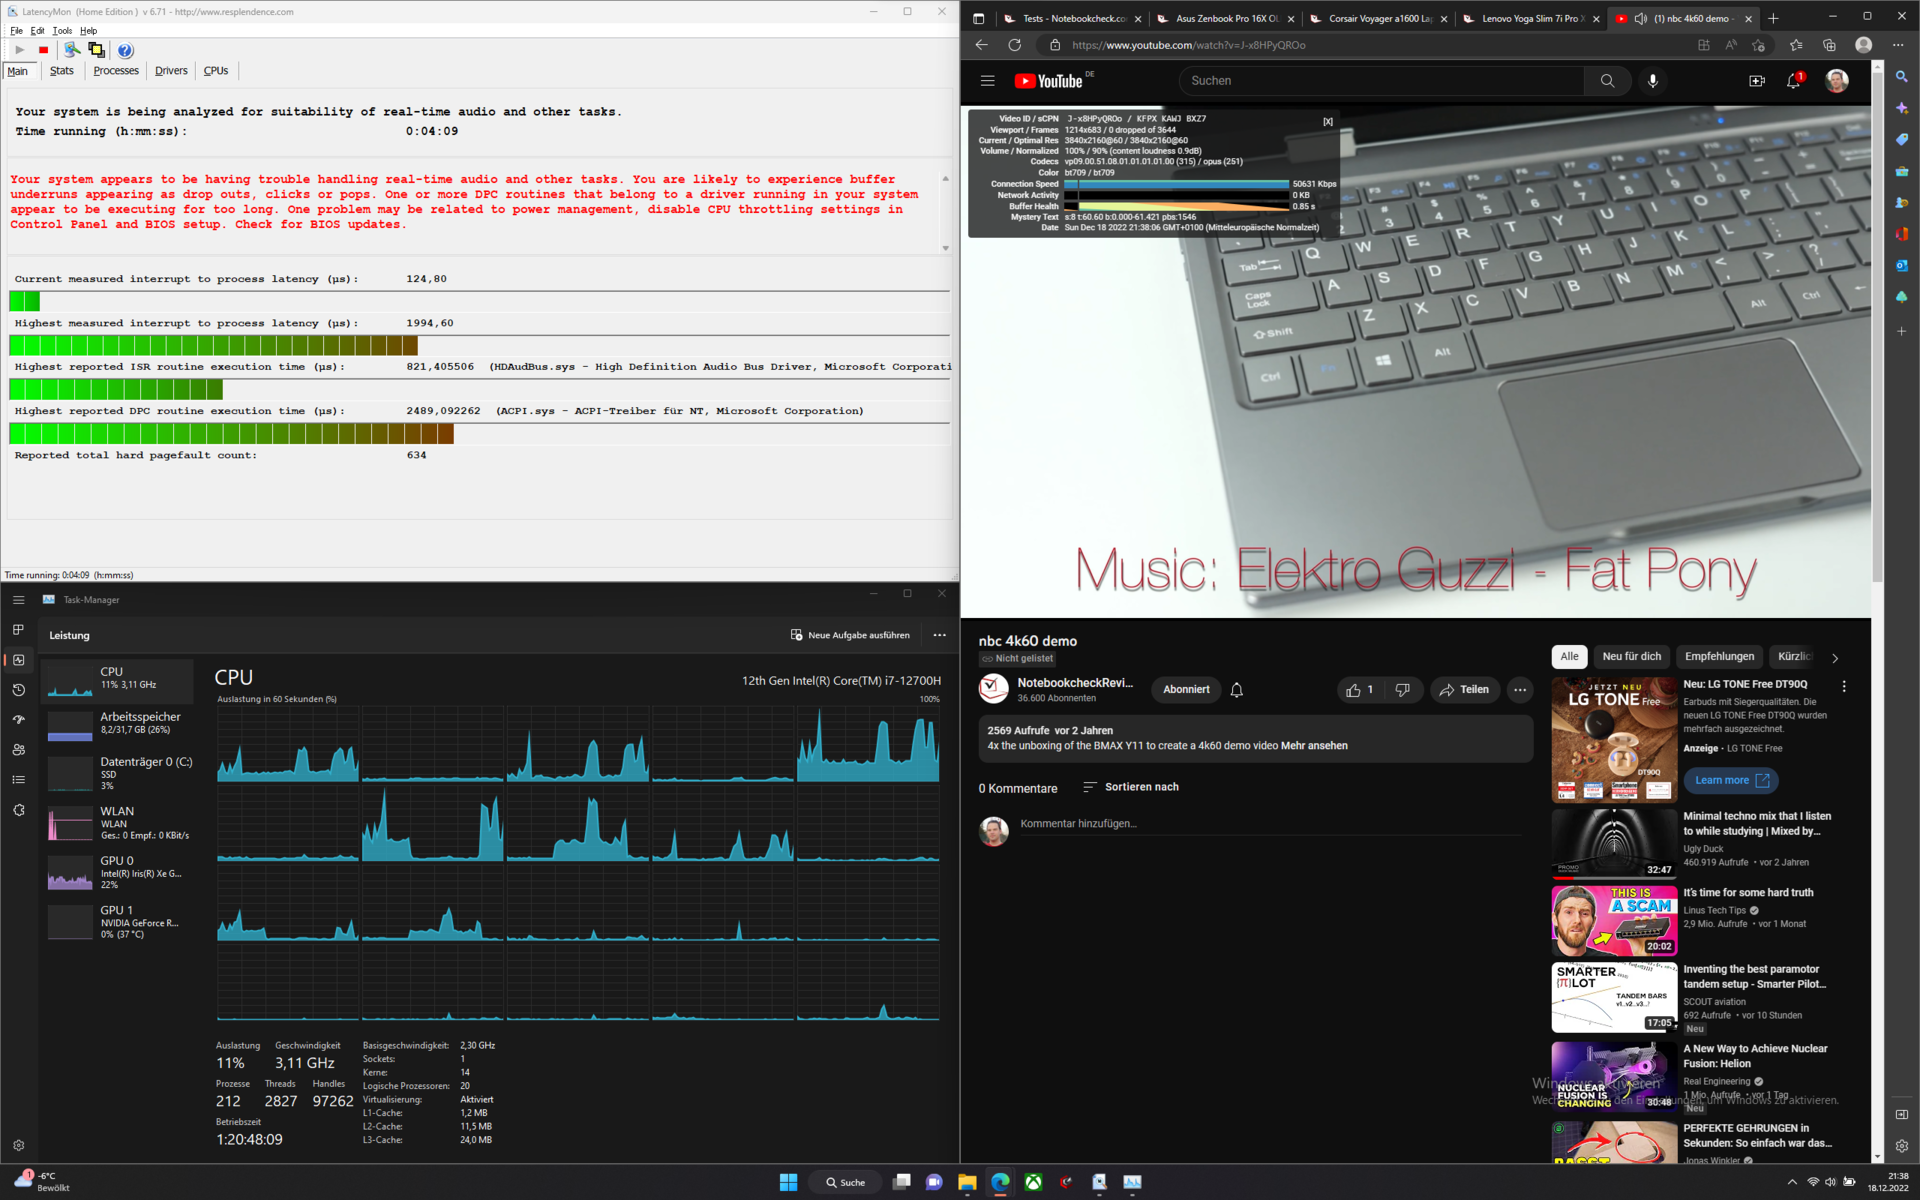
Latences DPC
Le XMG Focus 16 n'est pas le seul à présenter des latences DPC élevées. Avec la combinaison actuelle de pilotes, l'ordinateur portable de jeu a enregistré des niveaux élevés et n'est donc pas adapté aux applications en temps réel. Aucune image n'a été sautée lors du test YouTube 4K 60Hz.
| DPC Latencies / LatencyMon - interrupt to process latency (max), Web, Youtube, Prime95 | |
| Schenker XMG Focus 16 (i7-12700H, RTX 3060) | |
| Asus ROG Flow X16 GV601RW-M5082W | |
| Lenovo ThinkPad X1 Extreme G5-21DE003RGE | |
| Dell G16 7620 | |
| Lenovo Legion 5 Pro 16IAH7H | |
| Lenovo Legion Slim 7-16IAH 82TF004YGE | |
| Asus ZenBook Pro 16X OLED UX7602ZM-ME115W | |
* ... Moindre est la valeur, meilleures sont les performances
Mémoire de masse
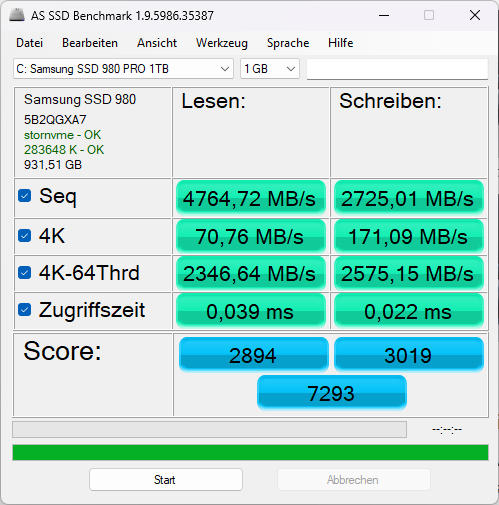
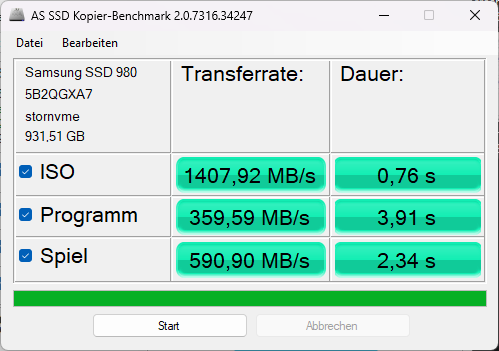
L'ordinateur portable de jeu Schenker possède un Samsung SSD 980 Pro de 1 To. Ce puissant disque SSD est proche du sommet de notre tableau de référence des disques SSD et des disques durs. Le stockage NVMe de l'ordinateur portable de jeu est également très performant. Cependant, après quelques exécutions dans la boucle DiskSpd, le SSD NVMe a subi un ralentissement significatif. Ce comportement indique une mauvaise dissipation de la chaleur. Alors que de nombreux autres fabricants ont commencé à mettre en place des coussinets thermiques sur ou sous les SSD, afin de dissiper la chaleur opérationnelle, on ne peut pas en dire autant de l'ordinateur portable de Schenker.

* ... Moindre est la valeur, meilleures sont les performances
Continuous performance read: DiskSpd Read Loop, Queue Depth 8
Carte graphique
UnNvidia GeForce RTX 3060fait son travail dans le XMG Focus 16. Selon les exigences de qualité, la carte graphique est adaptée aux jeux en Full HD ou QHD. La 3060 de l'ordinateur portable Schenker devrait être capable de faire tourner la plupart des titres actuels à plus de 60 images par seconde à la pleine résolution de l'écran. Seuls quelques jeux nécessitent plus de puissance.
Après des résultats de performance système peu inspirants, la carte graphique de l'appareil Schenker nous a surpris par ses excellentes performances. Dans la plupart des benchmarks, la 3060 de Schenker a obtenu des scores élevés. Le score très élevé dans le benchmark 3DMark Cloud Gate indique un accès rapide à la mémoire graphique.
| 3DMark 11 Performance | 26508 points | |
| 3DMark Ice Storm Standard Score | 147494 points | |
| 3DMark Cloud Gate Standard Score | 57261 points | |
| 3DMark Fire Strike Score | 19951 points | |
| 3DMark Time Spy Score | 8675 points | |
Aide | ||
* ... Moindre est la valeur, meilleures sont les performances
Performances de jeu
Le Nvidia GeForce RTX 3060 devrait être suffisamment puissant pour jouer à la plupart des jeux actuels à 60 images par seconde dans les réglages les plus élevés en utilisant la résolution QHD de l'écran. Cependant, cet écran offre un taux de rafraîchissement de 165 Hz. Les résultats des benchmarks montrent qu'il est possible d'atteindre 165fps en Full HD avec des paramètres de qualité moyenne.
Comparé à d'autres ordinateurs portables de jeu, le XMG Focus 16 a obtenu des résultats moyennement bons. Cependant, leLenovo Legion 5 Proet leDell G16sont un peu plus puissants.
Witcher 3 les taux de rafraîchissement affichent le comportement jour/nuit typique du jeu. Pendant le jeu, le taux d'images change en fonction de l'augmentation ou de la diminution de la distance de tir.
Witcher 3 fps-diagram
| Bas | Moyen | Élevé | Ultra | QHD | 4K | |
|---|---|---|---|---|---|---|
| GTA V (2015) | 183.8 | 179.1 | 167.9 | 94.7 | 80.9 | |
| The Witcher 3 (2015) | 80 | |||||
| Dota 2 Reborn (2015) | 165.8 | 151.7 | 143.4 | 135.7 | 103.4 | |
| Final Fantasy XV Benchmark (2018) | 111.4 | 84.5 | 64.3 | 37.8 | ||
| X-Plane 11.11 (2018) | 137.6 | 123.9 | 99.5 | 89 | ||
| Strange Brigade (2018) | 340 | 210 | 171.2 | 150.1 | ||
| F1 22 (2022) | 168 | 166.1 | 141.8 | 53.5 | 34.8 |
Emissions - les ventilateurs peuvent être réglés grâce au Control Center
Émissions sonores
En comparaison directe, 54 dB(A) en charge n'est pas exactement silencieux. Si l'ordinateur portable doit vraiment être aussi silencieux qu'une souris, Control Center 3.0 propose un mode silencieux.
Degré de la nuisance sonore
| Au repos |
| 23 / 23 / 32.07 dB(A) |
| Fortement sollicité |
| 53.7 / 54.58 dB(A) |
 | ||
30 dB silencieux 40 dB(A) audible 50 dB(A) bruyant |
||
min: | ||
| Schenker XMG Focus 16 (i7-12700H, RTX 3060) GeForce RTX 3060 Laptop GPU, i7-12700H, Samsung SSD 980 Pro 1TB MZ-V8P1T0BW | Asus ZenBook Pro 16X OLED UX7602ZM-ME115W GeForce RTX 3060 Laptop GPU, i9-12900H, Samsung PM9A1 MZVL21T0HCLR | Dell G16 7620 GeForce RTX 3060 Laptop GPU, i7-12700H, WDC PC SN810 512GB | Asus ROG Flow X16 GV601RW-M5082W GeForce RTX 3070 Ti Laptop GPU, R9 6900HS, Micron 3400 1TB MTFDKBA1T0TFH | Lenovo ThinkPad X1 Extreme G5-21DE003RGE GeForce RTX 3060 Laptop GPU, i7-12700H, Micron 3400 1TB MTFDKBA1T0TFH | Lenovo Legion Slim 7-16IAH 82TF004YGE GeForce RTX 3060 Laptop GPU, i7-12700H, SK Hynix HFS001TEJ9X115N | Lenovo Legion 5 Pro 16IAH7H GeForce RTX 3060 Laptop GPU, i7-12700H, 2x Samsung PM9A1 MZVL21T0HCLR (RAID 0) | |
|---|---|---|---|---|---|---|---|
| Noise | -2% | 4% | -2% | 11% | 8% | -9% | |
| arrêt / environnement * (dB) | 23 | 26 -13% | 23.2 -1% | 25.5 -11% | 23.2 -1% | 23 -0% | 24.6 -7% |
| Idle Minimum * (dB) | 23 | 26 -13% | 28.3 -23% | 25.5 -11% | 23.2 -1% | 23 -0% | 28.7 -25% |
| Idle Average * (dB) | 23 | 26 -13% | 28.8 -25% | 25.5 -11% | 23.2 -1% | 23 -0% | 32 -39% |
| Idle Maximum * (dB) | 32.07 | 26 19% | 28.9 10% | 27.4 15% | 23.2 28% | 23 28% | 32 -0% |
| Load Average * (dB) | 53.7 | 48 11% | 32.4 40% | 49.9 7% | 45.5 15% | 43.7 19% | 45.2 16% |
| Witcher 3 ultra * (dB) | 54.58 | 48.3 12% | 45.5 17% | 51.7 5% | |||
| Load Maximum * (dB) | 54.58 | 54.6 -0% | 48.1 12% | 55 -1% | 45.5 17% | 52 5% | 54.4 -0% |
* ... Moindre est la valeur, meilleures sont les performances
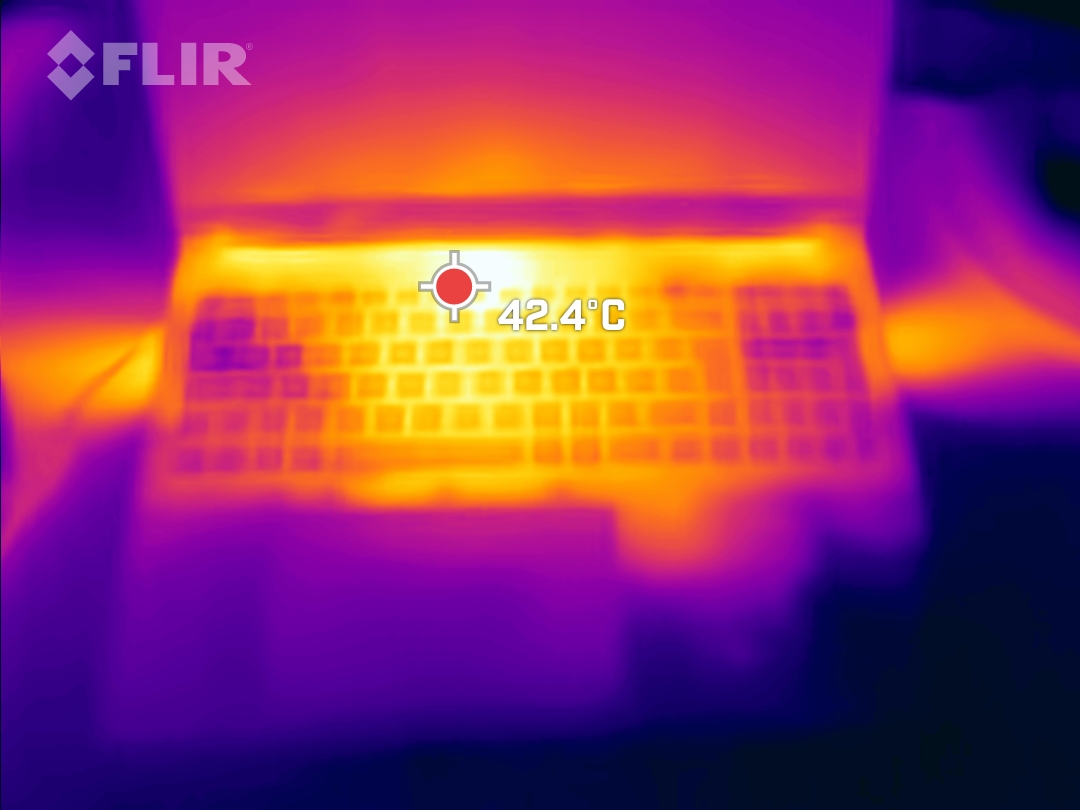
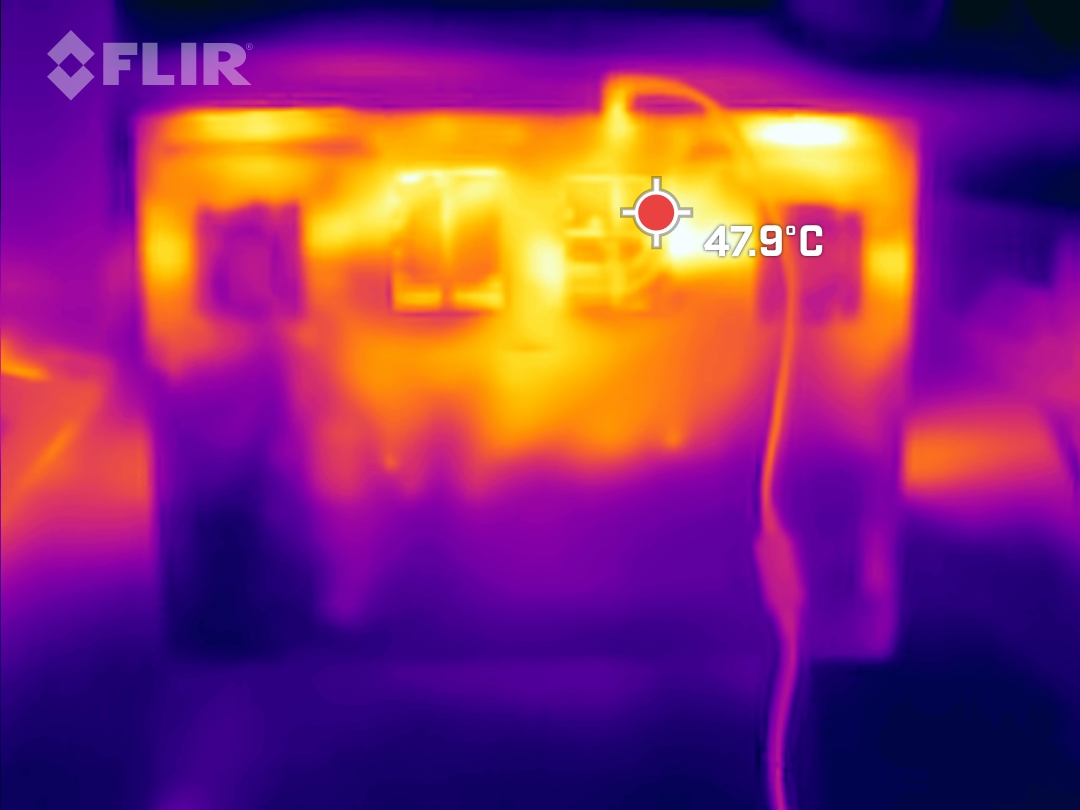
Température
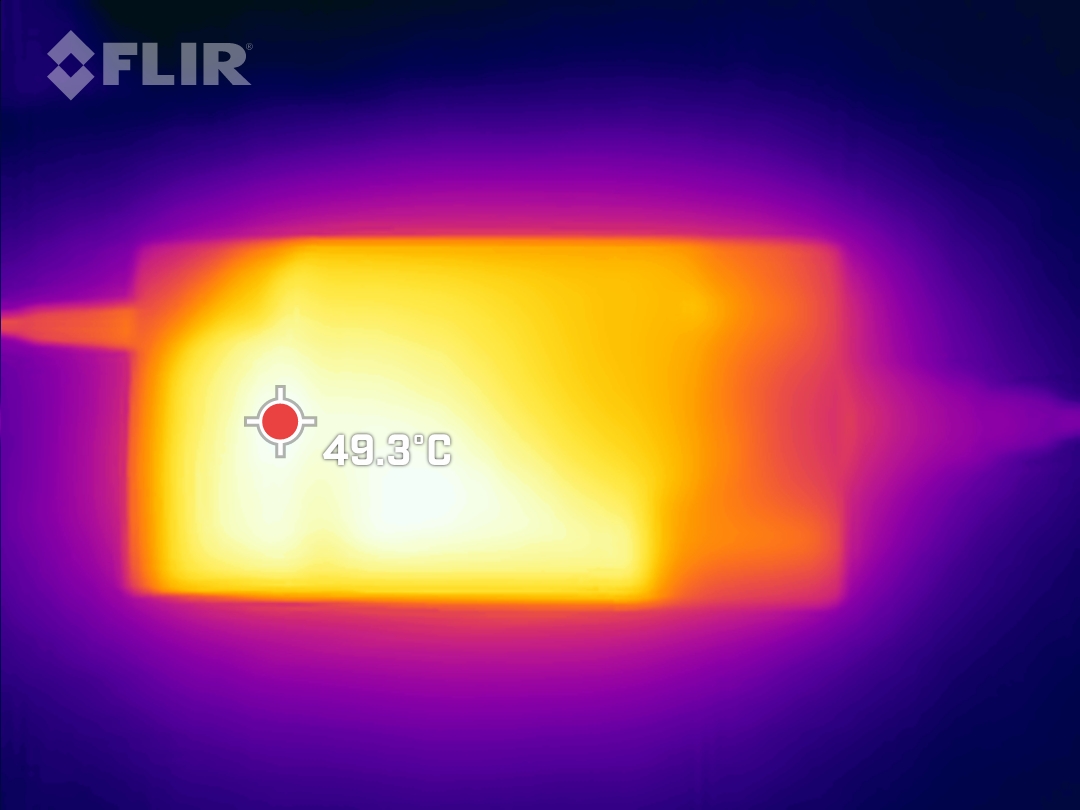
En fin de compte, le niveau de performance élevé des ordinateurs portables de jeu va toujours de pair avec beaucoup de chaleur. Le Focus 16 est lui aussi relativement chaud, mais sans brûler vos doigts sur le clavier. Outre l'ordinateur portable lui-même, le bloc d'alimentation chauffe également pendant le fonctionnement. Celui-ci peut parfois atteindre des températures de plus de 50 °C.
(-) La température maximale du côté supérieur est de 50 °C / 122 F, par rapport à la moyenne de 40.4 °C / 105 F, allant de 21.2 à 68.8 °C pour la classe Gaming.
(-) Le fond chauffe jusqu'à un maximum de 48 °C / 118 F, contre une moyenne de 43.2 °C / 110 F
(+) En utilisation inactive, la température moyenne du côté supérieur est de 25.3 °C / 78 F, par rapport à la moyenne du dispositif de 33.9 °C / 93 F.
(±) En jouant à The Witcher 3, la température moyenne du côté supérieur est de 37.1 °C / 99 F, alors que la moyenne de l'appareil est de 33.9 °C / 93 F.
(+) Les repose-poignets et le pavé tactile sont plus froids que la température de la peau avec un maximum de 30 °C / 86 F et sont donc froids au toucher.
(±) La température moyenne de la zone de l'appui-paume de dispositifs similaires était de 28.8 °C / 83.8 F (-1.2 °C / #-2.2 F).
| Schenker XMG Focus 16 (i7-12700H, RTX 3060) Intel Core i7-12700H, NVIDIA GeForce RTX 3060 Laptop GPU | Asus ZenBook Pro 16X OLED UX7602ZM-ME115W Intel Core i9-12900H, NVIDIA GeForce RTX 3060 Laptop GPU | Dell G16 7620 Intel Core i7-12700H, NVIDIA GeForce RTX 3060 Laptop GPU | Asus ROG Flow X16 GV601RW-M5082W AMD Ryzen 9 6900HS, NVIDIA GeForce RTX 3070 Ti Laptop GPU | Lenovo ThinkPad X1 Extreme G5-21DE003RGE Intel Core i7-12700H, NVIDIA GeForce RTX 3060 Laptop GPU | Lenovo Legion Slim 7-16IAH 82TF004YGE Intel Core i7-12700H, NVIDIA GeForce RTX 3060 Laptop GPU | Lenovo Legion 5 Pro 16IAH7H Intel Core i7-12700H, NVIDIA GeForce RTX 3060 Laptop GPU | |
|---|---|---|---|---|---|---|---|
| Heat | 5% | 8% | -14% | -0% | -15% | -9% | |
| Maximum Upper Side * (°C) | 50 | 32 36% | 47.6 5% | 55.1 -10% | 52 -4% | 48.3 3% | 45.8 8% |
| Maximum Bottom * (°C) | 48 | 41.6 13% | 54 -13% | 50.3 -5% | 56.4 -18% | 55.3 -15% | 66.3 -38% |
| Idle Upper Side * (°C) | 28 | 32.6 -16% | 23 18% | 35.5 -27% | 26.4 6% | 35.7 -28% | 30.4 -9% |
| Idle Bottom * (°C) | 32 | 36 -13% | 24.6 23% | 36.1 -13% | 27.2 15% | 37.6 -18% | 30.4 5% |
* ... Moindre est la valeur, meilleures sont les performances
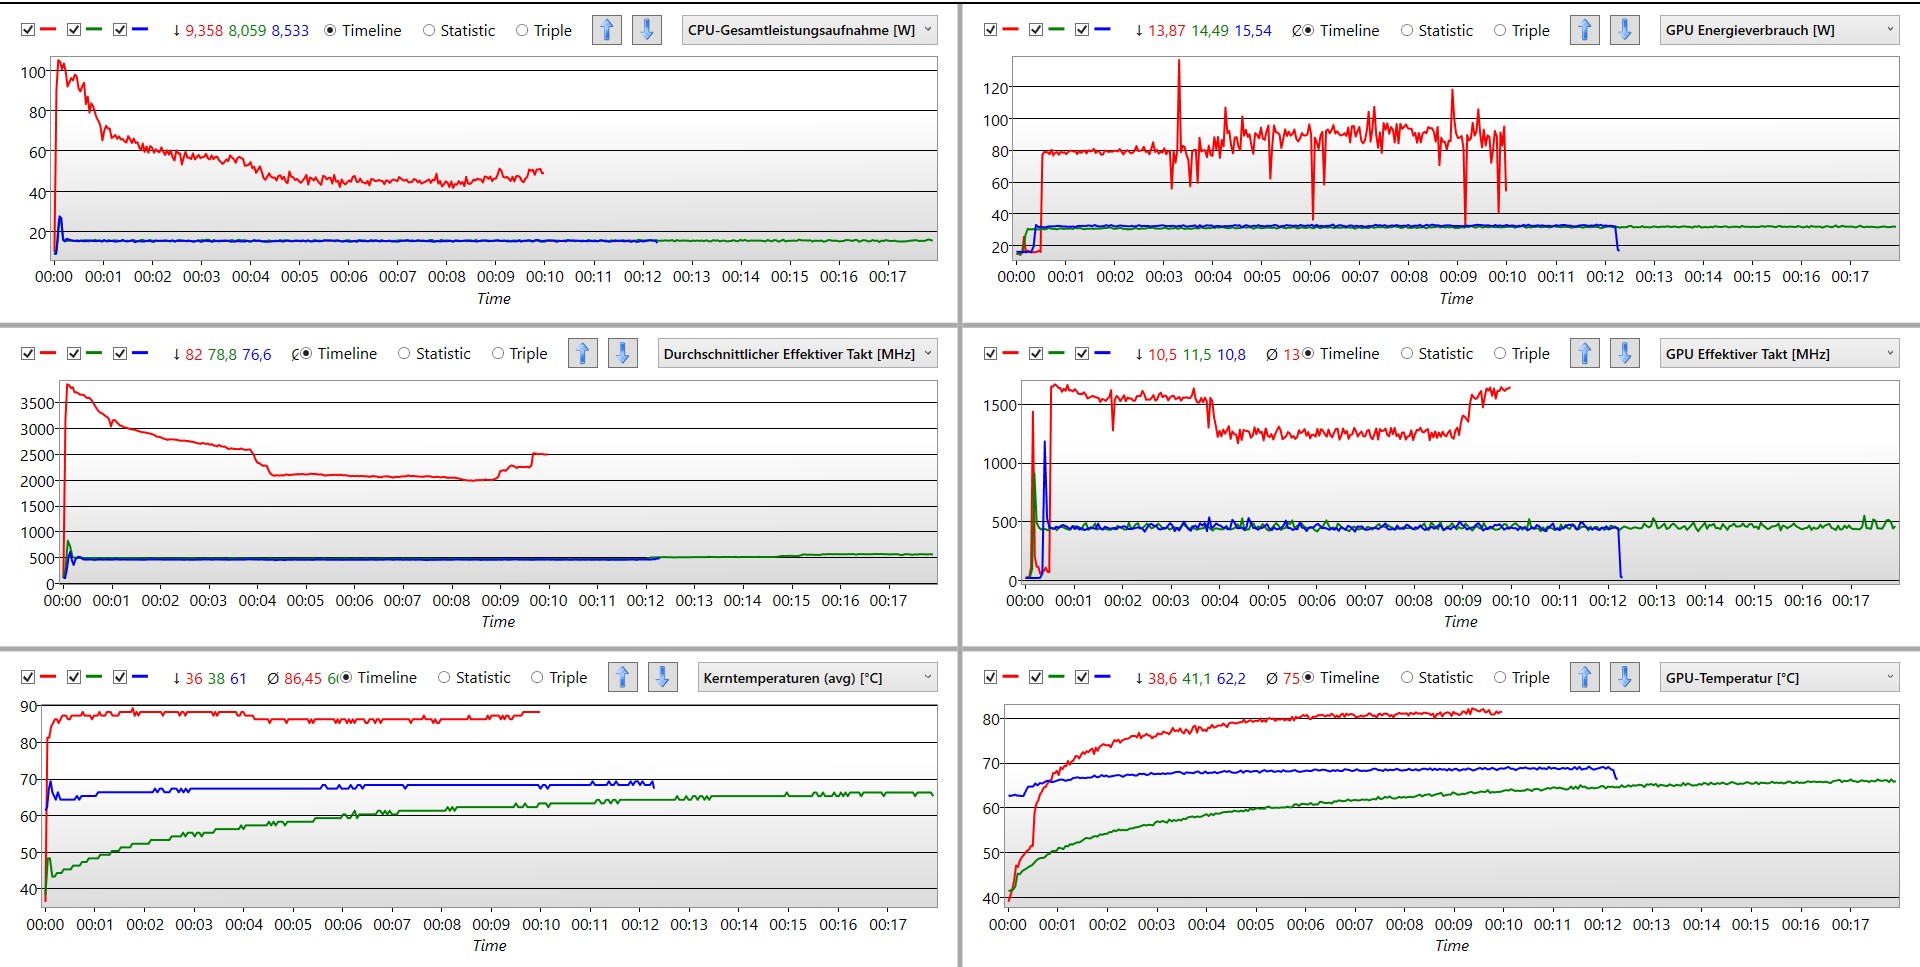
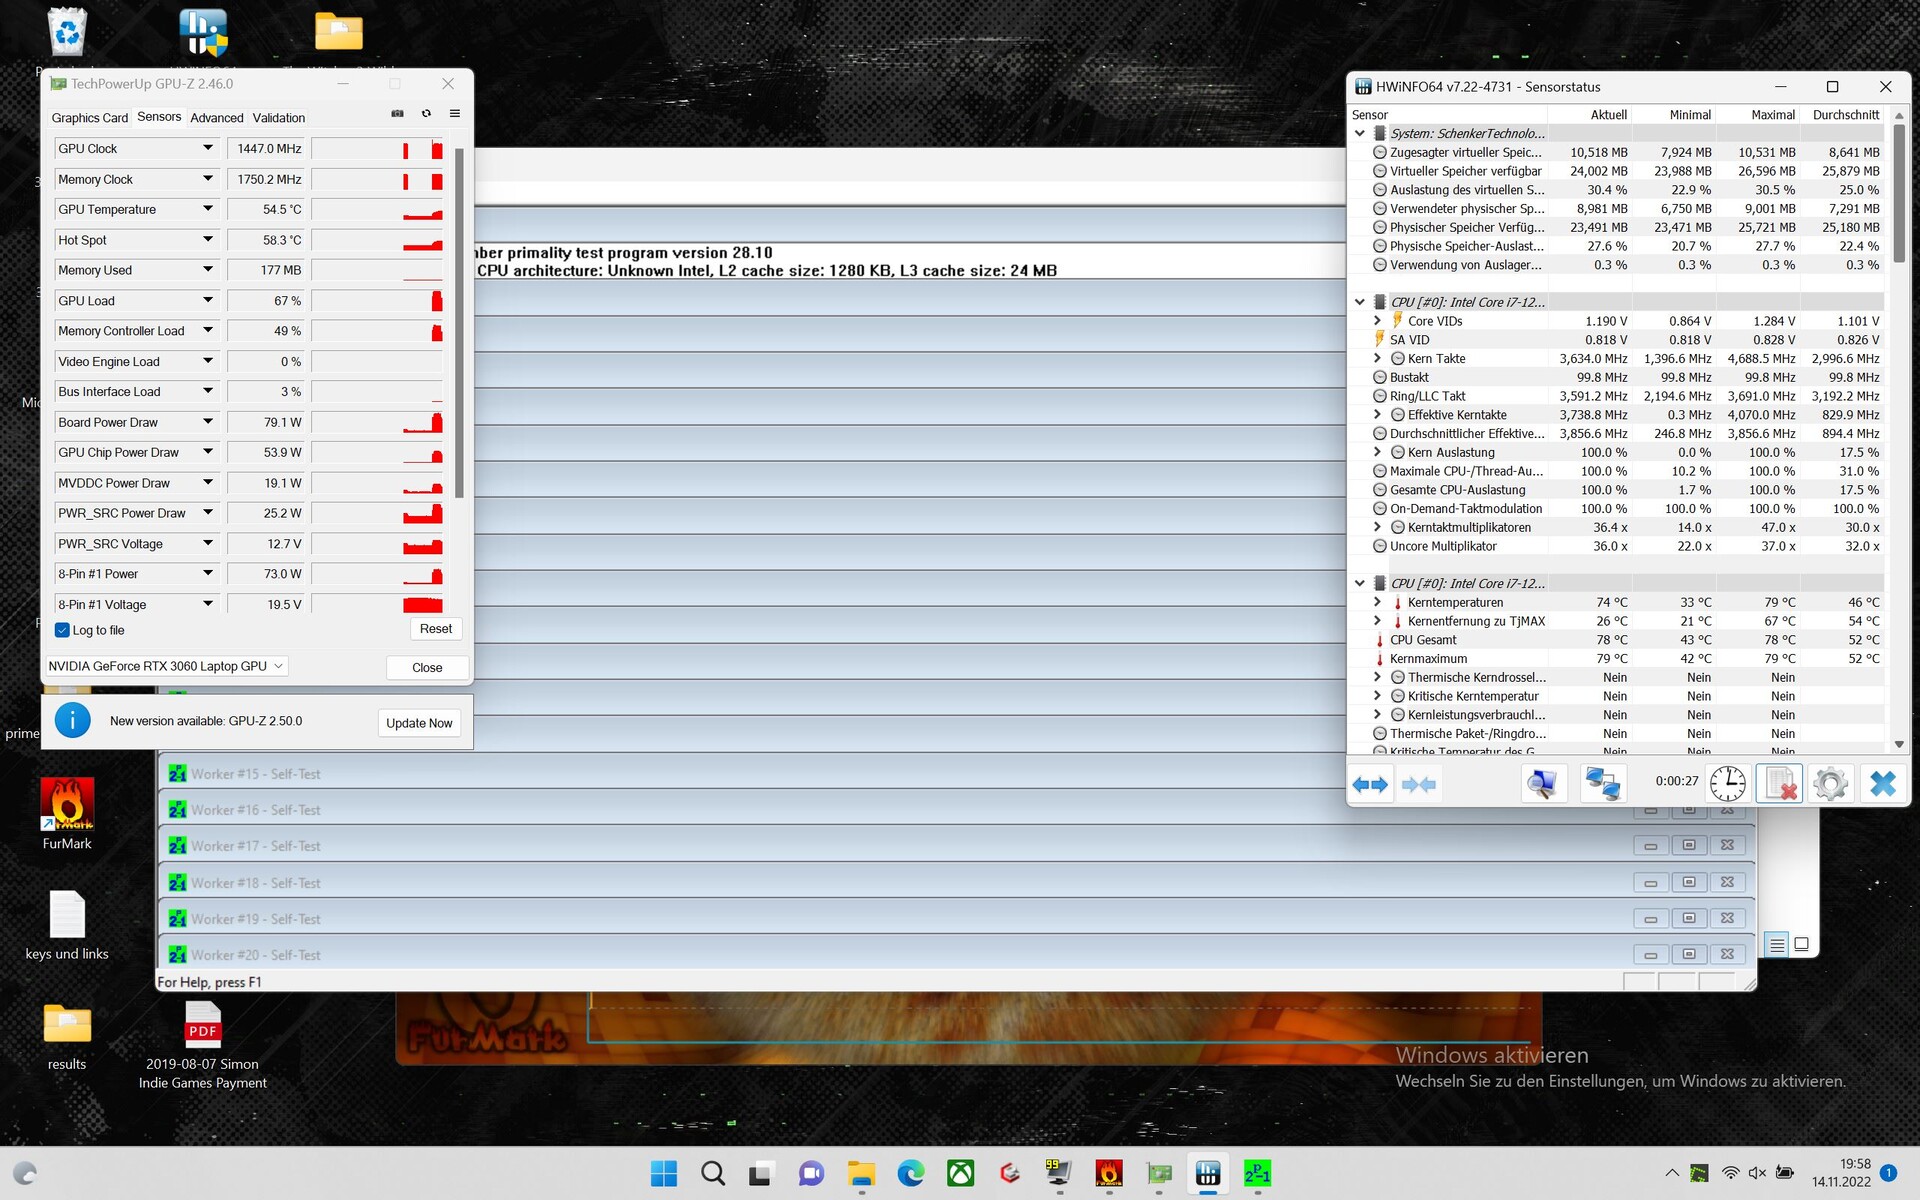
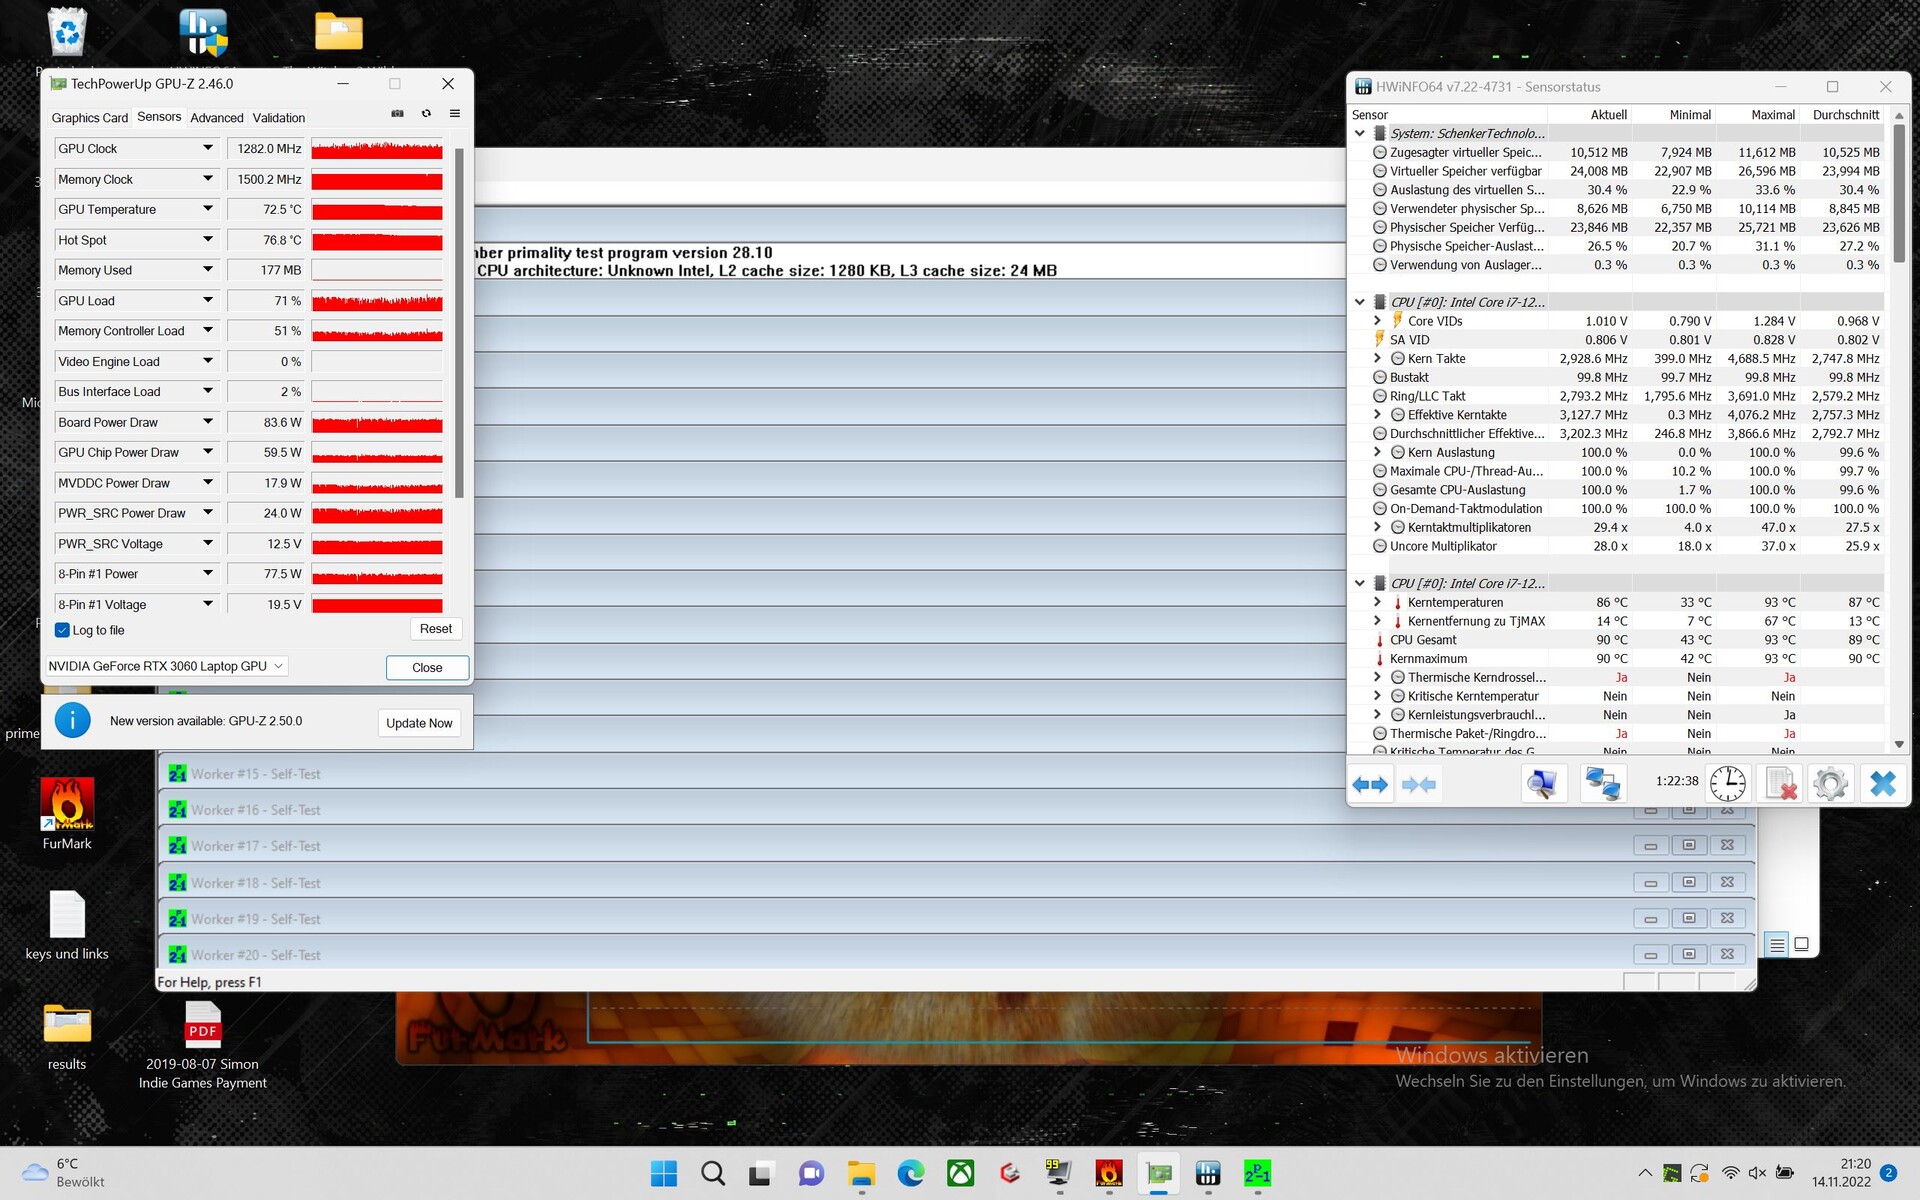
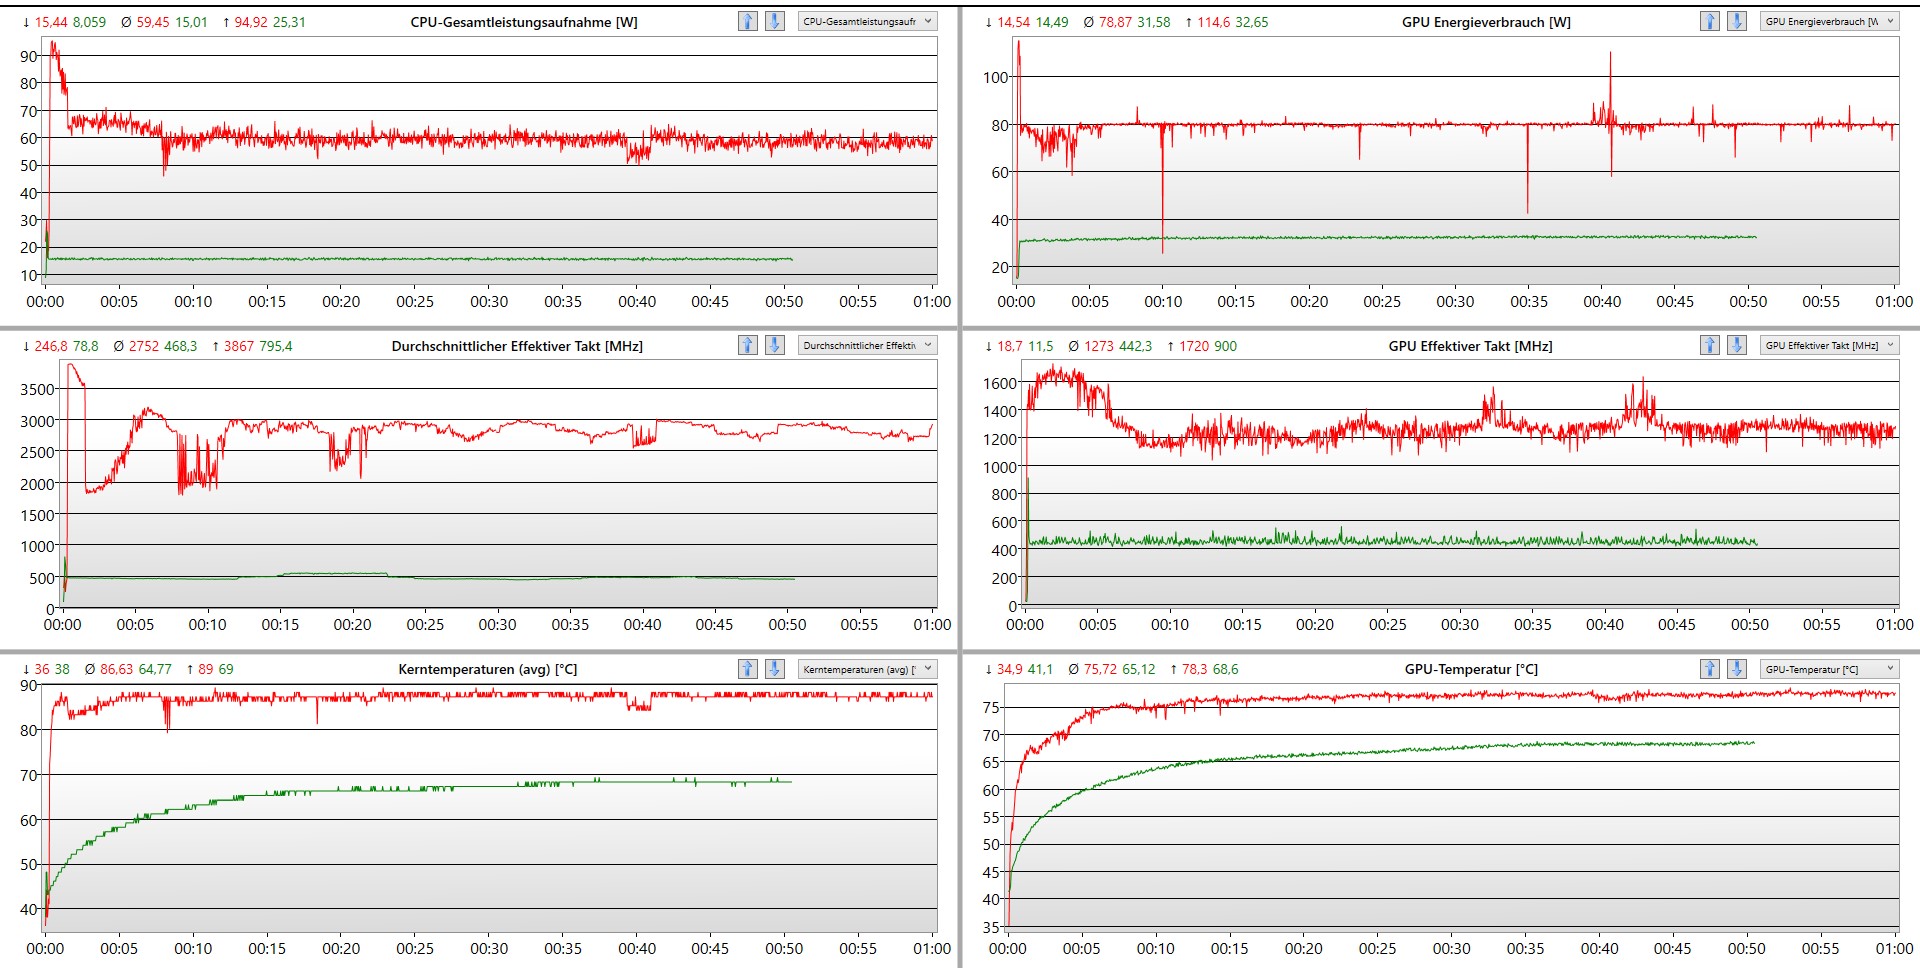
Test de stress
Pendant le test de stress, les vitesses du CPU et du GPU du Schenker XMG Focus 16 chutent dès que les températures atteignent respectivement les 80° et 90°C.
Haut-parleurs
Le Schenker XMG Focus 16 est équipé de deux petits haut-parleurs dont la dynamique est limitée. Ils ne sont vraiment forts que dans les médiums et parviennent à peine à couvrir les ventilateurs de l'ordinateur portable. Des haut-parleurs externes connectés via la prise audio 3,5 mm ou Bluetooth sont presque indispensables. L'ordinateur portable Schenker est livré avec l'application Sound Blaster Cinema 6+. Cela garantit une excellente qualité sonore au casque.
Schenker XMG Focus 16 (i7-12700H, RTX 3060) analyse audio
(±) | le niveau sonore du haut-parleur est moyen mais bon (79.2# dB)
Basses 100 - 315 Hz
(-) | presque aucune basse - en moyenne 24.4% plus bas que la médiane
(±) | la linéarité des basses est moyenne (8.1% delta à la fréquence précédente)
Médiums 400 - 2000 Hz
(±) | médiane supérieure - en moyenne 10.6% supérieure à la médiane
(±) | la linéarité des médiums est moyenne (13.1% delta à la fréquence précédente)
Aiguës 2 - 16 kHz
(+) | des sommets équilibrés - à seulement 4.7% de la médiane
(±) | la linéarité des aigus est moyenne (10.4% delta à la fréquence précédente)
Globalement 100 - 16 000 Hz
(-) | le son global n'est pas linéaire (30.1% de différence à la médiane)
Par rapport à la même classe
» 95% de tous les appareils testés de cette catégorie étaient meilleurs, 2% similaires, 3% pires
» Le meilleur avait un delta de 6%, la moyenne était de 18%, le pire était de 132%.
Par rapport à tous les appareils testés
» 88% de tous les appareils testés étaient meilleurs, 3% similaires, 9% pires
» Le meilleur avait un delta de 4%, la moyenne était de 24%, le pire était de 134%.
Asus ROG Flow X16 GV601RW-M5082W analyse audio
(±) | le niveau sonore du haut-parleur est moyen mais bon (80.7# dB)
Basses 100 - 315 Hz
(±) | basse réduite - en moyenne 12.7% inférieure à la médiane
(±) | la linéarité des basses est moyenne (13.8% delta à la fréquence précédente)
Médiums 400 - 2000 Hz
(+) | médiane équilibrée - seulement 1.3% de la médiane
(+) | les médiums sont linéaires (4.7% delta à la fréquence précédente)
Aiguës 2 - 16 kHz
(±) | sommets plus élevés - en moyenne 6.4% plus élevés que la médiane
(+) | les aigus sont linéaires (6.8% delta à la fréquence précédente)
Globalement 100 - 16 000 Hz
(+) | le son global est linéaire (12.9% différence à la médiane)
Par rapport à la même classe
» 17% de tous les appareils testés de cette catégorie étaient meilleurs, 4% similaires, 79% pires
» Le meilleur avait un delta de 6%, la moyenne était de 18%, le pire était de 132%.
Par rapport à tous les appareils testés
» 12% de tous les appareils testés étaient meilleurs, 3% similaires, 85% pires
» Le meilleur avait un delta de 4%, la moyenne était de 24%, le pire était de 134%.
Gestion de l'énergie - consommation électrique typique d'un ordinateur portable de jeu
Consommation électrique
L'ordinateur portable est livré avec un bloc d'alimentation de 180 watts de Lite-ON (PA-1181-76). Pendant le test de stress, nous avons mesuré une consommation d'énergie à long terme de 190 watts. Dans l'ensemble, l'alimentation semble faible compte tenu de la configuration de l'ordinateur portable. Les appareils de comparaison de Dell et Lenovo, dont la configuration est similaire à celle du Schenker Laptop, sont équipés d'un bloc d'alimentation d'au moins 230 watts. Et ces ordinateurs portables en profitent.
Au ralenti, l'ordinateur portable consomme 3 watts de plus que les appareils de comparaison, ce qui le place au coude à coude avec les autres ordinateurs portables de jeu en ce qui concerne les besoins en énergie. En somme, le Schenker XMG Focus 16 n'est pas vraiment une merveille d'économie d'énergie, malgré son petit bloc d'alimentation.
| Éteint/en veille | |
| Au repos | |
| Fortement sollicité |
|
Légende:
min: | |
| Schenker XMG Focus 16 (i7-12700H, RTX 3060) i7-12700H, GeForce RTX 3060 Laptop GPU, Samsung SSD 980 Pro 1TB MZ-V8P1T0BW, IPS, 2560x1600, 16" | Asus ZenBook Pro 16X OLED UX7602ZM-ME115W i9-12900H, GeForce RTX 3060 Laptop GPU, Samsung PM9A1 MZVL21T0HCLR, OLED, 3840x2400, 16" | Dell G16 7620 i7-12700H, GeForce RTX 3060 Laptop GPU, WDC PC SN810 512GB, IPS, 2560x1600, 16" | Asus ROG Flow X16 GV601RW-M5082W R9 6900HS, GeForce RTX 3070 Ti Laptop GPU, Micron 3400 1TB MTFDKBA1T0TFH, Mini LED, 2560x1600, 16.1" | Lenovo ThinkPad X1 Extreme G5-21DE003RGE i7-12700H, GeForce RTX 3060 Laptop GPU, Micron 3400 1TB MTFDKBA1T0TFH, IPS, 3840x2400, 16" | Lenovo Legion Slim 7-16IAH 82TF004YGE i7-12700H, GeForce RTX 3060 Laptop GPU, SK Hynix HFS001TEJ9X115N, IPS LED, 2560x1600, 16" | Lenovo Legion 5 Pro 16IAH7H i7-12700H, GeForce RTX 3060 Laptop GPU, 2x Samsung PM9A1 MZVL21T0HCLR (RAID 0), IPS, 2560x1600, 16" | Moyenne NVIDIA GeForce RTX 3060 Laptop GPU | Moyenne de la classe Gaming | |
|---|---|---|---|---|---|---|---|---|---|
| Power Consumption | 20% | -5% | -21% | 1% | 7% | -44% | 14% | -1% | |
| Idle Minimum * (Watt) | 14.7 | 11.1 24% | 14.4 2% | 12.2 17% | 11.8 20% | 13.3 10% | 22.8 -55% | 10.4 ? 29% | 13.3 ? 10% |
| Idle Average * (Watt) | 18.6 | 11.4 39% | 17.8 4% | 25.5 -37% | 22.4 -20% | 17.5 6% | 26.5 -42% | 14.5 ? 22% | 19 ? -2% |
| Idle Maximum * (Watt) | 21.2 | 14.4 32% | 31.5 -49% | 29.8 -41% | 23.1 -9% | 18.4 13% | 41 -93% | 21.4 ? -1% | 24.5 ? -16% |
| Load Average * (Watt) | 121 | 137.4 -14% | 101.2 16% | 183 -51% | 138 -14% | 122.8 -1% | 191 -58% | 109.3 ? 10% | 108.1 ? 11% |
| Witcher 3 ultra * (Watt) | 174 | 136 22% | 176.9 -2% | 183.6 -6% | 129.9 25% | 154.7 11% | 194.7 -12% | ||
| Load Maximum * (Watt) | 235 | 197 16% | 242.9 -3% | 253 -8% | 225.6 4% | 232.6 1% | 238 -1% | 206 ? 12% | 254 ? -8% |
* ... Moindre est la valeur, meilleures sont les performances
Power consumption Witcher 3 / stress test
Power consumption with an external monitor
Durée de vie de la batterie
Le Focus 16 est équipé d'une petite batterie de 54 Wh. Pour cette raison, il ne faut pas s'étonner que l'autonomie de la batterie soit inférieure à la moitié de celle des appareils de comparaison. Néanmoins, le mode d'économie d'énergie du Control Center est très efficace. Le test de navigation sur Internet en WiFi avec une luminosité plein écran a été effectué en utilisant le paramètre du mode divertissement, tandis que le test de 150 cd/m² a été effectué en utilisant le paramètre d'économie d'énergie et un taux de rafraîchissement de 60 Hz. Avec ce mode, la batterie dure beaucoup plus longtemps.
| Schenker XMG Focus 16 (i7-12700H, RTX 3060) i7-12700H, GeForce RTX 3060 Laptop GPU, 54 Wh | Asus ZenBook Pro 16X OLED UX7602ZM-ME115W i9-12900H, GeForce RTX 3060 Laptop GPU, 96 Wh | Dell G16 7620 i7-12700H, GeForce RTX 3060 Laptop GPU, 84 Wh | Asus ROG Flow X16 GV601RW-M5082W R9 6900HS, GeForce RTX 3070 Ti Laptop GPU, 90 Wh | Lenovo ThinkPad X1 Extreme G5-21DE003RGE i7-12700H, GeForce RTX 3060 Laptop GPU, 90 Wh | Lenovo Legion Slim 7-16IAH 82TF004YGE i7-12700H, GeForce RTX 3060 Laptop GPU, 99.99 Wh | Lenovo Legion 5 Pro 16IAH7H i7-12700H, GeForce RTX 3060 Laptop GPU, 80 Wh | Moyenne de la classe Gaming | |
|---|---|---|---|---|---|---|---|---|
| Autonomie de la batterie | 86% | -23% | -9% | 31% | 1% | -41% | 26% | |
| WiFi v1.3 (h) | 4.8 | 8.9 85% | 5 4% | 5.7 19% | 6.7 40% | 5.2 8% | 3.6 -25% | 7.01 ? 46% |
| Load (h) | 1.4 | 2.6 86% | 0.7 -50% | 0.9 -36% | 1.7 21% | 1.3 -7% | 0.6 -57% | 1.47 ? 5% |
| Reader / Idle (h) | 12.7 | 7.1 | 8.71 ? | |||||
| Witcher 3 ultra (h) | 0.9 | 1.5 | 2.1 | |||||
| H.264 (h) | 7.3 | 9.5 | 4.1 | 8.26 ? |
Points positifs
Points négatifs
Verdict : un ordinateur portable de jeu moyen avec un service supérieur à la moyenne
Le Schenker XMG Focus 16 a fourni un nombre d'images par seconde élevé et constant dans les jeux testés. Dans l'ensemble, l'ordinateur portable de jeu Nvidia RTX 3060 offre des performances supérieures à la moyenne. Néanmoins, la concurrence sous la forme du Dell G16 Test du Dell G16 7620 : un châssis épais pour de bonnes performances ou du Lenovo Legion 5 Pro offre plus de puissance brute pour un prix presque identique. Malgré cela, le gain de performance est plutôt marginal.
En revanche, l'ordinateur portable Schenker se distingue par une meilleure ergonomie que ses concurrents de Dell et Lenovo. Le clavier de l'ordinateur Schenker impressionne par la course élevée des touches et le bon retour haptique. Le XMG Focus 16 bénéficie également d'une bonne sélection de ports bien placés. En outre, le support client de Schenker est également impressionnant. Comme c'était le cas auparavant, les demandes sont traitées rapidement et avec compétence, souvent en quelques heures. C'est ce qui a permis à Schenker d'obtenir la première place pour la troisième fois consécutive dans notre enquête sur le service et le support client pour les ordinateurs portables et les smartphones dans notre enquête sur le service et l'assistance à la clientèle pour les ordinateurs portables et les smartphones. Le design du XMG Focus 16 est une question de goût. Pour un ordinateur portable de jeu, l'appareil est discret, noir et carré.
Le XMG Focus 16 tire beaucoup de puissance du matériel sans atteindre les limites de son potentiel.
Dans l'ensemble, l'ordinateur portable Schenker est solide comme un roc, mais il est incapable d'atteindre des performances de haut niveau. Dans aucun domaine de nos benchmarks et analyses, l'ordinateur portable de jeu n'a pu dominer la concurrence. La meilleure performance de la carte graphique se trouve dans l'Asus ROG Flow X16 Asus ROG Flow X16 laptop in review: 1,100 nits mini-LED display in gaming convertible with Ryzen 9 6900HS , tandis que le Lenovo Legion 5 Pro obtient la meilleure performance du processeur. De plus, le Asus Zenbook Pro 16X OLED a l'écran le plus réactif. Dans chacun de ces domaines, l'ordinateur portable Schenker offre des performances adéquates ou supérieures à la moyenne.
Prix et disponibilité
Bestware.com est la boutique en ligne de Schenker où l'ordinateur portable de jeu peut être configuré et commandé. Au moment de l'examen, notre spécification de test XMG Focus 16est disponible pour environ 1800 dollars américains. Avec seulement 8 Go de RAM et sans SSD NVMe, le prix de base de l'ordinateur portable est d'environ 1600 dollars US.
Schenker XMG Focus 16 (i7-12700H, RTX 3060)
- 12/21/2022 v7 (old)
Marc Herter
Price comparison

