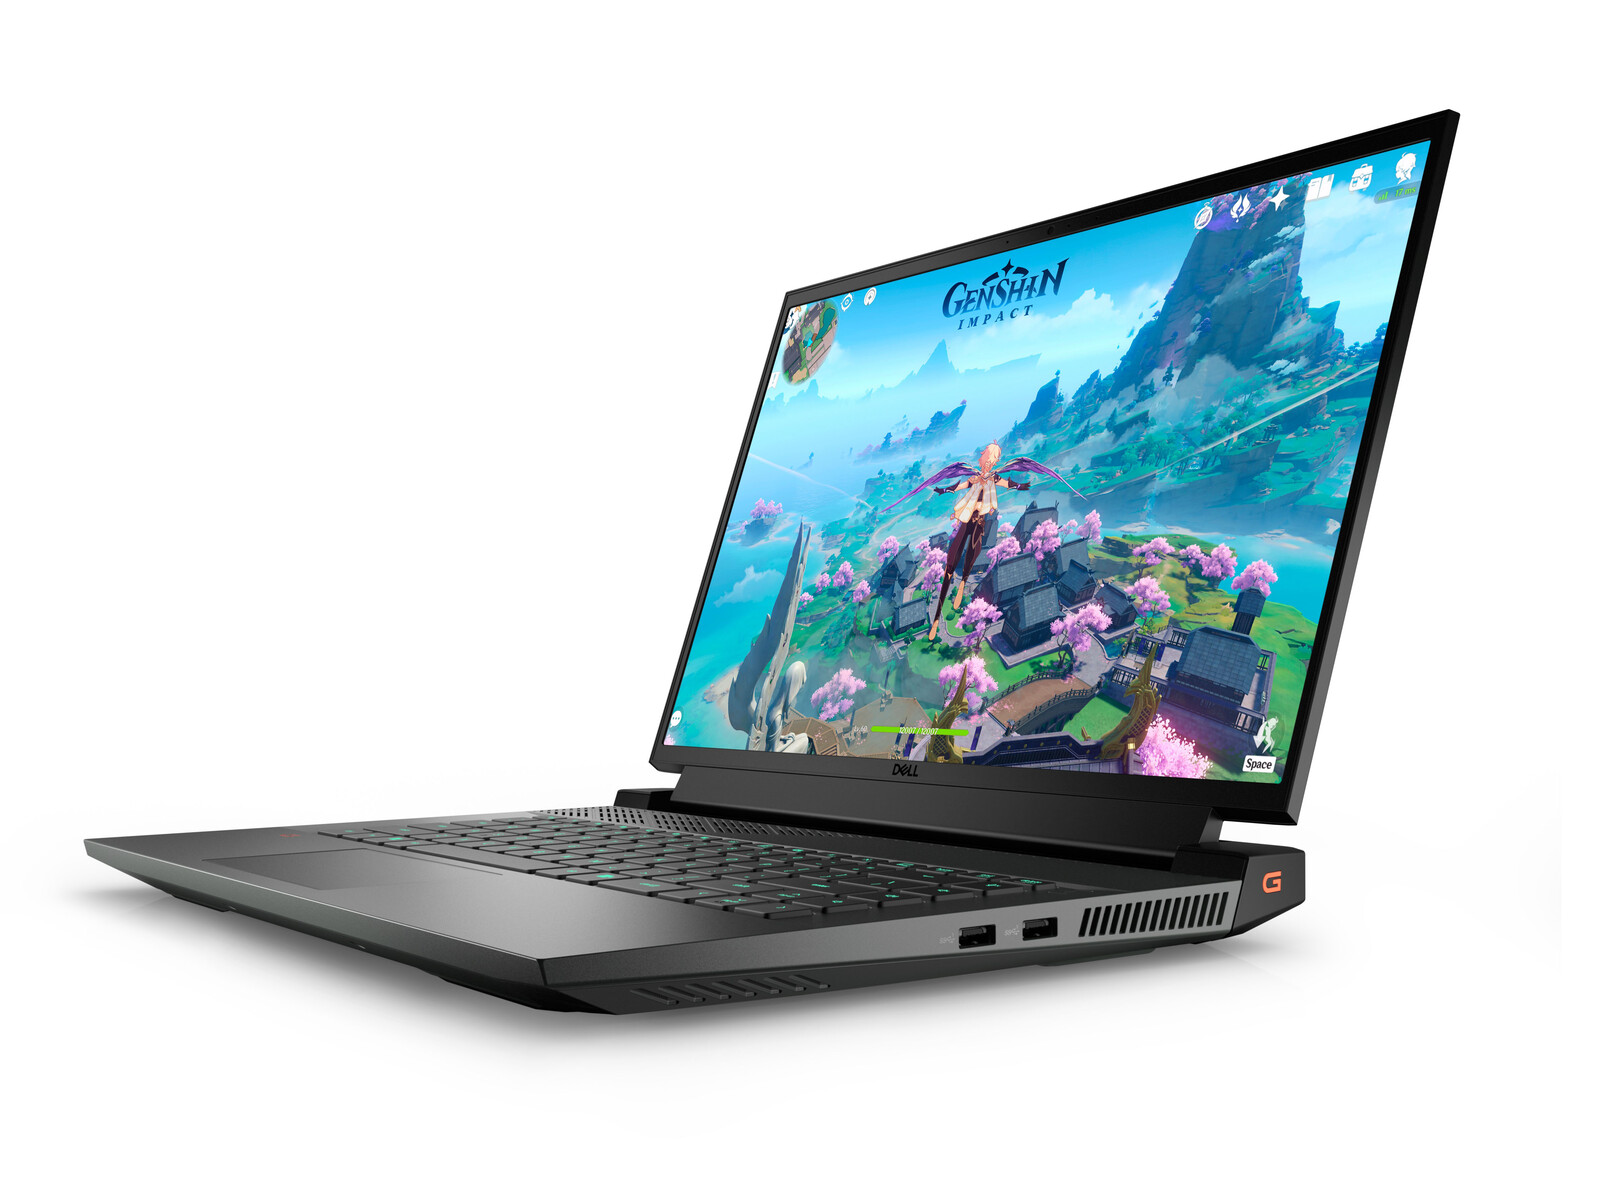
Test du Dell G16 7620 : un châssis épais pour de bonnes performances
La série G de Dell est constituée d'ordinateurs portables de jeu de budget à milieu de gamme, contrairement à la série Alienware plus haut de gamme. La série n'a que quelques années d'existence avec les modèles initiaux G15 et G17 couvrant les facteurs de forme de 15,6 et 17,3 pouces, respectivement. Pour 2022, Dell a introduit un modèle de 16 pouces, le G16, équipé des derniers processeurs Intel Core-H de 12e génération et des GPU Nvidia RTX Ampere
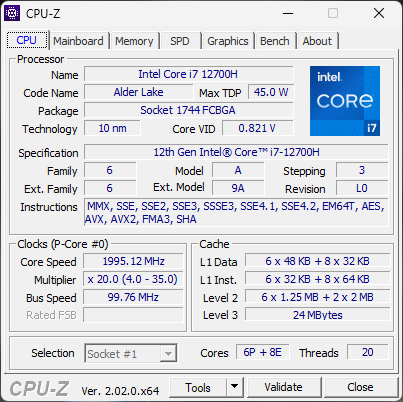
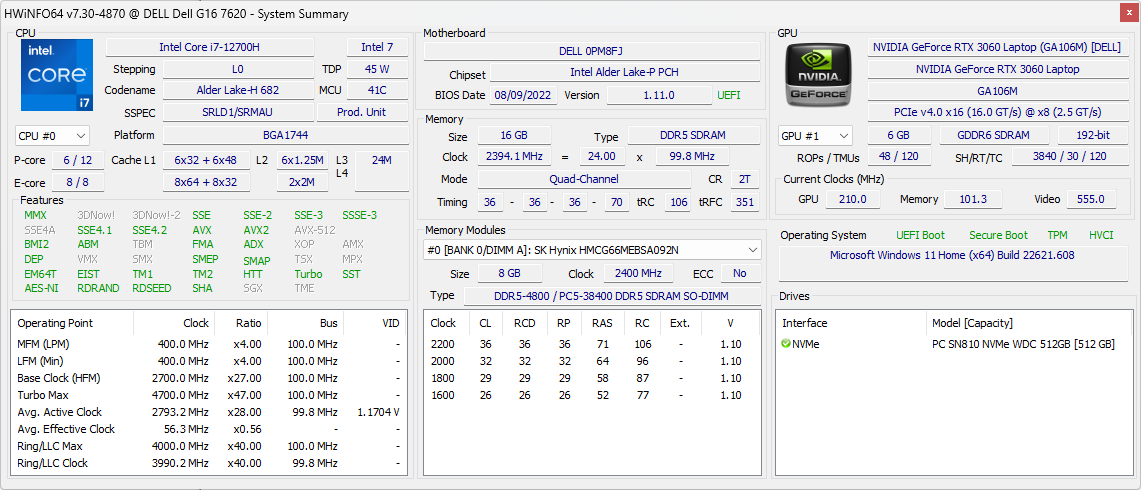
Notre unité en revue est une configuration de milieu de gamme avec le CPU Core i7-12700H et le GPU RTX 3060 de 130 W GeForce pour un prix de détail d'environ 1500 USD. D'autres SKU sont disponibles avec la RTX 3050 Ti, plus lente, la RTX 3070 Ti, plus rapide, ou le Core i9-12900H. Toutes les configurations actuelles sont équipées du même écran 16 pouces 1600p 165 Hz
Les concurrents dans ce domaine comprennent d'autres ordinateurs portables de jeu de 16 pouces comme le Lenovo Legion 7 16, HP Victus 16, Asus ROG Zephyrus M16ou Acer Swift X SFX16
Plus de commentaires sur Dell
Comparaison avec les concurrents potentiels
Note | Date | Modèle | Poids | Épaisseur | Taille | Résolution | Prix |
|---|---|---|---|---|---|---|---|
| 86.1 % v7 (old) | 10/22 | Dell G16 7620 i7-12700H, GeForce RTX 3060 Laptop GPU | 2.6 kg | 26.9 mm | 16.00" | 2560x1600 | |
| 90.8 % v7 (old) | 09/22 | Lenovo Legion 7 16ARHA7 R9 6900HX, Radeon RX 6850M XT | 2.6 kg | 19.4 mm | 16.00" | 2560x1600 | |
| 82.3 % v7 (old) | 05/22 | HP Victus 16-e0145ng R5 5600H, GeForce RTX 3050 Ti Laptop GPU | 2.4 kg | 23.5 mm | 16.10" | 1920x1080 | |
| 85.6 % v7 (old) | 07/21 | Asus ROG Zephyrus M16 GU603H i9-11900H, GeForce RTX 3070 Laptop GPU | 2 kg | 20 mm | 16.00" | 2560x1600 | |
| 86.6 % v7 (old) | 07/22 | Lenovo Legion 5 Pro 16IAH7H i7-12700H, GeForce RTX 3060 Laptop GPU | 2.6 kg | 27 mm | 16.00" | 2560x1600 | |
| 86.2 % v7 (old) | 07/22 | Acer Swift X SFX16-51G-5388 i5-11320H, GeForce RTX 3050 4GB Laptop GPU | 1.8 kg | 18.9 mm | 16.10" | 1920x1080 |
Cas - Un G15 plus grand
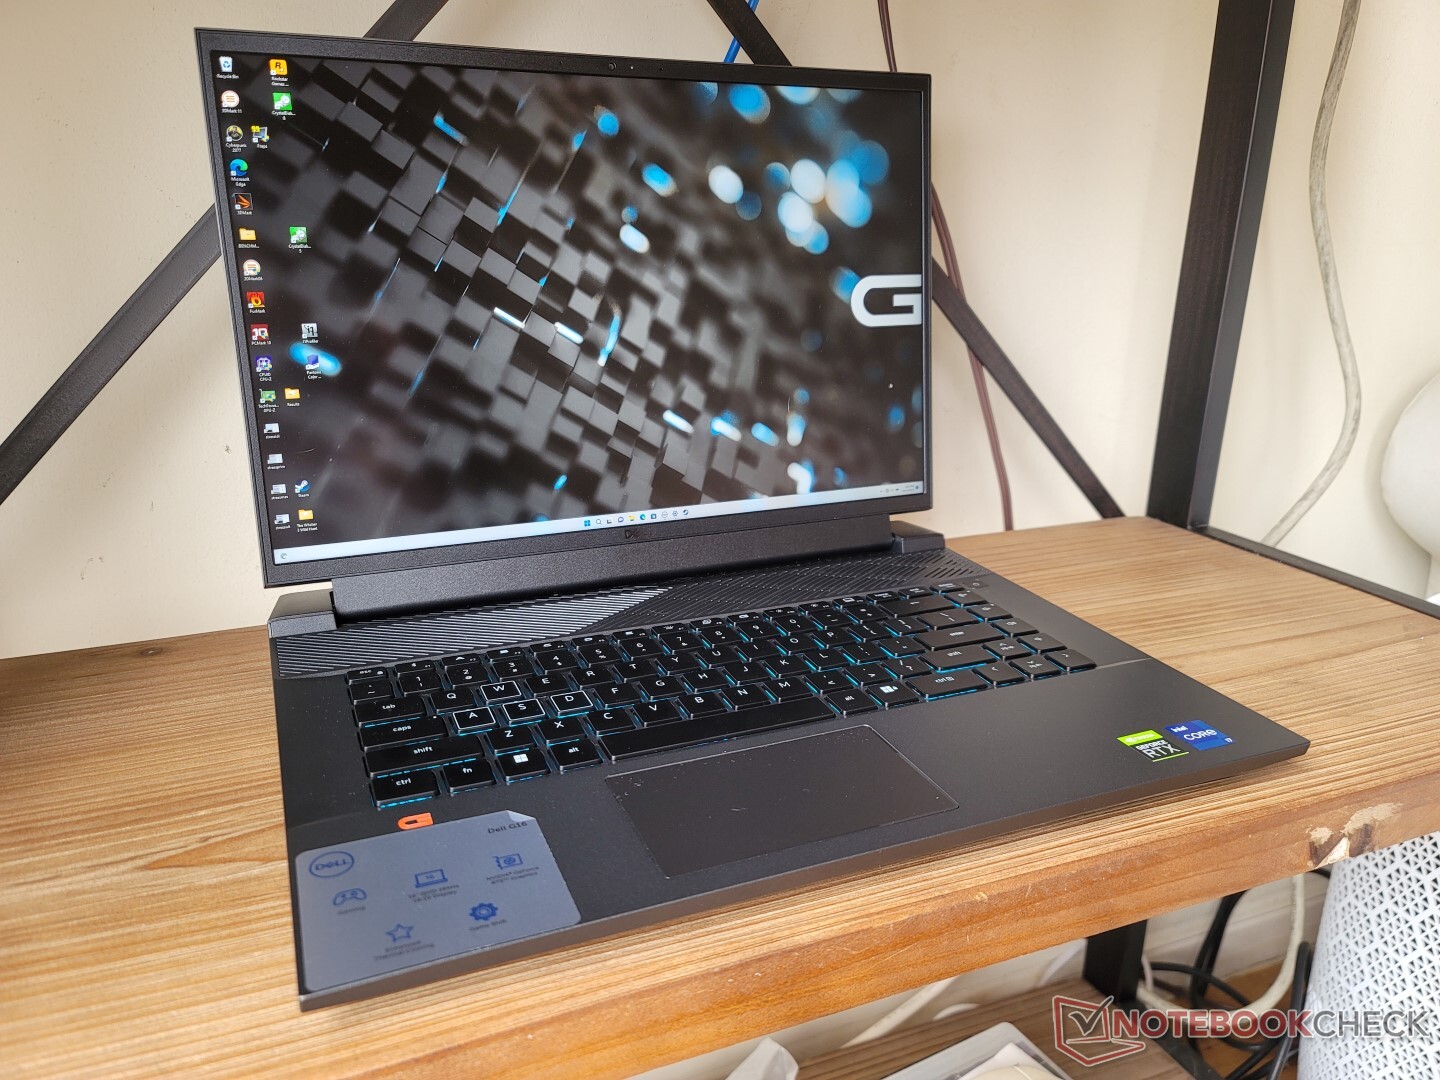
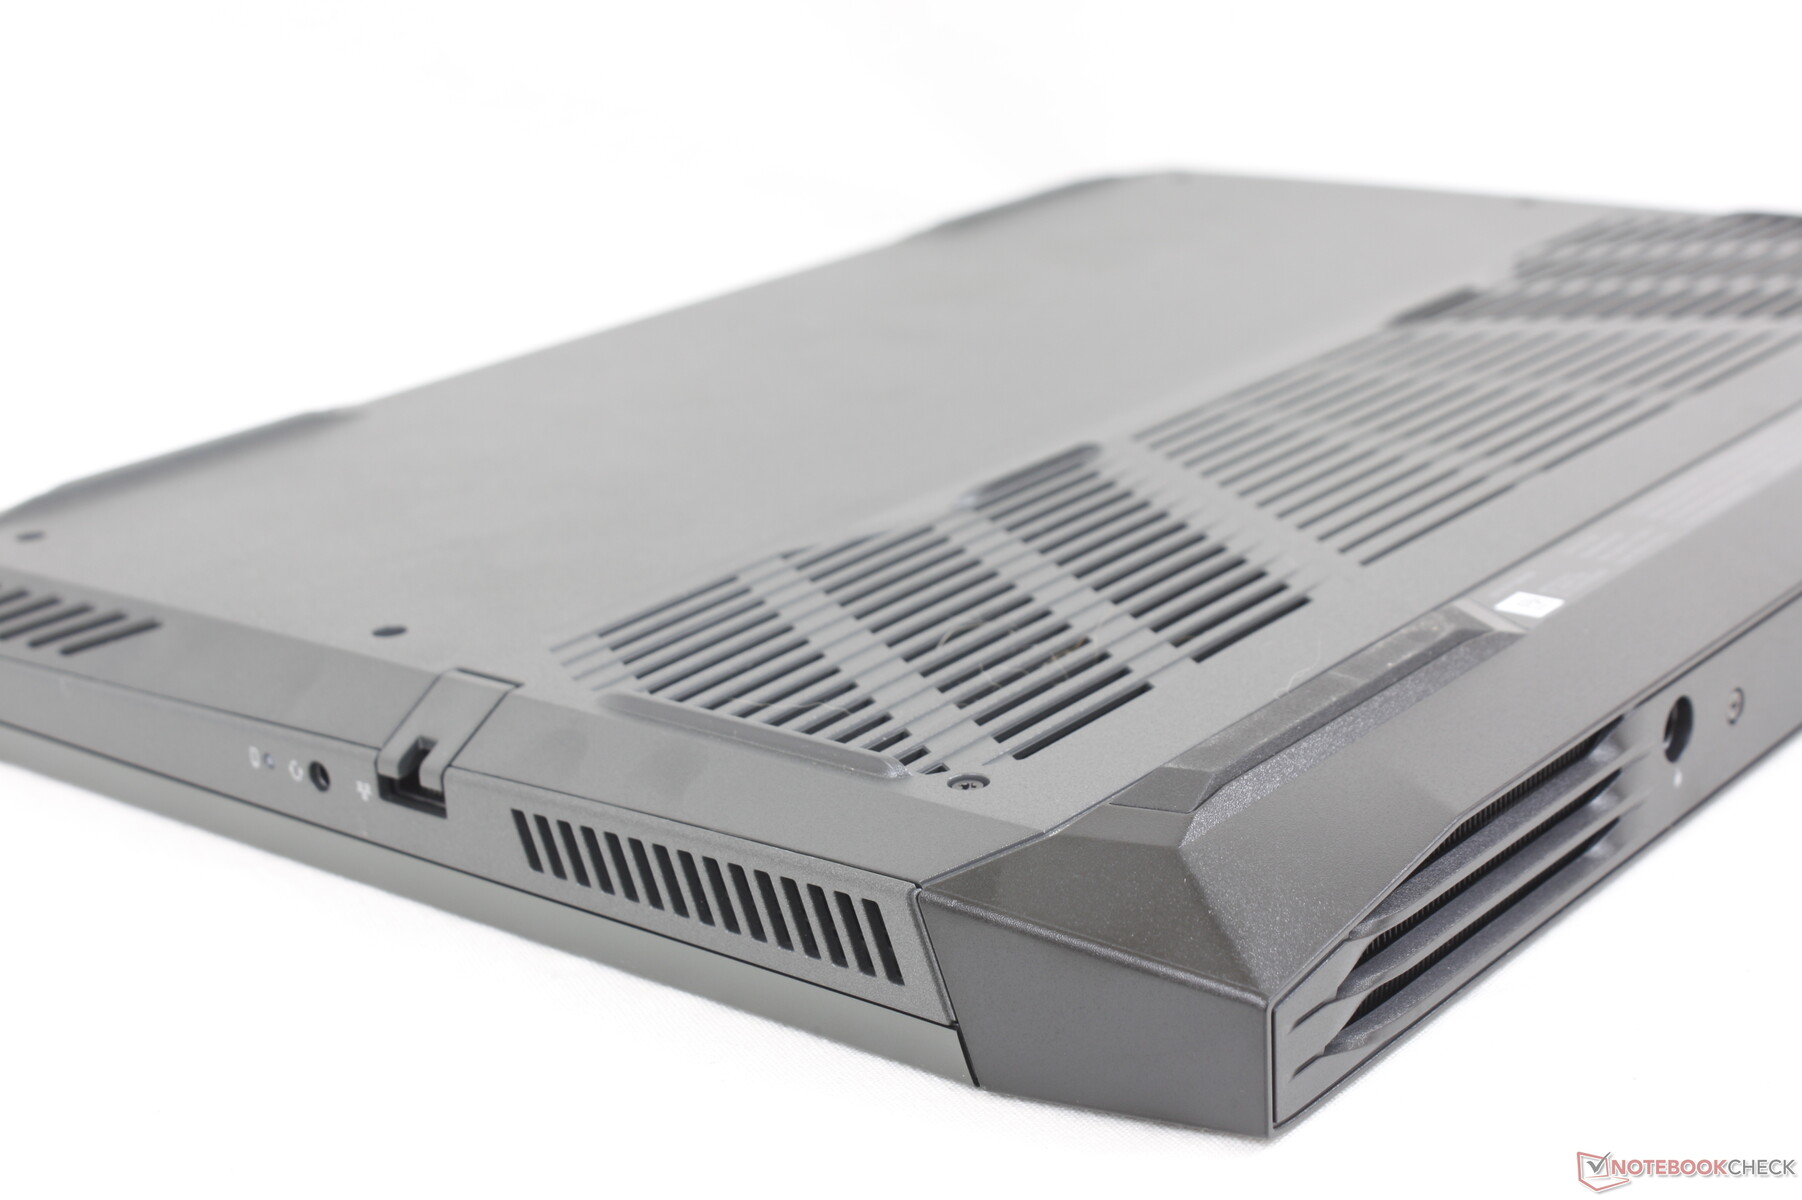
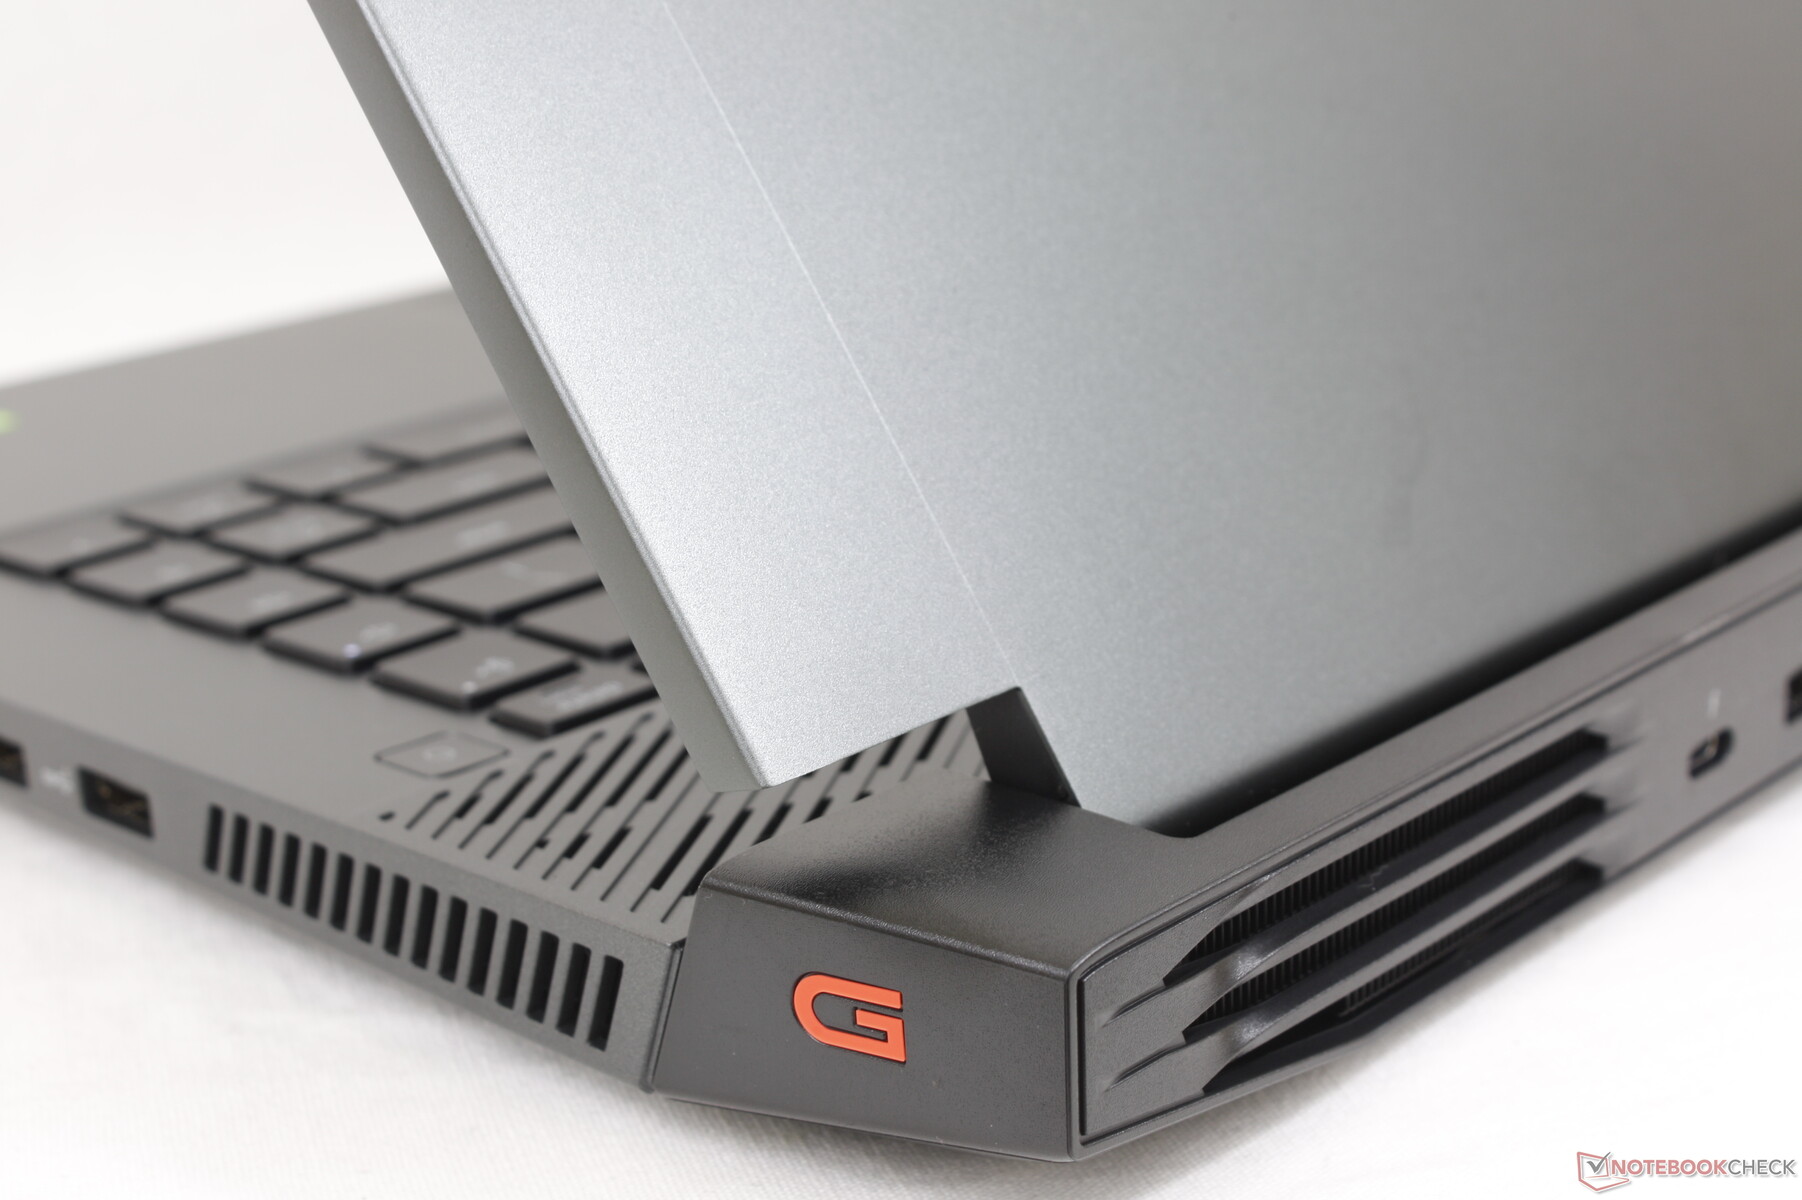
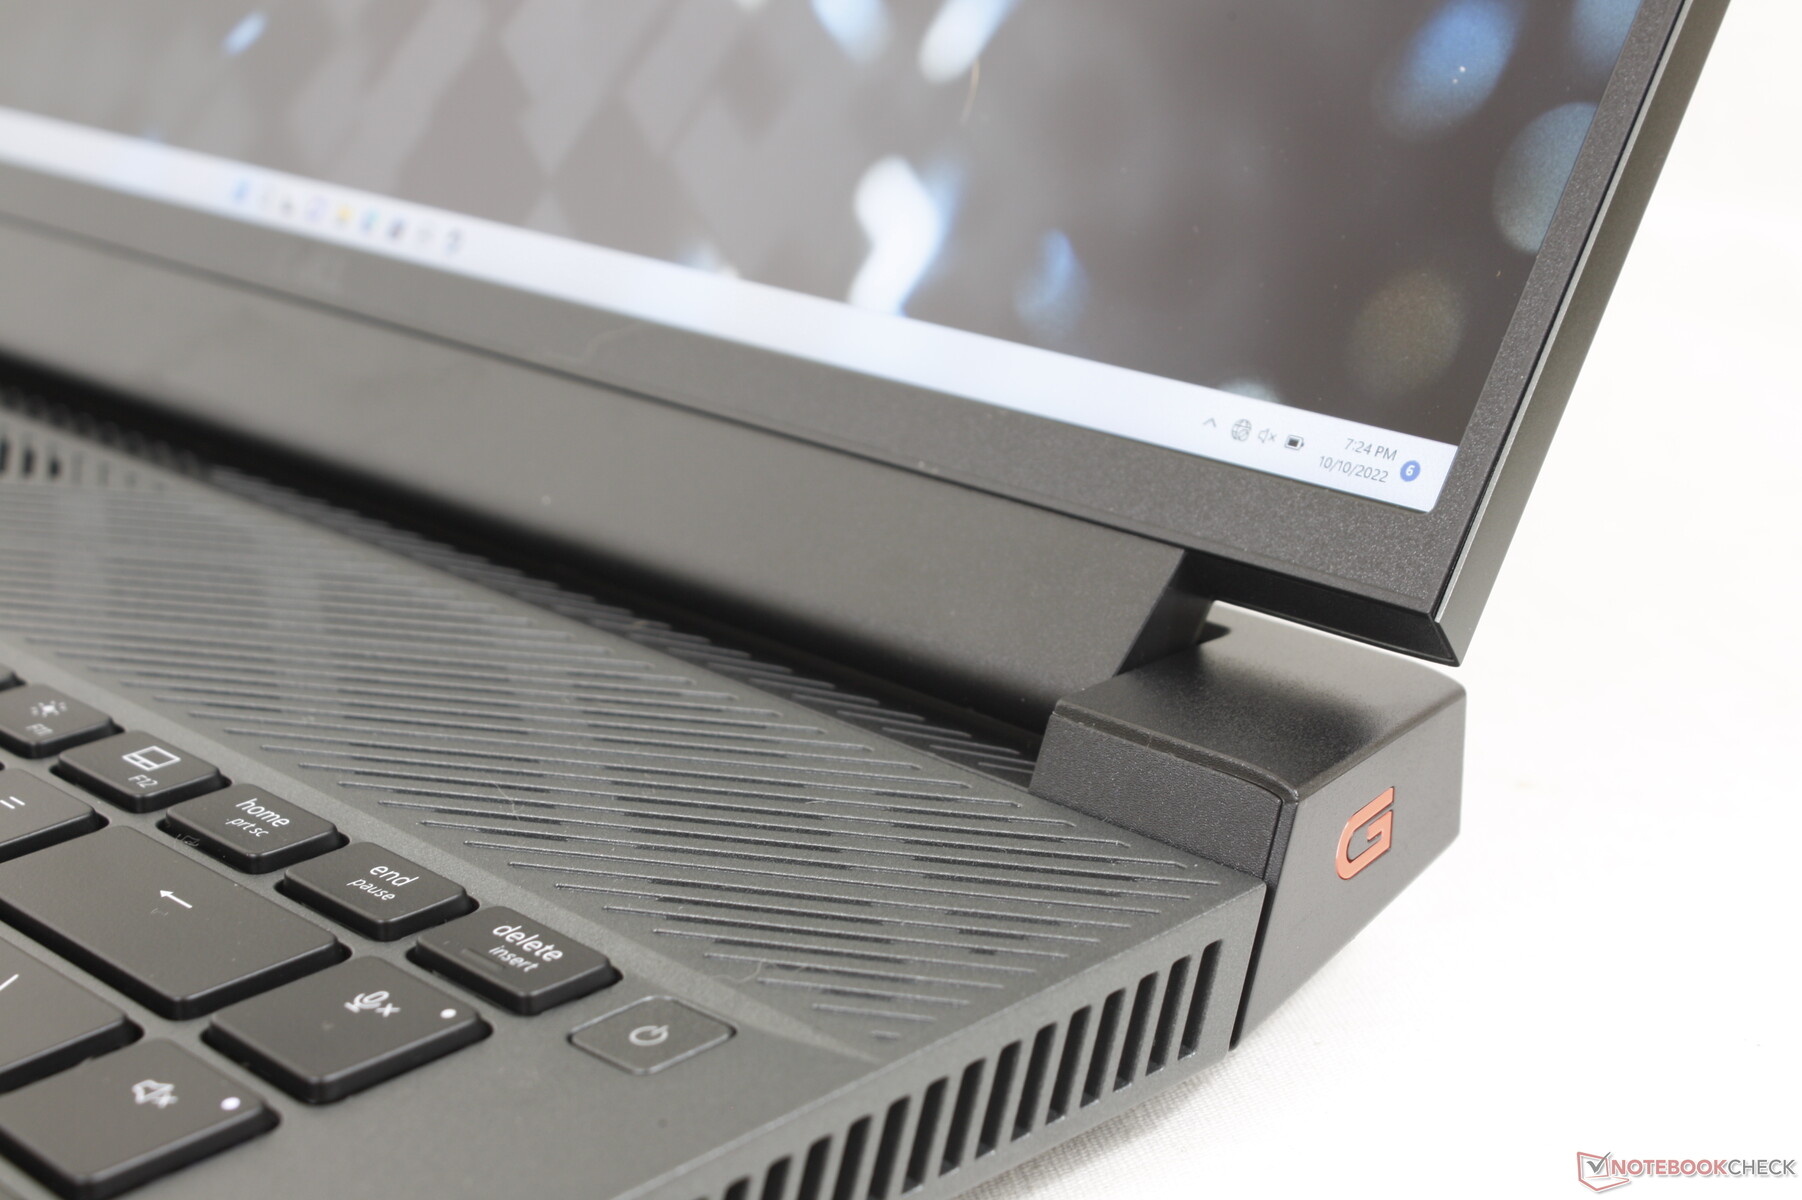
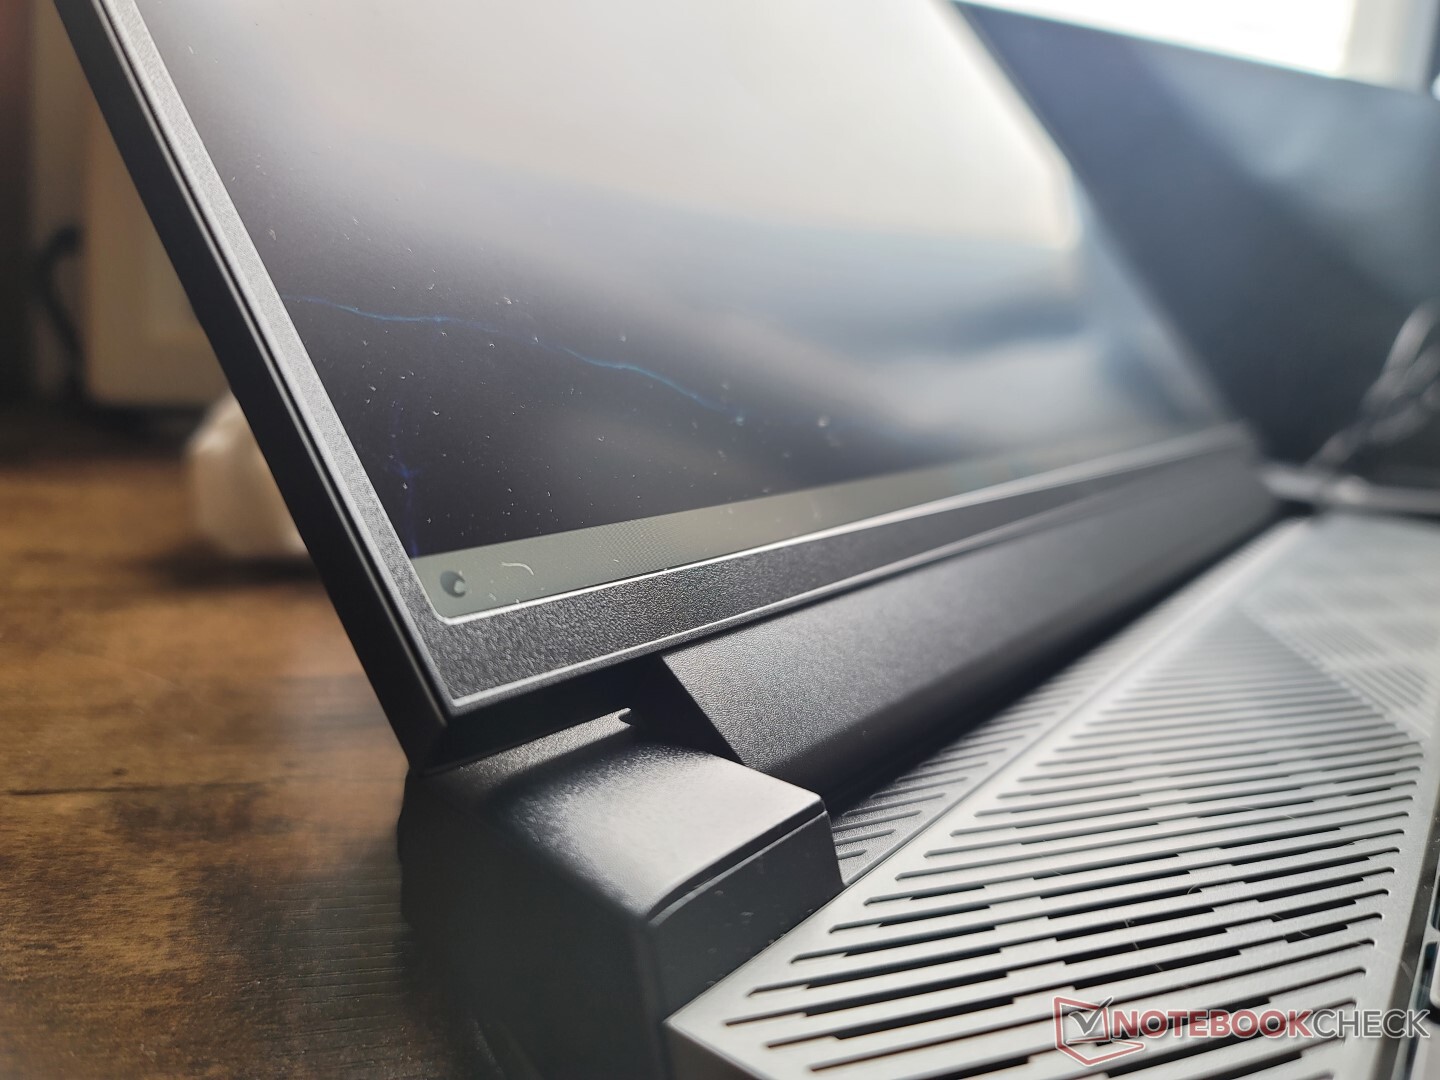
Le design général présente de nombreuses similitudes avec le modèle 16:9 de 15,6 pouces existant Dell G15 mais il a été remanié pour le nouveau facteur de forme 16:10. Les matériaux de la base en plastique obsidienne et du couvercle en aluminium anodisé restent les mêmes pour une texture lisse et une sensation familière. l'esthétique "gamer", comme le cadre intérieur brillant de l'écran ou l'anneau RVB des ordinateurs portables Alienware, n'est pas présente sur la série G.
La rigidité du châssis est ferme autour de la base et du centre du clavier où la flexion et la torsion sont minimes. Le couvercle présente une flexion relativement plus importante, mais pas de manière significative.
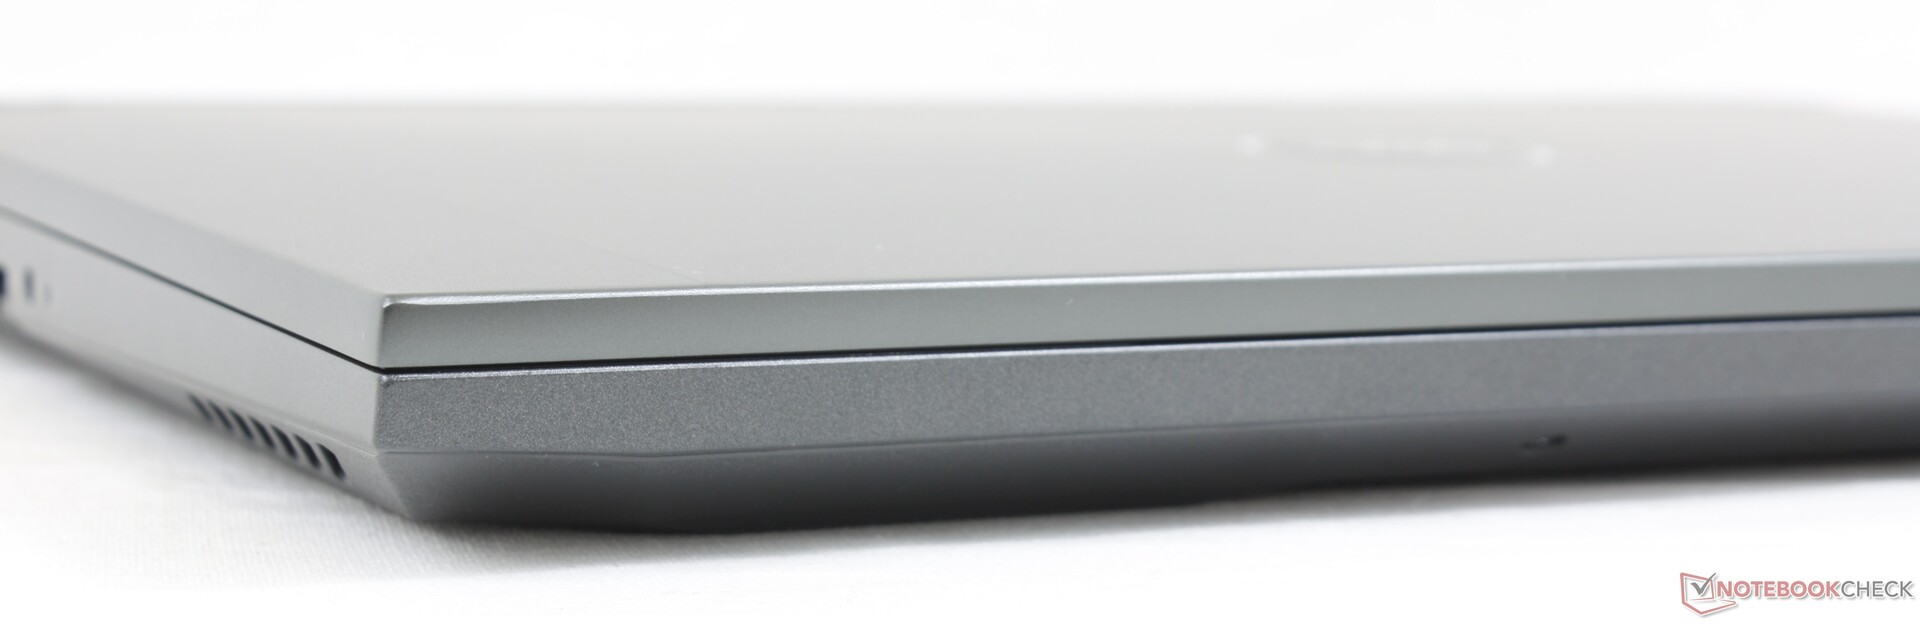
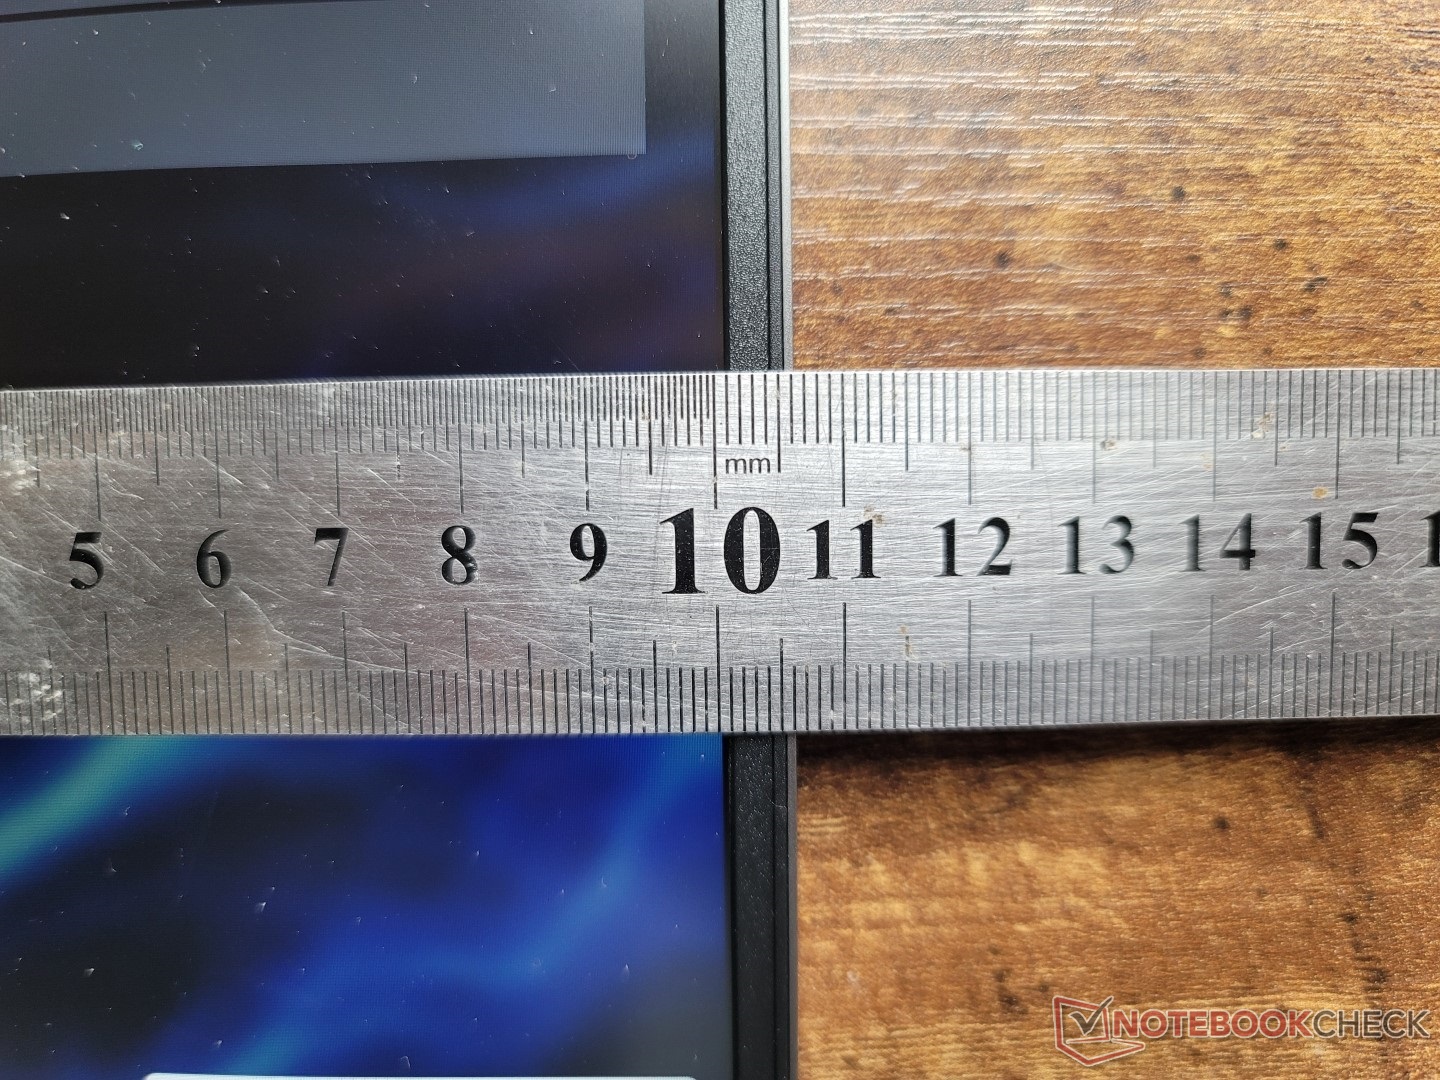
Les ordinateurs portables de jeu Dell sont généralement plus lourds que la concurrence et le G16 ne fait pas exception. Avec ses 2,6 kg, ce modèle est plus lourd que le HP Victus 16l'Acer Swift X et l'Asus Zephyrus M16 de plusieurs centaines de grammes chacun. Le G16 est donc plus épais que la plupart des autres ordinateurs portables de jeu de sa catégorie.
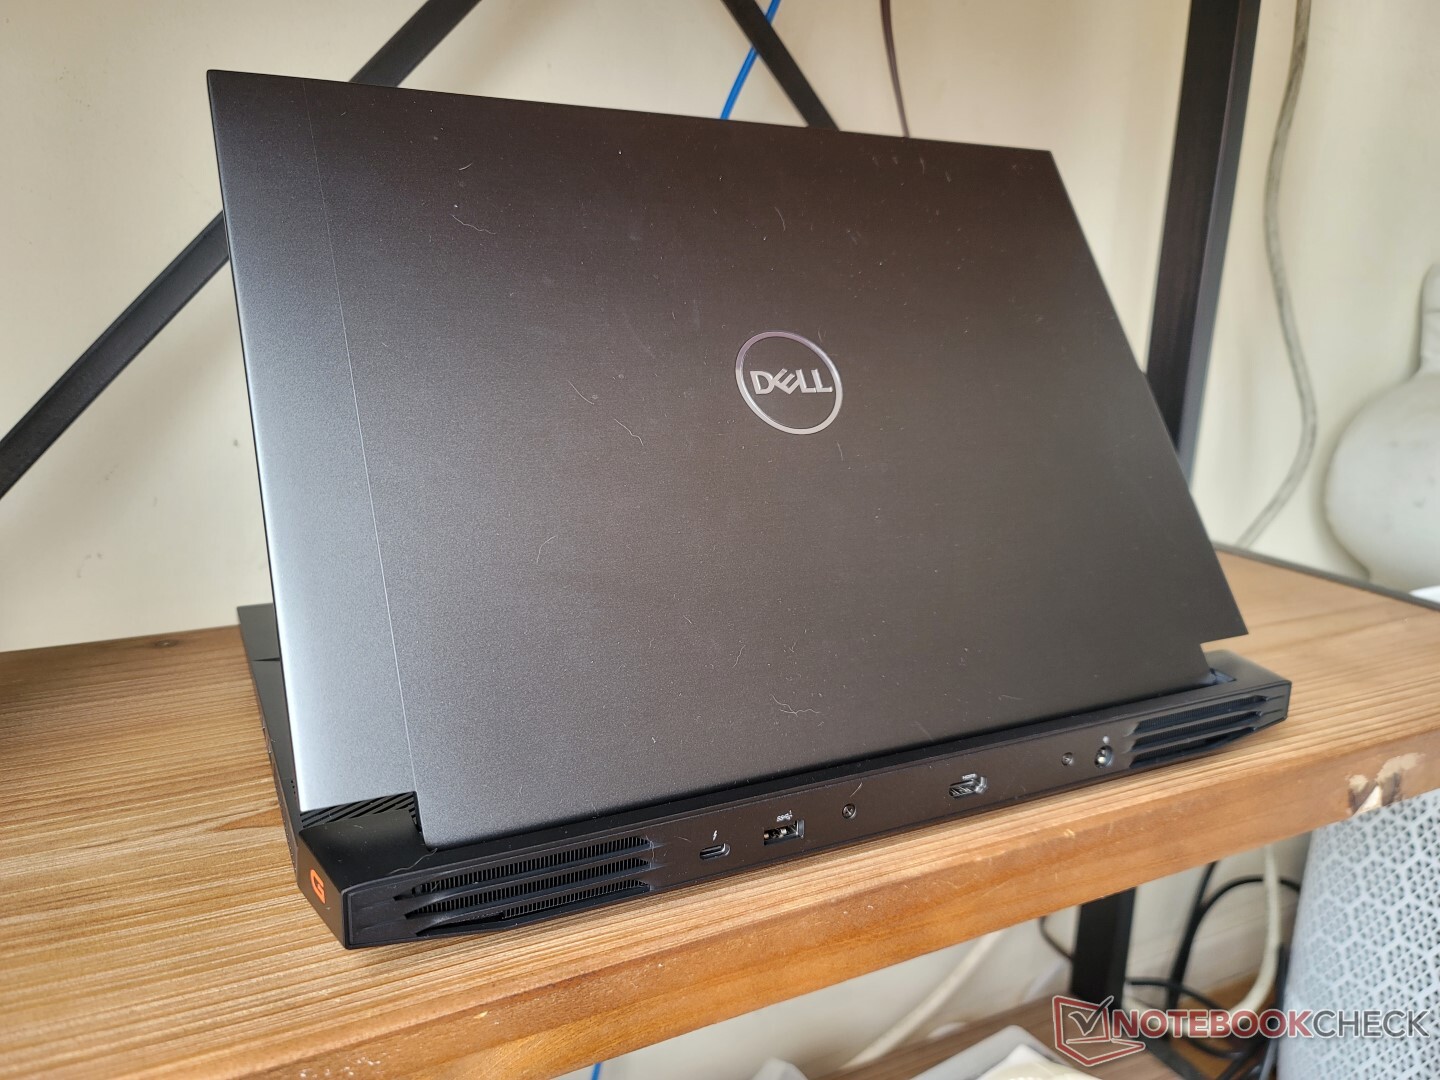
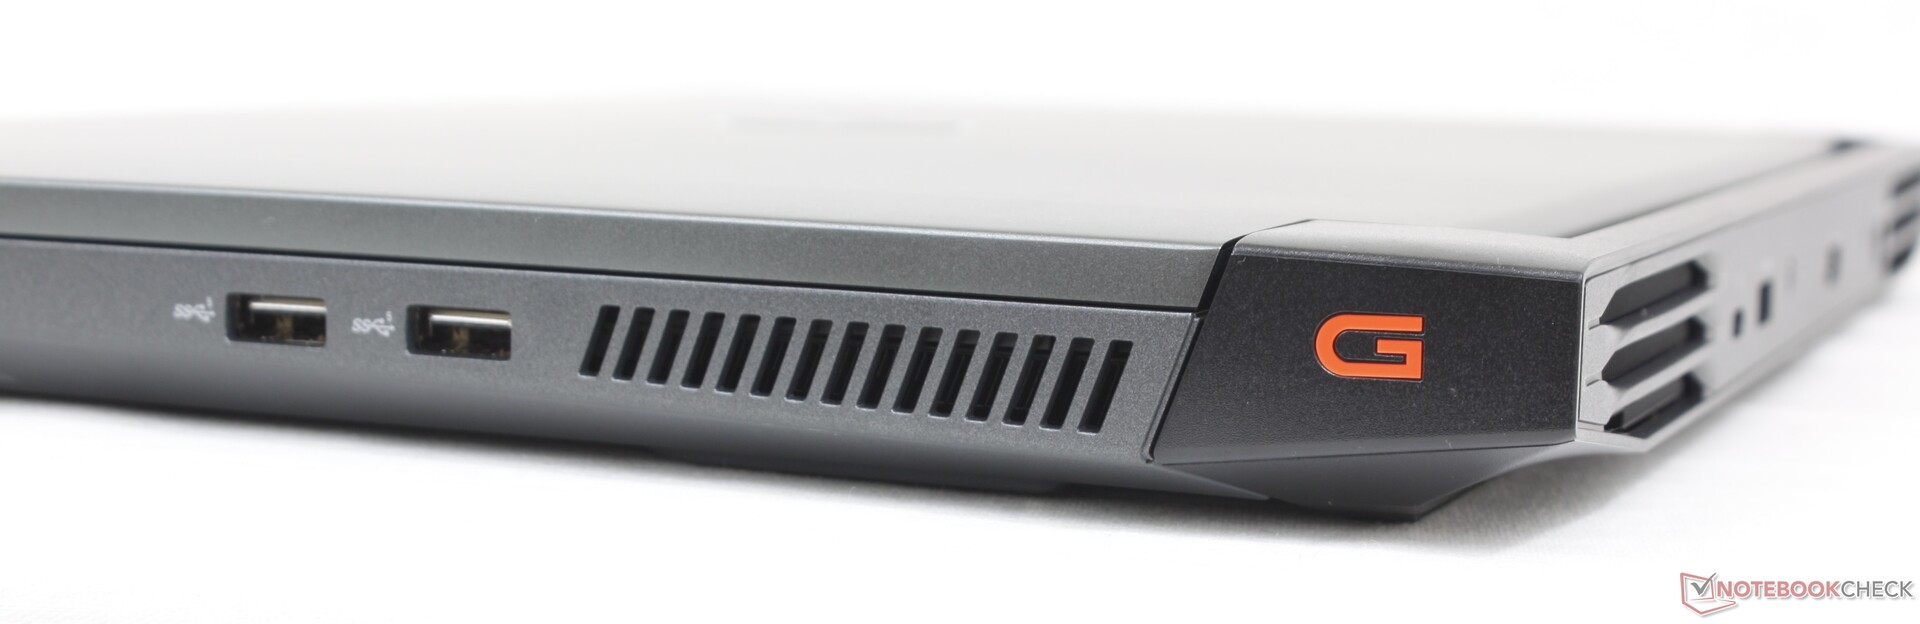
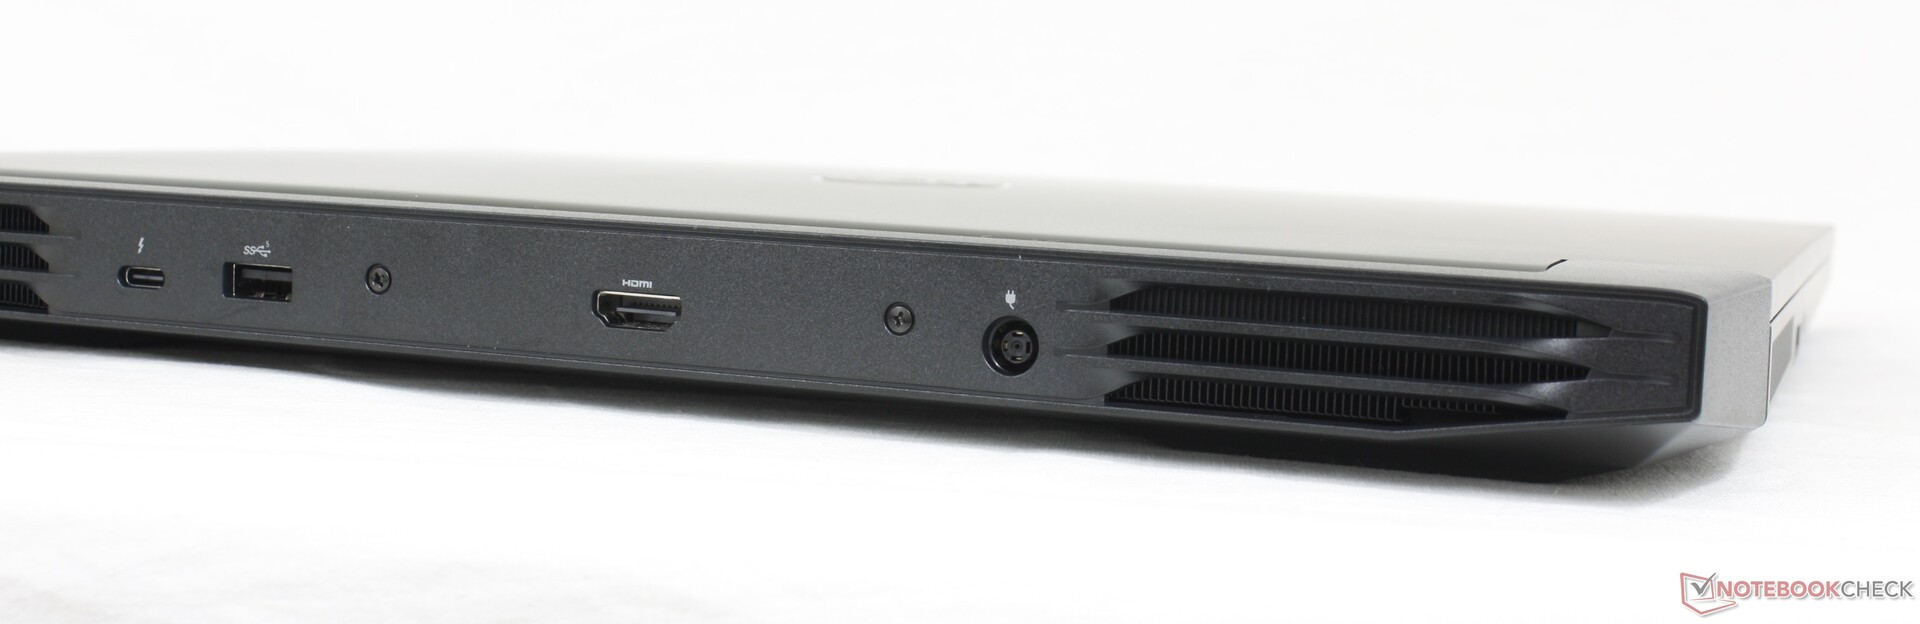
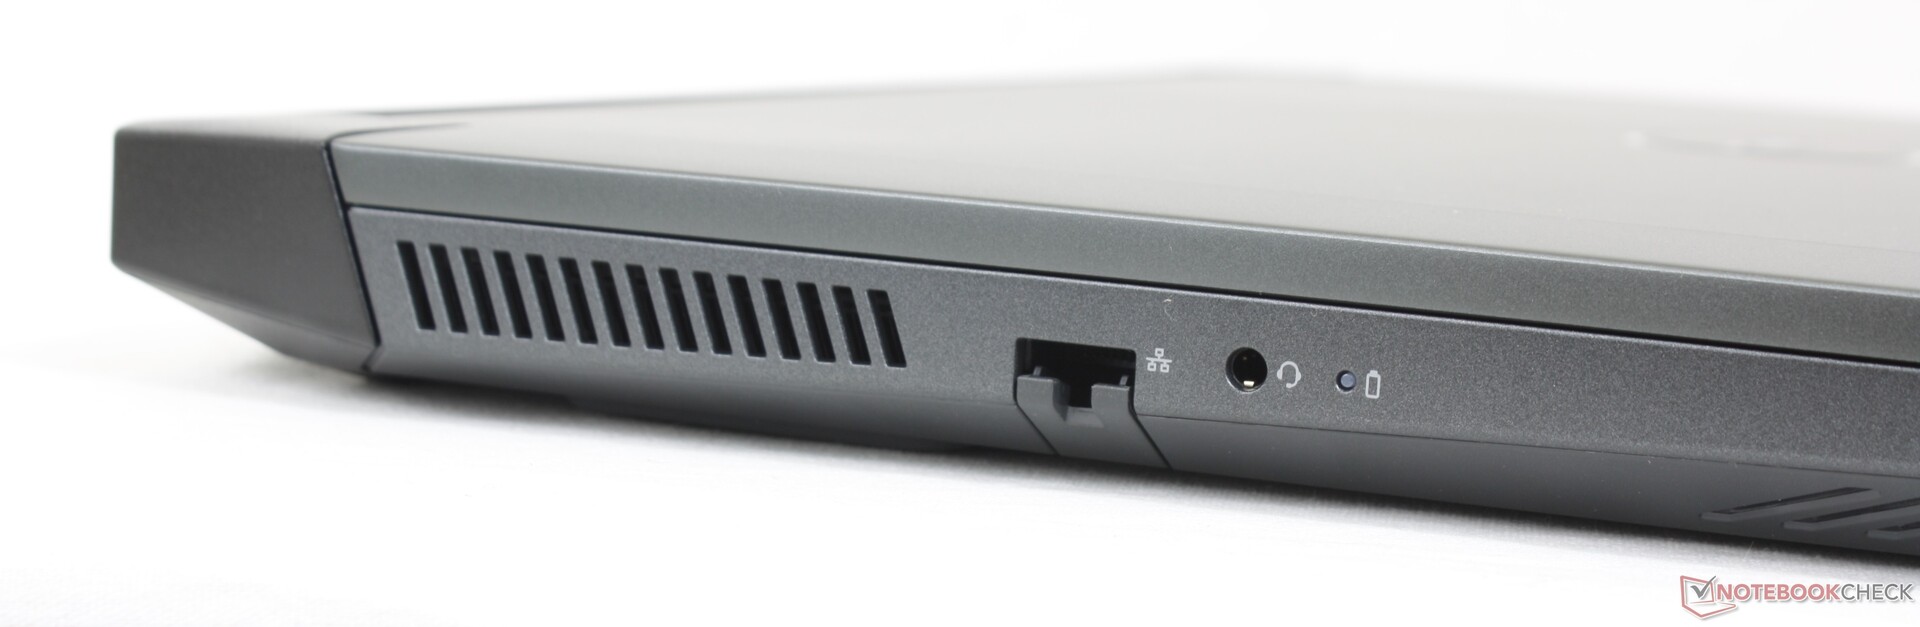
Connectivité - Support Thunderbolt 4
Les options de port sont très similaires à celles du HP Victus 16, bien que réarrangées. En fait, la moitié des ports sur le G16 se trouvent le long de l'arrière en raison des grandes grilles de ventilation sur les bords gauche et droit. Nous aimerions voir plus de ports USB-C à l'avenir, car il n'y en a qu'un seul, contre trois sur les ordinateurs concurrents.Lenovo Legion 5 Pro.
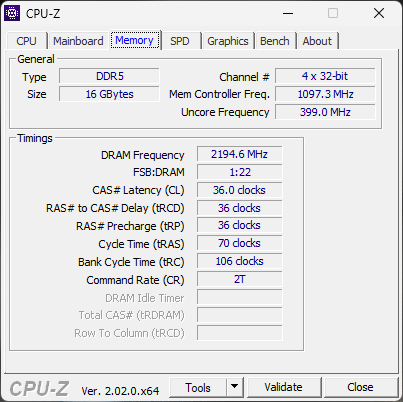
Communication - 6 GHz Non inclus
Un Intel AX201 est fourni en standard pour la connectivité Wi-Fi 6 et Bluetooth 5.2. Il n'existe pas d'options Wi-Fi 6E susceptibles de réduire les coûts. Les taux de transfert sont par ailleurs stables, voire peu impressionnants, lorsqu'ils sont associés à notre routeur AXE11000.
| Networking | |
| iperf3 transmit AX12 | |
| Acer Swift X SFX16-51G-5388 | |
| Asus ROG Zephyrus M16 GU603H | |
| iperf3 receive AX12 | |
| Acer Swift X SFX16-51G-5388 | |
| Asus ROG Zephyrus M16 GU603H | |
| iperf3 receive AXE11000 6GHz | |
| Lenovo Legion 5 Pro 16IAH7H | |
| Lenovo Legion 7 16ARHA7 | |
| iperf3 receive AXE11000 | |
| Dell G16 7620 | |
| HP Victus 16-e0145ng | |
| iperf3 transmit AXE11000 6GHz | |
| Lenovo Legion 7 16ARHA7 | |
| Lenovo Legion 5 Pro 16IAH7H | |
| iperf3 transmit AXE11000 | |
| Dell G16 7620 | |
| HP Victus 16-e0145ng | |
Webcam
La webcam est un décevant 1 MP pour une image très boueuse. Il n'y a pas non plus de capteur IR ni d'obturateur de confidentialité.


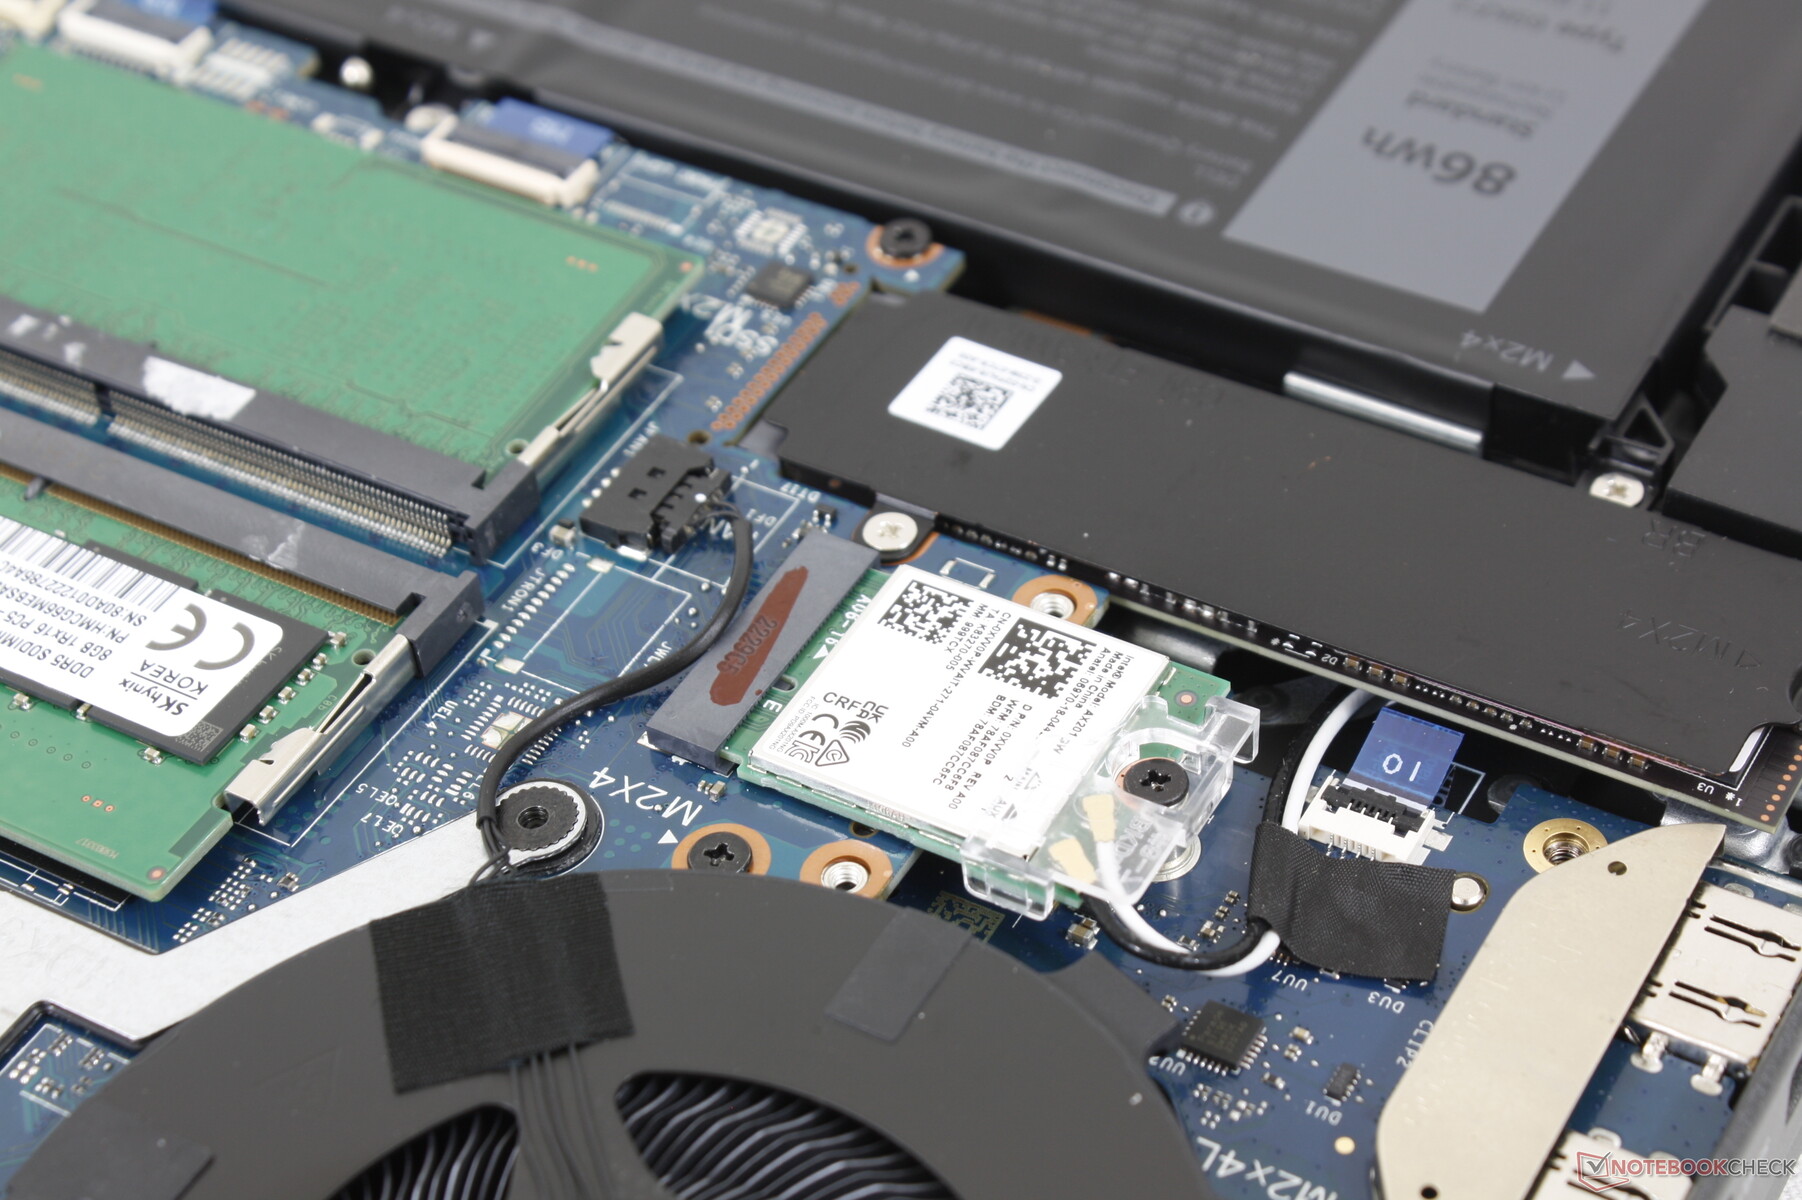
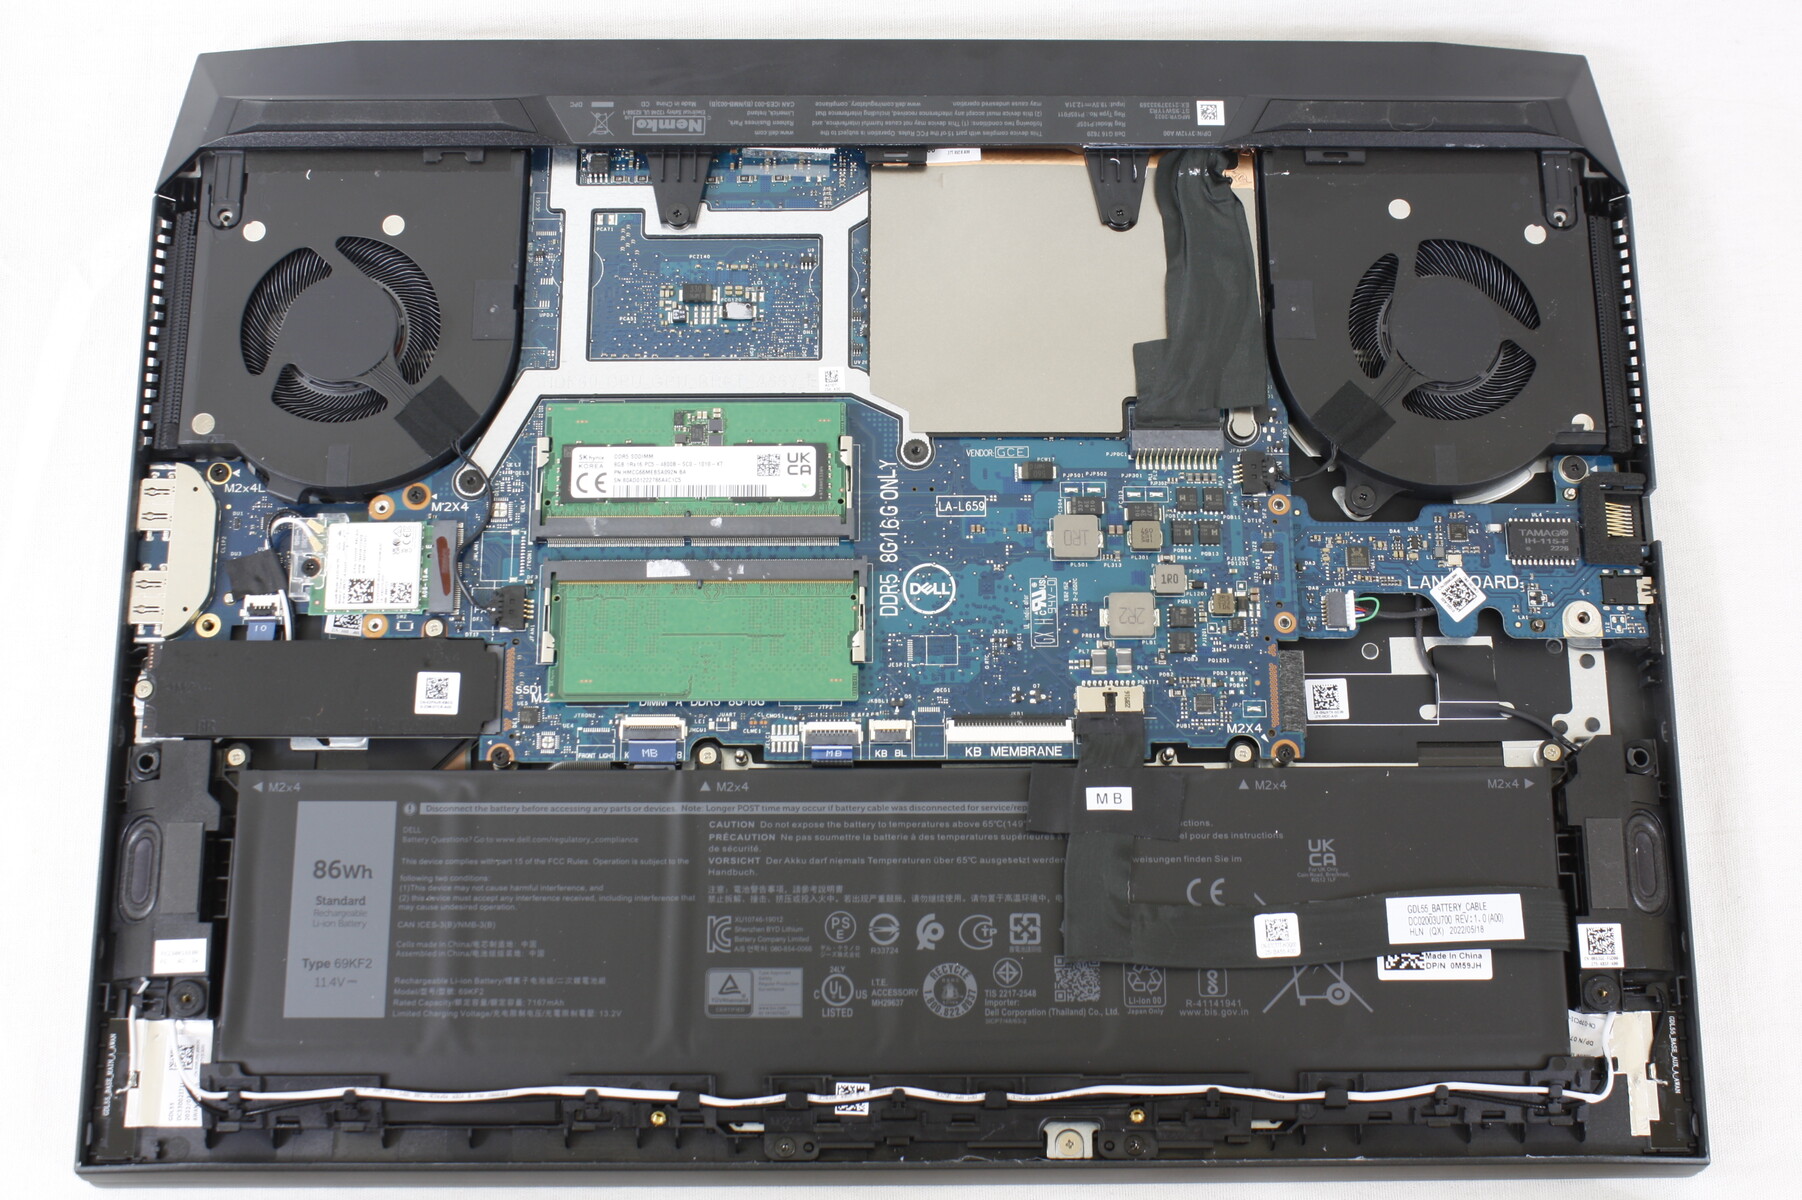
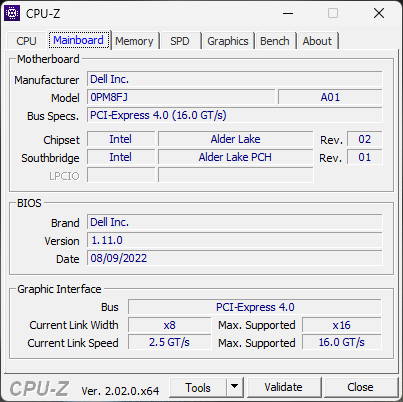
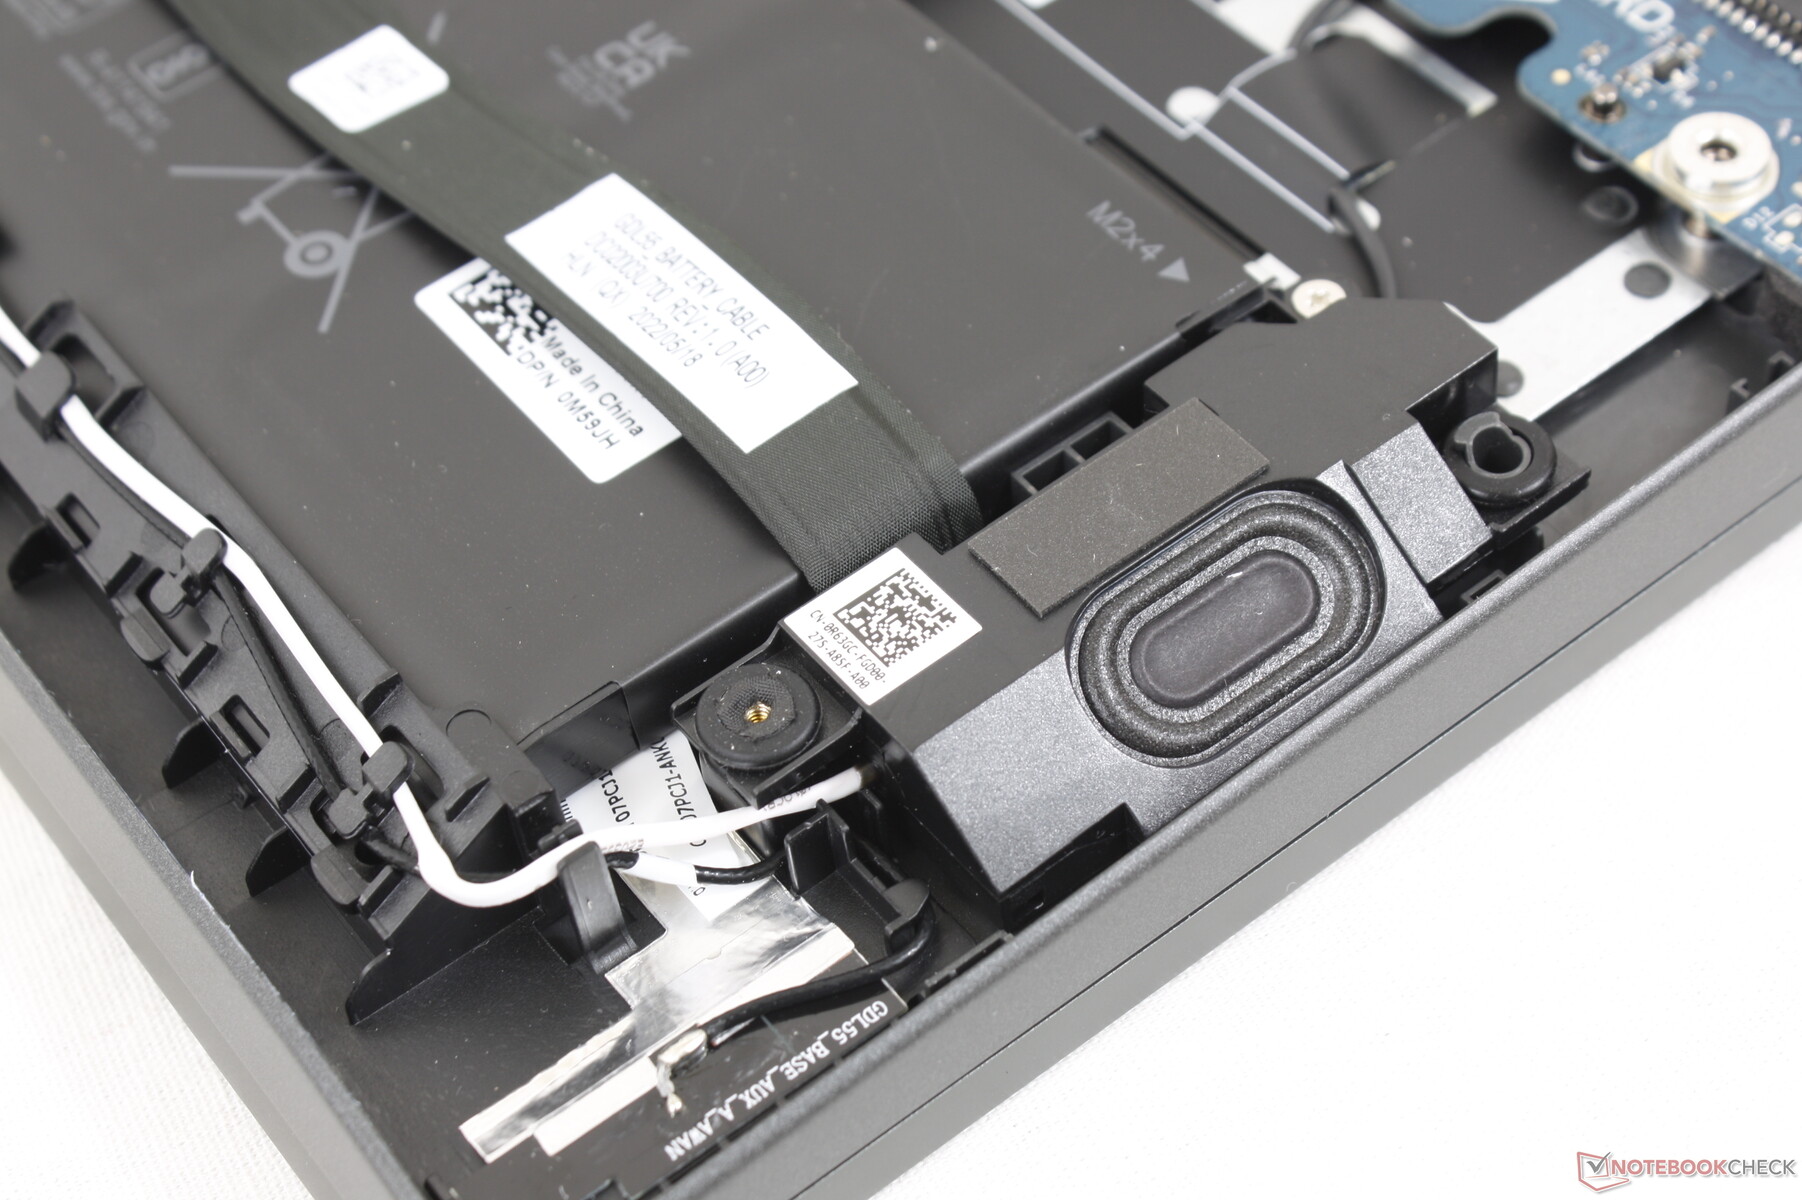
Maintenance
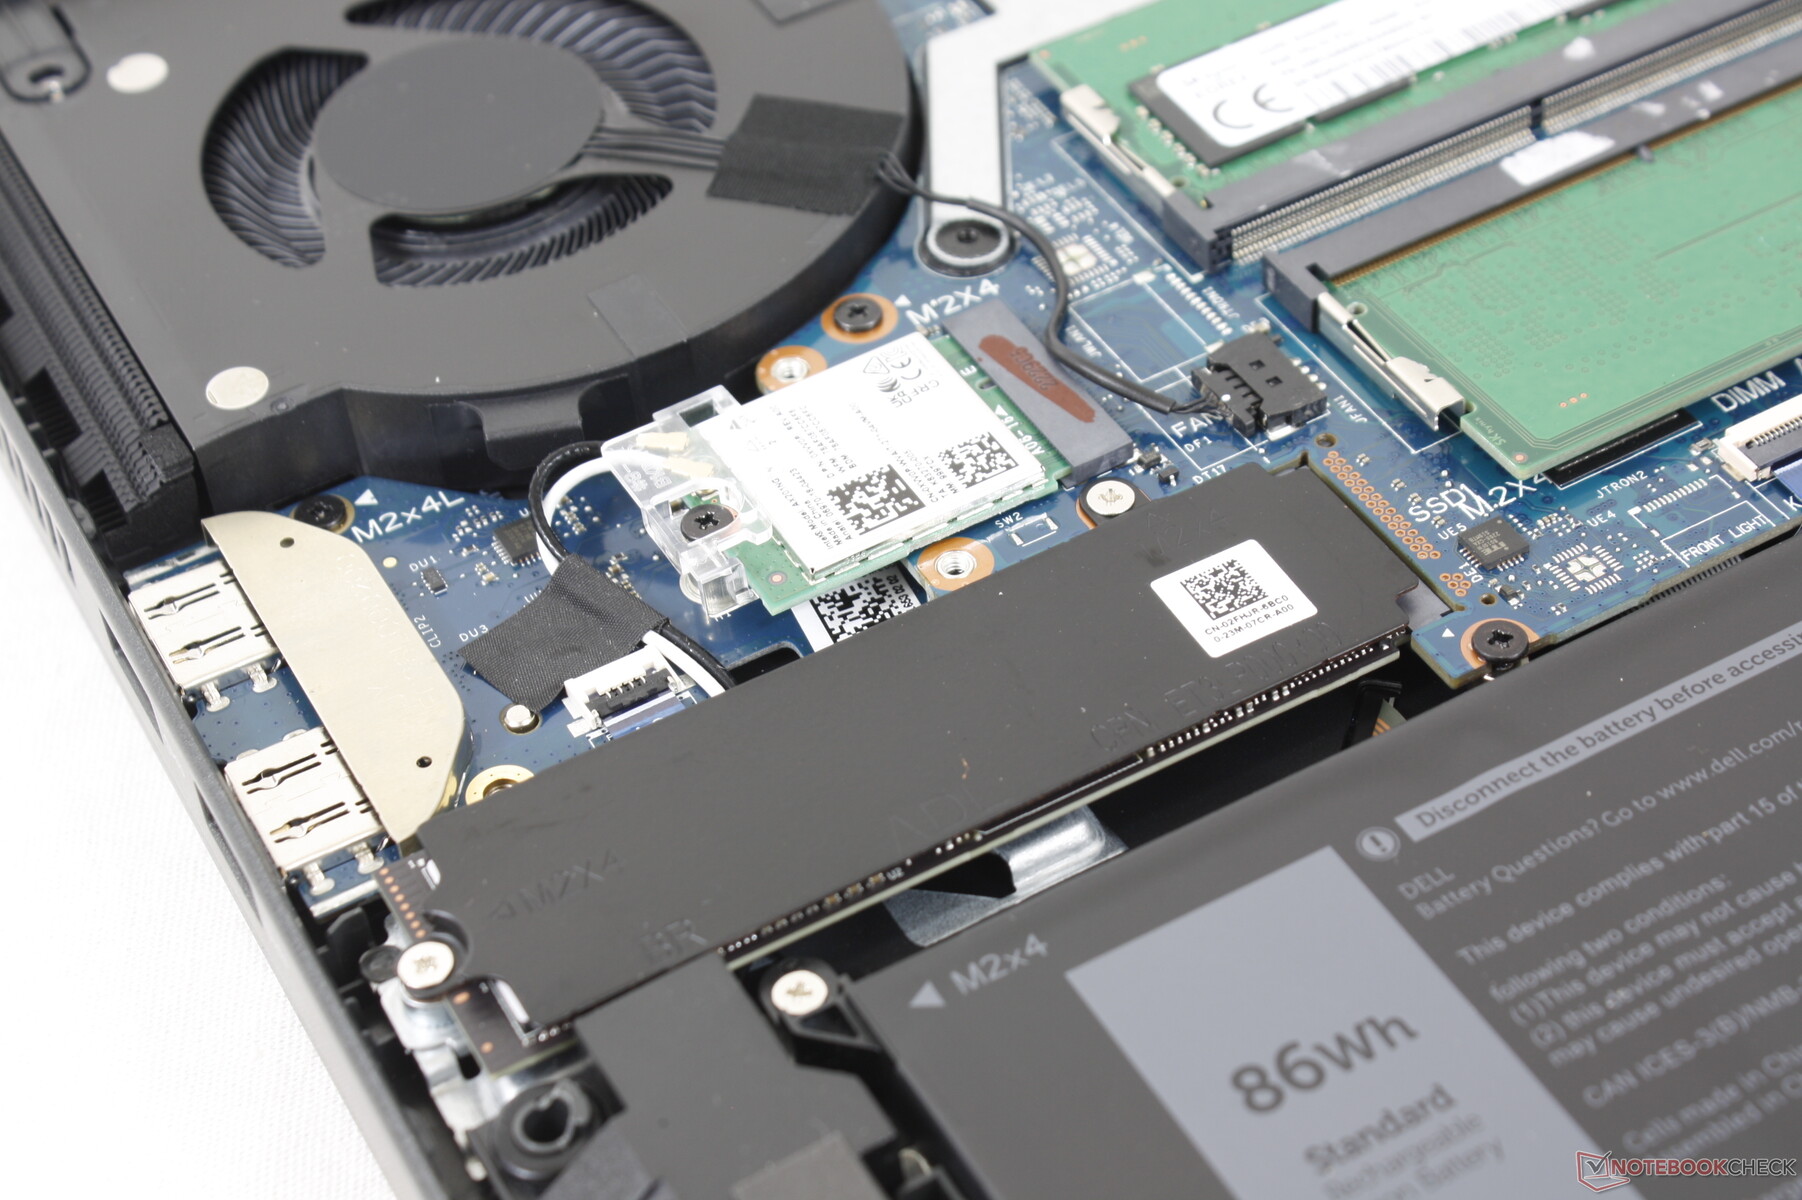
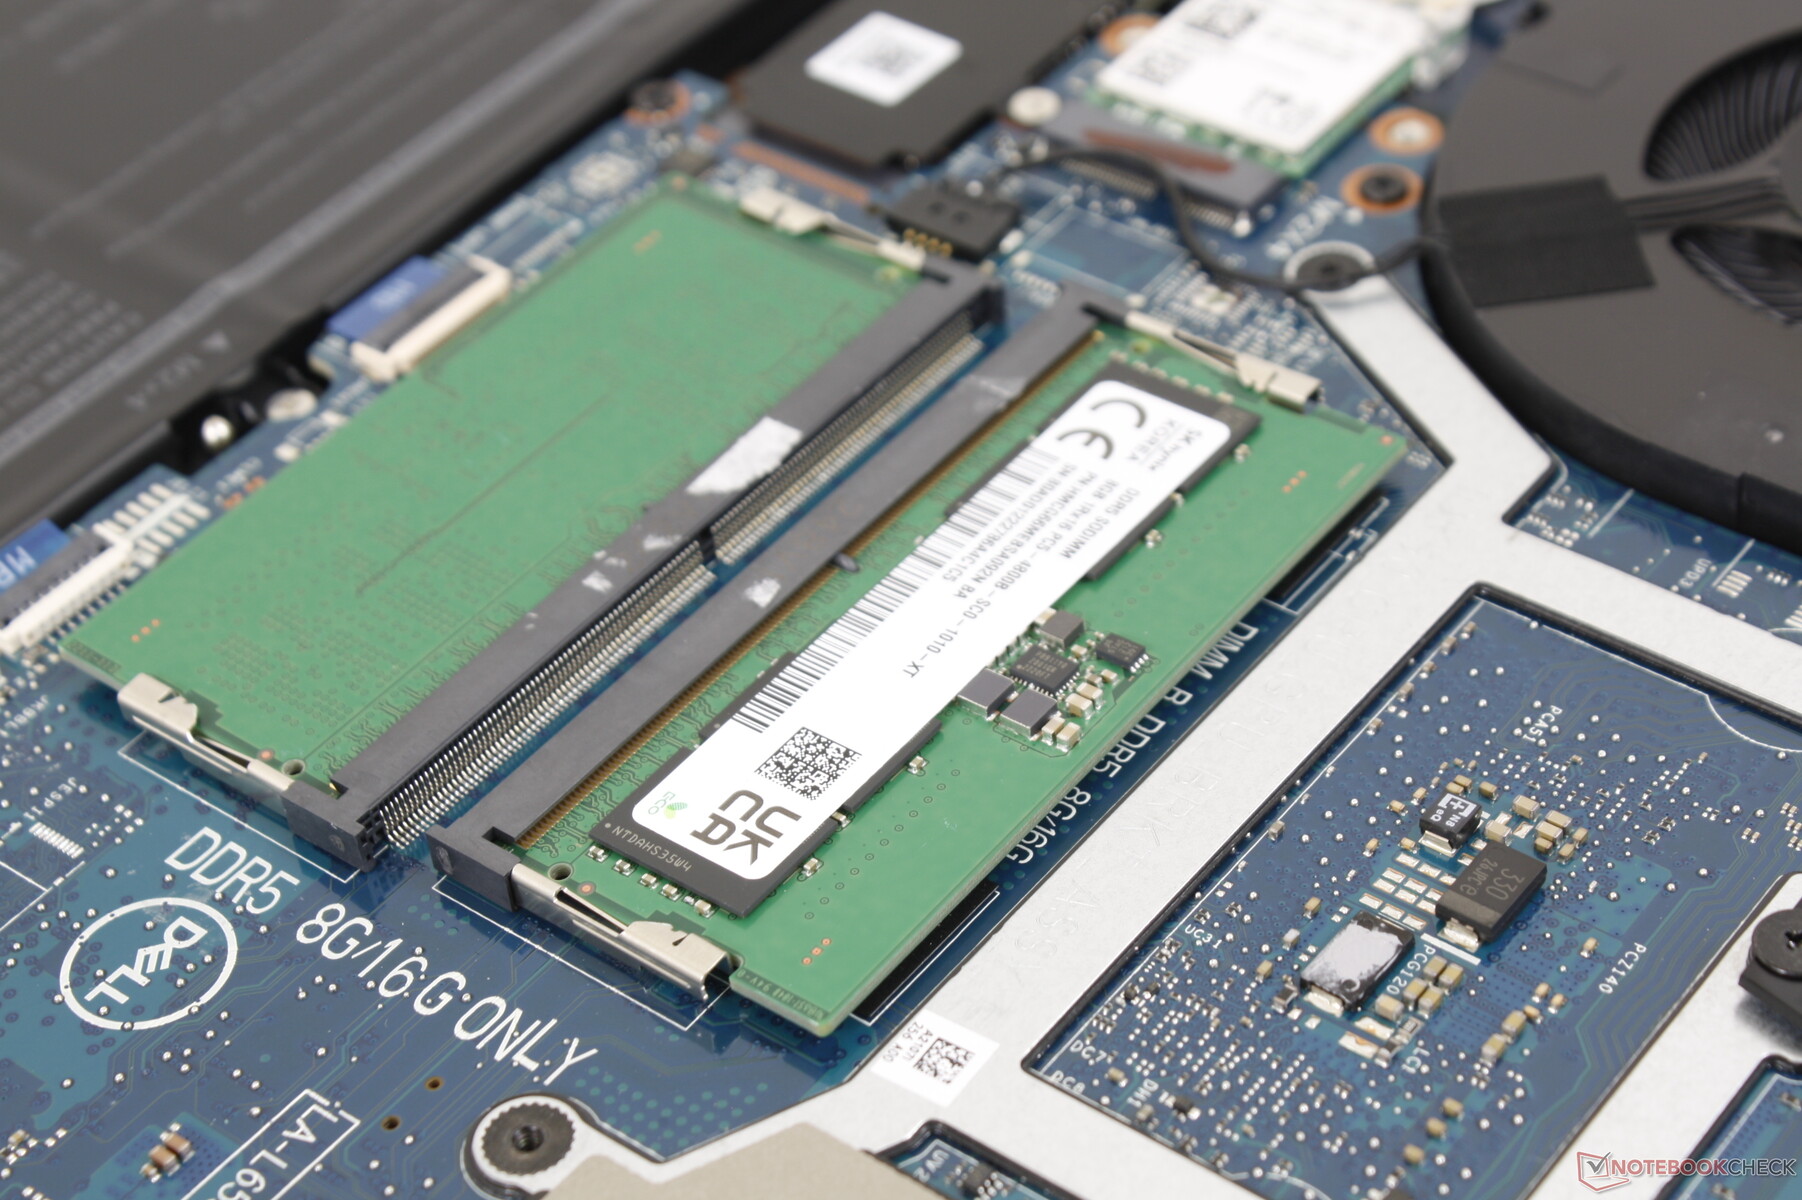
Le panneau inférieur est fixé par 8 vis Philips pour faciliter l'entretien. Les utilisateurs ont un accès direct à 2 emplacements SODIMM DDR5, 1 emplacement SSD M.2 2280, la batterie et le module WLAN M.2 amovible. Les caloducs et les processeurs se trouvent sur le côté opposé et nécessitent un démontage supplémentaire pour y accéder.
Accessoires et garantie
Il n'y a pas d'autres éléments dans la boîte que l'adaptateur secteur et les documents. La garantie limitée habituelle d'un an du fabricant s'applique si l'appareil est acheté aux États-Unis.
Périphériques d'entrée - Plus de Numpad
Clavier
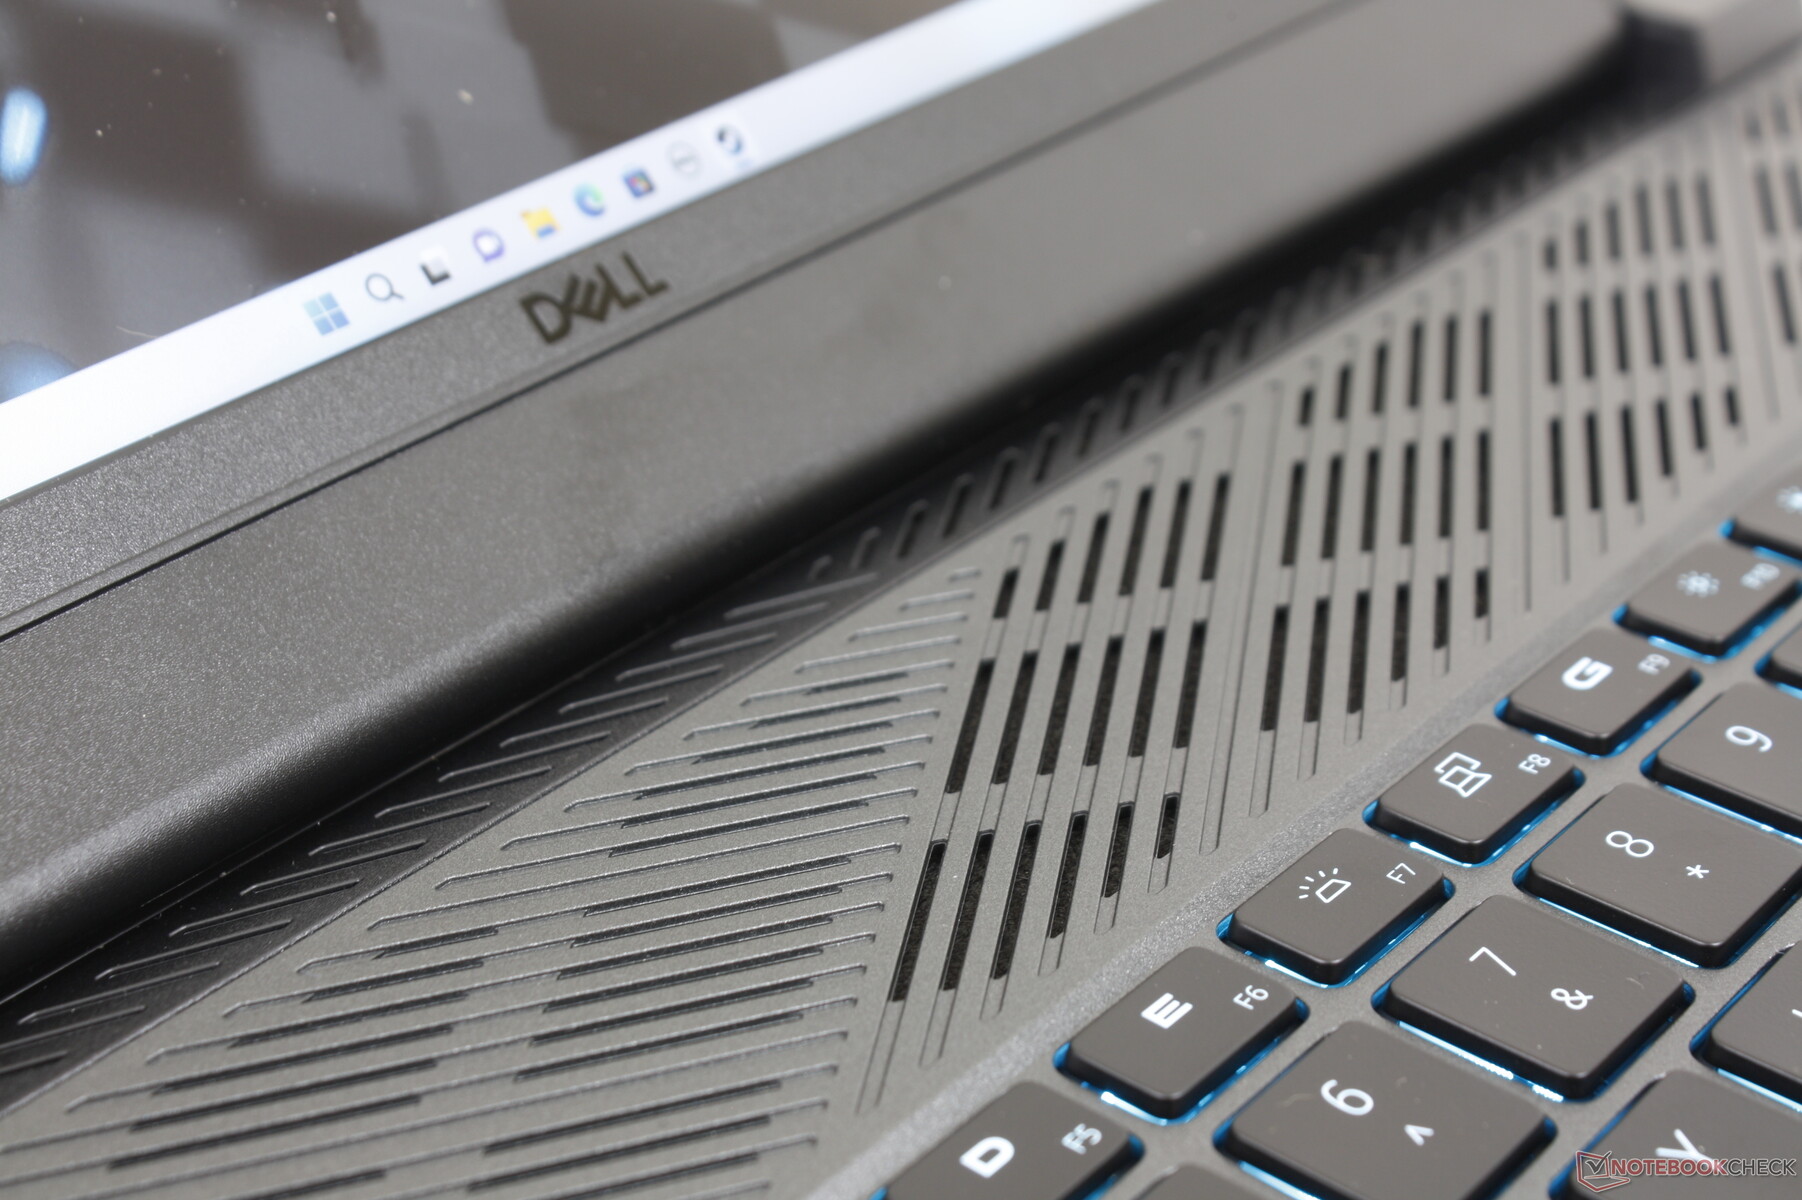
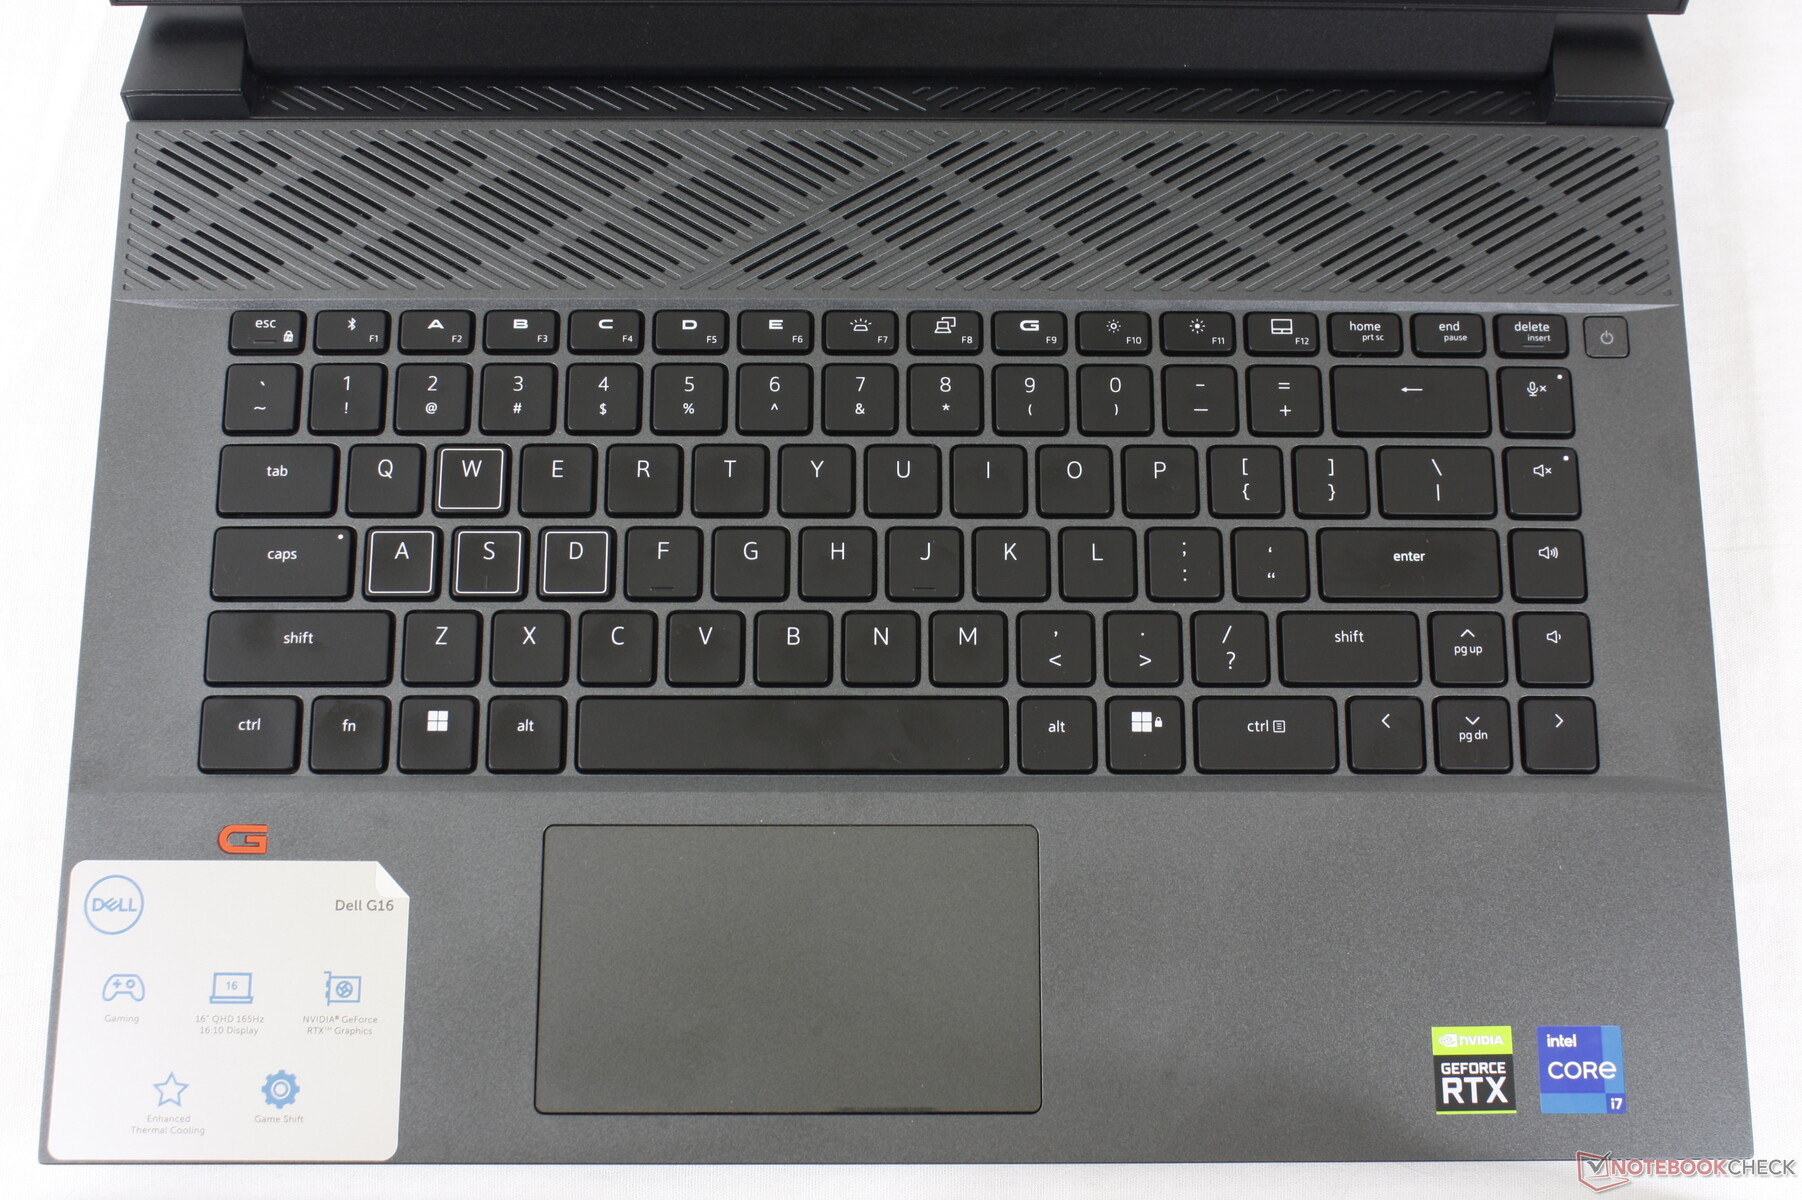
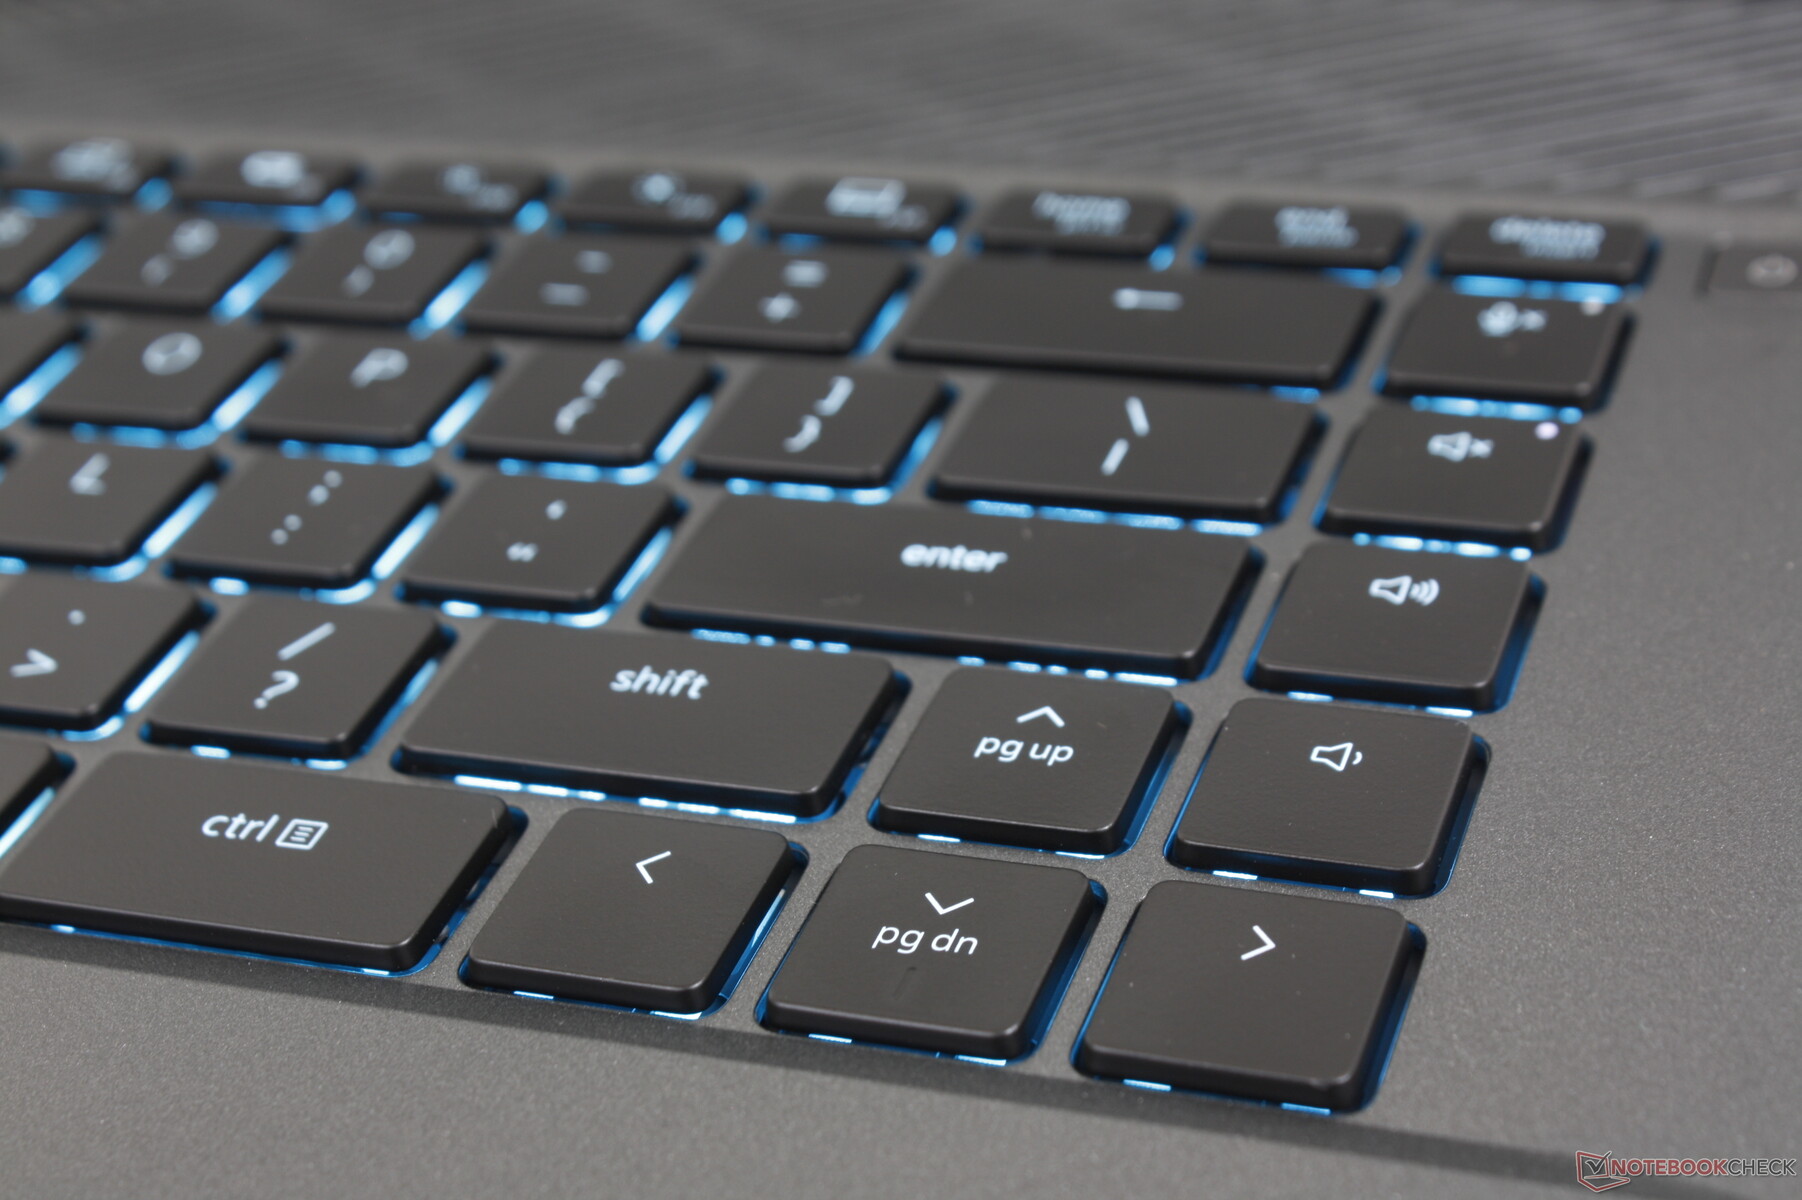
Alors que Dell aurait pu facilement utiliser le même clavier G15 pour son nouveau modèle G16, la société a opté pour un clavier complètement différent. Le clavier G16 a abandonné le pavé numérique pour des touches fléchées de taille normale, ce qui est mitigé selon l'application ou le jeu. Du côté positif, le retour des touches est plus net et plus ferme que sur le G15 pour une expérience de frappe plus satisfaisante.
Malheureusement, les utilisateurs devront payer plus cher pour la fonction d'éclairage RVB par touche sur le G16. Le modèle est autrement livré avec un rétroéclairage LED bleu à zone unique, comme le montrent nos images ci-dessous.
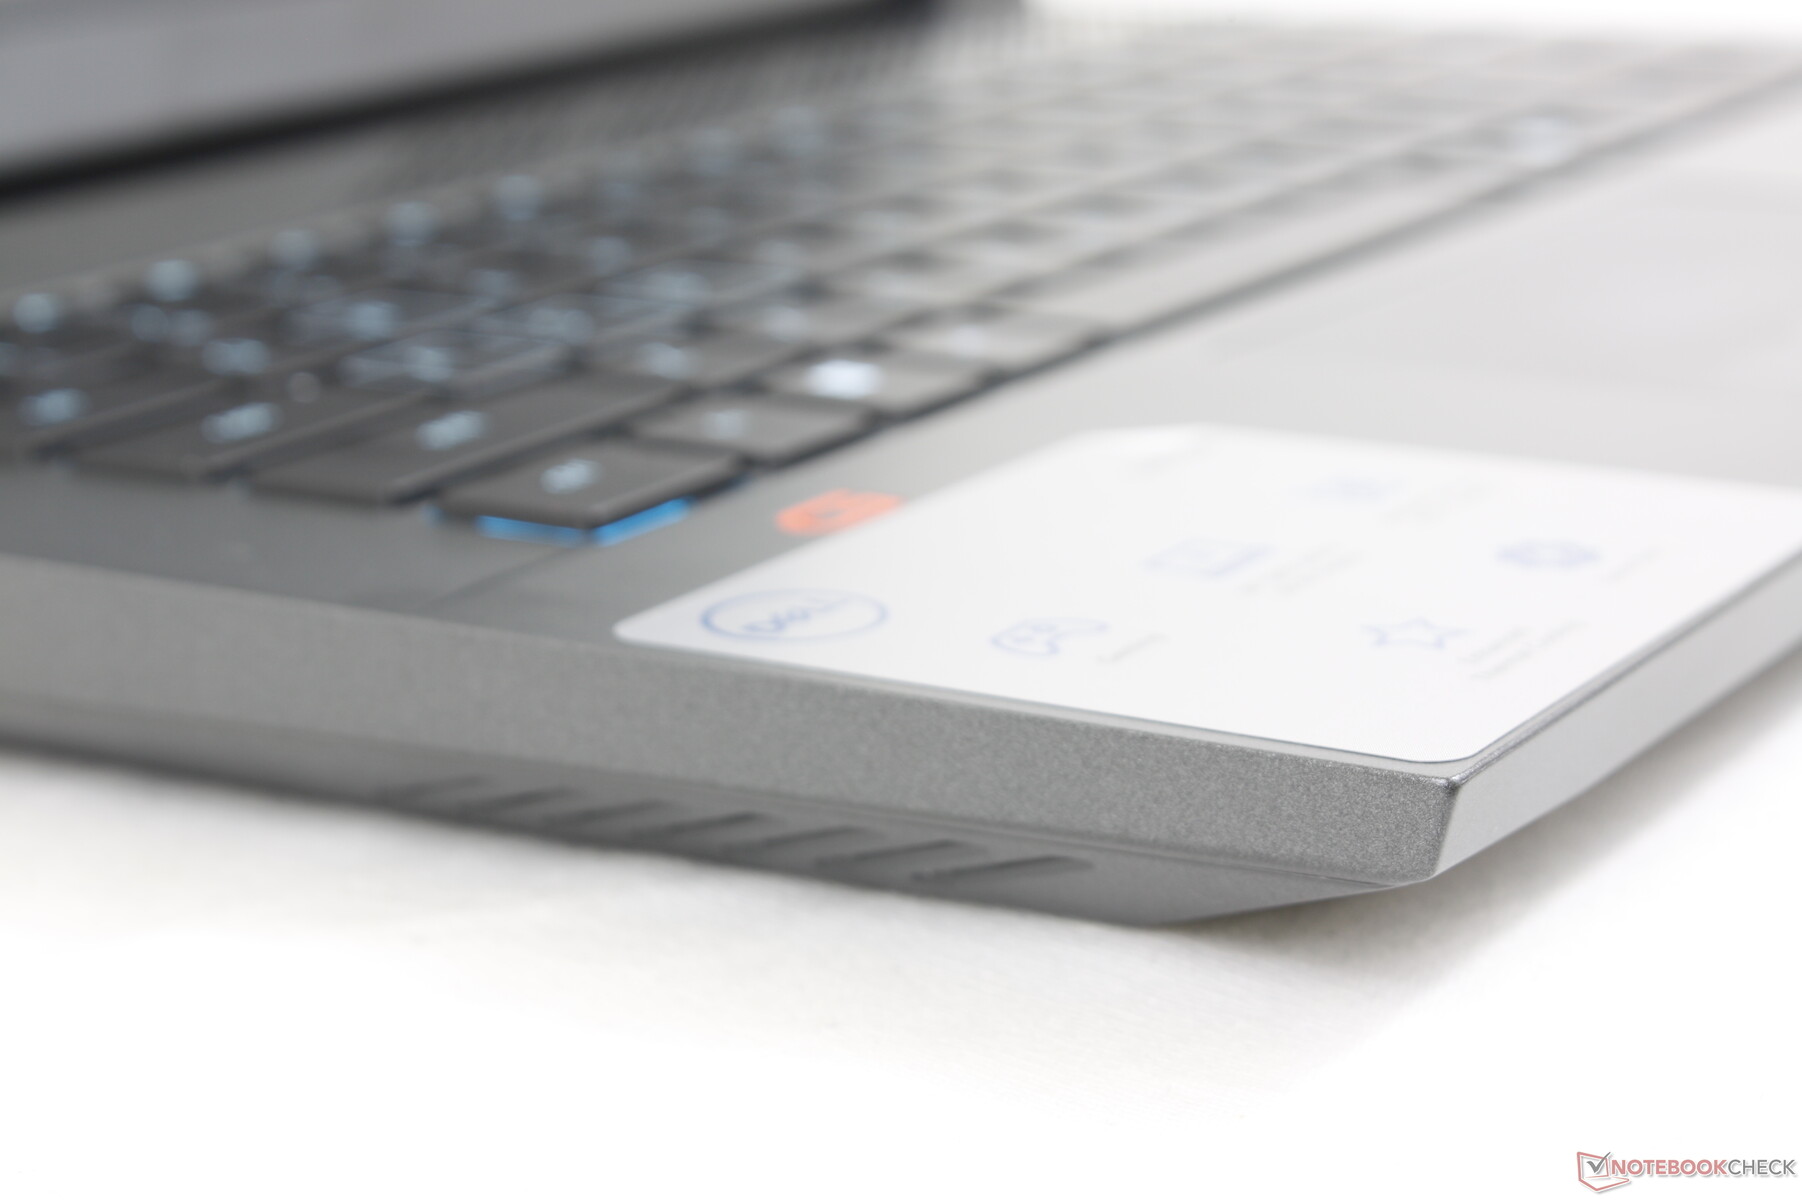
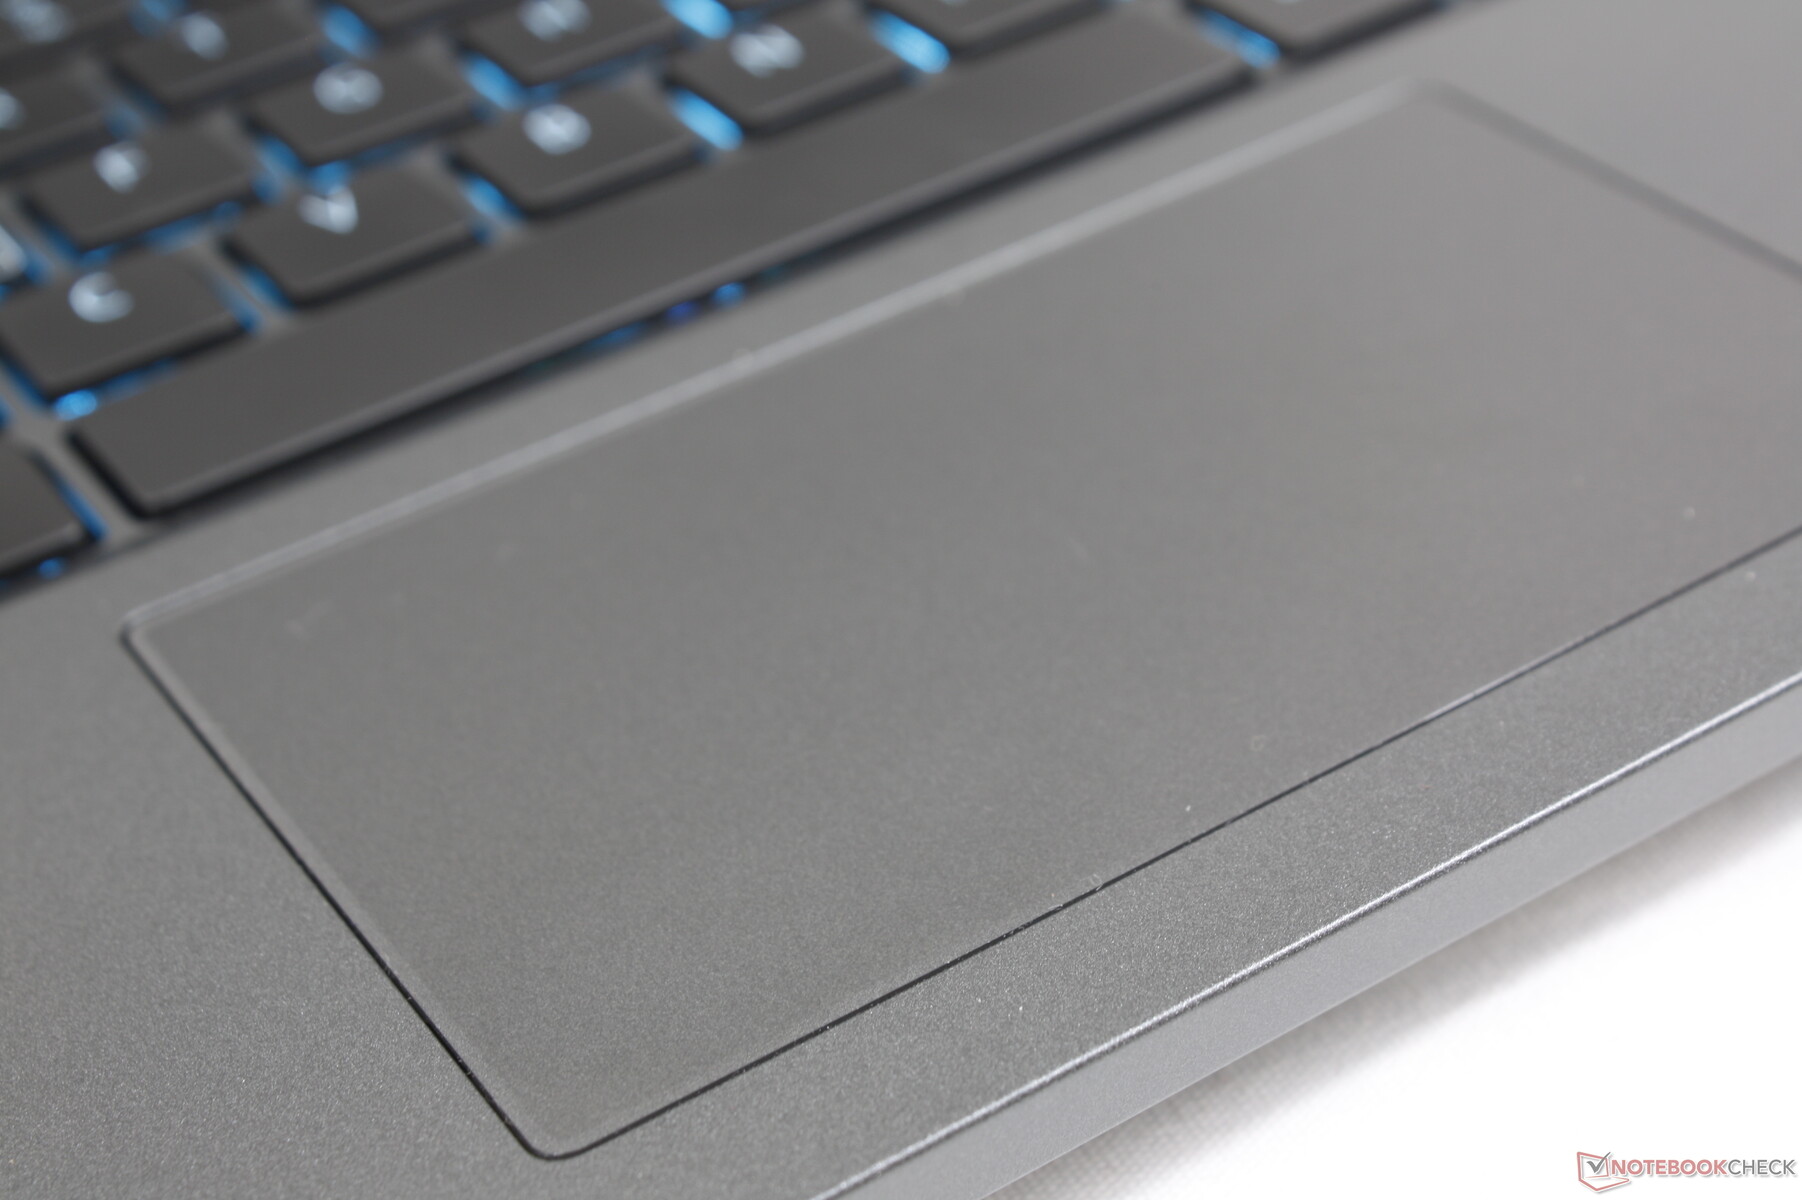
Pavé tactile
Avec ses dimensions de 10,5 x 6 cm, le pavé tactile du G16 est l'un des plus petits pavés que nous ayons vus sur un ordinateur portable de cette gamme de prix. Le pavé tactile de l Inspiron 16 Plus 7620 mesure 11,5 x 8 cm en comparaison. Cette petite taille n'est toutefois pas un obstacle, car le public cible des joueurs aura probablement une souris à portée de main à tout moment.

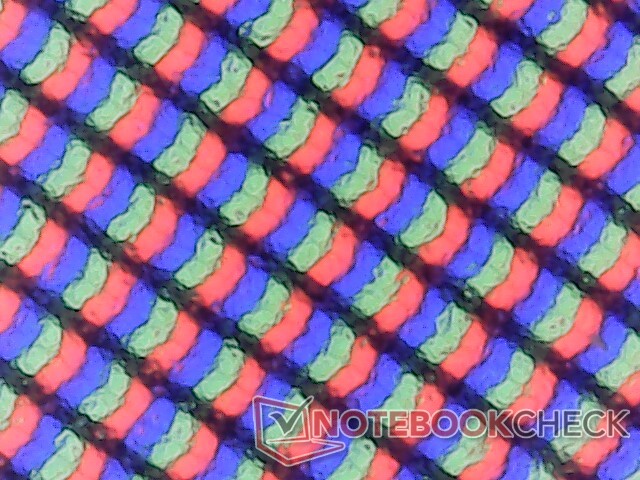
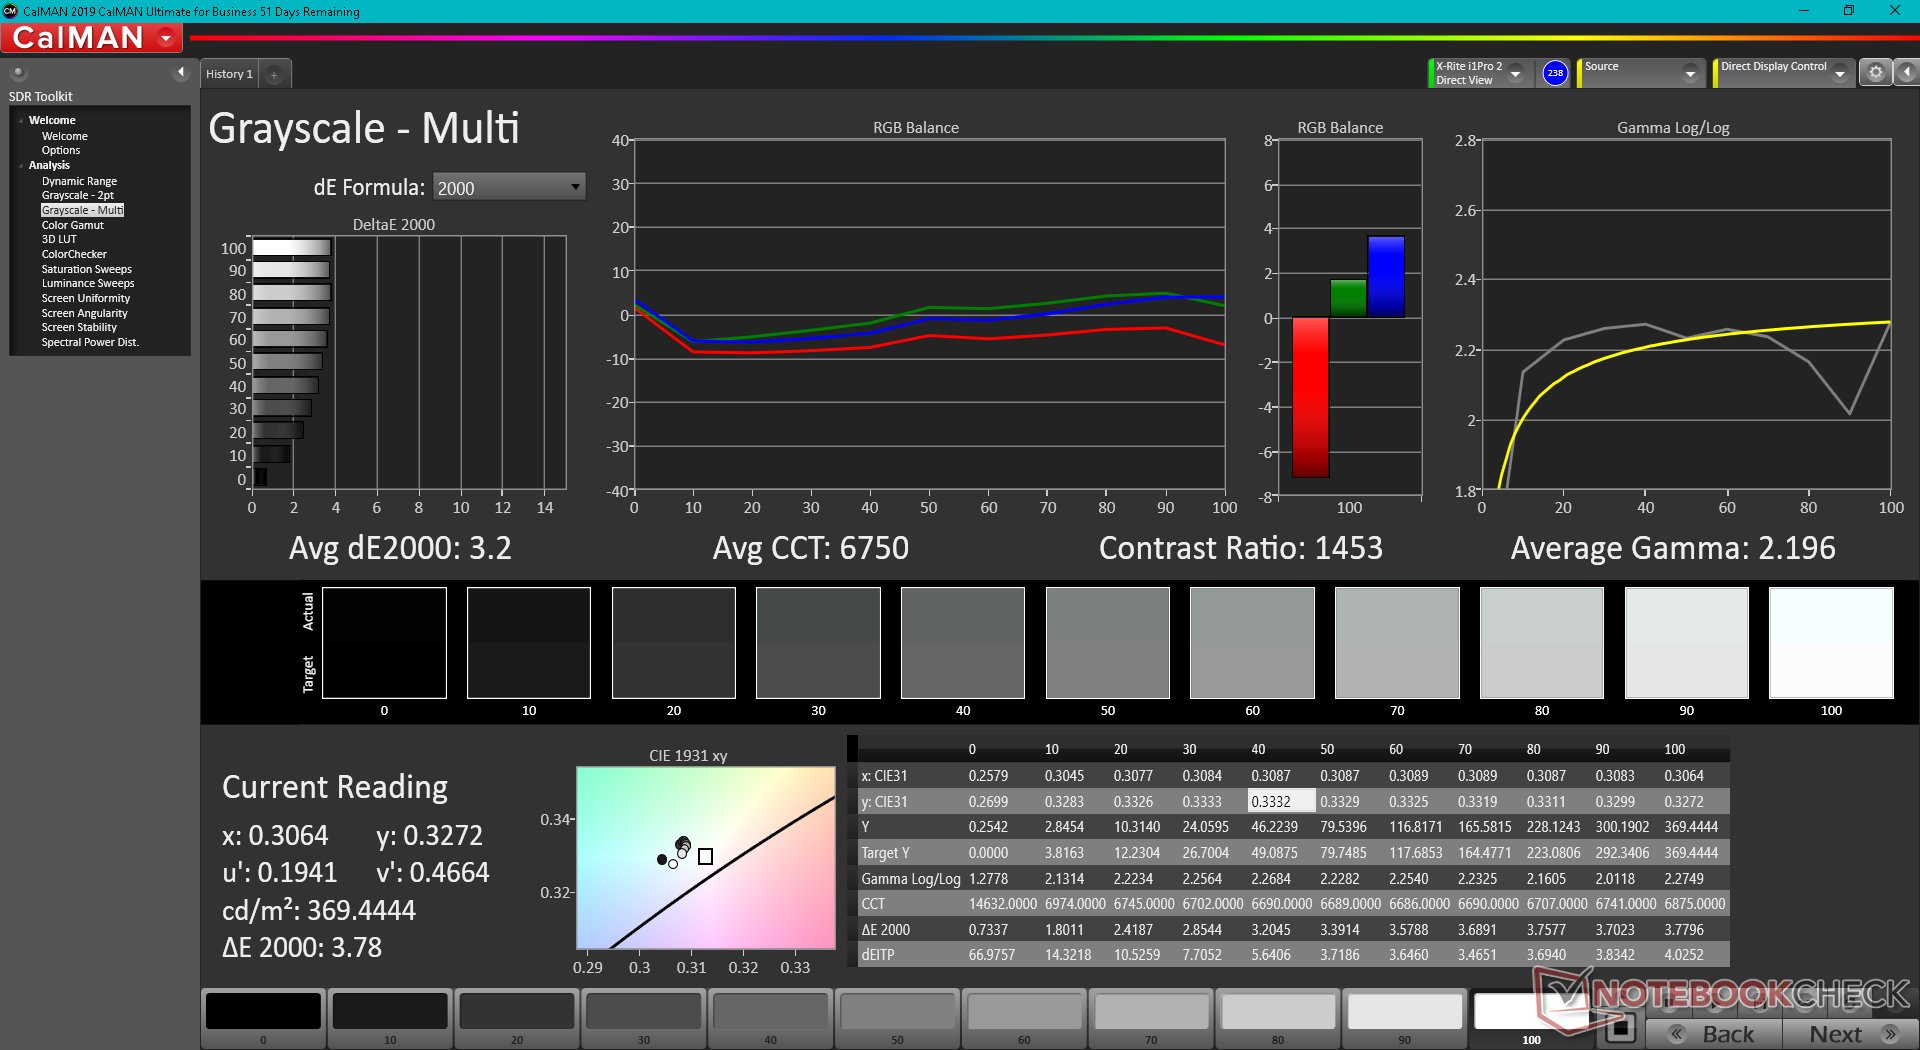
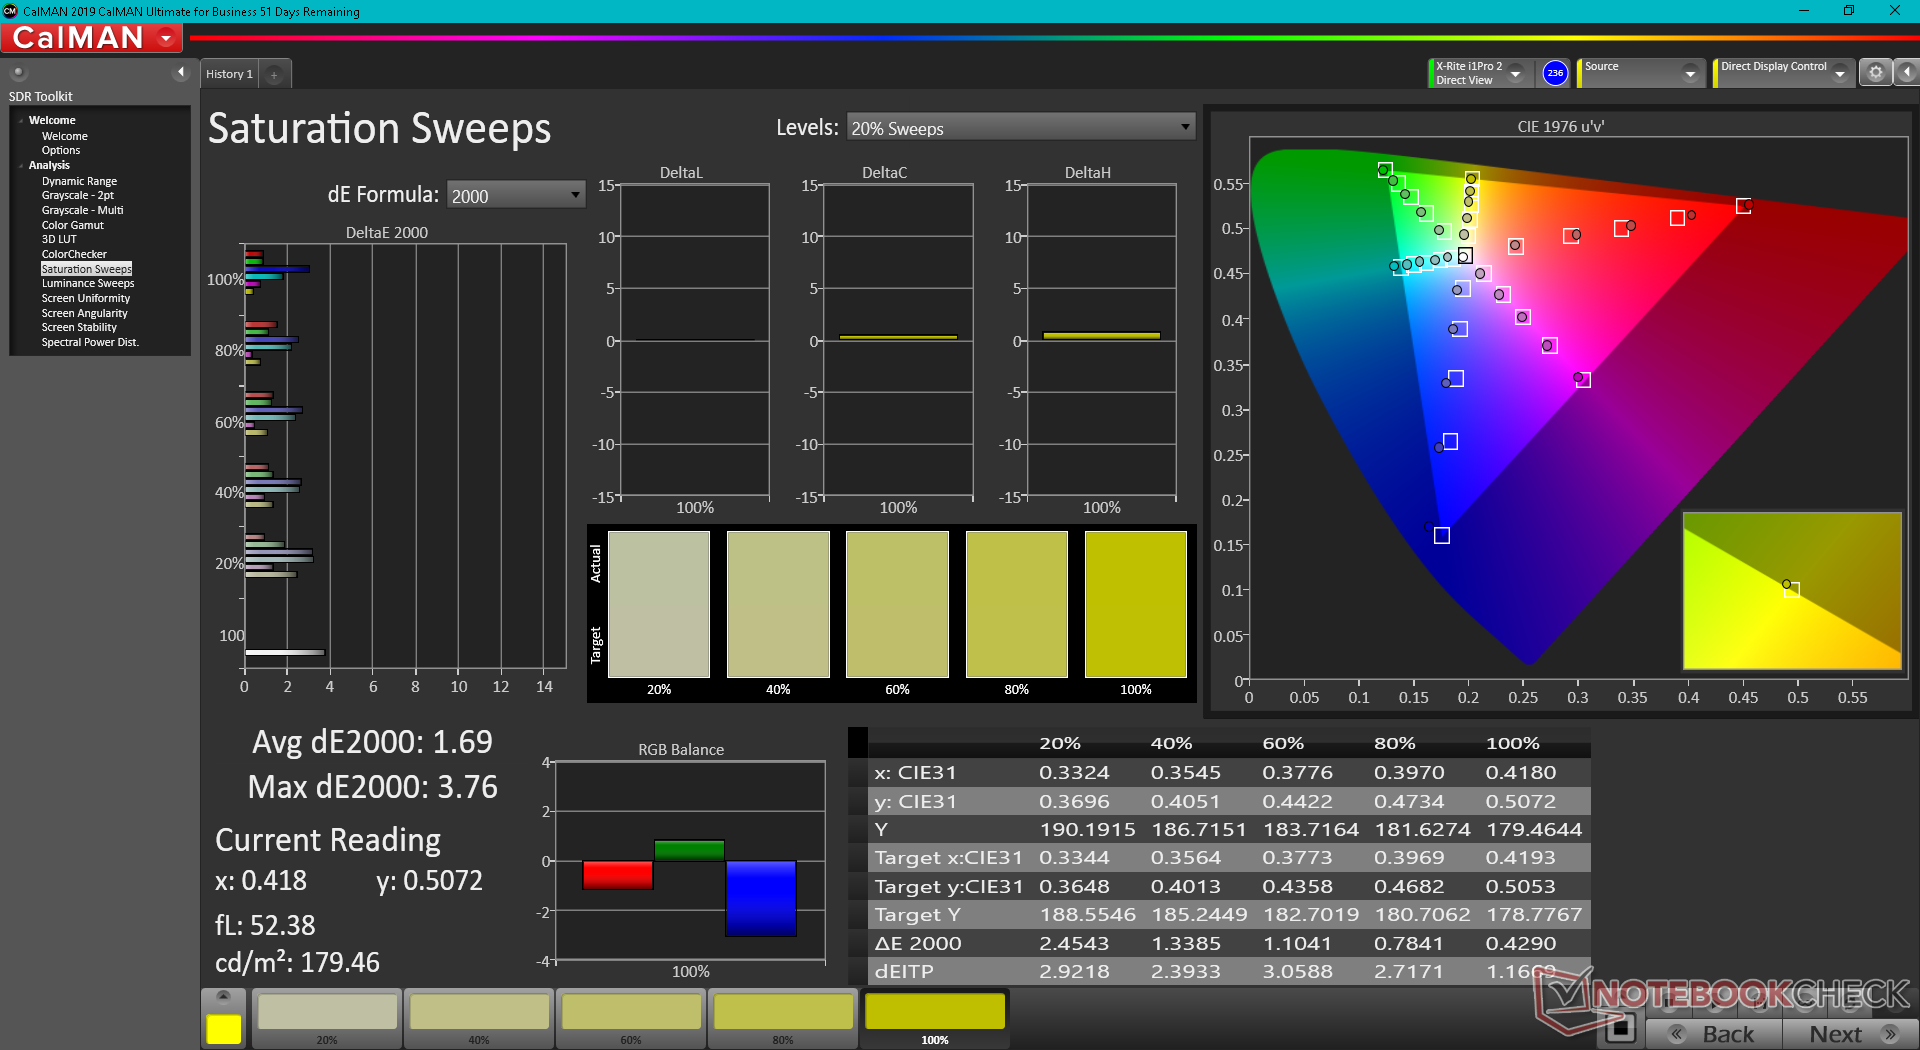
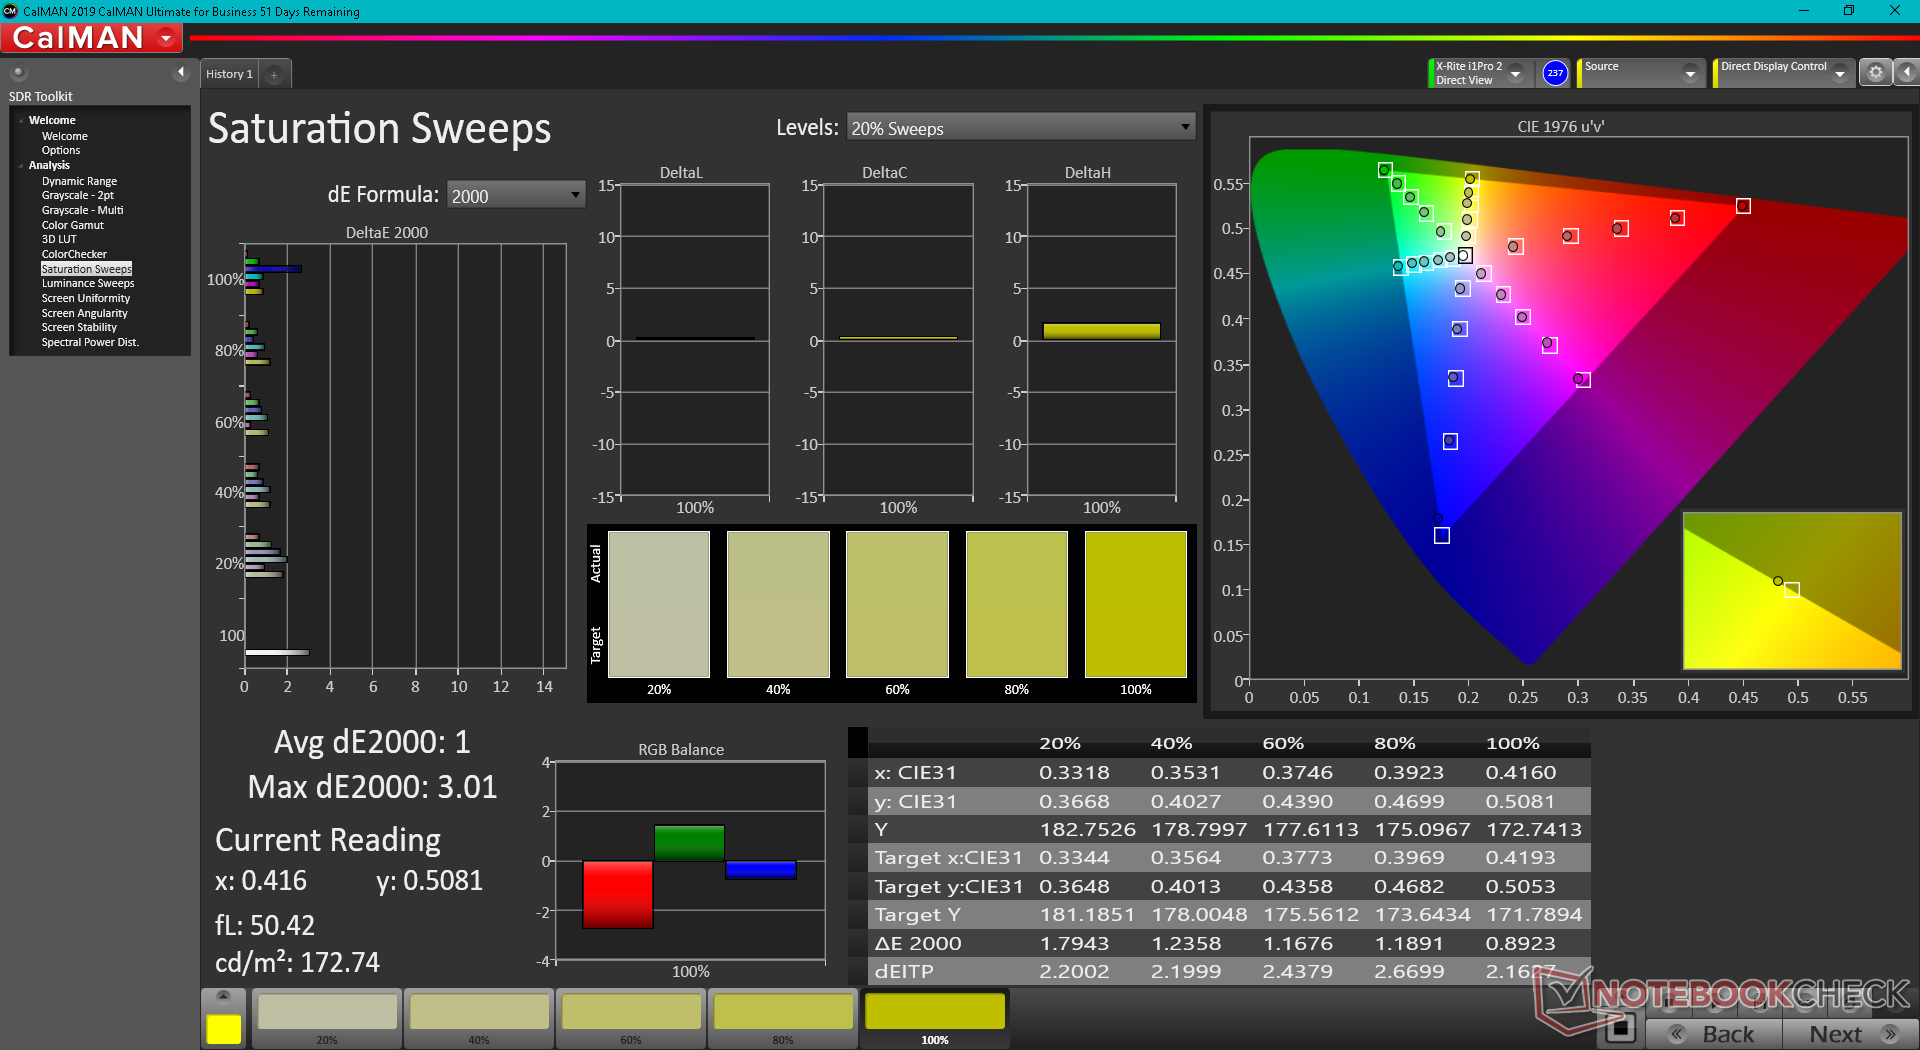
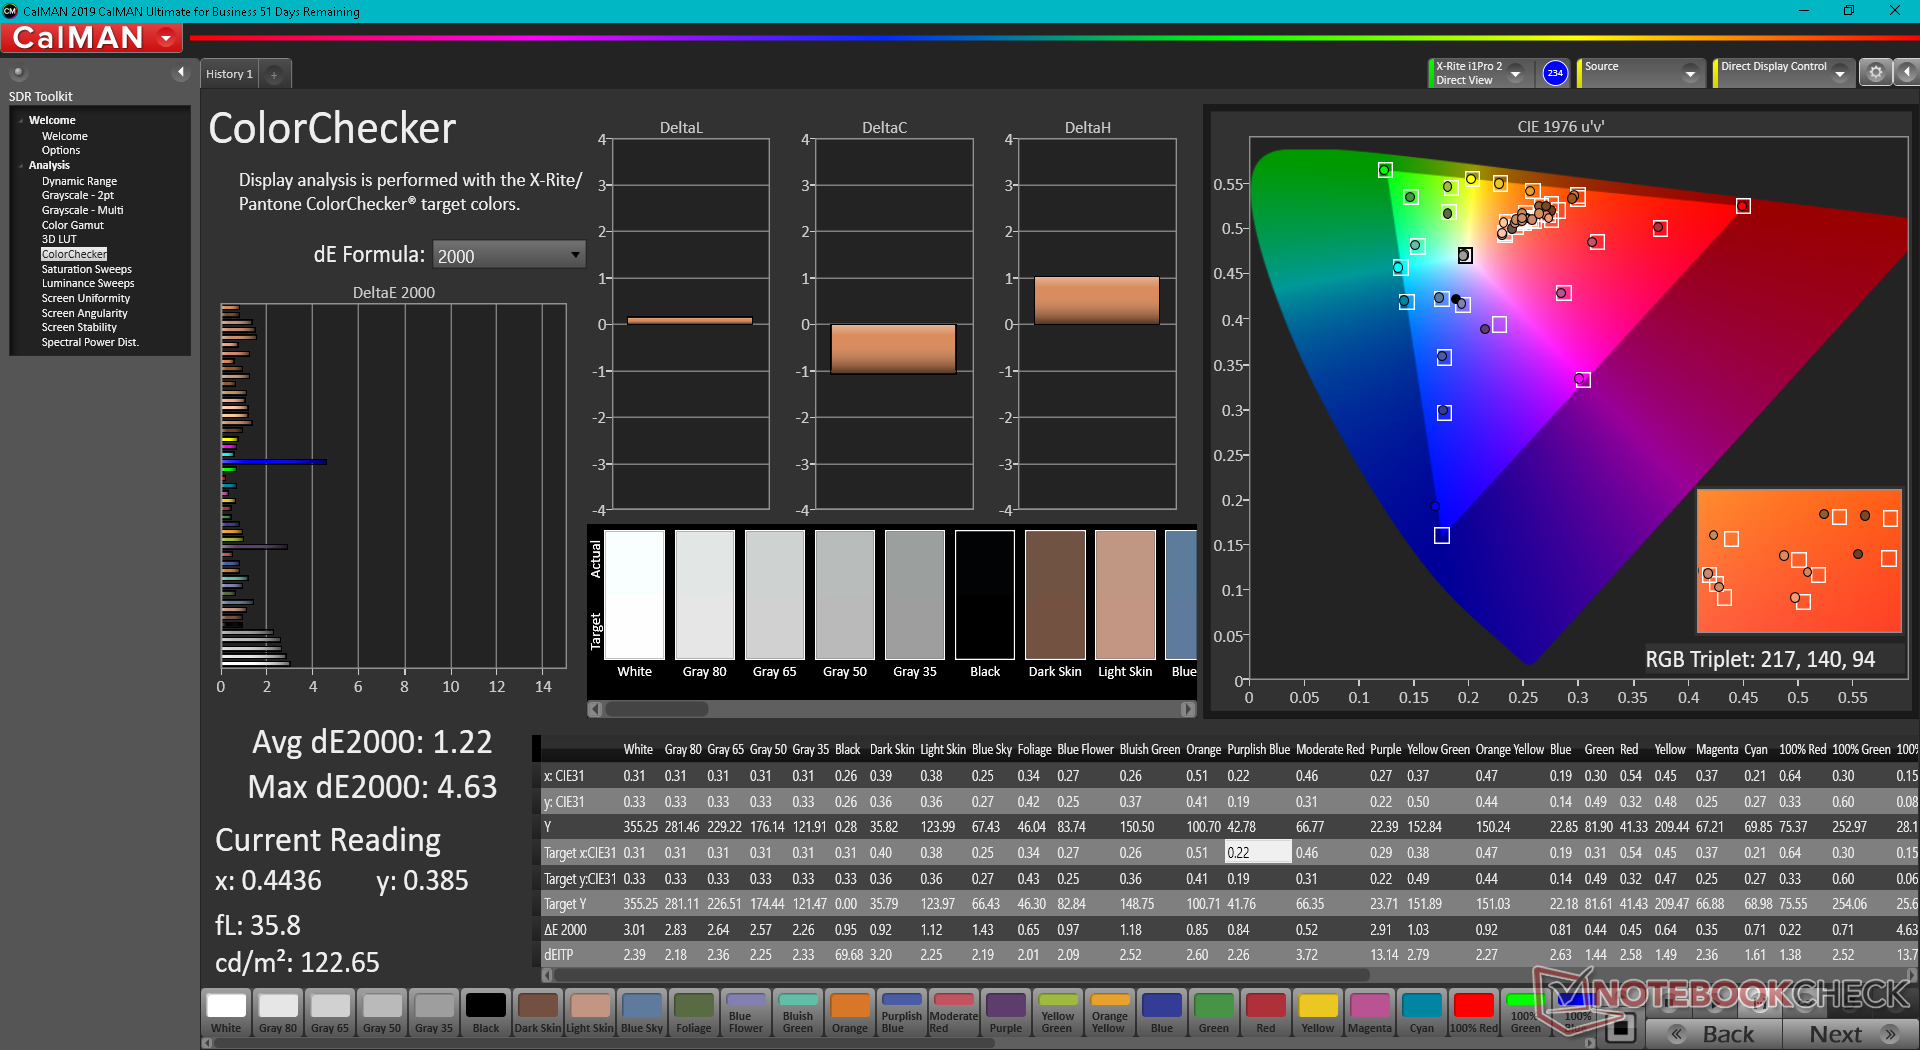
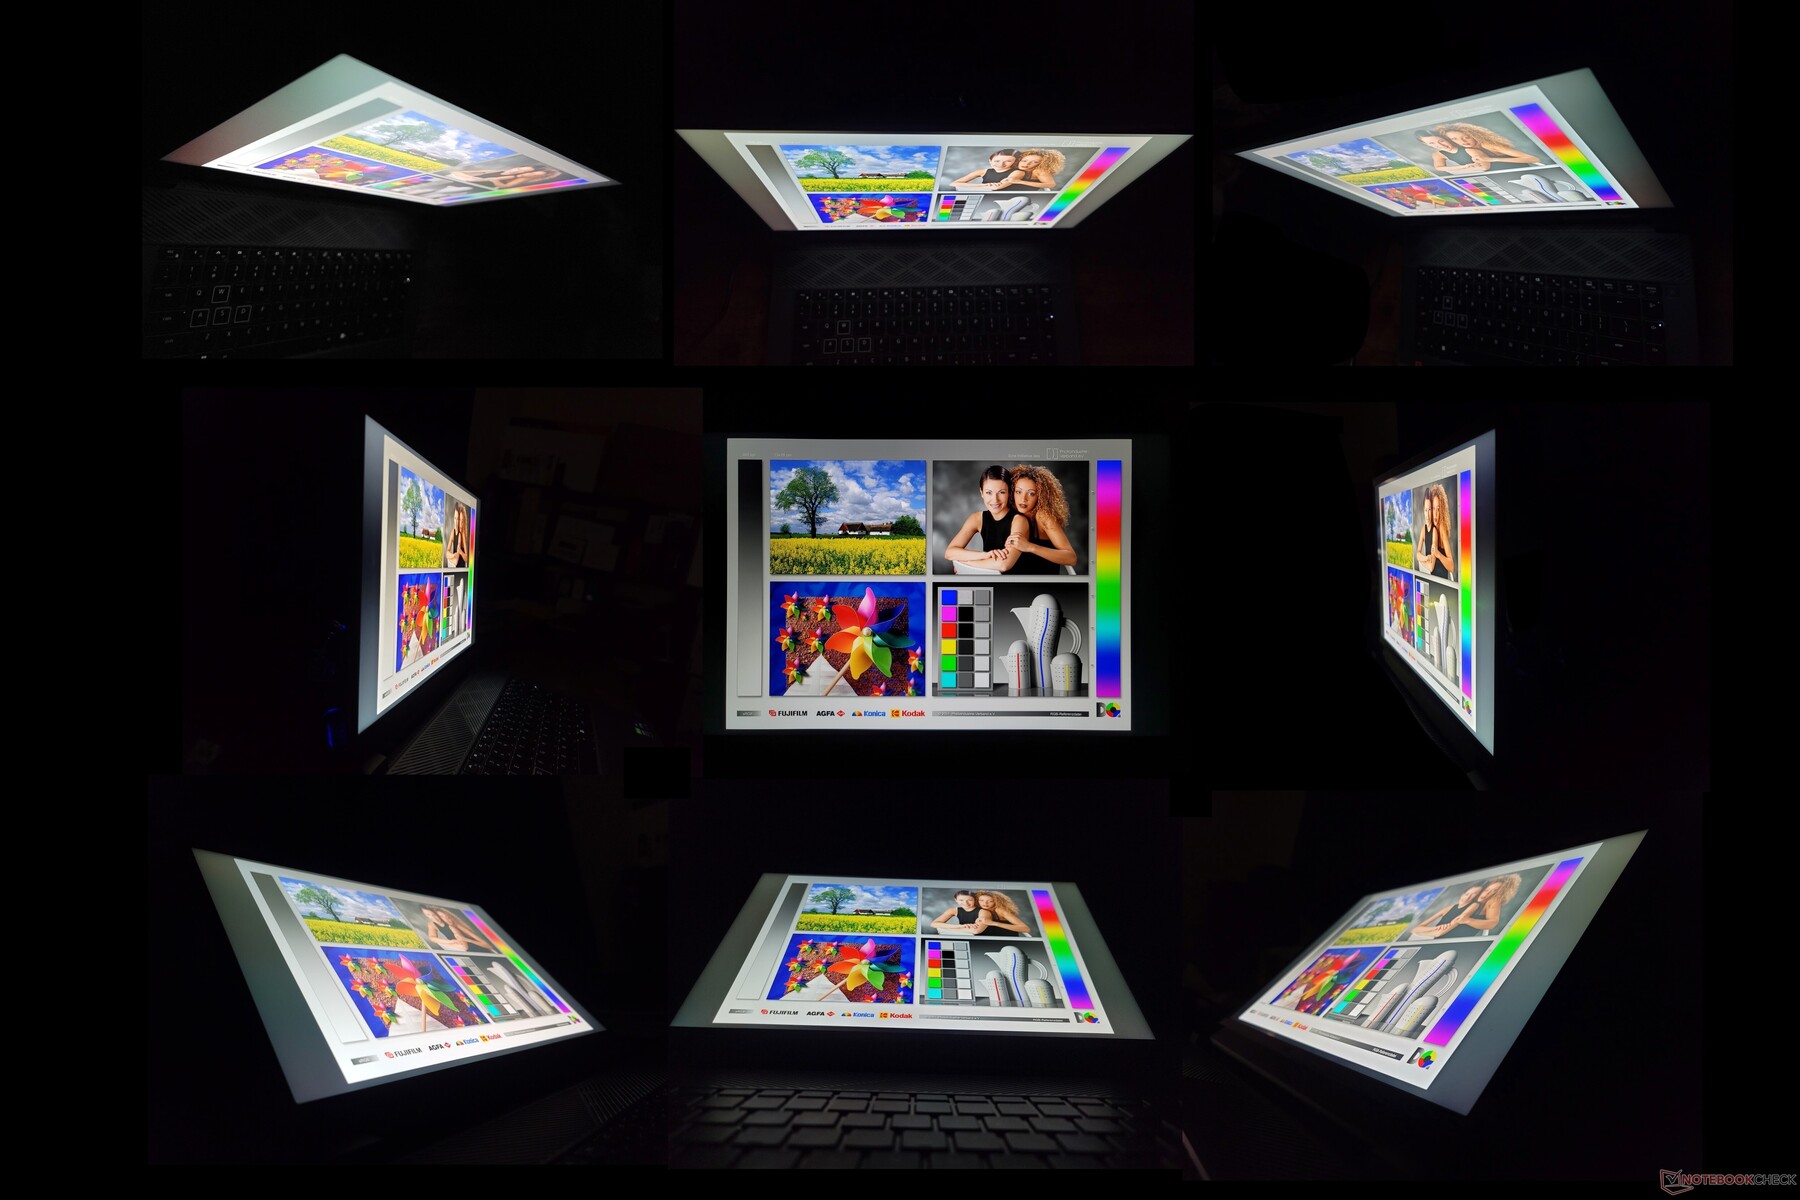
Écran - IPS, sRGB complet, 165 Hz, et temps de réponse rapide
La dalle est similaire à celle qui équipe actuellement le Lenovo Legion 7 16ARHA7, car elles partagent le même fabricant, la même fréquence de rafraîchissement élevée, la même résolution, la même cible sRGB à 100%, et même des taux de contraste et des temps de réponse noir-blanc presque identiques. La qualité d'image est nettement supérieure à celle de la dalle Chi Mei que l'on trouve sur le HP Victus 16. Bien qu'il soit un peu dommage qu'il n'y ait pas d'autres options parmi lesquelles choisir, cela signifie au moins que tous les propriétaires de G16 devraient bénéficier de la même excellente expérience visuelle, sans configuration d'écran bas de gamme inattendue.
| |||||||||||||||||||||||||
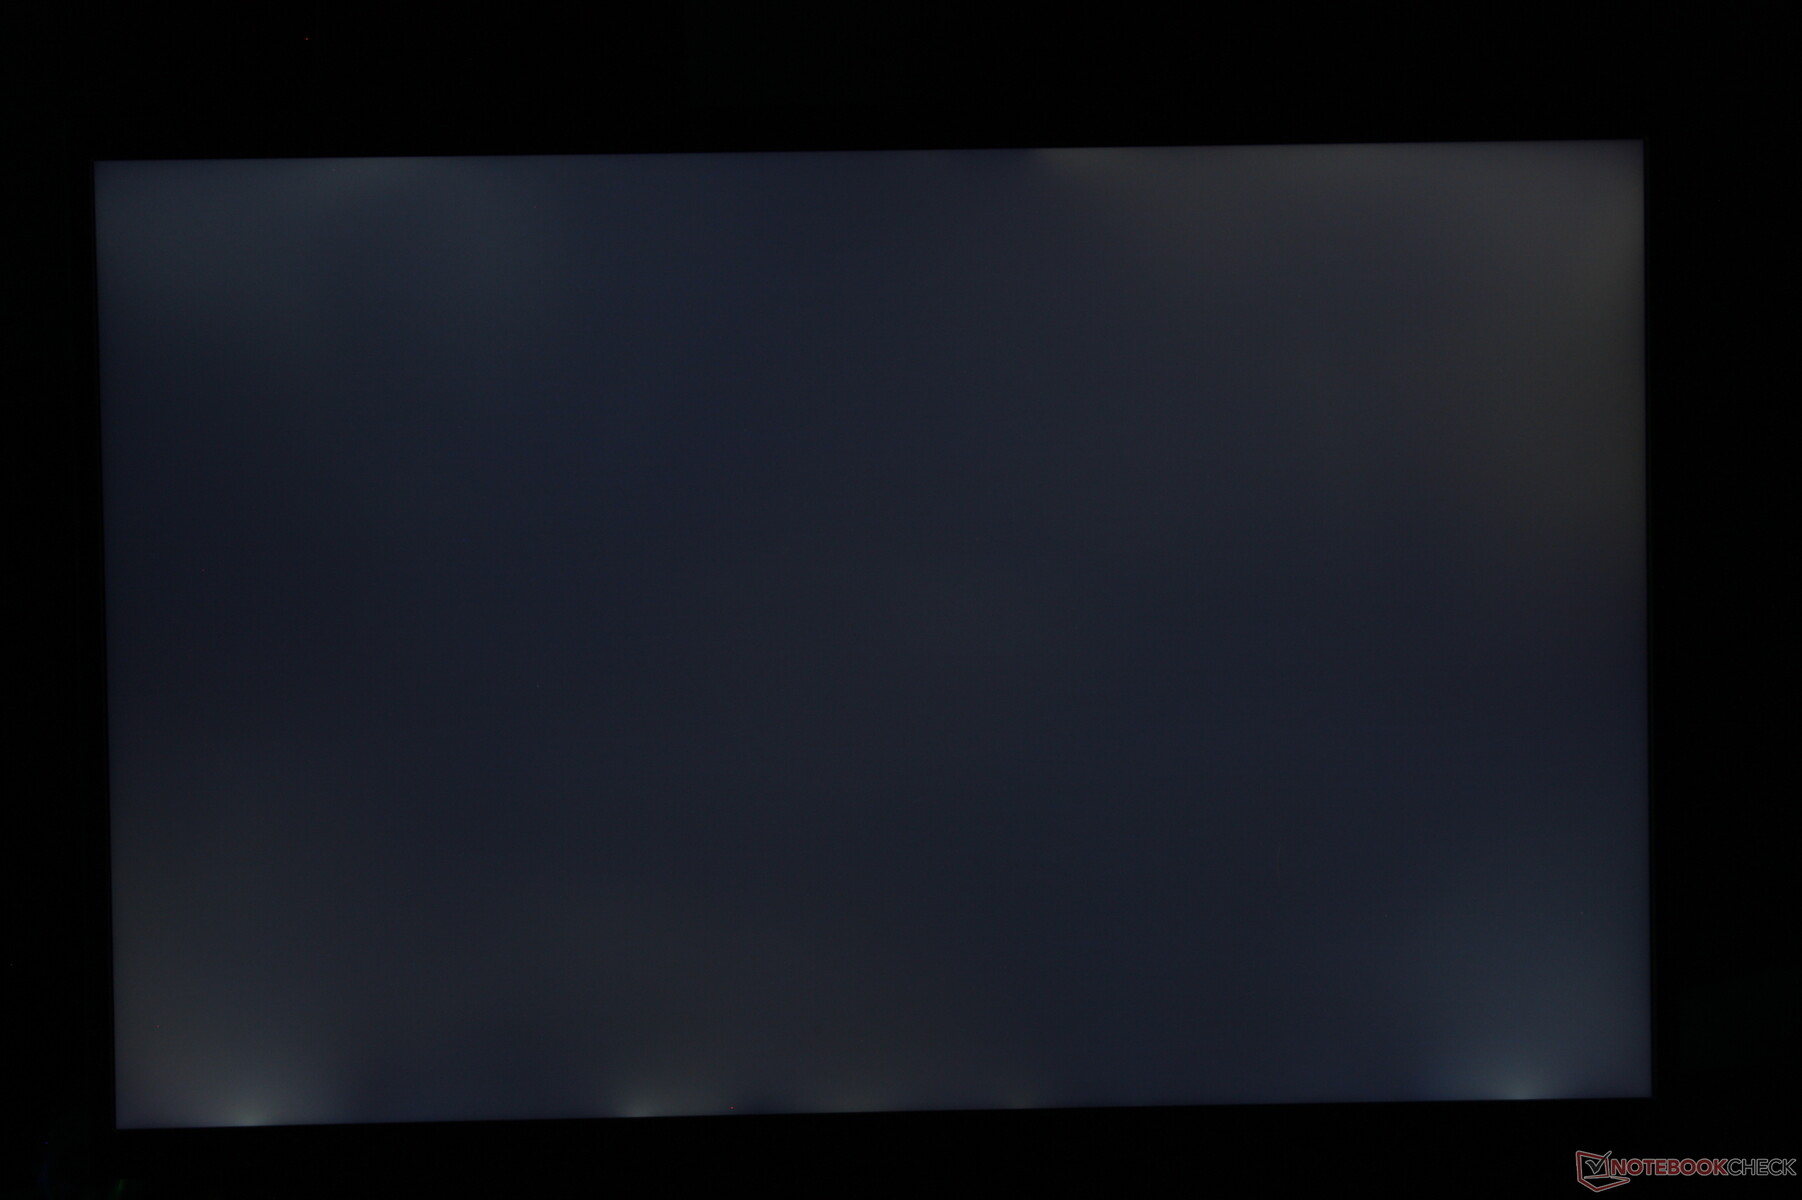
Homogénéité de la luminosité: 83 %
Valeur mesurée au centre, sur batterie: 369.4 cd/m²
Contraste: 1154:1 (Valeurs des noirs: 0.32 cd/m²)
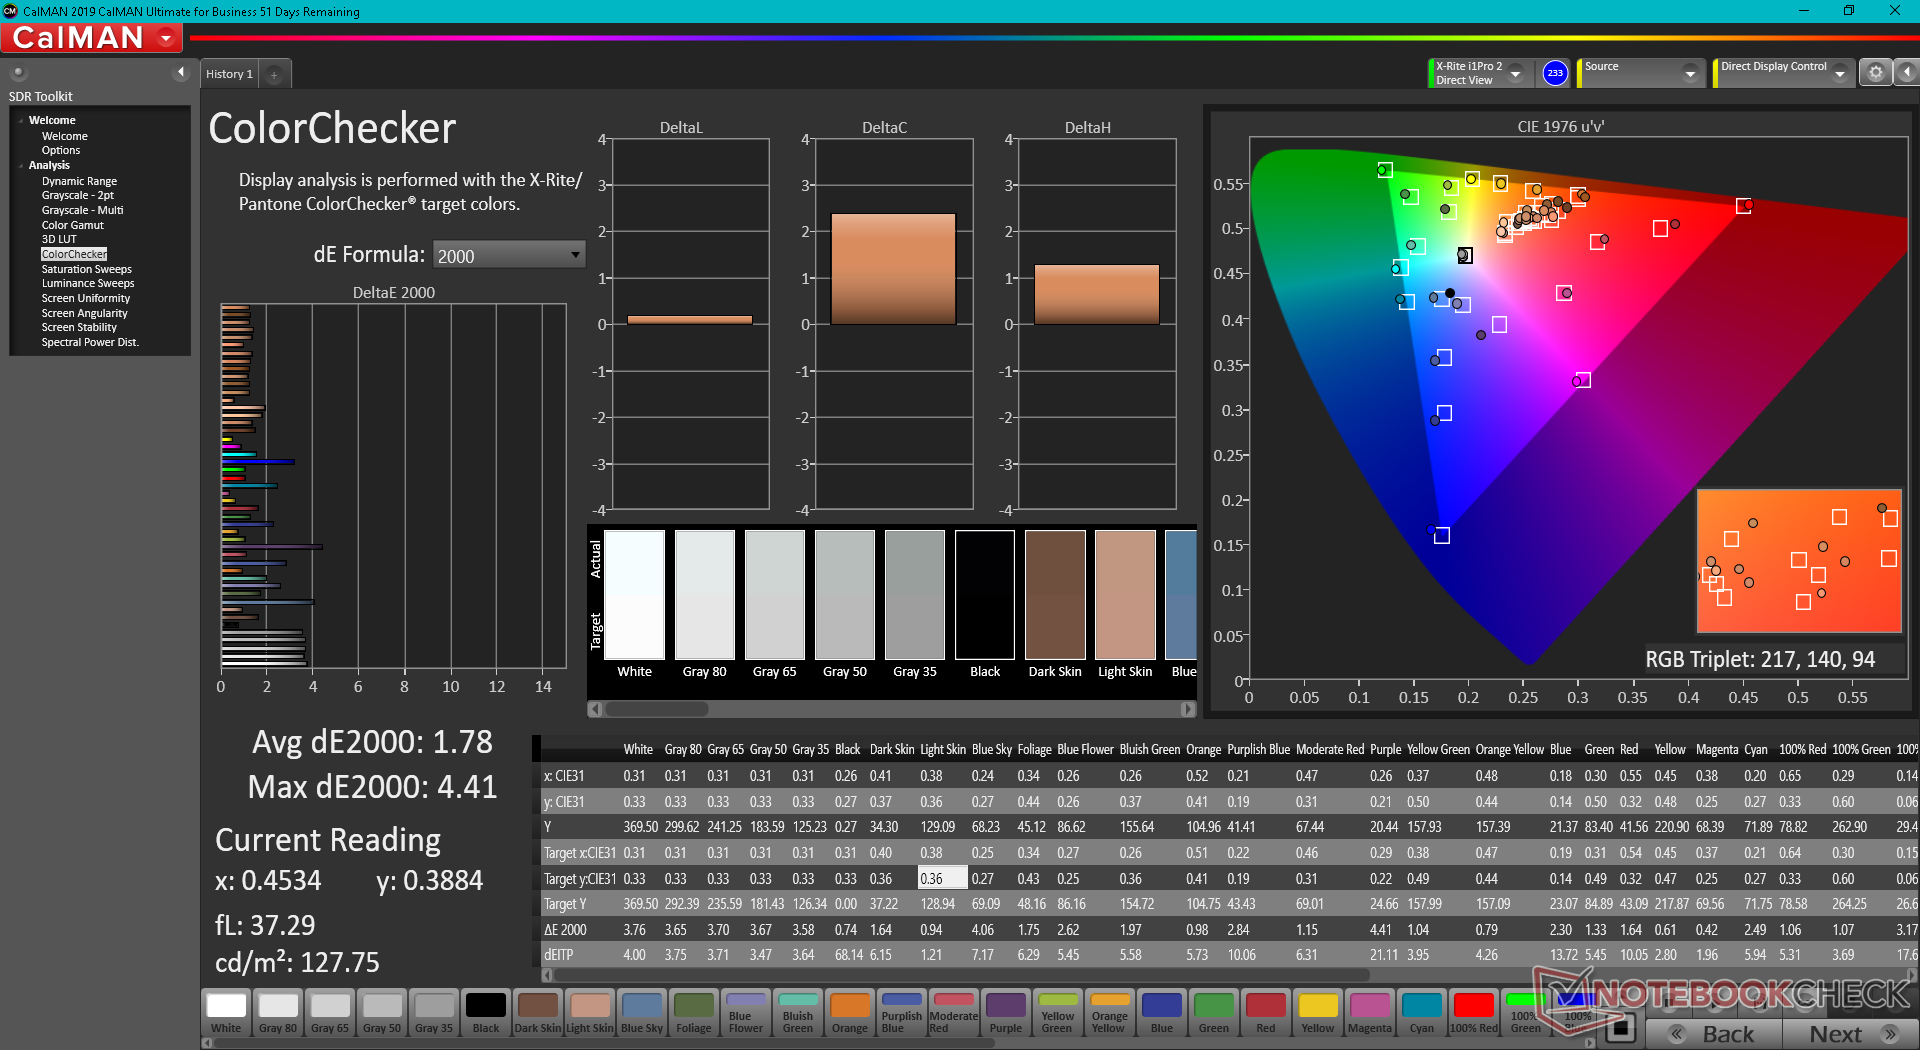
ΔE ColorChecker Calman: 1.78 | ∀{0.5-29.43 Ø4.72}
calibrated: 1.22
ΔE Greyscale Calman: 3.2 | ∀{0.09-98 Ø4.97}
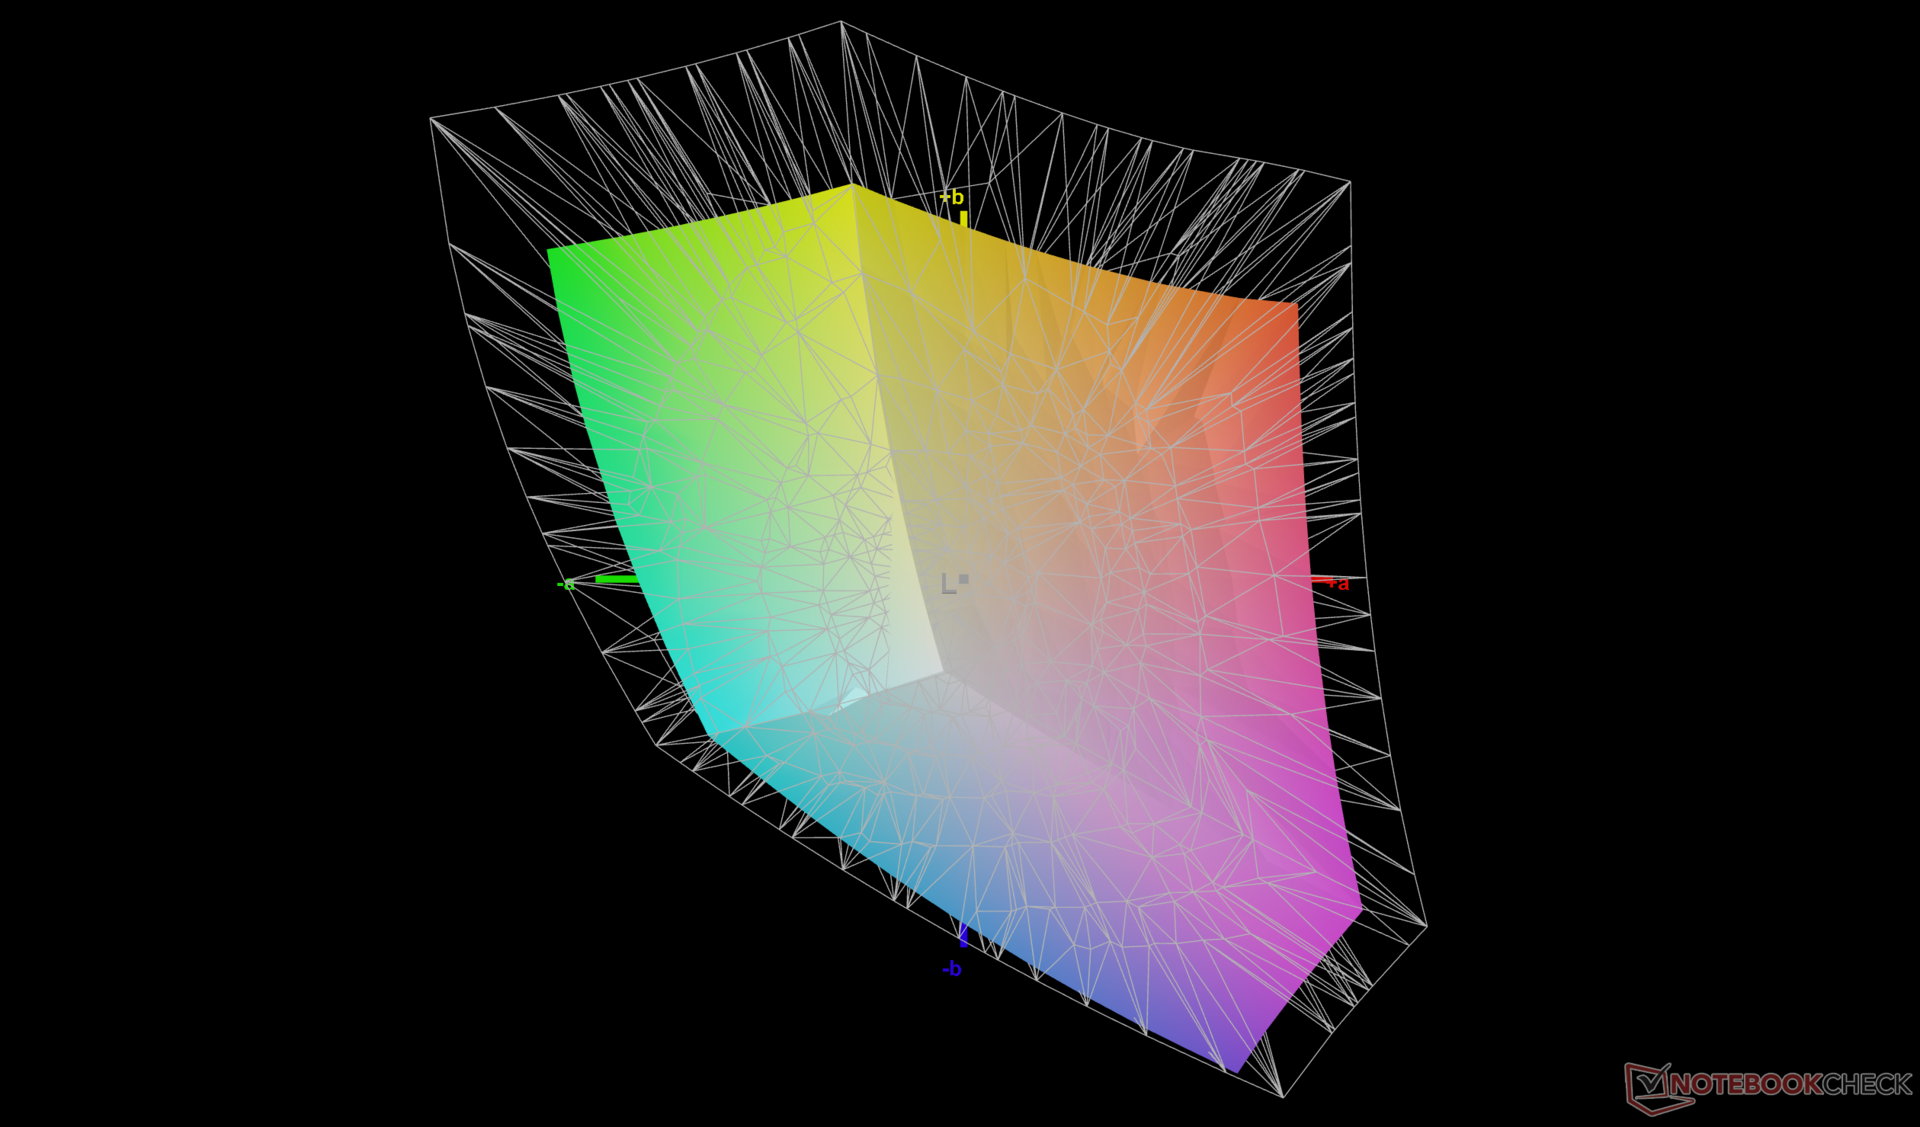
70.5% AdobeRGB 1998 (Argyll 3D)
98% sRGB (Argyll 3D)
68.3% Display P3 (Argyll 3D)
Gamma: 2.2
CCT: 6750 K
| Dell G16 7620 BOE NE16QDM, IPS, 2560x1600, 16" | Lenovo Legion 7 16ARHA7 BOE CQ NE160QDM-NY1, IPS, 2560x1600, 16" | HP Victus 16-e0145ng CMN1609, IPS, 1920x1080, 16.1" | Asus ROG Zephyrus M16 GU603H AU Optronics AUOC199, IPS, 2560x1600, 16" | Lenovo Legion 5 Pro 16IAH7H BOE CCQ_NE160QDM_NY1, IPS, 2560x1600, 16" | Acer Swift X SFX16-51G-5388 Chi Mei N161HCA-EA3, , 1920x1080, 16.1" | |
|---|---|---|---|---|---|---|
| Display | -6% | -38% | 0% | -4% | ||
| Display P3 Coverage (%) | 68.3 | 63.7 -7% | 41.6 -39% | 68.53 0% | 65.1 -5% | |
| sRGB Coverage (%) | 98 | 95.3 -3% | 61.9 -37% | 98.38 0% | 95.65 -2% | |
| AdobeRGB 1998 Coverage (%) | 70.5 | 65.7 -7% | 43 -39% | 70.45 0% | 66.75 -5% | |
| Response Times | 1% | -166% | 43% | -11% | -171% | |
| Response Time Grey 50% / Grey 80% * (ms) | 8.6 ? | 9.2 ? -7% | 29.6 ? -244% | 4.8 ? 44% | 14 ? -63% | 30 ? -249% |
| Response Time Black / White * (ms) | 10.4 ? | 9.6 ? 8% | 19.4 ? -87% | 6 ? 42% | 6 ? 42% | 20 ? -92% |
| PWM Frequency (Hz) | ||||||
| Screen | -2% | -119% | -29% | 3% | 14% | |
| Brightness middle (cd/m²) | 369.4 | 478.8 30% | 257 -30% | 448 21% | 515 39% | 276 -25% |
| Brightness (cd/m²) | 348 | 477 37% | 239 -31% | 446 28% | 475 36% | 264 -24% |
| Brightness Distribution (%) | 83 | 90 8% | 88 6% | 86 4% | 85 2% | 85 2% |
| Black Level * (cd/m²) | 0.32 | 0.43 -34% | 0.25 22% | 0.48 -50% | 0.45 -41% | 0.16 50% |
| Contrast (:1) | 1154 | 1113 -4% | 1028 -11% | 933 -19% | 1144 -1% | 1725 49% |
| Colorchecker dE 2000 * | 1.78 | 2.24 -26% | 6.91 -288% | 2.76 -55% | 2.38 -34% | 1.8 -1% |
| Colorchecker dE 2000 max. * | 4.41 | 4.49 -2% | 22.27 -405% | 7.09 -61% | 4.37 1% | 3.77 15% |
| Colorchecker dE 2000 calibrated * | 1.22 | 1.89 -55% | 3.61 -196% | 2.86 -134% | 1.1 10% | 0.63 48% |
| Greyscale dE 2000 * | 3.2 | 2.3 28% | 7.5 -134% | 3.1 3% | 2.71 15% | 2.76 14% |
| Gamma | 2.2 100% | 2.25 98% | 2.125 104% | 2.153 102% | 2.49 88% | 2.37 93% |
| CCT | 6750 96% | 6955 93% | 6025 108% | 6826 95% | 6117 106% | 6564 99% |
| Color Space (Percent of AdobeRGB 1998) (%) | 87 | |||||
| Color Space (Percent of sRGB) (%) | 100 | |||||
| Moyenne finale (programmes/paramètres) | -2% /
-2% | -108% /
-108% | 7% /
-16% | -3% /
0% | -54% /
-16% |
* ... Moindre est la valeur, meilleures sont les performances
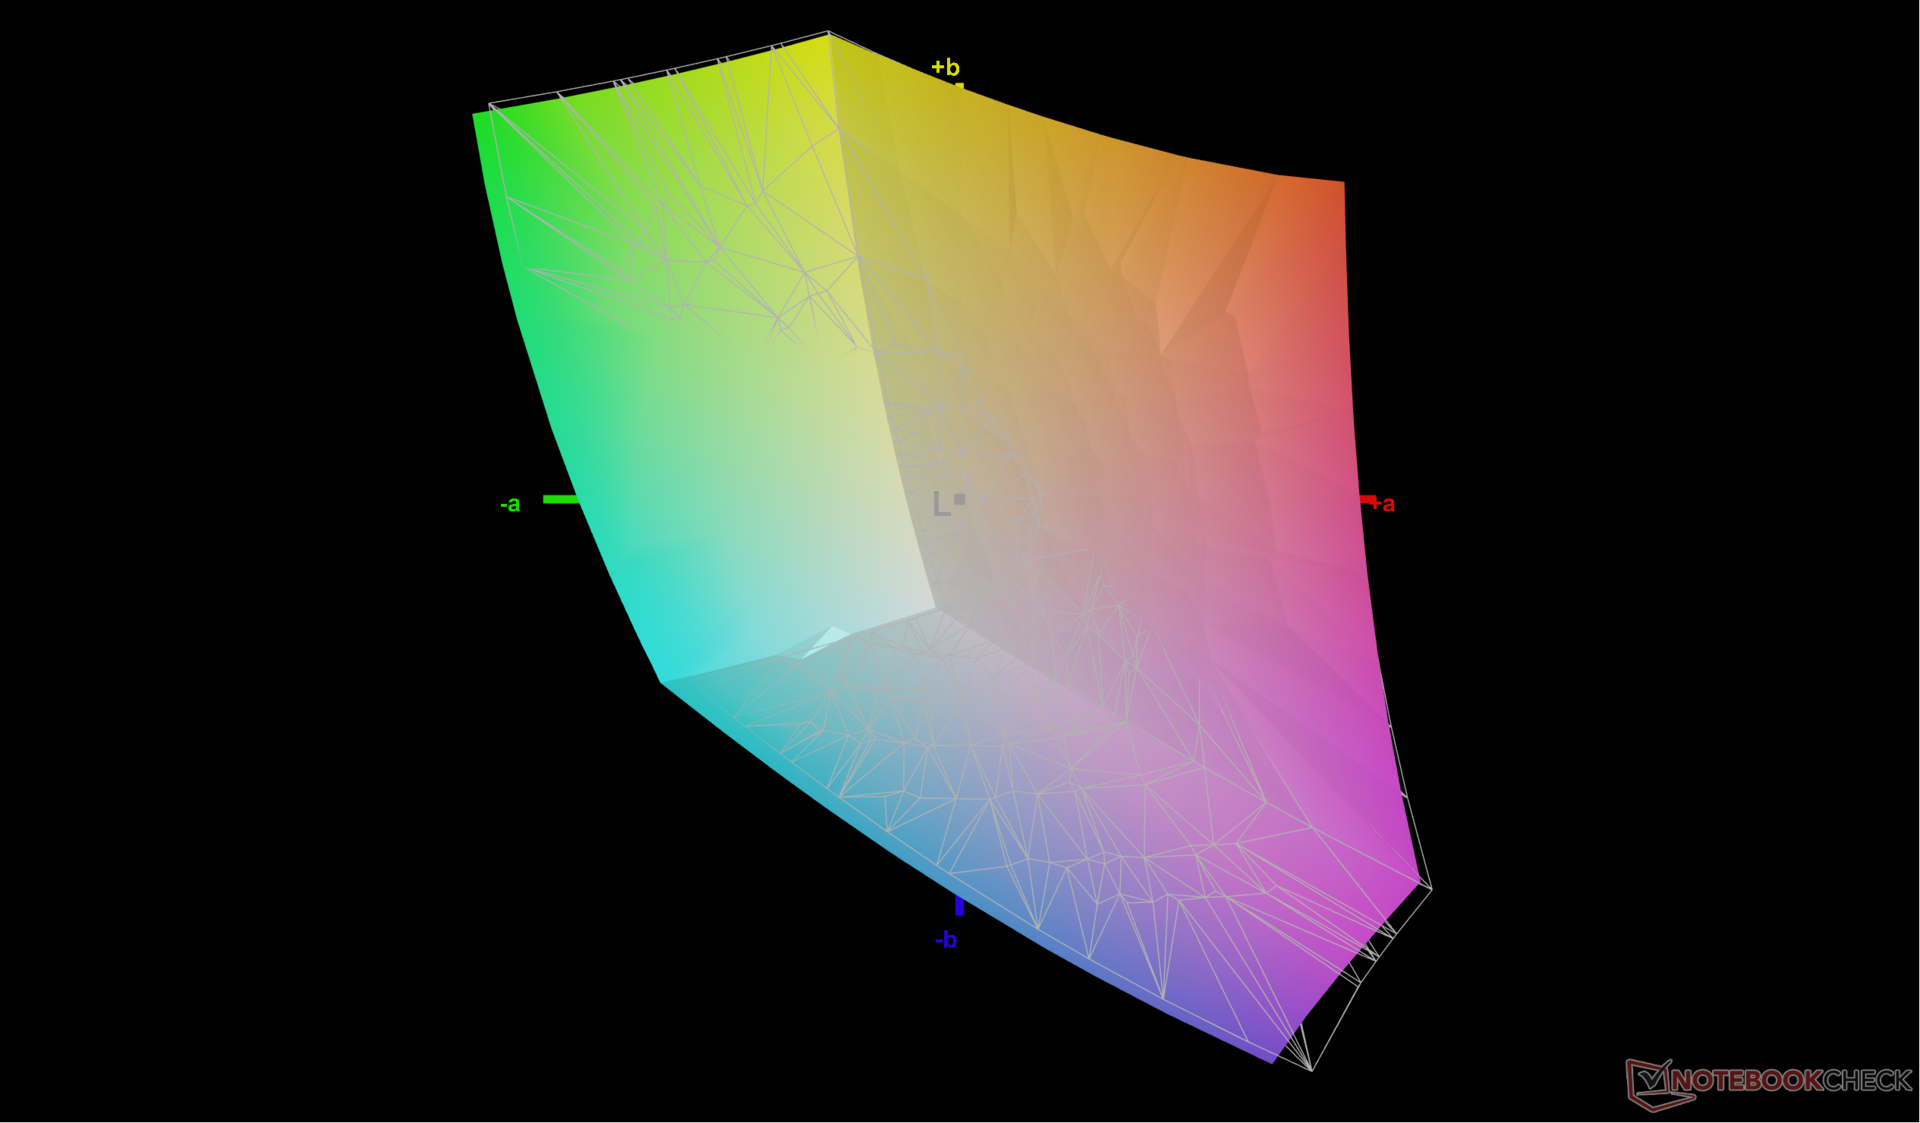
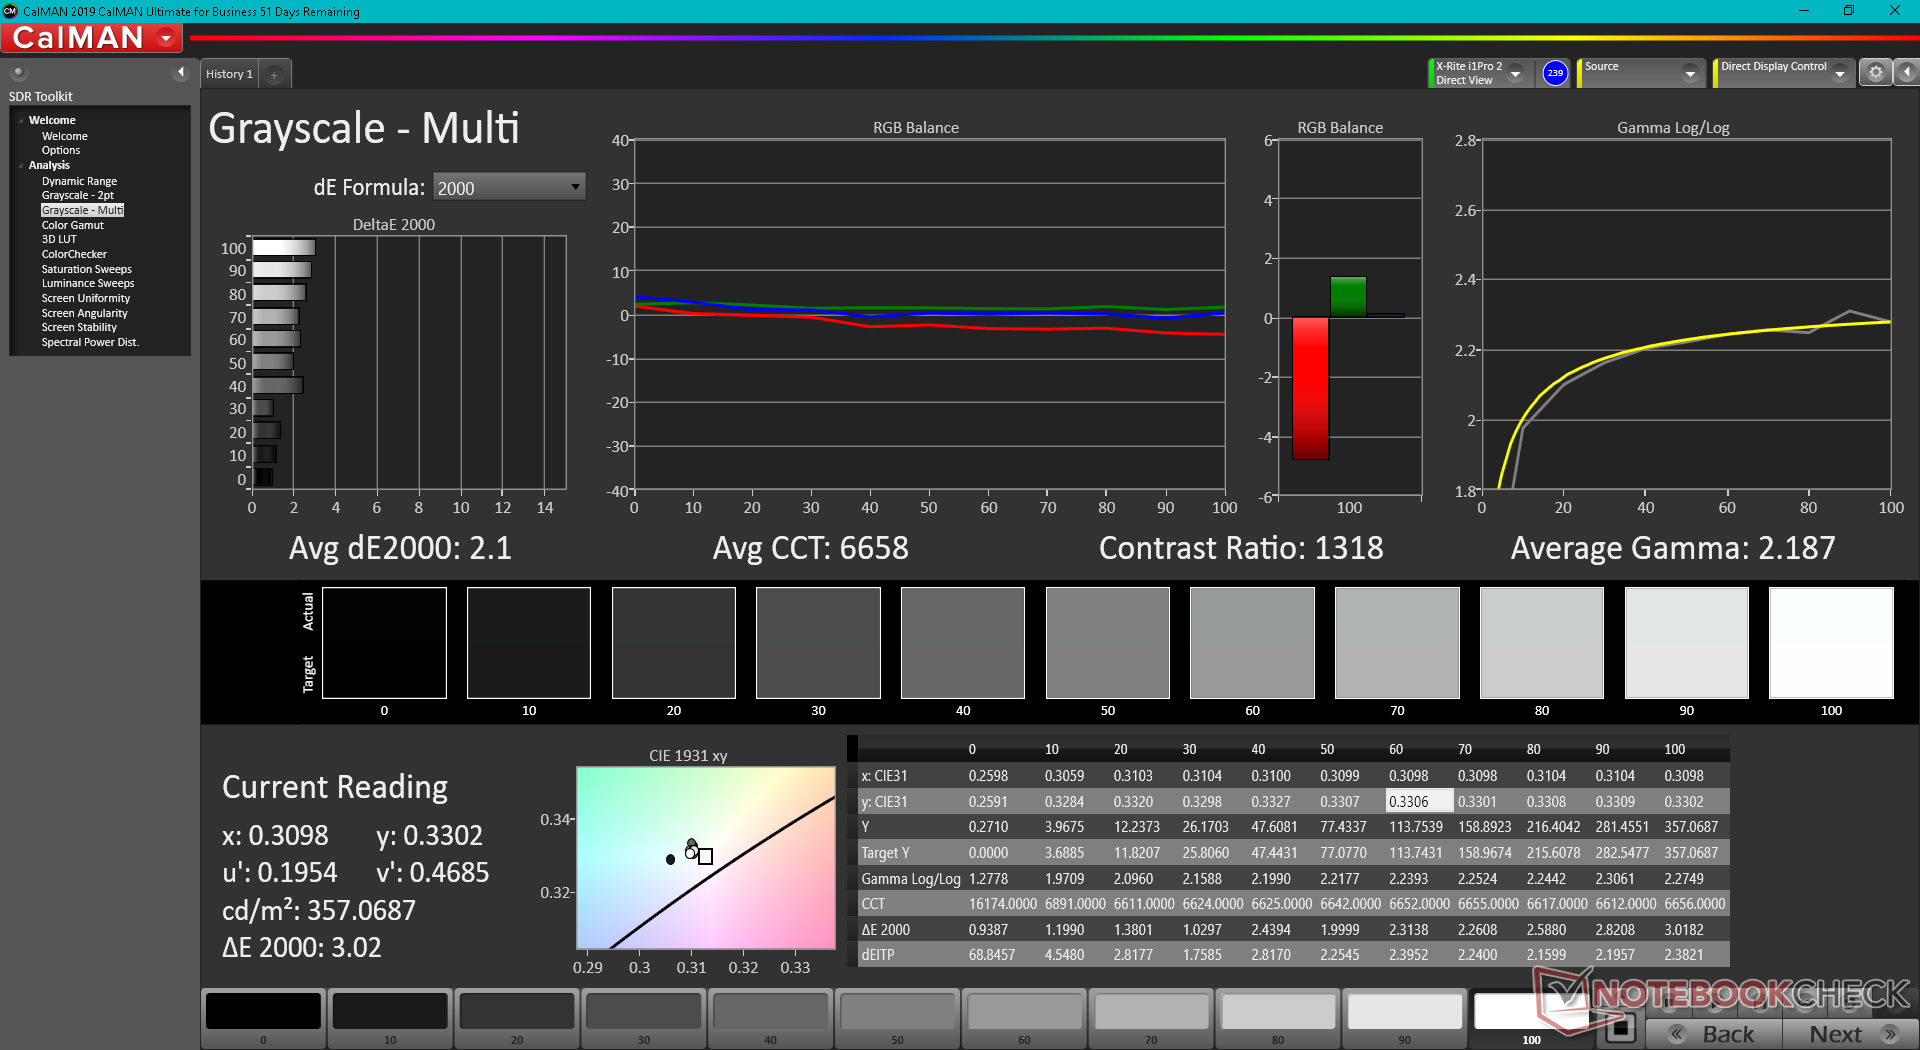
Les couleurs sont correctement calibrées dès la sortie de l'emballage, même si Dell n'applique aucune procédure de pré-calibrage pour le G16. Si nous calibrions nous-mêmes l'écran avec un colorimètre X-Rite, les valeurs DeltaE moyennes des niveaux de gris et des couleurs seraient légèrement améliorées, passant respectivement de 3,2 et 1,78 à 2,1 et 1,22. Un étalonnage par l'utilisateur final n'est donc pas nécessaire pour la plupart des propriétaires.
Temps de réponse de l'écran
| ↔ Temps de réponse noir à blanc | ||
|---|---|---|
| 10.4 ms ... hausse ↗ et chute ↘ combinées | ↗ 5.2 ms hausse | 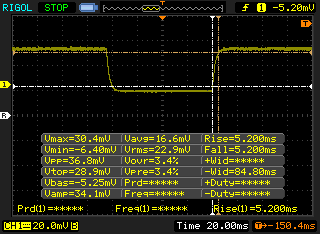 |
| ↘ 5.2 ms chute | ||
| L'écran montre de bons temps de réponse, mais insuffisant pour du jeu compétitif. En comparaison, tous les appareils testés affichent entre 0.1 (minimum) et 240 (maximum) ms. » 28 % des appareils testés affichent de meilleures performances. Cela signifie que les latences relevées sont meilleures que la moyenne (19.8 ms) de tous les appareils testés. | ||
| ↔ Temps de réponse gris 50% à gris 80% | ||
| 8.6 ms ... hausse ↗ et chute ↘ combinées | ↗ 3.4 ms hausse | 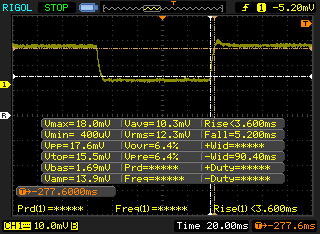 |
| ↘ 5.2 ms chute | ||
| L'écran montre de faibles temps de réponse, un bon écran pour jouer. En comparaison, tous les appareils testés affichent entre 0.165 (minimum) et 636 (maximum) ms. » 22 % des appareils testés affichent de meilleures performances. Cela signifie que les latences relevées sont meilleures que la moyenne (31 ms) de tous les appareils testés. | ||
Scintillement / MLI (Modulation de largeur d'impulsion)
| Scintillement / MLI (Modulation de largeur d'impulsion) non décelé |  | ||
En comparaison, 52 % des appareils testés n'emploient pas MDI pour assombrir leur écran. Nous avons relevé une moyenne à 7769 (minimum : 5 - maximum : 343500) Hz dans le cas où une MDI était active. | |||
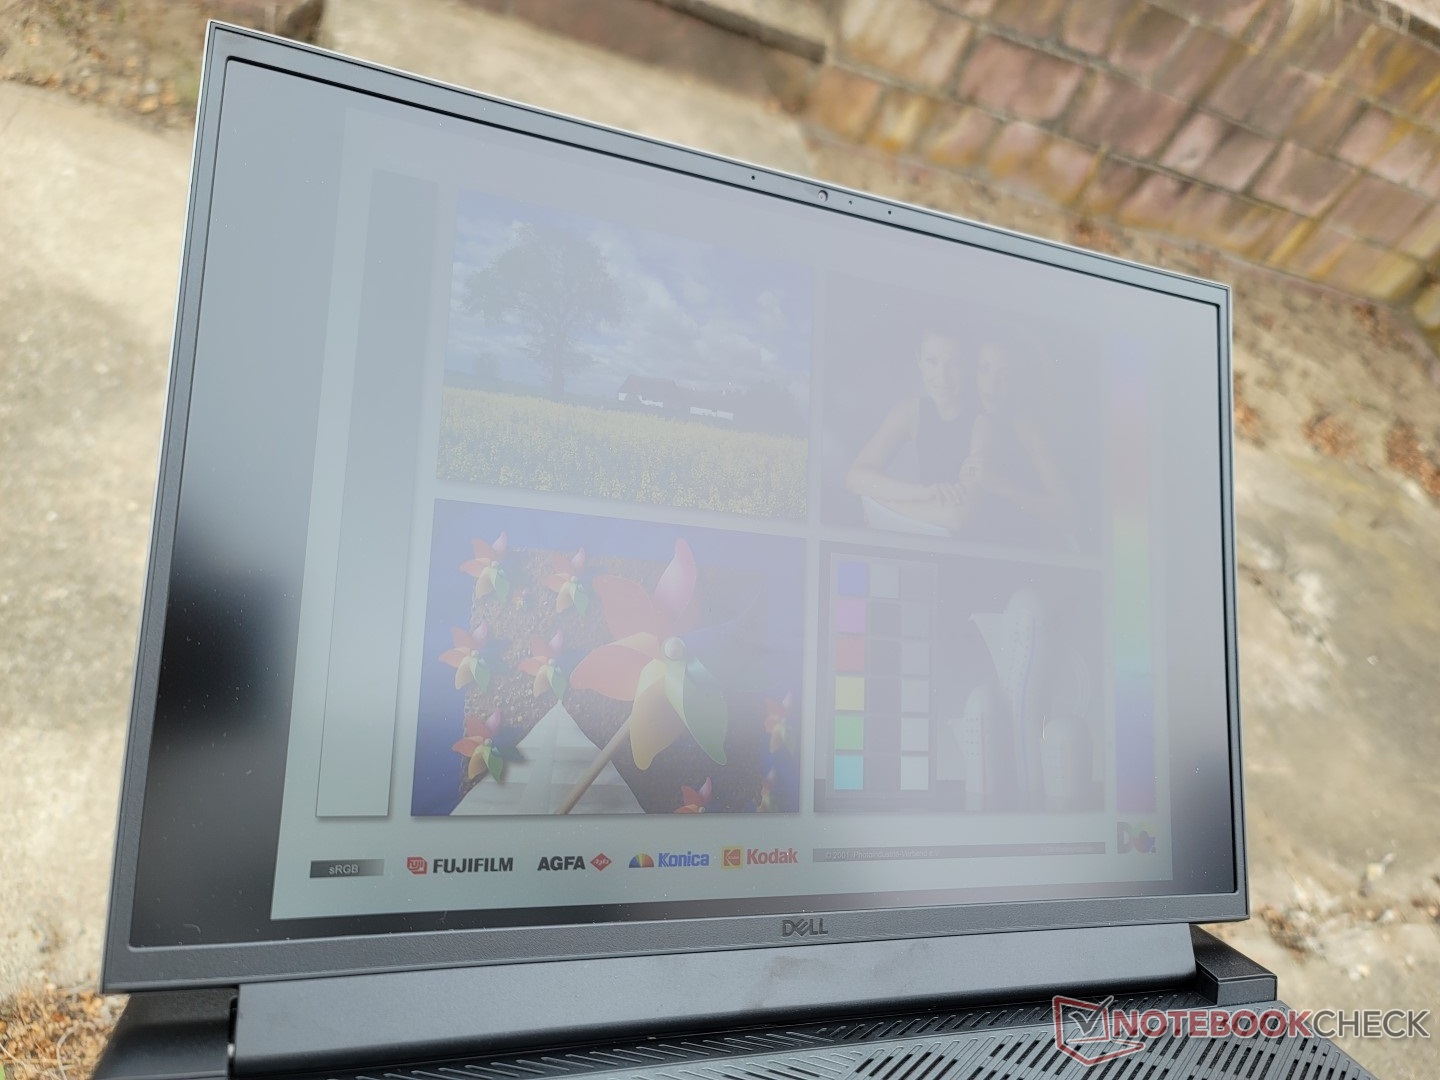
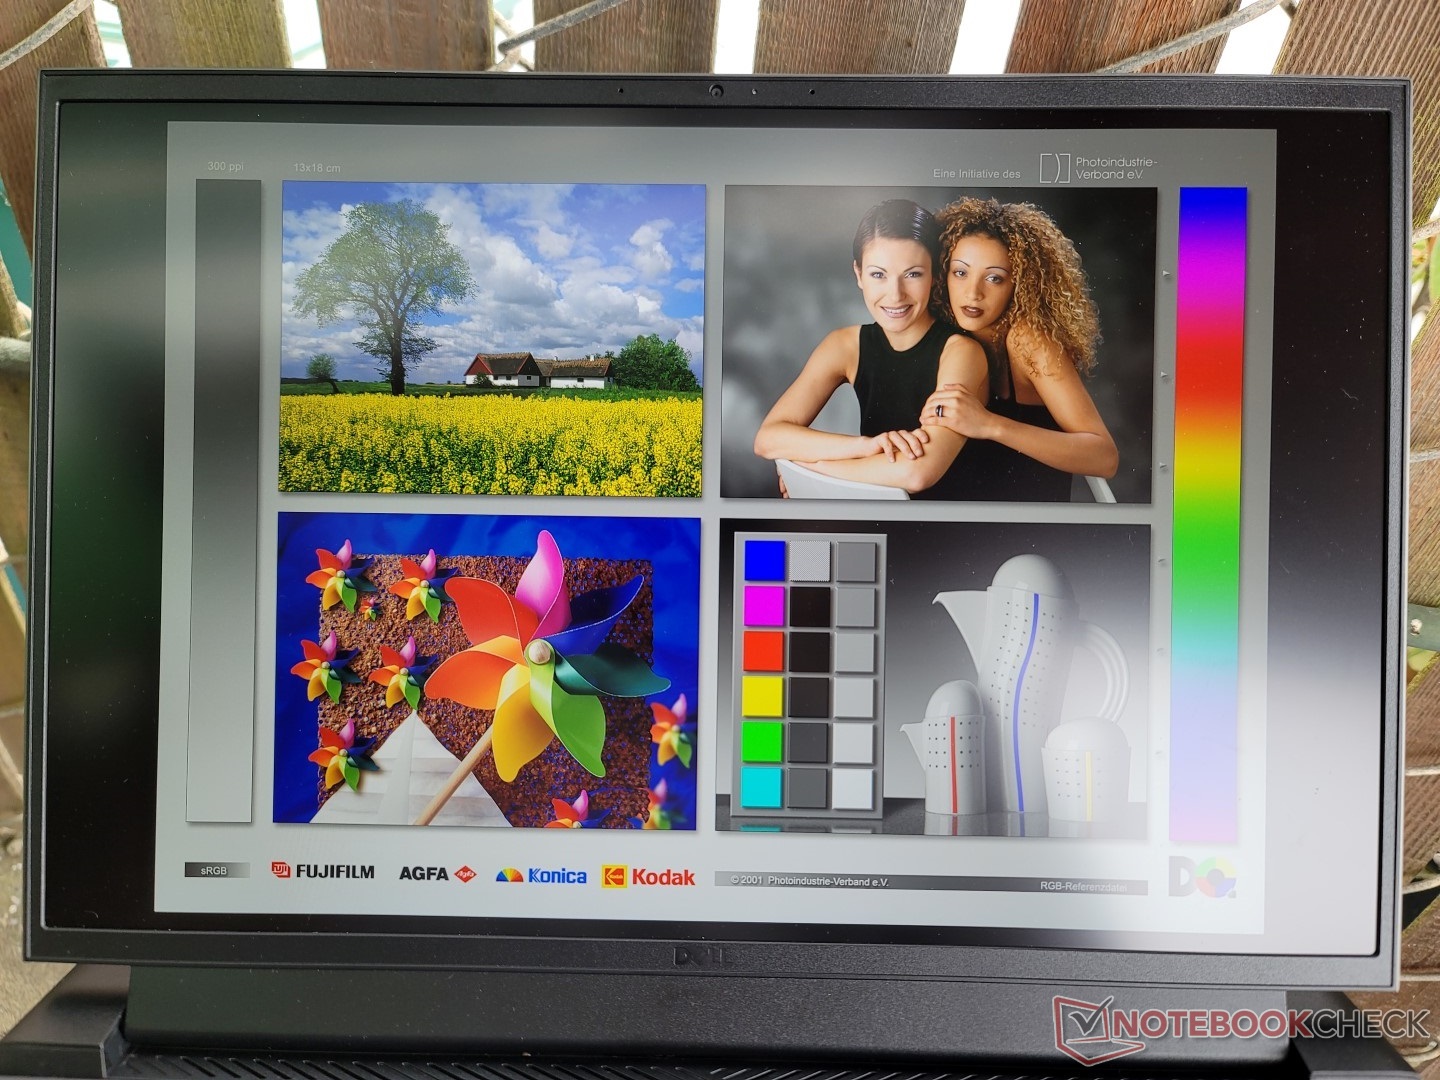
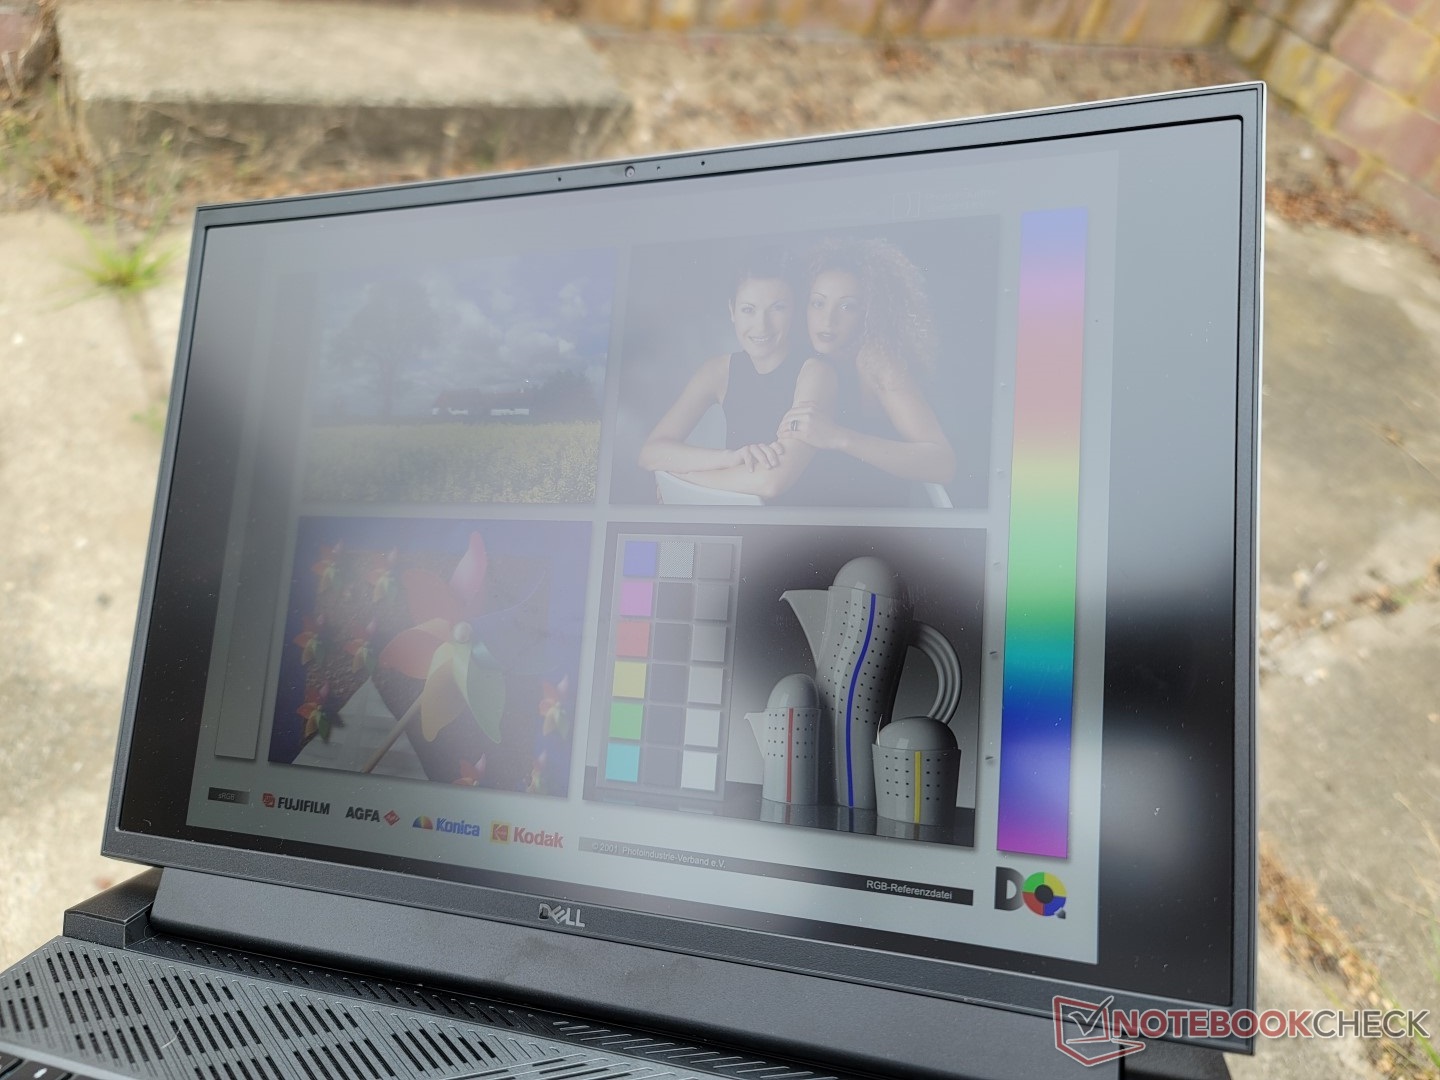
La visibilité en extérieur est décente si l'on se trouve à l'ombre, mais l'éblouissement devient trop important si l'on se trouve sous un éclairage ambiant plus intense. Des alternatives comme le Lenovo Legion 5 Pro 16 ou Legion 7 16 ont des écrans beaucoup plus lumineux d'environ 500 nits chacun si la visibilité extérieure est une préoccupation.
Performance - Plus rapide que la moyenne
Conditions d'essai
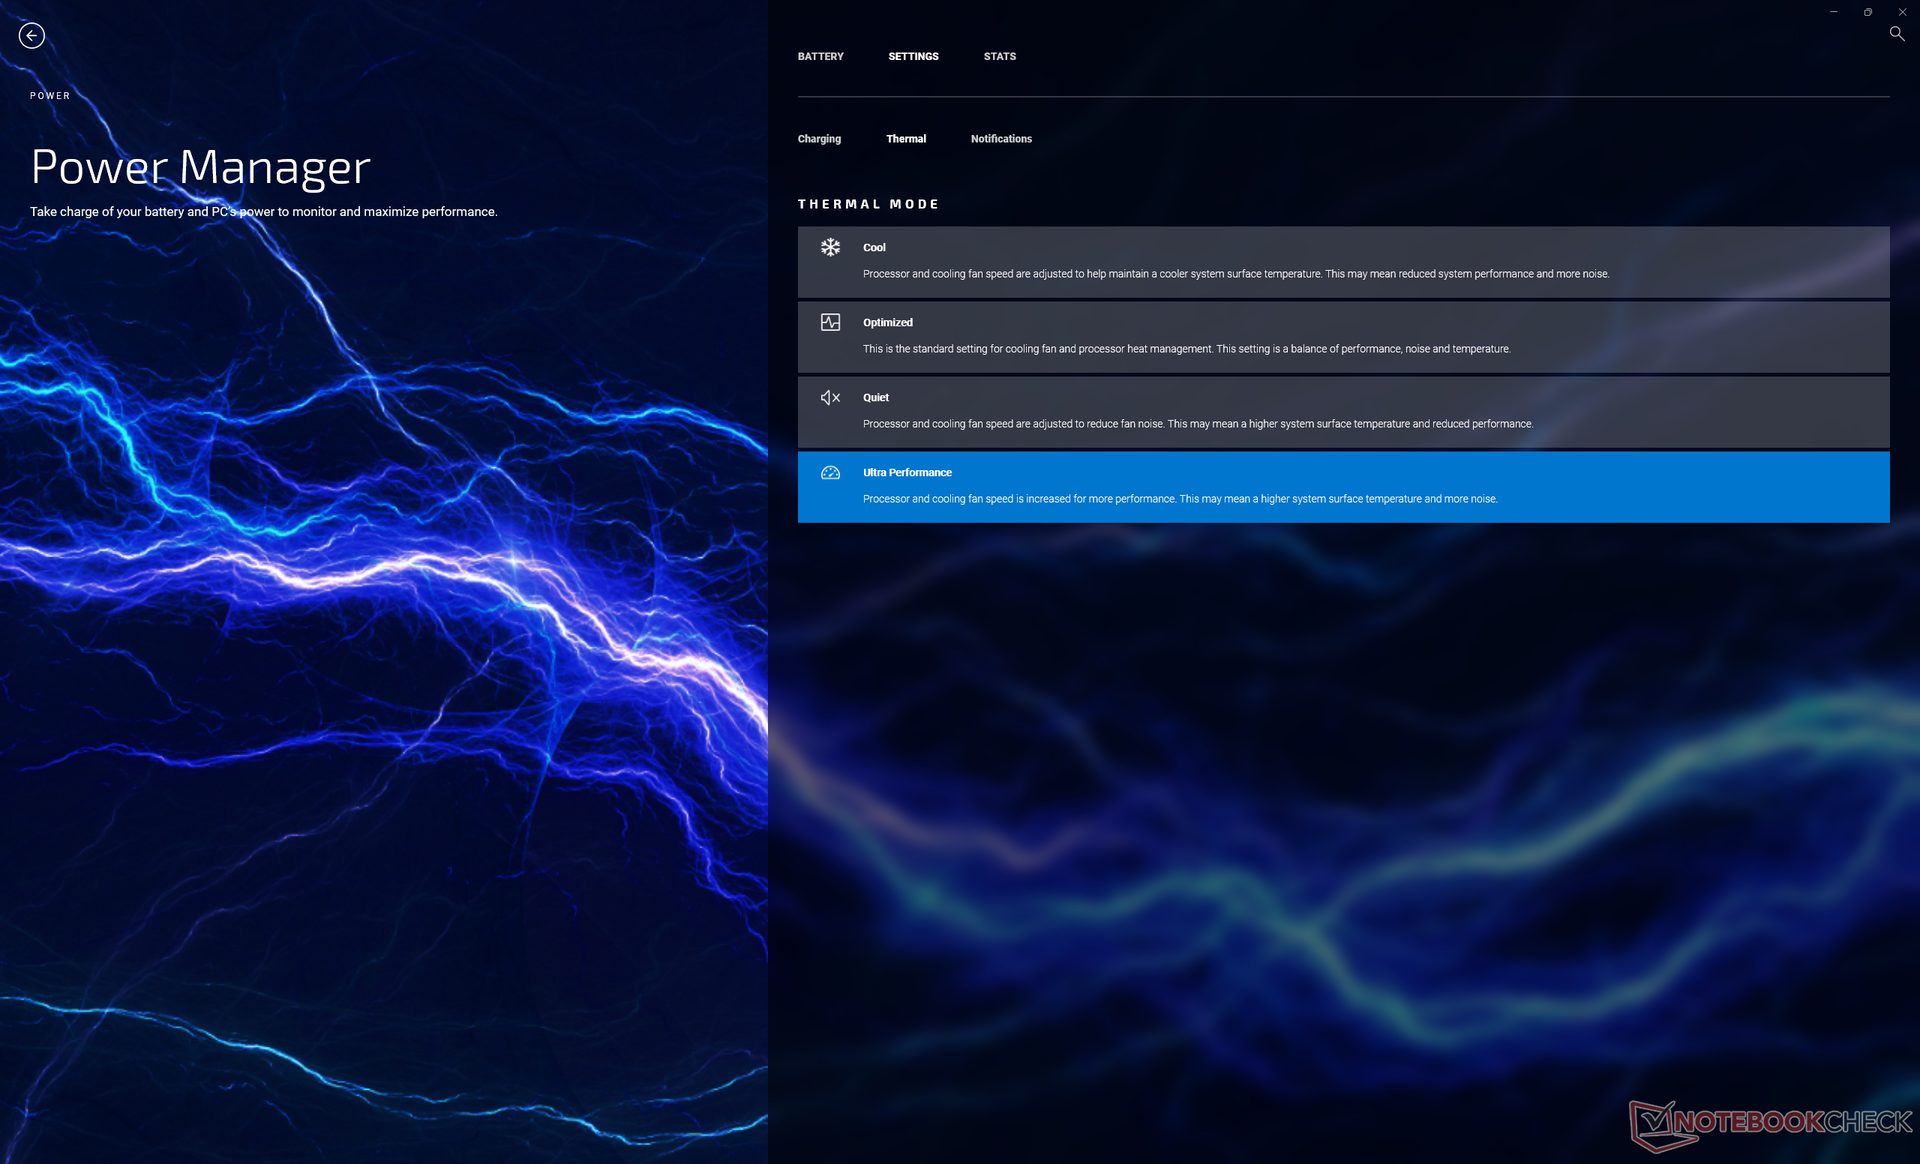
Nous avons réglé notre unité en mode Performance via Windows et en mode Ultra Performance via le logiciel My Dell avant d'exécuter les benchmarks ci-dessous. Nous nous sommes également assurés de désactiver Optimus et de régler le système en mode GPU discret via le panneau de configuration Nvidia. Il est recommandé aux propriétaires de se familiariser avec My Dell et Dell Update, car ces deux applications préinstallées sont essentielles pour ajuster le comportement du système.
Processeur
Les performances multithread sont excellentes, avec des résultats qui sont de 5 à 10 % plus rapides que ceux de l'ordinateur portable moyen de notre base de données avec le même Core i7-12700H CPU. Le processeur est environ 20 à 30 % plus rapide que même la dernière génération du Core i9-11900H de dernière génération dans les charges de travail multithread, mais les performances en mode single-thread peuvent être inférieures de 10 %
La mise à niveau vers le Core i9-12900H ne devrait améliorer les performances que d'environ 5 %, d'après notre expérience avec l'Alienware x15 R2.Alienware x15 R2. Ainsi, le Core i7-12700H est la meilleure option en termes de performance par dollar
La durabilité des performances est excellente et meilleure que sur leDell Inspiron 16 Plus 7620 équipé du même CPU, comme le montre notre graphique de comparaison des tests en boucle CineBench R15 xT ci-dessous.
Cinebench R15 Multi Loop
Cinebench R23: Multi Core | Single Core
Cinebench R15: CPU Multi 64Bit | CPU Single 64Bit
Blender: v2.79 BMW27 CPU
7-Zip 18.03: 7z b 4 | 7z b 4 -mmt1
Geekbench 5.5: Multi-Core | Single-Core
HWBOT x265 Benchmark v2.2: 4k Preset
LibreOffice : 20 Documents To PDF
R Benchmark 2.5: Overall mean
| HWBOT x265 Benchmark v2.2 / 4k Preset | |
| Lenovo Legion 7 16IAX7-82TD004SGE | |
| Alienware x17 R2 P48E | |
| Lenovo Legion 5 Pro 16IAH7H | |
| Alienware x15 R2 P111F | |
| Dell G16 7620 | |
| Lenovo Legion 7 16ARHA7 | |
| Moyenne Intel Core i7-12700H (4.67 - 21.8, n=64) | |
| Asus ROG Zephyrus M16 GU603H | |
| HP Victus 16-e0145ng | |
| Razer Blade 15 Advanced Model Early 2021 | |
| Acer Swift X SFX16-51G-5388 | |
* ... Moindre est la valeur, meilleures sont les performances
AIDA64: FP32 Ray-Trace | FPU Julia | CPU SHA3 | CPU Queen | FPU SinJulia | FPU Mandel | CPU AES | CPU ZLib | FP64 Ray-Trace | CPU PhotoWorxx
| Performance rating | |
| Lenovo Legion 7 16ARHA7 | |
| Dell G16 7620 | |
| Lenovo Legion 5 Pro 16IAH7H | |
| Moyenne Intel Core i7-12700H | |
| HP Victus 16-e0145ng | |
| Acer Swift X SFX16-51G-5388 | |
| Asus ROG Zephyrus M16 GU603H -9! | |
| AIDA64 / FP32 Ray-Trace | |
| Lenovo Legion 7 16ARHA7 | |
| Dell G16 7620 | |
| Lenovo Legion 5 Pro 16IAH7H | |
| Lenovo Legion 5 Pro 16IAH7H | |
| HP Victus 16-e0145ng | |
| Moyenne Intel Core i7-12700H (2585 - 17957, n=64) | |
| Acer Swift X SFX16-51G-5388 | |
| AIDA64 / FPU Julia | |
| Lenovo Legion 7 16ARHA7 | |
| Dell G16 7620 | |
| Lenovo Legion 5 Pro 16IAH7H | |
| Lenovo Legion 5 Pro 16IAH7H | |
| HP Victus 16-e0145ng | |
| Moyenne Intel Core i7-12700H (12439 - 90760, n=64) | |
| Acer Swift X SFX16-51G-5388 | |
| AIDA64 / CPU SHA3 | |
| Dell G16 7620 | |
| Lenovo Legion 7 16ARHA7 | |
| Lenovo Legion 5 Pro 16IAH7H | |
| Lenovo Legion 5 Pro 16IAH7H | |
| Moyenne Intel Core i7-12700H (833 - 4242, n=64) | |
| HP Victus 16-e0145ng | |
| Acer Swift X SFX16-51G-5388 | |
| AIDA64 / CPU Queen | |
| Lenovo Legion 7 16ARHA7 | |
| Dell G16 7620 | |
| Lenovo Legion 5 Pro 16IAH7H | |
| Moyenne Intel Core i7-12700H (57923 - 103202, n=63) | |
| HP Victus 16-e0145ng | |
| Acer Swift X SFX16-51G-5388 | |
| AIDA64 / FPU SinJulia | |
| Lenovo Legion 7 16ARHA7 | |
| Lenovo Legion 5 Pro 16IAH7H | |
| Lenovo Legion 5 Pro 16IAH7H | |
| Dell G16 7620 | |
| Moyenne Intel Core i7-12700H (3249 - 9939, n=64) | |
| HP Victus 16-e0145ng | |
| Acer Swift X SFX16-51G-5388 | |
| AIDA64 / FPU Mandel | |
| Lenovo Legion 7 16ARHA7 | |
| HP Victus 16-e0145ng | |
| Lenovo Legion 5 Pro 16IAH7H | |
| Lenovo Legion 5 Pro 16IAH7H | |
| Dell G16 7620 | |
| Moyenne Intel Core i7-12700H (7135 - 44760, n=64) | |
| Acer Swift X SFX16-51G-5388 | |
| AIDA64 / CPU AES | |
| Lenovo Legion 7 16ARHA7 | |
| Lenovo Legion 5 Pro 16IAH7H | |
| Lenovo Legion 5 Pro 16IAH7H | |
| Moyenne Intel Core i7-12700H (31839 - 144360, n=64) | |
| Dell G16 7620 | |
| Acer Swift X SFX16-51G-5388 | |
| HP Victus 16-e0145ng | |
| AIDA64 / CPU ZLib | |
| Lenovo Legion 5 Pro 16IAH7H | |
| Lenovo Legion 5 Pro 16IAH7H | |
| Dell G16 7620 | |
| Moyenne Intel Core i7-12700H (305 - 1171, n=64) | |
| Lenovo Legion 7 16ARHA7 | |
| HP Victus 16-e0145ng | |
| Acer Swift X SFX16-51G-5388 | |
| Asus ROG Zephyrus M16 GU603H | |
| AIDA64 / FP64 Ray-Trace | |
| Lenovo Legion 7 16ARHA7 | |
| Dell G16 7620 | |
| Lenovo Legion 5 Pro 16IAH7H | |
| Lenovo Legion 5 Pro 16IAH7H | |
| HP Victus 16-e0145ng | |
| Moyenne Intel Core i7-12700H (1437 - 9692, n=64) | |
| Acer Swift X SFX16-51G-5388 | |
| AIDA64 / CPU PhotoWorxx | |
| Acer Swift X SFX16-51G-5388 | |
| Dell G16 7620 | |
| Lenovo Legion 5 Pro 16IAH7H | |
| Lenovo Legion 5 Pro 16IAH7H | |
| Moyenne Intel Core i7-12700H (12863 - 52207, n=64) | |
| Lenovo Legion 7 16ARHA7 | |
| HP Victus 16-e0145ng | |
Performance du système
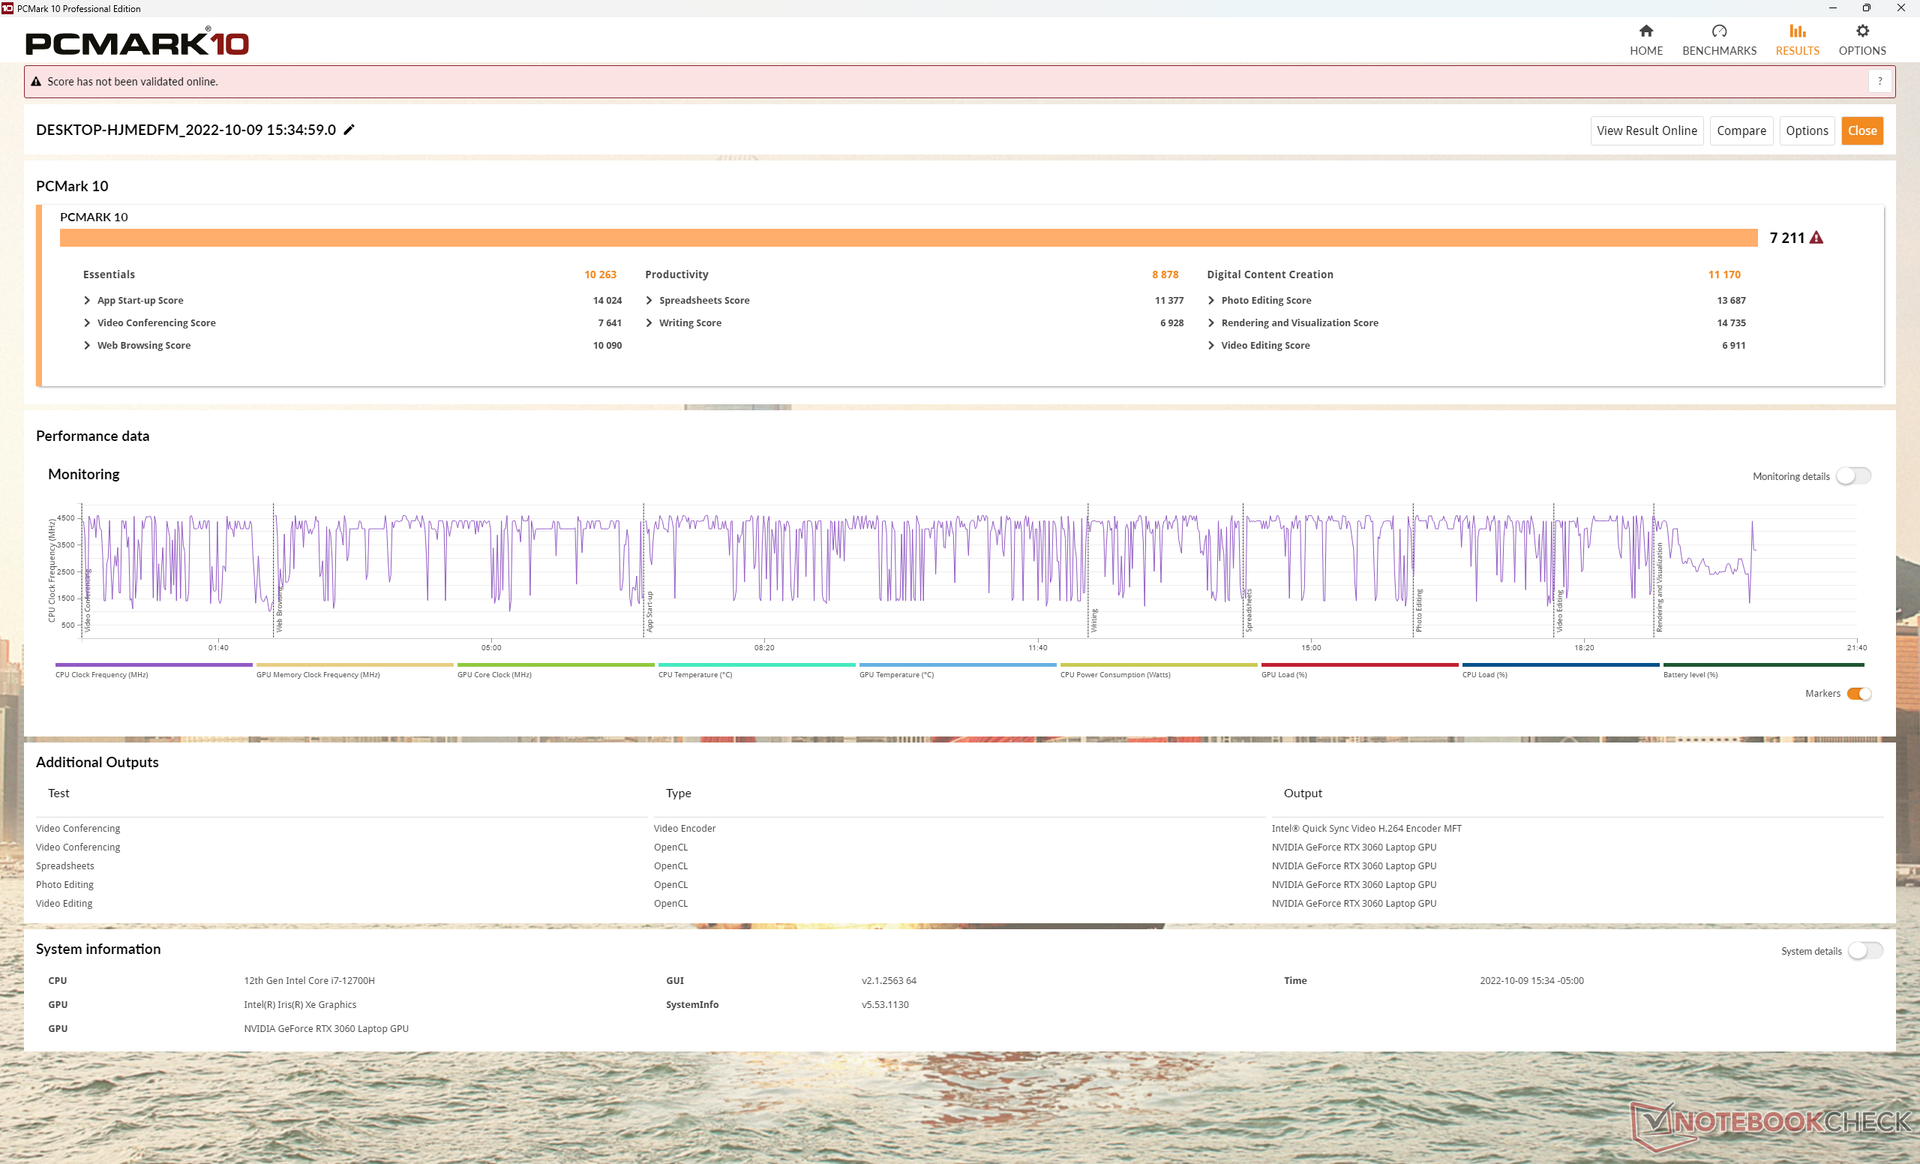
Les résultats de PCMark se situent à quelques points de pourcentage près de ceux d'autres ordinateurs portables équipés du même CPU Core i7-12700H et du même GPU RTX 3060. Les scores sont également plus élevés en moyenne que sur l'Alienware m15 R5 de l'année dernière Alienware m15 R5 avec le même GPU mais un AMD Ryzen 7 5800H plus lent.
CrossMark: Overall | Productivity | Creativity | Responsiveness
| PCMark 10 / Score | |
| Lenovo Legion 5 Pro 16IAH7H | |
| Lenovo Legion 7 16ARHA7 | |
| Moyenne Intel Core i7-12700H, NVIDIA GeForce RTX 3060 Laptop GPU (5986 - 8156, n=12) | |
| Dell G16 7620 | |
| Asus ROG Zephyrus M16 GU603H | |
| HP Victus 16-e0145ng | |
| Acer Swift X SFX16-51G-5388 | |
| PCMark 10 / Essentials | |
| Lenovo Legion 5 Pro 16IAH7H | |
| Moyenne Intel Core i7-12700H, NVIDIA GeForce RTX 3060 Laptop GPU (9289 - 12144, n=12) | |
| Asus ROG Zephyrus M16 GU603H | |
| Lenovo Legion 7 16ARHA7 | |
| Dell G16 7620 | |
| HP Victus 16-e0145ng | |
| Acer Swift X SFX16-51G-5388 | |
| PCMark 10 / Productivity | |
| Lenovo Legion 5 Pro 16IAH7H | |
| Moyenne Intel Core i7-12700H, NVIDIA GeForce RTX 3060 Laptop GPU (6161 - 10362, n=12) | |
| Asus ROG Zephyrus M16 GU603H | |
| Lenovo Legion 7 16ARHA7 | |
| Dell G16 7620 | |
| Acer Swift X SFX16-51G-5388 | |
| HP Victus 16-e0145ng | |
| PCMark 10 / Digital Content Creation | |
| Lenovo Legion 7 16ARHA7 | |
| Lenovo Legion 5 Pro 16IAH7H | |
| Dell G16 7620 | |
| Moyenne Intel Core i7-12700H, NVIDIA GeForce RTX 3060 Laptop GPU (8950 - 12554, n=12) | |
| Asus ROG Zephyrus M16 GU603H | |
| HP Victus 16-e0145ng | |
| Acer Swift X SFX16-51G-5388 | |
| CrossMark / Overall | |
| Moyenne Intel Core i7-12700H, NVIDIA GeForce RTX 3060 Laptop GPU (1649 - 2017, n=11) | |
| Dell G16 7620 | |
| Lenovo Legion 5 Pro 16IAH7H | |
| Lenovo Legion 7 16ARHA7 | |
| Acer Swift X SFX16-51G-5388 | |
| CrossMark / Productivity | |
| Moyenne Intel Core i7-12700H, NVIDIA GeForce RTX 3060 Laptop GPU (1536 - 1958, n=11) | |
| Lenovo Legion 5 Pro 16IAH7H | |
| Dell G16 7620 | |
| Lenovo Legion 7 16ARHA7 | |
| Acer Swift X SFX16-51G-5388 | |
| CrossMark / Creativity | |
| Moyenne Intel Core i7-12700H, NVIDIA GeForce RTX 3060 Laptop GPU (1816 - 2084, n=11) | |
| Dell G16 7620 | |
| Lenovo Legion 5 Pro 16IAH7H | |
| Lenovo Legion 7 16ARHA7 | |
| Acer Swift X SFX16-51G-5388 | |
| CrossMark / Responsiveness | |
| Lenovo Legion 5 Pro 16IAH7H | |
| Moyenne Intel Core i7-12700H, NVIDIA GeForce RTX 3060 Laptop GPU (1210 - 2207, n=11) | |
| Dell G16 7620 | |
| Lenovo Legion 7 16ARHA7 | |
| Acer Swift X SFX16-51G-5388 | |
| PCMark 10 Score | 7211 points | |
Aide | ||
| AIDA64 / Memory Copy | |
| Acer Swift X SFX16-51G-5388 | |
| Lenovo Legion 5 Pro 16IAH7H | |
| Lenovo Legion 5 Pro 16IAH7H | |
| Dell G16 7620 | |
| Moyenne Intel Core i7-12700H (25615 - 80511, n=64) | |
| Lenovo Legion 7 16ARHA7 | |
| HP Victus 16-e0145ng | |
| AIDA64 / Memory Read | |
| Dell G16 7620 | |
| Lenovo Legion 5 Pro 16IAH7H | |
| Lenovo Legion 5 Pro 16IAH7H | |
| Moyenne Intel Core i7-12700H (25586 - 79442, n=64) | |
| Acer Swift X SFX16-51G-5388 | |
| Lenovo Legion 7 16ARHA7 | |
| HP Victus 16-e0145ng | |
| AIDA64 / Memory Write | |
| Acer Swift X SFX16-51G-5388 | |
| Lenovo Legion 5 Pro 16IAH7H | |
| Lenovo Legion 5 Pro 16IAH7H | |
| Dell G16 7620 | |
| Lenovo Legion 7 16ARHA7 | |
| Moyenne Intel Core i7-12700H (23679 - 88660, n=64) | |
| HP Victus 16-e0145ng | |
| AIDA64 / Memory Latency | |
| Lenovo Legion 5 Pro 16IAH7H | |
| Lenovo Legion 5 Pro 16IAH7H | |
| Acer Swift X SFX16-51G-5388 | |
| Dell G16 7620 | |
| Lenovo Legion 7 16ARHA7 | |
| Moyenne Intel Core i7-12700H (76.2 - 133.9, n=62) | |
| HP Victus 16-e0145ng | |
| Asus ROG Zephyrus M16 GU603H | |
* ... Moindre est la valeur, meilleures sont les performances
Latence DPC
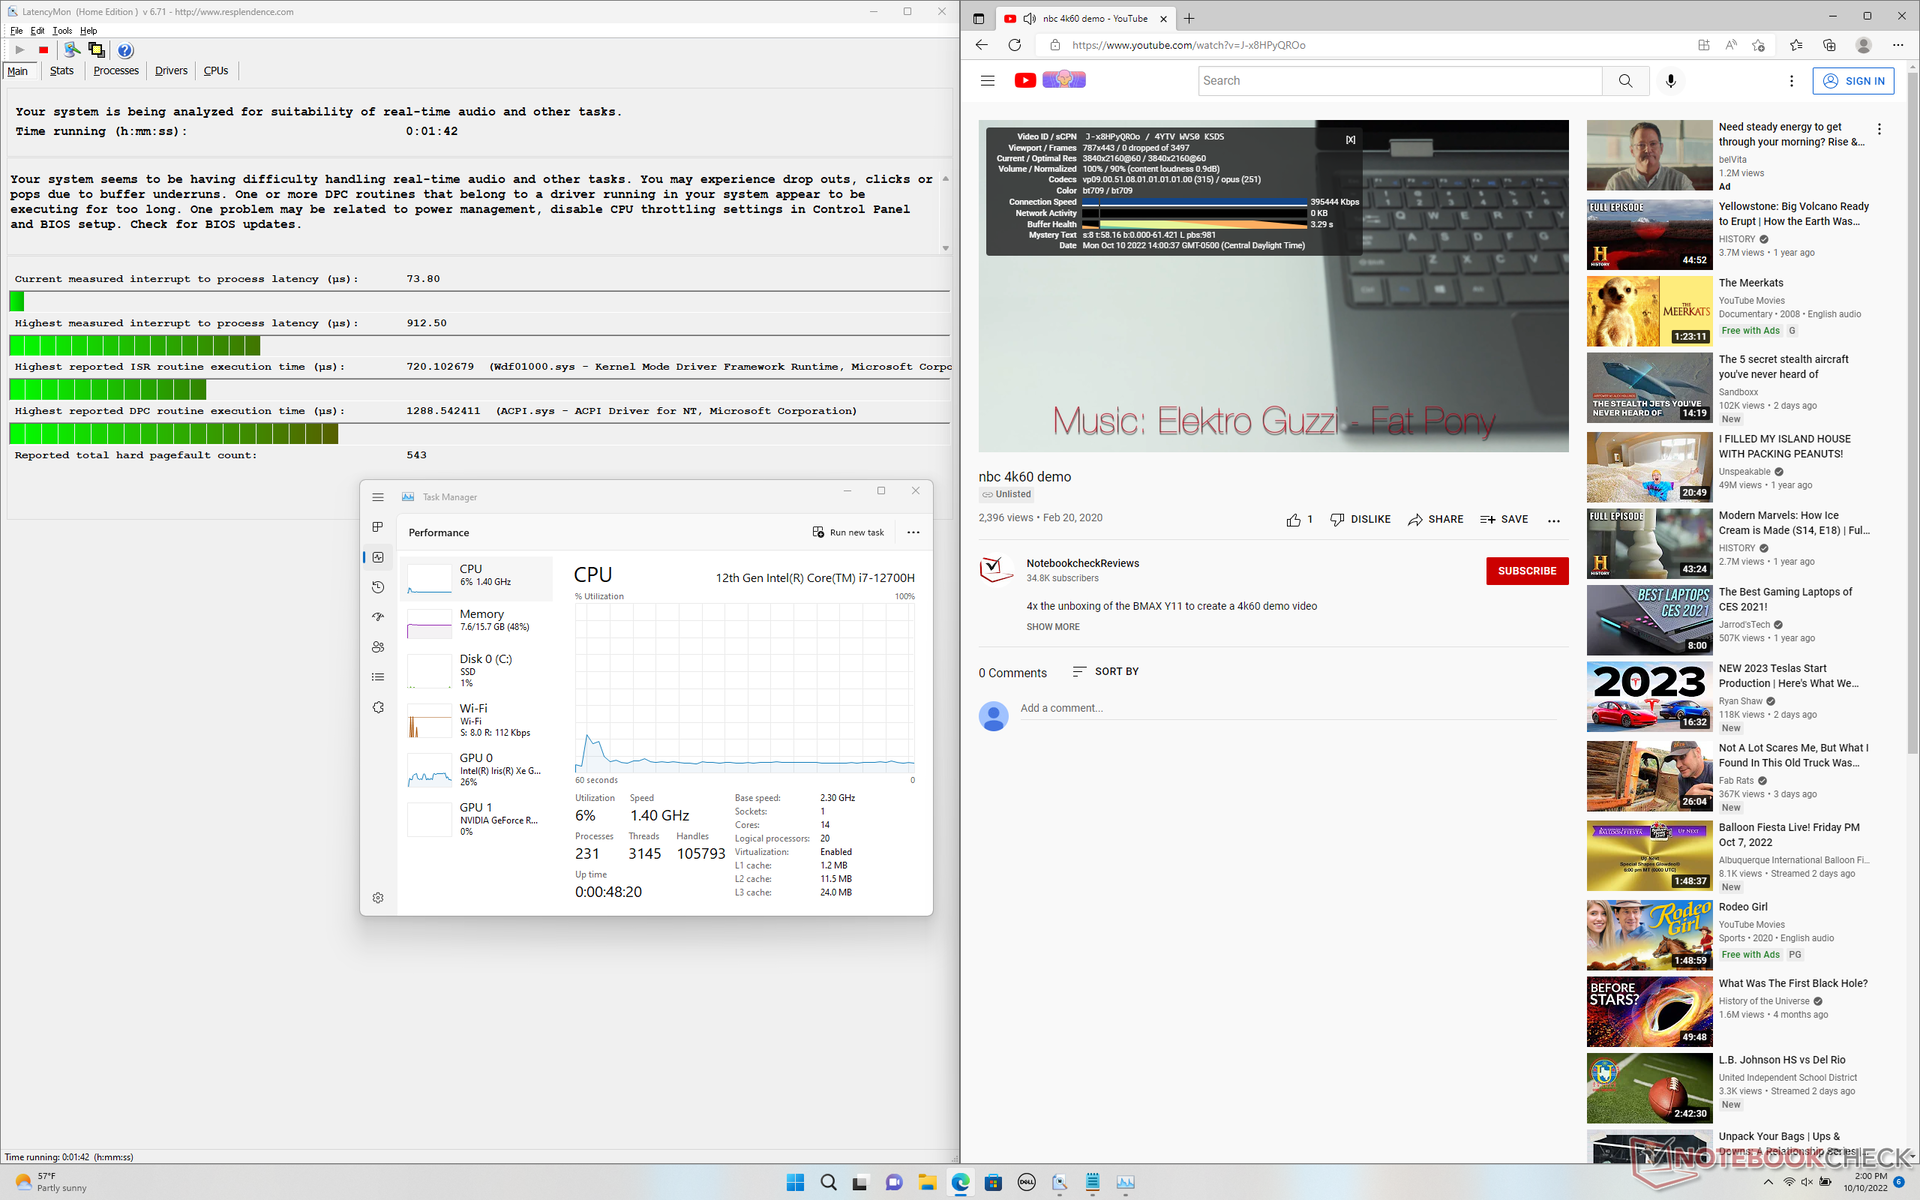
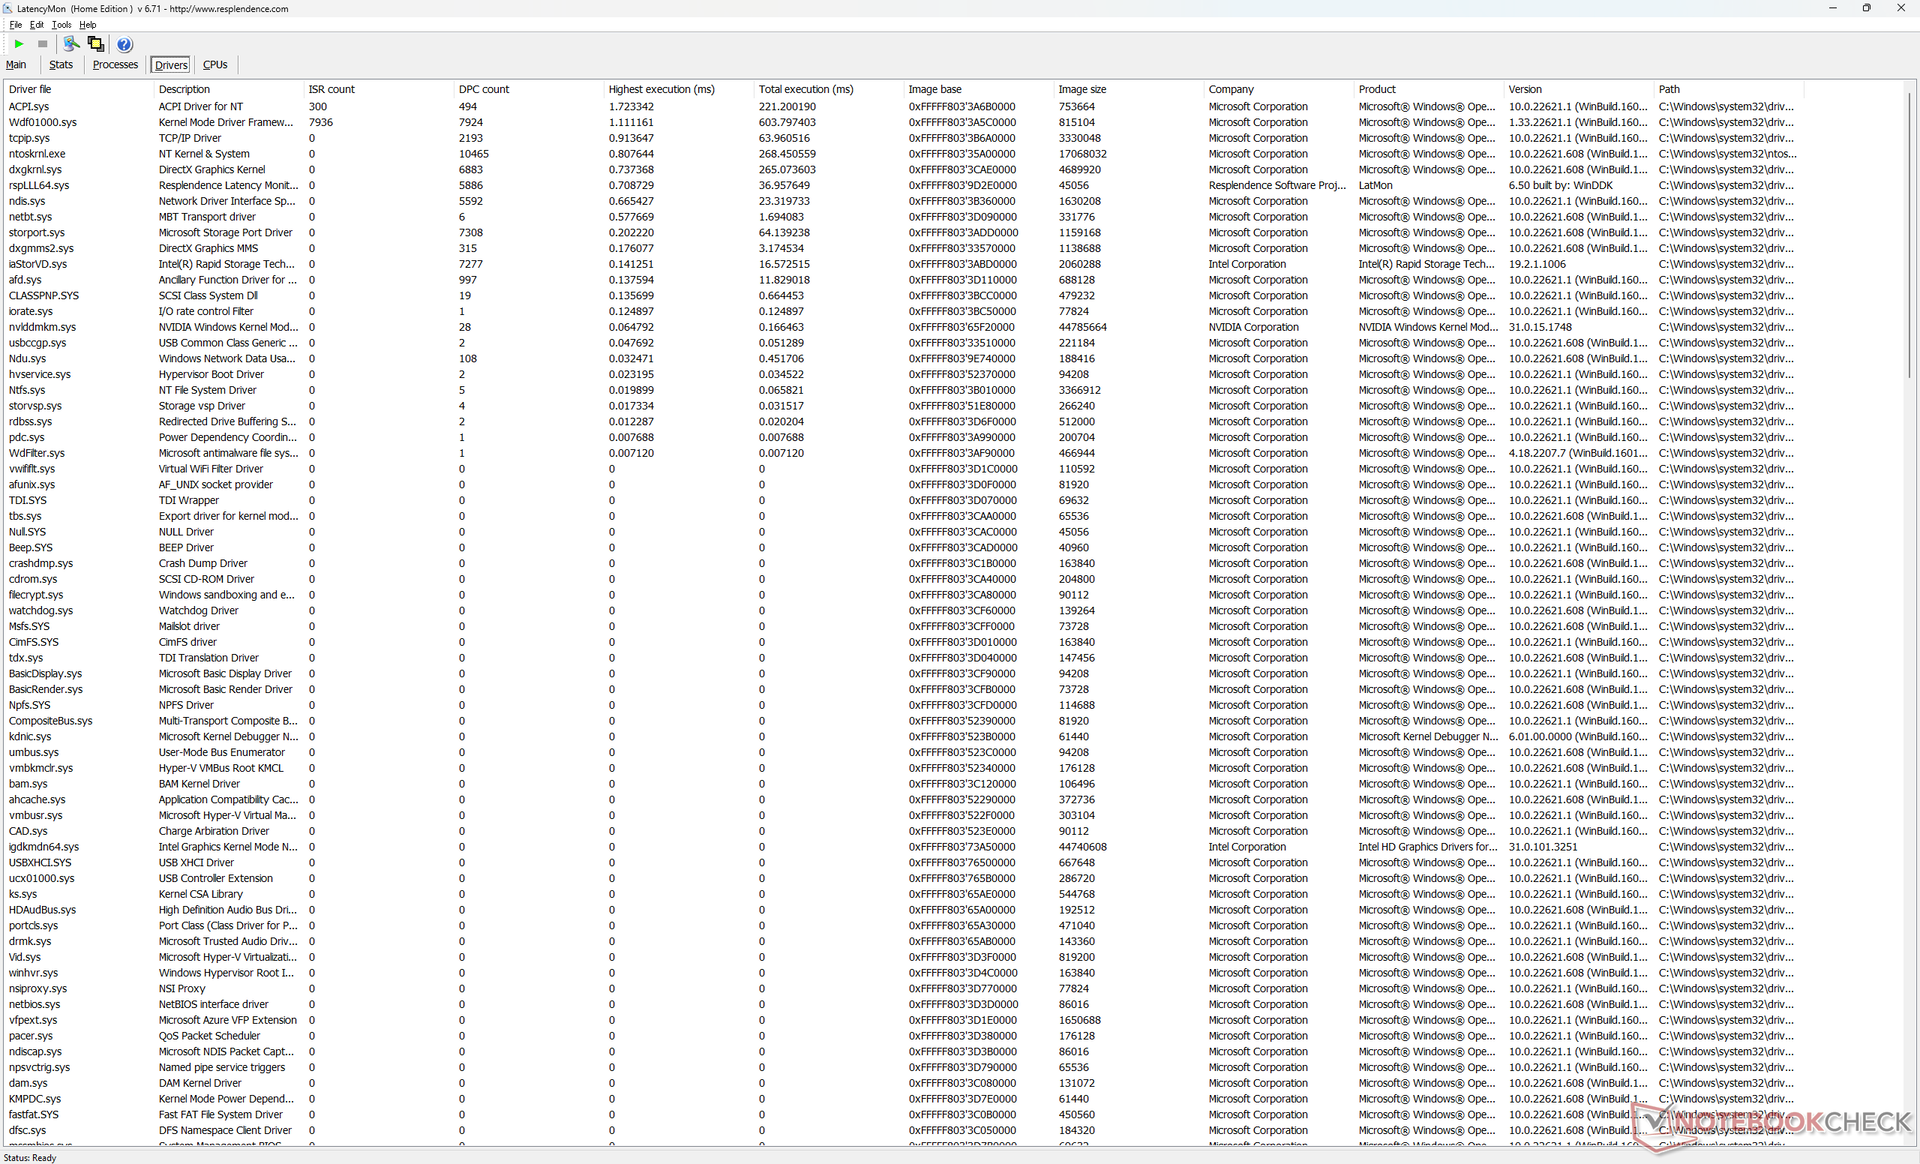
LatencyMon révèle de légers problèmes de CPD lors de l'ouverture de plusieurs onglets de navigateur sur notre page d'accueil. la lecture de vidéos 4K à 60 FPS est par ailleurs parfaite, sans aucune perte d'images.
| DPC Latencies / LatencyMon - interrupt to process latency (max), Web, Youtube, Prime95 | |
| Acer Swift X SFX16-51G-5388 | |
| Lenovo Legion 7 16ARHA7 | |
| Asus ROG Zephyrus M16 GU603H | |
| Dell G16 7620 | |
| HP Victus 16-e0145ng | |
| Lenovo Legion 5 Pro 16IAH7H | |
* ... Moindre est la valeur, meilleures sont les performances
Périphériques de stockage
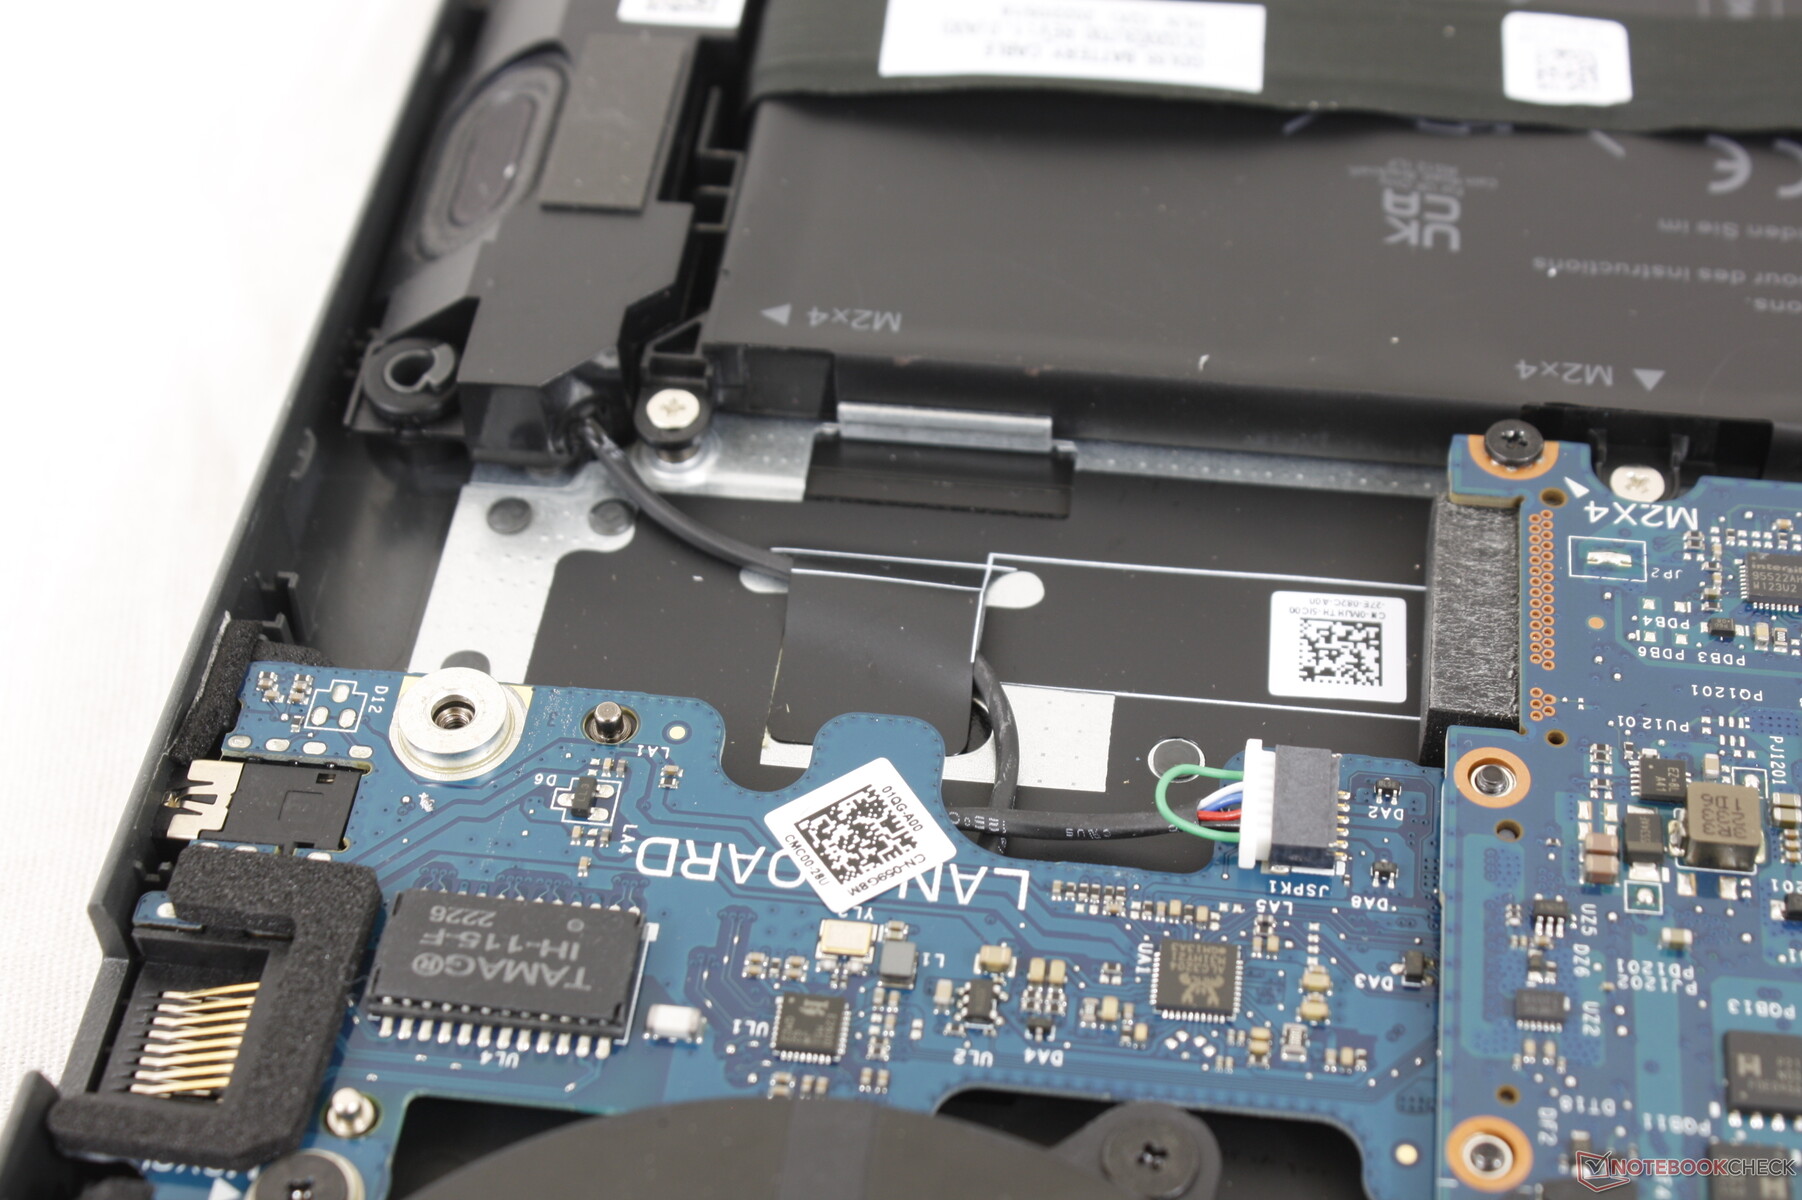
La carte mère peut accueillir jusqu'à deux SSD M.2 2280 comme le montrent les images ci-dessous. Cependant, toutes les configurations actuelles sont livrées avec le second connecteur retiré, ce qui signifie que le G16 ne peut supporter qu'un seul SSD M.2 2280 interne
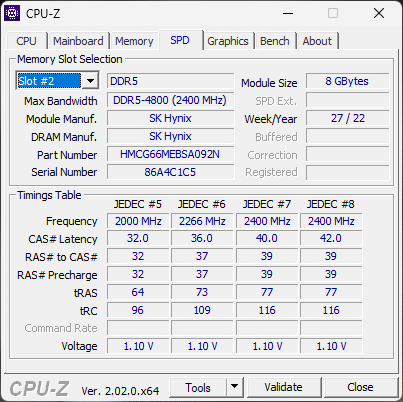
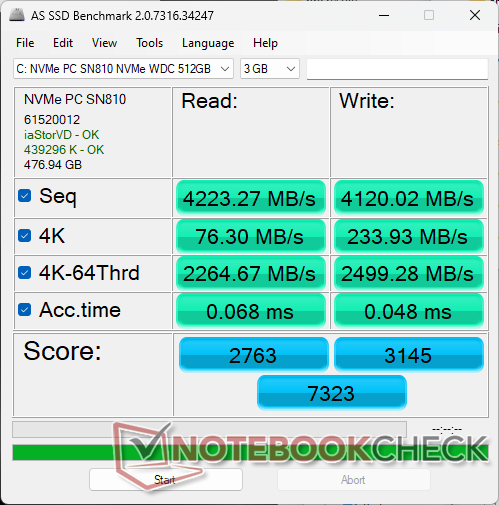
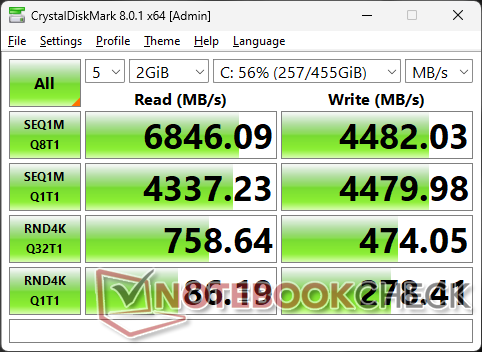
Notre unité de test est livrée avec le modèle de milieu de gamme supérieur WDC PC SN810 PCIe4 x4 NVMe SSD pour des taux théoriques de lecture et d'écriture séquentielle allant jusqu'à 6000 Mo/s et 4000 Mo/s, respectivement, selon le fabricant. Le disque de notre unité est capable d'atteindre 6700 Mo/s, mais il est incapable de maintenir ces vitesses rapides pendant des périodes prolongées. Lors de l'exécution de DiskSpd en boucle, par exemple, les taux de lecture finissaient par être réduits à 3500 Mo/s.

| Drive Performance rating - Percent | |
| Lenovo Legion 5 Pro 16IAH7H | |
| Asus ROG Zephyrus M16 GU603H | |
| Dell G16 7620 | |
| Lenovo Legion 7 16ARHA7 | |
| HP Victus 16-e0145ng | |
| Acer Swift X SFX16-51G-5388 | |
* ... Moindre est la valeur, meilleures sont les performances
Disk Throttling: DiskSpd Read Loop, Queue Depth 8
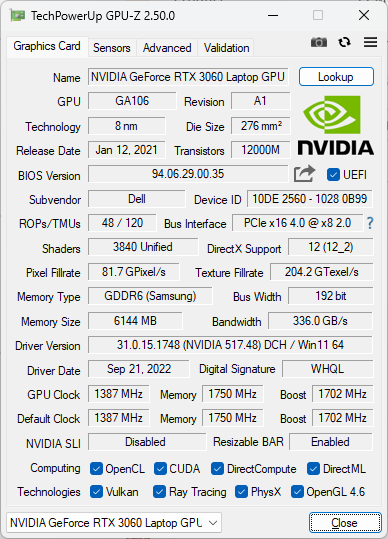
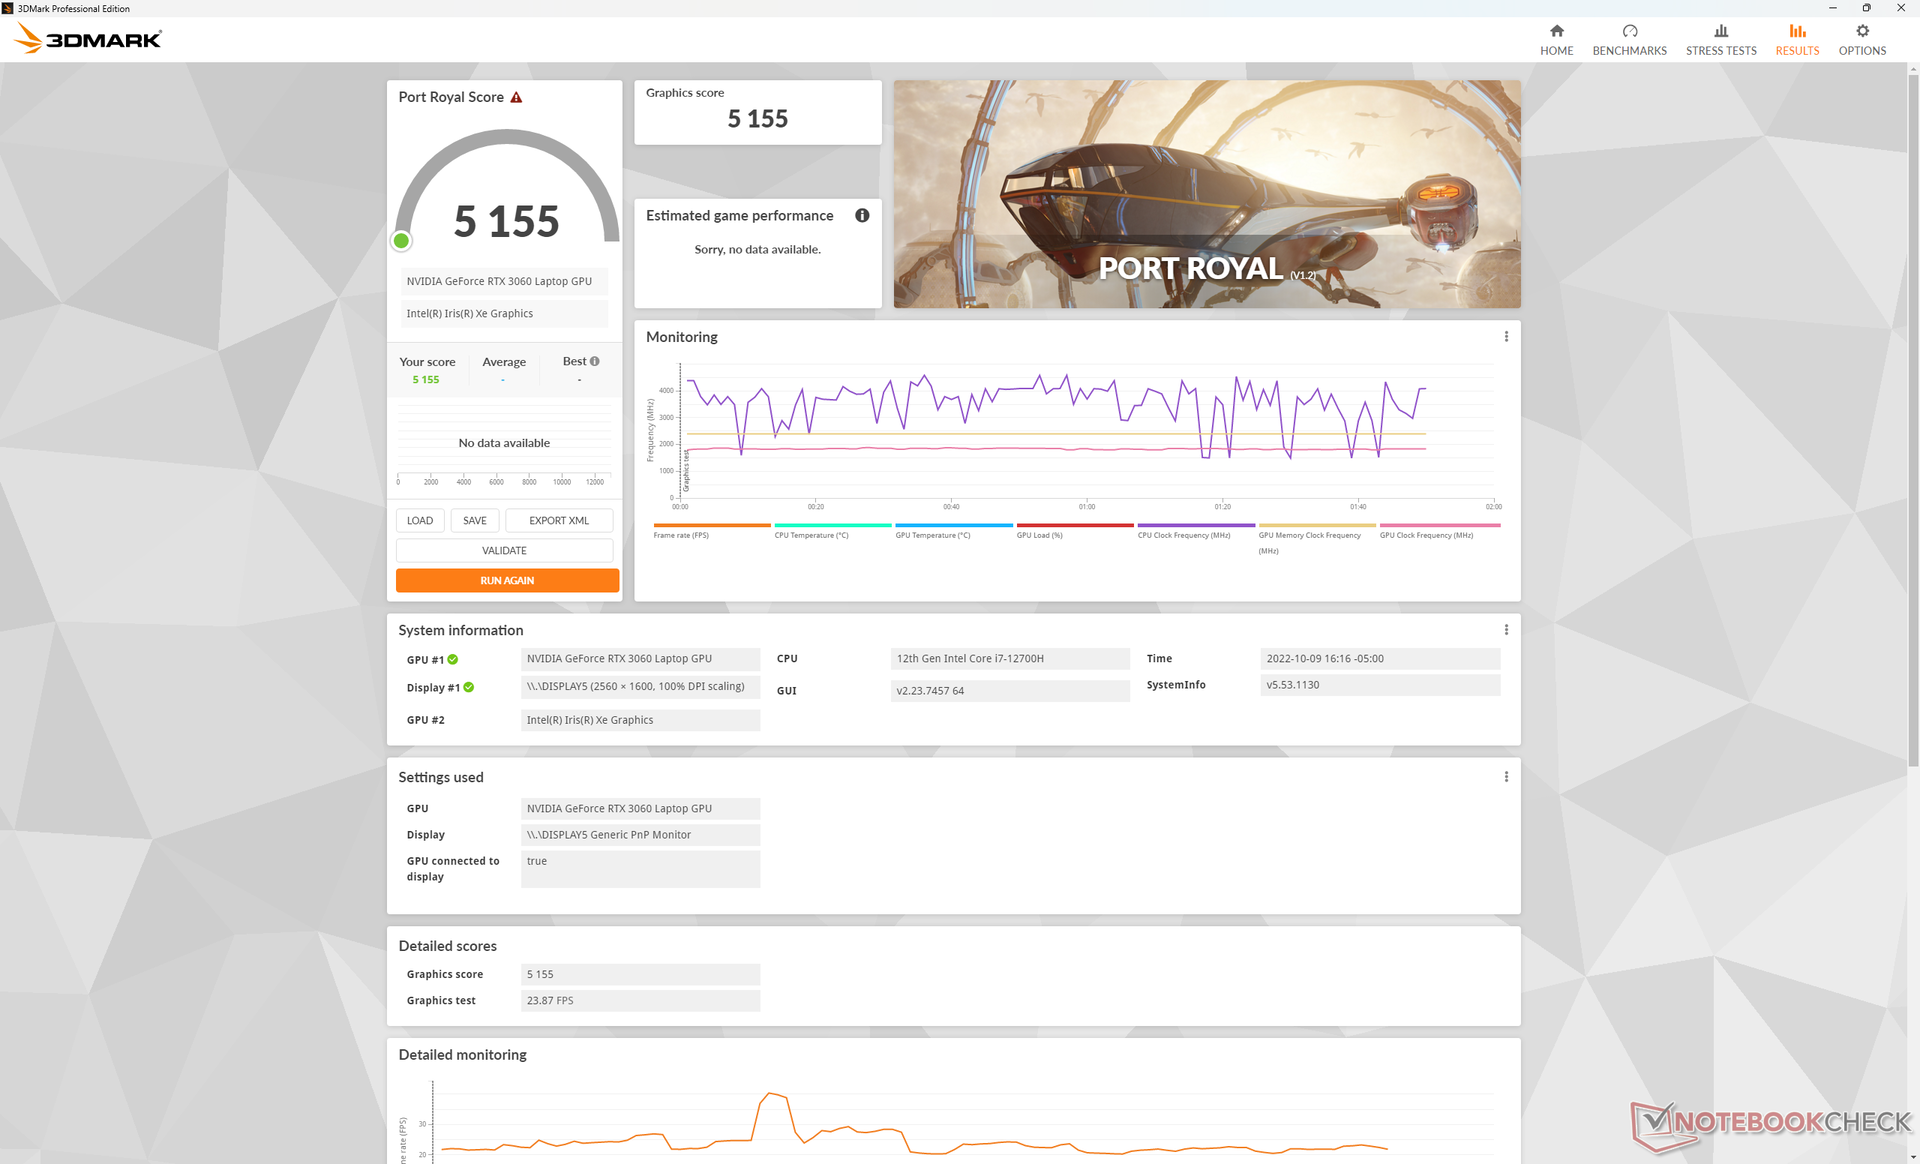
Performances du GPU - 130 W TGP Graphics
Les performances graphiques sont excellentes, avec des résultats 5 à 10 % plus rapides que ceux de l'ordinateur portable moyen de notre base de données équipé de la même technologie GeForce RTX 3060 GPU. Les performances globales se situent maintenant à moins de 10 % d'un RTX 3060 de bureau correct. Cela est dû en partie à la cible TGP de 130 W du Dell G16 qui se situe dans le haut du spectre lorsqu'il s'agit d'ordinateurs portables de jeu.
La mise à niveau vers la RTX 3070 Ti devrait améliorer les performances graphiques d'environ 20 à 30 %, tandis que le passage à la configuration RTX 3050 Ti réduira les performances d'environ 30 à 35 %.
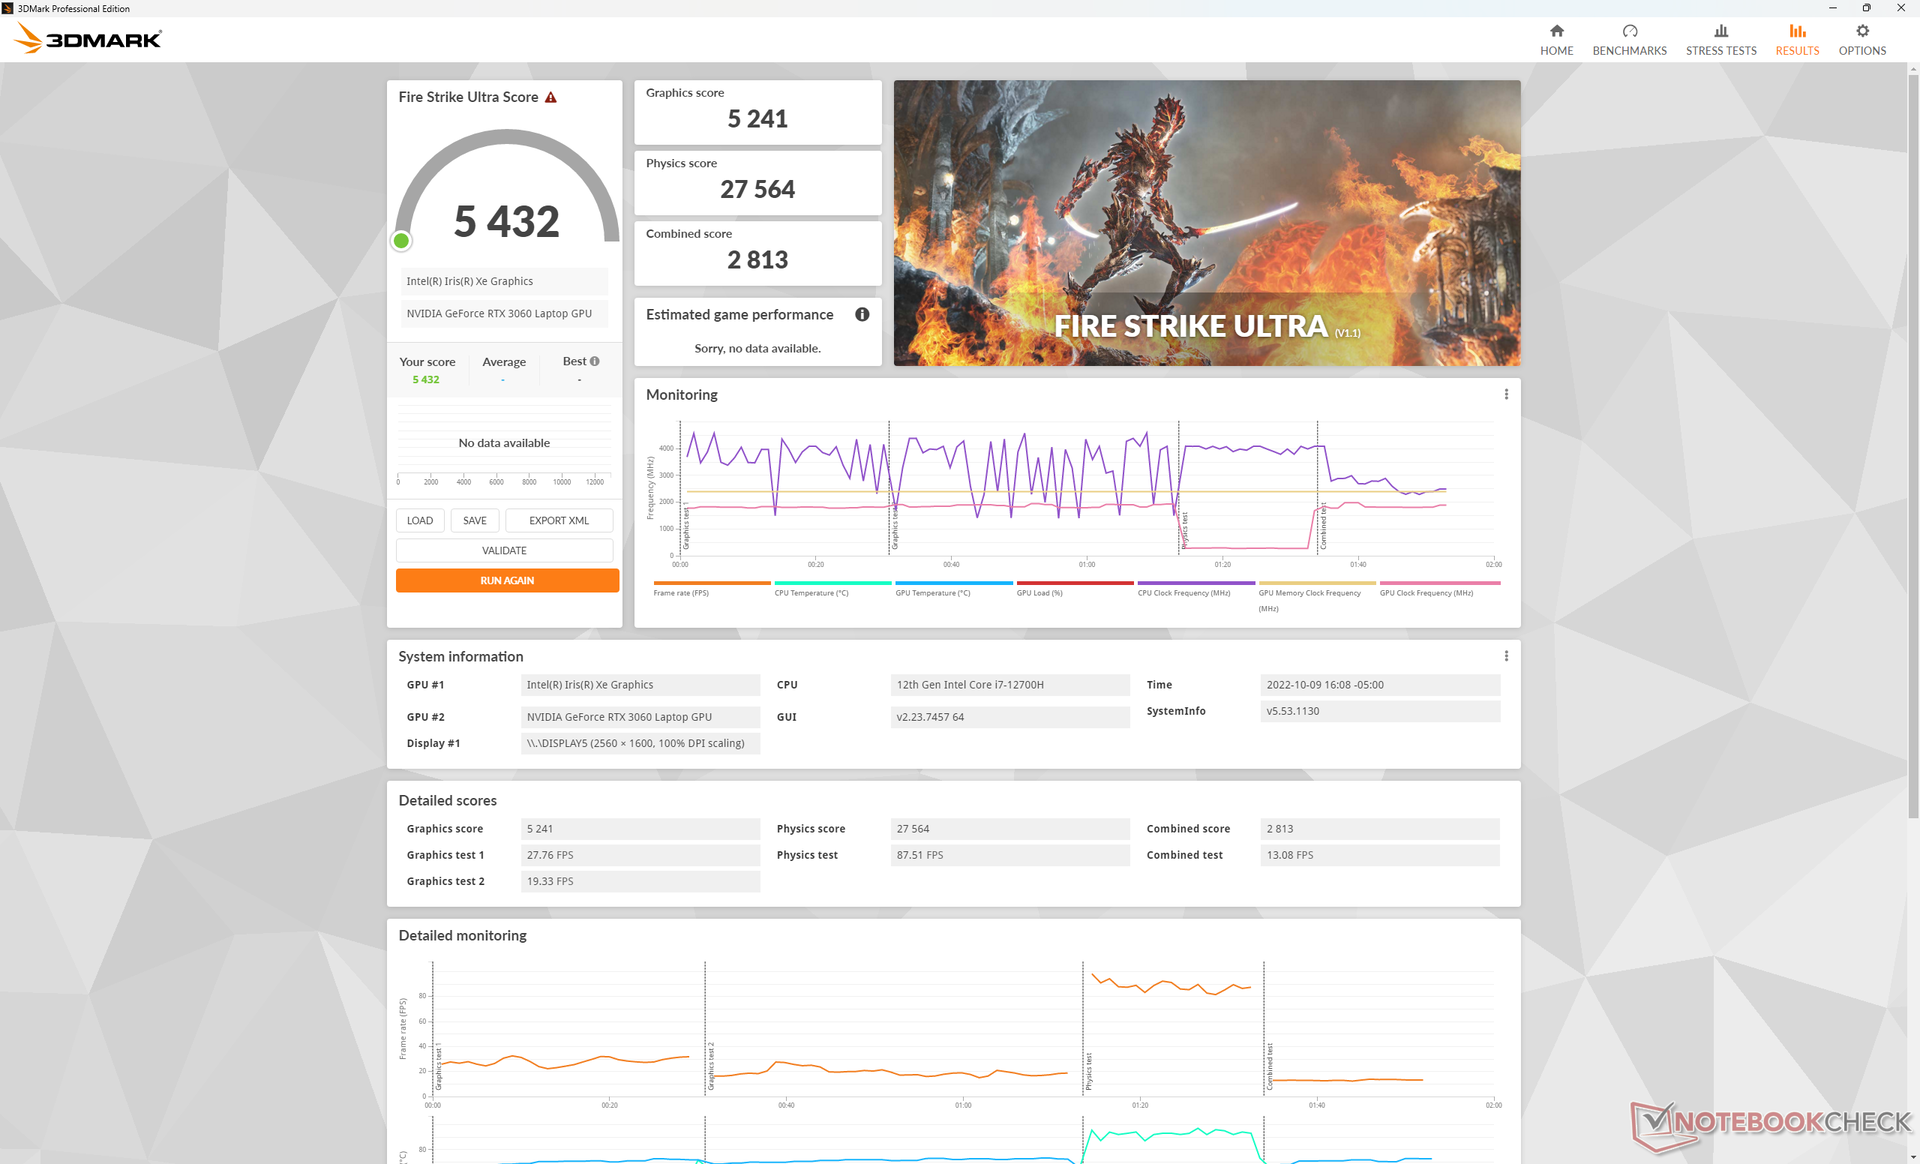
L'exécution en mode Optimisé au lieu du mode Ultra Performance a un impact très léger sur les performances. Un test sur Fire Strike en mode Optimisé donne des résultats de 26289 et 21492 points pour la physique et le graphisme, respectivement, contre 27735 et 21584 points en mode Ultra Performance.
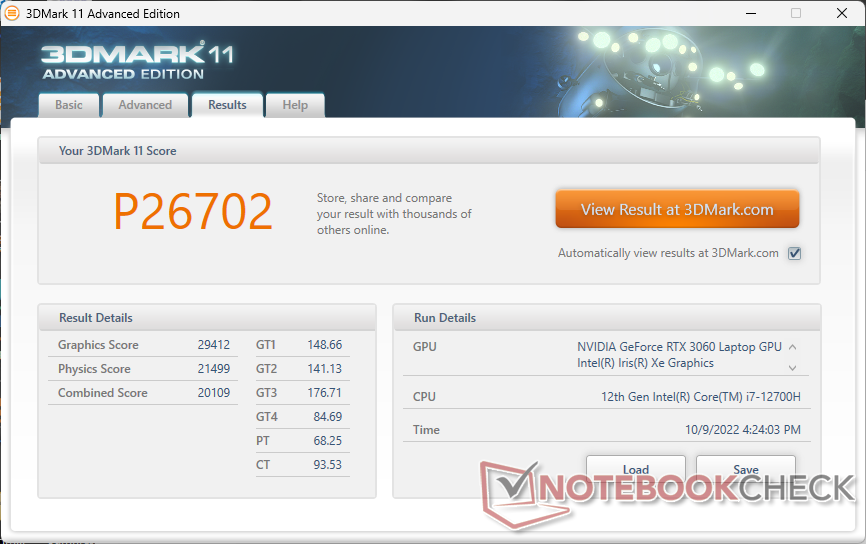
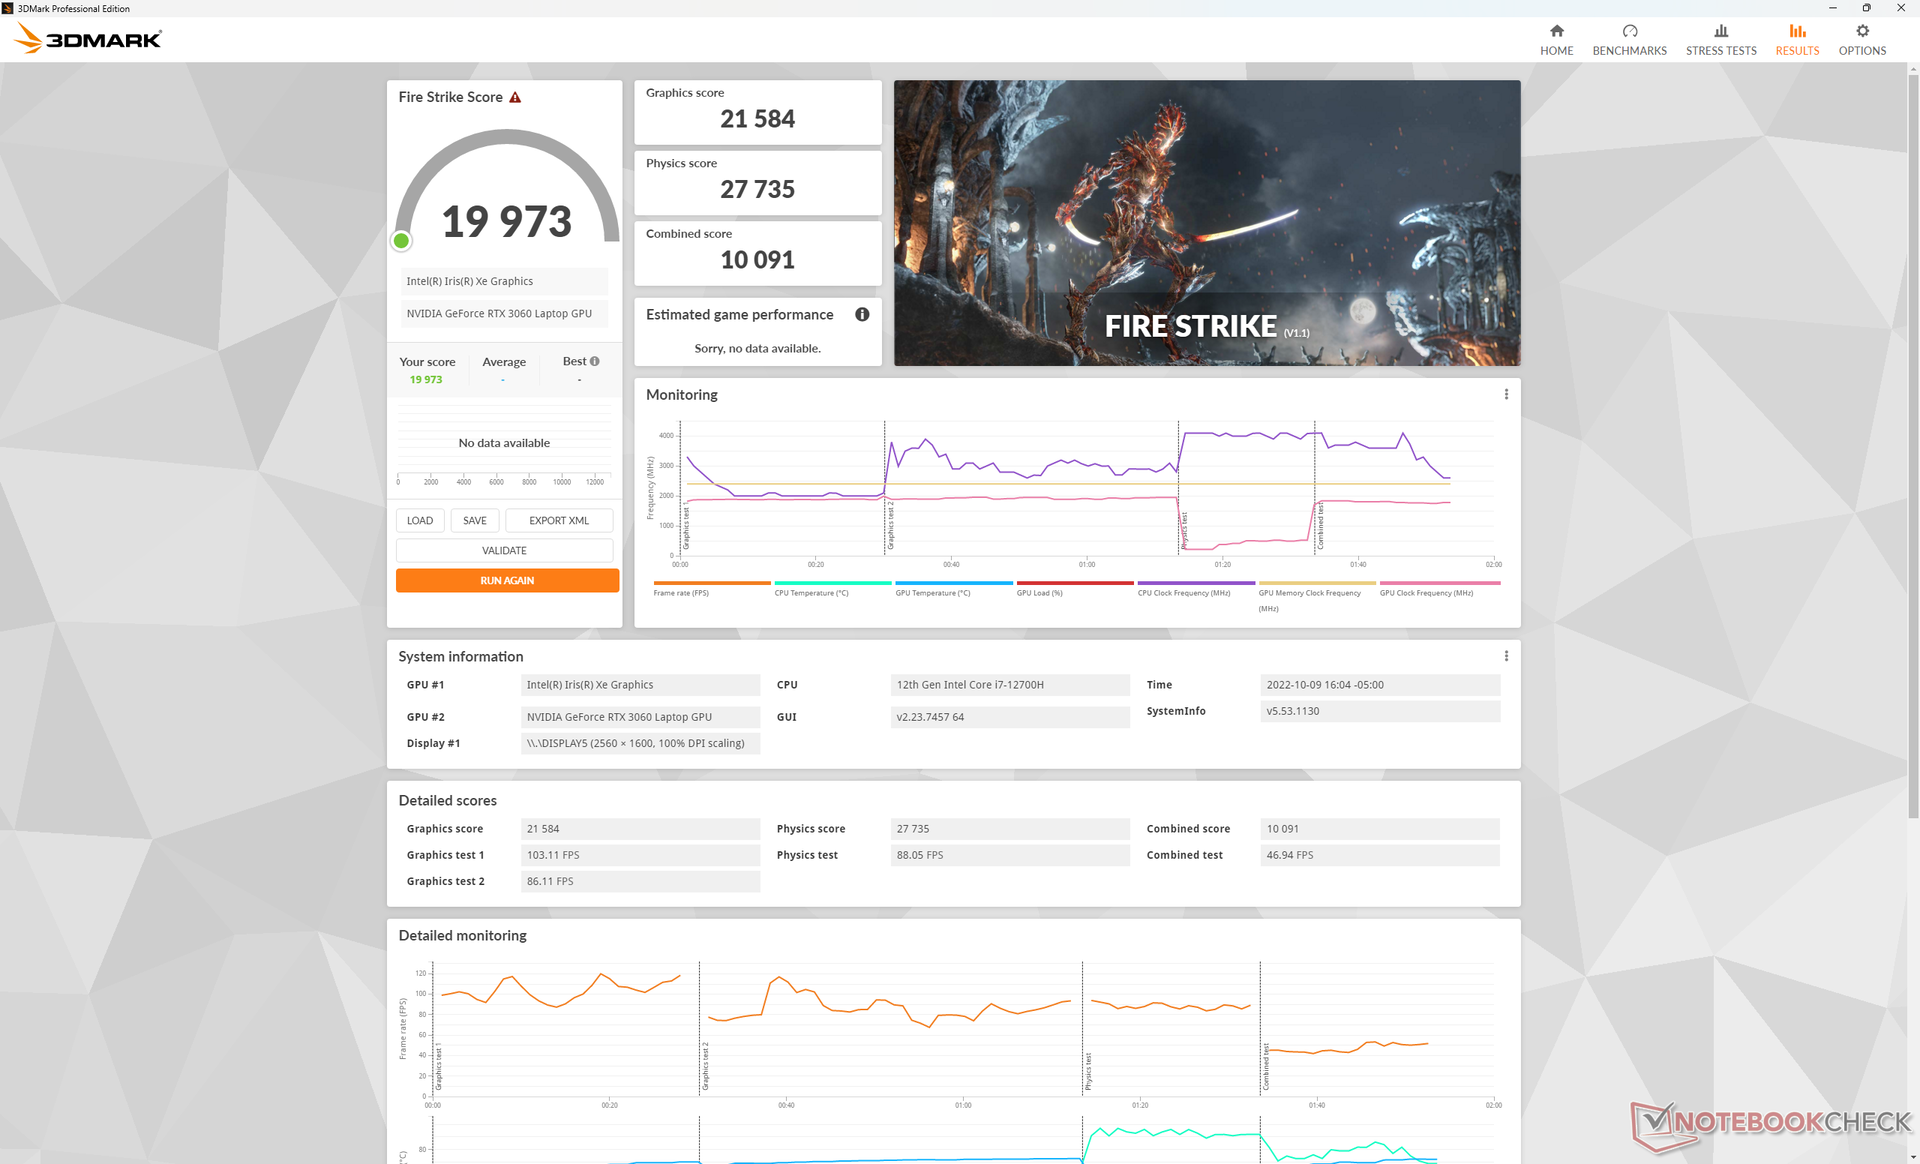
| 3DMark 11 Performance | 26702 points | |
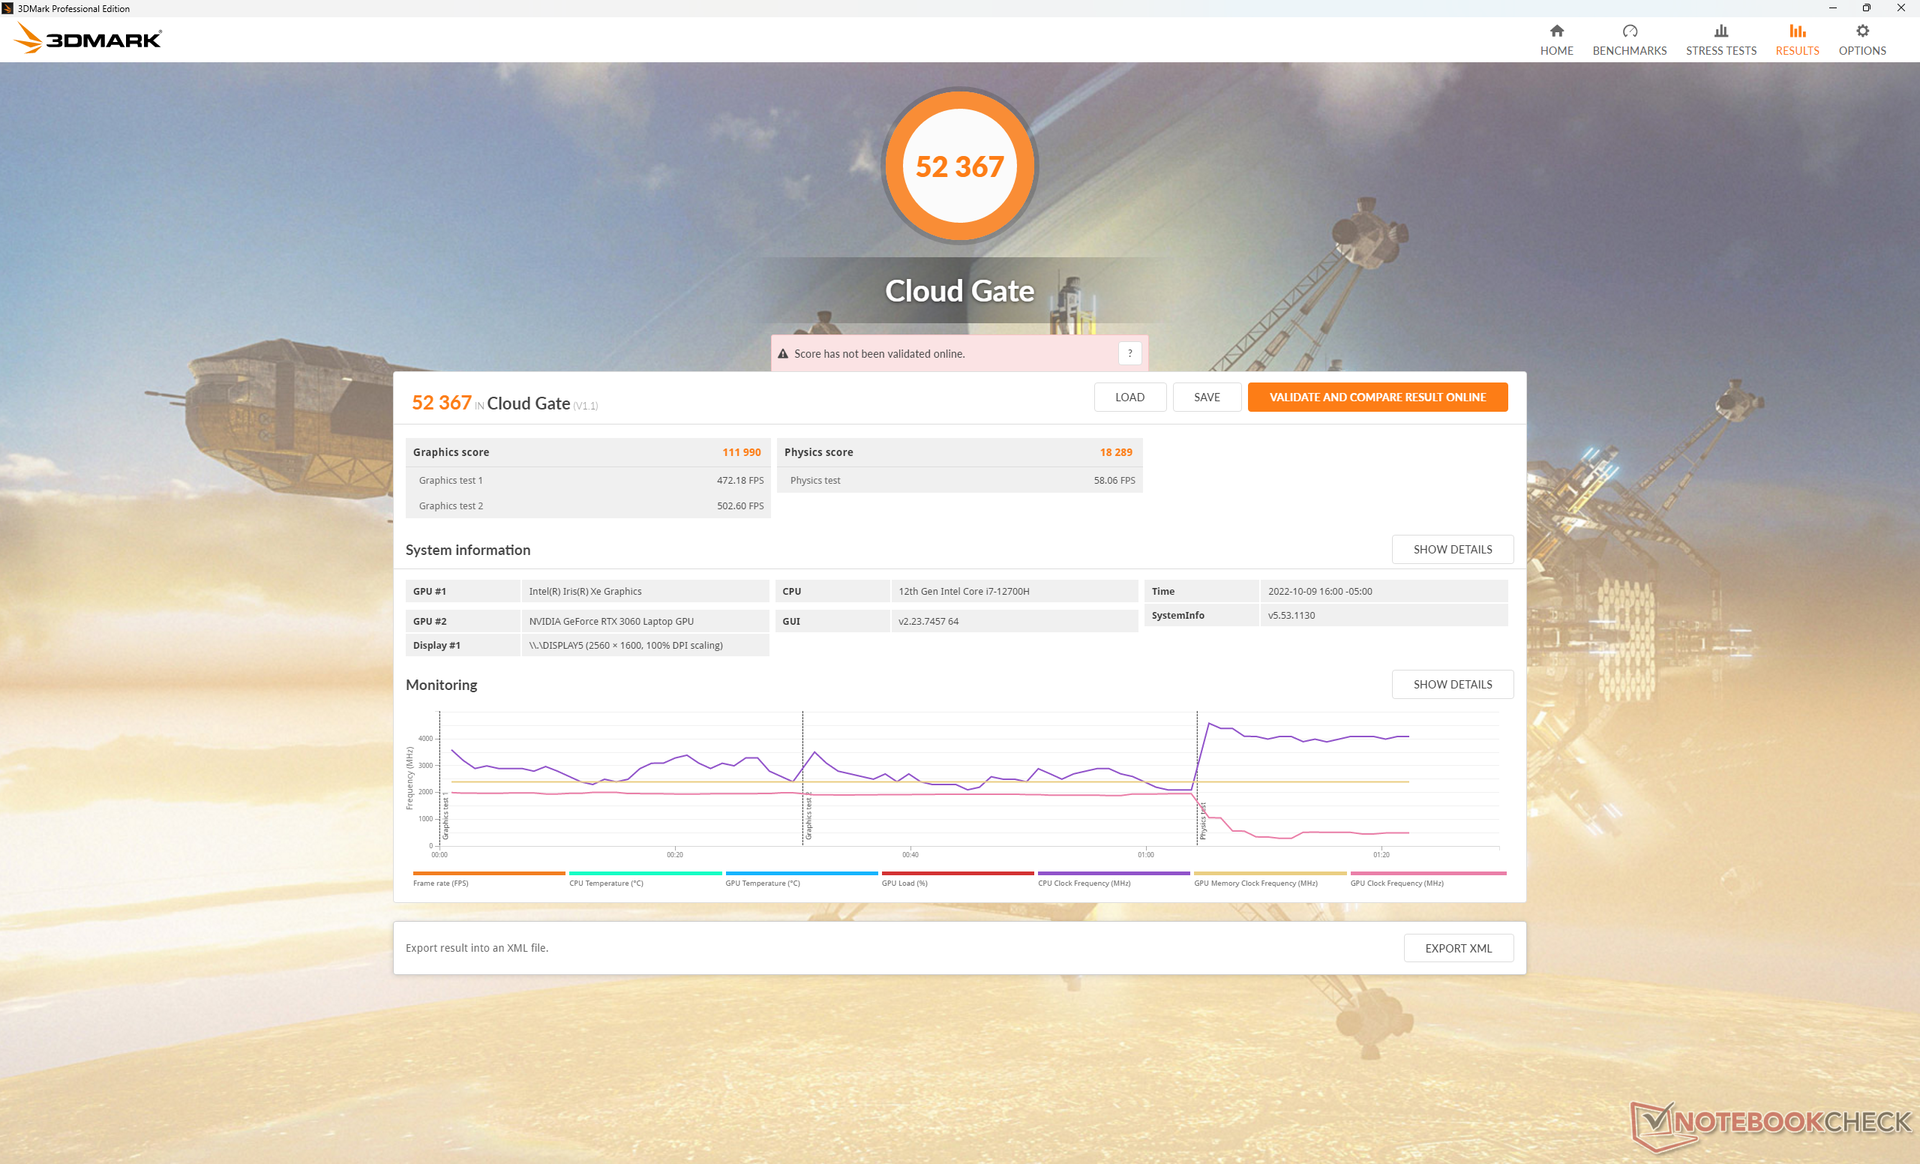
| 3DMark Cloud Gate Standard Score | 52367 points | |
| 3DMark Fire Strike Score | 19973 points | |
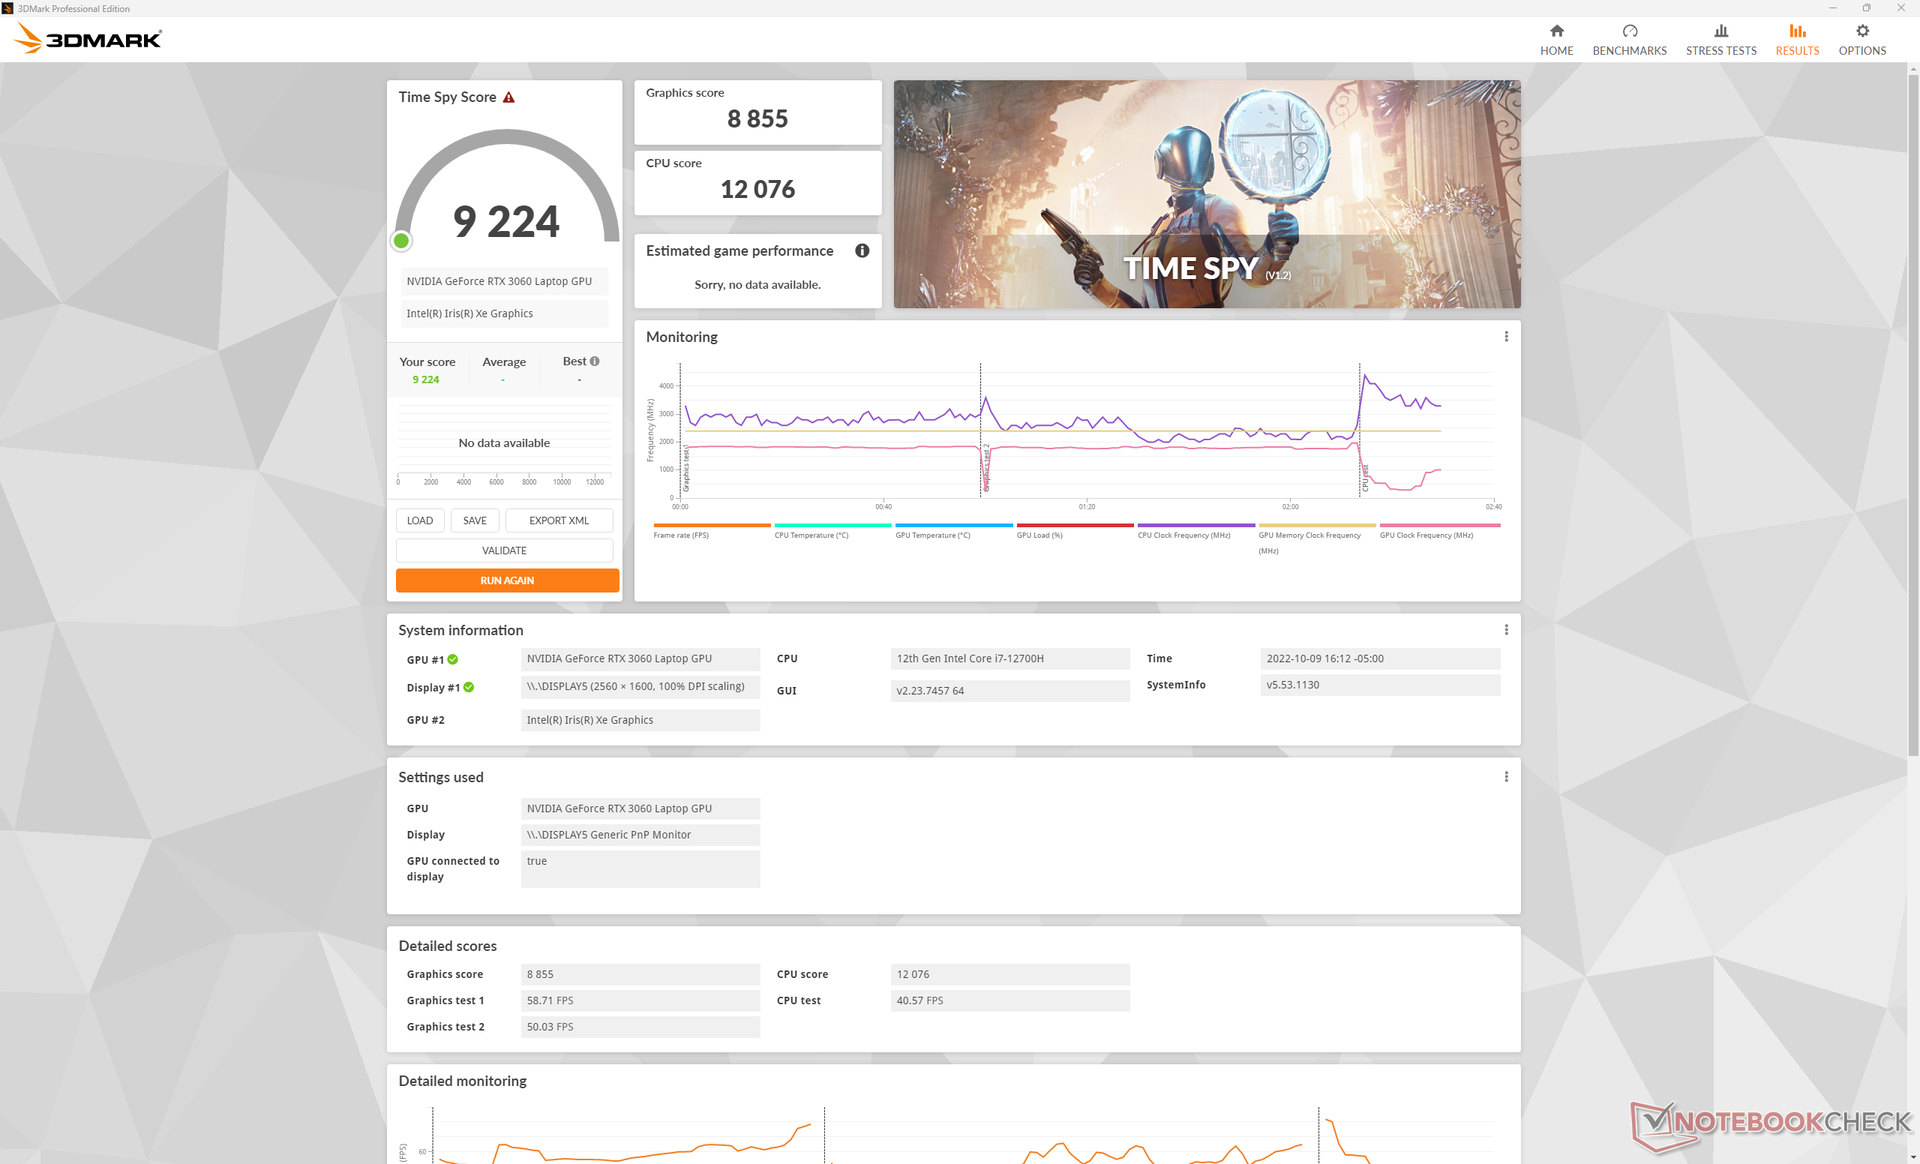
| 3DMark Time Spy Score | 9224 points | |
Aide | ||
* ... Moindre est la valeur, meilleures sont les performances
Witcher 3 FPS Chart
| Bas | Moyen | Élevé | Ultra | QHD | |
|---|---|---|---|---|---|
| GTA V (2015) | 185.6 | 179.9 | 176.2 | 108.7 | 82.1 |
| The Witcher 3 (2015) | 415.2 | 260.5 | 167.2 | 86.6 | |
| Dota 2 Reborn (2015) | 171.8 | 159.3 | 159 | 147.2 | |
| Final Fantasy XV Benchmark (2018) | 176.7 | 123.3 | 89.4 | 67.1 | |
| X-Plane 11.11 (2018) | 147.8 | 130.5 | 102.6 | ||
| Strange Brigade (2018) | 395 | 228 | 180.2 | 155.5 | 113 |
| Cyberpunk 2077 1.6 (2022) | 125.1 | 105.4 | 80.4 | 66.8 | 41.6 |
Émissions
Bruit du système - Presque jamais silencieux
Les ventilateurs internes du G16 ne tournent presque jamais au ralenti, même lorsqu'ils sont réglés sur le profil de puissance le plus bas. En mode "silencieux", par exemple, nous sommes toujours en mesure d'enregistrer un bruit de ventilateur de 28 dB(A) contre un fond silencieux de 23 dB(A). C'est suffisamment fort pour être perceptible lors de la diffusion de vidéos en continu et également plus fort que de nombreux autres ordinateurs portables de jeu dans des conditions similaires, comme le Lenovo Legion 7 16 ou le HP Victus 16.
La bonne nouvelle est que le bruit de fond élevé signifie que les ventilateurs montent en puissance plus lentement lorsque des charges plus élevées sont introduites. Lors de l'exécution de la première scène de benchmark de 3DMark 06, par exemple, le bruit du ventilateur atteignait 32 dB(A), contre 40 dB(A) ou plus sur l'Acer Swift X SFX16 HP Victus 16.
Le bruit du ventilateur se stabilise à 45,7 dB(A) et 48,3 dB(A) en mode équilibré et en mode performance Witcher 3 en mode équilibré et en mode performance, respectivement.
Degré de la nuisance sonore
| Au repos |
| 28.3 / 28.8 / 28.9 dB(A) |
| Fortement sollicité |
| 32.4 / 48.1 dB(A) |
 | ||
30 dB silencieux 40 dB(A) audible 50 dB(A) bruyant |
||
min: | ||
| Dell G16 7620 GeForce RTX 3060 Laptop GPU, i7-12700H, WDC PC SN810 512GB | Lenovo Legion 7 16ARHA7 Radeon RX 6850M XT, R9 6900HX, Samsung PM9A1 MZVL22T0HBLB | HP Victus 16-e0145ng GeForce RTX 3050 Ti Laptop GPU, R5 5600H, Samsung SSD PM981a MZVLB512HBJQ | Asus ROG Zephyrus M16 GU603H GeForce RTX 3070 Laptop GPU, i9-11900H, Samsung PM9A1 MZVL22T0HBLB | Lenovo Legion 5 Pro 16IAH7H GeForce RTX 3060 Laptop GPU, i7-12700H, 2x Samsung PM9A1 MZVL21T0HCLR (RAID 0) | Acer Swift X SFX16-51G-5388 GeForce RTX 3050 4GB Laptop GPU, i5-11320H, Samsung PM991 MZVLQ512HBLU | |
|---|---|---|---|---|---|---|
| Noise | 8% | -9% | -17% | -14% | -1% | |
| arrêt / environnement * (dB) | 23.2 | 22.8 2% | 26 -12% | 25 -8% | 24.6 -6% | 25.4 -9% |
| Idle Minimum * (dB) | 28.3 | 23 19% | 26 8% | 25 12% | 28.7 -1% | 25.4 10% |
| Idle Average * (dB) | 28.8 | 23 20% | 28 3% | 31 -8% | 32 -11% | 25.4 12% |
| Idle Maximum * (dB) | 28.9 | 23 20% | 34 -18% | 42 -45% | 32 -11% | 27.8 4% |
| Load Average * (dB) | 32.4 | 26.8 17% | 44 -36% | 48 -48% | 45.2 -40% | 41 -27% |
| Witcher 3 ultra * (dB) | 48.3 | 54.3 -12% | 48 1% | 52 -8% | ||
| Load Maximum * (dB) | 48.1 | 54.2 -13% | 53 -10% | 56 -16% | 54.4 -13% | 47 2% |
* ... Moindre est la valeur, meilleures sont les performances
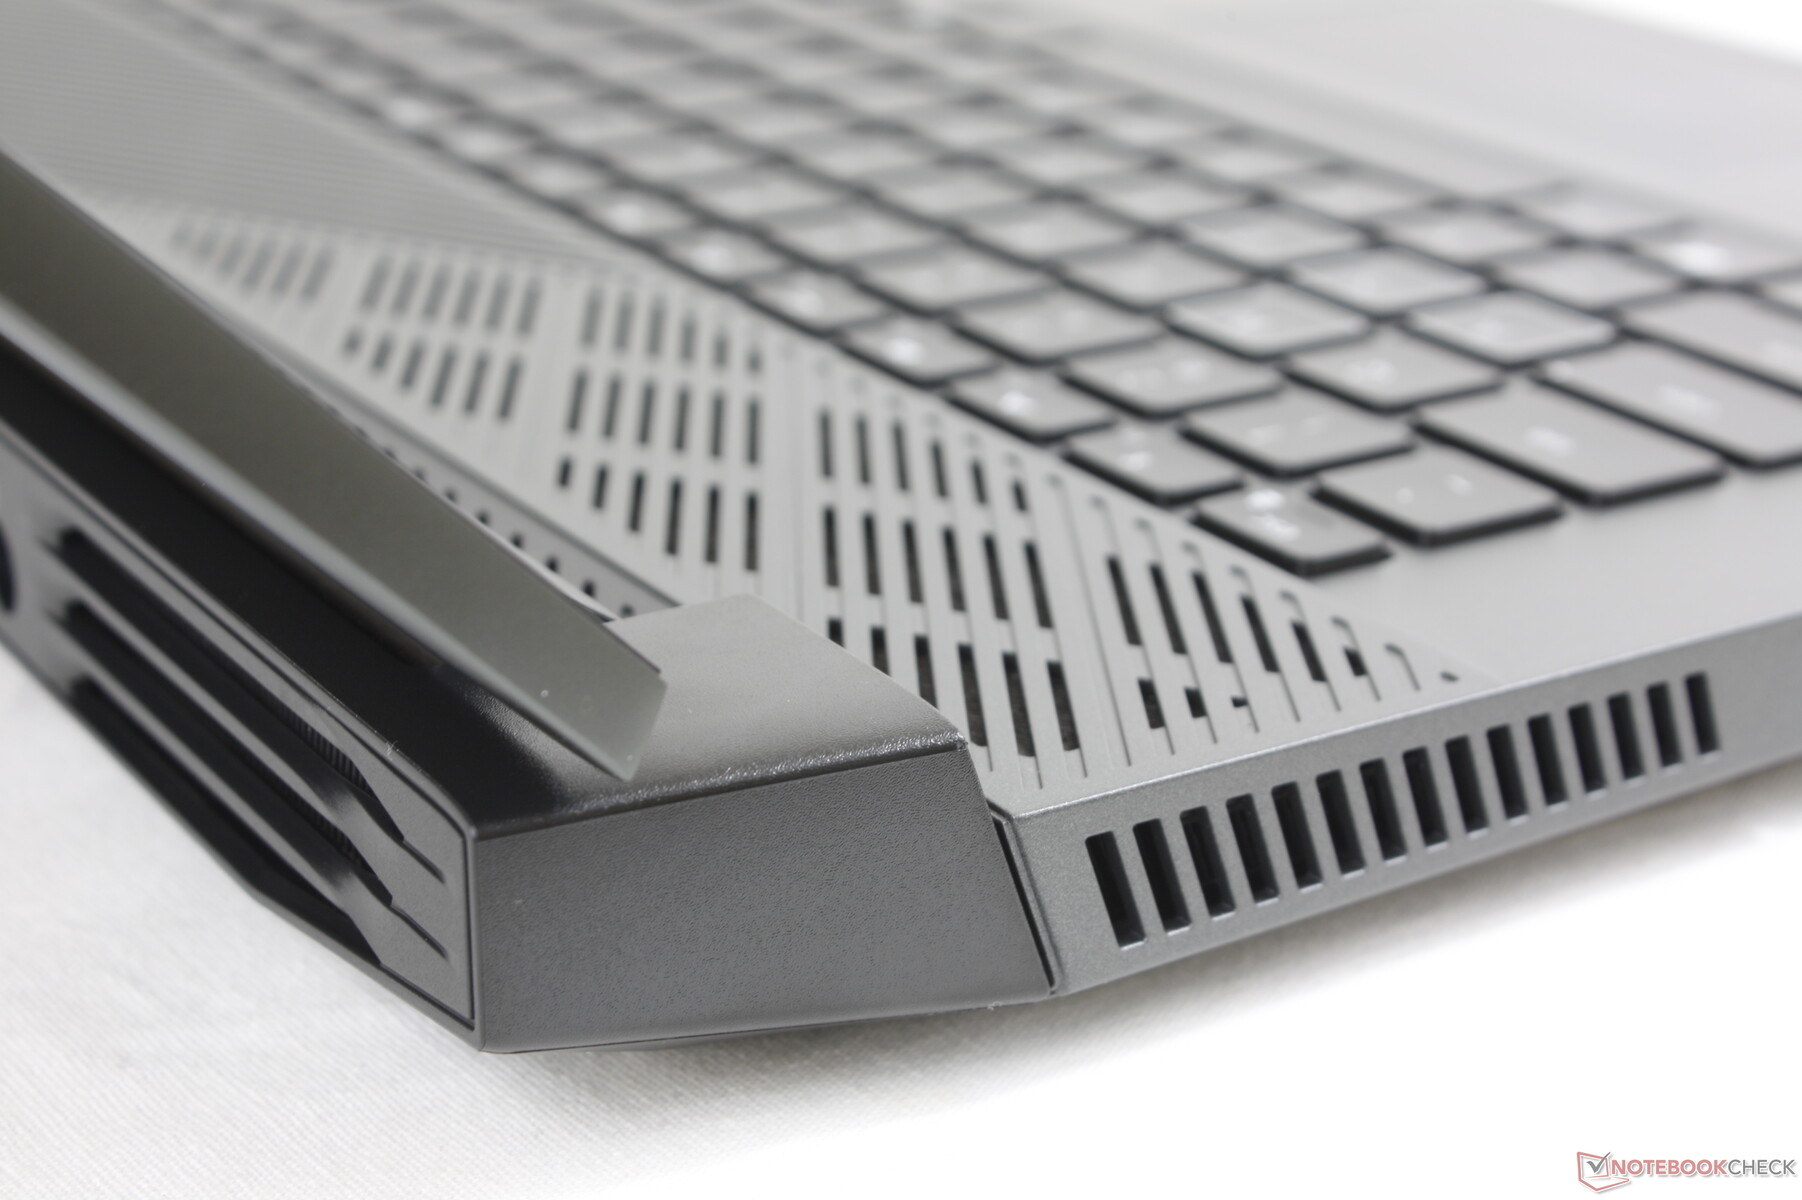
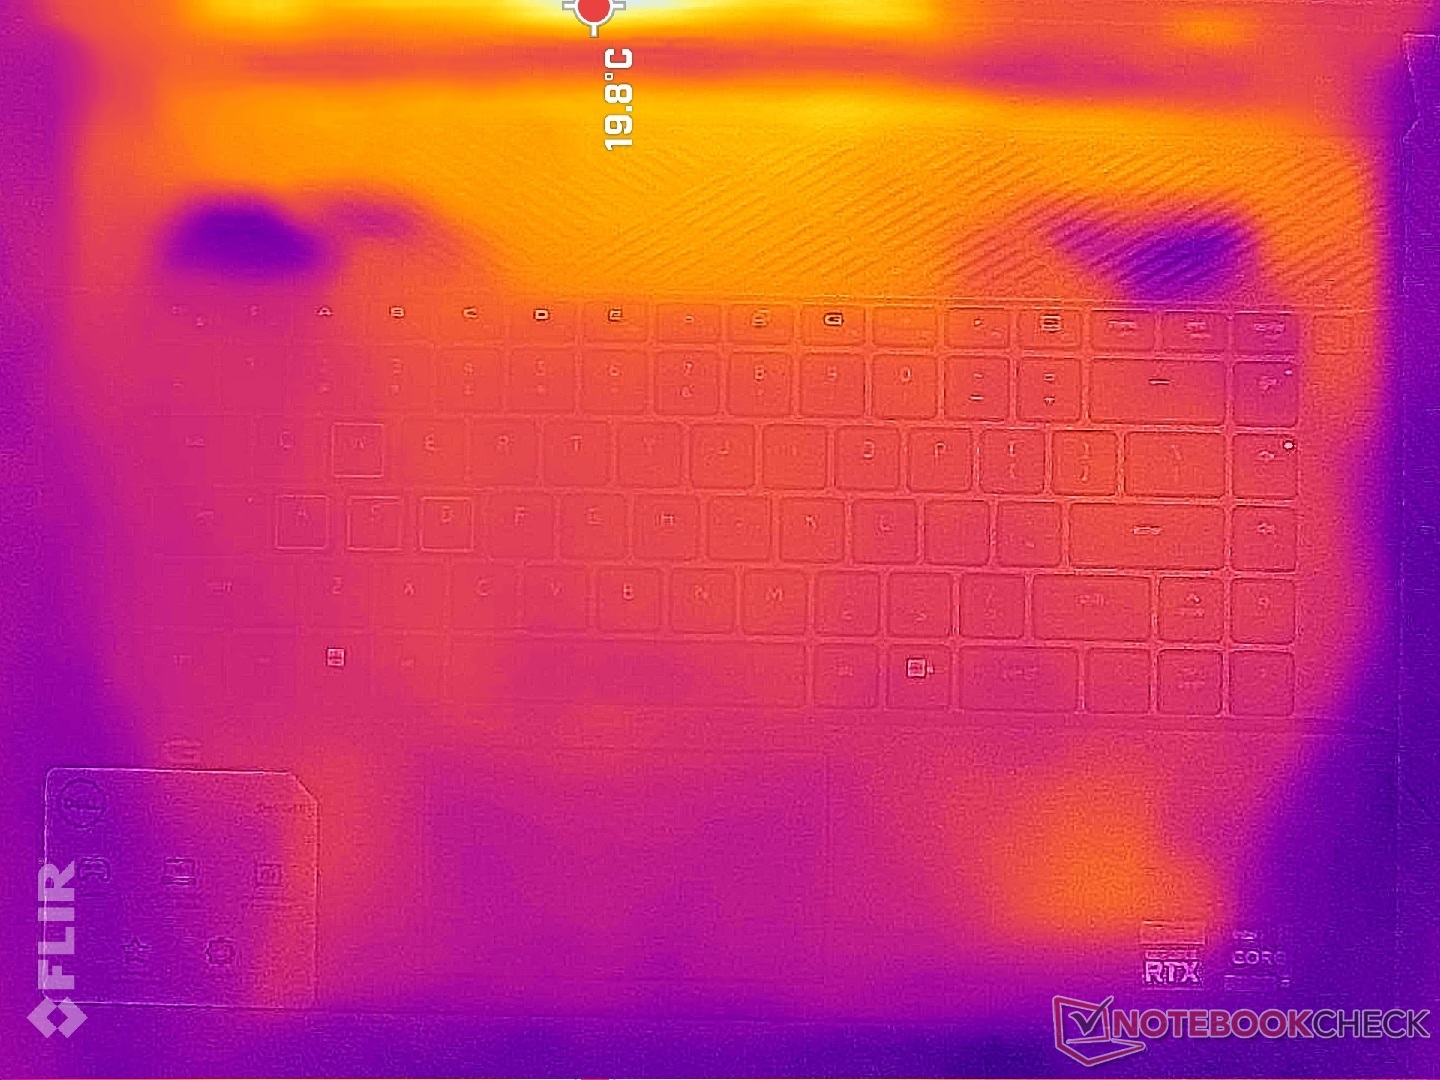
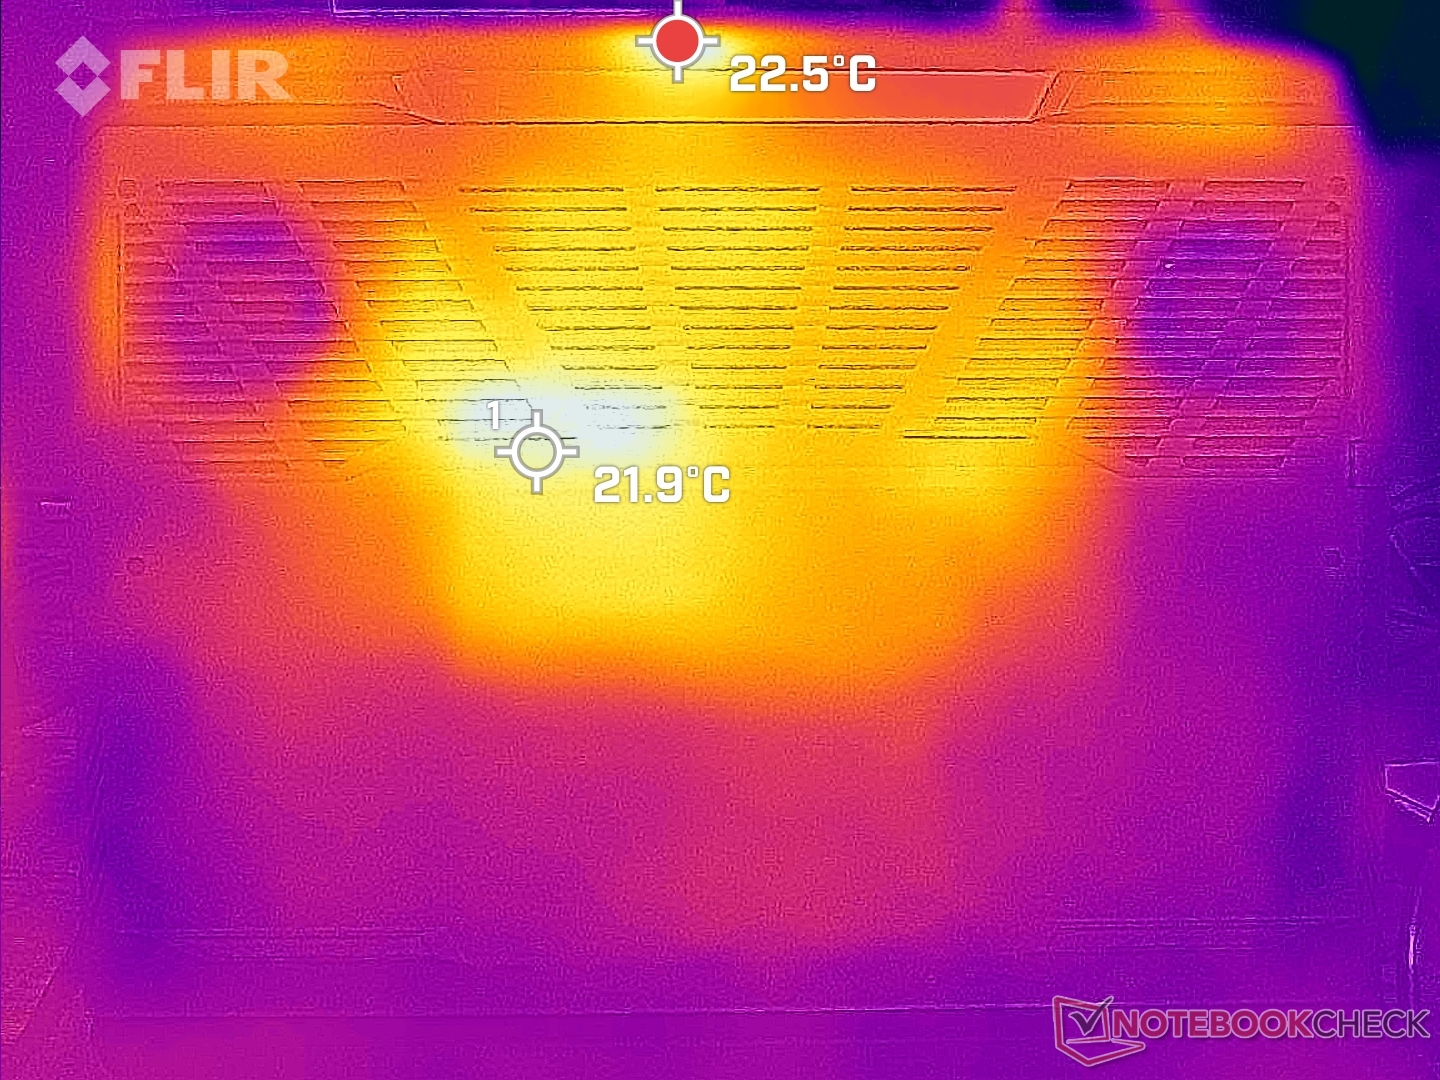
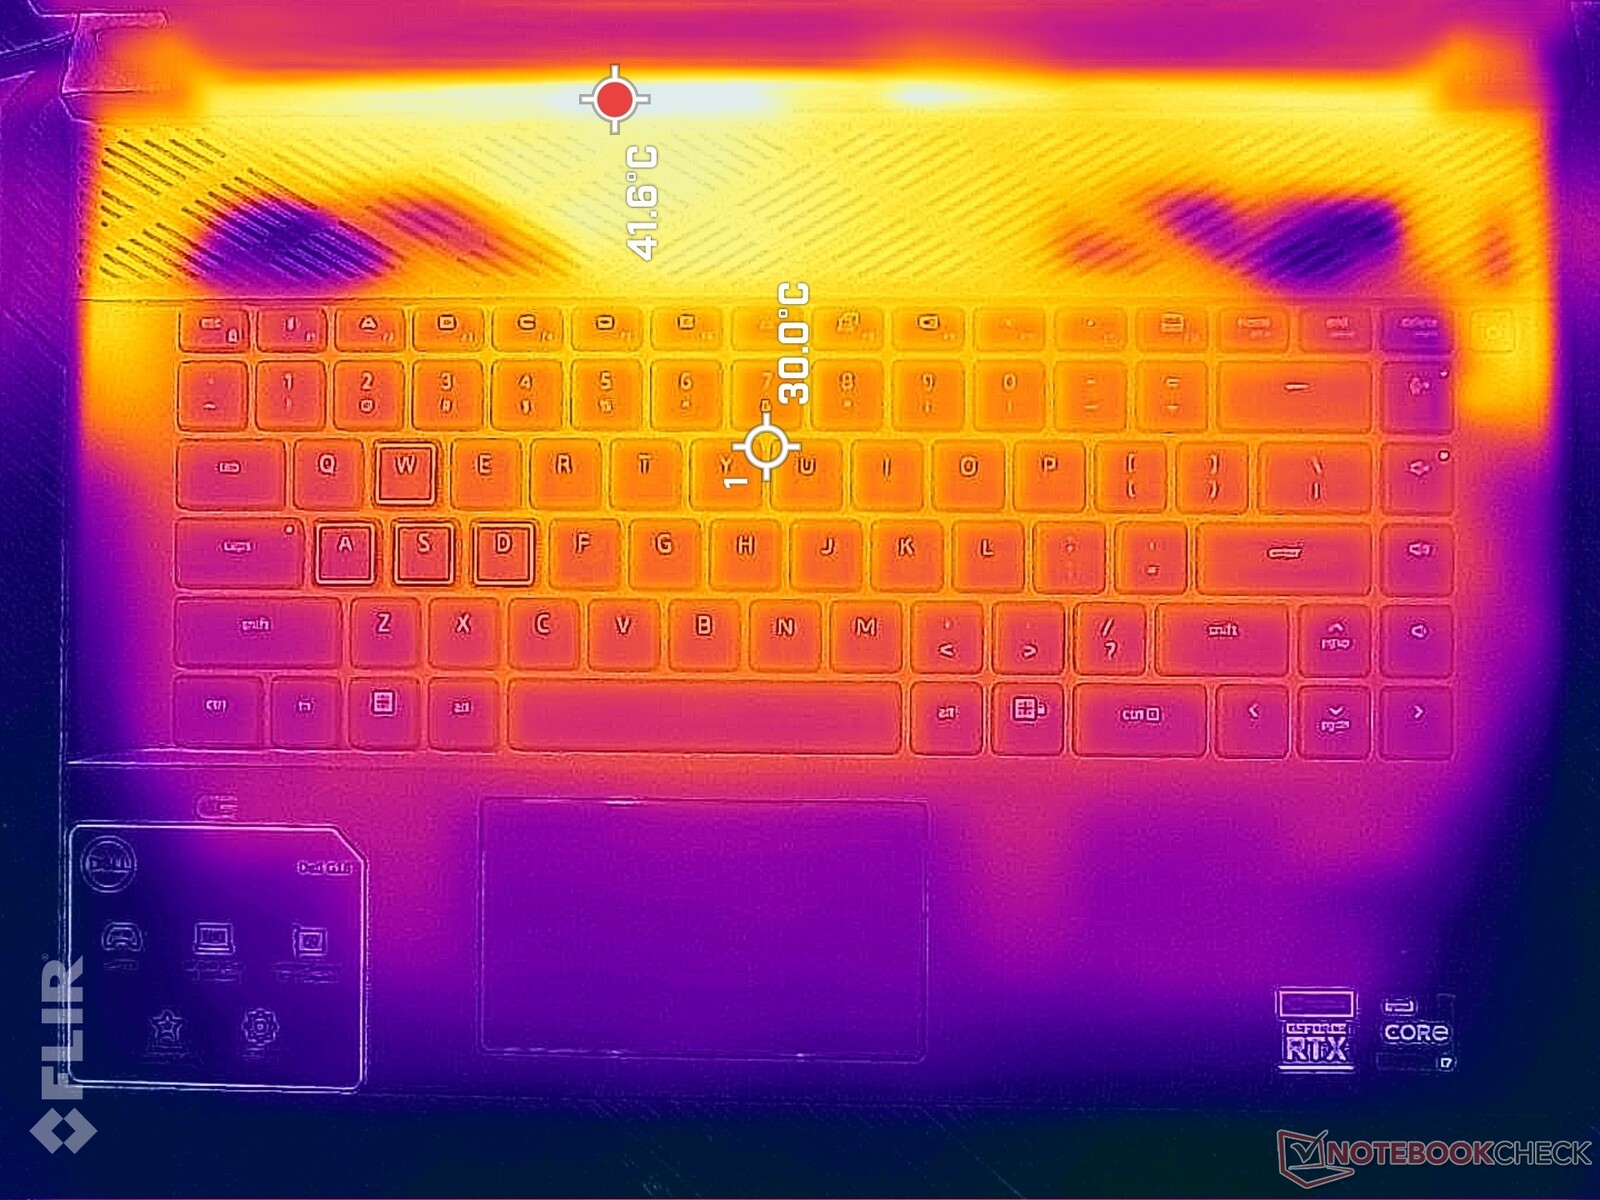
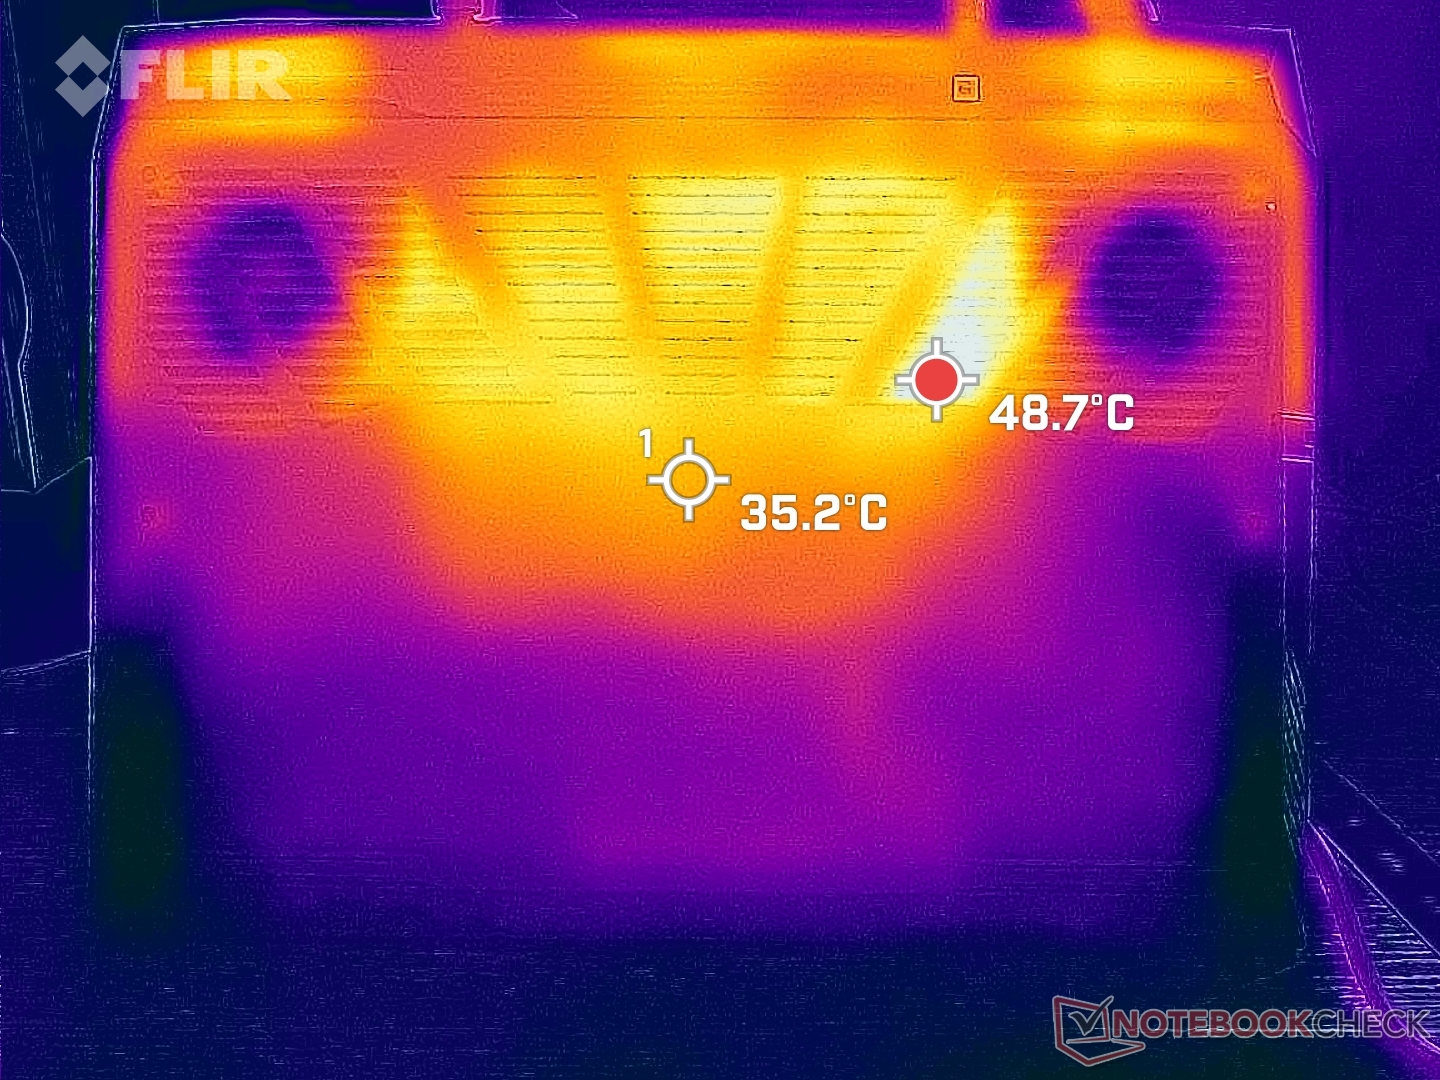
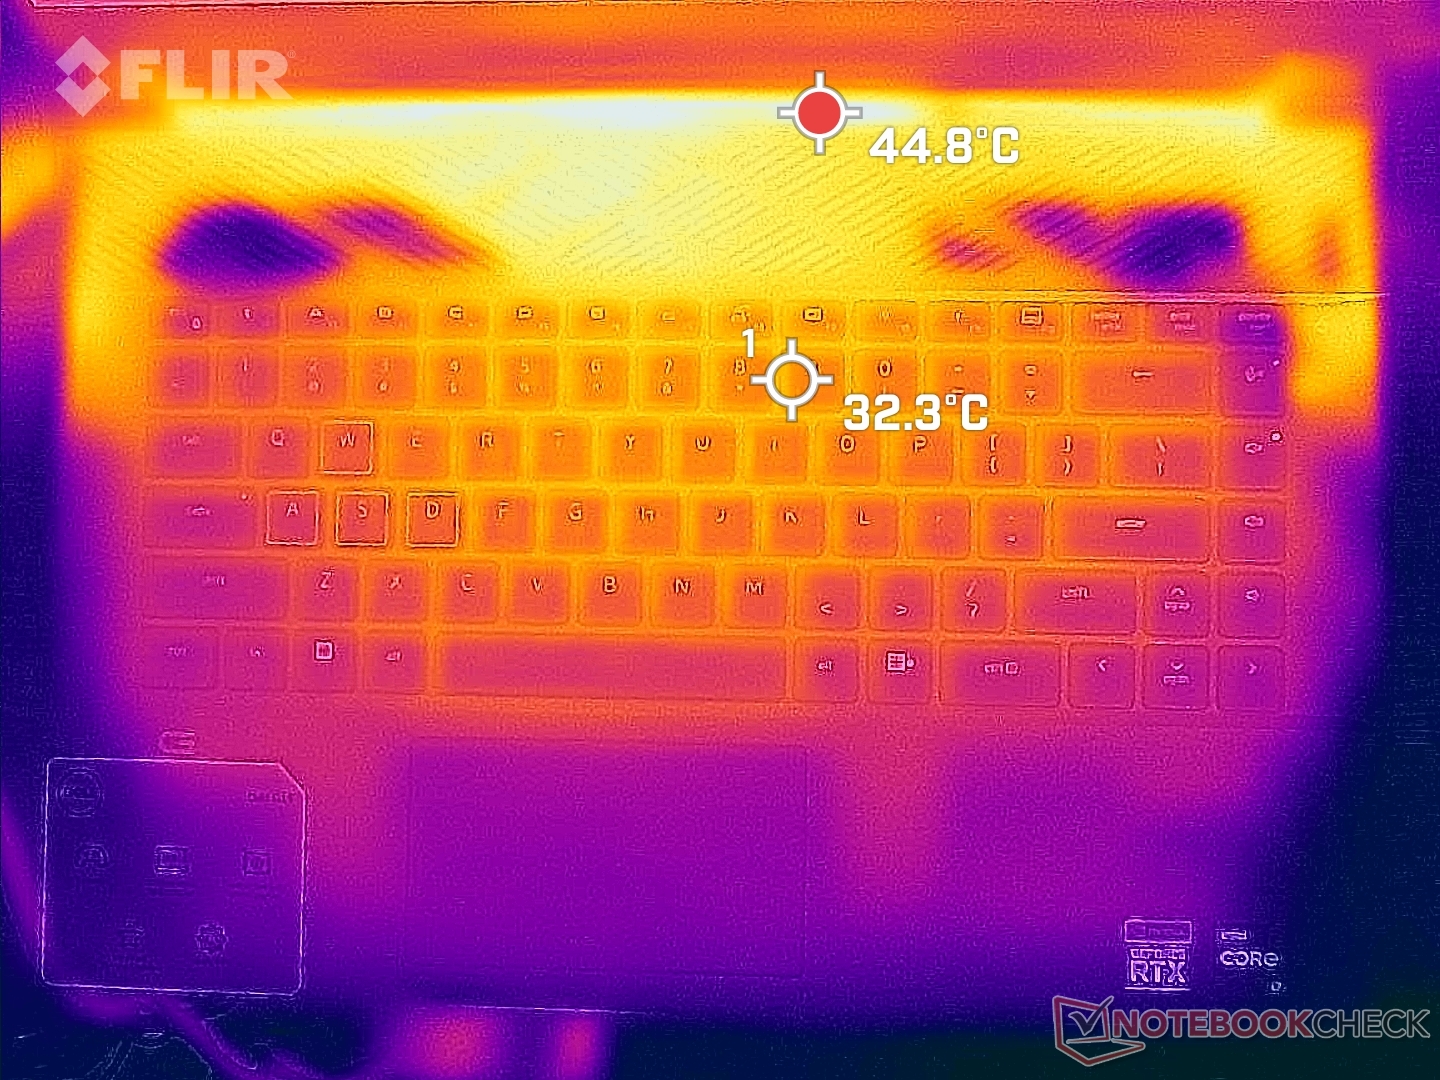
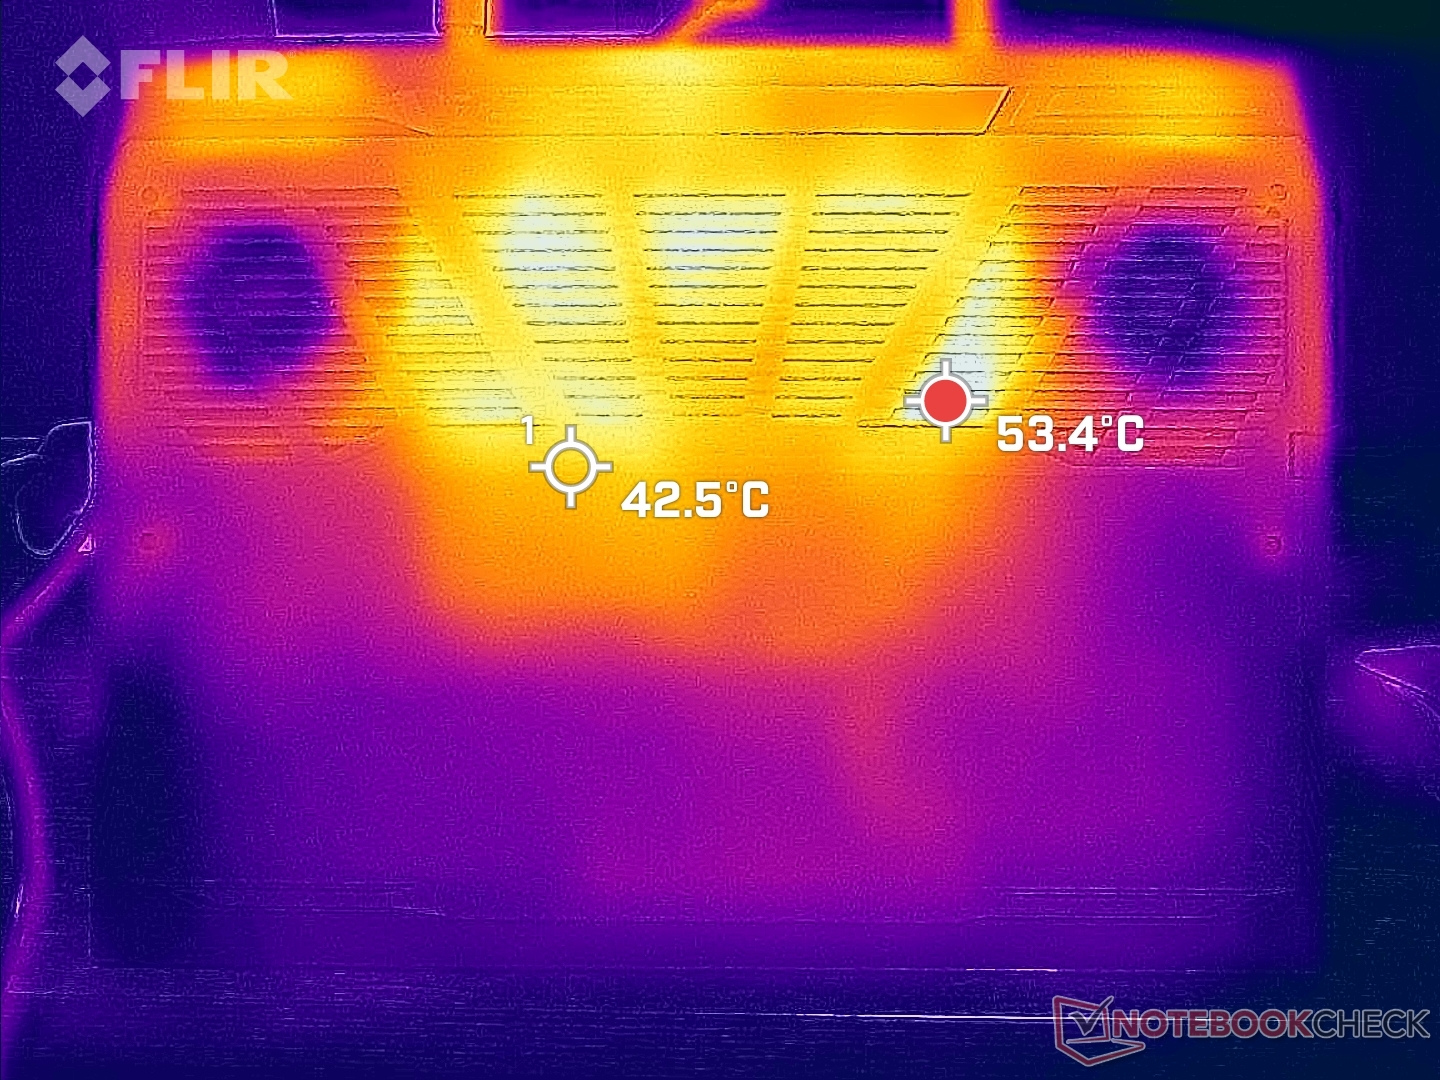
Température - Très chaud vers l'arrière
Les températures de surface lors des jeux peuvent atteindre jusqu'à 48 C et 51 C sur le dessus et le dessous, respectivement, contre 54 C et 46 C sur l'écran du HP Victus 16 dans des conditions similaires. Les points chauds se situent heureusement vers l'arrière et loin des touches du clavier ou des zones frontales. Ainsi, les repose-paumes et les touches ne deviennent jamais inconfortablement chauds lorsque vous jouez.
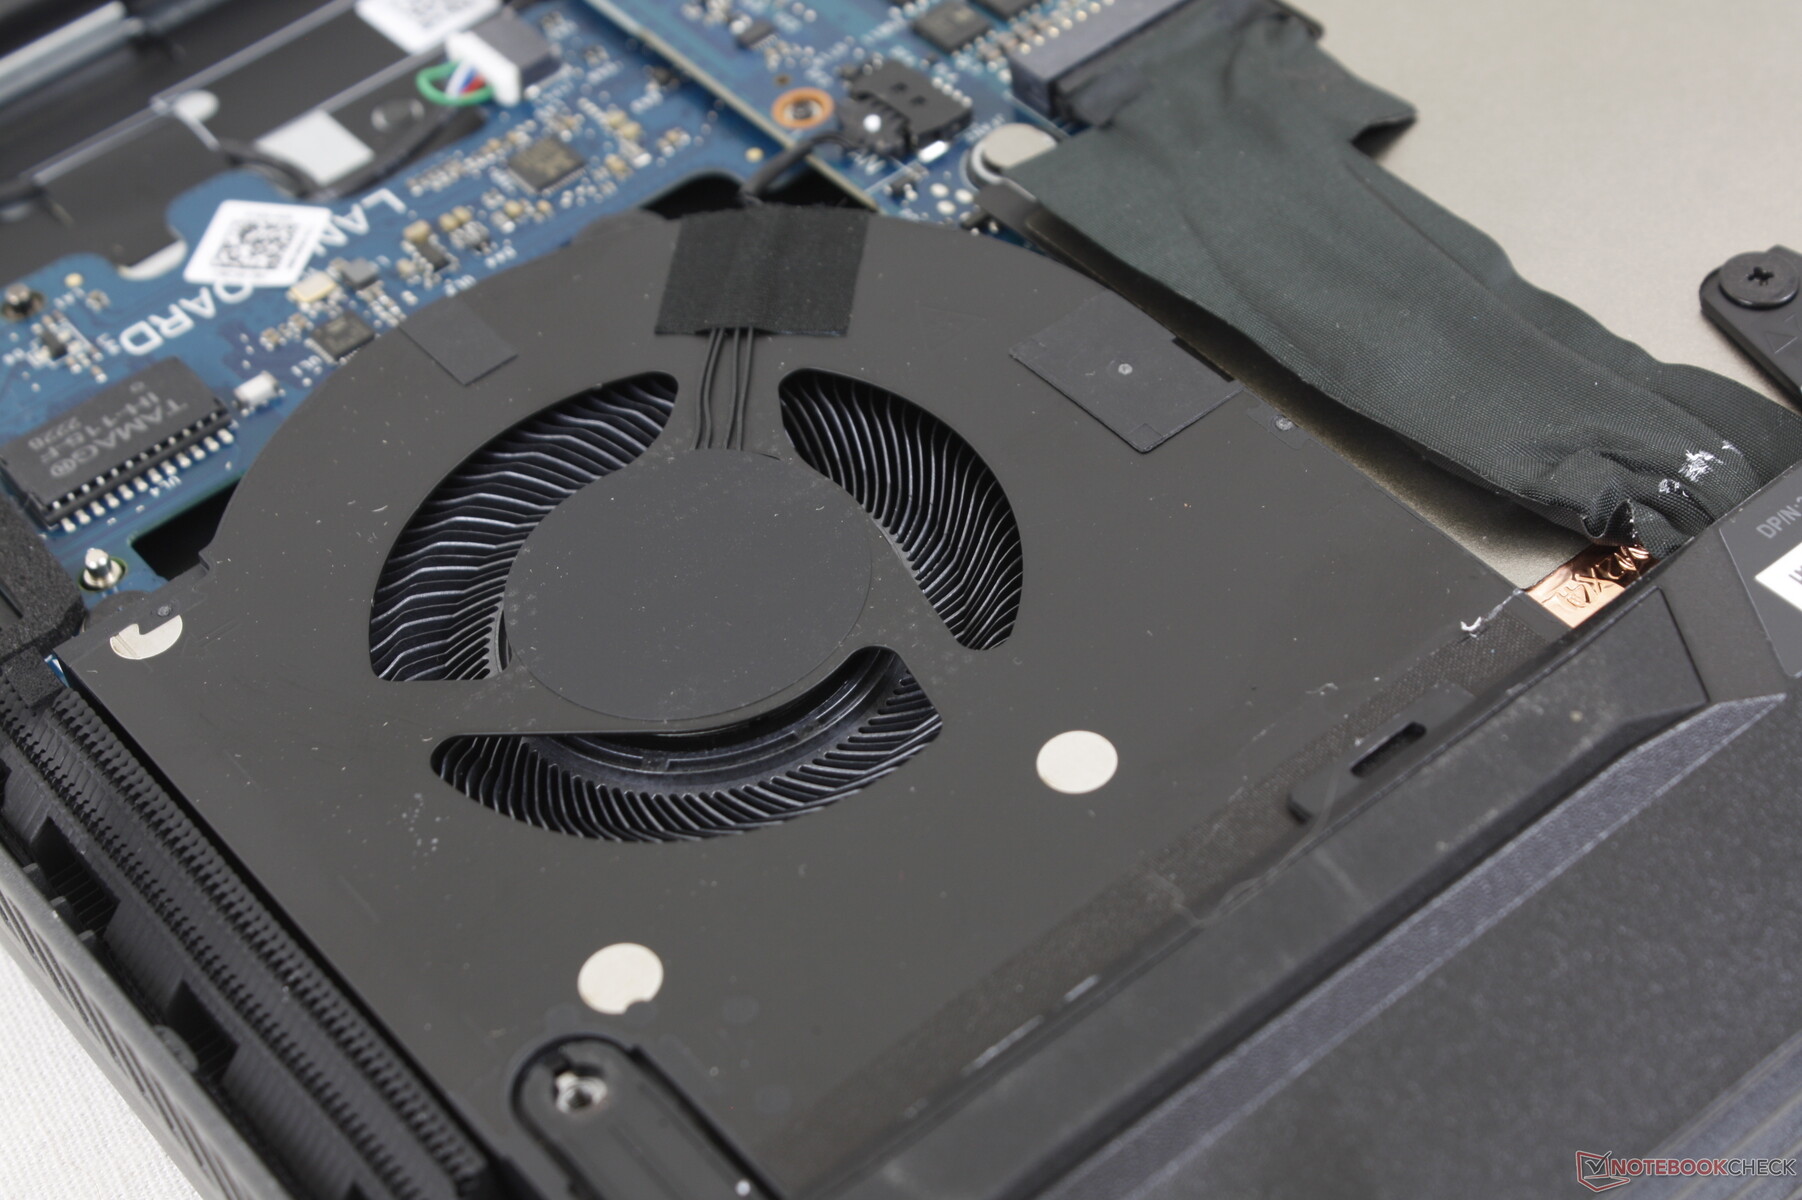
Une grande partie de l'arrière est consacrée à la ventilation, comme en témoignent les nombreuses grilles sur tous les côtés de la base.
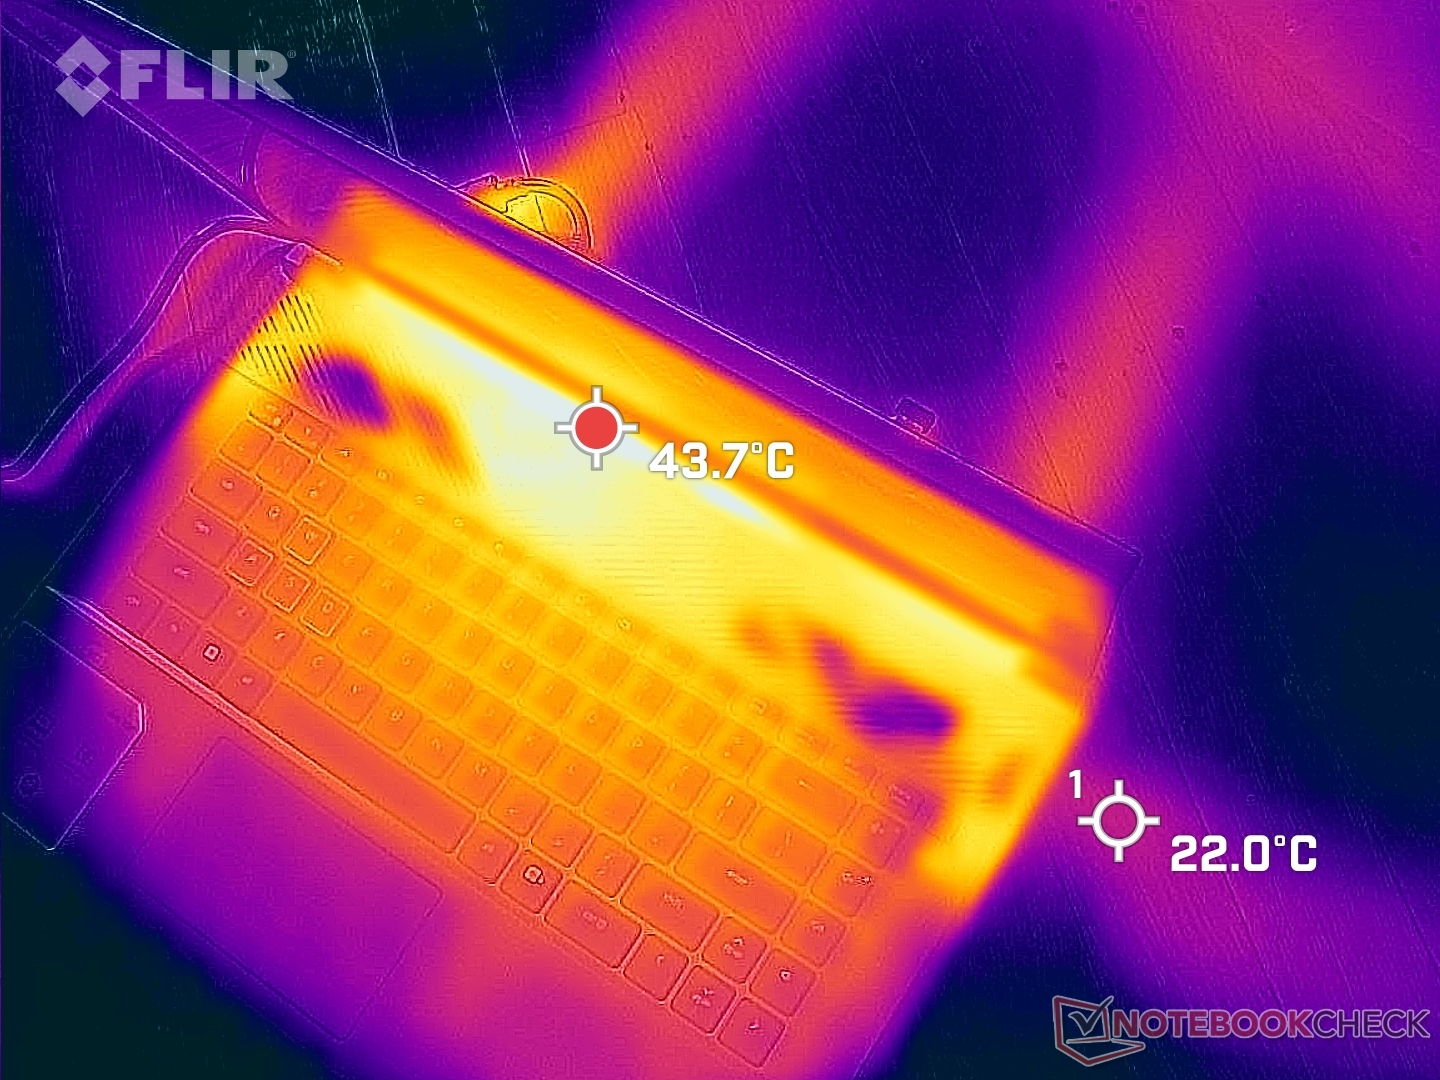
(-) La température maximale du côté supérieur est de 47.6 °C / 118 F, par rapport à la moyenne de 40.4 °C / 105 F, allant de 21.2 à 68.8 °C pour la classe Gaming.
(-) Le fond chauffe jusqu'à un maximum de 54 °C / 129 F, contre une moyenne de 43.2 °C / 110 F
(+) En utilisation inactive, la température moyenne du côté supérieur est de 21.8 °C / 71 F, par rapport à la moyenne du dispositif de 33.9 °C / 93 F.
(±) En jouant à The Witcher 3, la température moyenne du côté supérieur est de 33.7 °C / 93 F, alors que la moyenne de l'appareil est de 33.9 °C / 93 F.
(+) Les repose-poignets et le pavé tactile sont plus froids que la température de la peau avec un maximum de 30.2 °C / 86.4 F et sont donc froids au toucher.
(±) La température moyenne de la zone de l'appui-paume de dispositifs similaires était de 28.8 °C / 83.8 F (-1.4 °C / #-2.6 F).
| Dell G16 7620 Intel Core i7-12700H, NVIDIA GeForce RTX 3060 Laptop GPU | Lenovo Legion 7 16ARHA7 AMD Ryzen 9 6900HX, AMD Radeon RX 6850M XT | HP Victus 16-e0145ng AMD Ryzen 5 5600H, NVIDIA GeForce RTX 3050 Ti Laptop GPU | Asus ROG Zephyrus M16 GU603H Intel Core i9-11900H, NVIDIA GeForce RTX 3070 Laptop GPU | Lenovo Legion 5 Pro 16IAH7H Intel Core i7-12700H, NVIDIA GeForce RTX 3060 Laptop GPU | Acer Swift X SFX16-51G-5388 Intel Core i5-11320H, NVIDIA GeForce RTX 3050 4GB Laptop GPU | |
|---|---|---|---|---|---|---|
| Heat | -10% | -26% | -35% | -19% | -15% | |
| Maximum Upper Side * (°C) | 47.6 | 37.2 22% | 54 -13% | 52 -9% | 45.8 4% | 52.4 -10% |
| Maximum Bottom * (°C) | 54 | 43 20% | 47 13% | 53 2% | 66.3 -23% | 50 7% |
| Idle Upper Side * (°C) | 23 | 34 -48% | 41 -78% | 38 -65% | 30.4 -32% | 30.3 -32% |
| Idle Bottom * (°C) | 24.6 | 32.8 -33% | 31 -26% | 41 -67% | 30.4 -24% | 30.4 -24% |
* ... Moindre est la valeur, meilleures sont les performances
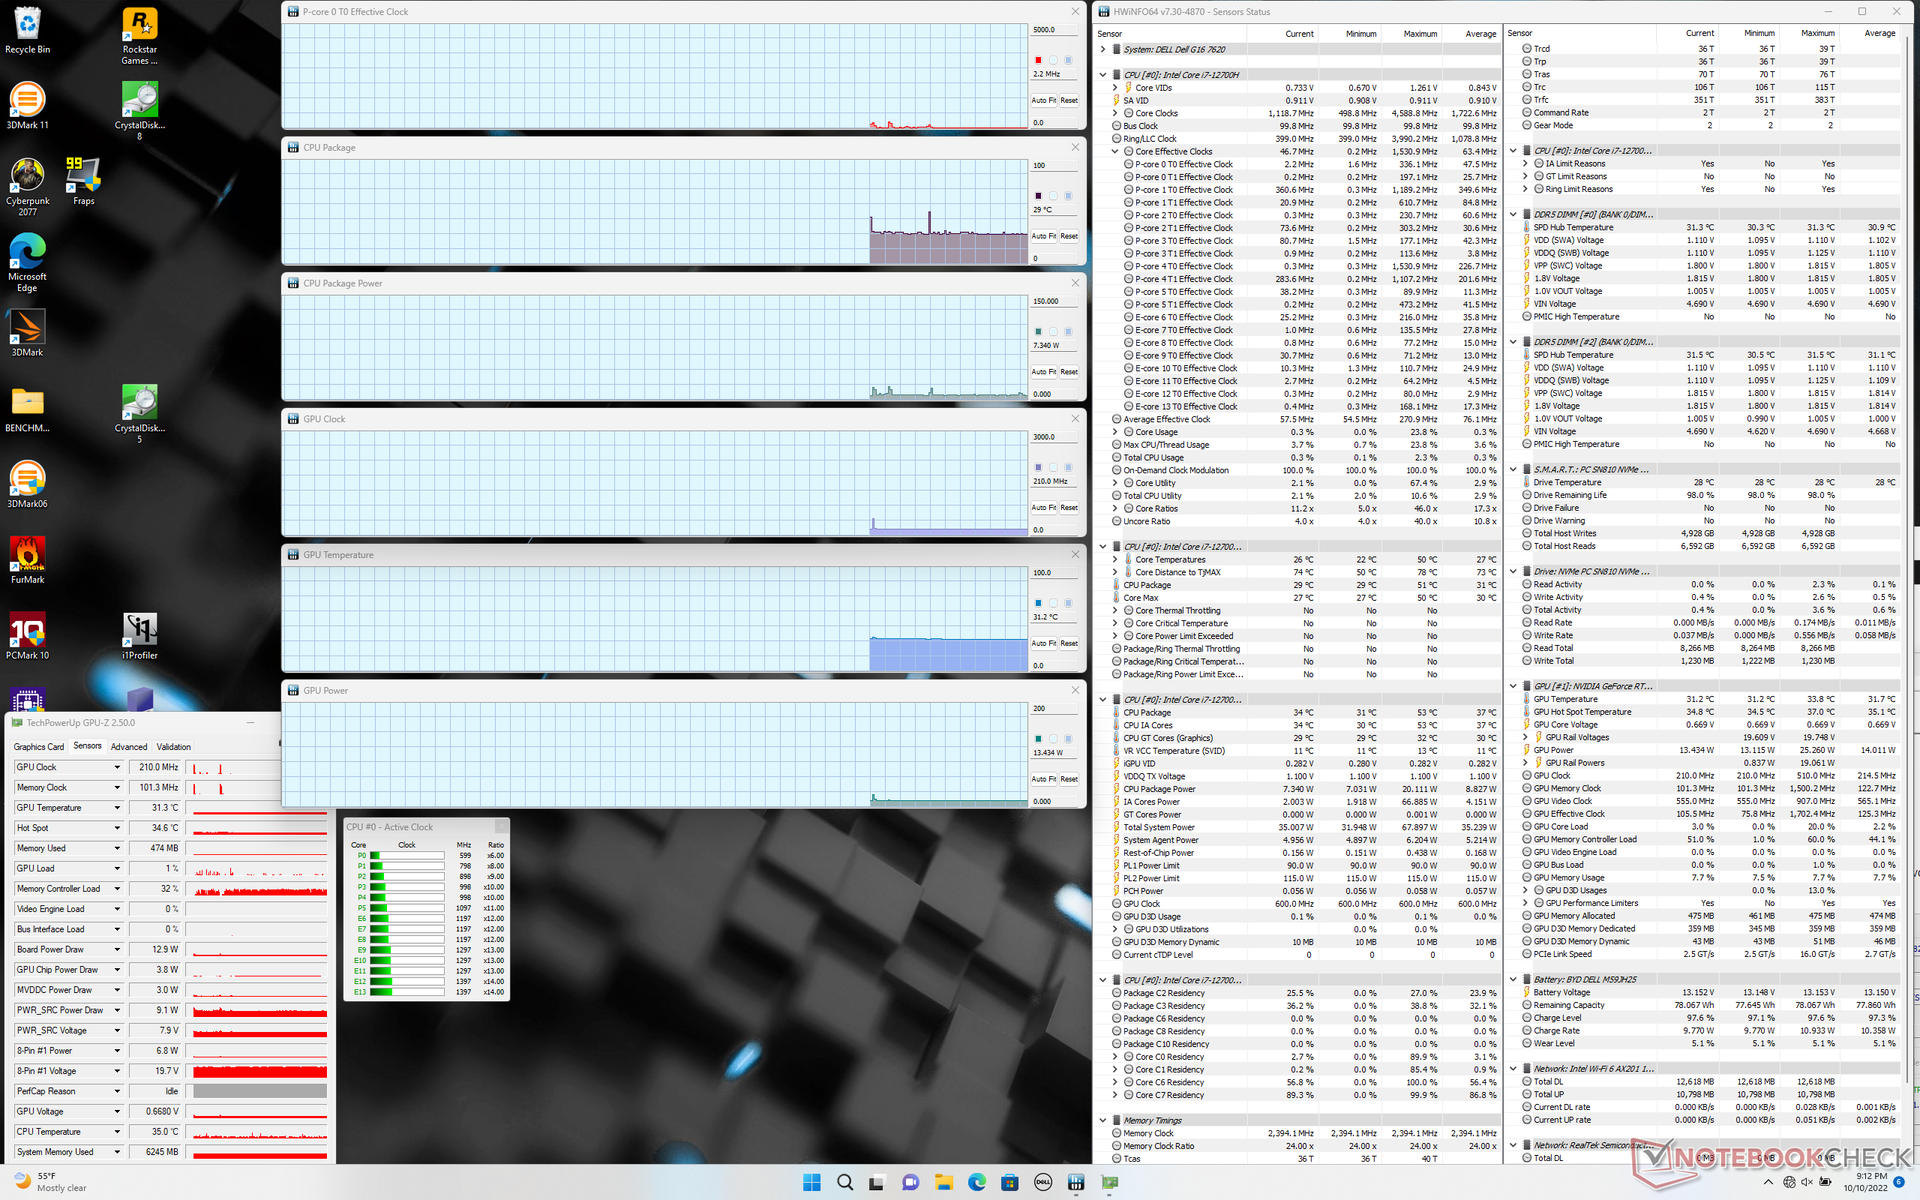
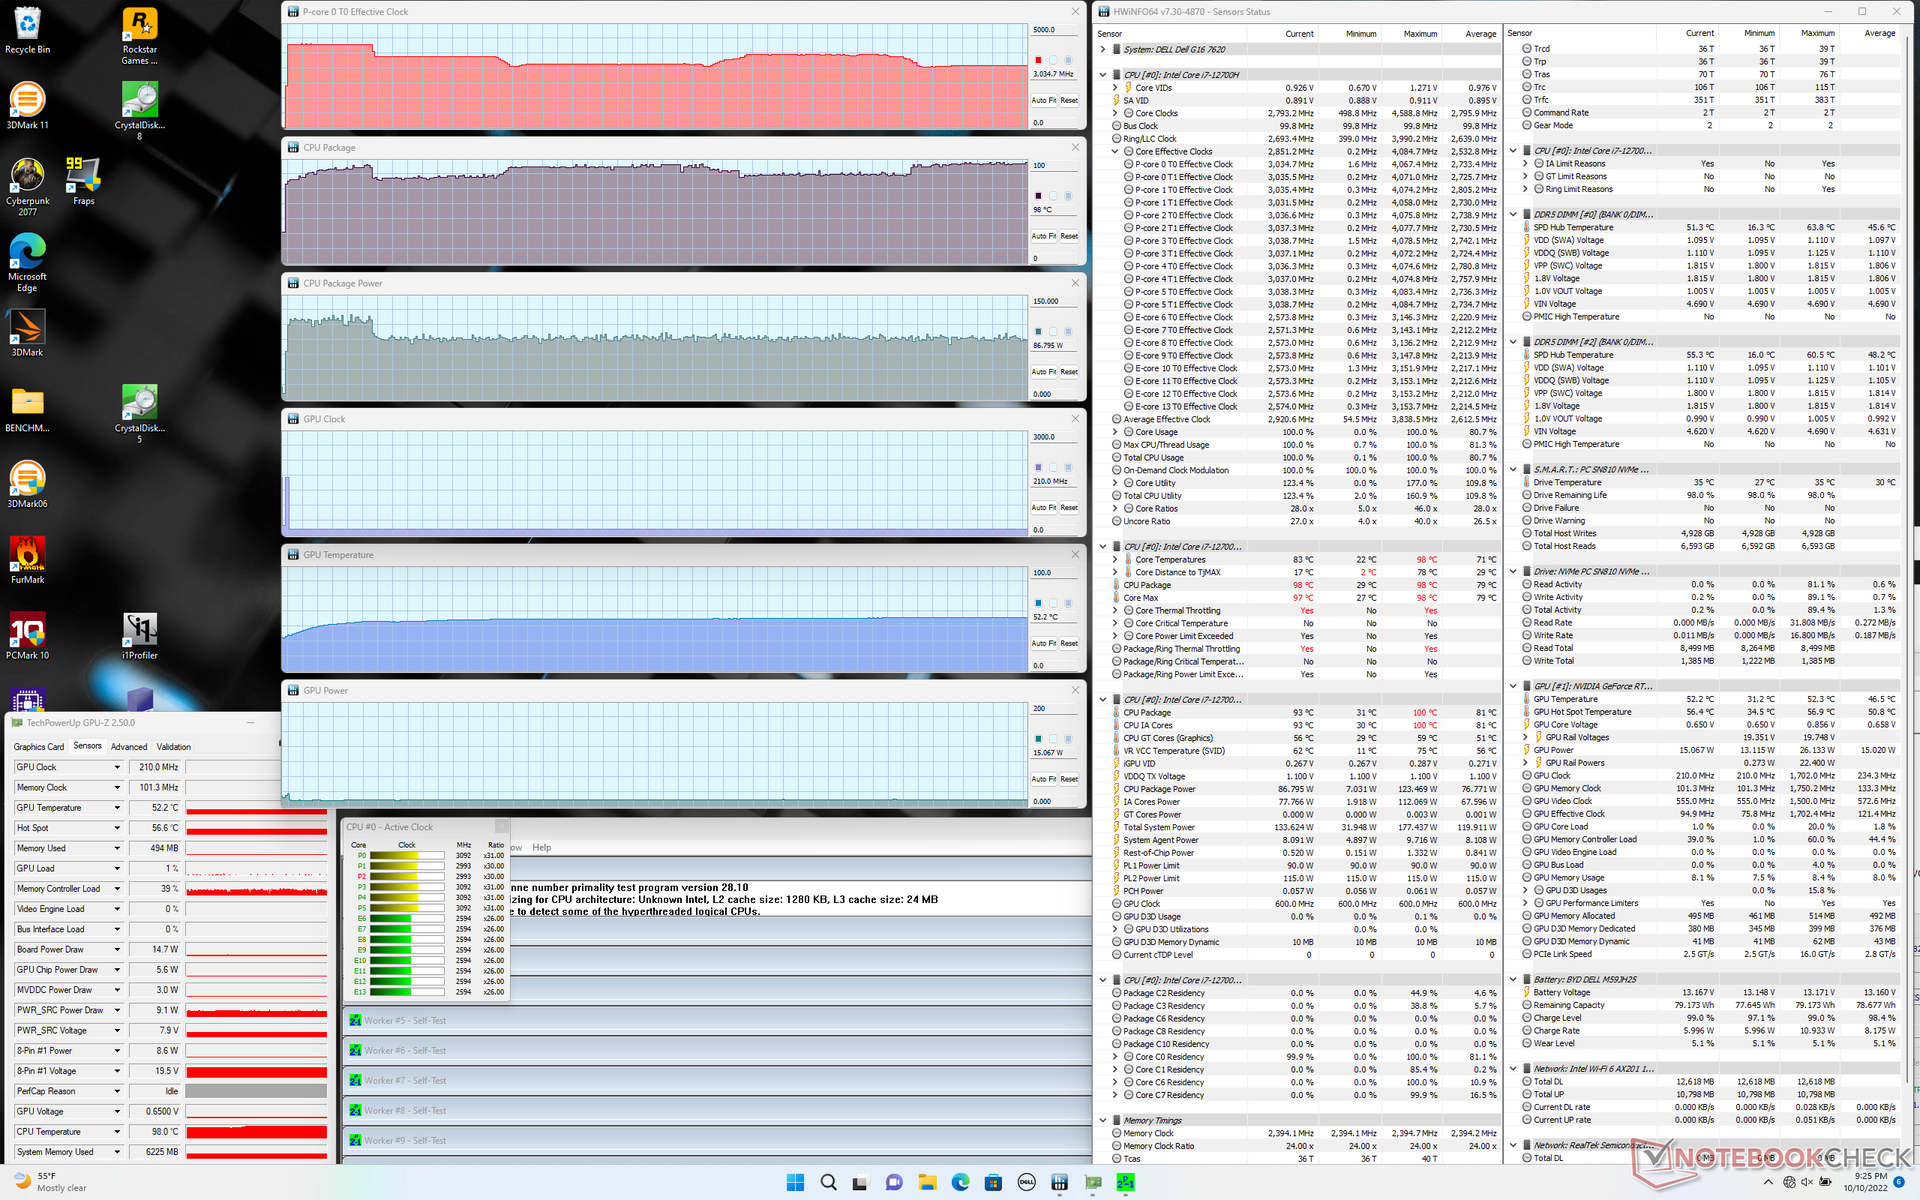
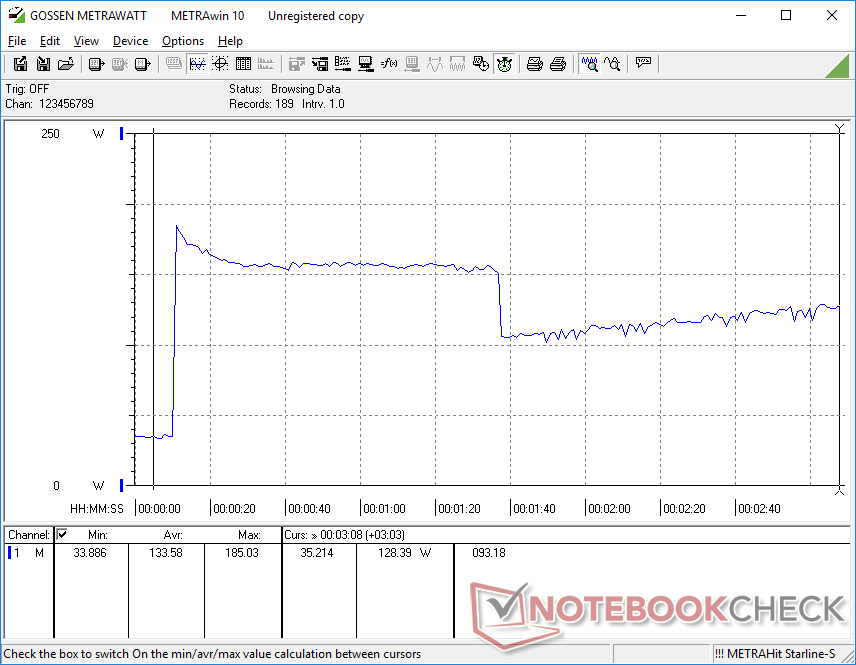
Test de stress
La température du CPU devient très élevée lorsque le système est sollicité. Lors de l'exécution de Prime95, par exemple, les fréquences d'horloge et la consommation d'énergie de la carte augmenteraient jusqu'à 4,1 GHz et 117 W, respectivement, et dureraient environ une minute à 99 C. Le processeur redescendrait ensuite dans la plage de 3,1 à 3,5 GHz et à une consommation d'énergie plus faible de 88 W afin d'éviter que les températures du cœur n'atteignent 100 C. En comparaison, l'exécution de ce même test sur l'imprimante HP Envy 16 avec le même processeur Core i7-12700H et le même GPU GeForce, la température du cœur ne serait que de 66 °C. La température déjà élevée du cœur du G16 suggère que le Core i9-12900H, plus coûteux, n'apportera au mieux que des améliorations mineures des performances.
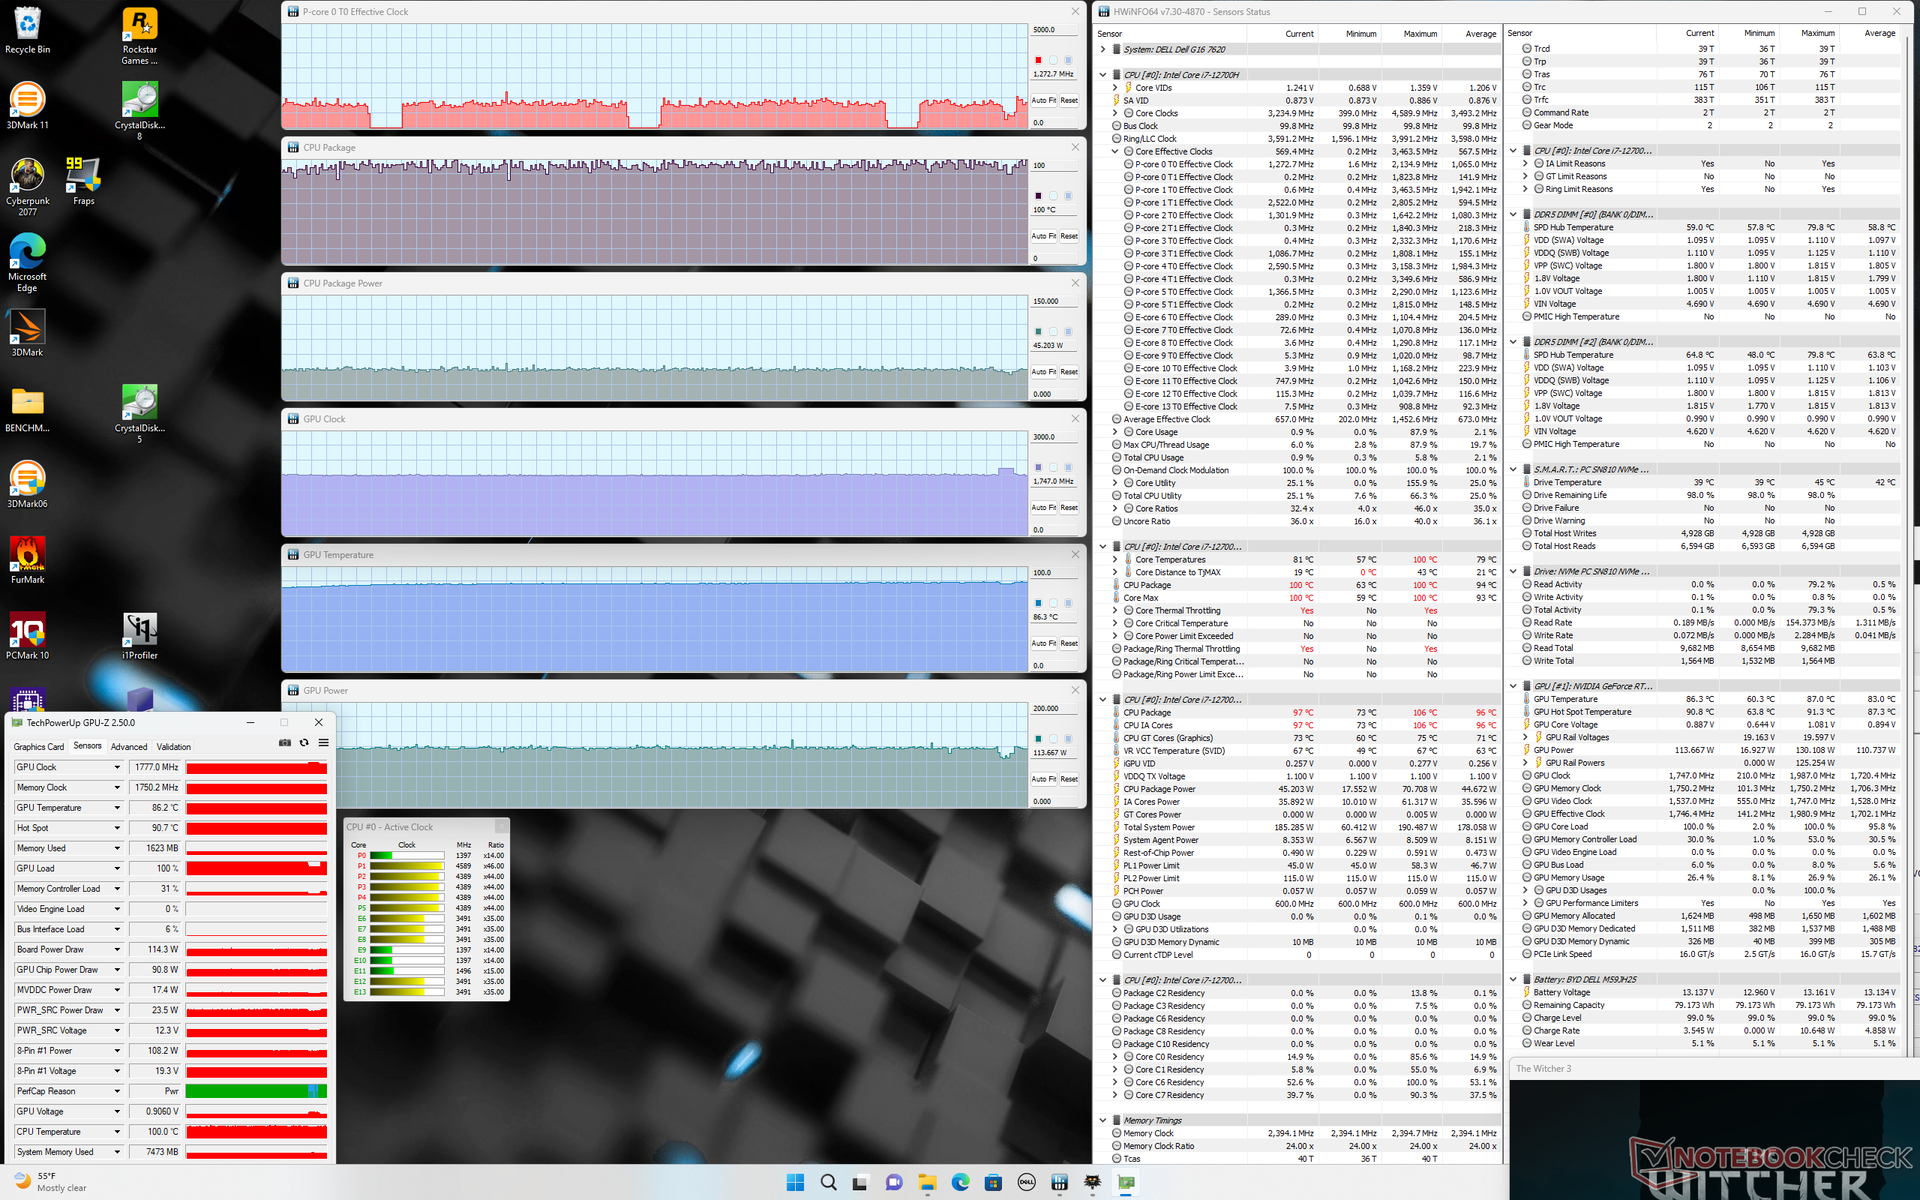
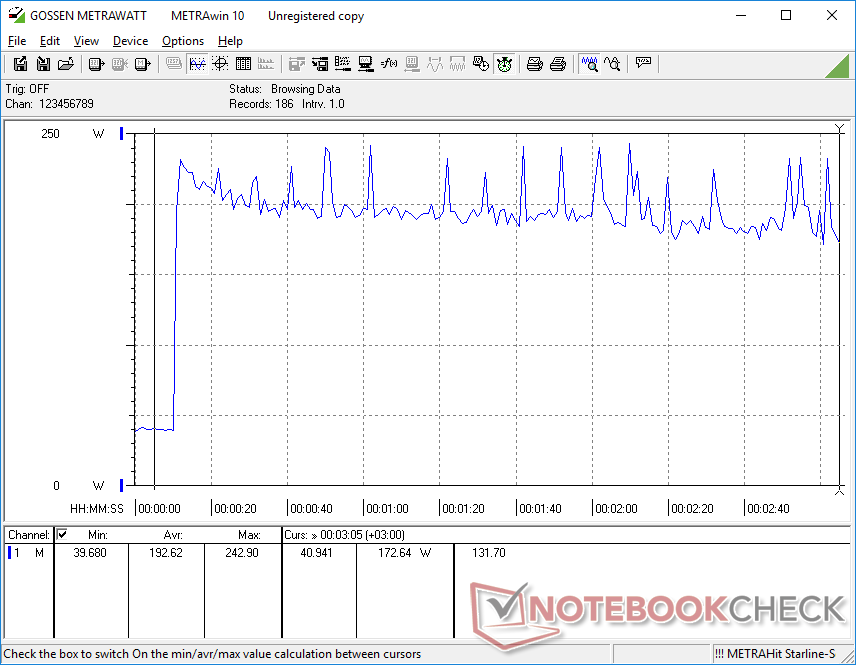
En exécutant Witcher 3, on obtient une horloge centrale du GPU stable, une température et une consommation d'énergie de la carte de 1777 MHz, 86 C et 114 W, respectivement, contre l'objectif de 130 W du TGP. En répétant ce même test sur l'Envy 16 susmentionné, on obtiendrait des fréquences d'horloge centrales légèrement plus basses et des températures et des demandes d'énergie plus faibles. Ce qui est plus inquiétant, cependant, c'est que la température du CPU dans le G16 est à nouveau supérieure à 90 C, ce qui est beaucoup plus chaud que sur les ordinateurs portables de jeu concurrents.
Le fonctionnement sur batterie limite sévèrement les performances. Un test Fire Strike sur batteries donnerait des scores physiques et graphiques de 19465 et 4162 points, respectivement, contre 27735 et 21584 points sur secteur.
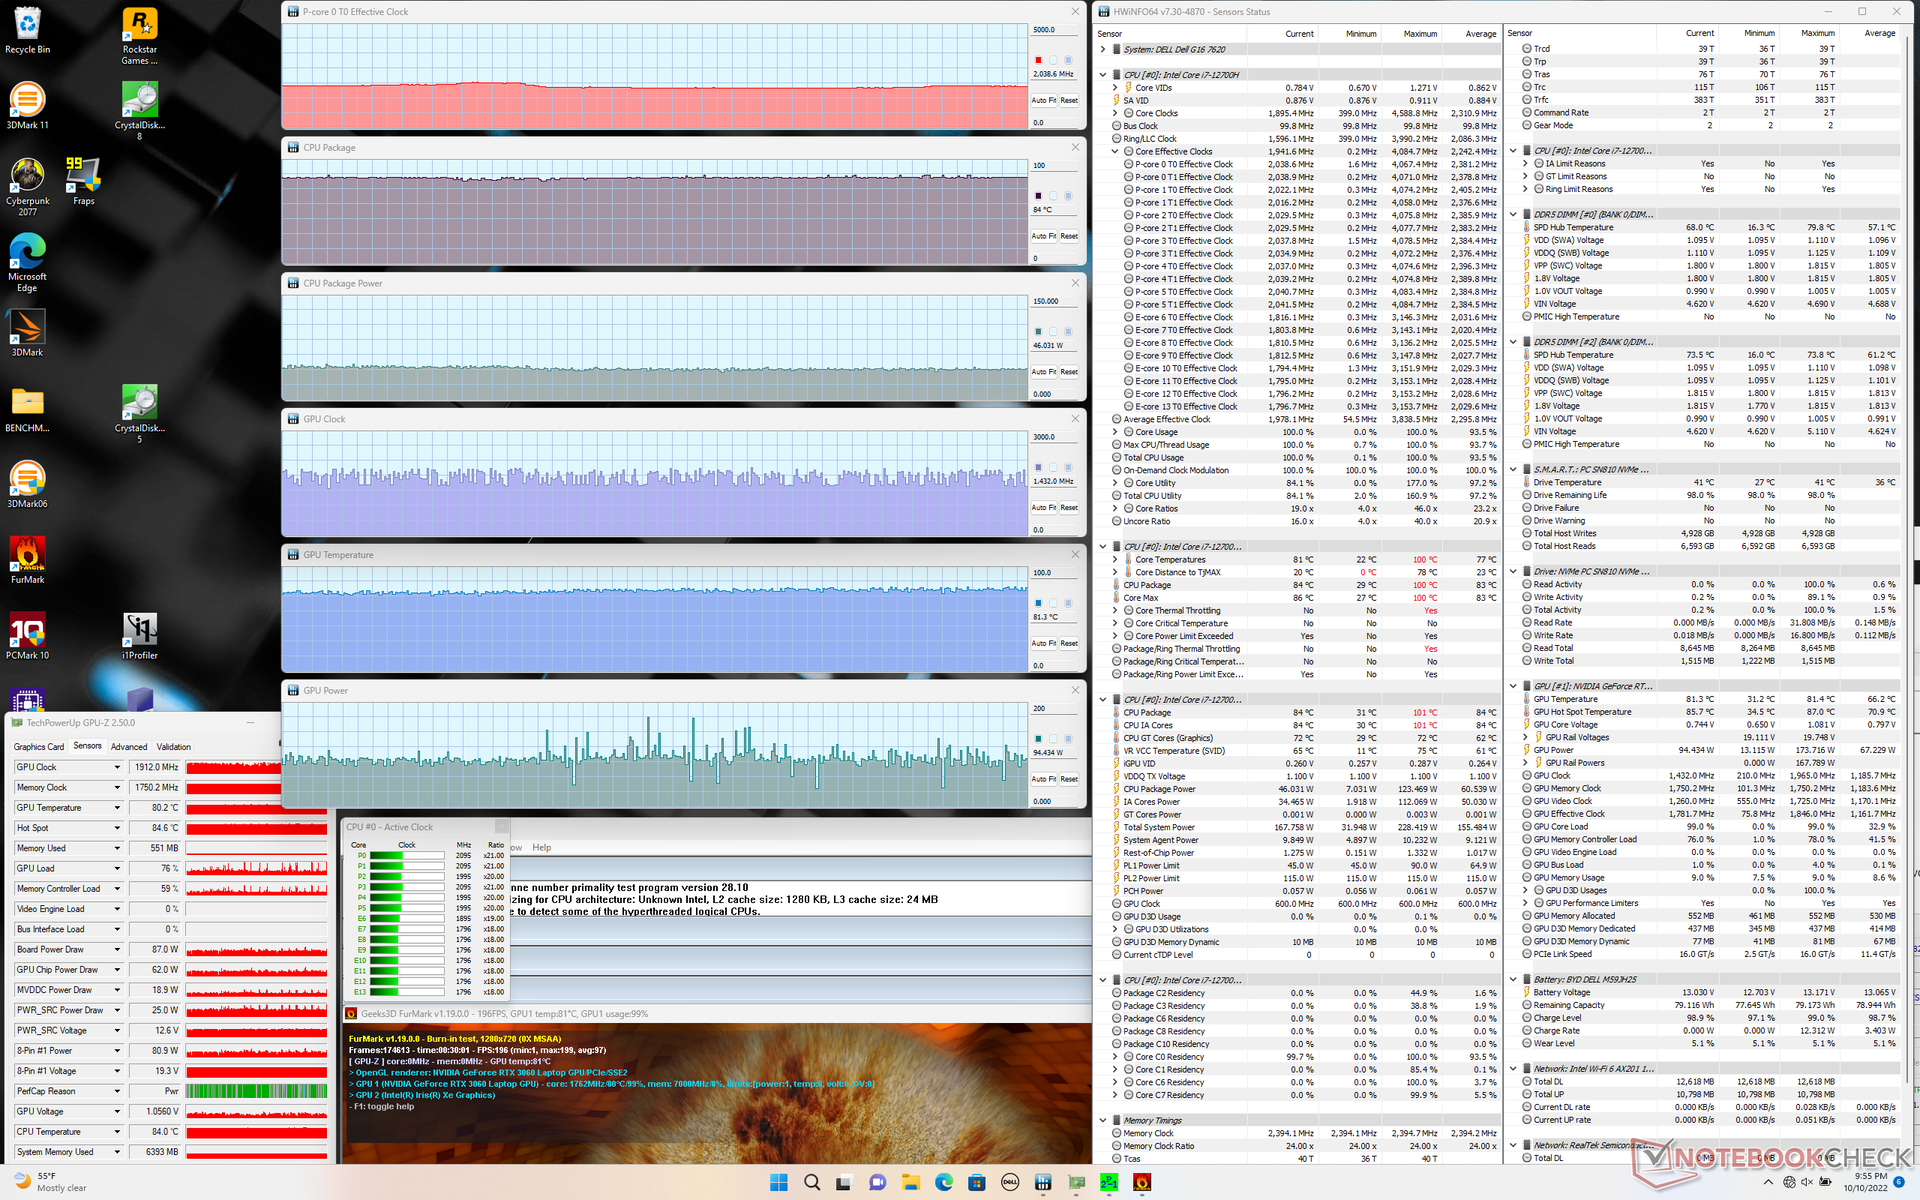
| Fréquence CPU (GHz) | Fréquence GPU (MHz) | Température CPU moyenne (°C) | Température GPU moyenne (°C) | |
| Système au repos | -- | -- | 29 | 31 |
| Prime95 Stress | 3.1 - 3.6 | -- | 86 - 98 | 52 |
| Prime95+ FurMark Stress | 2.0 | ~1432 - ~1912 | 84 | 81 |
| Witcher 3 Stress | ~1.3 | 1777 | ~99 | 86 |
Haut-parleurs
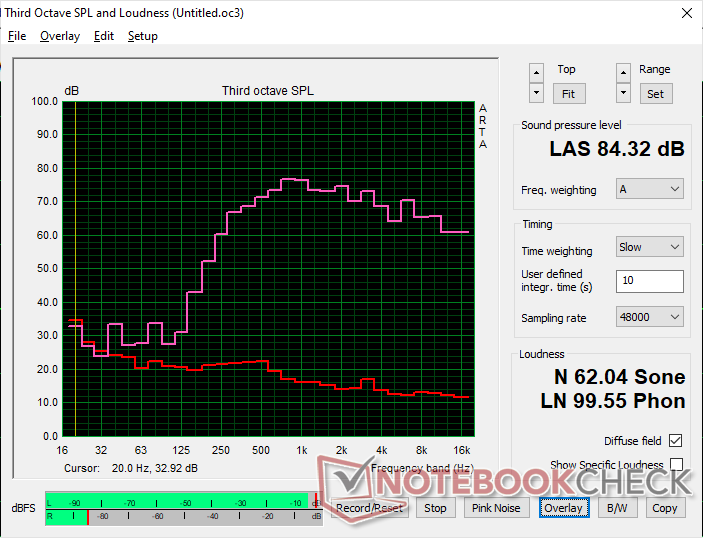
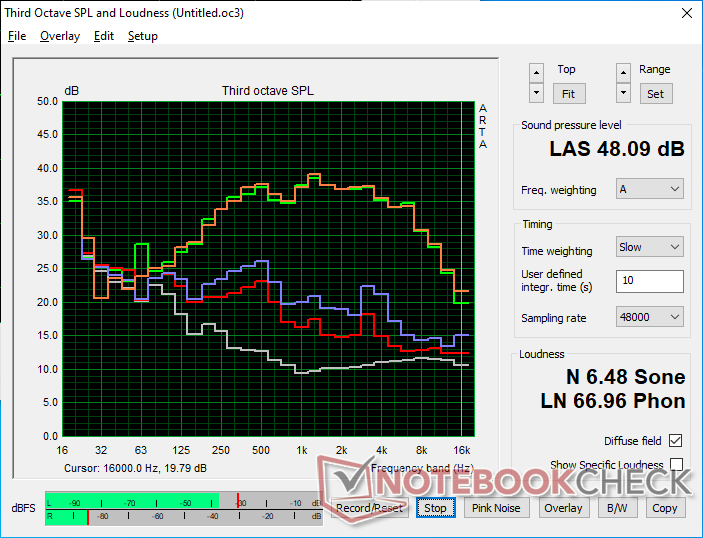
Dell G16 7620 analyse audio
(+) | les haut-parleurs peuvent jouer relativement fort (84.3# dB)
Basses 100 - 315 Hz
(-) | presque aucune basse - en moyenne 21.8% plus bas que la médiane
(±) | la linéarité des basses est moyenne (14.5% delta à la fréquence précédente)
Médiums 400 - 2000 Hz
(+) | médiane équilibrée - seulement 4.9% de la médiane
(+) | les médiums sont linéaires (3.5% delta à la fréquence précédente)
Aiguës 2 - 16 kHz
(+) | des sommets équilibrés - à seulement 2.6% de la médiane
(±) | la linéarité des aigus est moyenne (7.7% delta à la fréquence précédente)
Globalement 100 - 16 000 Hz
(±) | la linéarité du son global est moyenne (17.2% de différence avec la médiane)
Par rapport à la même classe
» 46% de tous les appareils testés de cette catégorie étaient meilleurs, 11% similaires, 42% pires
» Le meilleur avait un delta de 6%, la moyenne était de 18%, le pire était de 132%.
Par rapport à tous les appareils testés
» 32% de tous les appareils testés étaient meilleurs, 8% similaires, 60% pires
» Le meilleur avait un delta de 4%, la moyenne était de 24%, le pire était de 134%.
Apple MacBook Pro 16 2021 M1 Pro analyse audio
(+) | les haut-parleurs peuvent jouer relativement fort (84.7# dB)
Basses 100 - 315 Hz
(+) | bonne basse - seulement 3.8% loin de la médiane
(+) | les basses sont linéaires (5.2% delta à la fréquence précédente)
Médiums 400 - 2000 Hz
(+) | médiane équilibrée - seulement 1.3% de la médiane
(+) | les médiums sont linéaires (2.1% delta à la fréquence précédente)
Aiguës 2 - 16 kHz
(+) | des sommets équilibrés - à seulement 1.9% de la médiane
(+) | les aigus sont linéaires (2.7% delta à la fréquence précédente)
Globalement 100 - 16 000 Hz
(+) | le son global est linéaire (4.6% différence à la médiane)
Par rapport à la même classe
» 0% de tous les appareils testés de cette catégorie étaient meilleurs, 0% similaires, 100% pires
» Le meilleur avait un delta de 5%, la moyenne était de 17%, le pire était de 45%.
Par rapport à tous les appareils testés
» 0% de tous les appareils testés étaient meilleurs, 0% similaires, 100% pires
» Le meilleur avait un delta de 4%, la moyenne était de 24%, le pire était de 134%.
La gestion de l'énergie - exigeante dans la plupart des scénarios
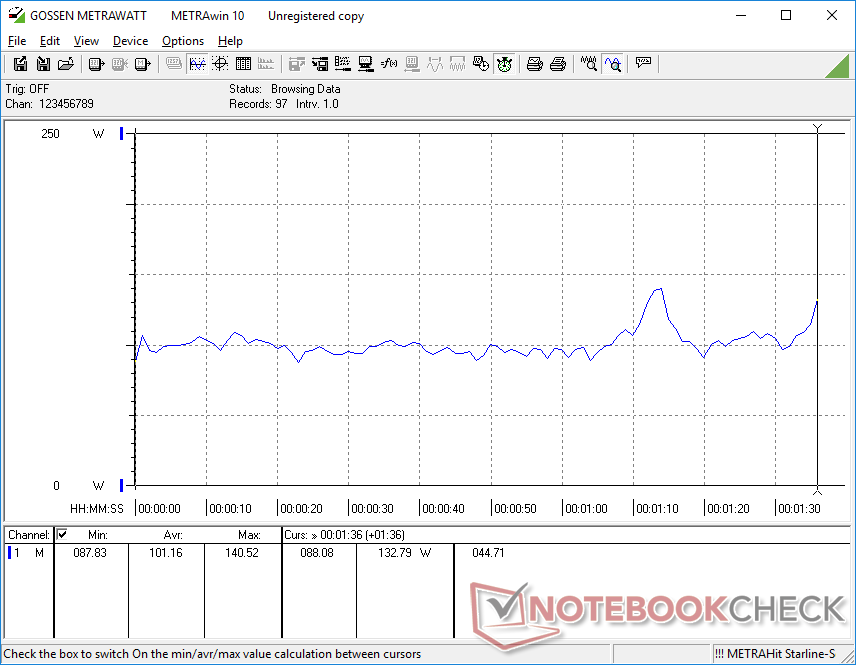
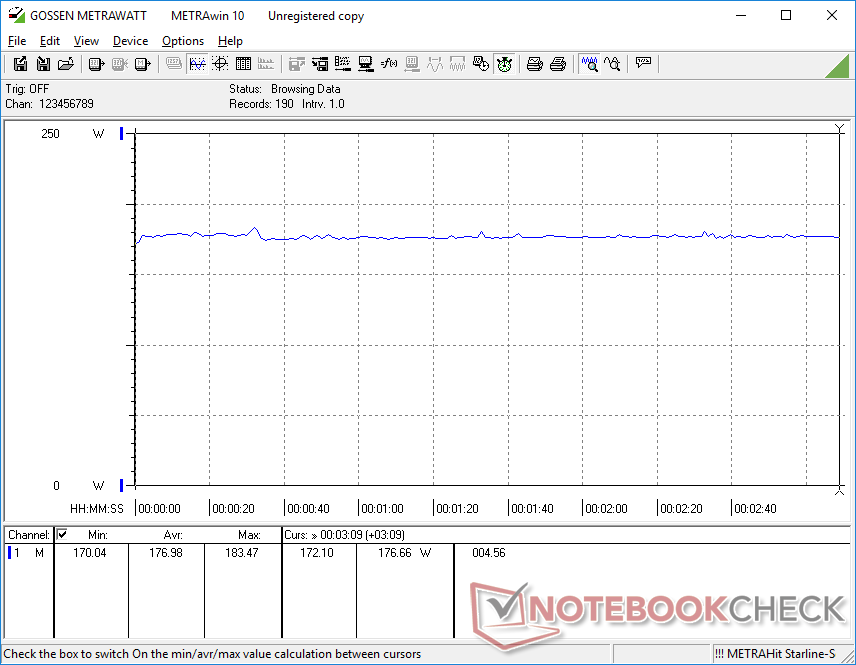
Consommation d'énergie
La consommation d'énergie est relativement élevée lorsqu'elle tourne au ralenti sur le bureau, entre 14 et 32 W. Néanmoins, cette plage n'est que légèrement supérieure à celle du HP Envy 16 avec le même CPU et GPU. Attendez-vous à ce que la consommation atteigne 177 W lors de l'exécution de jeux, soit environ 20 W de moins que sur le HP Envy 16 Lenovo Legion 5 Pro ou Asus ROG Strix Scar 15
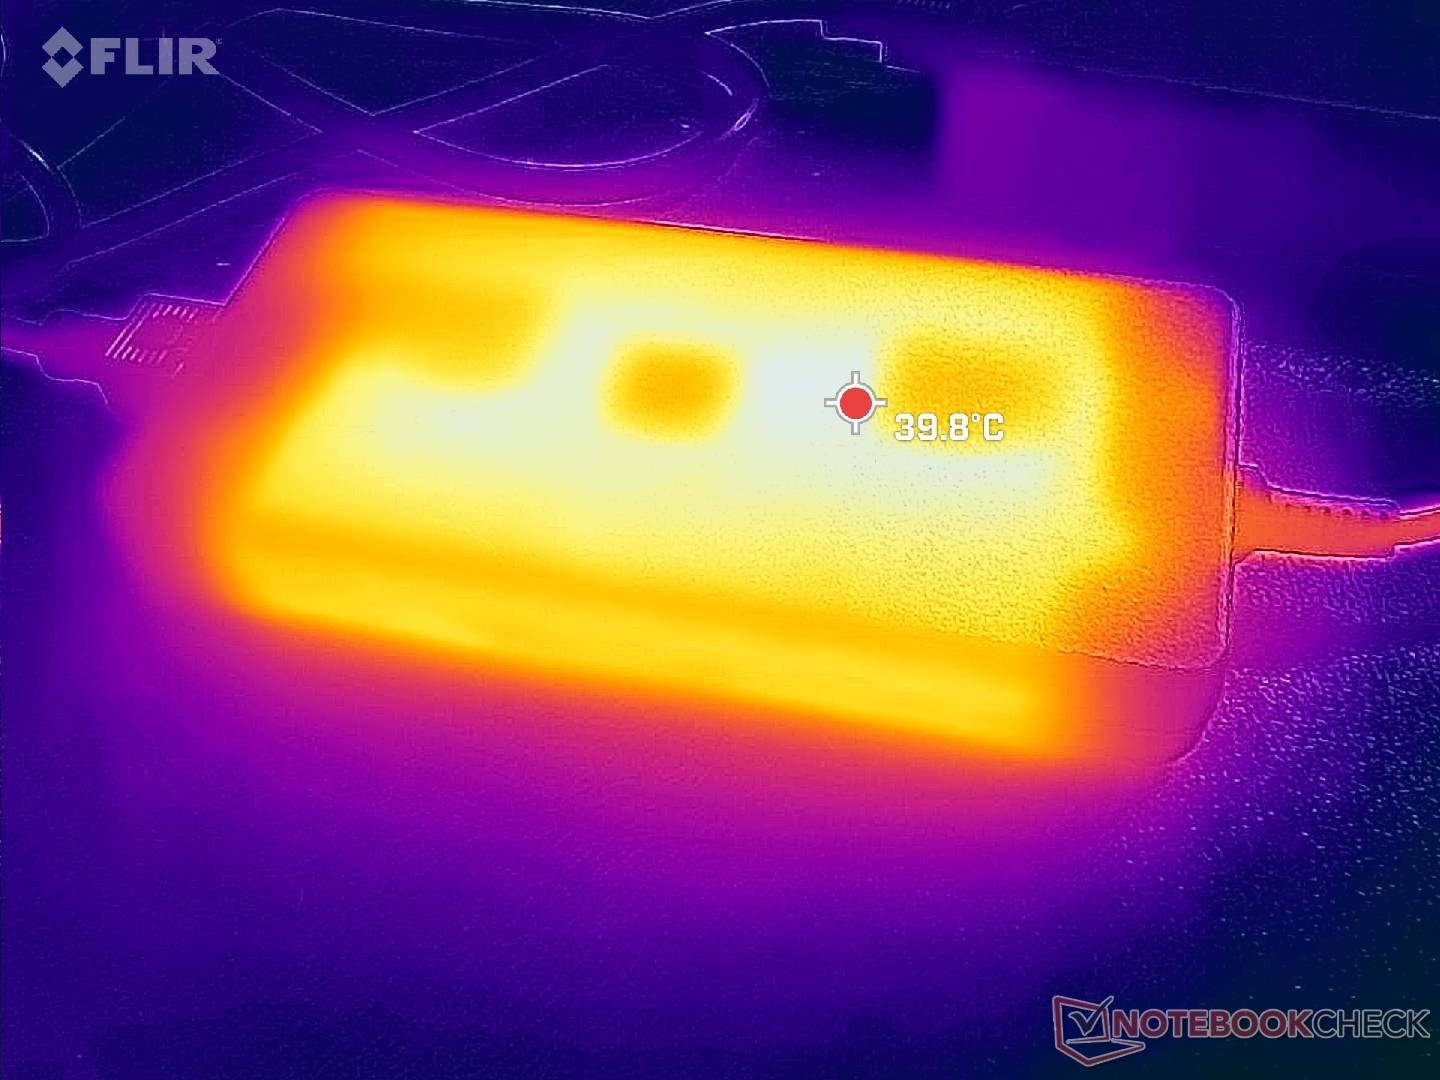
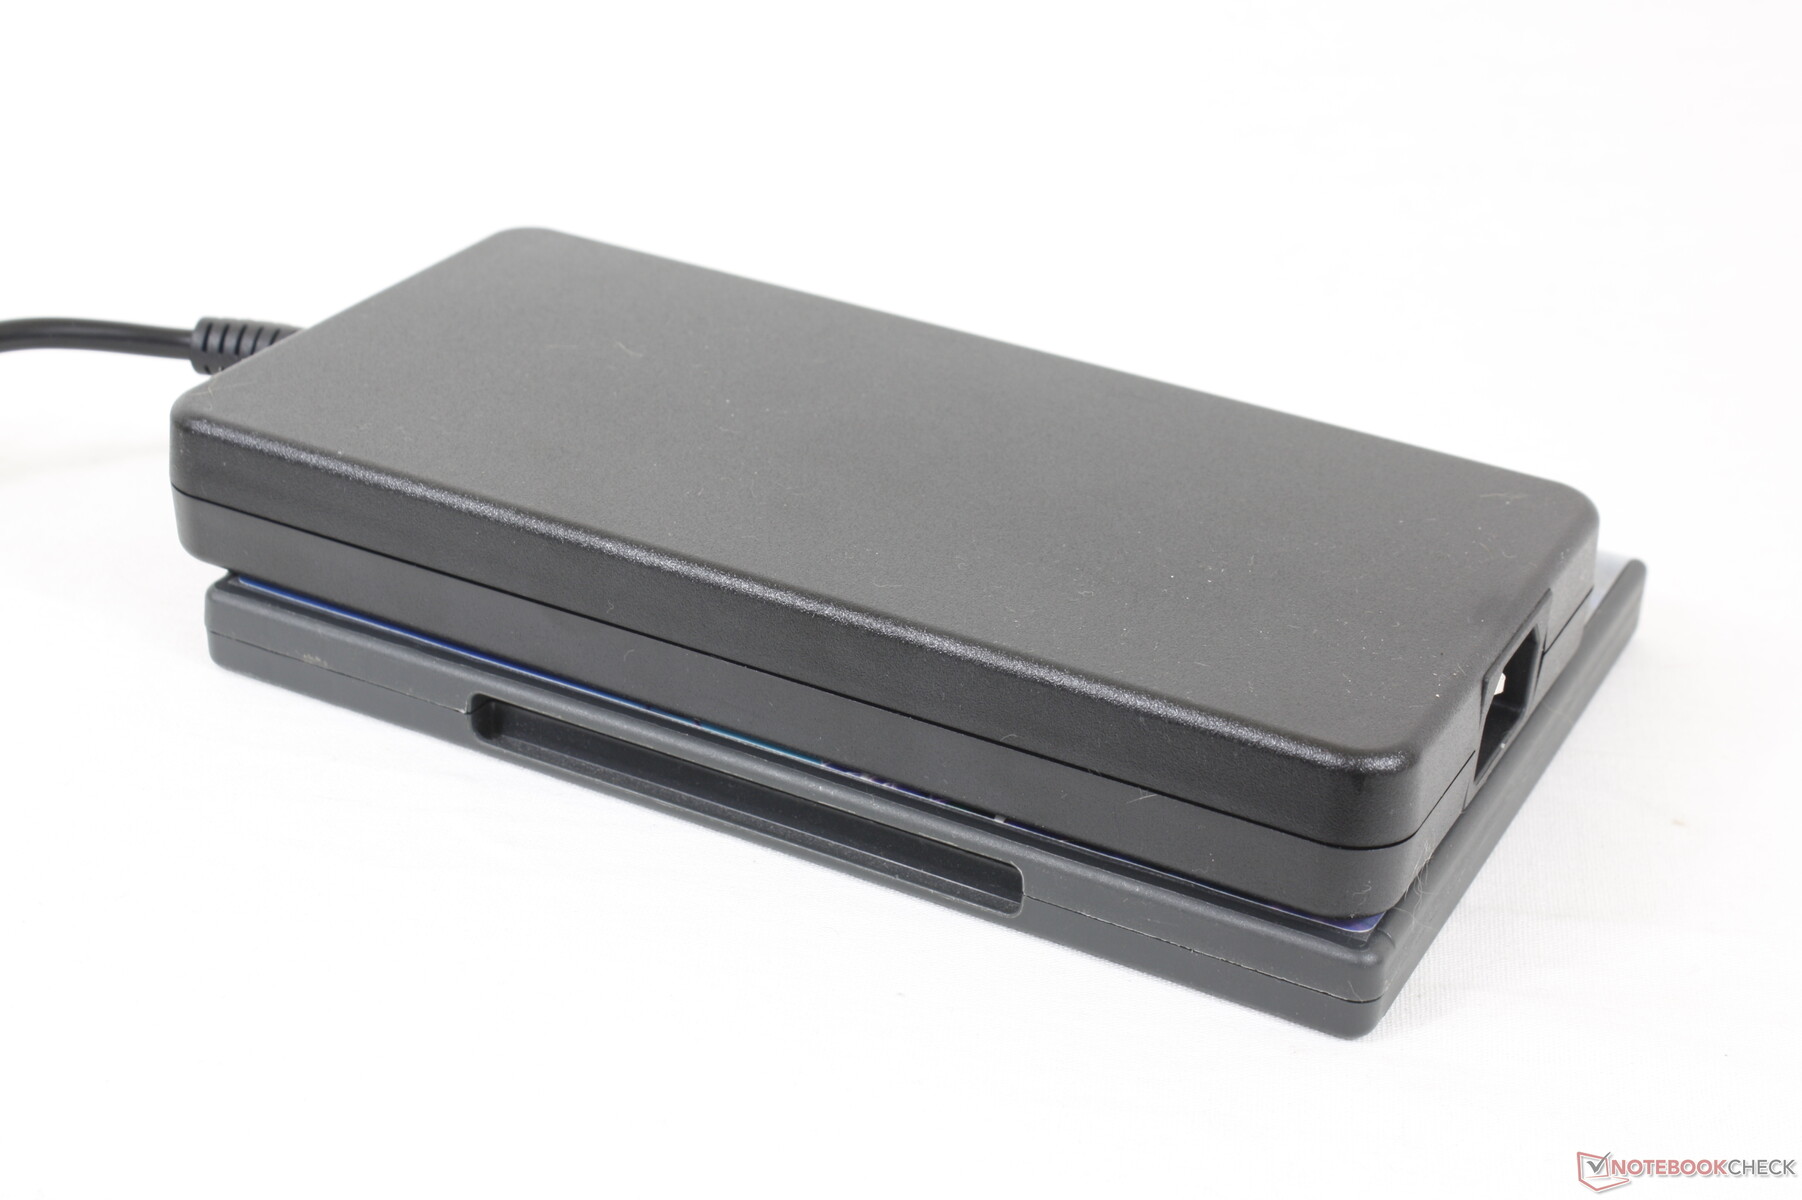
Nous avons pu enregistrer une consommation maximale de 243 W sur le grand adaptateur secteur de 240 W (~19,9 x 10 x 2,5 cm) lorsque le CPU et le GPU sont tous deux utilisés à 100 %. La consommation oscille entre 180 W et 240 W dans de telles conditions, probablement en raison de limitations thermiques.
| Éteint/en veille | |
| Au repos | |
| Fortement sollicité |
|
Légende:
min: | |
| Dell G16 7620 i7-12700H, GeForce RTX 3060 Laptop GPU, WDC PC SN810 512GB, IPS, 2560x1600, 16" | Lenovo Legion 7 16ARHA7 R9 6900HX, Radeon RX 6850M XT, Samsung PM9A1 MZVL22T0HBLB, IPS, 2560x1600, 16" | HP Victus 16-e0145ng R5 5600H, GeForce RTX 3050 Ti Laptop GPU, Samsung SSD PM981a MZVLB512HBJQ, IPS, 1920x1080, 16.1" | Asus ROG Zephyrus M16 GU603H i9-11900H, GeForce RTX 3070 Laptop GPU, Samsung PM9A1 MZVL22T0HBLB, IPS, 2560x1600, 16" | Lenovo Legion 5 Pro 16IAH7H i7-12700H, GeForce RTX 3060 Laptop GPU, 2x Samsung PM9A1 MZVL21T0HCLR (RAID 0), IPS, 2560x1600, 16" | Acer Swift X SFX16-51G-5388 i5-11320H, GeForce RTX 3050 4GB Laptop GPU, Samsung PM991 MZVLQ512HBLU, , 1920x1080, 16.1" | |
|---|---|---|---|---|---|---|
| Power Consumption | -2% | 35% | 6% | -39% | 51% | |
| Idle Minimum * (Watt) | 14.4 | 9.9 31% | 7 51% | 11 24% | 22.8 -58% | 7 51% |
| Idle Average * (Watt) | 17.8 | 22 -24% | 9 49% | 20 -12% | 26.5 -49% | 10.1 43% |
| Idle Maximum * (Watt) | 31.5 | 23.1 27% | 15 52% | 30 5% | 41 -30% | 15 52% |
| Load Average * (Watt) | 101.2 | 94.4 7% | 93 8% | 111 -10% | 191 -89% | 63.3 37% |
| Witcher 3 ultra * (Watt) | 176.9 | 249 -41% | 134.5 24% | 156 12% | 194.7 -10% | 63.3 64% |
| Load Maximum * (Watt) | 242.9 | 276 -14% | 185 24% | 197 19% | 238 2% | 94 61% |
* ... Moindre est la valeur, meilleures sont les performances
Power Consumption Witcher 3 / Stresstest
Power Consumption external Monitor
Autonomie de la batterie - Pas très bonne
Les durées d'exécution ne sont que moyennes, même pour un gros ordinateur portable de jeu. L'autonomie de la batterie du WLAN est d'un peu moins de 5 heures, contre 7 heures sur leLenovo Legion 7 16ARHA7 ou HP Victus 16.
Le chargement d'une batterie vide à sa pleine capacité prend environ 2 heures. Le modèle ne prend pas en charge l'USB-PD et ne peut donc pas être rechargé via l'USB-C.
| Dell G16 7620 i7-12700H, GeForce RTX 3060 Laptop GPU, 84 Wh | Lenovo Legion 7 16ARHA7 R9 6900HX, Radeon RX 6850M XT, 99 Wh | HP Victus 16-e0145ng R5 5600H, GeForce RTX 3050 Ti Laptop GPU, 70 Wh | Asus ROG Zephyrus M16 GU603H i9-11900H, GeForce RTX 3070 Laptop GPU, 90 Wh | Lenovo Legion 5 Pro 16IAH7H i7-12700H, GeForce RTX 3060 Laptop GPU, 80 Wh | Acer Swift X SFX16-51G-5388 i5-11320H, GeForce RTX 3050 4GB Laptop GPU, 58.7 Wh | |
|---|---|---|---|---|---|---|
| Autonomie de la batterie | 57% | 42% | 90% | -21% | 88% | |
| Reader / Idle (h) | 7.1 | 4.9 -31% | 13.3 87% | |||
| WiFi v1.3 (h) | 5 | 7.3 46% | 7.1 42% | 7.7 54% | 3.6 -28% | 8.1 62% |
| Load (h) | 0.7 | 1.8 157% | 1.6 129% | 0.6 -14% | 1.5 114% | |
| H.264 (h) | 4.1 | 8.4 | ||||
| Witcher 3 ultra (h) | 2.1 | |||||
| Gaming (h) | 1.1 |
Points positifs
Points négatifs
Verdict - Grand et rapide
Le G16 présente de nombreuses similitudes avec certains des derniers Ordinateurs portables Alienware pour le meilleur et pour le pire. Plus précisément, le système est plus grand et plus lourd que celui de nombreux concurrents et il fonctionne même à une température beaucoup plus élevée, avec des températures centrales avoisinant les 90 °C lors des jeux. Le G16 n'est donc pas la meilleure solution pour les utilisateurs qui veulent un ordinateur portable de jeu fin et léger. Des alternatives telles que leLenovo Legion 7 16 ou Asus ROG Zephyrus M16 sont plus fins, plus légers, voire les deux, tout en offrant des options d'affichage et de processeur similaires.
Le Dell G16 excelle en termes de performances au prix d'un encombrement plus important, d'un poids plus élevé et de températures centrales plus chaudes.
Là où le système Dell a du mal, il se rattrape en termes de performances. Le système est plus rapide que la plupart des autres ordinateurs portables dotés du même processeur et du même processeur graphique, en raison de son profil plus épais et de ses températures plus élevées. Malgré cela, l'autonomie moyenne de la batterie, l'absence de prise en charge des disques SSD secondaires, la webcam médiocre et la brique d'alimentation de taille peu pratique signifient qu'il y a encore beaucoup de place pour l'amélioration.
Prix et disponibilité
Le Dell G16 7620 est désormais disponible sur Best Buy dans notre configuration actuelle pour $1600 USD. Il n'est pas encore sur Amazon au moment où nous écrivons ces lignes. D'autres UGS peuvent être commandées directement auprès de Dell pour un prix allant de 1140 $ à 1935 $.
Dell G16 7620
- 10/18/2022 v7 (old)
Allen Ngo
Price comparison

