Courte critique de la station de travail MSI WE72 7RJ (7700HQ, FHD, M2200)
| SD Card Reader | |
| average JPG Copy Test (av. of 3 runs) | |
| Dell Precision 7710 | |
| HP ZBook 17 G3 TZV66eA | |
| Lenovo ThinkPad P70 | |
| MSI WE72 7RJ | |
| maximum AS SSD Seq Read Test (1GB) | |
| HP ZBook 17 G3 TZV66eA | |
| Lenovo ThinkPad P70 | |
| Dell Precision 7710 | |
| MSI WE72 7RJ | |
| Networking | |
| iperf3 transmit AX12 | |
| Lenovo ThinkPad T570-20HAS01E00 | |
| MSI GE72 7RE-046 | |
| MSI WE72 7RJ | |
| iperf3 receive AX12 | |
| Lenovo ThinkPad T570-20HAS01E00 | |
| MSI WE72 7RJ | |
| MSI GE72 7RE-046 | |
| |||||||||||||||||||||||||
Homogénéité de la luminosité: 93 %
Valeur mesurée au centre, sur batterie: 301 cd/m²
Contraste: 974:1 (Valeurs des noirs: 0.31 cd/m²)
ΔE ColorChecker Calman: 6.2 | ∀{0.5-29.43 Ø4.71}
ΔE Greyscale Calman: 7.3 | ∀{0.09-98 Ø4.96}
85.2% sRGB (Argyll 1.6.3 3D)
56% AdobeRGB 1998 (Argyll 1.6.3 3D)
62.4% AdobeRGB 1998 (Argyll 3D)
85.3% sRGB (Argyll 3D)
67.4% Display P3 (Argyll 3D)
Gamma: 2.08
CCT: 7020 K
| MSI WE72 7RJ LP173WF4-SPF1, , 1920x1080, 17.3" | Dell Precision 7710 SDC8151, VHN17_173HL, , 1920x1080, 17.3" | Lenovo ThinkPad P70 LEN4123, , 3840x2160, 17.3" | HP ZBook 17 G3 TZV66eA SDC3854, , 1920x1080, 17.3" | |
|---|---|---|---|---|
| Display | 8% | 30% | 8% | |
| Display P3 Coverage (%) | 67.4 | 66.6 -1% | 90.8 35% | 67.3 0% |
| sRGB Coverage (%) | 85.3 | 96.9 14% | 100 17% | 95.9 12% |
| AdobeRGB 1998 Coverage (%) | 62.4 | 68.6 10% | 85.4 37% | 69 11% |
| Response Times | -24% | -1% | -10% | |
| Response Time Grey 50% / Grey 80% * (ms) | 45.2 ? | 50 ? -11% | 44 ? 3% | 50.4 ? -12% |
| Response Time Black / White * (ms) | 26.4 ? | 36 ? -36% | 27.6 ? -5% | 28.4 ? -8% |
| PWM Frequency (Hz) | 198 ? | 228 ? | 200 ? | |
| Screen | 13% | 11% | 23% | |
| Brightness middle (cd/m²) | 302 | 332 10% | 365 21% | 252 -17% |
| Brightness (cd/m²) | 306 | 307 0% | 341 11% | 243 -21% |
| Brightness Distribution (%) | 93 | 83 -11% | 85 -9% | 86 -8% |
| Black Level * (cd/m²) | 0.31 | 0.33 -6% | 0.4 -29% | 0.21 32% |
| Contrast (:1) | 974 | 1006 3% | 913 -6% | 1200 23% |
| Colorchecker dE 2000 * | 6.2 | 3 52% | 3.8 39% | 2.2 65% |
| Colorchecker dE 2000 max. * | 10.6 | 3.8 64% | ||
| Greyscale dE 2000 * | 7.3 | 4 45% | 6.09 17% | 2.7 63% |
| Gamma | 2.08 106% | 2 110% | 2.3 96% | 2.28 96% |
| CCT | 7020 93% | 7089 92% | 6332 103% | 6686 97% |
| Color Space (Percent of AdobeRGB 1998) (%) | 56 | 62 11% | 76.01 36% | 62 11% |
| Color Space (Percent of sRGB) (%) | 85.2 | 97 14% | 99.97 17% | 96 13% |
| Moyenne finale (programmes/paramètres) | -1% /
7% | 13% /
13% | 7% /
15% |
* ... Moindre est la valeur, meilleures sont les performances
Temps de réponse de l'écran
| ↔ Temps de réponse noir à blanc | ||
|---|---|---|
| 26.4 ms ... hausse ↗ et chute ↘ combinées | ↗ 14.8 ms hausse | 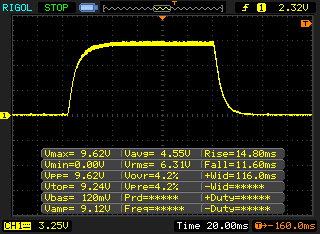 |
| ↘ 11.6 ms chute | ||
| L'écran souffre de latences relativement élevées, insuffisant pour le jeu. En comparaison, tous les appareils testés affichent entre 0.1 (minimum) et 240 (maximum) ms. » 66 % des appareils testés affichent de meilleures performances. Cela signifie que les latences relevées sont moins bonnes que la moyenne (19.8 ms) de tous les appareils testés. | ||
| ↔ Temps de réponse gris 50% à gris 80% | ||
| 45.2 ms ... hausse ↗ et chute ↘ combinées | ↗ 27.2 ms hausse | 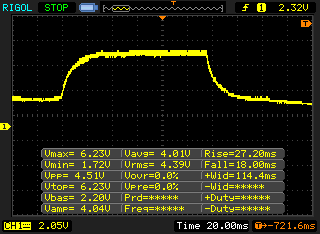 |
| ↘ 18 ms chute | ||
| L'écran souffre de latences très élevées, à éviter pour le jeu. En comparaison, tous les appareils testés affichent entre 0.165 (minimum) et 636 (maximum) ms. » 78 % des appareils testés affichent de meilleures performances. Cela signifie que les latences relevées sont moins bonnes que la moyenne (30.9 ms) de tous les appareils testés. | ||
Scintillement / MLI (Modulation de largeur d'impulsion)
| Scintillement / MLI (Modulation de largeur d'impulsion) non décelé |  | ||
En comparaison, 52 % des appareils testés n'emploient pas MDI pour assombrir leur écran. Nous avons relevé une moyenne à 7744 (minimum : 5 - maximum : 343500) Hz dans le cas où une MDI était active. | |||

| PCMark 8 | |
| Home Score Accelerated v2 | |
| Dell Precision 7710 | |
| MSI WE72 7RJ | |
| HP ZBook 17 G3 TZV66eA | |
| Lenovo ThinkPad P70 | |
| Work Score Accelerated v2 | |
| Dell Precision 7710 | |
| HP ZBook 17 G3 TZV66eA | |
| MSI WE72 7RJ | |
| Lenovo ThinkPad P70 | |
| PCMark 8 Home Score Accelerated v2 | 4295 points | |
| PCMark 8 Work Score Accelerated v2 | 5150 points | |
Aide | ||
| MSI WE72 7RJ Samsung SM961 MZVPW256 m.2 PCI-e | Lenovo ThinkPad P70 Samsung SSD PM871 MZNLN512HCJH | HP ZBook 17 G3 TZV66eA Samsung SM951 MZVPV256HDGL m.2 PCI-e | MSI GE72 7RE-046 Toshiba HG6 THNSNJ256G8NY | Dell Precision 5520 UHD Samsung SM961 MZVKW512HMJP m.2 PCI-e | MSI GS63VR 7RF-228US Samsung SM961 MZVKW512HMJP m.2 PCI-e | |
|---|---|---|---|---|---|---|
| CrystalDiskMark 3.0 | -44% | 30% | -45% | 10% | 9% | |
| Read Seq (MB/s) | 1492 | 509 -66% | 1481 -1% | 540 -64% | 2253 51% | 2141 43% |
| Write Seq (MB/s) | 1512 | 457.8 -70% | 1243 -18% | 495.7 -67% | 1662 10% | 1621 7% |
| Read 512 (MB/s) | 312.6 | 420.3 34% | 1202 285% | 455.1 46% | 459.1 47% | 499.7 60% |
| Write 512 (MB/s) | 1483 | 420.5 -72% | 1163 -22% | 481.4 -68% | 1611 9% | 1531 3% |
| Read 4k (MB/s) | 59.9 | 29.88 -50% | 58.7 -2% | 22.7 -62% | 56.1 -6% | 54.2 -10% |
| Write 4k (MB/s) | 184.2 | 104.1 -43% | 207.4 13% | 112.9 -39% | 169.4 -8% | 158.2 -14% |
| Read 4k QD32 (MB/s) | 681 | 391.8 -42% | 832 22% | 372.5 -45% | 633 -7% | 632 -7% |
| Write 4k QD32 (MB/s) | 590 | 350.4 -41% | 377.9 -36% | 212.9 -64% | 506 -14% | 527 -11% |

| 3DMark - 1920x1080 Fire Strike Graphics | |
| MSI GE72VR-6RF16H21 | |
| MSI GE72 7RE-046 | |
| Acer Predator 15 G9-592-7925 | |
| Dell Precision 7710 | |
| HP ZBook 17 G3 TZV66eA | |
| Lenovo ThinkPad P70 | |
| MSI GE72 965M Ti | |
| Asus FX553VD-DM249T | |
| MSI WE72 7RJ | |
| HP Omen 17-w010ng | |
| Dell Precision 5520 UHD | |
| Lenovo ThinkPad P50 | |
| Unigine Heaven 4.0 | |
| Extreme Preset DX11 | |
| MSI GE72VR-6RF16H21 | |
| MSI GE72 7RE-046 | |
| MSI WE72 7RJ | |
| MSI GE72 965M Ti | |
| HP Omen 17-w010ng | |
| Extreme Preset OpenGL | |
| MSI WE72 7RJ | |
| Unigine Valley 1.0 | |
| 1920x1080 Extreme HD DirectX AA:x8 | |
| MSI GE72VR-6RF16H21 | |
| HP ZBook 17 G3 TZV66eA | |
| Lenovo ThinkPad P70 | |
| Dell Precision 7710 | |
| MSI WE72 7RJ | |
| MSI GE72 965M Ti | |
| Lenovo ThinkPad P50 | |
| 1920x1080 Extreme HD Preset OpenGL AA:x8 | |
| HP ZBook 17 G3 TZV66eA | |
| Dell Precision 7710 | |
| MSI WE72 7RJ | |
| Lenovo ThinkPad P70 | |
| Lenovo ThinkPad P50 | |
| 3DMark 06 Standard Score | 26834 points | |
| 3DMark Vantage P Result | 24622 points | |
| 3DMark 11 Performance | 7453 points | |
| 3DMark Ice Storm Standard Score | 93770 points | |
| 3DMark Cloud Gate Standard Score | 20388 points | |
| 3DMark Fire Strike Score | 5252 points | |
| 3DMark Fire Strike Extreme Score | 2627 points | |
| 3DMark Time Spy Score | 1845 points | |
Aide | ||
| Ghost Recon Wildlands - 1920x1080 High Preset AA:T AF:4x | |
| Gigabyte Aero 15 | |
| Acer Aspire VX5-591G-75C4 VX15 | |
| MSI WE72 7RJ | |
| MSI GL62M 7RD-077 | |
| Apple MacBook Pro 15 2016 (2.6 GHz, 450) | |
| For Honor - 1920x1080 High Preset AA:T AF:8x | |
| Gigabyte Aero 15 | |
| Razer Blade (2017) | |
| MSI WE72 7RJ | |
| MSI GE72 965M Ti | |
| Acer Aspire VX5-591G-75C4 VX15 | |
| Apple MacBook Pro 15 2016 (2.6 GHz, 450) | |
| Battlefield 1 - 1920x1080 High Preset AA:T | |
| Schenker XMG P407 | |
| Acer Aspire VN7-593G-73HP V15 Nitro BE | |
| MSI GE72 965M Ti | |
| Dell XPS 15 2017 9560 (7300HQ, Full-HD) | |
| MSI GL62M 7RD-077 | |
| MSI WE72 7RJ | |
| Apple MacBook Pro 15 2016 (2.9 GHz, 460) | |
| Apple MacBook Pro 15 2016 (2.6 GHz, 450) | |
| Bas | Moyen | Élevé | Ultra | |
|---|---|---|---|---|
| Tomb Raider (2013) | 381.4 | 238.8 | 149.3 | 70.2 |
| BioShock Infinite (2013) | 229.4 | 177.2 | 155.5 | 58.6 |
| Battlefield 4 (2013) | 171.5 | 148.3 | 115.9 | 47.8 |
| Thief (2014) | 108.8 | 88.6 | 74.8 | 39.6 |
| The Witcher 3 (2015) | 116.6 | 68.4 | 37.8 | 20.3 |
| Star Wars Battlefront (2015) | 148.8 | 119 | 56.4 | 48.2 |
| Rainbow Six Siege (2015) | 214.2 | 131.2 | 70.4 | 52.4 |
| Rise of the Tomb Raider (2016) | 128.7 | 72.8 | 40.7 | 34.4 |
| Battlefield 1 (2016) | 139.4 | 105.3 | 47.1 | 42 |
| For Honor (2017) | 78 | 52.3 | 50.5 | 36.2 |
| Ghost Recon Wildlands (2017) | 83.4 | 37.1 | 33.7 | 17.6 |
Degré de la nuisance sonore
| Au repos |
| 36.3 / 36.3 / 36.6 dB(A) |
| Fortement sollicité |
| 40.4 / 46.6 dB(A) |
 | ||
30 dB silencieux 40 dB(A) audible 50 dB(A) bruyant |
||
min: | ||
(-) La température maximale du côté supérieur est de 45.7 °C / 114 F, par rapport à la moyenne de 38.2 °C / 101 F, allant de 22.2 à 69.8 °C pour la classe Workstation.
(-) Le fond chauffe jusqu'à un maximum de 48.4 °C / 119 F, contre une moyenne de 41.1 °C / 106 F
(+) En utilisation inactive, la température moyenne du côté supérieur est de 26.7 °C / 80 F, par rapport à la moyenne du dispositif de 32 °C / 90 F.
(-) Les repose-poignets et le pavé tactile peuvent devenir très chauds au toucher, avec un maximum de 40.4 °C / 104.7# F.
(-) La température moyenne de la zone de l'appui-paume de dispositifs similaires était de 27.8 °C / 82 F (-12.6 °C / #-22.7 F).
| Éteint/en veille | |
| Au repos | |
| Fortement sollicité |
|
Légende:
min: | |
| MSI WE72 7RJ i7-7700HQ, Quadro M2200, Samsung SM961 MZVPW256 m.2 PCI-e, IPS, 1920x1080, 17.3" | Dell Precision 7710 E3-1535M v5, FirePro W7170M, Samsung SM951 MZVPV256HDGL m.2 PCI-e, IPS LED, 1920x1080, 17.3" | Lenovo ThinkPad P70 6820HQ, Quadro M3000M, Samsung SSD PM871 MZNLN512HCJH, IPS, 3840x2160, 17.3" | HP ZBook 17 G3 TZV66eA E3-1535M v5, Quadro M3000M, Samsung SM951 MZVPV256HDGL m.2 PCI-e, IPS, 1920x1080, 17.3" | MSI GE72 7RE-046 i7-7700HQ, GeForce GTX 1050 Ti Mobile, Toshiba HG6 THNSNJ256G8NY, TN LED, 1920x1080, 17.3" | |
|---|---|---|---|---|---|
| Power Consumption | -14% | 3% | 13% | 0% | |
| Idle Minimum * (Watt) | 15 | 6.04 60% | 12.1 19% | 6.7 55% | 14 7% |
| Idle Average * (Watt) | 20.1 | 15.2 24% | 19.7 2% | 12.5 38% | 20 -0% |
| Idle Maximum * (Watt) | 23.8 | 42.3 -78% | 20.5 14% | 13.2 45% | 25 -5% |
| Load Average * (Watt) | 85.6 | 112.8 -32% | 94.3 -10% | 128.2 -50% | 82 4% |
| Load Maximum * (Watt) | 128 | 182.2 -42% | 139.6 -9% | 158.9 -24% | 135 -5% |
* ... Moindre est la valeur, meilleures sont les performances
| MSI WE72 7RJ i7-7700HQ, Quadro M2200, 51 Wh | Dell Precision 7710 E3-1535M v5, FirePro W7170M, 72 Wh | Lenovo ThinkPad P70 6820HQ, Quadro M3000M, 96 Wh | HP ZBook 17 G3 TZV66eA E3-1535M v5, Quadro M3000M, 96 Wh | MSI GE72 7RE-046 i7-7700HQ, GeForce GTX 1050 Ti Mobile, 51.4 Wh | |
|---|---|---|---|---|---|
| Autonomie de la batterie | 112% | 95% | 134% | 7% | |
| Reader / Idle (h) | 4.5 | 12.9 187% | 7.7 71% | 15.9 253% | |
| H.264 (h) | 3 | 4.7 57% | 7.5 150% | 5 67% | 3.3 10% |
| WiFi v1.3 (h) | 3 | 6.1 103% | 6 100% | 4.8 60% | 3.1 3% |
| Load (h) | 0.7 | 1.4 100% | 1.1 57% | 1.8 157% |
Points positifs
Points négatifs
Verdict

Le MSI GE72 est un bon PC portable de jeu, mais l'implémentation d'une carte graphique professionnelle suffit-elle à en faire une bonne station de travail mobile? Nous sortons non convaincus de ce test, qui montre que le WE72 a du mal face à ses concurrents. On se rappelle trop souvent de ses origines gamer et l'absence de port pour station d'accueil ou Thunderbolt 3 rend impossible toute bonne solution de station d'accueil.
Tout dépendra en grande partie des scénarios d'usage de tout un chacun, mais d'autres limitations existent en ce qui concerne les performances et les émissions. Le système de refroidissement à du mal à gérer la chaleur produite par le CPU, ce qui est bien montré par son bridage même lorsqu'on ne sollicite que ce dernier dans CineBench. Le chargeur secteur de 120 W montre également ses limites lorsqu'on sollicite simultanément le CPU et le GPU. Bien qu'on puisse contrôler soi-même les ventilateurs grâce au logiciel préinstallé, les températures élevées observées ne laissent qu'une marge de manœuvre très limitée.
Fonctionnalités professionnelles limitées et faible système de refroidissement: Le MSI WE72 n'est pas particulièrement convaincant. Mais ce dernier peut malgré tout être intéressant en fonction des usages, en particulier grâce à son prix attractif.
L'un des points forts du WE72 est son prix attractif (1799 $US), la concurrence de la part de la gamme Precision de Dell ou ThinkPad P de Lenovo revenant facilement à plus de 3000 $US. Si l'usage principal visé avec le WE72 est la CAO ou la DAO et ses applications et que les défauts cités plus haut ne nous gênent pas, le WE72 peut être un bon choix.
Pour plus de détails, la version complète de ce test (en anglais) est disponible ici.
MSI WE72 7RJ
- 05/09/2017 v6 (old)
Andreas Osthoff
Price comparison
