Courte critique du MSI GS75 Stealth 9SG (i7-9750H, RTX 2080 Max-Q, FHD) : un portable de jeu fin et puissant avec une bonne autonomie
| |||||||||||||||||||||||||
Homogénéité de la luminosité: 91 %
Valeur mesurée au centre, sur batterie: 366 cd/m²
Contraste: 1262:1 (Valeurs des noirs: 0.29 cd/m²)
ΔE ColorChecker Calman: 1.51 | ∀{0.5-29.43 Ø4.73}
calibrated: 0.71
ΔE Greyscale Calman: 1.93 | ∀{0.09-98 Ø4.97}
94% sRGB (Argyll 1.6.3 3D)
60% AdobeRGB 1998 (Argyll 1.6.3 3D)
64.7% AdobeRGB 1998 (Argyll 3D)
93.5% sRGB (Argyll 3D)
62.6% Display P3 (Argyll 3D)
Gamma: 2.38
CCT: 6881 K
| MSI GS75 Stealth 9SG Chi Mei N173HCE-G33 (CMN175C), IPS, 1920x1080 | Schenker XMG Neo 17 BOEhydis NV173FHM-N44 (BOE07B6), IPS, 1920x1080 | Dell G7 17 7790 AU Optronics AUO409D, B173HAN, IPS, 1920x1080 | Alienware m17 P37E AU Optronics B173ZAN01.0, IPS, 3840x2160 | Asus Zephyrus S GX701GX B173HAN04.0 (AUO409D), IPS, 1920x1080 | Lenovo Legion Y740-17ICH AU Optronics B173HAN03.2, IPS, 1920x1080 | |
|---|---|---|---|---|---|---|
| Display | 2% | -2% | 33% | -2% | -0% | |
| Display P3 Coverage (%) | 62.6 | 65.2 4% | 61.9 -1% | 86.4 38% | 62.9 0% | 64 2% |
| sRGB Coverage (%) | 93.5 | 92.2 -1% | 89.6 -4% | 99.9 7% | 87.8 -6% | 90.4 -3% |
| AdobeRGB 1998 Coverage (%) | 64.7 | 66.5 3% | 63.2 -2% | 99.1 53% | 63.9 -1% | 64.8 0% |
| Response Times | -91% | -80% | -287% | 2% | -73% | |
| Response Time Grey 50% / Grey 80% * (ms) | 7.2 ? | 18.8 ? -161% | 17.2 ? -139% | 35.6 ? -394% | 7.2 ? -0% | 15.6 ? -117% |
| Response Time Black / White * (ms) | 10 ? | 12 ? -20% | 12 ? -20% | 28 ? -180% | 9.6 ? 4% | 12.8 ? -28% |
| PWM Frequency (Hz) | 25510 ? | 971 ? | ||||
| Screen | -32% | -77% | -135% | -30% | -104% | |
| Brightness middle (cd/m²) | 366 | 304 -17% | 308.6 -16% | 357.9 -2% | 288 -21% | 299.1 -18% |
| Brightness (cd/m²) | 343 | 289 -16% | 299 -13% | 347 1% | 287 -16% | 273 -20% |
| Brightness Distribution (%) | 91 | 90 -1% | 92 1% | 94 3% | 91 0% | 81 -11% |
| Black Level * (cd/m²) | 0.29 | 0.26 10% | 0.29 -0% | 0.33 -14% | 0.2 31% | 0.27 7% |
| Contrast (:1) | 1262 | 1169 -7% | 1064 -16% | 1085 -14% | 1440 14% | 1108 -12% |
| Colorchecker dE 2000 * | 1.51 | 2.65 -75% | 4.26 -182% | 6.57 -335% | 2.33 -54% | 5.07 -236% |
| Colorchecker dE 2000 max. * | 3.22 | 6.11 -90% | 7.83 -143% | 9.86 -206% | 5.34 -66% | 10.55 -228% |
| Colorchecker dE 2000 calibrated * | 0.71 | 1.5 -111% | 2.93 -313% | 6.74 -849% | 2.47 -248% | 3.31 -366% |
| Greyscale dE 2000 * | 1.93 | 2.75 -42% | 5 -159% | 4.3 -123% | 1.19 38% | 6.8 -252% |
| Gamma | 2.38 92% | 2.46 89% | 2.07 106% | 2.6 85% | 2.41 91% | 2.46 89% |
| CCT | 6881 94% | 6763 96% | 7488 87% | 6403 102% | 6710 97% | 7805 83% |
| Color Space (Percent of AdobeRGB 1998) (%) | 60 | 60 0% | 57.8 -4% | 88.4 47% | 57 -5% | 58.5 -2% |
| Color Space (Percent of sRGB) (%) | 94 | 92 -2% | 89.2 -5% | 100 6% | 88 -6% | 89.9 -4% |
| Moyenne finale (programmes/paramètres) | -40% /
-33% | -53% /
-64% | -130% /
-123% | -10% /
-21% | -59% /
-81% |
* ... Moindre est la valeur, meilleures sont les performances
Temps de réponse de l'écran
| ↔ Temps de réponse noir à blanc | ||
|---|---|---|
| 10 ms ... hausse ↗ et chute ↘ combinées | ↗ 5.2 ms hausse | 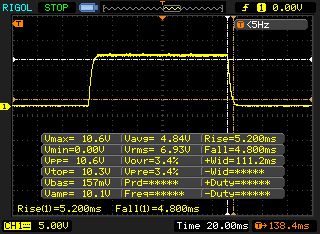 |
| ↘ 4.8 ms chute | ||
| L'écran montre de bons temps de réponse, mais insuffisant pour du jeu compétitif. En comparaison, tous les appareils testés affichent entre 0.1 (minimum) et 240 (maximum) ms. » 27 % des appareils testés affichent de meilleures performances. Cela signifie que les latences relevées sont meilleures que la moyenne (19.9 ms) de tous les appareils testés. | ||
| ↔ Temps de réponse gris 50% à gris 80% | ||
| 7.2 ms ... hausse ↗ et chute ↘ combinées | ↗ 3.8 ms hausse | 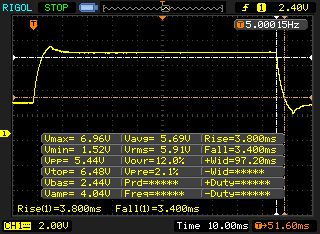 |
| ↘ 3.4 ms chute | ||
| L'écran montre de très faibles temps de réponse, parfait pour le jeu. En comparaison, tous les appareils testés affichent entre 0.165 (minimum) et 636 (maximum) ms. » 20 % des appareils testés affichent de meilleures performances. Cela signifie que les latences relevées sont meilleures que la moyenne (31.1 ms) de tous les appareils testés. | ||
Scintillement / MLI (Modulation de largeur d'impulsion)
| Scintillement / MLI (Modulation de largeur d'impulsion) décelé | 25510 Hz | ≤ 17 Niveau de luminosité | 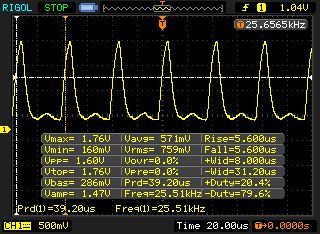 |
Le rétroéclairage de l'écran scintille à la fréquence de 25510 Hz (certainement du fait de l'utilisation d'une MDI - Modulation de largeur d'impulsion) à un niveau de luminosité inférieur ou égal à 17 % . Aucun scintillement ne devrait être perceptible au-dessus de cette valeur. La fréquence de rafraîchissement de 25510 Hz est élevée, la grande majorité des utilisateurs ne devrait pas percevoir de scintillements et être sujette à une fatigue oculaire accrue. En comparaison, 52 % des appareils testés n'emploient pas MDI pour assombrir leur écran. Nous avons relevé une moyenne à 7791 (minimum : 5 - maximum : 343500) Hz dans le cas où une MDI était active. | |||
| Cinebench R10 | |
| Rendering Single 32Bit | |
| Moyenne de la classe Gaming (7457 - 11779, n=8, 2 dernières années) | |
| MSI GS75 Stealth 9SG | |
| Rendering Multiple CPUs 32Bit | |
| Moyenne de la classe Gaming (42932 - 81339, n=8, 2 dernières années) | |
| MSI GS75 Stealth 9SG | |
| Cinebench R20 | |
| CPU (Single Core) | |
| Moyenne de la classe Gaming (442 - 895, n=109, 2 dernières années) | |
| MSI GS75 Stealth 9SG | |
| CPU (Multi Core) | |
| Moyenne de la classe Gaming (4029 - 16108, n=109, 2 dernières années) | |
| MSI GS75 Stealth 9SG | |
| Geekbench 3 | |
| 32 Bit Multi-Core Score | |
| MSI GS75 Stealth 9SG | |
| 32 Bit Single-Core Score | |
| MSI GS75 Stealth 9SG | |
| Geekbench 4.4 | |
| 64 Bit Multi-Core Score | |
| Moyenne de la classe Gaming (89200 - 97490, n=2, 2 dernières années) | |
| MSI GS75 Stealth 9SG | |
| 64 Bit Single-Core Score | |
| Moyenne de la classe Gaming (9335 - 9492, n=2, 2 dernières années) | |
| MSI GS75 Stealth 9SG | |
| Mozilla Kraken 1.1 - Total | |
| Lenovo Legion Y740-17ICH (Edge 44.17763.1.0) | |
| MSI GS75 Stealth 9SG (Edge 44) | |
| Moyenne de la classe Gaming (391 - 590, n=104, 2 dernières années) | |
| Octane V2 - Total Score | |
| Moyenne de la classe Gaming (89353 - 139447, n=29, 2 dernières années) | |
| MSI GS75 Stealth 9SG (Edge 44) | |
| Lenovo Legion Y740-17ICH (Edge 44.17763.1.0) | |
| JetStream 1.1 - 1.1 Total | |
| Moyenne de la classe Gaming (533 - 647, n=4, 2 dernières années) | |
| MSI GS75 Stealth 9SG (Edge 44) | |
| Lenovo Legion Y740-17ICH (Edge 44.17763.1.0) | |
* ... Moindre est la valeur, meilleures sont les performances
| PCMark 7 Score | 6948 points | |
| PCMark 8 Home Score Accelerated v2 | 4461 points | |
| PCMark 8 Creative Score Accelerated v2 | 4193 points | |
| PCMark 8 Work Score Accelerated v2 | 5716 points | |
| PCMark 10 Score | 5804 points | |
Aide | ||
| PCMark 8 | |
| Home Score Accelerated v2 | |
| Moyenne de la classe Gaming (n=12 dernières années) | |
| Lenovo Legion Y740-17ICH | |
| MSI GS75 Stealth 9SG | |
| Dell G7 17 7790 | |
| Alienware m17 P37E | |
| Work Score Accelerated v2 | |
| Lenovo Legion Y740-17ICH | |
| MSI GS75 Stealth 9SG | |
| Dell G7 17 7790 | |
| Alienware m17 P37E | |
| Moyenne de la classe Gaming (n=12 dernières années) | |

| MSI GS75 Stealth 9SG 2x Samsung SSD PM981 MZVLB1T0HALR (RAID 0) | Schenker XMG Neo 17 Samsung SSD 970 EVO Plus 1TB | Dell G7 17 7790 Toshiba BG3 KBG30ZMS256G | Alienware m17 P37E SK Hynix PC401 512GB M.2 (HFS512GD9TNG) | Asus Zephyrus S GX701GX Samsung SSD PM981 MZVLB1T0HALR | Lenovo Legion Y740-17ICH Samsung SSD PM981 MZVLB256HAHQ | |
|---|---|---|---|---|---|---|
| CrystalDiskMark 5.2 / 6 | -21% | -56% | -17% | -27% | -18% | |
| Write 4K (MB/s) | 95.5 | 92.7 -3% | 78.6 -18% | 120.2 26% | 92.4 -3% | 99.8 5% |
| Read 4K (MB/s) | 42.59 | 41.4 -3% | 31.89 -25% | 44.3 4% | 39.59 -7% | 40.81 -4% |
| Write Seq (MB/s) | 2851 | 1363 -52% | 230.4 -92% | 1278 -55% | 1221 -57% | 1385 -51% |
| Read Seq (MB/s) | 2696 | 1259 -53% | 925 -66% | 1389 -48% | 1005 -63% | 2089 -23% |
| Write 4K Q32T1 (MB/s) | 402.6 | 289.7 -28% | 159.1 -60% | 436.2 8% | 292.5 -27% | 380 -6% |
| Read 4K Q32T1 (MB/s) | 443.9 | 337.5 -24% | 315.6 -29% | 515 16% | 330.8 -25% | 445.5 0% |
| Write Seq Q32T1 (MB/s) | 3420 | 3332 -3% | 230.7 -93% | 1157 -66% | 2385 -30% | 1380 -60% |
| Read Seq Q32T1 (MB/s) | 3514 | 3477 -1% | 1323 -62% | 2671 -24% | 3339 -5% | 3471 -1% |
| 3DMark 06 Standard Score | 37968 points | |
| 3DMark 11 Performance | 21390 points | |
| 3DMark Cloud Gate Standard Score | 34168 points | |
| 3DMark Fire Strike Score | 17182 points | |
| 3DMark Time Spy Score | 7518 points | |
Aide | ||
| The Witcher 3 - 1920x1080 Ultra Graphics & Postprocessing (HBAO+) | |
| Moyenne de la classe Gaming (95 - 240, n=8, 2 dernières années) | |
| Asus Zephyrus S GX701GX | |
| MSI GS75 Stealth 9SG | |
| Alienware m17 P37E | |
| Lenovo Legion Y740-17ICH | |
| Schenker XMG Neo 17 | |
| Dell G7 17 7790 | |
| BioShock Infinite - 1920x1080 Ultra Preset, DX11 (DDOF) | |
| Alienware m17 P37E | |
| MSI GS75 Stealth 9SG | |
| Lenovo Legion Y740-17ICH | |
| Dell G7 17 7790 | |
| Far Cry New Dawn - 1920x1080 Ultra Preset | |
| MSI GS75 Stealth 9SG | |
| Schenker XMG Neo 17 | |
| Batman: Arkham Knight - 1920x1080 High / On AA:SM AF:16x | |
| MSI GS75 Stealth 9SG | |
| Bas | Moyen | Élevé | Ultra | |
|---|---|---|---|---|
| BioShock Infinite (2013) | 331.1 | 289.6 | 263.6 | 163.7 |
| The Witcher 3 (2015) | 286.3 | 217.2 | 135 | 76.9 |
| Batman: Arkham Knight (2015) | 172 | 161 | 134 | 92 |
| Ashes of the Singularity (2016) | 82.5 | 80.7 | 81.3 | |
| Ark Survival Evolved (2017) | 160.9 | 87.9 | 63.5 | 43.9 |
| Final Fantasy XV Benchmark (2018) | 127.4 | 100.7 | 74 | |
| Far Cry 5 (2018) | 123 | 109 | 99 | 95 |
| Far Cry New Dawn (2019) | 116 | 98 | 94 | 85 |
| Anno 1800 (2019) | 98.5 | 93.9 | 77.7 | 41.2 |
| Rage 2 (2019) | 206.6 | 112.2 | 96.1 | 93.3 |
Degré de la nuisance sonore
| Au repos |
| 31 / 32 / 38 dB(A) |
| Fortement sollicité |
| 47 / 49 dB(A) |
 | ||
30 dB silencieux 40 dB(A) audible 50 dB(A) bruyant |
||
min: | ||
| MSI GS75 Stealth 9SG i7-9750H, GeForce RTX 2080 Max-Q | Schenker XMG Neo 17 i7-8750H, GeForce RTX 2070 Mobile | Dell G7 17 7790 i7-8750H, GeForce RTX 2070 Max-Q | Alienware m17 P37E i9-8950HK, GeForce RTX 2080 Max-Q | Asus Zephyrus S GX701GX i7-8750H, GeForce RTX 2080 Max-Q | Lenovo Legion Y740-17ICH i7-8750H, GeForce RTX 2080 Max-Q | Moyenne de la classe Gaming | |
|---|---|---|---|---|---|---|---|
| Noise | 4% | 10% | 4% | 2% | 10% | 12% | |
| arrêt / environnement * (dB) | 30 | 29 3% | 28.2 6% | 28.2 6% | 29 3% | 28.3 6% | 24.1 ? 20% |
| Idle Minimum * (dB) | 31 | 29 6% | 28.6 8% | 28.2 9% | 29 6% | 31.5 -2% | 25.8 ? 17% |
| Idle Average * (dB) | 32 | 32 -0% | 28.6 11% | 28.2 12% | 32 -0% | 31.6 1% | 27.4 ? 14% |
| Idle Maximum * (dB) | 38 | 33 13% | 28.6 25% | 31 18% | 33 13% | 31.6 17% | 29.9 ? 21% |
| Load Average * (dB) | 47 | 42 11% | 31.8 32% | 50.8 -8% | 47 -0% | 32.3 31% | 43 ? 9% |
| Witcher 3 ultra * (dB) | 48 | 49 -2% | 50.6 -5% | 50.8 -6% | 49 -2% | 43 10% | |
| Load Maximum * (dB) | 49 | 49 -0% | 50.8 -4% | 50.8 -4% | 51 -4% | 45.5 7% | 54 ? -10% |
* ... Moindre est la valeur, meilleures sont les performances
(-) La température maximale du côté supérieur est de 55 °C / 131 F, par rapport à la moyenne de 40.4 °C / 105 F, allant de 21.2 à 68.8 °C pour la classe Gaming.
(-) Le fond chauffe jusqu'à un maximum de 65 °C / 149 F, contre une moyenne de 43.2 °C / 110 F
(+) En utilisation inactive, la température moyenne du côté supérieur est de 28.9 °C / 84 F, par rapport à la moyenne du dispositif de 33.9 °C / 93 F.
(-) En jouant à The Witcher 3, la température moyenne du côté supérieur est de 47.1 °C / 117 F, alors que la moyenne de l'appareil est de 33.9 °C / 93 F.
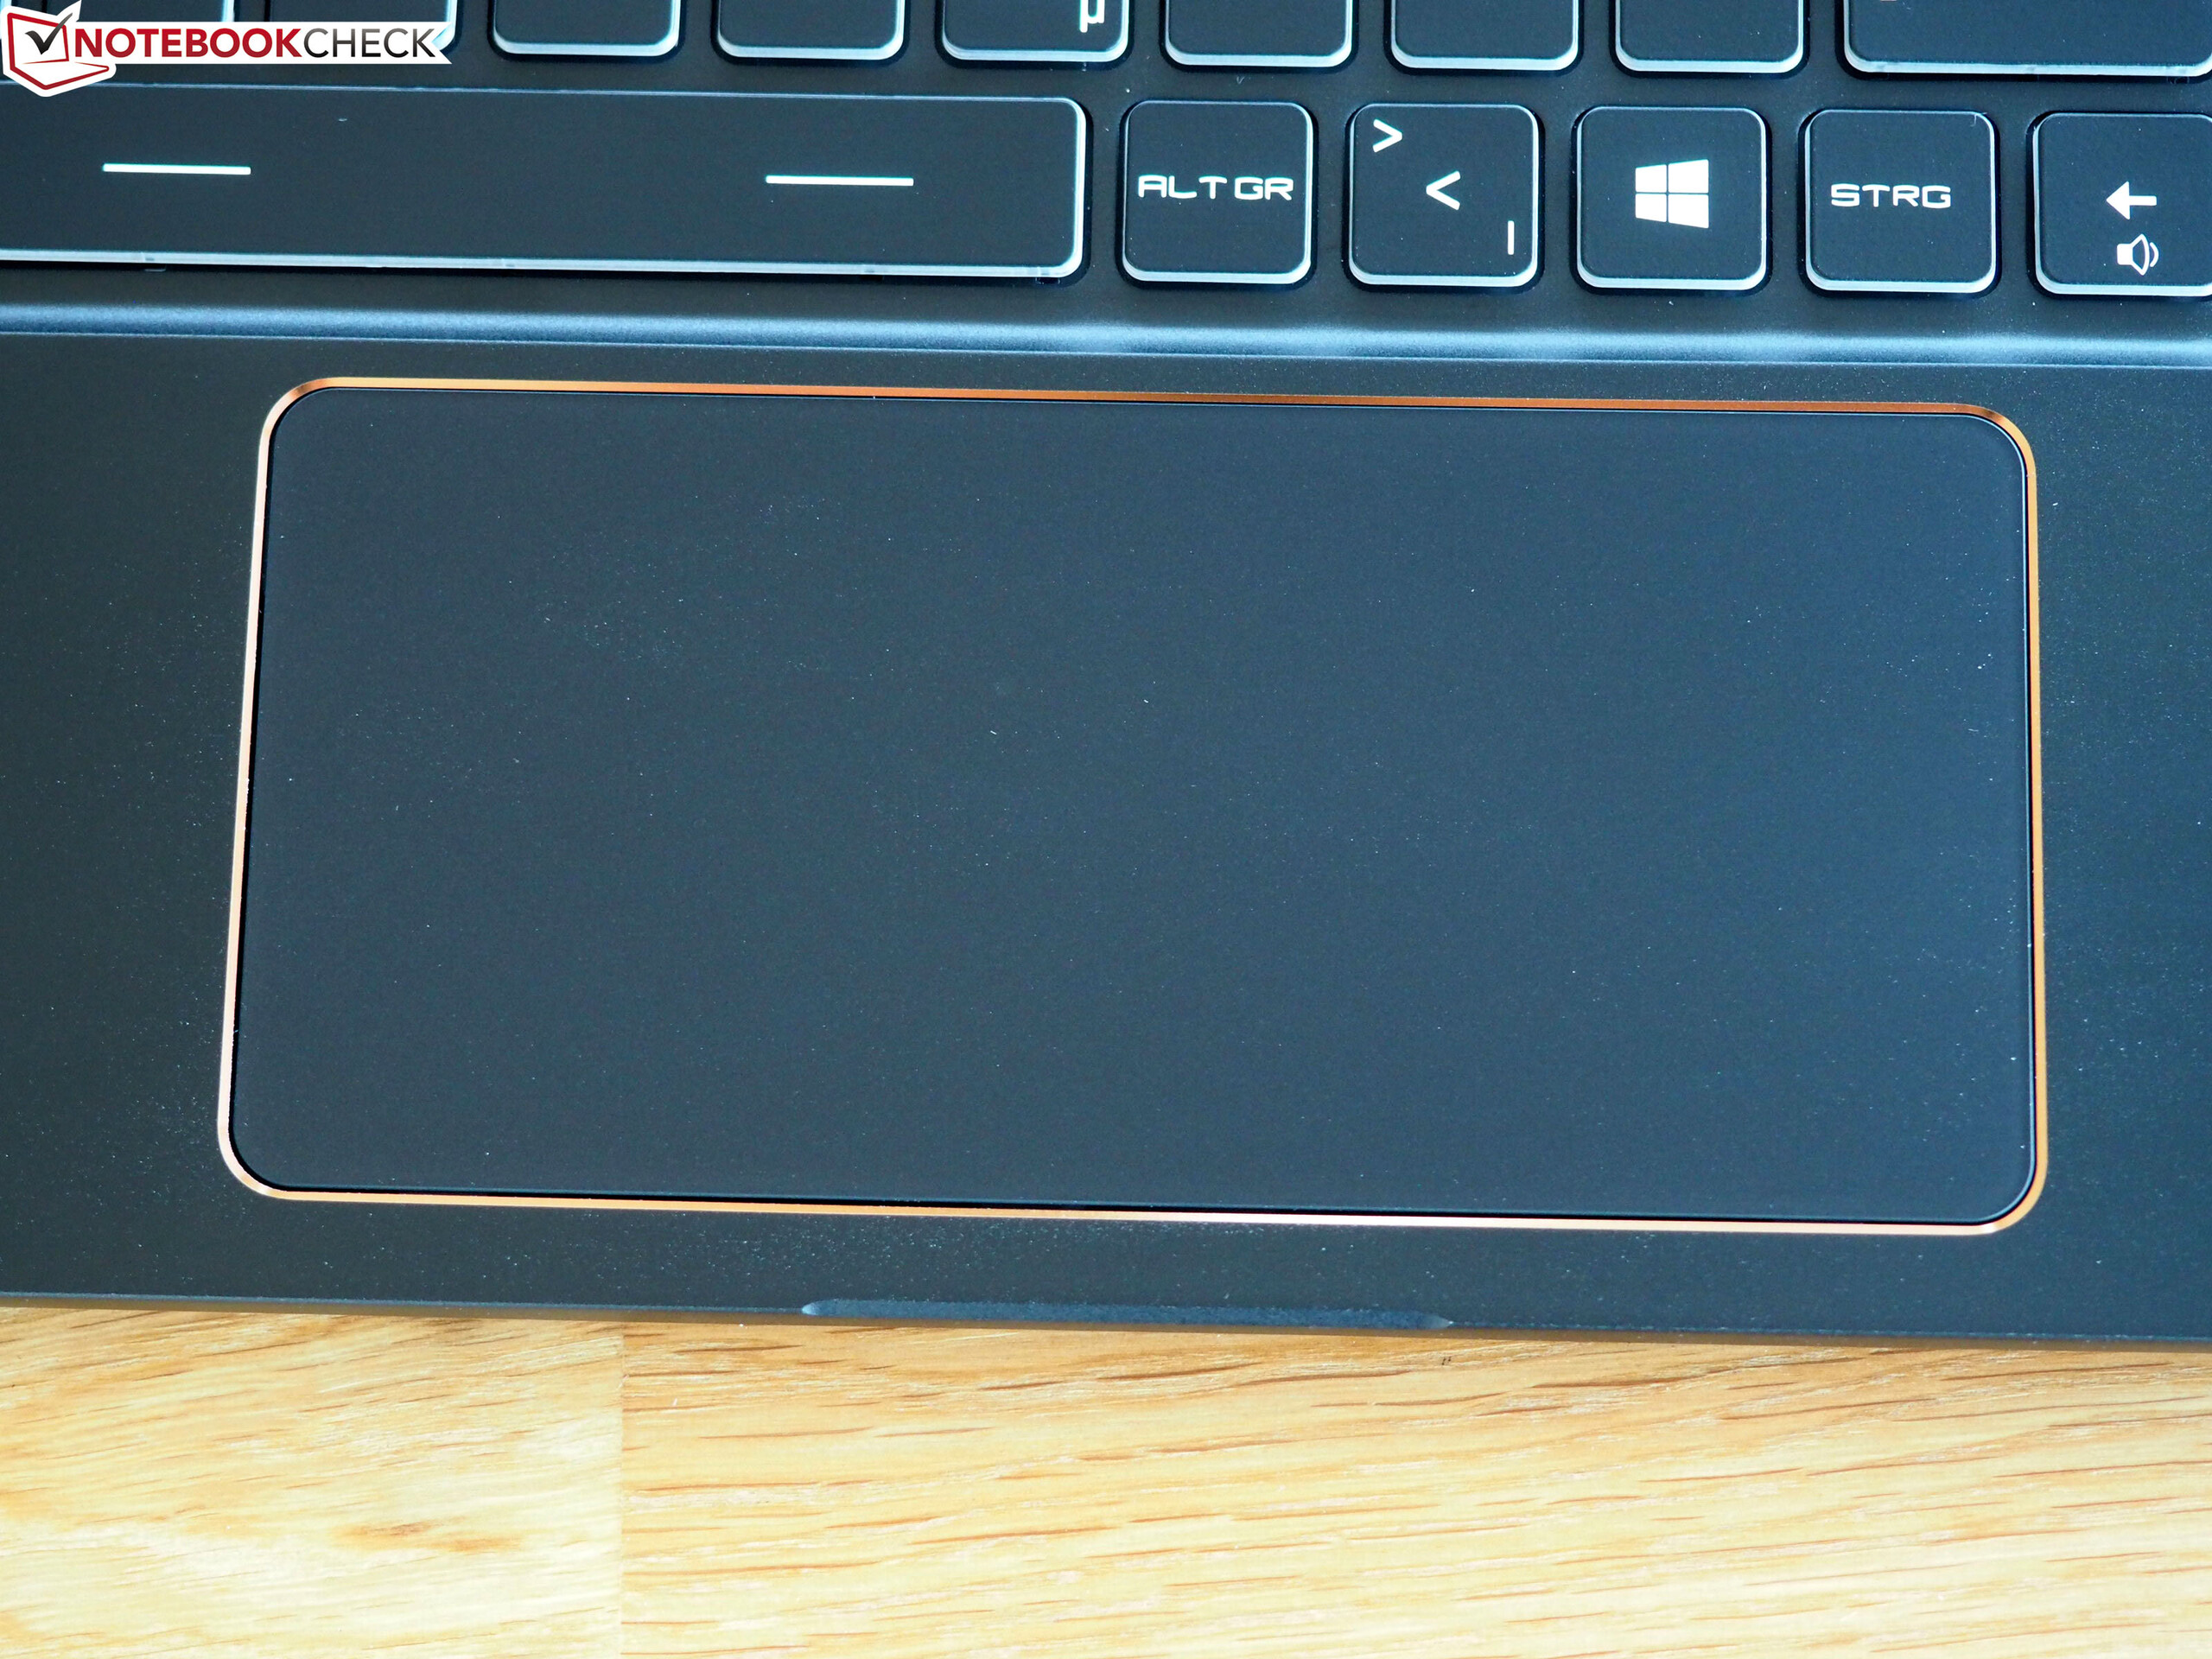
(-) Les repose-poignets et le pavé tactile peuvent devenir très chauds au toucher, avec un maximum de 45 °C / 113# F.
(-) La température moyenne de la zone de l'appui-paume de dispositifs similaires était de 28.8 °C / 83.8 F (-16.2 °C / #-29.2 F).
| MSI GS75 Stealth 9SG i7-9750H, GeForce RTX 2080 Max-Q | Schenker XMG Neo 17 i7-8750H, GeForce RTX 2070 Mobile | Dell G7 17 7790 i7-8750H, GeForce RTX 2070 Max-Q | Alienware m17 P37E i9-8950HK, GeForce RTX 2080 Max-Q | Asus Zephyrus S GX701GX i7-8750H, GeForce RTX 2080 Max-Q | Lenovo Legion Y740-17ICH i7-8750H, GeForce RTX 2080 Max-Q | Moyenne de la classe Gaming | |
|---|---|---|---|---|---|---|---|
| Heat | 11% | 1% | 2% | 11% | 13% | 8% | |
| Maximum Upper Side * (°C) | 55 | 47 15% | 46.6 15% | 55 -0% | 53 4% | 38.6 30% | 45.2 ? 18% |
| Maximum Bottom * (°C) | 65 | 56 14% | 57 12% | 60 8% | 50 23% | 43.6 33% | 47.9 ? 26% |
| Idle Upper Side * (°C) | 30 | 28 7% | 34.4 -15% | 30.4 -1% | 27 10% | 30.2 -1% | 31.1 ? -4% |
| Idle Bottom * (°C) | 32 | 30 6% | 34.6 -8% | 31.8 1% | 30 6% | 35 -9% | 34.2 ? -7% |
* ... Moindre est la valeur, meilleures sont les performances
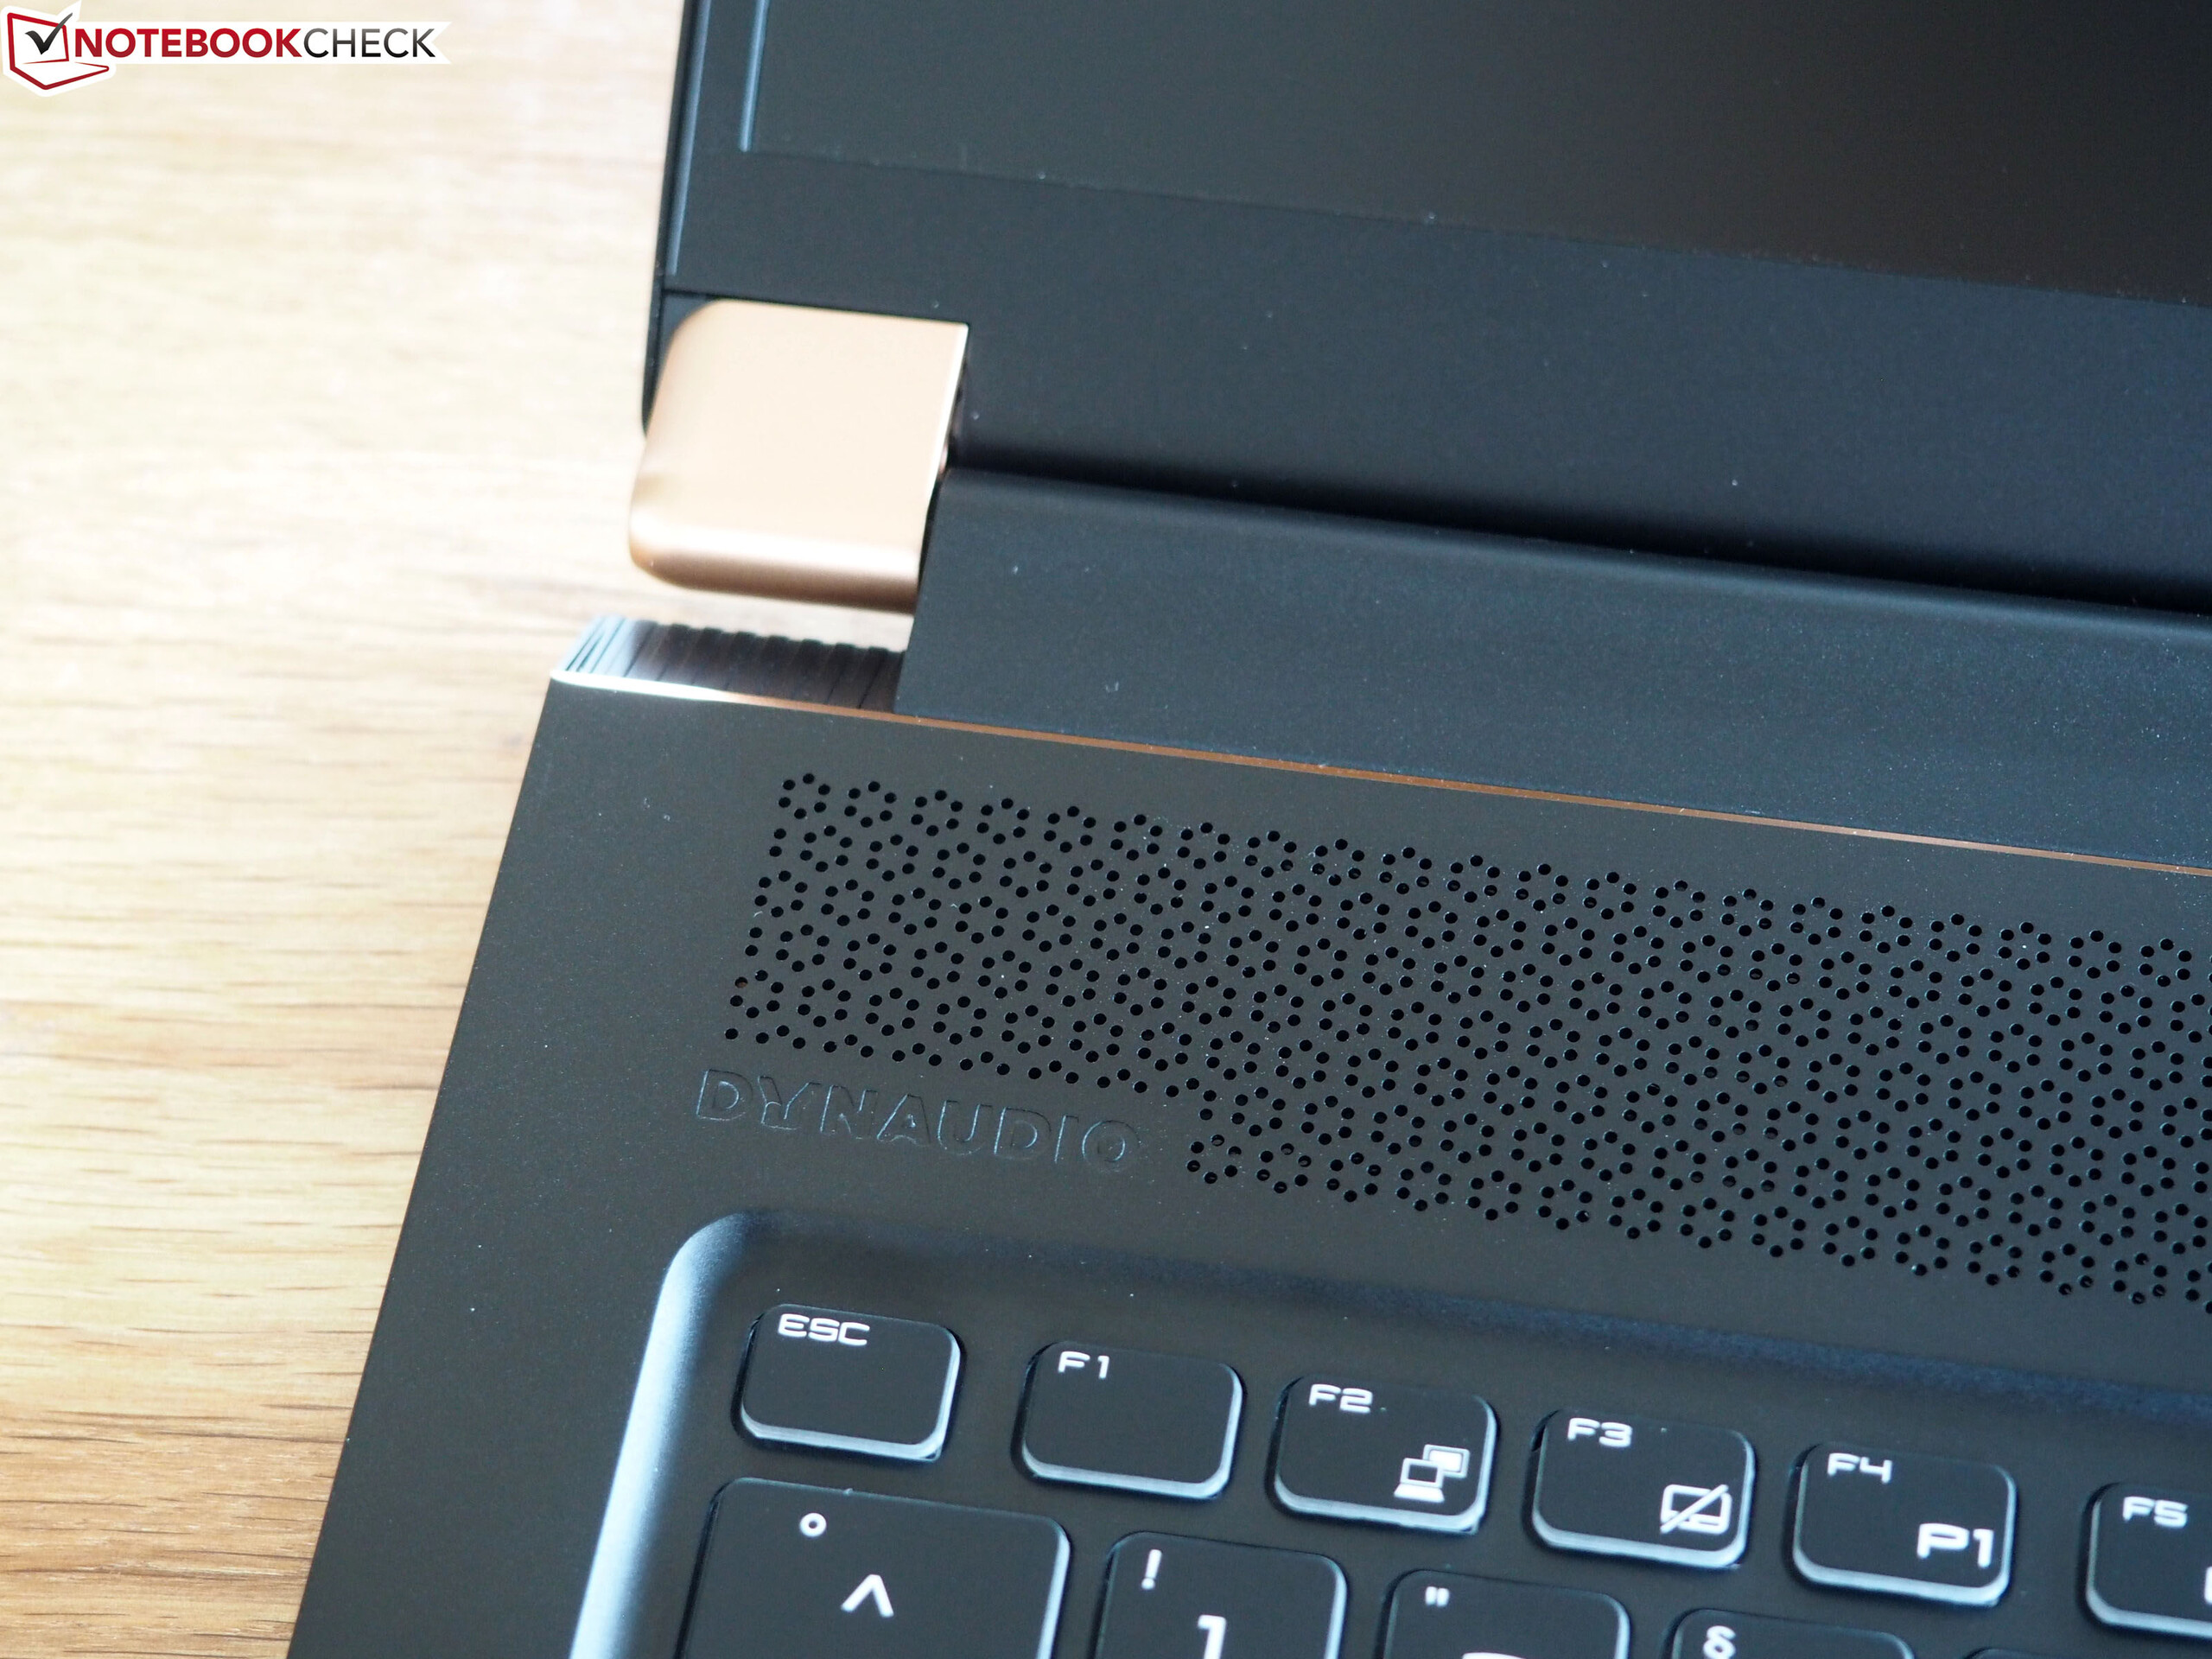
MSI GS75 Stealth 9SG analyse audio
(±) | le niveau sonore du haut-parleur est moyen mais bon (81# dB)
Basses 100 - 315 Hz
(-) | presque aucune basse - en moyenne 28.4% plus bas que la médiane
(±) | la linéarité des basses est moyenne (7.8% delta à la fréquence précédente)
Médiums 400 - 2000 Hz
(±) | médiane réduite - en moyenne 5.8% inférieure à la médiane
(±) | la linéarité des médiums est moyenne (10% delta à la fréquence précédente)
Aiguës 2 - 16 kHz
(+) | des sommets équilibrés - à seulement 2.3% de la médiane
(+) | les aigus sont linéaires (3.9% delta à la fréquence précédente)
Globalement 100 - 16 000 Hz
(±) | la linéarité du son global est moyenne (23.2% de différence avec la médiane)
Par rapport à la même classe
» 84% de tous les appareils testés de cette catégorie étaient meilleurs, 4% similaires, 11% pires
» Le meilleur avait un delta de 6%, la moyenne était de 18%, le pire était de 132%.
Par rapport à tous les appareils testés
» 69% de tous les appareils testés étaient meilleurs, 5% similaires, 25% pires
» Le meilleur avait un delta de 4%, la moyenne était de 24%, le pire était de 134%.
MSI GE75 9SG analyse audio
(+) | les haut-parleurs peuvent jouer relativement fort (92.8# dB)
Basses 100 - 315 Hz
(±) | basse réduite - en moyenne 12.2% inférieure à la médiane
(±) | la linéarité des basses est moyenne (8.7% delta à la fréquence précédente)
Médiums 400 - 2000 Hz
(±) | médiane supérieure - en moyenne 6.7% supérieure à la médiane
(±) | la linéarité des médiums est moyenne (11.5% delta à la fréquence précédente)
Aiguës 2 - 16 kHz
(+) | des sommets équilibrés - à seulement 2.9% de la médiane
(±) | la linéarité des aigus est moyenne (7.6% delta à la fréquence précédente)
Globalement 100 - 16 000 Hz
(±) | la linéarité du son global est moyenne (16.5% de différence avec la médiane)
Par rapport à la même classe
» 42% de tous les appareils testés de cette catégorie étaient meilleurs, 7% similaires, 51% pires
» Le meilleur avait un delta de 6%, la moyenne était de 18%, le pire était de 132%.
Par rapport à tous les appareils testés
» 28% de tous les appareils testés étaient meilleurs, 6% similaires, 66% pires
» Le meilleur avait un delta de 4%, la moyenne était de 24%, le pire était de 134%.
| Éteint/en veille | |
| Au repos | |
| Fortement sollicité |
|
Légende:
min: | |
| MSI GS75 Stealth 9SG i7-9750H, GeForce RTX 2080 Max-Q | Schenker XMG Neo 17 i7-8750H, GeForce RTX 2070 Mobile | Dell G7 17 7790 i7-8750H, GeForce RTX 2070 Max-Q | Alienware m17 P37E i9-8950HK, GeForce RTX 2080 Max-Q | Asus Zephyrus S GX701GX i7-8750H, GeForce RTX 2080 Max-Q | Lenovo Legion Y740-17ICH i7-8750H, GeForce RTX 2080 Max-Q | Moyenne de la classe Gaming | |
|---|---|---|---|---|---|---|---|
| Power Consumption | 5% | 10% | -36% | -16% | -15% | -6% | |
| Idle Minimum * (Watt) | 13 | 13 -0% | 9.5 27% | 21.2 -63% | 19 -46% | 20.2 -55% | 13.2 ? -2% |
| Idle Average * (Watt) | 17 | 16 6% | 16.2 5% | 29.6 -74% | 22 -29% | 27.2 -60% | 18.9 ? -11% |
| Idle Maximum * (Watt) | 25 | 21 16% | 23.8 5% | 34 -36% | 30 -20% | 28.7 -15% | 24.3 ? 3% |
| Load Average * (Watt) | 96 | 96 -0% | 101.7 -6% | 130.9 -36% | 104 -8% | 90.8 5% | 108.3 ? -13% |
| Witcher 3 ultra * (Watt) | 156 | 172 -10% | 155 1% | 177.5 -14% | 167 -7% | 152.1 2% | |
| Load Maximum * (Watt) | 239 | 191 20% | 172.2 28% | 219.7 8% | 203 15% | 165.4 31% | 254 ? -6% |
* ... Moindre est la valeur, meilleures sont les performances
| MSI GS75 Stealth 9SG i7-9750H, GeForce RTX 2080 Max-Q, 80.25 Wh | Schenker XMG Neo 17 i7-8750H, GeForce RTX 2070 Mobile, 46.74 Wh | Dell G7 17 7790 i7-8750H, GeForce RTX 2070 Max-Q, 60 Wh | Alienware m17 P37E i9-8950HK, GeForce RTX 2080 Max-Q, 90 Wh | Asus Zephyrus S GX701GX i7-8750H, GeForce RTX 2080 Max-Q, 76 Wh | Lenovo Legion Y740-17ICH i7-8750H, GeForce RTX 2080 Max-Q, 76 Wh | Moyenne de la classe Gaming | |
|---|---|---|---|---|---|---|---|
| Autonomie de la batterie | -31% | 14% | -11% | -32% | -47% | 19% | |
| Reader / Idle (h) | 7.7 | 5.3 -31% | 8.5 10% | 9.1 18% | 5 -35% | 8.71 ? 13% | |
| H.264 (h) | 6.8 | 8.26 ? 21% | |||||
| WiFi v1.3 (h) | 6 | 3.7 -38% | 3.9 -35% | 4.9 -18% | 3.8 -37% | 3.2 -47% | 7.04 ? 17% |
| Load (h) | 1.2 | 0.9 -25% | 2 67% | 0.8 -33% | 0.9 -25% | 1.47 ? 23% |
Points positifs
Points négatifs
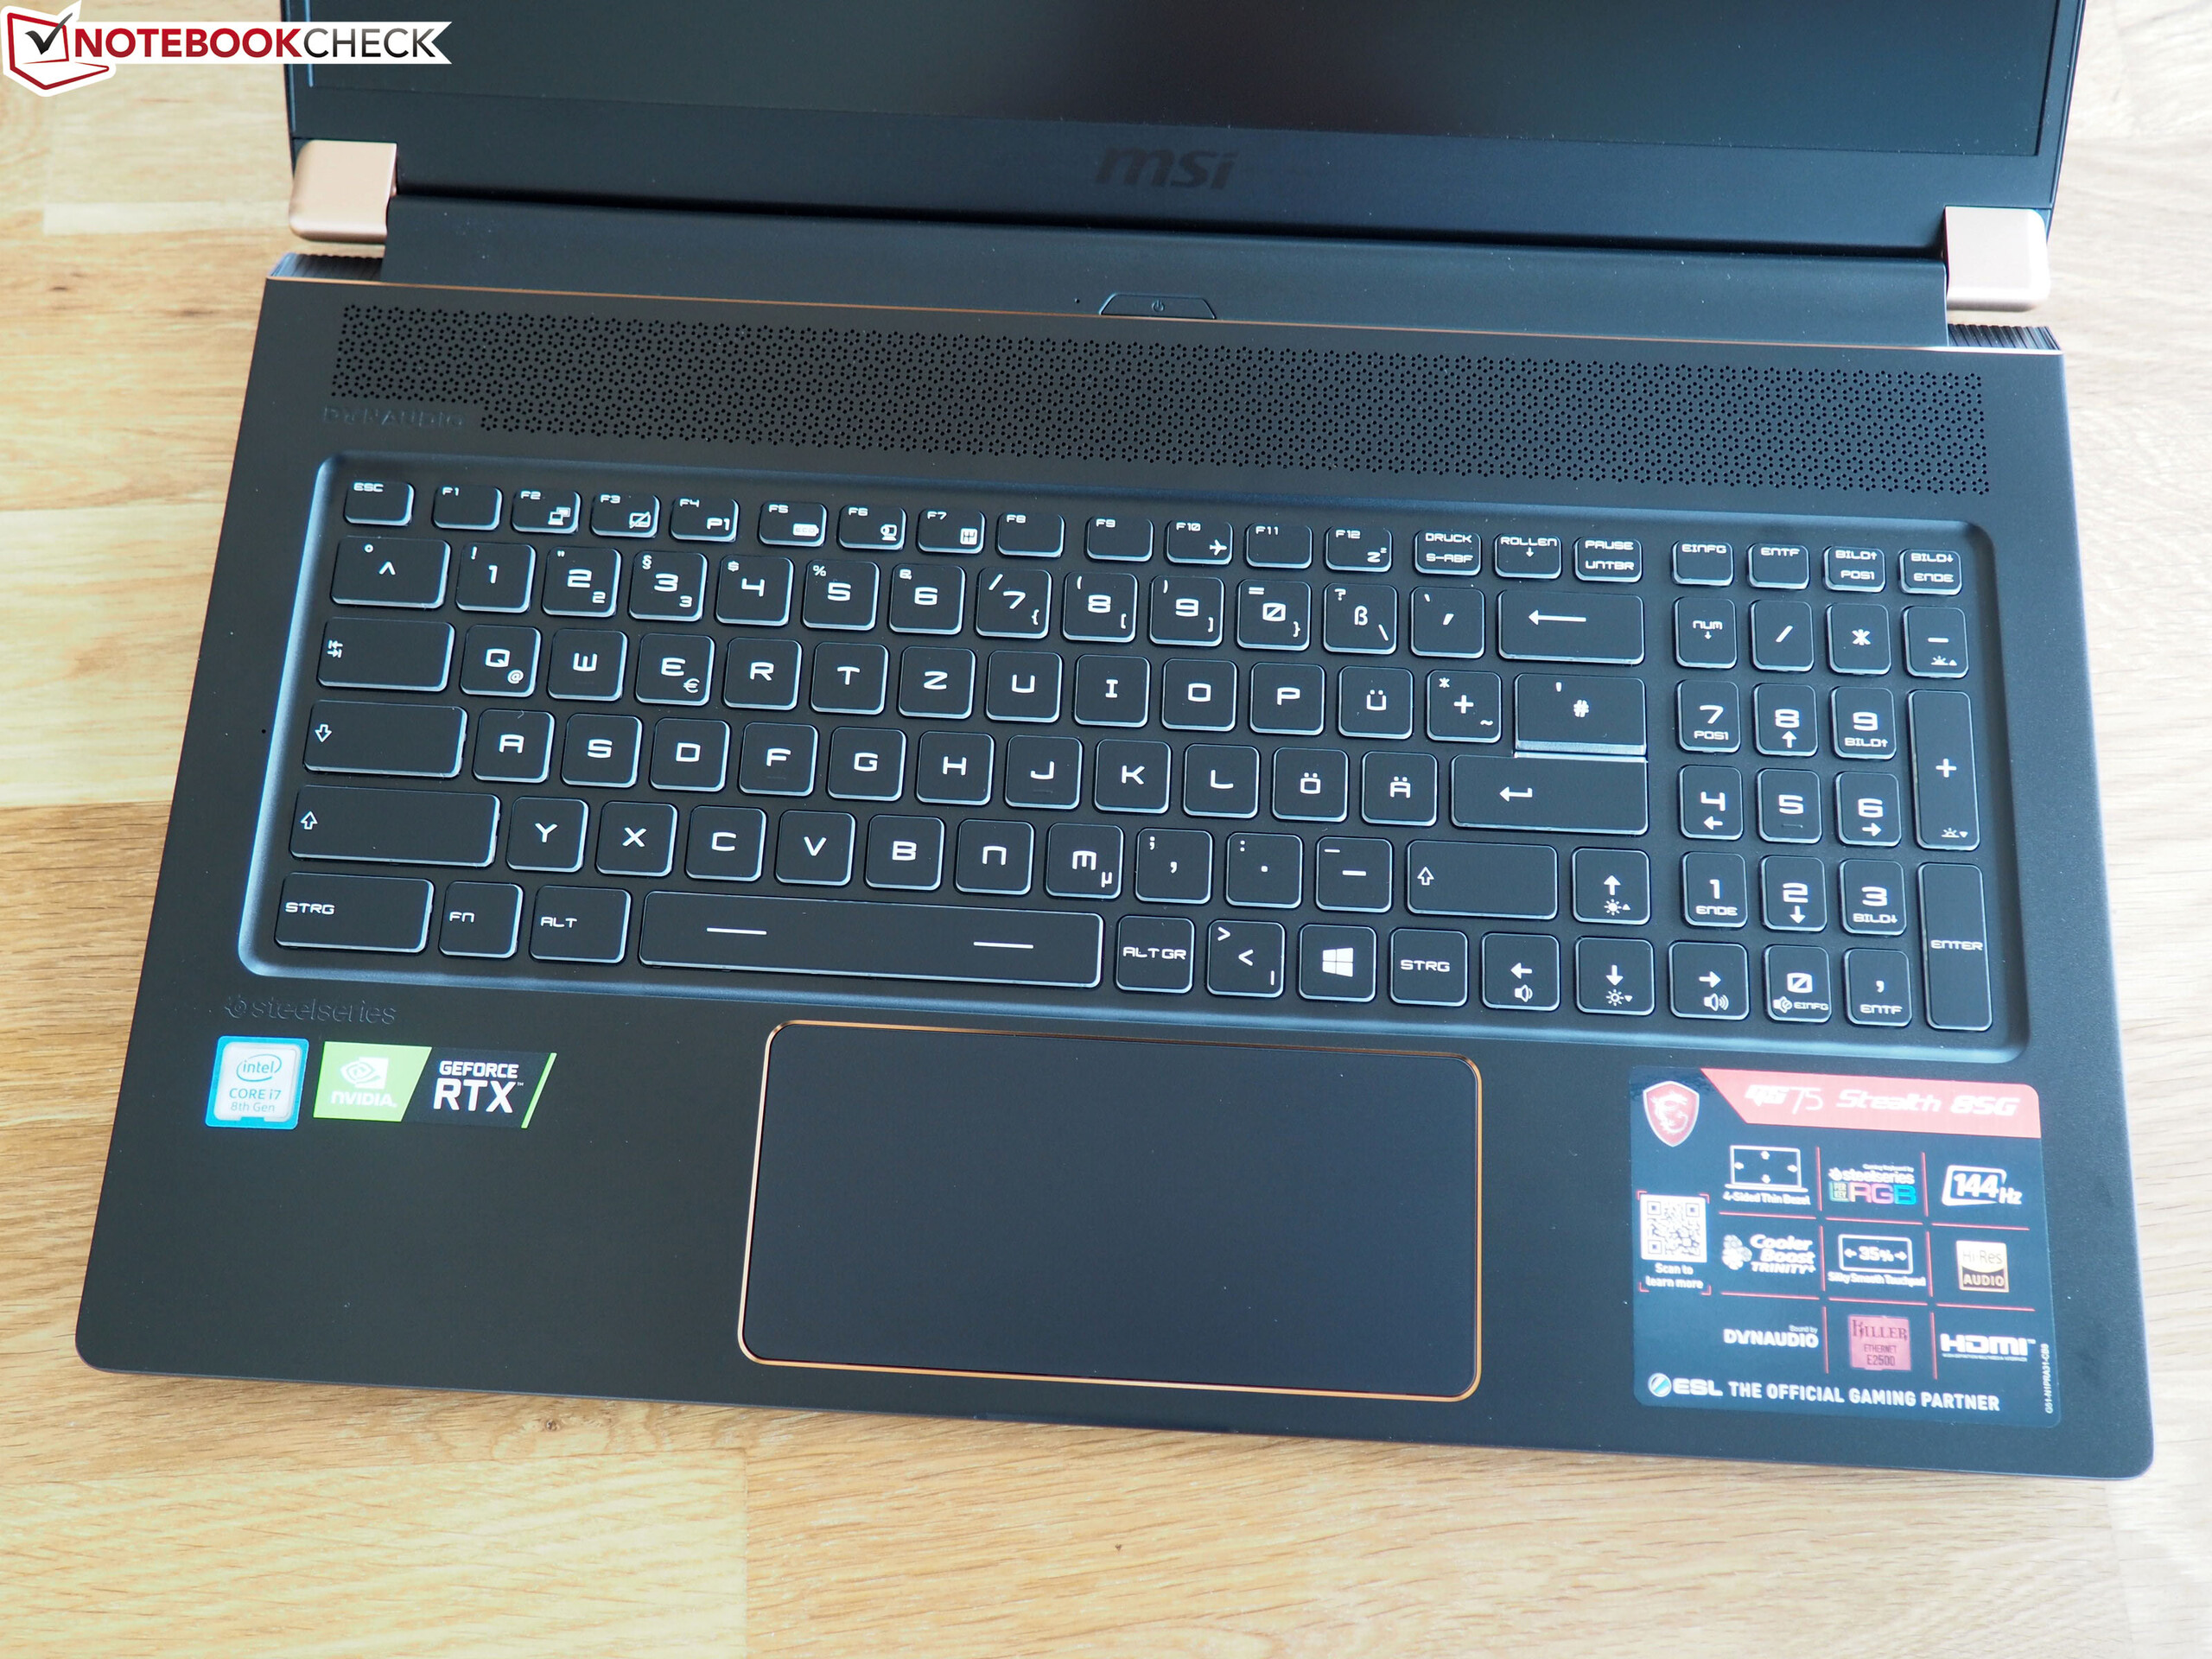
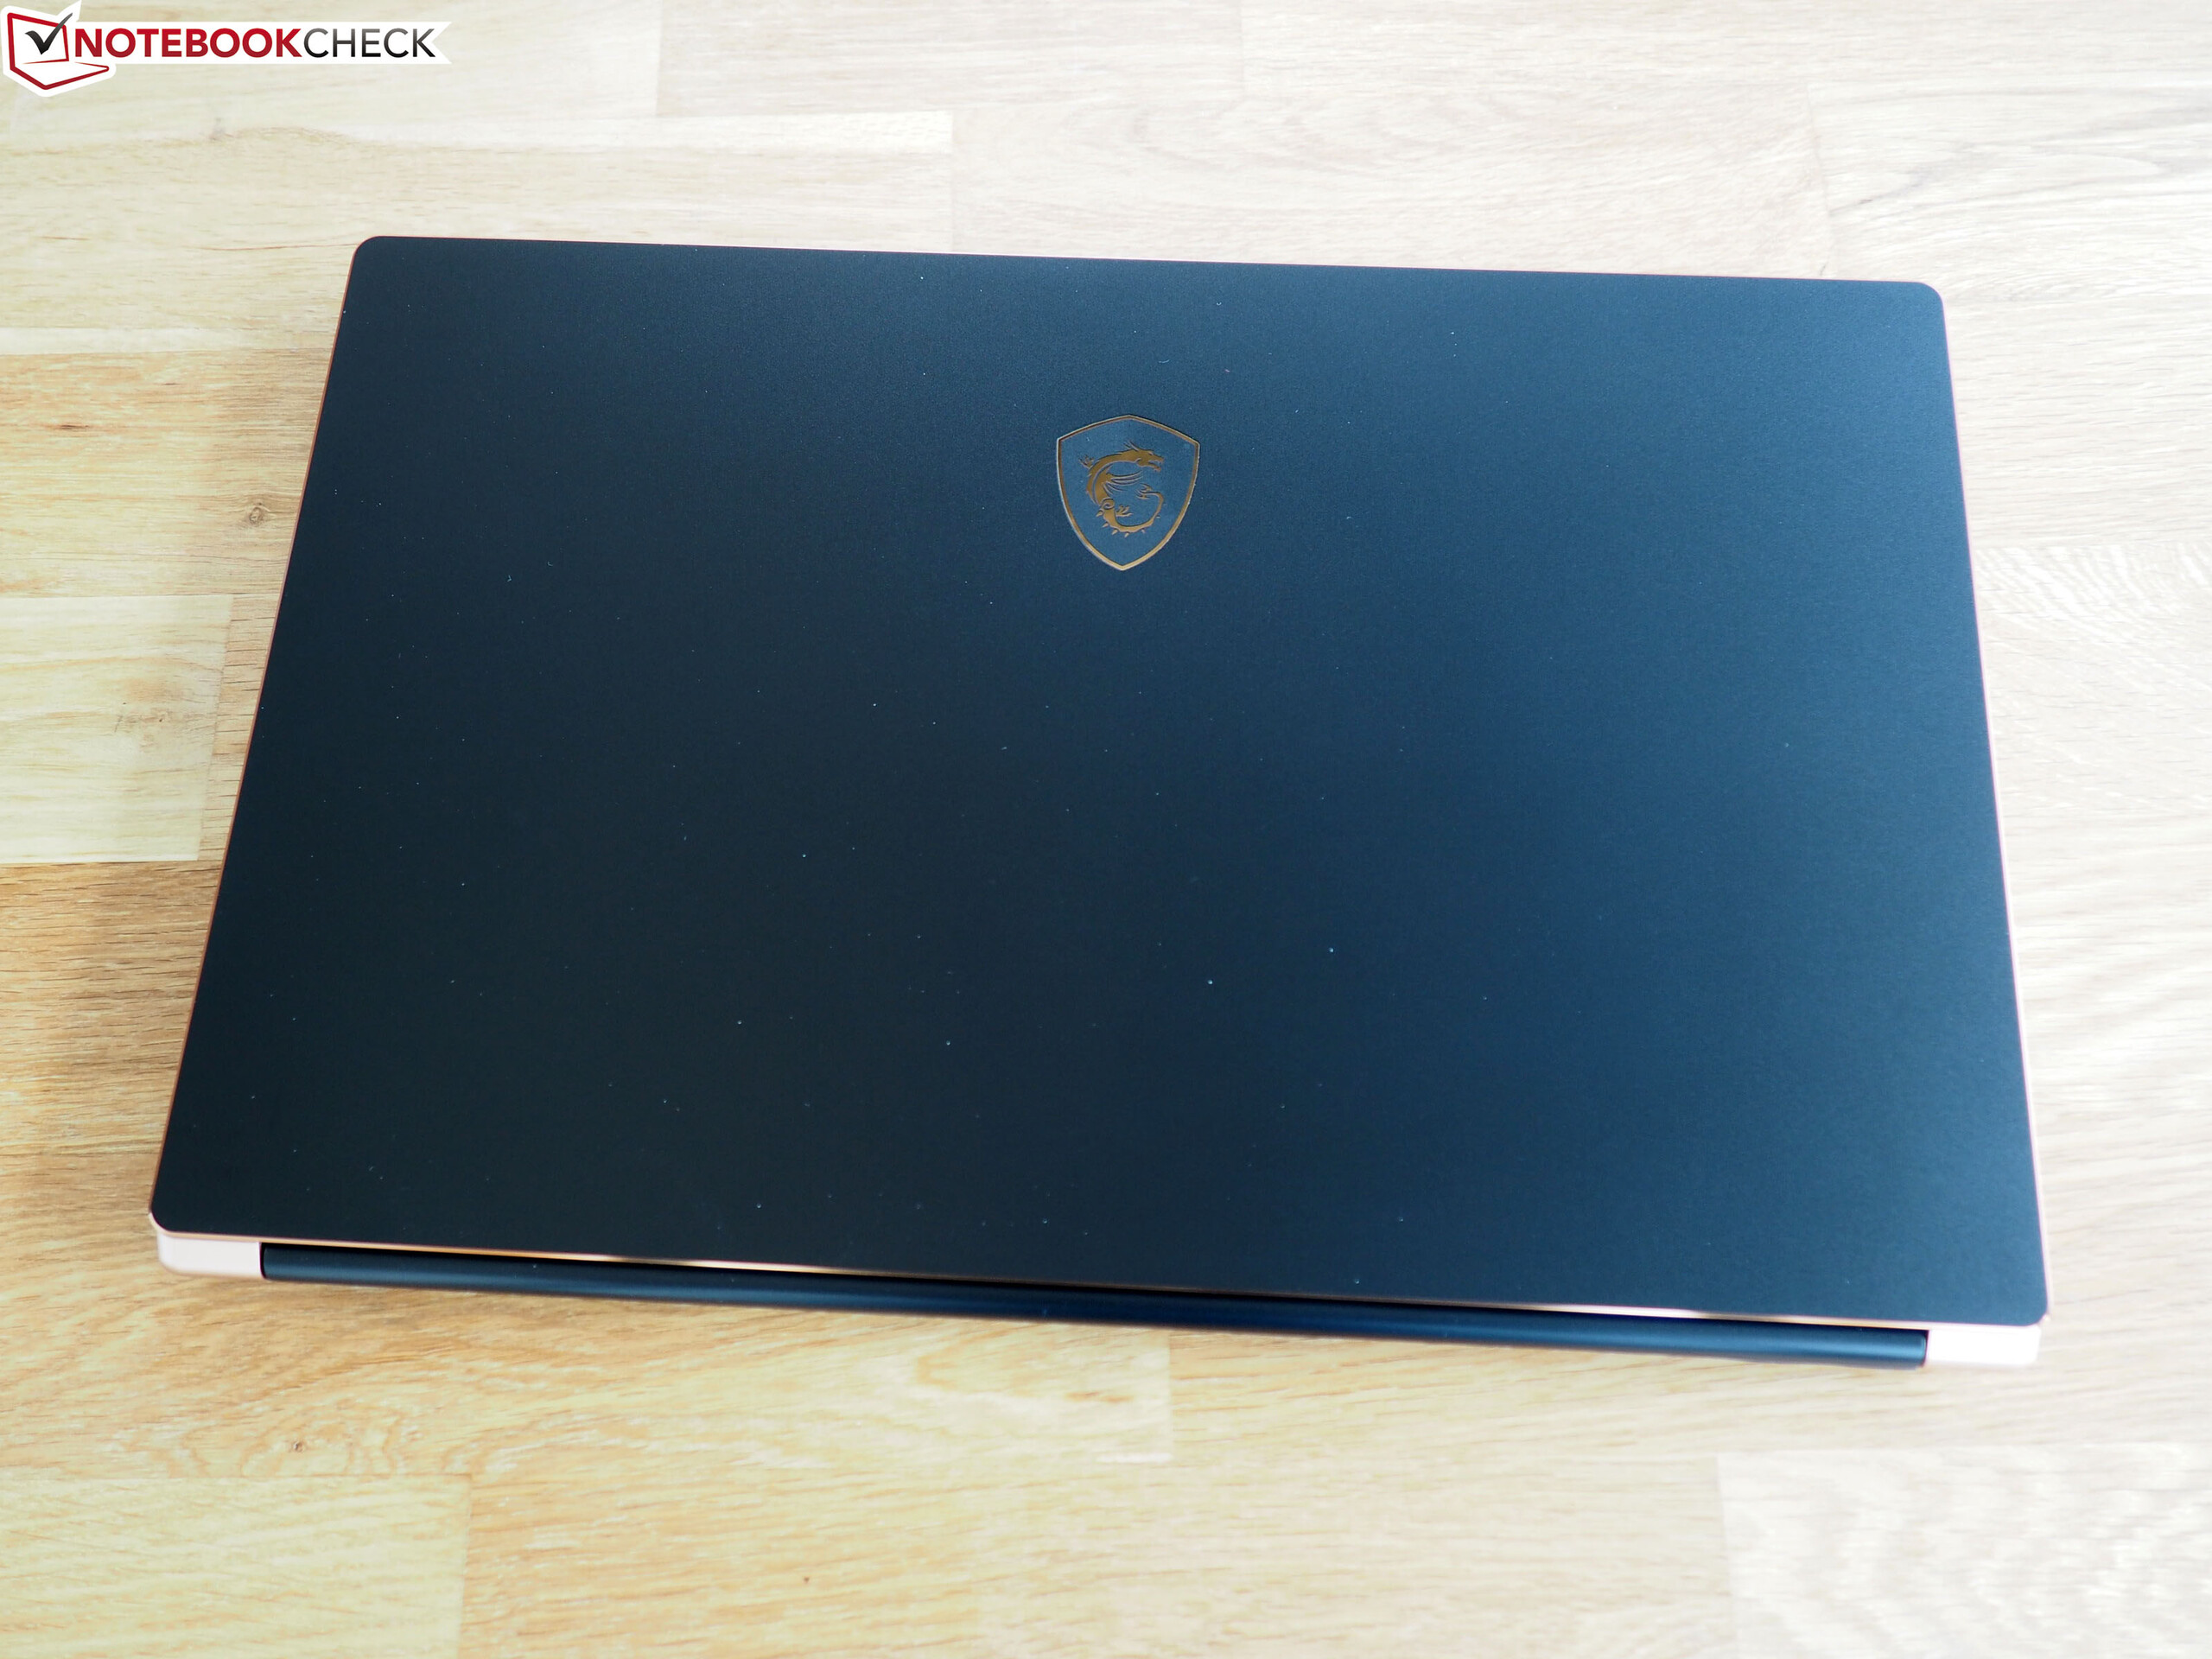
Le MSI GS75 Stealth 9SG est un portable de jeu fin puissant. Malheureusement, alors que l’appareil semble élégant pour des standards de jeu, il pourrait être plus rigide. Espérons que MSI corrige cela en renforçant ou revoyant le châssis.
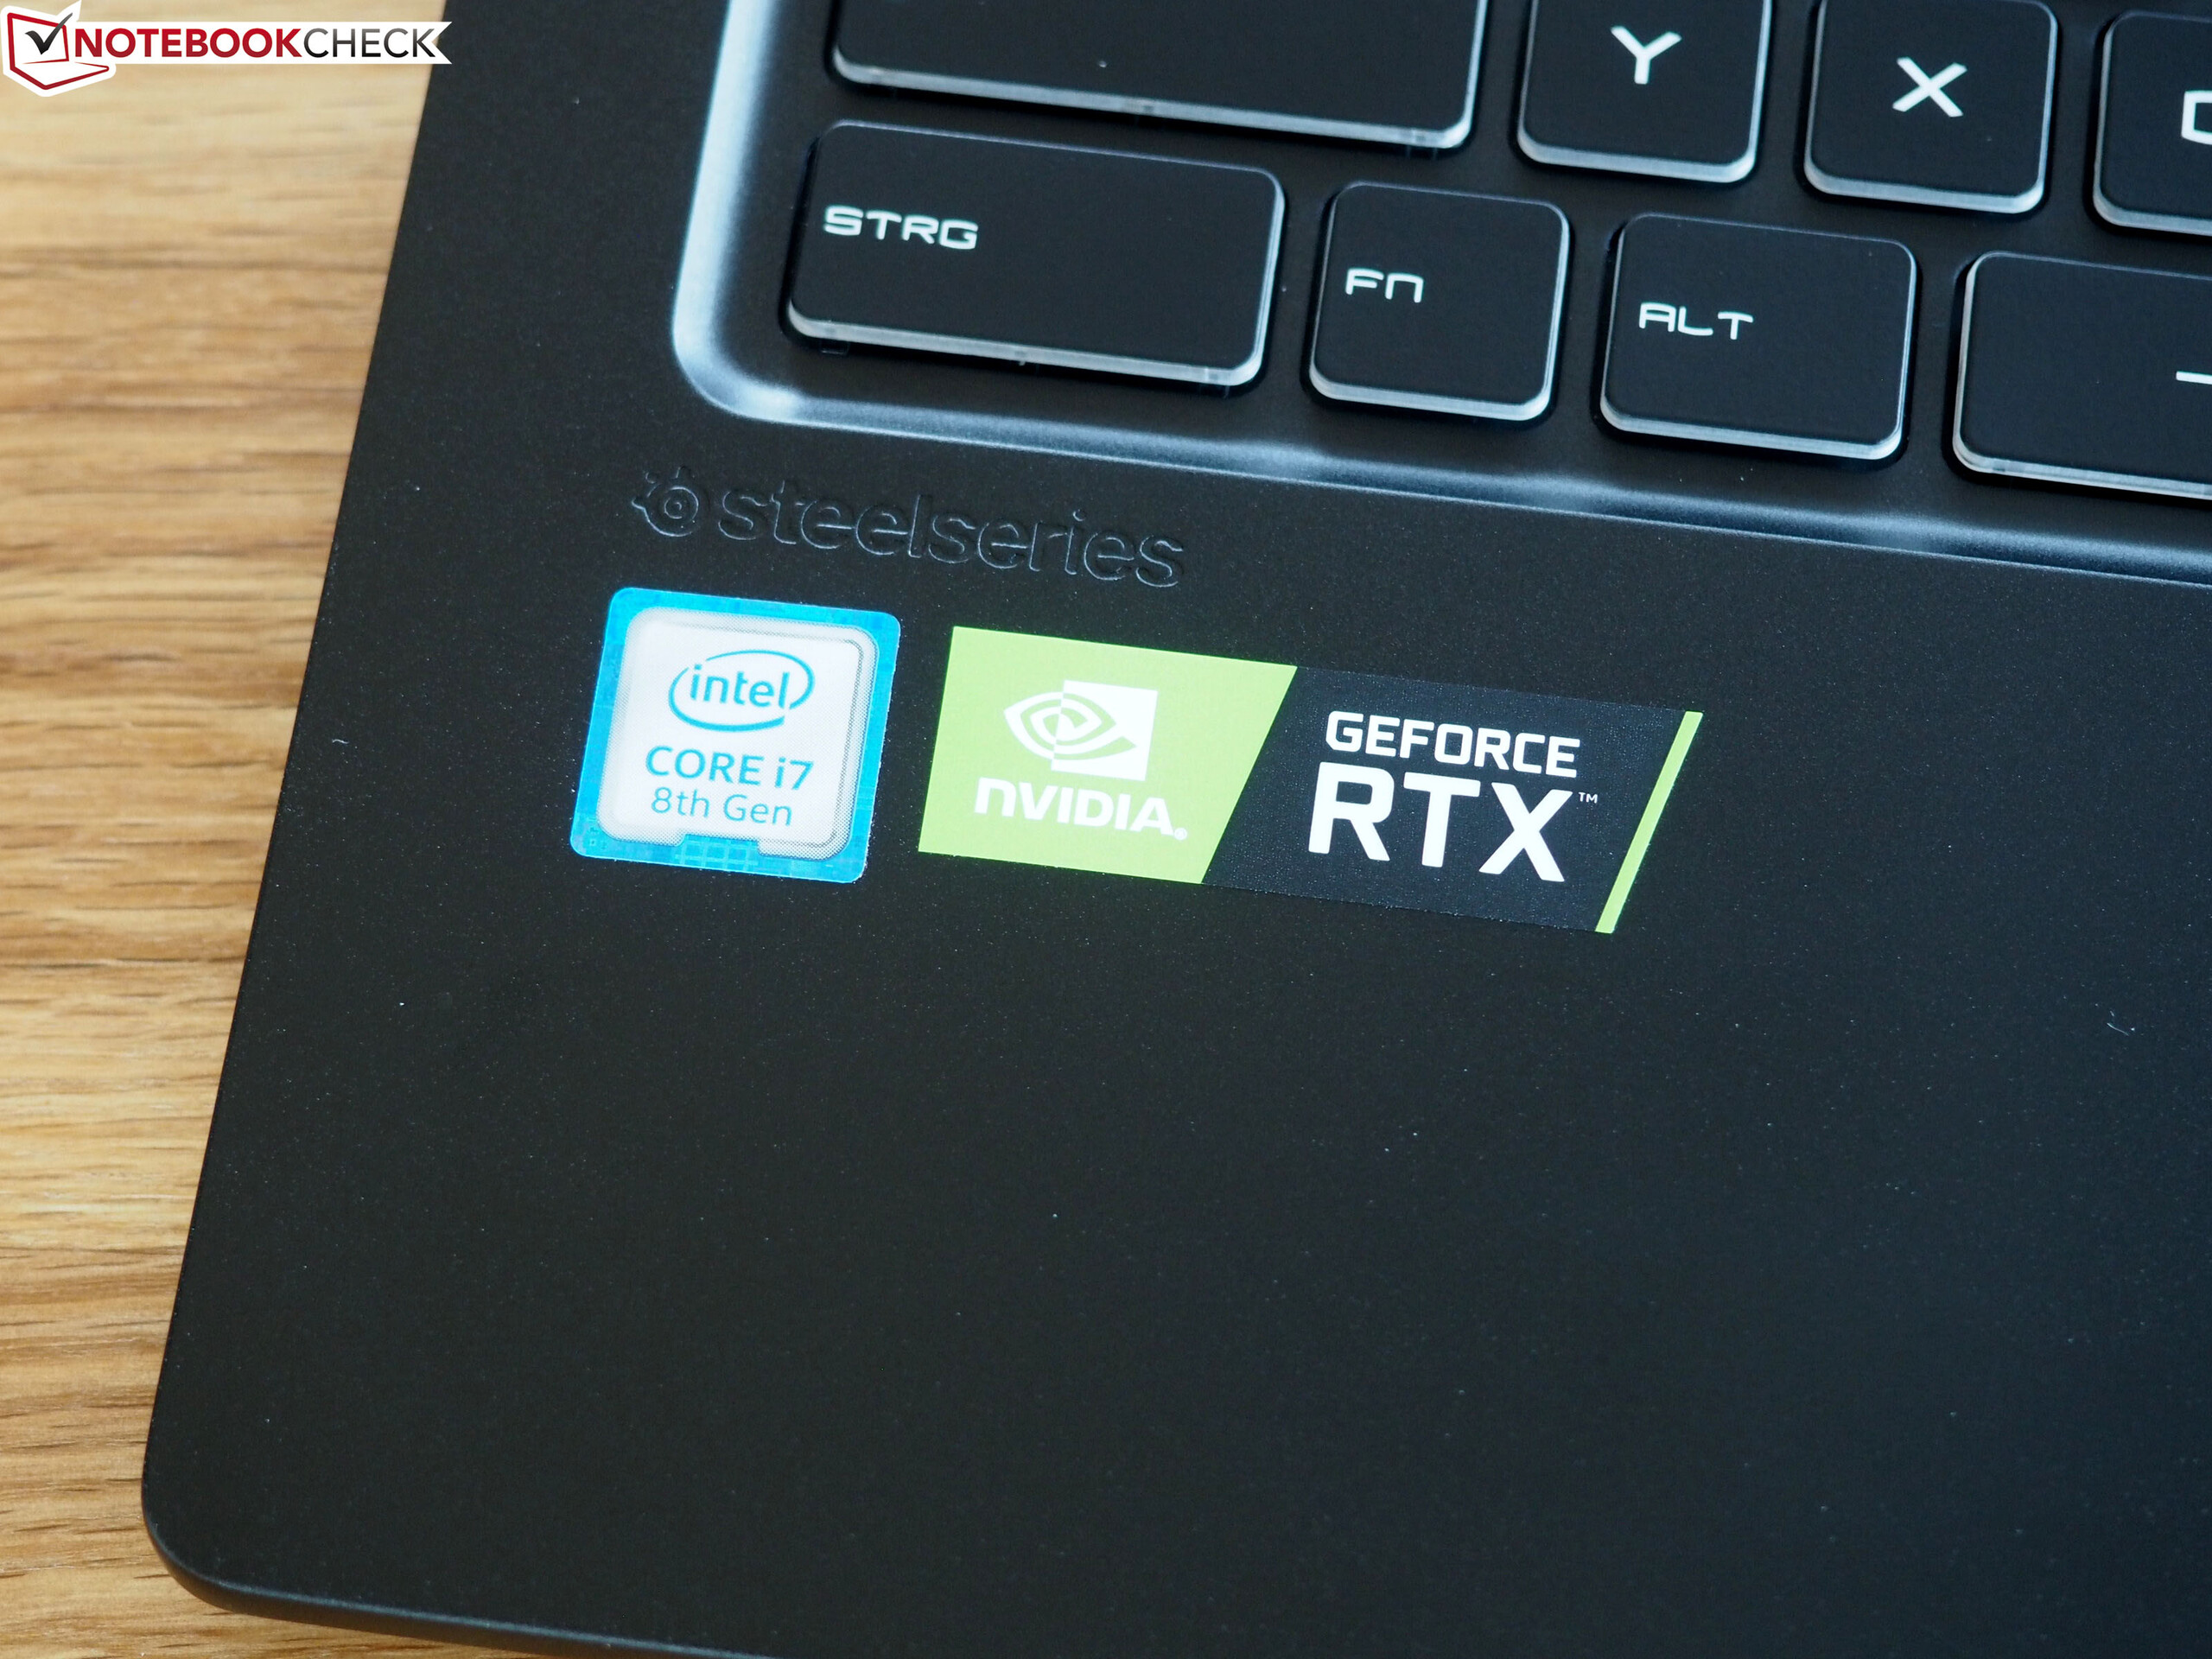
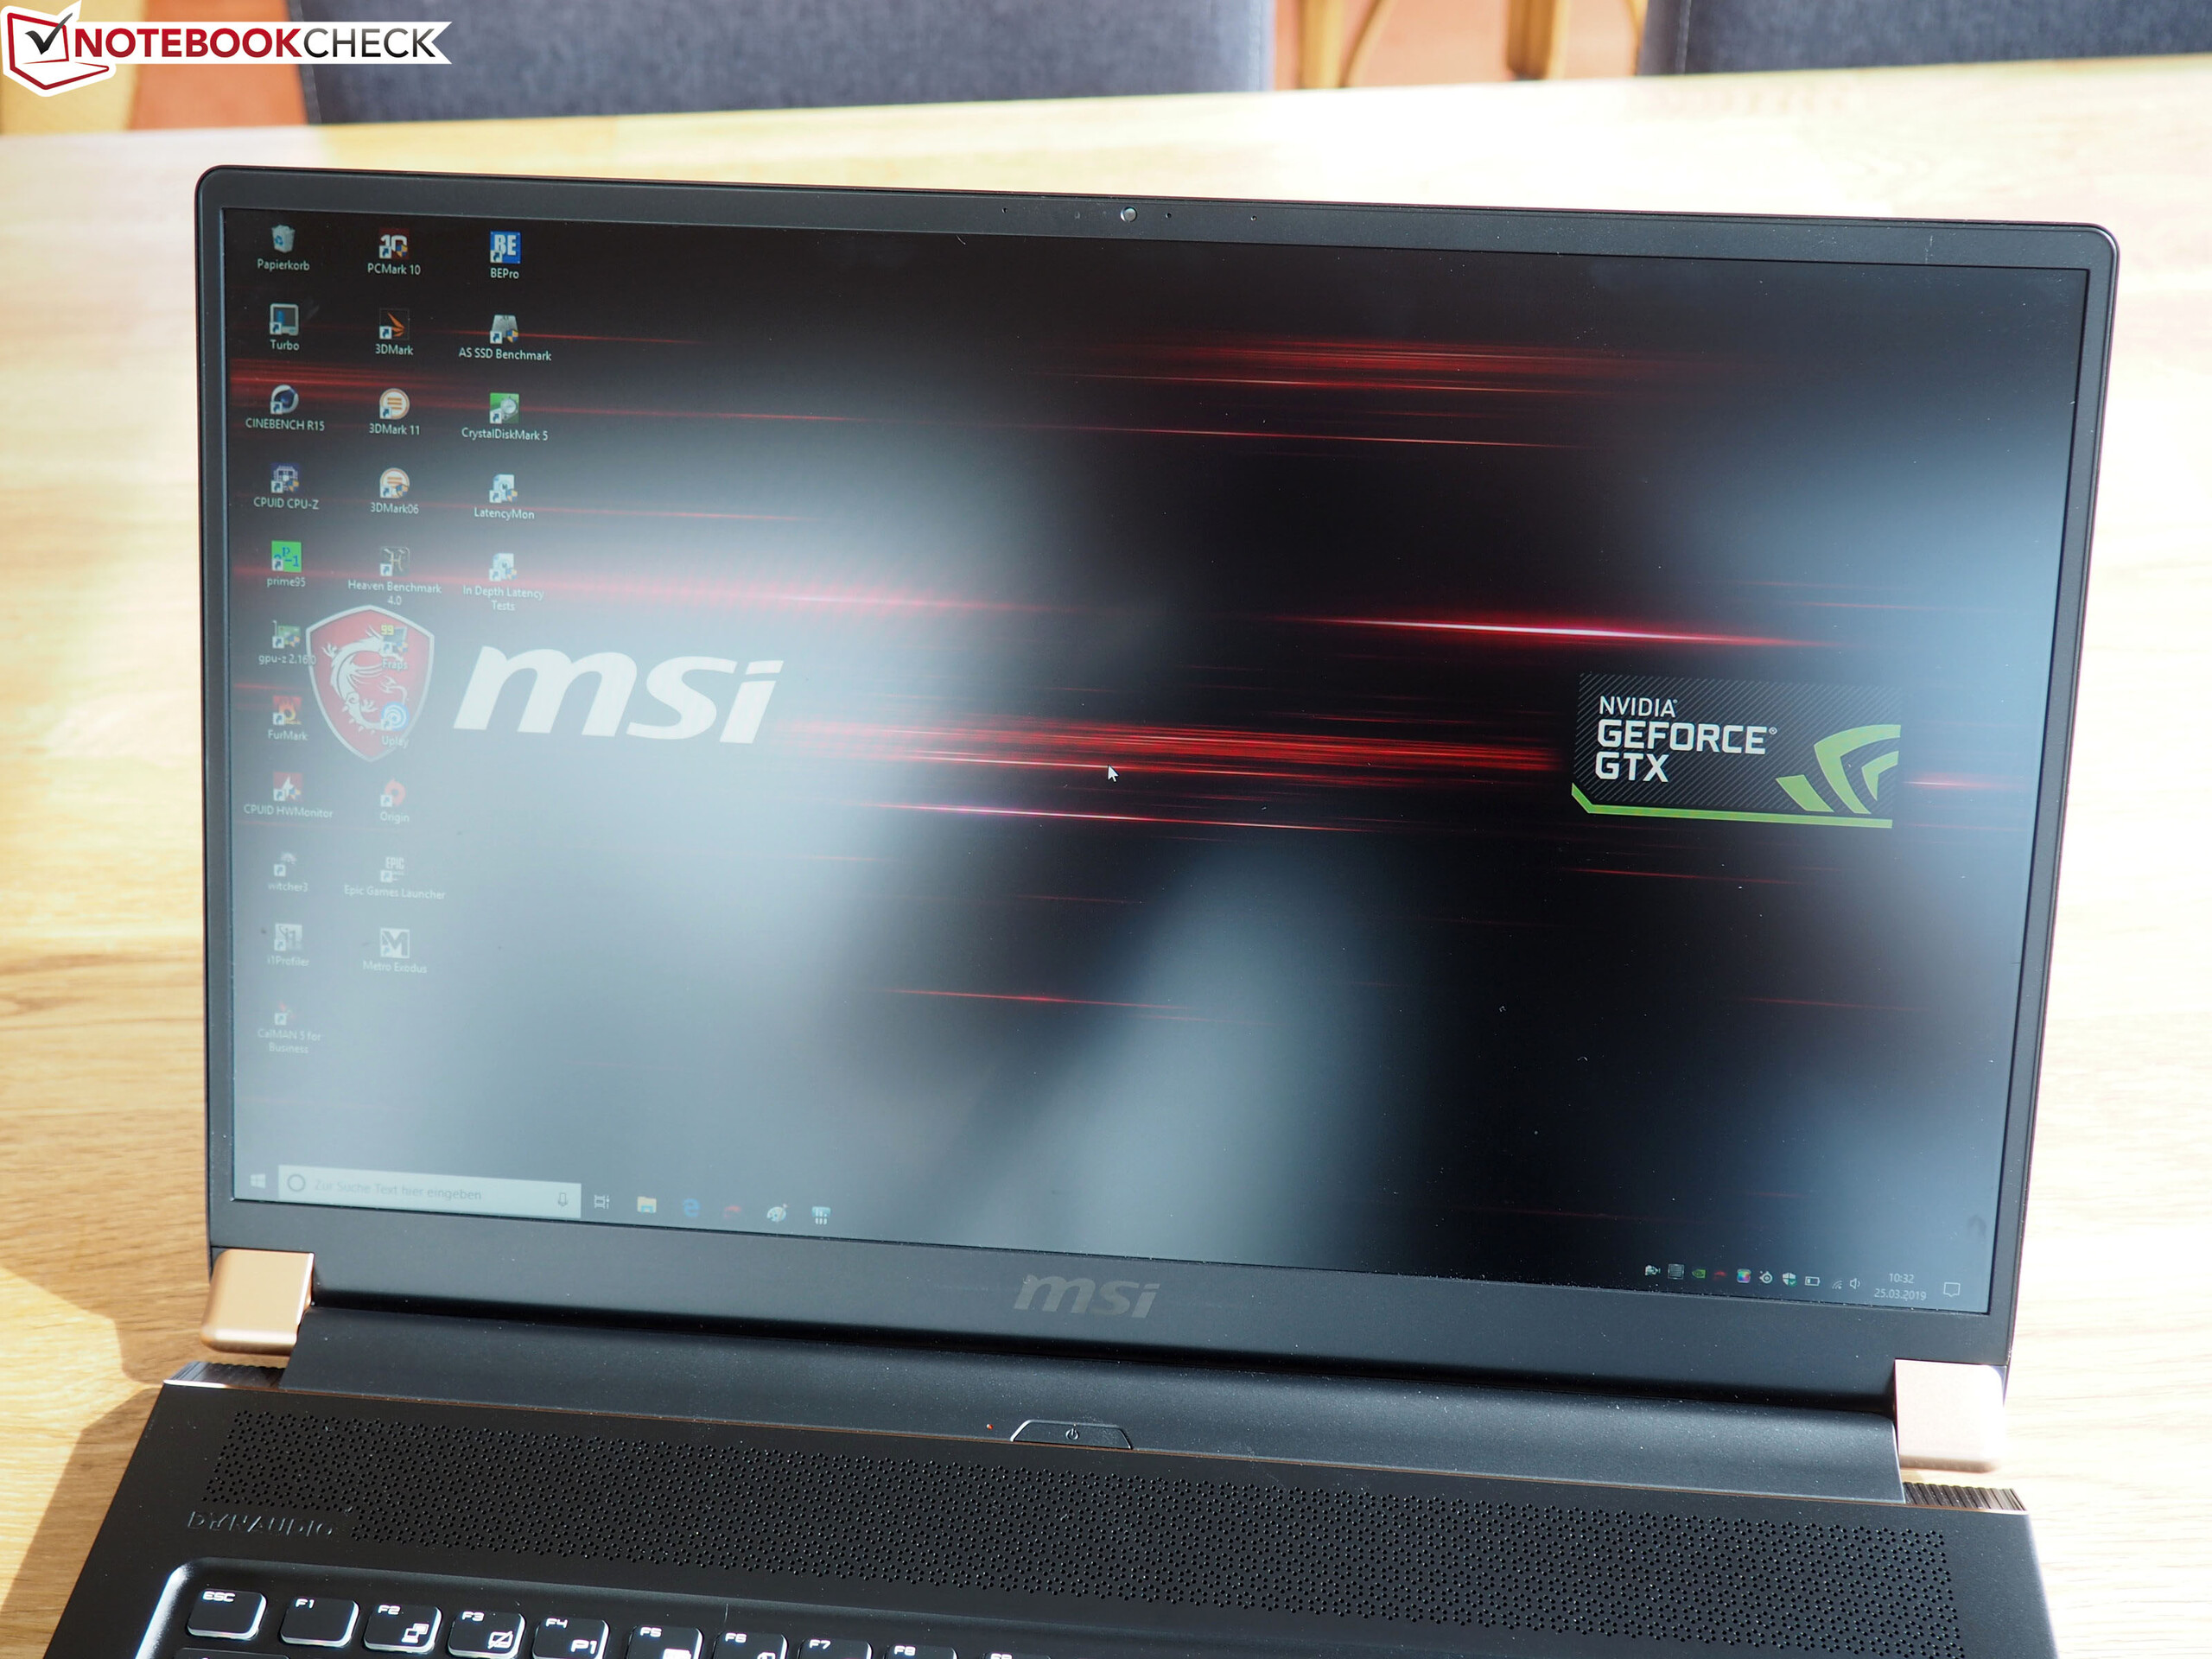
À l’intérieur, les choses se combinent bien, avec le Core i7-9750H et la GeForce RTX 2080 Max-Q se complétant pour fournir d’excellentes performances de jeu. Ces composants permettent au 9SG de profiter de son écran 144 Hz, la plupart des jeux triple A récents atteignant les 90 IPS, même aux réglages maximums. L’écran marque des points grâce à ses angles de vision stables, sa luminosité élevée, son bon contraste, ses courts temps de réponse, et ses couleurs fidèles.
Le MSI GS75 Stealth 9SG est un puissant portable de jeu qui devrait satisfaire son monde. Son châssis trop mou et son prix élevé sont cependant de bonnes raisons d’aller voir ailleurs.
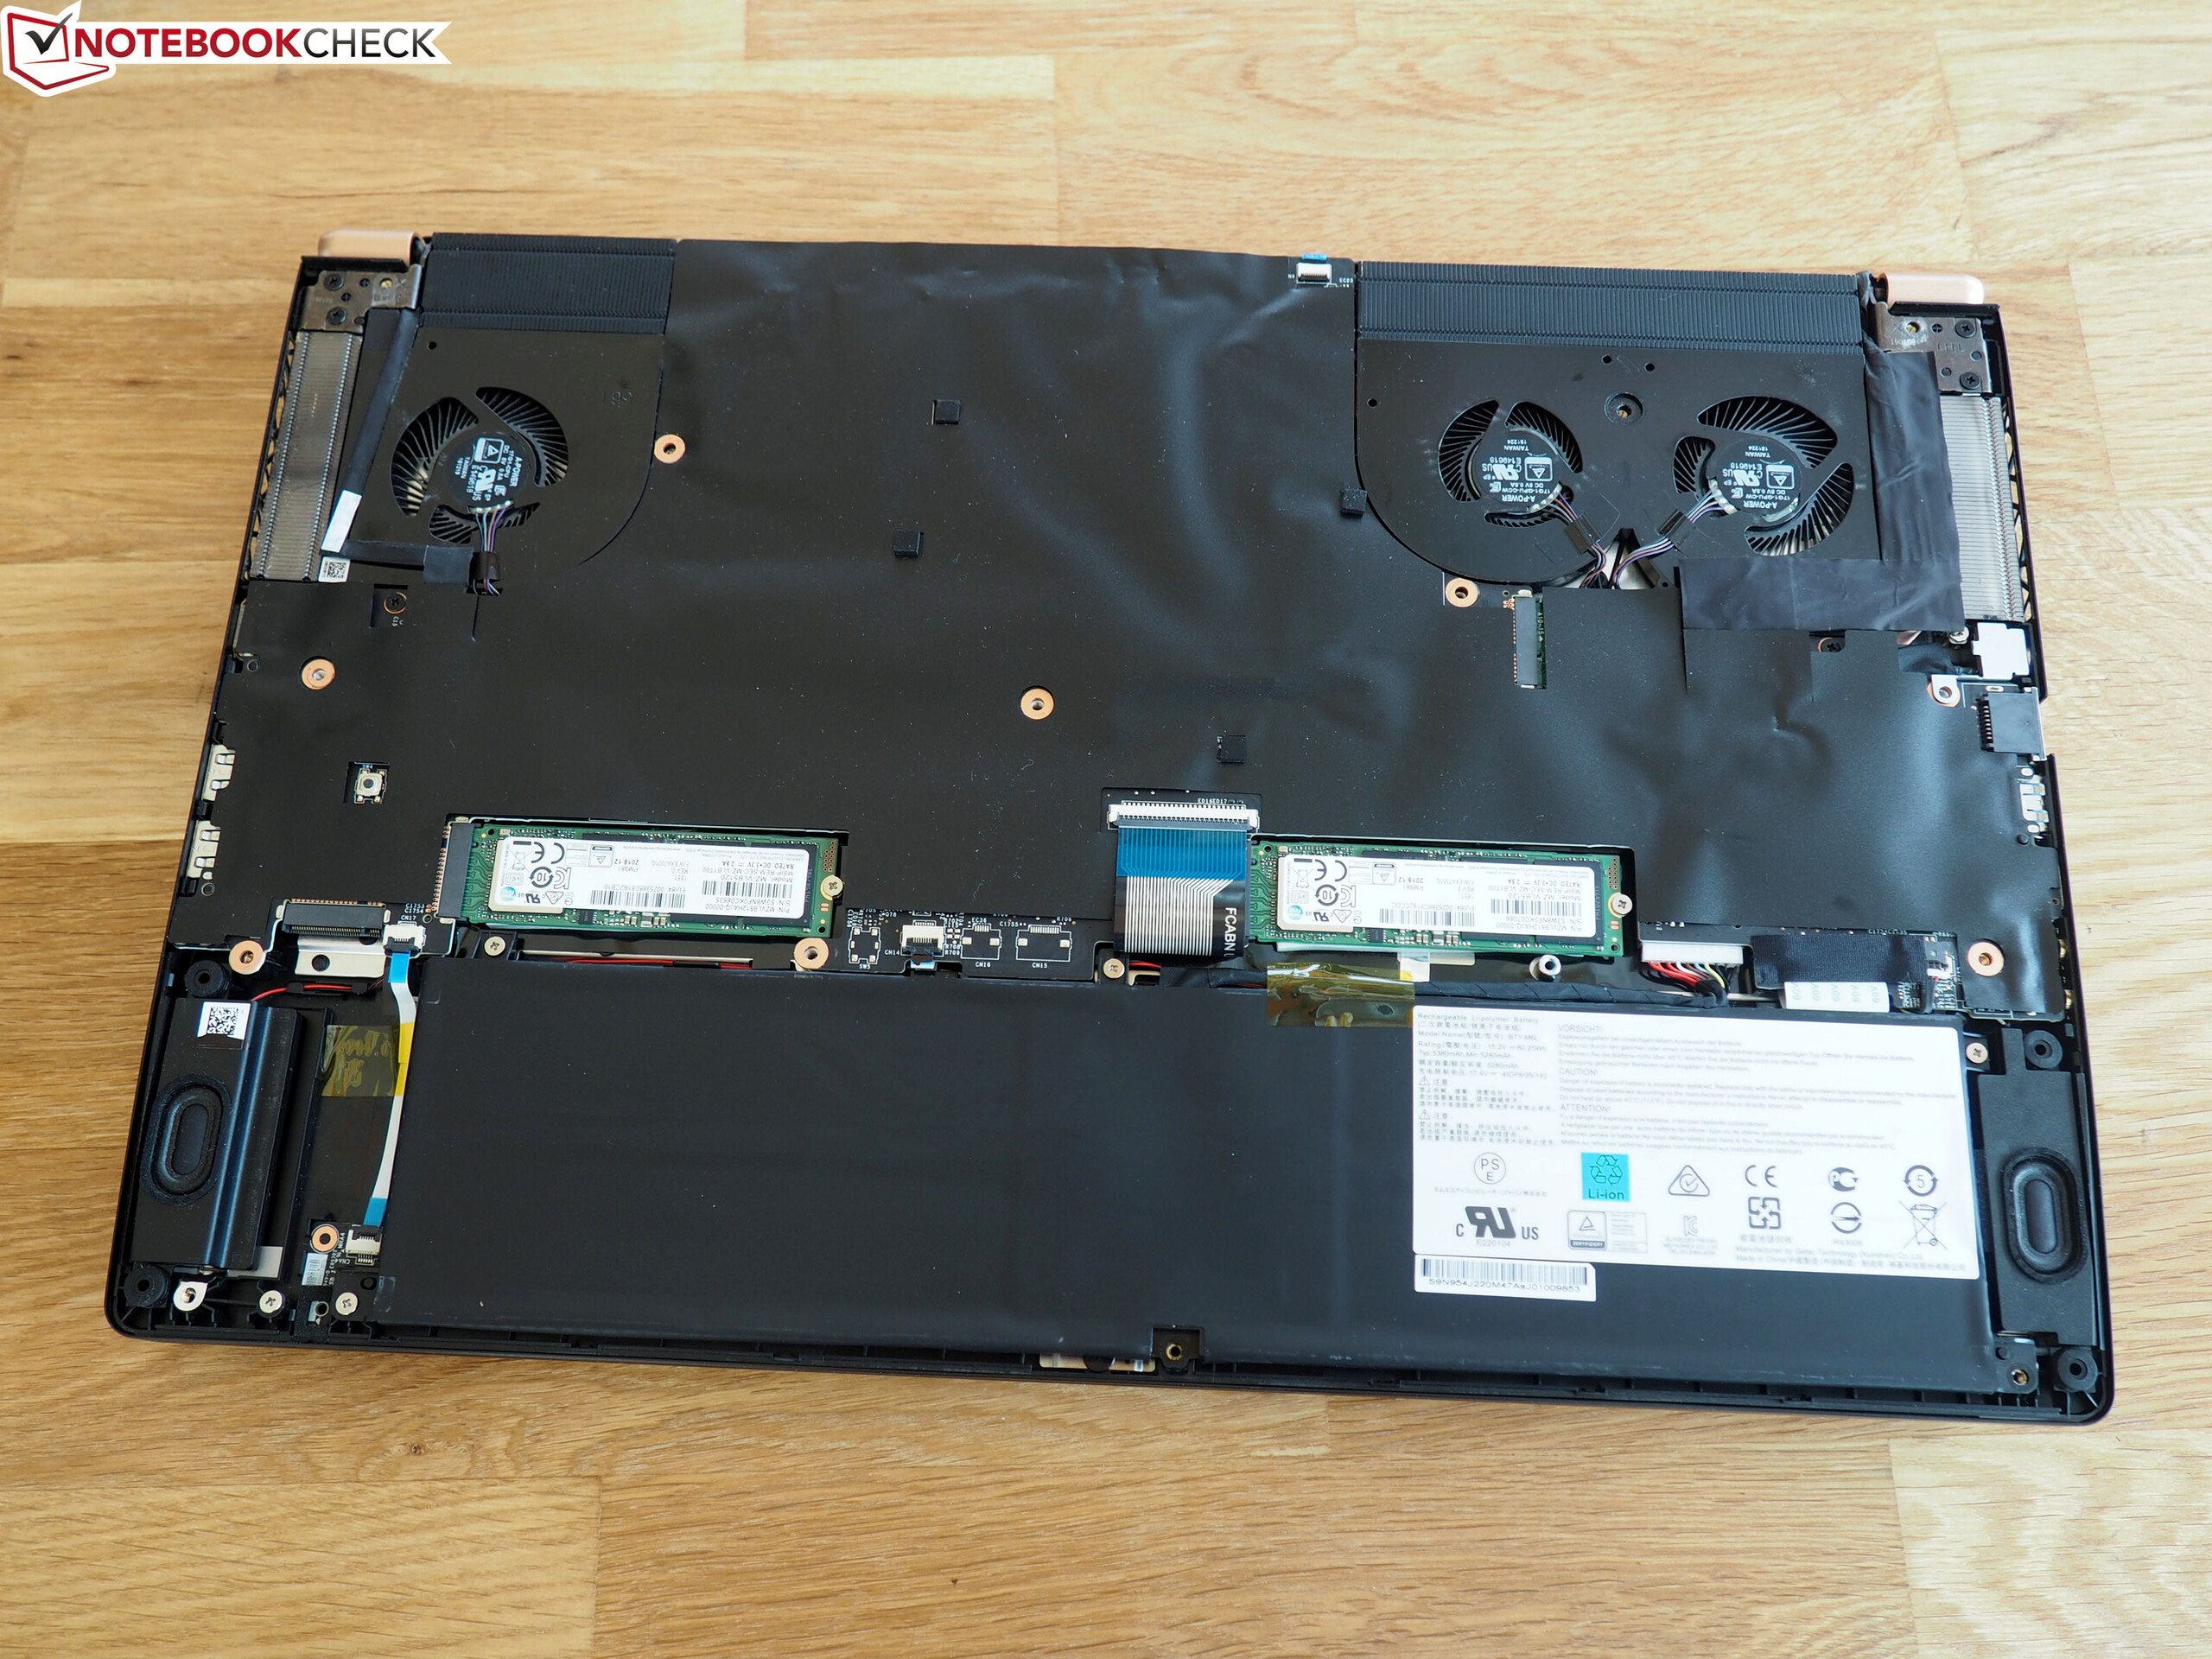
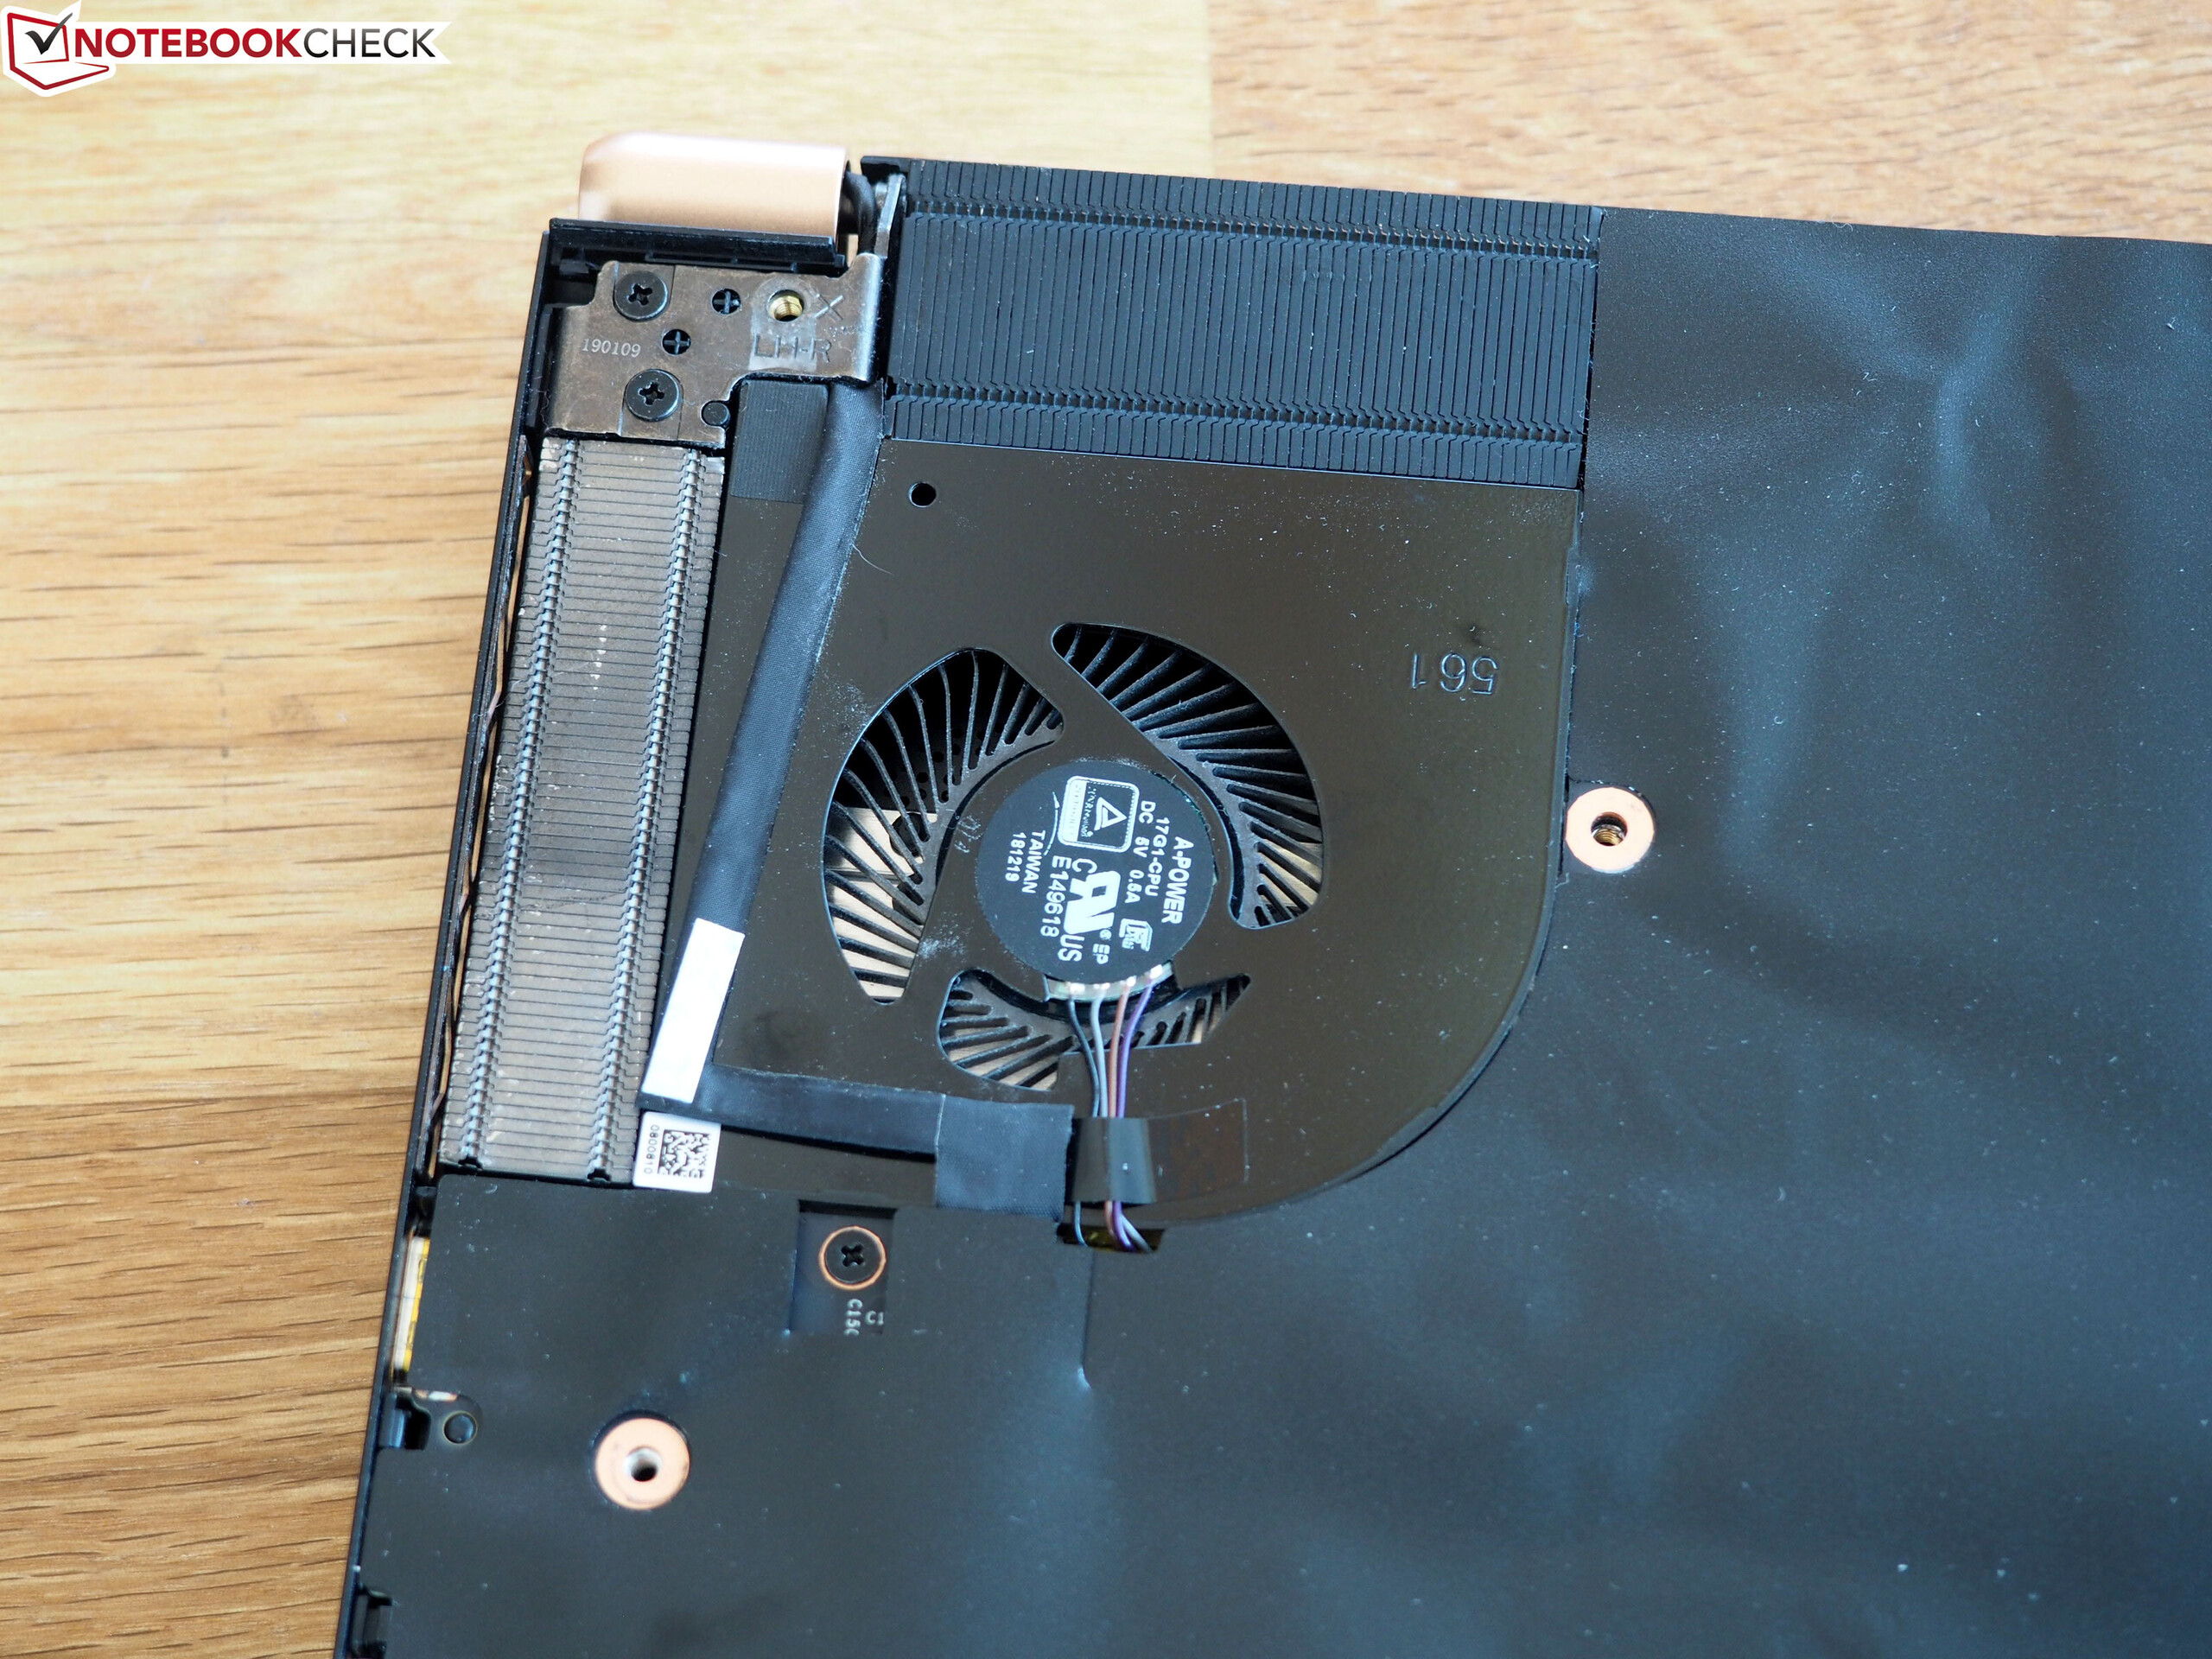
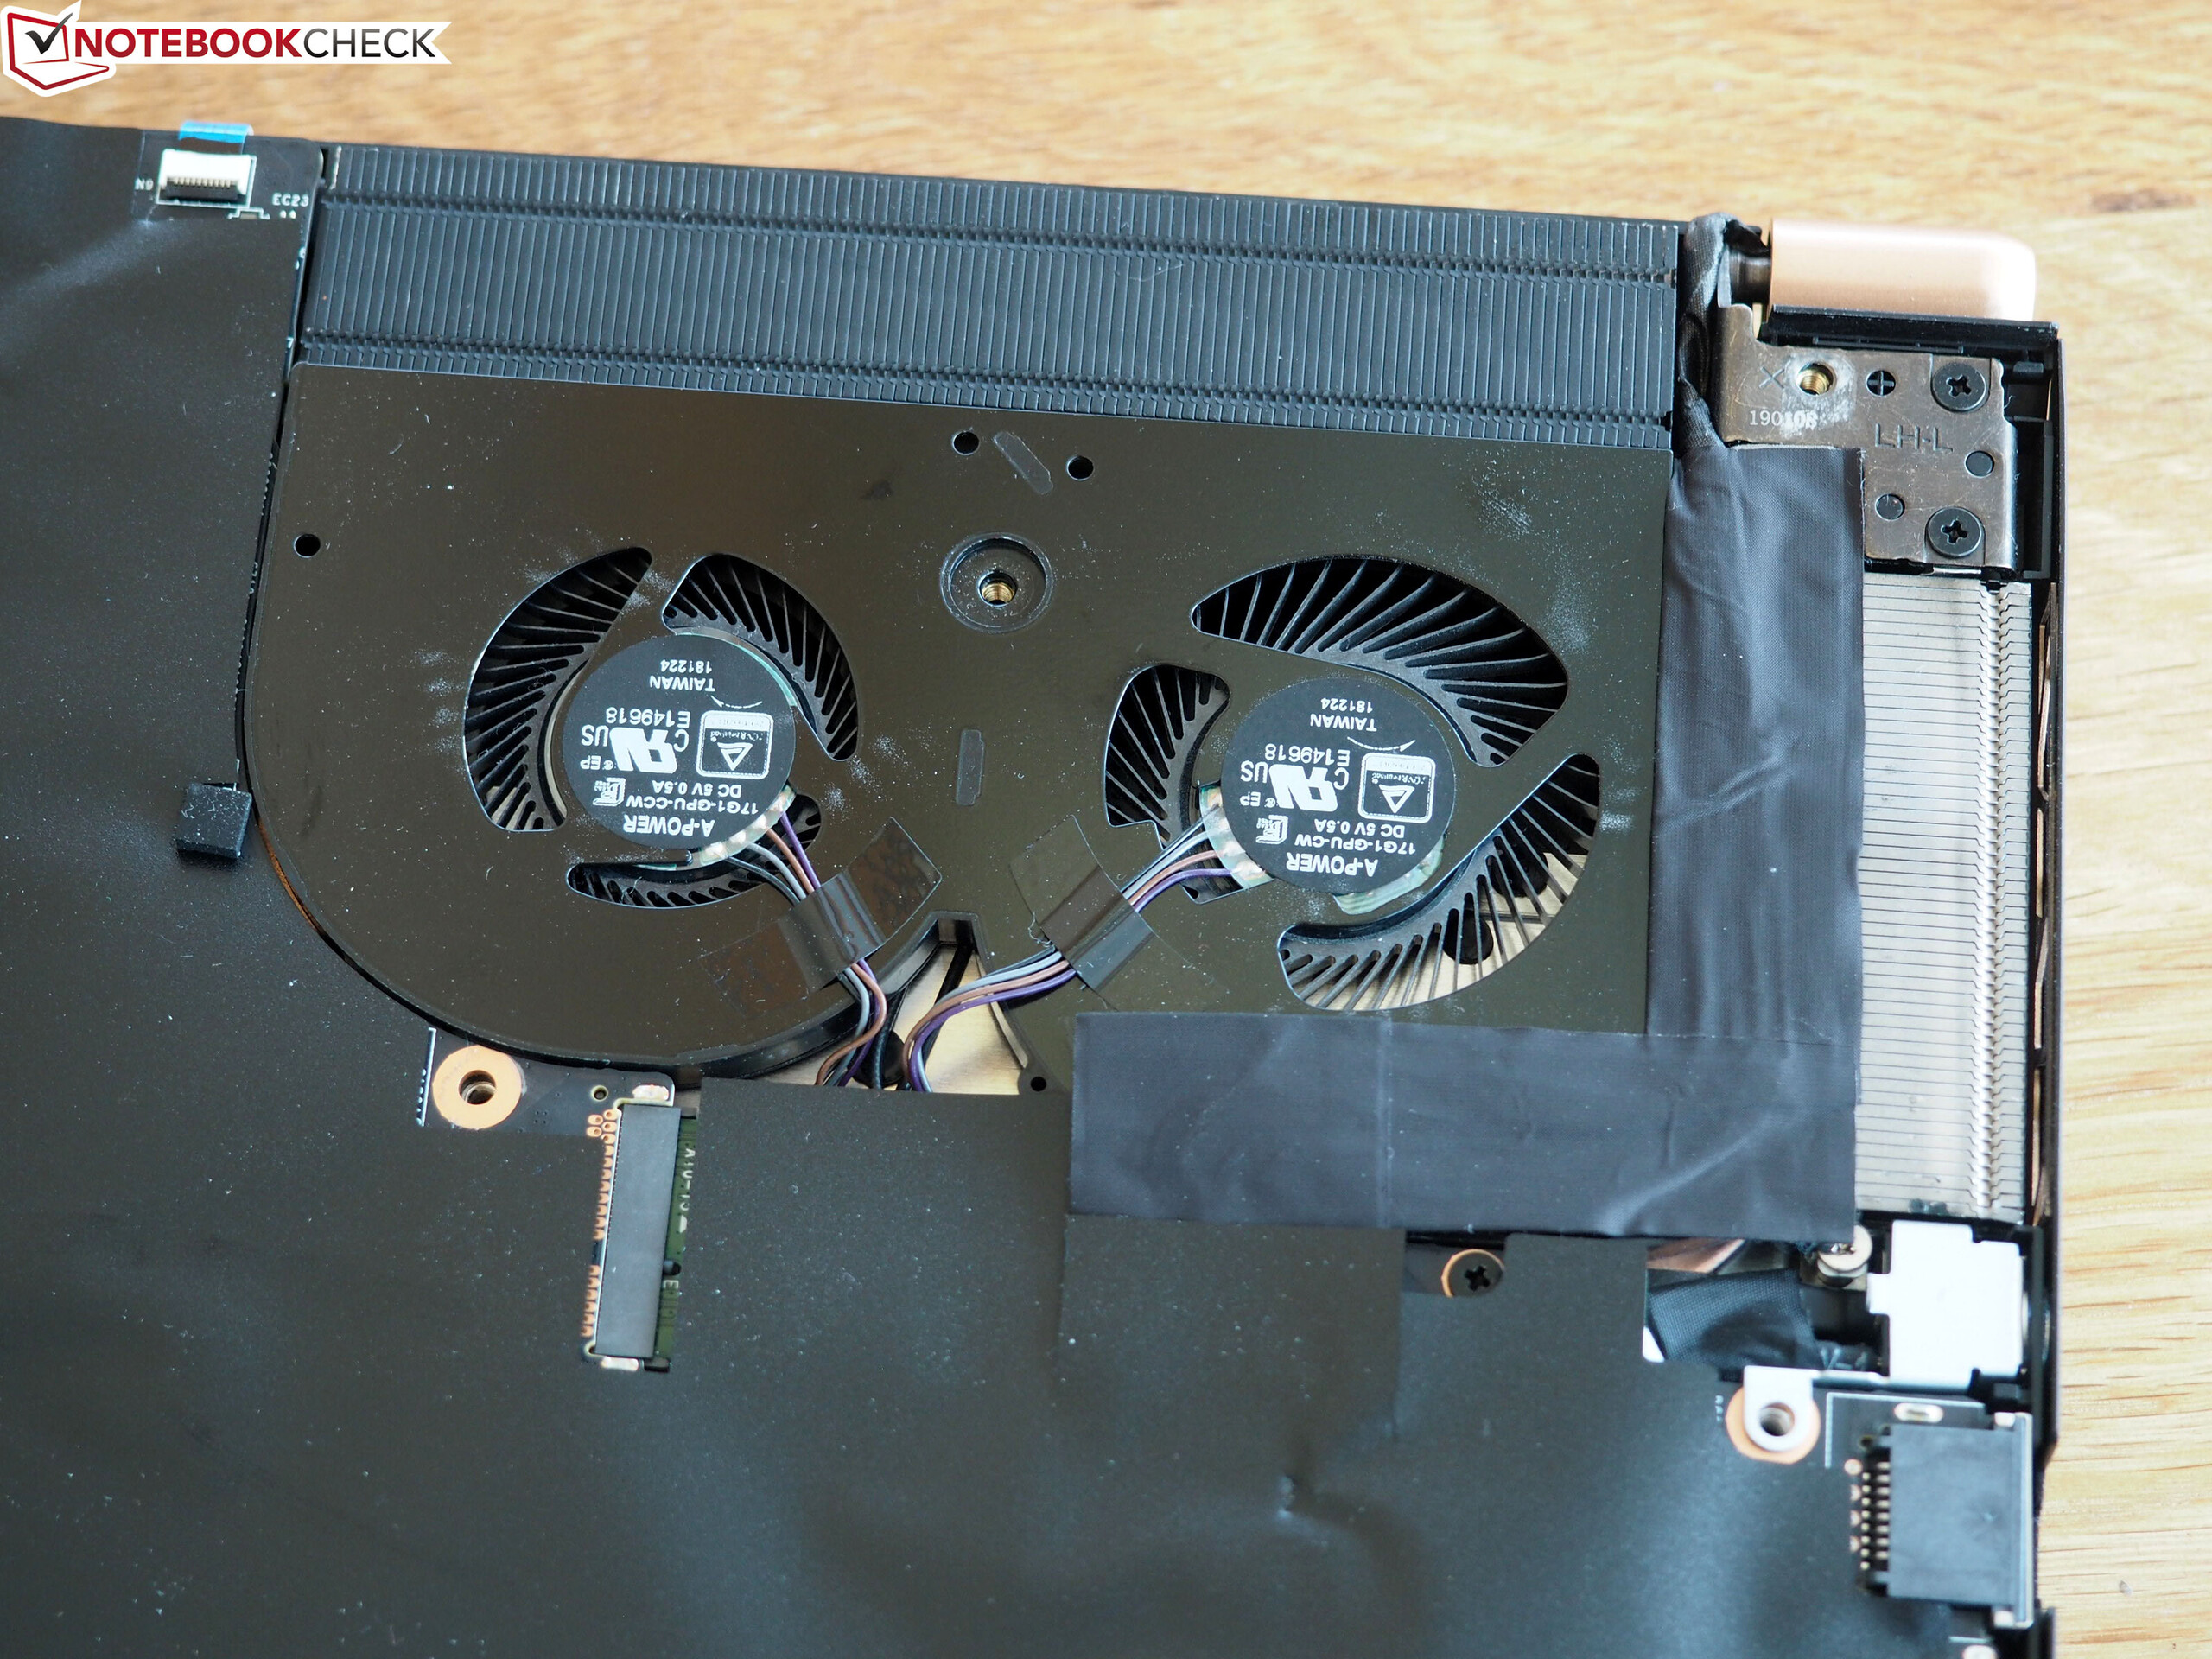
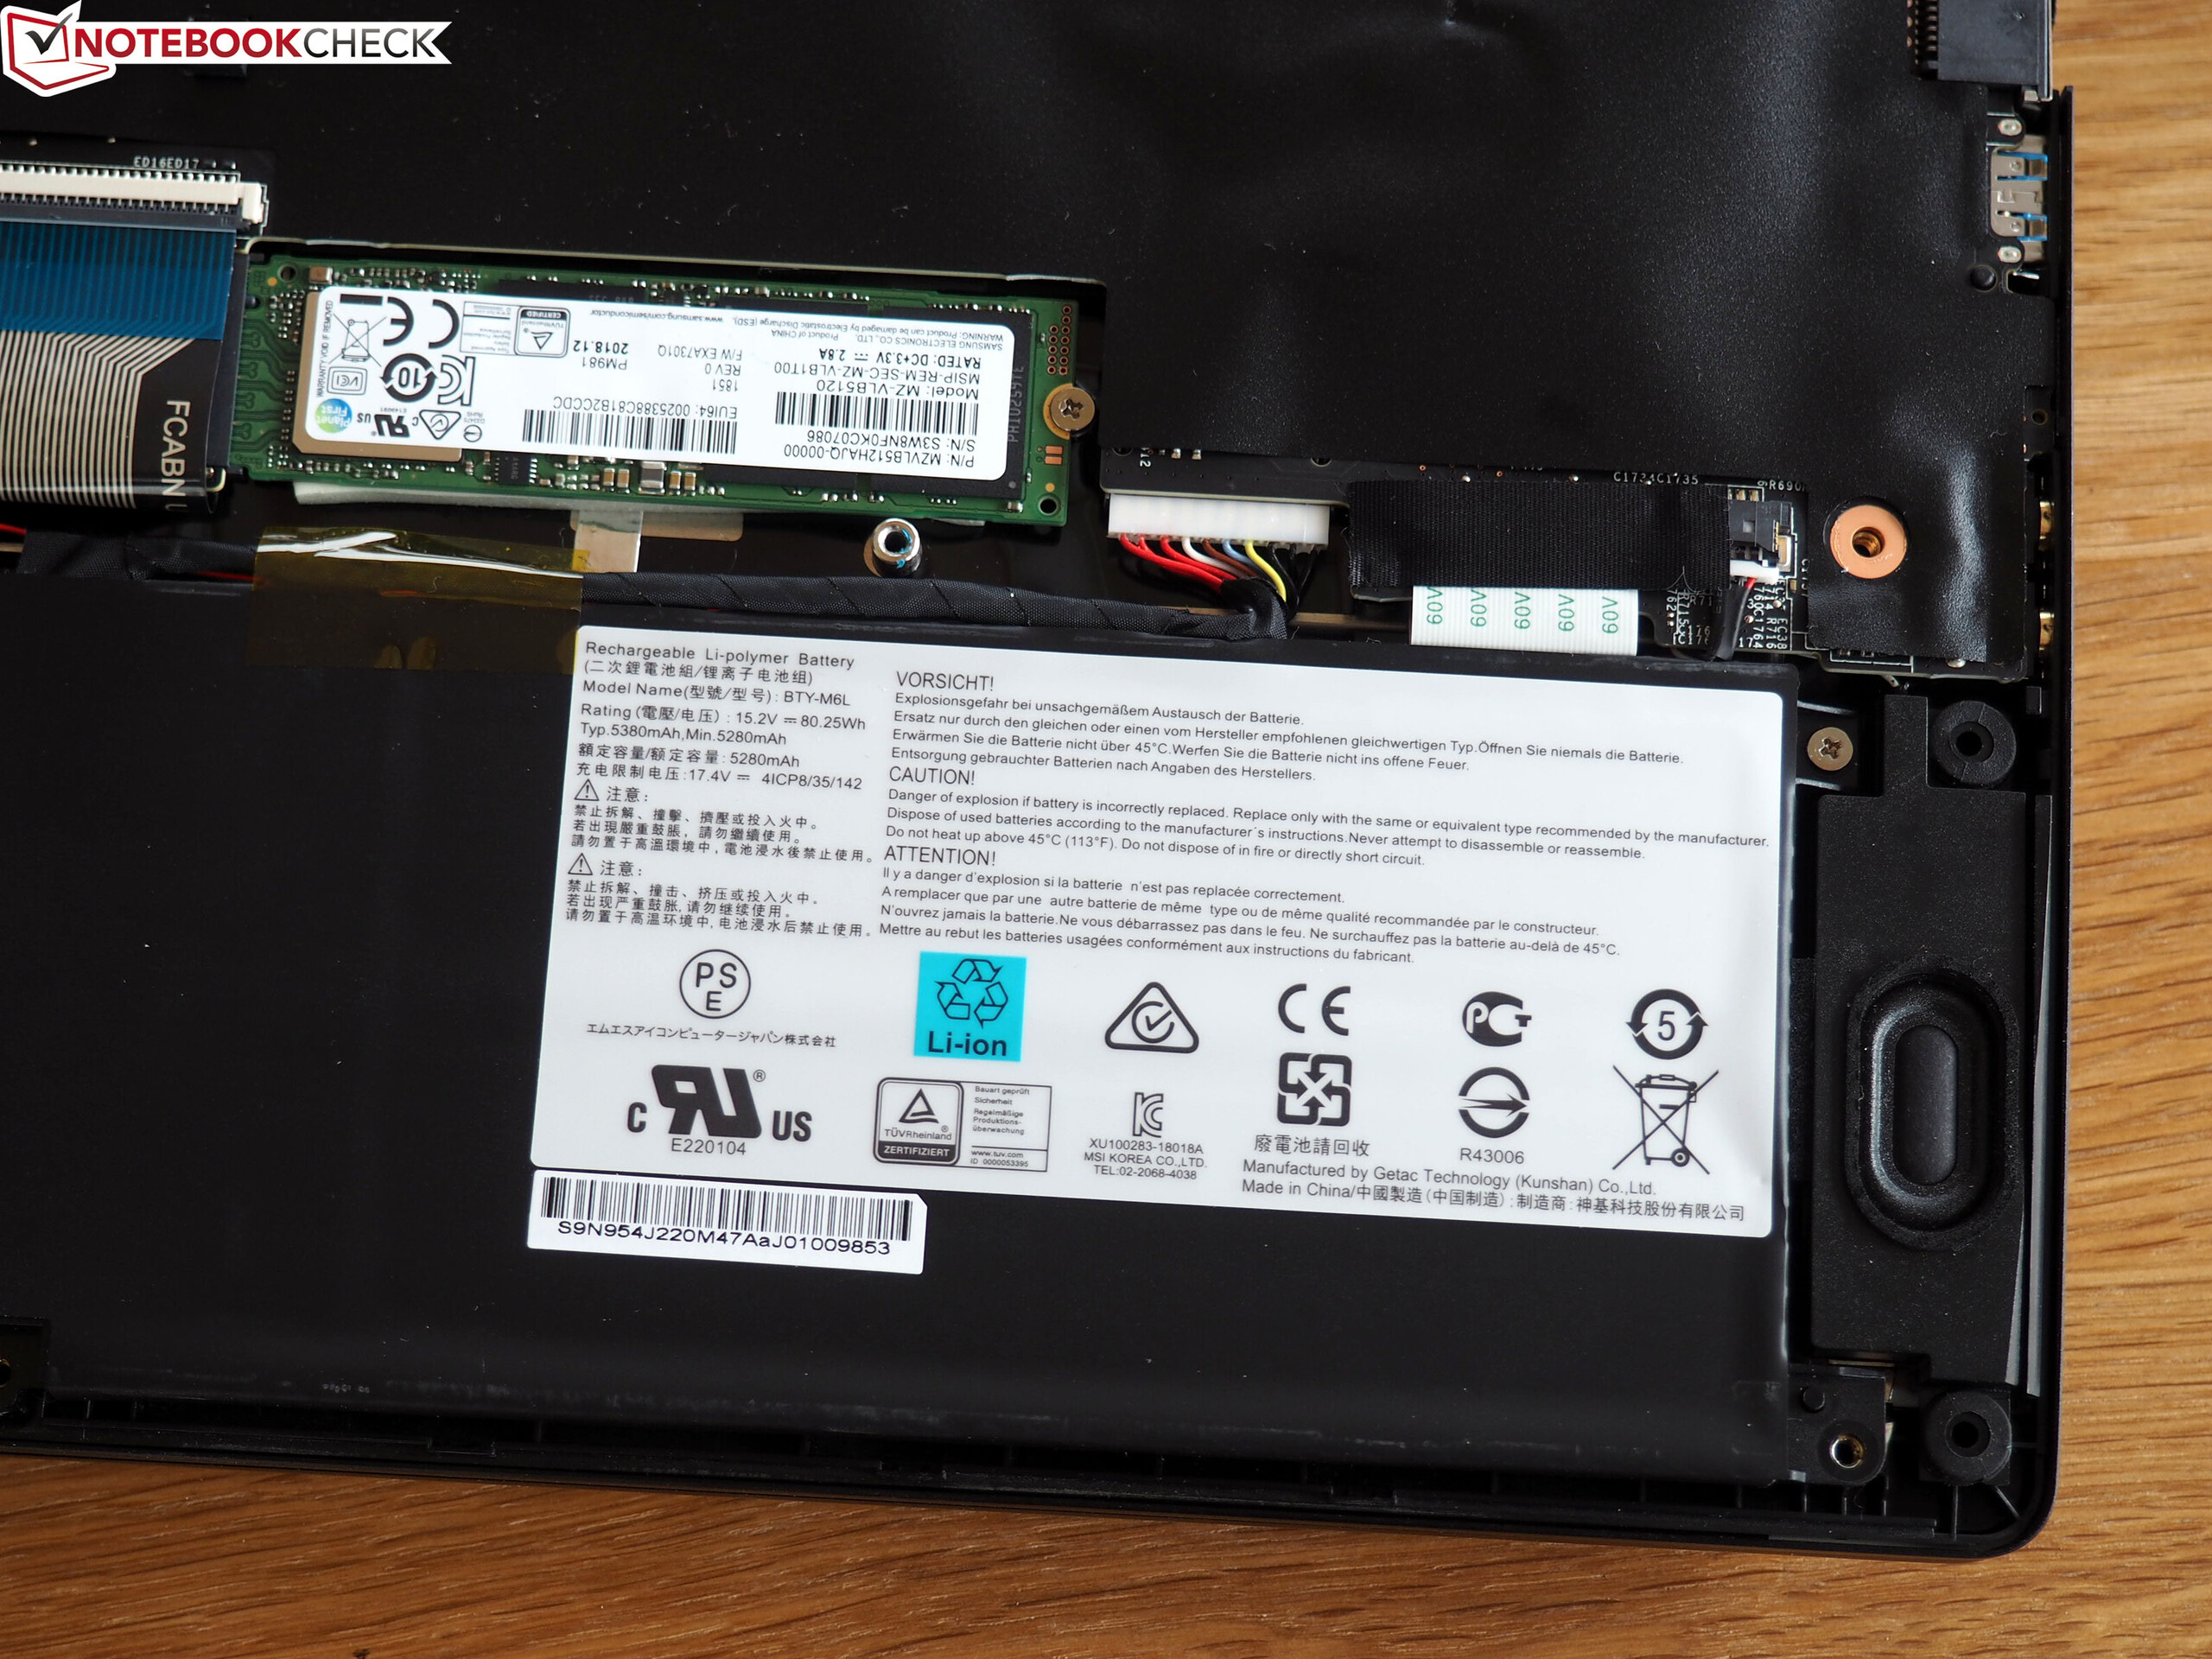
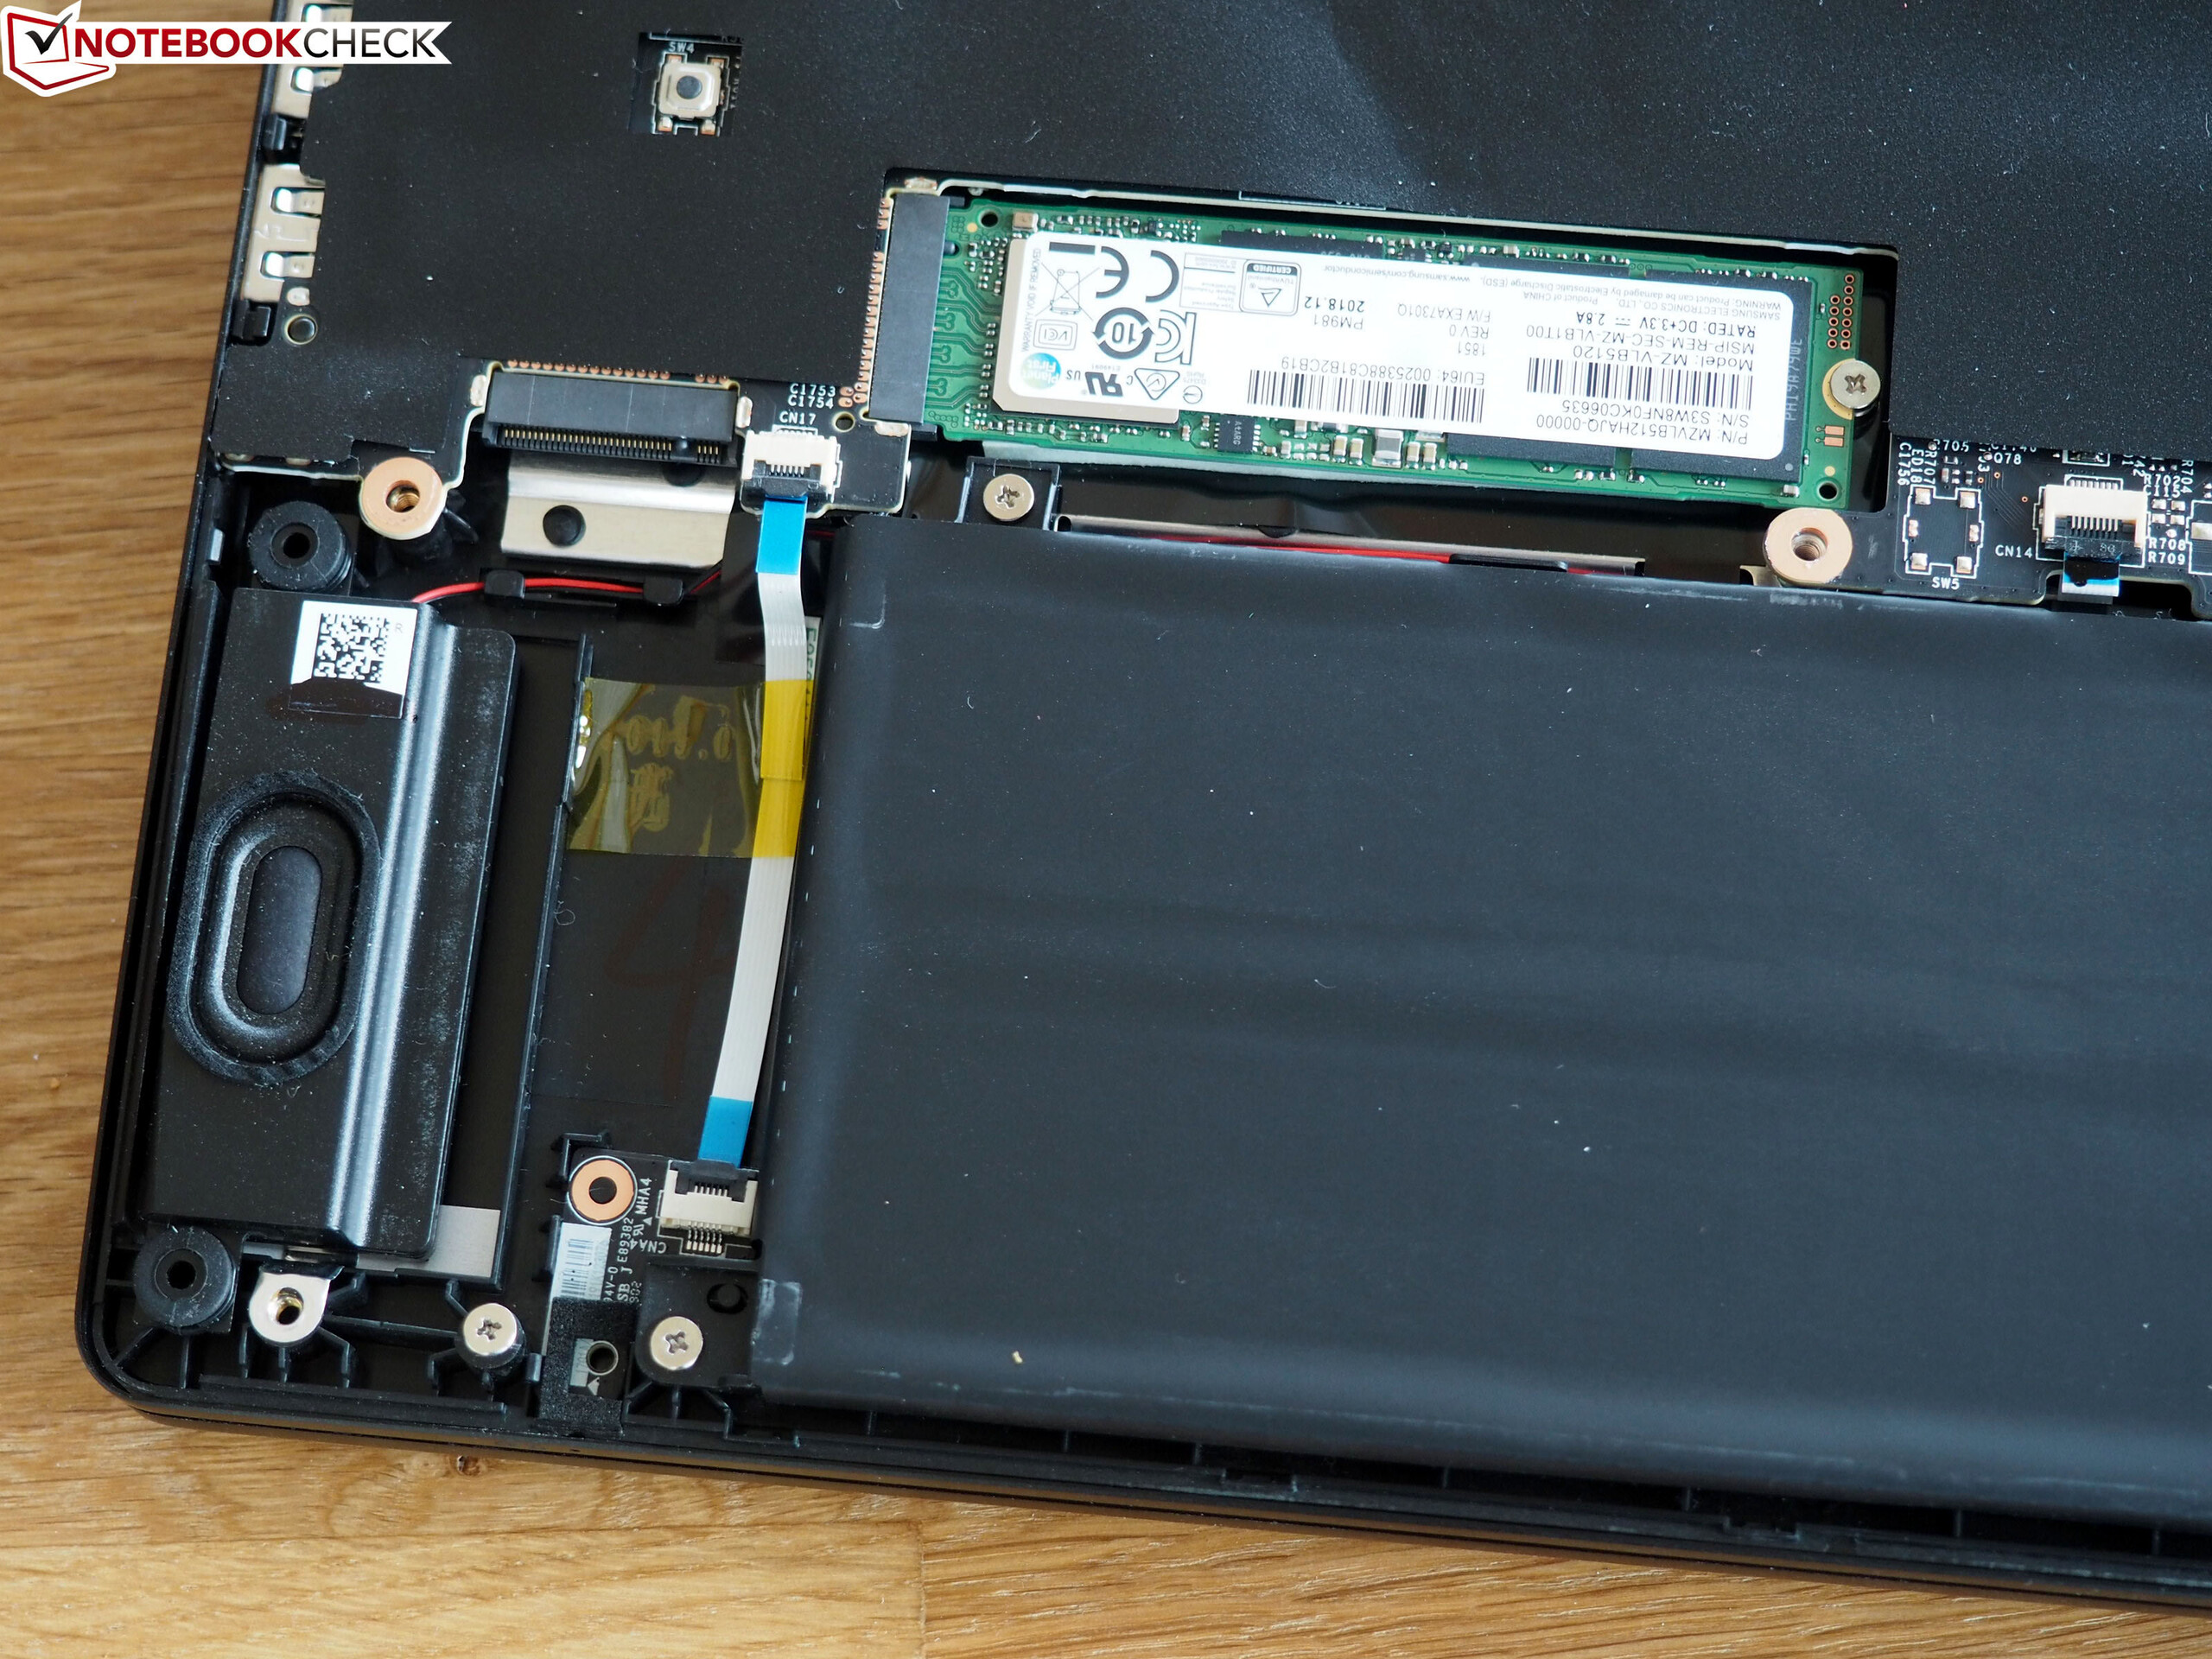
Nous apprécions également que MSI ait inclus deux SSD NVMe tournant en RAID 0. Ce choix permet au 9SG d’atteindre des vitesses comparativement élevées, avec un gros stockage de 9 To. Il est même possible d’ajouter un troisième disque M.2 2280 si l’on a besoin de plus d’espace, même si MSI a tristement fait le choix d’un connecteur SATA III plus lent au lieu d’un NVMe.
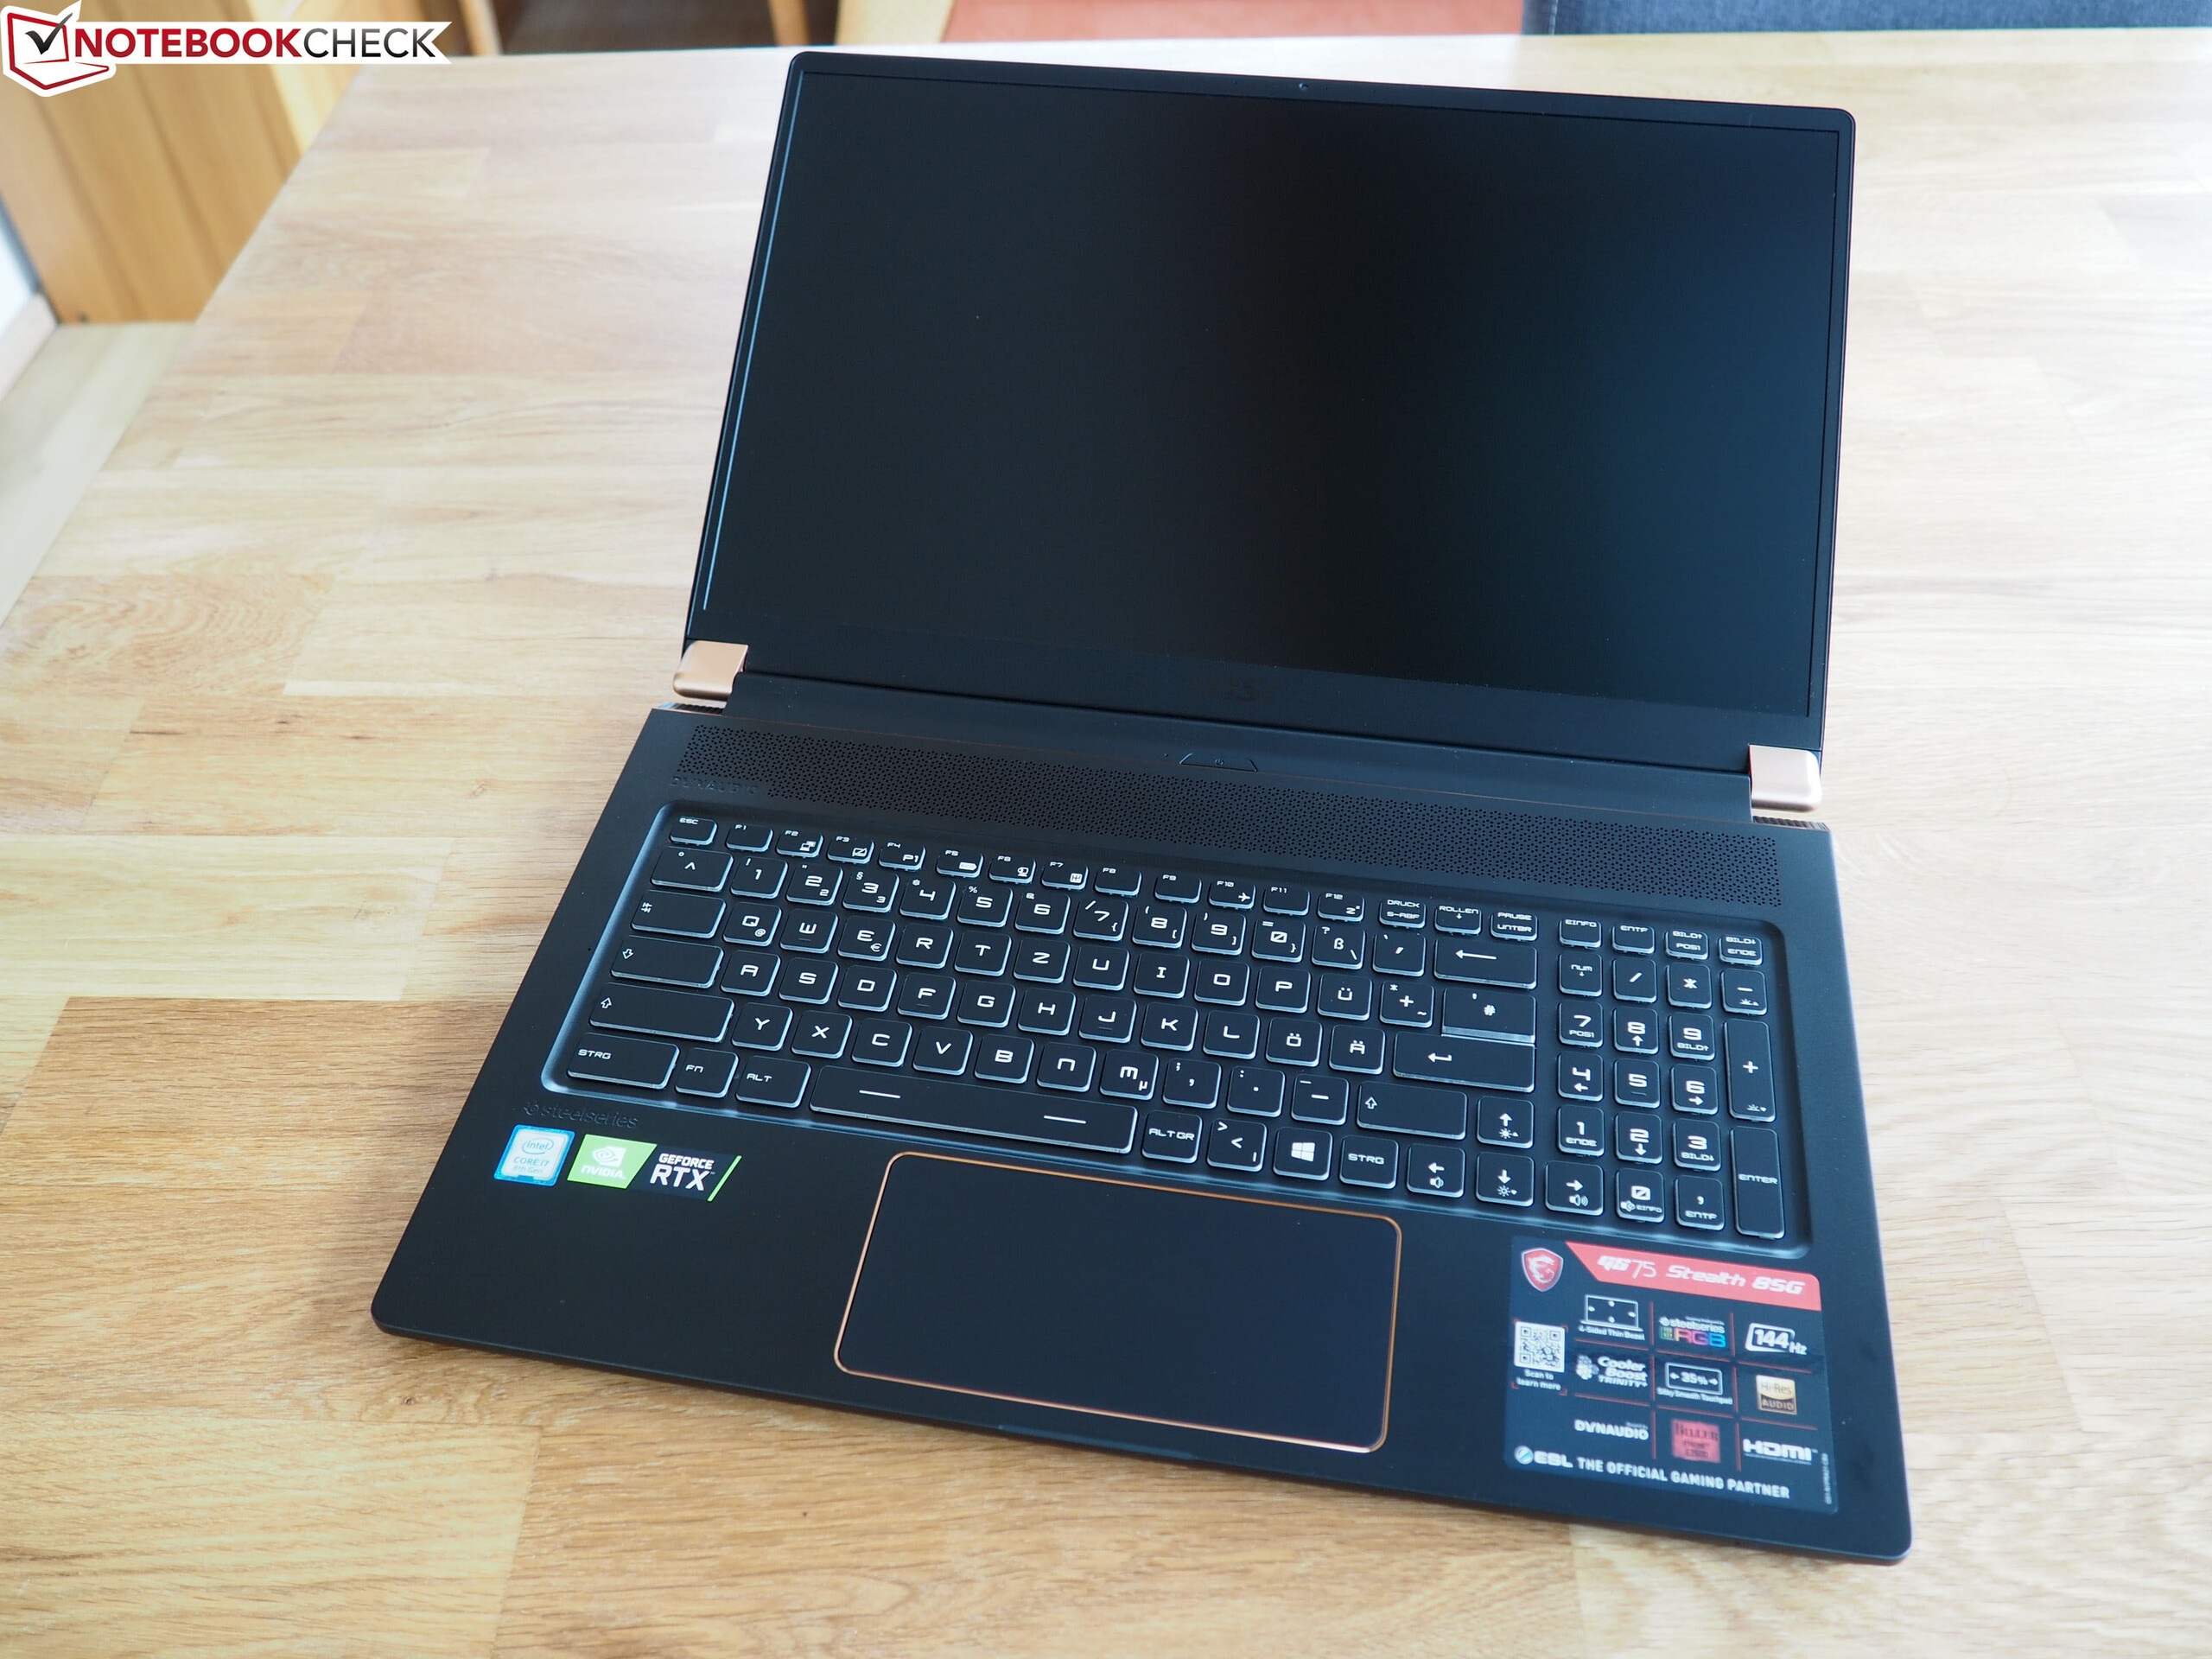
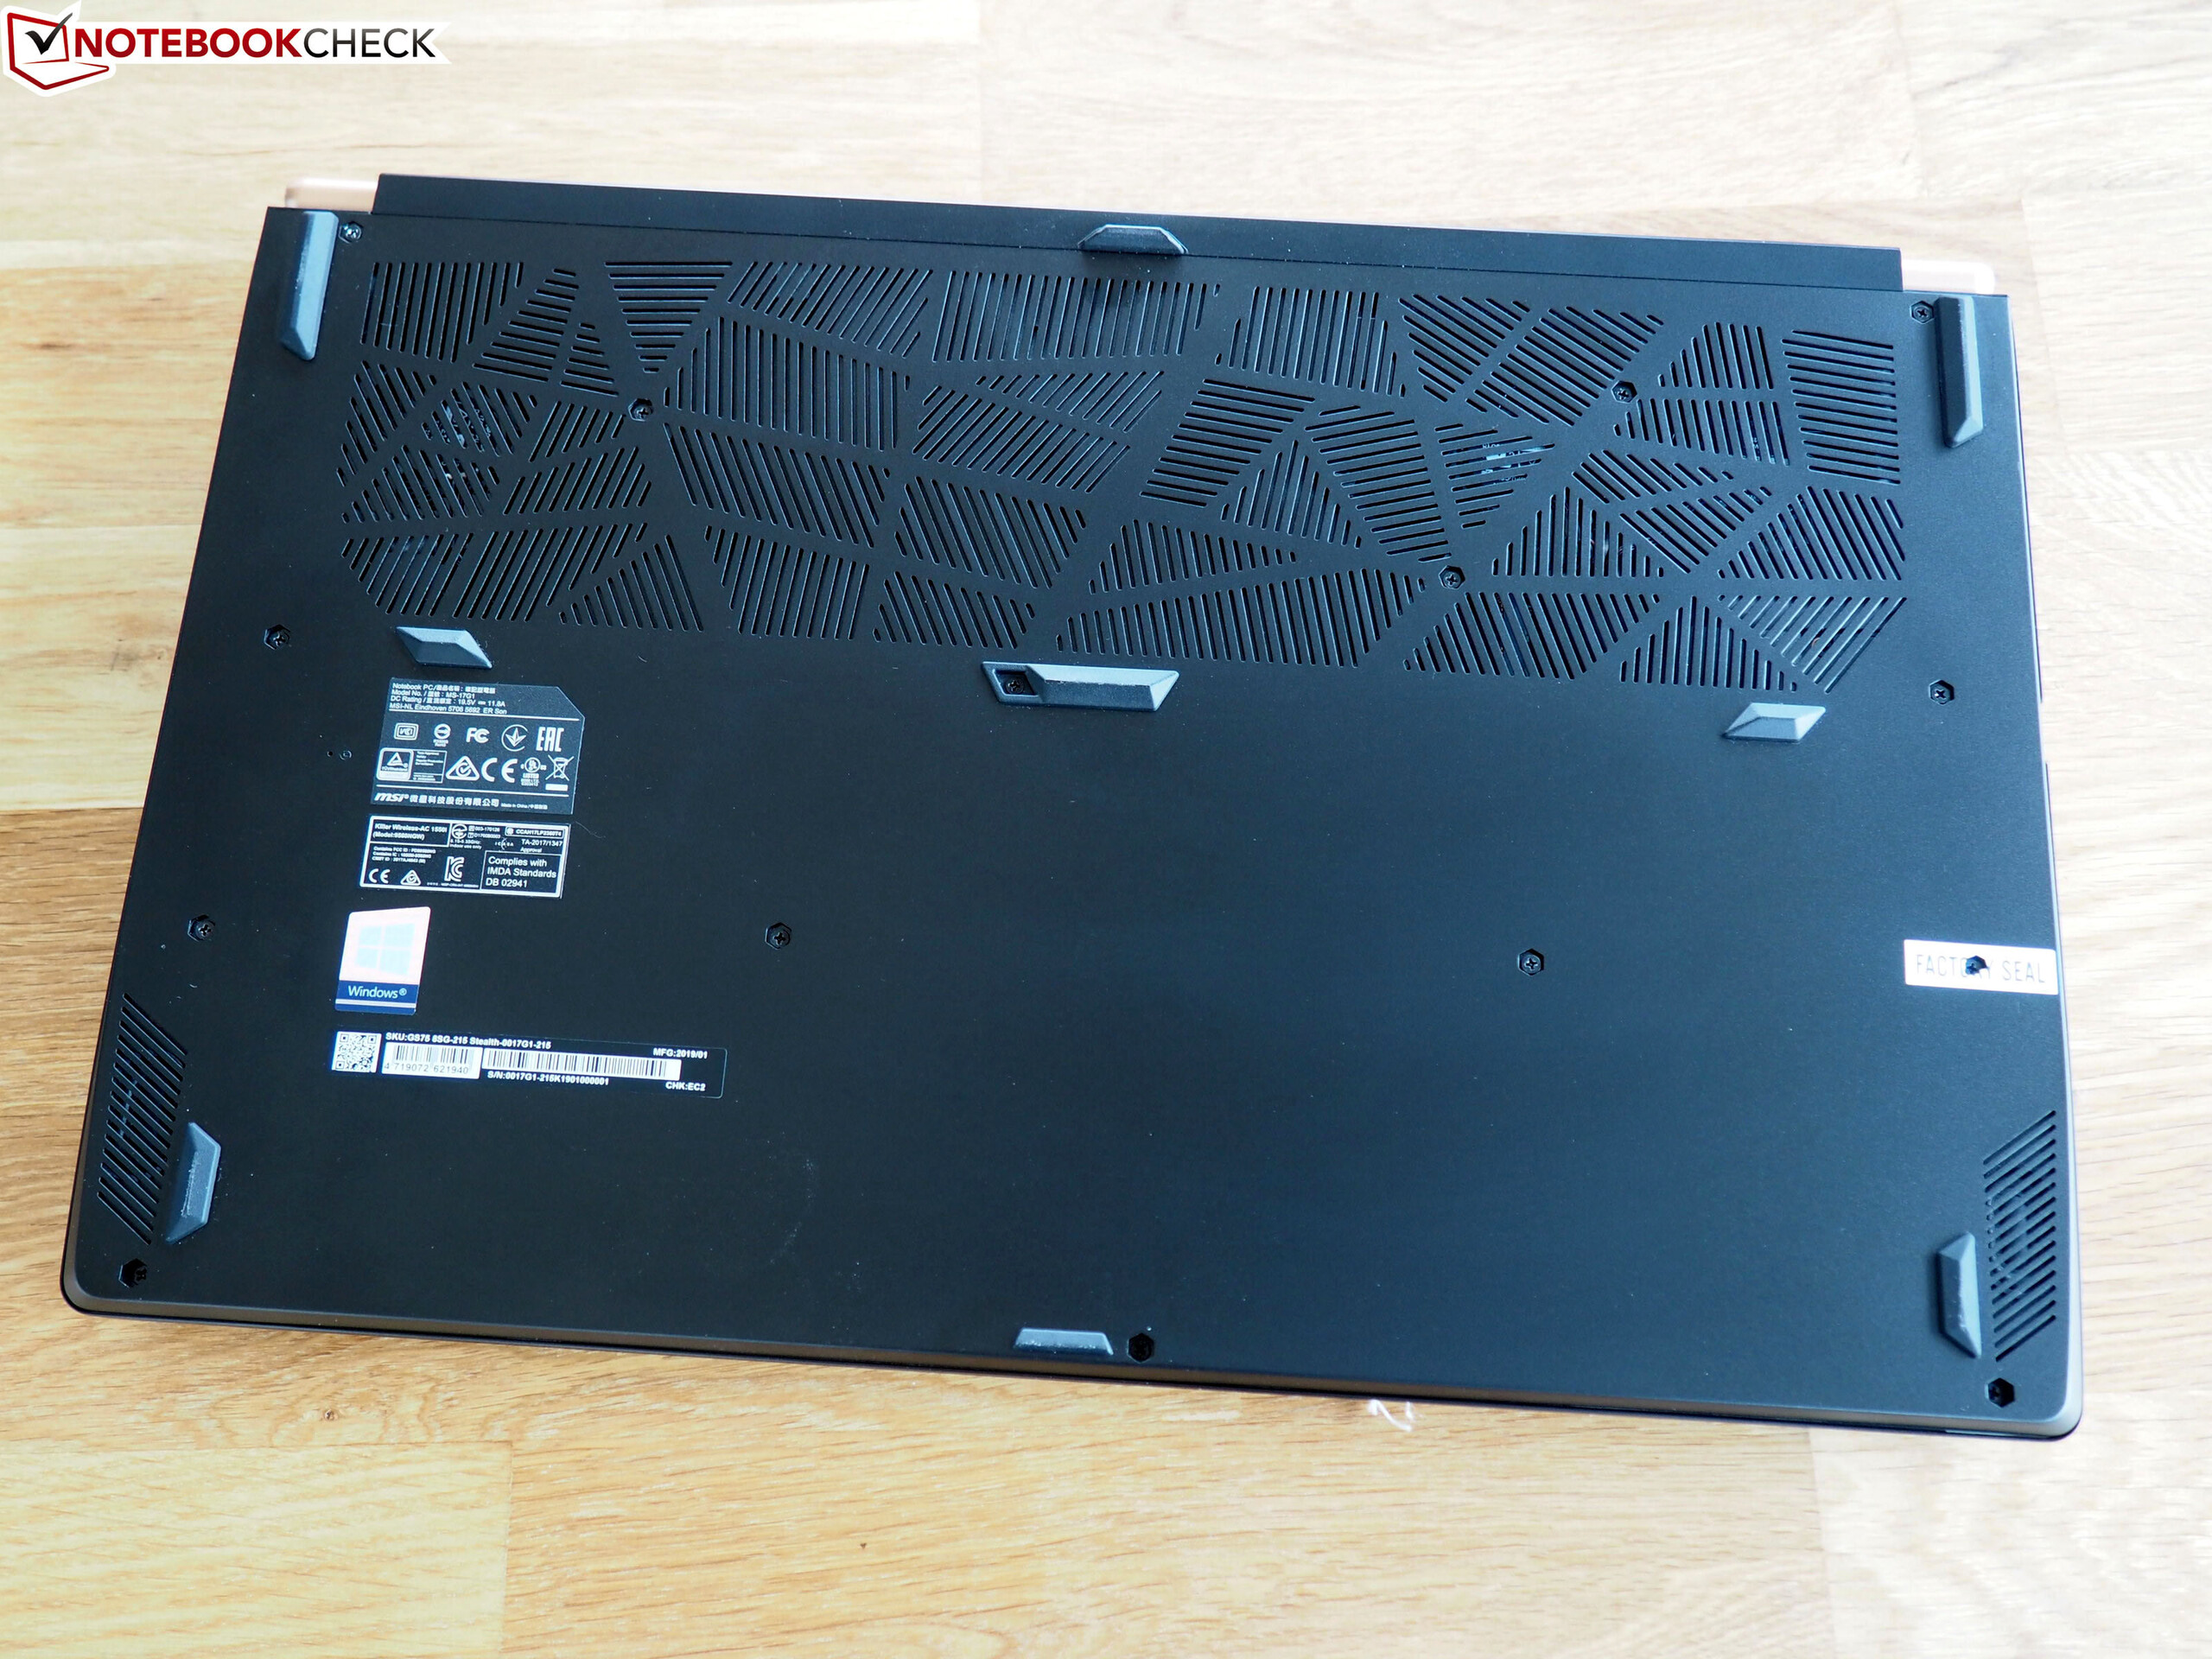
Le 9SG possède également une autonomie comparativement bonne grâce à sa batterie de 80,25 Wh, et devrait tenir la journée entre deux charges. Le châssis trop flexible aide à garder un faible poids, le 9SG ne pesant que 2,28 kg. L’intégration du Thunderbolt 3 est pertinente, et si les ports devraient suffire pour beaucoup, MSI aurait pu en ajouter quelques-uns. Dans l’ensemble, le MSI GS75 Stealth 9SG est un bon appareil pour ceux qui veulent un portable de jeu de 17,3 pouces nomade. Ceux qui passeront par-dessus sa conception seront bien servis par le 9SG, avec ses excellentes performances sur un magnifique écran 144 Hz.
L’intégralité de cette critique est disponible en anglais en suivant ce lien.
MSI GS75 Stealth 9SG
- 05/14/2020 v7 (old)
Sascha Mölck
Price comparison
