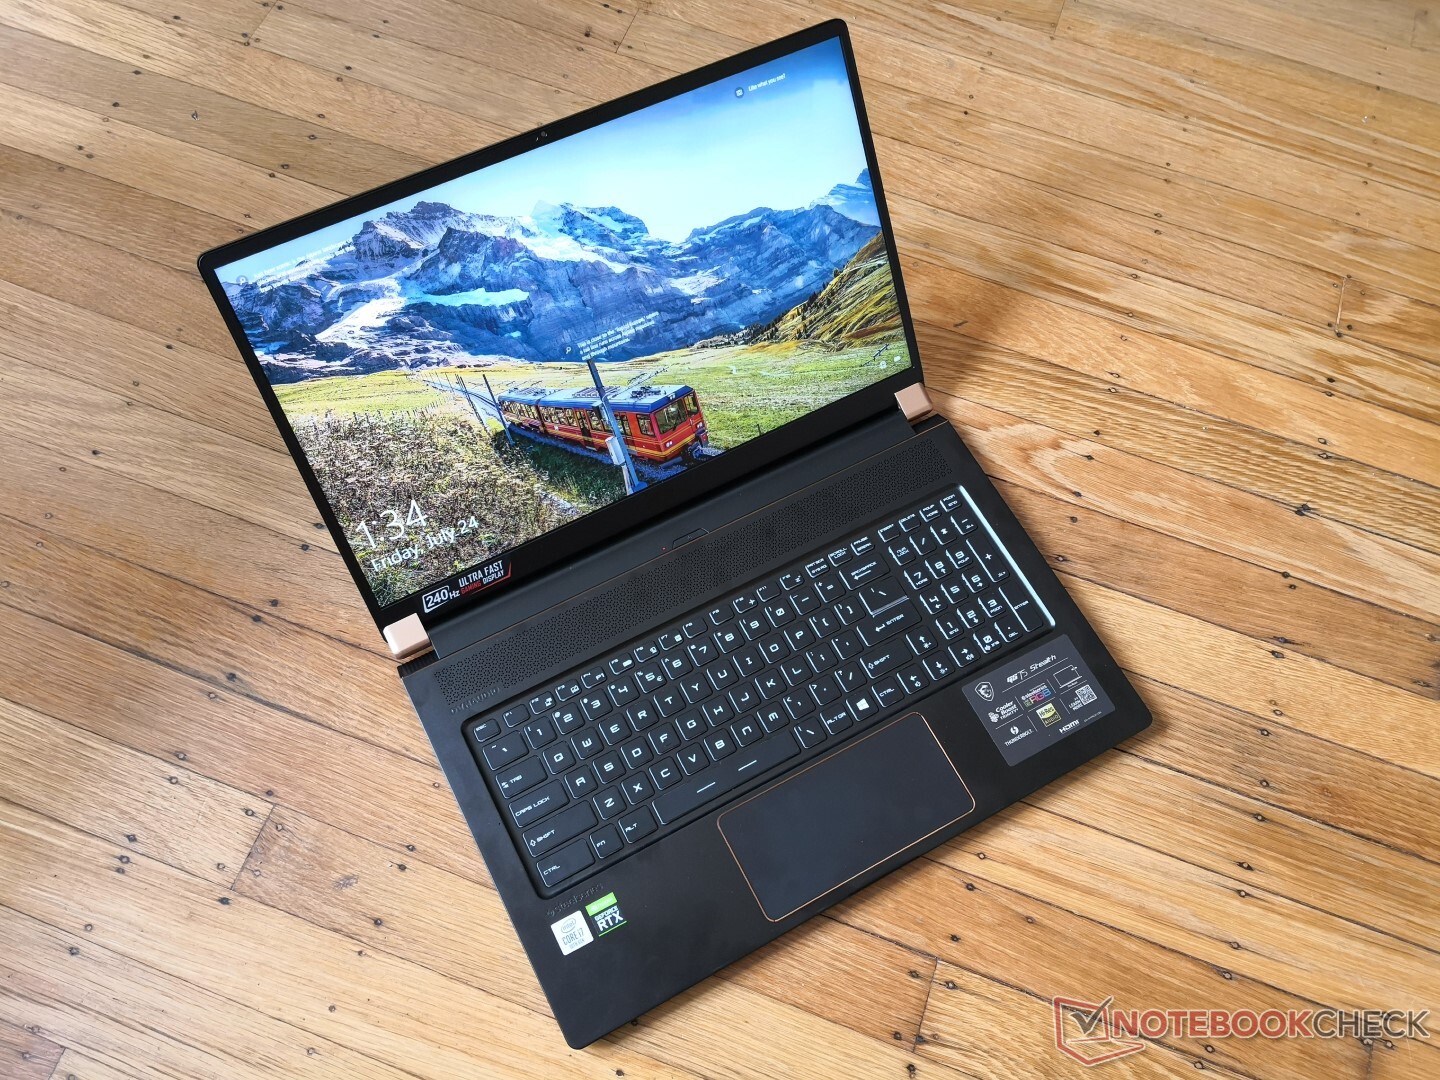
Test du MSI GS75 Stealth 10SF (i7-10875H, RTX 2070 Max-Q, FHD, 240 Hz) : très bonnes performances du Core i7
Note | Date | Modèle | Poids | Épaisseur | Taille | Résolution | Prix |
|---|---|---|---|---|---|---|---|
| 83.7 % v7 (old) | 09/20 | MSI GS75 10SF-609US i7-10875H, GeForce RTX 2070 Max-Q | 2.3 kg | 18.9 mm | 17.30" | 1920x1080 | |
| 87.4 % v7 (old) | 08/20 | Razer Blade Pro 17 RTX 2070 Max-Q 300 Hz i7-10875H, GeForce RTX 2070 Max-Q | 2.7 kg | 19.9 mm | 17.30" | 1920x1080 | |
| 86.5 % v7 (old) | 06/20 | Aorus 17G XB i7-10875H, GeForce RTX 2070 Super Max-Q | 2.7 kg | 26 mm | 17.30" | 1920x1080 | |
| 87 % v7 (old) | 05/20 | Gigabyte Aero 17 HDR XB i7-10875H, GeForce RTX 2070 Super Max-Q | 2.7 kg | 21 mm | 17.30" | 3840x2160 | |
| 84.2 % v7 (old) | 03/20 | Alienware m17 R2 P41E i9-9980HK, GeForce RTX 2080 Max-Q | 2.6 kg | 20.5 mm | 17.30" | 1920x1080 | |
| 82.4 % v7 (old) | 09/20 | Asus Zephyrus S17 GX701LXS i7-10875H, GeForce RTX 2080 Super Max-Q | 2.6 kg | 18.7 mm | 17.30" | 1920x1080 |

| SD Card Reader | |
| average JPG Copy Test (av. of 3 runs) | |
| Aorus 17G XB (Toshiba Exceria Pro SDXC 64 GB UHS-II) | |
| Razer Blade Pro 17 RTX 2070 Max-Q 300 Hz (Toshiba Exceria Pro SDXC 64 GB UHS-II) | |
| Gigabyte Aero 17 HDR XB (Toshiba Exceria Pro SDXC 64 GB UHS-II) | |
| MSI GS75 10SF-609US (Toshiba Exceria Pro M501 UHS-II) | |
| MSI GS73 Stealth 8RF-011 (Toshiba Exceria Pro SDXC 64 GB UHS-II) | |
| maximum AS SSD Seq Read Test (1GB) | |
| Aorus 17G XB (Toshiba Exceria Pro SDXC 64 GB UHS-II) | |
| Gigabyte Aero 17 HDR XB (Toshiba Exceria Pro SDXC 64 GB UHS-II) | |
| MSI GS73 Stealth 8RF-011 (Toshiba Exceria Pro SDXC 64 GB UHS-II) | |
| MSI GS75 10SF-609US (Toshiba Exceria Pro M501 UHS-II) | |
| Razer Blade Pro 17 RTX 2070 Max-Q 300 Hz (Toshiba Exceria Pro SDXC 64 GB UHS-II) | |


| |||||||||||||||||||||||||
Homogénéité de la luminosité: 84 %
Valeur mesurée au centre, sur batterie: 299.4 cd/m²
Contraste: 966:1 (Valeurs des noirs: 0.31 cd/m²)
ΔE ColorChecker Calman: 1.82 | ∀{0.5-29.43 Ø4.71}
calibrated: 1.59
ΔE Greyscale Calman: 2.7 | ∀{0.09-98 Ø4.96}
99.8% sRGB (Argyll 1.6.3 3D)
67.1% AdobeRGB 1998 (Argyll 1.6.3 3D)
75.1% AdobeRGB 1998 (Argyll 3D)
99.8% sRGB (Argyll 3D)
75.6% Display P3 (Argyll 3D)
Gamma: 2.18
CCT: 6837 K
| MSI GS75 10SF-609US Sharp LQ173M1JW05, IPS, 17.3", 1920x1080 | Razer Blade Pro 17 RTX 2070 Max-Q 300 Hz Sharp LQ173M1JW02, IPS, 17.3", 1920x1080 | Aorus 17G XB AU Optronics B173HAN05.0 (AUO509D), IPS, 17.3", 1920x1080 | Alienware m17 R2 P41E Chi Mei 173HCE, CMN175F, IPS, 17.3", 1920x1080 | Asus ROG Zephyrus S GX701GXR AU Optronics B173HAN05.1, IPS, 17.3", 1920x1080 | MSI GS73 Stealth 8RF-011 CMN N173HHE-G32 (CMN1747), TN, 17.3", 1920x1080 | |
|---|---|---|---|---|---|---|
| Display | -3% | -4% | -4% | -5% | 11% | |
| Display P3 Coverage (%) | 75.6 | 72.2 -4% | 70.6 -7% | 70.8 -6% | 70 -7% | 90.8 20% |
| sRGB Coverage (%) | 99.8 | 98.5 -1% | 97.2 -3% | 98.5 -1% | 96.6 -3% | 99.9 0% |
| AdobeRGB 1998 Coverage (%) | 75.1 | 73 -3% | 72.8 -3% | 72.2 -4% | 72.3 -4% | 85.8 14% |
| Response Times | -29% | -151% | -154% | -14% | -25% | |
| Response Time Grey 50% / Grey 80% * (ms) | 5 ? | 5.6 ? -12% | 16 ? -220% | 17.2 ? -244% | 5.6 ? -12% | 7.8 ? -56% |
| Response Time Black / White * (ms) | 6.6 ? | 9.6 ? -45% | 12 ? -82% | 10.8 ? -64% | 7.6 ? -15% | 6.2 ? 6% |
| PWM Frequency (Hz) | 26320 ? | 25510 ? | ||||
| Screen | -44% | 19% | 18% | 3% | -17% | |
| Brightness middle (cd/m²) | 299.4 | 328 10% | 293 -2% | 384.2 28% | 288 -4% | 262 -12% |
| Brightness (cd/m²) | 299 | 329 10% | 285 -5% | 357 19% | 276 -8% | 261 -13% |
| Brightness Distribution (%) | 84 | 78 -7% | 95 13% | 90 7% | 93 11% | 94 12% |
| Black Level * (cd/m²) | 0.31 | 0.35 -13% | 0.24 23% | 0.29 6% | 0.24 23% | 0.2 35% |
| Contrast (:1) | 966 | 937 -3% | 1221 26% | 1325 37% | 1200 24% | 1310 36% |
| Colorchecker dE 2000 * | 1.82 | 4.74 -160% | 1.27 30% | 1.35 26% | 1.92 -5% | 3.96 -118% |
| Colorchecker dE 2000 max. * | 3.91 | 8.99 -130% | 2.24 43% | 3.45 12% | 4.57 -17% | 7.29 -86% |
| Colorchecker dE 2000 calibrated * | 1.59 | 2.12 -33% | 1.06 33% | 1.42 11% | 1.14 28% | 2.18 -37% |
| Greyscale dE 2000 * | 2.7 | 6.8 -152% | 1.34 50% | 1.2 56% | 3.08 -14% | 3.09 -14% |
| Gamma | 2.18 101% | 2.2 100% | 2.38 92% | 2.23 99% | 2.42 91% | 2.48 89% |
| CCT | 6837 95% | 6446 101% | 6542 99% | 6580 99% | 7055 92% | 6977 93% |
| Color Space (Percent of AdobeRGB 1998) (%) | 67.1 | 64.8 -3% | 73 9% | 65.5 -2% | 65 -3% | 76 13% |
| Color Space (Percent of sRGB) (%) | 99.8 | 98.6 -1% | 94 -6% | 98.5 -1% | 96 -4% | 100 0% |
| Moyenne finale (programmes/paramètres) | -25% /
-34% | -45% /
-6% | -47% /
-8% | -5% /
-1% | -10% /
-13% |
* ... Moindre est la valeur, meilleures sont les performances
Temps de réponse de l'écran
| ↔ Temps de réponse noir à blanc | ||
|---|---|---|
| 6.6 ms ... hausse ↗ et chute ↘ combinées | ↗ 2.6 ms hausse |  |
| ↘ 4 ms chute | ||
| L'écran montre de très faibles temps de réponse, parfait pour le jeu. En comparaison, tous les appareils testés affichent entre 0.1 (minimum) et 240 (maximum) ms. » 21 % des appareils testés affichent de meilleures performances. Cela signifie que les latences relevées sont meilleures que la moyenne (19.8 ms) de tous les appareils testés. | ||
| ↔ Temps de réponse gris 50% à gris 80% | ||
| 5 ms ... hausse ↗ et chute ↘ combinées | ↗ 2.2 ms hausse |  |
| ↘ 2.8 ms chute | ||
| L'écran montre de très faibles temps de réponse, parfait pour le jeu. En comparaison, tous les appareils testés affichent entre 0.165 (minimum) et 636 (maximum) ms. » 17 % des appareils testés affichent de meilleures performances. Cela signifie que les latences relevées sont meilleures que la moyenne (30.9 ms) de tous les appareils testés. | ||
Scintillement / MLI (Modulation de largeur d'impulsion)
| Scintillement / MLI (Modulation de largeur d'impulsion) non décelé |  | ||
En comparaison, 52 % des appareils testés n'emploient pas MDI pour assombrir leur écran. Nous avons relevé une moyenne à 7748 (minimum : 5 - maximum : 343500) Hz dans le cas où une MDI était active. | |||
Cinebench R15: CPU Multi 64Bit | CPU Single 64Bit
Blender: v2.79 BMW27 CPU
7-Zip 18.03: 7z b 4 -mmt1 | 7z b 4
Geekbench 5.5: Single-Core | Multi-Core
HWBOT x265 Benchmark v2.2: 4k Preset
LibreOffice : 20 Documents To PDF
R Benchmark 2.5: Overall mean
| Cinebench R20 / CPU (Multi Core) | |
| Eurocom Sky X4C i9-9900KS | |
| Asus Zephyrus G14 GA401IV | |
| Asus TUF A17 FA706IU-AS76 | |
| MSI GS75 10SF-609US | |
| Asus Strix Scar 17 G732LXS | |
| MSI GE75 9SG | |
| Moyenne Intel Core i7-10875H (1986 - 4176, n=32) | |
| Acer Nitro 5 AN515-44-R5FT | |
| MSI GE75 Raider 10SE-008US | |
| Asus ROG Zephyrus S GX701GXR | |
| MSI GF75 Thin 10SCXR | |
| Cinebench R20 / CPU (Single Core) | |
| Eurocom Sky X4C i9-9900KS | |
| Asus Zephyrus G14 GA401IV | |
| Asus Strix Scar 17 G732LXS | |
| Moyenne Intel Core i7-10875H (430 - 524, n=32) | |
| Asus TUF A17 FA706IU-AS76 | |
| MSI GS75 10SF-609US | |
| MSI GE75 Raider 10SE-008US | |
| MSI GE75 9SG | |
| MSI GF75 Thin 10SCXR | |
| Acer Nitro 5 AN515-44-R5FT | |
| Asus ROG Zephyrus S GX701GXR | |
| Cinebench R15 / CPU Multi 64Bit | |
| Eurocom Sky X4C i9-9900KS | |
| Asus Zephyrus G14 GA401IV | |
| Asus TUF A17 FA706IU-AS76 | |
| Asus Strix Scar 17 G732LXS | |
| MSI GE75 9SG | |
| MSI GS75 10SF-609US | |
| Moyenne Intel Core i7-10875H (1003 - 1833, n=38) | |
| Acer Nitro 5 AN515-44-R5FT | |
| MSI GE75 Raider 10SE-008US | |
| Asus ROG Zephyrus S GX701GXR | |
| MSI GF75 Thin 10SCXR | |
| Cinebench R15 / CPU Single 64Bit | |
| Eurocom Sky X4C i9-9900KS | |
| Moyenne Intel Core i7-10875H (190 - 220, n=37) | |
| Asus Strix Scar 17 G732LXS | |
| MSI GS75 10SF-609US | |
| Asus Zephyrus G14 GA401IV | |
| MSI GE75 9SG | |
| Asus TUF A17 FA706IU-AS76 | |
| MSI GE75 Raider 10SE-008US | |
| MSI GF75 Thin 10SCXR | |
| Acer Nitro 5 AN515-44-R5FT | |
| Asus ROG Zephyrus S GX701GXR | |
| Blender / v2.79 BMW27 CPU | |
| MSI GF75 Thin 10SCXR | |
| MSI GE75 Raider 10SE-008US | |
| Acer Nitro 5 AN515-44-R5FT | |
| Moyenne Intel Core i7-10875H (259 - 535, n=30) | |
| Asus Zephyrus G14 GA401IV | |
| MSI GE75 9SG | |
| Asus Strix Scar 17 G732LXS | |
| MSI GS75 10SF-609US | |
| Asus TUF A17 FA706IU-AS76 | |
| Eurocom Sky X4C i9-9900KS | |
| 7-Zip 18.03 / 7z b 4 -mmt1 | |
| Eurocom Sky X4C i9-9900KS | |
| Moyenne Intel Core i7-10875H (5071 - 5780, n=31) | |
| Asus Strix Scar 17 G732LXS | |
| MSI GS75 10SF-609US | |
| MSI GE75 Raider 10SE-008US | |
| MSI GE75 9SG | |
| Asus TUF A17 FA706IU-AS76 | |
| MSI GF75 Thin 10SCXR | |
| Asus Zephyrus G14 GA401IV | |
| Acer Nitro 5 AN515-44-R5FT | |
| Geekbench 5.5 / Single-Core | |
| Eurocom Sky X4C i9-9900KS | |
| Moyenne Intel Core i7-10875H (1233 - 1371, n=29) | |
| Asus Strix Scar 17 G732LXS | |
| MSI GS75 10SF-609US | |
| MSI GE75 Raider 10SE-008US | |
| Asus Zephyrus G14 GA401IV | |
| Asus TUF A17 FA706IU-AS76 | |
| MSI GF75 Thin 10SCXR | |
| Acer Nitro 5 AN515-44-R5FT | |
| Geekbench 5.5 / Multi-Core | |
| Eurocom Sky X4C i9-9900KS | |
| Asus Strix Scar 17 G732LXS | |
| MSI GS75 10SF-609US | |
| Asus TUF A17 FA706IU-AS76 | |
| Moyenne Intel Core i7-10875H (5715 - 8620, n=29) | |
| Asus Zephyrus G14 GA401IV | |
| MSI GE75 Raider 10SE-008US | |
| Acer Nitro 5 AN515-44-R5FT | |
| MSI GF75 Thin 10SCXR | |
| HWBOT x265 Benchmark v2.2 / 4k Preset | |
| Eurocom Sky X4C i9-9900KS | |
| MSI GS75 10SF-609US | |
| Asus Strix Scar 17 G732LXS | |
| Asus TUF A17 FA706IU-AS76 | |
| Asus Zephyrus G14 GA401IV | |
| MSI GE75 9SG | |
| Moyenne Intel Core i7-10875H (7.27 - 14.1, n=27) | |
| MSI GE75 Raider 10SE-008US | |
| Acer Nitro 5 AN515-44-R5FT | |
| MSI GF75 Thin 10SCXR | |
| LibreOffice / 20 Documents To PDF | |
| Acer Nitro 5 AN515-44-R5FT | |
| Asus TUF A17 FA706IU-AS76 | |
| MSI GF75 Thin 10SCXR | |
| MSI GE75 Raider 10SE-008US | |
| Asus Strix Scar 17 G732LXS | |
| Moyenne Intel Core i7-10875H (30.2 - 84.3, n=30) | |
| MSI GS75 10SF-609US | |
| R Benchmark 2.5 / Overall mean | |
| MSI GF75 Thin 10SCXR | |
| Acer Nitro 5 AN515-44-R5FT | |
| MSI GE75 Raider 10SE-008US | |
| Asus TUF A17 FA706IU-AS76 | |
| MSI GS75 10SF-609US | |
| Moyenne Intel Core i7-10875H (0.546 - 0.662, n=29) | |
| Asus Strix Scar 17 G732LXS | |
* ... Moindre est la valeur, meilleures sont les performances
| PCMark 8 Home Score Accelerated v2 | 4780 points | |
| PCMark 8 Work Score Accelerated v2 | 6191 points | |
| PCMark 10 Score | 6582 points | |
Aide | ||
| DPC Latencies / LatencyMon - interrupt to process latency (max), Web, Youtube, Prime95 | |
| Asus TUF A17 FA706IU-AS76 | |
| Aorus 17G XB | |
| Asus Strix Scar 17 G732LXS | |
| MSI GF75 Thin 10SCXR | |
| Gigabyte Aero 17 HDR XB | |
| MSI GE75 Raider 10SE-008US | |
| Razer Blade Pro 17 RTX 2070 Max-Q 300 Hz | |
| MSI GS75 10SF-609US | |
* ... Moindre est la valeur, meilleures sont les performances
| MSI GS75 10SF-609US WDC PC SN730 SDBPNTY-512G | Razer Blade Pro 17 RTX 2070 Max-Q 300 Hz Lite-On CA5-8D512 | Aorus 17G XB Samsung SSD PM981a MZVLB512HBJQ | Alienware m17 R2 P41E 2x SK Hynix PC601 NVMe 512 GB (RAID 0) | Asus ROG Zephyrus S GX701GXR Samsung SSD PM981 MZVLB1T0HALR | MSI GS73 Stealth 8RF-011 Samsung PM961 MZVLW256HEHP | |
|---|---|---|---|---|---|---|
| AS SSD | -30% | 29% | -9% | 8% | -10% | |
| Seq Read (MB/s) | 2327 | 2019 -13% | 1791 -23% | 1938 -17% | 1662 -29% | 1749 -25% |
| Seq Write (MB/s) | 2479 | 1314 -47% | 2193 -12% | 2094 -16% | 2266 -9% | 1173 -53% |
| 4K Read (MB/s) | 45.46 | 46.61 3% | 50.7 12% | 25.88 -43% | 46.86 3% | 42.81 -6% |
| 4K Write (MB/s) | 157.4 | 90.2 -43% | 116.8 -26% | 100.8 -36% | 101.1 -36% | 98.4 -37% |
| 4K-64 Read (MB/s) | 1050 | 665 -37% | 1525 45% | 1217 16% | 1419 35% | 1238 18% |
| 4K-64 Write (MB/s) | 938 | 813 -13% | 1958 109% | 1137 21% | 1746 86% | 691 -26% |
| Access Time Read * (ms) | 0.076 | 0.058 24% | 0.07 8% | 0.051 33% | 0.047 38% | 0.077 -1% |
| Access Time Write * (ms) | 0.071 | 0.167 -135% | 0.032 55% | 0.107 -51% | 0.037 48% | 0.038 46% |
| Score Read (Points) | 1328 | 913 -31% | 1755 32% | 1437 8% | 1632 23% | 1456 10% |
| Score Write (Points) | 1343 | 1034 -23% | 2294 71% | 1447 8% | 2074 54% | 906 -33% |
| Score Total (Points) | 3366 | 2392 -29% | 4972 48% | 3624 8% | 4576 36% | 3083 -8% |
| Copy ISO MB/s (MB/s) | 3092 | 1715 -45% | 1926 -38% | 1398 -55% | ||
| Copy Program MB/s (MB/s) | 733 | 622 -15% | 626 -15% | 438.9 -40% | ||
| Copy Game MB/s (MB/s) | 1683 | 1506 -11% | 1533 -9% | 996 -41% | ||
| CrystalDiskMark 5.2 / 6 | -7% | -3% | -10% | -29% | -38% | |
| Write 4K (MB/s) | 177.9 | 119 -33% | 123.4 -31% | 110.6 -38% | 96.1 -46% | 90.1 -49% |
| Read 4K (MB/s) | 47.42 | 51.9 9% | 45.02 -5% | 41.46 -13% | 40.86 -14% | 39.07 -18% |
| Write Seq (MB/s) | 2707 | 2258 -17% | 2526 -7% | 2378 -12% | 1317 -51% | 1192 -56% |
| Read Seq (MB/s) | 2369 | 2283 -4% | 2062 -13% | 2114 -11% | 1030 -57% | 1135 -52% |
| Write 4K Q32T1 (MB/s) | 427.8 | 491 15% | 497.9 16% | 445.4 4% | 350.4 -18% | 290.9 -32% |
| Read 4K Q32T1 (MB/s) | 543 | 540 -1% | 579 7% | 509 -6% | 404.1 -26% | 343.9 -37% |
| Write Seq Q32T1 (MB/s) | 2703 | 2253 -17% | 2982 10% | 2735 1% | 2396 -11% | 1194 -56% |
| Read Seq Q32T1 (MB/s) | 3387 | 3172 -6% | 3440 2% | 3206 -5% | 3194 -6% | 3199 -6% |
| Moyenne finale (programmes/paramètres) | -19% /
-21% | 13% /
16% | -10% /
-10% | -11% /
-5% | -24% /
-22% |
* ... Moindre est la valeur, meilleures sont les performances

Throttling du disque : DiskSpd Read Loop, Queue Depth 8
| 3DMark 11 Performance | 22303 points | |
| 3DMark Cloud Gate Standard Score | 51136 points | |
| 3DMark Fire Strike Score | 17066 points | |
| 3DMark Time Spy Score | 7392 points | |
Aide | ||
| Bas | Moyen | Élevé | Ultra | |
|---|---|---|---|---|
| The Witcher 3 (2015) | 349.7 | 231.3 | 131.3 | 67.5 |
| Dota 2 Reborn (2015) | 164 | 141 | 133 | 126 |
| X-Plane 11.11 (2018) | 112 | 100 | 83.7 | |
| Shadow of the Tomb Raider (2018) | 161 | 110 | 98 | 89 |
| MSI GS75 10SF-609US GeForce RTX 2070 Max-Q, i7-10875H, WDC PC SN730 SDBPNTY-512G | Razer Blade Pro 17 RTX 2070 Max-Q 300 Hz GeForce RTX 2070 Max-Q, i7-10875H, Lite-On CA5-8D512 | Aorus 17G XB GeForce RTX 2070 Super Max-Q, i7-10875H, Samsung SSD PM981a MZVLB512HBJQ | Alienware m17 R2 P41E GeForce RTX 2080 Max-Q, i9-9980HK, 2x SK Hynix PC601 NVMe 512 GB (RAID 0) | Asus ROG Zephyrus S GX701GXR GeForce RTX 2080 Max-Q, i7-9750H, Samsung SSD PM981 MZVLB1T0HALR | MSI GS73 Stealth 8RF-011 GeForce GTX 1070 Max-Q, i7-8750H, Samsung PM961 MZVLW256HEHP | |
|---|---|---|---|---|---|---|
| Noise | 6% | -5% | 3% | 2% | 4% | |
| arrêt / environnement * (dB) | 26.2 | 28.2 -8% | 30 -15% | 29.1 -11% | 30 -15% | 30 -15% |
| Idle Minimum * (dB) | 31.2 | 28.2 10% | 35 -12% | 29.4 6% | 32 -3% | 30 4% |
| Idle Average * (dB) | 31.4 | 28.2 10% | 36 -15% | 29.4 6% | 33 -5% | 34 -8% |
| Idle Maximum * (dB) | 34 | 30.5 10% | 41 -21% | 31.5 7% | 34 -0% | 36 -6% |
| Load Average * (dB) | 49.5 | 42.2 15% | 47 5% | 49.7 -0% | 40 19% | 43 13% |
| Witcher 3 ultra * (dB) | 50.6 | 53 -5% | 48 5% | 49.5 2% | 49 3% | 45 11% |
| Load Maximum * (dB) | 60.7 | 55.5 9% | 49 19% | 53.3 12% | 50 18% | 45 26% |
* ... Moindre est la valeur, meilleures sont les performances
Degré de la nuisance sonore
| Au repos |
| 31.2 / 31.4 / 34 dB(A) |
| Fortement sollicité |
| 49.5 / 60.7 dB(A) |
 | ||
30 dB silencieux 40 dB(A) audible 50 dB(A) bruyant |
||
min: | ||
(-) La température maximale du côté supérieur est de 49.8 °C / 122 F, par rapport à la moyenne de 40.4 °C / 105 F, allant de 21.2 à 68.8 °C pour la classe Gaming.
(-) Le fond chauffe jusqu'à un maximum de 55.6 °C / 132 F, contre une moyenne de 43.2 °C / 110 F
(+) En utilisation inactive, la température moyenne du côté supérieur est de 25.9 °C / 79 F, par rapport à la moyenne du dispositif de 33.9 °C / 93 F.
(±) En jouant à The Witcher 3, la température moyenne du côté supérieur est de 34.8 °C / 95 F, alors que la moyenne de l'appareil est de 33.9 °C / 93 F.
(+) Les repose-poignets et le pavé tactile atteignent la température maximale de la peau (33.8 °C / 92.8 F) et ne sont donc pas chauds.
(-) La température moyenne de la zone de l'appui-paume de dispositifs similaires était de 28.8 °C / 83.8 F (-5 °C / #-9 F).
MSI GS75 10SF-609US analyse audio
(+) | les haut-parleurs peuvent jouer relativement fort (93.4# dB)
Basses 100 - 315 Hz
(-) | presque aucune basse - en moyenne 28.5% plus bas que la médiane
(+) | les basses sont linéaires (3% delta à la fréquence précédente)
Médiums 400 - 2000 Hz
(+) | médiane équilibrée - seulement 4.8% de la médiane
(+) | les médiums sont linéaires (6.3% delta à la fréquence précédente)
Aiguës 2 - 16 kHz
(+) | des sommets équilibrés - à seulement 1.5% de la médiane
(+) | les aigus sont linéaires (2.6% delta à la fréquence précédente)
Globalement 100 - 16 000 Hz
(±) | la linéarité du son global est moyenne (17.8% de différence avec la médiane)
Par rapport à la même classe
» 53% de tous les appareils testés de cette catégorie étaient meilleurs, 10% similaires, 37% pires
» Le meilleur avait un delta de 6%, la moyenne était de 18%, le pire était de 132%.
Par rapport à tous les appareils testés
» 36% de tous les appareils testés étaient meilleurs, 8% similaires, 56% pires
» Le meilleur avait un delta de 4%, la moyenne était de 23%, le pire était de 134%.
Apple MacBook 12 (Early 2016) 1.1 GHz analyse audio
(+) | les haut-parleurs peuvent jouer relativement fort (83.6# dB)
Basses 100 - 315 Hz
(±) | basse réduite - en moyenne 11.3% inférieure à la médiane
(±) | la linéarité des basses est moyenne (14.2% delta à la fréquence précédente)
Médiums 400 - 2000 Hz
(+) | médiane équilibrée - seulement 2.4% de la médiane
(+) | les médiums sont linéaires (5.5% delta à la fréquence précédente)
Aiguës 2 - 16 kHz
(+) | des sommets équilibrés - à seulement 2% de la médiane
(+) | les aigus sont linéaires (4.5% delta à la fréquence précédente)
Globalement 100 - 16 000 Hz
(+) | le son global est linéaire (10.2% différence à la médiane)
Par rapport à la même classe
» 7% de tous les appareils testés de cette catégorie étaient meilleurs, 2% similaires, 90% pires
» Le meilleur avait un delta de 5%, la moyenne était de 18%, le pire était de 53%.
Par rapport à tous les appareils testés
» 5% de tous les appareils testés étaient meilleurs, 1% similaires, 94% pires
» Le meilleur avait un delta de 4%, la moyenne était de 23%, le pire était de 134%.
| Éteint/en veille | |
| Au repos | |
| Fortement sollicité |
|
Légende:
min: | |
| MSI GS75 10SF-609US i7-10875H, GeForce RTX 2070 Max-Q, WDC PC SN730 SDBPNTY-512G, IPS, 1920x1080, 17.3" | Razer Blade Pro 17 RTX 2070 Max-Q 300 Hz i7-10875H, GeForce RTX 2070 Max-Q, Lite-On CA5-8D512, IPS, 1920x1080, 17.3" | Aorus 17G XB i7-10875H, GeForce RTX 2070 Super Max-Q, Samsung SSD PM981a MZVLB512HBJQ, IPS, 1920x1080, 17.3" | Asus ROG Zephyrus S GX701GXR i7-9750H, GeForce RTX 2080 Max-Q, Samsung SSD PM981 MZVLB1T0HALR, IPS, 1920x1080, 17.3" | MSI GS73 Stealth 8RF-011 i7-8750H, GeForce GTX 1070 Max-Q, Samsung PM961 MZVLW256HEHP, TN, 1920x1080, 17.3" | MSI GS75 Stealth 9SG i7-9750H, GeForce RTX 2080 Max-Q, 2x Samsung SSD PM981 MZVLB1T0HALR (RAID 0), IPS, 1920x1080, 17.3" | |
|---|---|---|---|---|---|---|
| Power Consumption | 1% | -2% | -14% | 28% | 17% | |
| Idle Minimum * (Watt) | 19.2 | 19.6 -2% | 20 -4% | 32 -67% | 8 58% | 13 32% |
| Idle Average * (Watt) | 22.4 | 21.7 3% | 23 -3% | 34 -52% | 14 37% | 17 24% |
| Idle Maximum * (Watt) | 34.7 | 36.1 -4% | 38 -10% | 36 -4% | 22 37% | 25 28% |
| Load Average * (Watt) | 106.7 | 115.6 -8% | 105 2% | 95 11% | 92 14% | 96 10% |
| Witcher 3 ultra * (Watt) | 160.5 | 157 2% | 158 2% | 155 3% | 154 4% | 156 3% |
| Load Maximum * (Watt) | 248.7 | 219.9 12% | 243 2% | 187 25% | 207 17% | 239 4% |
* ... Moindre est la valeur, meilleures sont les performances
| MSI GS75 10SF-609US i7-10875H, GeForce RTX 2070 Max-Q, 80.25 Wh | Razer Blade Pro 17 RTX 2070 Max-Q 300 Hz i7-10875H, GeForce RTX 2070 Max-Q, 70 Wh | Aorus 17G XB i7-10875H, GeForce RTX 2070 Super Max-Q, 94 Wh | Alienware m17 R2 P41E i9-9980HK, GeForce RTX 2080 Max-Q, 76 Wh | Asus ROG Zephyrus S GX701GXR i7-9750H, GeForce RTX 2080 Max-Q, 76 Wh | MSI GS73 Stealth 8RF-011 i7-8750H, GeForce GTX 1070 Max-Q, 51 Wh | |
|---|---|---|---|---|---|---|
| Autonomie de la batterie | 0% | 8% | -36% | -54% | -47% | |
| Reader / Idle (h) | 8.6 | 10 16% | 7.1 -17% | 4.1 -52% | 5.8 -33% | |
| WiFi v1.3 (h) | 4.9 | 4.9 0% | 7.5 53% | 4.8 -2% | 3 -39% | 3.3 -33% |
| Load (h) | 4.1 | 2.2 -46% | 0.5 -88% | 1.2 -71% | 1 -76% |
Points positifs
Points négatifs

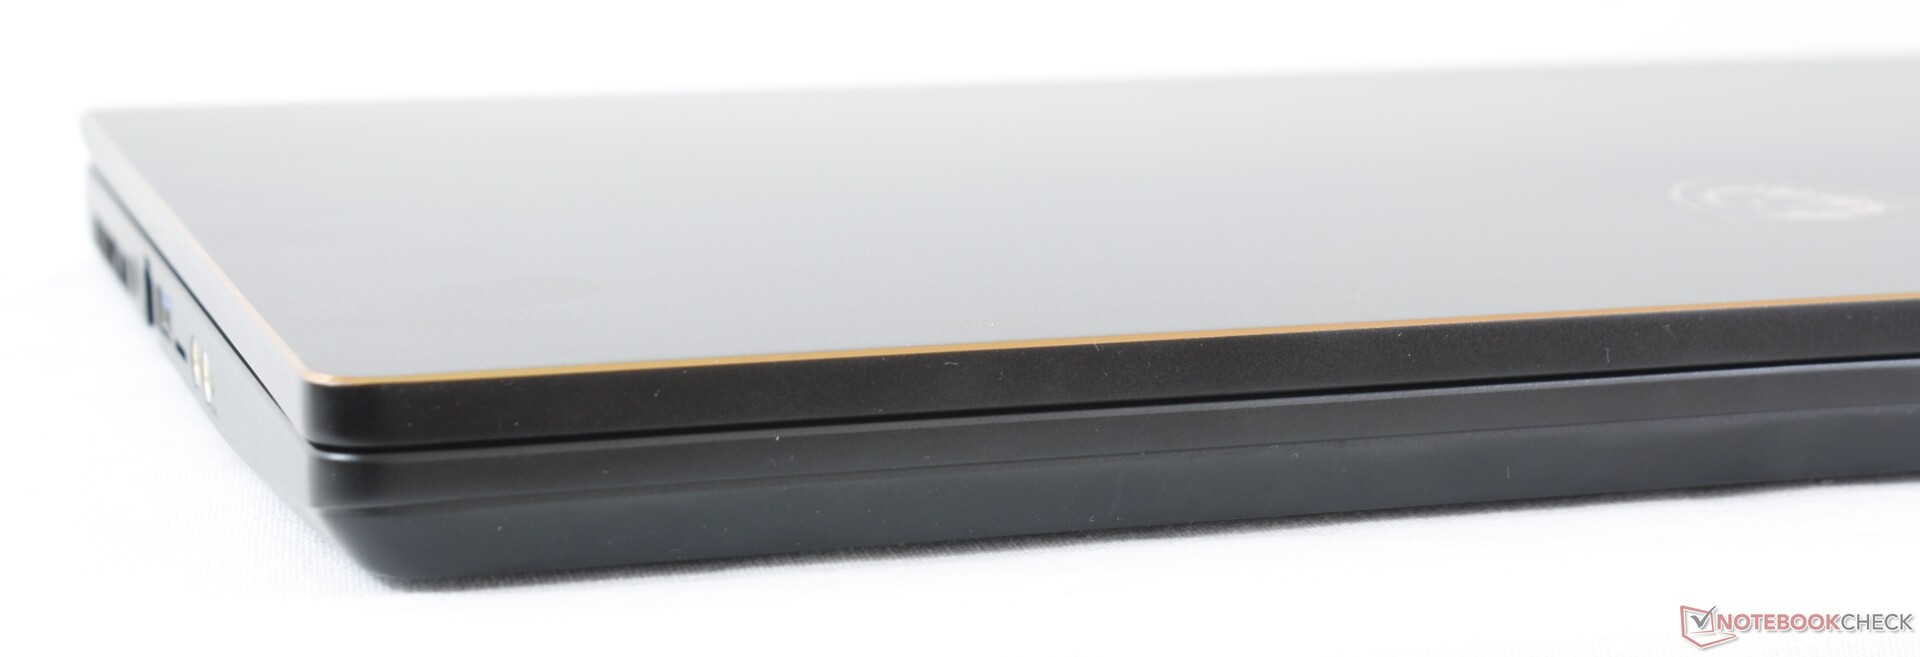
Le principal argument du GS75 est son excellent rapport performances / poids. Impossible de trouver un autre PC portable de jeu de 17,3 pouces avec un Core i9 et une GeForce RTX 2080 Max-Q aussi léger.
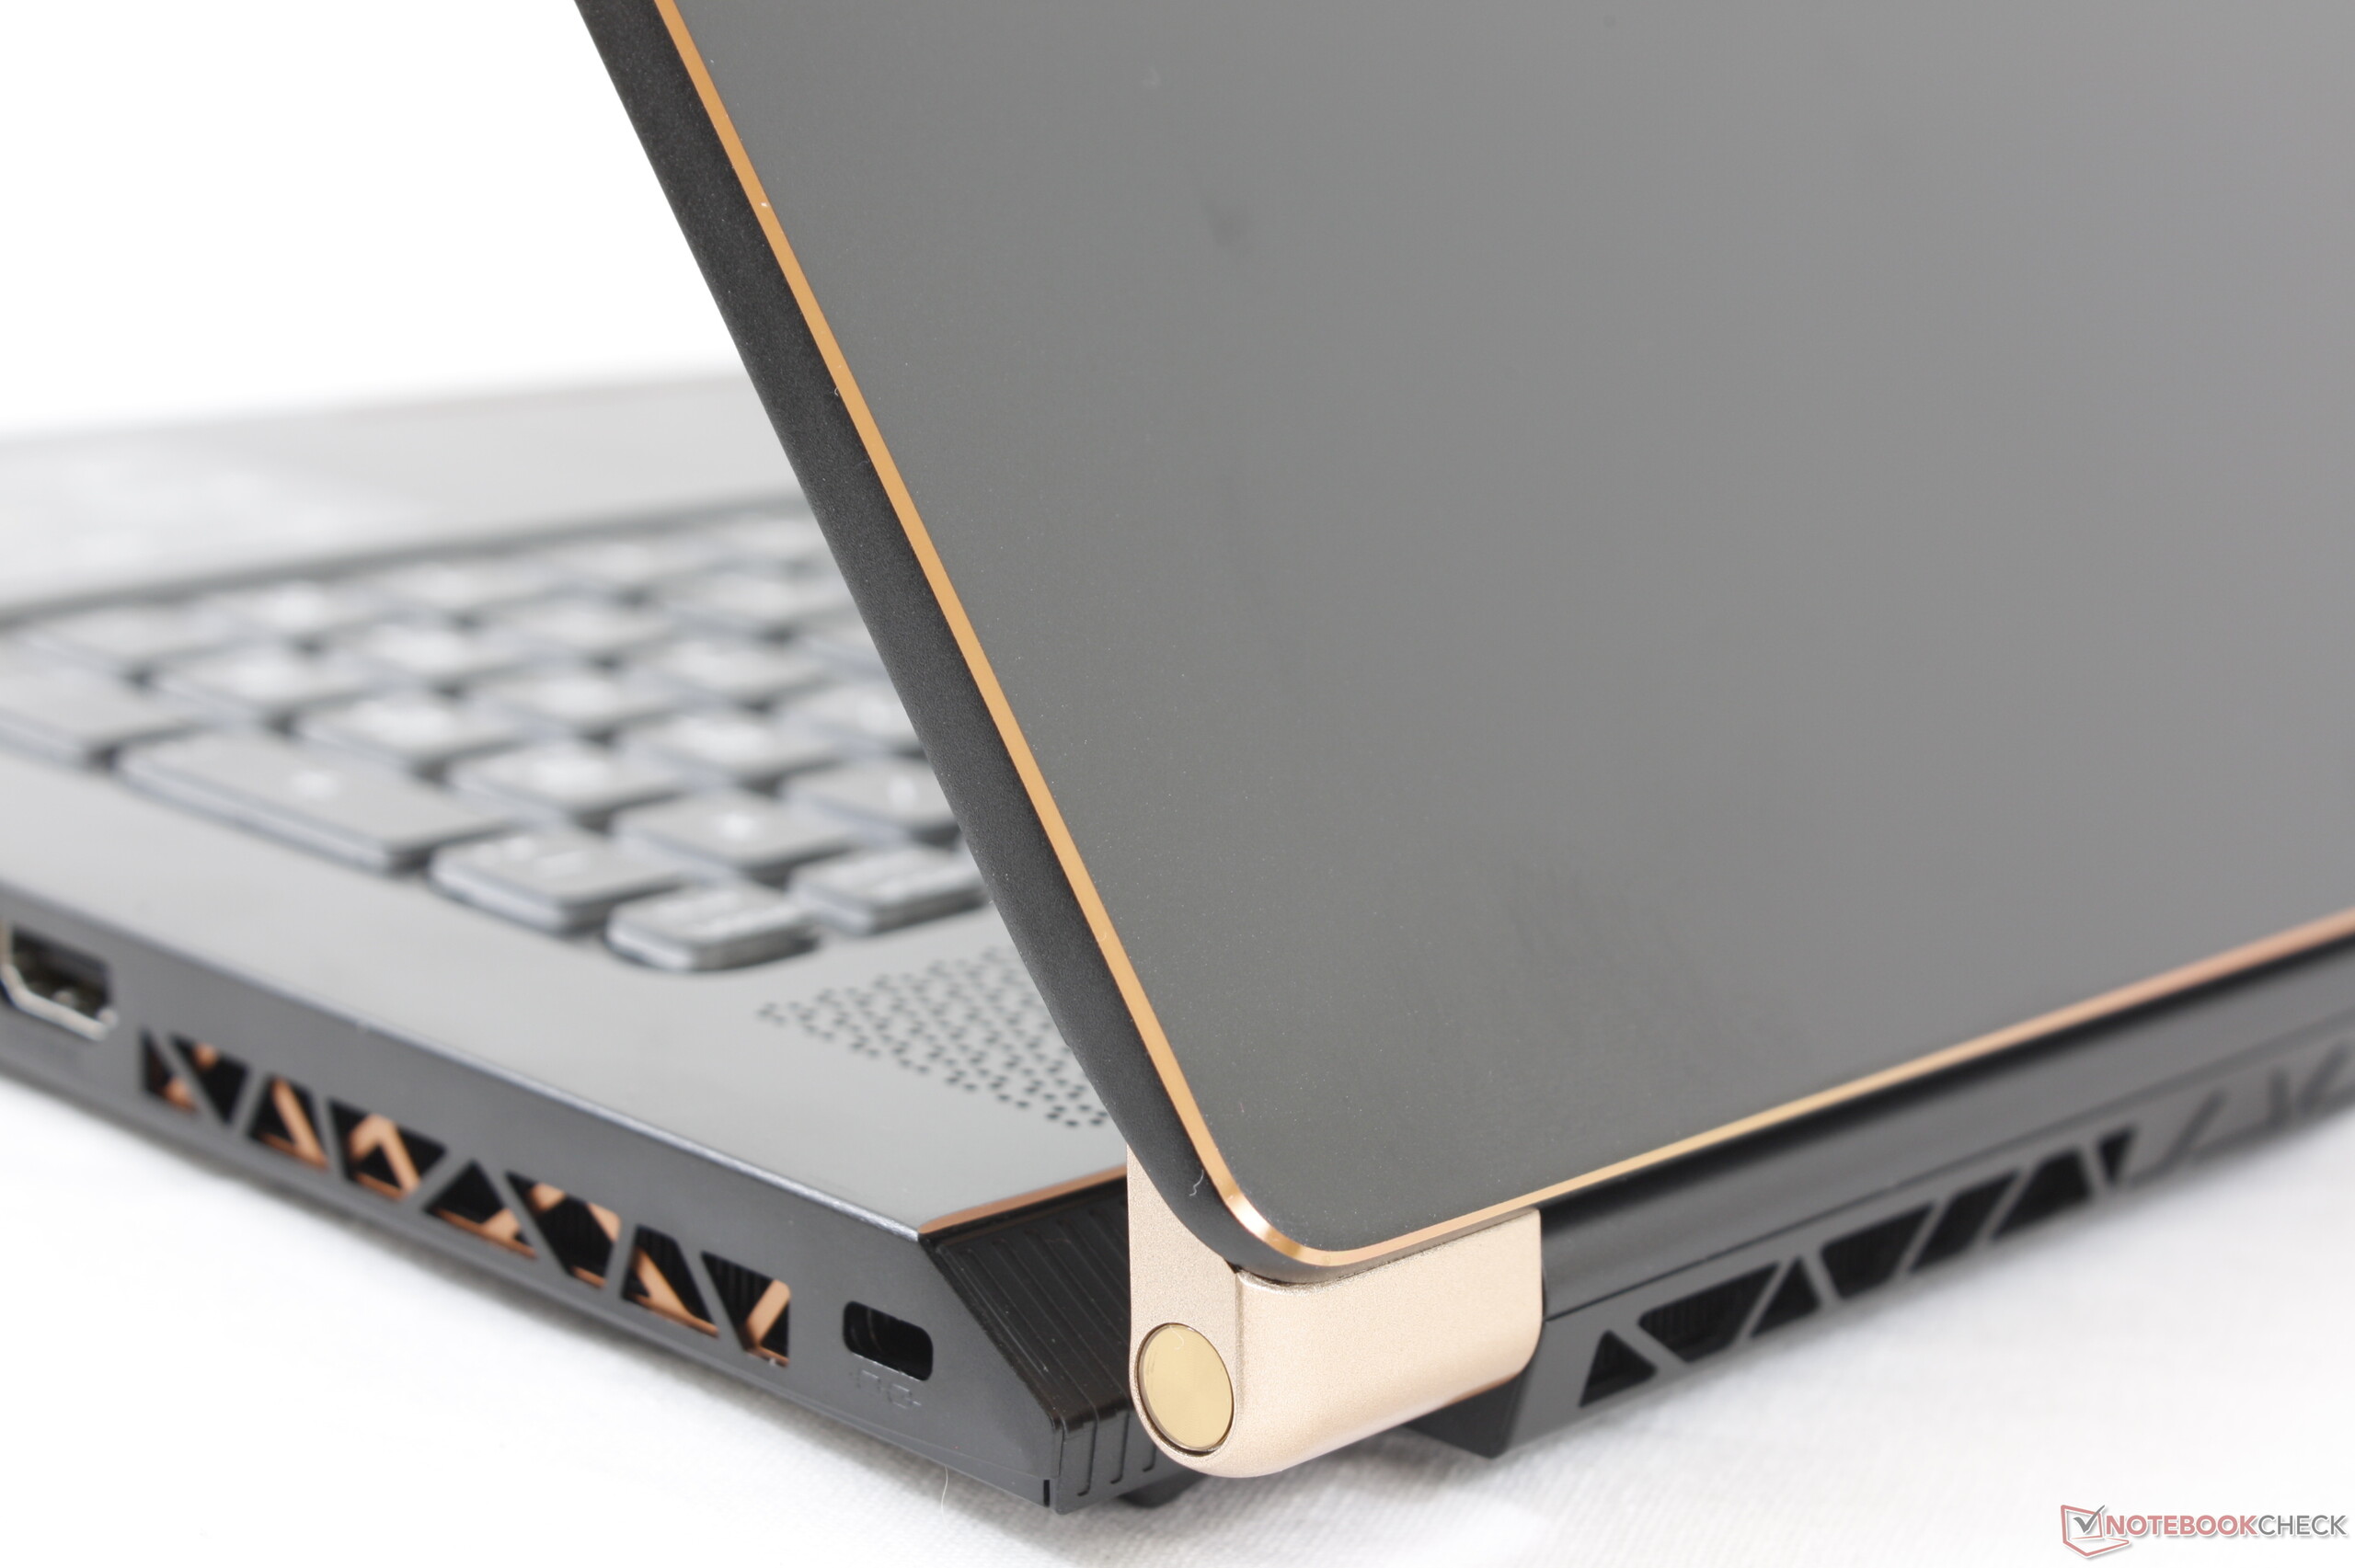
Mais ce point fort débouche sur les plus grands défauts de la machine. Son châssis ploie et craque plus que la plupart des autres PC portables de jeu ultrafins, dont le Razer Blade Pro ou l'Alienware m17. Il faudra sans doute une mallette robuste pour les nomades...
Quant aux nouveaux CPU et GPU, le Core i9 et la RTX 2070 Super Max-Q, ils ne permettent que des gains de performances limités par rapport au Core i7-10875H et à la RTX 2070 Max-Q. Le rapport performances / prix sera meilleur avec l'ancienne configuration, ou bien alors en fonçant vers la RTX 2080 Super Max-Q.
Les nomades seront satisfaits par le MSI GS75 ultraléger, surtout au vu des composants intégrés. Mais si vous travaillez ou jouez principalement à la maison ou au bureau, alors d'autres machines existent avec des châssis plus costauds.
L’intégralité de cette critique est disponible en anglais en suivant ce lien.
MSI GS75 10SF-609US
- 07/29/2020 v7 (old)
Allen Ngo
Price comparison
