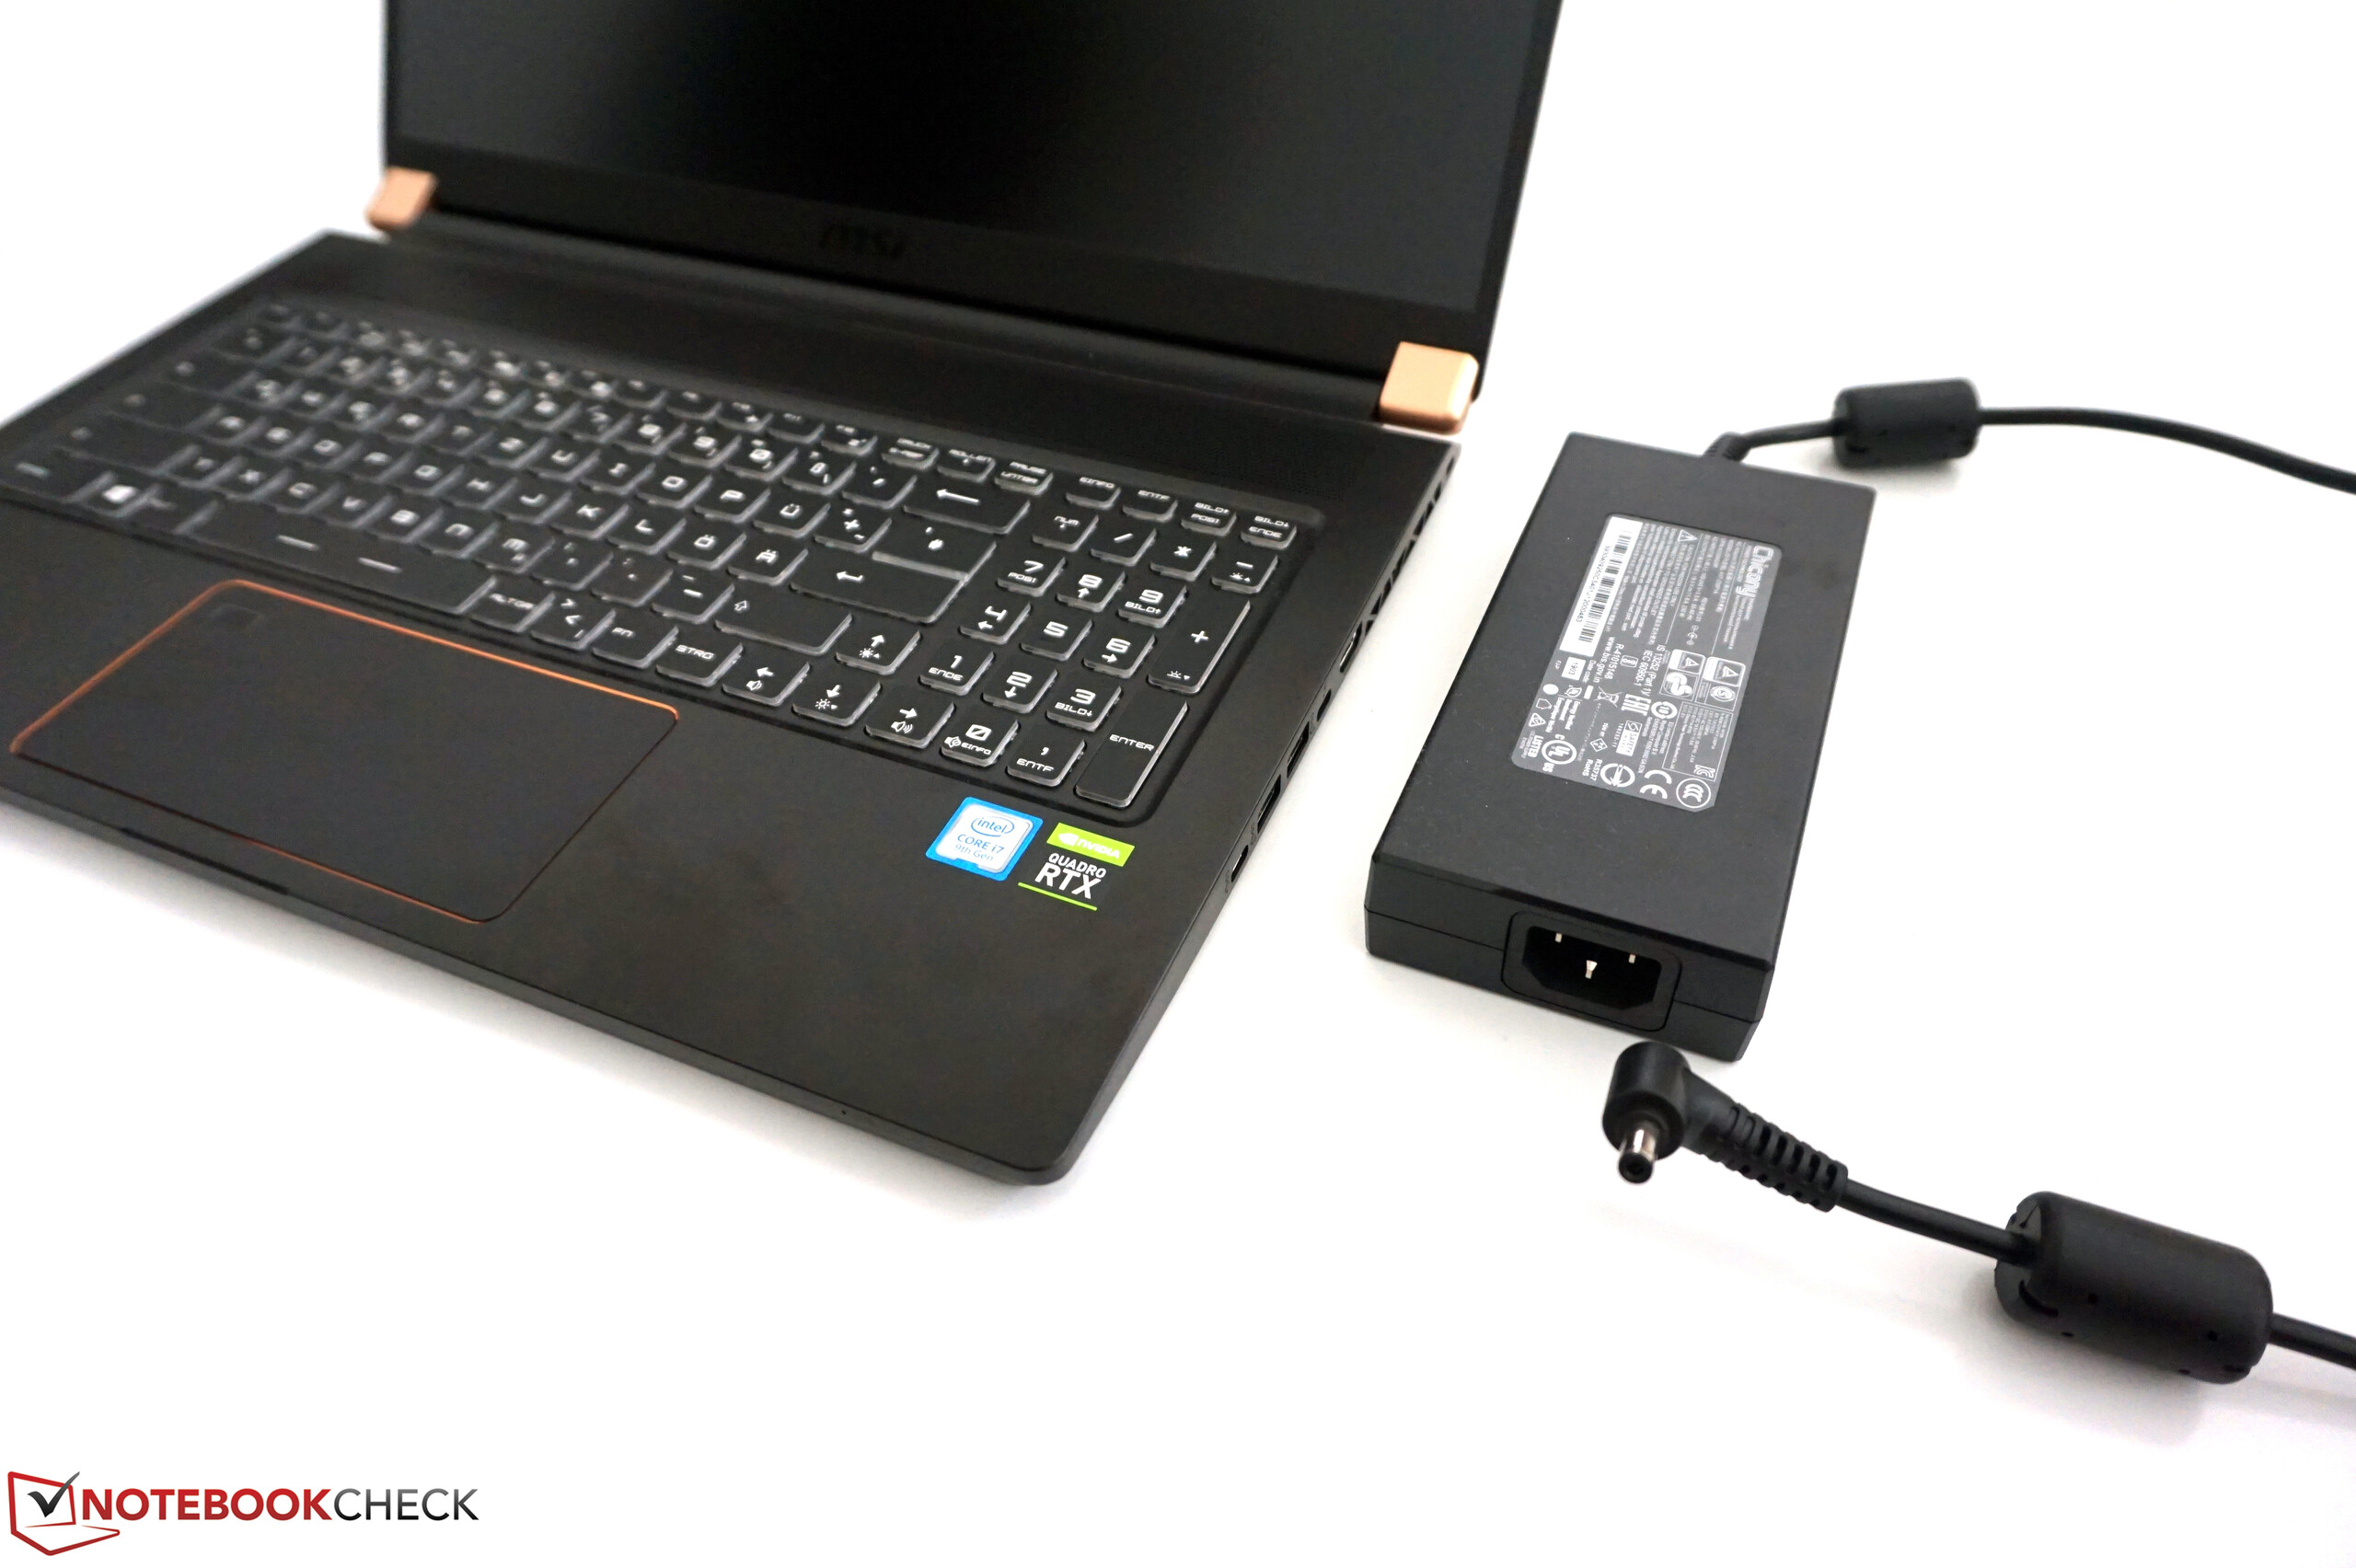
Courte critique du MSI WS75 (i7-9750H, Quadro RTX 4000, FHD) : station de travail de 17 pouces fine avec carte graphique puissante
| SD Card Reader | |
| average JPG Copy Test (av. of 3 runs) | |
| Dell Precision 7730 (Toshiba Exceria Pro SDXC 64 GB UHS-II) | |
| MSI WS75 9TL-636 (Toshiba Exceria Pro M501 64 GB UHS-II) | |
| HP ZBook 17 G5-2ZC48EA (Toshiba Exceria Pro SDXC 64 GB UHS-II) | |
| Lenovo ThinkPad P72-20MB000EGE (Toshiba Exceria Pro SDXC 64 GB UHS-II) | |
| Fujitsu Celsius H980 (Toshiba Exceria Pro SDXC 64 GB UHS-II) | |
| Moyenne de la classe Workstation (49.6 - 681, n=14, 2 dernières années) | |
| maximum AS SSD Seq Read Test (1GB) | |
| Moyenne de la classe Workstation (87.6 - 1455, n=14, 2 dernières années) | |
| Dell Precision 7730 (Toshiba Exceria Pro SDXC 64 GB UHS-II) | |
| MSI WS75 9TL-636 (Toshiba Exceria Pro M501 64 GB UHS-II) | |
| Lenovo ThinkPad P72-20MB000EGE (Toshiba Exceria Pro SDXC 64 GB UHS-II) | |
| HP ZBook 17 G5-2ZC48EA (Toshiba Exceria Pro SDXC 64 GB UHS-II) | |
| Fujitsu Celsius H980 (Toshiba Exceria Pro SDXC 64 GB UHS-II) | |
| Networking | |
| iperf3 transmit AX12 | |
| Dell Precision 7730 | |
| HP ZBook 17 G5-2ZC48EA | |
| Lenovo ThinkPad P72-20MB000EGE | |
| MSI WS75 9TL-636 | |
| iperf3 receive AX12 | |
| Lenovo ThinkPad P72-20MB000EGE | |
| HP ZBook 17 G5-2ZC48EA | |
| MSI WS75 9TL-636 | |
| Dell Precision 7730 | |
| |||||||||||||||||||||||||
Homogénéité de la luminosité: 86 %
Valeur mesurée au centre, sur batterie: 301 cd/m²
Contraste: 1200:1 (Valeurs des noirs: 0.25 cd/m²)
ΔE ColorChecker Calman: 3.9 | ∀{0.5-29.43 Ø4.71}
calibrated: 2.3
ΔE Greyscale Calman: 4.3 | ∀{0.09-98 Ø4.96}
91% sRGB (Argyll 1.6.3 3D)
59.2% AdobeRGB 1998 (Argyll 1.6.3 3D)
65.8% AdobeRGB 1998 (Argyll 3D)
91.1% sRGB (Argyll 3D)
64.5% Display P3 (Argyll 3D)
Gamma: 2.2
CCT: 7391 K
| MSI WS75 9TL-636 B173HAN04.2, , 1920x1080, 17.3" | Lenovo ThinkPad P72-20MB000EGE LP173WF4_SPF7, , 1920x1080, 17.3" | HP ZBook 17 G5-2ZC48EA AUO B173HW01 V0, , 1920x1080, 17.3" | Dell Precision 7730 B173HAN01.3, , 1920x1080, 17.3" | Fujitsu Celsius H980 LG Philips, LP173WF4-SPF5, , 1920x1080, 17.3" | |
|---|---|---|---|---|---|
| Display | -3% | 1% | 2% | -3% | |
| Display P3 Coverage (%) | 64.5 | 67.4 4% | 66.3 3% | 65 1% | 67.3 4% |
| sRGB Coverage (%) | 91.1 | 85 -7% | 89.9 -1% | 93.4 3% | 85 -7% |
| AdobeRGB 1998 Coverage (%) | 65.8 | 62.2 -5% | 66.3 1% | 62.2 -5% | |
| Response Times | -3% | -4% | -20% | 11% | |
| Response Time Grey 50% / Grey 80% * (ms) | 39.2 ? | 40.8 ? -4% | 42.4 ? -8% | 48.8 ? -24% | 38 ? 3% |
| Response Time Black / White * (ms) | 28.4 ? | 28.8 ? -1% | 28.4 ? -0% | 32.8 ? -15% | 23.2 ? 18% |
| PWM Frequency (Hz) | 120500 ? | ||||
| Screen | -8% | -6% | 17% | -24% | |
| Brightness middle (cd/m²) | 300 | 338 13% | 335 12% | 322 7% | 400 33% |
| Brightness (cd/m²) | 288 | 317 10% | 326 13% | 316 10% | 394 37% |
| Brightness Distribution (%) | 86 | 86 0% | 92 7% | 84 -2% | 92 7% |
| Black Level * (cd/m²) | 0.25 | 0.28 -12% | 0.22 12% | 0.24 4% | 0.51 -104% |
| Contrast (:1) | 1200 | 1207 1% | 1523 27% | 1342 12% | 784 -35% |
| Colorchecker dE 2000 * | 3.9 | 4.3 -10% | 4.7 -21% | 2.2 44% | 5.3 -36% |
| Colorchecker dE 2000 max. * | 6 | 10.2 -70% | 8.7 -45% | 4.6 23% | 9.3 -55% |
| Colorchecker dE 2000 calibrated * | 2.3 | 3.7 -61% | 2.7 -17% | 1.9 17% | 3.8 -65% |
| Greyscale dE 2000 * | 4.3 | 2.2 49% | 6.5 -51% | 1.6 63% | 5.5 -28% |
| Gamma | 2.2 100% | 2.17 101% | 2.23 99% | 2.19 100% | 2.17 101% |
| CCT | 7391 88% | 6621 98% | 6108 106% | 6621 98% | 6686 97% |
| Color Space (Percent of AdobeRGB 1998) (%) | 59.2 | 55.8 -6% | 58.7 -1% | 60.4 2% | 55.8 -6% |
| Color Space (Percent of sRGB) (%) | 91 | 84.7 -7% | 89.7 -1% | 93.3 3% | 84.9 -7% |
| Moyenne finale (programmes/paramètres) | -5% /
-7% | -3% /
-5% | -0% /
9% | -5% /
-15% |
* ... Moindre est la valeur, meilleures sont les performances
Temps de réponse de l'écran
| ↔ Temps de réponse noir à blanc | ||
|---|---|---|
| 28.4 ms ... hausse ↗ et chute ↘ combinées | ↗ 15.6 ms hausse | 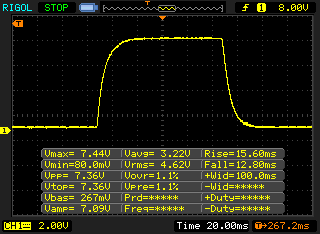 |
| ↘ 12.8 ms chute | ||
| L'écran souffre de latences relativement élevées, insuffisant pour le jeu. En comparaison, tous les appareils testés affichent entre 0.1 (minimum) et 240 (maximum) ms. » 75 % des appareils testés affichent de meilleures performances. Cela signifie que les latences relevées sont moins bonnes que la moyenne (19.8 ms) de tous les appareils testés. | ||
| ↔ Temps de réponse gris 50% à gris 80% | ||
| 39.2 ms ... hausse ↗ et chute ↘ combinées | ↗ 19.6 ms hausse | 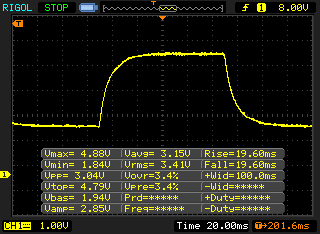 |
| ↘ 19.6 ms chute | ||
| L'écran souffre de latences très élevées, à éviter pour le jeu. En comparaison, tous les appareils testés affichent entre 0.165 (minimum) et 636 (maximum) ms. » 60 % des appareils testés affichent de meilleures performances. Cela signifie que les latences relevées sont moins bonnes que la moyenne (30.9 ms) de tous les appareils testés. | ||
Scintillement / MLI (Modulation de largeur d'impulsion)
| Scintillement / MLI (Modulation de largeur d'impulsion) non décelé | 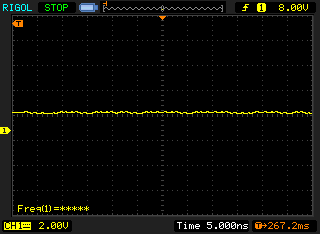 | ||
En comparaison, 52 % des appareils testés n'emploient pas MDI pour assombrir leur écran. Nous avons relevé une moyenne à 7741 (minimum : 5 - maximum : 343500) Hz dans le cas où une MDI était active. | |||

| Cinebench R15 | |
| CPU Single 64Bit | |
| Moyenne de la classe Workstation (191.4 - 328, n=23, 2 dernières années) | |
| MSI WS75 9TL-636 | |
| Lenovo ThinkPad P1-20MD002LUS | |
| Lenovo ThinkPad P72-20MB000EGE | |
| Moyenne Intel Core i7-9750H (170 - 194, n=82) | |
| Dell Precision 7730 | |
| HP ZBook 17 G5-2ZC48EA | |
| HP ZBook Studio G5-4QH10EA | |
| Fujitsu Celsius H980 | |
| CPU Multi 64Bit | |
| Moyenne de la classe Workstation (2489 - 5810, n=23, 2 dernières années) | |
| Dell Precision 7730 | |
| Lenovo ThinkPad P72-20MB000EGE (Undervolting) | |
| Lenovo ThinkPad P72-20MB000EGE (Default) | |
| HP ZBook 17 G5-2ZC48EA | |
| MSI WS75 9TL-636 | |
| Moyenne Intel Core i7-9750H (952 - 1306, n=85) | |
| HP ZBook Studio G5-4QH10EA | |
| Lenovo ThinkPad P1-20MD002LUS | |
| Fujitsu Celsius H980 | |
| PCMark 8 | |
| Home Score Accelerated v2 | |
| MSI WS75 9TL-636 | |
| Moyenne Intel Core i7-9750H, NVIDIA Quadro RTX 4000 (Laptop) (n=1) | |
| Dell Precision 7730 | |
| Lenovo ThinkPad P72-20MB000EGE | |
| Fujitsu Celsius H980 | |
| HP ZBook 17 G5-2ZC48EA | |
| Lenovo ThinkPad P1-20MD002LUS | |
| HP ZBook Studio G5-4QH10EA | |
| Work Score Accelerated v2 | |
| Lenovo ThinkPad P72-20MB000EGE | |
| Dell Precision 7730 | |
| MSI WS75 9TL-636 | |
| Moyenne Intel Core i7-9750H, NVIDIA Quadro RTX 4000 (Laptop) (n=1) | |
| HP ZBook 17 G5-2ZC48EA | |
| Fujitsu Celsius H980 | |
| HP ZBook Studio G5-4QH10EA | |
| Lenovo ThinkPad P1-20MD002LUS | |
| Creative Score Accelerated v2 | |
| MSI WS75 9TL-636 | |
| Moyenne Intel Core i7-9750H, NVIDIA Quadro RTX 4000 (Laptop) (n=1) | |
| HP ZBook 17 G5-2ZC48EA | |
| Lenovo ThinkPad P72-20MB000EGE | |
| Lenovo ThinkPad P1-20MD002LUS | |
| PCMark 8 Home Score Accelerated v2 | 4732 points | |
| PCMark 8 Creative Score Accelerated v2 | 7933 points | |
| PCMark 8 Work Score Accelerated v2 | 5323 points | |
| PCMark 10 Score | 5875 points | |
Aide | ||
| MSI WS75 9TL-636 Samsung SSD PM981 MZVLB1T0HALR | Lenovo ThinkPad P72-20MB000EGE Lenovo LENSE20256GMSP34MEAT2TA | Dell Precision 7730 Samsung SSD PM981 MZVLB512HAJQ | Lenovo ThinkPad P1-20MD002LUS Samsung SSD PM981 MZVLB2T0HMLB | HP ZBook Studio G5-4QH10EA Samsung SSD PM981 MZVLB512HAJQ | Fujitsu Celsius H980 Samsung SSD PM981 MZVLB512HAJQ | Moyenne Samsung SSD PM981 MZVLB1T0HALR | |
|---|---|---|---|---|---|---|---|
| CrystalDiskMark 5.2 / 6 | -7% | -2% | -9% | -15% | -14% | 11% | |
| Write 4K (MB/s) | 103.5 | 101 -2% | 103.2 0% | 108 4% | 102.7 -1% | 111.8 8% | 165.7 ? 60% |
| Read 4K (MB/s) | 41.88 | 45.37 8% | 41.39 -1% | 37.24 -11% | 38.32 -9% | 32.02 -24% | 44.6 ? 6% |
| Write Seq (MB/s) | 1931 | 1409 -27% | 1880 -3% | 1476 -24% | 1417 -27% | 1539 -20% | 1982 ? 3% |
| Read Seq (MB/s) | 1286 | 2129 66% | 2350 83% | 1367 6% | 1289 0% | 1252 -3% | 1764 ? 37% |
| Write 4K Q32T1 (MB/s) | 414.3 | 320.3 -23% | 282.3 -32% | 302.4 -27% | 278.9 -33% | 355.4 -14% | 395 ? -5% |
| Read 4K Q32T1 (MB/s) | 470.2 | 348.3 -26% | 314.3 -33% | 375 -20% | 348.8 -26% | 408.7 -13% | 434 ? -8% |
| Write Seq Q32T1 (MB/s) | 2393 | 1529 -36% | 1881 -21% | 2433 2% | 1895 -21% | 1913 -20% | 2351 ? -2% |
| Read Seq Q32T1 (MB/s) | 3425 | 2957 -14% | 3216 -6% | 3493 2% | 3352 -2% | 2530 -26% | 3234 ? -6% |
| Write 4K Q8T8 (MB/s) | 1484 | 1575 | 1772 | 1408 ? | |||
| Read 4K Q8T8 (MB/s) | 1536 | 1607 | 1022 | 1449 ? |

| LuxMark v2.0 64Bit | |
| Room GPUs-only | |
| MSI WS75 9TL-636 | |
| Dell Precision 7720 | |
| MSI WS63VR 7RL-023US | |
| HP ZBook 17 G4-Y3J82AV | |
| Dell Precision 7730 | |
| Fujitsu Celsius H980 | |
| Lenovo ThinkPad P72-20MB000EGE | |
| HP ZBook 17 G5-2ZC48EA | |
| Lenovo ThinkPad P1-20MD002LUS | |
| HP ZBook Studio G5-4QH10EA | |
| Sala GPUs-only | |
| MSI WS75 9TL-636 | |
| Fujitsu Celsius H980 | |
| MSI WS63VR 7RL-023US | |
| Dell Precision 7730 | |
| Dell Precision 7720 | |
| HP ZBook 17 G4-Y3J82AV | |
| Lenovo ThinkPad P72-20MB000EGE | |
| HP ZBook 17 G5-2ZC48EA | |
| Lenovo ThinkPad P1-20MD002LUS | |
| HP ZBook Studio G5-4QH10EA | |
| SiSoft Sandra 2016 | |
| Image Processing | |
| MSI WS75 9TL-636 | |
| Dell Precision 7730 | |
| Fujitsu Celsius H980 | |
| Lenovo ThinkPad P72-20MB000EGE | |
| Dell Precision 7720 | |
| HP ZBook 17 G4-Y3J82AV | |
| HP ZBook 17 G5-2ZC48EA | |
| HP ZBook Studio G5-4QH10EA | |
| GP Cryptography (Higher Security AES256+SHA2-512) | |
| MSI WS75 9TL-636 | |
| HP ZBook 17 G4-Y3J82AV | |
| Dell Precision 7720 | |
| Lenovo ThinkPad P72-20MB000EGE | |
| Fujitsu Celsius H980 | |
| Dell Precision 7730 | |
| HP ZBook 17 G5-2ZC48EA | |
| HP ZBook Studio G5-4QH10EA | |
| GP Financial Analysis (FP High/Double Precision) | |
| MSI WS75 9TL-636 | |
| Dell Precision 7720 | |
| HP ZBook 17 G4-Y3J82AV | |
| Dell Precision 7730 | |
| Fujitsu Celsius H980 | |
| Lenovo ThinkPad P72-20MB000EGE | |
| HP ZBook 17 G5-2ZC48EA | |
| HP ZBook Studio G5-4QH10EA | |
| Unigine Heaven 4.0 | |
| Extreme Preset OpenGL | |
| Moyenne de la classe Workstation (87 - 185.3, n=3, 2 dernières années) | |
| MSI WS75 9TL-636 | |
| Moyenne NVIDIA Quadro RTX 4000 (Laptop) (n=1) | |
| Dell Precision 7720 | |
| HP ZBook 17 G4-Y3J82AV | |
| Fujitsu Celsius H980 | |
| Lenovo ThinkPad P72-20MB000EGE | |
| HP ZBook 17 G5-2ZC48EA | |
| HP ZBook Studio G5-4QH10EA | |
| Extreme Preset DX11 | |
| Moyenne de la classe Workstation (92.7 - 222, n=3, 2 dernières années) | |
| MSI WS75 9TL-636 | |
| Moyenne NVIDIA Quadro RTX 4000 (Laptop) (n=1) | |
| Dell Precision 7720 | |
| HP ZBook 17 G4-Y3J82AV | |
| Fujitsu Celsius H980 | |
| HP ZBook 17 G5-2ZC48EA | |
| Lenovo ThinkPad P72-20MB000EGE | |
| Lenovo ThinkPad P1-20MD002LUS | |
| HP ZBook Studio G5-4QH10EA | |
| Unigine Valley 1.0 | |
| 1920x1080 Extreme HD DirectX AA:x8 | |
| MSI WS75 9TL-636 | |
| Moyenne NVIDIA Quadro RTX 4000 (Laptop) (n=1) | |
| HP ZBook 17 G4-Y3J82AV | |
| Dell Precision 7720 | |
| Lenovo ThinkPad P72-20MB000EGE | |
| Fujitsu Celsius H980 | |
| HP ZBook 17 G5-2ZC48EA | |
| HP ZBook Studio G5-4QH10EA | |
| 1920x1080 Extreme HD Preset OpenGL AA:x8 | |
| MSI WS75 9TL-636 | |
| Moyenne NVIDIA Quadro RTX 4000 (Laptop) (n=1) | |
| HP ZBook 17 G4-Y3J82AV | |
| Dell Precision 7720 | |
| Fujitsu Celsius H980 | |
| HP ZBook 17 G5-2ZC48EA | |
| Lenovo ThinkPad P72-20MB000EGE | |
| HP ZBook Studio G5-4QH10EA | |
| 3DMark Vantage P Result | 56250 points | |
| 3DMark 11 Performance | 19880 points | |
| 3DMark Cloud Gate Standard Score | 38830 points | |
| 3DMark Fire Strike Score | 15912 points | |
| 3DMark Time Spy Score | 6823 points | |
Aide | ||
| The Witcher 3 | |
| 1920x1080 High Graphics & Postprocessing (Nvidia HairWorks Off) | |
| MSI GT76 Titan DT 9SG | |
| Moyenne de la classe Workstation (n=12 dernières années) | |
| Moyenne NVIDIA Quadro RTX 4000 (Laptop) (132 - 153, n=2) | |
| MSI WS75 9TL-636 | |
| Asus Zephyrus S GX502GW | |
| Gigabyte Aero 15 Classic-XA | |
| Medion Erazer X15805 | |
| Dell G5 15 5590 | |
| 1920x1080 Ultra Graphics & Postprocessing (HBAO+) | |
| MSI GT76 Titan DT 9SG | |
| Moyenne de la classe Workstation (n=12 dernières années) | |
| Moyenne NVIDIA Quadro RTX 4000 (Laptop) (70 - 79, n=2) | |
| Asus Zephyrus S GX502GW | |
| MSI WS75 9TL-636 | |
| Gigabyte Aero 15 Classic-XA | |
| Medion Erazer X15805 | |
| Dell G5 15 5590 | |
| Anno 1800 | |
| 1920x1080 Ultra Graphics Quality (DX11) | |
| MSI GT76 Titan DT 9SG | |
| MSI WS75 9TL-636 | |
| Moyenne NVIDIA Quadro RTX 4000 (Laptop) (n=1) | |
| Asus Zephyrus S GX502GW | |
| Medion Erazer X15805 | |
| Dell G5 15 5590 | |
| Gigabyte Aero 15 Classic-XA | |
| 1920x1080 High Graphics Quality (DX11) | |
| MSI GT76 Titan DT 9SG | |
| MSI WS75 9TL-636 | |
| Moyenne NVIDIA Quadro RTX 4000 (Laptop) (n=1) | |
| Asus Zephyrus S GX502GW | |
| Medion Erazer X15805 | |
| Gigabyte Aero 15 Classic-XA | |
| Dell G5 15 5590 | |
| Bas | Moyen | Élevé | Ultra | QHD | 4K | |
|---|---|---|---|---|---|---|
| The Witcher 3 (2015) | 303 | 215 | 132 | 70 | 46 | |
| Dota 2 Reborn (2015) | 152 | 140 | 133 | 129 | 100 | |
| Rise of the Tomb Raider (2016) | 199.6 | 127.8 | 104.9 | 45.1 | ||
| For Honor (2017) | 289 | 148 | 141 | 109 | 45.7 | |
| Ghost Recon Wildlands (2017) | 139.9 | 98 | 90.8 | 52.9 | 35 | |
| X-Plane 11.11 (2018) | 119 | 107 | 88 | |||
| Far Cry 5 (2018) | 129 | 106 | 100 | 96 | 69 | 36 |
| F1 2018 (2018) | 241 | 180 | 142 | 95 | 76 | 48 |
| Shadow of the Tomb Raider (2018) | 138.6 | 105.2 | 81.6 | 85 | 57.1 | 29.7 |
| Assassin´s Creed Odyssey (2018) | 99 | 87 | 75 | 54 | 41 | 28 |
| Hitman 2 (2018) | 95.4 | 93.6 | 85.8 | 81.1 | 72.9 | 39.4 |
| Battlefield V (2018) | 116.7 | 100.6 | 86.6 | 81 | 65.5 | 41.8 |
| Darksiders III (2018) | 143.8 | 119.2 | 105.2 | 69.1 | 34.2 | |
| Just Cause 4 (2018) | 150 | 125 | 93 | 86 | 60 | 33 |
| Far Cry New Dawn (2019) | 124 | 102 | 99 | 88 | 72 | 39 |
| Dirt Rally 2.0 (2019) | 267 | 180.7 | 151 | 85.6 | 63.3 | |
| The Division 2 (2019) | 180 | 122 | 96 | 70 | 47 | 25 |
| Anno 1800 (2019) | 98 | 77.5 | 42.6 | 37.7 | 22.4 |
Degré de la nuisance sonore
| Au repos |
| 29.4 / 30.1 / 30.9 dB(A) |
| Fortement sollicité |
| 40.7 / 42.7 dB(A) |
 | ||
30 dB silencieux 40 dB(A) audible 50 dB(A) bruyant |
||
min: | ||
| MSI WS75 9TL-636 Quadro RTX 4000 (Laptop), i7-9750H, Samsung SSD PM981 MZVLB1T0HALR | Lenovo ThinkPad P72-20MB000EGE Quadro P3200, i7-8850H, Lenovo LENSE20256GMSP34MEAT2TA | HP ZBook 17 G5-2ZC48EA Quadro P3200, i7-8850H, Toshiba XG5 KXG50ZNV256G | Dell Precision 7730 Quadro P3200, i7-8850H, Samsung SSD PM981 MZVLB512HAJQ | Lenovo ThinkPad P1-20MD002LUS Quadro P2000 Max-Q, E-2176M, Samsung SSD PM981 MZVLB2T0HMLB | HP ZBook Studio G5-4QH10EA Quadro P1000, i7-8750H, Samsung SSD PM981 MZVLB512HAJQ | Fujitsu Celsius H980 Quadro P3200, i7-8750H, Samsung SSD PM981 MZVLB512HAJQ | |
|---|---|---|---|---|---|---|---|
| Noise | 10% | 3% | 5% | 4% | 5% | -3% | |
| arrêt / environnement * (dB) | 29.4 | 28.6 3% | 28.7 2% | 29.7 -1% | 28.3 4% | 28.6 3% | 29.6 -1% |
| Idle Minimum * (dB) | 29.4 | 28.6 3% | 28.7 2% | 29.7 -1% | 28.4 3% | 28.6 3% | 29.6 -1% |
| Idle Average * (dB) | 30.1 | 28.6 5% | 28.7 5% | 29.7 1% | 28.4 6% | 28.6 5% | 32.5 -8% |
| Idle Maximum * (dB) | 30.9 | 28.6 7% | 30.9 -0% | 29.7 4% | 29.2 6% | 30 3% | 32.5 -5% |
| Load Average * (dB) | 40.7 | 31.9 22% | 37.3 8% | 31.4 23% | 41.8 -3% | 38.1 6% | 34.9 14% |
| Witcher 3 ultra * (dB) | 41.9 | 35.7 15% | 41.1 2% | 37.9 10% | 39.1 7% | 35 16% | |
| Load Maximum * (dB) | 42.7 | 37.7 12% | 41.4 3% | 44.2 -4% | 41.8 2% | 42.5 -0% | 49.1 -15% |
* ... Moindre est la valeur, meilleures sont les performances
(-) La température maximale du côté supérieur est de 47.4 °C / 117 F, par rapport à la moyenne de 38.2 °C / 101 F, allant de 22.2 à 69.8 °C pour la classe Workstation.
(-) Le fond chauffe jusqu'à un maximum de 55.6 °C / 132 F, contre une moyenne de 41.1 °C / 106 F
(+) En utilisation inactive, la température moyenne du côté supérieur est de 22.6 °C / 73 F, par rapport à la moyenne du dispositif de 32 °C / 90 F.
(±) En jouant à The Witcher 3, la température moyenne du côté supérieur est de 36.4 °C / 98 F, alors que la moyenne de l'appareil est de 32 °C / 90 F.
(+) Les repose-poignets et le pavé tactile sont plus froids que la température de la peau avec un maximum de 31.9 °C / 89.4 F et sont donc froids au toucher.
(-) La température moyenne de la zone de l'appui-paume de dispositifs similaires était de 27.8 °C / 82 F (-4.1 °C / #-7.4 F).
MSI WS75 9TL-636 analyse audio
(±) | le niveau sonore du haut-parleur est moyen mais bon (75.4# dB)
Basses 100 - 315 Hz
(-) | presque aucune basse - en moyenne 25.9% plus bas que la médiane
(±) | la linéarité des basses est moyenne (7.8% delta à la fréquence précédente)
Médiums 400 - 2000 Hz
(±) | médiane supérieure - en moyenne 5.2% supérieure à la médiane
(±) | la linéarité des médiums est moyenne (8.1% delta à la fréquence précédente)
Aiguës 2 - 16 kHz
(+) | des sommets équilibrés - à seulement 3.3% de la médiane
(±) | la linéarité des aigus est moyenne (9.3% delta à la fréquence précédente)
Globalement 100 - 16 000 Hz
(±) | la linéarité du son global est moyenne (27.5% de différence avec la médiane)
Par rapport à la même classe
» 94% de tous les appareils testés de cette catégorie étaient meilleurs, 2% similaires, 4% pires
» Le meilleur avait un delta de 7%, la moyenne était de 17%, le pire était de 35%.
Par rapport à tous les appareils testés
» 84% de tous les appareils testés étaient meilleurs, 3% similaires, 13% pires
» Le meilleur avait un delta de 4%, la moyenne était de 23%, le pire était de 134%.
Lenovo ThinkPad P72-20MB000EGE analyse audio
(-) | haut-parleurs pas très forts (69.6 dB)
Basses 100 - 315 Hz
(-) | presque aucune basse - en moyenne 17.4% plus bas que la médiane
(±) | la linéarité des basses est moyenne (13.5% delta à la fréquence précédente)
Médiums 400 - 2000 Hz
(±) | médiane supérieure - en moyenne 7.2% supérieure à la médiane
(±) | la linéarité des médiums est moyenne (8.7% delta à la fréquence précédente)
Aiguës 2 - 16 kHz
(+) | des sommets équilibrés - à seulement 4.4% de la médiane
(±) | la linéarité des aigus est moyenne (12.7% delta à la fréquence précédente)
Globalement 100 - 16 000 Hz
(-) | le son global n'est pas linéaire (30.7% de différence à la médiane)
Par rapport à la même classe
» 97% de tous les appareils testés de cette catégorie étaient meilleurs, 1% similaires, 1% pires
» Le meilleur avait un delta de 7%, la moyenne était de 17%, le pire était de 35%.
Par rapport à tous les appareils testés
» 89% de tous les appareils testés étaient meilleurs, 3% similaires, 8% pires
» Le meilleur avait un delta de 4%, la moyenne était de 23%, le pire était de 134%.
HP ZBook 17 G5-2ZC48EA analyse audio
(±) | le niveau sonore du haut-parleur est moyen mais bon (75.8# dB)
Basses 100 - 315 Hz
(±) | basse réduite - en moyenne 9.3% inférieure à la médiane
(±) | la linéarité des basses est moyenne (8.5% delta à la fréquence précédente)
Médiums 400 - 2000 Hz
(+) | médiane équilibrée - seulement 3.1% de la médiane
(+) | les médiums sont linéaires (3.9% delta à la fréquence précédente)
Aiguës 2 - 16 kHz
(+) | des sommets équilibrés - à seulement 2.6% de la médiane
(+) | les aigus sont linéaires (3.4% delta à la fréquence précédente)
Globalement 100 - 16 000 Hz
(+) | le son global est linéaire (14.3% différence à la médiane)
Par rapport à la même classe
» 30% de tous les appareils testés de cette catégorie étaient meilleurs, 4% similaires, 67% pires
» Le meilleur avait un delta de 7%, la moyenne était de 17%, le pire était de 35%.
Par rapport à tous les appareils testés
» 18% de tous les appareils testés étaient meilleurs, 4% similaires, 78% pires
» Le meilleur avait un delta de 4%, la moyenne était de 23%, le pire était de 134%.
Dell Precision 7730 analyse audio
(±) | le niveau sonore du haut-parleur est moyen mais bon (81.1# dB)
Basses 100 - 315 Hz
(-) | presque aucune basse - en moyenne 16.7% plus bas que la médiane
(±) | la linéarité des basses est moyenne (11.6% delta à la fréquence précédente)
Médiums 400 - 2000 Hz
(±) | médiane réduite - en moyenne 5.4% inférieure à la médiane
(+) | les médiums sont linéaires (5.4% delta à la fréquence précédente)
Aiguës 2 - 16 kHz
(+) | des sommets équilibrés - à seulement 4% de la médiane
(+) | les aigus sont linéaires (5.8% delta à la fréquence précédente)
Globalement 100 - 16 000 Hz
(±) | la linéarité du son global est moyenne (17% de différence avec la médiane)
Par rapport à la même classe
» 49% de tous les appareils testés de cette catégorie étaient meilleurs, 10% similaires, 41% pires
» Le meilleur avait un delta de 7%, la moyenne était de 17%, le pire était de 35%.
Par rapport à tous les appareils testés
» 31% de tous les appareils testés étaient meilleurs, 8% similaires, 61% pires
» Le meilleur avait un delta de 4%, la moyenne était de 23%, le pire était de 134%.
| Éteint/en veille | |
| Au repos | |
| Fortement sollicité |
|
Légende:
min: | |
| MSI WS75 9TL-636 i7-9750H, Quadro RTX 4000 (Laptop), Samsung SSD PM981 MZVLB1T0HALR, IPS, 1920x1080, 17.3" | Lenovo ThinkPad P72-20MB000EGE i7-8850H, Quadro P3200, Lenovo LENSE20256GMSP34MEAT2TA, IPS, 1920x1080, 17.3" | HP ZBook 17 G5-2ZC48EA i7-8850H, Quadro P3200, Toshiba XG5 KXG50ZNV256G, , 1920x1080, 17.3" | Dell Precision 7730 i7-8850H, Quadro P3200, Samsung SSD PM981 MZVLB512HAJQ, IPS LED, 1920x1080, 17.3" | Lenovo ThinkPad P1-20MD002LUS E-2176M, Quadro P2000 Max-Q, Samsung SSD PM981 MZVLB2T0HMLB, IPS, 3840x2160, 15.6" | HP ZBook Studio G5-4QH10EA i7-8750H, Quadro P1000, Samsung SSD PM981 MZVLB512HAJQ, IPS LED, 3840x2160, 15.6" | Fujitsu Celsius H980 i7-8750H, Quadro P3200, Samsung SSD PM981 MZVLB512HAJQ, IPS, 1920x1080, 17.3" | Moyenne NVIDIA Quadro RTX 4000 (Laptop) | Moyenne de la classe Workstation | |
|---|---|---|---|---|---|---|---|---|---|
| Power Consumption | 34% | 20% | 11% | 36% | 41% | -0% | -16% | 20% | |
| Idle Minimum * (Watt) | 16.4 | 4.6 72% | 9.3 43% | 10.1 38% | 7.1 57% | 6.8 59% | 14.8 10% | 18.7 ? -14% | 9.11 ? 44% |
| Idle Average * (Watt) | 21.6 | 12.2 44% | 14.4 33% | 18 17% | 14.4 33% | 11.3 48% | 20.4 6% | 26 ? -20% | 13.8 ? 36% |
| Idle Maximum * (Watt) | 22.9 | 15.4 33% | 15.8 31% | 19.7 14% | 14.6 36% | 14.3 38% | 21.5 6% | 29.3 ? -28% | 17.9 ? 22% |
| Load Average * (Watt) | 88 | 79.6 10% | 89.2 -1% | 89.6 -2% | 93.9 -7% | 78 11% | 98.4 -12% | 99 ? -13% | 96 ? -9% |
| Witcher 3 ultra * (Watt) | 137 | 86 37% | 123 10% | 134 2% | 77.9 43% | 64 53% | |||
| Load Maximum * (Watt) | 193 | 176 9% | 189 2% | 204 -6% | 88.3 54% | 126 35% | 213.5 -11% | 204 ? -6% | 180.3 ? 7% |
* ... Moindre est la valeur, meilleures sont les performances
| MSI WS75 9TL-636 i7-9750H, Quadro RTX 4000 (Laptop), 82 Wh | Lenovo ThinkPad P72-20MB000EGE i7-8850H, Quadro P3200, 99 Wh | HP ZBook 17 G5-2ZC48EA i7-8850H, Quadro P3200, Wh | Dell Precision 7730 i7-8850H, Quadro P3200, 92 Wh | Lenovo ThinkPad P1-20MD002LUS E-2176M, Quadro P2000 Max-Q, 80 Wh | HP ZBook Studio G5-4QH10EA i7-8750H, Quadro P1000, 97 Wh | Fujitsu Celsius H980 i7-8750H, Quadro P3200, 96 Wh | Moyenne de la classe Workstation | |
|---|---|---|---|---|---|---|---|---|
| Autonomie de la batterie | 63% | 54% | -6% | -20% | 45% | 6% | 45% | |
| Reader / Idle (h) | 12.6 | 28.3 125% | 21.9 74% | 17.3 37% | 13.5 7% | 26.1 ? 107% | ||
| H.264 (h) | 8.2 | 12.3 50% | 9.2 12% | 5.8 -29% | 9.1 11% | 5.9 -28% | 10.1 ? 23% | |
| WiFi v1.3 (h) | 6.6 | 11.2 70% | 5.6 -15% | 5.3 -20% | 9.7 47% | 8.3 26% | 8.55 ? 30% | |
| Load (h) | 1.2 | 1.3 8% | 2.1 75% | 1.5 25% | 2.2 83% | 1.4 17% | 1.441 ? 20% |
Points positifs
Points négatifs
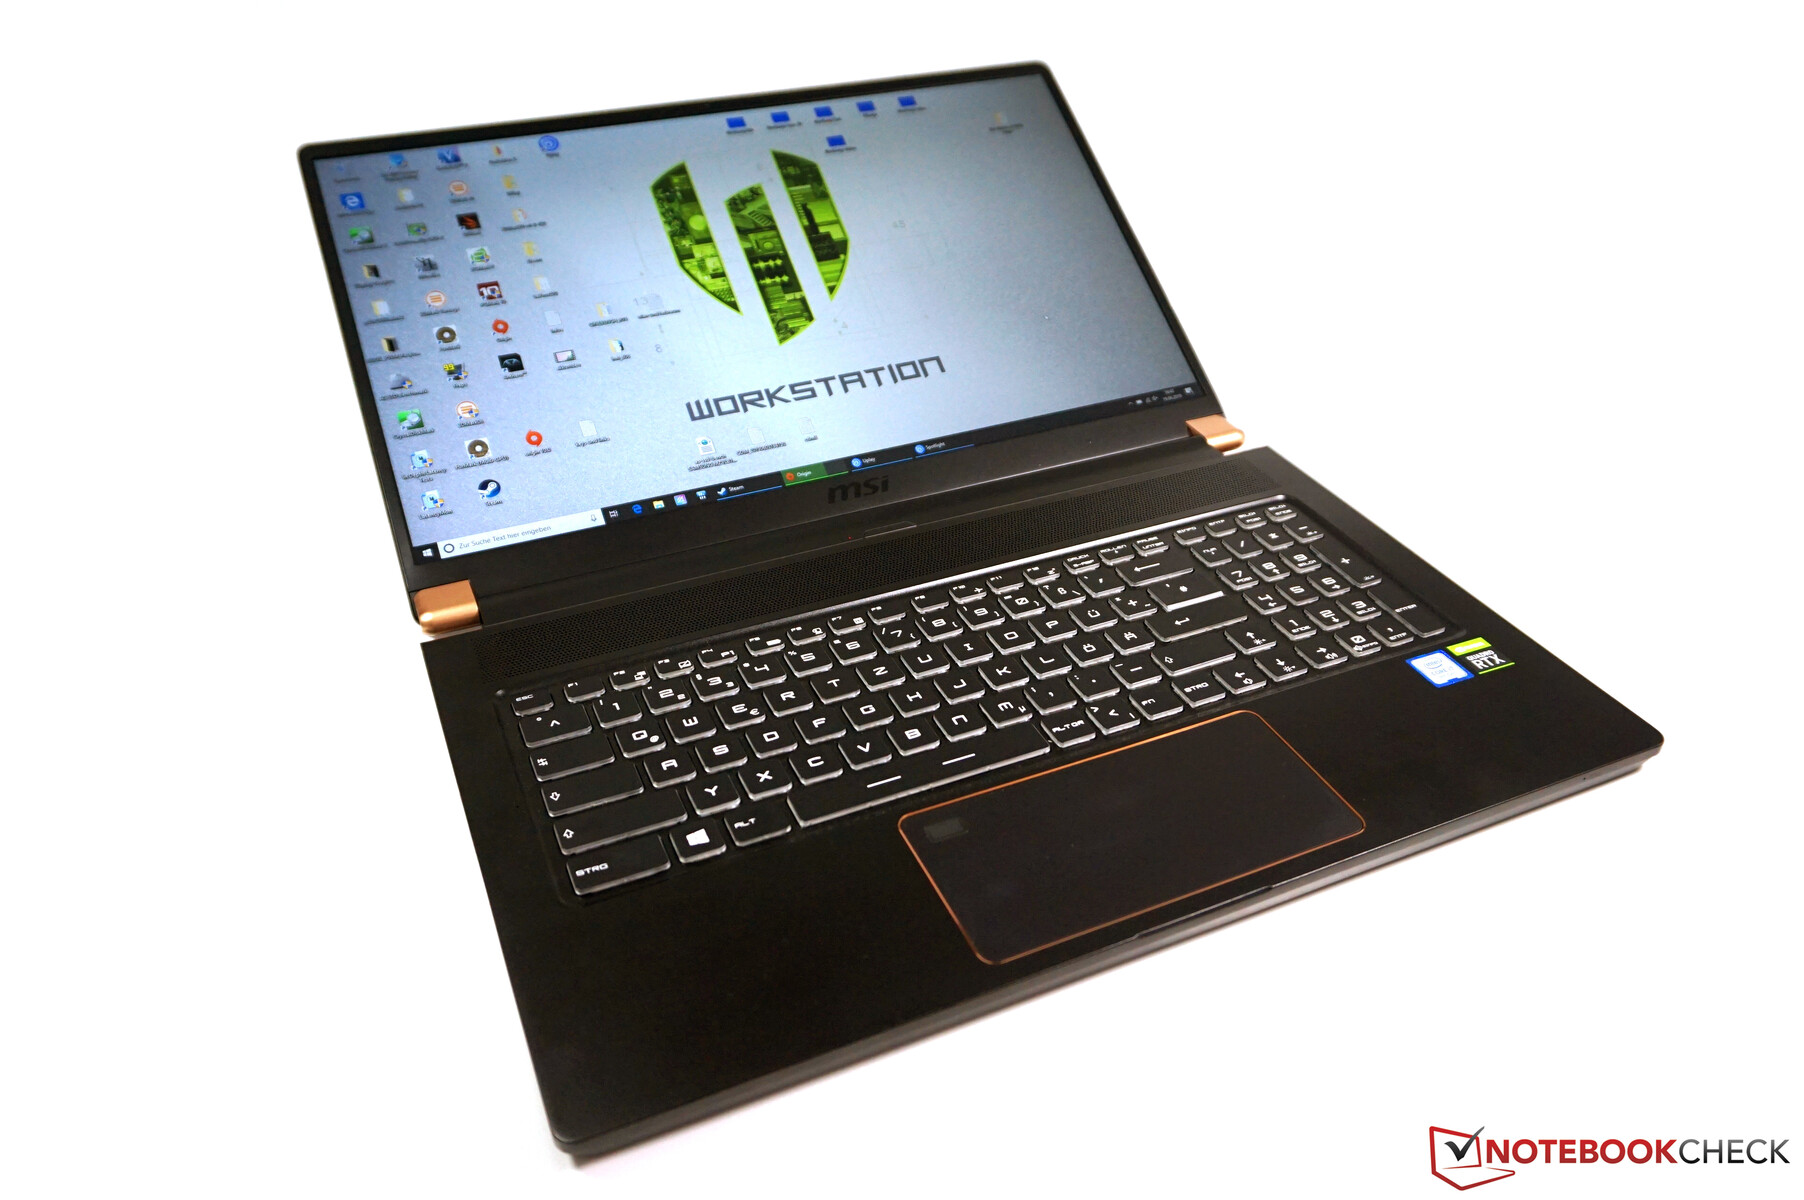
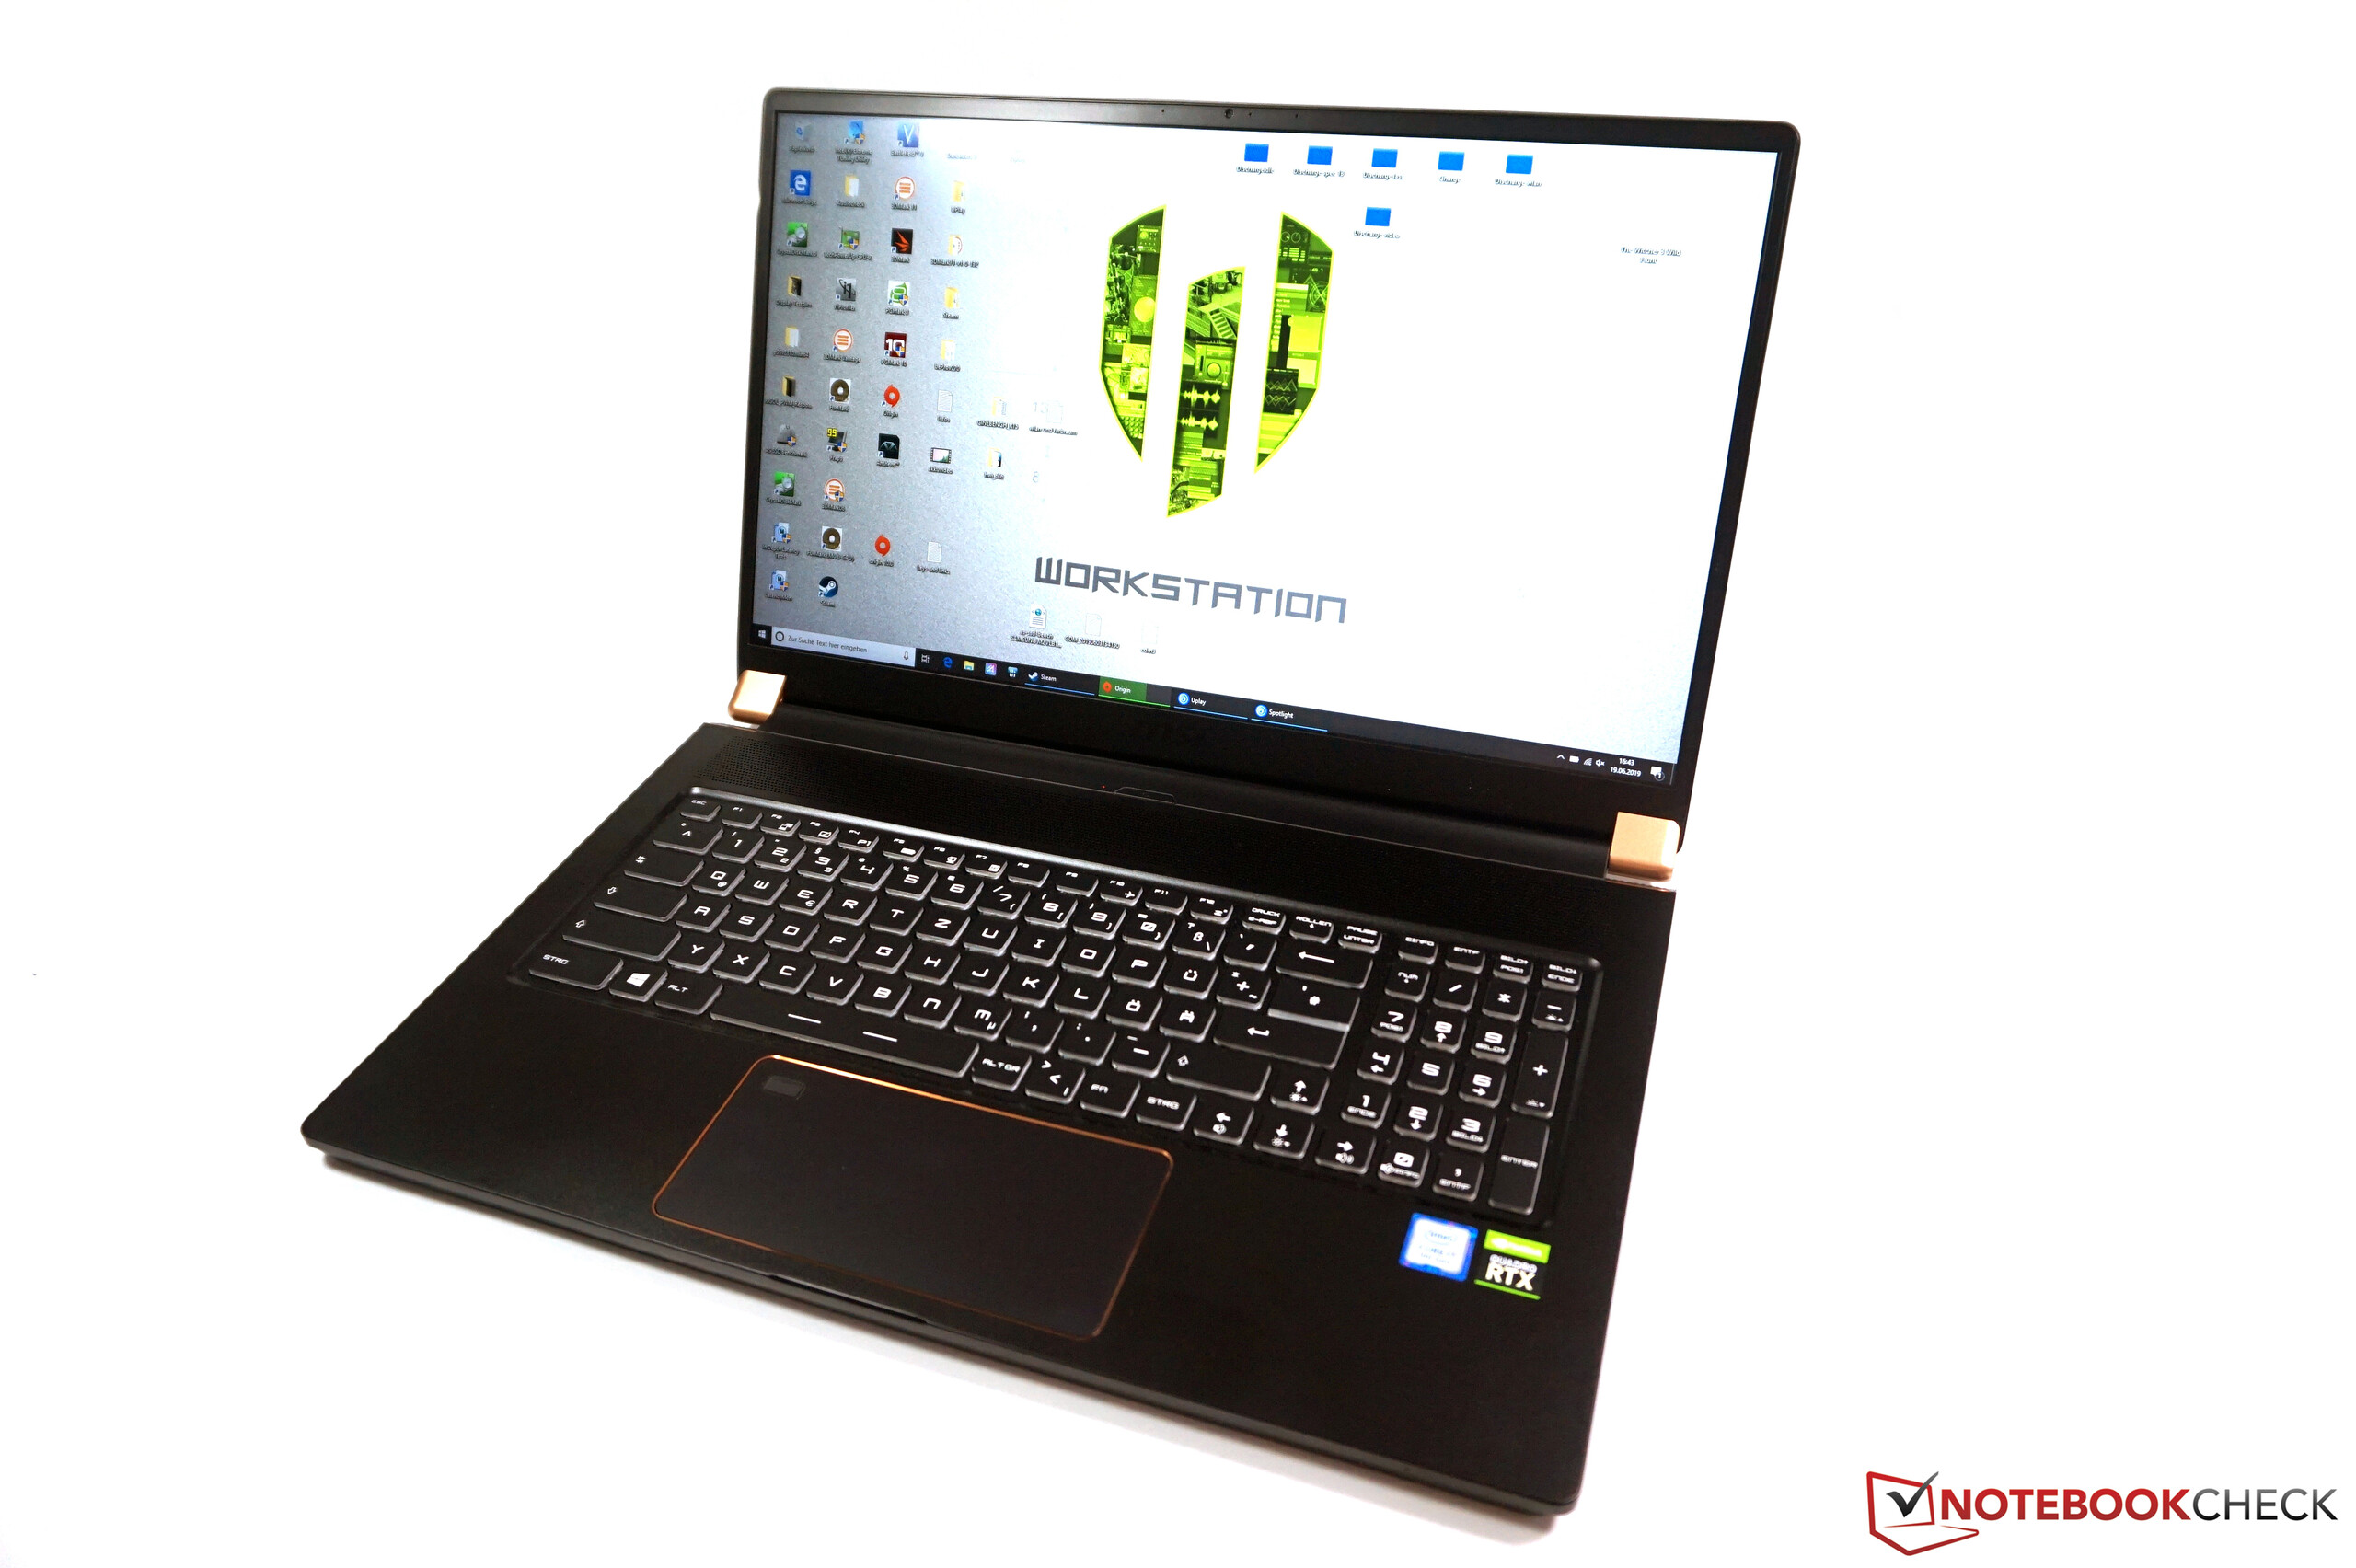
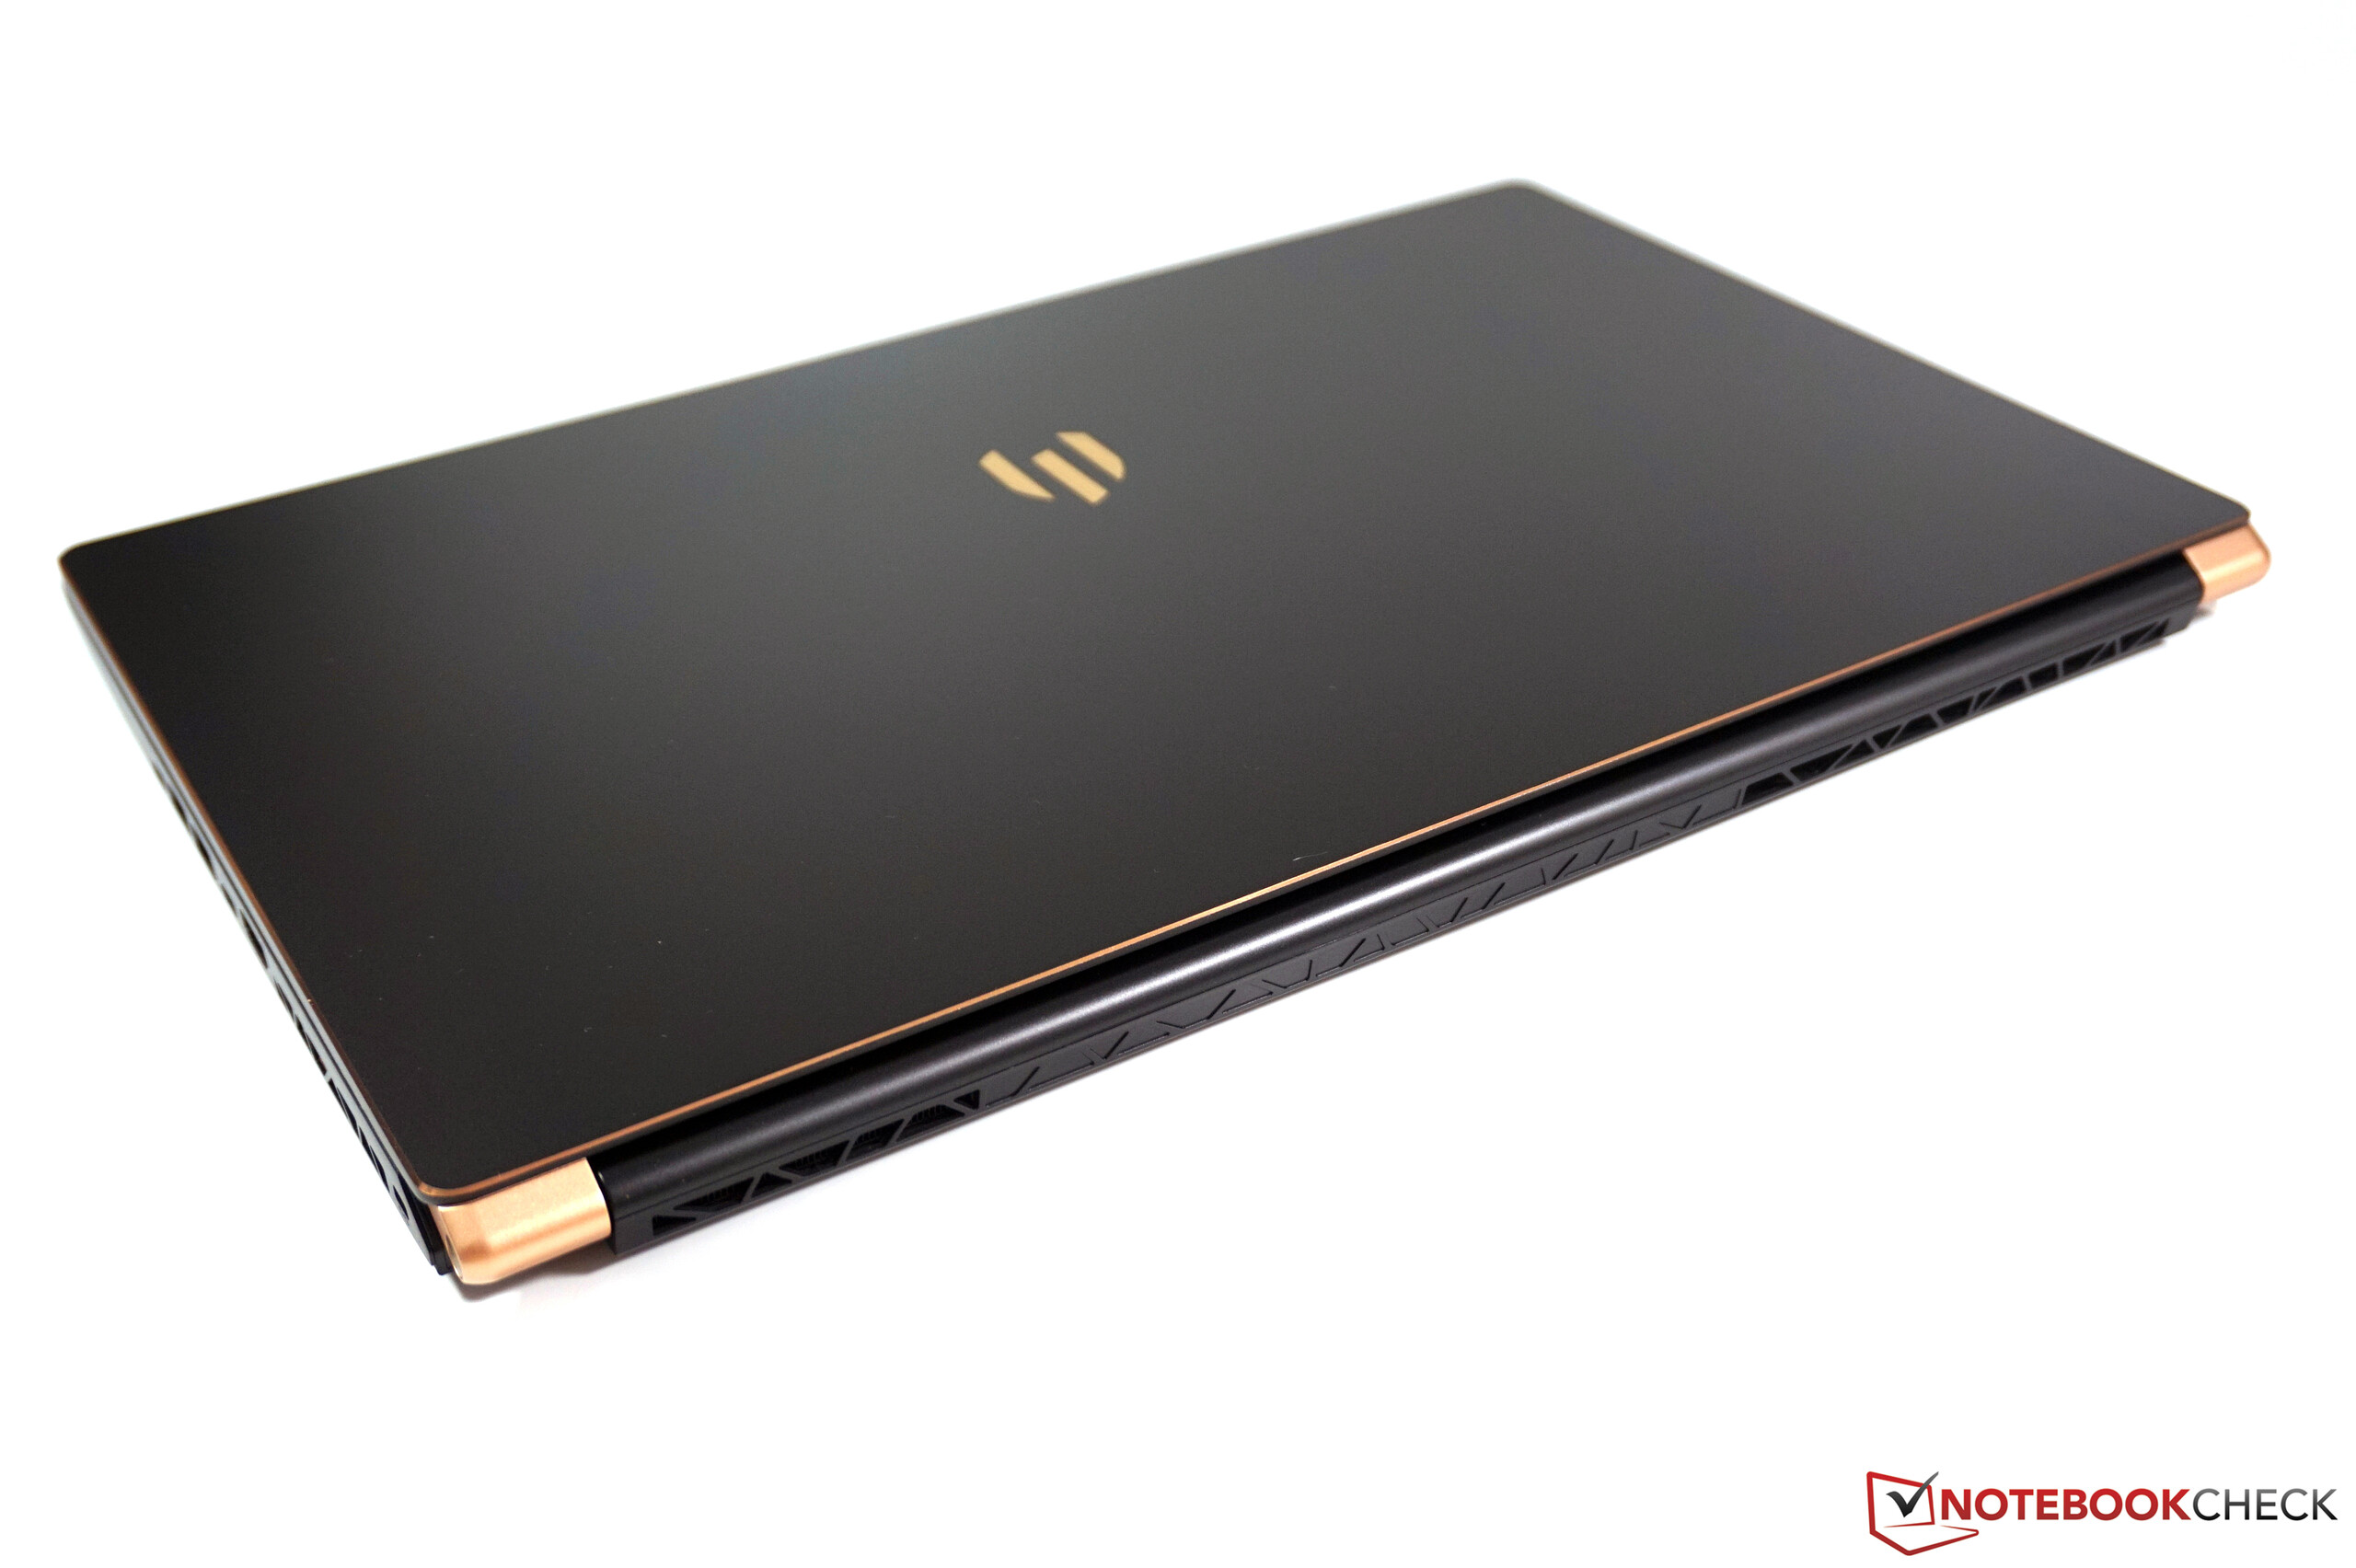
Avec le WS75, MSI propose une station de travail très intéressante. Cette conversion du portable de jeu GS75 a très bien fonctionné, et cet appareil fin pourrait être pour beaucoup une alternative viable aux modèles de 17,3 pouces classiques qui paraissent, en comparaison, très gros.
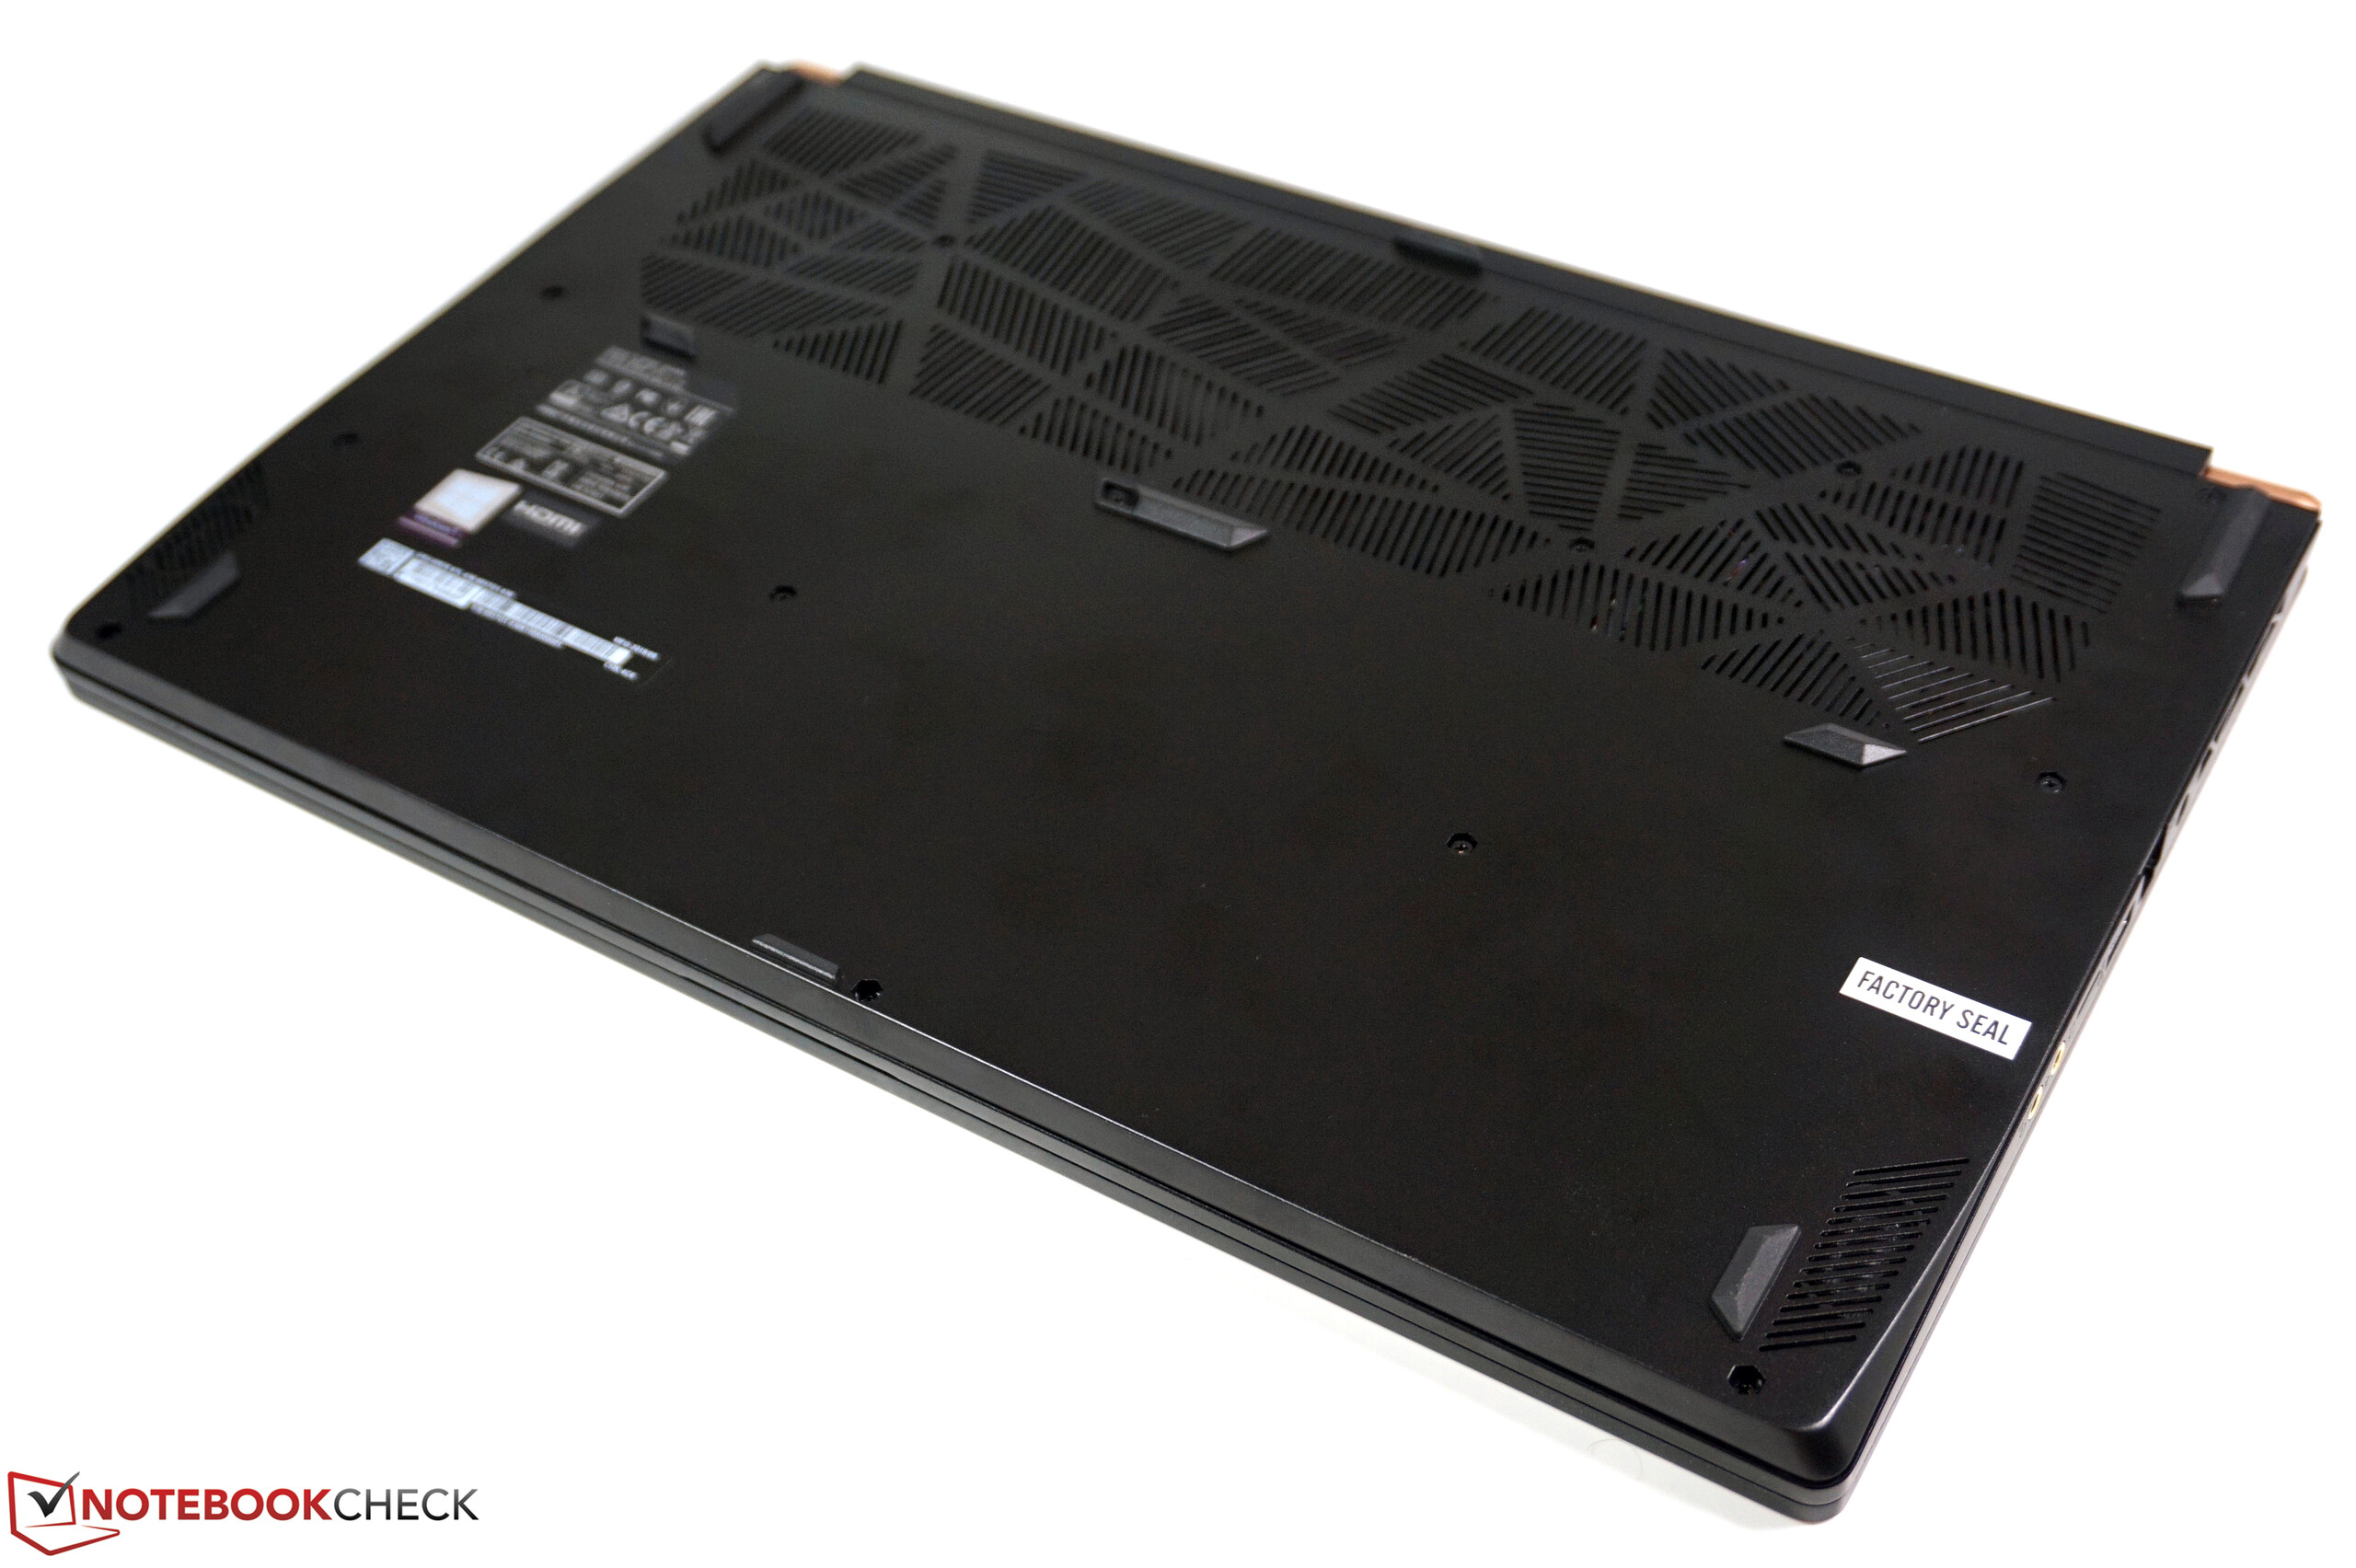
Une telle baisse de la taille et du poids a bien sûr été obtenue par des compromis. La base et la partie écran sont un peu plus faciles à tordre et, pris en main, l’appareil craque un peu.
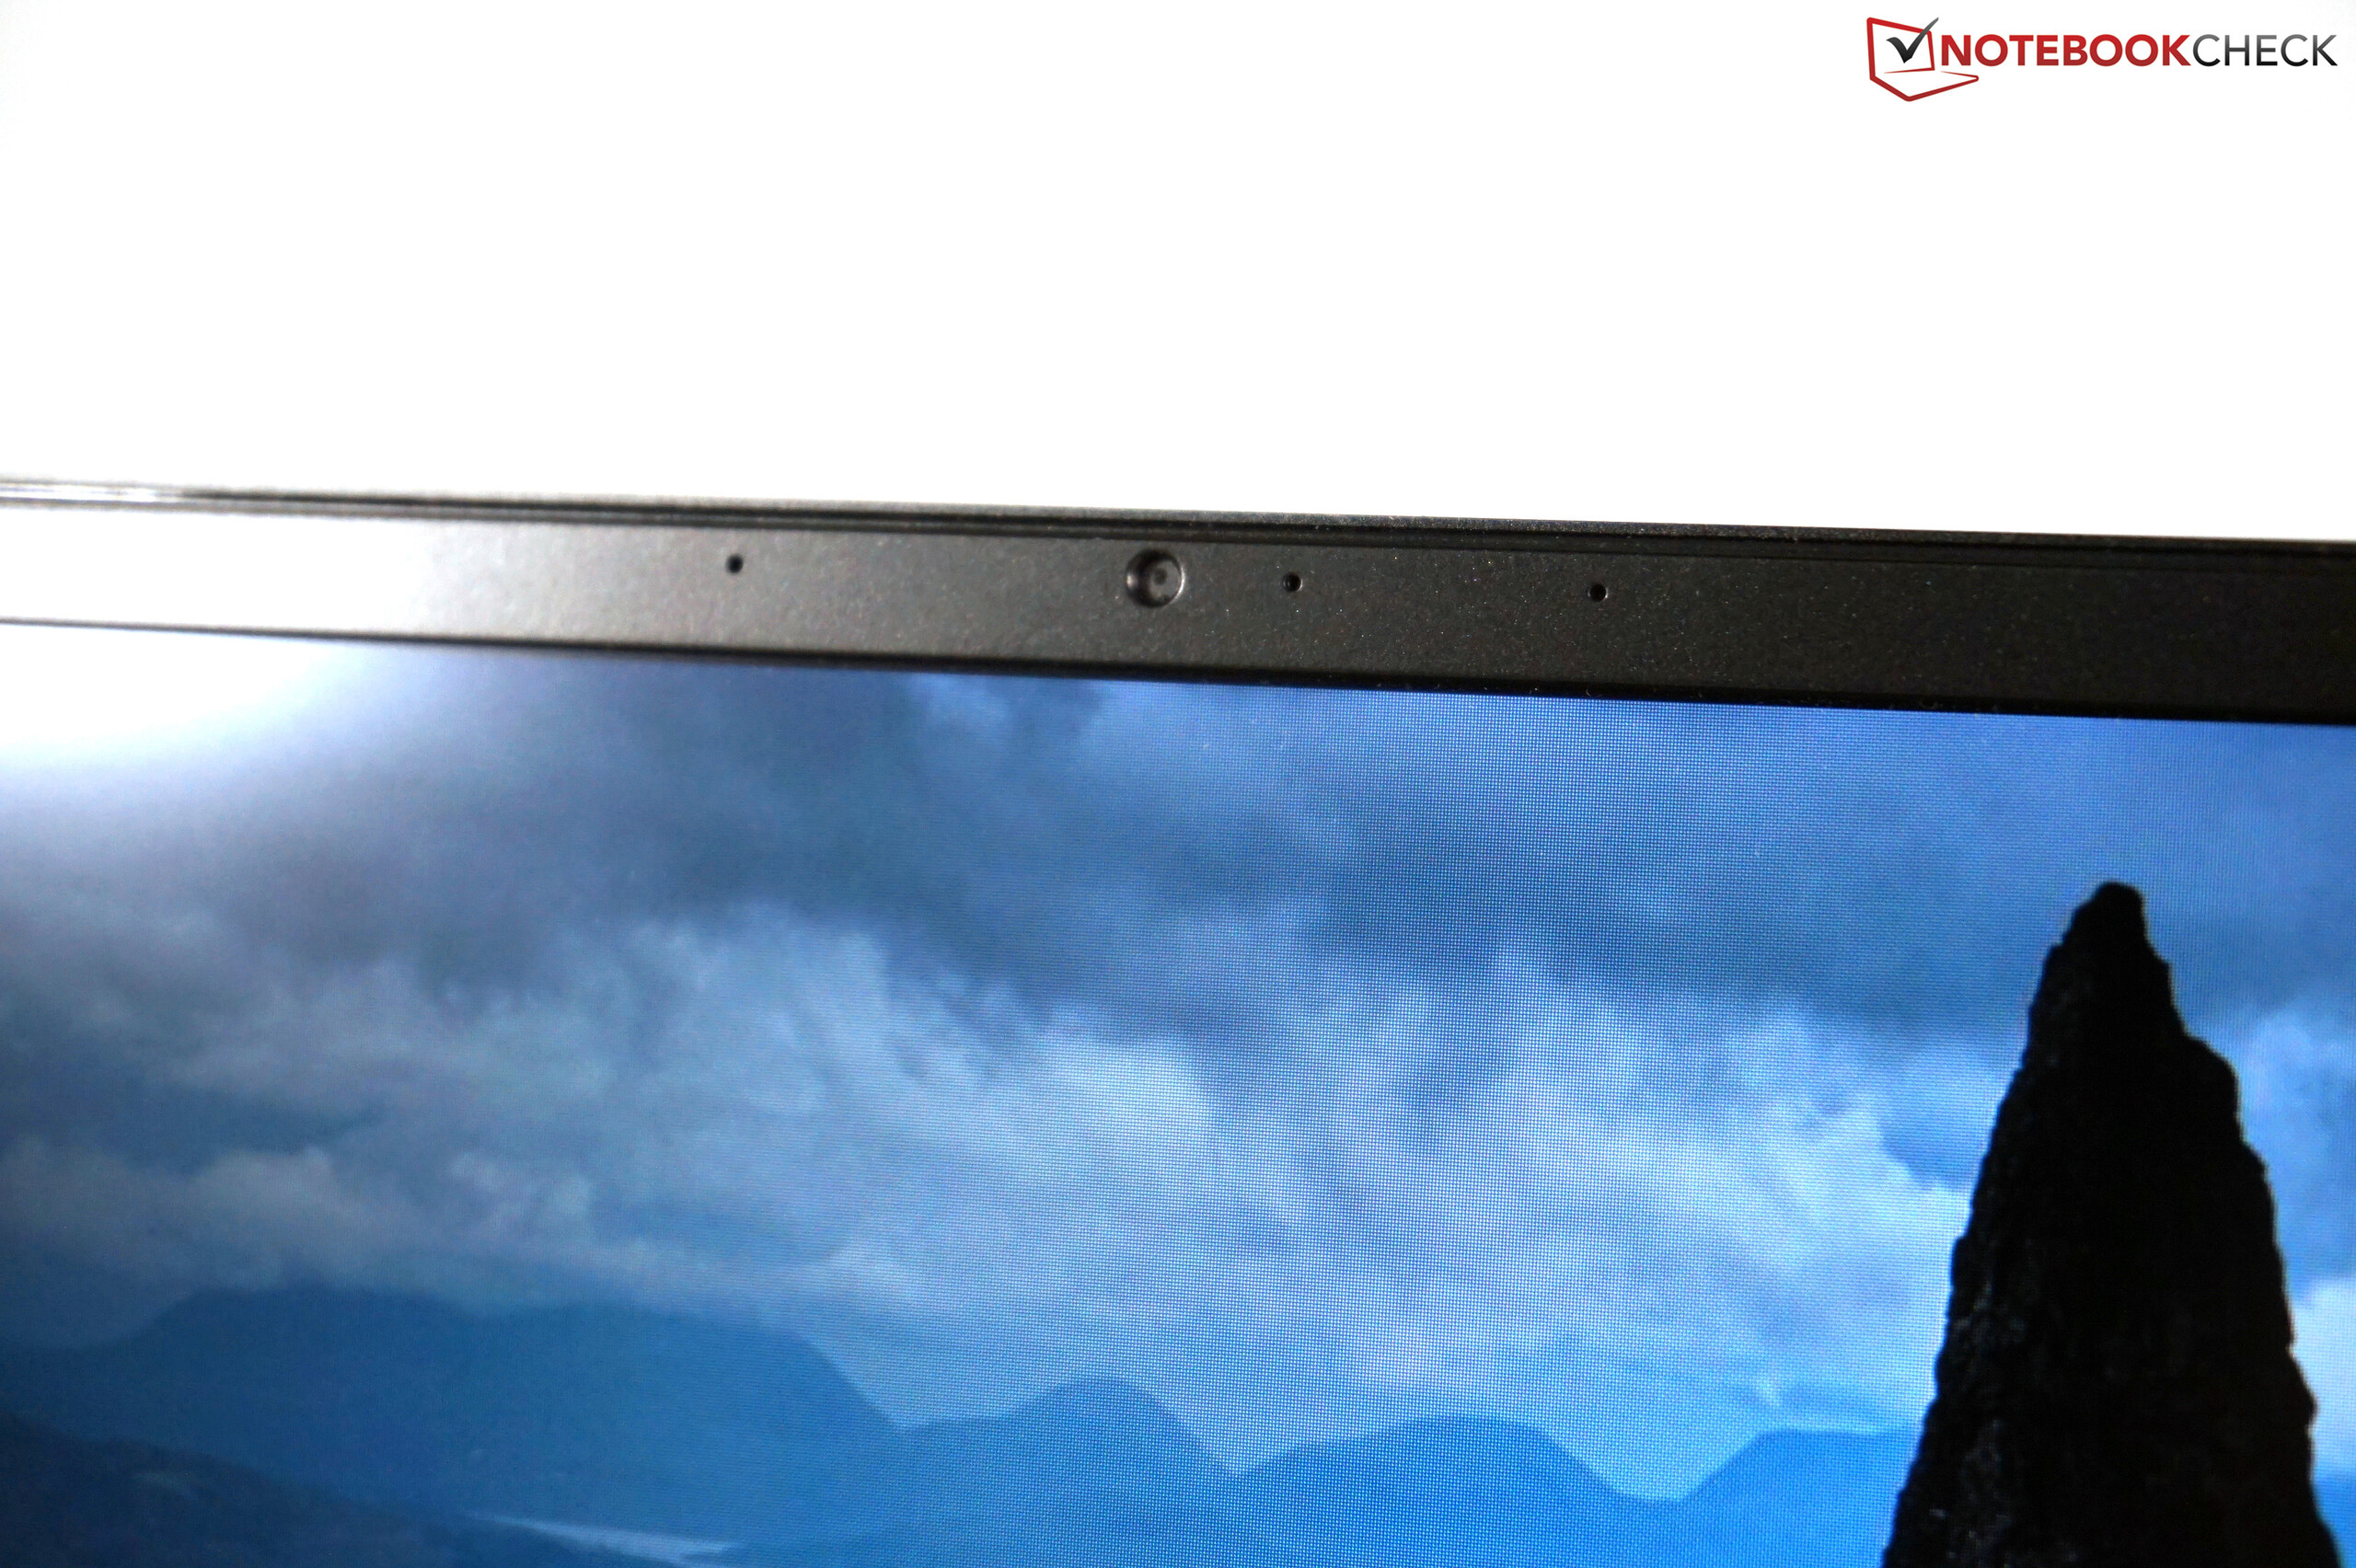
L’écran 1080p mat n’est pas exceptionnel, mais il fait son office, et les écrans de base des concurrents ne font pas mieux. L’écran optionnel 4K devrait néanmoins être meilleur.
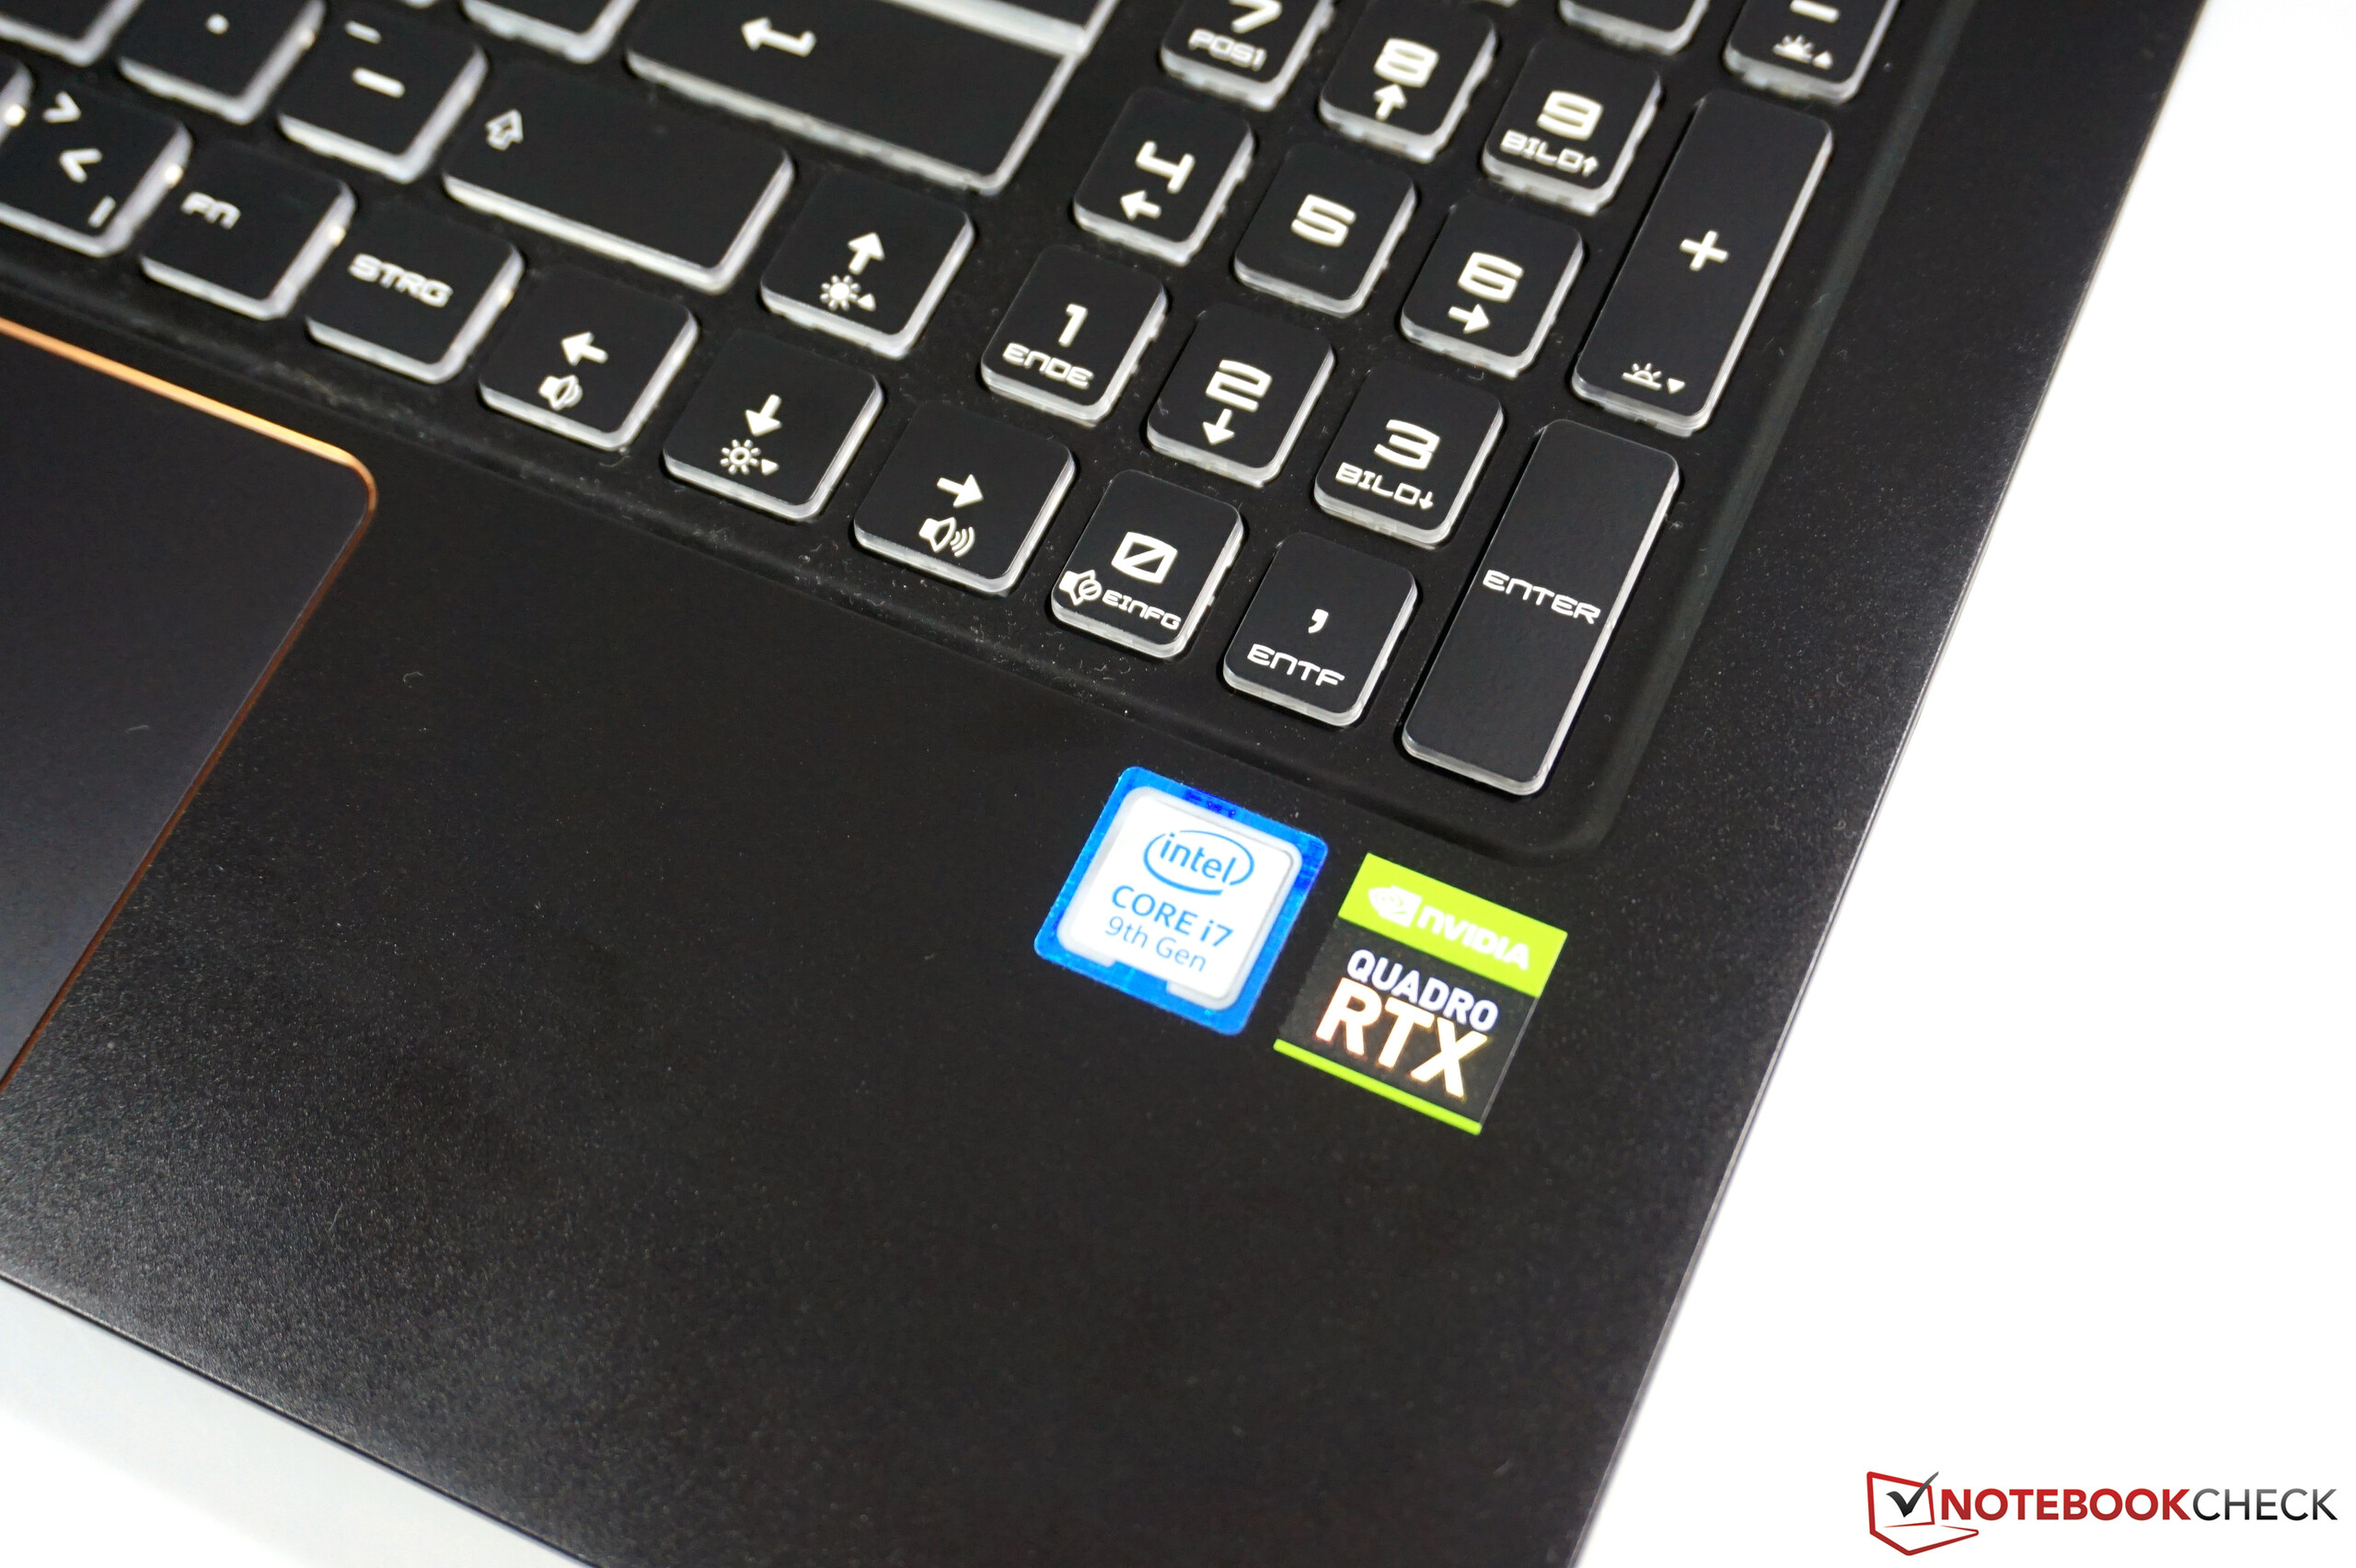
Nous en arrivons au plus important – les performances du WS75. À cause de ses dimensions et de sa finesse, nous étions quelque peu sceptiques face au choix d’une Quadro RTX 4000 classique, non Max-Q. Mais dans nos tests, la carte graphique a presque toujours pu tourner à sa fréquence maximale, incluant le turbo, débouchant sur d’excellentes performances graphiques. Le processeur est à la hauteur, et reste capable de tourner à 45 W dans les scénarios extrêmes. La température et le bruit sont également acceptables – ce qui n’est vraiment pas garanti avec les appareils fins et légers.
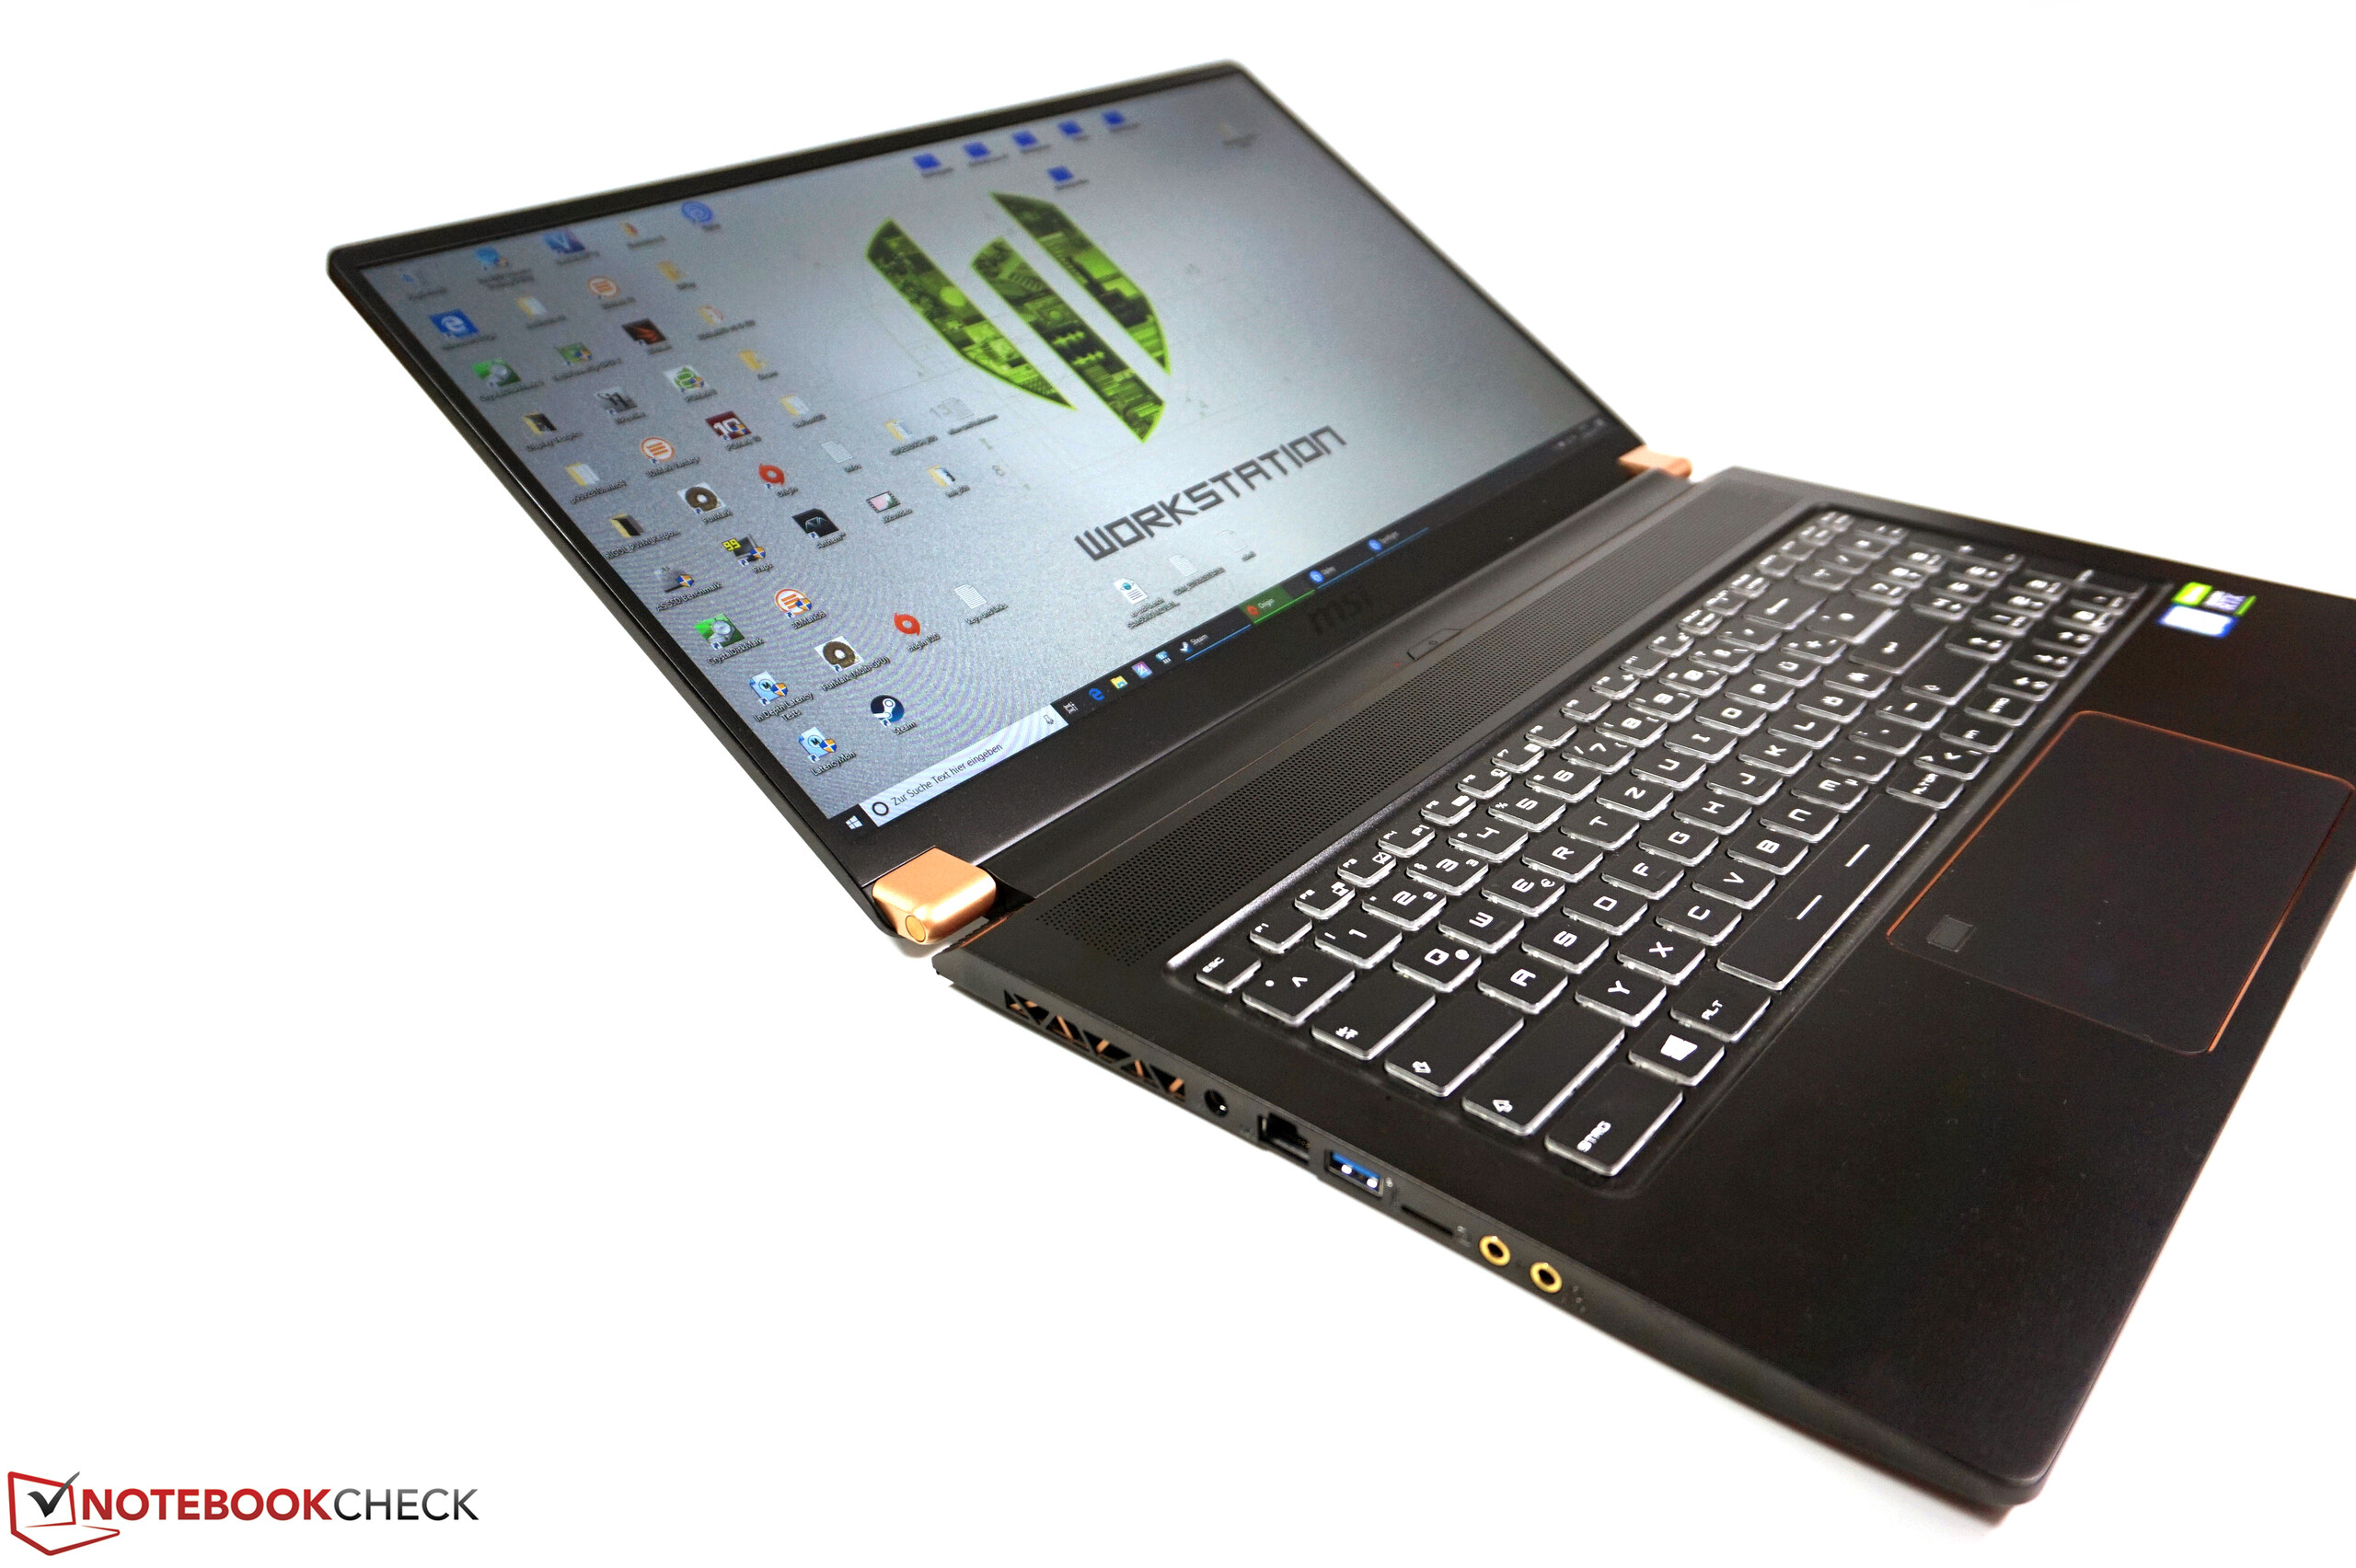
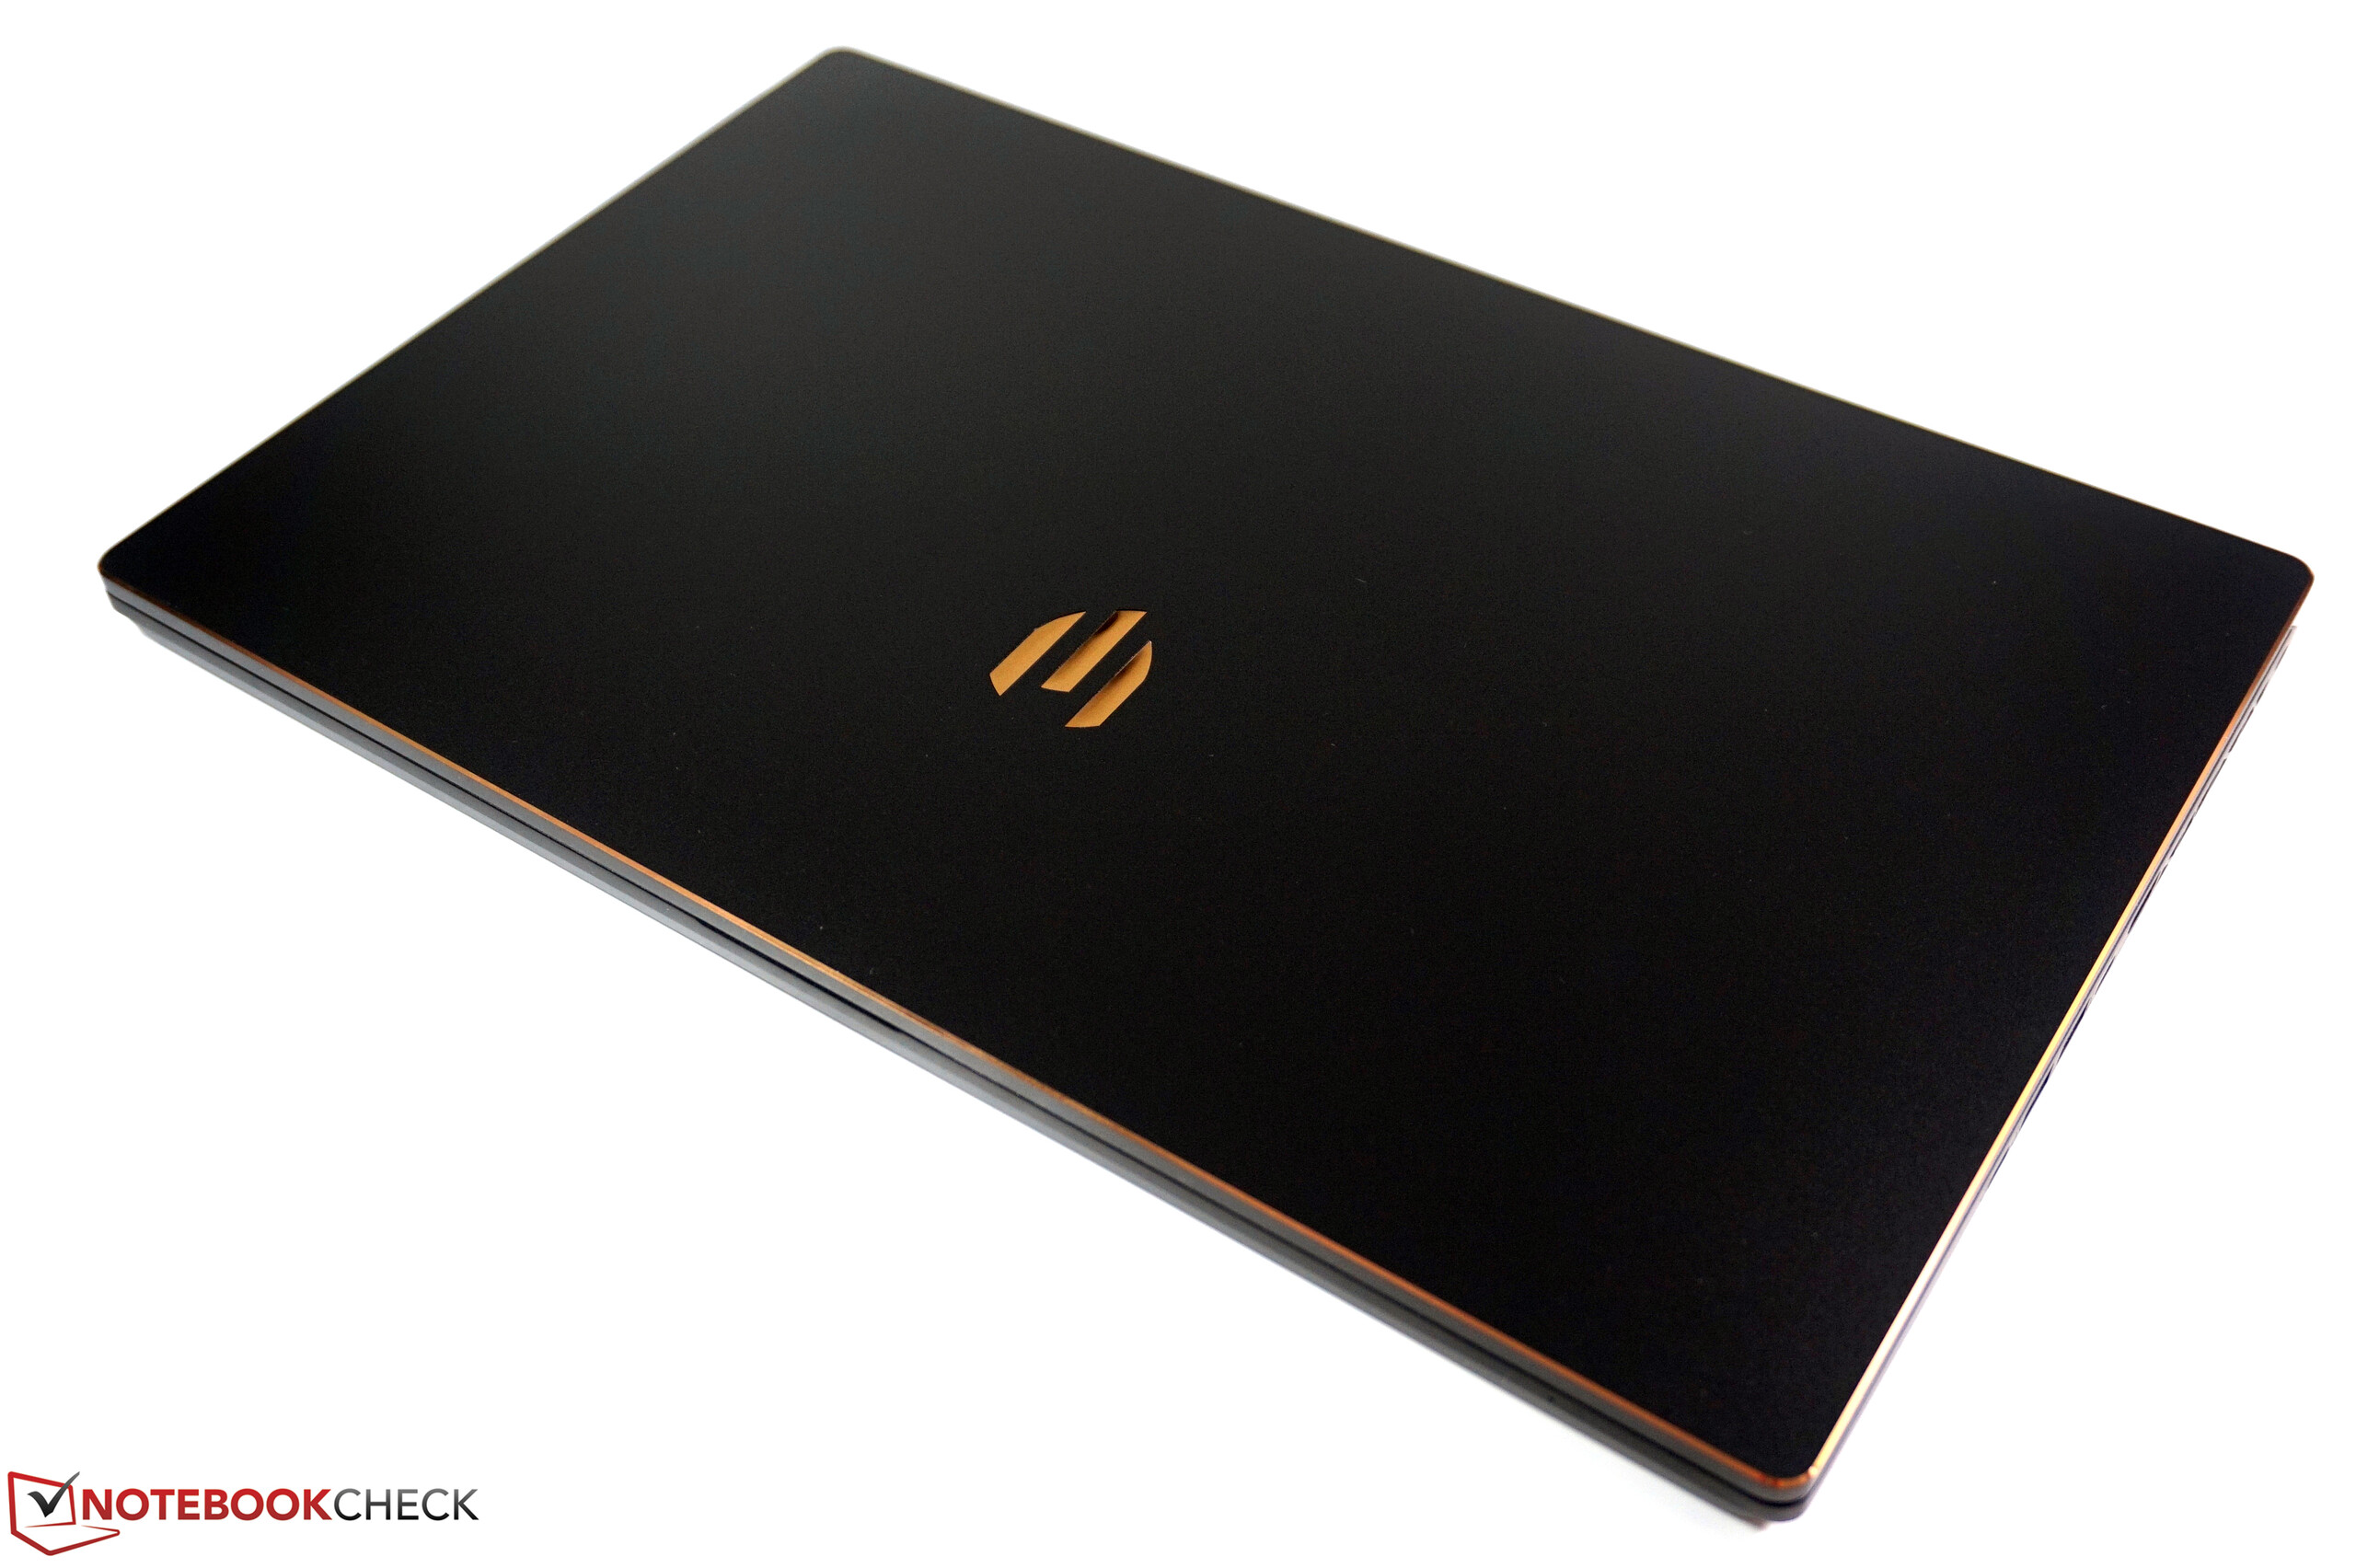
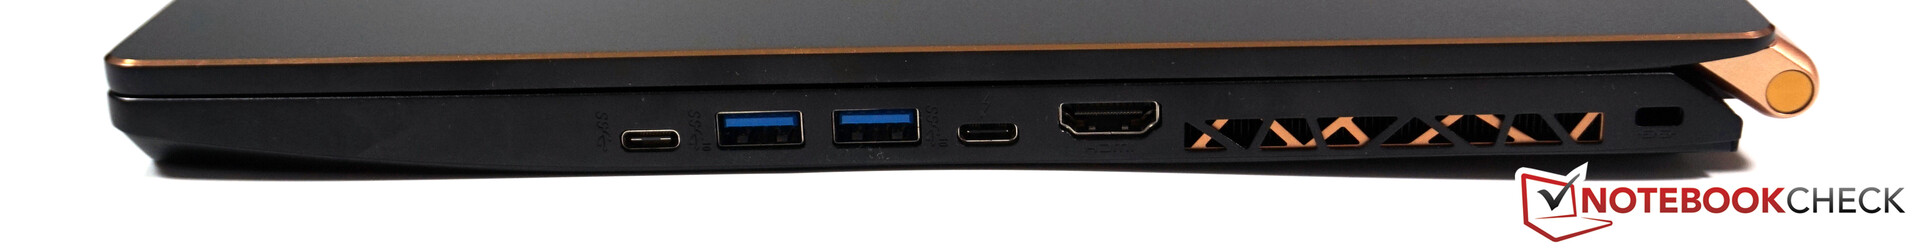
Compact, fin et élégant : le MSI WS75 impressionne avec un design très réussi, une connectivité complète et un bon clavier. Il fait des compromis avec la solidité, mais cette station de travail fine est tout à fait au niveau des poids-lourds du secteur sans.
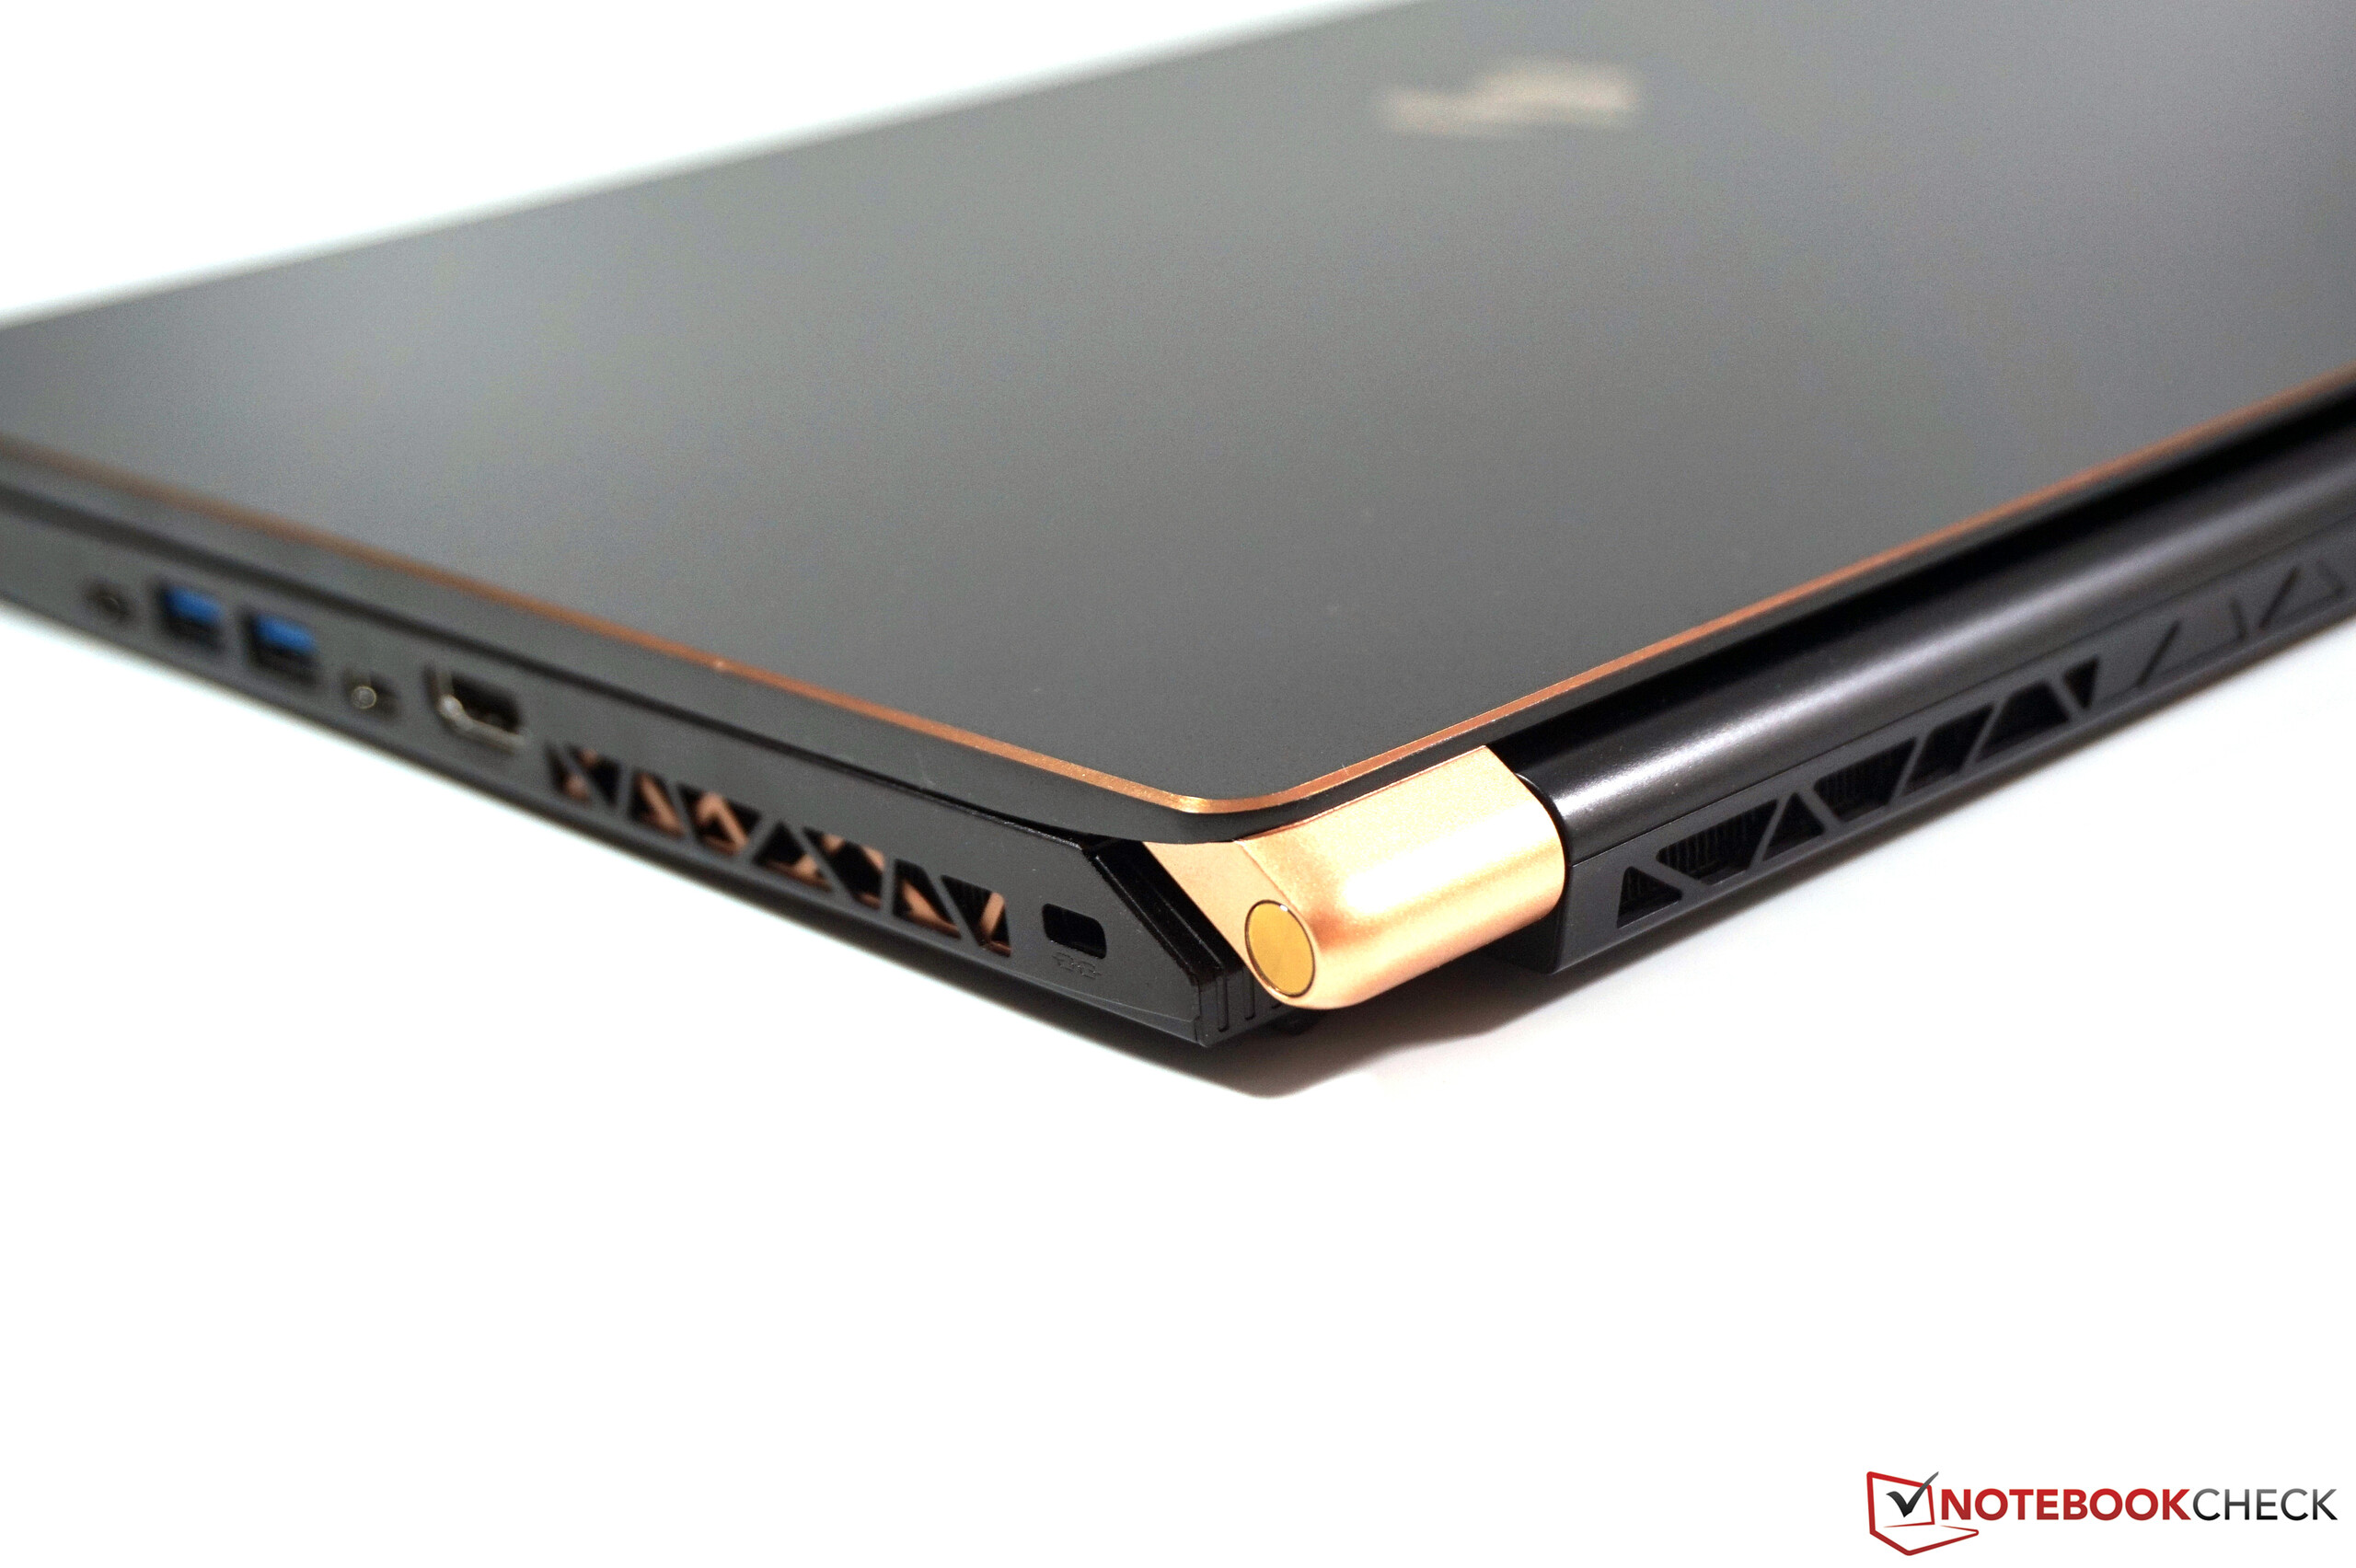
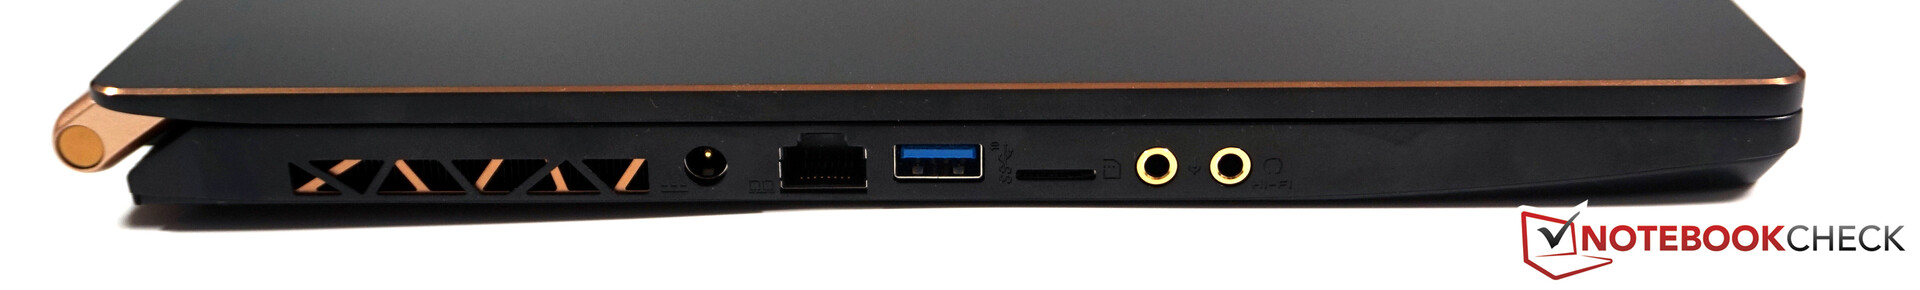
La machine possède néanmoins des points faibles comme ses mauvais haut-parleurs, sa consommation élevée en cas de sollicitations, et l’organisation de ses ports. Surtout pour ceux qui recherchent une machine à utiliser au travail et à la maison, et qui veulent tirer le plus de performances possibles d’une machine compacte, le WS75 est une proposition très intéressante.
L’intégralité de cette critique est disponible en anglais en suivant ce lien.
MSI WS75 9TL-636
- 01/08/2020 v7 (old)
Andreas Osthoff