Courte critique de la station de travail Lenovo ThinkPad P1 (Xeon E-2176M, Quadro P2000 Max-Q, UHD)
| SD Card Reader | |
| average JPG Copy Test (av. of 3 runs) | |
| Lenovo ThinkPad X1 Carbon 2018-20KGS03900 (Toshiba Exceria Pro M501) | |
| Lenovo ThinkPad X1 Extreme-20MF000XGE (Toshiba Exceria Pro SDXC 64 GB UHS-II) | |
| Lenovo ThinkPad P1-20MD002LUS (Toshiba Exceria Pro SDXC 64 GB UHS-II) | |
| Dell Precision 5530 Xeon E-2176M (Toshiba Exceria Pro SDXC 64 GB UHS-II) | |
| HP EliteBook 1050 G1-4QY20EA (Toshiba Exceria Pro SDXC 64 GB UHS-II) | |
| Moyenne de la classe Workstation (49.6 - 681, n=14, 2 dernières années) | |
| maximum AS SSD Seq Read Test (1GB) | |
| Lenovo ThinkPad X1 Extreme-20MF000XGE (Toshiba Exceria Pro SDXC 64 GB UHS-II) | |
| Lenovo ThinkPad P1-20MD002LUS (Toshiba Exceria Pro SDXC 64 GB UHS-II) | |
| Lenovo ThinkPad X1 Carbon 2018-20KGS03900 (Toshiba Exceria Pro M501) | |
| Moyenne de la classe Workstation (87.6 - 1455, n=14, 2 dernières années) | |
| HP EliteBook 1050 G1-4QY20EA (Toshiba Exceria Pro SDXC 64 GB UHS-II) | |
| Dell Precision 5530 Xeon E-2176M (Toshiba Exceria Pro SDXC 64 GB UHS-II) | |
| |||||||||||||||||||||||||
Homogénéité de la luminosité: 85 %
Valeur mesurée au centre, sur batterie: 397.6 cd/m²
Contraste: 1590:1 (Valeurs des noirs: 0.25 cd/m²)
ΔE ColorChecker Calman: 4.95 | ∀{0.5-29.43 Ø4.73}
calibrated: 4.22
ΔE Greyscale Calman: 5.1 | ∀{0.09-98 Ø4.97}
100% sRGB (Argyll 1.6.3 3D)
87.6% AdobeRGB 1998 (Argyll 1.6.3 3D)
99.1% AdobeRGB 1998 (Argyll 3D)
99.9% sRGB (Argyll 3D)
86.4% Display P3 (Argyll 3D)
Gamma: 2.234
CCT: 7543 K
| Lenovo ThinkPad P1-20MD002LUS B156ZAN03.2, IPS, 15.6", 3840x2160 | Lenovo ThinkPad X1 Extreme-20MF000XGE B156ZAN03.2, IPS, 15.6", 3840x2160 | Dell Precision 5530 Xeon E-2176M Sharp SHP148D / LQ156D1, IGZO, 15.6", 3840x2160 | HP EliteBook 1050 G1-4QY20EA AUO30EB, IPS LED, 15.6", 3840x2160 | Apple MacBook Pro 15 2018 (2.6 GHz, 560X) APPA040, IPS, 15.4", 2880x1800 | |
|---|---|---|---|---|---|
| Display | 0% | -12% | -20% | 0% | |
| Display P3 Coverage (%) | 86.4 | 86.3 0% | 76.5 -11% | 67.8 -22% | 98.7 14% |
| sRGB Coverage (%) | 99.9 | 100 0% | 98.4 -2% | 94.1 -6% | 99.9 0% |
| AdobeRGB 1998 Coverage (%) | 99.1 | 99.4 0% | 76.4 -23% | 67.9 -31% | 86.6 -13% |
| Response Times | -8% | 3% | 3% | 11% | |
| Response Time Grey 50% / Grey 80% * (ms) | 55.6 ? | 61.6 ? -11% | 48 ? 14% | 56 ? -1% | 43.2 ? 22% |
| Response Time Black / White * (ms) | 30.8 ? | 32 ? -4% | 33.6 ? -9% | 29 ? 6% | 31.2 ? -1% |
| PWM Frequency (Hz) | 1000 | 117000 ? | |||
| Screen | 8% | 2% | 0% | 27% | |
| Brightness middle (cd/m²) | 397.6 | 396 0% | 451.7 14% | 440 11% | 520 31% |
| Brightness (cd/m²) | 396 | 380 -4% | 440 11% | 389 -2% | 492 24% |
| Brightness Distribution (%) | 85 | 90 6% | 90 6% | 83 -2% | 88 4% |
| Black Level * (cd/m²) | 0.25 | 0.28 -12% | 0.4 -60% | 0.34 -36% | 0.39 -56% |
| Contrast (:1) | 1590 | 1414 -11% | 1129 -29% | 1294 -19% | 1333 -16% |
| Colorchecker dE 2000 * | 4.95 | 4 19% | 3.11 37% | 5.04 -2% | 1.2 76% |
| Colorchecker dE 2000 max. * | 10.23 | 7.6 26% | 8.62 16% | 6.99 32% | 2.3 78% |
| Colorchecker dE 2000 calibrated * | 4.22 | 0.9 79% | 3.07 27% | 2.04 52% | |
| Greyscale dE 2000 * | 5.1 | 6.1 -20% | 3.7 27% | 4.98 2% | 1.3 75% |
| Gamma | 2.234 98% | 2.25 98% | 2.11 104% | 2.48 89% | 2.18 101% |
| CCT | 7543 86% | 7786 83% | 6492 100% | 7777 84% | 6738 96% |
| Color Space (Percent of AdobeRGB 1998) (%) | 87.6 | 88.5 1% | 69 -21% | 61 -30% | |
| Color Space (Percent of sRGB) (%) | 100 | 100 0% | 98 -2% | 94 -6% | |
| Moyenne finale (programmes/paramètres) | 0% /
4% | -2% /
-0% | -6% /
-3% | 13% /
18% |
* ... Moindre est la valeur, meilleures sont les performances
Temps de réponse de l'écran
| ↔ Temps de réponse noir à blanc | ||
|---|---|---|
| 30.8 ms ... hausse ↗ et chute ↘ combinées | ↗ 16.4 ms hausse | 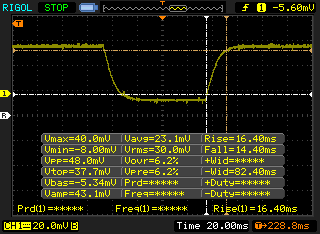 |
| ↘ 14.4 ms chute | ||
| L'écran souffre de latences très élevées, à éviter pour le jeu. En comparaison, tous les appareils testés affichent entre 0.1 (minimum) et 240 (maximum) ms. » 83 % des appareils testés affichent de meilleures performances. Cela signifie que les latences relevées sont moins bonnes que la moyenne (19.9 ms) de tous les appareils testés. | ||
| ↔ Temps de réponse gris 50% à gris 80% | ||
| 55.6 ms ... hausse ↗ et chute ↘ combinées | ↗ 38 ms hausse | 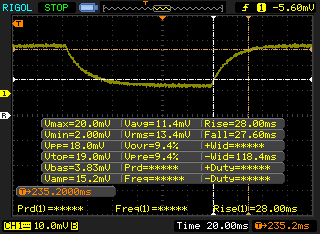 |
| ↘ 37.6 ms chute | ||
| L'écran souffre de latences très élevées, à éviter pour le jeu. En comparaison, tous les appareils testés affichent entre 0.165 (minimum) et 636 (maximum) ms. » 92 % des appareils testés affichent de meilleures performances. Cela signifie que les latences relevées sont moins bonnes que la moyenne (31.1 ms) de tous les appareils testés. | ||
Scintillement / MLI (Modulation de largeur d'impulsion)
| Scintillement / MLI (Modulation de largeur d'impulsion) non décelé |  | ||
En comparaison, 52 % des appareils testés n'emploient pas MDI pour assombrir leur écran. Nous avons relevé une moyenne à 7784 (minimum : 5 - maximum : 343500) Hz dans le cas où une MDI était active. | |||
| PCMark 8 Home Score Accelerated v2 | 3536 points | |
| PCMark 8 Creative Score Accelerated v2 | 4832 points | |
| PCMark 8 Work Score Accelerated v2 | 4404 points | |
| PCMark 10 Score | 4618 points | |
Aide | ||
| Lenovo ThinkPad P1-20MD002LUS Samsung SSD PM981 MZVLB2T0HMLB | Lenovo ThinkPad X1 Extreme-20MF000XGE Samsung SSD PM981 MZVLB1T0HALR | Dell Precision 5530 Xeon E-2176M SK hynix PC400 512 GB | HP EliteBook 1050 G1-4QY20EA Toshiba XG5-P KXG50PNV2T04 | Apple MacBook Pro 15 2018 (2.6 GHz, 560X) Apple SSD AP0512 | Moyenne Samsung SSD PM981 MZVLB2T0HMLB | |
|---|---|---|---|---|---|---|
| AS SSD | 19% | -37% | -38% | -97% | 4% | |
| Score Total (Points) | 4784 | 5355 12% | 2922 -39% | 2768 -42% | 2119 -56% | 4881 ? 2% |
| Score Write (Points) | 2200 | 2147 -2% | 1121 -49% | 1153 -48% | 347 -84% | 2139 ? -3% |
| Score Read (Points) | 1722 | 2132 24% | 1226 -29% | 1120 -35% | 1199 -30% | 1828 ? 6% |
| Access Time Write * (ms) | 0.032 | 0.028 12% | 0.053 -66% | 0.056 -75% | 0.0295 ? 8% | |
| Access Time Read * (ms) | 0.038 | 0.034 11% | 0.073 -92% | 0.051 -34% | 0.225 -492% | 0.0485 ? -28% |
| 4K-64 Write (MB/s) | 1866 | 1782 -5% | 926 -50% | 953 -49% | 163.5 -91% | 1789 ? -4% |
| 4K-64 Read (MB/s) | 1450 | 1805 24% | 970 -33% | 856 -41% | 965 -33% | 1527 ? 5% |
| 4K Write (MB/s) | 118.4 | 130.9 11% | 92.8 -22% | 105.4 -11% | 18.78 -84% | 128.8 ? 9% |
| 4K Read (MB/s) | 28.61 | 56.8 99% | 38.43 34% | 19.07 -33% | 9.46 -67% | 39.1 ? 37% |
| Seq Write (MB/s) | 2155 | 2336 8% | 1022 -53% | 948 -56% | 1644 -24% | 2217 ? 3% |
| Seq Read (MB/s) | 2440 | 2703 11% | 2169 -11% | 2454 1% | 2239 -8% | 2628 ? 8% |
* ... Moindre est la valeur, meilleures sont les performances

| 3DMark 06 Standard Score | 31482 points | |
| 3DMark Vantage P Result | 32724 points | |
| 3DMark 11 Performance | 8363 points | |
| 3DMark Ice Storm Standard Score | 23769 points | |
| 3DMark Cloud Gate Standard Score | 14996 points | |
| 3DMark Fire Strike Score | 5958 points | |
| 3DMark Fire Strike Extreme Score | 3104 points | |
| 3DMark Time Spy Score | 2206 points | |
Aide | ||
| SPECviewperf 13 | |
| Solidworks (sw-04) | |
| Lenovo ThinkPad P52 20MAS03N00 | |
| Lenovo ThinkPad P1-20MD002LUS | |
| Siemens NX (snx-03) | |
| Lenovo ThinkPad P52 20MAS03N00 | |
| Lenovo ThinkPad P1-20MD002LUS | |
| Showcase (showcase-02) | |
| Lenovo ThinkPad P1-20MD002LUS | |
| Lenovo ThinkPad P52 20MAS03N00 | |
| Medical (medical-02) | |
| Lenovo ThinkPad P1-20MD002LUS | |
| Lenovo ThinkPad P52 20MAS03N00 | |
| Maya (maya-05) | |
| Lenovo ThinkPad P1-20MD002LUS | |
| Lenovo ThinkPad P52 20MAS03N00 | |
| Energy (energy-02) | |
| Lenovo ThinkPad P1-20MD002LUS | |
| Lenovo ThinkPad P52 20MAS03N00 | |
| Creo (creo-02) | |
| Lenovo ThinkPad P1-20MD002LUS | |
| Lenovo ThinkPad P52 20MAS03N00 | |
| Catia (catia-05) | |
| Lenovo ThinkPad P1-20MD002LUS | |
| Lenovo ThinkPad P52 20MAS03N00 | |
| 3ds Max (3dsmax-06) | |
| Lenovo ThinkPad P1-20MD002LUS | |
| Lenovo ThinkPad P52 20MAS03N00 | |
| Bas | Moyen | Élevé | Ultra | 4K | |
|---|---|---|---|---|---|
| Sleeping Dogs (2012) | 197 | 135 | 133 | 46 | |
| BioShock Infinite (2013) | 264 | 192 | 168 | 65 | |
| Metro: Last Light (2013) | 122 | 111 | 84 | 46 | |
| GRID 2 (2013) | 194 | 132 | 117 | 85 | |
| Company of Heroes 2 (2013) | 72 | 65 | 54 | 27 | |
| Total War: Rome II (2013) | 241 | 177 | 142 | 21 | |
| Thief (2014) | 57 | 54 | 51 | 44 | |
| Dirt Rally (2015) | 234 | 131 | 88 | 73 | 49 |
| The Witcher 3 (2015) | 106 | 73 | 32 | 25 | 12 |
| Batman: Arkham Knight (2015) | 100 | 92 | 59 | 58 | 17 |
| Metal Gear Solid V (2015) | 60 | 60 | 60 | 60 | 28 |
| Rise of the Tomb Raider (2016) | 44 | 40 | 36 | 32 | 15 |
| Ashes of the Singularity (2016) | 54.5 | 39.6 | 34.9 | 13 | |
| Doom (2016) | 103 | 104 | 63 | 61 | 20 |
| Deus Ex Mankind Divided (2016) | 70 | 53 | 31 | 16 | 10 |
| Prey (2017) | 140 | 111 | 109 | 109 | 36 |
| Middle-earth: Shadow of War (2017) | 67 | 49 | 38 | 29 | 13 |
| F1 2018 (2018) | 118 | 72 | 72 | 40 | 24 |
| Shadow of the Tomb Raider (2018) | 79 | 33 | 30 | 23 | 3 |
| Shadow of the Tomb Raider | |
| 1280x720 Lowest Preset | |
| Lenovo ThinkPad X1 Extreme-20MF000XGE | |
| Apple MacBook Pro 15 2018 (2.6 GHz, 560X) | |
| Lenovo ThinkPad P1-20MD002LUS | |
| 1920x1080 Medium Preset | |
| Lenovo ThinkPad X1 Extreme-20MF000XGE | |
| Lenovo ThinkPad P1-20MD002LUS | |
| Apple MacBook Pro 15 2018 (2.6 GHz, 560X) | |
| 1920x1080 High Preset AA:SM | |
| Lenovo ThinkPad X1 Extreme-20MF000XGE | |
| Lenovo ThinkPad P1-20MD002LUS | |
| Apple MacBook Pro 15 2018 (2.6 GHz, 560X) | |
| 1920x1080 Highest Preset AA:T | |
| Lenovo ThinkPad X1 Extreme-20MF000XGE | |
| Apple MacBook Pro 15 2018 (2.6 GHz, 560X) | |
| Lenovo ThinkPad P1-20MD002LUS | |
| 3840x2160 Highest Preset AA:T | |
| Lenovo ThinkPad X1 Extreme-20MF000XGE | |
| Apple MacBook Pro 15 2018 (2.6 GHz, 560X) | |
| Lenovo ThinkPad P1-20MD002LUS | |
| Batman: Arkham Knight | |
| 1280x720 Low / Off AF:Trilinear | |
| Dell Precision 5530 Xeon E-2176M | |
| Lenovo ThinkPad P1-20MD002LUS | |
| 1366x768 Normal / Off AF:4x | |
| Dell Precision 5530 Xeon E-2176M | |
| Lenovo ThinkPad P1-20MD002LUS | |
| 1920x1080 High / On (Interactive Smoke & Paper Debris Off) AA:SM AF:8x | |
| MSI WS63 7RF-290US | |
| Lenovo ThinkPad P1-20MD002LUS | |
| Dell Precision 5530 Xeon E-2176M | |
| 1920x1080 High / On AA:SM AF:16x | |
| Eurocom Tornado F5W | |
| Lenovo ThinkPad P1-20MD002LUS | |
| MSI WS63 7RF-290US | |
| Dell Precision 5530 Xeon E-2176M | |
| 3840x2160 High / On (Interactive Smoke & Paper Debris Off) AA:SM AF:8x | |
| Dell Precision 5530 Xeon E-2176M | |
| Lenovo ThinkPad P1-20MD002LUS | |
| Prey | |
| 1280x720 Low Preset AF:2x | |
| Lenovo ThinkPad P1-20MD002LUS | |
| Dell Precision 5530 Xeon E-2176M | |
| 1366x768 Medium Preset AA:FX AF:4x | |
| Dell Precision 5530 Xeon E-2176M | |
| 1920x1080 High Preset AA:2TX SM AF:8x | |
| Lenovo ThinkPad P1-20MD002LUS | |
| Dell Precision 5530 Xeon E-2176M | |
| 1920x1080 Very High Preset AA:2TX SM AF:16x | |
| Lenovo ThinkPad P1-20MD002LUS | |
| MSI WS63 7RF-290US | |
| Dell Precision 5530 Xeon E-2176M | |
| 3840x2160 High Preset AA:2TX SM AF:8x | |
| Lenovo ThinkPad P1-20MD002LUS | |
| Dell Precision 5530 Xeon E-2176M | |
Degré de la nuisance sonore
| Au repos |
| 28.4 / 28.4 / 29.2 dB(A) |
| Fortement sollicité |
| 41.8 / 41.8 dB(A) |
 | ||
30 dB silencieux 40 dB(A) audible 50 dB(A) bruyant |
||
min: | ||
| Lenovo ThinkPad P1-20MD002LUS Quadro P2000 Max-Q, E-2176M, Samsung SSD PM981 MZVLB2T0HMLB | Lenovo ThinkPad X1 Extreme-20MF000XGE GeForce GTX 1050 Ti Max-Q, i7-8750H, Samsung SSD PM981 MZVLB1T0HALR | Dell Precision 5530 Xeon E-2176M Quadro P2000, E-2176M, SK hynix PC400 512 GB | HP EliteBook 1050 G1-4QY20EA GeForce GTX 1050 Max-Q, i7-8750H, Toshiba XG5-P KXG50PNV2T04 | Lenovo ThinkPad X1 Carbon 2018-20KGS03900 UHD Graphics 620, i5-8550U, Samsung SSD PM981 MZVLB512HAJQ | Apple MacBook Pro 15 2018 (2.6 GHz, 560X) Radeon Pro 560X, i7-8850H, Apple SSD AP0512 | |
|---|---|---|---|---|---|---|
| Noise | 2% | -5% | -6% | 3% | -5% | |
| arrêt / environnement * (dB) | 28.3 | 28.8 -2% | 28.4 -0% | 30.25 -7% | 28.9 -2% | 29.6 -5% |
| Idle Minimum * (dB) | 28.4 | 28.8 -1% | 28.4 -0% | 30.25 -7% | 28.9 -2% | 30.1 -6% |
| Idle Average * (dB) | 28.4 | 28.8 -1% | 28.4 -0% | 30.25 -7% | 28.9 -2% | 30.1 -6% |
| Idle Maximum * (dB) | 29.2 | 31.3 -7% | 28.4 3% | 31.8 -9% | 32.5 -11% | 30.1 -3% |
| Load Average * (dB) | 41.8 | 36.4 13% | 46.5 -11% | 44.7 -7% | 35.1 16% | 46.8 -12% |
| Witcher 3 ultra * (dB) | 39.1 | 36.4 7% | 46.5 -19% | 36 8% | ||
| Load Maximum * (dB) | 41.8 | 39.2 6% | 46.5 -11% | 42 -0% | 35.1 16% | 46.8 -12% |
* ... Moindre est la valeur, meilleures sont les performances
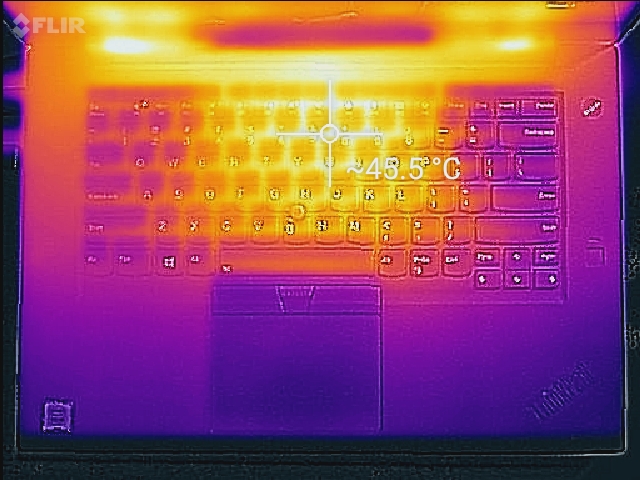
(±) La température maximale du côté supérieur est de 43.4 °C / 110 F, par rapport à la moyenne de 38.2 °C / 101 F, allant de 22.2 à 69.8 °C pour la classe Workstation.
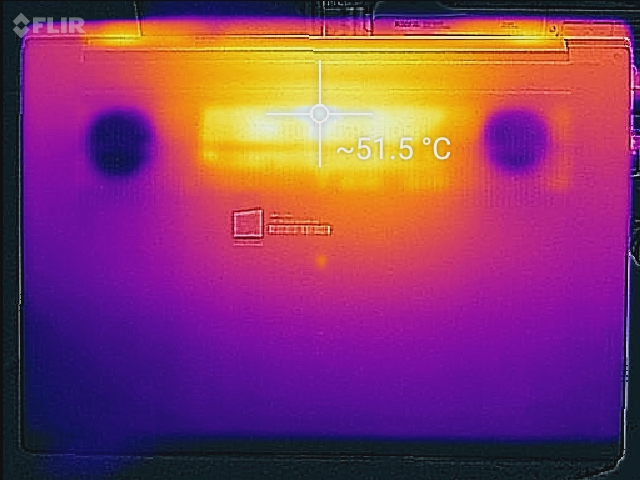
(-) Le fond chauffe jusqu'à un maximum de 50 °C / 122 F, contre une moyenne de 41.1 °C / 106 F
(+) En utilisation inactive, la température moyenne du côté supérieur est de 24.8 °C / 77 F, par rapport à la moyenne du dispositif de 32 °C / 90 F.
(±) En jouant à The Witcher 3, la température moyenne du côté supérieur est de 33.9 °C / 93 F, alors que la moyenne de l'appareil est de 32 °C / 90 F.
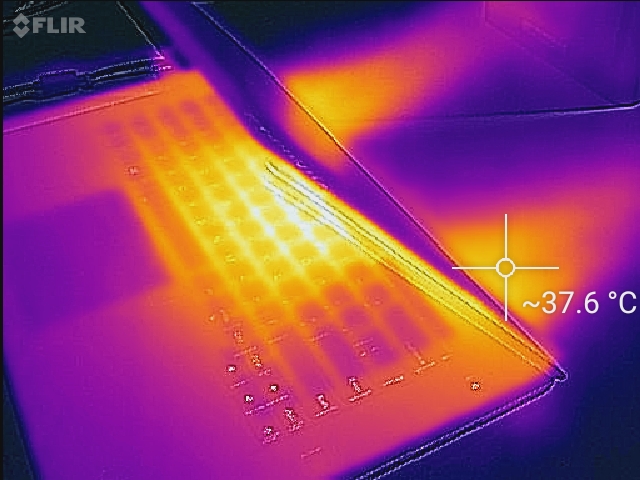
(+) Les repose-poignets et le pavé tactile sont plus froids que la température de la peau avec un maximum de 28.8 °C / 83.8 F et sont donc froids au toucher.
(±) La température moyenne de la zone de l'appui-paume de dispositifs similaires était de 27.8 °C / 82 F (-1 °C / #-1.8 F).
Lenovo ThinkPad P1-20MD002LUS analyse audio
(±) | le niveau sonore du haut-parleur est moyen mais bon (73.7# dB)
Basses 100 - 315 Hz
(±) | basse réduite - en moyenne 10.1% inférieure à la médiane
(±) | la linéarité des basses est moyenne (12.3% delta à la fréquence précédente)
Médiums 400 - 2000 Hz
(±) | médiane supérieure - en moyenne 5.9% supérieure à la médiane
(±) | la linéarité des médiums est moyenne (8.9% delta à la fréquence précédente)
Aiguës 2 - 16 kHz
(+) | des sommets équilibrés - à seulement 2% de la médiane
(+) | les aigus sont linéaires (5.1% delta à la fréquence précédente)
Globalement 100 - 16 000 Hz
(±) | la linéarité du son global est moyenne (21.8% de différence avec la médiane)
Par rapport à la même classe
» 77% de tous les appareils testés de cette catégorie étaient meilleurs, 6% similaires, 17% pires
» Le meilleur avait un delta de 7%, la moyenne était de 17%, le pire était de 35%.
Par rapport à tous les appareils testés
» 62% de tous les appareils testés étaient meilleurs, 7% similaires, 31% pires
» Le meilleur avait un delta de 4%, la moyenne était de 24%, le pire était de 134%.
Apple MacBook Pro 15 2018 (2.6 GHz, 560X) analyse audio
(+) | les haut-parleurs peuvent jouer relativement fort (85# dB)
Basses 100 - 315 Hz
(+) | bonne basse - seulement 4.7% loin de la médiane
(±) | la linéarité des basses est moyenne (8.3% delta à la fréquence précédente)
Médiums 400 - 2000 Hz
(+) | médiane équilibrée - seulement 1.8% de la médiane
(+) | les médiums sont linéaires (3.5% delta à la fréquence précédente)
Aiguës 2 - 16 kHz
(+) | des sommets équilibrés - à seulement 2.6% de la médiane
(+) | les aigus sont linéaires (5.7% delta à la fréquence précédente)
Globalement 100 - 16 000 Hz
(+) | le son global est linéaire (6.4% différence à la médiane)
Par rapport à la même classe
» 4% de tous les appareils testés de cette catégorie étaient meilleurs, 1% similaires, 95% pires
» Le meilleur avait un delta de 5%, la moyenne était de 17%, le pire était de 45%.
Par rapport à tous les appareils testés
» 1% de tous les appareils testés étaient meilleurs, 0% similaires, 99% pires
» Le meilleur avait un delta de 4%, la moyenne était de 24%, le pire était de 134%.
| Éteint/en veille | |
| Au repos | |
| Fortement sollicité |
|
Légende:
min: | |
| Lenovo ThinkPad P1-20MD002LUS E-2176M, Quadro P2000 Max-Q, Samsung SSD PM981 MZVLB2T0HMLB, IPS, 3840x2160, 15.6" | Lenovo ThinkPad X1 Extreme-20MF000XGE i7-8750H, GeForce GTX 1050 Ti Max-Q, Samsung SSD PM981 MZVLB1T0HALR, IPS, 3840x2160, 15.6" | Dell Precision 5530 Xeon E-2176M E-2176M, Quadro P2000, SK hynix PC400 512 GB, IGZO, 3840x2160, 15.6" | HP EliteBook 1050 G1-4QY20EA i7-8750H, GeForce GTX 1050 Max-Q, Toshiba XG5-P KXG50PNV2T04, IPS LED, 3840x2160, 15.6" | Apple MacBook Pro 15 2018 (2.6 GHz, 560X) i7-8850H, Radeon Pro 560X, Apple SSD AP0512, IPS, 2880x1800, 15.4" | |
|---|---|---|---|---|---|
| Power Consumption | -11% | -18% | 5% | 17% | |
| Idle Minimum * (Watt) | 7.1 | 7.6 -7% | 9.8 -38% | 6.1 14% | 3.4 52% |
| Idle Average * (Watt) | 14.4 | 14.8 -3% | 16.8 -17% | 10.2 29% | 11 24% |
| Idle Maximum * (Watt) | 14.6 | 17.6 -21% | 16.9 -16% | 13.4 8% | 14.9 -2% |
| Load Average * (Watt) | 93.9 | 86 8% | 102.3 -9% | 82 13% | 78.9 16% |
| Witcher 3 ultra * (Watt) | 77.9 | 85 -9% | 76.5 2% | ||
| Load Maximum * (Watt) | 88.3 | 118.9 -35% | 114.5 -30% | 122 -38% | 91.2 -3% |
* ... Moindre est la valeur, meilleures sont les performances
| Lenovo ThinkPad P1-20MD002LUS E-2176M, Quadro P2000 Max-Q, 80 Wh | Lenovo ThinkPad X1 Extreme-20MF000XGE i7-8750H, GeForce GTX 1050 Ti Max-Q, 80 Wh | Dell Precision 5530 Xeon E-2176M E-2176M, Quadro P2000, 97 Wh | HP EliteBook 1050 G1-4QY20EA i7-8750H, GeForce GTX 1050 Max-Q, 96 Wh | Lenovo ThinkPad X1 Carbon 2018-20KGS03900 i5-8550U, UHD Graphics 620, 57 Wh | Apple MacBook Pro 15 2018 (2.6 GHz, 560X) i7-8850H, Radeon Pro 560X, 83 Wh | |
|---|---|---|---|---|---|---|
| Autonomie de la batterie | 21% | 58% | 64% | 64% | 92% | |
| WiFi v1.3 (h) | 5.3 | 6.4 21% | 8.4 58% | 8.7 64% | 8.7 64% | 10.2 92% |
| Reader / Idle (h) | 11.5 | 16.5 | 17.1 | 22.1 | ||
| Witcher 3 ultra (h) | 1.1 | 1.5 | ||||
| Load (h) | 2 | 1.8 | 2.1 | 1.8 |
Points positifs
Points négatifs
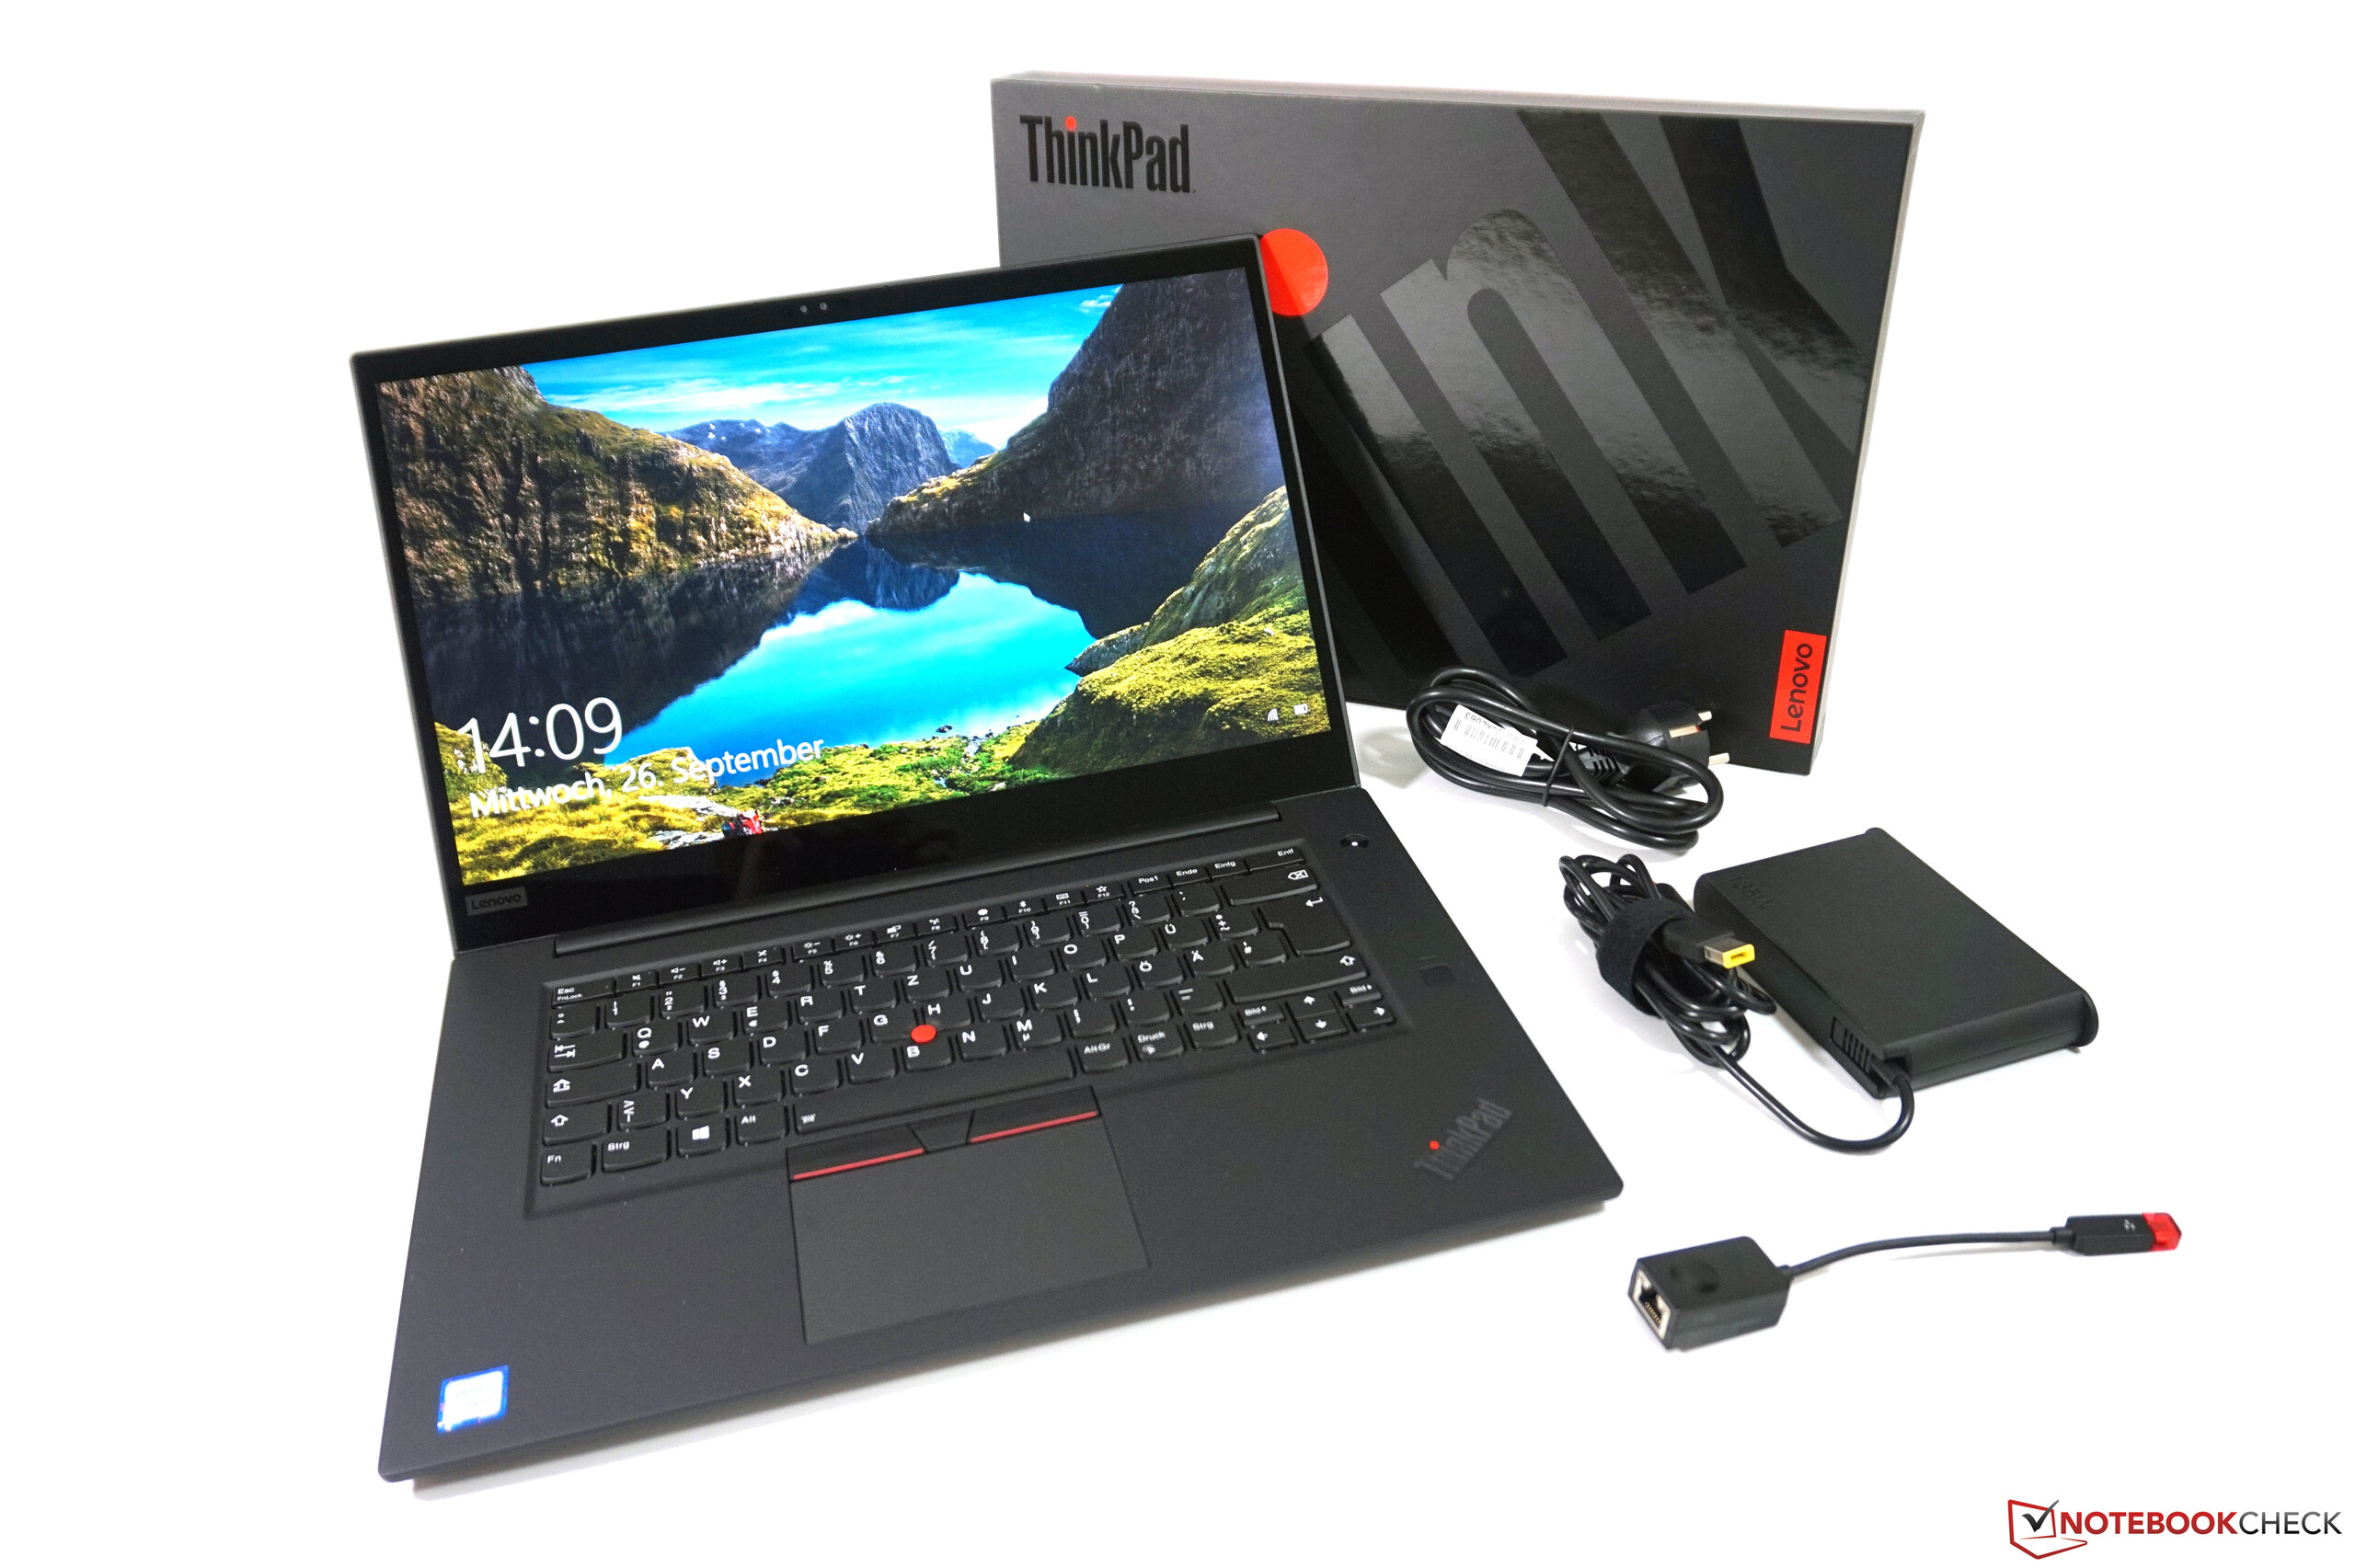
En parallèle de la popularité croissante des portables de jeu légers, les stations de travail fines et légères (dans la veine du Precision 5530 de Dell) se sont également taillées une place sur le marché, et le ThinkPad P1 de Lenovo est une belle addition à ce segment en cours de développement.
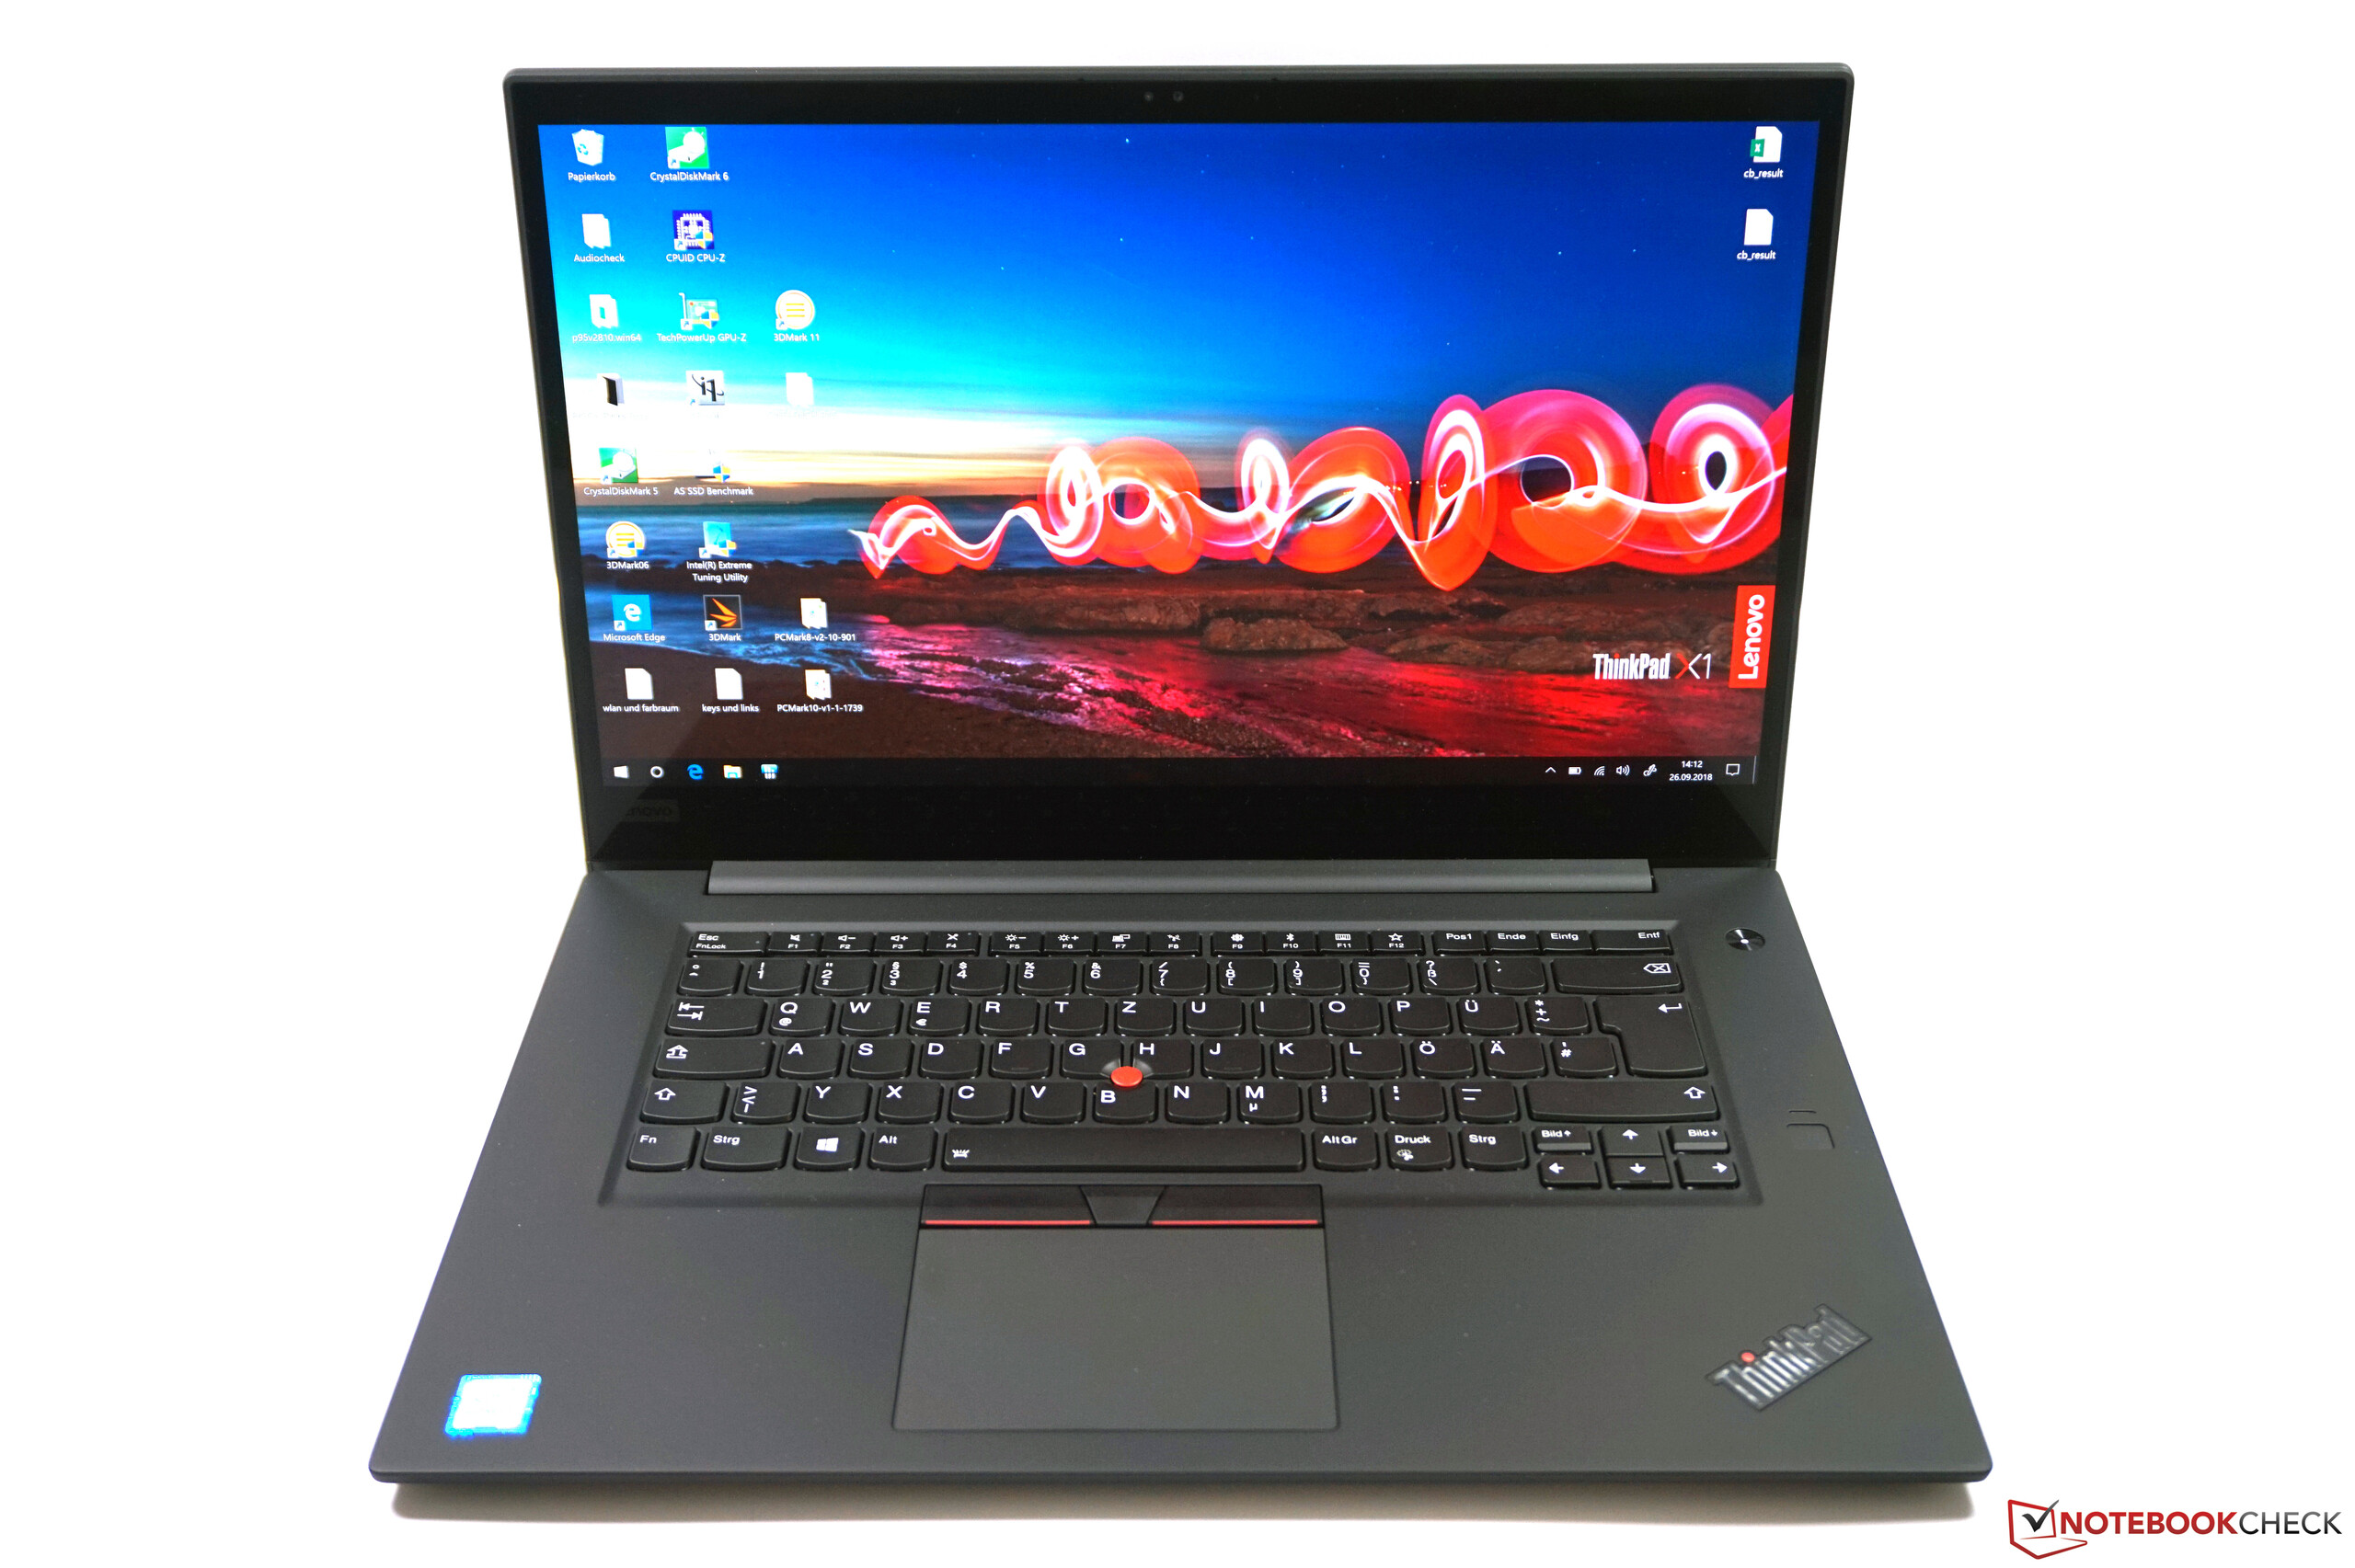
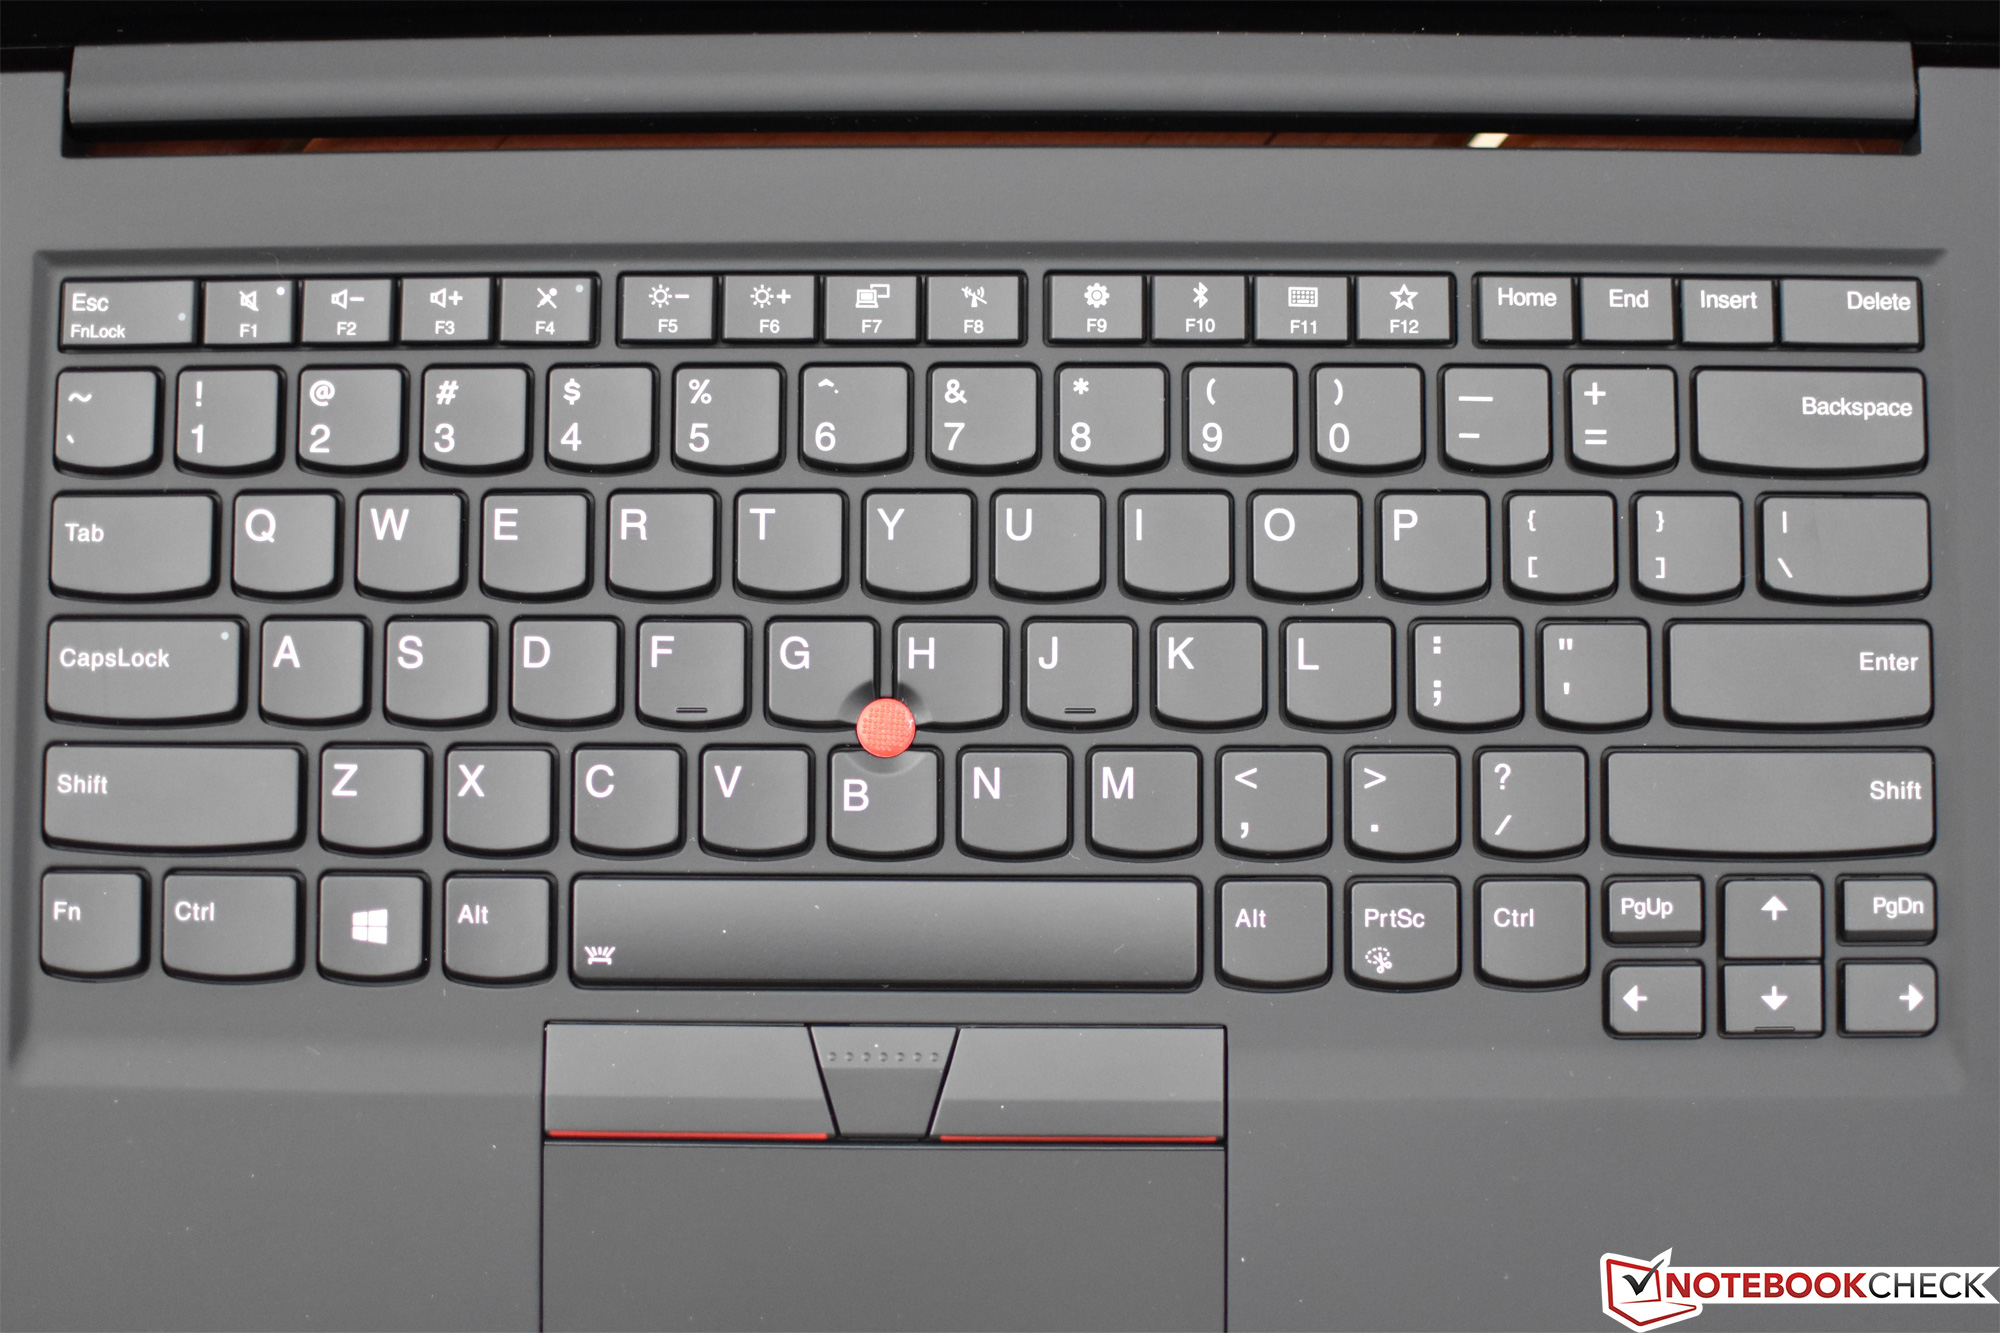
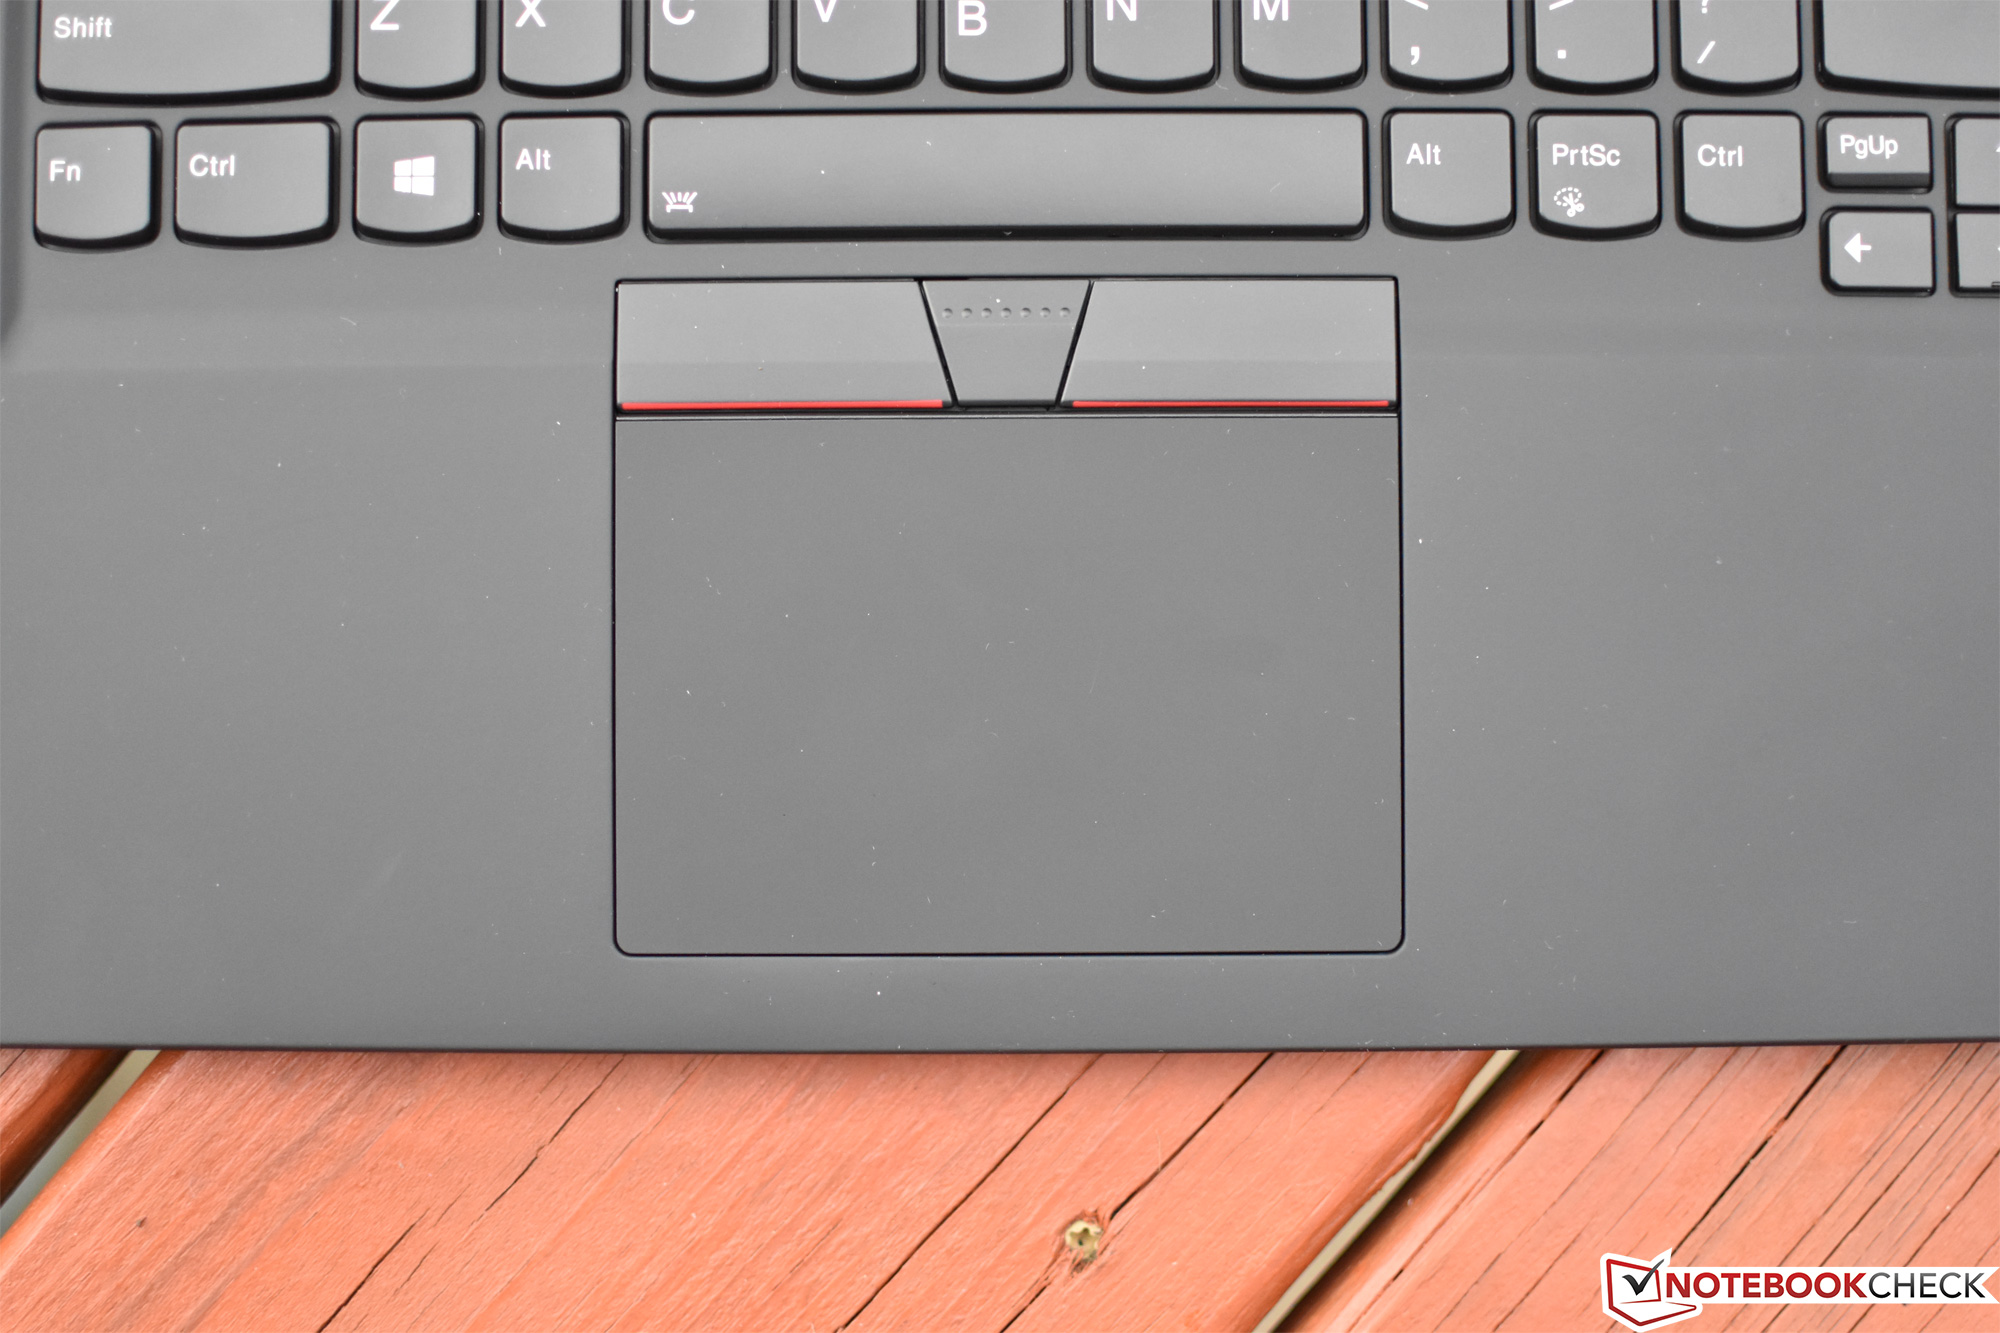
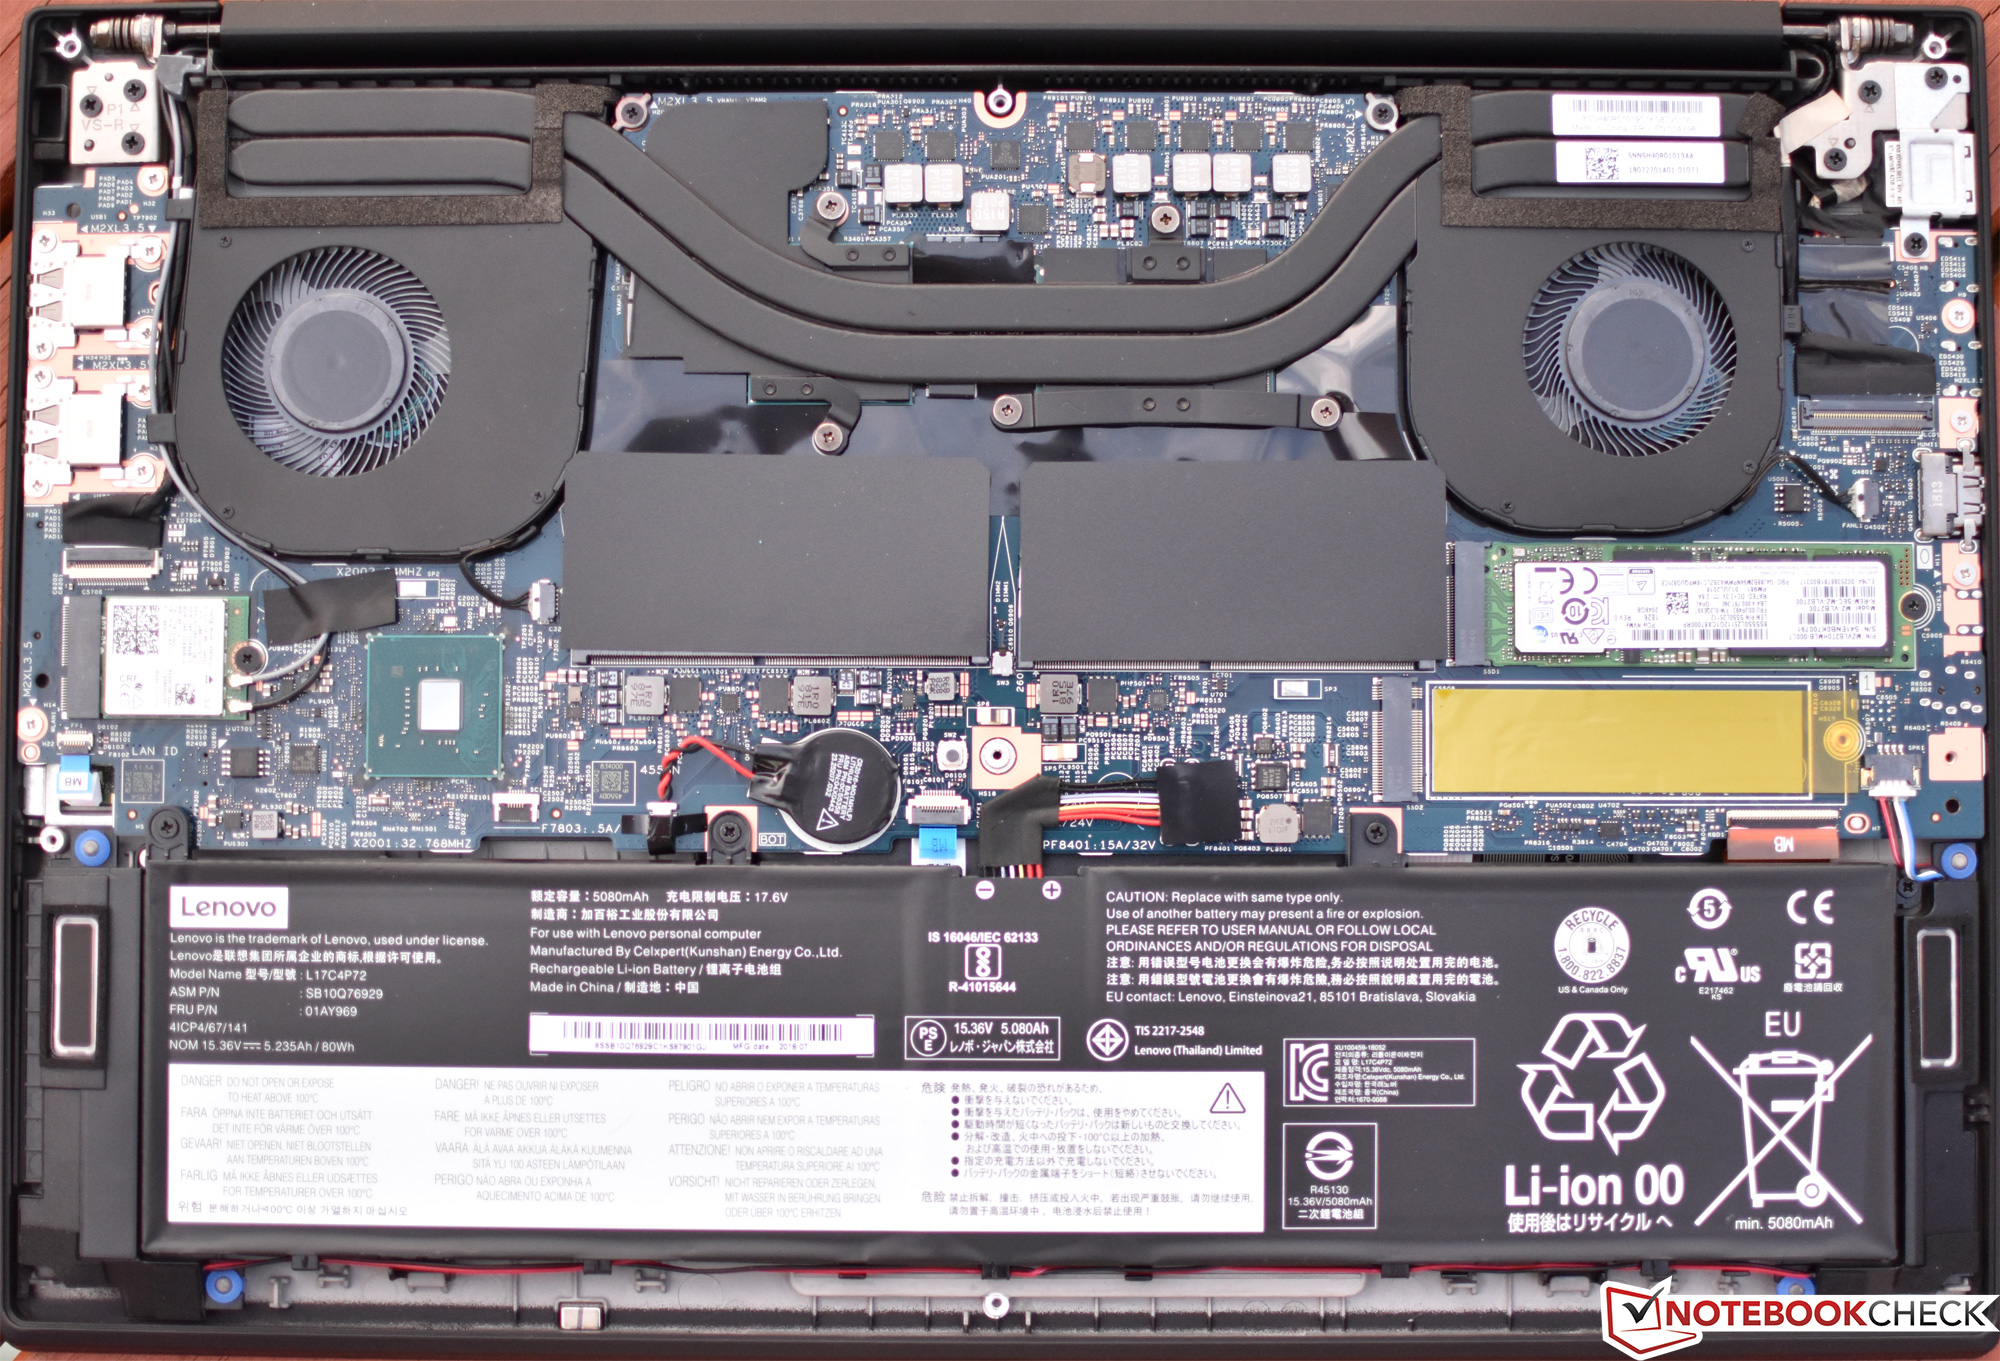
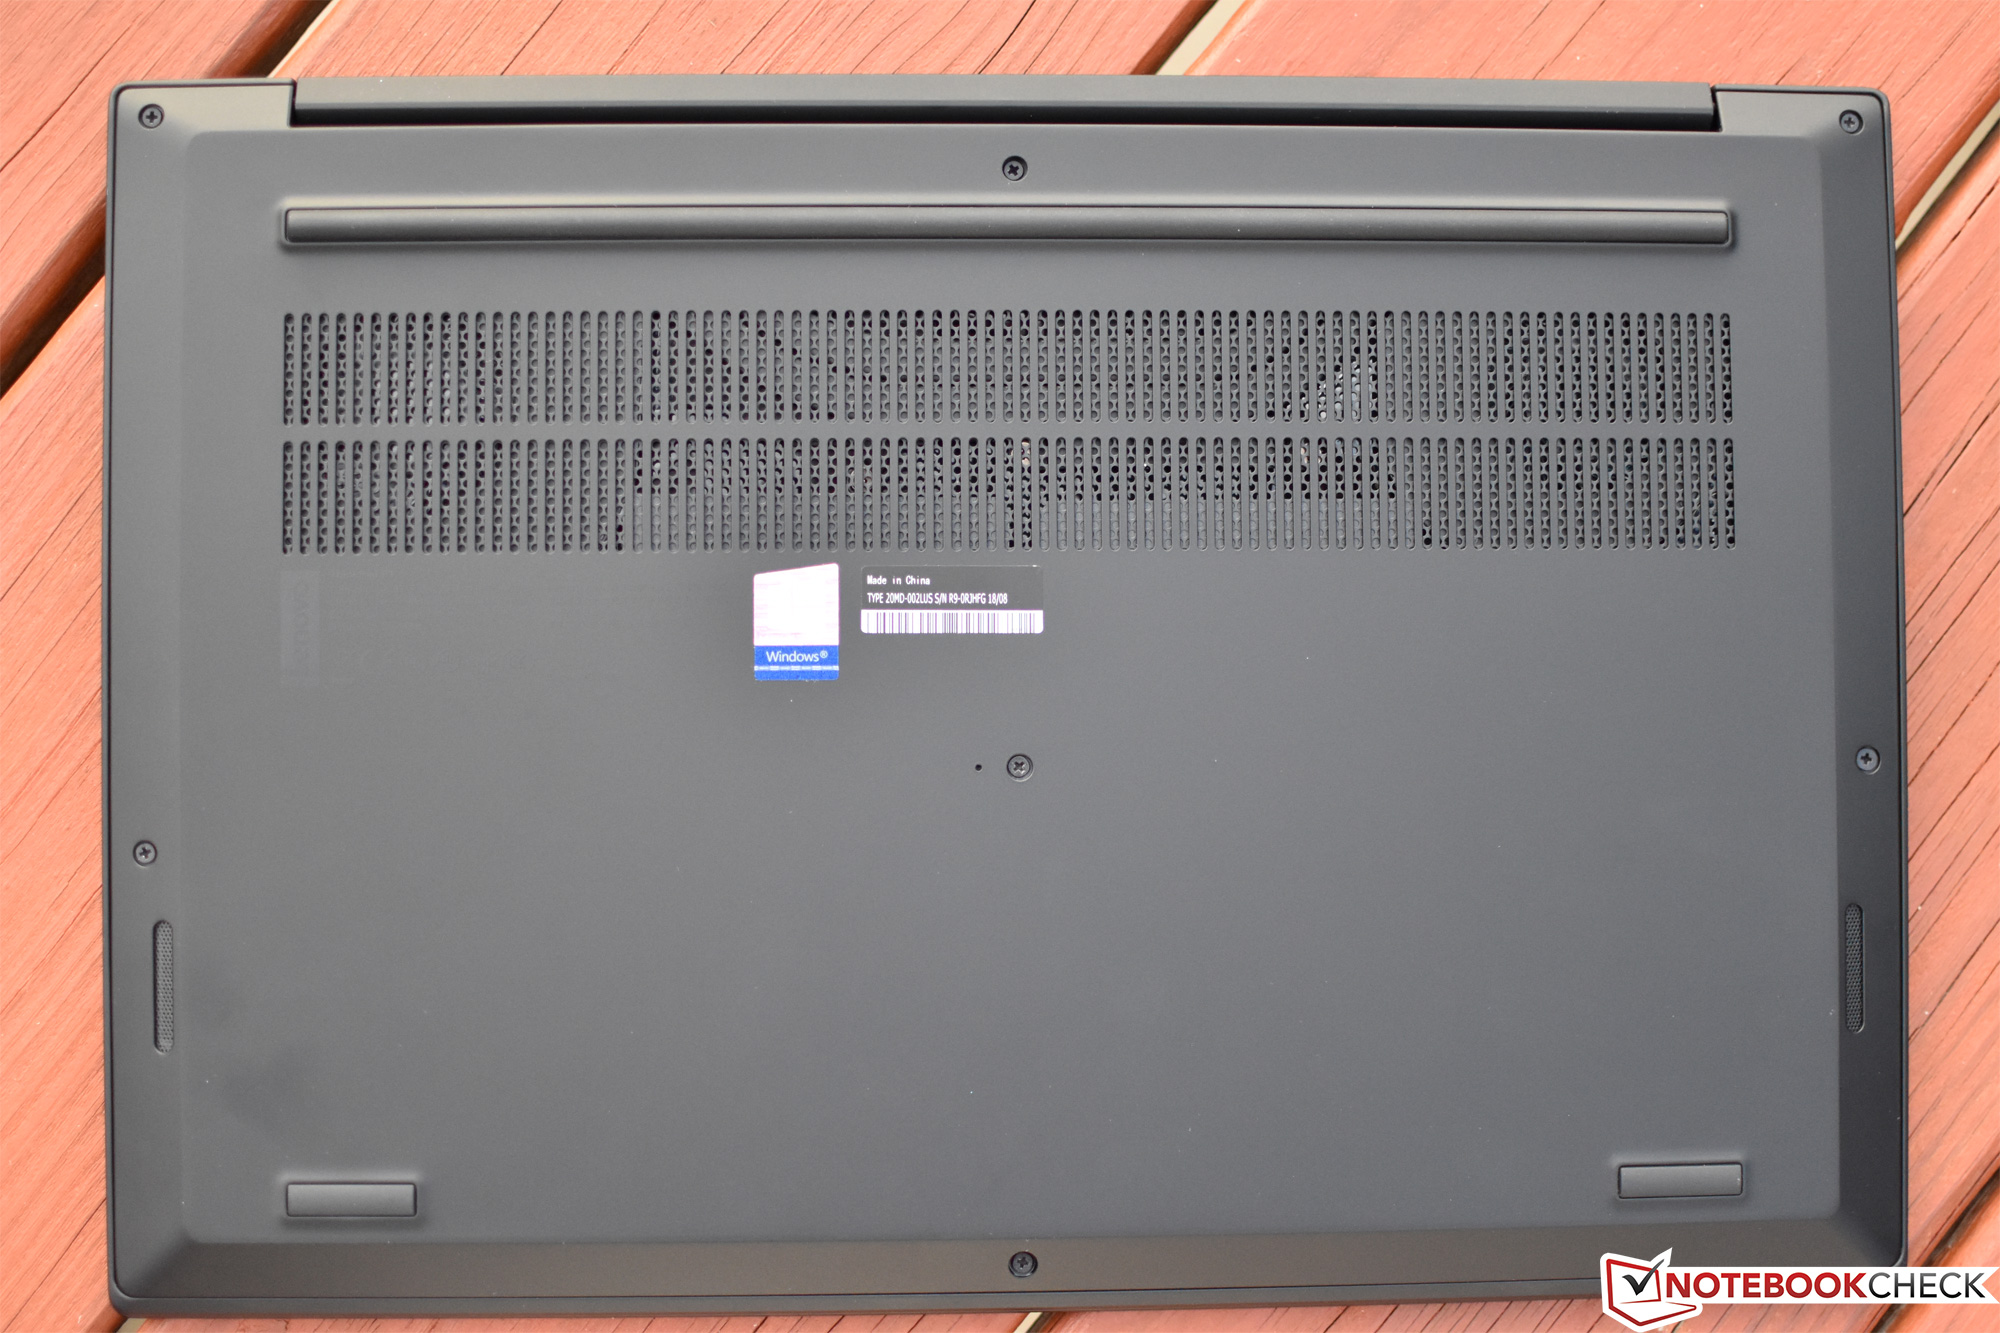
Vu que les deux machines ont un design identique, le ThinkPad P1 ne diffère pas vraiment du X1 Extreme testé il y a quelques semaines. Nous sommes toujours impressionnés par son châssis rigide, de grande qualité et élégant, son écran IPS aux belles couleurs, ses solides performances CPU et GPU, son système de refroidissement discret mais efficace, et ses périphériques d’entrée du meilleur niveau. Nous apprécions également la simplicité de maintenance et de mise à jour, avec une coque inférieure facile à enlever, et avec nombre de possibilités pour le faire évoluer (jusqu’à 64 Go de mémoire vive double canal, deux emplacements M.2 PCIe x4).
Le X1 Extreme était déjà une machine grand public de premier ordre, et sa conception s’adapte parfaitement aux caractéristiques d’une station de travail ultraportable.
Bien sûr, des compromis ont dû être faits, puisqu’il s’agit de baisser de 30 à 50 % la taille et le poids d’une station de travail classique. Le ThinkPad P1 est performant avec la plupart des sollicitations, mais de gros stress tests combinés sont un petit rappel des limites d’un tel concept. Avec une carte graphique Max-Q de Nvidia aux commandes, la température et la consommation ne dérapent jamais, mais les performances GPU chutent (et les performances CPU sont notablement réduites) avec les sollicitations les plus extrêmes. La station de travail gère néanmoins efficacement la plupart des besoins de modélisation et de design, même si elle est en retrait par rapport à des appareils classiques équipés d’un GPU P2000 (comme le Precision 5530).
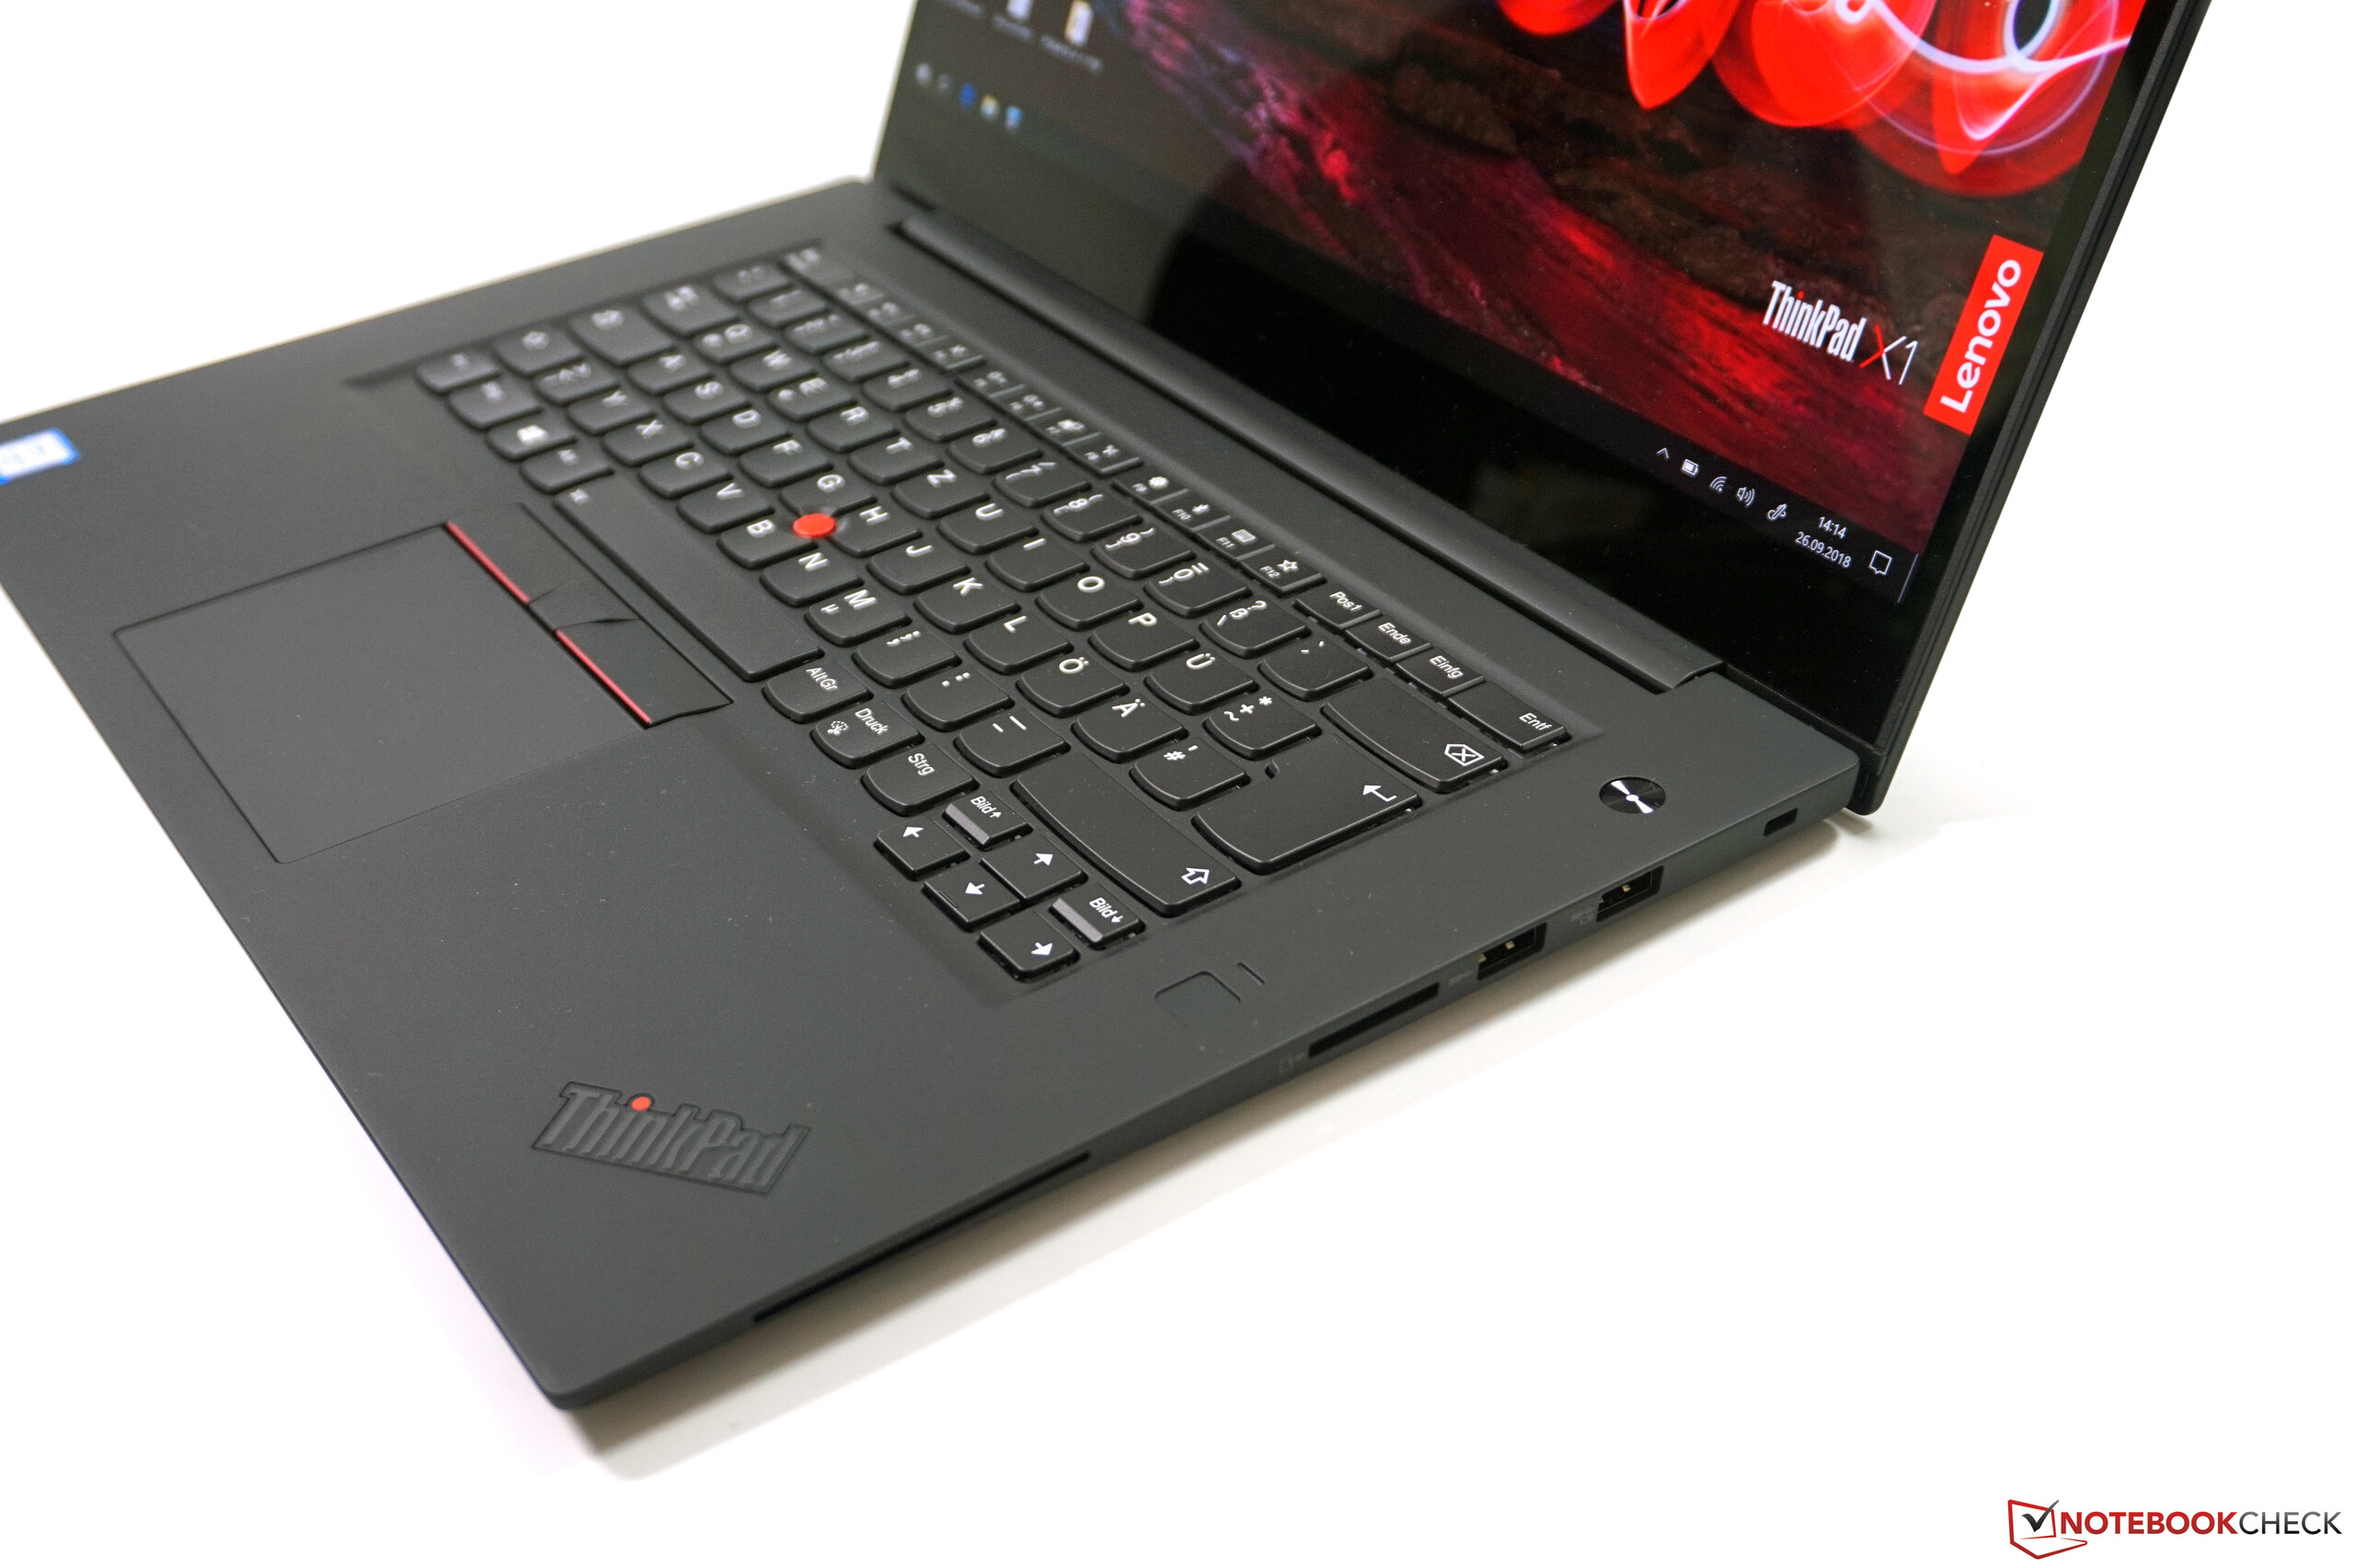
La plupart de nos chicaneries à l'encontre du X1 Extreme s’appliquent toujours au ThinkPad P1. La pression à l’arrière de l’écran produit toujours un craquement audible, et le ventilateur a toujours tendance à se lancer de façon aléatoire au ralenti. L’autonomie est en retrait par rapport aux leaders du secteur. Et l’absence de version avec écran anti-reflets ne facilite pas l’utilisation dans des environnements lumineux.
Le prix de 4 220 $ de ce modèle réussi - avec son SSD énorme de 2 To - pique les yeux. L’on trouvera des appareils légèrement plus abordables avec des performances comparables avec le X1 Extreme, le Precision 5530, l’EliteBook 1050 G1, ou même le XPS 15 9570. Mais il n’y a rien de vraiment raté avec le P1, et toutes ses qualités sont autant d’arguments justifiant son prix dans l’univers compétitif des appareils professionnels.
L’intégralité de cette critique est disponible en anglais en suivant ce lien.
Lenovo ThinkPad P1-20MD002LUS
- 10/11/2018 v6 (old)
Steve Schardein
Price comparison
