Courte critique du PC portable Microsoft Surface Laptop (i5-7200U)

| Networking | |
| iperf3 transmit AX12 | |
| Microsoft Surface Book with Performance Base | |
| Dell XPS 13 9360 FHD i5 | |
| Microsoft Surface Laptop i5 | |
| iperf3 receive AX12 | |
| Microsoft Surface Laptop i5 | |
| Dell XPS 13 9360 FHD i5 | |
| Microsoft Surface Book with Performance Base | |
| |||||||||||||||||||||||||
Homogénéité de la luminosité: 90 %
Valeur mesurée au centre, sur batterie: 384.1 cd/m²
Contraste: 1067:1 (Valeurs des noirs: 0.36 cd/m²)
ΔE ColorChecker Calman: 1.8 | ∀{0.5-29.43 Ø4.71}
ΔE Greyscale Calman: 1.2 | ∀{0.09-98 Ø4.96}
94.2% sRGB (Argyll 1.6.3 3D)
63.7% AdobeRGB 1998 (Argyll 1.6.3 3D)
69.5% AdobeRGB 1998 (Argyll 3D)
94.3% sRGB (Argyll 3D)
67.8% Display P3 (Argyll 3D)
Gamma: 2.21
CCT: 6708 K
| Microsoft Surface Laptop i5 ID: MEI96A2, Name: Panasonic VVX14T092N00, IPS, 13.5", 2256x1504 | Microsoft Surface Book with Performance Base Panasonic MEI96A2, IPS, 13.5", 3000x2000 | Microsoft Surface Pro 4, Core i5, 128GB Samsung 123YL01-001 ID: SDC3853, IPS, 12.3", 2736x1824 | Apple MacBook Pro 13 2016 (2.9 GHz) APPA033, , 13.3", 2560x1600 | Dell XPS 13 9360 FHD i5 Sharp SHP1449 LQ133M1, IPS, 13.3", 1920x1080 | |
|---|---|---|---|---|---|
| Display | -1% | -2% | 26% | -26% | |
| Display P3 Coverage (%) | 67.8 | 66.4 -2% | 65 -4% | 99.2 46% | 48.94 -28% |
| sRGB Coverage (%) | 94.3 | 95.4 1% | 96.5 2% | 99.9 6% | 73.3 -22% |
| AdobeRGB 1998 Coverage (%) | 69.5 | 67.6 -3% | 67 -4% | 87.6 26% | 50.5 -27% |
| Response Times | -10% | 13% | -18% | 23% | |
| Response Time Grey 50% / Grey 80% * (ms) | 50.8 ? | 61 ? -20% | 46 ? 9% | 47.2 ? 7% | 32.8 ? 35% |
| Response Time Black / White * (ms) | 37.2 ? | 37 ? 1% | 31.2 ? 16% | 53 ? -42% | 33.2 ? 11% |
| PWM Frequency (Hz) | 50 ? | ||||
| Screen | -8% | -32% | 6% | -84% | |
| Brightness middle (cd/m²) | 384.2 | 459 19% | 413 7% | 569 48% | 351.2 -9% |
| Brightness (cd/m²) | 378 | 423 12% | 396 5% | 542 43% | 325 -14% |
| Brightness Distribution (%) | 90 | 86 -4% | 87 -3% | 90 0% | 89 -1% |
| Black Level * (cd/m²) | 0.36 | 0.37 -3% | 0.36 -0% | 0.56 -56% | 0.195 46% |
| Contrast (:1) | 1067 | 1241 16% | 1147 7% | 1016 -5% | 1801 69% |
| Colorchecker dE 2000 * | 1.8 | 2.28 -27% | 3.09 -72% | 1.4 22% | 7.4 -311% |
| Colorchecker dE 2000 max. * | 4.2 | 3.61 14% | 2.9 31% | 9.08 -116% | |
| Greyscale dE 2000 * | 1.2 | 2.48 -107% | 3.92 -227% | 1.8 -50% | 6.71 -459% |
| Gamma | 2.21 100% | 2.5 88% | 2.3 96% | 2.16 102% | 2.74 80% |
| CCT | 6708 97% | 8602 76% | 7333 89% | 6877 95% | 7222 90% |
| Color Space (Percent of AdobeRGB 1998) (%) | 63.7 | 62 -3% | 61 -4% | 78.4 23% | 50.48 -21% |
| Color Space (Percent of sRGB) (%) | 94.2 | 96 2% | 97 3% | 99.3 5% | 73.31 -22% |
| Moyenne finale (programmes/paramètres) | -6% /
-7% | -7% /
-19% | 5% /
7% | -29% /
-58% |
* ... Moindre est la valeur, meilleures sont les performances
Temps de réponse de l'écran
| ↔ Temps de réponse noir à blanc | ||
|---|---|---|
| 37.2 ms ... hausse ↗ et chute ↘ combinées | ↗ 20 ms hausse | 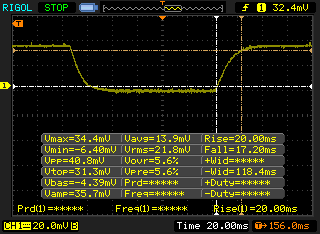 |
| ↘ 17.2 ms chute | ||
| L'écran souffre de latences très élevées, à éviter pour le jeu. En comparaison, tous les appareils testés affichent entre 0.1 (minimum) et 240 (maximum) ms. » 95 % des appareils testés affichent de meilleures performances. Cela signifie que les latences relevées sont moins bonnes que la moyenne (19.8 ms) de tous les appareils testés. | ||
| ↔ Temps de réponse gris 50% à gris 80% | ||
| 50.8 ms ... hausse ↗ et chute ↘ combinées | ↗ 25.6 ms hausse | 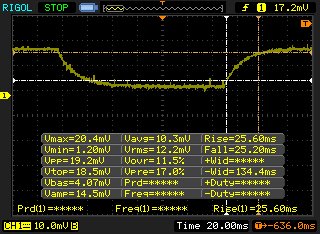 |
| ↘ 25.2 ms chute | ||
| L'écran souffre de latences très élevées, à éviter pour le jeu. En comparaison, tous les appareils testés affichent entre 0.165 (minimum) et 636 (maximum) ms. » 87 % des appareils testés affichent de meilleures performances. Cela signifie que les latences relevées sont moins bonnes que la moyenne (30.9 ms) de tous les appareils testés. | ||
Scintillement / MLI (Modulation de largeur d'impulsion)
| Scintillement / MLI (Modulation de largeur d'impulsion) non décelé | 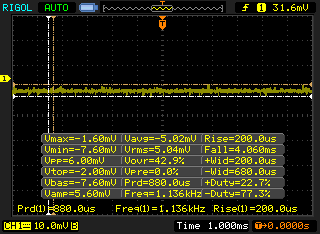 | ||
En comparaison, 52 % des appareils testés n'emploient pas MDI pour assombrir leur écran. Nous avons relevé une moyenne à 7744 (minimum : 5 - maximum : 343500) Hz dans le cas où une MDI était active. | |||
| wPrime 2.10 - 1024m | |
| Microsoft Surface Pro 4, Core m3 | |
| Lenovo Thinkpad 13-20J1001BUS | |
| Apple MacBook Pro 13 2016 | |
| Dell Latitude 5280 | |
| Microsoft Surface Laptop i5 | |
| Samsung Notebook 9 NP900X5N-X01US | |
* ... Moindre est la valeur, meilleures sont les performances
| PCMark 8 | |
| Home Score Accelerated v2 | |
| Apple MacBook Pro 13 2016 | |
| Microsoft Surface Laptop i5 | |
| Microsoft Surface Book with Performance Base | |
| Work Score Accelerated v2 | |
| Microsoft Surface Laptop i5 | |
| Microsoft Surface Book with Performance Base | |
| Apple MacBook Pro 13 2016 | |
| Creative Score Accelerated v2 | |
| Apple MacBook Pro 13 2016 | |
| Microsoft Surface Book with Performance Base | |
| Microsoft Surface Laptop i5 | |
| PCMark 8 Home Score Accelerated v2 | 3071 points | |
| PCMark 8 Creative Score Accelerated v2 | 3962 points | |
| PCMark 8 Work Score Accelerated v2 | 4106 points | |
Aide | ||
| Microsoft Surface Laptop i5 Toshiba THNSN0128GTYA | Microsoft Surface Book with Performance Base Toshiba NVMe THNSN5256GPU7 | Microsoft Surface Pro 4, Core i5, 128GB Samsung MZFLV128 NVMe | Apple MacBook Pro 13 2016 (2.9 GHz) Apple SSD AP0256 | Dell XPS 13 9360 FHD i5 Toshiba NVMe THNSN5256GPUK | |
|---|---|---|---|---|---|
| CrystalDiskMark 3.0 | 328% | 115% | 527% | 294% | |
| Read Seq (MB/s) | 425.6 | 1017 139% | 666 56% | 1662 291% | 1233 190% |
| Write Seq (MB/s) | 128.2 | 861 572% | 154.2 20% | 1336 942% | 733 472% |
| Read 512 (MB/s) | 278.5 | 687 147% | 266.3 -4% | 1183 325% | 1036 272% |
| Write 512 (MB/s) | 126.7 | 698 451% | 154.2 22% | 1481 1069% | 439.9 247% |
| Read 4k (MB/s) | 22.15 | 40.91 85% | 28.51 29% | 16.1 -27% | 29.31 32% |
| Write 4k (MB/s) | 40.45 | 108.6 168% | 101.5 151% | 23.5 -42% | 116.9 189% |
| Read 4k QD32 (MB/s) | 77.8 | 326.9 320% | 368.3 373% | 657 744% | 479.2 516% |
| Write 4k QD32 (MB/s) | 41.18 | 347.1 743% | 153.6 273% | 419 917% | 218.3 430% |

| 3DMark 11 | |
| 1280x720 Performance GPU | |
| Apple MacBook Pro 13 2017 Touchbar i5 | |
| Apple MacBook Pro 13 2016 (2.9 GHz) | |
| HP ProBook 440 G4-Y8B51EA | |
| Dell XPS 13 9360 FHD i7 Iris | |
| Asus VivoBook S15 S510UA | |
| Microsoft Surface Laptop i5 | |
| Acer TravelMate P449-M-7407 | |
| Apple MacBook 12 (Early 2016) 1.1 GHz | |
| Fujitsu Lifebook E544 | |
| 1280x720 Performance Combined | |
| Apple MacBook Pro 13 2016 (2.9 GHz) | |
| Apple MacBook Pro 13 2017 Touchbar i5 | |
| HP ProBook 440 G4-Y8B51EA | |
| Dell XPS 13 9360 FHD i7 Iris | |
| Asus VivoBook S15 S510UA | |
| Acer TravelMate P449-M-7407 | |
| Microsoft Surface Laptop i5 | |
| Apple MacBook 12 (Early 2016) 1.1 GHz | |
| Fujitsu Lifebook E544 | |
| 3DMark | |
| 1280x720 Cloud Gate Standard Graphics | |
| Apple MacBook Pro 13 2016 (2.9 GHz) | |
| Apple MacBook Pro 13 2017 Touchbar i5 | |
| Dell XPS 13 9360 FHD i7 Iris | |
| HP ProBook 440 G4-Y8B51EA | |
| Asus VivoBook S15 S510UA | |
| Acer TravelMate P449-M-7407 | |
| Microsoft Surface Laptop i5 | |
| Apple MacBook 12 (Early 2016) 1.1 GHz | |
| Fujitsu Lifebook E544 | |
| 1920x1080 Fire Strike Graphics | |
| Apple MacBook Pro 13 2017 Touchbar i5 | |
| Apple MacBook Pro 13 2016 (2.9 GHz) | |
| HP ProBook 440 G4-Y8B51EA | |
| Dell XPS 13 9360 FHD i7 Iris | |
| Asus VivoBook S15 S510UA | |
| Acer TravelMate P449-M-7407 | |
| Microsoft Surface Laptop i5 | |
| Apple MacBook 12 (Early 2016) 1.1 GHz | |
| 1920x1080 Ice Storm Extreme Graphics | |
| Asus VivoBook S15 S510UA | |
| Acer TravelMate P449-M-7407 | |
| Microsoft Surface Laptop i5 | |
| 3DMark 11 Performance | 1586 points | |
| 3DMark Ice Storm Standard Score | 48984 points | |
| 3DMark Cloud Gate Standard Score | 5454 points | |
| 3DMark Fire Strike Score | 743 points | |
Aide | ||
| Bas | Moyen | Élevé | Ultra | |
|---|---|---|---|---|
| BioShock Infinite (2013) | 45.8 | 27.4 | 22.7 | 7 |
| Rise of the Tomb Raider (2016) | 18.5 |
Degré de la nuisance sonore
| Au repos |
| 28.2 / 28.2 / 29 dB(A) |
| Fortement sollicité |
| 30.3 / 39.3 dB(A) |
 | ||
30 dB silencieux 40 dB(A) audible 50 dB(A) bruyant |
||
min: | ||
| Microsoft Surface Laptop i5 HD Graphics 620, i5-7200U, Toshiba THNSN0128GTYA | Microsoft Surface Book with Performance Base GeForce GTX 965M, 6600U, Toshiba NVMe THNSN5256GPU7 | Microsoft Surface Pro 4, Core i5, 128GB HD Graphics 520, 6300U, Samsung MZFLV128 NVMe | Apple MacBook Pro 13 2016 (2.9 GHz) Iris Graphics 550, 6267U, Apple SSD AP0256 | Dell XPS 13 9360 FHD i5 HD Graphics 620, i5-7200U, Toshiba NVMe THNSN5256GPUK | |
|---|---|---|---|---|---|
| Noise | -8% | -14% | -4% | 2% | |
| arrêt / environnement * (dB) | 28.2 | 29.4 -4% | 30.2 -7% | ||
| Idle Minimum * (dB) | 28.2 | 29.4 -4% | 31.5 -12% | 30.2 -7% | 28.9 -2% |
| Idle Average * (dB) | 28.2 | 29.4 -4% | 31.5 -12% | 30.2 -7% | 28.9 -2% |
| Idle Maximum * (dB) | 29 | 29.7 -2% | 31.5 -9% | 30.2 -4% | 28.9 -0% |
| Load Average * (dB) | 30.3 | 39 -29% | 40.5 -34% | 33 -9% | 30.9 -2% |
| Load Maximum * (dB) | 39.3 | 40.2 -2% | 40.7 -4% | 36.2 8% | 33.5 15% |
| Witcher 3 ultra * (dB) | 39.5 |
* ... Moindre est la valeur, meilleures sont les performances
(+) La température maximale du côté supérieur est de 36.4 °C / 98 F, par rapport à la moyenne de 35.9 °C / 97 F, allant de 21.4 à 59 °C pour la classe Subnotebook.
(-) Le fond chauffe jusqu'à un maximum de 45.2 °C / 113 F, contre une moyenne de 39.2 °C / 103 F
(+) En utilisation inactive, la température moyenne du côté supérieur est de 26.7 °C / 80 F, par rapport à la moyenne du dispositif de 30.8 °C / 87 F.
(+) Les repose-poignets et le pavé tactile sont plus froids que la température de la peau avec un maximum de 26.4 °C / 79.5 F et sont donc froids au toucher.
(±) La température moyenne de la zone de l'appui-paume de dispositifs similaires était de 28.2 °C / 82.8 F (+1.8 °C / #3.3 F).
Microsoft Surface Laptop i5 analyse audio
(-) | haut-parleurs pas très forts (64.6 dB)
Basses 100 - 315 Hz
(±) | basse réduite - en moyenne 7.1% inférieure à la médiane
(±) | la linéarité des basses est moyenne (11.8% delta à la fréquence précédente)
Médiums 400 - 2000 Hz
(+) | médiane équilibrée - seulement 4.1% de la médiane
(+) | les médiums sont linéaires (5.6% delta à la fréquence précédente)
Aiguës 2 - 16 kHz
(+) | des sommets équilibrés - à seulement 1.2% de la médiane
(+) | les aigus sont linéaires (4.7% delta à la fréquence précédente)
Globalement 100 - 16 000 Hz
(±) | la linéarité du son global est moyenne (15.6% de différence avec la médiane)
Par rapport à la même classe
» 36% de tous les appareils testés de cette catégorie étaient meilleurs, 5% similaires, 58% pires
» Le meilleur avait un delta de 5%, la moyenne était de 18%, le pire était de 53%.
Par rapport à tous les appareils testés
» 24% de tous les appareils testés étaient meilleurs, 5% similaires, 72% pires
» Le meilleur avait un delta de 4%, la moyenne était de 23%, le pire était de 134%.
Apple MacBook 12 (Early 2016) 1.1 GHz analyse audio
(+) | les haut-parleurs peuvent jouer relativement fort (83.6# dB)
Basses 100 - 315 Hz
(±) | basse réduite - en moyenne 11.3% inférieure à la médiane
(±) | la linéarité des basses est moyenne (14.2% delta à la fréquence précédente)
Médiums 400 - 2000 Hz
(+) | médiane équilibrée - seulement 2.4% de la médiane
(+) | les médiums sont linéaires (5.5% delta à la fréquence précédente)
Aiguës 2 - 16 kHz
(+) | des sommets équilibrés - à seulement 2% de la médiane
(+) | les aigus sont linéaires (4.5% delta à la fréquence précédente)
Globalement 100 - 16 000 Hz
(+) | le son global est linéaire (10.2% différence à la médiane)
Par rapport à la même classe
» 7% de tous les appareils testés de cette catégorie étaient meilleurs, 2% similaires, 90% pires
» Le meilleur avait un delta de 5%, la moyenne était de 18%, le pire était de 53%.
Par rapport à tous les appareils testés
» 5% de tous les appareils testés étaient meilleurs, 1% similaires, 94% pires
» Le meilleur avait un delta de 4%, la moyenne était de 23%, le pire était de 134%.
| Éteint/en veille | |
| Au repos | |
| Fortement sollicité |
|
Légende:
min: | |
| Microsoft Surface Laptop i5 i5-7200U, HD Graphics 620, Toshiba THNSN0128GTYA, IPS, 2256x1504, 13.5" | Microsoft Surface Book with Performance Base 6600U, GeForce GTX 965M, Toshiba NVMe THNSN5256GPU7, IPS, 3000x2000, 13.5" | Microsoft Surface Pro 4, Core i5, 128GB 6300U, HD Graphics 520, Samsung MZFLV128 NVMe, IPS, 2736x1824, 12.3" | Apple MacBook Pro 13 2016 (2.9 GHz) 6267U, Iris Graphics 550, Apple SSD AP0256, , 2560x1600, 13.3" | Dell XPS 13 9360 FHD i5 i5-7200U, HD Graphics 620, Toshiba NVMe THNSN5256GPUK, IPS, 1920x1080, 13.3" | |
|---|---|---|---|---|---|
| Power Consumption | -75% | -12% | -34% | 14% | |
| Idle Minimum * (Watt) | 3.2 | 4.15 -30% | 4.4 -38% | 2.1 34% | 4.1 -28% |
| Idle Average * (Watt) | 6.5 | 8 -23% | 9 -38% | 7.6 -17% | 4.2 35% |
| Idle Maximum * (Watt) | 6.8 | 11.9 -75% | 10.7 -57% | 8.2 -21% | 5.1 25% |
| Load Average * (Watt) | 28.2 | 67 -138% | 19.6 30% | 56.4 -100% | 22.1 22% |
| Load Maximum * (Watt) | 36 | 76 -111% | 19.9 45% | 59.8 -66% | 29.4 18% |
| Witcher 3 ultra * (Watt) | 58 |
* ... Moindre est la valeur, meilleures sont les performances
| Microsoft Surface Laptop i5 i5-7200U, HD Graphics 620, 45 Wh | Microsoft Surface Book with Performance Base 6600U, GeForce GTX 965M, 78 Wh | Microsoft Surface Pro 4, Core i5, 128GB 6300U, HD Graphics 520, 38 Wh | Apple MacBook Pro 13 2016 (2.9 GHz) 6267U, Iris Graphics 550, 49.2 Wh | Dell XPS 13 9360 FHD i5 i5-7200U, HD Graphics 620, 60 Wh | Asus Zenbook UX3410UQ-GV077T i7-7500U, GeForce 940MX, 48 Wh | |
|---|---|---|---|---|---|---|
| Autonomie de la batterie | -7% | -24% | -27% | 11% | -15% | |
| Reader / Idle (h) | 22.5 | 25.5 13% | 15 -33% | 21.6 -4% | ||
| WiFi v1.3 (h) | 10 | 9.6 -4% | 7.1 -29% | 9.4 -6% | 11.3 13% | 8.5 -15% |
| Load (h) | 2.1 | 1.5 -29% | 1.9 -10% | 1.1 -48% | 2.6 24% |
Points positifs
Points négatifs
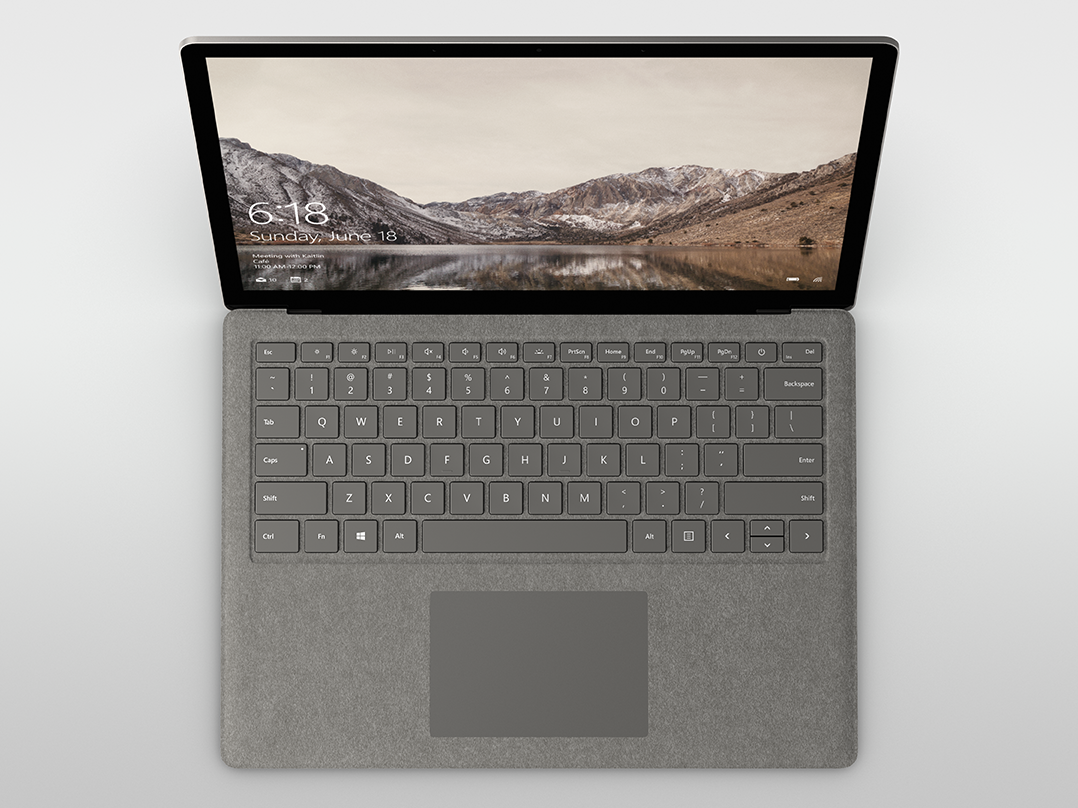
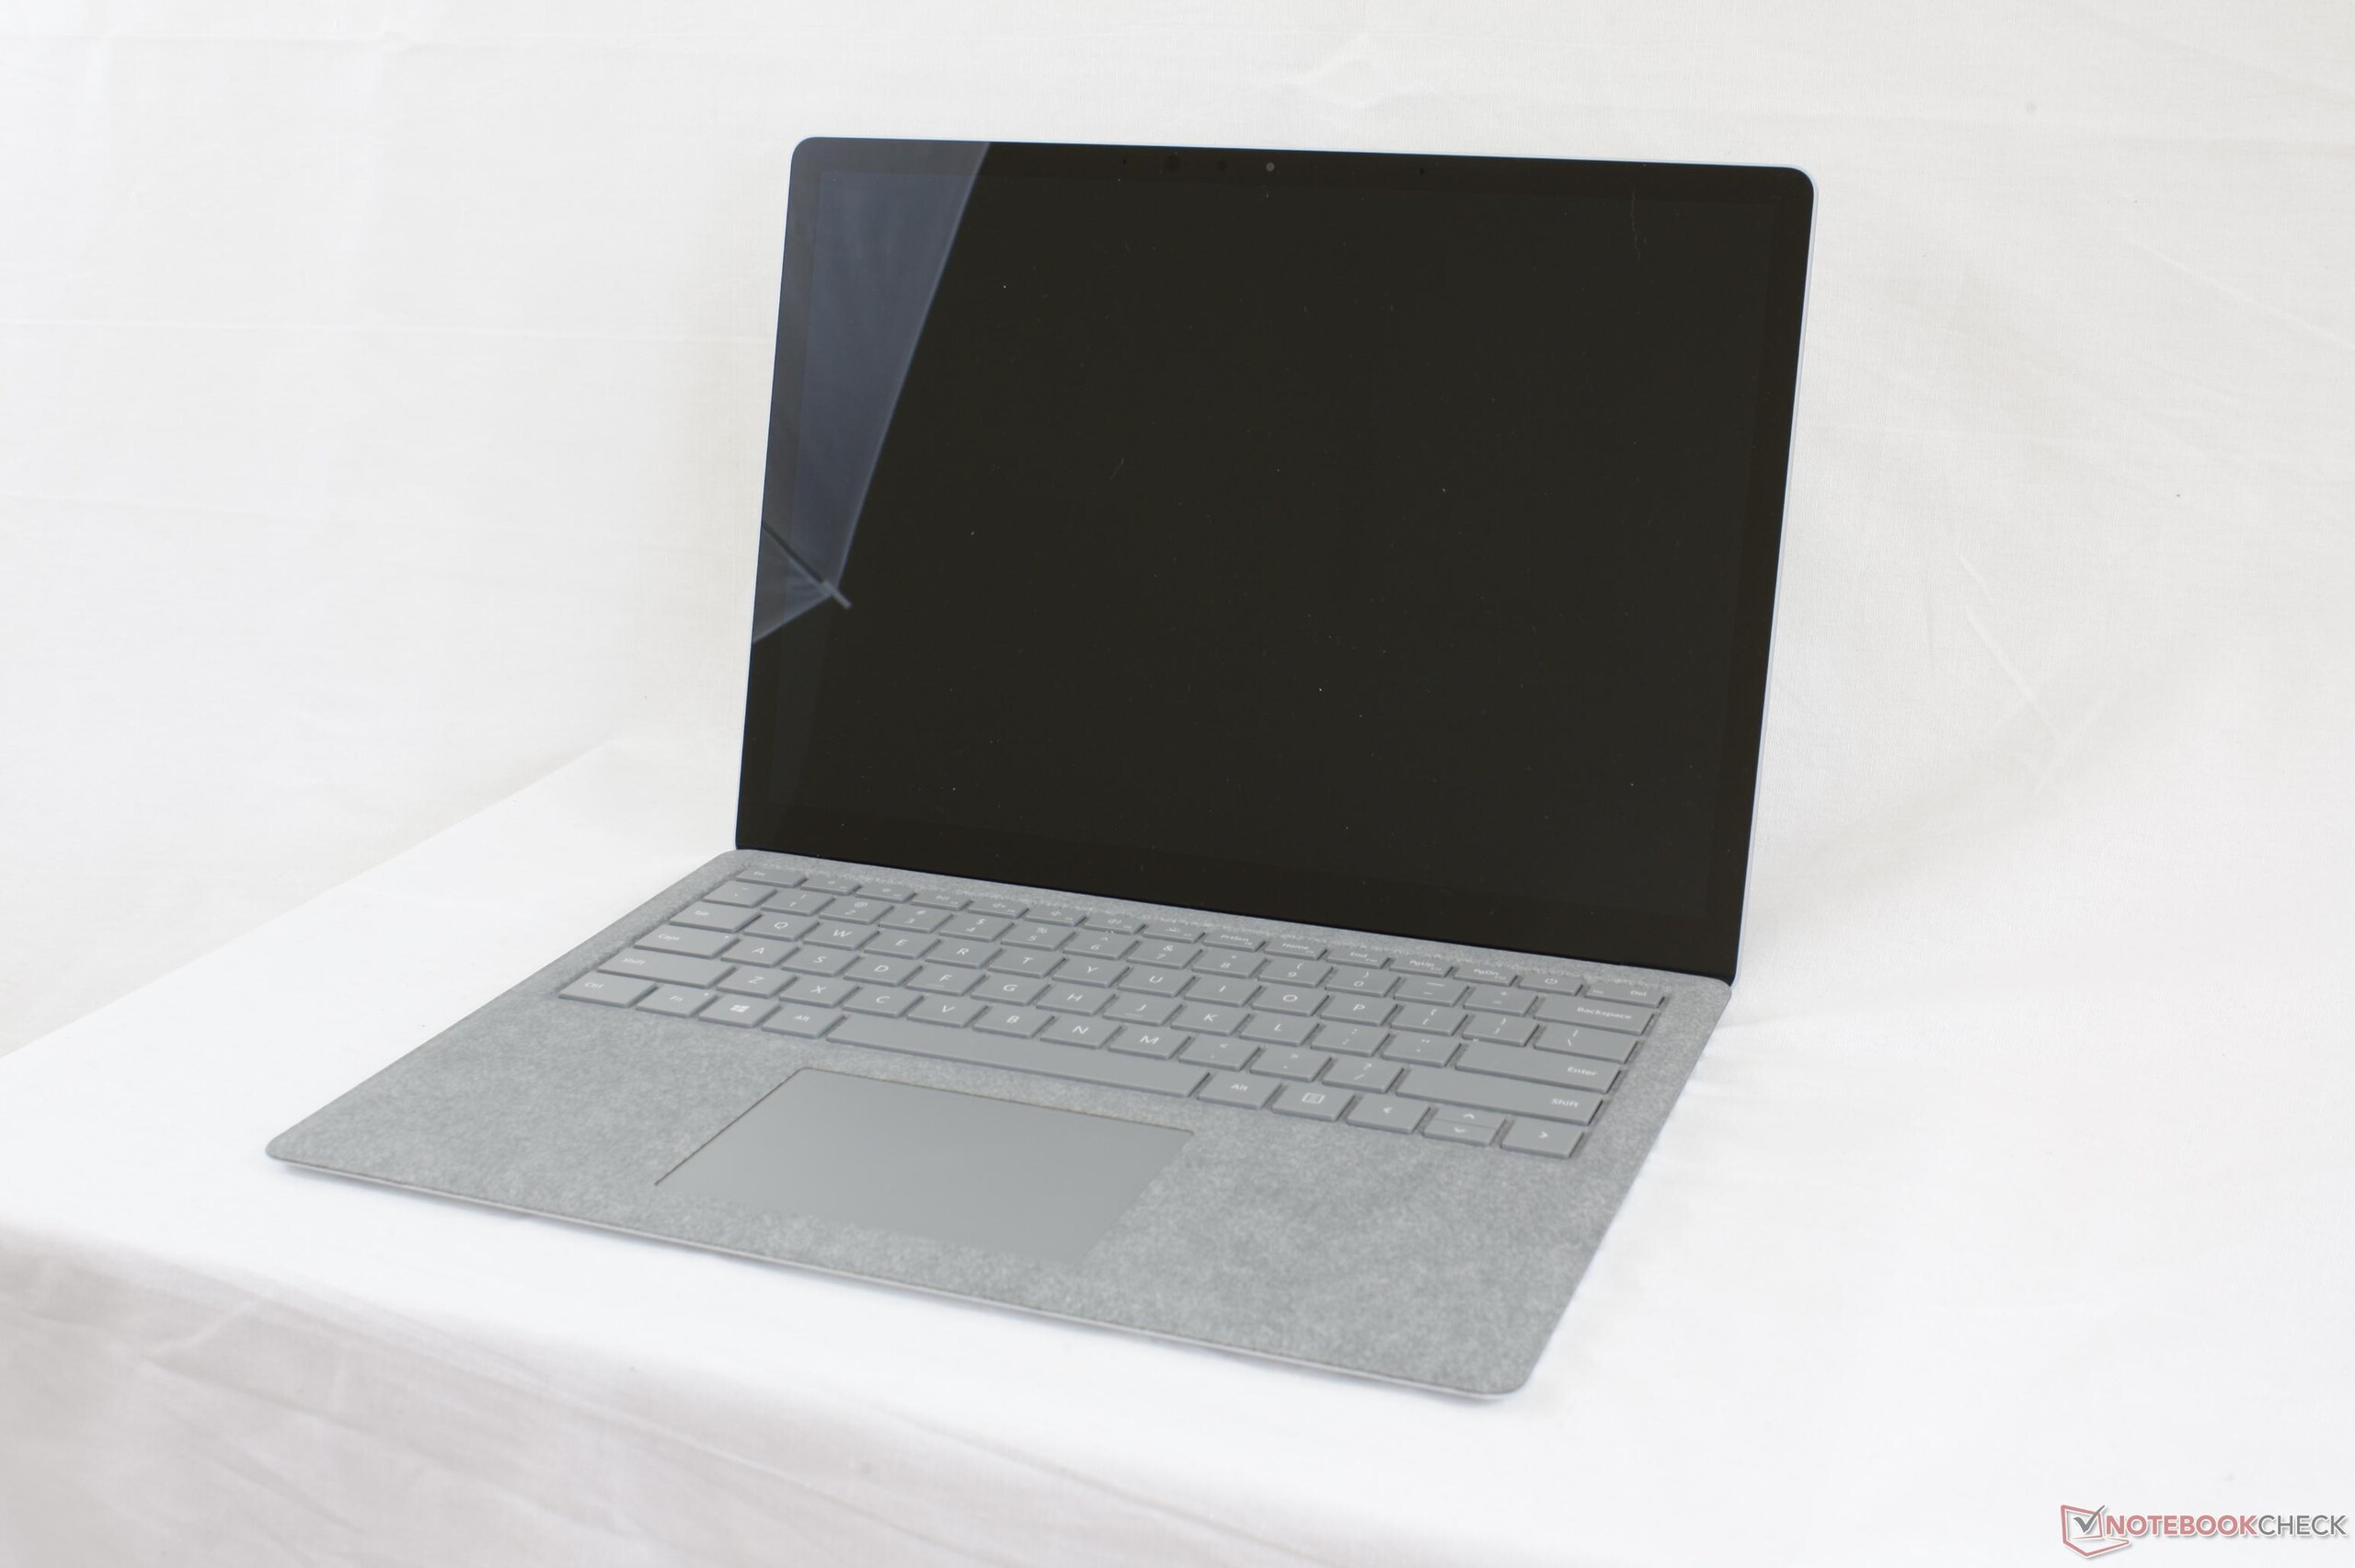
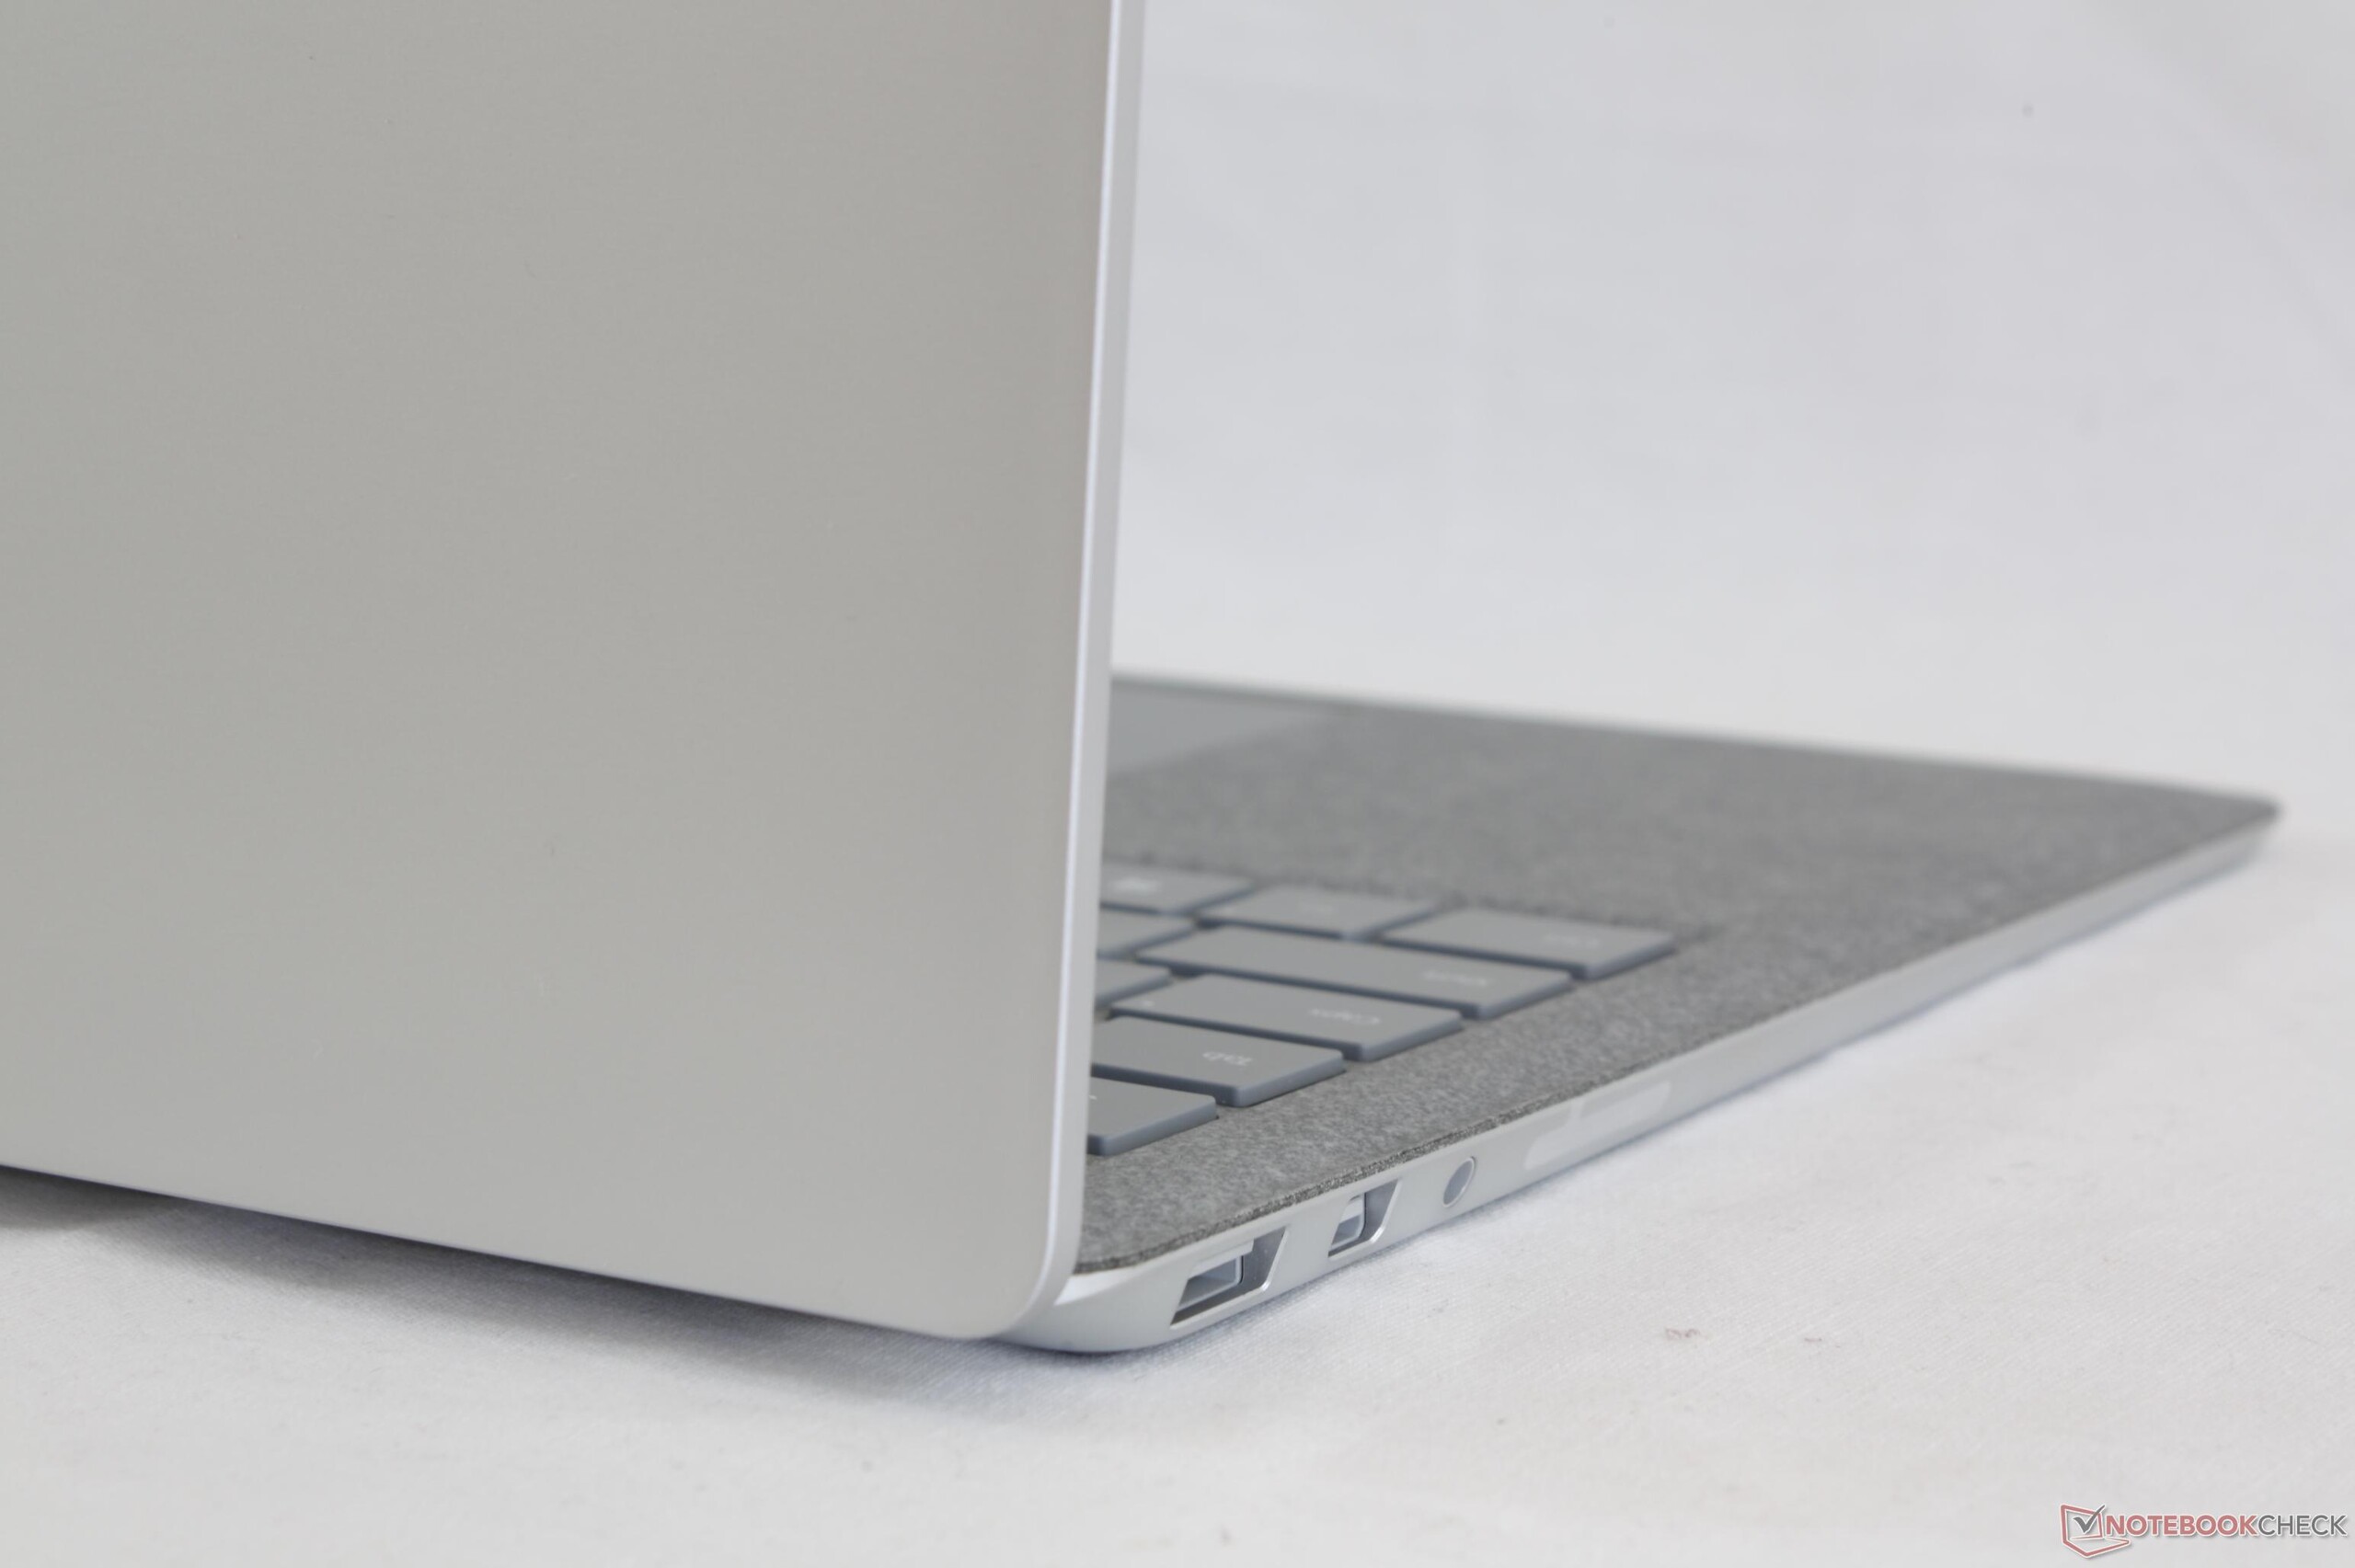
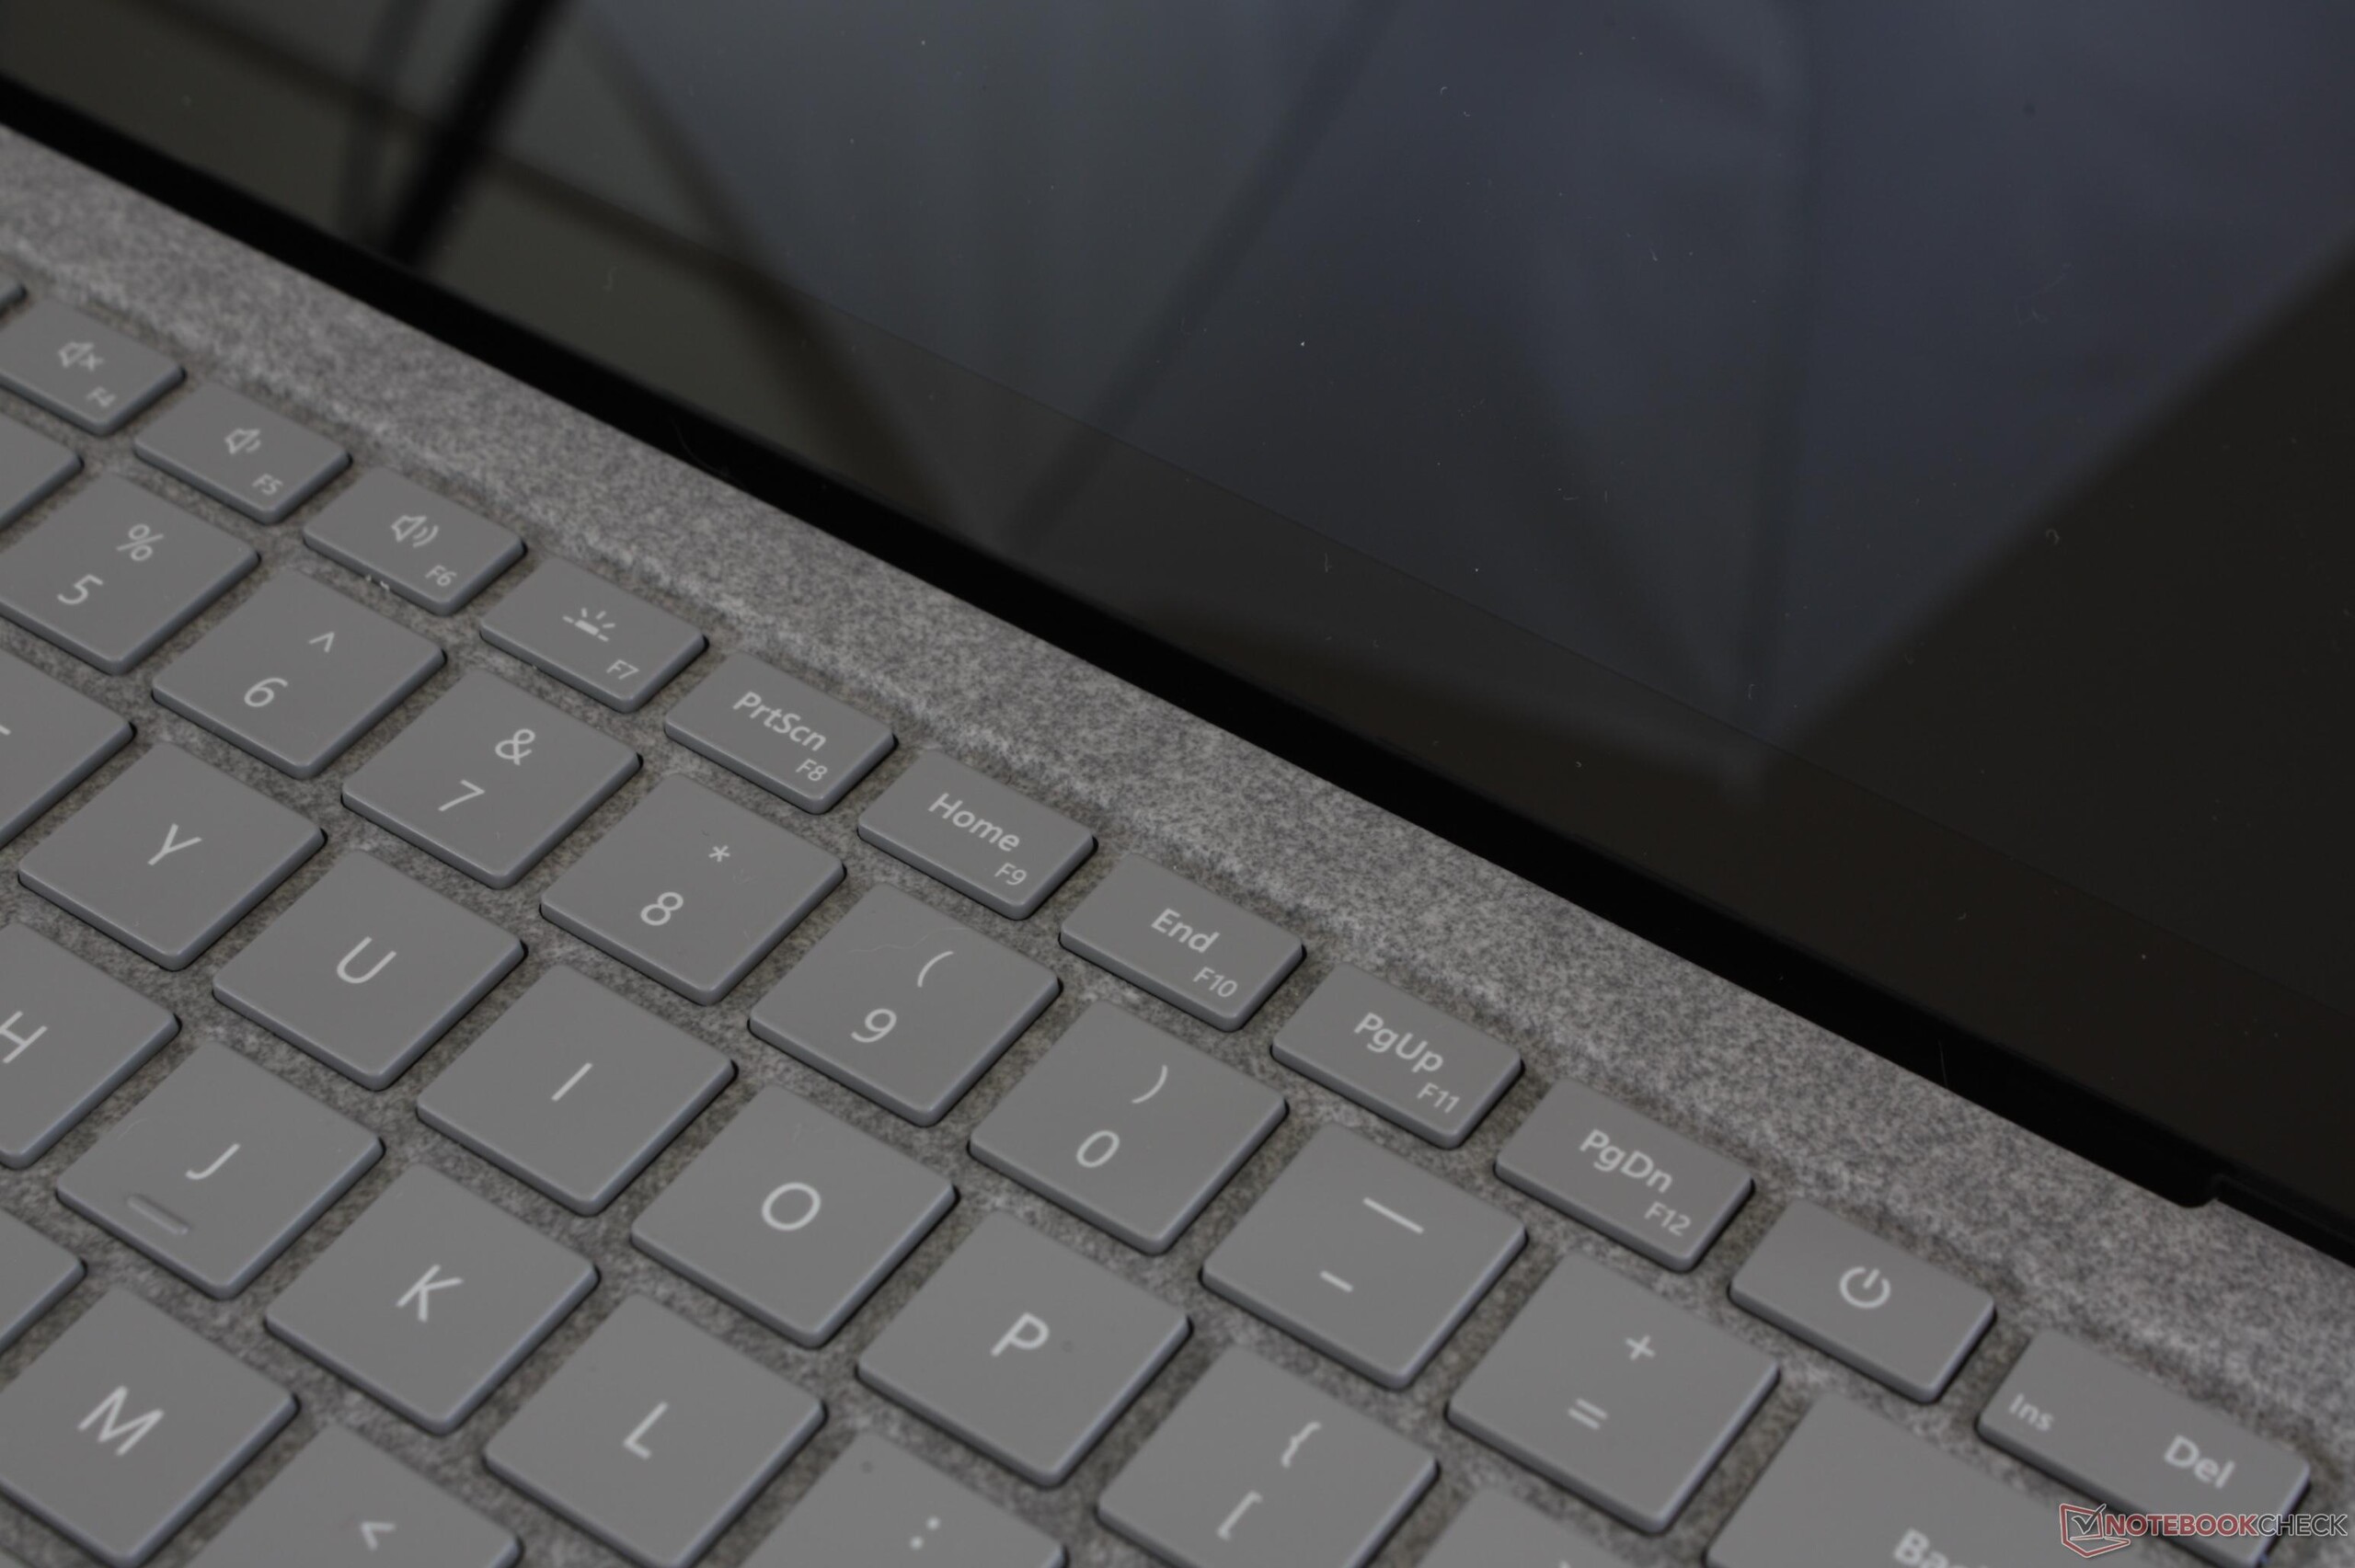
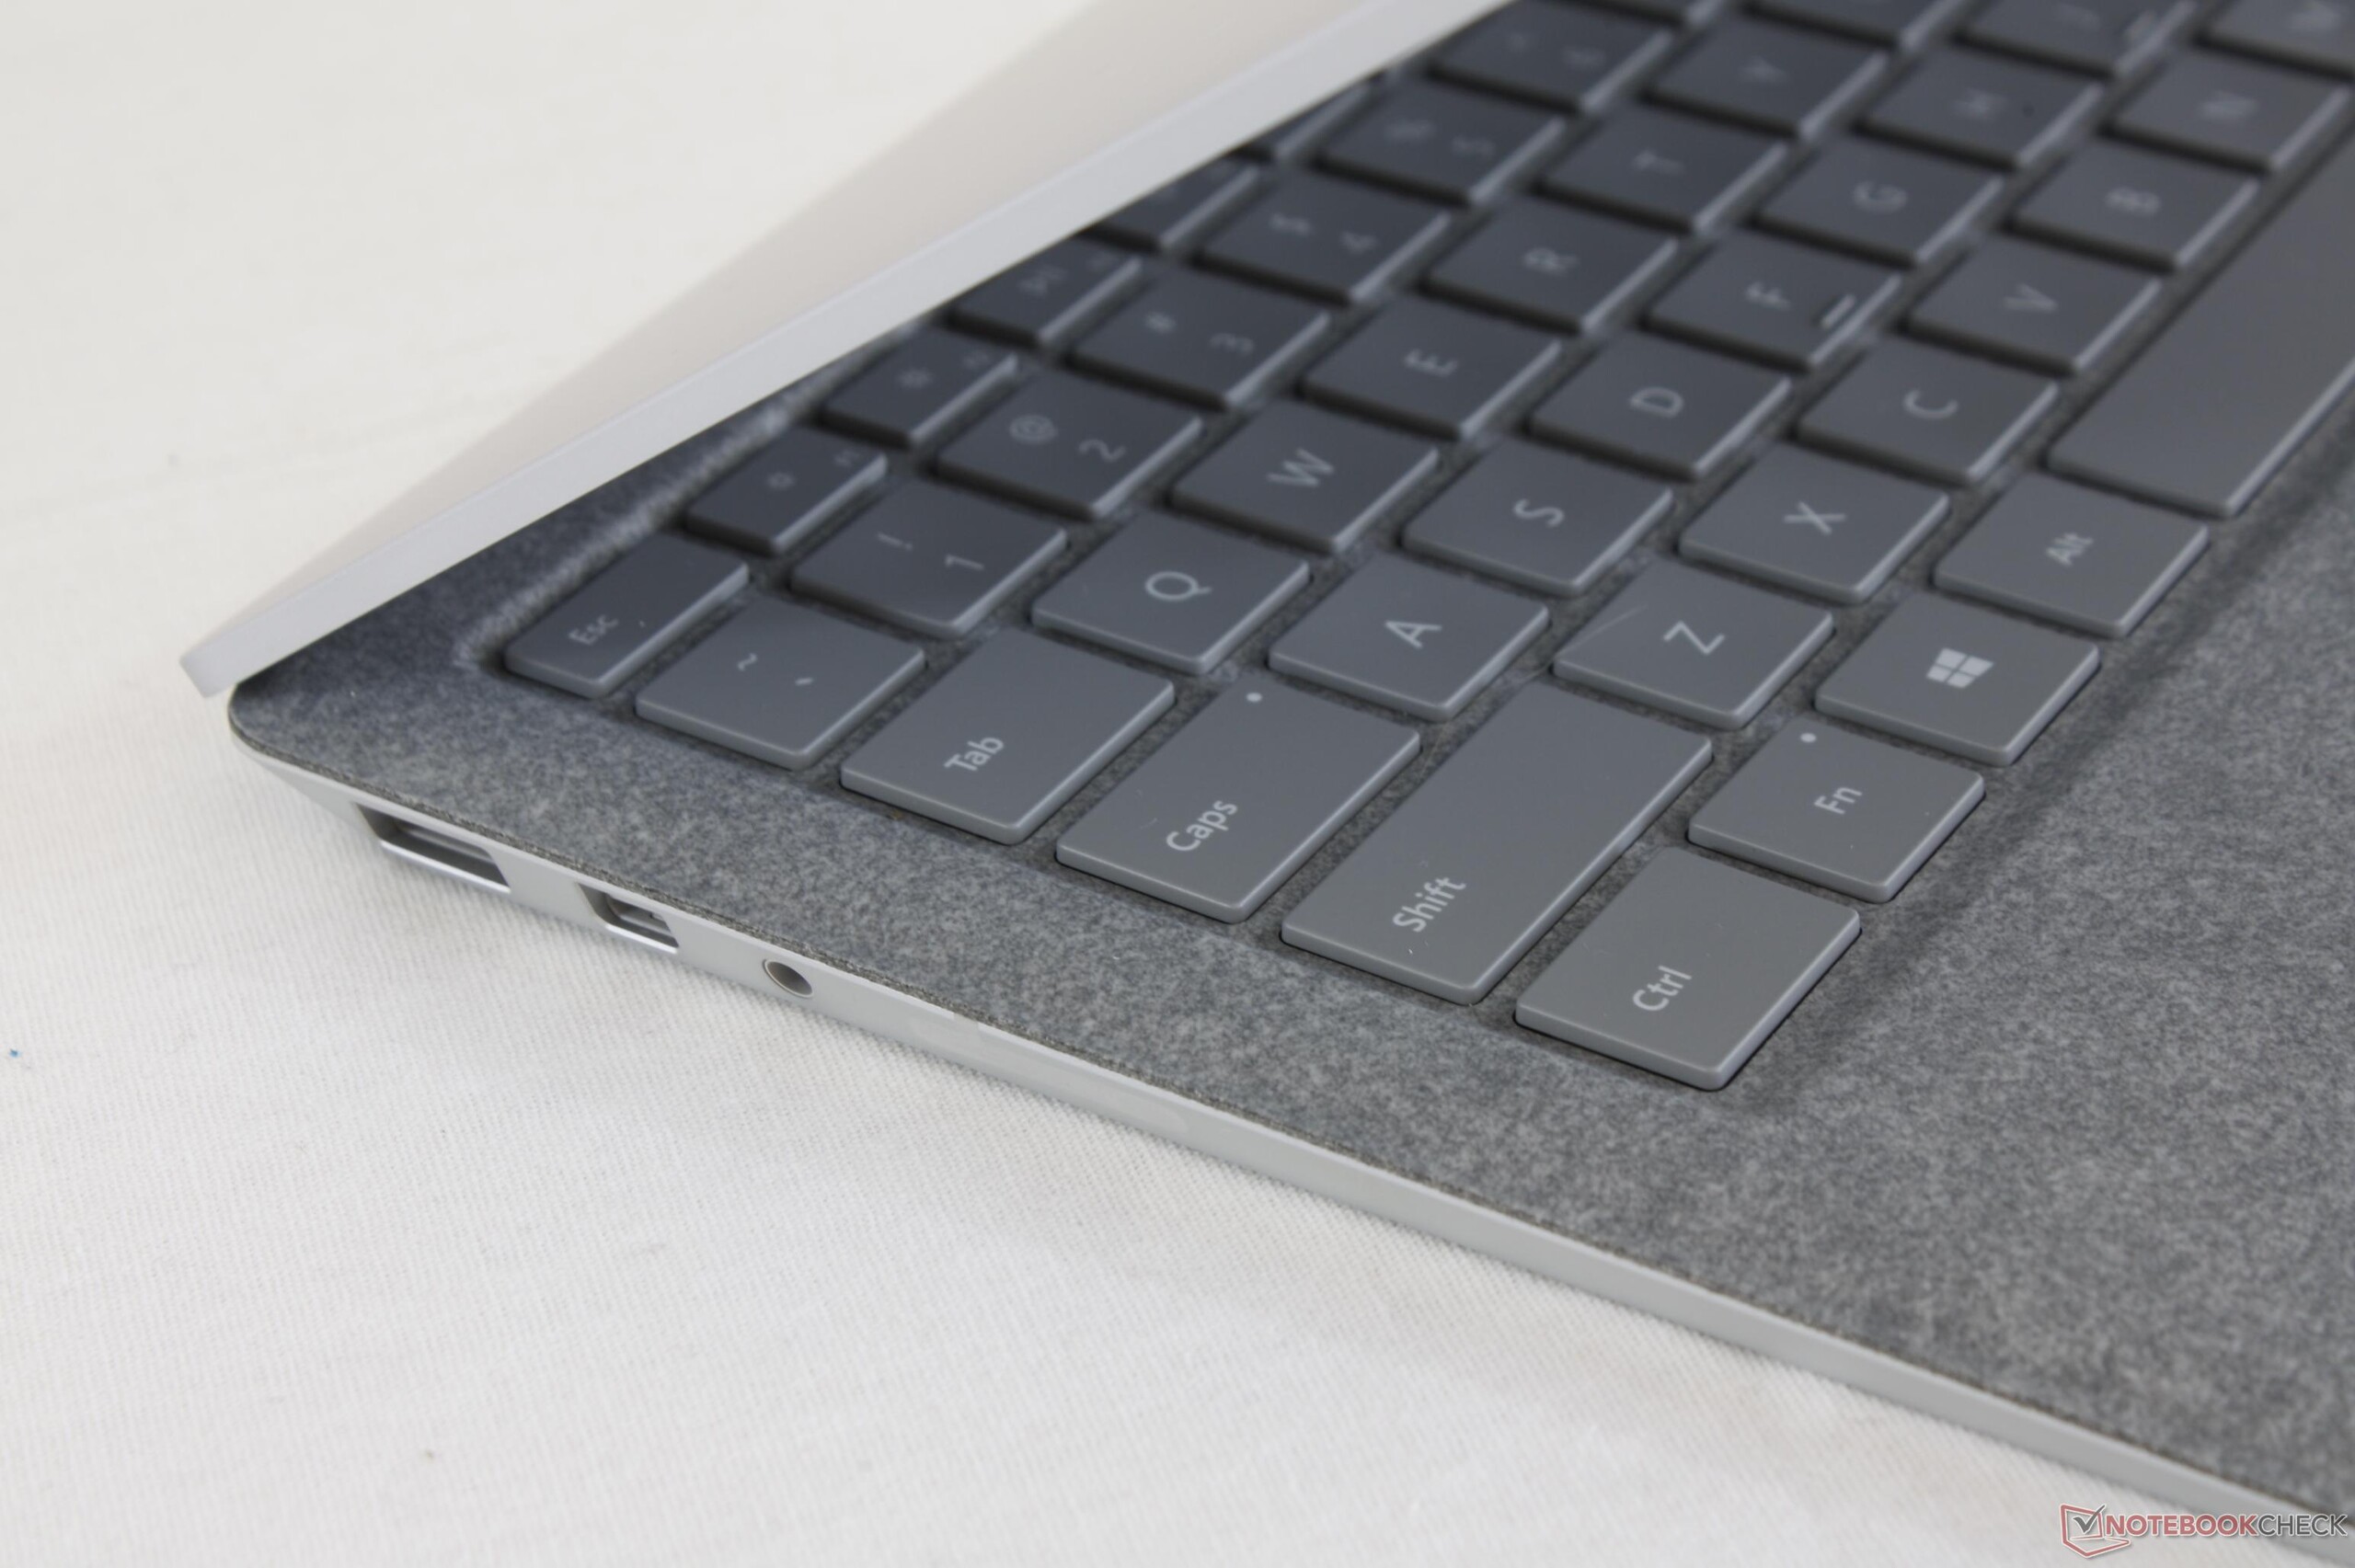
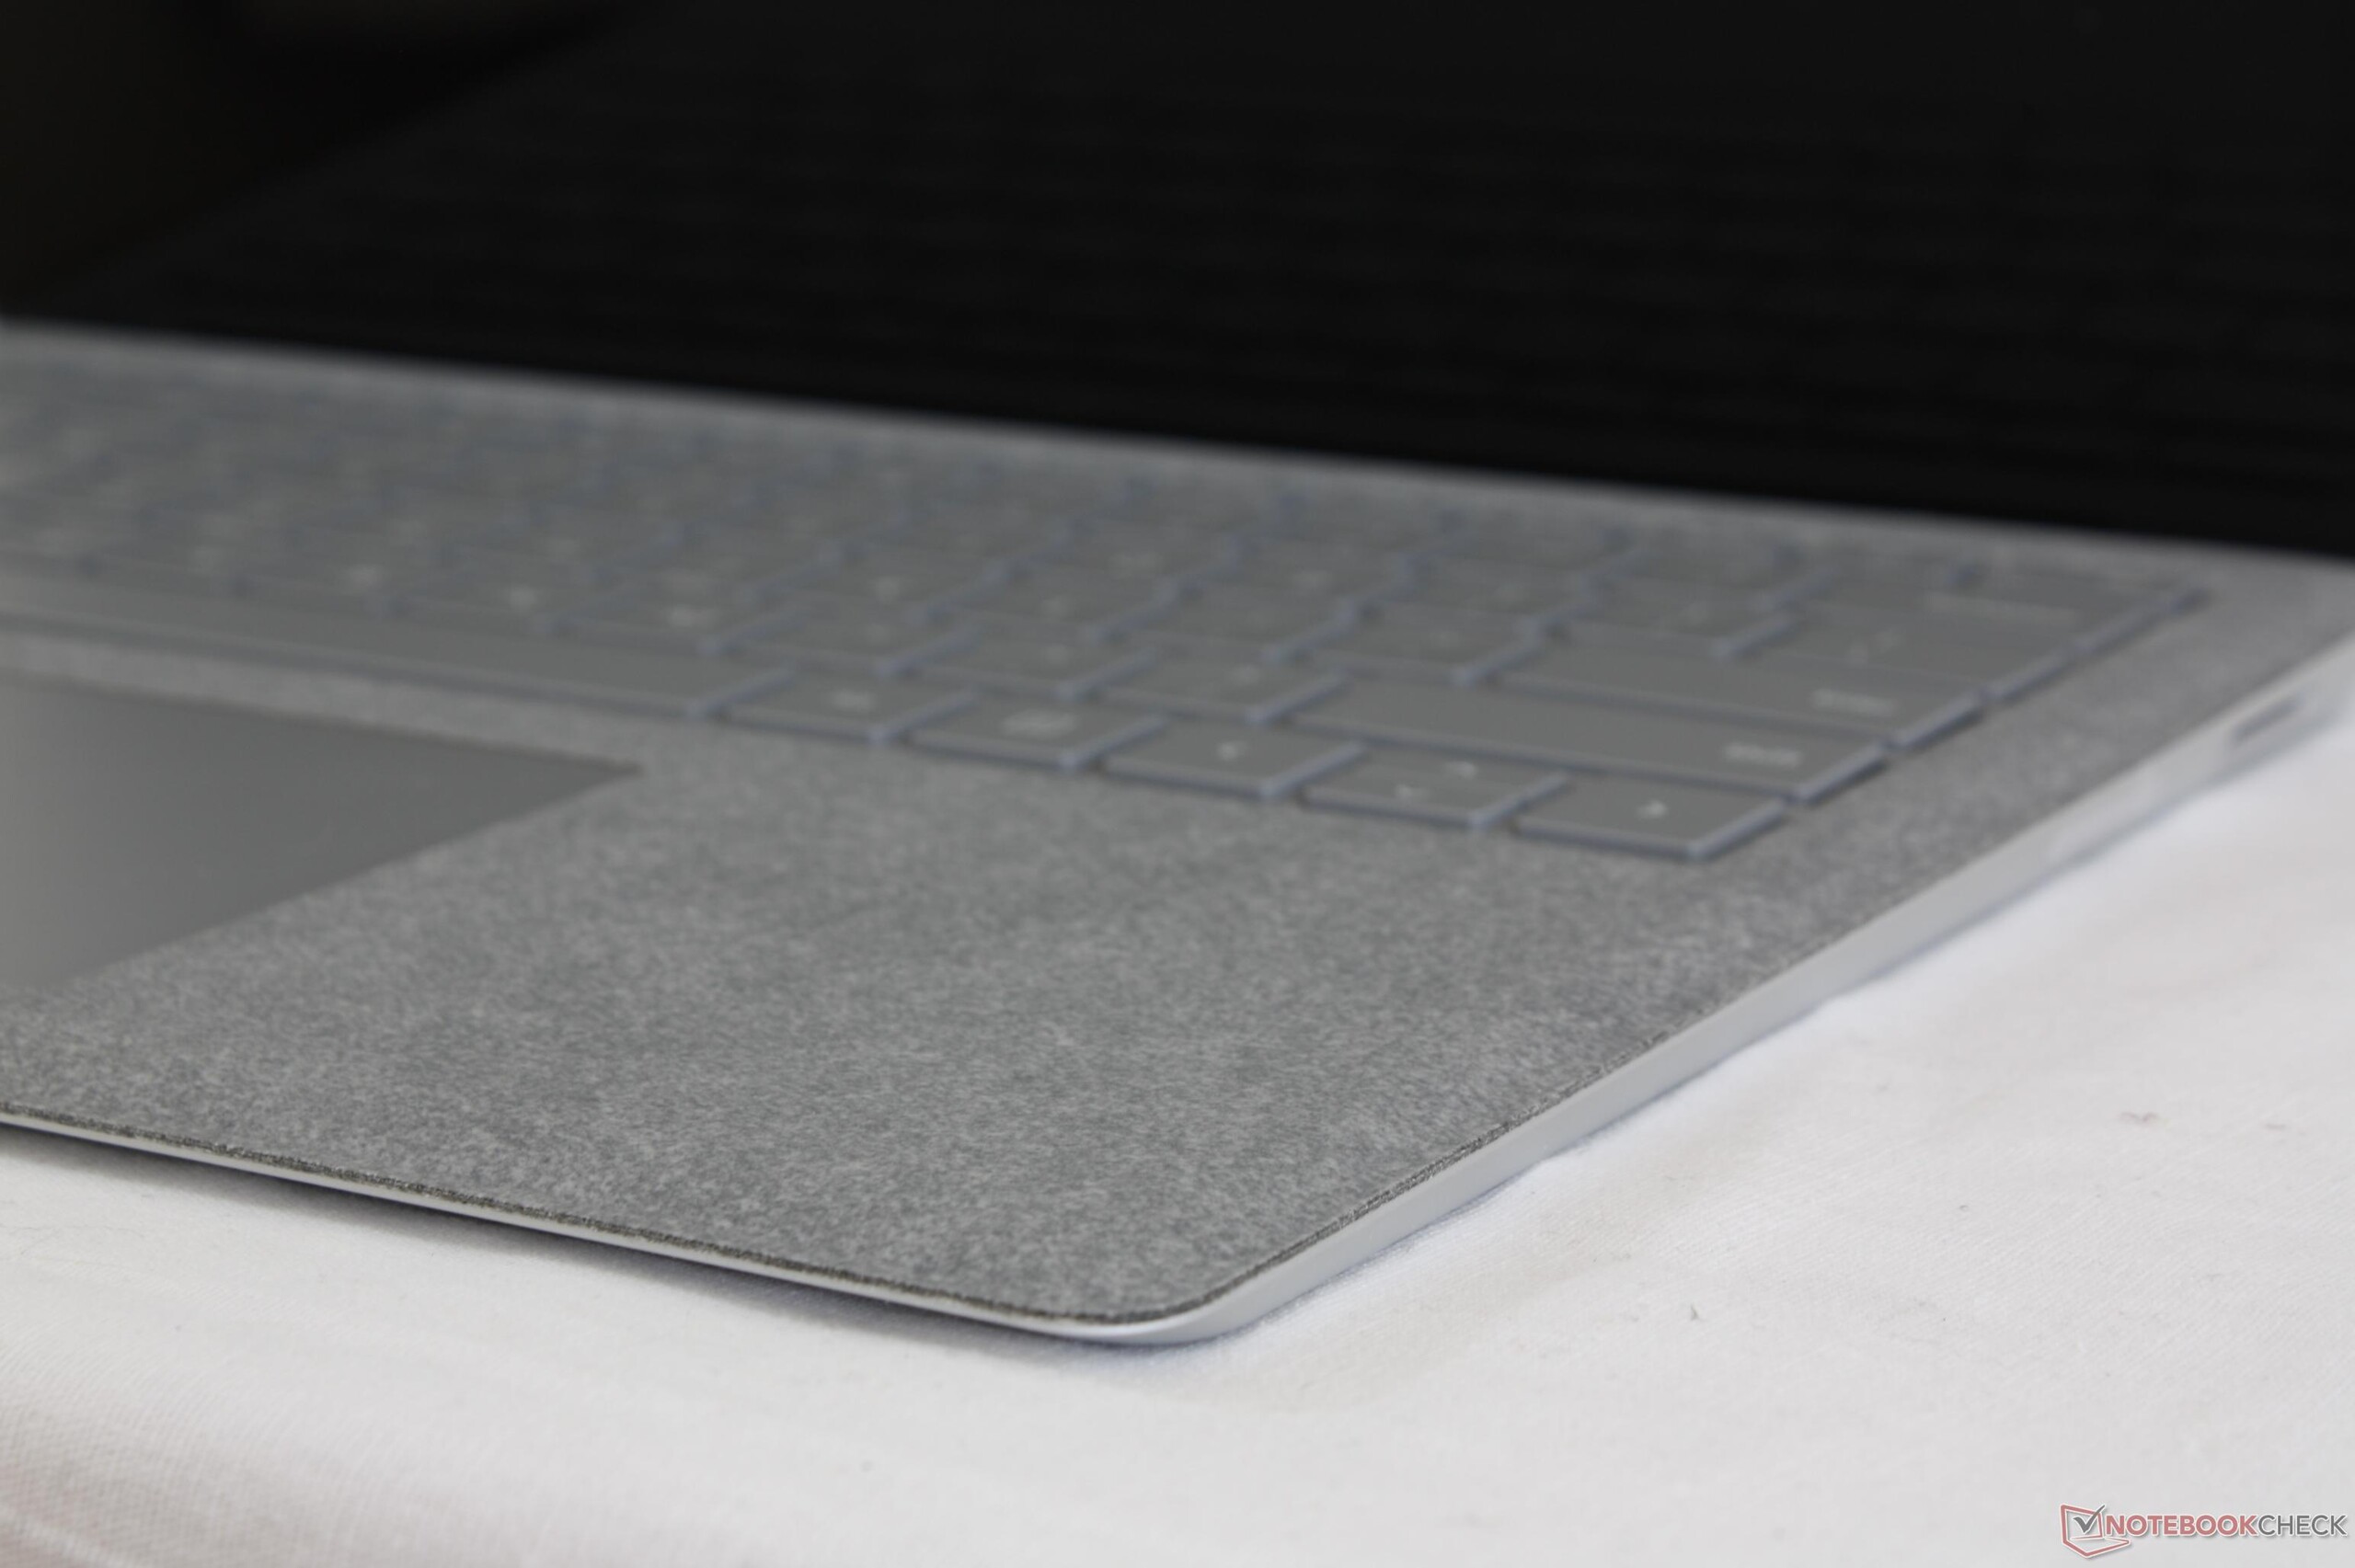
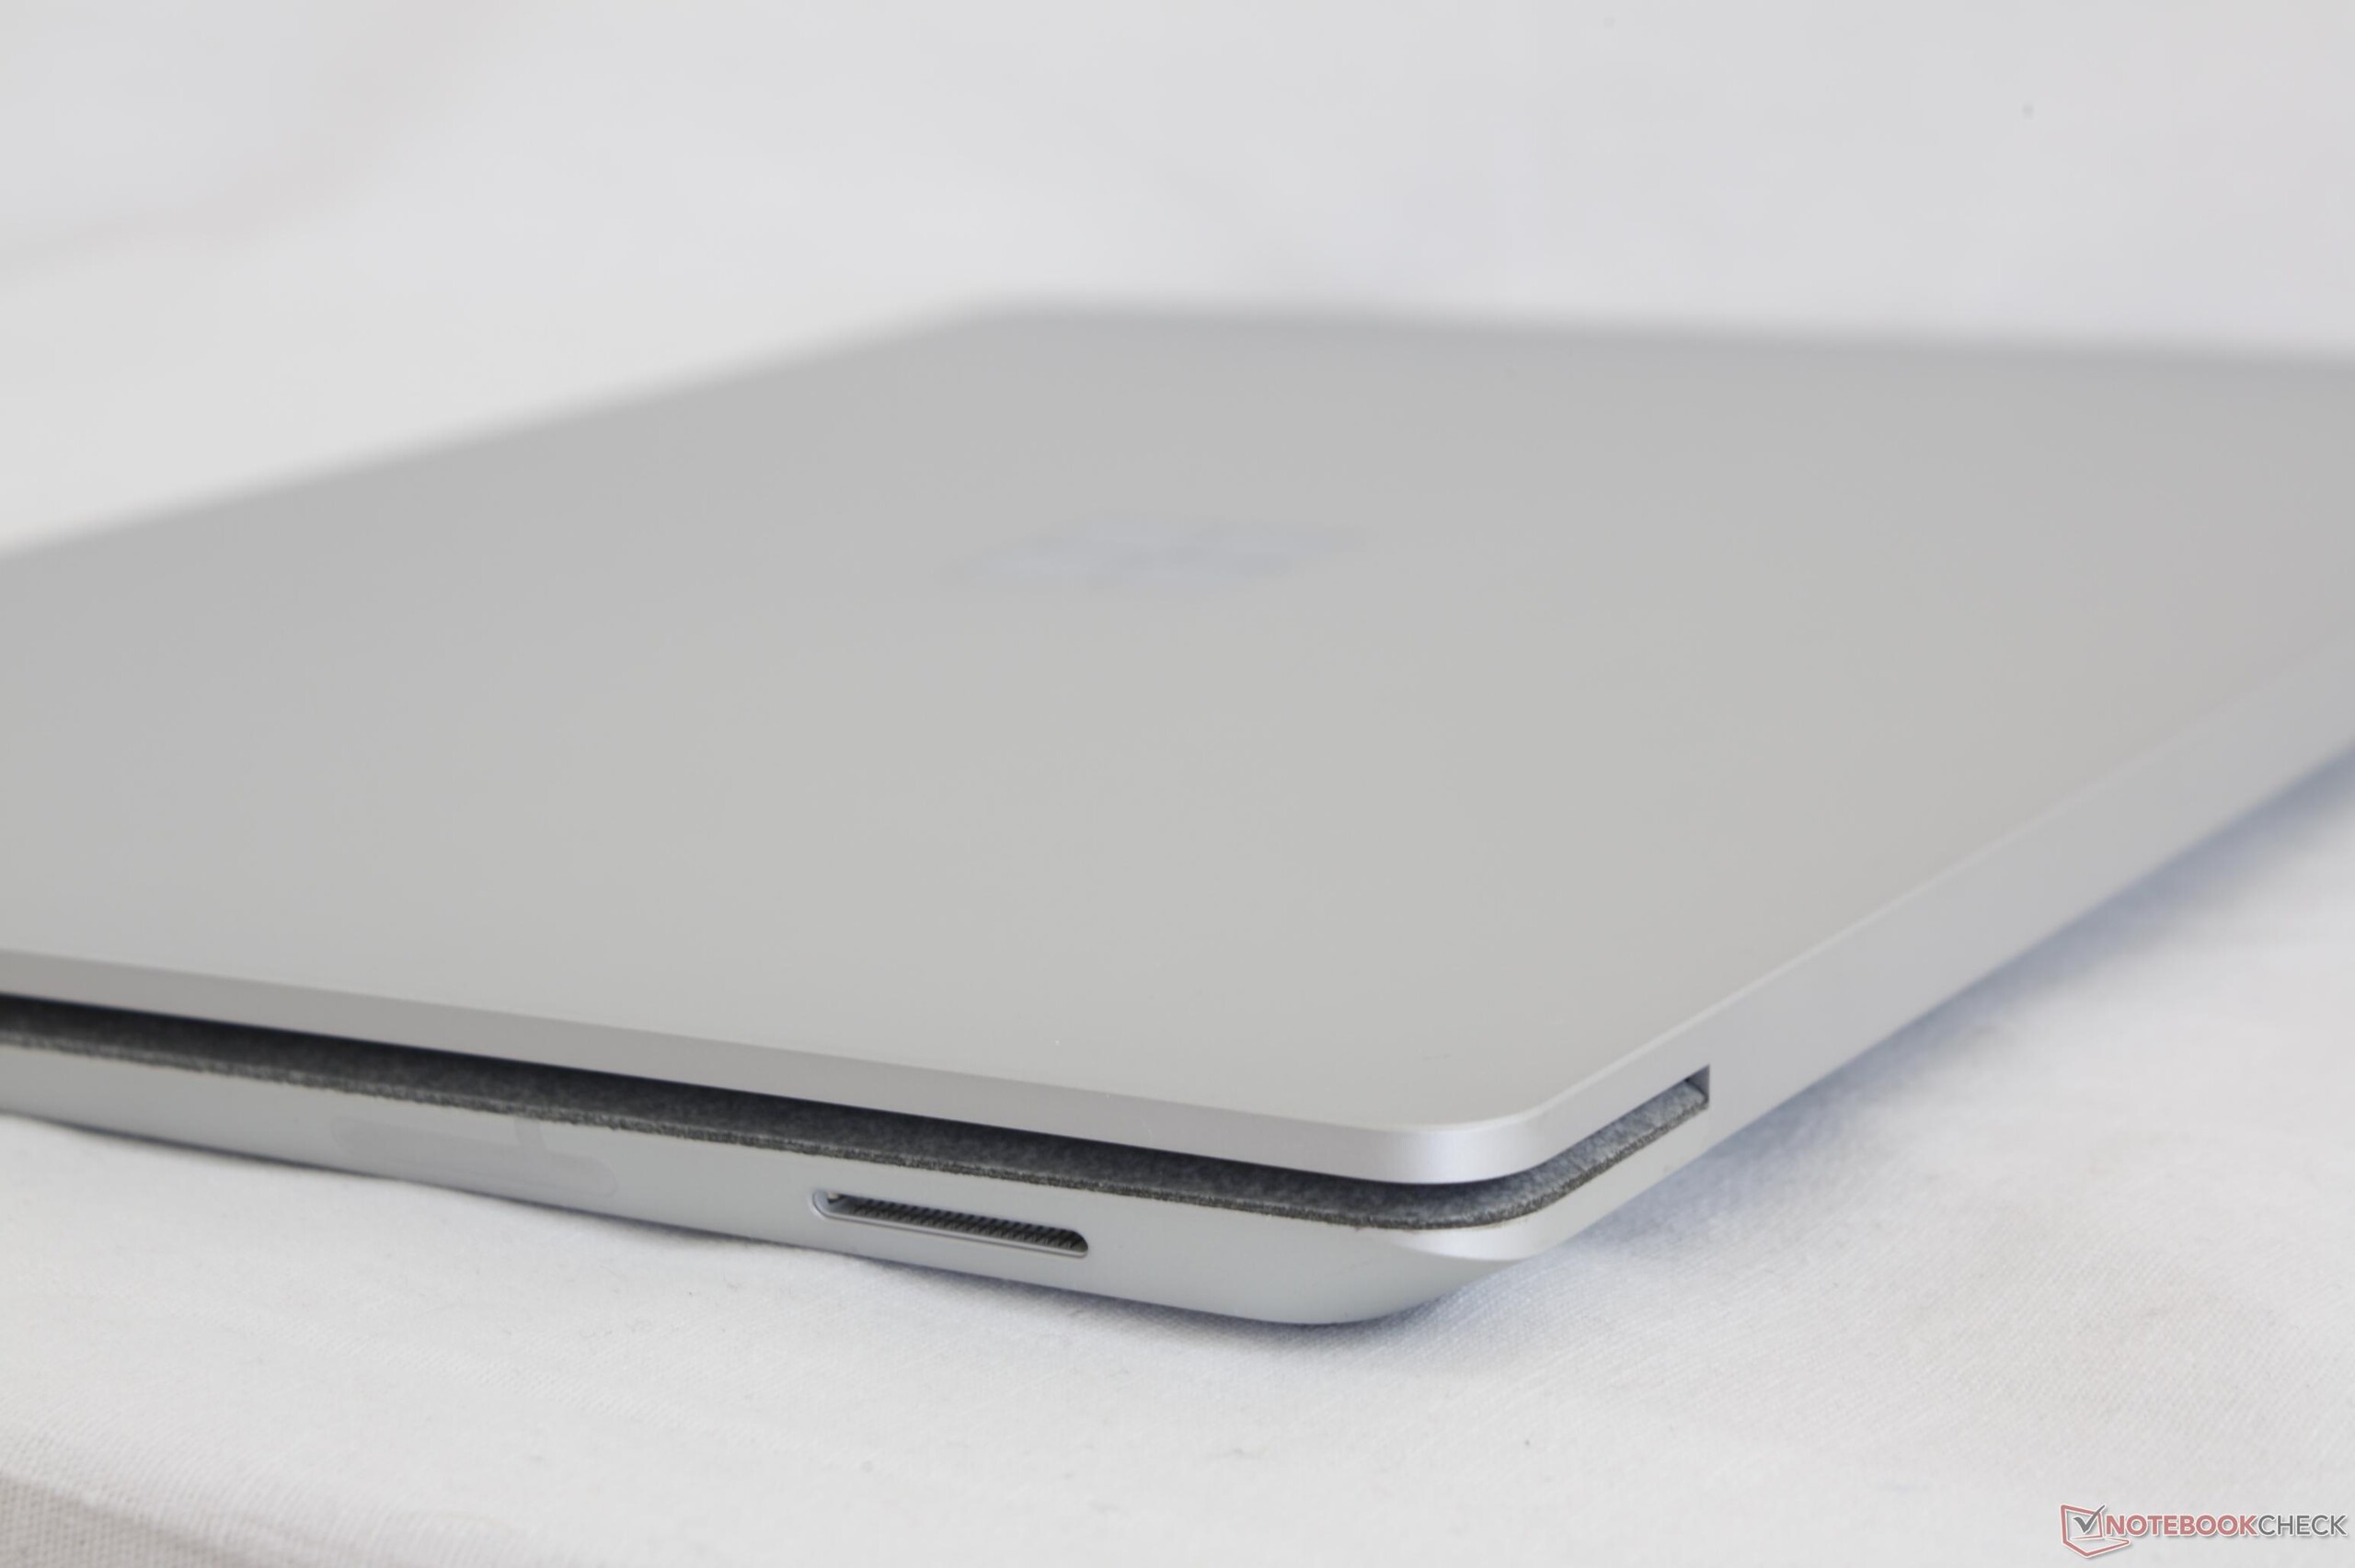
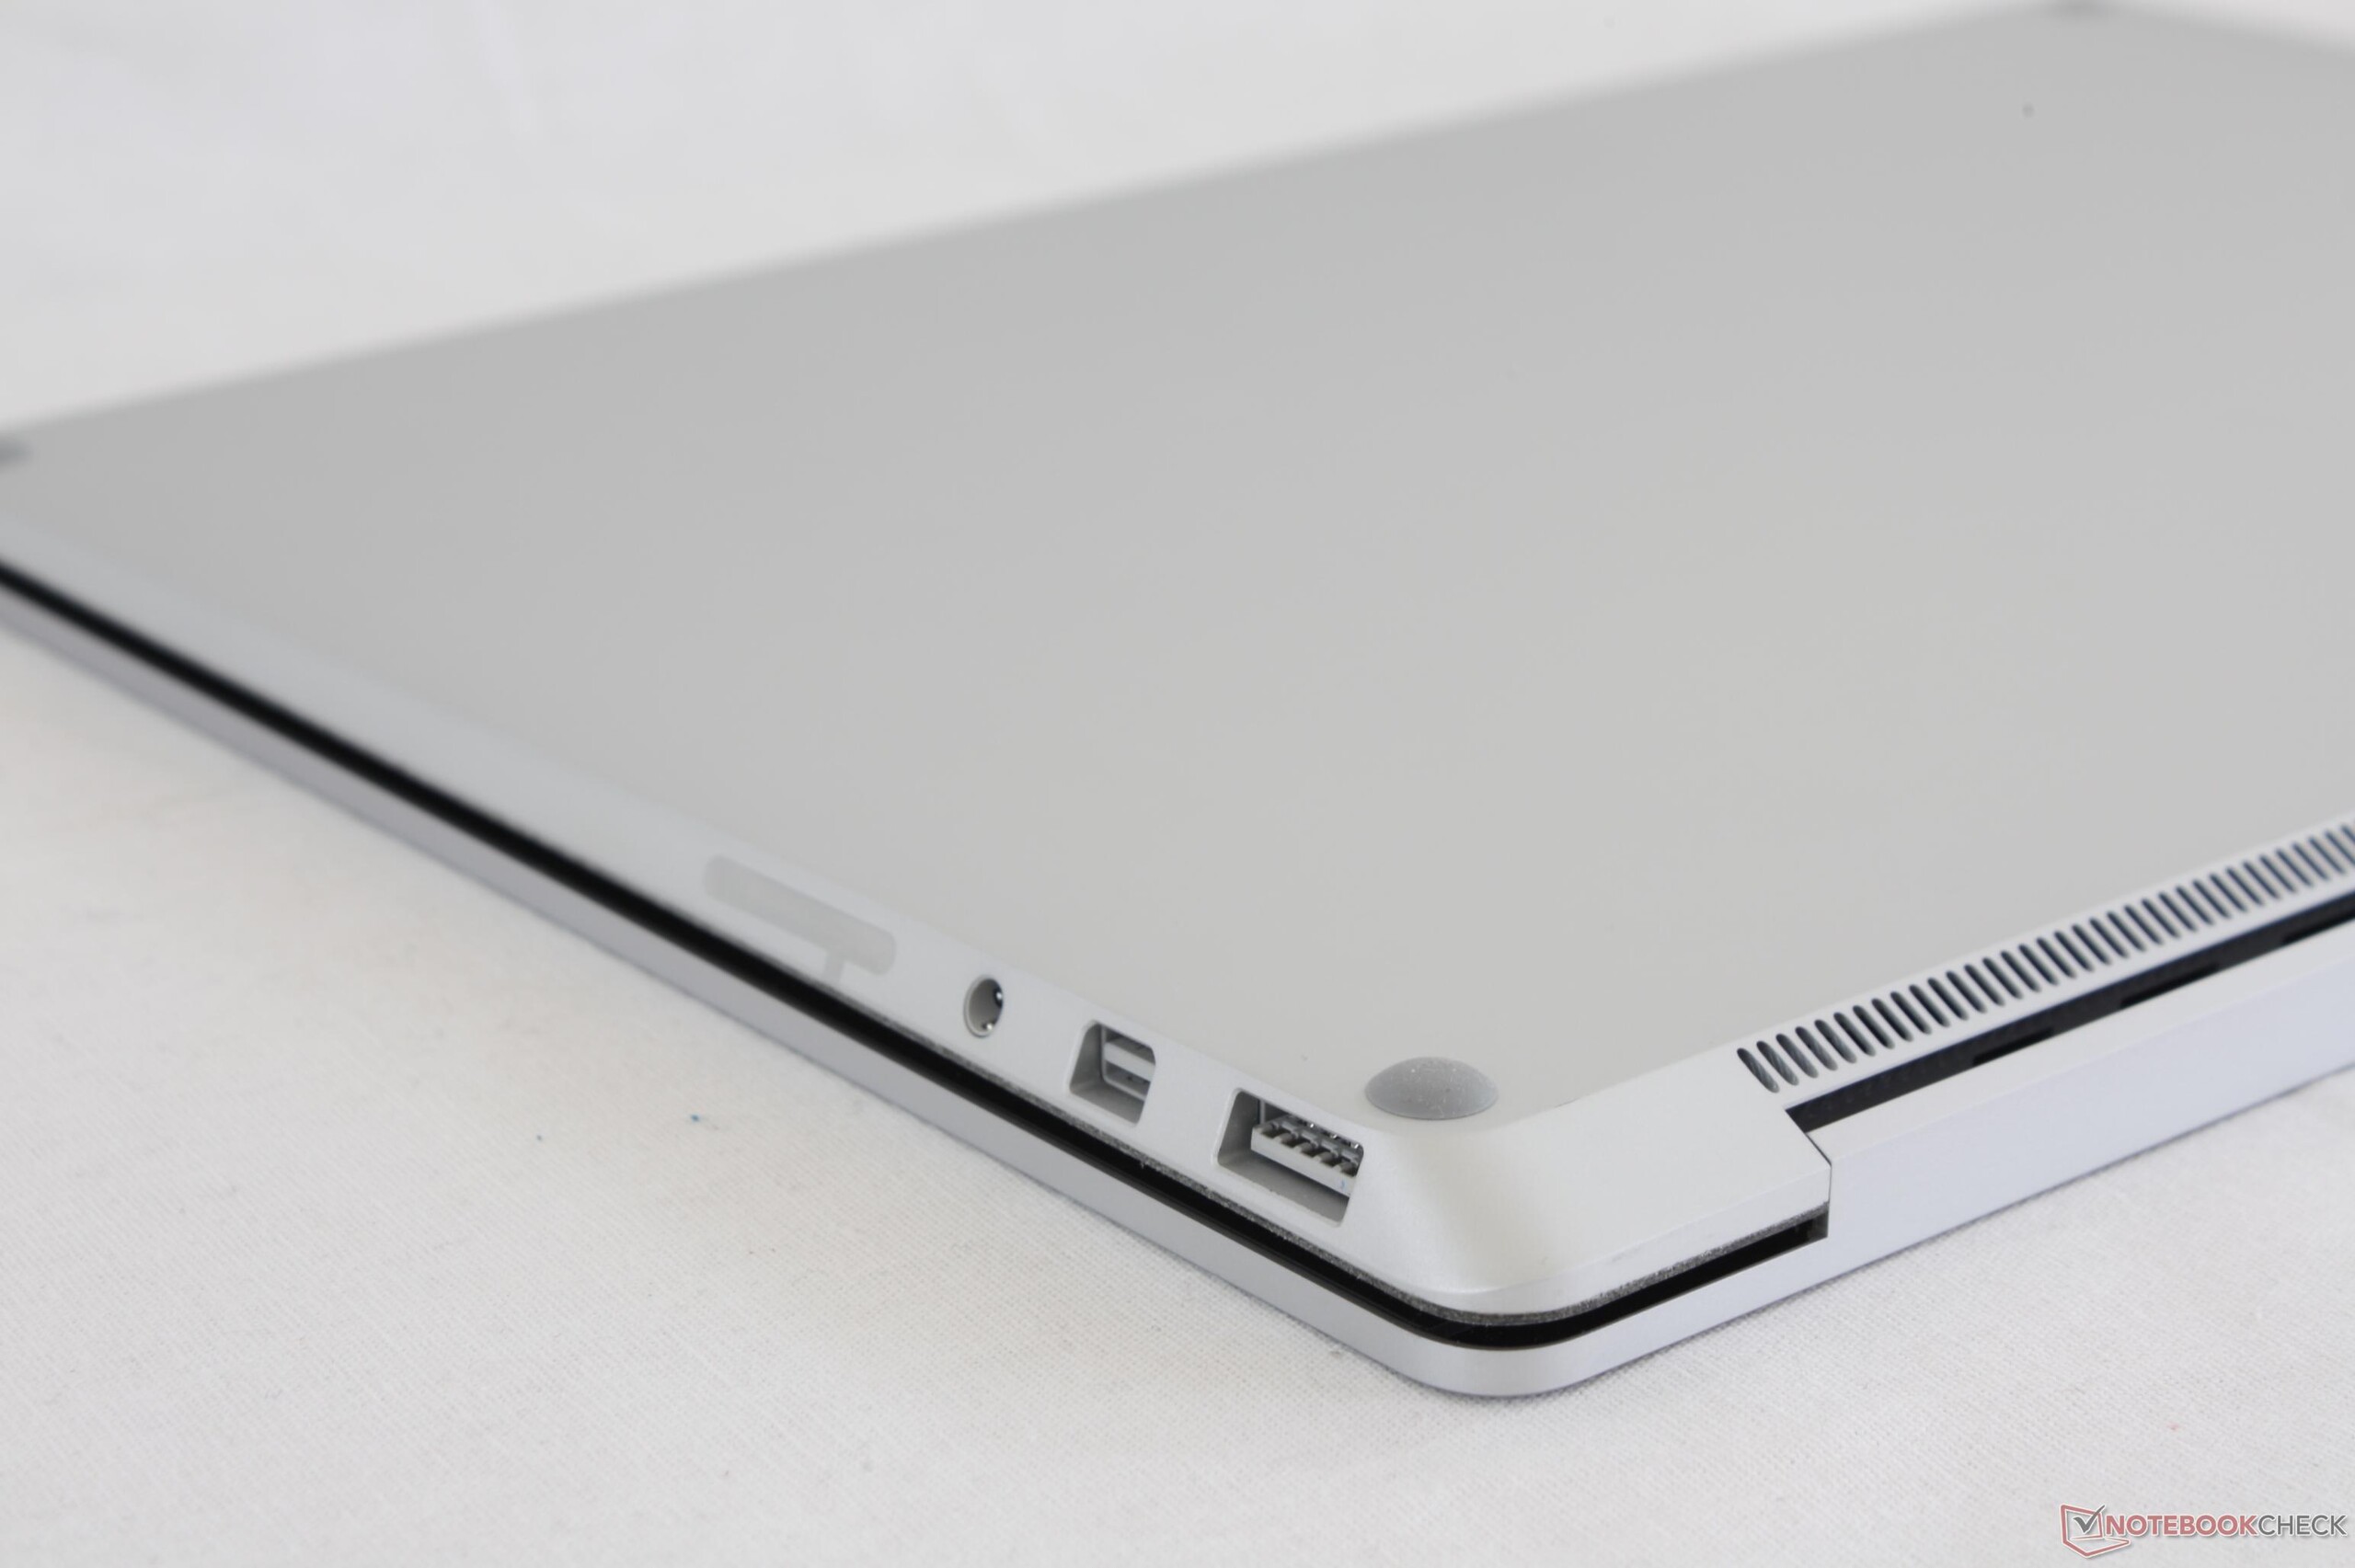
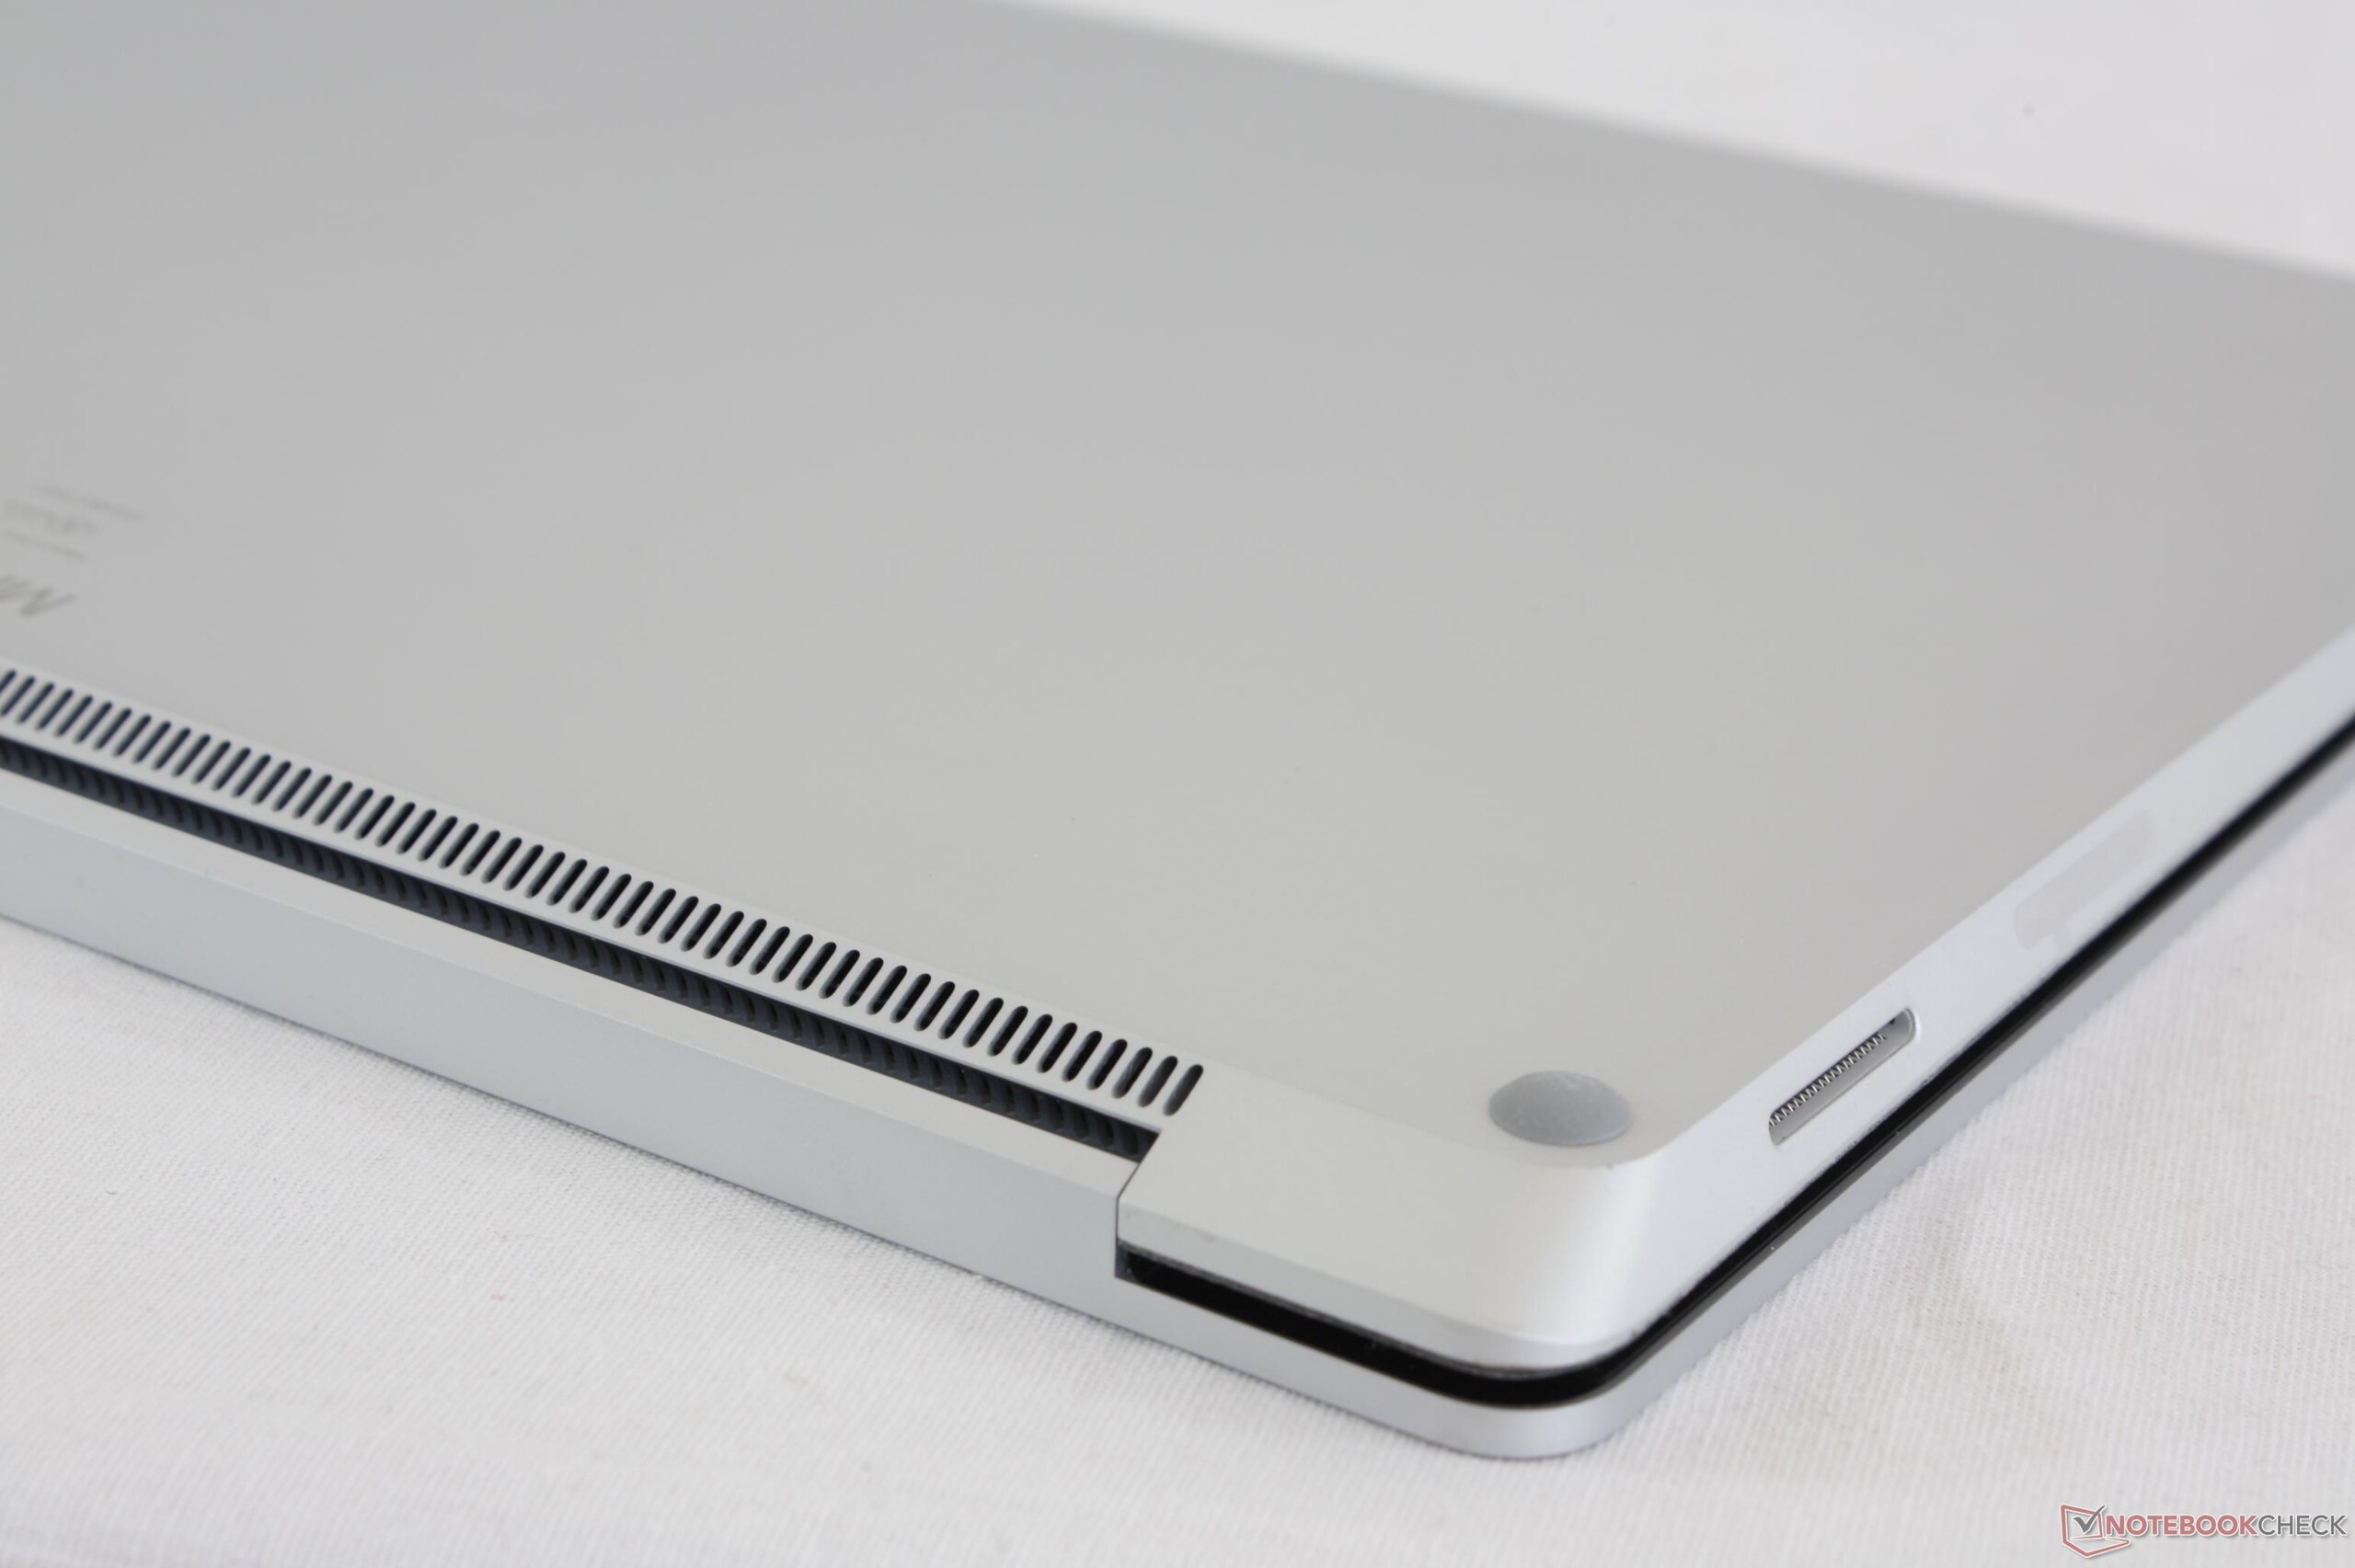
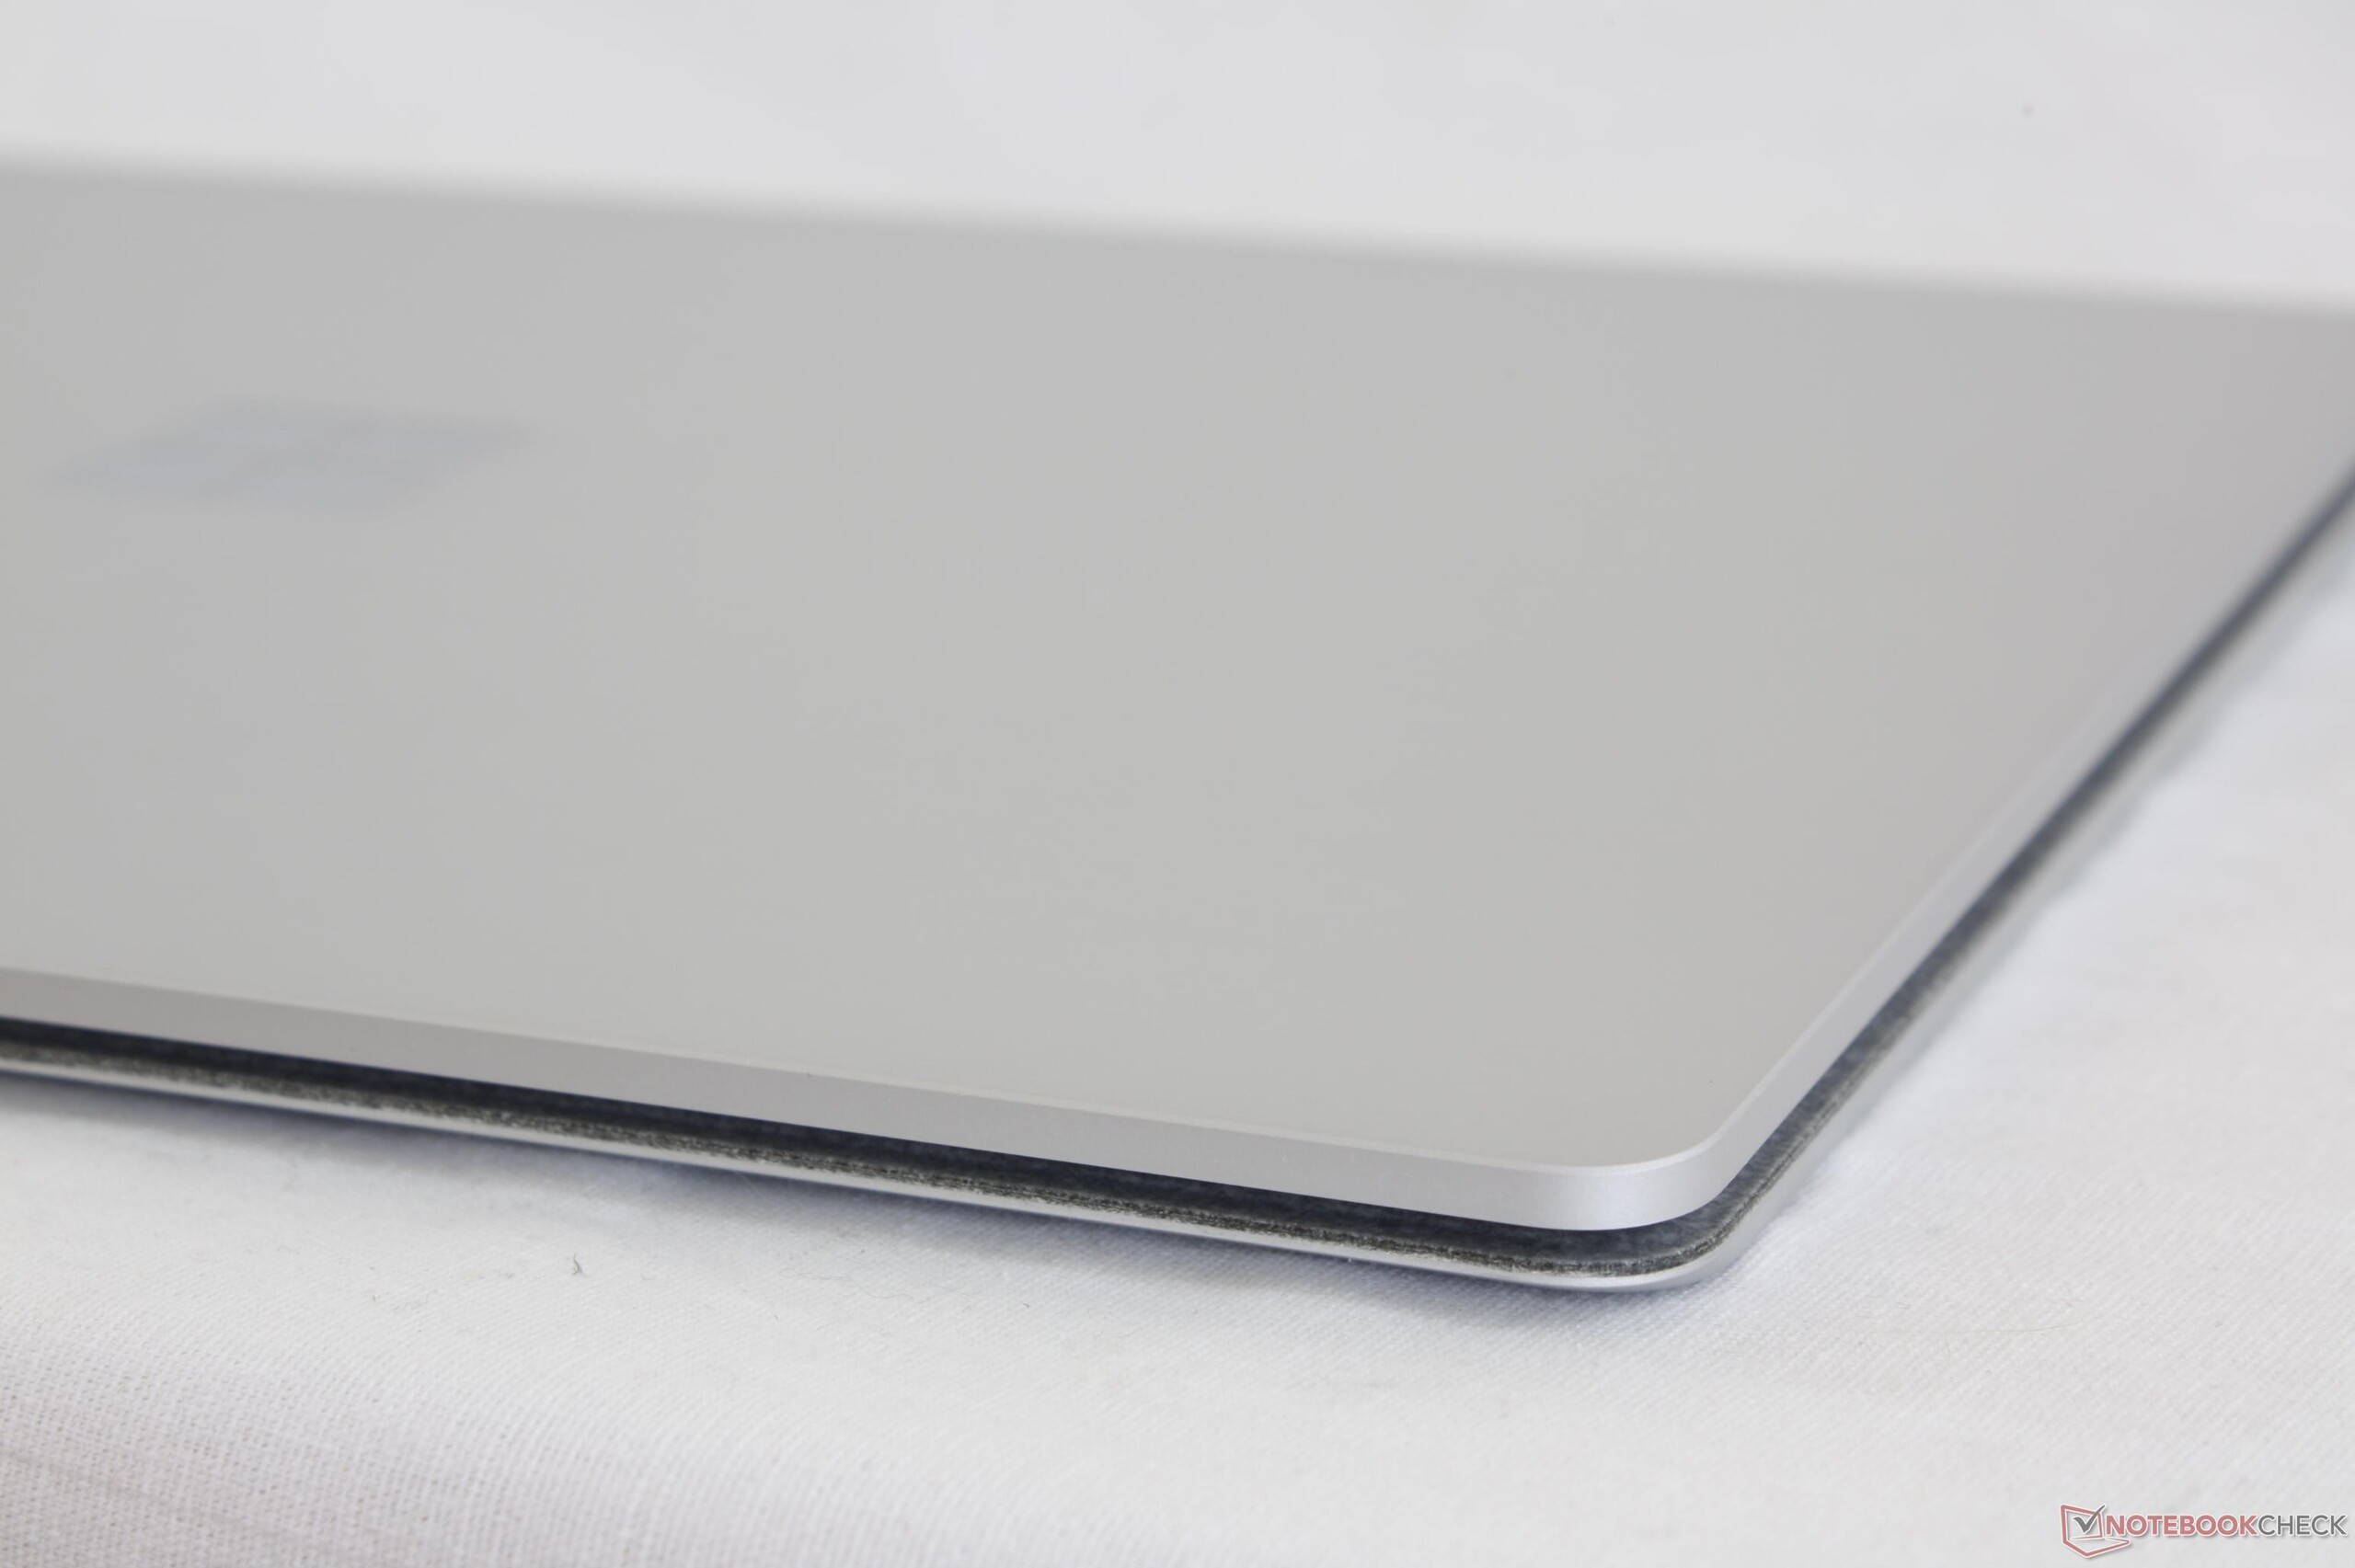
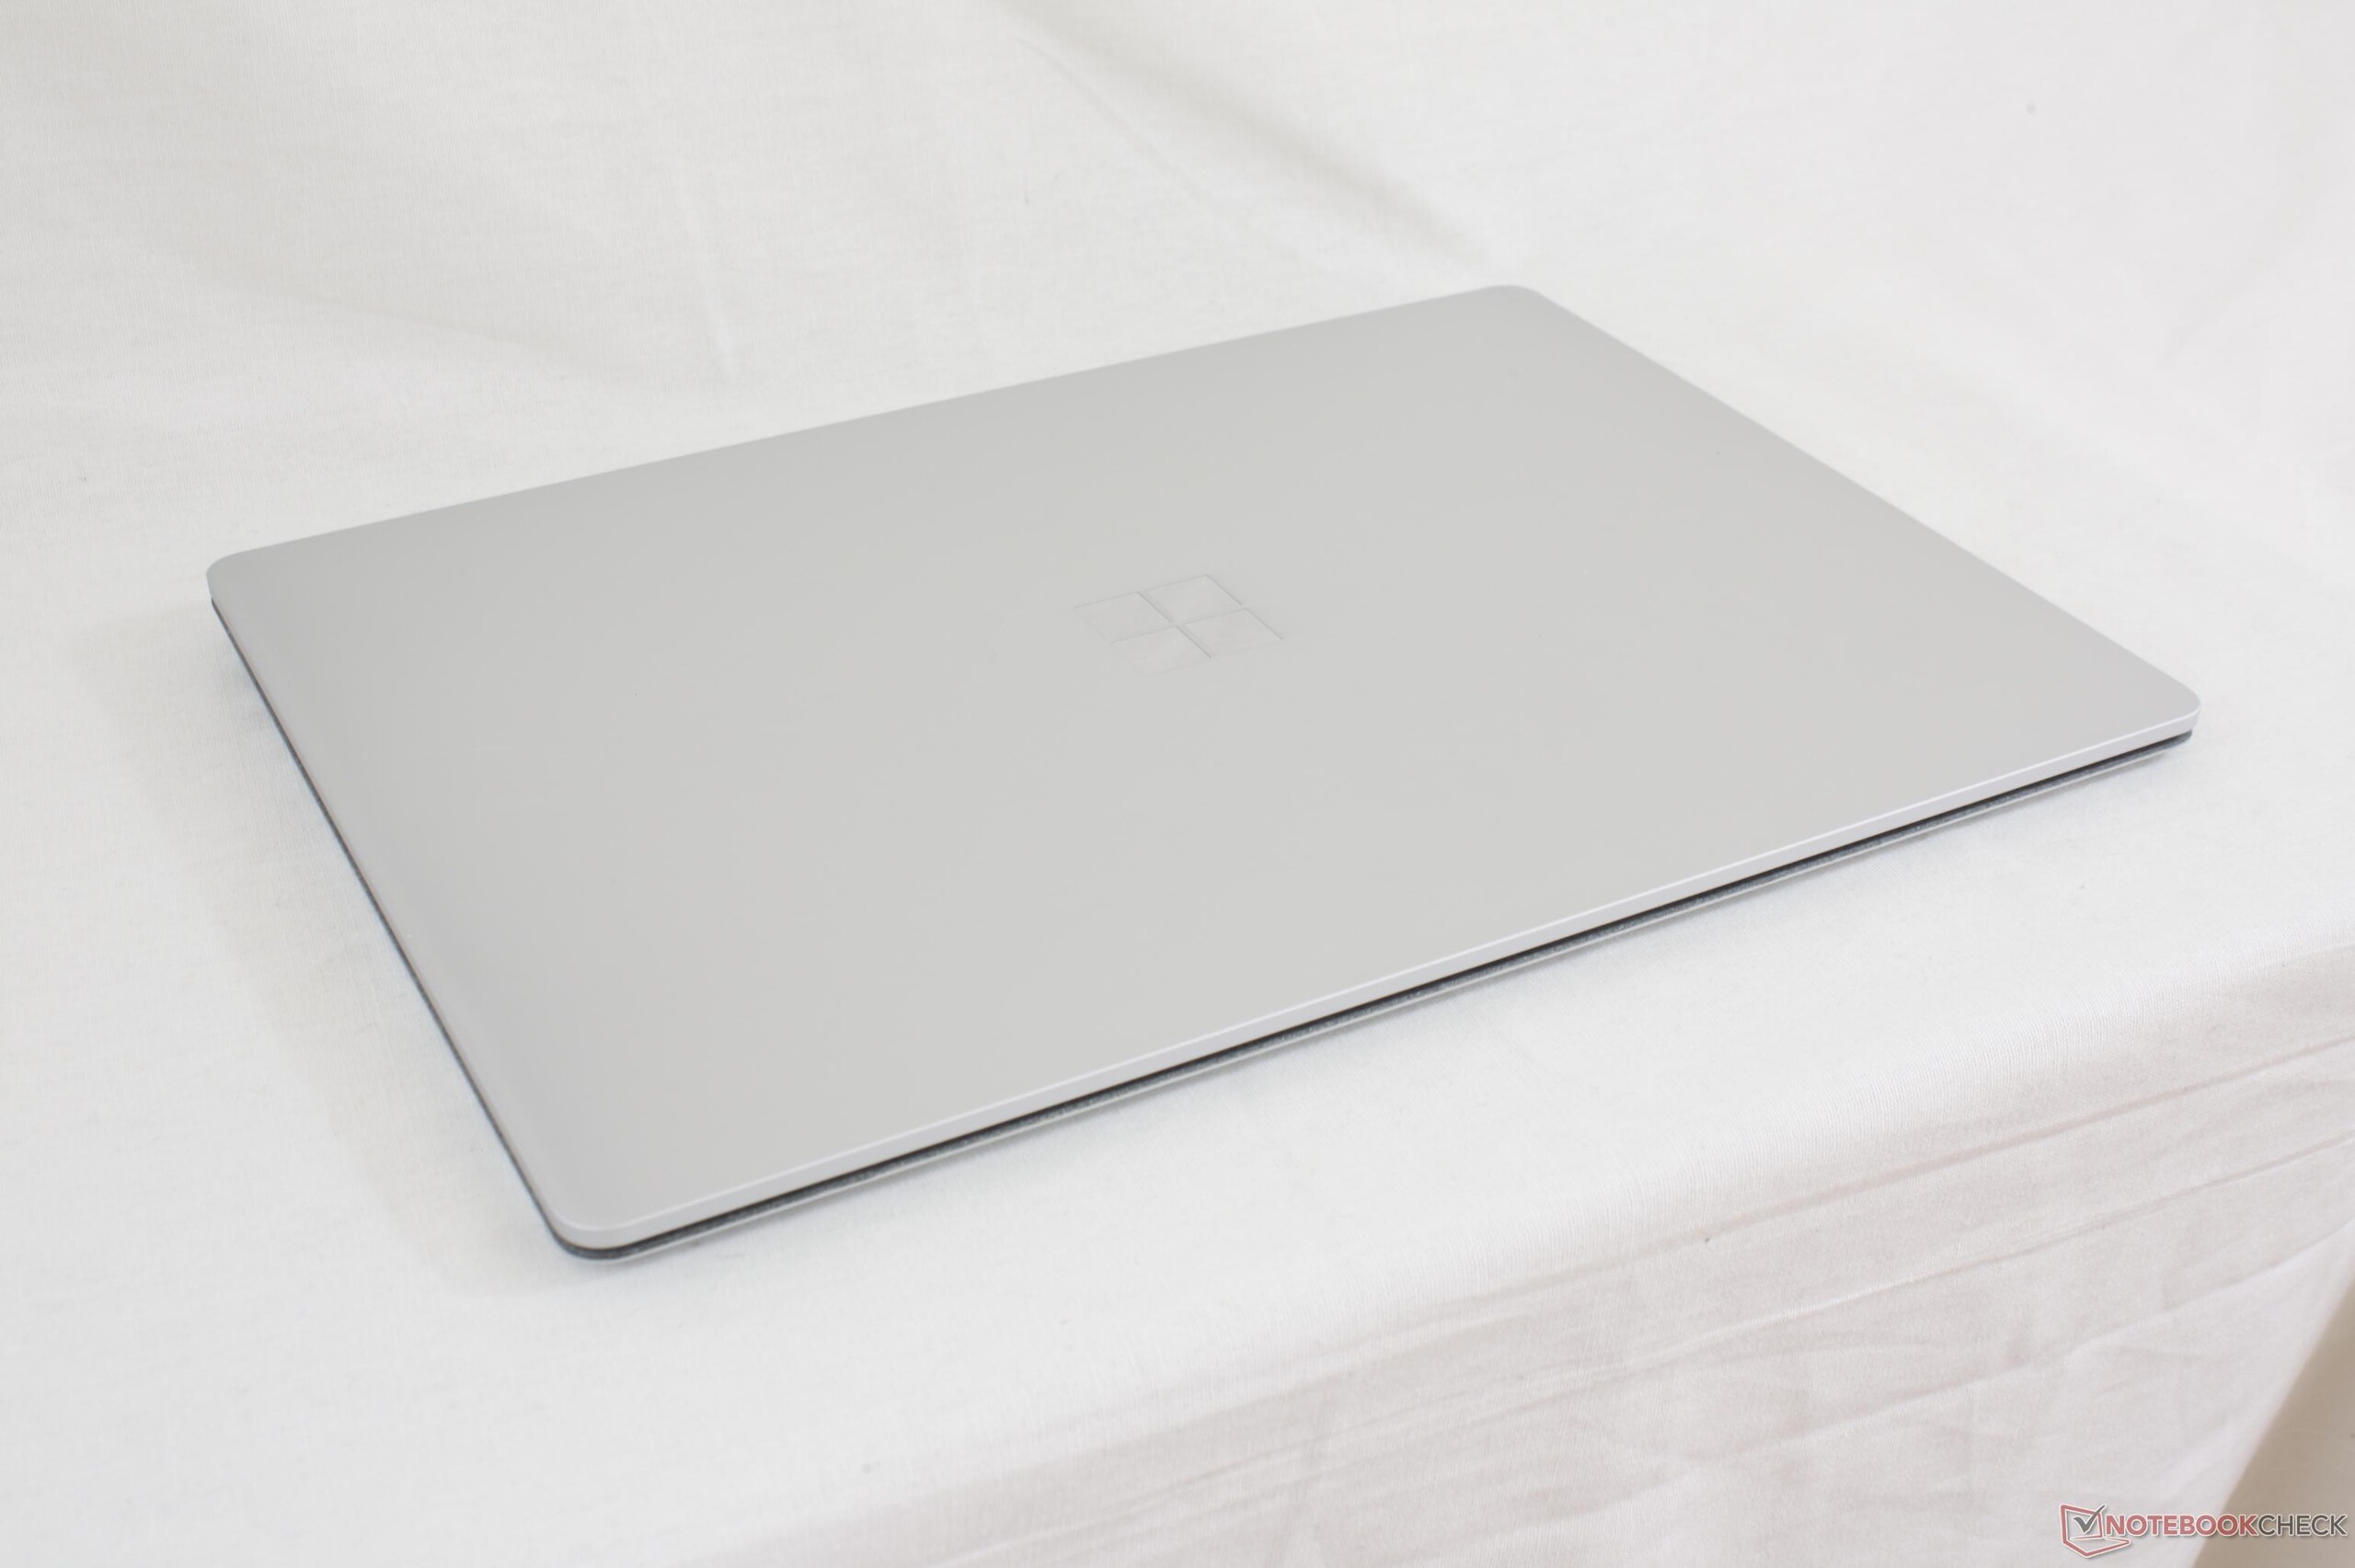
Microsoft présente sa Surface Laptop comme étant "plus qu’un portable traditionnel", mais nos tests démontrent le contraire. Ceux pour qui l’USB C, un lecteur de carte SD ou le NVMe sont importants, devront se tourner vers les ultrabooks phares de Lenovo, HP ou Dell, mieux fournis que la Surface de Microsoft. La base en Alcantara est certainement originale et constitue un argument de vente unique, mais n’apporte rien de particulier en pratique.
L’écran de 13,5 pouces est le meilleur argument en faveur de la Surface Laptop, tout le reste étant vraiment décevant. Si l’écran 3:2 ou les graphiques Iris ne sont pas importants pour vous, alors le portable est moins bon que la pléthore d’alternatives de 13 ou 14 pouces. La bonne autonomie, les ventilateurs silencieux, et la large couverture colorimétrique du portable peuvent également être retrouvés sur des concurrents comme le XPS 13 9360 QHD+, ou le Notebook 9.
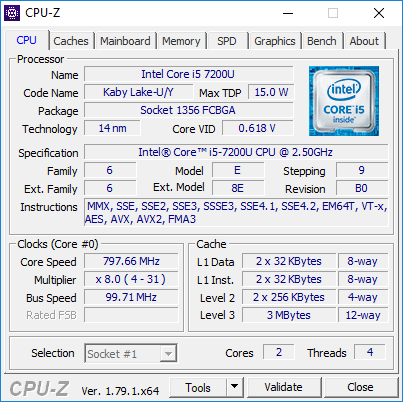
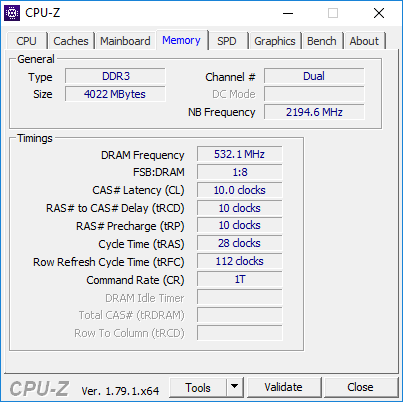
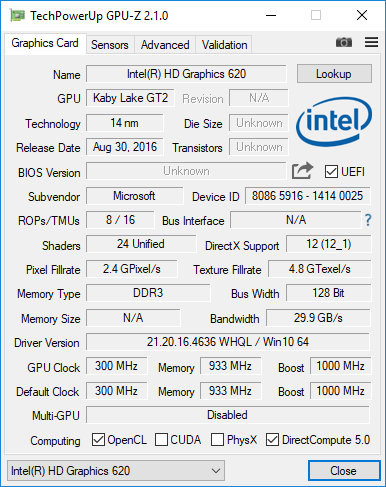
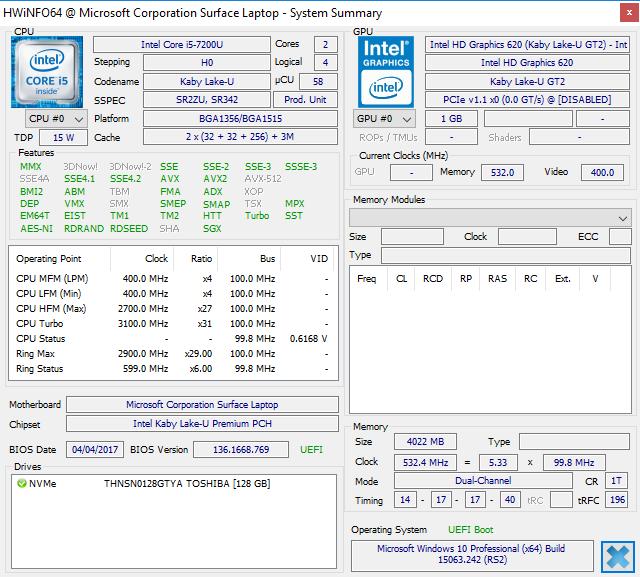
Le comportement du Core i7 en cas de fortes sollicitations sera intéressant à étudier dans un test futur : si notre configuration Core i5 parvient difficilement à maintenir ses taux d’horloge à 2,7-2,8 GHz, alors comment la version Core i7 plus exigeante pourra-t-elle maintenir son Turbo Boost de 4 GHz ? Nous sommes aussi préoccupés de voir dans quelle mesure la RAM DDR3 limitera les performances du GPU Iris Plus Graphics 640, vu les limitations de la HD Graphics 620 sur notre configuration Core i5.
Microsoft met en avant ses notebooks auprès des étudiants, et nous pouvons apprécier la qualité globale de l’appareil. Mais la longue liste de fonctionnalités absentes limite sa polyvalence, et la rend difficile à recommander, que ce soit pour les étudiants ou pour des utilisateurs classiques.
Trop peu, trop tard : si la Surface Laptop est un ordinateur portable costaud avec un bon écran, elle n’offre pas grand-chose de plus, et elle est loin de la polyvalence d’une Surface Pro 4 ou même de nombre d’ultrabooks du marché.
L’intégralité de cette critique est disponible en anglais en suivant ce lien.
Microsoft Surface Laptop i5
- 06/18/2017 v6 (old)
Allen Ngo
Price comparison
