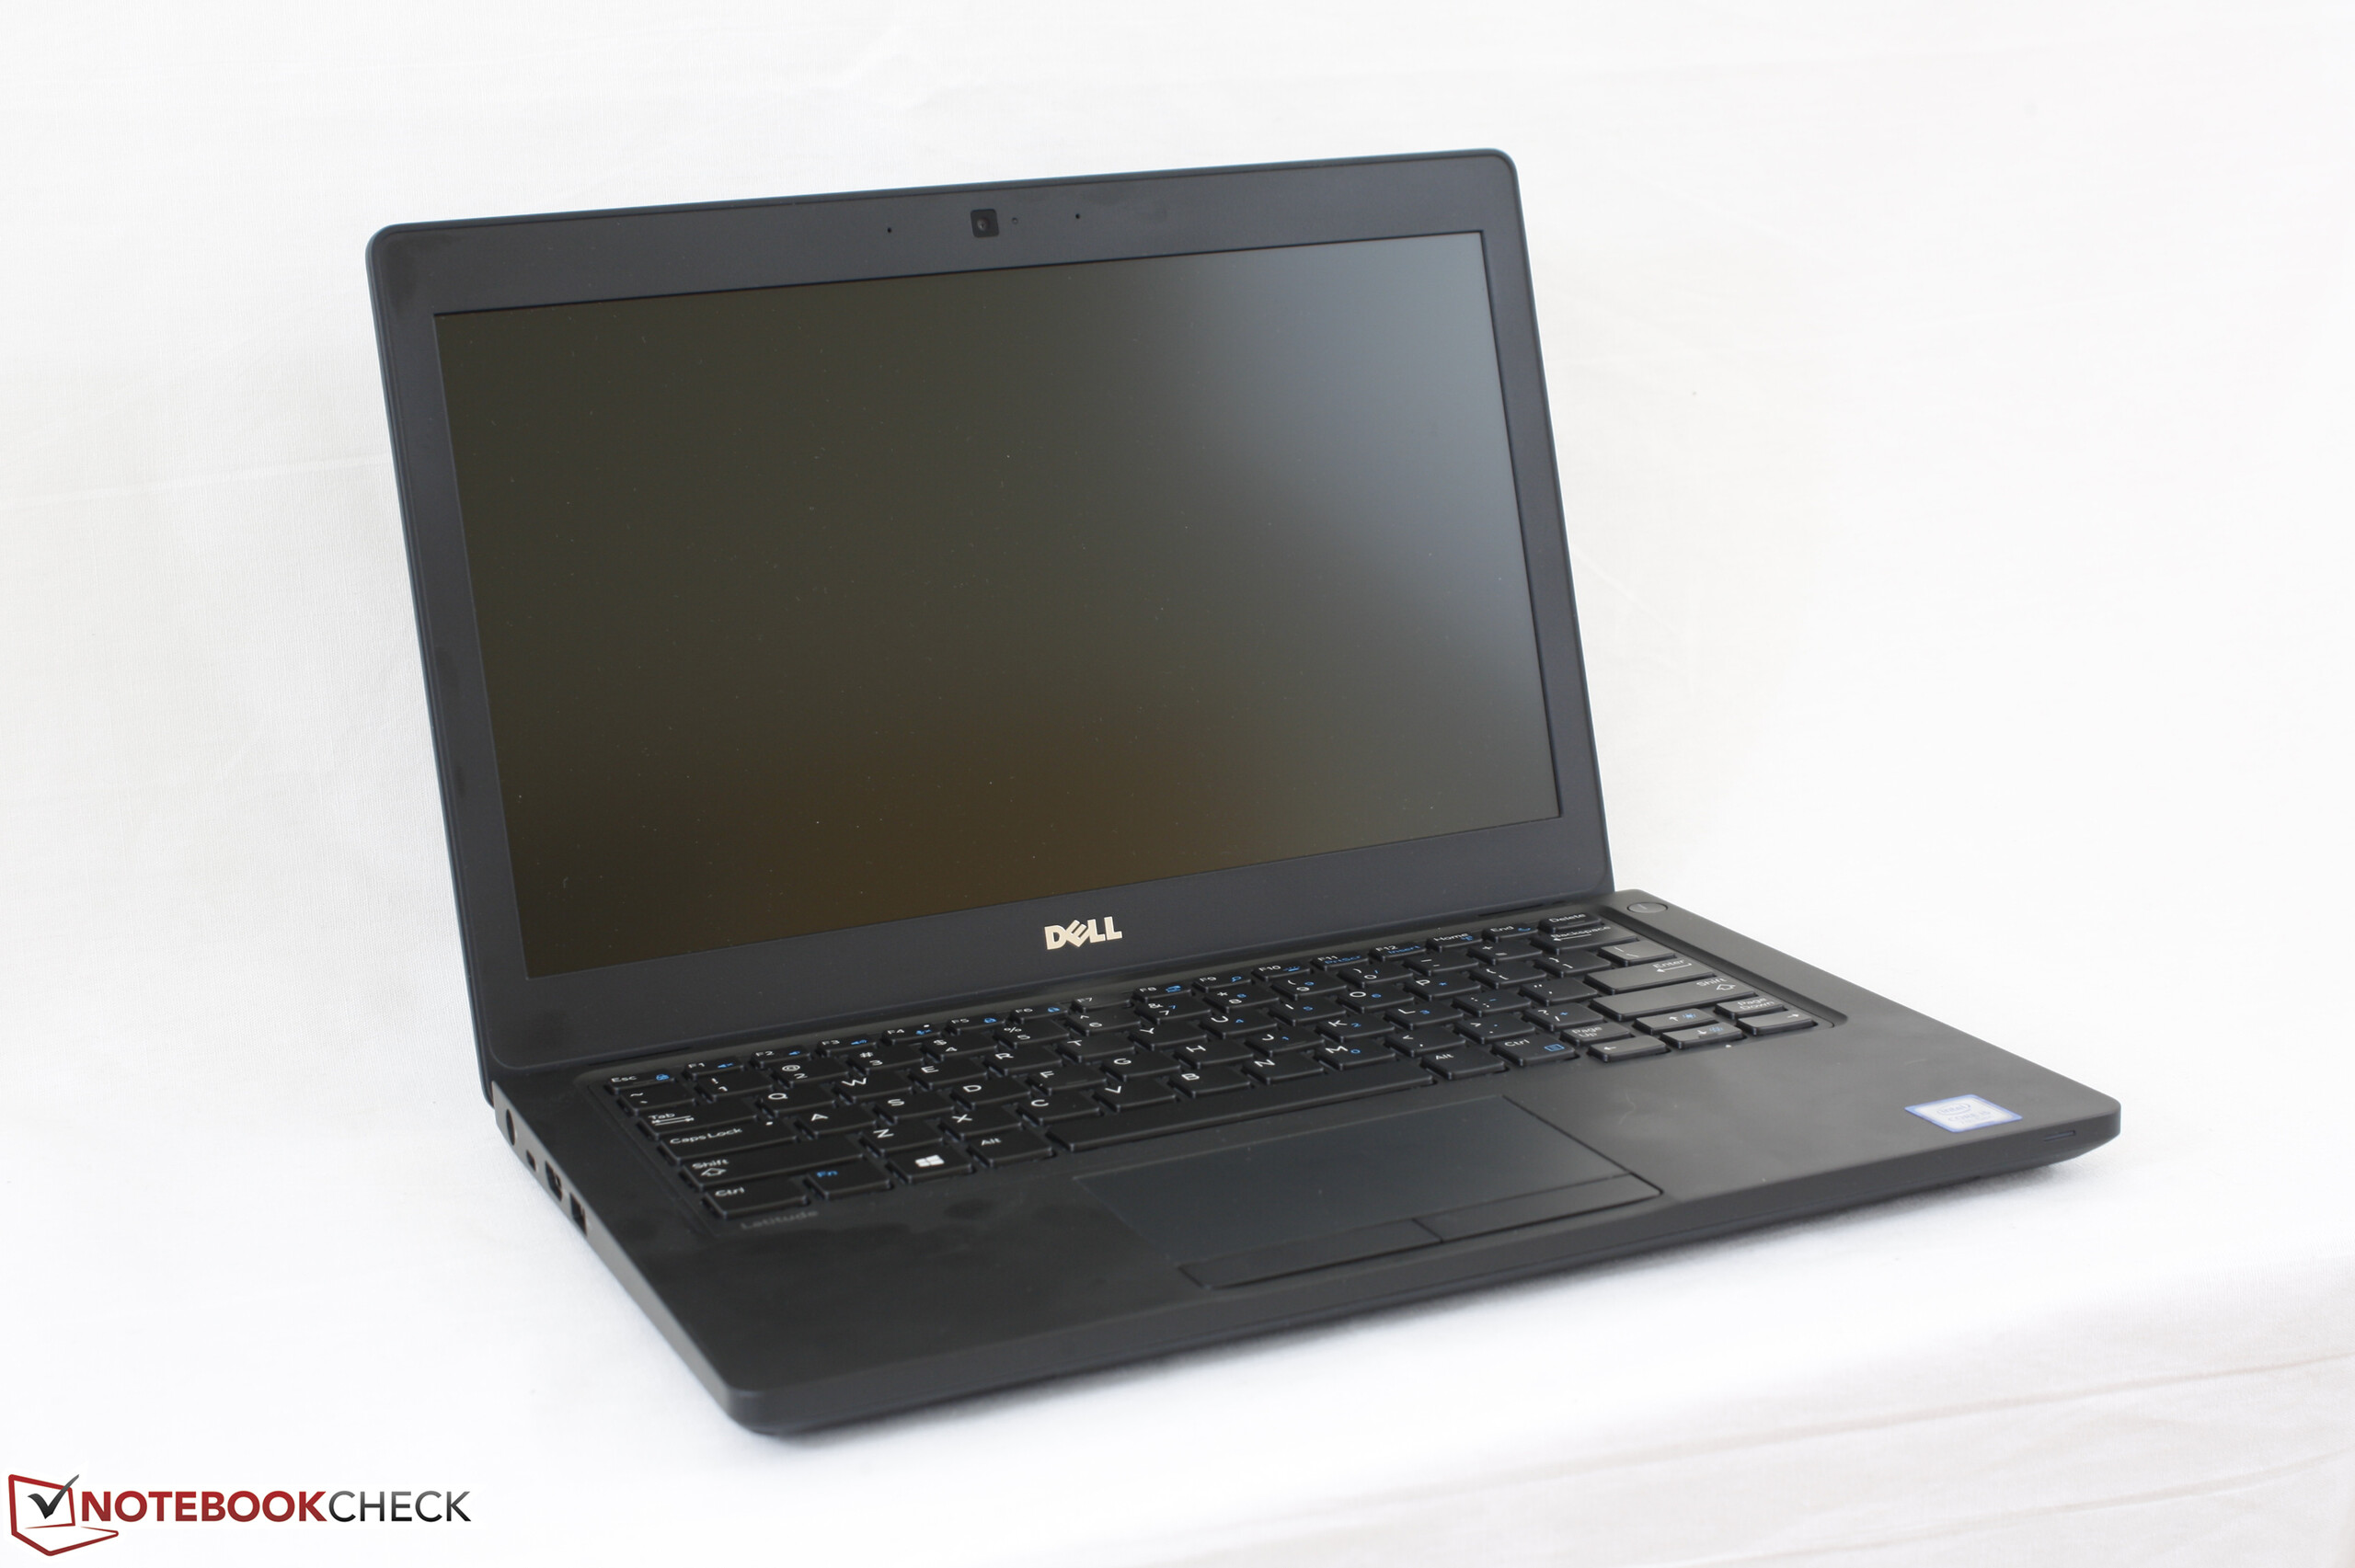
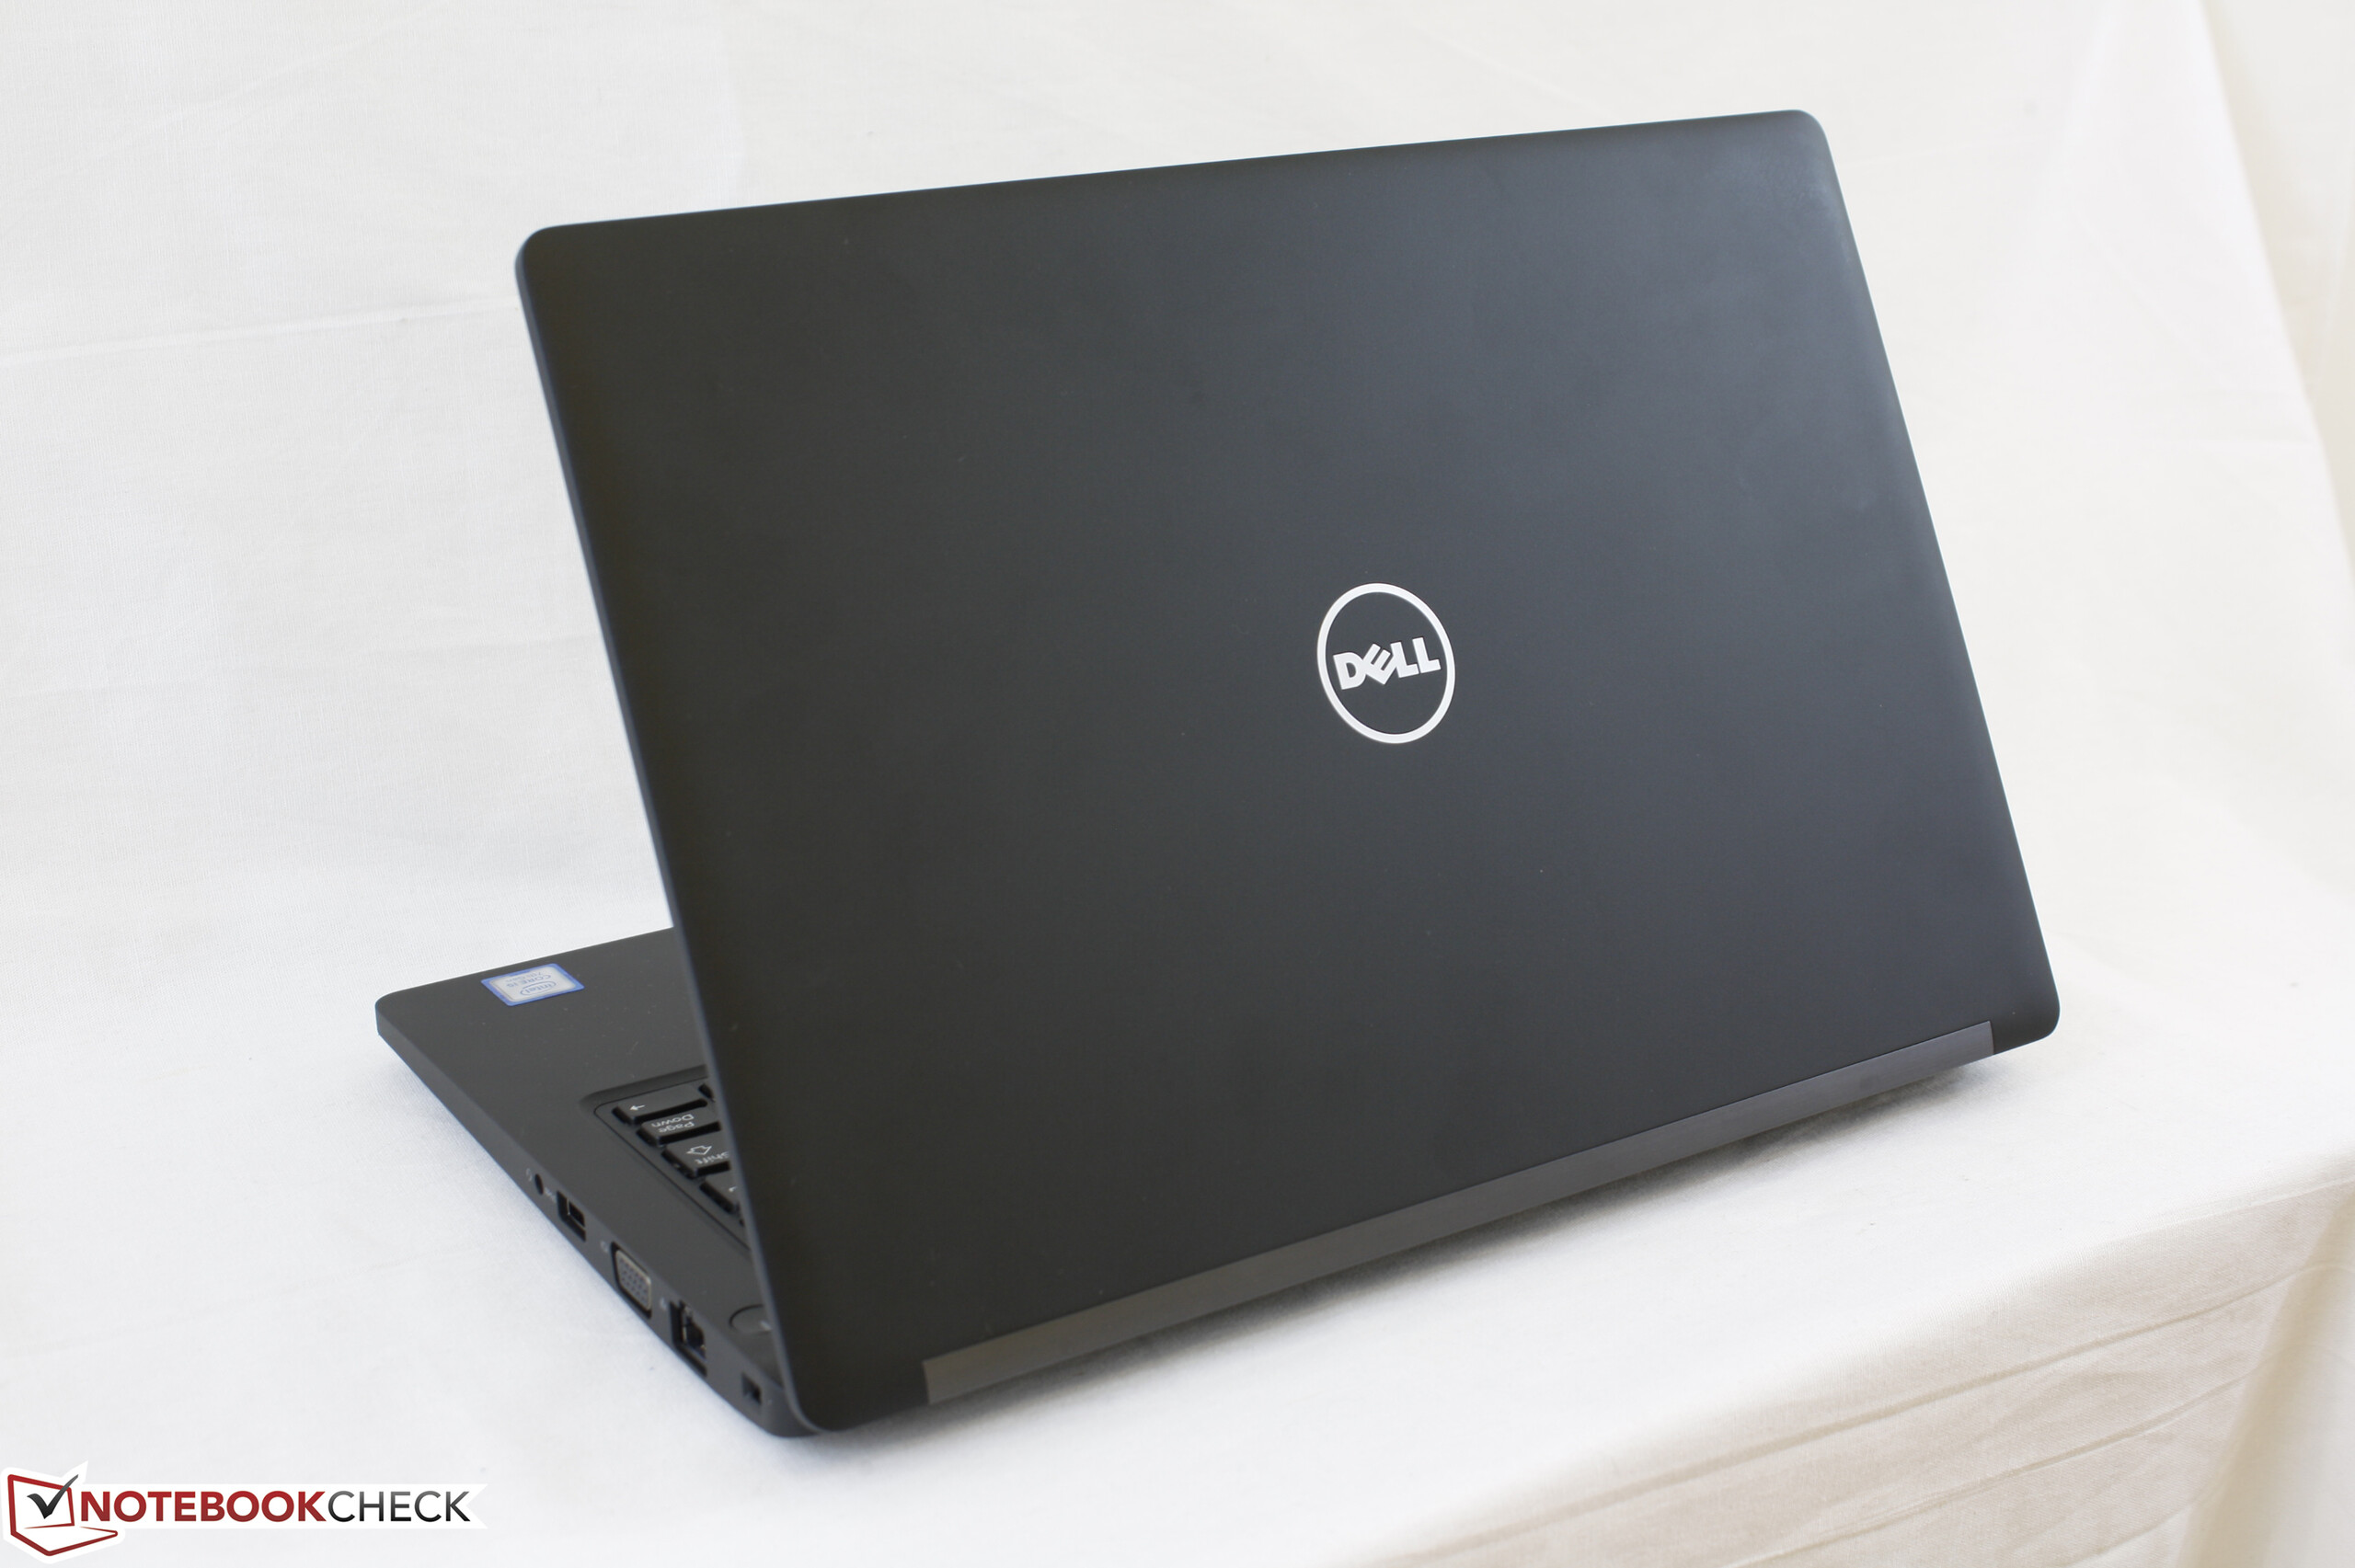
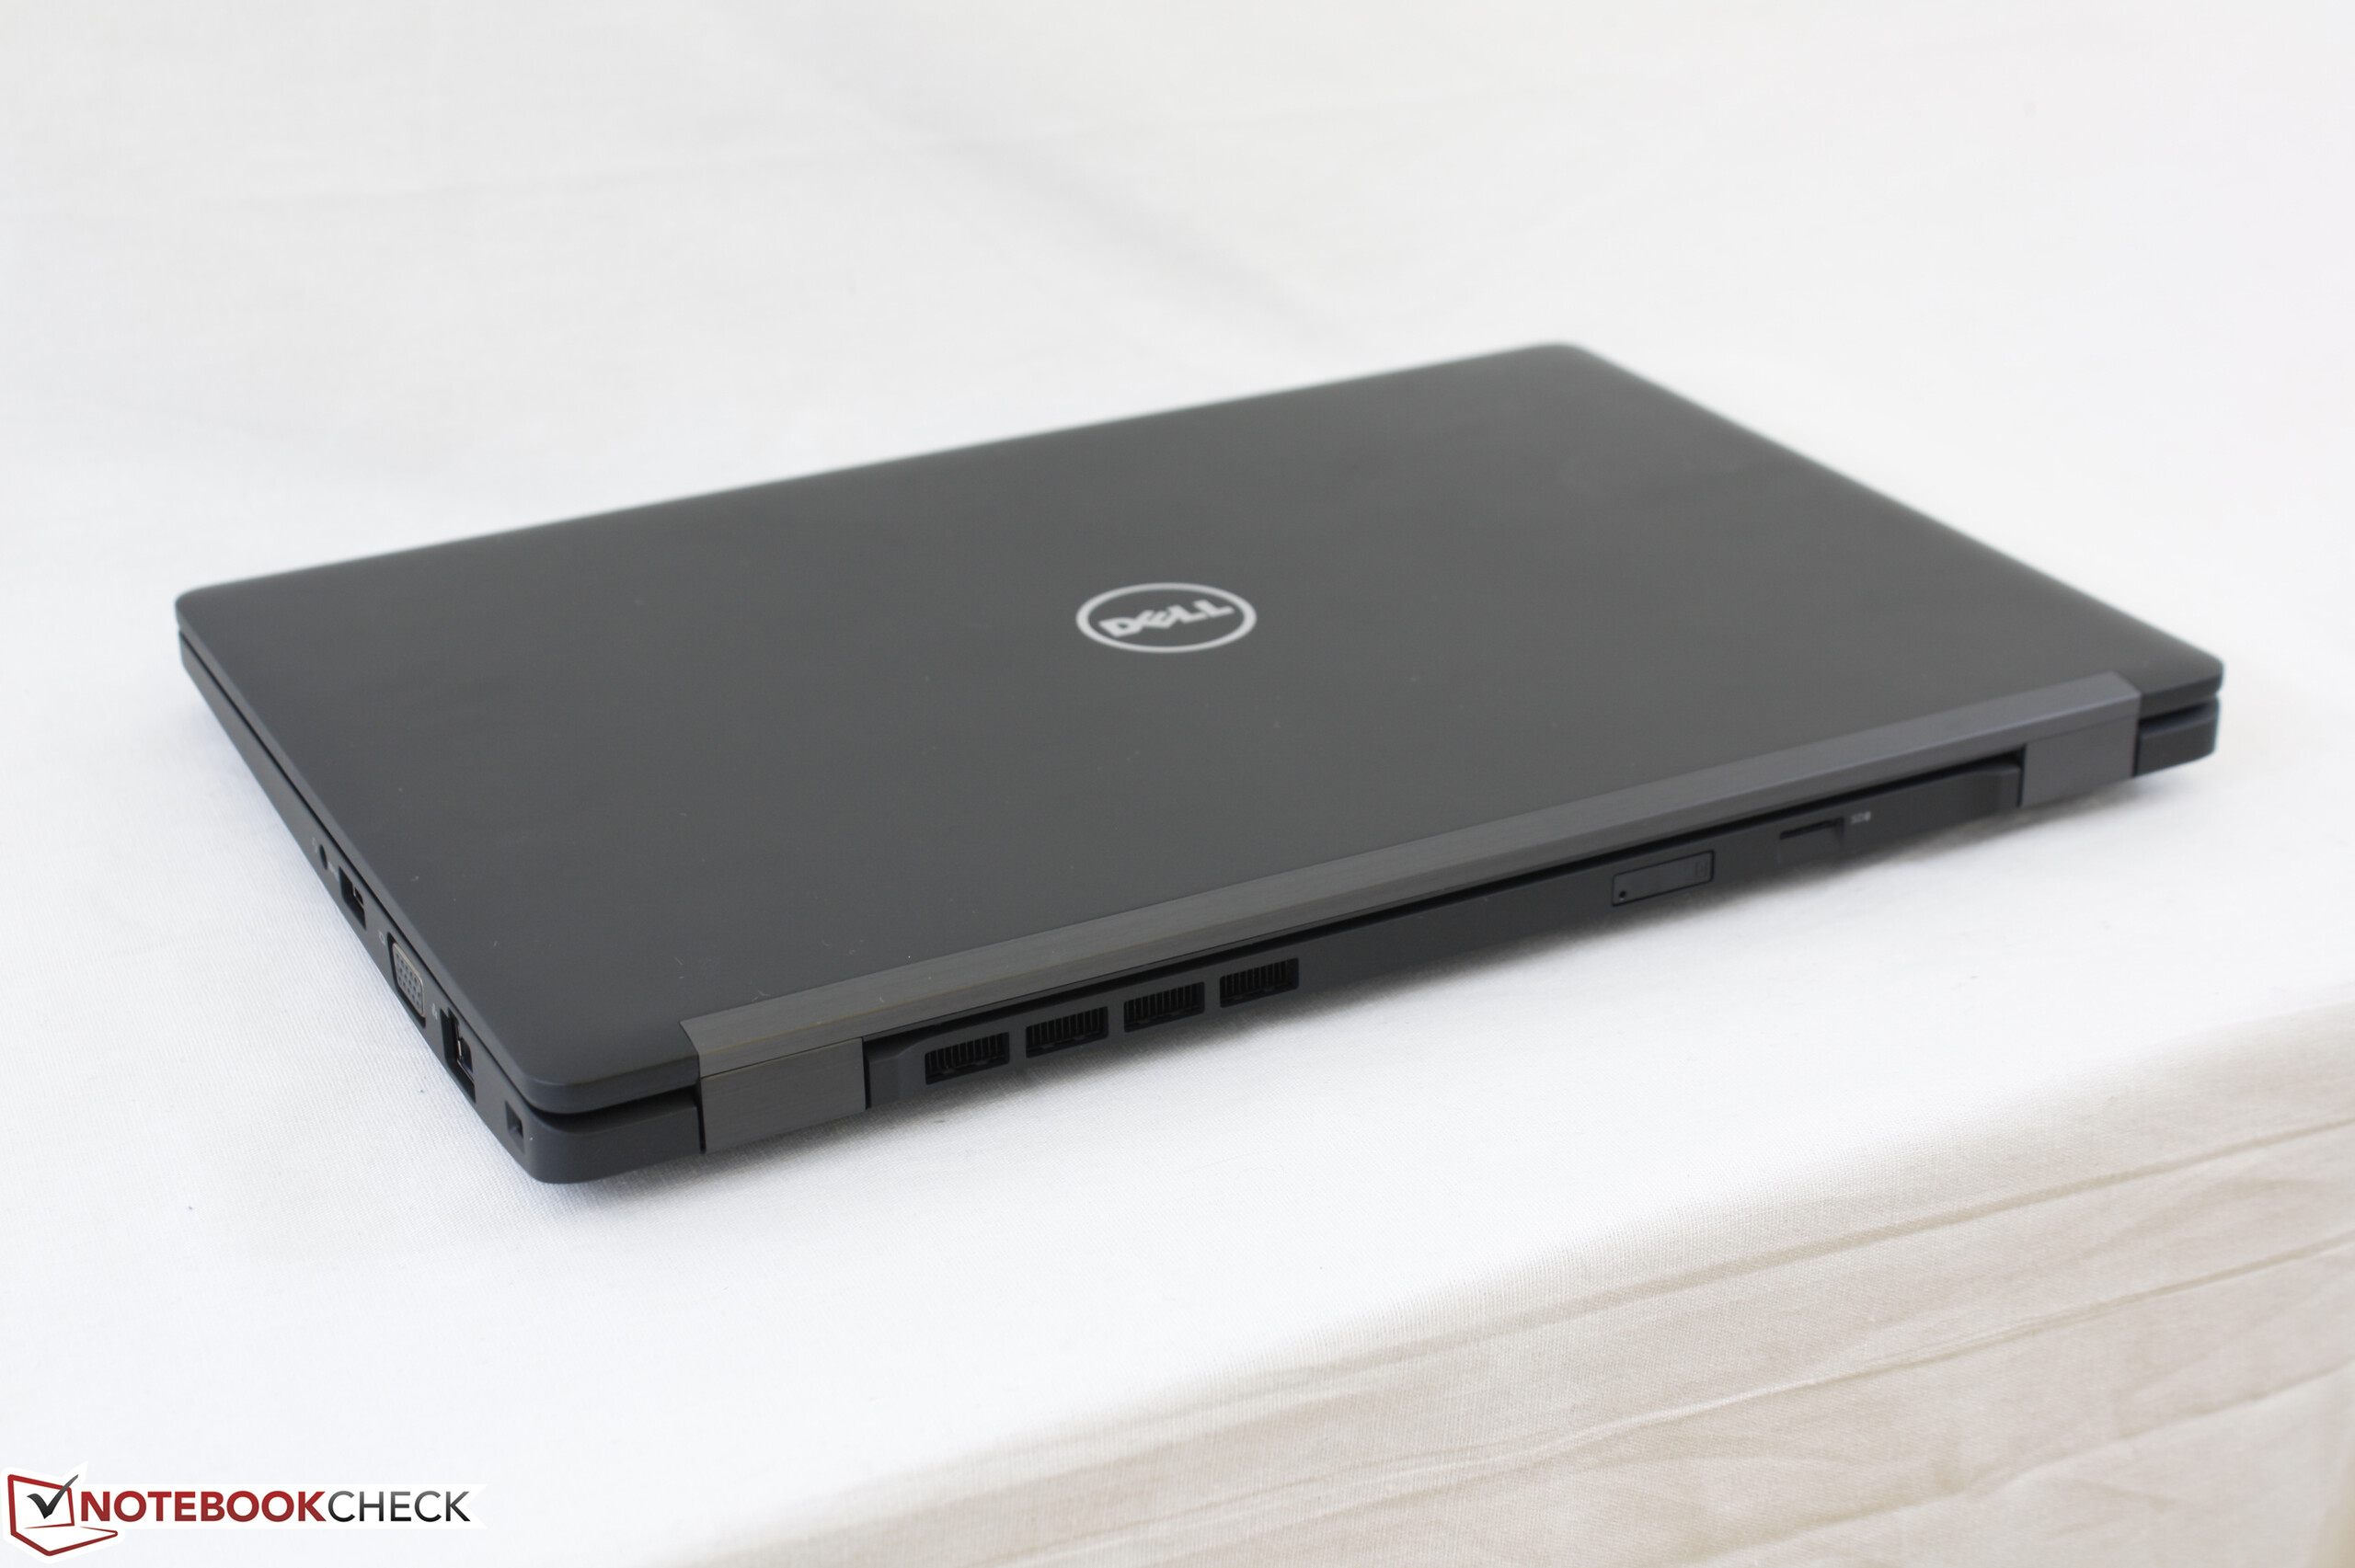
Courte critique du Dell Latitude 5280 (7200U, HD)

| SD Card Reader | |
| average JPG Copy Test (av. of 3 runs) | |
| Lenovo ThinkPad X270-20HMS00T00 | |
| HP EliteBook 725 G4 | |
| Dell Latitude 5280 | |
| maximum AS SSD Seq Read Test (1GB) | |
| Dell Latitude 5280 | |
| Lenovo ThinkPad X270-20HMS00T00 | |
| HP EliteBook 725 G4 | |
| Networking | |
| iperf3 transmit AX12 | |
| Lenovo ThinkPad X270-20HMS00T00 | |
| Dell Latitude 5289 | |
| Dell Latitude 5280 | |
| iperf3 receive AX12 | |
| Lenovo ThinkPad X270-20HMS00T00 | |
| Dell Latitude 5280 | |
| Dell Latitude 5289 | |
| |||||||||||||||||||||||||
Homogénéité de la luminosité: 90 %
Valeur mesurée au centre, sur batterie: 251.8 cd/m²
Contraste: 336:1 (Valeurs des noirs: 0.75 cd/m²)
ΔE ColorChecker Calman: 11.3 | ∀{0.5-29.43 Ø4.71}
ΔE Greyscale Calman: 13.2 | ∀{0.09-98 Ø4.96}
59.2% sRGB (Argyll 1.6.3 3D)
37.6% AdobeRGB 1998 (Argyll 1.6.3 3D)
40.67% AdobeRGB 1998 (Argyll 3D)
59.2% sRGB (Argyll 3D)
39.34% Display P3 (Argyll 3D)
Gamma: 2.05
CCT: 14912 K
| Dell Latitude 5280 TN LED, 12.5", 1366x768 | Dell Latitude 5289 BOE NV12N51, IPS LED, 12.5", 1920x1080 | Lenovo ThinkPad X270-20HMS00T00 Innolux N125HCE-GN1, IPS LED, 12.5", 1920x1080 | HP EliteBook 725 G4 AU Optronics, IPS, 12.5", 1920x1080 | Dell Latitude 12 E5270 BOE05F4, TN, 12.5", 1366x768 | |
|---|---|---|---|---|---|
| Display | 9% | 12% | 24% | -1% | |
| Display P3 Coverage (%) | 39.34 | 42.79 9% | 44.6 13% 44.6 13% | 49.16 25% | 39.06 -1% |
| sRGB Coverage (%) | 59.2 | 64.3 9% | 65.9 11% 65.9 11% | 72.3 22% | 58.7 -1% |
| AdobeRGB 1998 Coverage (%) | 40.67 | 44.21 9% | 46.11 13% 46.11 13% | 50.8 25% | 40.36 -1% |
| Response Times | -17% | -14% | -8% | -6% | |
| Response Time Grey 50% / Grey 80% * (ms) | 42 ? | 42 ? -0% | 40.8 ? 3% | 47 ? -12% | 45.2 ? -8% |
| Response Time Black / White * (ms) | 23.2 ? | 31 ? -34% | 30.4 ? -31% | 24 ? -3% | 24 ? -3% |
| PWM Frequency (Hz) | 531 ? | 26040 ? | 1000 ? | ||
| Screen | 55% | 49% | 81% | 9% | |
| Brightness middle (cd/m²) | 251.8 | 336 33% | 283 12% | 329 31% | 161 -36% |
| Brightness (cd/m²) | 246 | 320 30% | 281 14% | 310 26% | 152 -38% |
| Brightness Distribution (%) | 90 | 90 0% | 94 4% | 88 -2% | 90 0% |
| Black Level * (cd/m²) | 0.75 | 0.34 55% | 0.25 67% | 0.19 75% | 0.29 61% |
| Contrast (:1) | 336 | 988 194% | 1132 237% | 1732 415% | 555 65% |
| Colorchecker dE 2000 * | 11.3 | 3.45 69% | 6.1 46% | 2.69 76% | 10.31 9% |
| Colorchecker dE 2000 max. * | 23.1 | 7.95 66% | 15.4 33% | 4.47 81% | 18.58 20% |
| Greyscale dE 2000 * | 13.2 | 1.68 87% | 6 55% | 4.23 68% | 11.3 14% |
| Gamma | 2.05 107% | 2.49 88% | 2.05 107% | 2.21 100% | 2.57 86% |
| CCT | 14912 44% | 6782 96% | 6832 95% | 6011 108% | 13574 48% |
| Color Space (Percent of AdobeRGB 1998) (%) | 37.6 | 41 9% | 42.26 12% | 46 22% | 37.32 -1% |
| Color Space (Percent of sRGB) (%) | 59.2 | 64 8% | 65.43 11% | 72 22% | 58.82 -1% |
| Moyenne finale (programmes/paramètres) | 16% /
36% | 16% /
30% | 32% /
58% | 1% /
5% |
* ... Moindre est la valeur, meilleures sont les performances
Temps de réponse de l'écran
| ↔ Temps de réponse noir à blanc | ||
|---|---|---|
| 23.2 ms ... hausse ↗ et chute ↘ combinées | ↗ 17.2 ms hausse | 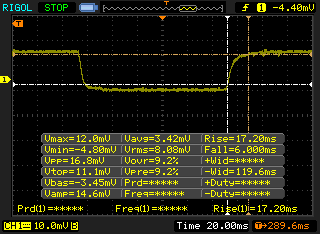 |
| ↘ 6 ms chute | ||
| L'écran montre de bons temps de réponse, mais insuffisant pour du jeu compétitif. En comparaison, tous les appareils testés affichent entre 0.1 (minimum) et 240 (maximum) ms. » 53 % des appareils testés affichent de meilleures performances. Cela signifie que les latences relevées sont moins bonnes que la moyenne (19.8 ms) de tous les appareils testés. | ||
| ↔ Temps de réponse gris 50% à gris 80% | ||
| 42 ms ... hausse ↗ et chute ↘ combinées | ↗ 21.2 ms hausse | 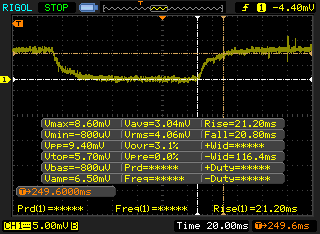 |
| ↘ 20.8 ms chute | ||
| L'écran souffre de latences très élevées, à éviter pour le jeu. En comparaison, tous les appareils testés affichent entre 0.165 (minimum) et 636 (maximum) ms. » 67 % des appareils testés affichent de meilleures performances. Cela signifie que les latences relevées sont moins bonnes que la moyenne (31 ms) de tous les appareils testés. | ||
Scintillement / MLI (Modulation de largeur d'impulsion)
| Scintillement / MLI (Modulation de largeur d'impulsion) non décelé | 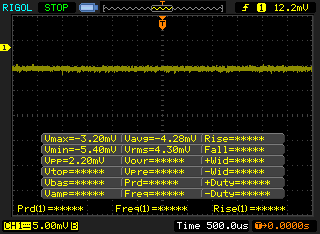 | ||
En comparaison, 52 % des appareils testés n'emploient pas MDI pour assombrir leur écran. Nous avons relevé une moyenne à 7754 (minimum : 5 - maximum : 343500) Hz dans le cas où une MDI était active. | |||
| Cinebench R15 | |
| CPU Single 64Bit | |
| Dell Latitude 7280 | |
| Asus Zenbook UX3410UQ-GV077T | |
| Lenovo ThinkPad T470s-20HF0012US | |
| Lenovo ThinkPad T460s-20FA003GGE | |
| Dell Latitude 5280 | |
| Dell Latitude 5580 | |
| Dell Latitude E7470 N001LE747014EMEA | |
| Lenovo Thinkpad 13-20J1001BUS | |
| HP EliteBook 725 G4 | |
| CPU Multi 64Bit | |
| Lenovo ThinkPad T470s-20HF0012US | |
| Dell Latitude 7280 | |
| Lenovo ThinkPad T460s-20FA003GGE | |
| Asus Zenbook UX3410UQ-GV077T | |
| Dell Latitude 5280 | |
| Dell Latitude 5580 | |
| Dell Latitude E7470 N001LE747014EMEA | |
| Lenovo Thinkpad 13-20J1001BUS | |
| HP EliteBook 725 G4 | |
| Cinebench R11.5 | |
| CPU Single 64Bit | |
| Dell Latitude 7280 | |
| Lenovo ThinkPad T470s-20HF0012US | |
| Lenovo ThinkPad T460s-20FA003GGE | |
| Dell Latitude 5280 | |
| Dell Latitude 5580 | |
| Lenovo Thinkpad 13-20J1001BUS | |
| HP EliteBook 725 G4 | |
| CPU Multi 64Bit | |
| Lenovo ThinkPad T470s-20HF0012US | |
| Dell Latitude 7280 | |
| Lenovo ThinkPad T460s-20FA003GGE | |
| Dell Latitude 5280 | |
| Dell Latitude 5580 | |
| Lenovo Thinkpad 13-20J1001BUS | |
| HP EliteBook 725 G4 | |
| Cinebench R10 | |
| Rendering Multiple CPUs 32Bit | |
| Lenovo ThinkPad T460s-20FA003GGE | |
| Asus Zenbook UX3410UQ-GV077T | |
| Dell Latitude 5280 | |
| Dell Latitude 5580 | |
| Lenovo Thinkpad 13-20J1001BUS | |
| HP EliteBook 725 G4 | |
| Rendering Single 32Bit | |
| Asus Zenbook UX3410UQ-GV077T | |
| Lenovo ThinkPad T460s-20FA003GGE | |
| Dell Latitude 5580 | |
| Dell Latitude 5280 | |
| Lenovo Thinkpad 13-20J1001BUS | |
| HP EliteBook 725 G4 | |
| wPrime 2.10 - 1024m | |
| Lenovo Thinkpad 13-20J1001BUS | |
| Dell Latitude E7470 N001LE747014EMEA | |
| Dell Latitude 7280 | |
| HP EliteBook 725 G4 | |
| Dell Latitude 5580 | |
| Dell Latitude 5280 | |
| Lenovo ThinkPad T470s-20HF0012US | |
* ... Moindre est la valeur, meilleures sont les performances
| PCMark 8 | |
| Home Score Accelerated v2 | |
| Lenovo ThinkPad X270-20HMS00T00 | |
| Dell Latitude 5289 | |
| Dell Latitude 5280 | |
| Dell Latitude 12 E5270 | |
| HP EliteBook 725 G4 | |
| Work Score Accelerated v2 | |
| Dell Latitude 5289 | |
| Lenovo ThinkPad X270-20HMS00T00 | |
| Dell Latitude 5280 | |
| Dell Latitude 12 E5270 | |
| HP EliteBook 725 G4 | |
| Creative Score Accelerated v2 | |
| Dell Latitude 5280 | |
| Dell Latitude 12 E5270 | |
| HP EliteBook 725 G4 | |
| PCMark 8 Home Score Accelerated v2 | 3409 points | |
| PCMark 8 Creative Score Accelerated v2 | 3928 points | |
| PCMark 8 Work Score Accelerated v2 | 4365 points | |
Aide | ||
| Dell Latitude 5280 Toshiba MQ01ACF050 | Dell Latitude 5289 SanDisk X400 256GB, SATA (SD8SB8U-256G) | Lenovo ThinkPad X270-20HMS00T00 Toshiba NVMe THNSF5512GPUK | HP EliteBook 725 G4 Samsung PM961 MZVLW256HEHP | Dell Latitude 12 E5270 Seagate ST500LM021-1KJ15 | |
|---|---|---|---|---|---|
| CrystalDiskMark 3.0 | 9086% | 18752% | 6641% | -1% | |
| Read Seq (MB/s) | 107.5 | 423.7 294% | 1190 1007% | 1963 1726% | 113.8 6% |
| Write Seq (MB/s) | 95.3 | 406.4 326% | 985 934% | 1409 1378% | 108.5 14% |
| Read 512 (MB/s) | 31.13 | 260.8 738% | 858 2656% | 949 2949% | 24.9 -20% |
| Write 512 (MB/s) | 45.49 | 255.6 462% | 528 1061% | 890 1856% | 51.9 14% |
| Read 4k (MB/s) | 0.357 | 22.73 6267% | 35.27 9780% | 29.75 8233% | 0.398 11% |
| Write 4k (MB/s) | 0.827 | 27.92 3276% | 124.5 14954% | 47.35 5626% | 0.654 -21% |
| Read 4k QD32 (MB/s) | 0.737 | 306.2 41447% | 495.3 67105% | 139.7 18855% | 0.798 8% |
| Write 4k QD32 (MB/s) | 0.795 | 158.8 19875% | 418.3 52516% | 100.2 12504% | 0.636 -20% |

| 3DMark 11 | |
| 1280x720 Performance GPU | |
| Intel Skull Canyon NUC6i7KYK | |
| Dell Latitude 7480 | |
| Acer Swift 3 SF314-51-731X | |
| Dell Latitude 5280 | |
| Dell Latitude 5580 | |
| Dell XPS 13 9365-4537 2-in-1 | |
| Lenovo Yoga 900S-12ISK-80ML | |
| 1280x720 Performance Combined | |
| Intel Skull Canyon NUC6i7KYK | |
| Dell Latitude 7480 | |
| Acer Swift 3 SF314-51-731X | |
| Dell XPS 13 9365-4537 2-in-1 | |
| Dell Latitude 5280 | |
| Dell Latitude 5580 | |
| Lenovo Yoga 900S-12ISK-80ML | |
| 3DMark | |
| 1280x720 Cloud Gate Standard Graphics | |
| Intel Skull Canyon NUC6i7KYK | |
| Dell Latitude 7480 | |
| Acer Swift 3 SF314-51-731X | |
| Dell Latitude 5280 | |
| Dell Latitude 5580 | |
| Lenovo Yoga 900S-12ISK-80ML | |
| 1920x1080 Fire Strike Graphics | |
| Intel Skull Canyon NUC6i7KYK | |
| Dell Latitude 7480 | |
| Dell Latitude 5280 | |
| Dell Latitude 5580 | |
| Lenovo Yoga 900S-12ISK-80ML | |
| 1920x1080 Ice Storm Extreme Graphics | |
| Intel Skull Canyon NUC6i7KYK | |
| Dell Latitude 7480 | |
| Dell Latitude 5280 | |
| Dell Latitude 5580 | |
| Lenovo Yoga 900S-12ISK-80ML | |
| 3DMark 11 Performance | 1378 points | |
| 3DMark Ice Storm Standard Score | 49846 points | |
| 3DMark Cloud Gate Standard Score | 5281 points | |
| 3DMark Fire Strike Score | 633 points | |
Aide | ||
| Bas | Moyen | Élevé | Ultra | |
|---|---|---|---|---|
| BioShock Infinite (2013) | 29.9 | 20.9 | 18 | |
| Rise of the Tomb Raider (2016) | 14 |
Degré de la nuisance sonore
| Au repos |
| 32.6 / 32.7 / 32.7 dB(A) |
| Disque dur |
| 33 dB(A) |
| Fortement sollicité |
| 33.4 / 37 dB(A) |
 | ||
30 dB silencieux 40 dB(A) audible 50 dB(A) bruyant |
||
min: | ||
| Dell Latitude 5280 HD Graphics 620, i5-7200U, Toshiba MQ01ACF050 | Dell Latitude 5289 HD Graphics 620, i5-7300U, SanDisk X400 256GB, SATA (SD8SB8U-256G) | Lenovo ThinkPad X270-20HMS00T00 HD Graphics 620, i5-7200U, Toshiba NVMe THNSF5512GPUK | HP EliteBook 725 G4 Radeon R7 (Bristol Ridge), PRO A12-9800B, Samsung PM961 MZVLW256HEHP | Dell Latitude 12 E5270 HD Graphics 520, 6300U, Seagate ST500LM021-1KJ15 | |
|---|---|---|---|---|---|
| Noise | 1% | 3% | 4% | -1% | |
| arrêt / environnement * (dB) | 27.6 | 30.5 -11% | 29 -5% | 30.4 -10% | 29.2 -6% |
| Idle Minimum * (dB) | 32.6 | 30.5 6% | 29 11% | 30.4 7% | 32.9 -1% |
| Idle Average * (dB) | 32.7 | 30.5 7% | 29 11% | 30.4 7% | 32.9 -1% |
| Idle Maximum * (dB) | 32.7 | 30.5 7% | 30.4 7% | 30.4 7% | 32.9 -1% |
| Load Average * (dB) | 33.4 | 36 -8% | 34.1 -2% | 31.7 5% | 33.7 -1% |
| Load Maximum * (dB) | 37 | 34.6 6% | 37.6 -2% | 34.4 7% | 34.9 6% |
* ... Moindre est la valeur, meilleures sont les performances
(-) La température maximale du côté supérieur est de 48.4 °C / 119 F, par rapport à la moyenne de 35.9 °C / 97 F, allant de 21.4 à 59 °C pour la classe Subnotebook.
(-) Le fond chauffe jusqu'à un maximum de 49.2 °C / 121 F, contre une moyenne de 39.2 °C / 103 F
(+) En utilisation inactive, la température moyenne du côté supérieur est de 25 °C / 77 F, par rapport à la moyenne du dispositif de 30.8 °C / 87 F.
(+) Les repose-poignets et le pavé tactile sont plus froids que la température de la peau avec un maximum de 28.4 °C / 83.1 F et sont donc froids au toucher.
(±) La température moyenne de la zone de l'appui-paume de dispositifs similaires était de 28.2 °C / 82.8 F (-0.2 °C / #-0.3 F).
Dell Latitude 5280 analyse audio
(±) | le niveau sonore du haut-parleur est moyen mais bon (81.1# dB)
Basses 100 - 315 Hz
(-) | presque aucune basse - en moyenne 20.2% plus bas que la médiane
(±) | la linéarité des basses est moyenne (12.4% delta à la fréquence précédente)
Médiums 400 - 2000 Hz
(+) | médiane équilibrée - seulement 4% de la médiane
(±) | la linéarité des médiums est moyenne (9.5% delta à la fréquence précédente)
Aiguës 2 - 16 kHz
(±) | sommets plus élevés - en moyenne 5.8% plus élevés que la médiane
(±) | la linéarité des aigus est moyenne (9.8% delta à la fréquence précédente)
Globalement 100 - 16 000 Hz
(±) | la linéarité du son global est moyenne (25.4% de différence avec la médiane)
Par rapport à la même classe
» 85% de tous les appareils testés de cette catégorie étaient meilleurs, 3% similaires, 11% pires
» Le meilleur avait un delta de 5%, la moyenne était de 18%, le pire était de 53%.
Par rapport à tous les appareils testés
» 78% de tous les appareils testés étaient meilleurs, 5% similaires, 17% pires
» Le meilleur avait un delta de 4%, la moyenne était de 23%, le pire était de 134%.
Apple MacBook 12 (Early 2016) 1.1 GHz analyse audio
(+) | les haut-parleurs peuvent jouer relativement fort (83.6# dB)
Basses 100 - 315 Hz
(±) | basse réduite - en moyenne 11.3% inférieure à la médiane
(±) | la linéarité des basses est moyenne (14.2% delta à la fréquence précédente)
Médiums 400 - 2000 Hz
(+) | médiane équilibrée - seulement 2.4% de la médiane
(+) | les médiums sont linéaires (5.5% delta à la fréquence précédente)
Aiguës 2 - 16 kHz
(+) | des sommets équilibrés - à seulement 2% de la médiane
(+) | les aigus sont linéaires (4.5% delta à la fréquence précédente)
Globalement 100 - 16 000 Hz
(+) | le son global est linéaire (10.2% différence à la médiane)
Par rapport à la même classe
» 7% de tous les appareils testés de cette catégorie étaient meilleurs, 2% similaires, 90% pires
» Le meilleur avait un delta de 5%, la moyenne était de 18%, le pire était de 53%.
Par rapport à tous les appareils testés
» 5% de tous les appareils testés étaient meilleurs, 1% similaires, 94% pires
» Le meilleur avait un delta de 4%, la moyenne était de 23%, le pire était de 134%.
| Éteint/en veille | |
| Au repos | |
| Fortement sollicité |
|
Légende:
min: | |
| Dell Latitude 5280 i5-7200U, HD Graphics 620, Toshiba MQ01ACF050, TN LED, 1366x768, 12.5" | Dell Latitude 5289 i5-7300U, HD Graphics 620, SanDisk X400 256GB, SATA (SD8SB8U-256G), IPS LED, 1920x1080, 12.5" | Lenovo ThinkPad X270-20HMS00T00 i5-7200U, HD Graphics 620, Toshiba NVMe THNSF5512GPUK, IPS LED, 1920x1080, 12.5" | HP EliteBook 725 G4 PRO A12-9800B, Radeon R7 (Bristol Ridge), Samsung PM961 MZVLW256HEHP, IPS, 1920x1080, 12.5" | Dell Latitude 12 E5270 6300U, HD Graphics 520, Seagate ST500LM021-1KJ15, TN, 1366x768, 12.5" | |
|---|---|---|---|---|---|
| Power Consumption | 12% | -1% | 0% | 2% | |
| Idle Minimum * (Watt) | 5.7 | 2.7 53% | 3.5 39% | 4.5 21% | 3.9 32% |
| Idle Average * (Watt) | 6.9 | 5.1 26% | 5.8 16% | 6.3 9% | 6 13% |
| Idle Maximum * (Watt) | 7.1 | 7.6 -7% | 7.6 -7% | 8.3 -17% | 6.6 7% |
| Load Average * (Watt) | 28.3 | 33 -17% | 33.2 -17% | 27.6 2% | 28.9 -2% |
| Load Maximum * (Watt) | 30.2 | 29 4% | 40.4 -34% | 34.5 -14% | 41.7 -38% |
* ... Moindre est la valeur, meilleures sont les performances
| Dell Latitude 5280 i5-7200U, HD Graphics 620, 51 Wh | Dell Latitude 5289 i5-7300U, HD Graphics 620, 60 Wh | Lenovo ThinkPad X270-20HMS00T00 i5-7200U, HD Graphics 620, 46 Wh | HP EliteBook 725 G4 PRO A12-9800B, Radeon R7 (Bristol Ridge), 49 Wh | Dell Latitude 12 E5270 6300U, HD Graphics 520, 47 Wh | |
|---|---|---|---|---|---|
| Autonomie de la batterie | 36% | -22% | -22% | -18% | |
| Reader / Idle (h) | 18.5 | 28.8 56% | 17.1 -8% | 11.7 -37% | 12.9 -30% |
| WiFi v1.3 (h) | 7.8 | 11.8 51% | 5.4 -31% | 6.3 -19% | 6.6 -15% |
| Load (h) | 2.3 | 2.3 0% | 1.7 -26% | 2.1 -9% | 2.1 -9% |
Points positifs
Points négatifs
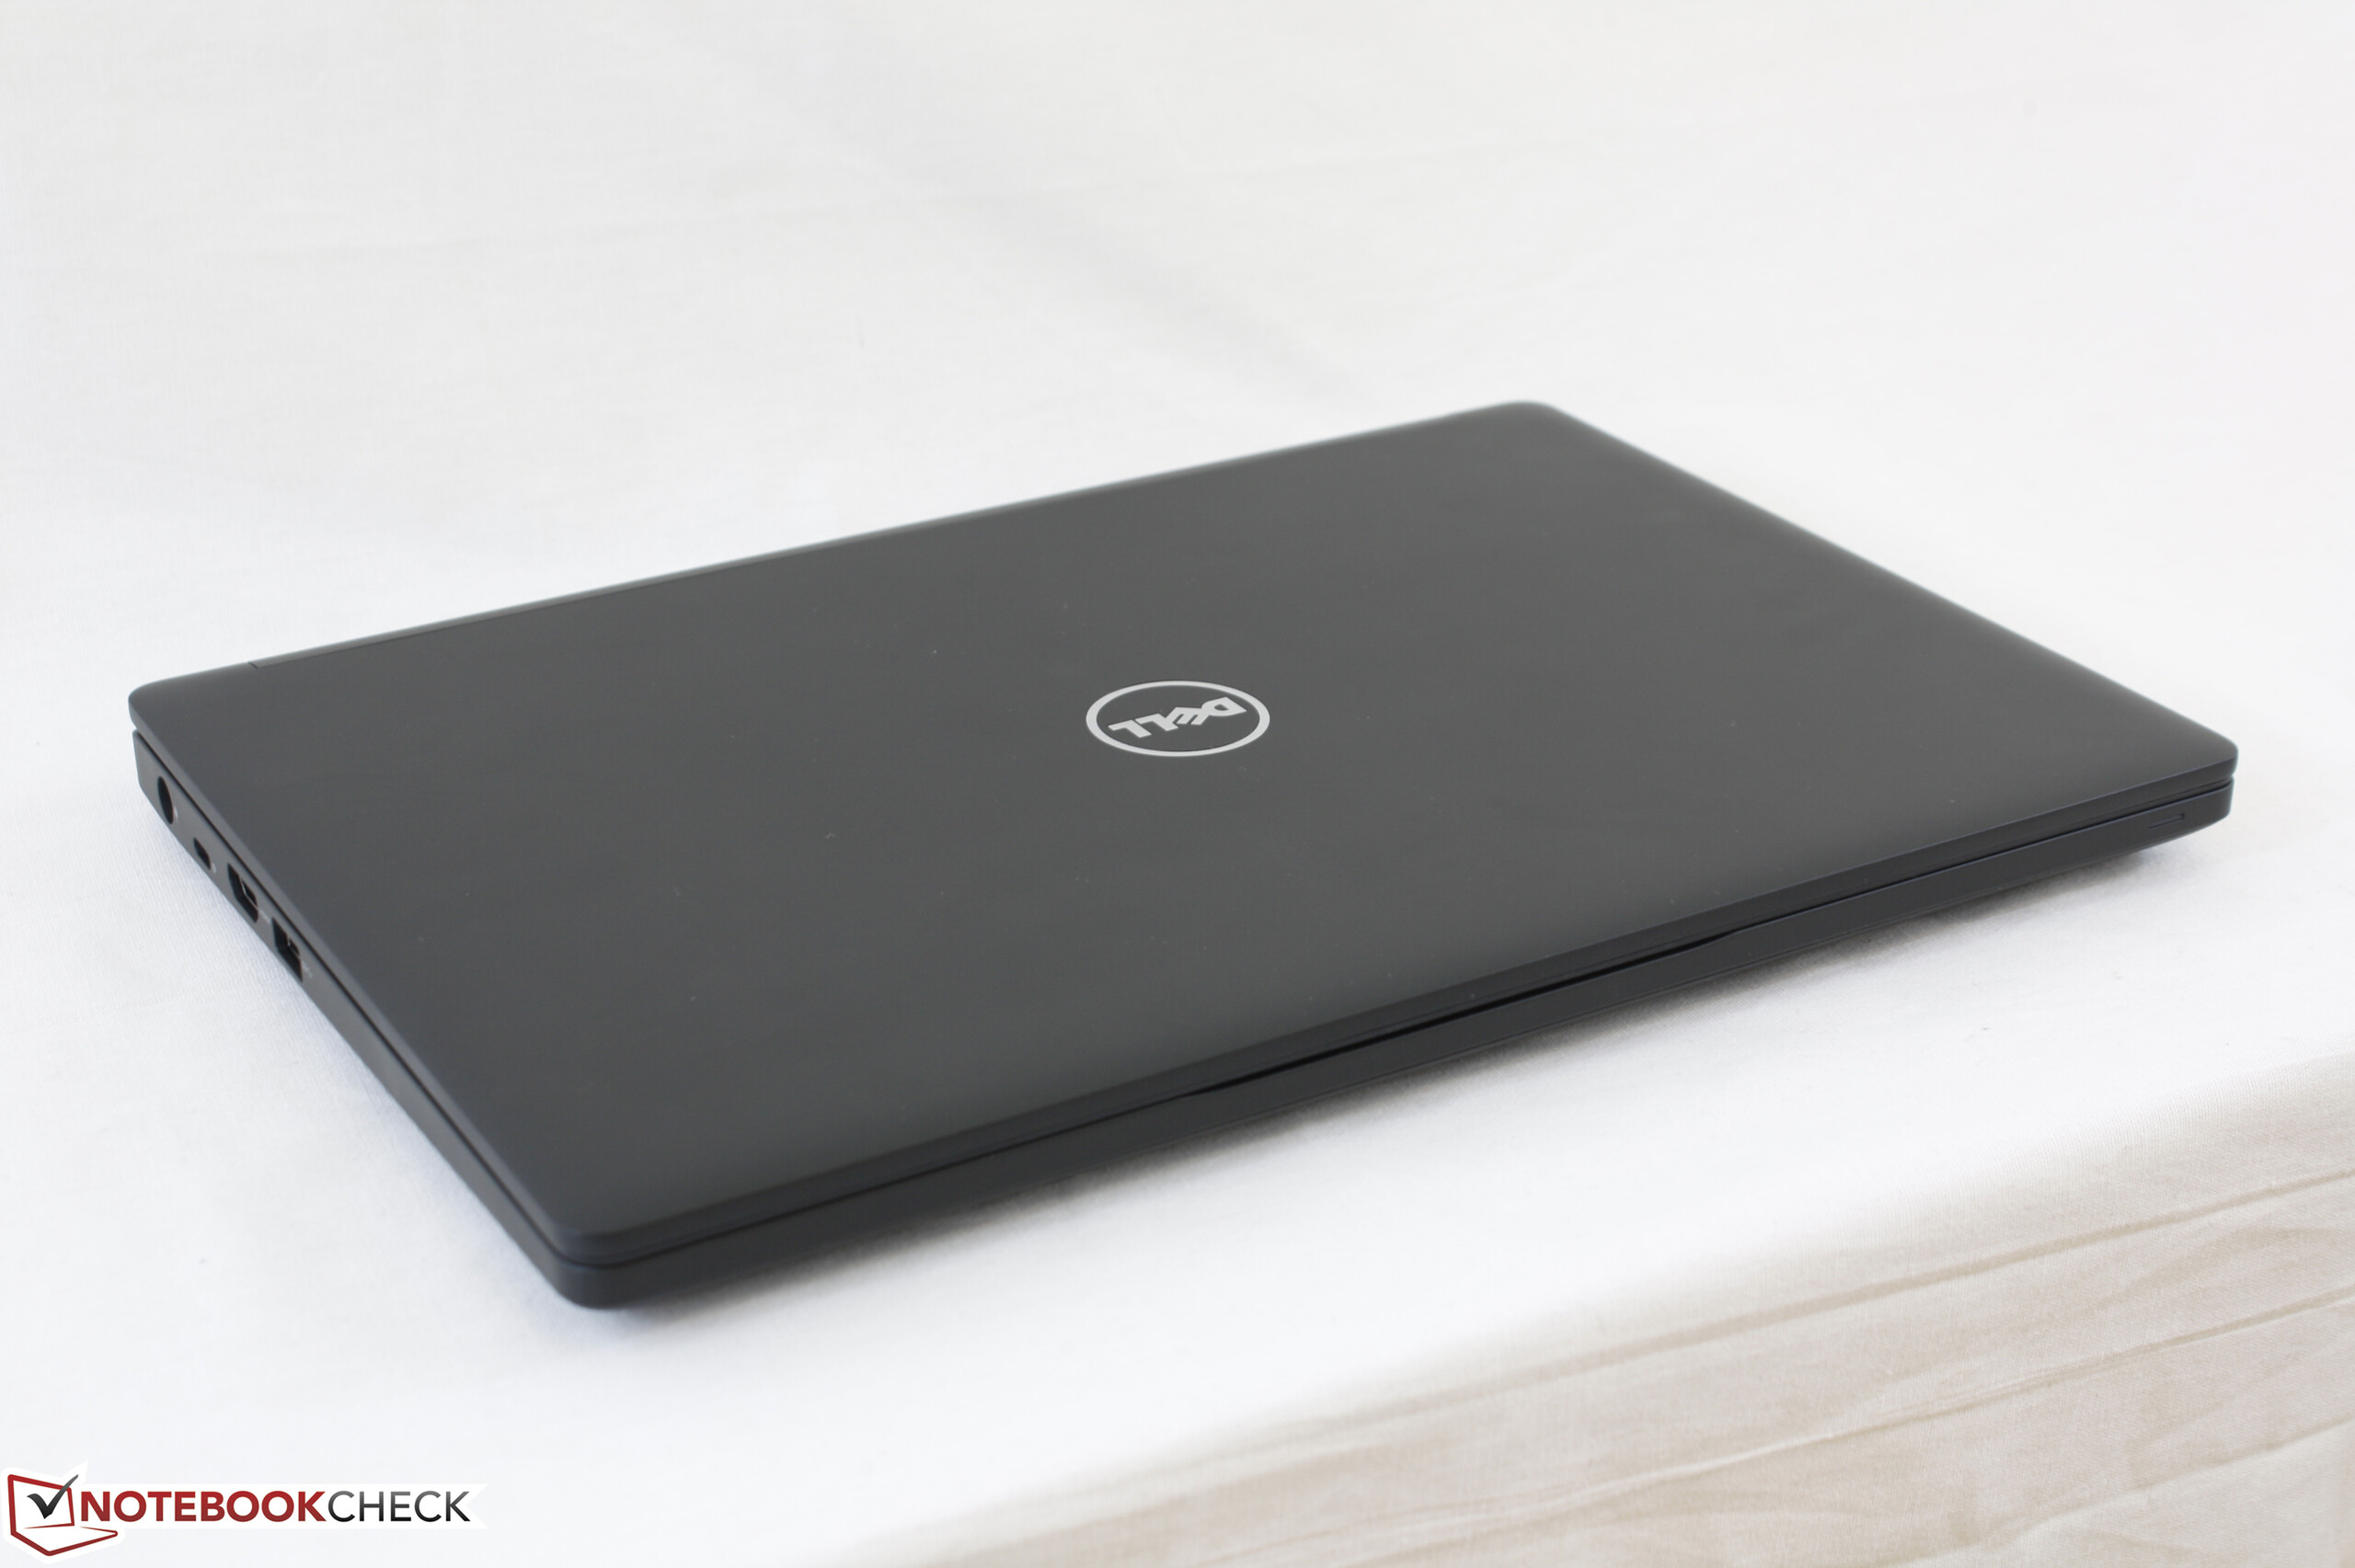
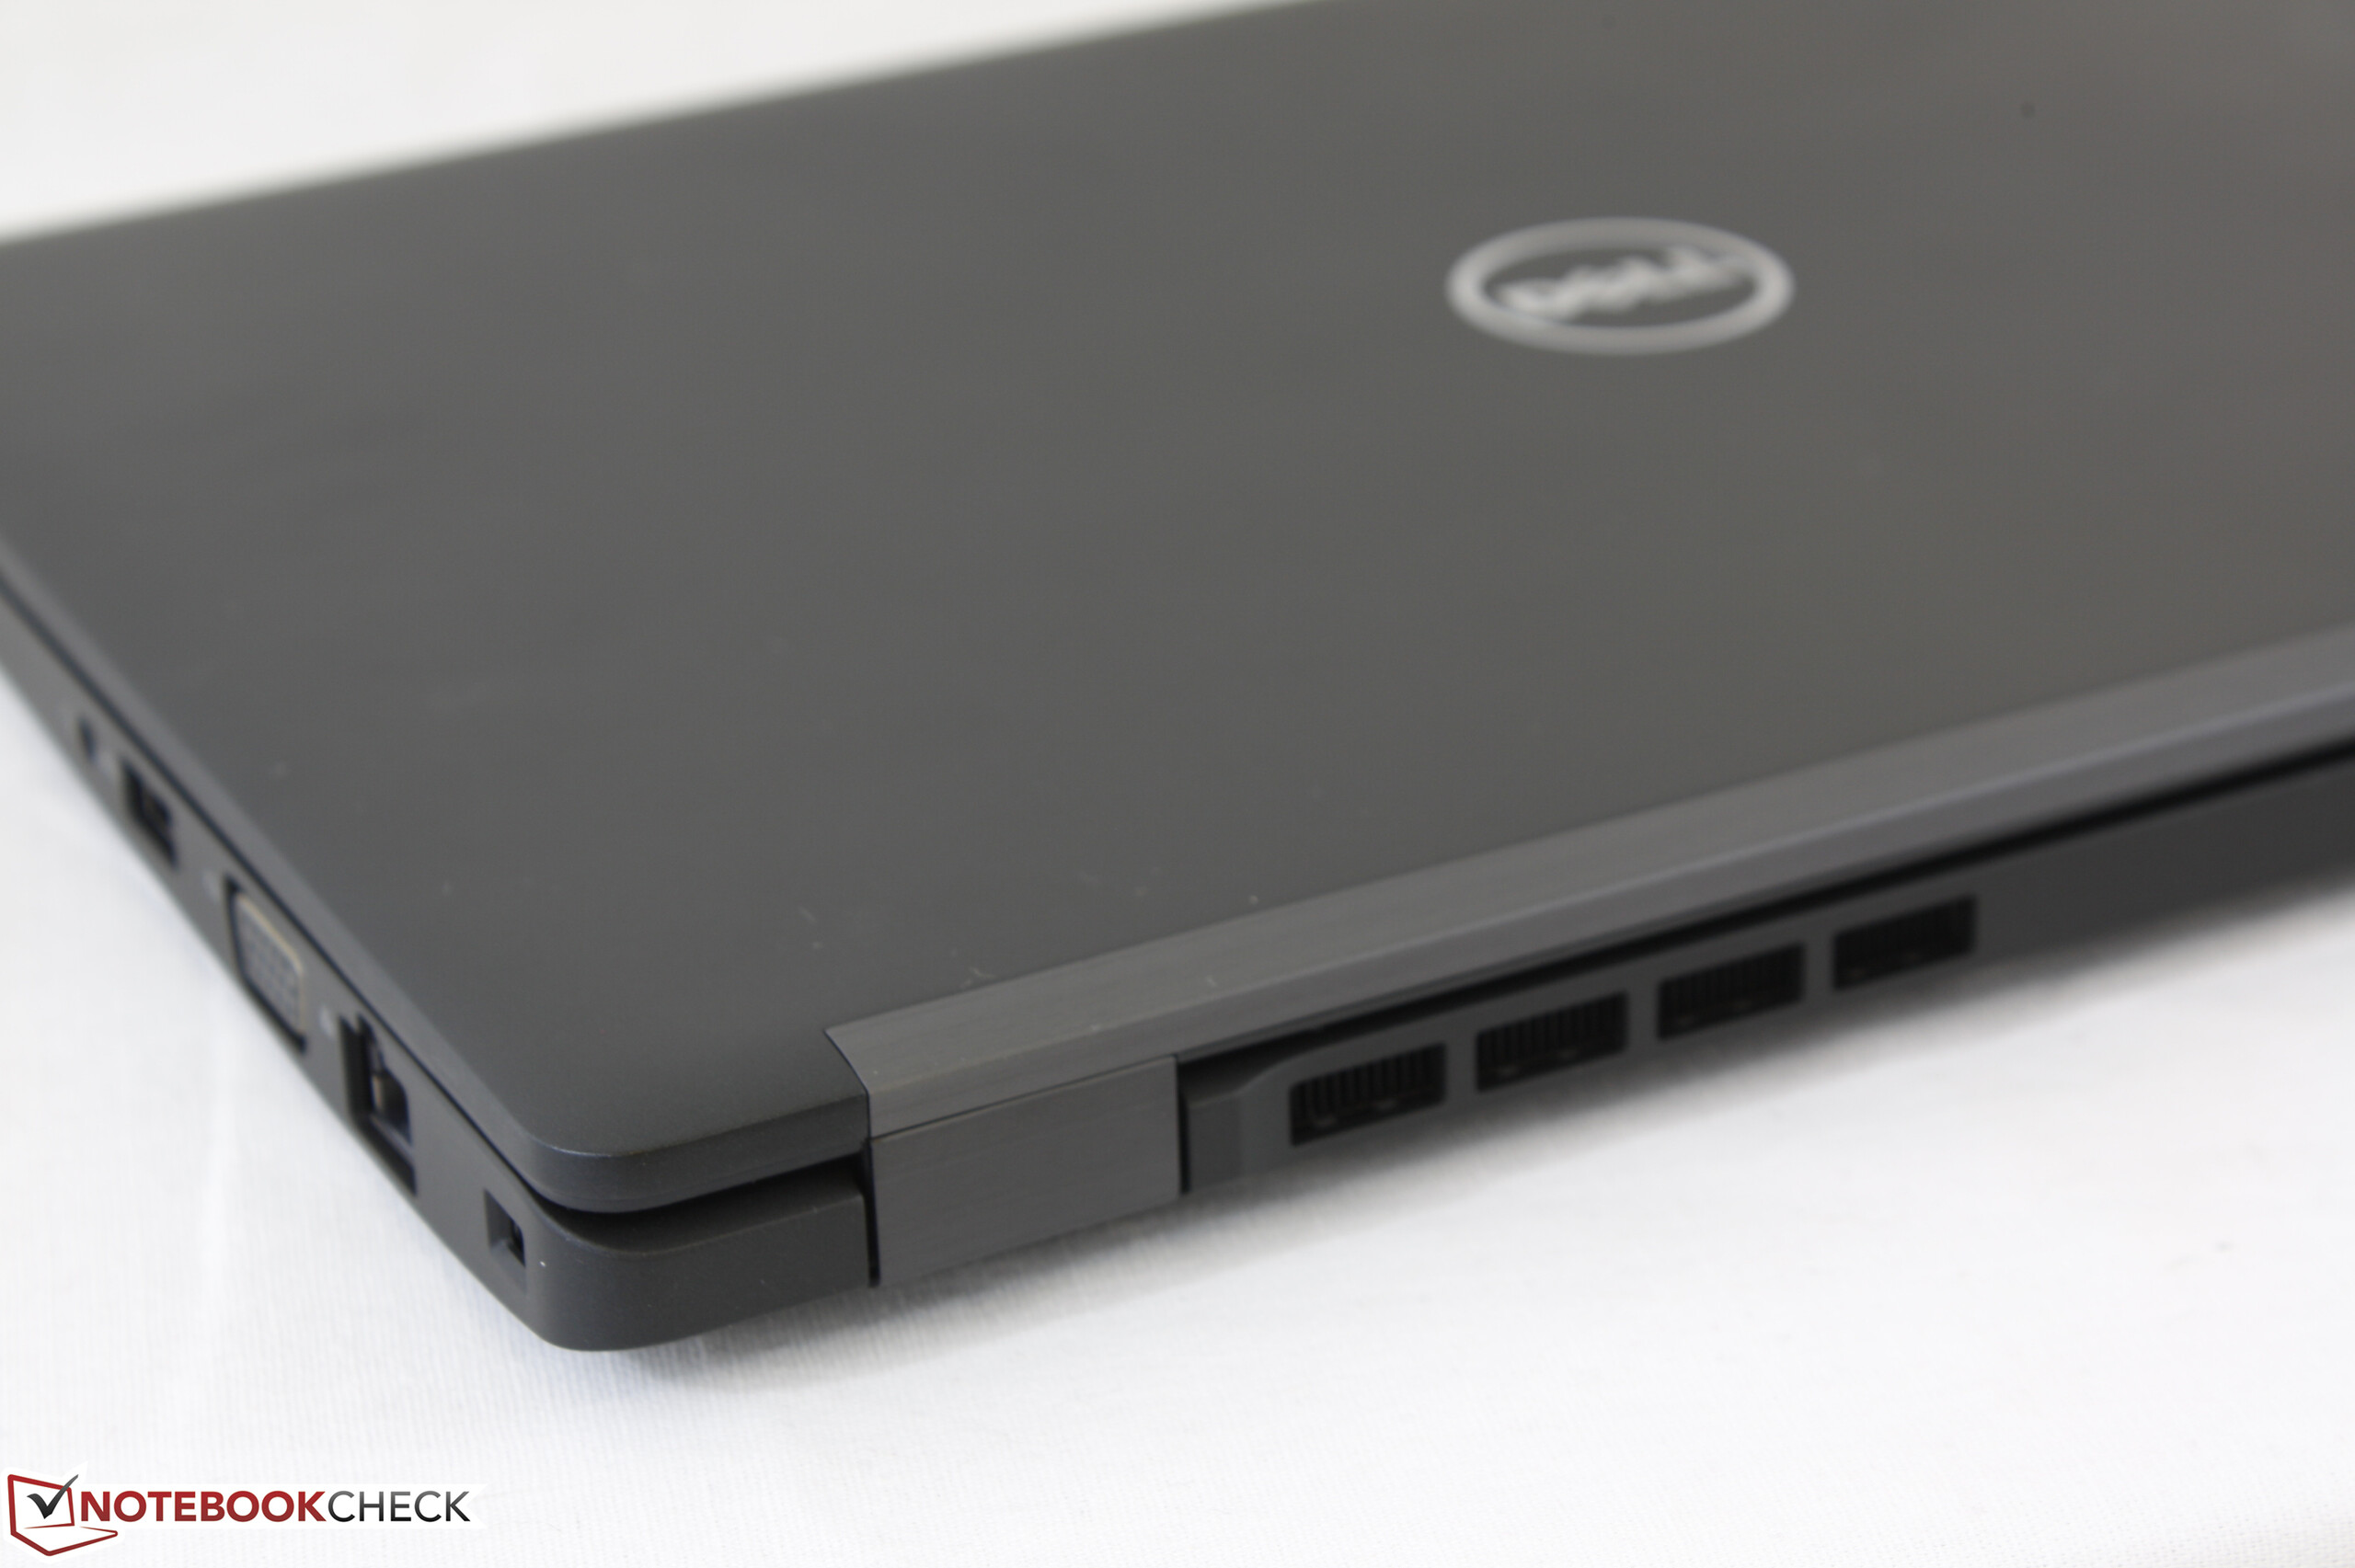
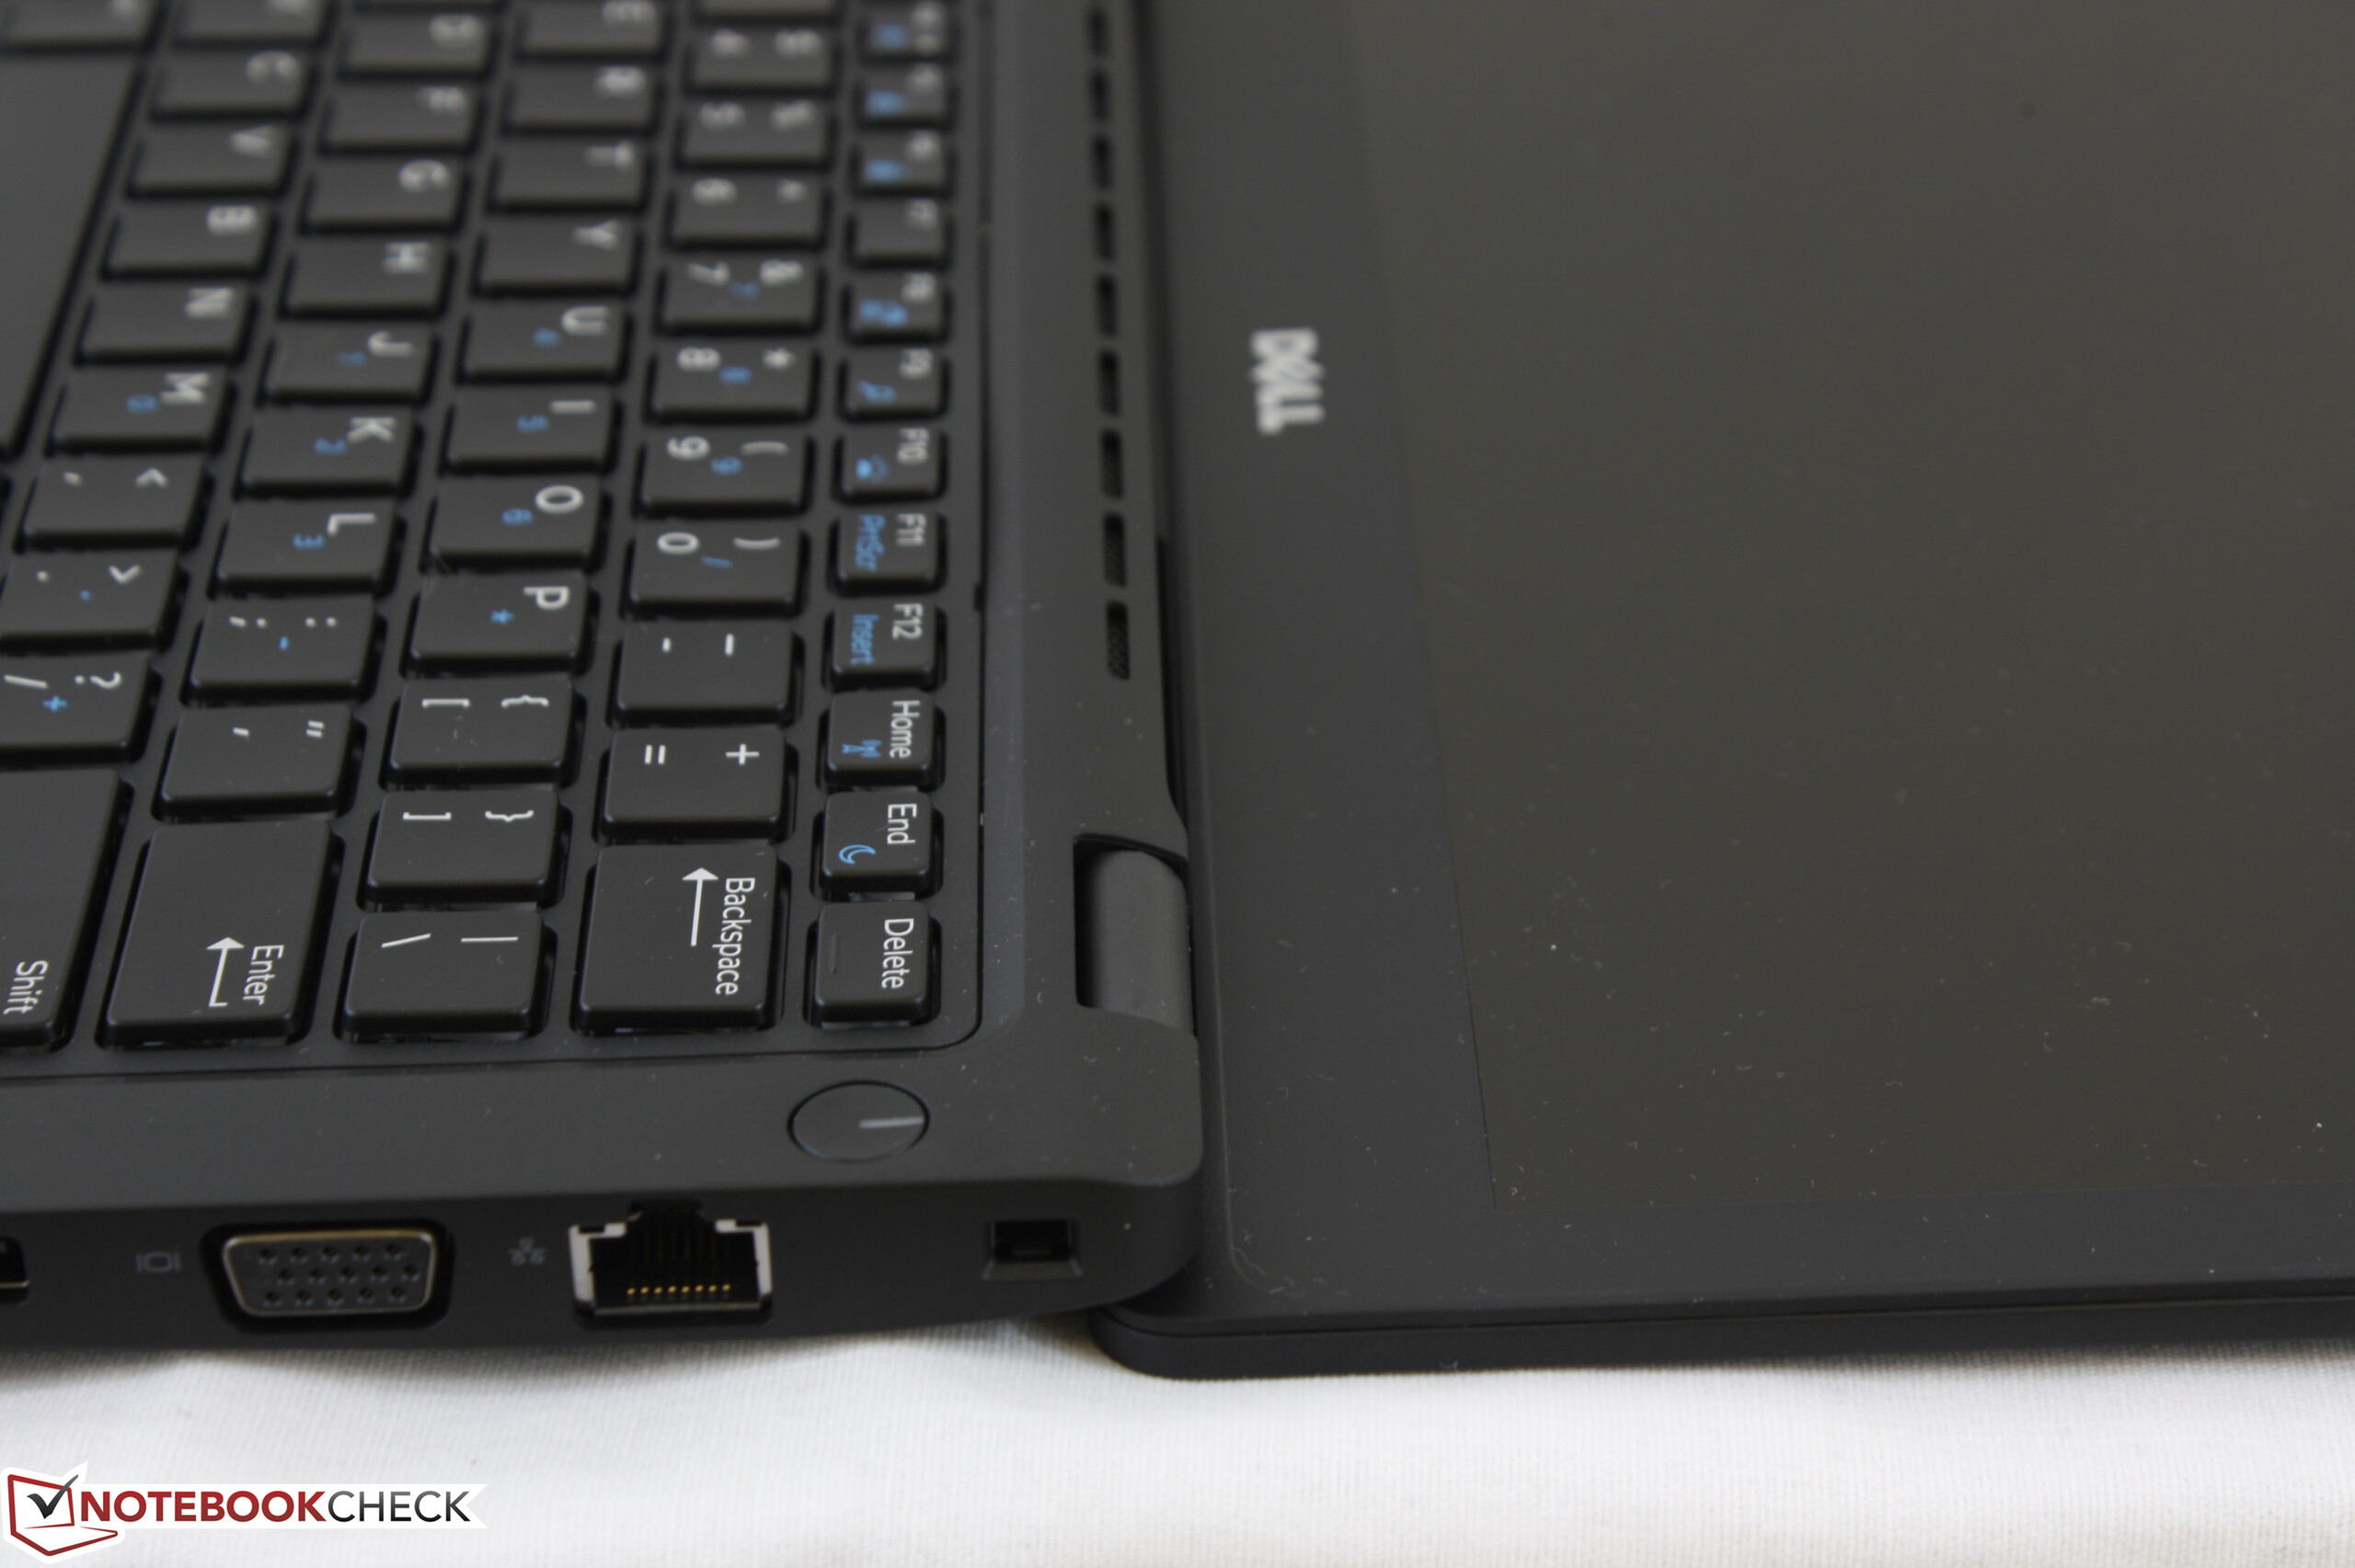
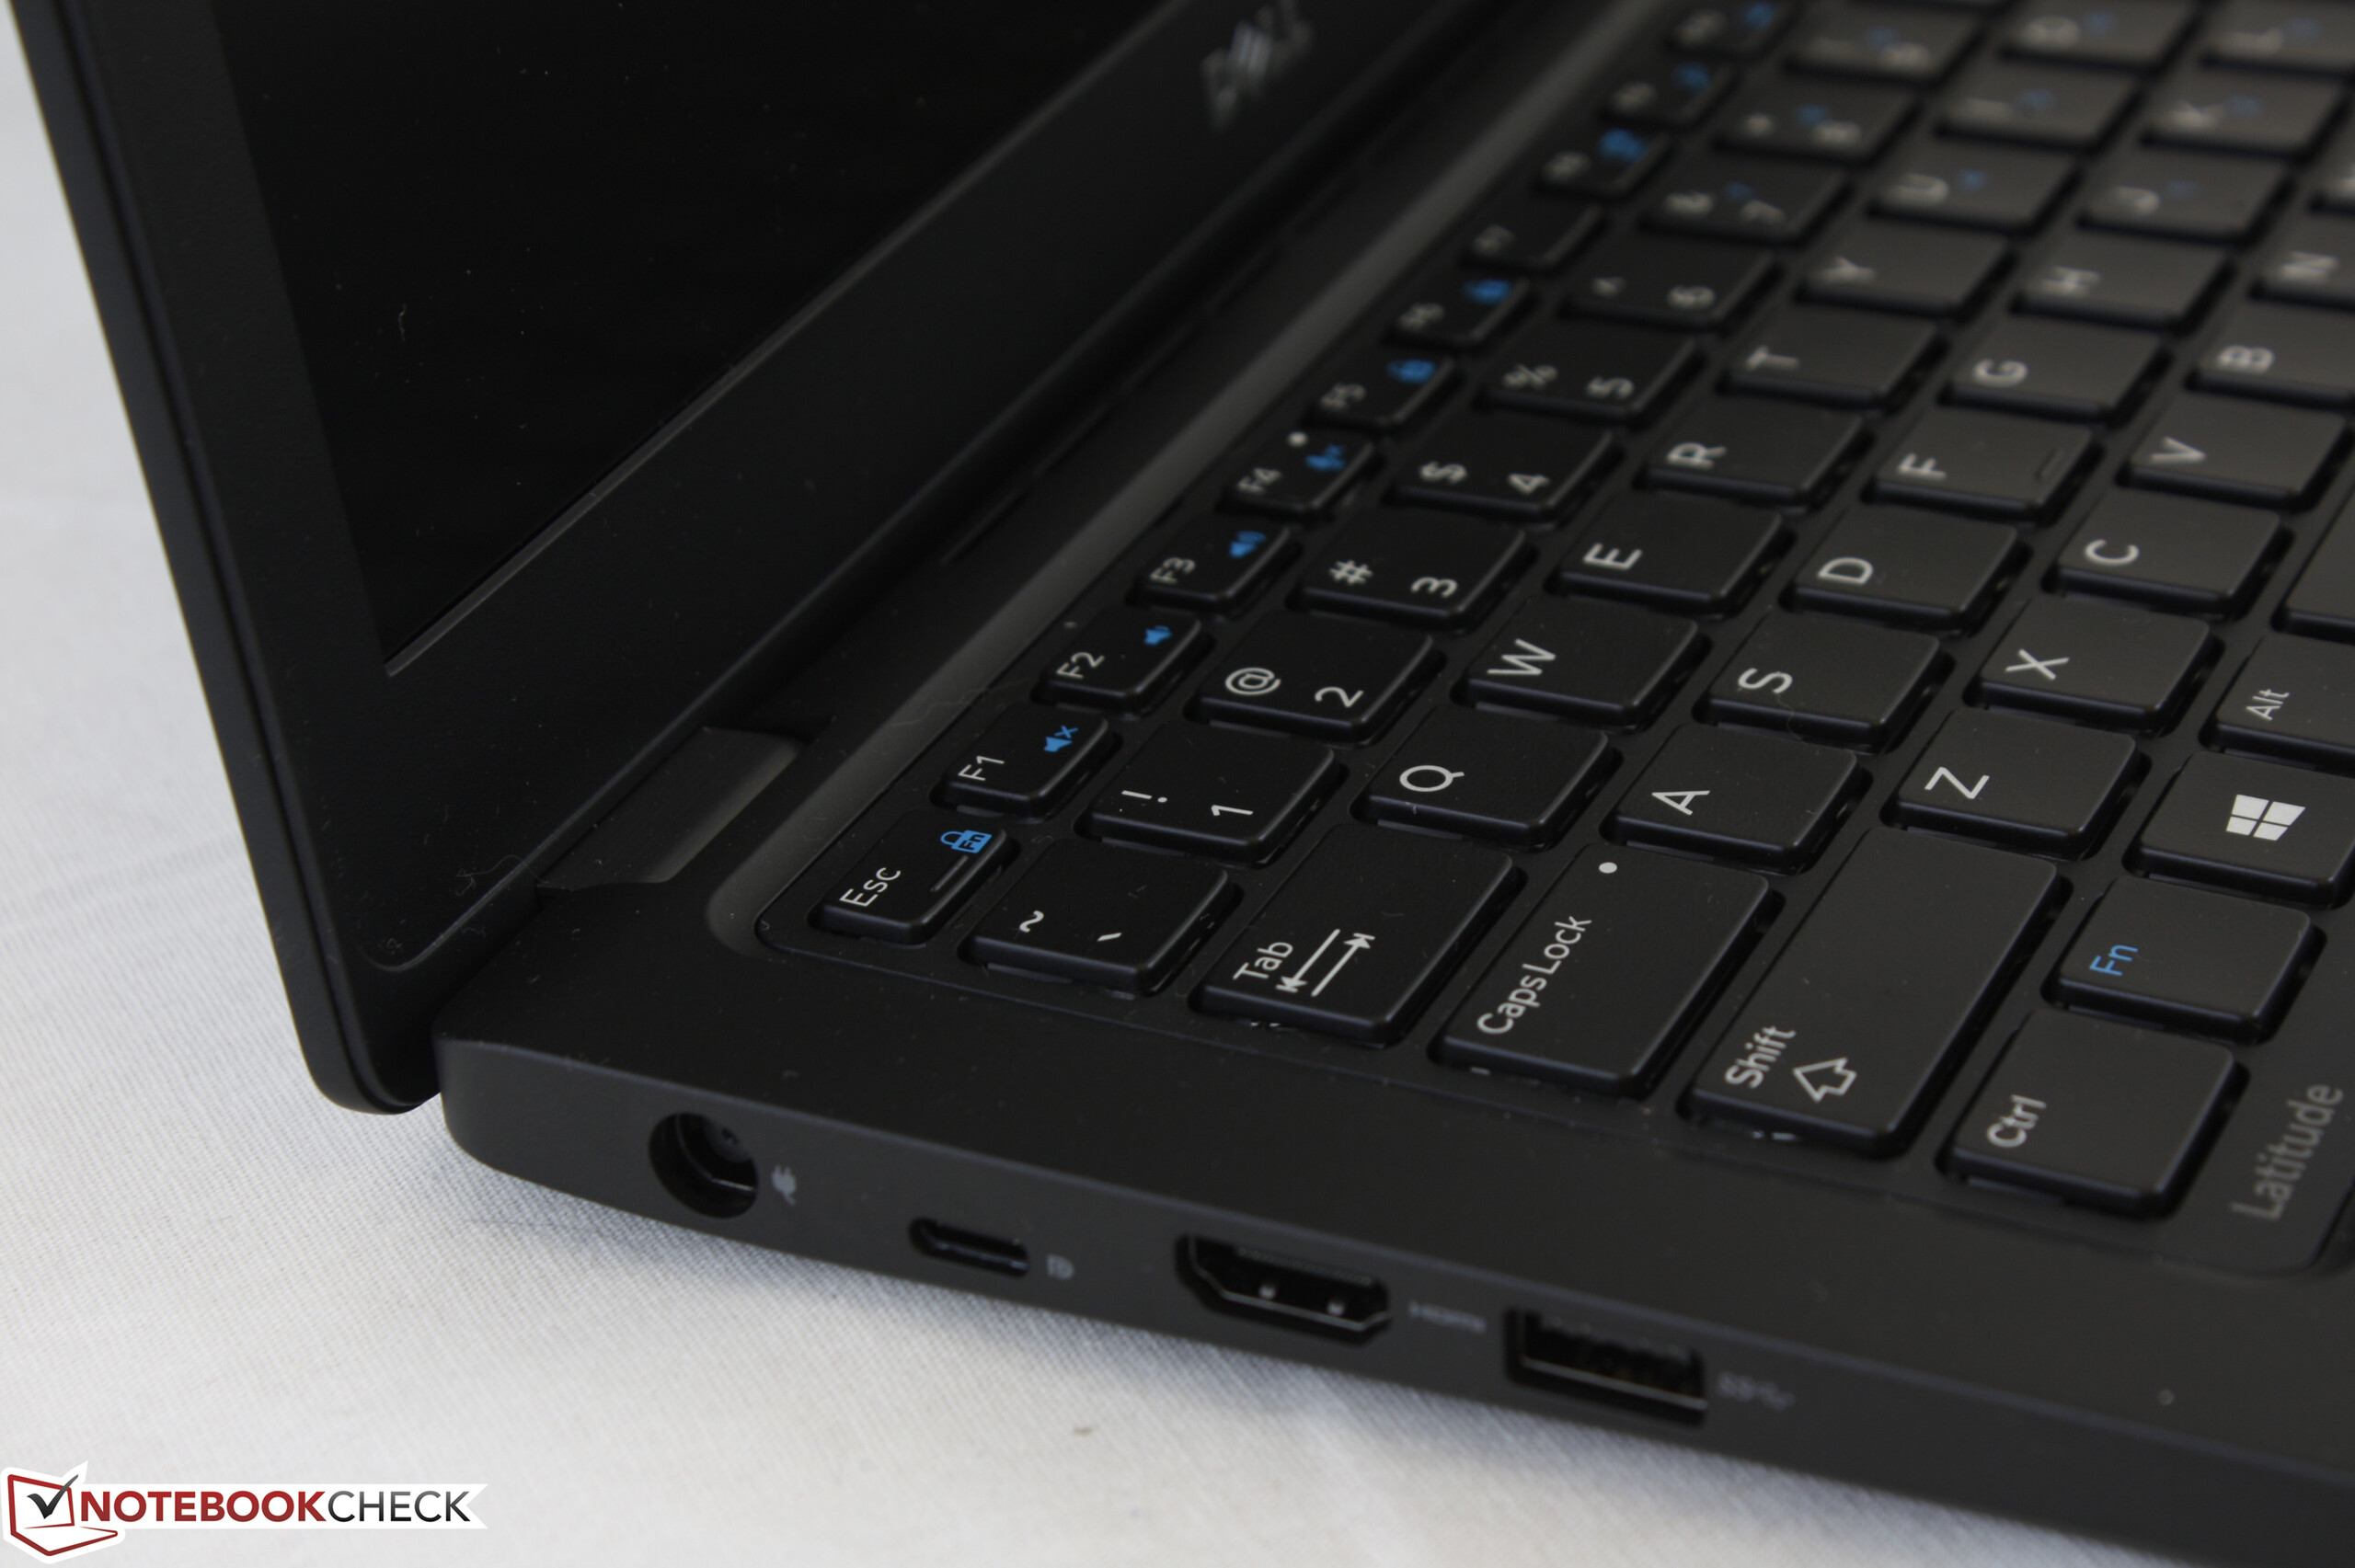
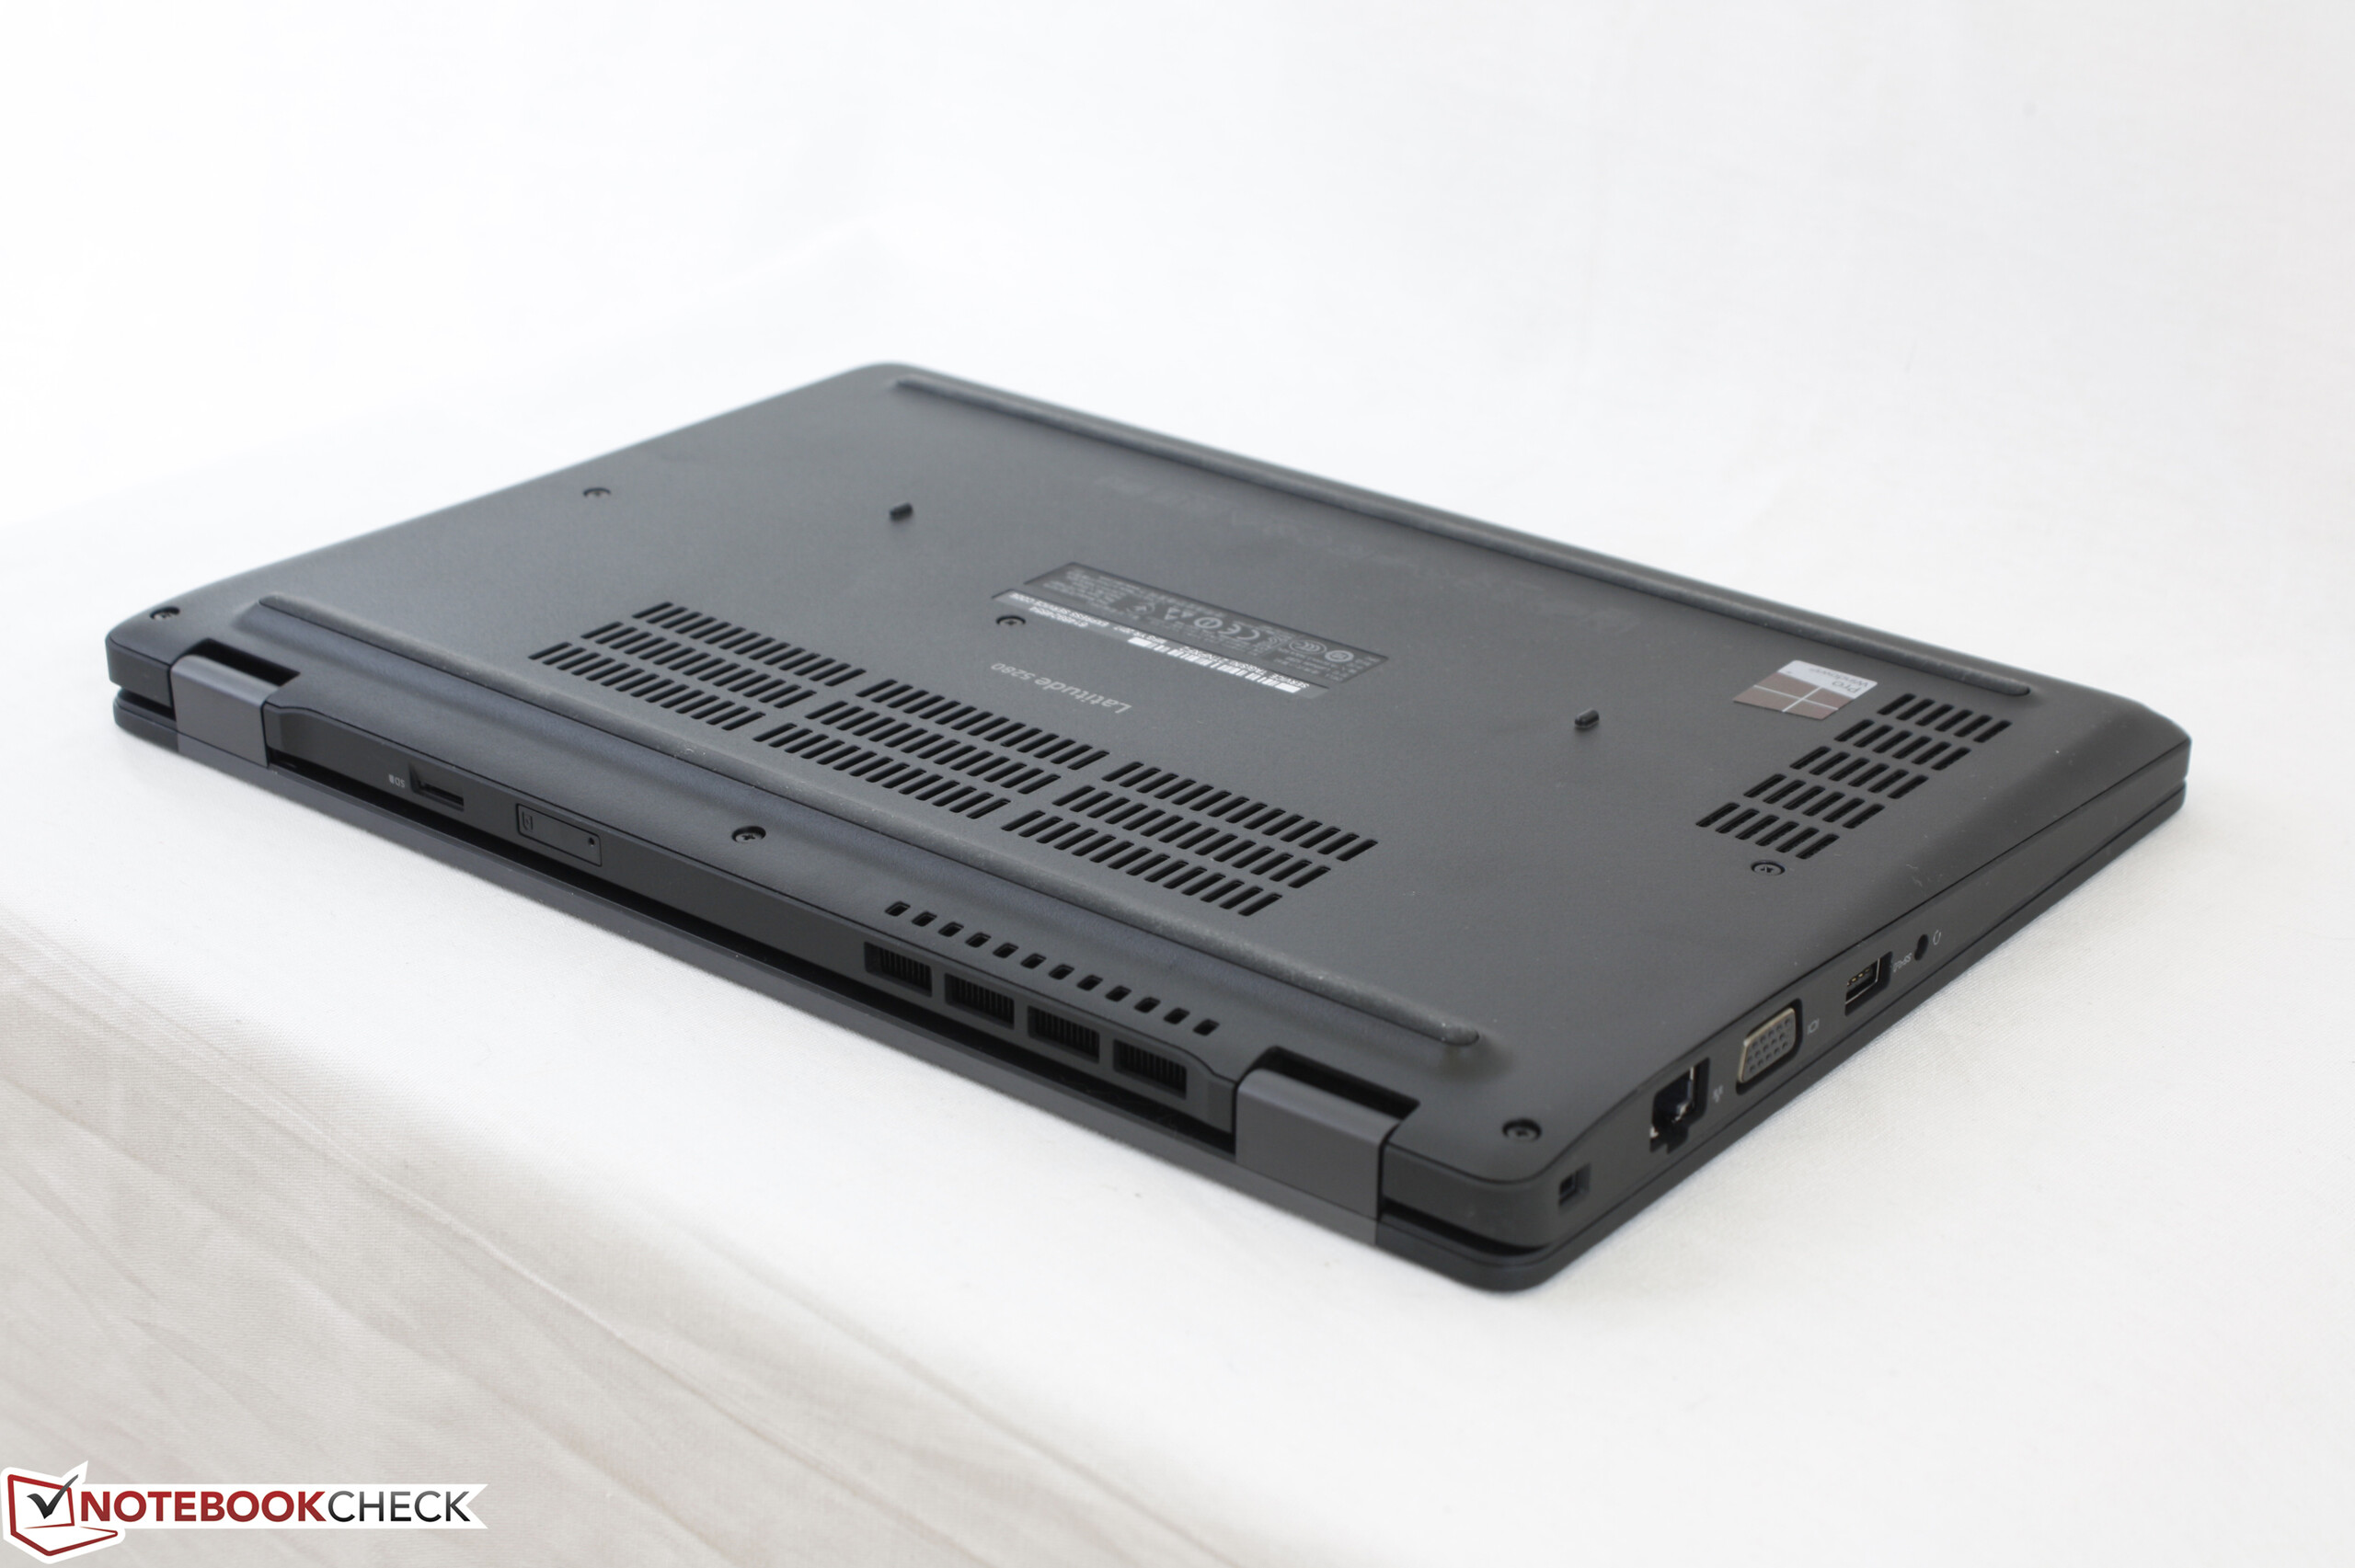
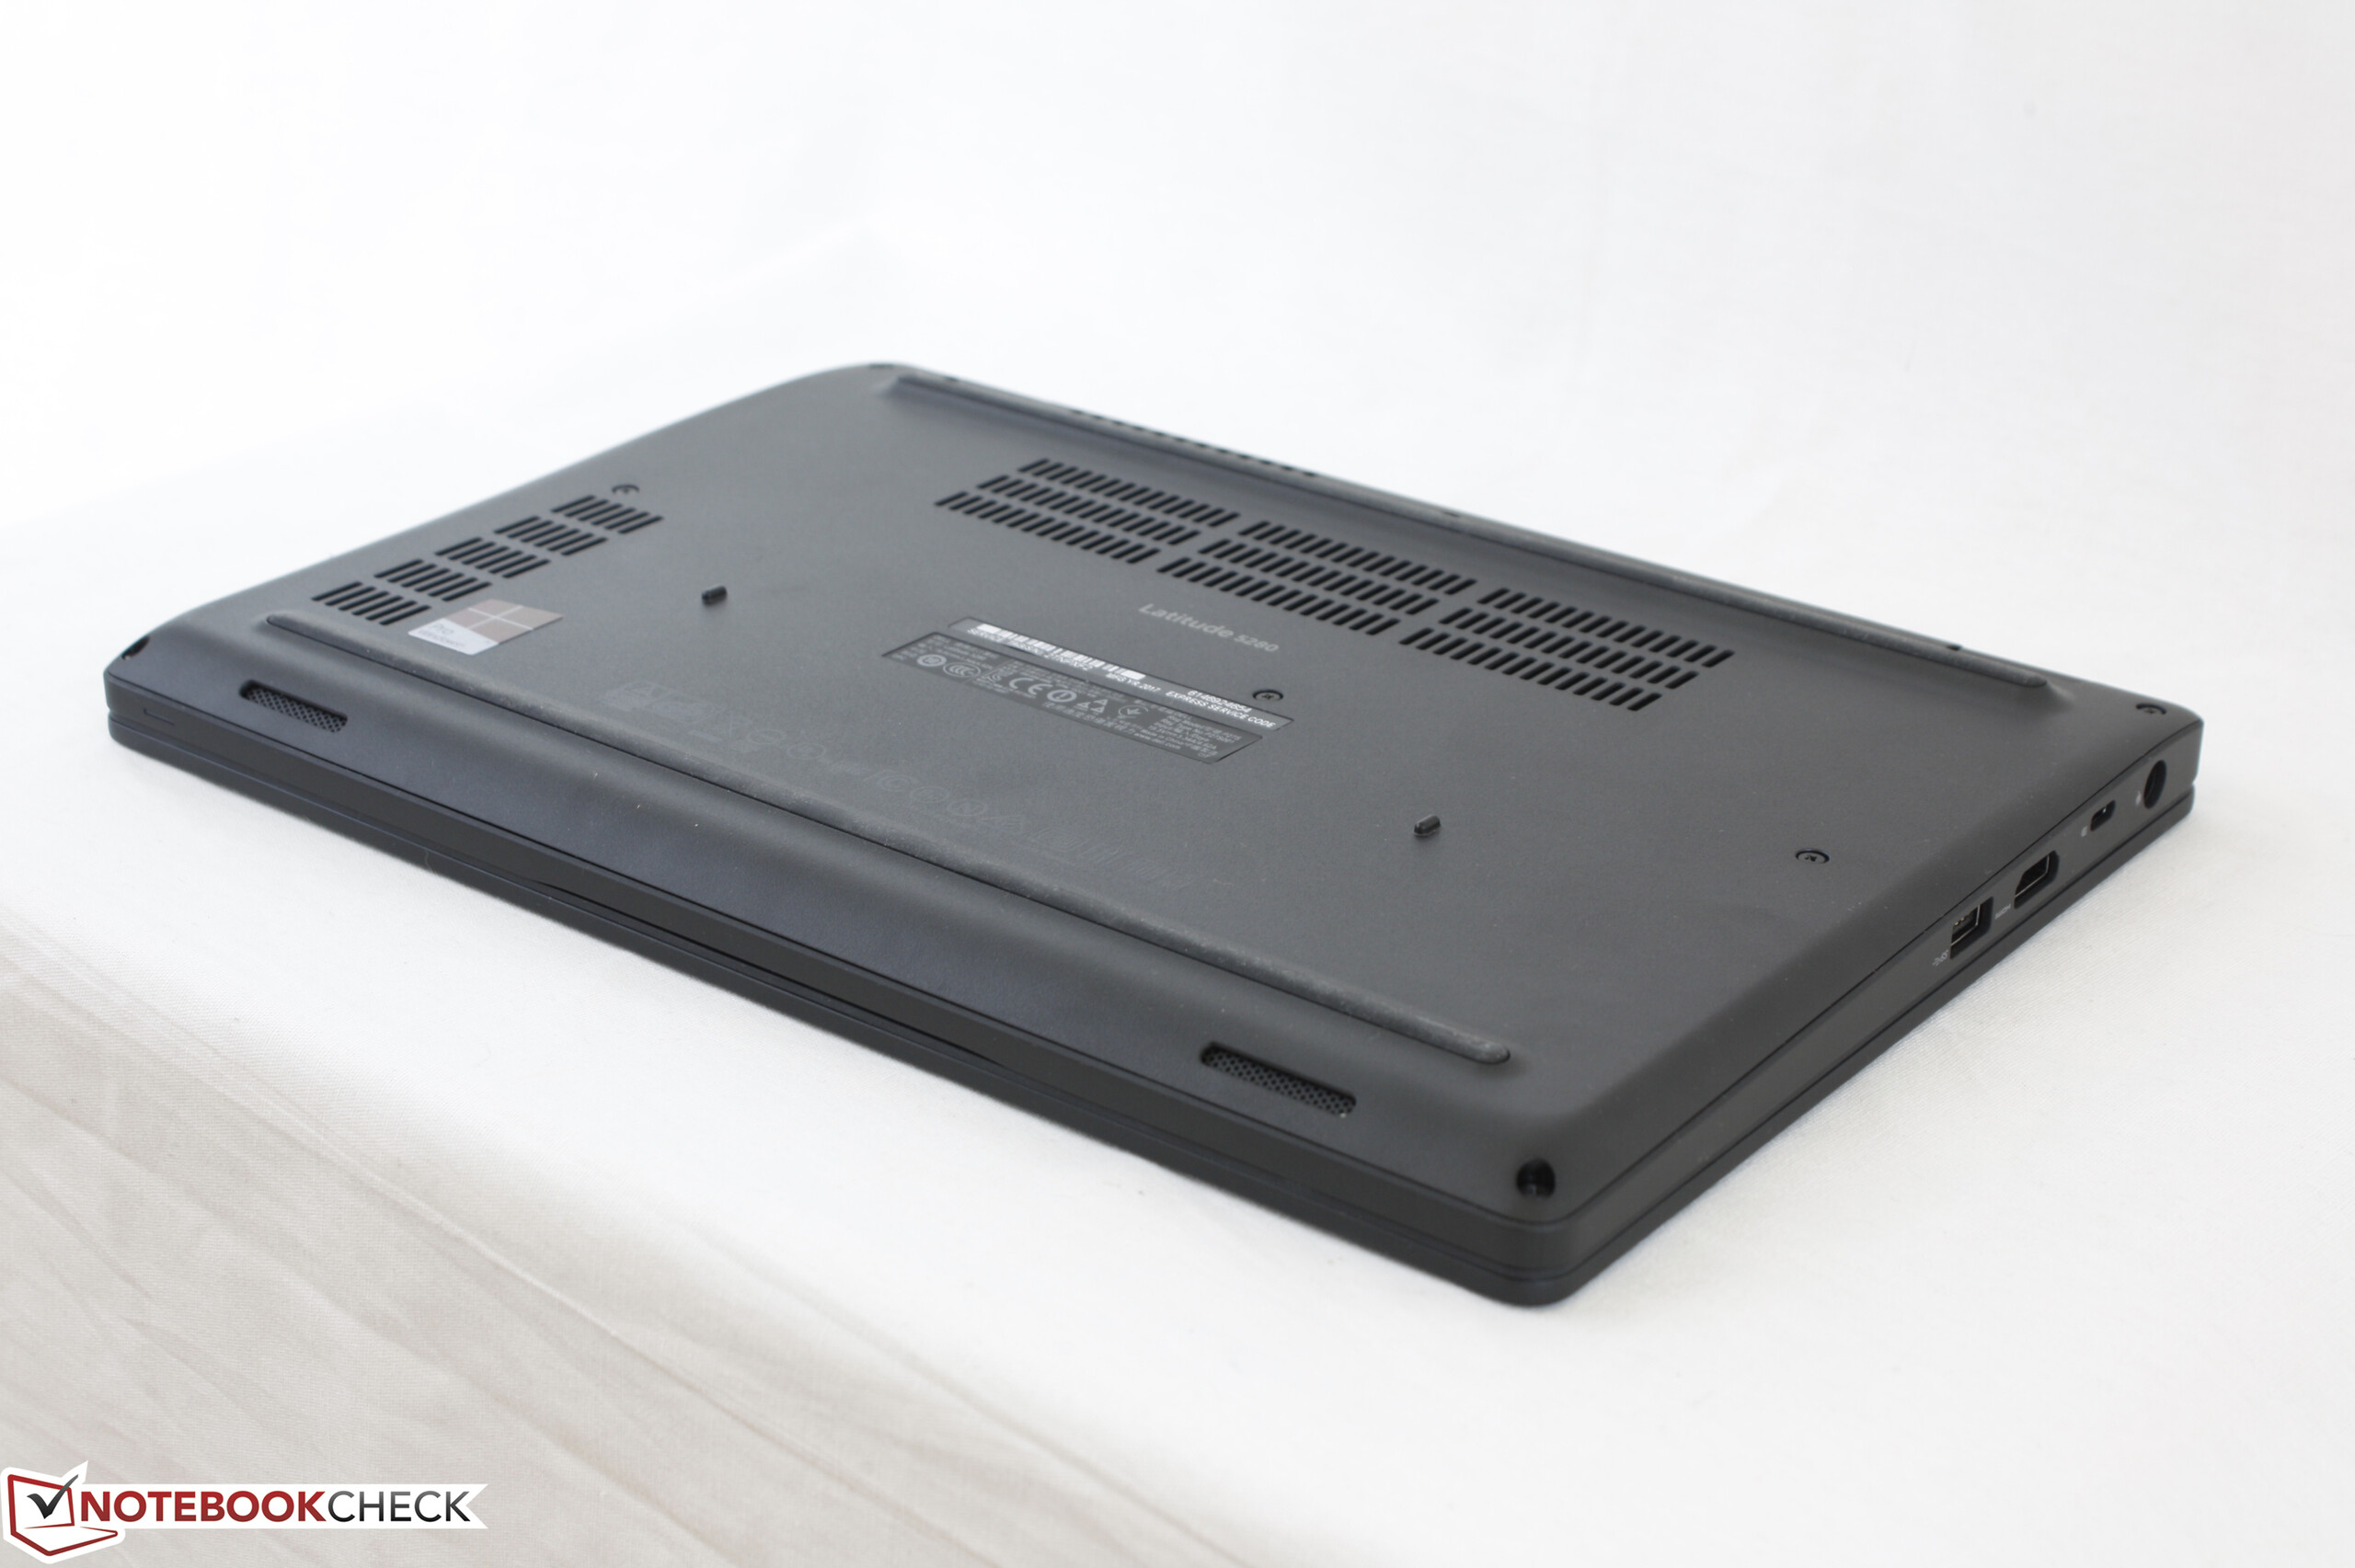
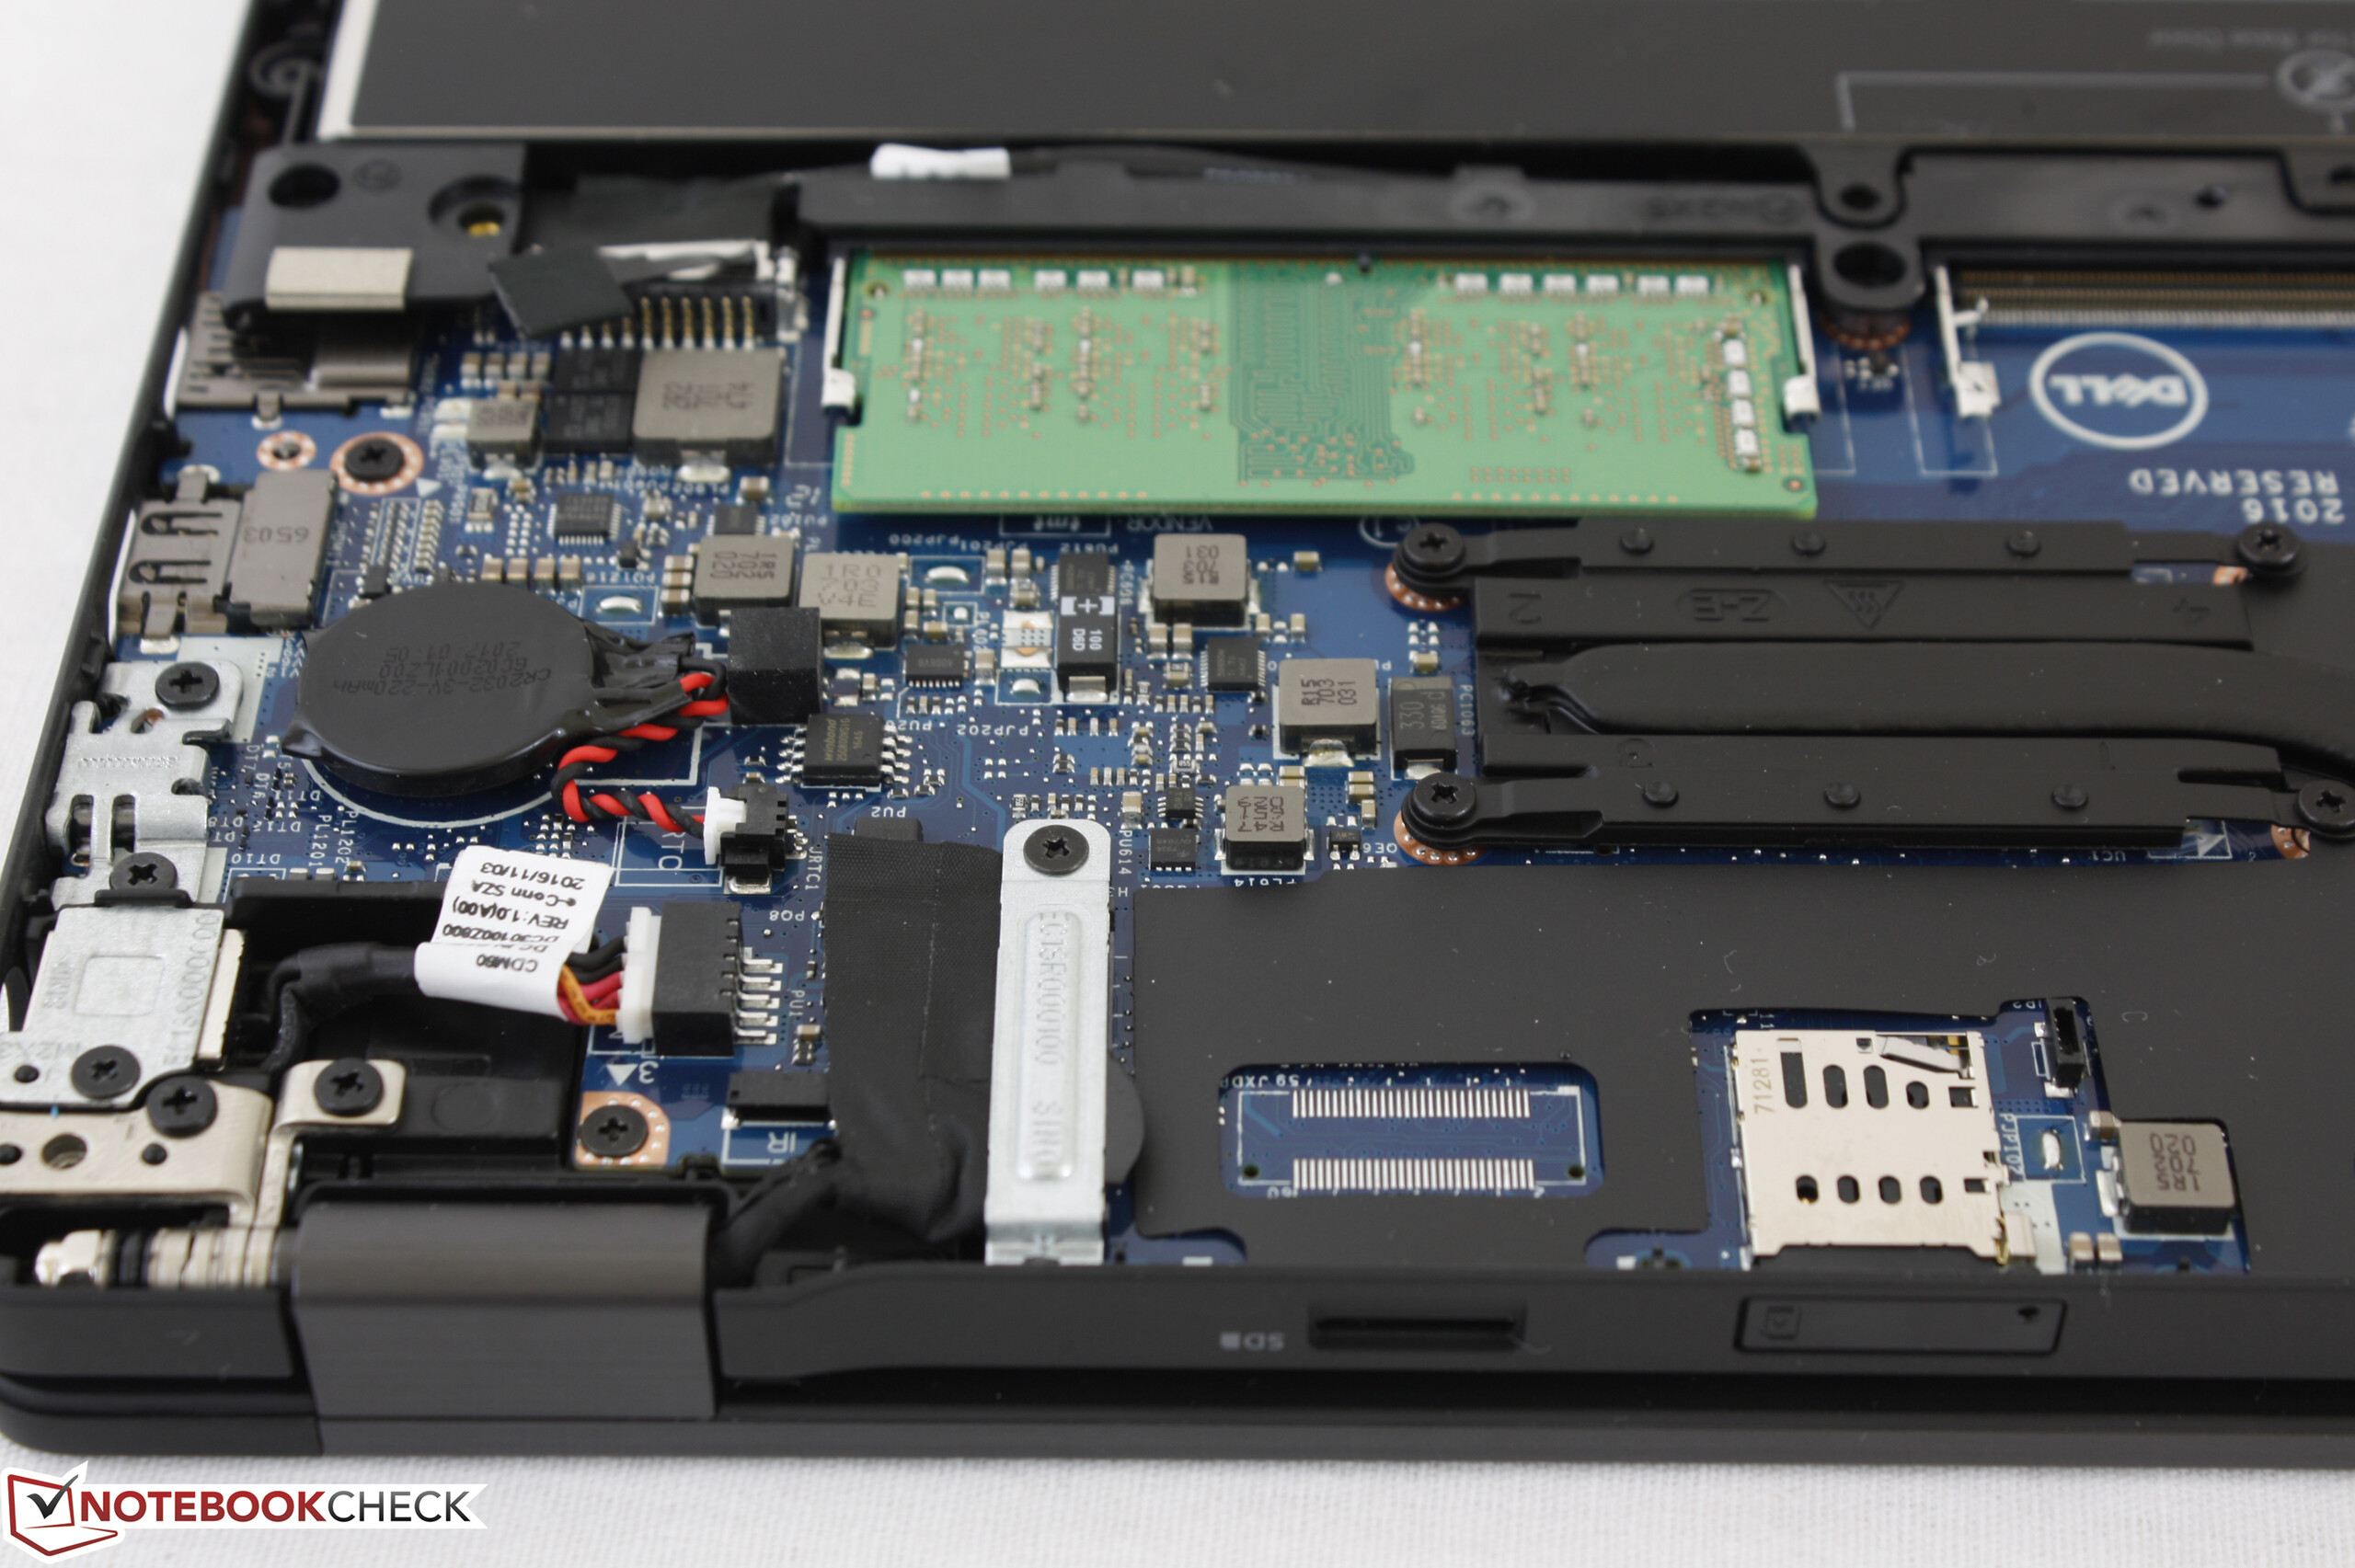
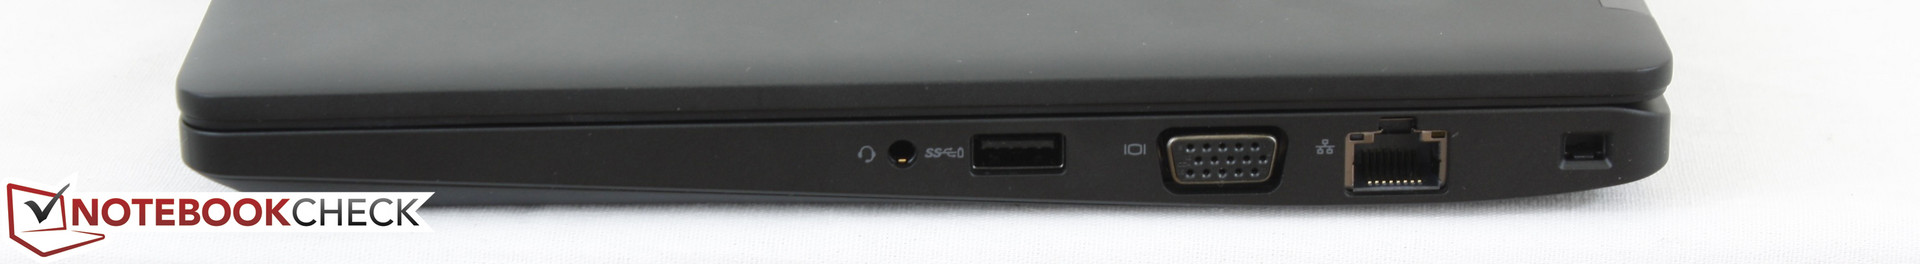
Pour les portables pro, la possibilité de se connecter facilement à des stations d’accueil, ainsi que l’existence de packs de batteries secondaires sont des élément importants de leur réussite. Maintenant que la série Latitude 5280/5480/5580 a abandonné le E-Port, le Thunderbolt 3 est devenu encore plus important. Mais le Latitude 5280 ne possède aucun des deux : il est donc moins polyvalent que les 5480 et 5580, même s’il et plus petit et plus portable. De plus les ventilateurs sont toujours actifs, ce qui ne devrait pas être le cas pour un portable équipé d’un processeur de classe U.
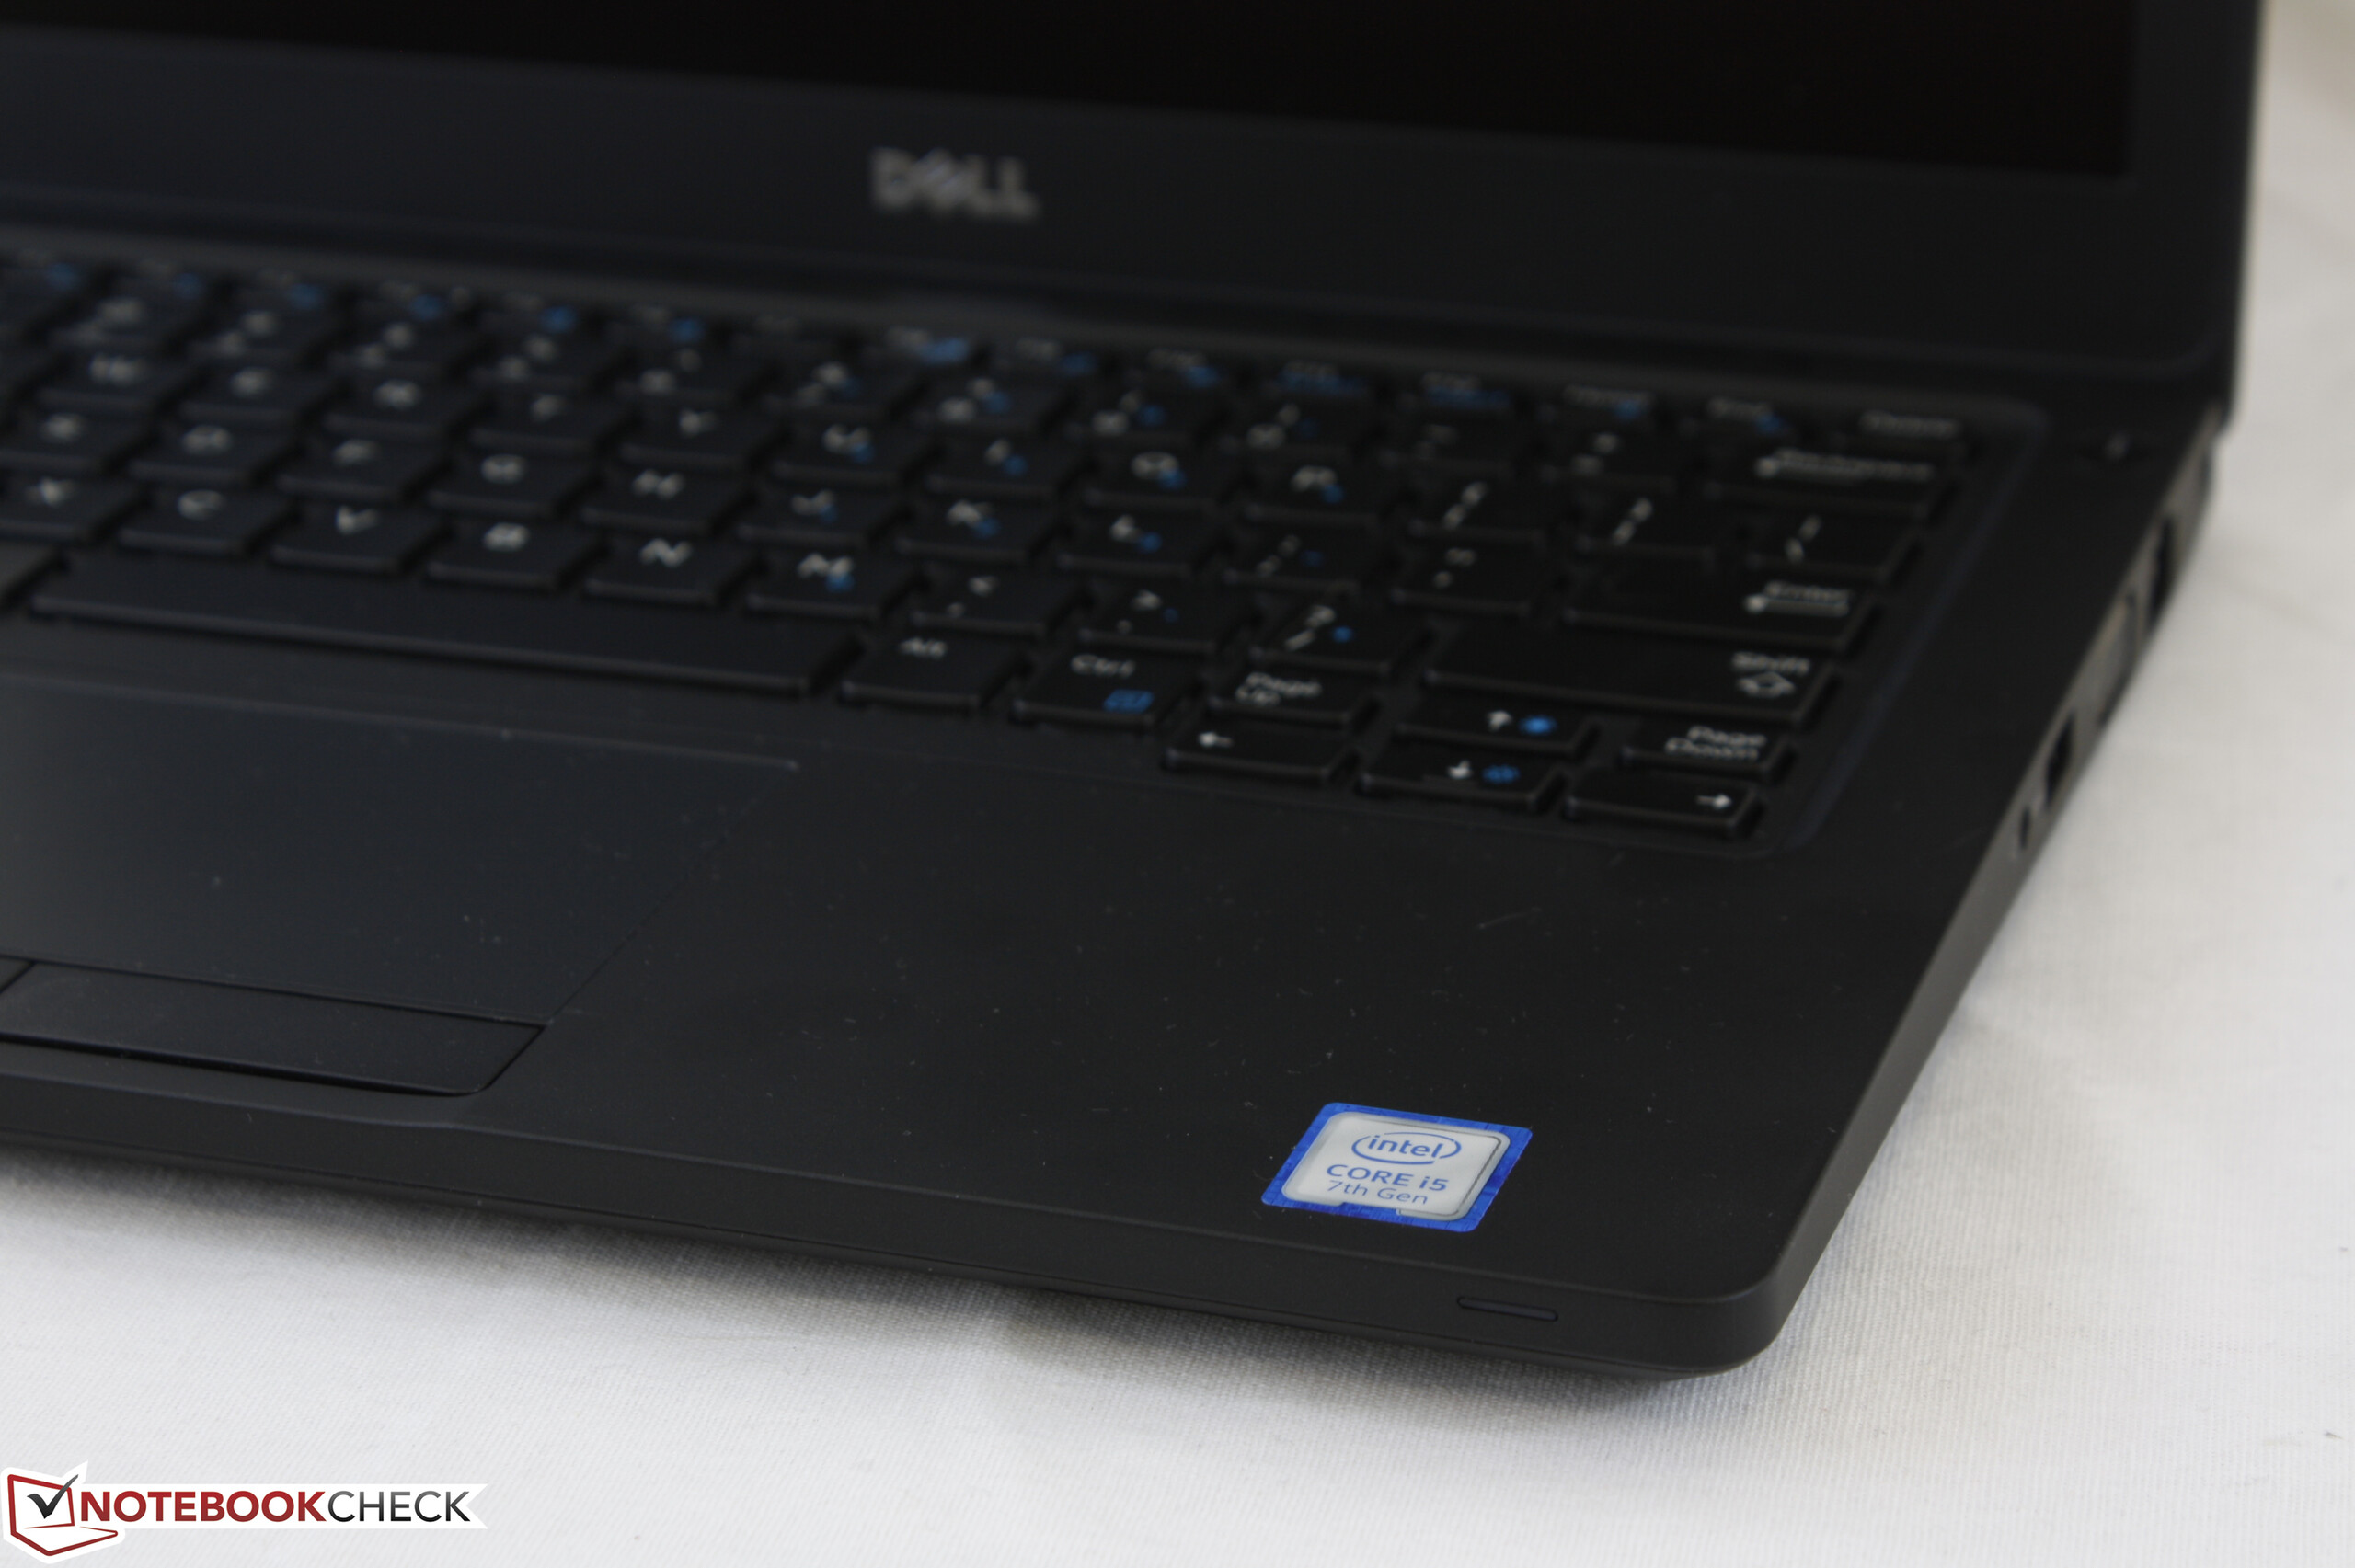
Si les désavantages ci-dessus ne sont pas rédhibitoires, le 5280 excelle dans la plupart des autres domaines. Son port USB de type C permettra l’affichage sur des écrans externes DisplayPort, et le nouveau châssis est bien plus léger que sur l’E5270 sans être plus fragile. L’autonomie est excellente avec la batterie de milieu de gamme, et la présence de ports VGA et HDMI peut se révéler utile à l’université ou lors de conférences. Les performances CPU sont impressionnantes, le processeur étant capable de maintenir le turbo boost au maximum même en cas de fortes sollicitations.
Nous recommandons fortement de ne pas prendre l’écran 768p, et de choisir celui de 1 080p, avec un SSD principal plus rapide. La hausse de la résolution et la meilleure luminosité rendent le portable plus intéressant et valent l’investissement, si le système est utilisé sans écran externe.
Il faut s’habituer au clavier un peu mou, et les utilisateurs avec des grandes mains devront éviter cette taille particulière de clavier, s’ils tapent beaucoup. Le 5280 est plus fait pour des utilisateurs en mobilité, plutôt que pour être en permanence connecté à une station d’accueil à la maison ou au bureau.
L'intégralité de ce test est disponible en anglais en suivant ce lien.
Dell Latitude 5280
- 05/27/2017 v6 (old)
Allen Ngo
Price comparison
