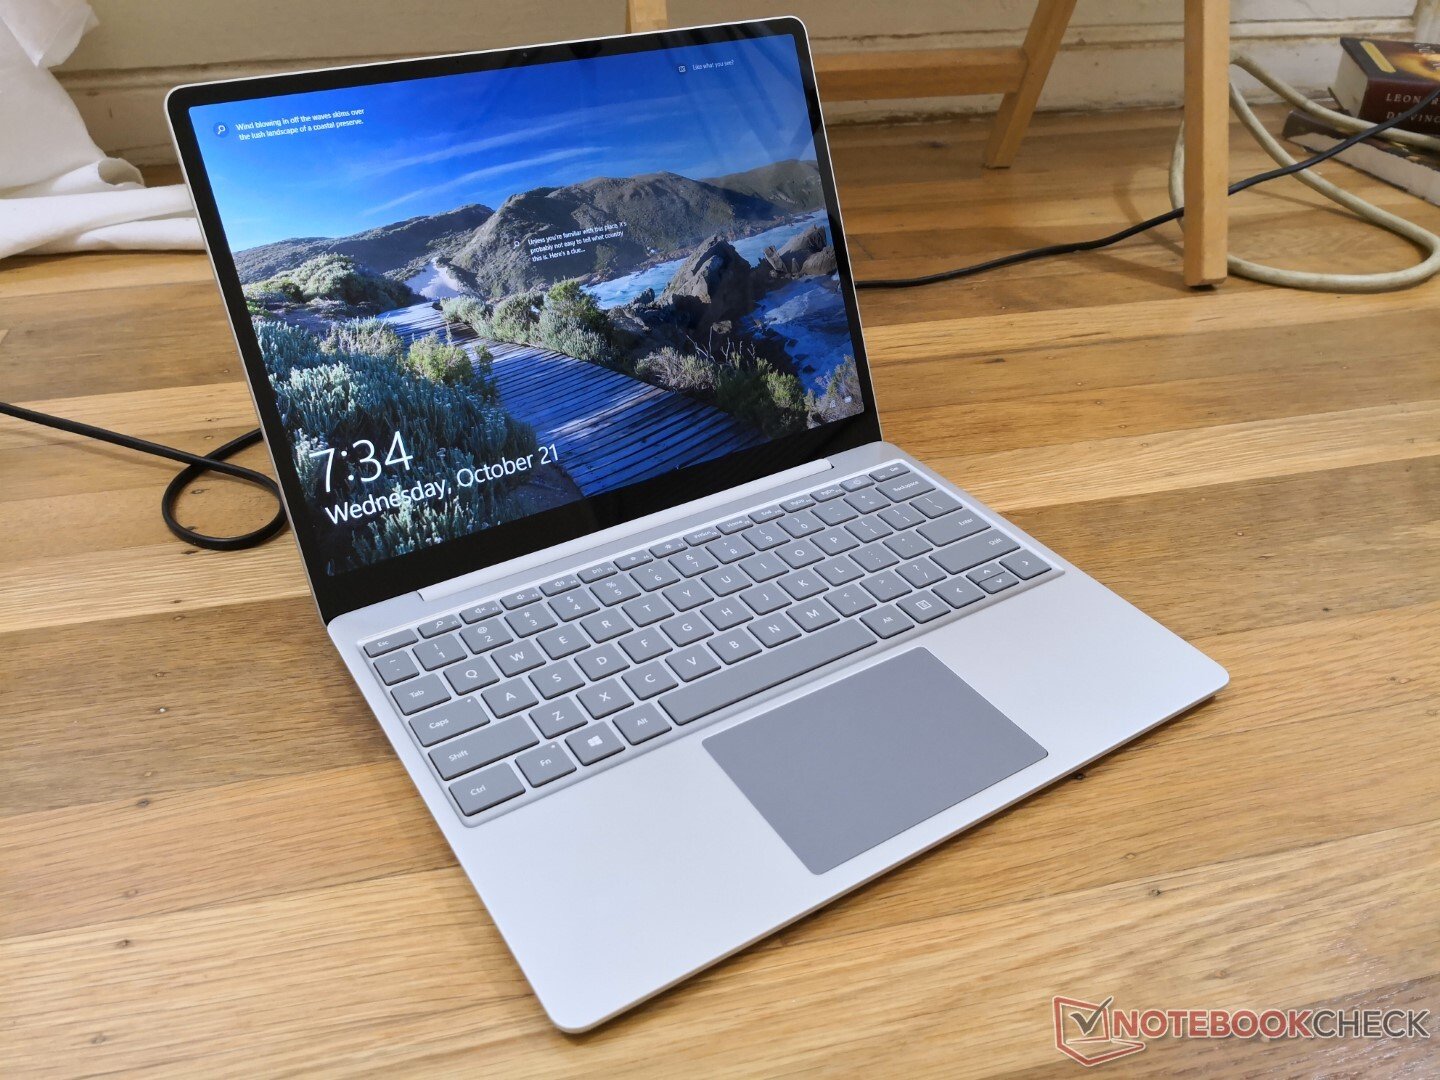
Test du Microsoft Surface Laptop Go (i5-1035G1, FHD) : un PC portable bien trop cher
Note | Date | Modèle | Poids | Épaisseur | Taille | Résolution | Prix |
|---|---|---|---|---|---|---|---|
| 84.6 % v7 (old) | 11/20 | Microsoft Surface Laptop Go Core i5 i5-1035G1, UHD Graphics G1 (Ice Lake 32 EU) | 1.1 kg | 15.69 mm | 12.40" | 1536x1024 | |
| 85.1 % v7 (old) | 10/20 | Asus Zenbook S UX393JA i7-1065G7, Iris Plus Graphics G7 (Ice Lake 64 EU) | 1.4 kg | 15.7 mm | 13.90" | 3300x2200 | |
| 88.7 % v7 (old) | 10/20 | HP EliteBook 830 G7 i7-10810U, UHD Graphics 620 | 1.3 kg | 18.1 mm | 13.30" | 1920x1080 | |
| 84 % v7 (old) | 03/20 | Microsoft Surface Laptop 3 13 Core i5-1035G7 i5-1035G7, Iris Plus Graphics G7 (Ice Lake 64 EU) | 1.3 kg | 14.5 mm | 13.50" | 2256x1504 | |
| 87.4 % v7 (old) | 07/20 | Huawei MateBook X Pro 2020 i7 i7-10510U, GeForce MX250 | 1.3 kg | 14.6 mm | 13.90" | 3000x2000 | |
| 92.1 % v7 (old) | 07/20 | Apple MacBook Pro 13 2020 2GHz i5 10th-Gen i5-1038NG7, Iris Plus Graphics G7 (Ice Lake 64 EU) | 1.4 kg | 15.6 mm | 13.30" | 2560x1600 |

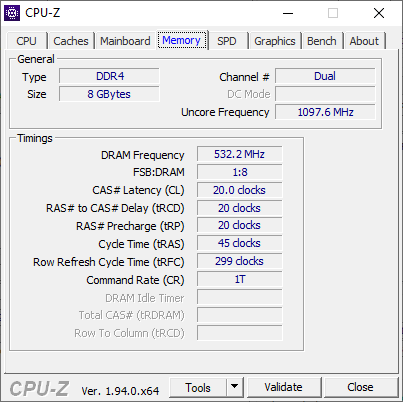
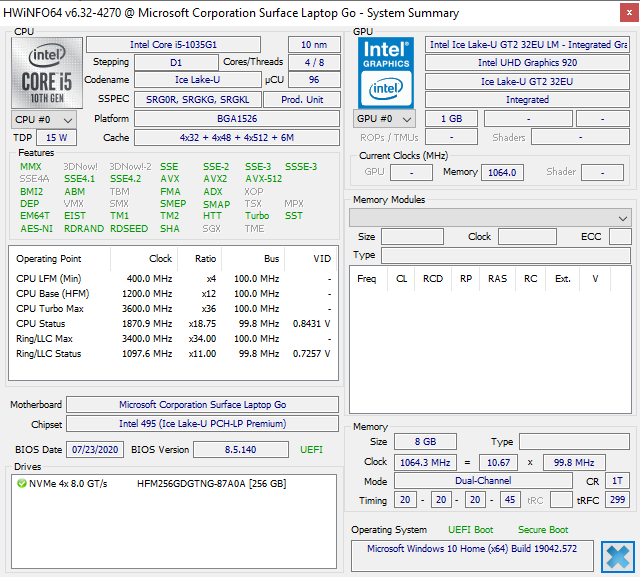
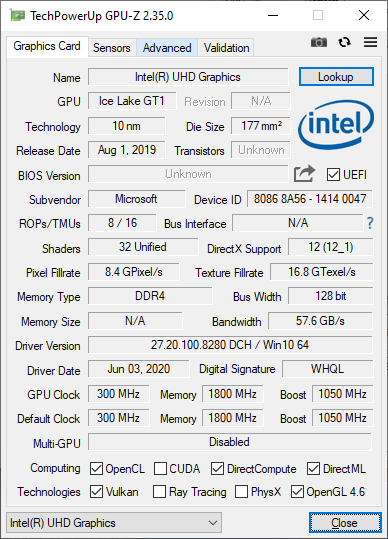
, i5-1035G1, SK hynix BC501 HFM256GDGTNG")
, i5-1035G1, SK hynix BC501 HFM256GDGTNG")
| |||||||||||||||||||||||||
Homogénéité de la luminosité: 95 %
Valeur mesurée au centre, sur batterie: 354.3 cd/m²
Contraste: 1222:1 (Valeurs des noirs: 0.29 cd/m²)
ΔE ColorChecker Calman: 1.41 | ∀{0.5-29.43 Ø4.71}
calibrated: 1.44
ΔE Greyscale Calman: 1.2 | ∀{0.09-98 Ø4.96}
94.4% sRGB (Argyll 1.6.3 3D)
60.2% AdobeRGB 1998 (Argyll 1.6.3 3D)
65.7% AdobeRGB 1998 (Argyll 3D)
94.6% sRGB (Argyll 3D)
64.4% Display P3 (Argyll 3D)
Gamma: 2.26
CCT: 6600 K
| Microsoft Surface Laptop Go Core i5 LG Philips LP125WX112403, IPS, 12.4", 1536x1024 | Asus Zenbook S UX393JA AU Optronics B139KAN01.0, IPS, 13.9", 3300x2200 | HP EliteBook 830 G7 Chi Mei CMN13A9, IPS, 13.3", 1920x1080 | Microsoft Surface Laptop 3 13 Core i5-1035G7 Sharp LQ135P1JX51, IPS, 13.5", 2256x1504 | Huawei MateBook X Pro 2020 i7 JDI LPM139M422A, LTPS, 13.9", 3000x2000 | Apple MacBook Pro 13 2020 2GHz i5 10th-Gen APPA03D, IPS, 13.3", 2560x1600 | |
|---|---|---|---|---|---|---|
| Display | 30% | 3% | 3% | 4% | 30% | |
| Display P3 Coverage (%) | 64.4 | 97.7 52% | 65.7 2% | 65.7 2% | 66.6 3% | 98.8 53% |
| sRGB Coverage (%) | 94.6 | 99.8 5% | 97.4 3% | 98.6 4% | 99.4 5% | 99.9 6% |
| AdobeRGB 1998 Coverage (%) | 65.7 | 87.9 34% | 67.4 3% | 67.8 3% | 68.6 4% | 86.4 32% |
| Response Times | -48% | -22% | -56% | -24% | -22% | |
| Response Time Grey 50% / Grey 80% * (ms) | 34.8 ? | 56.4 ? -62% | 46.8 ? -34% | 59.2 ? -70% | 49.6 ? -43% | 46 ? -32% |
| Response Time Black / White * (ms) | 29.2 ? | 38.8 ? -33% | 32 ? -10% | 41.6 ? -42% | 30.8 ? -5% | 32.4 ? -11% |
| PWM Frequency (Hz) | 21930 ? | 26600 ? | 21740 ? | 29070 ? | 113600 ? | |
| Screen | -42% | -26% | 9% | 12% | 7% | |
| Brightness middle (cd/m²) | 354.3 | 444.1 25% | 454.5 28% | 403.4 14% | 557 57% | 512 45% |
| Brightness (cd/m²) | 353 | 423 20% | 435 23% | 397 12% | 532 51% | 491 39% |
| Brightness Distribution (%) | 95 | 89 -6% | 91 -4% | 89 -6% | 87 -8% | 91 -4% |
| Black Level * (cd/m²) | 0.29 | 0.37 -28% | 0.27 7% | 0.34 -17% | 0.33 -14% | 0.32 -10% |
| Contrast (:1) | 1222 | 1200 -2% | 1683 38% | 1186 -3% | 1688 38% | 1600 31% |
| Colorchecker dE 2000 * | 1.41 | 2.94 -109% | 3.12 -121% | 0.94 33% | 1.4 1% | 1.7 -21% |
| Colorchecker dE 2000 max. * | 2.96 | 7.37 -149% | 4.85 -64% | 2.92 1% | 2.5 16% | 3.4 -15% |
| Colorchecker dE 2000 calibrated * | 1.44 | 3.05 -112% | 1.97 -37% | 0.99 31% | 0.7 51% | 1 31% |
| Greyscale dE 2000 * | 1.2 | 2.9 -142% | 3.1 -158% | 0.9 25% | 2 -67% | 1.9 -58% |
| Gamma | 2.26 97% | 2.1 105% | 2.01 109% | 2.13 103% | 2.14 103% | 2.19 100% |
| CCT | 6600 98% | 6766 96% | 6902 94% | 6620 98% | 6689 97% | 6817 95% |
| Color Space (Percent of AdobeRGB 1998) (%) | 60.2 | 78.2 30% | 61.5 2% | 62.3 3% | 62.5 4% | 77.4 29% |
| Color Space (Percent of sRGB) (%) | 94.4 | 99.8 6% | 97 3% | 98.7 5% | 99.5 5% | 99.9 6% |
| Moyenne finale (programmes/paramètres) | -20% /
-29% | -15% /
-20% | -15% /
-0% | -3% /
6% | 5% /
8% |
* ... Moindre est la valeur, meilleures sont les performances
Temps de réponse de l'écran
| ↔ Temps de réponse noir à blanc | ||
|---|---|---|
| 29.2 ms ... hausse ↗ et chute ↘ combinées | ↗ 17.2 ms hausse | 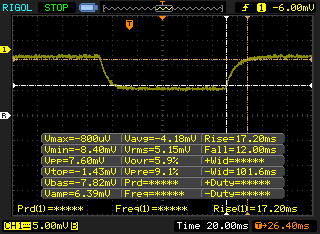 |
| ↘ 12 ms chute | ||
| L'écran souffre de latences relativement élevées, insuffisant pour le jeu. En comparaison, tous les appareils testés affichent entre 0.1 (minimum) et 240 (maximum) ms. » 78 % des appareils testés affichent de meilleures performances. Cela signifie que les latences relevées sont moins bonnes que la moyenne (19.8 ms) de tous les appareils testés. | ||
| ↔ Temps de réponse gris 50% à gris 80% | ||
| 34.8 ms ... hausse ↗ et chute ↘ combinées | ↗ 19.6 ms hausse | 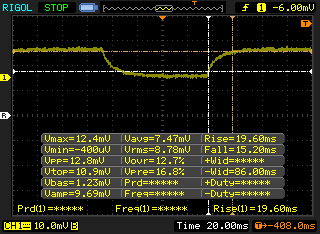 |
| ↘ 15.2 ms chute | ||
| L'écran souffre de latences très élevées, à éviter pour le jeu. En comparaison, tous les appareils testés affichent entre 0.165 (minimum) et 636 (maximum) ms. » 49 % des appareils testés affichent de meilleures performances. Cela signifie que les latences relevées sont moins bonnes que la moyenne (30.9 ms) de tous les appareils testés. | ||
Scintillement / MLI (Modulation de largeur d'impulsion)
| Scintillement / MLI (Modulation de largeur d'impulsion) décelé | 21930 Hz | ≤ 51 Niveau de luminosité | 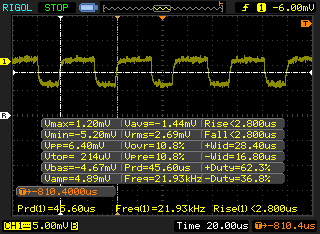 |
Le rétroéclairage de l'écran scintille à la fréquence de 21930 Hz (certainement du fait de l'utilisation d'une MDI - Modulation de largeur d'impulsion) à un niveau de luminosité inférieur ou égal à 51 % . Aucun scintillement ne devrait être perceptible au-dessus de cette valeur. La fréquence de rafraîchissement de 21930 Hz est élevée, la grande majorité des utilisateurs ne devrait pas percevoir de scintillements et être sujette à une fatigue oculaire accrue. En comparaison, 52 % des appareils testés n'emploient pas MDI pour assombrir leur écran. Nous avons relevé une moyenne à 7748 (minimum : 5 - maximum : 343500) Hz dans le cas où une MDI était active. | |||
Cinebench R15: CPU Multi 64Bit | CPU Single 64Bit
Blender: v2.79 BMW27 CPU
7-Zip 18.03: 7z b 4 -mmt1 | 7z b 4
Geekbench 5.5: Single-Core | Multi-Core
HWBOT x265 Benchmark v2.2: 4k Preset
LibreOffice : 20 Documents To PDF
R Benchmark 2.5: Overall mean
Cinebench R15: CPU Multi 64Bit | CPU Single 64Bit
Blender: v2.79 BMW27 CPU
7-Zip 18.03: 7z b 4 -mmt1 | 7z b 4
Geekbench 5.5: Single-Core | Multi-Core
HWBOT x265 Benchmark v2.2: 4k Preset
LibreOffice : 20 Documents To PDF
R Benchmark 2.5: Overall mean
* ... Moindre est la valeur, meilleures sont les performances
| PCMark 8 Home Score Accelerated v2 | 3469 points | |
| PCMark 8 Work Score Accelerated v2 | 2647 points | |
| PCMark 10 Score | 3474 points | |
Aide | ||
| DPC Latencies / LatencyMon - interrupt to process latency (max), Web, Youtube, Prime95 | |
| Asus Zenbook S UX393JA | |
| HP EliteBook 830 G7 | |
| Microsoft Surface Laptop Go Core i5 | |
* ... Moindre est la valeur, meilleures sont les performances
| Microsoft Surface Laptop Go Core i5 SK hynix BC501 HFM256GDGTNG | Asus Zenbook S UX393JA Intel SSD 660p 1TB SSDPEKNW010T8 | Microsoft Surface Laptop 3 13 Core i5-1035G7 SK hynix BC501 HFM256GDGTNG | Huawei MateBook X Pro 2020 i7 Samsung PM981a MZVLB1T0HBLR | Apple MacBook Pro 13 2020 2GHz i5 10th-Gen Apple SSD SM0512F | |
|---|---|---|---|---|---|
| AS SSD | 73% | 4% | 182% | -15% | |
| Seq Read (MB/s) | 1347 | 1405 4% | 1387 3% | 2737 103% | 1300 -3% |
| Seq Write (MB/s) | 491 | 1062 116% | 504 3% | 2530 415% | 1518 209% |
| 4K Read (MB/s) | 38.08 | 50.8 33% | 42.35 11% | 54 42% | 14.09 -63% |
| 4K Write (MB/s) | 98.2 | 124.9 27% | 120 22% | 152.5 55% | 24.25 -75% |
| 4K-64 Read (MB/s) | 483.1 | 590 22% | 497.4 3% | 2011 316% | 725 50% |
| 4K-64 Write (MB/s) | 350.9 | 840 139% | 354.9 1% | 1260 259% | 169.6 -52% |
| Access Time Read * (ms) | 0.057 | 0.041 28% | 0.055 4% | 0.066 -16% | 0.172 -202% |
| Access Time Write * (ms) | 0.105 | 0.118 -12% | 0.093 11% | 0.024 77% | 0.155 -48% |
| Score Read (Points) | 656 | 781 19% | 678 3% | 2339 257% | 869 32% |
| Score Write (Points) | 498 | 1071 115% | 525 5% | 1666 235% | 346 -31% |
| Score Total (Points) | 1458 | 2251 54% | 1520 4% | 5191 256% | 1667 14% |
| Copy ISO MB/s (MB/s) | 765 | 1459 91% | 764 0% | ||
| Copy Program MB/s (MB/s) | 299.6 | 600 100% | 256.1 -15% | ||
| Copy Game MB/s (MB/s) | 371.5 | 1411 280% | 368.4 -1% | ||
| CrystalDiskMark 5.2 / 6 | 53% | 14% | 113% | 29% | |
| Write 4K (MB/s) | 87.6 | 129.5 48% | 112.3 28% | 165.6 89% | 28.16 -68% |
| Read 4K (MB/s) | 40.41 | 54 34% | 42.13 4% | 50.2 24% | 17.5 -57% |
| Write Seq (MB/s) | 601 | 1265 110% | 630 5% | 1905 217% | 1195 99% |
| Read Seq (MB/s) | 1033 | 1410 36% | 1023 -1% | 1669 62% | 1470 42% |
| Write 4K Q32T1 (MB/s) | 269.1 | 420.3 56% | 336.6 25% | 474.6 76% | 205 -24% |
| Read 4K Q32T1 (MB/s) | 261.4 | 357.7 37% | 399.6 53% | 508 94% | 692 165% |
| Write Seq Q32T1 (MB/s) | 818 | 1799 120% | 821 0% | 3007 268% | 1475 80% |
| Read Seq Q32T1 (MB/s) | 2025 | 1616 -20% | 2030 0% | 3556 76% | 1920 -5% |
| Moyenne finale (programmes/paramètres) | 63% /
65% | 9% /
8% | 148% /
153% | 7% /
3% |
* ... Moindre est la valeur, meilleures sont les performances

Disk Throttling: DiskSpd Read Loop, Queue Depth 8
| 3DMark 11 Performance | 2458 points | |
| 3DMark Cloud Gate Standard Score | 10013 points | |
| 3DMark Fire Strike Score | 1635 points | |
| 3DMark Time Spy Score | 505 points | |
Aide | ||
| Bas | Moyen | Élevé | Ultra | |
|---|---|---|---|---|
| Dota 2 Reborn (2015) | 78.1 | 40.1 | 23.5 | 21.4 |
| Final Fantasy XV Benchmark (2018) | 15.1 | 7.49 | 5.21 | |
| X-Plane 11.11 (2018) | 17.3 | 10.4 | 10.8 |
| Microsoft Surface Laptop Go Core i5 UHD Graphics G1 (Ice Lake 32 EU), i5-1035G1, SK hynix BC501 HFM256GDGTNG | Asus Zenbook S UX393JA Iris Plus Graphics G7 (Ice Lake 64 EU), i7-1065G7, Intel SSD 660p 1TB SSDPEKNW010T8 | Microsoft Surface Laptop 3 13 Core i5-1035G7 Iris Plus Graphics G7 (Ice Lake 64 EU), i5-1035G7, SK hynix BC501 HFM256GDGTNG | Huawei MateBook X Pro 2020 i7 GeForce MX250, i7-10510U, Samsung PM981a MZVLB1T0HBLR | Apple MacBook Pro 13 2020 2GHz i5 10th-Gen Iris Plus Graphics G7 (Ice Lake 64 EU), i5-1038NG7, Apple SSD SM0512F | |
|---|---|---|---|---|---|
| Noise | -3% | 0% | -7% | -6% | |
| arrêt / environnement * (dB) | 26.4 | 26.9 -2% | 28.5 -8% | 29.6 -12% | 29.6 -12% |
| Idle Minimum * (dB) | 26.4 | 26.9 -2% | 28.5 -8% | 29.6 -12% | 29.6 -12% |
| Idle Average * (dB) | 26.4 | 29 -10% | 28.5 -8% | 29.6 -12% | 29.6 -12% |
| Idle Maximum * (dB) | 26.4 | 31.1 -18% | 28.5 -8% | 30.3 -15% | 29.6 -12% |
| Load Average * (dB) | 36.9 | 37.7 -2% | 28.5 23% | 38 -3% | 34.4 7% |
| Load Maximum * (dB) | 44.2 | 38.1 14% | 40.4 9% | 38 14% | 42.1 5% |
| Witcher 3 ultra * (dB) | 40.2 | 40.4 | 38 | 36.1 |
* ... Moindre est la valeur, meilleures sont les performances
Degré de la nuisance sonore
| Au repos |
| 26.4 / 26.4 / 26.4 dB(A) |
| Fortement sollicité |
| 36.9 / 44.2 dB(A) |
 | ||
30 dB silencieux 40 dB(A) audible 50 dB(A) bruyant |
||
min: | ||
(±) La température maximale du côté supérieur est de 42 °C / 108 F, par rapport à la moyenne de 35.9 °C / 97 F, allant de 21.4 à 59 °C pour la classe Subnotebook.
(-) Le fond chauffe jusqu'à un maximum de 51 °C / 124 F, contre une moyenne de 39.2 °C / 103 F
(+) En utilisation inactive, la température moyenne du côté supérieur est de 27.3 °C / 81 F, par rapport à la moyenne du dispositif de 30.8 °C / 87 F.
(+) Les repose-poignets et le pavé tactile atteignent la température maximale de la peau (32 °C / 89.6 F) et ne sont donc pas chauds.
(-) La température moyenne de la zone de l'appui-paume de dispositifs similaires était de 28.2 °C / 82.8 F (-3.8 °C / #-6.8 F).
Microsoft Surface Laptop Go Core i5 analyse audio
(±) | le niveau sonore du haut-parleur est moyen mais bon (81.5# dB)
Basses 100 - 315 Hz
(±) | basse réduite - en moyenne 14.6% inférieure à la médiane
(±) | la linéarité des basses est moyenne (8.1% delta à la fréquence précédente)
Médiums 400 - 2000 Hz
(+) | médiane équilibrée - seulement 4.4% de la médiane
(+) | les médiums sont linéaires (4.1% delta à la fréquence précédente)
Aiguës 2 - 16 kHz
(+) | des sommets équilibrés - à seulement 2.8% de la médiane
(+) | les aigus sont linéaires (6.7% delta à la fréquence précédente)
Globalement 100 - 16 000 Hz
(+) | le son global est linéaire (13.6% différence à la médiane)
Par rapport à la même classe
» 24% de tous les appareils testés de cette catégorie étaient meilleurs, 5% similaires, 71% pires
» Le meilleur avait un delta de 5%, la moyenne était de 18%, le pire était de 53%.
Par rapport à tous les appareils testés
» 15% de tous les appareils testés étaient meilleurs, 4% similaires, 82% pires
» Le meilleur avait un delta de 4%, la moyenne était de 23%, le pire était de 134%.
Apple MacBook 12 (Early 2016) 1.1 GHz analyse audio
(+) | les haut-parleurs peuvent jouer relativement fort (83.6# dB)
Basses 100 - 315 Hz
(±) | basse réduite - en moyenne 11.3% inférieure à la médiane
(±) | la linéarité des basses est moyenne (14.2% delta à la fréquence précédente)
Médiums 400 - 2000 Hz
(+) | médiane équilibrée - seulement 2.4% de la médiane
(+) | les médiums sont linéaires (5.5% delta à la fréquence précédente)
Aiguës 2 - 16 kHz
(+) | des sommets équilibrés - à seulement 2% de la médiane
(+) | les aigus sont linéaires (4.5% delta à la fréquence précédente)
Globalement 100 - 16 000 Hz
(+) | le son global est linéaire (10.2% différence à la médiane)
Par rapport à la même classe
» 7% de tous les appareils testés de cette catégorie étaient meilleurs, 2% similaires, 90% pires
» Le meilleur avait un delta de 5%, la moyenne était de 18%, le pire était de 53%.
Par rapport à tous les appareils testés
» 5% de tous les appareils testés étaient meilleurs, 1% similaires, 94% pires
» Le meilleur avait un delta de 4%, la moyenne était de 23%, le pire était de 134%.
| Éteint/en veille | |
| Au repos | |
| Fortement sollicité |
|
Légende:
min: | |
| Microsoft Surface Laptop Go Core i5 i5-1035G1, UHD Graphics G1 (Ice Lake 32 EU), SK hynix BC501 HFM256GDGTNG, IPS, 1536x1024, 12.4" | Asus Zenbook S UX393JA i7-1065G7, Iris Plus Graphics G7 (Ice Lake 64 EU), Intel SSD 660p 1TB SSDPEKNW010T8, IPS, 3300x2200, 13.9" | HP EliteBook 830 G7 i7-10810U, UHD Graphics 620, Samsung SSD PM981a MZVLB512HBJQ, IPS, 1920x1080, 13.3" | Microsoft Surface Laptop 3 13 Core i5-1035G7 i5-1035G7, Iris Plus Graphics G7 (Ice Lake 64 EU), SK hynix BC501 HFM256GDGTNG, IPS, 2256x1504, 13.5" | Huawei MateBook X Pro 2020 i7 i7-10510U, GeForce MX250, Samsung PM981a MZVLB1T0HBLR, LTPS, 3000x2000, 13.9" | Apple MacBook Pro 13 2020 2GHz i5 10th-Gen i5-1038NG7, Iris Plus Graphics G7 (Ice Lake 64 EU), Apple SSD SM0512F, IPS, 2560x1600, 13.3" | |
|---|---|---|---|---|---|---|
| Power Consumption | -16% | 2% | -20% | -39% | -31% | |
| Idle Minimum * (Watt) | 2.8 | 4.1 -46% | 3.6 -29% | 4.4 -57% | 4.3 -54% | 3.8 -36% |
| Idle Average * (Watt) | 6.8 | 7.5 -10% | 4.7 31% | 7.5 -10% | 8.5 -25% | 8.6 -26% |
| Idle Maximum * (Watt) | 8 | 8.5 -6% | 5.1 36% | 7.8 2% | 12 -50% | 10.3 -29% |
| Load Average * (Watt) | 37.2 | 36.8 1% | 33.3 10% | 41.9 -13% | 54.8 -47% | 52.1 -40% |
| Load Maximum * (Watt) | 51.6 | 61.6 -19% | 70 -36% | 63.9 -24% | 61.5 -19% | 65.2 -26% |
| Witcher 3 ultra * (Watt) | 39.2 | 40.8 | 47.1 | 48.2 |
* ... Moindre est la valeur, meilleures sont les performances
| Microsoft Surface Laptop Go Core i5 i5-1035G1, UHD Graphics G1 (Ice Lake 32 EU), 39 Wh | Asus Zenbook S UX393JA i7-1065G7, Iris Plus Graphics G7 (Ice Lake 64 EU), 67 Wh | HP EliteBook 830 G7 i7-10810U, UHD Graphics 620, 53 Wh | Microsoft Surface Laptop 3 13 Core i5-1035G7 i5-1035G7, Iris Plus Graphics G7 (Ice Lake 64 EU), 45 Wh | Huawei MateBook X Pro 2020 i7 i7-10510U, GeForce MX250, 57.4 Wh | Apple MacBook Pro 13 2020 2GHz i5 10th-Gen i5-1038NG7, Iris Plus Graphics G7 (Ice Lake 64 EU), 58 Wh | |
|---|---|---|---|---|---|---|
| Autonomie de la batterie | 16% | 43% | -1% | 25% | 51% | |
| Reader / Idle (h) | 35 | 38.4 10% | 34.6 -1% | 34.4 -2% | ||
| WiFi v1.3 (h) | 8 | 8.3 4% | 11.5 44% | 8.3 4% | 10.4 30% | 12.1 51% |
| Load (h) | 2 | 2.7 35% | 3.7 85% | 1.9 -5% | 2.4 20% |
Points positifs
Points négatifs
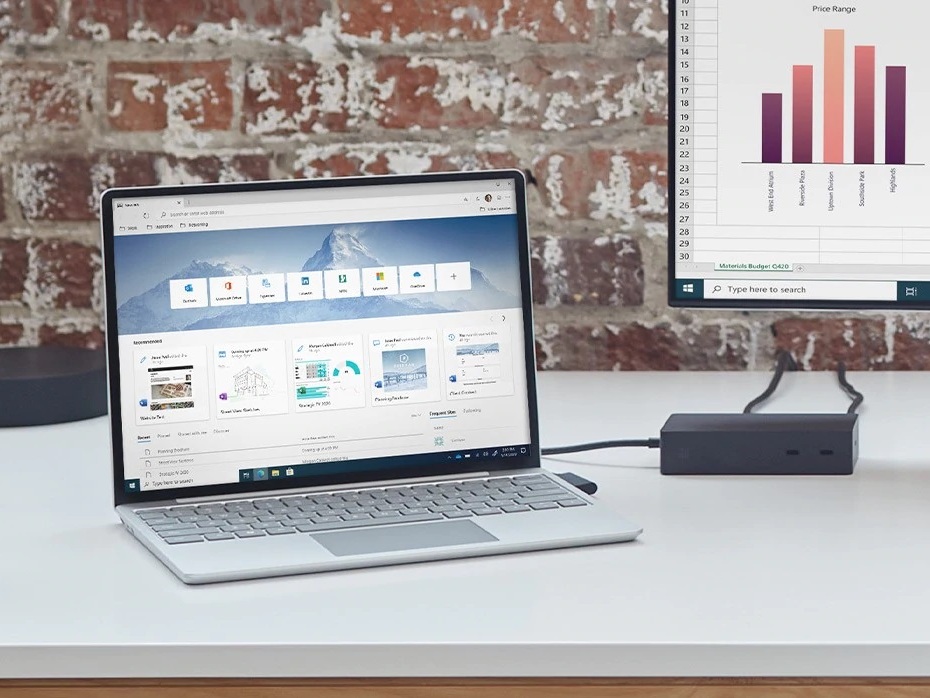
Le Surface Laptop Go est une machine bancale. D'un côté, c'est l'un des meilleurs PC portables à 550 € que l'on peut trouver, parce que son processeur Core i5 de 10e génération, son écran tactile 3:2, et sa conception en métal en font le meilleur actuellement disponible dans cette gamme de prix. Mais d'un autre côté, les 4 Go de RAM soudée, le SSD de 64 Go, les difficultés de maintenance, les graphismes lents et le manque de connectivité sont catastrophiques au regard des normes actuelles. Microsoft augmente spectaculairement le prix des versions supérieures, juste pour avoir 8 Go de RAM. Des spécifications au rabais, dignes d'un portable Acer à petit prix d'il y a cinq ans...
Ceux qui ne seront pas gênés de n'avoir que 4 Go de RAM pourront être séduits par les versions les moins hautes de gammes, parce que l'écran et le châssis sont excellents. Cela mis à part, il vaut mieux regarder du côté d'ultrabooks comme le XPS 13, le Spectre 13, le ZenBook 13, ou le Lenovo IdeaPad Slim 7, qui ont tous des versions à moins de 1000 €, équivalent à un Surface Laptop Go totalement équipé, et avec plus de fonctionnalités et une plus grosse autonomie...
L'intégralité de cette critique est disponible en anglais en suivant ce lien.
Microsoft Surface Laptop Go Core i5
- 10/24/2020 v7 (old)
Allen Ngo
Price comparison
