Courte critique du convertible Lenovo Yoga 920-13IKB (i7-8550U, FHD)
| SD Card Reader | |
| maximum SDCardreader Maximum Transfer Rate | |
| average SDCardreader Average Transfer Rate |
| Networking | |
| iperf3 transmit AX12 | |
| Asus ZenBook Flip S UX370 | |
| Lenovo Yoga 920-13IKB-80Y7 | |
| Dell Latitude 5289 | |
| Dell XPS 13-9365 2-in-1 | |
| iperf3 receive AX12 | |
| Lenovo Yoga 920-13IKB-80Y7 | |
| Dell Latitude 5289 | |
| Asus ZenBook Flip S UX370 | |
| Dell XPS 13-9365 2-in-1 | |
| |||||||||||||||||||||||||
Homogénéité de la luminosité: 81 %
Valeur mesurée au centre, sur batterie: 297.9 cd/m²
Contraste: 677:1 (Valeurs des noirs: 0.44 cd/m²)
ΔE ColorChecker Calman: 5.1 | ∀{0.5-29.43 Ø4.72}
ΔE Greyscale Calman: 6.7 | ∀{0.09-98 Ø4.97}
91.7% sRGB (Argyll 1.6.3 3D)
64.1% AdobeRGB 1998 (Argyll 1.6.3 3D)
64.1% AdobeRGB 1998 (Argyll 3D)
91.7% sRGB (Argyll 3D)
62.5% Display P3 (Argyll 3D)
Gamma: 2.9
CCT: 6839 K
| Lenovo Yoga 920-13IKB-80Y7 AU Optronics B139HAN03.0, IPS, 13.9", 1920x1080 | Dell XPS 13-9365 2-in-1 IPS, 13.3", 1920x1080 | HP Spectre x360 13-w023dx Chi Mei CMN1367, IPS, 13.3", 1920x1080 | Asus ZenBook Flip S UX370 AUO B133HAN04.2, a-Si TFT-LCD, WLED, 13.3", 1920x1080 | Dell Latitude 5289 BOE NV12N51, IPS LED, 12.5", 1920x1080 | HP Spectre x360 13-ac033dx LG Philips LGD054D, IPS, 13.3", 3840x2160 | |
|---|---|---|---|---|---|---|
| Display | -23% | 2% | 0% | -31% | 9% | |
| Display P3 Coverage (%) | 62.5 | 47.32 -24% | 65.4 5% | 64 2% | 42.79 -32% | 69.4 11% |
| sRGB Coverage (%) | 91.7 | 71.1 -22% | 90.4 -1% | 90 -2% | 64.3 -30% | 96.8 6% |
| AdobeRGB 1998 Coverage (%) | 64.1 | 48.83 -24% | 65.8 3% | 64.9 1% | 44.21 -31% | 71.1 11% |
| Response Times | -4% | 20% | 6% | 6% | 4% | |
| Response Time Grey 50% / Grey 80% * (ms) | 46 ? | 48 ? -4% | 33.2 ? 28% | 44 ? 4% | 42 ? 9% | 42 ? 9% |
| Response Time Black / White * (ms) | 31.6 ? | 32.8 ? -4% | 28 ? 11% | 29 ? 8% | 31 ? 2% | 32 ? -1% |
| PWM Frequency (Hz) | 1042 ? | 531 ? | ||||
| Screen | 11% | 5% | 26% | 18% | 30% | |
| Brightness middle (cd/m²) | 297.9 | 322.6 8% | 334.6 12% | 334 12% | 336 13% | 302.6 2% |
| Brightness (cd/m²) | 278 | 306 10% | 319 15% | 321 15% | 320 15% | 282 1% |
| Brightness Distribution (%) | 81 | 91 12% | 90 11% | 86 6% | 90 11% | 83 2% |
| Black Level * (cd/m²) | 0.44 | 0.19 57% | 0.336 24% | 0.25 43% | 0.34 23% | 0.25 43% |
| Contrast (:1) | 677 | 1698 151% | 996 47% | 1336 97% | 988 46% | 1210 79% |
| Colorchecker dE 2000 * | 5.1 | 7.7 -51% | 6.21 -22% | 4.24 17% | 3.45 32% | 2.4 53% |
| Colorchecker dE 2000 max. * | 11 | 11.1 -1% | 12 -9% | 6.03 45% | 7.95 28% | 4.9 55% |
| Greyscale dE 2000 * | 6.7 | 7.9 -18% | 7.71 -15% | 3.92 41% | 1.68 75% | 2.8 58% |
| Gamma | 2.9 76% | 2.88 76% | 2.36 93% | 2.68 82% | 2.49 88% | 2.2 100% |
| CCT | 6839 95% | 7044 92% | 6458 101% | 6758 96% | 6782 96% | 6333 103% |
| Color Space (Percent of AdobeRGB 1998) (%) | 64.1 | 44.1 -31% | 58.6 -9% | 58 -10% | 41 -36% | 65.5 2% |
| Color Space (Percent of sRGB) (%) | 91.7 | 69.9 -24% | 90 -2% | 90 -2% | 64 -30% | 97.1 6% |
| Moyenne finale (programmes/paramètres) | -5% /
2% | 9% /
7% | 11% /
18% | -2% /
6% | 14% /
22% |
* ... Moindre est la valeur, meilleures sont les performances
Temps de réponse de l'écran
| ↔ Temps de réponse noir à blanc | ||
|---|---|---|
| 31.6 ms ... hausse ↗ et chute ↘ combinées | ↗ 18.4 ms hausse | 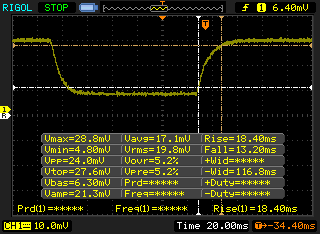 |
| ↘ 13.2 ms chute | ||
| L'écran souffre de latences très élevées, à éviter pour le jeu. En comparaison, tous les appareils testés affichent entre 0.1 (minimum) et 240 (maximum) ms. » 85 % des appareils testés affichent de meilleures performances. Cela signifie que les latences relevées sont moins bonnes que la moyenne (19.8 ms) de tous les appareils testés. | ||
| ↔ Temps de réponse gris 50% à gris 80% | ||
| 46 ms ... hausse ↗ et chute ↘ combinées | ↗ 20.8 ms hausse | 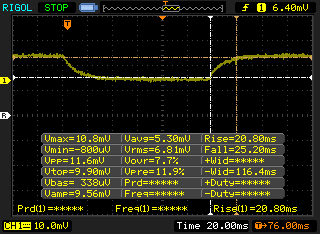 |
| ↘ 25.2 ms chute | ||
| L'écran souffre de latences très élevées, à éviter pour le jeu. En comparaison, tous les appareils testés affichent entre 0.165 (minimum) et 636 (maximum) ms. » 79 % des appareils testés affichent de meilleures performances. Cela signifie que les latences relevées sont moins bonnes que la moyenne (31 ms) de tous les appareils testés. | ||
Scintillement / MLI (Modulation de largeur d'impulsion)
| Scintillement / MLI (Modulation de largeur d'impulsion) non décelé | 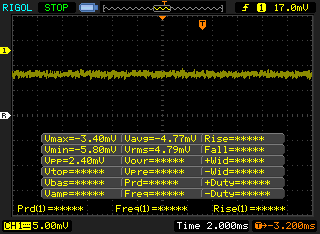 | ||
En comparaison, 52 % des appareils testés n'emploient pas MDI pour assombrir leur écran. Nous avons relevé une moyenne à 7772 (minimum : 5 - maximum : 343500) Hz dans le cas où une MDI était active. | |||
| Cinebench R10 | |
| Rendering Multiple CPUs 32Bit | |
| Dell XPS 13 i7-8550U | |
| Lenovo Yoga 920-13IKB-80Y7 | |
| HP Spectre x360 13-w023dx | |
| Asus ZenBook Flip S UX370 | |
| Dell XPS 13-9365 2-in-1 | |
| Rendering Single 32Bit | |
| Lenovo Yoga 920-13IKB-80Y7 | |
| HP Spectre x360 13-w023dx | |
| Dell XPS 13 i7-8550U | |
| Dell XPS 13-9365 2-in-1 | |
| Asus ZenBook Flip S UX370 | |
| wPrime 2.10 - 1024m | |
| Dell XPS 13-9365 2-in-1 | |
| HP Spectre x360 13-w023dx | |
| Lenovo Yoga 920-13IKB-80Y7 | |
* ... Moindre est la valeur, meilleures sont les performances
| PCMark 8 Home Score Accelerated v2 | 3999 points | |
| PCMark 8 Creative Score Accelerated v2 | 5342 points | |
| PCMark 8 Work Score Accelerated v2 | 5154 points | |
| PCMark 10 Score | 4012 points | |
Aide | ||
| Lenovo Yoga 920-13IKB-80Y7 Samsung PM961 MZVLW256HEHP | Dell XPS 13-9365 2-in-1 Toshiba NVMe THNSN5256GPUK | HP Spectre x360 13-w023dx Samsung PM951 NVMe MZVLV512 | Asus ZenBook Flip S UX370 SanDisk SD8SN8U256G1002 | Dell Latitude 5289 SanDisk X400 256GB, SATA (SD8SB8U-256G) | HP Spectre x360 13-ac033dx Samsung PM961 NVMe MZVLW512HMJP | |
|---|---|---|---|---|---|---|
| CrystalDiskMark 3.0 | -35% | -25% | -59% | -67% | 1% | |
| Write 4k QD32 (MB/s) | 573 | 250.2 -56% | 361.2 -37% | 170.8 -70% | 158.8 -72% | 225.6 -61% |
| Read 4k QD32 (MB/s) | 432.9 | 411 -5% | 535 24% | 385.4 -11% | 306.2 -29% | 518 20% |
| Write 4k (MB/s) | 142.4 | 121.2 -15% | 137.9 -3% | 57 -60% | 27.92 -80% | 139.4 -2% |
| Read 4k (MB/s) | 56.2 | 32.93 -41% | 42.66 -24% | 29.7 -47% | 22.73 -60% | 54.7 -3% |
| Write 512 (MB/s) | 832 | 410.7 -51% | 571 -31% | 291.5 -65% | 255.6 -69% | 1229 48% |
| Read 512 (MB/s) | 1252 | 966 -23% | 679 -46% | 315.7 -75% | 260.8 -79% | 865 -31% |
| Write Seq (MB/s) | 1125 | 629 -44% | 571 -49% | 432.5 -62% | 406.4 -64% | 1550 38% |
| Read Seq (MB/s) | 2070 | 1206 -42% | 1376 -34% | 455.9 -78% | 423.7 -80% | 2065 0% |

| 3DMark 11 | |
| 1280x720 Performance GPU | |
| HP Envy 13-ad006ng | |
| Dell XPS 13 9360 FHD i7 Iris | |
| Dell XPS 13 i7-8550U | |
| Lenovo Yoga 920-13IKB-80Y7 | |
| Dell Latitude 5289 | |
| Asus ZenBook Flip S UX370 | |
| HP Spectre x360 13-ac033dx | |
| Dell XPS 13-9365 2-in-1 | |
| 1280x720 Performance Combined | |
| HP Envy 13-ad006ng | |
| Dell XPS 13 9360 FHD i7 Iris | |
| Dell XPS 13 i7-8550U | |
| Lenovo Yoga 920-13IKB-80Y7 | |
| HP Spectre x360 13-ac033dx | |
| Dell Latitude 5289 | |
| Asus ZenBook Flip S UX370 | |
| Dell XPS 13-9365 2-in-1 | |
| 3DMark | |
| 1280x720 Cloud Gate Standard Graphics | |
| HP Envy 13-ad006ng | |
| Dell XPS 13 9360 FHD i7 Iris | |
| Lenovo Yoga 920-13IKB-80Y7 | |
| Dell XPS 13 i7-8550U | |
| Asus ZenBook Flip S UX370 | |
| Dell Latitude 5289 | |
| Dell XPS 13-9365 2-in-1 | |
| HP Spectre x360 13-ac033dx | |
| 1920x1080 Fire Strike Graphics | |
| HP Envy 13-ad006ng | |
| Dell XPS 13 9360 FHD i7 Iris | |
| Dell XPS 13 i7-8550U | |
| Lenovo Yoga 920-13IKB-80Y7 | |
| Dell Latitude 5289 | |
| Asus ZenBook Flip S UX370 | |
| HP Spectre x360 13-ac033dx | |
| Dell XPS 13-9365 2-in-1 | |
| 1920x1080 Ice Storm Extreme Graphics | |
| Lenovo Yoga 920-13IKB-80Y7 | |
| Asus ZenBook Flip S UX370 | |
| Dell XPS 13 i7-8550U | |
| Dell XPS 13-9365 2-in-1 | |
| HP Spectre x360 13-ac033dx | |
| 3DMark 11 Performance | 1915 points | |
| 3DMark Ice Storm Standard Score | 74895 points | |
| 3DMark Cloud Gate Standard Score | 8519 points | |
| 3DMark Fire Strike Score | 1052 points | |
| 3DMark Fire Strike Extreme Score | 489 points | |
Aide | ||
| BioShock Infinite | |
| 1920x1080 Ultra Preset, DX11 (DDOF) (Classer selon les valeurs) | |
| Lenovo Yoga 920-13IKB-80Y7 | |
| Asus ZenBook Flip S UX370 | |
| Dell XPS 13 i7-8550U | |
| HP Envy 13-ad006ng | |
| Dell XPS 13 9360 FHD i7 Iris | |
| 1366x768 High Preset (Classer selon les valeurs) | |
| Lenovo Yoga 920-13IKB-80Y7 | |
| Asus ZenBook Flip S UX370 | |
| Dell XPS 13 i7-8550U | |
| HP Envy 13-ad006ng | |
| Dell XPS 13 9360 FHD i7 Iris | |
| Rise of the Tomb Raider | |
| 1920x1080 High Preset AA:FX AF:4x (Classer selon les valeurs) | |
| Lenovo Yoga 920-13IKB-80Y7 | |
| Asus ZenBook Flip S UX370 | |
| Dell XPS 13 i7-8550U | |
| HP Envy 13-ad006ng | |
| 1366x768 Medium Preset AF:2x (Classer selon les valeurs) | |
| Lenovo Yoga 920-13IKB-80Y7 | |
| Asus ZenBook Flip S UX370 | |
| Dell XPS 13 i7-8550U | |
| HP Envy 13-ad006ng | |
| Bas | Moyen | Élevé | Ultra | |
|---|---|---|---|---|
| BioShock Infinite (2013) | 67.1 | 36.2 | 30.5 | 10.1 |
| Rise of the Tomb Raider (2016) | 22.9 | 12.7 | 6.8 |
Degré de la nuisance sonore
| Au repos |
| 28 / 28.8 / 30.3 dB(A) |
| Fortement sollicité |
| 34.5 / 34.3 dB(A) |
 | ||
30 dB silencieux 40 dB(A) audible 50 dB(A) bruyant |
||
min: | ||
| Lenovo Yoga 920-13IKB-80Y7 UHD Graphics 620, i5-8550U, Samsung PM961 MZVLW256HEHP | HP Spectre x360 13-w023dx HD Graphics 620, i7-7500U, Samsung PM951 NVMe MZVLV512 | Asus ZenBook Flip S UX370 HD Graphics 620, i5-7200U, SanDisk SD8SN8U256G1002 | Dell Latitude 5289 HD Graphics 620, i5-7300U, SanDisk X400 256GB, SATA (SD8SB8U-256G) | HP Spectre x360 13-ac033dx HD Graphics 620, i7-7500U, Samsung PM961 NVMe MZVLW512HMJP | Lenovo Yoga 910-13IKB-80VF004CGE HD Graphics 620, i7-7500U, Samsung PM951 NVMe MZVLV512 | |
|---|---|---|---|---|---|---|
| Noise | -6% | -3% | -5% | -10% | -9% | |
| arrêt / environnement * (dB) | 28 | 29.1 -4% | 30.5 -9% | 30.5 -9% | 28.7 -2% | 31.7 -13% |
| Idle Minimum * (dB) | 28 | 29.1 -4% | 30.5 -9% | 30.5 -9% | 28.7 -2% | 31.7 -13% |
| Idle Average * (dB) | 28.8 | 29.1 -1% | 30.5 -6% | 30.5 -6% | 34.2 -19% | 31.7 -10% |
| Idle Maximum * (dB) | 30.3 | 31.2 -3% | 30.5 -1% | 30.5 -1% | 35.8 -18% | 31.7 -5% |
| Load Average * (dB) | 34.5 | 37.3 -8% | 34.2 1% | 36 -4% | 35.8 -4% | 38.4 -11% |
| Load Maximum * (dB) | 34.3 | 39.6 -15% | 32.5 5% | 34.6 -1% | 39.6 -15% | 34.7 -1% |
* ... Moindre est la valeur, meilleures sont les performances
(±) La température maximale du côté supérieur est de 44.4 °C / 112 F, par rapport à la moyenne de 35.4 °C / 96 F, allant de 19.6 à 60 °C pour la classe Convertible.
(±) Le fond chauffe jusqu'à un maximum de 42.8 °C / 109 F, contre une moyenne de 36.9 °C / 98 F
(+) En utilisation inactive, la température moyenne du côté supérieur est de 20.8 °C / 69 F, par rapport à la moyenne du dispositif de 30.3 °C / 87 F.
(+) Les repose-poignets et le pavé tactile sont plus froids que la température de la peau avec un maximum de 31.8 °C / 89.2 F et sont donc froids au toucher.
(-) La température moyenne de la zone de l'appui-paume de dispositifs similaires était de 28 °C / 82.4 F (-3.8 °C / #-6.8 F).
Lenovo Yoga 920-13IKB-80Y7 analyse audio
(-) | haut-parleurs pas très forts (65.7 dB)
Basses 100 - 315 Hz
(±) | basse réduite - en moyenne 14.7% inférieure à la médiane
(-) | les basses ne sont pas linéaires (15.7% delta à la fréquence précédente)
Médiums 400 - 2000 Hz
(+) | médiane équilibrée - seulement 2.3% de la médiane
(+) | les médiums sont linéaires (5.5% delta à la fréquence précédente)
Aiguës 2 - 16 kHz
(+) | des sommets équilibrés - à seulement 2.9% de la médiane
(+) | les aigus sont linéaires (6.8% delta à la fréquence précédente)
Globalement 100 - 16 000 Hz
(±) | la linéarité du son global est moyenne (18.5% de différence avec la médiane)
Par rapport à la même classe
» 41% de tous les appareils testés de cette catégorie étaient meilleurs, 8% similaires, 51% pires
» Le meilleur avait un delta de 6%, la moyenne était de 20%, le pire était de 57%.
Par rapport à tous les appareils testés
» 41% de tous les appareils testés étaient meilleurs, 8% similaires, 51% pires
» Le meilleur avait un delta de 4%, la moyenne était de 24%, le pire était de 134%.
Apple MacBook 12 (Early 2016) 1.1 GHz analyse audio
(+) | les haut-parleurs peuvent jouer relativement fort (83.6# dB)
Basses 100 - 315 Hz
(±) | basse réduite - en moyenne 11.3% inférieure à la médiane
(±) | la linéarité des basses est moyenne (14.2% delta à la fréquence précédente)
Médiums 400 - 2000 Hz
(+) | médiane équilibrée - seulement 2.4% de la médiane
(+) | les médiums sont linéaires (5.5% delta à la fréquence précédente)
Aiguës 2 - 16 kHz
(+) | des sommets équilibrés - à seulement 2% de la médiane
(+) | les aigus sont linéaires (4.5% delta à la fréquence précédente)
Globalement 100 - 16 000 Hz
(+) | le son global est linéaire (10.2% différence à la médiane)
Par rapport à la même classe
» 7% de tous les appareils testés de cette catégorie étaient meilleurs, 2% similaires, 91% pires
» Le meilleur avait un delta de 5%, la moyenne était de 18%, le pire était de 53%.
Par rapport à tous les appareils testés
» 5% de tous les appareils testés étaient meilleurs, 1% similaires, 94% pires
» Le meilleur avait un delta de 4%, la moyenne était de 24%, le pire était de 134%.
| Éteint/en veille | |
| Au repos | |
| Fortement sollicité |
|
Légende:
min: | |
| Lenovo Yoga 920-13IKB-80Y7 i5-8550U, UHD Graphics 620, Samsung PM961 MZVLW256HEHP, IPS, 1920x1080, 13.9" | HP Spectre x360 13-w023dx i7-7500U, HD Graphics 620, Samsung PM951 NVMe MZVLV512, IPS, 1920x1080, 13.3" | Asus ZenBook Flip S UX370 i5-7200U, HD Graphics 620, SanDisk SD8SN8U256G1002, a-Si TFT-LCD, WLED, 1920x1080, 13.3" | HP Spectre x360 13-ac033dx i7-7500U, HD Graphics 620, Samsung PM961 NVMe MZVLW512HMJP, IPS, 3840x2160, 13.3" | Lenovo Yoga 910-13IKB-80VF004CGE i7-7500U, HD Graphics 620, Samsung PM951 NVMe MZVLV512, IPS, 3840x2160, 13.9" | Dell XPS 13-9365 2-in-1 i7-7Y75, HD Graphics 615, Toshiba NVMe THNSN5256GPUK, IPS, 1920x1080, 13.3" | Dell XPS 13 i7-8550U i5-8550U, UHD Graphics 620, Toshiba XG5 KXG50ZNV256G, IGZO IPS, 3200x1800, 13.3" | |
|---|---|---|---|---|---|---|---|
| Power Consumption | -15% | 11% | -32% | -8% | 26% | -9% | |
| Idle Minimum * (Watt) | 3.1 | 5.5 -77% | 2.6 16% | 5.3 -71% | 4.3 -39% | 3.1 -0% | 4.1 -32% |
| Idle Average * (Watt) | 6.6 | 6.7 -2% | 5.3 20% | 9.6 -45% | 6.3 5% | 4.3 35% | 5.8 12% |
| Idle Maximum * (Watt) | 7 | 7.1 -1% | 8.5 -21% | 10.1 -44% | 9 -29% | 4.9 30% | 6 14% |
| Load Average * (Watt) | 35.2 | 33.1 6% | 29 18% | 34.4 2% | 32.7 7% | 24.3 31% | 42.5 -21% |
| Load Maximum * (Watt) | 34.6 | 35.2 -2% | 27 22% | 34.8 -1% | 28.8 17% | 22.8 34% | 41.4 -20% |
* ... Moindre est la valeur, meilleures sont les performances
| Lenovo Yoga 920-13IKB-80Y7 i5-8550U, UHD Graphics 620, 70 Wh | HP Spectre x360 13-w023dx i7-7500U, HD Graphics 620, 57.8 Wh | Asus ZenBook Flip S UX370 i5-7200U, HD Graphics 620, 39 Wh | Dell Latitude 5289 i5-7300U, HD Graphics 620, 60 Wh | HP Spectre x360 13-ac033dx i7-7500U, HD Graphics 620, 57.8 Wh | Lenovo Yoga 910-13IKB-80VF004CGE i7-7500U, HD Graphics 620, 78 Wh | Dell XPS 13-9365 2-in-1 i7-7Y75, HD Graphics 615, 46 Wh | |
|---|---|---|---|---|---|---|---|
| Autonomie de la batterie | -19% | -21% | 3% | -30% | -5% | -5% | |
| Reader / Idle (h) | 27.6 | 20.6 -25% | 15.6 -43% | 28.8 4% | 13.2 -52% | 17.8 -36% | 16.2 -41% |
| WiFi v1.3 (h) | 11.4 | 9.3 -18% | 8.1 -29% | 11.8 4% | 9 -21% | 10.7 -6% | 11.4 0% |
| Load (h) | 2.3 | 2 -13% | 2.5 9% | 2.3 0% | 1.9 -17% | 2.9 26% | 2.9 26% |
Points positifs
Points négatifs
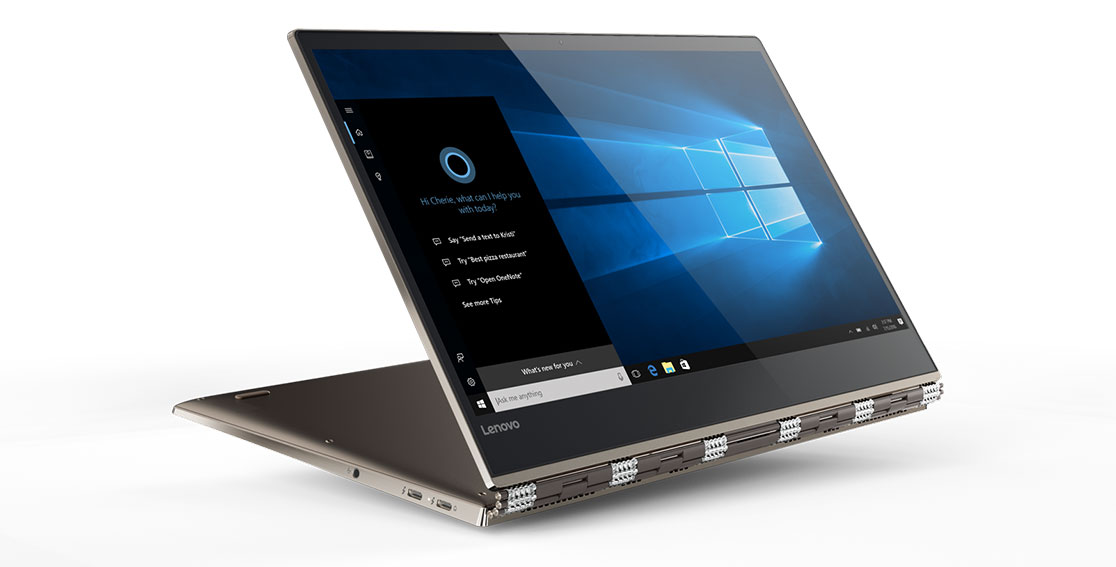
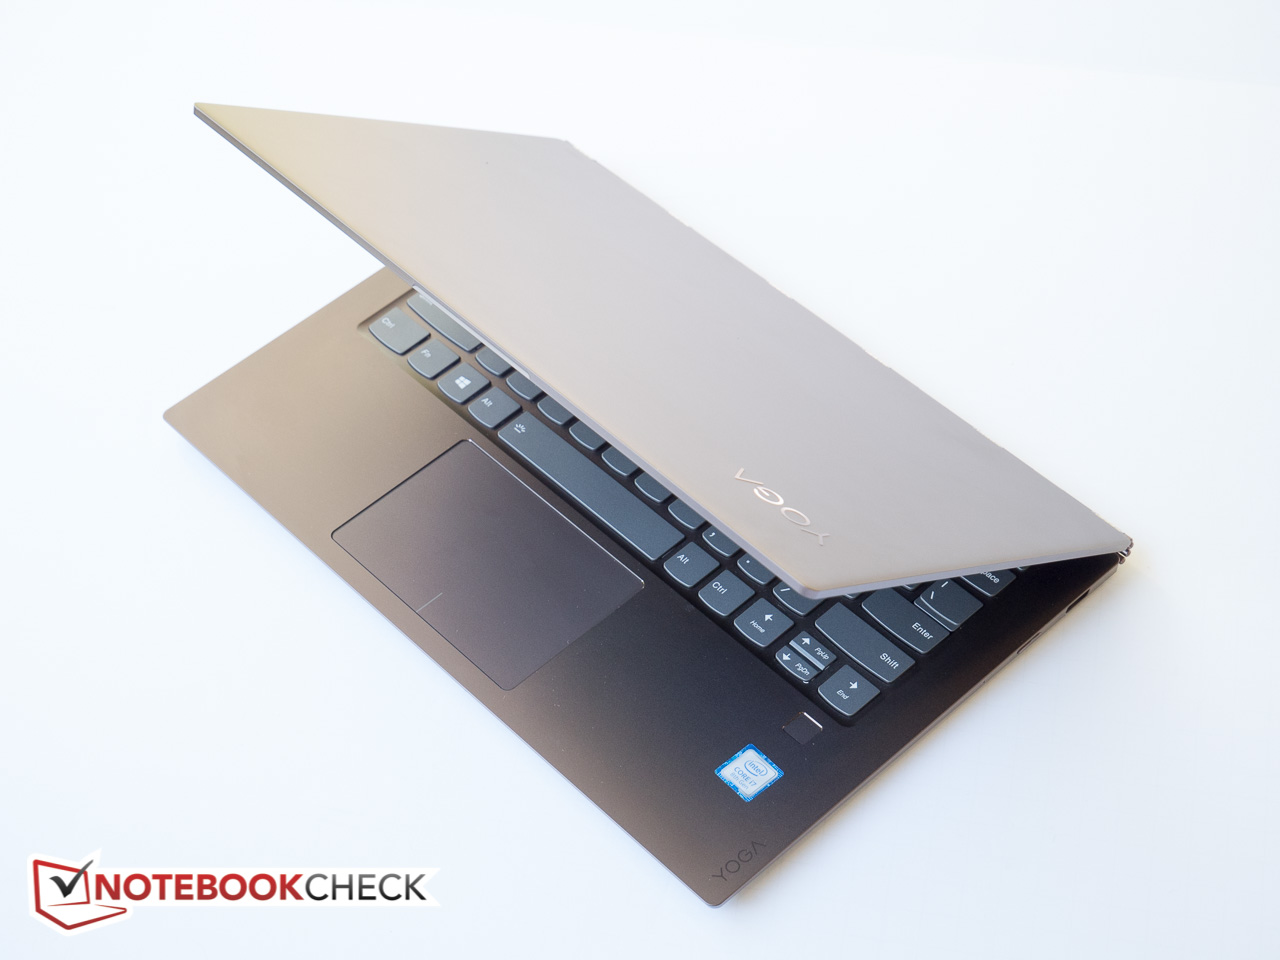
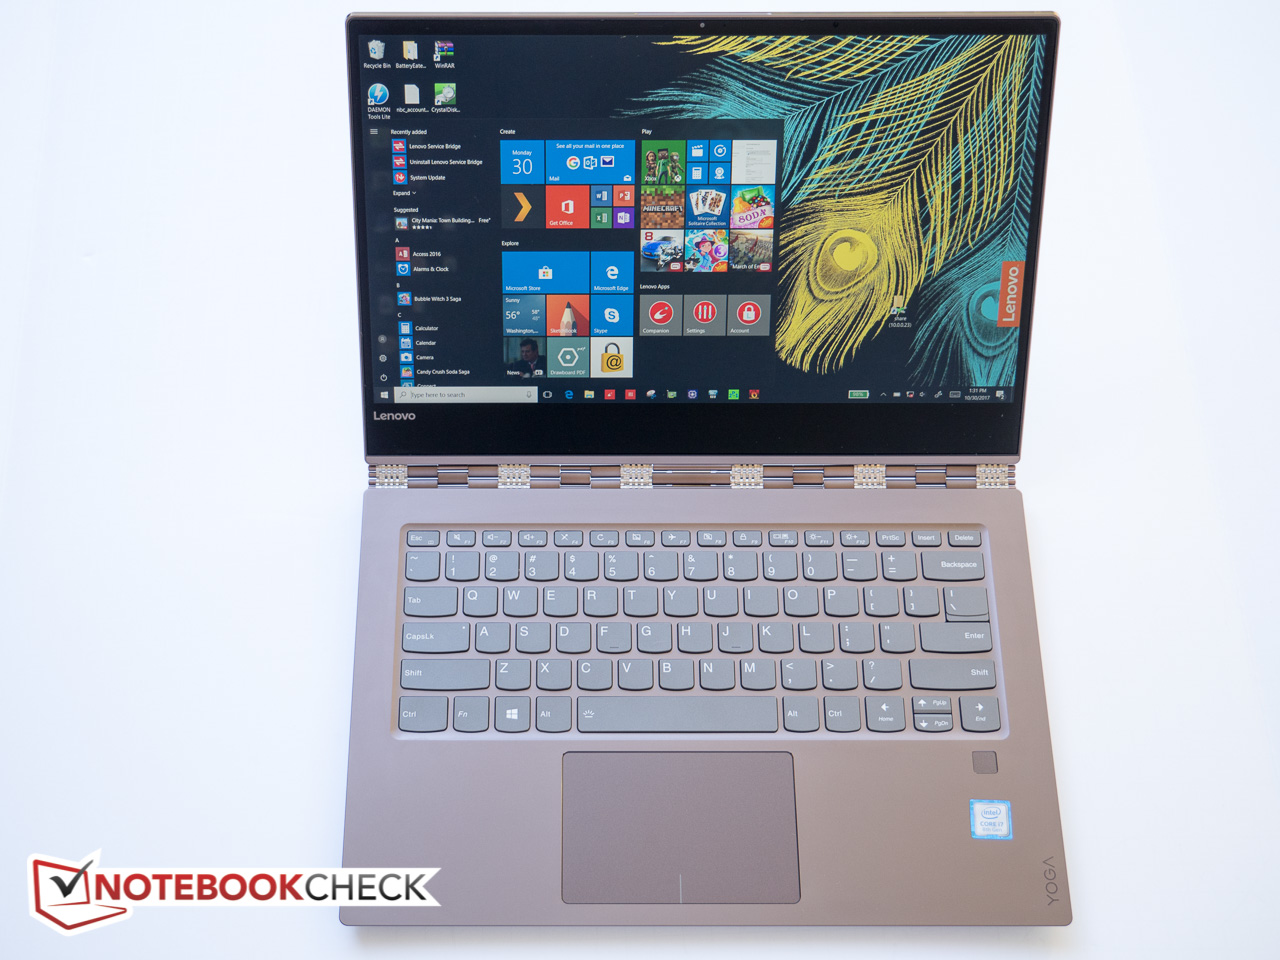
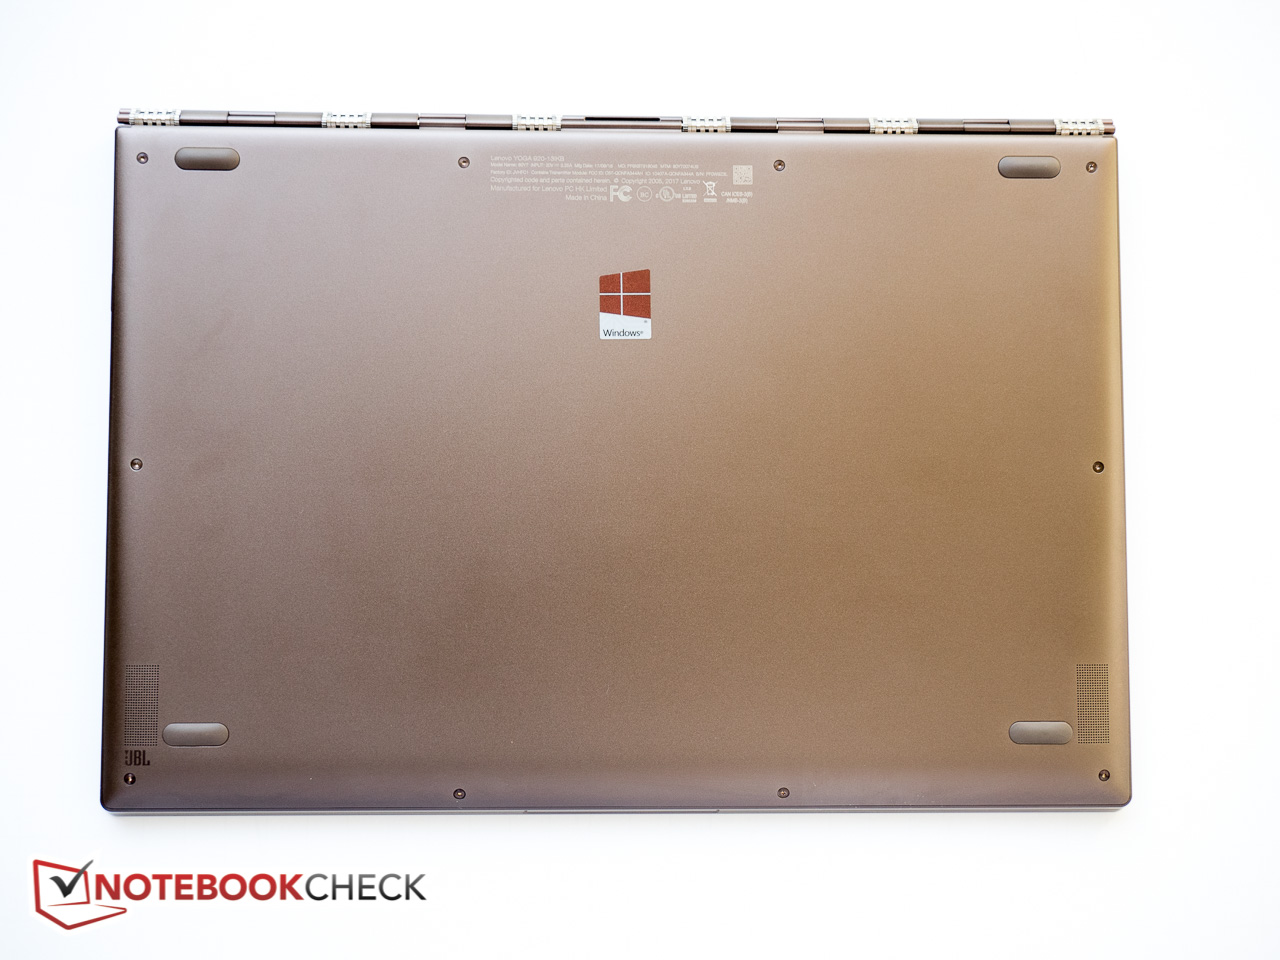
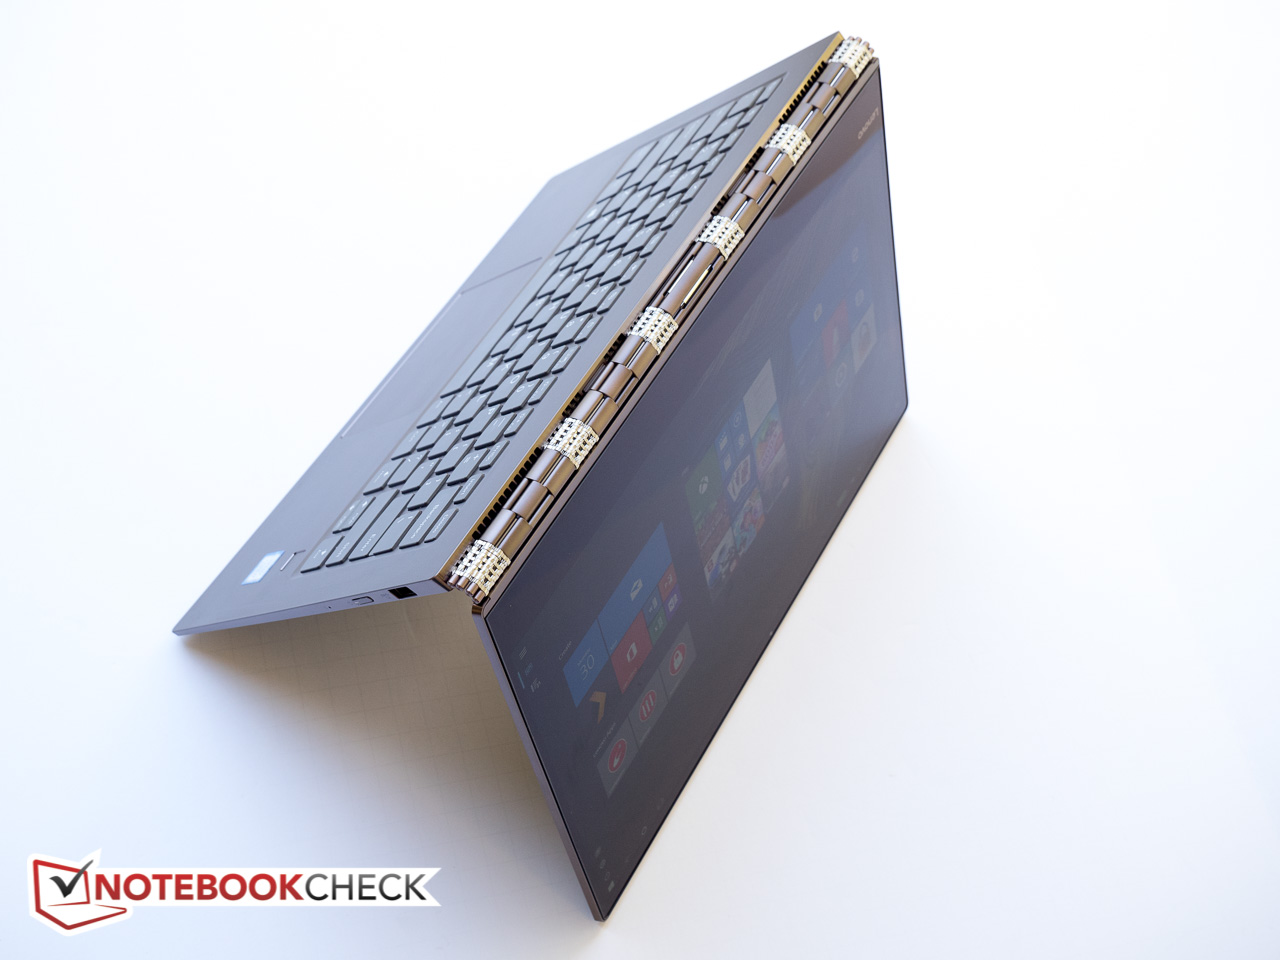
Le nouveau Yoga 920 est le meilleur des Yoga de la série 900 jusqu’à aujourd’hui, et il est bien plus qu’une mise à jour matérielle. Les performances ont certainement été améliorées grâce au nouveau CPU quatre cœurs et au SSD NVMe rapide, mais Lenovo a amélioré d’autres domaines : le nouveau convertible est maintenant équipé de 2 Thunderbolt 3, d’un meilleur emplacement pour la webcam, d’un clavier modifié, il permet pour la première fois l’utilisation d’un stylet actif, et possède une meilleure autonomie. Lenovo a assurément pris au sérieux les retours utilisateur, et c’est agréable à voir.
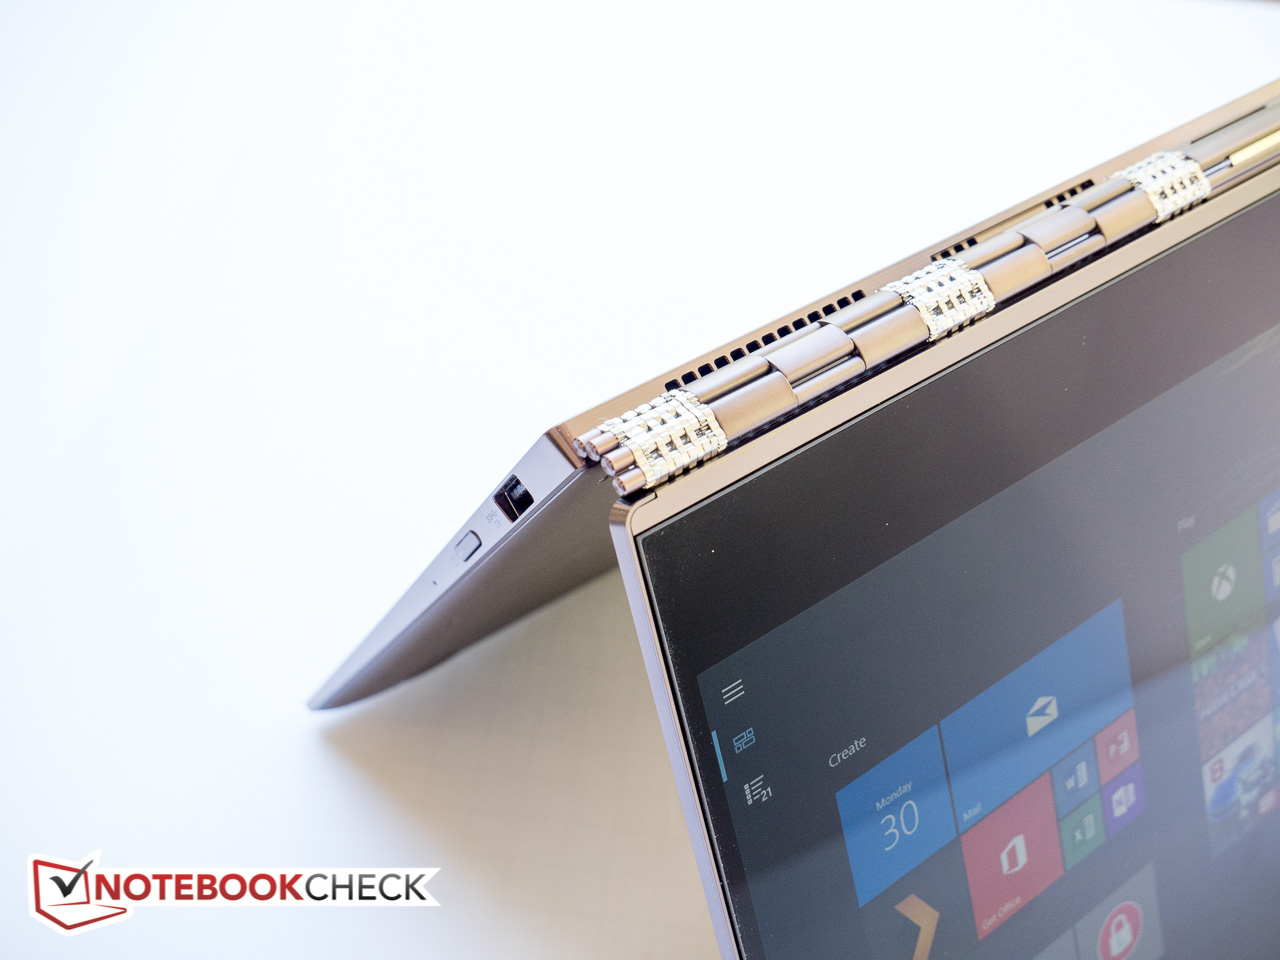
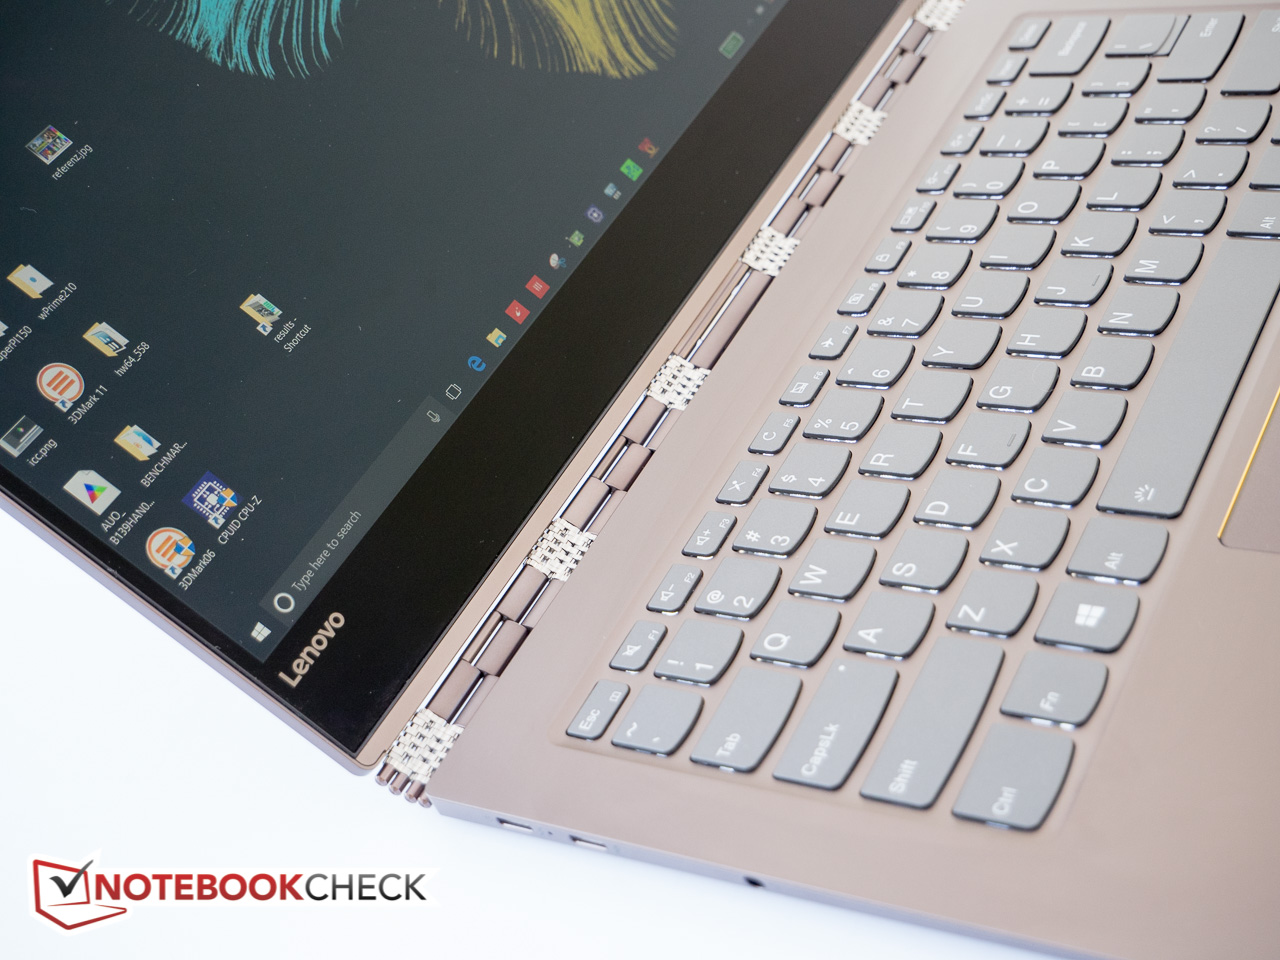
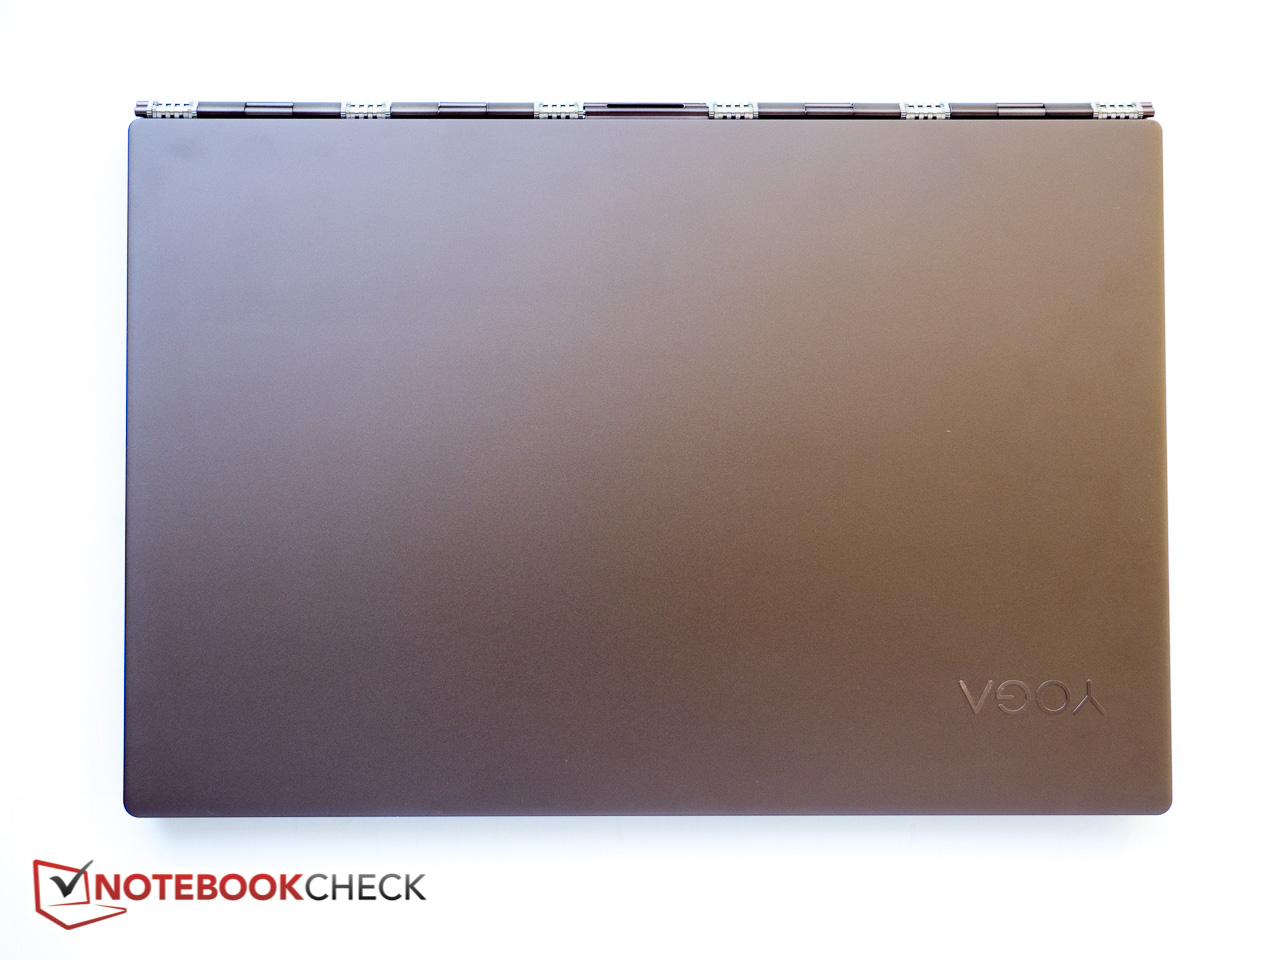
Le châssis en aluminium est réussi, et plutôt robuste, et la charnière est toujours aussi séduisante. L’écran pourrait être un petit peu plus lumineux, et le contraste et l’échelle de gris un peu meilleurs. Il y a aussi la question de la taille : la Yoga est toujours l’un des plus gros convertibles disponibles, ce qui ne facilite pas sa prise en main en mode tablette. Néanmoins l’on peut apprécier la taille d’écran un peu plus élevée que la moyenne. L’absence du "Lift’n Lock" pour le clavier, du style du ThinkPad Yoga, laisse les touchess exposées, il faudra donc y faire attention. Le throttling en cas de fortes sollicitations réduit un peu les grosses performances des cœurs supplémentaires, mais la puissance globale est malgré tout supérieure à avant, donc ce n’est pas un gros inconvénient. Avantage supplémentaire : le sifflement gênant que nous avions sur le Yoga 910 n’est plus de la partie.
Le Yoga 920 est un convertible très bien conçu. Ceux qui pensent acheter un convertible du style du HP Spectre x360 ou du Dell XPS 13 devraient très certainement jeter un œil au Yoga un peu plus grand.
L’intégralité de cette critique est disponible en anglais en suivant ce lien.
Lenovo Yoga 920-13IKB-80Y7
- 11/02/2017 v6 (old)
Bernhard Pechlaner
Price comparison
