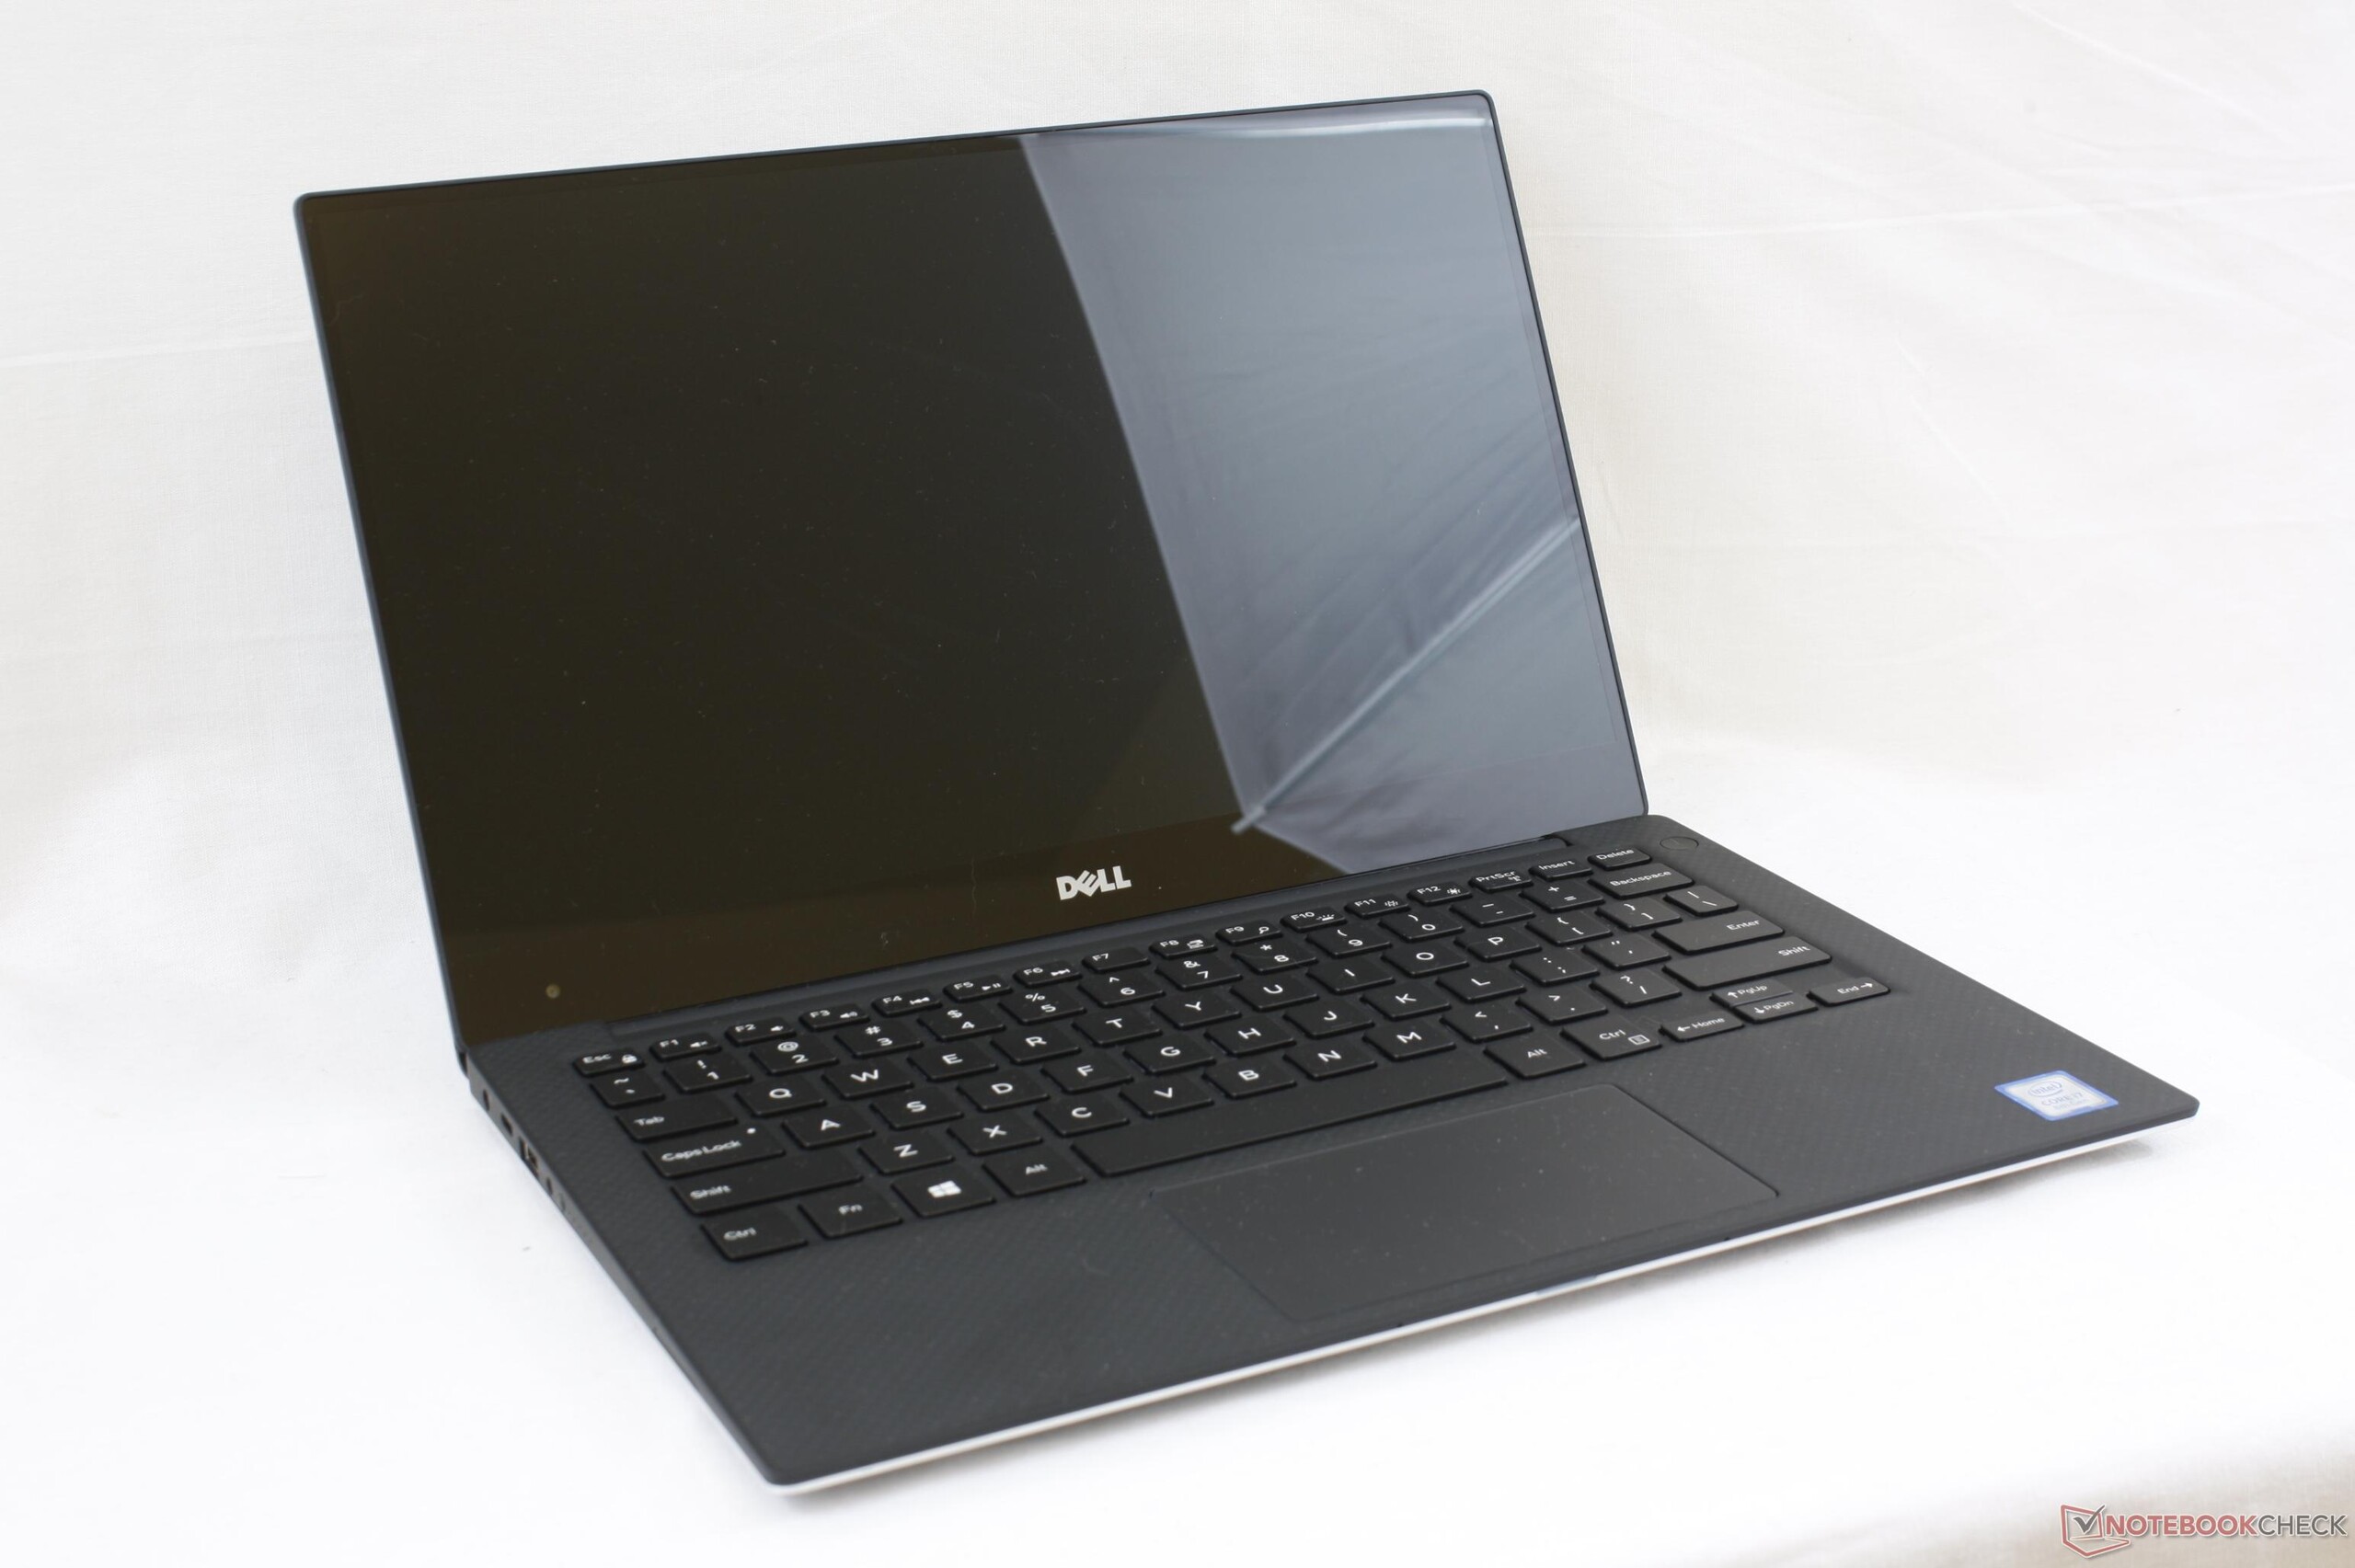
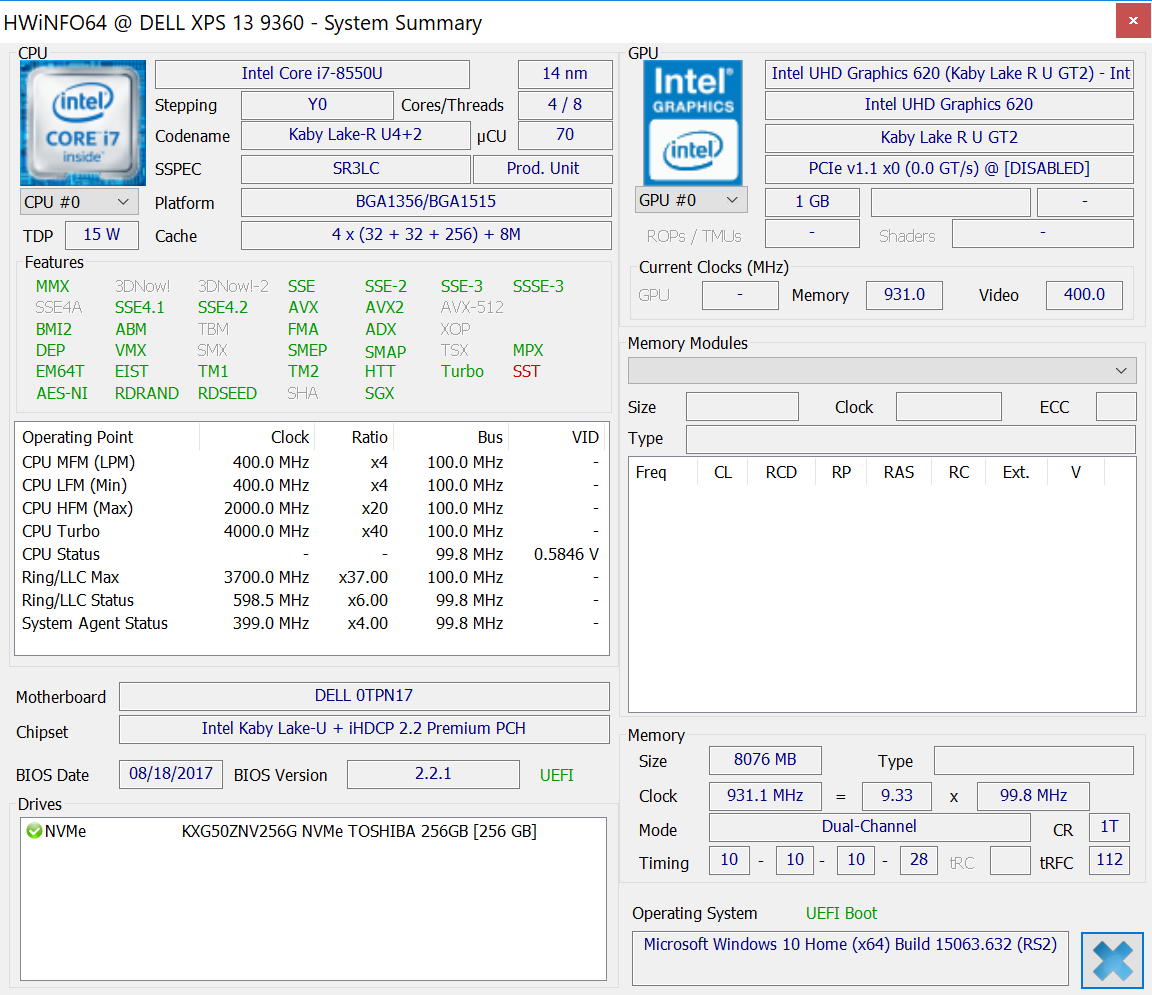
Courte critique du PC portable Dell XPS 13 9360R (i7-8550U, QHD)
| SD Card Reader | |
| average JPG Copy Test (av. of 3 runs) | |
| Dell XPS 13 i7-8550U | |
| Dell XPS 15 9560 (i7-7700HQ, UHD) | |
| Acer Swift 3 SF315-51G-57E5 | |
| maximum AS SSD Seq Read Test (1GB) | |
| Dell XPS 15 9560 (i7-7700HQ, UHD) | |
| Dell XPS 13 i7-8550U | |
| Acer Swift 3 SF315-51G-57E5 | |
| Networking | |
| iperf3 transmit AX12 | |
| Dell XPS 13 i7-8550U | |
| Samsung Notebook 9 NP900X3N-K01US | |
| HP Spectre x360 13-ac033dx | |
| iperf3 receive AX12 | |
| Samsung Notebook 9 NP900X3N-K01US | |
| HP Spectre x360 13-ac033dx | |
| Dell XPS 13 i7-8550U | |
| |||||||||||||||||||||||||
Homogénéité de la luminosité: 83 %
Valeur mesurée au centre, sur batterie: 386.1 cd/m²
Contraste: 1170:1 (Valeurs des noirs: 0.33 cd/m²)
ΔE ColorChecker Calman: 4.2 | ∀{0.5-29.43 Ø4.73}
ΔE Greyscale Calman: 5.7 | ∀{0.09-98 Ø4.97}
92.2% sRGB (Argyll 1.6.3 3D)
59% AdobeRGB 1998 (Argyll 1.6.3 3D)
65.4% AdobeRGB 1998 (Argyll 3D)
93% sRGB (Argyll 3D)
63.6% Display P3 (Argyll 3D)
Gamma: 2.28
CCT: 7336 K
| Dell XPS 13 i7-8550U ID: Sharp SHP144A, Name: LQ133Z1, IGZO IPS, 13.3", 3200x1800 | Samsung Notebook 9 NP900X3N-K01US ID: BOE06E1, Name: NV133FHB-N31, IPS, 13.3", 1920x1080 | Huawei MateBook X Chi Mei CMN8201 / P130ZDZ-EF1, , 13.3", 2160x1440 | Asus ZenBook Flip S UX370 AUO B133HAN04.2, a-Si TFT-LCD, WLED, 13.3", 1920x1080 | Razer Blade Stealth QHD i7-7500U Sharp SHP142F (LQ125T1JW02), , 12.5", 2560x1440 | Dell XPS 13 9360 QHD+ i7 Sharp SHP144A, IPS, 13.3", 3200x1800 | |
|---|---|---|---|---|---|---|
| Display | -2% | 3% | -1% | 6% | -2% | |
| Display P3 Coverage (%) | 63.6 | 63.4 0% | 65.8 3% | 64 1% | 68.7 8% | 62.8 -1% |
| sRGB Coverage (%) | 93 | 88.6 -5% | 96.2 3% | 90 -3% | 95.8 3% | 89.4 -4% |
| AdobeRGB 1998 Coverage (%) | 65.4 | 64 -2% | 66.8 2% | 64.9 -1% | 69.9 7% | 64.6 -1% |
| Response Times | -21% | 10% | -16% | -14% | -15% | |
| Response Time Grey 50% / Grey 80% * (ms) | 35.6 ? | 41.6 ? -17% | 33 ? 7% | 44 ? -24% | 37 ? -4% | 43.6 ? -22% |
| Response Time Black / White * (ms) | 27.2 ? | 34 ? -25% | 24 ? 12% | 29 ? -7% | 33.4 ? -23% | 29.2 ? -7% |
| PWM Frequency (Hz) | 19690 ? | 210.1 ? | 200 ? | |||
| Screen | 4% | 17% | 7% | 1% | 8% | |
| Brightness middle (cd/m²) | 386.1 | 510.7 32% | 408 6% | 334 -13% | 402 4% | 396.2 3% |
| Brightness (cd/m²) | 357 | 481 35% | 395 11% | 321 -10% | 382 7% | 357 0% |
| Brightness Distribution (%) | 83 | 90 8% | 88 6% | 86 4% | 88 6% | 84 1% |
| Black Level * (cd/m²) | 0.33 | 0.66 -100% | 0.45 -36% | 0.25 24% | 0.45 -36% | 0.266 19% |
| Contrast (:1) | 1170 | 774 -34% | 907 -22% | 1336 14% | 893 -24% | 1489 27% |
| Colorchecker dE 2000 * | 4.2 | 2.4 43% | 1.55 63% | 4.24 -1% | 3.6 14% | 3.9 7% |
| Colorchecker dE 2000 max. * | 7.6 | 7.3 4% | 2.19 71% | 6.03 21% | 7.5 1% | 7.58 -0% |
| Greyscale dE 2000 * | 5.7 | 2.4 58% | 1.91 66% | 3.92 31% | 4.3 25% | 4.16 27% |
| Gamma | 2.28 96% | 2.23 99% | 2.34 94% | 2.68 82% | 2.1 105% | 2.31 95% |
| CCT | 7336 89% | 6747 96% | 6491 100% | 6758 96% | 6572 99% | 6514 100% |
| Color Space (Percent of AdobeRGB 1998) (%) | 59 | 57 -3% | 61 3% | 58 -2% | 62.3 6% | 57.5 -3% |
| Color Space (Percent of sRGB) (%) | 92.2 | 88.1 -4% | 96 4% | 90 -2% | 95.7 4% | 88.7 -4% |
| Moyenne finale (programmes/paramètres) | -6% /
-1% | 10% /
13% | -3% /
2% | -2% /
-0% | -3% /
3% |
* ... Moindre est la valeur, meilleures sont les performances
Temps de réponse de l'écran
| ↔ Temps de réponse noir à blanc | ||
|---|---|---|
| 27.2 ms ... hausse ↗ et chute ↘ combinées | ↗ 16 ms hausse | 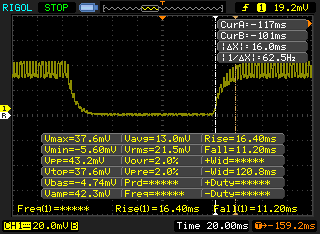 |
| ↘ 11.2 ms chute | ||
| L'écran souffre de latences relativement élevées, insuffisant pour le jeu. En comparaison, tous les appareils testés affichent entre 0.1 (minimum) et 240 (maximum) ms. » 69 % des appareils testés affichent de meilleures performances. Cela signifie que les latences relevées sont moins bonnes que la moyenne (19.9 ms) de tous les appareils testés. | ||
| ↔ Temps de réponse gris 50% à gris 80% | ||
| 35.6 ms ... hausse ↗ et chute ↘ combinées | ↗ 18.4 ms hausse | 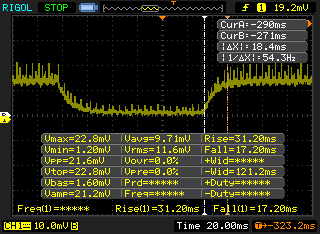 |
| ↘ 17.2 ms chute | ||
| L'écran souffre de latences très élevées, à éviter pour le jeu. En comparaison, tous les appareils testés affichent entre 0.165 (minimum) et 636 (maximum) ms. » 50 % des appareils testés affichent de meilleures performances. Cela signifie que les latences relevées sont moins bonnes que la moyenne (31.1 ms) de tous les appareils testés. | ||
Scintillement / MLI (Modulation de largeur d'impulsion)
| Scintillement / MLI (Modulation de largeur d'impulsion) décelé | 19690 Hz | ≤ 100 Niveau de luminosité | 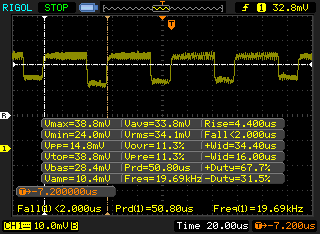 |
Le rétroéclairage de l'écran scintille à la fréquence de 19690 Hz (certainement du fait de l'utilisation d'une MDI - Modulation de largeur d'impulsion) à un niveau de luminosité inférieur ou égal à 100 % . Aucun scintillement ne devrait être perceptible au-dessus de cette valeur. La fréquence de rafraîchissement de 19690 Hz est élevée, la grande majorité des utilisateurs ne devrait pas percevoir de scintillements et être sujette à une fatigue oculaire accrue. En comparaison, 52 % des appareils testés n'emploient pas MDI pour assombrir leur écran. Nous avons relevé une moyenne à 7798 (minimum : 5 - maximum : 343500) Hz dans le cas où une MDI était active. | |||
| Cinebench R15 | |
| CPU Single 64Bit | |
| Eurocom Tornado F5 | |
| Dell XPS 13 i7-8550U | |
| MSI WS63VR 7RL-023US | |
| Tuxedo InfinityBook Pro 13 2017 | |
| Dell XPS 13 9360 FHD i7 Iris | |
| Acer Spin 5 SP513-52N-566U | |
| Dell XPS 13 9360-4764 | |
| Dell XPS 13 2016 9350 (FHD, i7-6560U) | |
| Dell XPS 13 2016 i7 256GB QHD | |
| Dell XPS 13 9360 FHD i5 | |
| Dell XPS 13-9343 Non-Touch | |
| CPU Multi 64Bit | |
| Eurocom Tornado F5 | |
| MSI WS63VR 7RL-023US | |
| Dell XPS 13 i7-8550U | |
| Tuxedo InfinityBook Pro 13 2017 | |
| Acer Spin 5 SP513-52N-566U | |
| Acer Spin 5 SP513-52N-566U | |
| Dell XPS 13 9360-4764 | |
| Dell XPS 13 9360 FHD i7 Iris | |
| Dell XPS 13 9360 FHD i5 | |
| Dell XPS 13 2016 9350 (FHD, i7-6560U) | |
| Dell XPS 13 2016 i7 256GB QHD | |
| Dell XPS 13-9343 Non-Touch | |
| wPrime 2.10 - 1024m | |
| Dell XPS 13-9343 Non-Touch | |
| Dell XPS 13 9360-4764 | |
| Tuxedo InfinityBook Pro 13 2017 | |
| Acer Spin 5 SP513-52N-566U | |
| MSI WS63VR 7RL-023US | |
| Eurocom Tornado F5 | |
* ... Moindre est la valeur, meilleures sont les performances
| PCMark 8 | |
| Home Score Accelerated v2 | |
| Dell XPS 13 9360 FHD i7 Iris | |
| Dell XPS 13 9360 FHD i5 | |
| Dell XPS 13 i7-8550U | |
| Dell XPS 13 9360 QHD+ i7 | |
| Work Score Accelerated v2 | |
| Dell XPS 13 9360 FHD i7 Iris | |
| Dell XPS 13 9360 FHD i5 | |
| Dell XPS 13 i7-8550U | |
| Dell XPS 13 9360 QHD+ i7 | |
| Creative Score Accelerated v2 | |
| Dell XPS 13 9360 FHD i7 Iris | |
| Dell XPS 13 i7-8550U | |
| Dell XPS 13 9360 FHD i5 | |
| Dell XPS 13 9360 QHD+ i7 | |
| PCMark 8 Home Score Accelerated v2 | 3432 points | |
| PCMark 8 Creative Score Accelerated v2 | 4604 points | |
| PCMark 8 Work Score Accelerated v2 | 4436 points | |
Aide | ||
| Dell XPS 13 i7-8550U Toshiba XG5 KXG50ZNV256G | Dell XPS 13 9365-4537 2-in-1 Toshiba NVMe THNSN5256GPUK | Dell XPS 13-9365 2-in-1 Toshiba NVMe THNSN5256GPUK | Dell XPS 13 9360 FHD i5 Toshiba NVMe THNSN5256GPUK | Dell XPS 13 2016 9350 (FHD, i7-6560U) Samsung SSD SM951 512 GB MZHPV512HDGL | |
|---|---|---|---|---|---|
| AS SSD | 23% | 52% | 16% | 86% | |
| Copy Game MB/s (MB/s) | 285.3 | 457.8 60% | 726 154% | 390 37% | 618 117% |
| Copy Program MB/s (MB/s) | 172 | 264.7 54% | 263.8 53% | 188 9% | 333.8 94% |
| Copy ISO MB/s (MB/s) | 329.7 | 714 117% | 950 188% | 283.3 -14% | 830 152% |
| Score Total (Points) | 1284 | 1388 8% | 1495 16% | 1607 25% | 1992 55% |
| Score Write (Points) | 452 | 389 -14% | 375 -17% | 327 -28% | 606 34% |
| Score Read (Points) | 580 | 681 17% | 752 30% | 870 50% | 911 57% |
| Access Time Write * (ms) | 0.051 | 0.041 20% | 0.037 27% | 0.035 31% | 0.031 39% |
| Access Time Read * (ms) | 0.102 | 0.169 -66% | 0.045 56% | 0.055 46% | 0.048 53% |
| 4K-64 Write (MB/s) | 325.1 | 249.4 -23% | 204.7 -37% | 197.7 -39% | 363.4 12% |
| 4K-64 Read (MB/s) | 423.6 | 512 21% | 586 38% | 723 71% | 722 70% |
| 4K Write (MB/s) | 101.7 | 85.8 -16% | 96.9 -5% | 92 -10% | 107.4 6% |
| 4K Read (MB/s) | 28.17 | 34.77 23% | 37.69 34% | 29.52 5% | 46.9 66% |
| Seq Write (MB/s) | 249.2 | 543 118% | 735 195% | 372.8 50% | 1348 441% |
| Seq Read (MB/s) | 1277 | 1342 5% | 1283 0% | 1179 -8% | 1413 11% |
* ... Moindre est la valeur, meilleures sont les performances

| 3DMark 11 | |
| 1280x720 Performance GPU | |
| HP Pavilion 17z 1EX13AV | |
| Apple MacBook Pro 13 2017 | |
| Dell XPS 13 9360 FHD i7 Iris | |
| Dell XPS 13 i7-8550U | |
| Lenovo ThinkCentre M910z-10NR000KUS | |
| Asus ZenBook Flip S UX370 | |
| HP Spectre x360 13-ac033dx | |
| Huawei MateBook X | |
| Acer TravelMate P449-M-7407 | |
| 1280x720 Performance Combined | |
| Apple MacBook Pro 13 2017 | |
| Dell XPS 13 9360 FHD i7 Iris | |
| Dell XPS 13 i7-8550U | |
| HP Spectre x360 13-ac033dx | |
| Asus ZenBook Flip S UX370 | |
| Acer TravelMate P449-M-7407 | |
| Lenovo ThinkCentre M910z-10NR000KUS | |
| Huawei MateBook X | |
| HP Pavilion 17z 1EX13AV | |
| 3DMark | |
| 1280x720 Cloud Gate Standard Graphics | |
| Apple MacBook Pro 13 2017 | |
| Dell XPS 13 9360 FHD i7 Iris | |
| HP Pavilion 17z 1EX13AV | |
| Dell XPS 13 i7-8550U | |
| Asus ZenBook Flip S UX370 | |
| Lenovo ThinkCentre M910z-10NR000KUS | |
| HP Spectre x360 13-ac033dx | |
| Huawei MateBook X | |
| Acer TravelMate P449-M-7407 | |
| 1920x1080 Fire Strike Graphics | |
| HP Pavilion 17z 1EX13AV | |
| Apple MacBook Pro 13 2017 | |
| Dell XPS 13 9360 FHD i7 Iris | |
| Dell XPS 13 i7-8550U | |
| Asus ZenBook Flip S UX370 | |
| HP Spectre x360 13-ac033dx | |
| Lenovo ThinkCentre M910z-10NR000KUS | |
| Huawei MateBook X | |
| Acer TravelMate P449-M-7407 | |
| 1280x720 Ice Storm Standard Graphics | |
| Asus ZenBook Flip S UX370 | |
| Dell XPS 13 i7-8550U | |
| Acer TravelMate P449-M-7407 | |
| Huawei MateBook X | |
| HP Spectre x360 13-ac033dx | |
| HP Pavilion 17z 1EX13AV | |
| 3DMark 11 Performance | 2032 points | |
| 3DMark Ice Storm Standard Score | 67042 points | |
| 3DMark Cloud Gate Standard Score | 8459 points | |
| 3DMark Fire Strike Score | 1071 points | |
| 3DMark Fire Strike Extreme Score | 490 points | |
Aide | ||
| BioShock Infinite | |
| 1366x768 High Preset | |
| HP Envy 13-ad006ng | |
| Apple MacBook Pro 13 2016 | |
| Dell XPS 13 9360 FHD i7 Iris | |
| Dell XPS 13 i7-8550U | |
| Dell XPS 13 9360-4764 | |
| Dell XPS 13 9360 QHD+ i7 | |
| Dell XPS 13 9360 QHD+ i5 | |
| Dell XPS 13 2016 i7 256GB QHD | |
| Dell XPS 13-9350 | |
| Dell XPS 13-9343 | |
| 1920x1080 Ultra Preset, DX11 (DDOF) | |
| HP Envy 13-ad006ng | |
| Apple MacBook Pro 13 2016 | |
| Dell XPS 13 9360 FHD i7 Iris | |
| Dell XPS 13 i7-8550U | |
| Dell XPS 13 9360 QHD+ i7 | |
| Dell XPS 13 9360 QHD+ i5 | |
| Dell XPS 13 2016 i7 256GB QHD | |
| Dell XPS 13-9350 | |
| Dell XPS 13-9343 | |
| Rise of the Tomb Raider | |
| 1366x768 Medium Preset AF:2x | |
| HP Envy 13-ad006ng | |
| Apple MacBook Pro 13 2016 | |
| Microsoft Surface Pro (2017) i7 | |
| Dell XPS 13 i7-8550U | |
| Dell XPS 13 9360 QHD+ i7 | |
| 1920x1080 High Preset AA:FX AF:4x | |
| HP Envy 13-ad006ng | |
| Microsoft Surface Pro (2017) i7 | |
| Dell XPS 13 i7-8550U | |
| Dell XPS 13 9360 QHD+ i7 | |
| Bas | Moyen | Élevé | Ultra | |
|---|---|---|---|---|
| BioShock Infinite (2013) | 72.8 | 37.6 | 31.1 | 10 |
| Rise of the Tomb Raider (2016) | 24.9 | 14.6 | 7.4 | |
| Overwatch (2016) | 49.6 | 30.7 | 14.9 |
Degré de la nuisance sonore
| Au repos |
| 27.9 / 27.9 / 27.9 dB(A) |
| Fortement sollicité |
| 30.8 / 33.1 dB(A) |
 | ||
30 dB silencieux 40 dB(A) audible 50 dB(A) bruyant |
||
min: | ||
| Dell XPS 13 i7-8550U UHD Graphics 620, i5-8550U, Toshiba XG5 KXG50ZNV256G | Samsung Notebook 9 NP900X3N-K01US HD Graphics 620, i5-7200U, Samsung CM871a MZNTY256HDHP | Huawei MateBook X HD Graphics 620, i5-7200U, LITEON CB1-SD256 | Asus ZenBook Flip S UX370 HD Graphics 620, i5-7200U, SanDisk SD8SN8U256G1002 | Dell XPS 13 9360 FHD i7 Iris Iris Plus Graphics 640, i7-7560U, Toshiba XG4 NVMe (THNSN5512GPUK) | Dell XPS 13 9360 FHD i5 HD Graphics 620, i5-7200U, Toshiba NVMe THNSN5256GPUK | |
|---|---|---|---|---|---|---|
| Noise | -4% | -8% | -8% | -3% | ||
| arrêt / environnement * (dB) | 27.9 | 28.4 -2% | 30.5 -9% | 29.9 -7% | ||
| Idle Minimum * (dB) | 27.9 | 28.4 -2% | 30.5 -9% | 29.9 -7% | 28.9 -4% | |
| Idle Average * (dB) | 27.9 | 28.4 -2% | 30.5 -9% | 29.9 -7% | 28.9 -4% | |
| Idle Maximum * (dB) | 27.9 | 28.4 -2% | 30.5 -9% | 30.3 -9% | 28.9 -4% | |
| Load Average * (dB) | 30.8 | 33.2 -8% | 34.2 -11% | 33.9 -10% | 30.9 -0% | |
| Load Maximum * (dB) | 33.1 | 35.2 -6% | 32.5 2% | 34.9 -5% | 33.5 -1% |
* ... Moindre est la valeur, meilleures sont les performances
(-) La température maximale du côté supérieur est de 49 °C / 120 F, par rapport à la moyenne de 35.9 °C / 97 F, allant de 21.4 à 59 °C pour la classe Subnotebook.
(-) Le fond chauffe jusqu'à un maximum de 54 °C / 129 F, contre une moyenne de 39.2 °C / 103 F
(+) En utilisation inactive, la température moyenne du côté supérieur est de 25.7 °C / 78 F, par rapport à la moyenne du dispositif de 30.8 °C / 87 F.
(+) Les repose-poignets et le pavé tactile atteignent la température maximale de la peau (32.2 °C / 90 F) et ne sont donc pas chauds.
(-) La température moyenne de la zone de l'appui-paume de dispositifs similaires était de 28.2 °C / 82.8 F (-4 °C / #-7.2 F).
Dell XPS 13 i7-8550U analyse audio
(-) | haut-parleurs pas très forts (66.8 dB)
Basses 100 - 315 Hz
(+) | bonne basse - seulement 4.5% loin de la médiane
(±) | la linéarité des basses est moyenne (8.2% delta à la fréquence précédente)
Médiums 400 - 2000 Hz
(±) | médiane supérieure - en moyenne 5% supérieure à la médiane
(+) | les médiums sont linéaires (5.8% delta à la fréquence précédente)
Aiguës 2 - 16 kHz
(+) | des sommets équilibrés - à seulement 3% de la médiane
(±) | la linéarité des aigus est moyenne (14.5% delta à la fréquence précédente)
Globalement 100 - 16 000 Hz
(±) | la linéarité du son global est moyenne (17.2% de différence avec la médiane)
Par rapport à la même classe
» 44% de tous les appareils testés de cette catégorie étaient meilleurs, 9% similaires, 47% pires
» Le meilleur avait un delta de 5%, la moyenne était de 18%, le pire était de 53%.
Par rapport à tous les appareils testés
» 32% de tous les appareils testés étaient meilleurs, 8% similaires, 60% pires
» Le meilleur avait un delta de 4%, la moyenne était de 24%, le pire était de 134%.
Apple MacBook 12 (Early 2016) 1.1 GHz analyse audio
(+) | les haut-parleurs peuvent jouer relativement fort (83.6# dB)
Basses 100 - 315 Hz
(±) | basse réduite - en moyenne 11.3% inférieure à la médiane
(±) | la linéarité des basses est moyenne (14.2% delta à la fréquence précédente)
Médiums 400 - 2000 Hz
(+) | médiane équilibrée - seulement 2.4% de la médiane
(+) | les médiums sont linéaires (5.5% delta à la fréquence précédente)
Aiguës 2 - 16 kHz
(+) | des sommets équilibrés - à seulement 2% de la médiane
(+) | les aigus sont linéaires (4.5% delta à la fréquence précédente)
Globalement 100 - 16 000 Hz
(+) | le son global est linéaire (10.2% différence à la médiane)
Par rapport à la même classe
» 7% de tous les appareils testés de cette catégorie étaient meilleurs, 2% similaires, 91% pires
» Le meilleur avait un delta de 5%, la moyenne était de 18%, le pire était de 53%.
Par rapport à tous les appareils testés
» 5% de tous les appareils testés étaient meilleurs, 1% similaires, 94% pires
» Le meilleur avait un delta de 4%, la moyenne était de 24%, le pire était de 134%.
| Éteint/en veille | |
| Au repos | |
| Fortement sollicité |
|
Légende:
min: | |
| Dell XPS 13 i7-8550U i5-8550U, UHD Graphics 620, Toshiba XG5 KXG50ZNV256G, IGZO IPS, 3200x1800, 13.3" | Samsung Notebook 9 NP900X3N-K01US i5-7200U, HD Graphics 620, Samsung CM871a MZNTY256HDHP, IPS, 1920x1080, 13.3" | Asus ZenBook Flip S UX370 i5-7200U, HD Graphics 620, SanDisk SD8SN8U256G1002, a-Si TFT-LCD, WLED, 1920x1080, 13.3" | Dell XPS 13 9360 FHD i7 Iris i7-7560U, Iris Plus Graphics 640, Toshiba XG4 NVMe (THNSN5512GPUK), IPS, 1920x1080, 13.3" | Dell XPS 13 9360 QHD+ i7 i7-7500U, HD Graphics 620, Toshiba NVMe THNSN5256GPUK, IPS, 3200x1800, 13.3" | HP Spectre 13-v131ng i7-7500U, HD Graphics 620, Samsung PM961 NVMe MZVLW512HMJP, IPS UWVA, 1920x1080, 13.3" | |
|---|---|---|---|---|---|---|
| Power Consumption | -29% | 14% | 7% | -5% | -3% | |
| Idle Minimum * (Watt) | 4.1 | 3.8 7% | 2.6 37% | 3.32 19% | 6.4 -56% | 3.6 12% |
| Idle Average * (Watt) | 5.8 | 11 -90% | 5.3 9% | 5.27 9% | 6.6 -14% | 6.4 -10% |
| Idle Maximum * (Watt) | 6 | 11.3 -88% | 8.5 -42% | 6.32 -5% | 6.8 -13% | 9.2 -53% |
| Load Average * (Watt) | 42.5 | 35.6 16% | 29 32% | 32 25% | 27.5 35% | 34 20% |
| Load Maximum * (Watt) | 41.4 | 37.2 10% | 27 35% | 45.9 -11% | 32.4 22% | 34.4 17% |
* ... Moindre est la valeur, meilleures sont les performances
| Dell XPS 13 i7-8550U i5-8550U, UHD Graphics 620, 60 Wh | Samsung Notebook 9 NP900X3N-K01US i5-7200U, HD Graphics 620, 30 Wh | Huawei MateBook X i5-7200U, HD Graphics 620, 40 Wh | Asus ZenBook Flip S UX370 i5-7200U, HD Graphics 620, 39 Wh | Dell XPS 13 9360 FHD i7 Iris i7-7560U, Iris Plus Graphics 640, 60 Wh | Dell XPS 13 9360 FHD i5 i5-7200U, HD Graphics 620, 60 Wh | |
|---|---|---|---|---|---|---|
| Autonomie de la batterie | -49% | -28% | -10% | 19% | 13% | |
| Reader / Idle (h) | 18.5 | 11.6 -37% | 8.5 -54% | 15.6 -16% | 25.4 37% | 21.6 17% |
| WiFi v1.3 (h) | 9.8 | 4.7 -52% | 5.6 -43% | 8.1 -17% | 10.9 11% | 11.3 15% |
| Load (h) | 2.4 | 1 -58% | 2.7 13% | 2.5 4% | 2.6 8% | 2.6 8% |
Points positifs
Points négatifs
La principale intention de Dell en intégrant la 8e génération de processeurs Intel Kaby Lake R est de booster les performances grâce à une meilleure gestion de la température. Ainsi cette dernière version doit fonctionner à des températures internes plus élevées sans impacter négativement l’expérience de l’utilisateur, ni augmenter la température de surface à des niveaux inconfortables. Nos tests reflètent plus ou moins ces affirmations, les températures internes pouvant dépasser les 90 °C en cas de sollicitations élevées, sans augmenter la vitesse maximale des ventilateurs. Les températures en surface seront légèrement plus élevées à certains endroits du clavier, mais les repose-poignets et le touchpad ne deviennent jamais inconfortables.
Mis à part le bond significatif des performances CPU et les améliorations mineures des performances GPU, il n’y a pas de surprise dans cette nouvelle génération de XPS 13. Les avantages et inconvénients des modèles précédents sont toujours présents. Il peut même être préférable d’acheter le XPS 13 i7-7560U plutôt que le i7-8550U, la carte graphique Iris étant plus performante de 18 % que la UHD Graphics 620. Mais dans ce cas les performances CPU sont plus lentes d’environ 40 %. Les logiciels exigeants qui tirent profit du plus grand nombre de cœurs adoreront Kaby Lake R et le nouveau XPS 13. Celui-ci peut néanmoins toujours être amélioré, le taux d’horloge stabilisé à 2,5 GHz étant encore loin des 3,7 GHz potentiels. Il sera de ce fait intéressant de voir comment les autres ultrabooks équipés du même CPU se comporteront.
Le XPS 13 est une fois de plus un concurrent très crédible dans ce début d'année. Le gains de performances annoncé est bien là, même si nous aurions apprécié un meilleur maintient dans le temps du Turbo Boost.
L’intégralité de cette critique est disponible en anglais en suivant ce lien.
Dell XPS 13 i7-8550U
- 10/12/2017 v6 (old)
Allen Ngo
Price comparison
