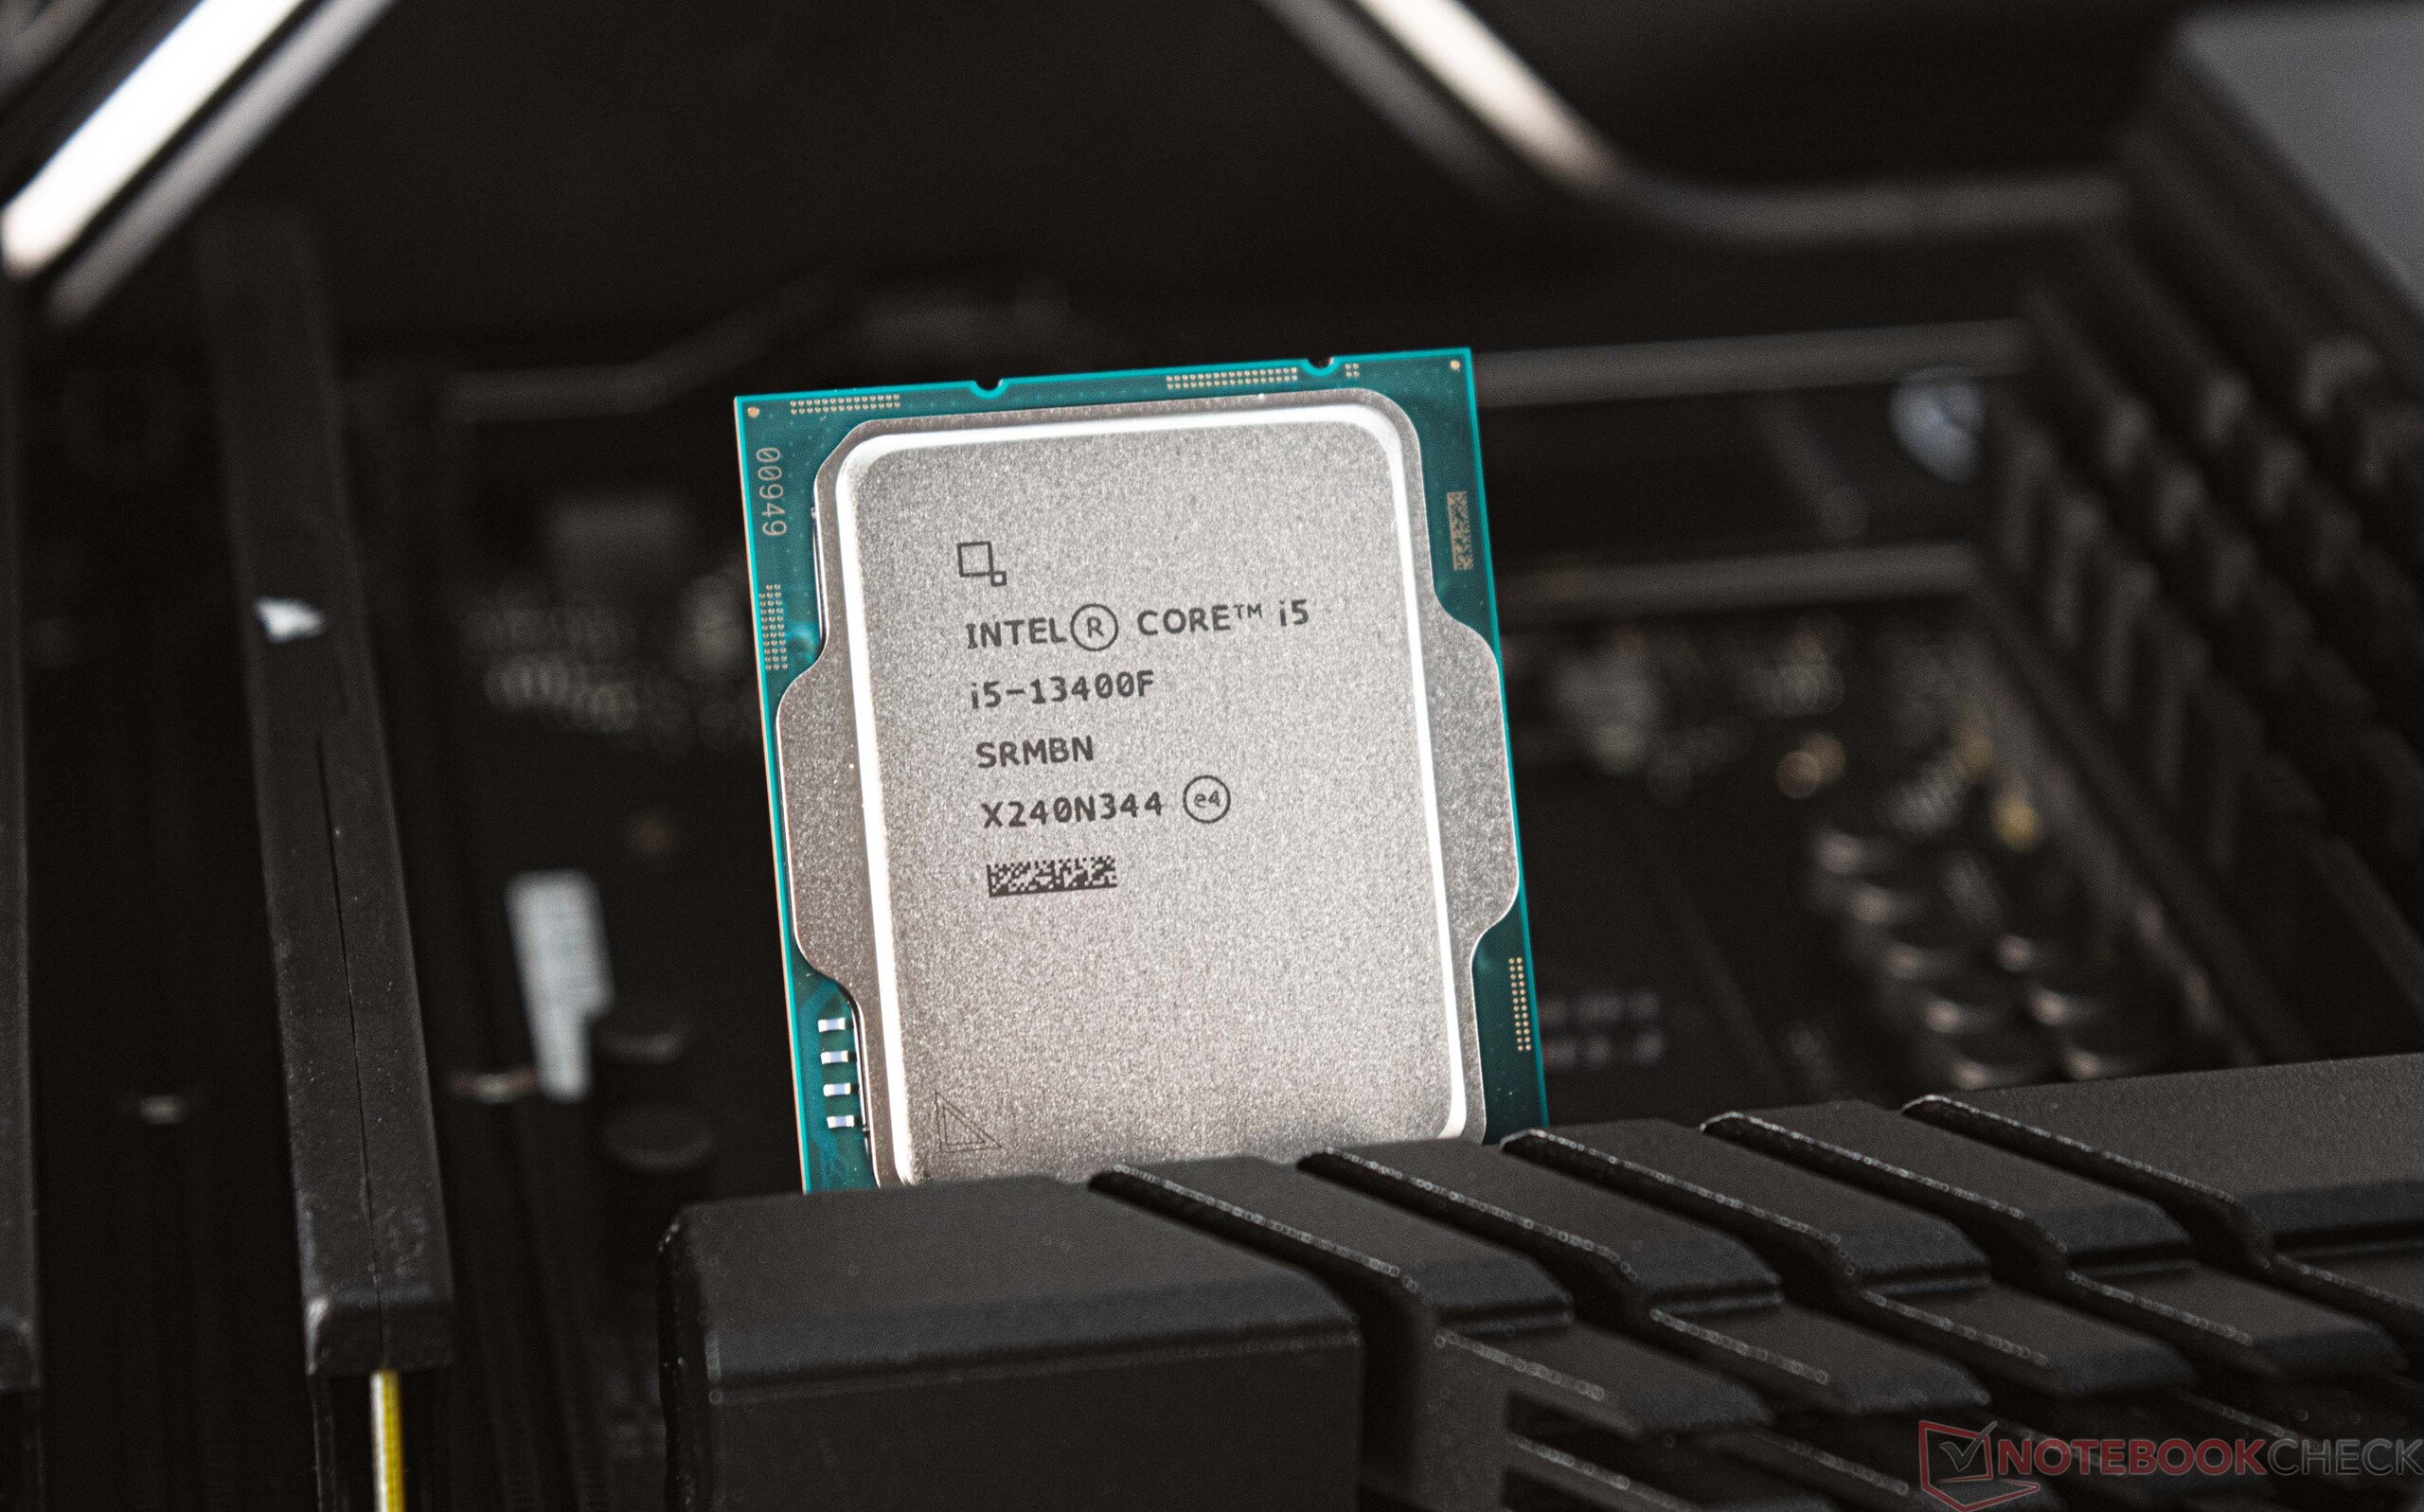
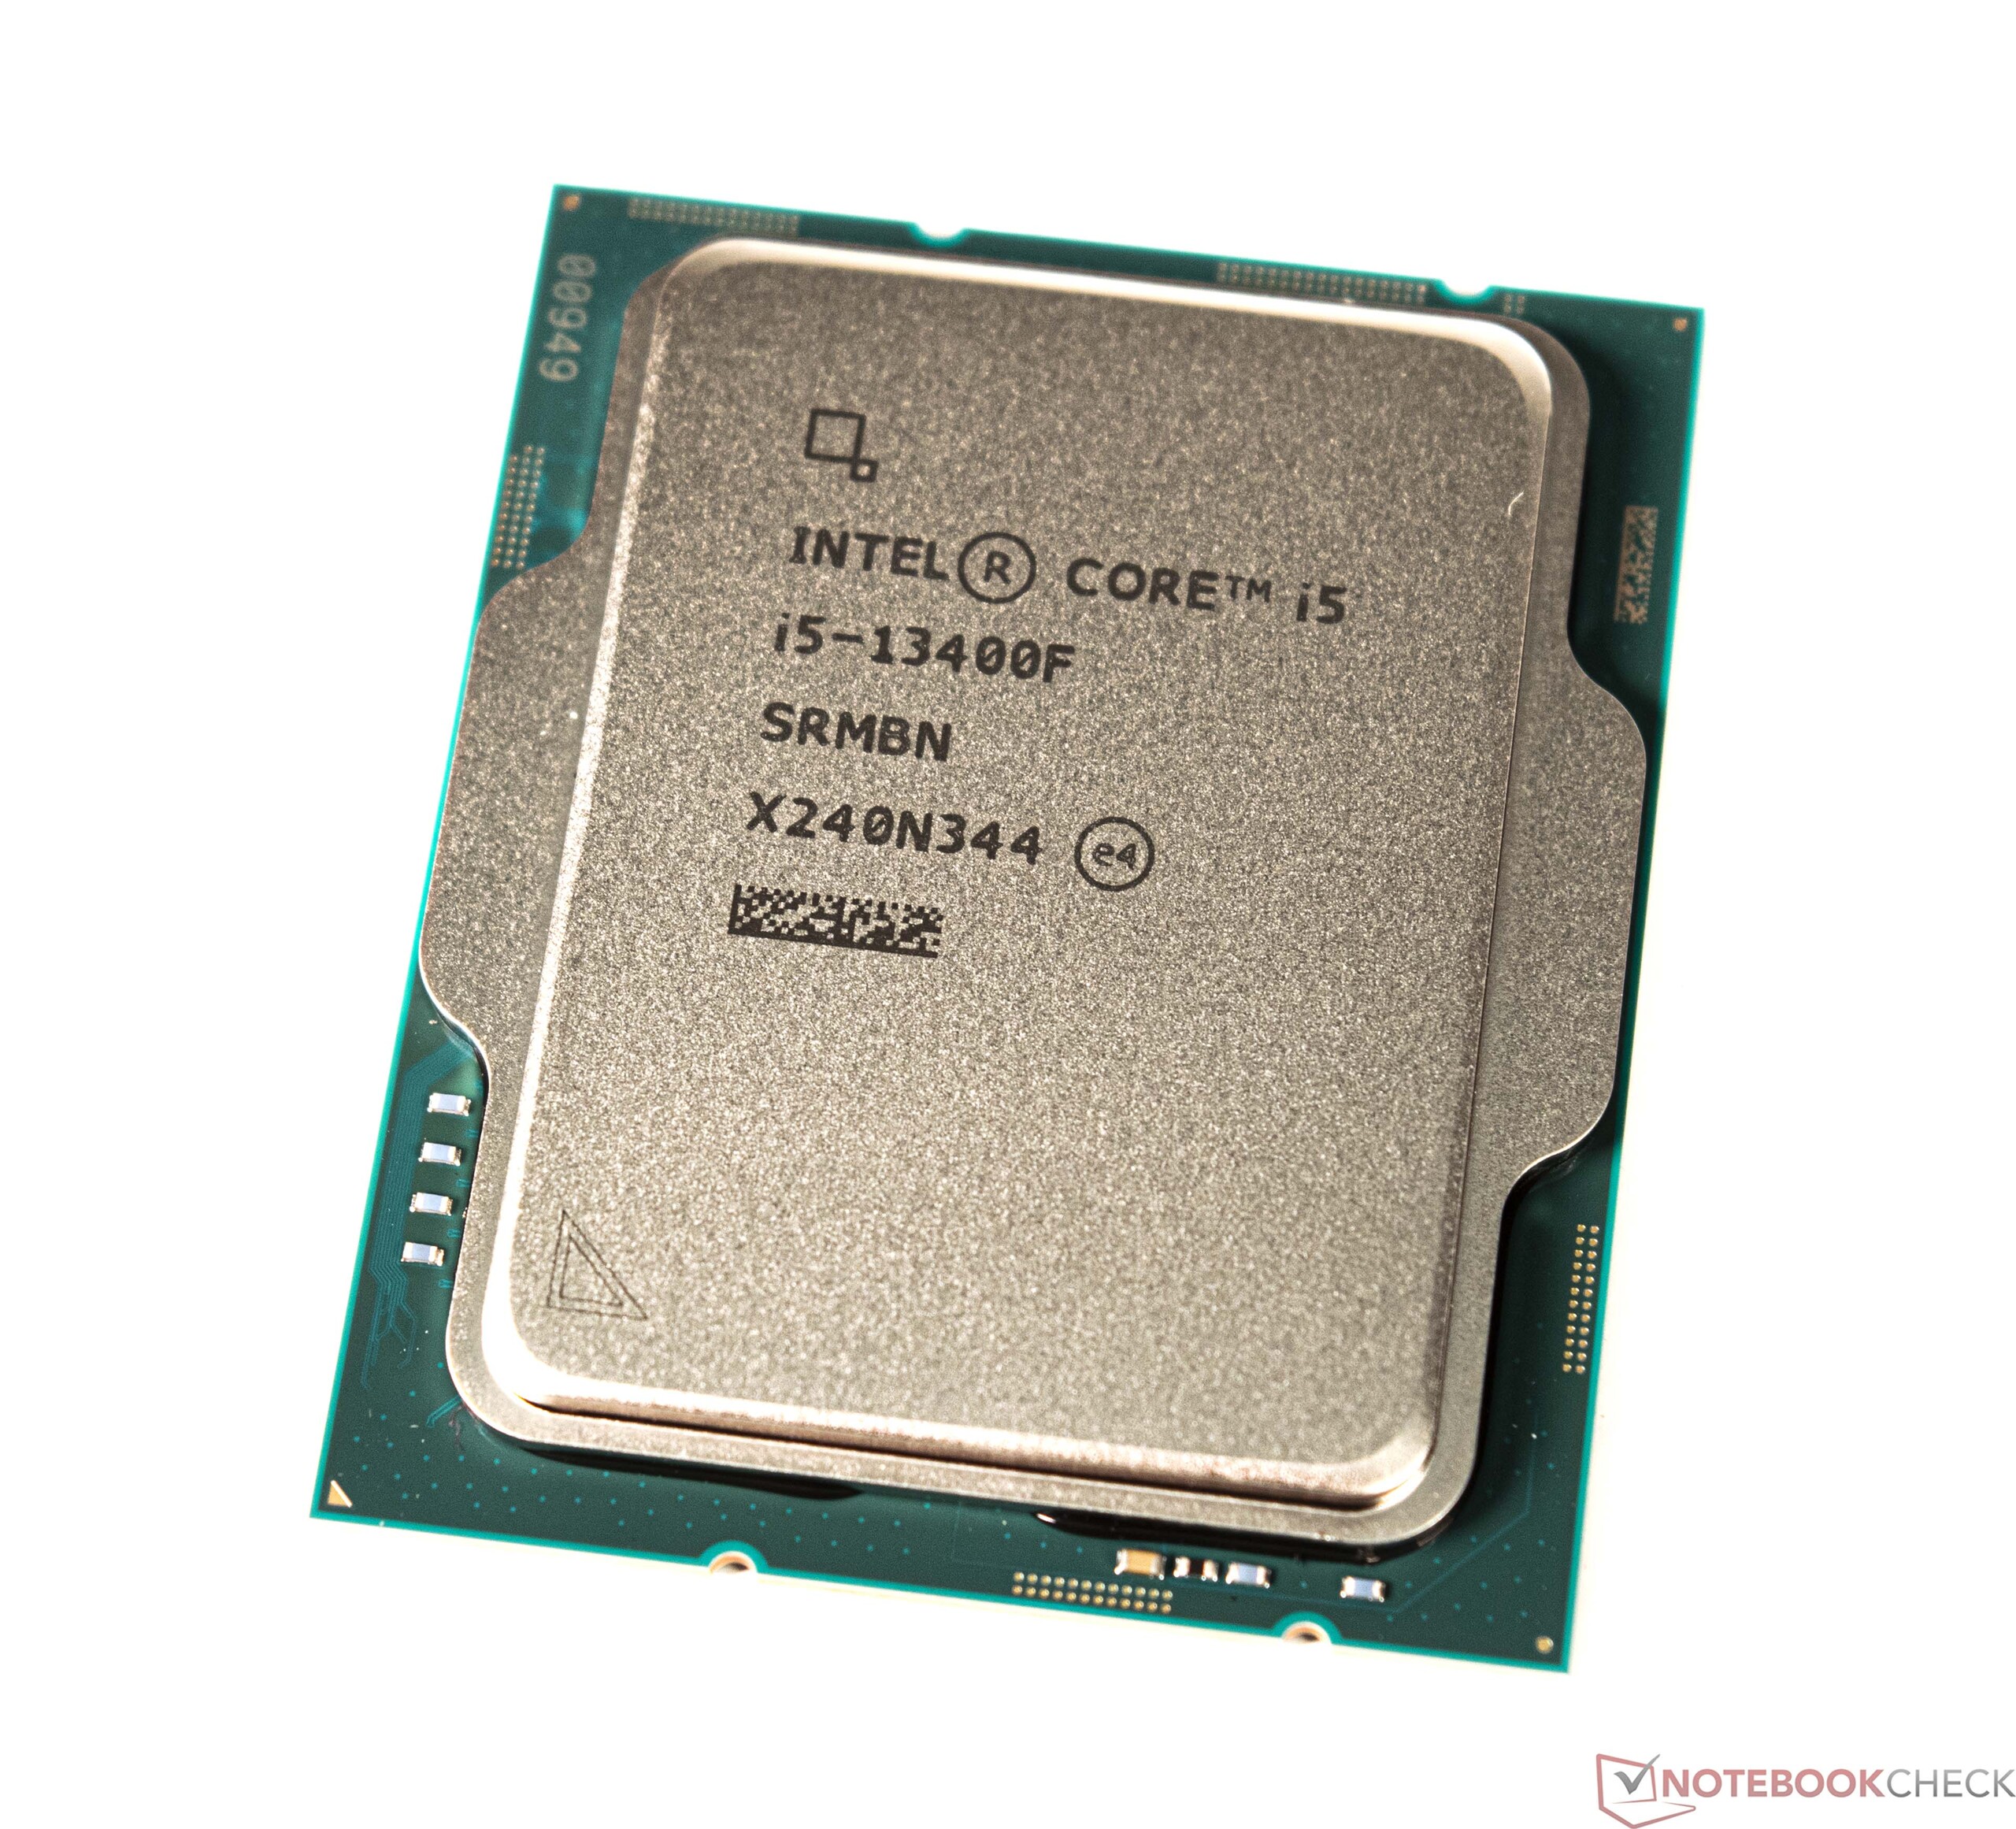
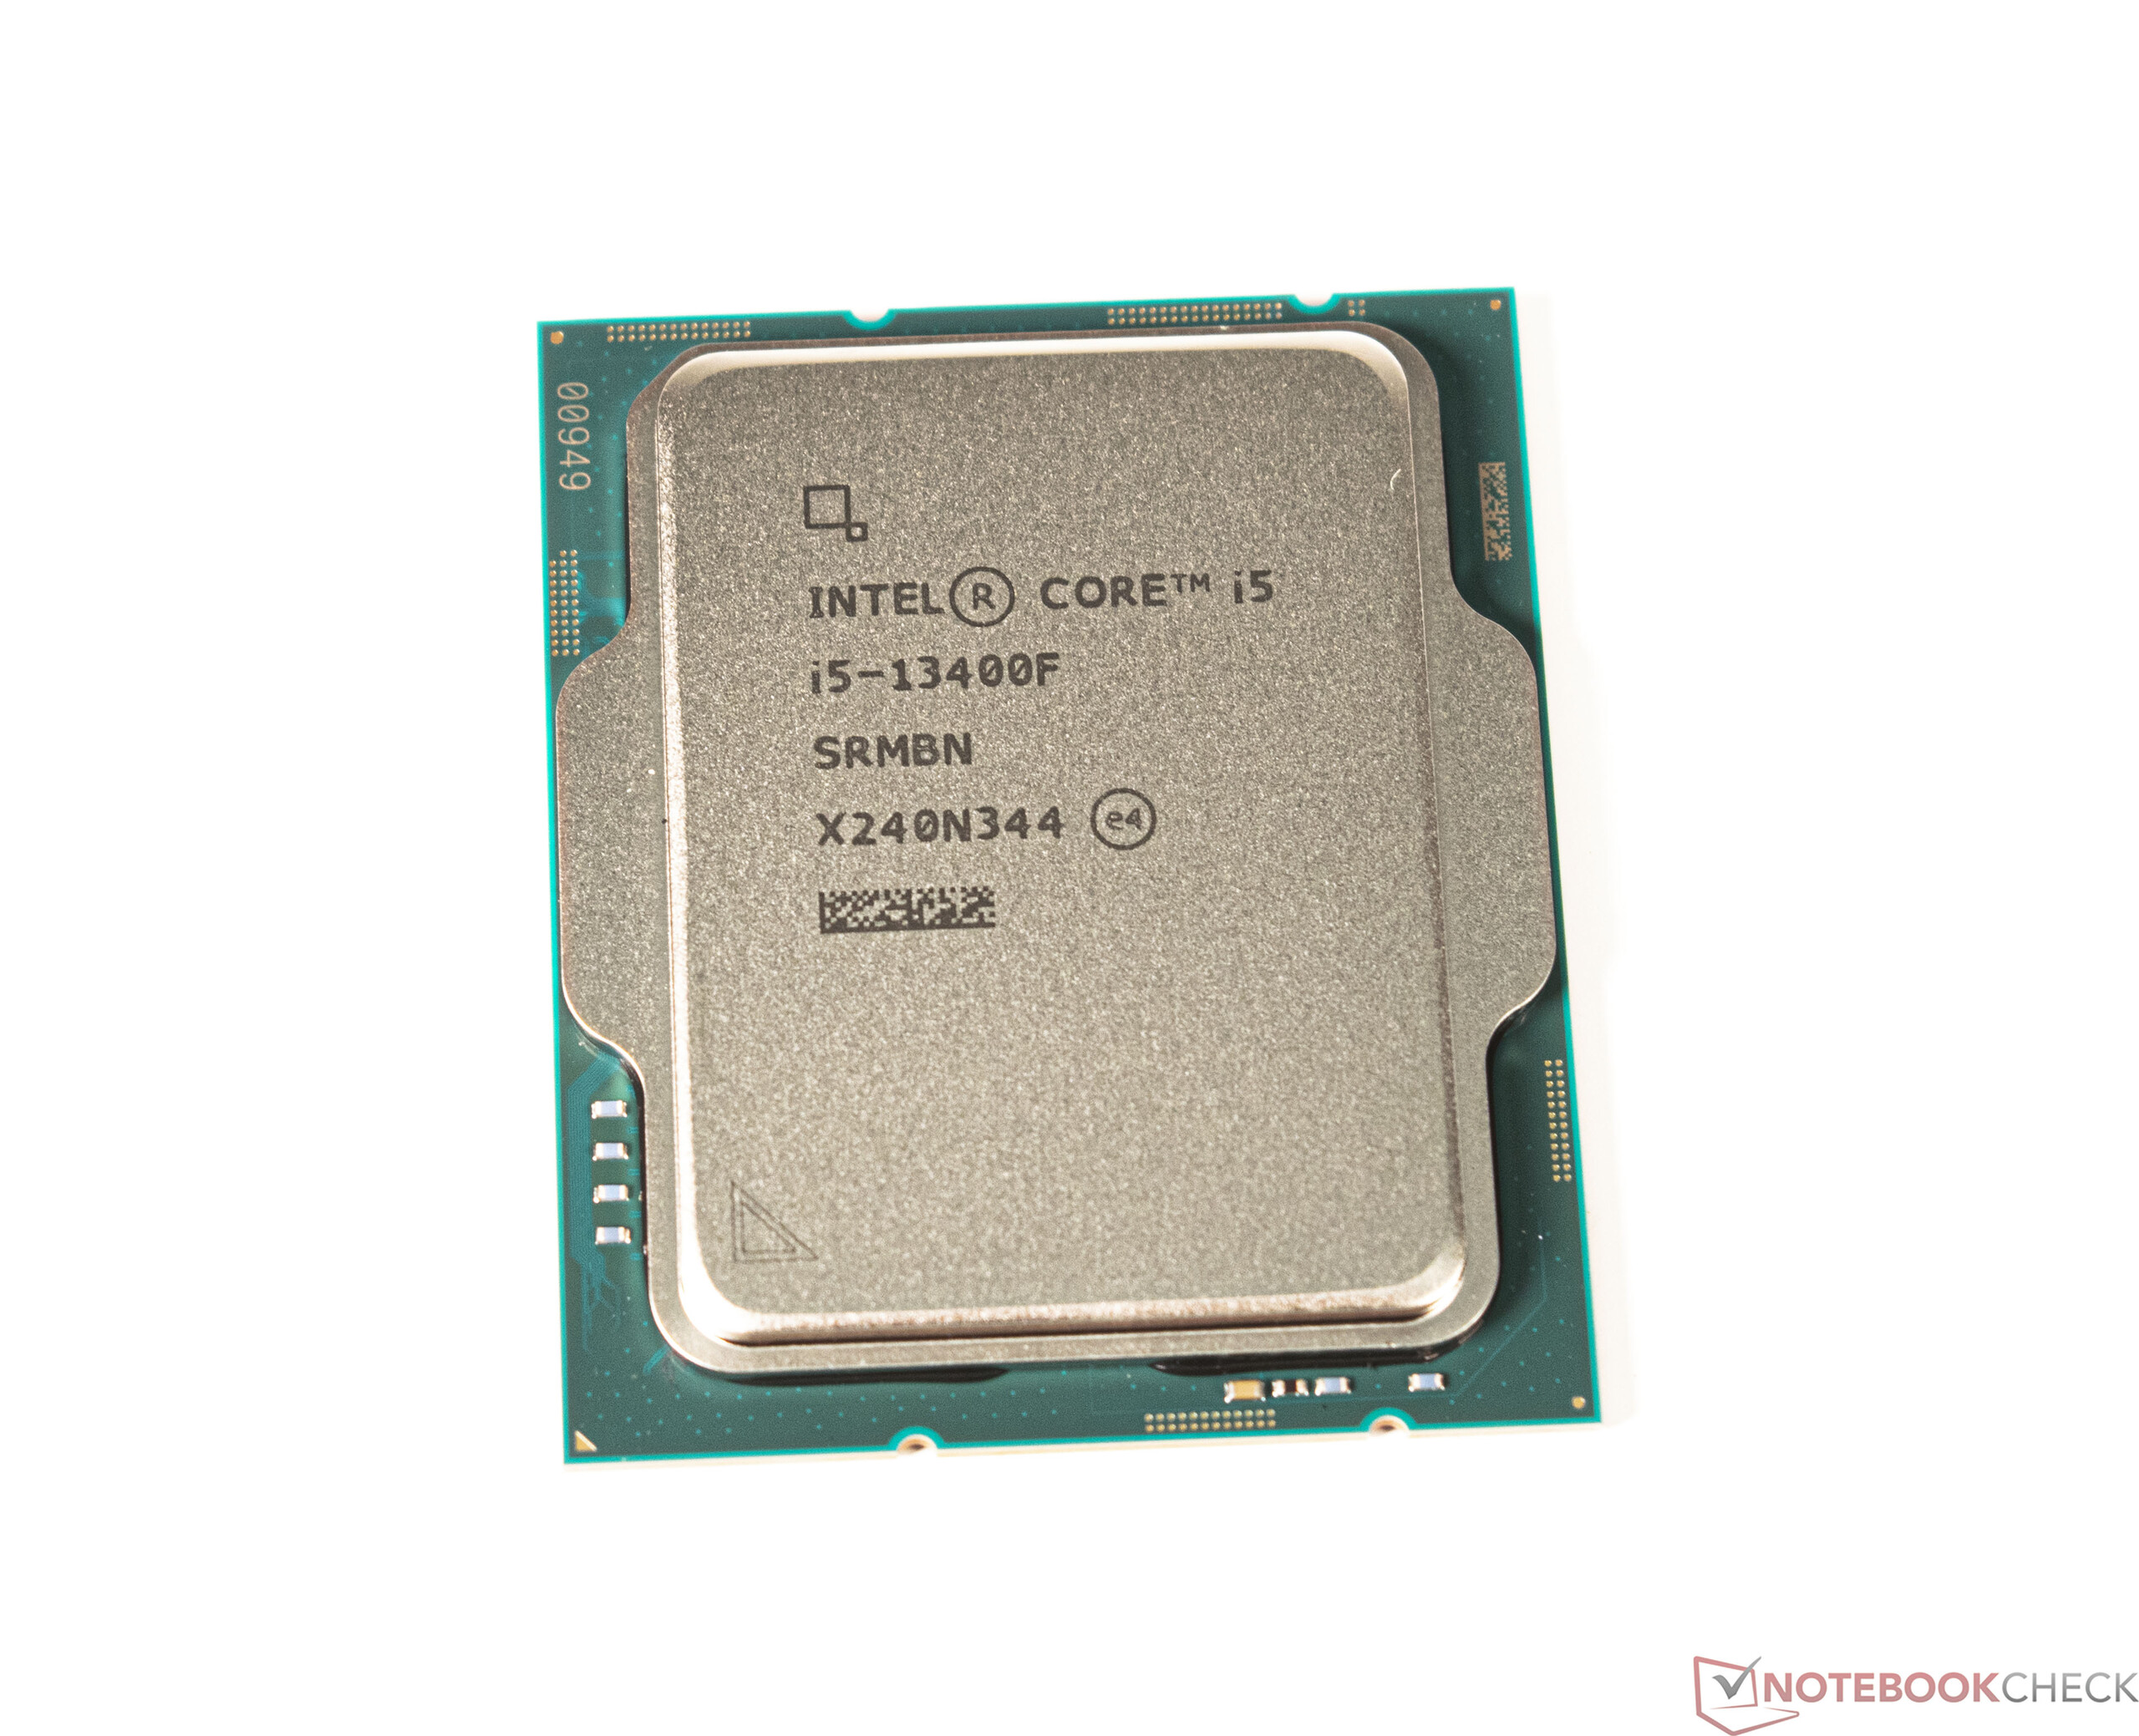
Test de l'Intel Core i5-13400F : processeur 10 cœurs économique et bon marché pour jouer et travailler

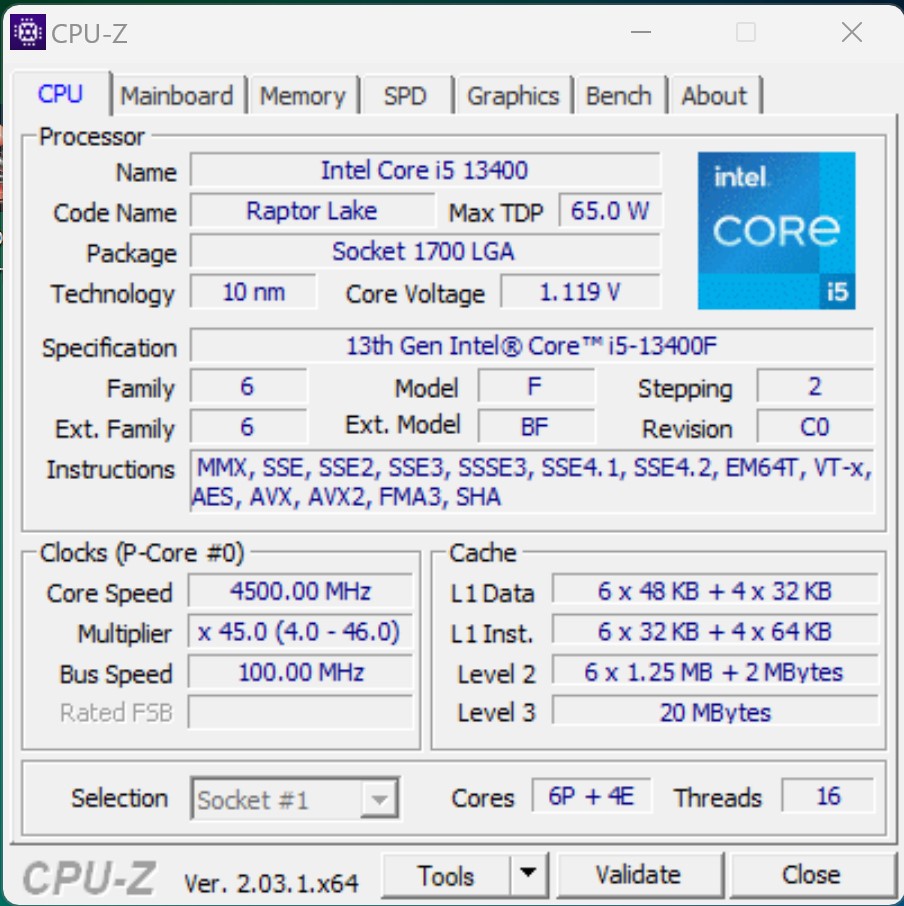
Intel a lancé l'architecture de CPU hybride avec la série Alder Lake, qui combine les cœurs dits P et E sous un seul diffuseur de chaleur. Les cœurs E ont été omis des CPU d'entrée de gamme jusqu'à présent, ce qui affectait principalement les performances multithread. Avec la 13e génération de Core, Intel a finalement doté le Core i5-13400F de 4 cœurs E supplémentaires en plus des 6 cœurs P. Ainsi, il est désormais au même niveau que les processeurs d'entrée de gamme. Ainsi, il est maintenant à égalité avec un Intel Core i5-12600K de la série Alder Lake. Néanmoins, ces deux modèles diffèrent fortement au niveau de leur consommation électrique. Cependant, seuls quelques points de pourcentage séparent les deux modèles en termes de performances, ce que nous pouvons révéler à ce stade.
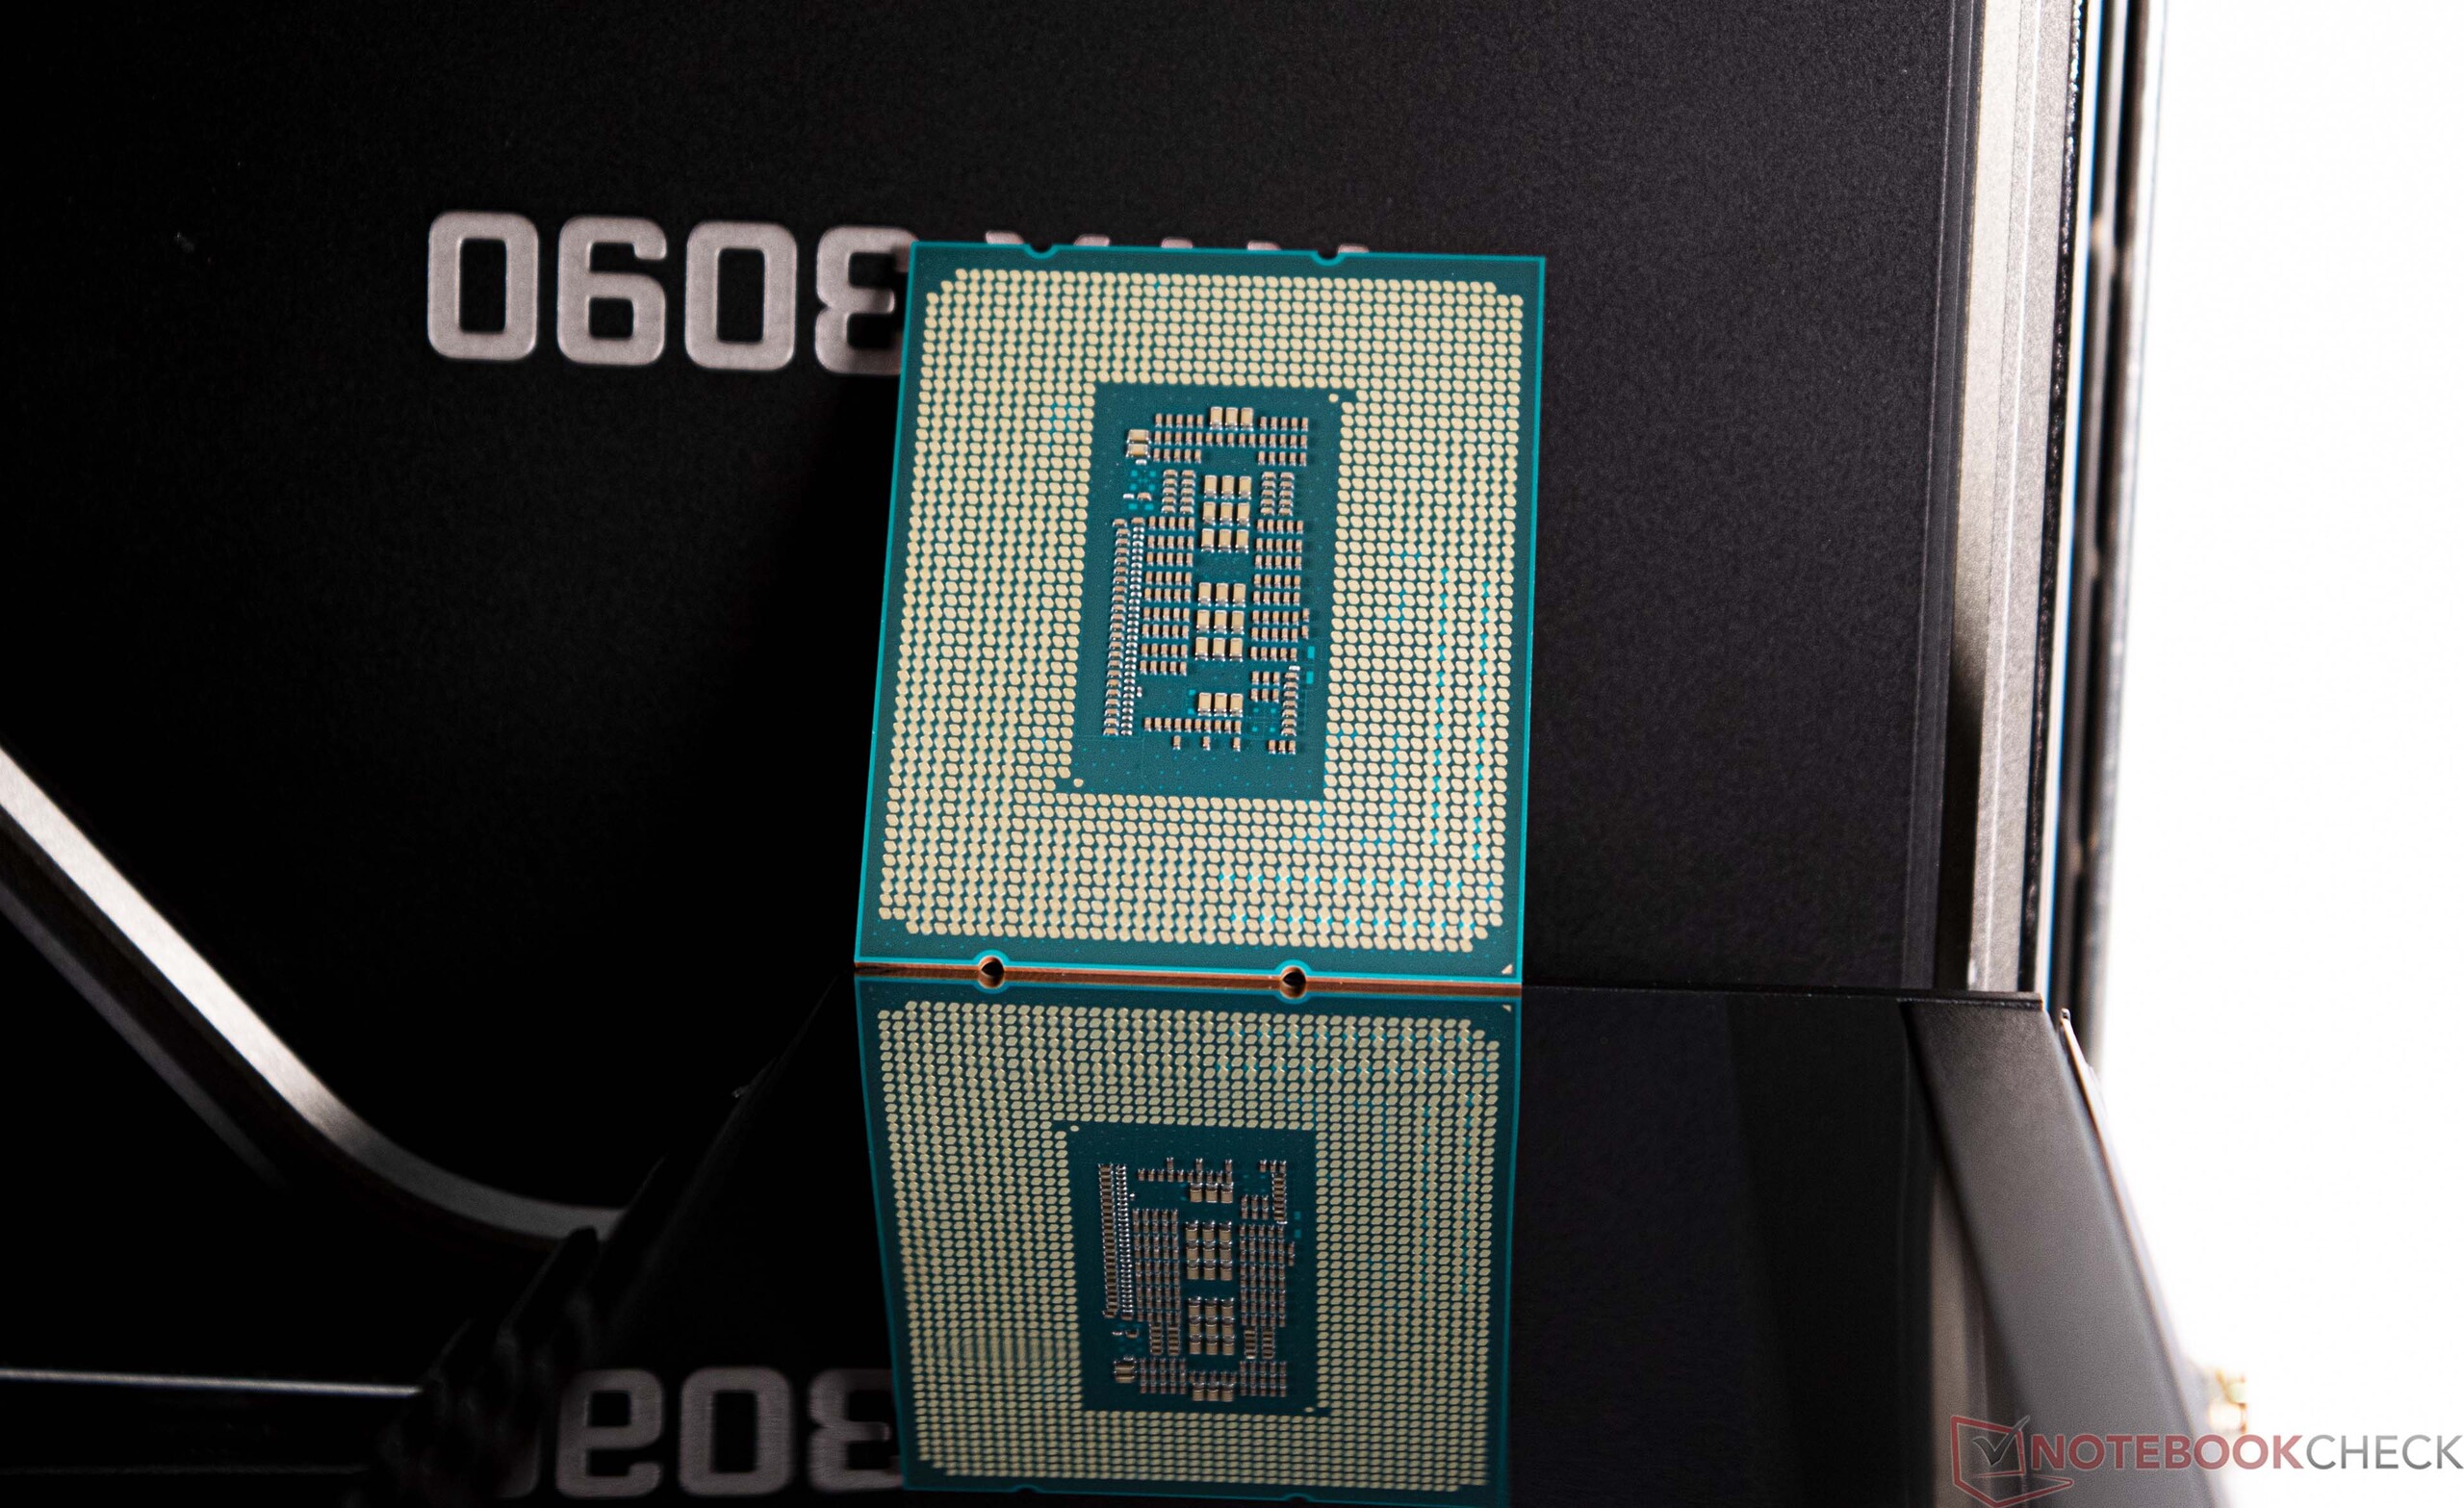
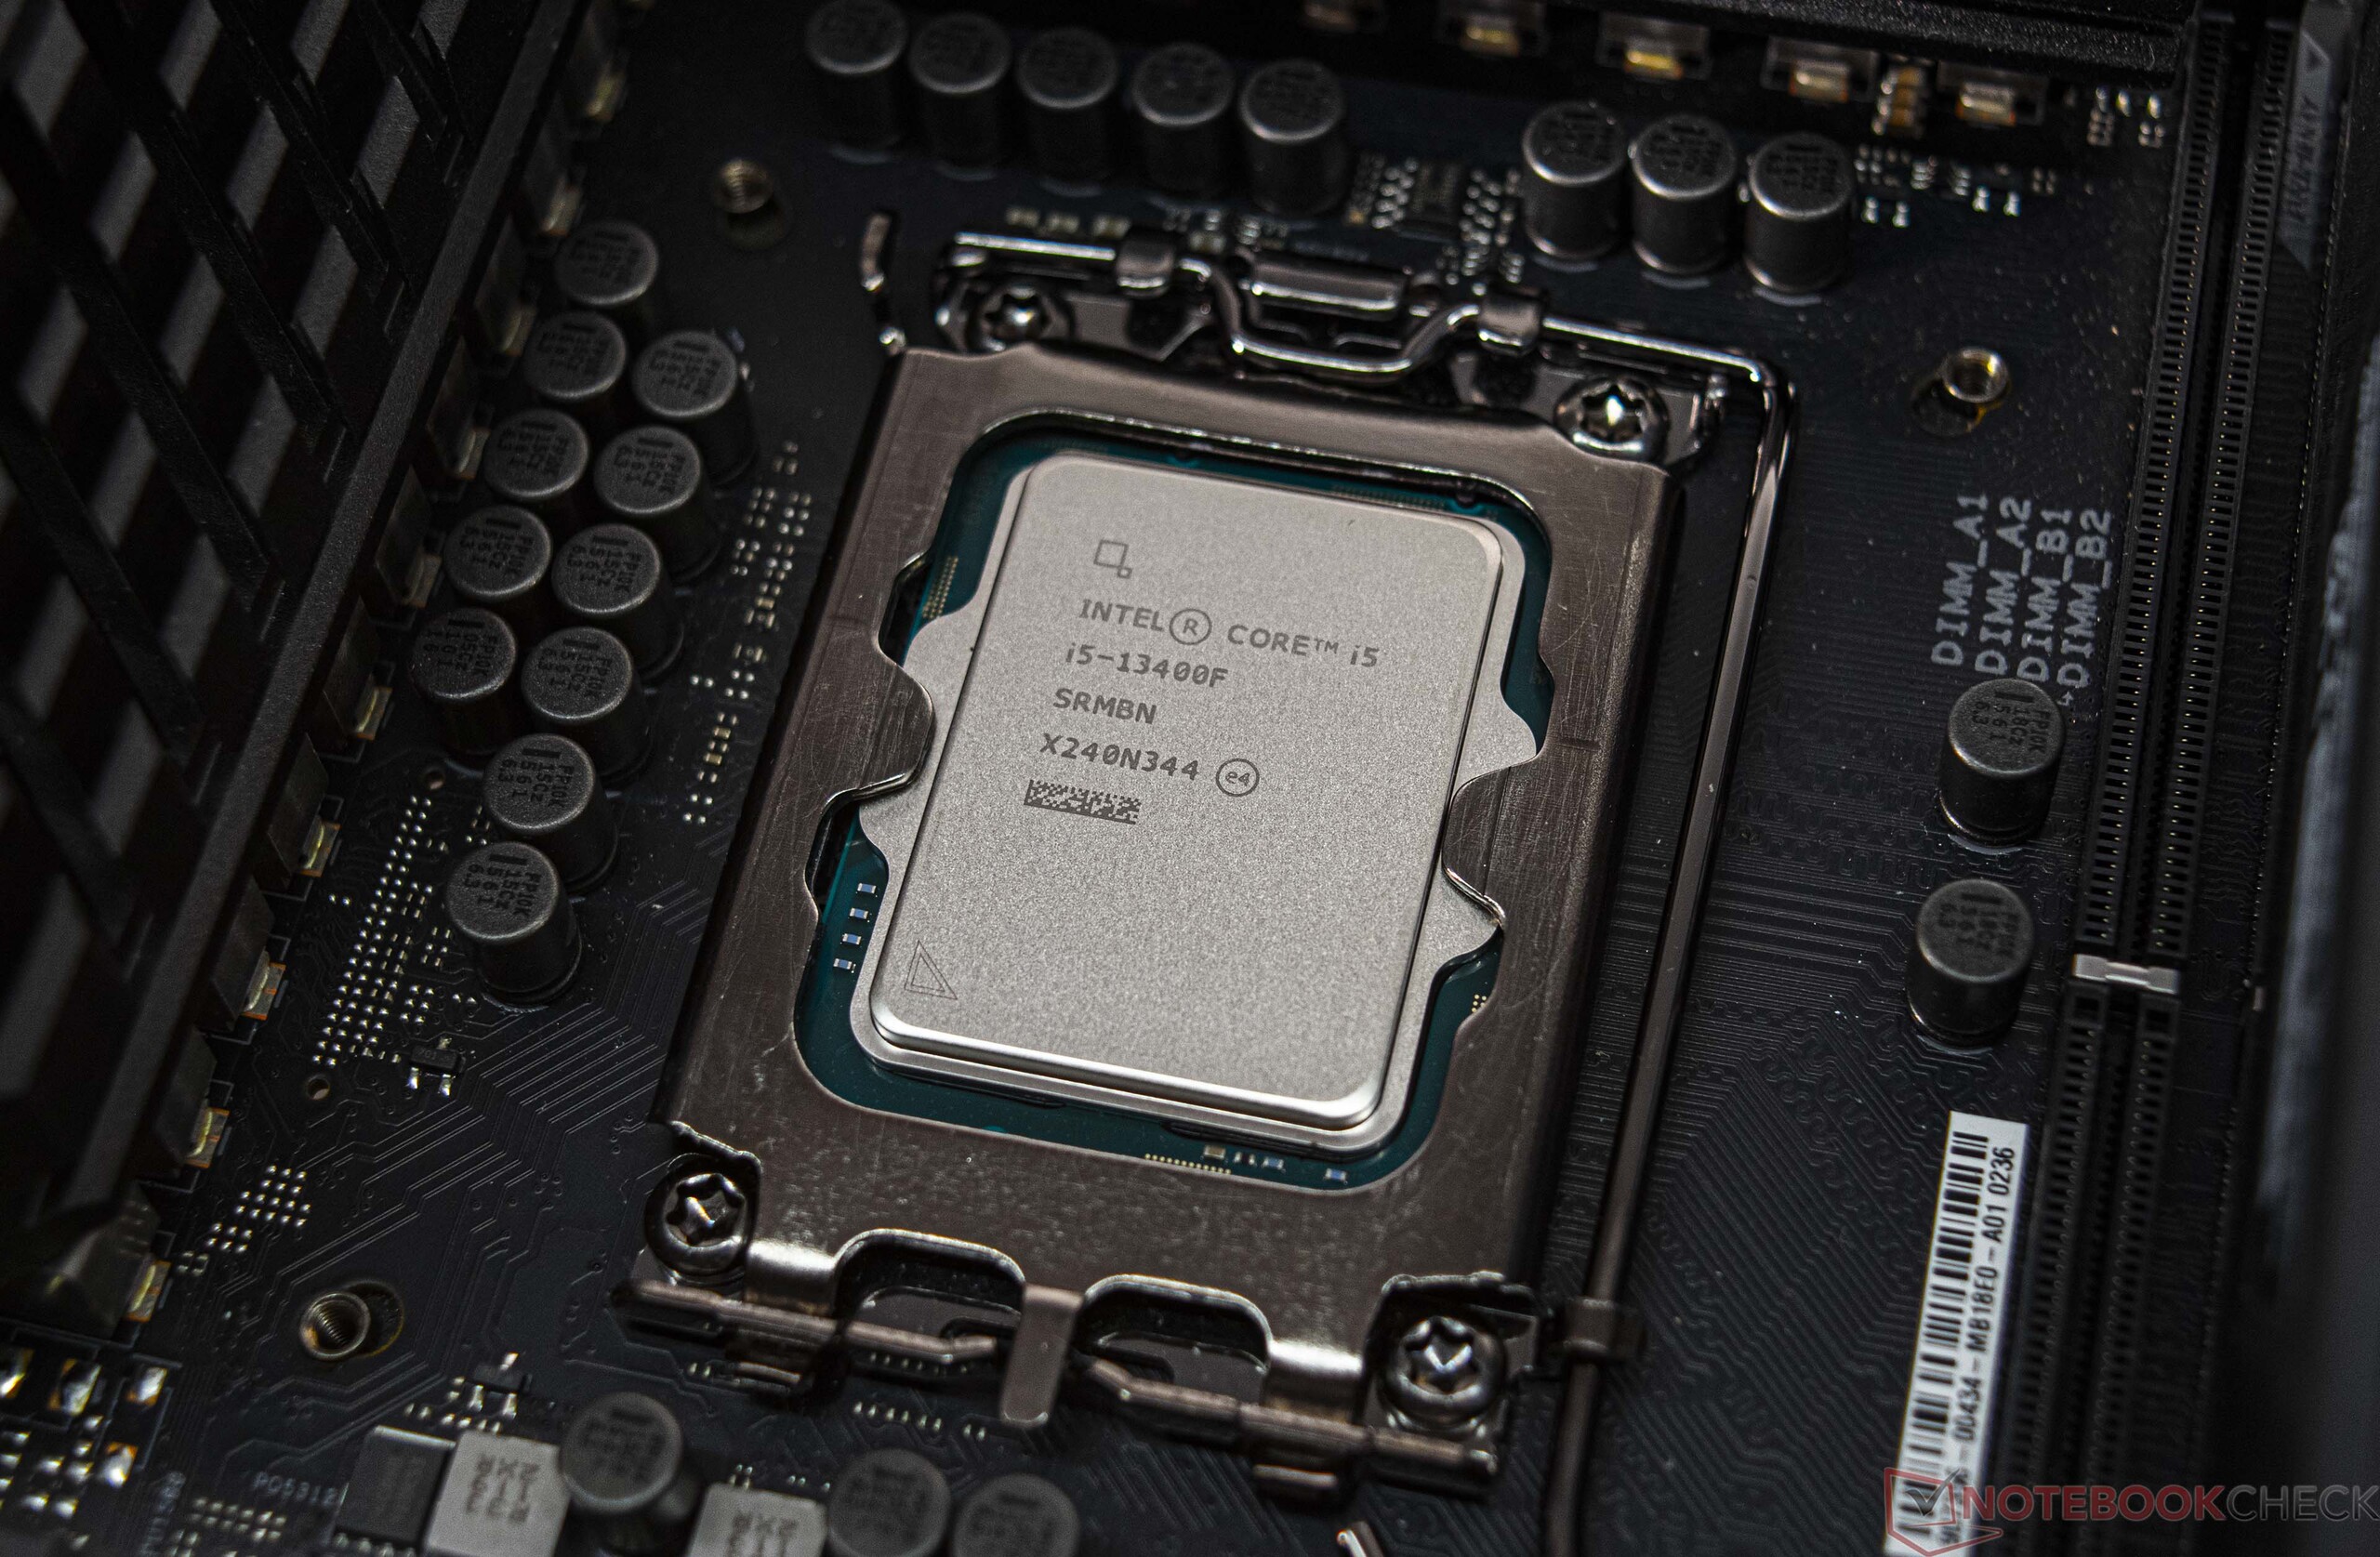
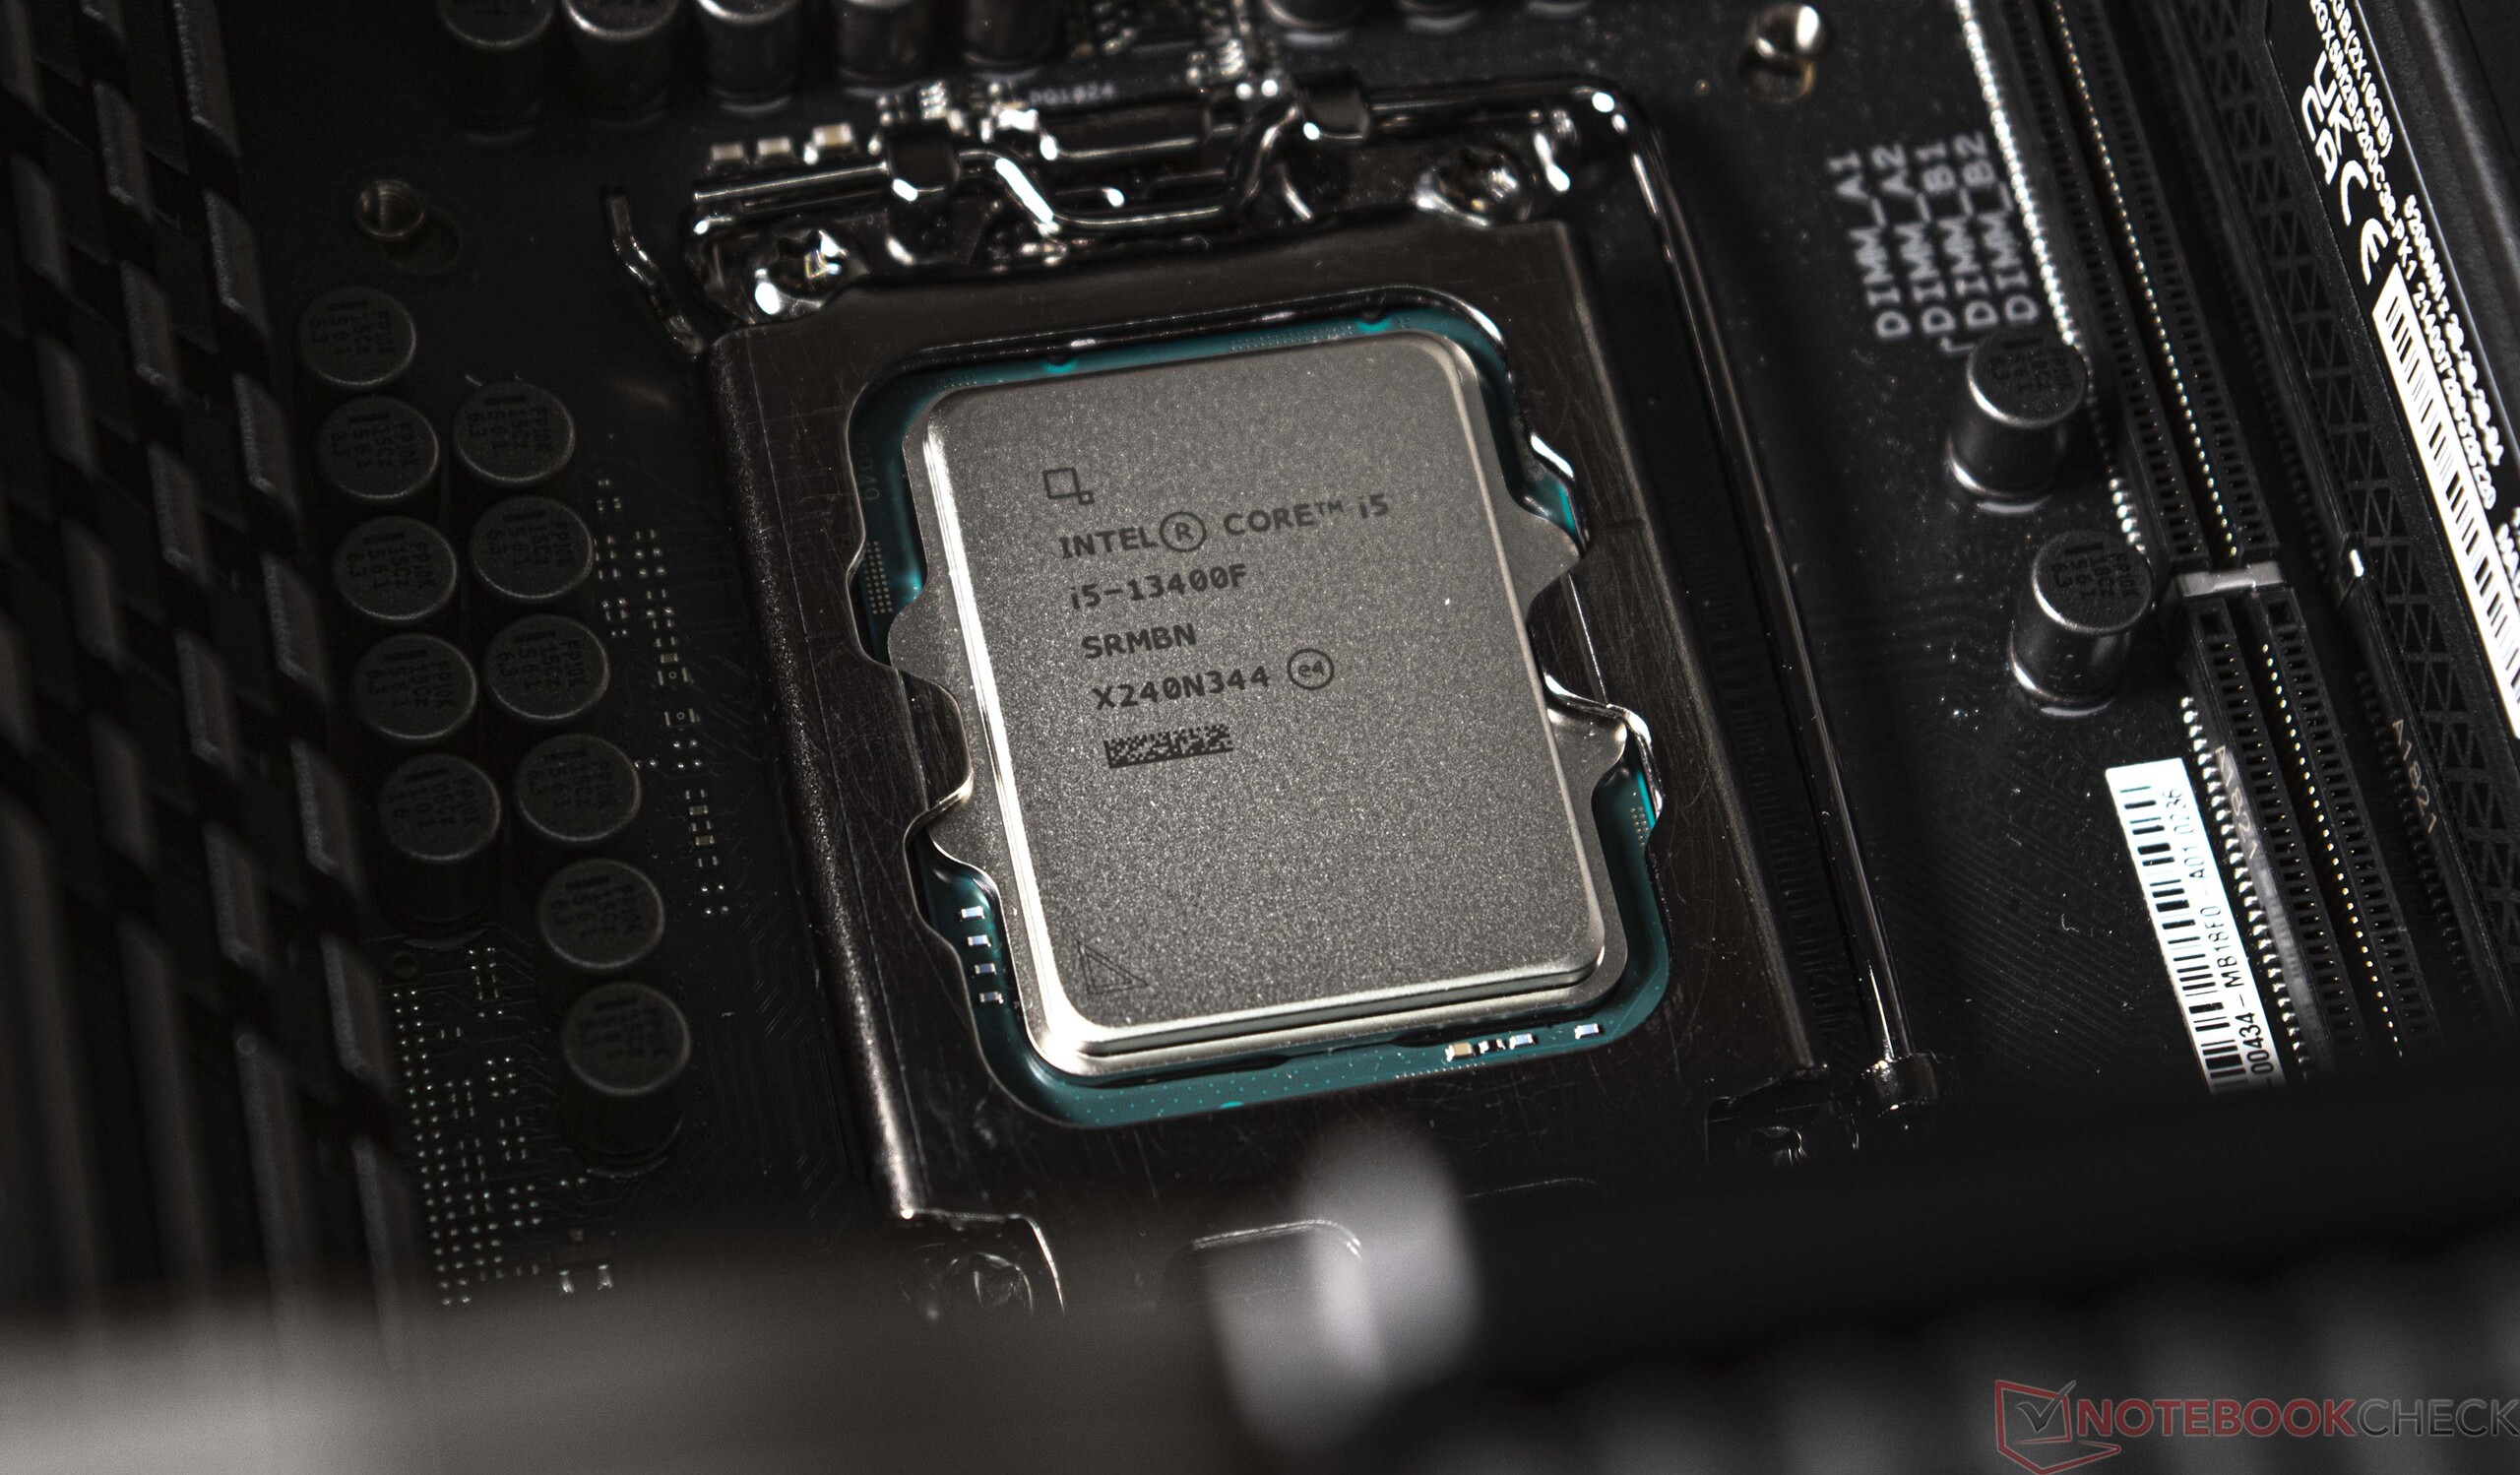
Intel Alder-Lake et Intel Raptor-Lake partagent tous deux le socket 1700 en tant que sous-structure. Ainsi, tous les nouveaux processeurs peuvent également être exécutés sur les anciens jeux de puces 600. Néanmoins, une mise à jour du BIOS devrait être effectuée au préalable afin que les derniers processeurs soient reconnus et correctement pris en charge. En parlant de Alder-Lake et Raptor-Lake : L'Intel Core i5-13400F peut être disponible en option en stepping B0 ou C0. Le pas B0 fait référence à un DIE Raptor-Lake, tandis qu'un DIE Alder-Lake se trouve sous le dissipateur thermique dans le pas C0.
Dans le tableau suivant, nous avons compilé pour vous les représentants les plus importants de la nouvelle famille Raptor Lake S. Plus de détails sur les Intel Core i5-13400F peuvent être trouvés ici.
Comparaison des processeurs Core d'Intel
| Modèle | Cœurs / Threads |
Horloge P-Core / Turbo | Horloge E-Core / Turbo | Cache L2 + L3 | Graphique | PBP | MTB | Prix (MSRP) |
| Core i9-13900K | 24 (8P + 16E) /32 | 3,0 GHz / 5,8 GHz | 2,2 GHz / 4,3 GHz | 32 + 36 Mo | UHD 770 | 125 Watt | 253 Watt | $ 589 |
| Core i9-13900KF | 16 (8P + 16E) /32 | 3.0 GHz / 5.8 GHz | 2.2 GHz / 4.3 GHz | 32 + 36 MB | - | 125 Watt | 253 Watt | $ 564 |
| Core i9-12900K | 16 (8P + 8E) /24 | 3,2 GHz / 5,1 GHz | 2,4 GHz / 3,9 GHz | 14 + 30 Mo | UHD 770 | 125 Watt | 241 Watt | $ 589 |
| Core i9-12900KF | 16 (8P + 8E) /24 | 3,2 GHz / 5,1 GHz | 2,4 GHz / 3,9 GHz | 14 + 30 Mo | - | 125 Watt | 241 Watt | $ 564 |
| Core i7-13700K | 16 (8P + 8E) /24 | 3,4 GHz / 5,4 GHz | 2,5 GHz / 4,2 GHz | 24 + 30 Mo | UHD 770 | 125 Watt | 253 Watt | $ 409 |
| Core i7-13700KF | 16 (8P + 8E) /24 | 3,4 GHz / 5,4 GHz | 2,5 GHz / 4,2 GHz | 24 + 30 Mo | - | 125 Watt | 253 Watt | $ 384 |
| Core i7-12700K | 12 (8P + 4E) /20 | 3,6 GHz / 4,9 GHz | 2,7 GHz / 3,8 GHz | 12 + 25 MB | UHD 770 | 125 Watt | 190 Watt | $ 409 |
| Core i7-12700KF | 12 (8P + 4E) /20 | 3,6 GHz / 4,9 GHz | 2,7 GHz / 3,8 GHz | 12 + 25 MB | - | 125 Watt | 190 Watt | $ 384 |
| Core i5-13600K | 14 (6P + 8E) /20 | 3,5 GHz / 5,1 GHz | 2,6 GHz / 3,9 GHz | 20 + 24 MB | UHD 770 | 125 Watt | 181 Watt | $ 319 |
| Core i5-13600KF | 14 (6P + 8E) /20 | 3,5 GHz / 5,1 GHz | 2,6 GHz / 3,9 GHz | 20 + 24 MB | - | 125 Wat | 181 Watt | $ 294 |
| Core i5-12600K | 10 (6P + 4E) /16 | 3,7 GHz / 4,9 GHz | 2,8 GHz / 3,6 GHz | 9,5 + 20 Mo | UHD 770 | 125 Watts | 150 Watts | $ 289 |
| Core i5-12600KF | 10 (6P + 4E) /16 | 3,7 GHz / 4,9 GHz | 2,8 GHz / 3,6 GHz | 9,5 + 20 Mo | - | 125 Watts | 150 Watts | $ 264 |
| Core i5-13400F | 10 (6P + 4E) /16 | 2,5 GHz / 4,6 GHz | 1,8 GHz / 3,3 GHz | 9,5 + 20 Mo | - | 65 Watt | 148Watt | $ 196 |
| Core i5-12400F | 6 (6P + 0E) /12 | 2,5 GHz / 4,4 GHz | - | 7,5 + 18 Mo | - | 65 Watt | 117 Watt | $ 194 |
Détails sur notre système de test
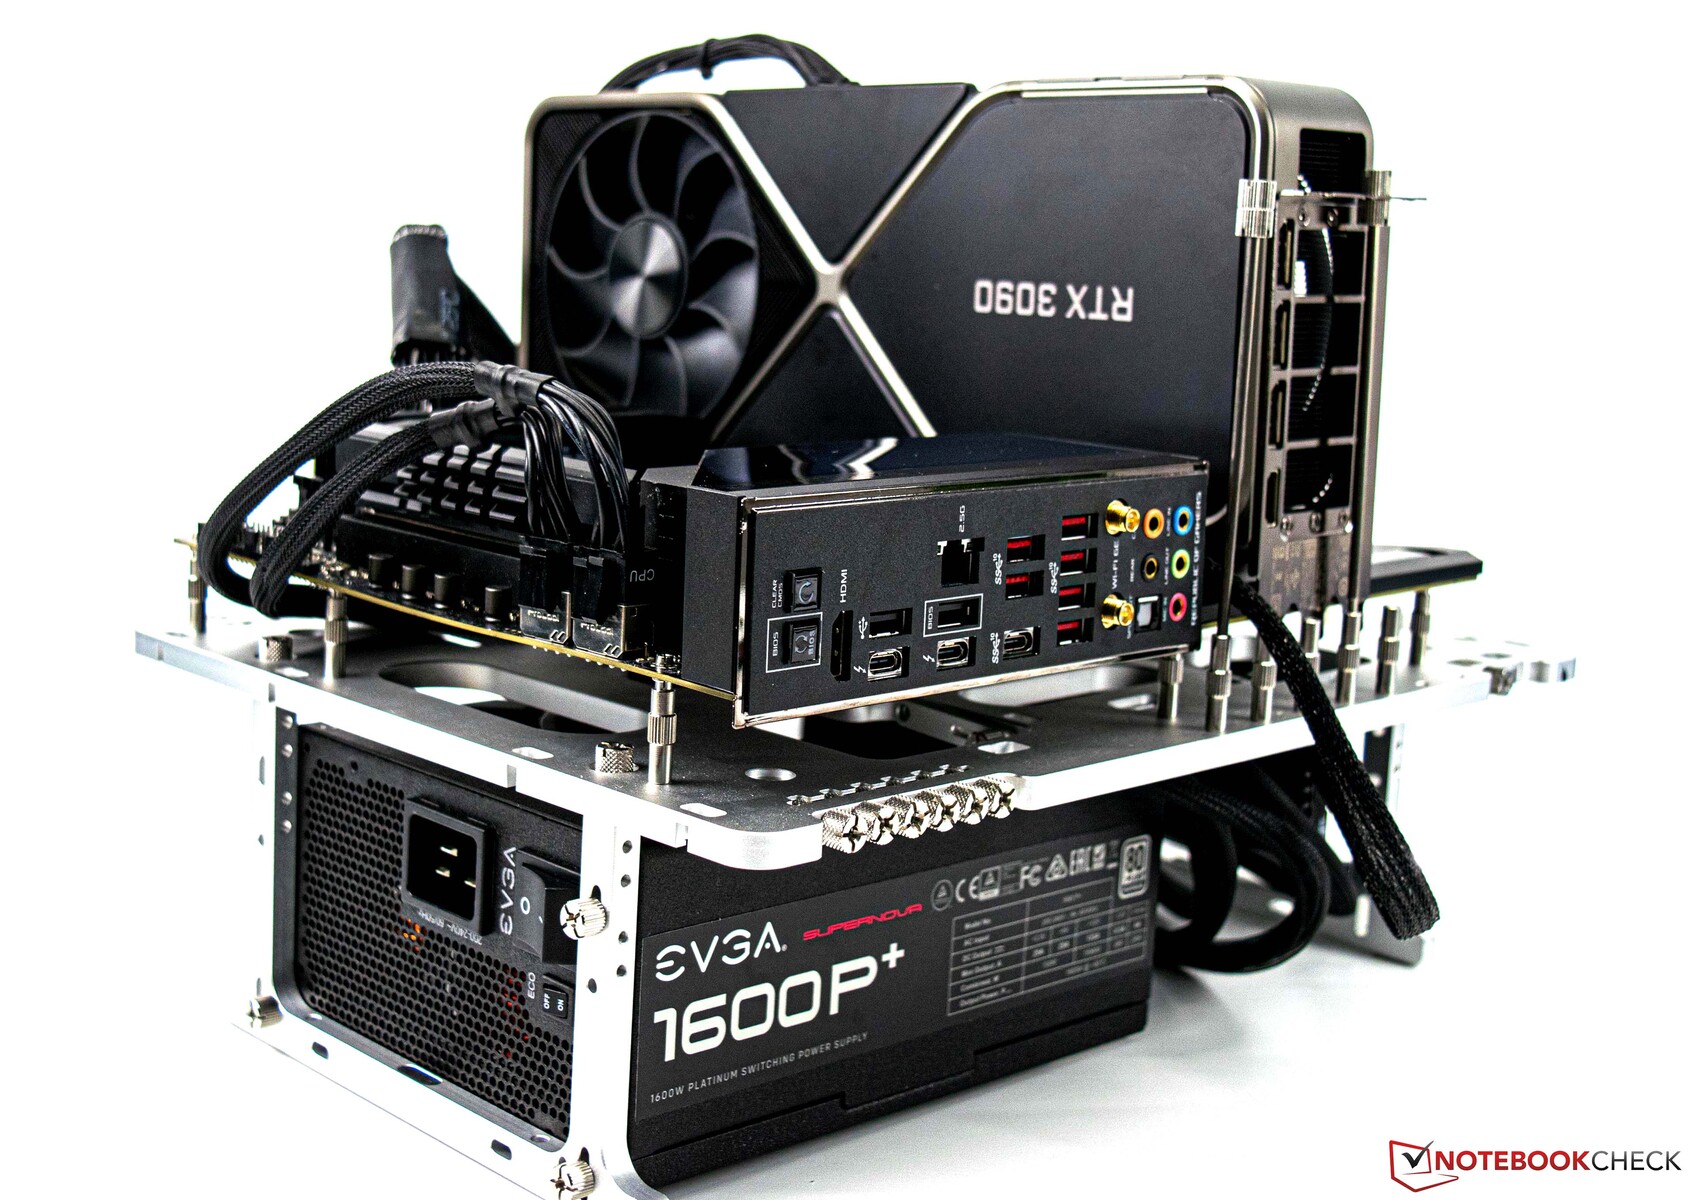
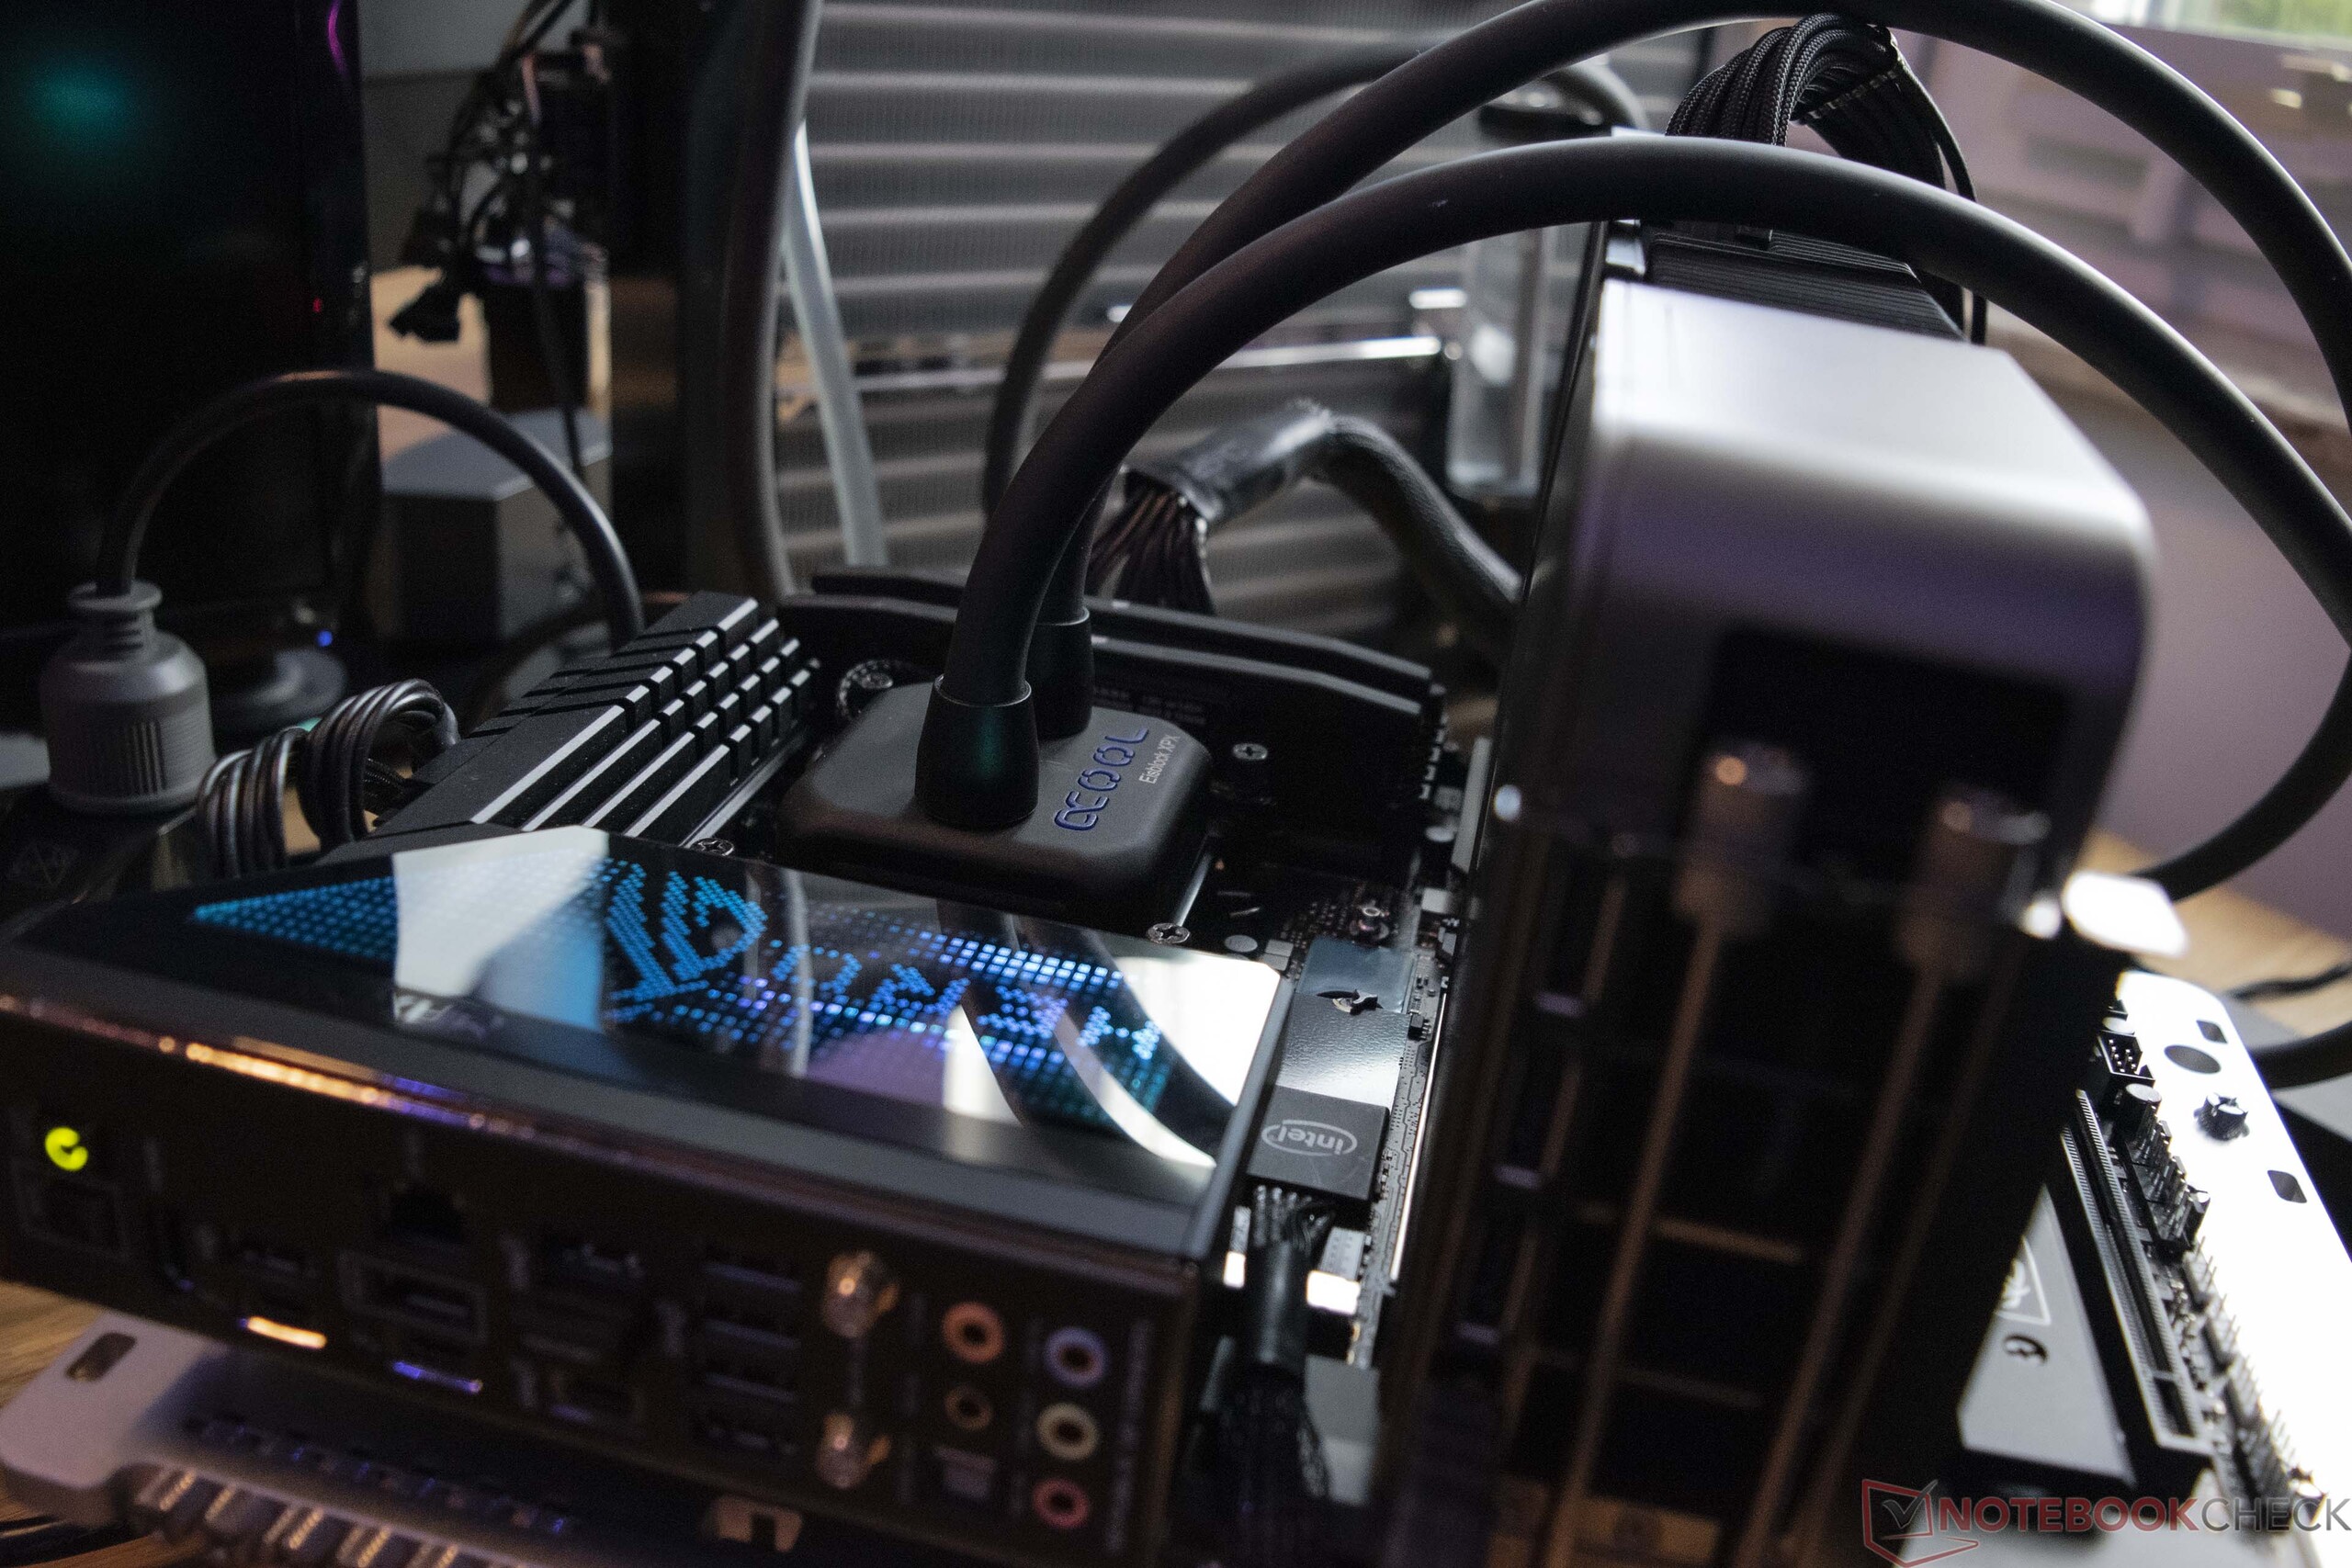
- Table de travail ouverte Streacom BC1 V2
- Intel Core i5-13400F
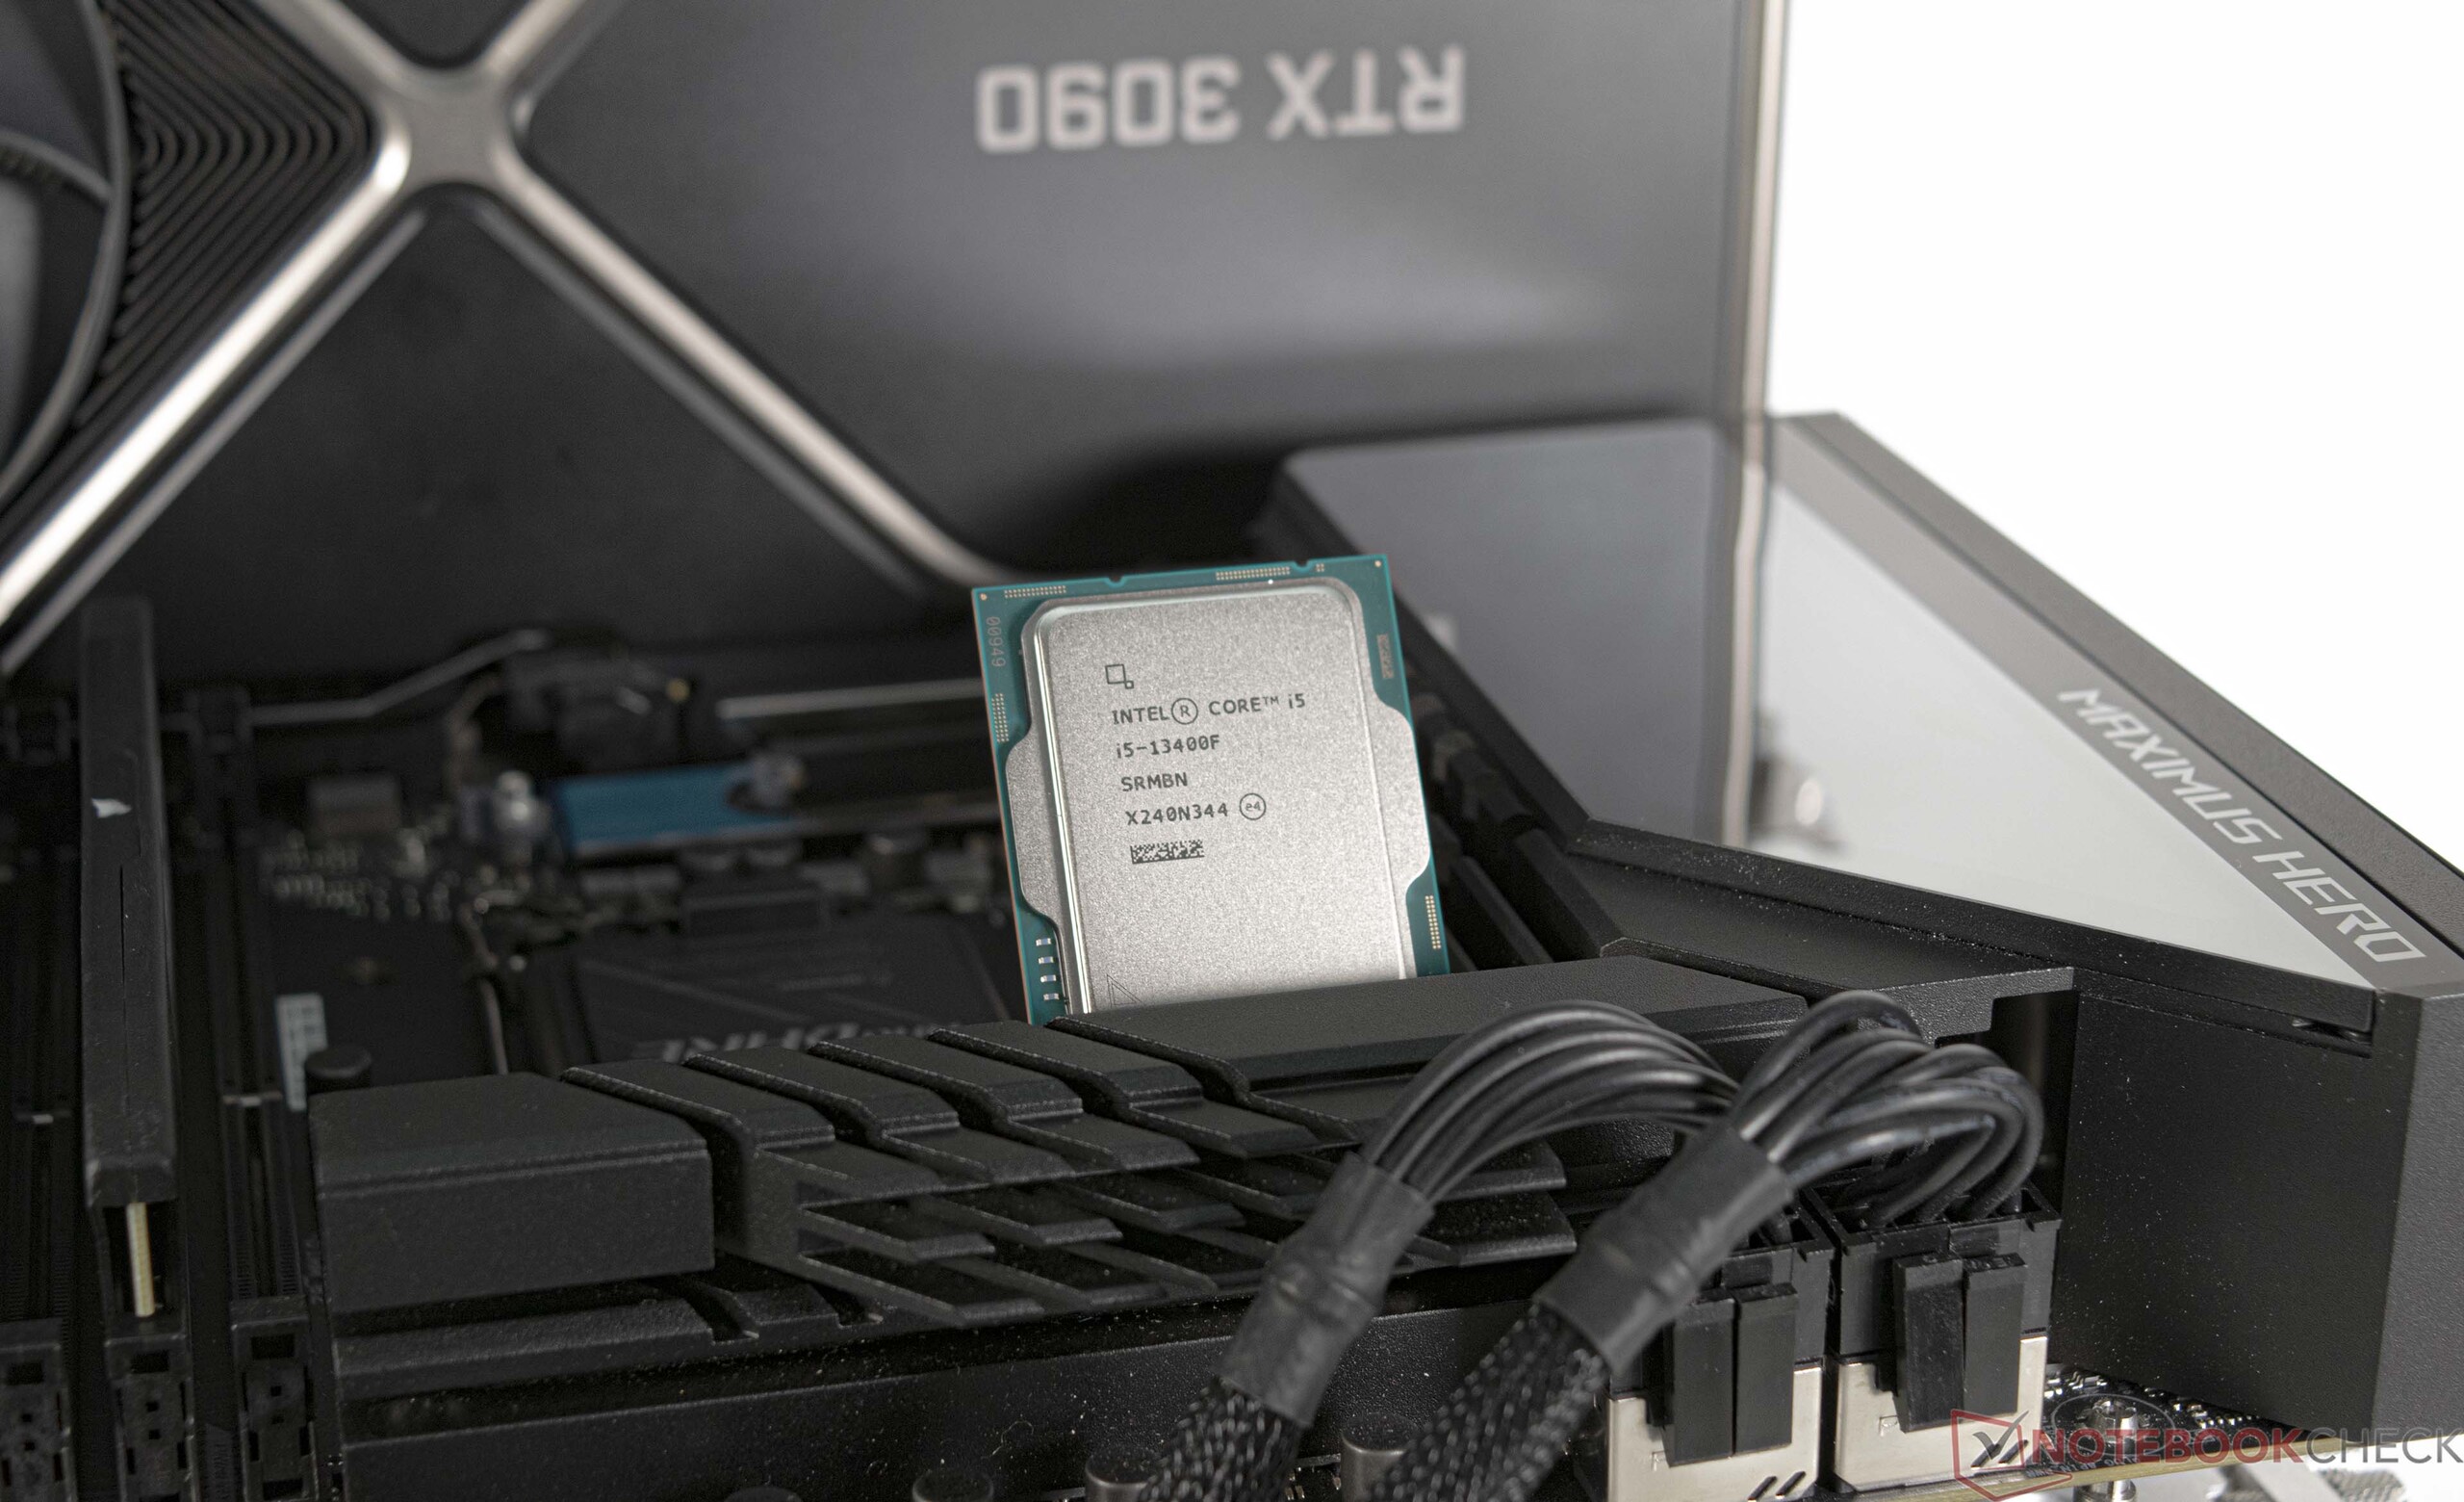
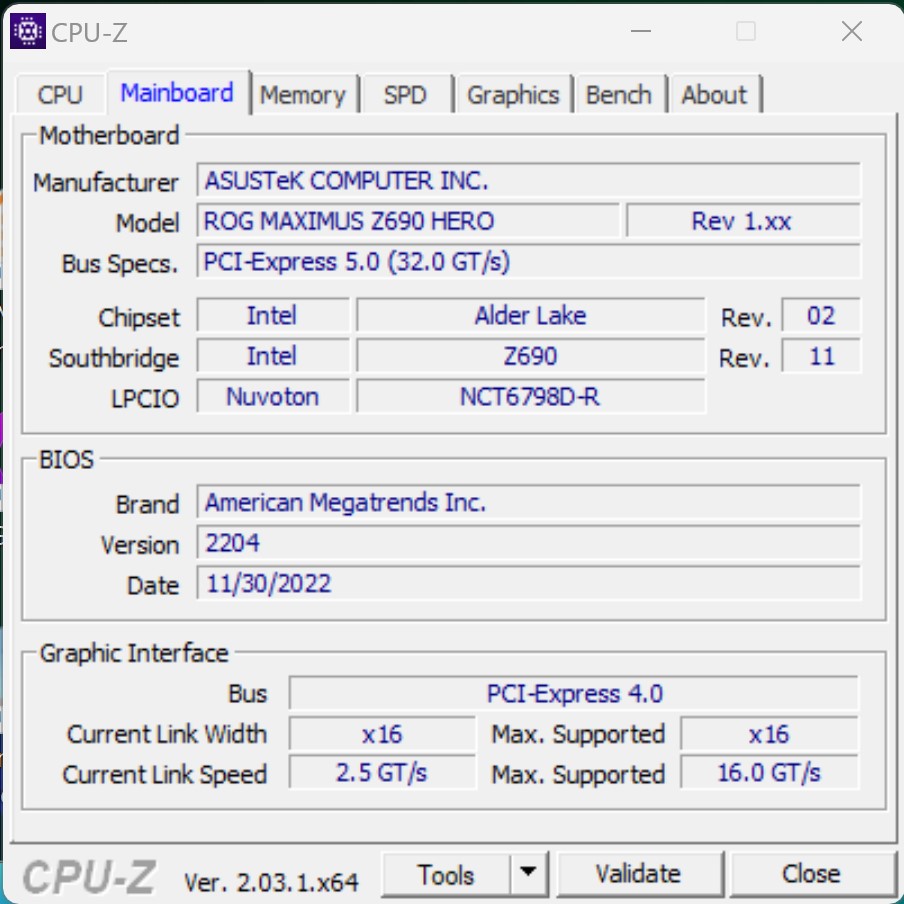
- Asus ROG Maximus Z690 Hero (BIOS v2204)
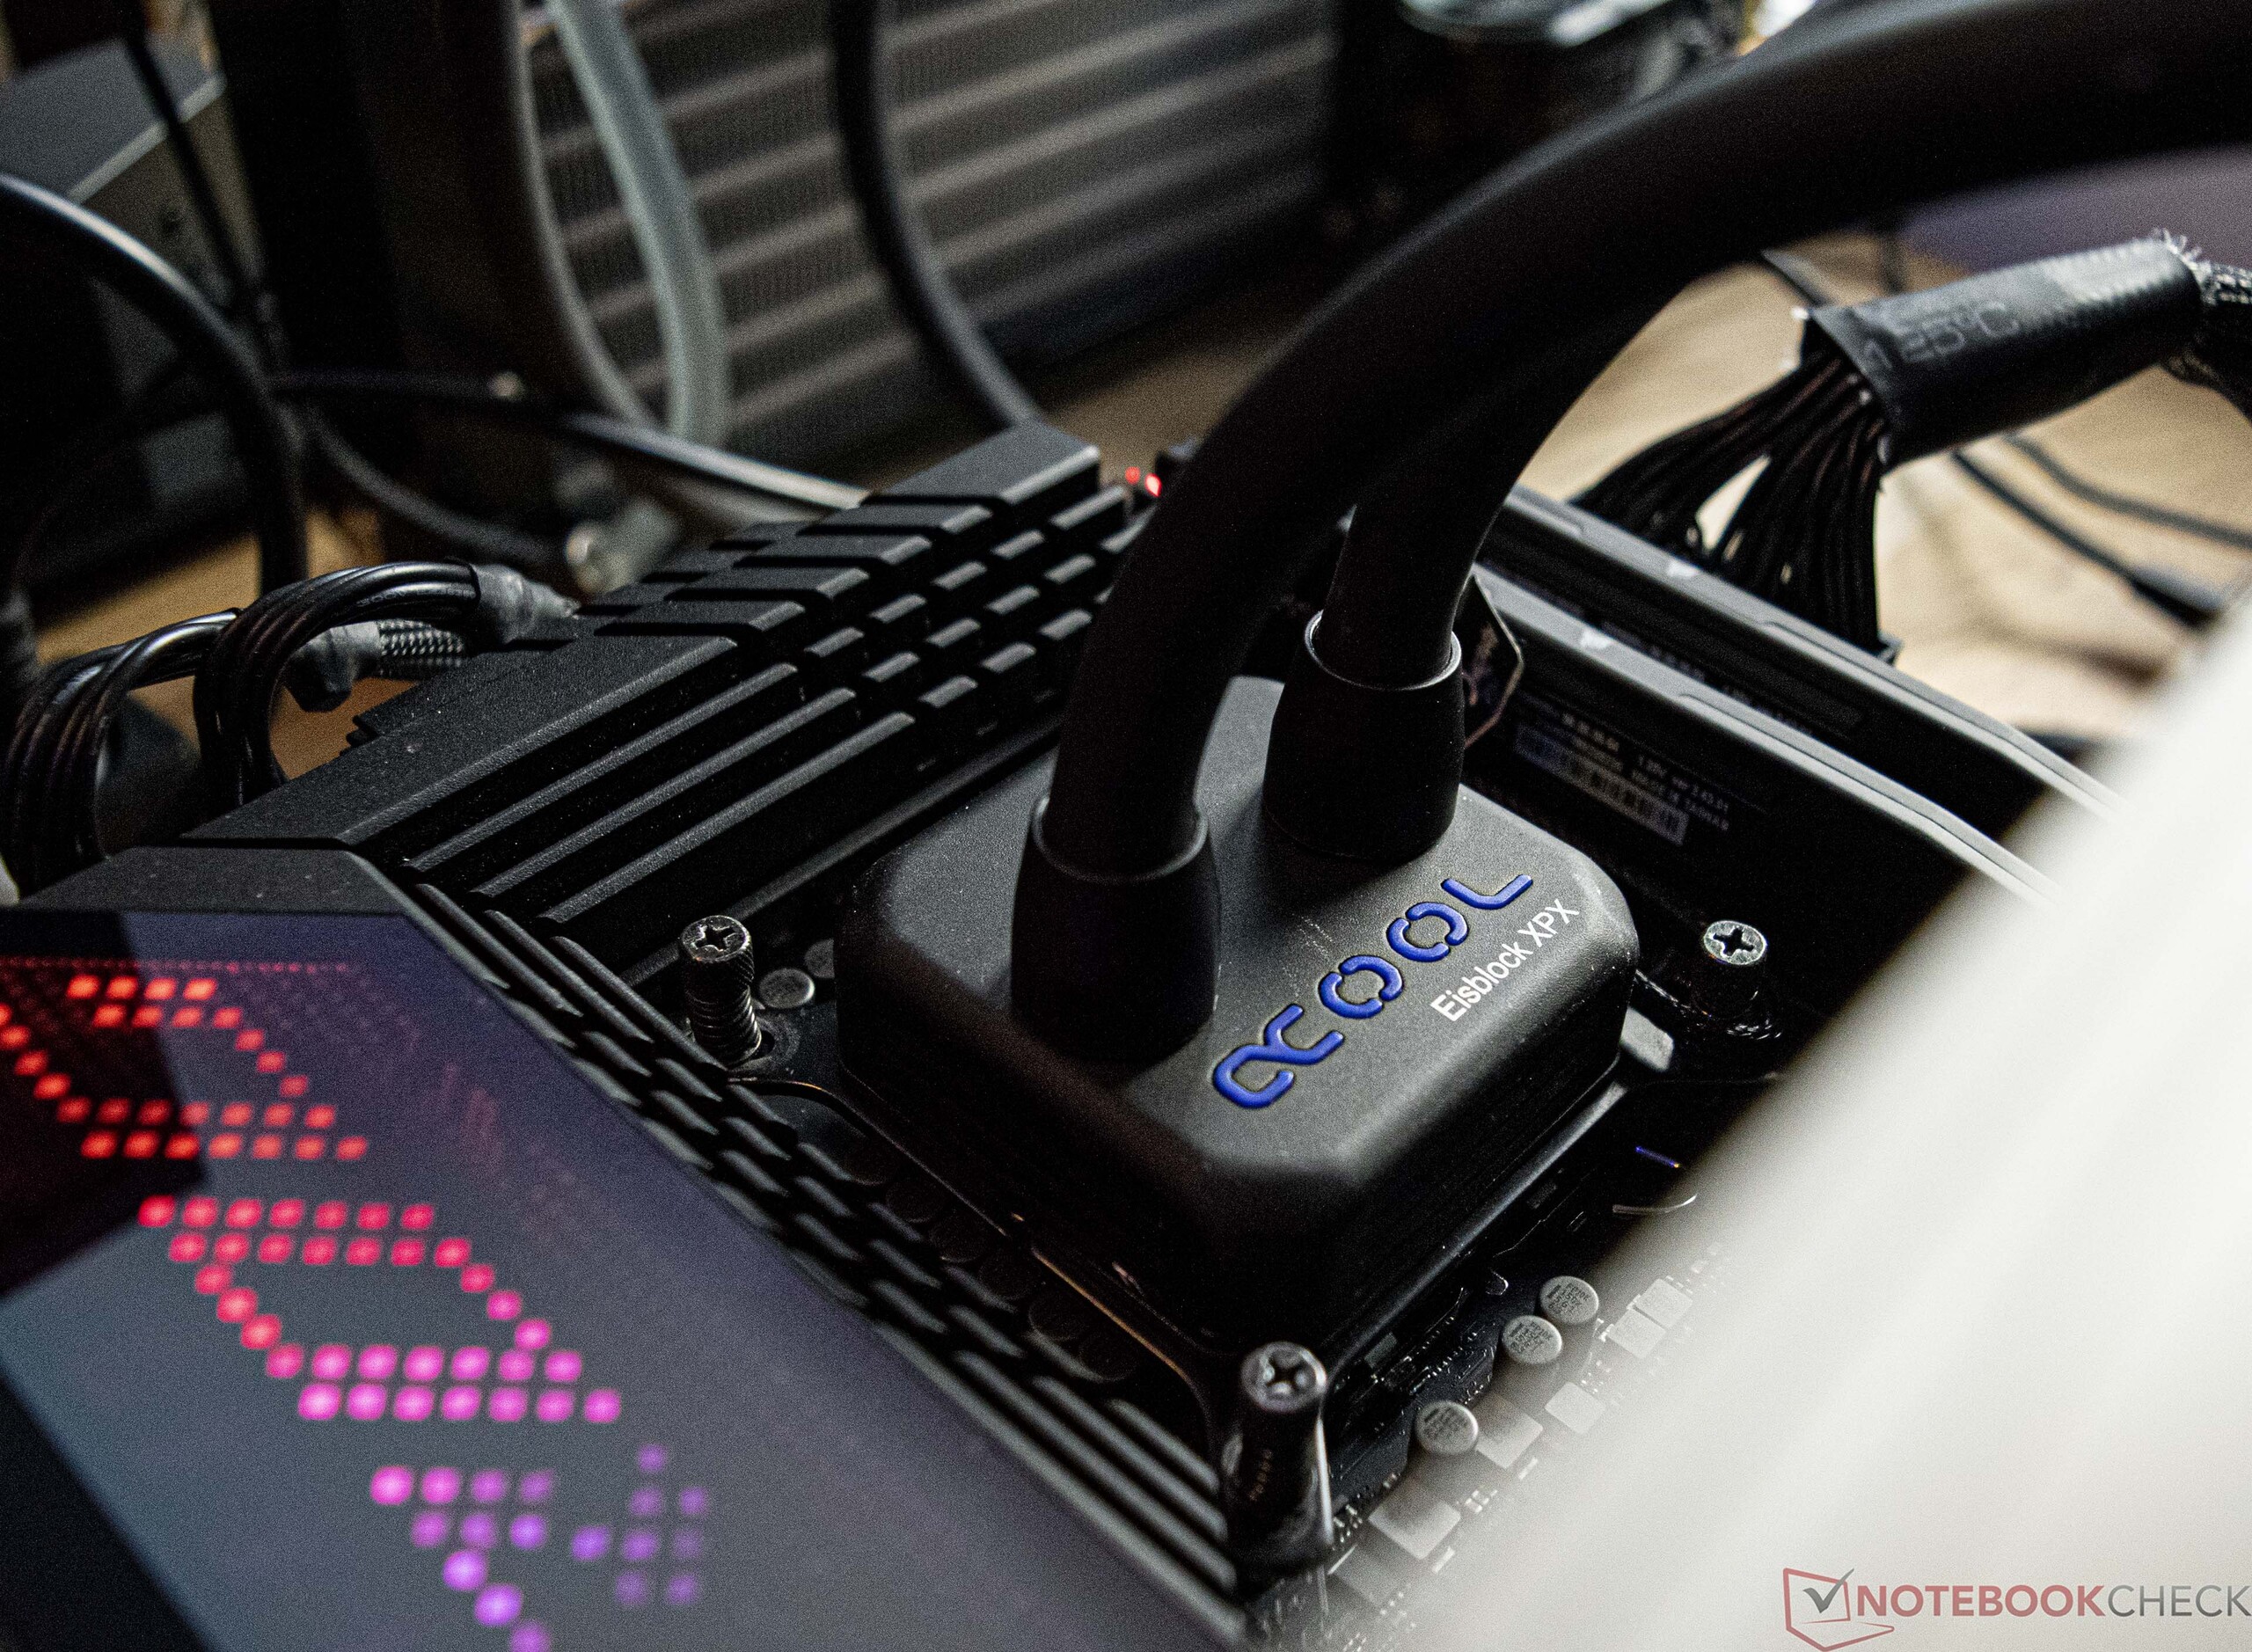
- Refroidissement par eau Custom-Loop (Pompe : Alphacool Aquastream XT Ultra, Radiateur : EK MO-RA3 420 LT BLACK)
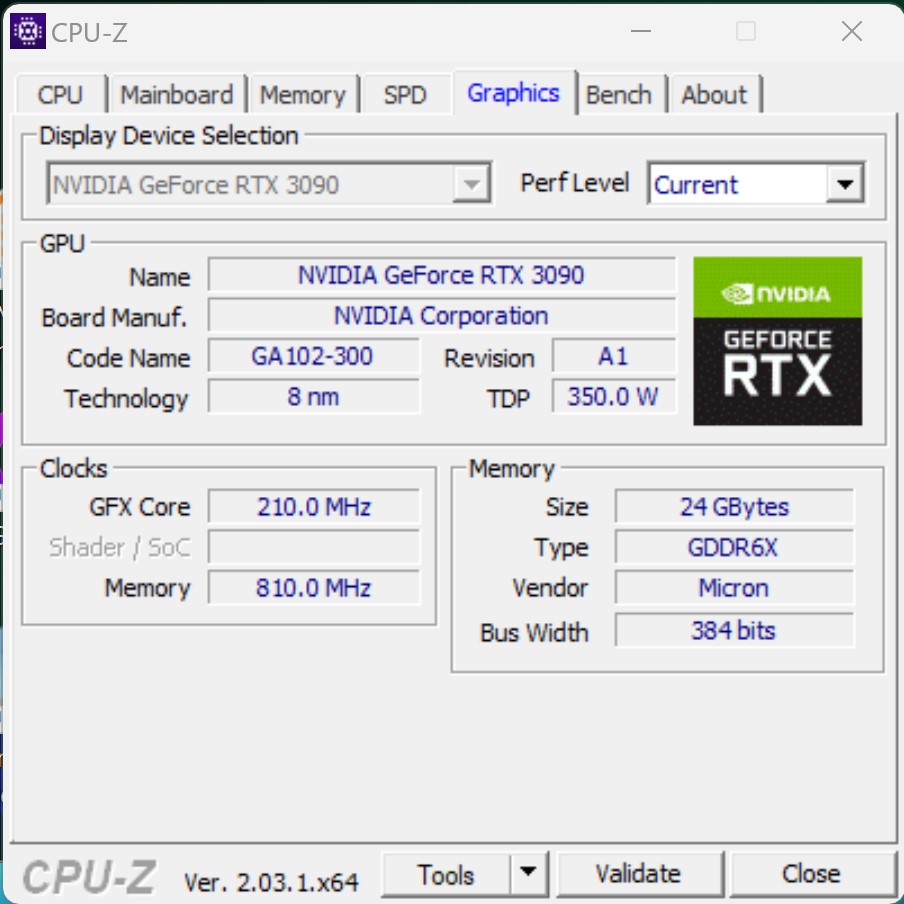
- Nvidia GeForce RTX 3090 Founders Edition (driver : 528.02)
- EVGA SuperNOVA P+ 1600W
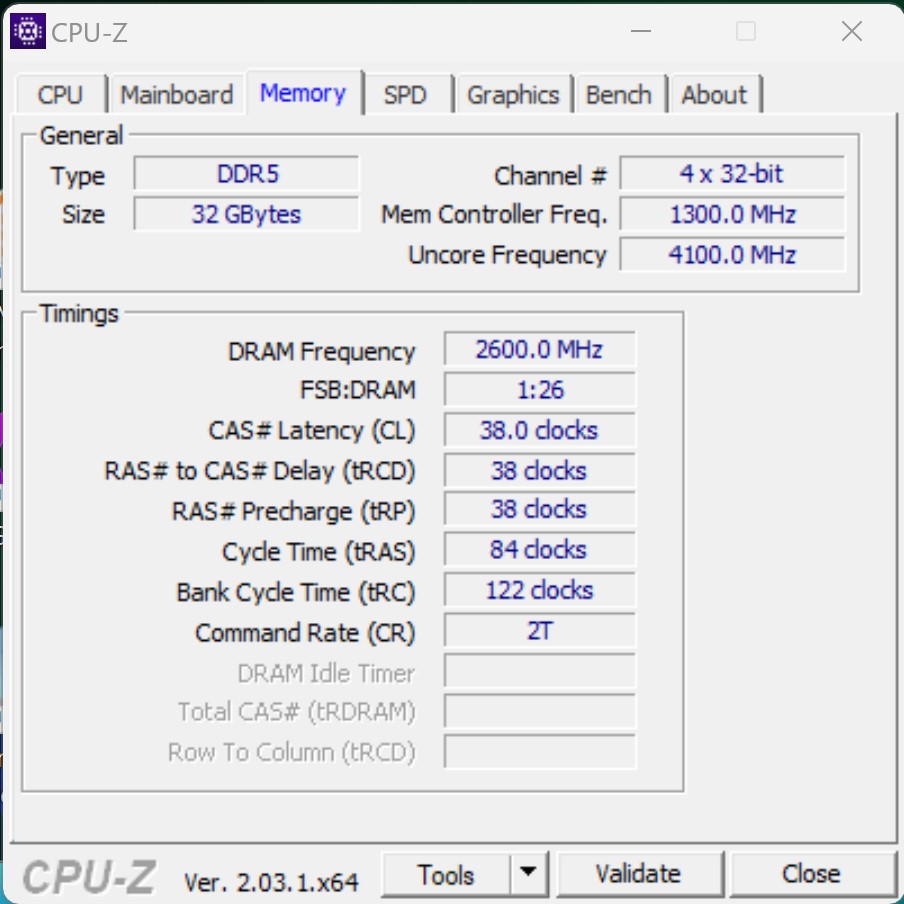
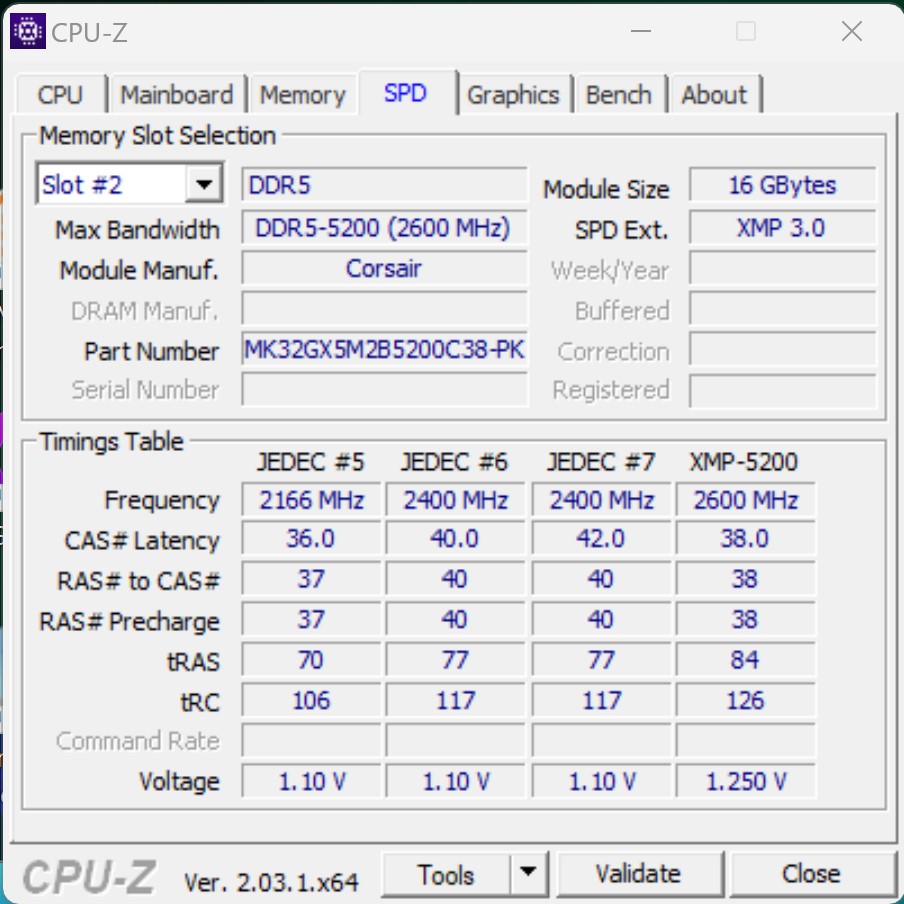
- G.Skill Ripjaws S5 (2x 16 GB - DDR5-5200 MT/s)
- Intel Optane 905p (480 GB système + benchmarks)
- Western Digital SN720 (Jeux)
- Microsoft Windows 11 Professional 64-bit (version 22H2)
Conditions de test - Z690 toujours utilisable après la mise à jour du BIOS
Nous continuons à utiliser le Asus ROG Maximus Z690 Hero comme base pour ce test, qui a déjà été notre choix depuis l'introduction des Processeurs Alder-Lake. Après quelques problèmes que nous avons rencontrés lors de notre test avec le Intel Core i9-13900Kil n'y a pas eu de complications avec leIntel Core i5-13400F. Le dernier BIOS v2204 a été installé afin de démarrer l'Intel Core i5-13400F. Heureusement, le Asus ROG Maximus Z690 Hero offre la possibilité de mettre à jour le BIOS sans CPU ni RAM.
Tous les tests ont été effectués avec le dernier BIOS et le profil XMP1 activé. En outre, toutes les restrictions de limite de puissance ont été désactivées pour accéder à la pleine performance des processeurs.
Benchmarks des processeurs
Malheureusement, nous ne pouvons pas faire une comparaison directe des performances avec l'Intel Core i5-12400F à ce stade. Cependant, nous avons de nombreux autres processeurs dans notre base de données qui peuvent être utilisés comme référence. Ainsi, nous constatons un avantage minime pour l'Intel Core i5-13400F par rapport à un Intel Core i7-12700F. En moyenne, l'Intel Core i5-13400F peut obtenir un meilleur résultat, bien que les threads manquants conduisent définitivement à un plus mauvais score dans les tests individuels. Nous voyons une image presque identique dans la comparaison directe avec le AMD Ryzen 7 5800X. Comme l'Intel Core i5-13400F, ce dernier offre 16 threads, mais peut obtenir de meilleurs résultats dans les benchmarks multithreads purs.
Si vous avez besoin de plus de performances, vous pouvez opter pour un Intel Core i5-13600K. Il offre environ 20 % de performances supplémentaires. La même augmentation des performances peut également être obtenue avec un processeur AMD Ryzen 7 7700X.
Vous trouverez d'autres benchmarks sur les processeursici.
| Performance rating - Percent | |
| Intel Core i9-13900K | |
| Intel Core i5-13600K | |
| AMD Ryzen 7 7700X | |
| Intel Core i5-12600K | |
| AMD Ryzen 7 5800X | |
| Intel Core i7-12700F | |
| Intel Core i5-13400F | |
| AMD Ryzen 5 5600X | |
| Intel Core i5-11400F | |
| Cinebench R15 | |
| CPU Single 64Bit | |
| Intel Core i9-13900K | |
| AMD Ryzen 7 7700X | |
| Intel Core i5-13600K | |
| Intel Core i5-12600K | |
| Intel Core i7-12700F | |
| AMD Ryzen 7 5800X | |
| AMD Ryzen 5 5600X | |
| Intel Core i5-13400F | |
| Intel Core i5-11400F | |
| CPU Multi 64Bit | |
| Intel Core i9-13900K | |
| Intel Core i5-13600K | |
| AMD Ryzen 7 7700X | |
| AMD Ryzen 7 5800X | |
| Intel Core i7-12700F | |
| Intel Core i5-12600K | |
| Intel Core i5-13400F | |
| AMD Ryzen 5 5600X | |
| Intel Core i5-11400F | |
| Cinebench R20 | |
| CPU (Single Core) | |
| Intel Core i9-13900K | |
| Intel Core i5-13600K | |
| AMD Ryzen 7 7700X | |
| Intel Core i5-12600K | |
| Intel Core i7-12700F | |
| Intel Core i5-13400F | |
| AMD Ryzen 7 5800X | |
| AMD Ryzen 5 5600X | |
| Intel Core i5-11400F | |
| CPU (Multi Core) | |
| Intel Core i9-13900K | |
| Intel Core i5-13600K | |
| AMD Ryzen 7 7700X | |
| Intel Core i5-12600K | |
| Intel Core i5-13400F | |
| AMD Ryzen 7 5800X | |
| Intel Core i7-12700F | |
| AMD Ryzen 5 5600X | |
| Intel Core i5-11400F | |
| Cinebench R23 | |
| Single Core | |
| Intel Core i9-13900K | |
| Intel Core i5-13600K | |
| AMD Ryzen 7 7700X | |
| Intel Core i5-12600K | |
| Intel Core i7-12700F | |
| Intel Core i5-13400F | |
| AMD Ryzen 7 5800X | |
| AMD Ryzen 5 5600X | |
| Intel Core i5-11400F | |
| Multi Core | |
| Intel Core i9-13900K | |
| Intel Core i5-13600K | |
| AMD Ryzen 7 7700X | |
| Intel Core i5-12600K | |
| Intel Core i5-13400F | |
| Intel Core i7-12700F | |
| AMD Ryzen 7 5800X | |
| AMD Ryzen 5 5600X | |
| Intel Core i5-11400F | |
| Cinebench R11.5 | |
| CPU Single 64Bit | |
| Intel Core i9-13900K | |
| AMD Ryzen 7 7700X | |
| Intel Core i5-13600K | |
| Intel Core i5-12600K | |
| Intel Core i7-12700F | |
| AMD Ryzen 7 5800X | |
| Intel Core i5-13400F | |
| AMD Ryzen 5 5600X | |
| Intel Core i5-11400F | |
| CPU Multi 64Bit | |
| Intel Core i9-13900K | |
| Intel Core i5-13600K | |
| AMD Ryzen 7 7700X | |
| Intel Core i7-12700F | |
| Intel Core i5-12600K | |
| AMD Ryzen 7 5800X | |
| Intel Core i5-13400F | |
| AMD Ryzen 5 5600X | |
| Intel Core i5-11400F | |
| Blender - v2.79 BMW27 CPU | |
| Intel Core i5-11400F | |
| AMD Ryzen 5 5600X | |
| Intel Core i7-12700F | |
| Intel Core i5-13400F | |
| AMD Ryzen 7 5800X | |
| Intel Core i5-12600K | |
| AMD Ryzen 7 7700X | |
| Intel Core i5-13600K | |
| Intel Core i9-13900K | |
| wPrime 2.10 | |
| 32m | |
| Intel Core i5-12600K | |
| Intel Core i5-11400F | |
| AMD Ryzen 5 5600X | |
| Intel Core i5-13400F | |
| AMD Ryzen 7 5800X | |
| Intel Core i7-12700F | |
| Intel Core i5-13600K | |
| AMD Ryzen 7 7700X | |
| Intel Core i9-13900K | |
| 1024m | |
| Intel Core i5-13400F | |
| Intel Core i5-12600K | |
| Intel Core i5-13600K | |
| Intel Core i7-12700F | |
| Intel Core i5-11400F | |
| AMD Ryzen 5 5600X | |
| AMD Ryzen 7 5800X | |
| Intel Core i9-13900K | |
| AMD Ryzen 7 7700X | |
| X264 HD Benchmark 4.0 | |
| Pass 1 | |
| Intel Core i9-13900K | |
| Intel Core i5-13600K | |
| AMD Ryzen 7 7700X | |
| AMD Ryzen 7 5800X | |
| Intel Core i5-12600K | |
| AMD Ryzen 5 5600X | |
| Intel Core i5-13400F | |
| Intel Core i7-12700F | |
| Intel Core i5-11400F | |
| Pass 2 | |
| Intel Core i9-13900K | |
| Intel Core i5-13600K | |
| AMD Ryzen 7 7700X | |
| AMD Ryzen 7 5800X | |
| Intel Core i5-12600K | |
| Intel Core i5-13400F | |
| Intel Core i7-12700F | |
| AMD Ryzen 5 5600X | |
| Intel Core i5-11400F | |
| WinRAR - Result | |
| AMD Ryzen 7 5800X | |
| AMD Ryzen 7 7700X | |
| Intel Core i9-13900K | |
| AMD Ryzen 5 5600X | |
| Intel Core i5-13600K | |
| Intel Core i7-12700F | |
| Intel Core i5-13400F | |
| Intel Core i5-11400F | |
| Intel Core i5-12600K | |
| TrueCrypt | |
| AES Mean 100MB | |
| Intel Core i9-13900K | |
| Intel Core i5-13600K | |
| AMD Ryzen 7 7700X | |
| AMD Ryzen 7 5800X | |
| Intel Core i5-12600K | |
| Intel Core i5-13400F | |
| AMD Ryzen 5 5600X | |
| Intel Core i5-11400F | |
| Intel Core i7-12700F | |
| Twofish Mean 100MB | |
| Intel Core i9-13900K | |
| Intel Core i5-13600K | |
| Intel Core i7-12700F | |
| AMD Ryzen 7 7700X | |
| Intel Core i5-12600K | |
| AMD Ryzen 7 5800X | |
| Intel Core i5-13400F | |
| AMD Ryzen 5 5600X | |
| Intel Core i5-11400F | |
| Serpent Mean 100MB | |
| Intel Core i9-13900K | |
| Intel Core i5-13600K | |
| Intel Core i7-12700F | |
| AMD Ryzen 7 7700X | |
| AMD Ryzen 7 5800X | |
| Intel Core i5-12600K | |
| Intel Core i5-13400F | |
| AMD Ryzen 5 5600X | |
| Intel Core i5-11400F | |
| Geekbench 5.5 | |
| Multi-Core | |
| Intel Core i9-13900K | |
| Intel Core i5-13600K | |
| AMD Ryzen 7 7700X | |
| Intel Core i5-12600K | |
| Intel Core i5-13400F | |
| AMD Ryzen 7 5800X | |
| Intel Core i7-12700F | |
| AMD Ryzen 5 5600X | |
| Intel Core i5-11400F | |
| Single-Core | |
| Intel Core i9-13900K | |
| AMD Ryzen 7 7700X | |
| Intel Core i5-13600K | |
| Intel Core i5-12600K | |
| Intel Core i5-13400F | |
| AMD Ryzen 7 5800X | |
| AMD Ryzen 5 5600X | |
| Intel Core i7-12700F | |
| Intel Core i5-11400F | |
| Geekbench 5.0 | |
| 5.0 Multi-Core | |
| Intel Core i9-13900K | |
| Intel Core i5-13600K | |
| AMD Ryzen 7 7700X | |
| Intel Core i5-12600K | |
| Intel Core i5-13400F | |
| AMD Ryzen 7 5800X | |
| Intel Core i7-12700F | |
| AMD Ryzen 5 5600X | |
| Intel Core i5-11400F | |
| 5.0 Single-Core | |
| Intel Core i9-13900K | |
| AMD Ryzen 7 7700X | |
| Intel Core i5-13600K | |
| Intel Core i5-12600K | |
| Intel Core i5-13400F | |
| AMD Ryzen 7 5800X | |
| AMD Ryzen 5 5600X | |
| Intel Core i7-12700F | |
| Intel Core i5-11400F | |
| Geekbench 4.4 | |
| 64 Bit Single-Core Score | |
| Intel Core i9-13900K | |
| AMD Ryzen 7 7700X | |
| Intel Core i5-13600K | |
| Intel Core i5-12600K | |
| Intel Core i5-13400F | |
| AMD Ryzen 7 5800X | |
| AMD Ryzen 5 5600X | |
| Intel Core i5-11400F | |
| Intel Core i7-12700F | |
| 64 Bit Multi-Core Score | |
| Intel Core i9-13900K | |
| Intel Core i5-13600K | |
| AMD Ryzen 7 7700X | |
| Intel Core i5-12600K | |
| AMD Ryzen 7 5800X | |
| Intel Core i5-13400F | |
| Intel Core i7-12700F | |
| AMD Ryzen 5 5600X | |
| Intel Core i5-11400F | |
| 3DMark 11 - 1280x720 Performance Physics | |
| Intel Core i9-13900K | |
| AMD Ryzen 7 7700X | |
| Intel Core i5-13600K | |
| Intel Core i5-12600K | |
| Intel Core i5-13400F | |
| Intel Core i7-12700F | |
| AMD Ryzen 7 5800X | |
| AMD Ryzen 5 5600X | |
| Intel Core i5-11400F | |
| 7-Zip 18.03 | |
| 7z b 4 | |
| Intel Core i9-13900K | |
| Intel Core i5-13600K | |
| AMD Ryzen 7 7700X | |
| AMD Ryzen 7 5800X | |
| Intel Core i5-12600K | |
| Intel Core i7-12700F | |
| Intel Core i5-13400F | |
| AMD Ryzen 5 5600X | |
| Intel Core i5-11400F | |
| 7z b 4 -mmt1 | |
| AMD Ryzen 7 7700X | |
| Intel Core i9-13900K | |
| AMD Ryzen 7 5800X | |
| AMD Ryzen 5 5600X | |
| Intel Core i5-13600K | |
| Intel Core i7-12700F | |
| Intel Core i5-12600K | |
| Intel Core i5-13400F | |
| Intel Core i5-11400F | |
| HWBOT x265 Benchmark v2.2 - 4k Preset | |
| Intel Core i9-13900K | |
| Intel Core i5-12600K | |
| Intel Core i5-13600K | |
| AMD Ryzen 7 7700X | |
| AMD Ryzen 7 5800X | |
| Intel Core i5-13400F | |
| Intel Core i7-12700F | |
| AMD Ryzen 5 5600X | |
| Intel Core i5-11400F | |
| R Benchmark 2.5 - Overall mean | |
| Intel Core i5-11400F | |
| AMD Ryzen 5 5600X | |
| Intel Core i5-13400F | |
| AMD Ryzen 7 5800X | |
| Intel Core i5-12600K | |
| Intel Core i7-12700F | |
| Intel Core i5-13600K | |
| AMD Ryzen 7 7700X | |
| Intel Core i9-13900K | |
| LibreOffice - 20 Documents To PDF | |
| Intel Core i5-12600K | |
| Intel Core i7-12700F | |
| Intel Core i5-11400F | |
| AMD Ryzen 5 5600X | |
| AMD Ryzen 7 5800X | |
| Intel Core i5-13400F | |
| Intel Core i9-13900K | |
| Intel Core i5-13600K | |
| AMD Ryzen 7 7700X | |
| WebXPRT 3 - Overall | |
| Intel Core i9-13900K | |
| AMD Ryzen 7 7700X | |
| Intel Core i5-13600K | |
| AMD Ryzen 7 5800X | |
| Intel Core i5-13400F | |
| Intel Core i5-12600K | |
| AMD Ryzen 5 5600X | |
| Intel Core i7-12700F | |
| Intel Core i5-11400F | |
| Mozilla Kraken 1.1 - Total | |
| Intel Core i5-11400F | |
| AMD Ryzen 5 5600X | |
| AMD Ryzen 7 5800X | |
| Intel Core i5-13400F | |
| Intel Core i7-12700F | |
| Intel Core i5-12600K | |
| Intel Core i5-13600K | |
| AMD Ryzen 7 7700X | |
| Intel Core i9-13900K | |
| 3DMark | |
| 1920x1080 Fire Strike Physics | |
| Intel Core i9-13900K | |
| Intel Core i5-13600K | |
| AMD Ryzen 7 7700X | |
| Intel Core i7-12700F | |
| AMD Ryzen 7 5800X | |
| Intel Core i5-12600K | |
| Intel Core i5-13400F | |
| AMD Ryzen 5 5600X | |
| Intel Core i5-11400F | |
| 2560x1440 Time Spy CPU | |
| Intel Core i9-13900K | |
| Intel Core i5-13600K | |
| AMD Ryzen 7 7700X | |
| Intel Core i5-12600K | |
| Intel Core i5-13400F | |
| AMD Ryzen 7 5800X | |
| Intel Core i7-12700F | |
| AMD Ryzen 5 5600X | |
| Intel Core i5-11400F | |
* ... Moindre est la valeur, meilleures sont les performances
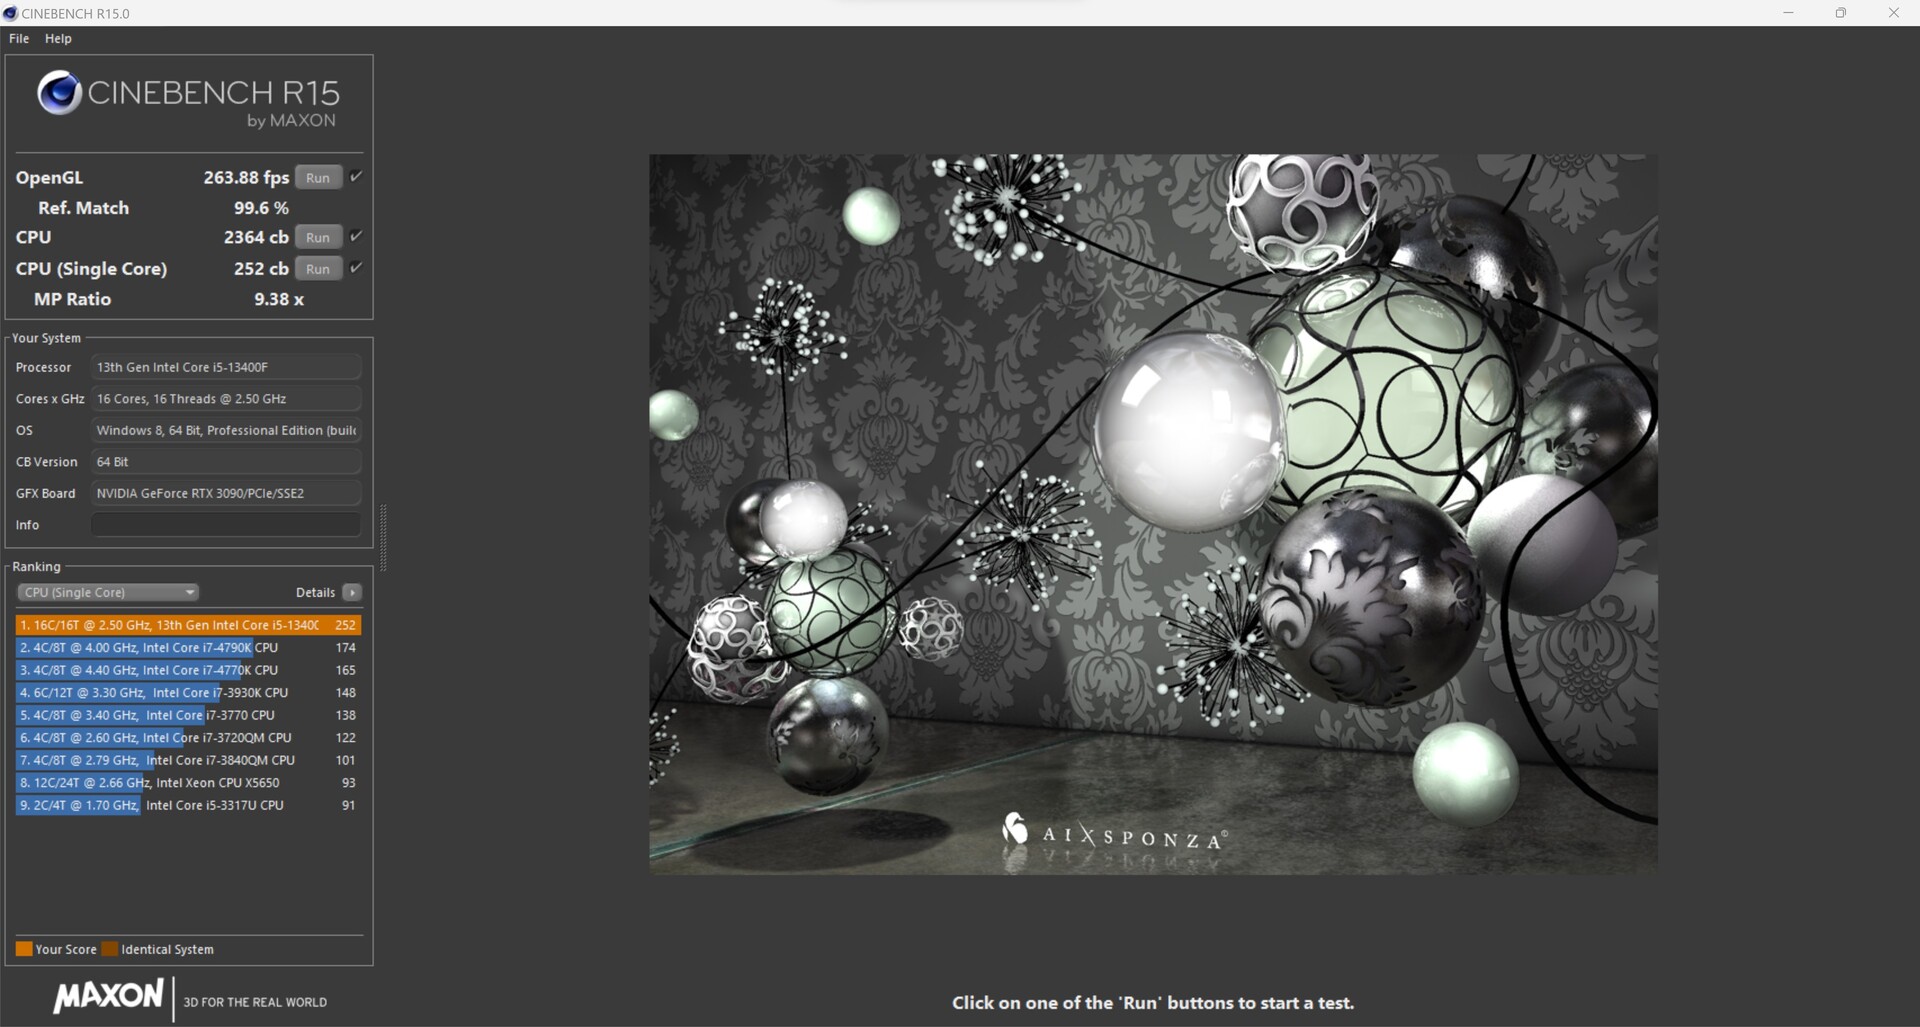
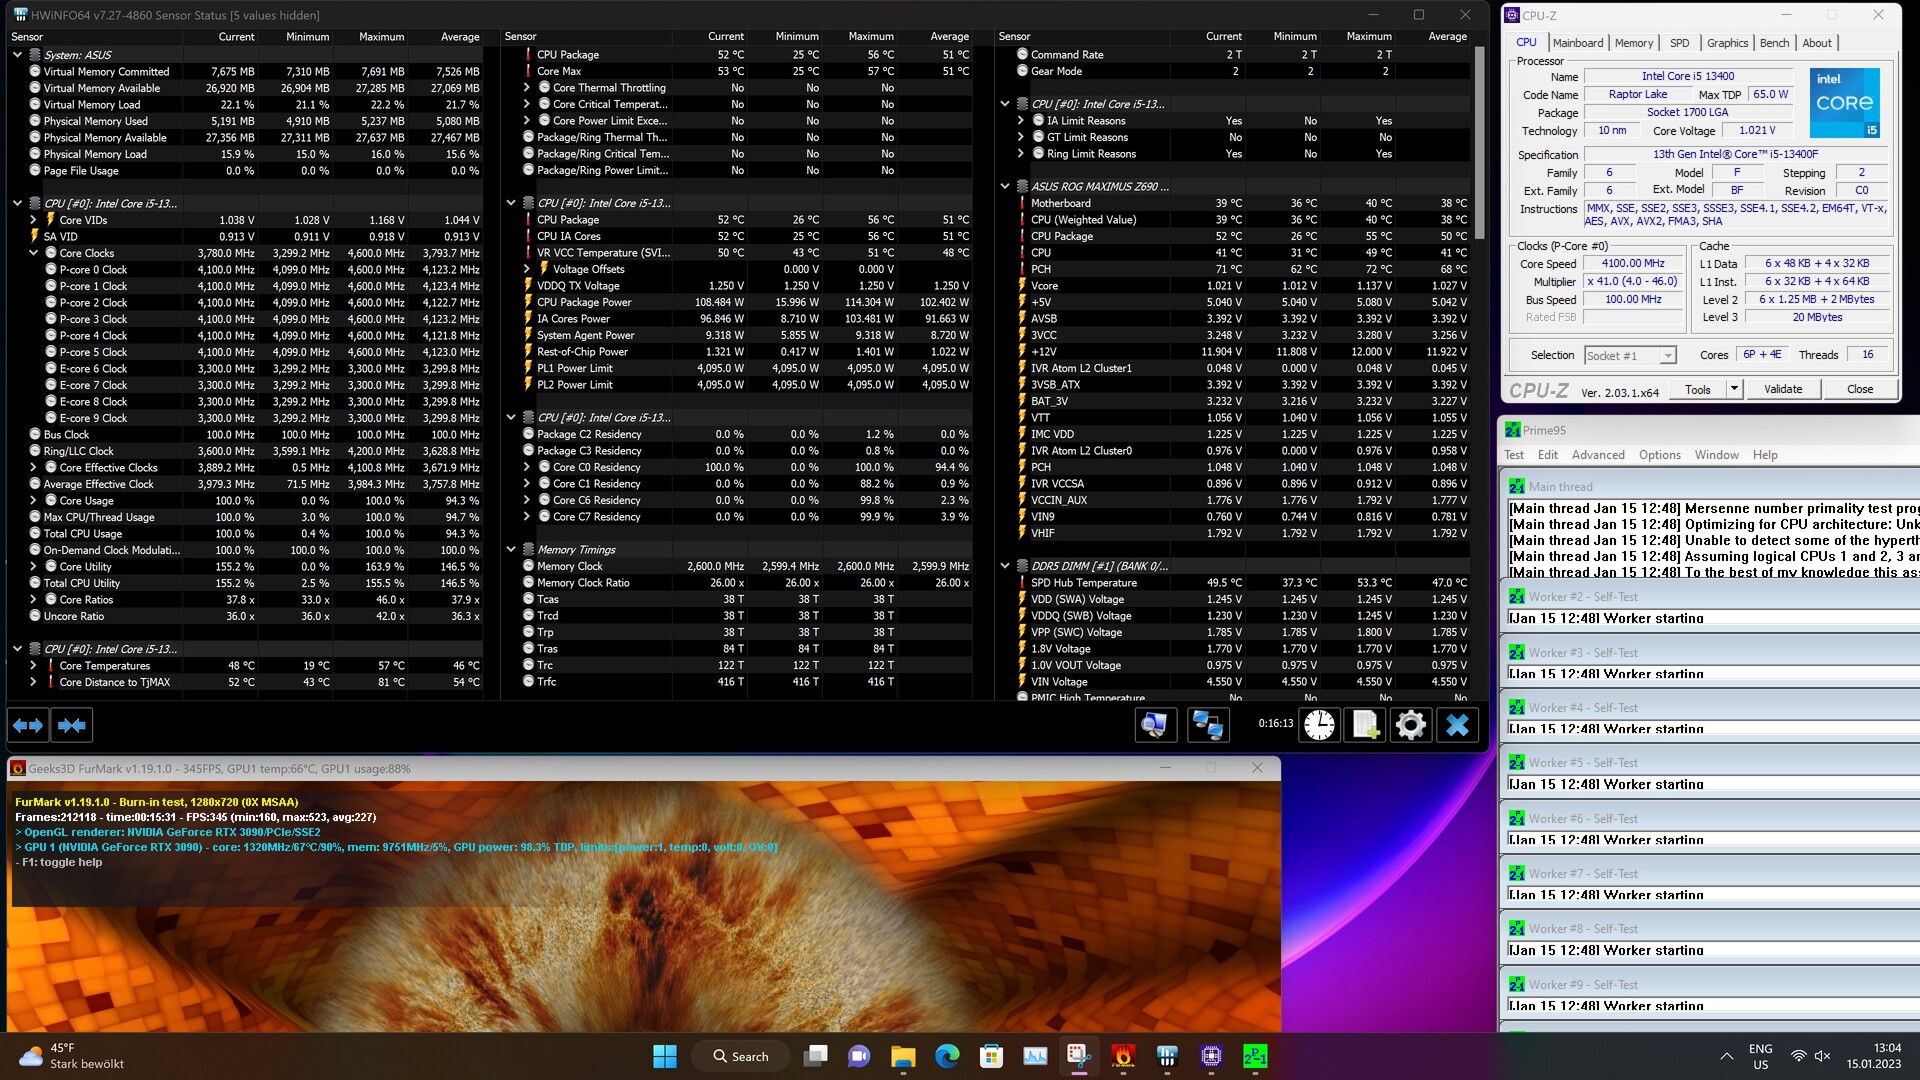
Intel Core i5-13400F vs. Cinebench R15 multi boucle
Pendant le test de stress, que nous exécutons avec la boucle continue Cinebench R15, il n'y a aucun problème en termes de développement stable de la puissance. Avec un maximum de 148 watts, qu'Intel autorise au Core i5-13400F, le système de refroidissement n'est pas particulièrement mis à contribution. L'Intel Core i5-13400F est à peine plus lent que l'Intel Core i5-12600K avec une moyenne de 2 338 points sur l'ensemble des 50 tests Intel Core i5-12600K (2,545 points).
Bancs d'essai synthétiques et performances des applications
L'Intel Core i5-13400F peut également obtenir de bons résultats dans les benchmarks d'application et est égal à un Intel Core i5-12600K en termes de performances. Par rapport aux modèles K des processeurs Raptor-Lake énumérés ici, notre échantillon d'examen doit accepter un net déficit, cependant. Néanmoins, l'Intel Core i5-13400F offre une performance solide dans l'utilisation quotidienne, ce qui est tout à fait suffisant pour la plupart des applications.
| 3DMark | |
| 1920x1080 Fire Strike Physics | |
| Intel Core i9-13900K | |
| AMD Ryzen 9 5950X | |
| Intel Core i9-12900K | |
| Intel Core i5-13600K | |
| AMD Ryzen 9 5900X | |
| Intel Core i7-12700F | |
| AMD Ryzen 5 7600X | |
| Intel Core i5-12600K | |
| Intel Core i5-13400F | |
| AMD Ryzen 5 5600X | |
| Intel Core i5-11400F | |
| 2560x1440 Time Spy CPU | |
| Intel Core i9-13900K | |
| Intel Core i9-12900K | |
| Intel Core i5-13600K | |
| Intel Core i5-12600K | |
| AMD Ryzen 9 5950X | |
| Intel Core i5-13400F | |
| AMD Ryzen 9 5900X | |
| Intel Core i7-12700F | |
| AMD Ryzen 5 7600X | |
| AMD Ryzen 5 5600X | |
| Intel Core i5-11400F | |
| 3DMark 11 - 1280x720 Performance Physics | |
| Intel Core i9-13900K | |
| Intel Core i5-13600K | |
| Intel Core i9-12900K | |
| AMD Ryzen 5 7600X | |
| AMD Ryzen 9 5950X | |
| Intel Core i5-12600K | |
| Intel Core i5-13400F | |
| Intel Core i7-12700F | |
| Intel Core i9-12900K | |
| AMD Ryzen 9 5900X | |
| AMD Ryzen 5 5600X | |
| Intel Core i5-11400F | |
| CrossMark - Overall | |
| Intel Core i9-13900K | |
| Intel Core i5-13600K | |
| AMD Ryzen 5 7600X | |
| Intel Core i5-13400F | |
| Intel Core i7-12700F | |
| Intel Core i5-12600K | |
| AMD Ryzen 9 5900X | |
| AMD Ryzen 9 5950X | |
| AMD Ryzen 5 5600X | |
| AIDA64 / Memory Copy | |
| Intel Core i9-13900K | |
| Intel Core i5-13600K | |
| Intel Core i5-13400F | |
| Intel Core i5-12600K | |
| AMD Ryzen 9 5900X | |
| AMD Ryzen 5 7600X | |
| AMD Ryzen 9 5950X | |
| AMD Ryzen 5 5600X | |
| Moyenne de la classe (4514 - 234662, n=2213) | |
| AIDA64 / Memory Read | |
| Intel Core i9-13900K | |
| Intel Core i5-13400F | |
| Intel Core i5-12600K | |
| Intel Core i5-13600K | |
| AMD Ryzen 9 5900X | |
| AMD Ryzen 9 5950X | |
| AMD Ryzen 5 5600X | |
| AMD Ryzen 5 7600X | |
| Moyenne de la classe (4031 - 271066, n=2175) | |
| AIDA64 / Memory Write | |
| AMD Ryzen 5 7600X | |
| Intel Core i9-13900K | |
| Intel Core i5-12600K | |
| Intel Core i5-13600K | |
| Intel Core i5-13400F | |
| Moyenne de la classe (3506 - 242868, n=2180) | |
| AMD Ryzen 9 5900X | |
| AMD Ryzen 9 5950X | |
| AMD Ryzen 5 5600X | |
| AIDA64 / Memory Latency | |
| Moyenne de la classe (6.1 - 536, n=2241) | |
| Intel Core i5-12600K | |
| Intel Core i5-13600K | |
| Intel Core i5-13400F | |
| Intel Core i9-13900K | |
| AMD Ryzen 9 5950X | |
| AMD Ryzen 5 5600X | |
| AMD Ryzen 5 7600X | |
| AMD Ryzen 9 5900X | |
* ... Moindre est la valeur, meilleures sont les performances
Bancs d'essai de jeux
Comme précédemment, notre échantillon se mesure principalement à l'Intel Core i5-12600K dans les tests de jeu. Dans les hautes résolutions et un préréglage élevé, les rivaux se rapprochent. S'il s'agit uniquement de jeux, vous ne vous tromperez certainement pas avec l'Intel Core i5-13400F. Avec ses 16 threads, tous les jeux sont actuellement bien jouables avec la carte graphique correspondante. Dans notre test, nous avons utilisé une Nvidia GeForce RTX 3090 Founder Edition afin de pouvoir comparer les performances de notre échantillon de test avec celles des appareils de comparaison. Si vous souhaitez également faire du streaming en même temps que jouer, nous vous recommandons actuellement un Intel Core i9-13900K ou un AMD Ryzen 9 7950X.
Gaming Performance
| Performance rating - Percent | |
| Intel Core i9-13900K | |
| AMD Ryzen 9 7900X | |
| AMD Ryzen 5 7600X | |
| Intel Core i9-12900K | |
| Intel Core i5-13600K | |
| Intel Core i5-13400F | |
| Intel Core i5-12600K | |
| F1 22 | |
| 1920x1080 Low Preset AA:T AF:16x | |
| AMD Ryzen 9 7900X | |
| AMD Ryzen 5 7600X | |
| Intel Core i5-13600K | |
| Intel Core i9-13900K | |
| Intel Core i9-12900K | |
| Intel Core i5-13400F | |
| Intel Core i5-12600K | |
| 1920x1080 Ultra High Preset AA:T AF:16x | |
| Intel Core i9-12900K | |
| Intel Core i5-12600K | |
| Intel Core i5-13600K | |
| Intel Core i5-13400F | |
| AMD Ryzen 5 7600X | |
| AMD Ryzen 9 7900X | |
| Intel Core i9-13900K | |
| Far Cry 5 | |
| 1920x1080 Ultra Preset AA:T | |
| Intel Core i9-13900K | |
| Intel Core i5-13600K | |
| Intel Core i9-12900K | |
| AMD Ryzen 9 7900X | |
| AMD Ryzen 5 7600X | |
| Intel Core i5-12600K | |
| Intel Core i5-13400F | |
| 1280x720 Low Preset AA:T | |
| Intel Core i9-13900K | |
| AMD Ryzen 9 7900X | |
| Intel Core i5-13600K | |
| AMD Ryzen 5 7600X | |
| Intel Core i9-12900K | |
| Intel Core i5-12600K | |
| Intel Core i5-13400F | |
| X-Plane 11.11 | |
| 1920x1080 high (fps_test=3) | |
| AMD Ryzen 9 7900X | |
| AMD Ryzen 5 7600X | |
| Intel Core i9-13900K | |
| Intel Core i9-12900K | |
| Intel Core i5-13600K | |
| Intel Core i5-13400F | |
| Intel Core i5-12600K | |
| 1280x720 low (fps_test=1) | |
| Intel Core i9-13900K | |
| AMD Ryzen 5 7600X | |
| AMD Ryzen 9 7900X | |
| Intel Core i9-12900K | |
| Intel Core i5-13600K | |
| Intel Core i5-13400F | |
| Intel Core i5-12600K | |
| Final Fantasy XV Benchmark | |
| 1920x1080 High Quality | |
| AMD Ryzen 9 7900X | |
| Intel Core i5-13600K | |
| Intel Core i9-13900K | |
| AMD Ryzen 5 7600X | |
| Intel Core i9-12900K | |
| Intel Core i5-13400F | |
| Intel Core i5-12600K | |
| 1280x720 Lite Quality | |
| AMD Ryzen 9 7900X | |
| Intel Core i5-13600K | |
| Intel Core i9-13900K | |
| Intel Core i9-12900K | |
| AMD Ryzen 5 7600X | |
| Intel Core i5-13400F | |
| Intel Core i5-12600K | |
| Dota 2 Reborn | |
| 1920x1080 ultra (3/3) best looking | |
| AMD Ryzen 9 7900X | |
| Intel Core i9-13900K | |
| AMD Ryzen 5 7600X | |
| Intel Core i5-13600K | |
| Intel Core i9-12900K | |
| Intel Core i5-12600K | |
| Intel Core i5-13400F | |
| 1280x720 min (0/3) fastest | |
| AMD Ryzen 5 7600X | |
| AMD Ryzen 9 7900X | |
| Intel Core i9-13900K | |
| Intel Core i5-13600K | |
| Intel Core i9-12900K | |
| Intel Core i5-12600K | |
| Intel Core i5-13400F | |
| GTA V | |
| 1920x1080 Highest AA:4xMSAA + FX AF:16x | |
| Intel Core i9-13900K | |
| AMD Ryzen 9 7900X | |
| AMD Ryzen 5 7600X | |
| Intel Core i5-13600K | |
| Intel Core i9-12900K | |
| Intel Core i5-12600K | |
| Intel Core i5-13400F | |
| 1024x768 Lowest Settings possible | |
| Intel Core i9-13900K | |
| AMD Ryzen 9 7900X | |
| AMD Ryzen 5 7600X | |
| Intel Core i5-13600K | |
| Intel Core i9-12900K | |
| Intel Core i5-13400F | |
| Intel Core i5-12600K | |
| Bas | Moyen | Élevé | Ultra | QHD | 4K | |
|---|---|---|---|---|---|---|
| GTA V (2015) | 187.5 | 187.5 | 187.1 | 161.4 | 151.8 | 182.2 |
| The Witcher 3 (2015) | 773 | 586 | 384 | 188.1 | 156.9 | |
| Dota 2 Reborn (2015) | 293.1 | 257 | 250.4 | 231.65 | 216.7 | |
| Final Fantasy XV Benchmark (2018) | 236 | 231 | 190.8 | 146.6 | 88.8 | |
| X-Plane 11.11 (2018) | 225 | 199.2 | 160.9 | 133.5 | ||
| Far Cry 5 (2018) | 244 | 211 | 203 | 186 | 176 | 110 |
| Strange Brigade (2018) | 741 | 479 | 380 | 329 | 249 | 153.1 |
| Shadow of the Tomb Raider (2018) | 314 | 261 | 251 | 234 | 172.2 | 99.6 |
| Far Cry New Dawn (2019) | 200 | 176 | 169 | 151 | 143 | 109 |
| Metro Exodus (2019) | 311 | 223 | 175.2 | 140.1 | 115.8 | 76.6 |
| Borderlands 3 (2019) | 244 | 213 | 190.8 | 164.1 | 131.6 | 75.3 |
| F1 2020 (2020) | 487 | 403 | 374 | 270 | 218 | 138.8 |
| F1 2021 (2021) | 648 | 548 | 441 | 224 | 175.4 | 105.3 |
| Cyberpunk 2077 1.6 (2022) | 214 | 213 | 174 | 173 | 88 | 46 |
| Tiny Tina's Wonderlands (2022) | 364 | 294 | 212 | 168.5 | 124 | 70.8 |
| F1 22 (2022) | 344 | 361 | 321 | 125.1 | 83.8 | 42.4 |
| The Quarry (2022) | 282 | 216 | 177.7 | 144.4 | 103.6 | 58.9 |
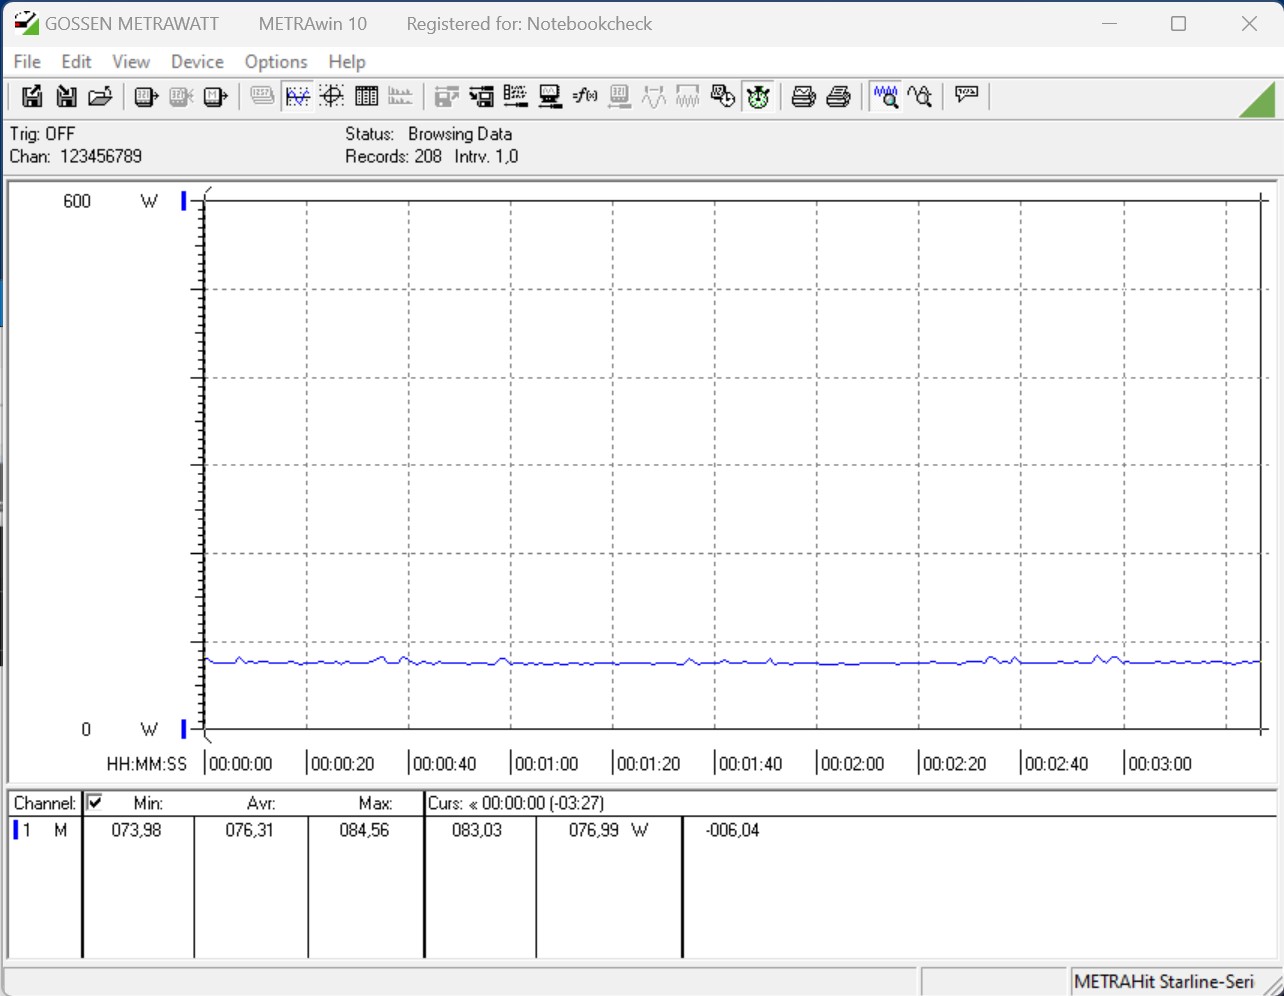
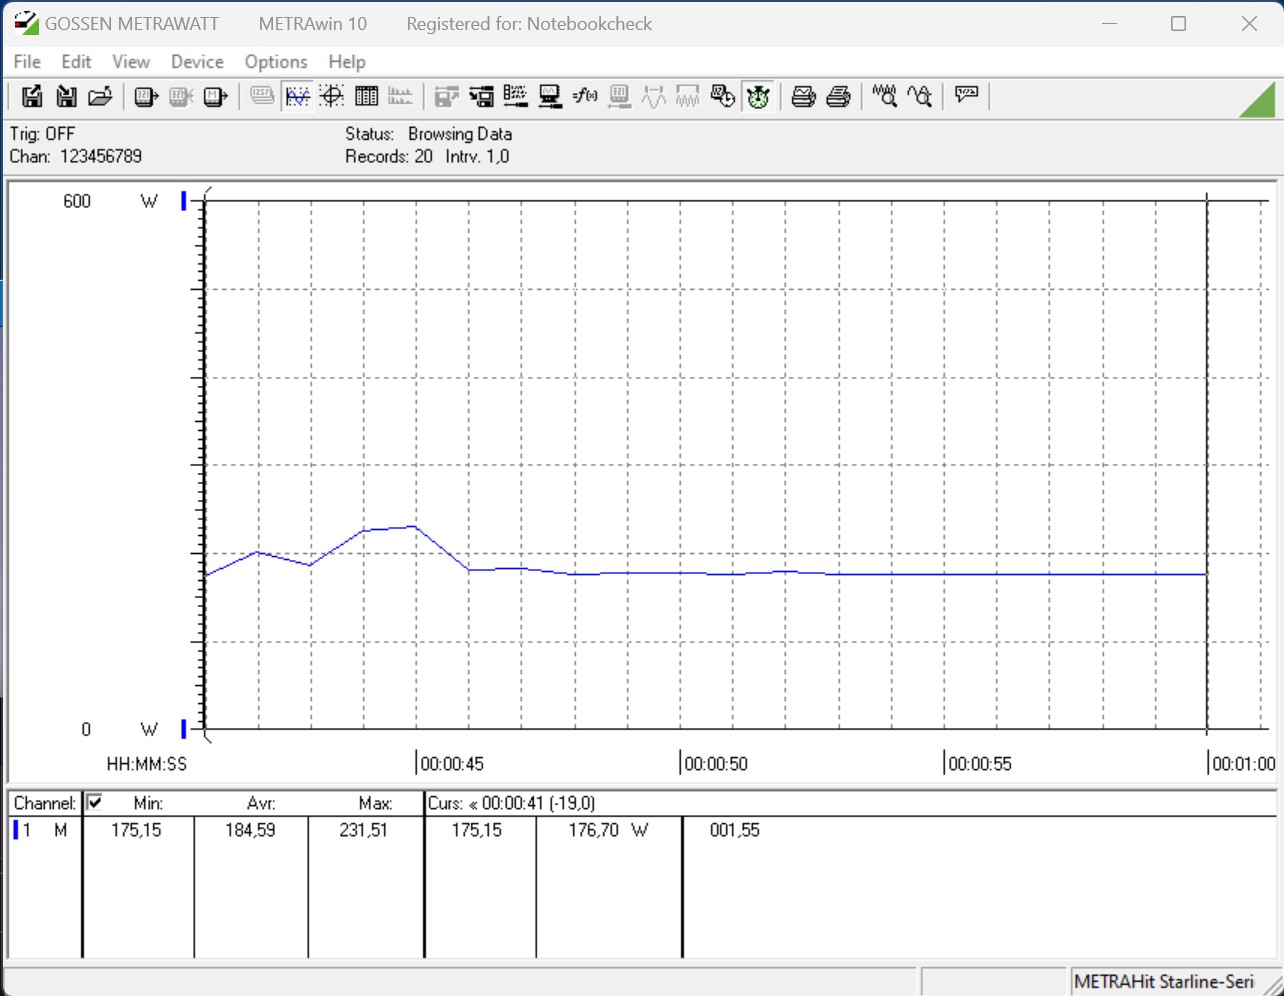
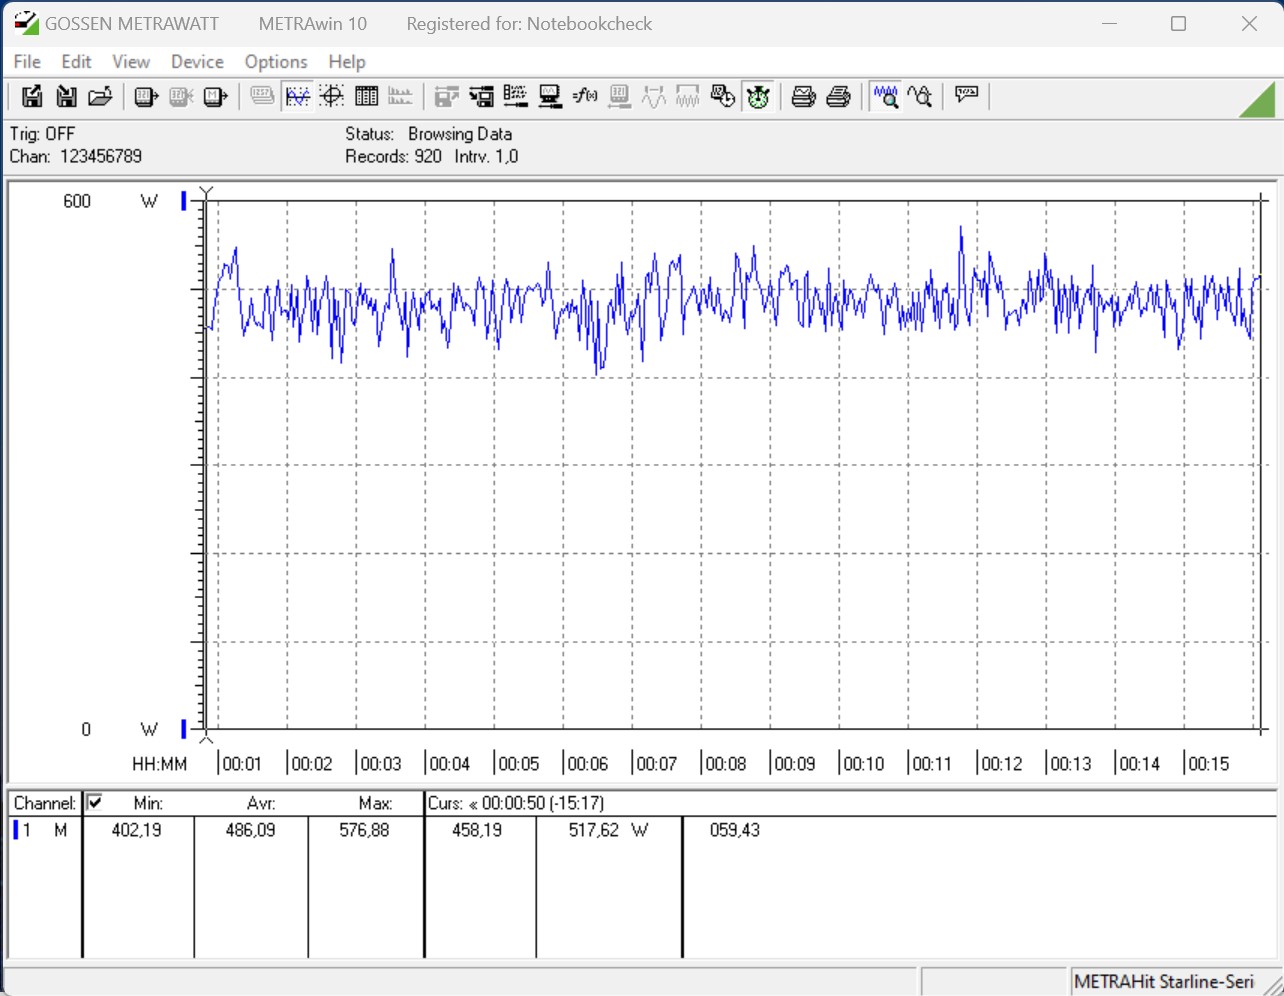
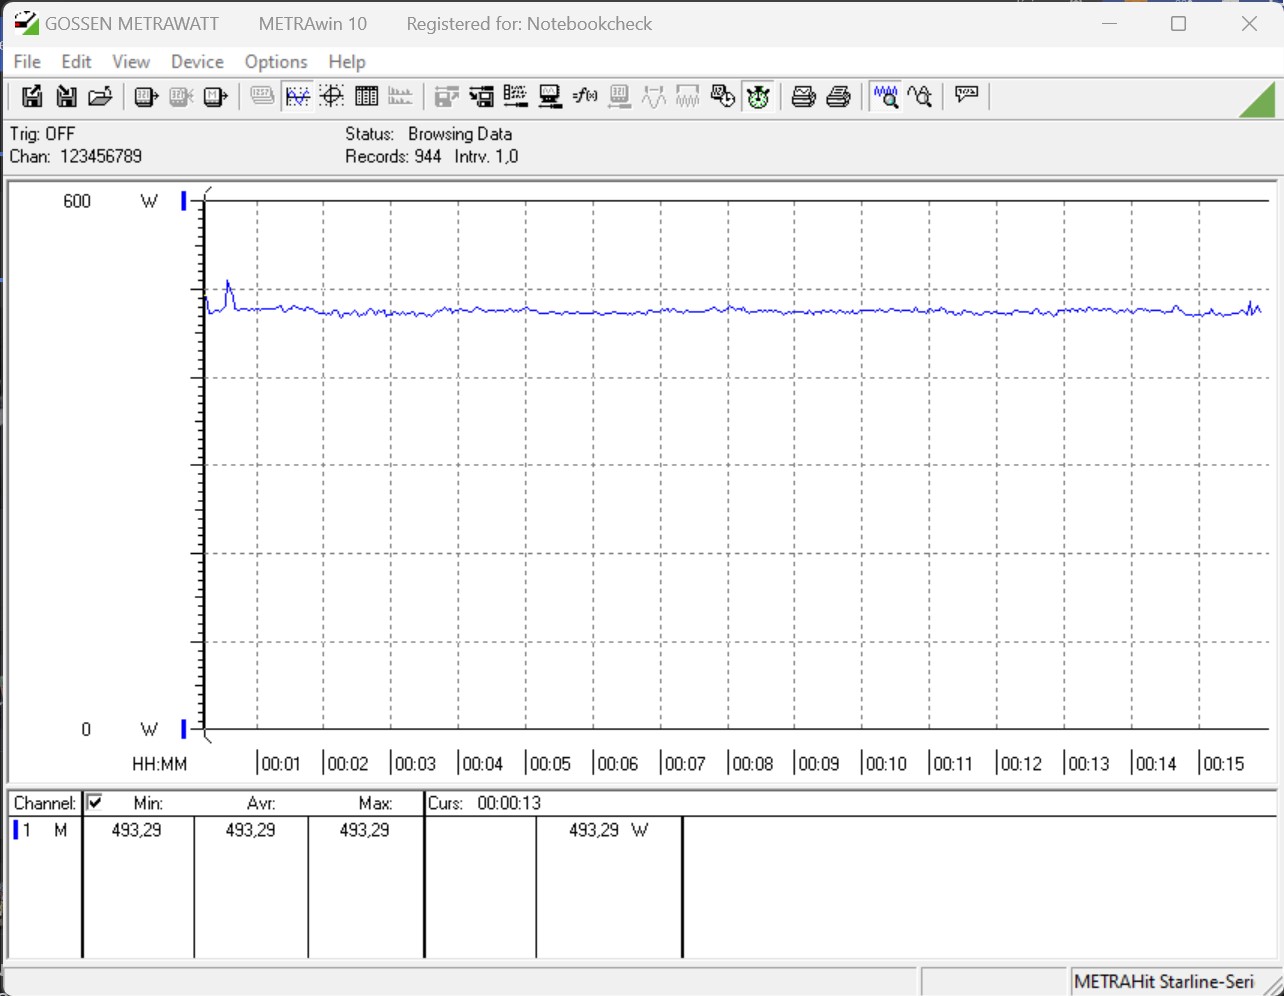
Consommation d'énergie
Selon les spécifications techniques du processeur Intel Core i5-13400F, la consommation d'énergie est de 65 watts et peut atteindre jusqu'à 148 watts en charge. Si les restrictions de la consommation d'énergie du processeur ne sont pas limitées dans le BIOS, les 148 watts sont activés en permanence et ne sont pas limités temporellement par la valeur de rosée. Tous les tests que nous avons effectués avec le processeur ont été réalisés sans aucune restriction. Nous enregistrons la consommation d'énergie du système de test avec seulement 184 watts dans le multi-test Cinebench R15. Ainsi, l'Intel Core i5-13400F est considérablement plus frugal qu'un Intel Core i5-12600K, qui nécessite un peu moins de 206 watts dans notre test. Nous notons un peu plus avec 214 watts dans le test de stress. Néanmoins, la consommation d'énergie est agréablement faible.
En raison de sa faible consommation d'énergie, l'Intel Core i5-13400F n'a pas besoin de beaucoup de refroidissement. Ainsi, vous pouvez sans crainte vous passer d'un AiO et un refroidisseur à air de haute qualité est tout à fait suffisant pour ce CPU.
| Power Consumption / Cinebench R15 Multi (external Monitor) | |
| Intel Core i9-13900K | |
| Intel Core i9-12900K (Idle: 70.5 W) | |
| AMD Ryzen 9 7900X | |
| Intel Core i5-13600K | |
| AMD Ryzen 9 5900X (Idle: 78.1 W) | |
| AMD Ryzen 9 5950X (Idle: 78 W) | |
| AMD Ryzen 5 7600X | |
| Intel Core i5-12600K (Idle: 70.45 W) | |
| Intel Core i5-13400F | |
| AMD Ryzen 5 5600X (Idle: 79.23 W) | |
| Power Consumption / Prime95 V2810 Stress (external Monitor) | |
| Intel Core i9-13900K | |
| Intel Core i5-13600K | |
| AMD Ryzen 9 7900X | |
| Intel Core i9-12900K (Idle: 70.5 W) | |
| Intel Core i5-12600K (Idle: 70.45 W) | |
| AMD Ryzen 9 5950X (Idle: 78 W) | |
| AMD Ryzen 9 5900X (Idle: 78.1 W) | |
| AMD Ryzen 5 7600X | |
| Intel Core i5-13400F | |
| AMD Ryzen 5 5600X (Idle: 79.23 W) | |
| Power Consumption / The Witcher 3 ultra (external Monitor) | |
| AMD Ryzen 9 7900X | |
| Intel Core i9-13900K | |
| AMD Ryzen 5 7600X | |
| Intel Core i5-13600K | |
| Intel Core i5-13400F | |
| Nvidia GeForce RTX 3090 Founders Edition (Idle: 91.1 W) | |
| Intel Core i9-12900K (Idle: 70.5 W) | |
| AMD Ryzen 9 5950X (Idle: 78 W) | |
| AMD Ryzen 9 5900X (Idle: 78.1 W) | |
| AMD Ryzen 5 5600X (Idle: 79.23 W) | |
| Intel Core i5-12600K (Idle: 70.45 W) | |
* ... Moindre est la valeur, meilleures sont les performances
Power Consumption With External Monitor
Points positifs
Points négatifs
Conclusion - Économique, rapide et facile à refroidir


Intel a déjà envoyé un vénérable successeur de la génération Alder Lake dans la course avec Raptor Lake. Les modèles de milieu et d'entrée de gamme sur la même base arrivent maintenant progressivement. Néanmoins, il faut regarder de plus près et faire attention à l'étagement du processeur car il ne s'agit pas toujours d'un processeur Raptor Lake. Dans notre cas, nous avons l'Intel Core i5-13400F en C0-stepping, ce qui indique qu'il s'agit d'un CPU Alder Lake à la base. Seul le pas B0 indique un processeur Raptor Lake natif. Les deux versions sont censées être disponibles, et nous supposons qu'elles sont aussi performantes l'une que l'autre.
Pendant ce temps, Intel offre un 10-core frugal avec l'Intel Core i5-13400F, qui a également 4 E-cores en plus des P-cores. Avec une puissance maximale de 148 watts, ce modèle est relativement frugal à pleine charge. En outre, les températures sont faciles à gérer et ne nécessitent pas de refroidissement complexe et coûteux. Dans le test, l'Intel Core i5-13400F tient très bien la distance avec un Intel Core i5-12600K, le match en termes d'efficacité énergétique est clairement en faveur du modèle le plus frugal. Les processeurs Zen 4 d'AMD ne sont pas à la hauteur. Ici, le 10-core natif de notre test se classe plutôt avec un AMD Ryzen 7 5800X, qui dispose également d'un total de 16 threads.
L'Intel Core i5-13400F offre des performances solides pour l'utilisation quotidienne et maîtrise également les jeux les plus récents. En raison de son faible TDP, le processeur frugal peut également être refroidi sans problème dans les petits boîtiers.
Une carte mère avec un chipset de la série 600 peut toujours être utilisée pour l'unité de base. Cela ne met pas trop de pression sur le porte-monnaie lors de la mise à niveau. Néanmoins, il faut tenir compte du fait qu'il n'y aura plus de nouvelle génération d'Intel pour le socket 1700. Selon les rumeurs actuelles, le socket 1851 sera introduit avec Meteor Lake. Cela signifie qu'une nouvelle carte mère sera à nouveau obligatoire.
Prix et disponibilité
L'Intel Core i5-13400F est actuellement disponible pour 227 Euros (~$247) chez Notebooksbilliger.de. Pour 260 Euro(~$283) vous pouvez l'acheter avec une unité graphique intégrée, également sur Notebooksbilliger.de.
