Test de l'Acer Predator Orion 3000 avec Core i7-12700F et RTX 3070
")
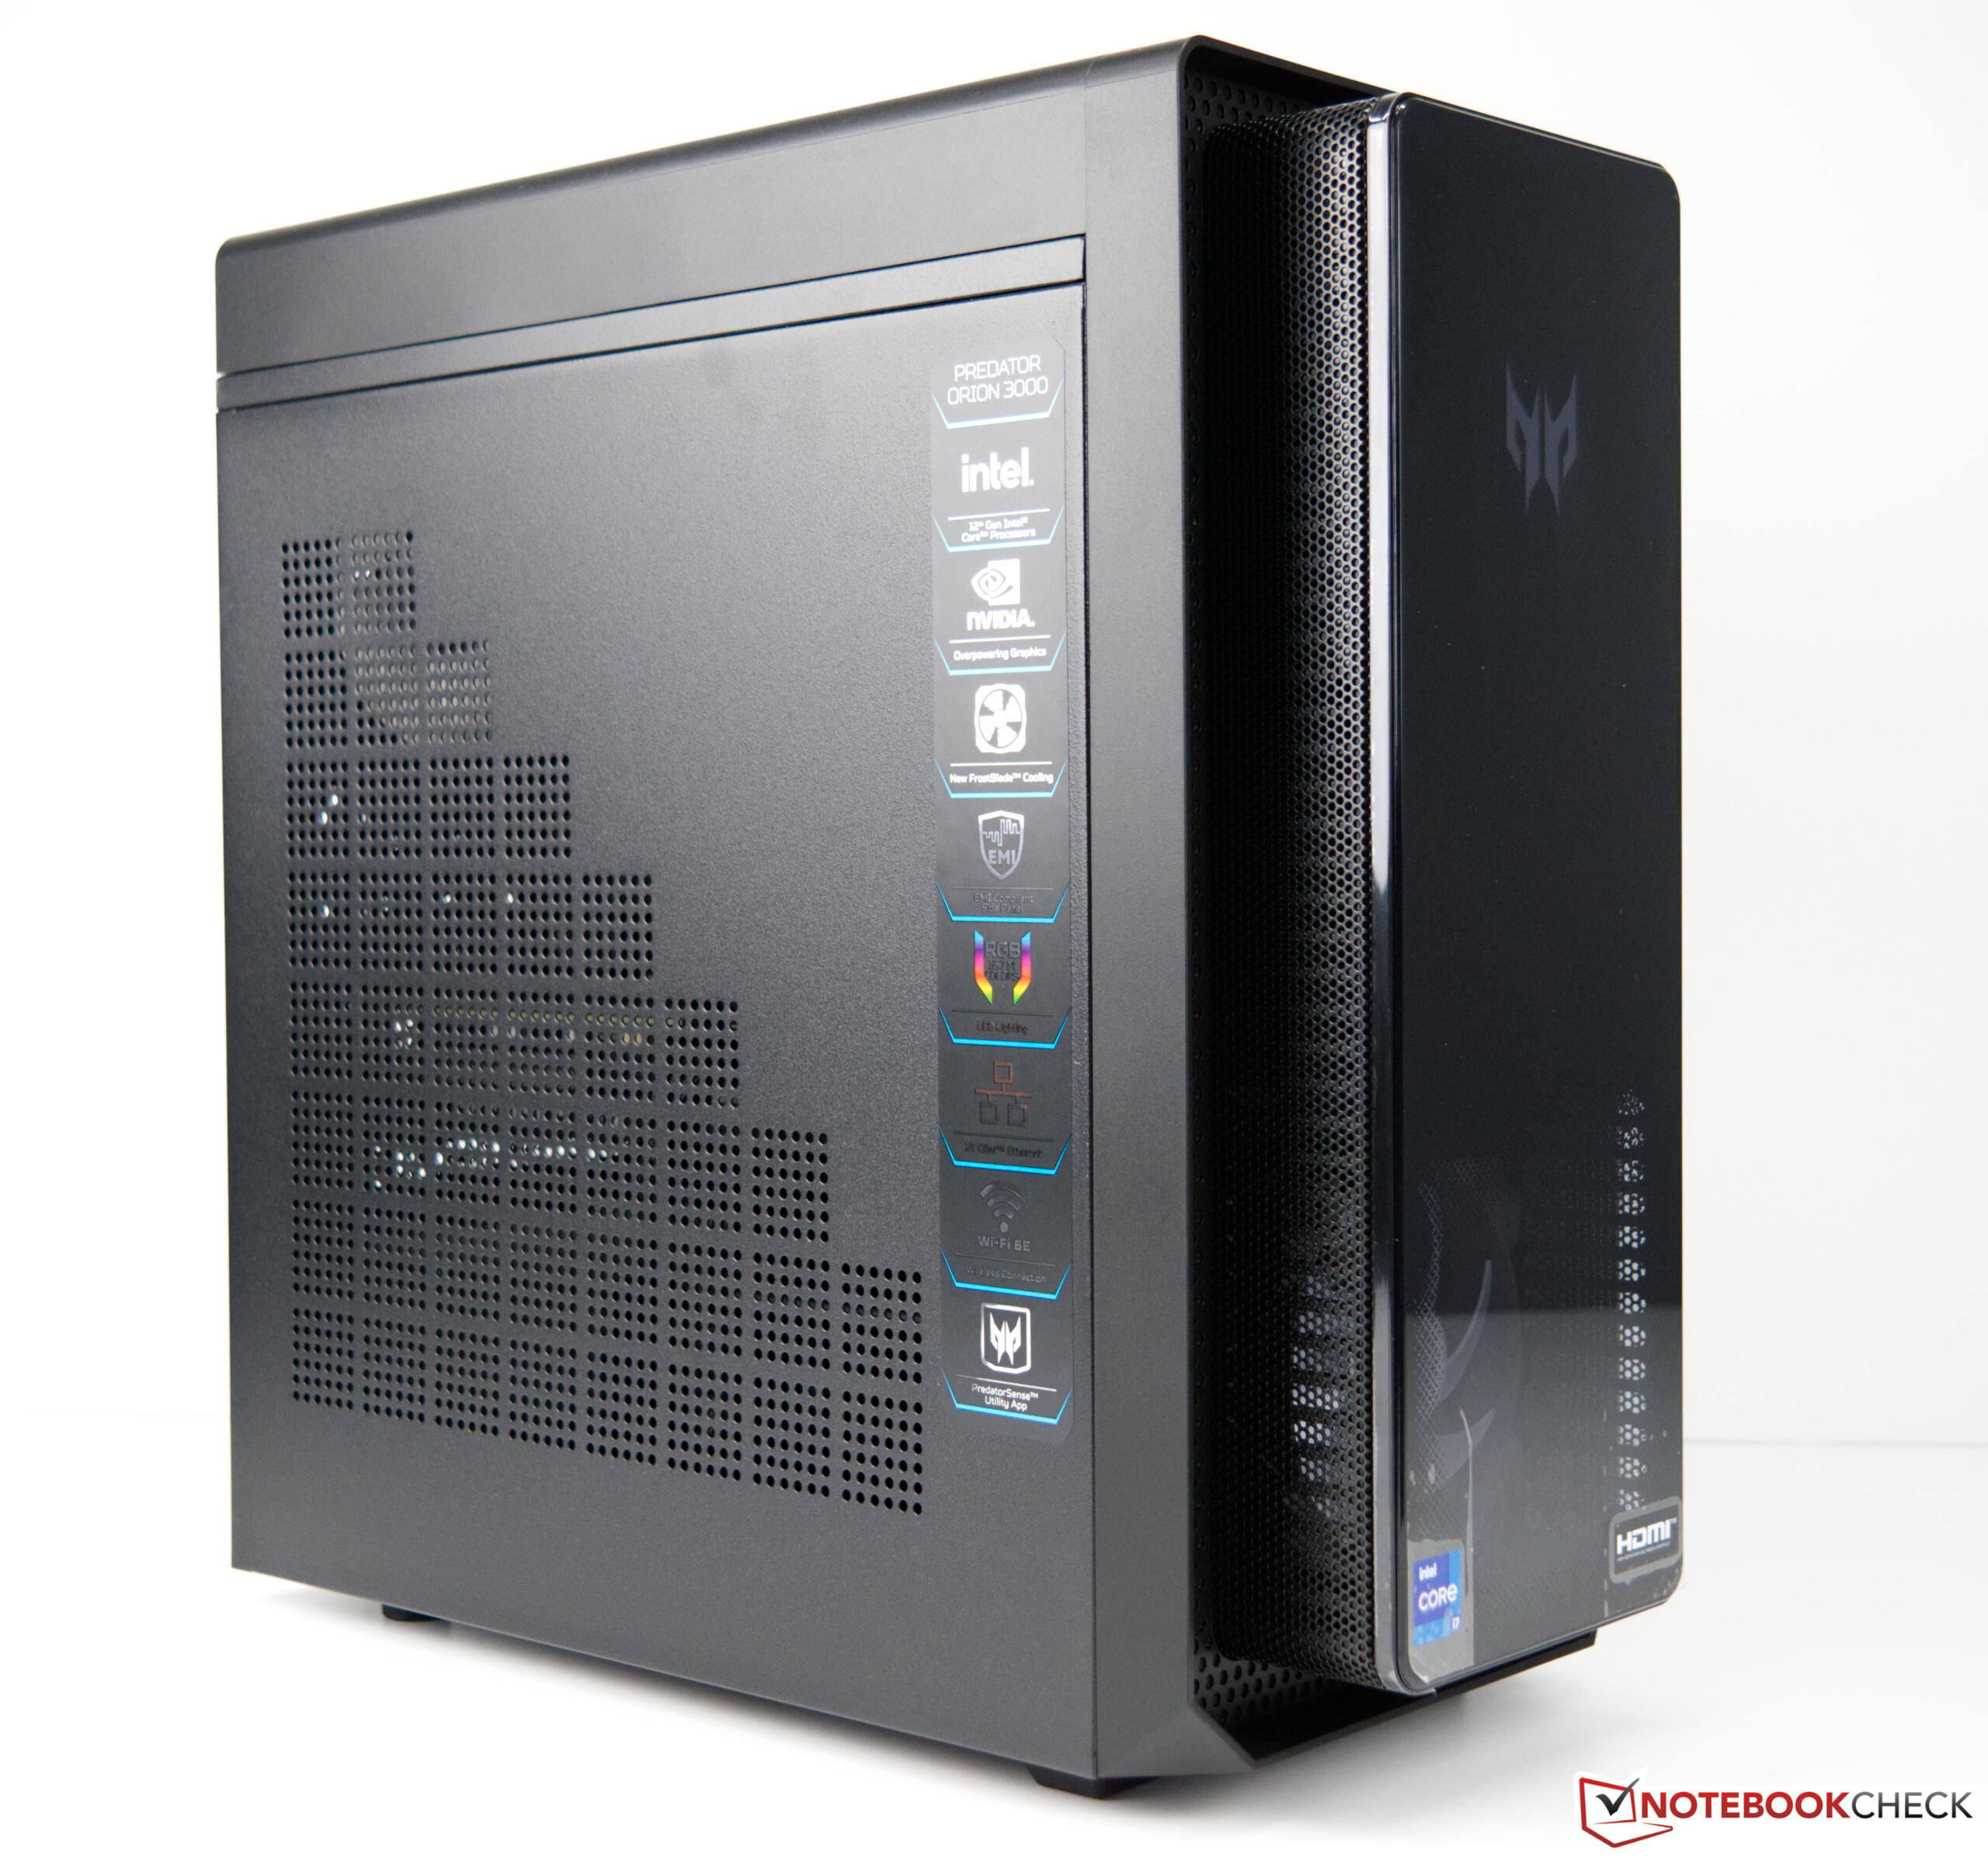
La série Predator d'Acer existe depuis de nombreuses années et s'adresse principalement aux joueurs. Il existe différents modèles portant cette appellation, tant pour les ordinateurs portables que pour les ordinateurs de bureau. Avec l'actuel Predator Orion 3000, le fabricant ne se contente pas de mettre à jour le produit mais utilise également un nouveau boîtier par rapport à l'ancienne génération.
Un Intel Core i7-12700 ou un Intel Core i7-12700F est toujours utilisé comme base (Intel Core i7-12700F dans notre échantillon). Cependant, il existe différents modèles en termes de configuration GPU, bien que laGeForce RTX 3070est le modèle de pointe de cette série. En ce qui concerne la mémoire de travail, la RAM DDR4 est toujours utilisée. Néanmoins, vous pouvez choisir entre 16 Go ou 32 Go en fonction de votre budget. Il en va de même pour le stockage, qui est le minimum dans notre système avec 1 To qu'Acer propose dans l'actuel Predator Orion 3000.
Comparaison avec les concurrents potentiels
Note | Date | Modèle | Poids | Épaisseur | Prix |
|---|---|---|---|---|---|
v7 (old) | 09/22 | Acer Predator Orion 3000 PO3-640 i7-12700F, GeForce RTX 3070 | 7.4 kg | 377 mm | |
v (old) | 12/21 | Intel Beast Canyon NUC i9-11900KB, GeForce RTX 3060 | 189 mm | ||
v (old) | 06/21 | Zotac Magnus One (ECM73070C) i7-10700, GeForce RTX 3070 | |||
v (old) | 05/22 | Zotac ZBOX Magnus EN173070C i7-11800H, GeForce RTX 3070 Laptop GPU | 1.8 kg | 62.2 mm | |
v (old) | 04/22 | Intel Dragon Canyon NUC - RTX 3060 i9-12900, GeForce RTX 3060 | 189 mm | ||
v (old) | 08/20 | Zotac MEK Mini (RTX 2070 Super) i7-9700, GeForce RTX 2070 Super (Desktop) |
Acer Predator Orion 3000 PO3-640 en détail
Cas
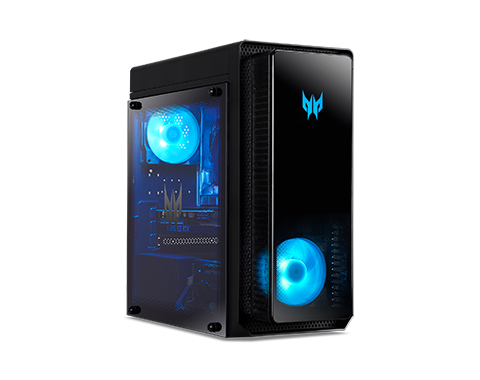
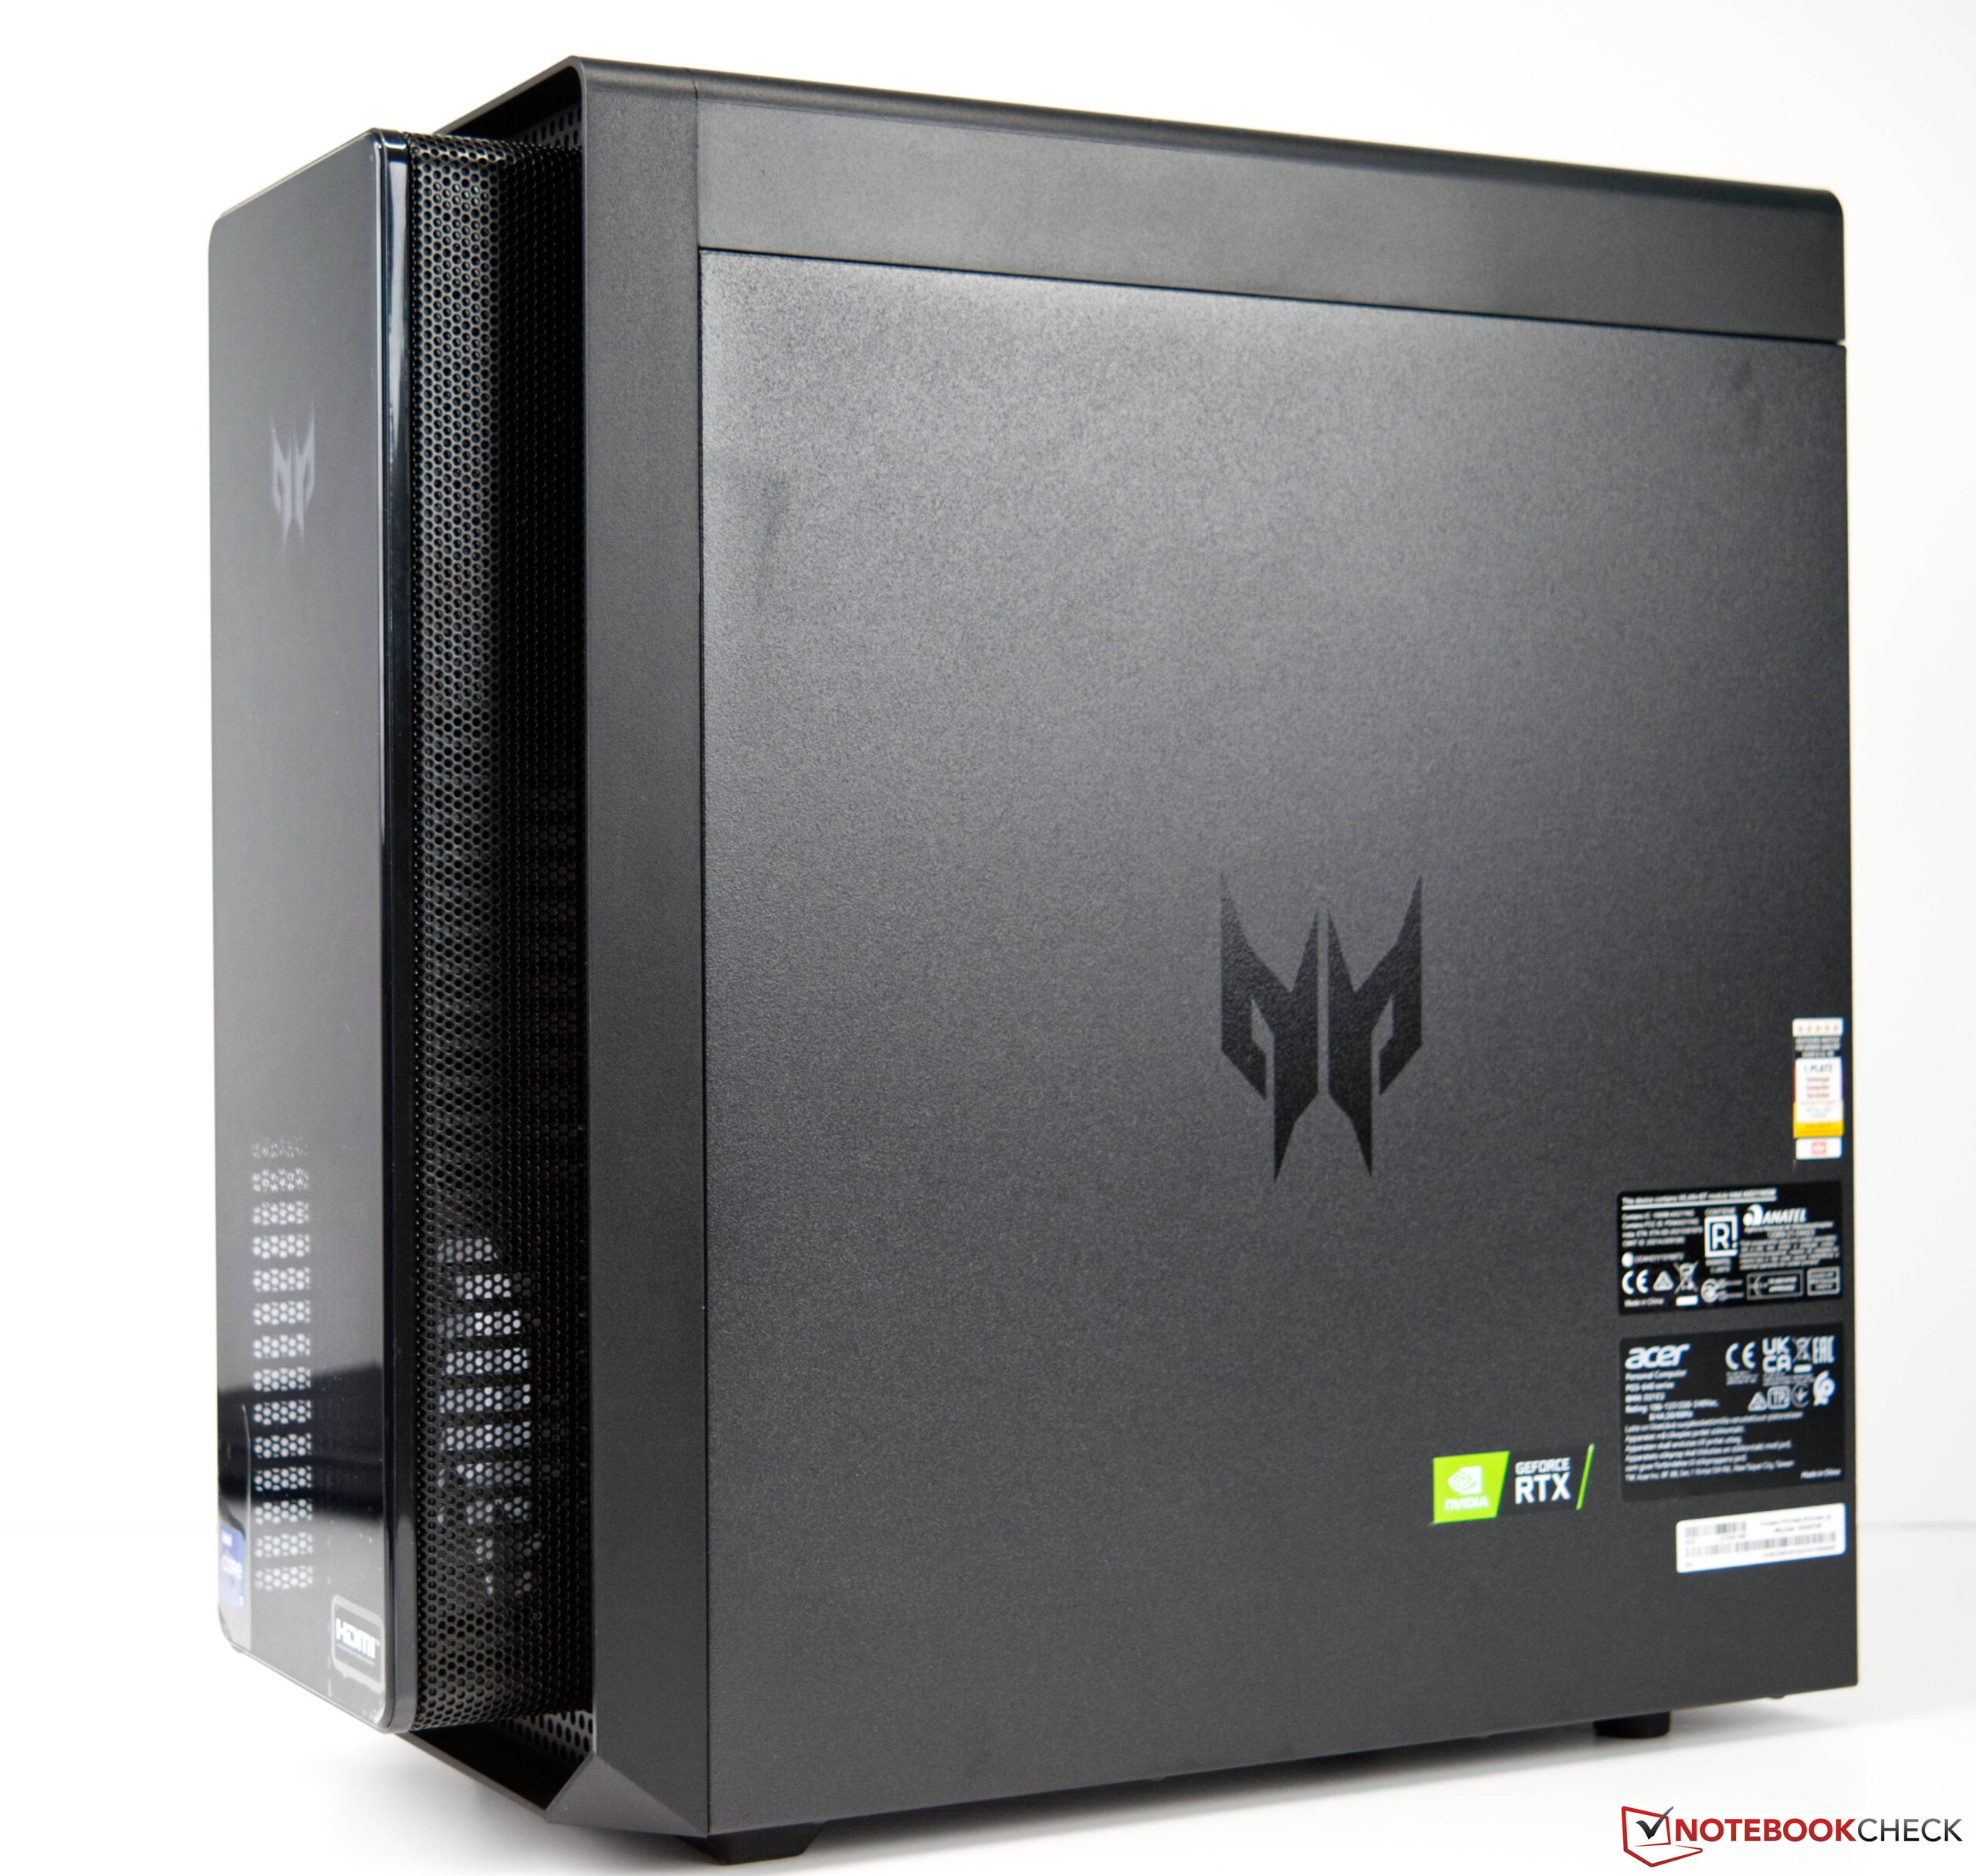
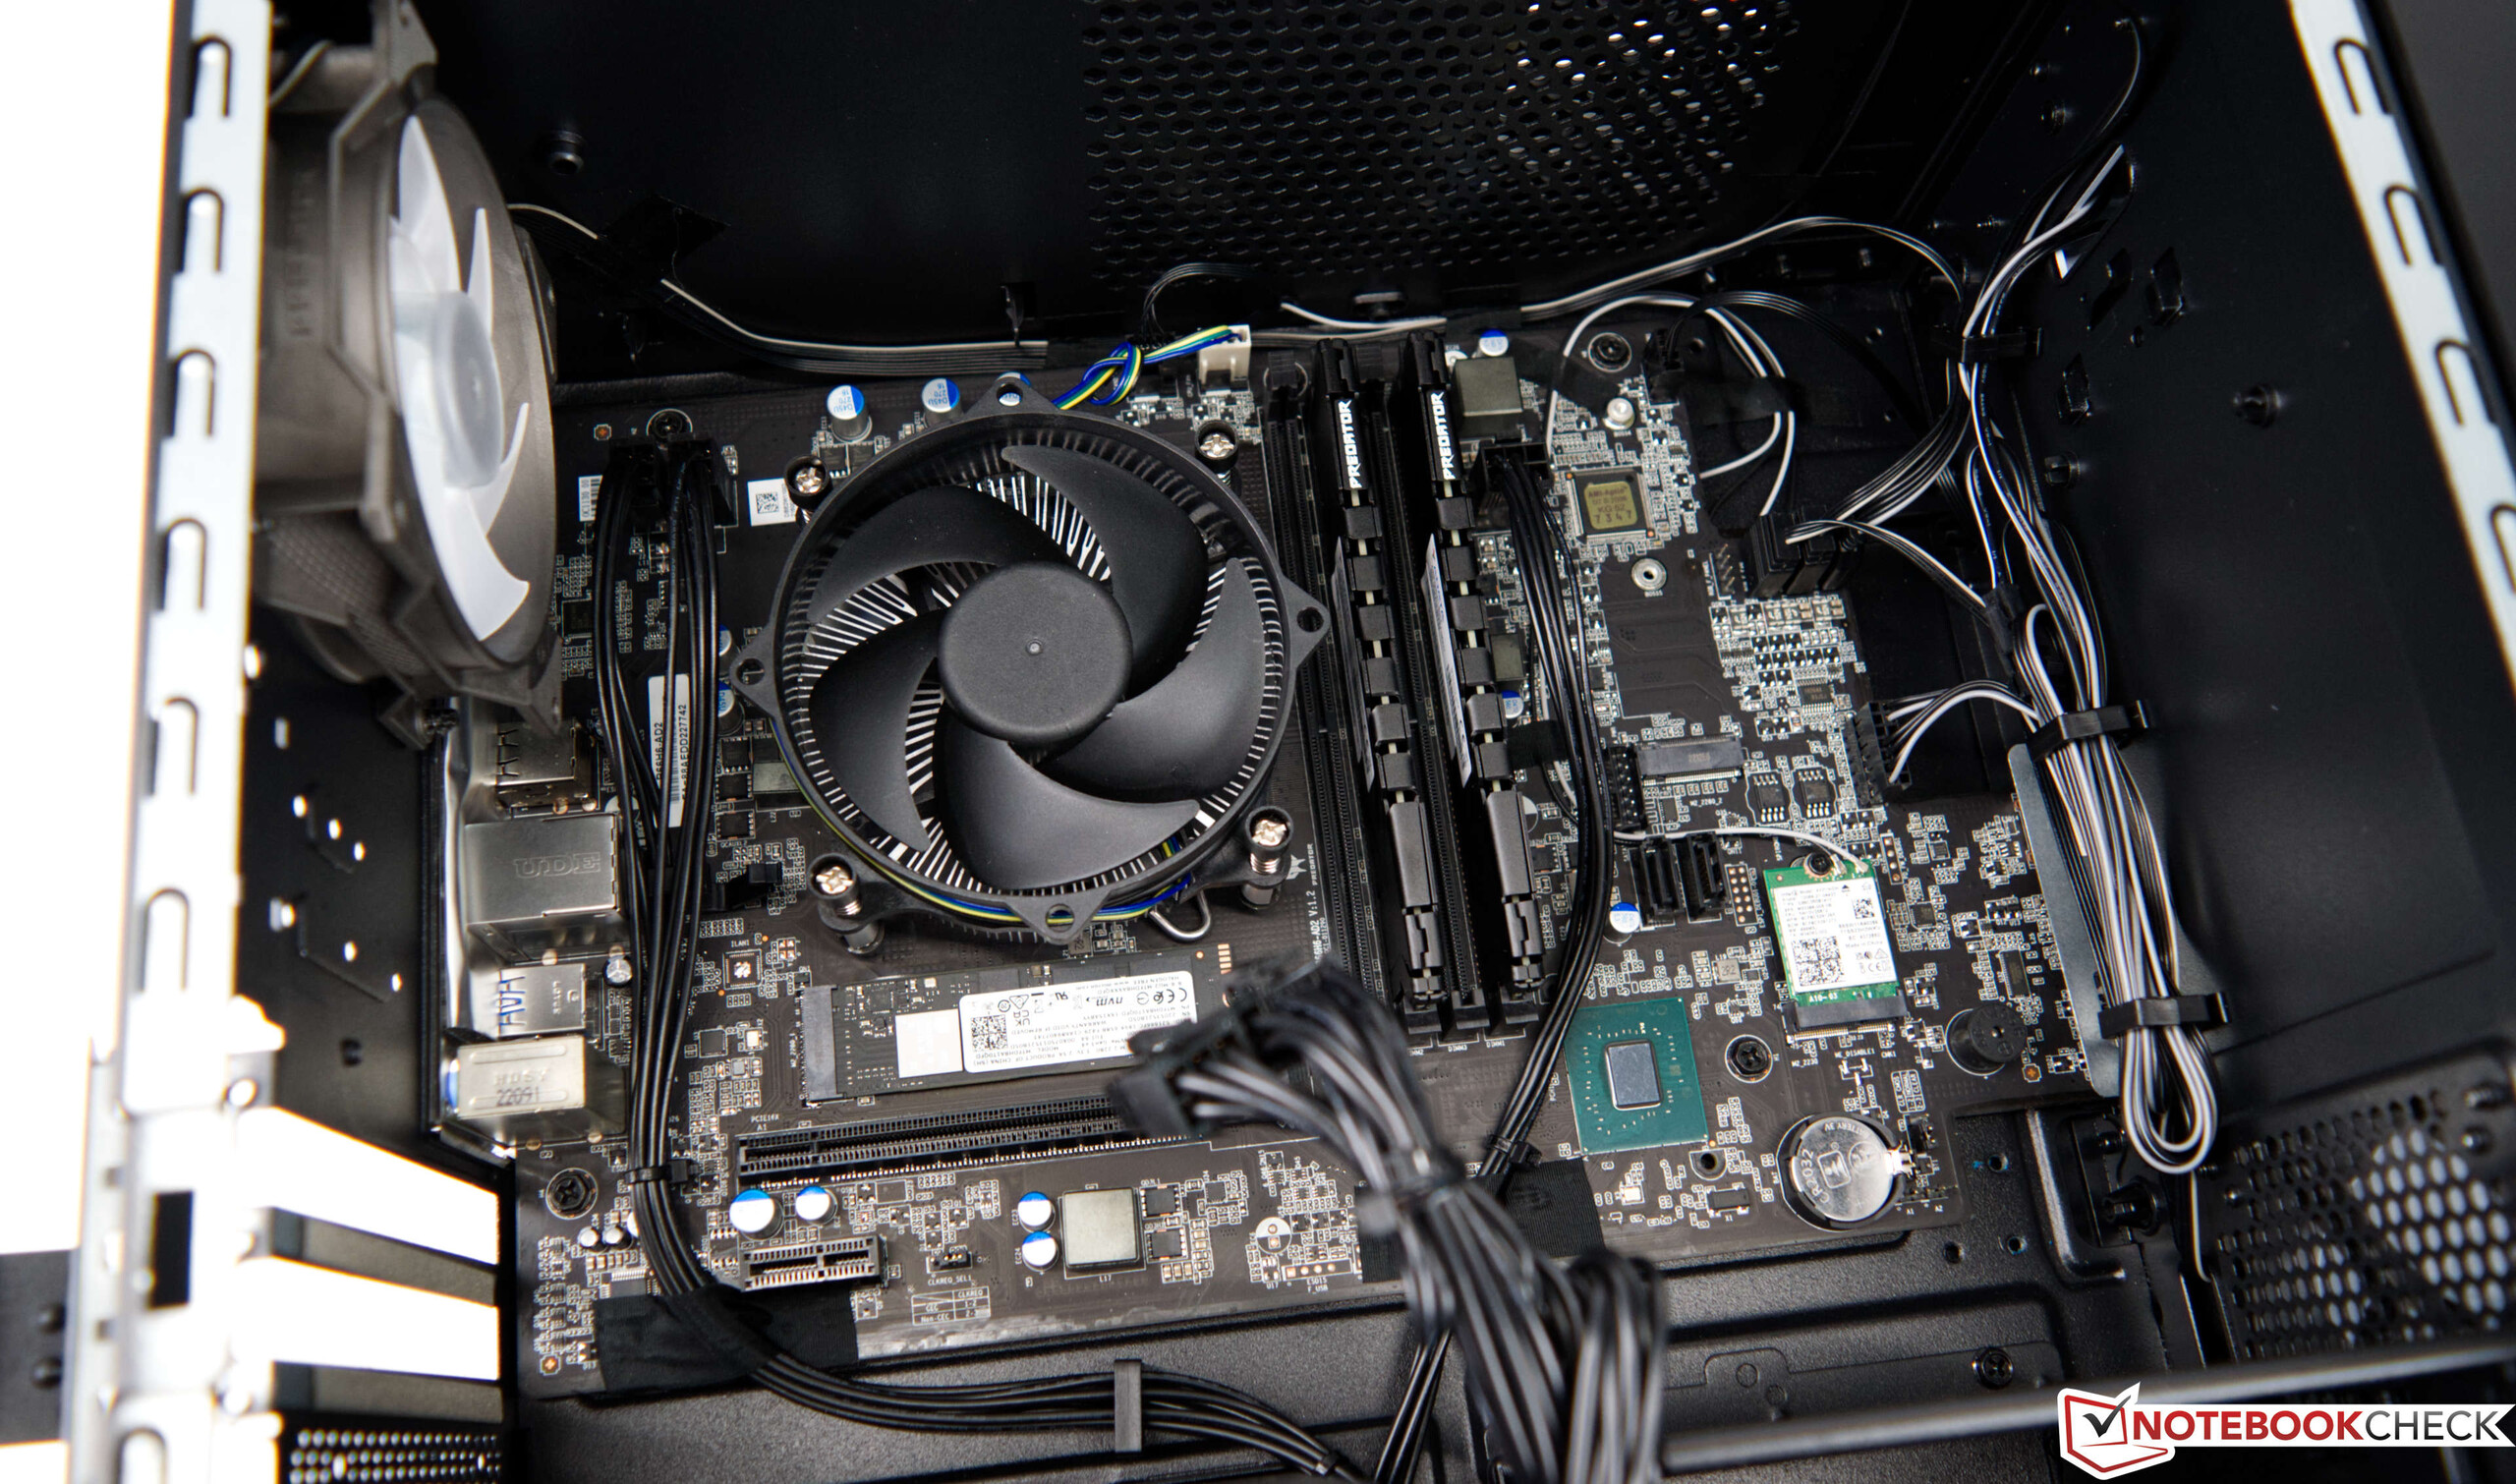
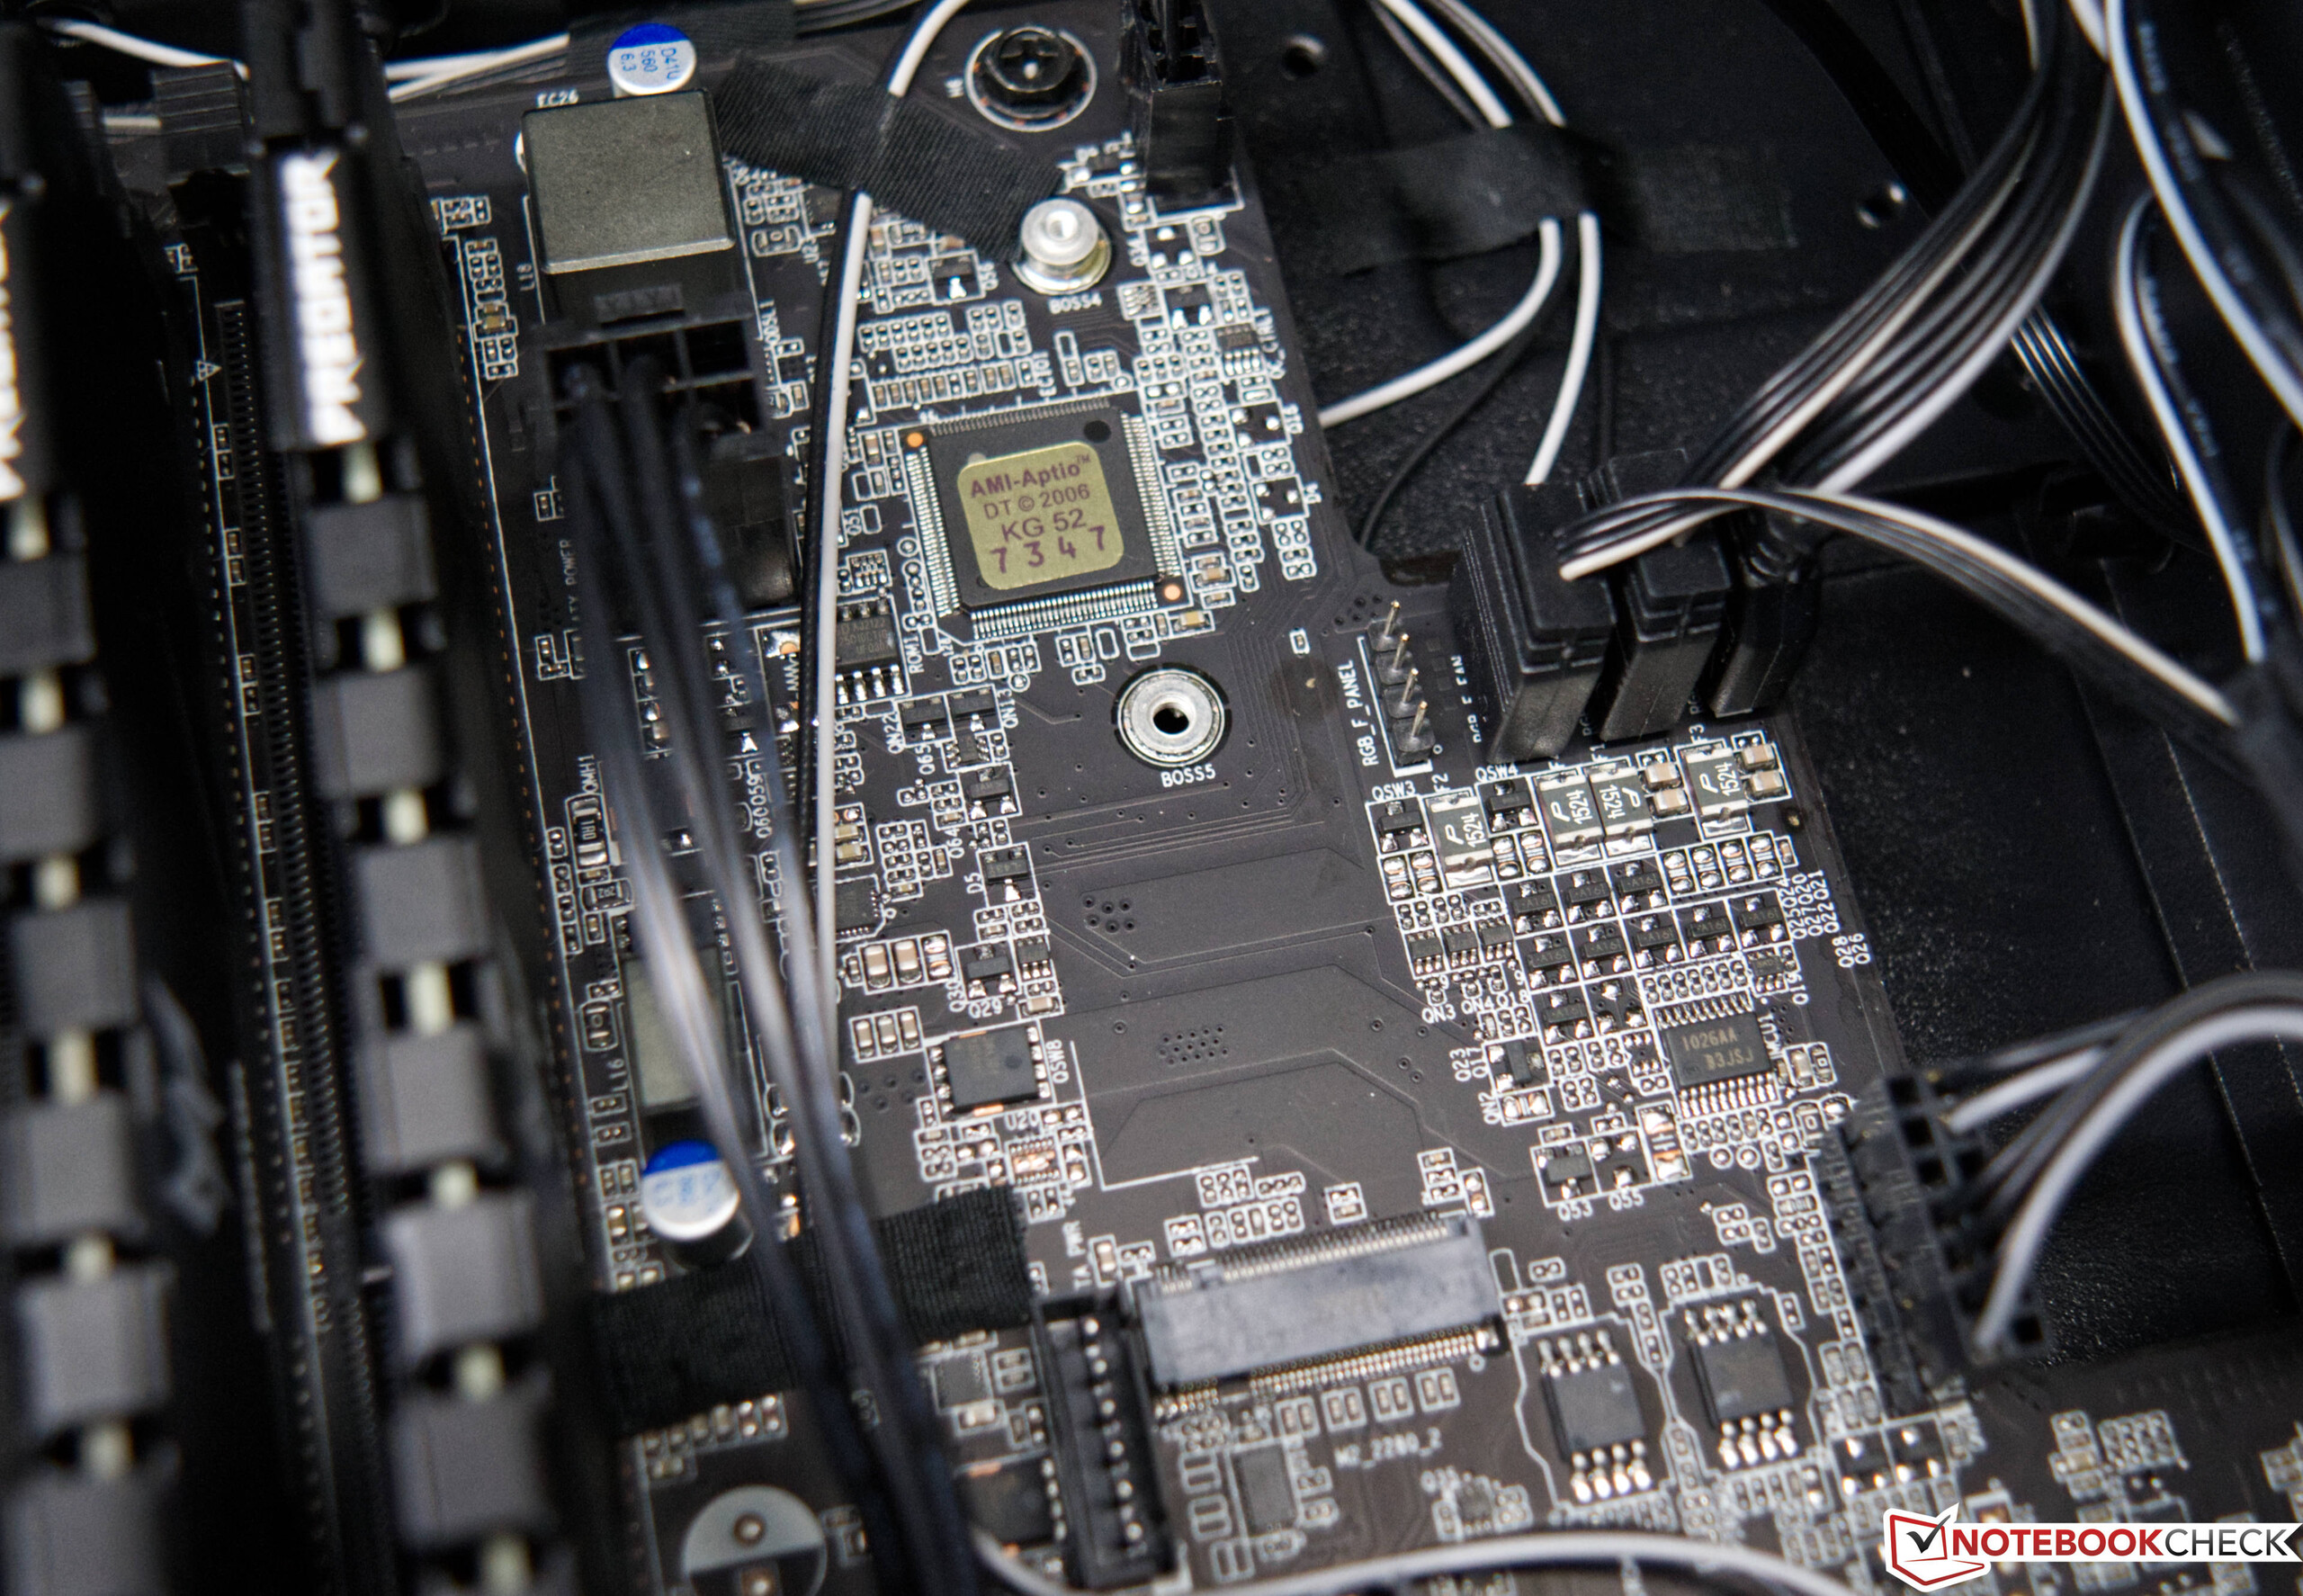
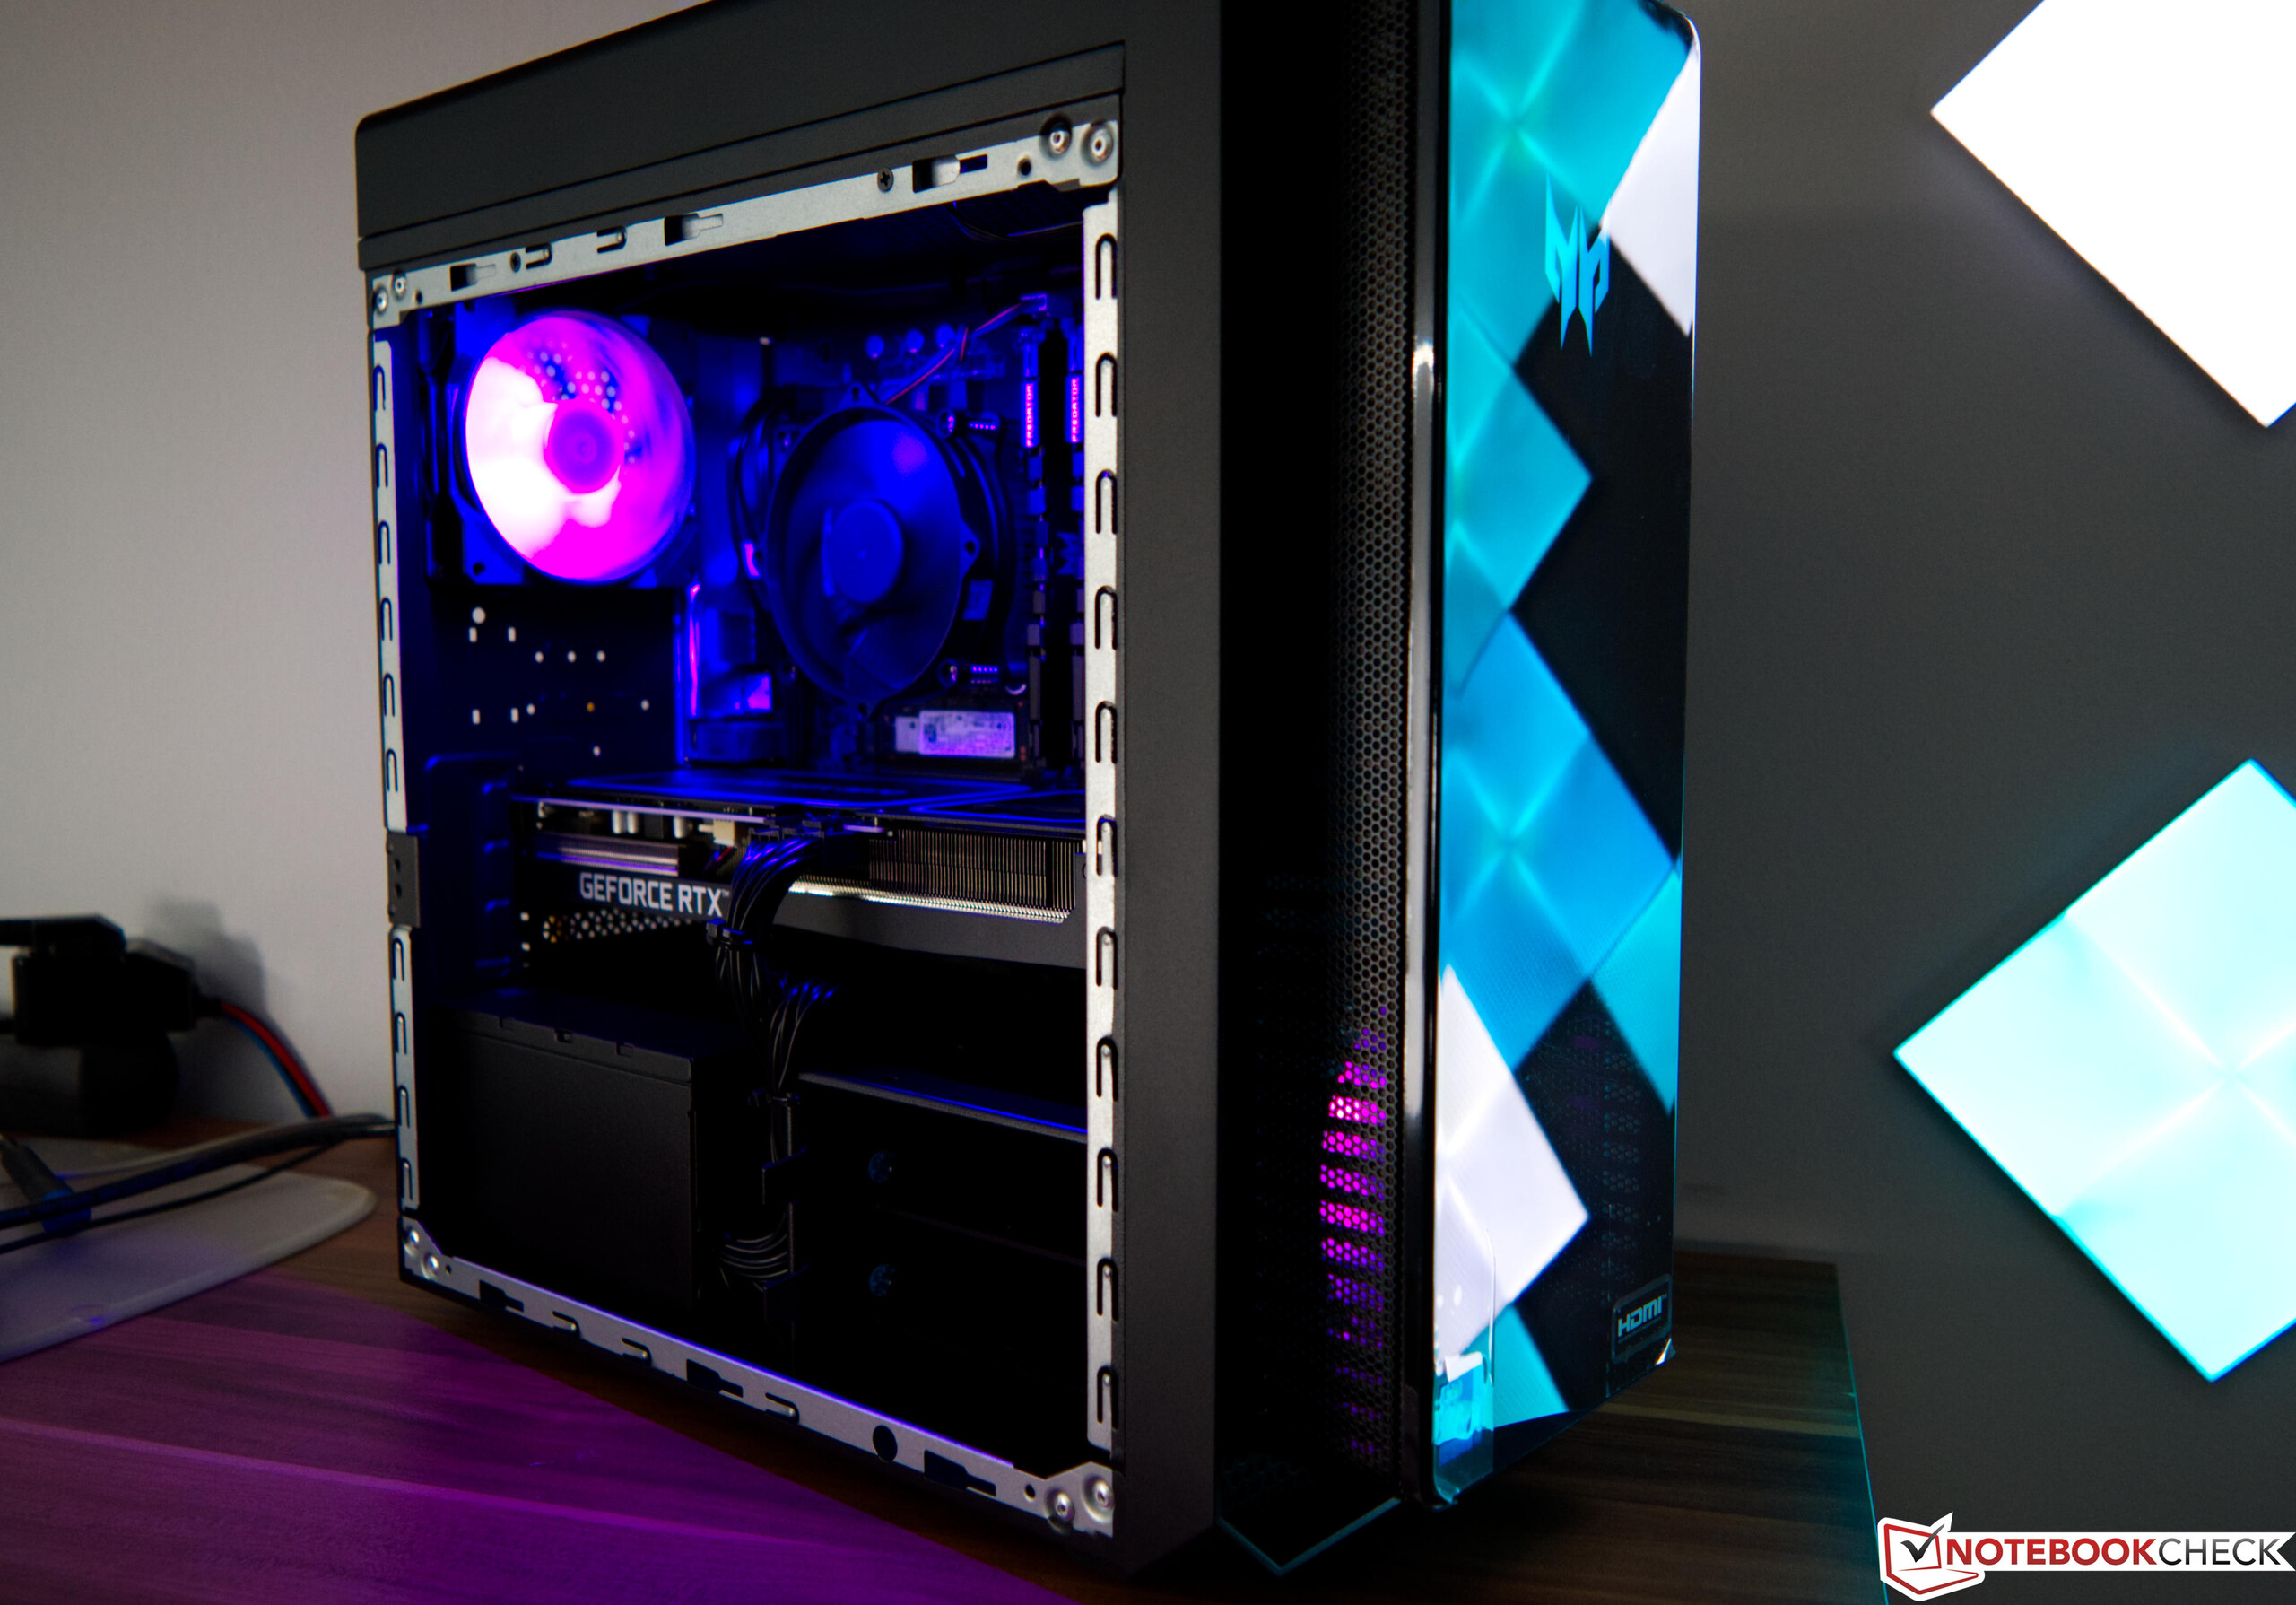
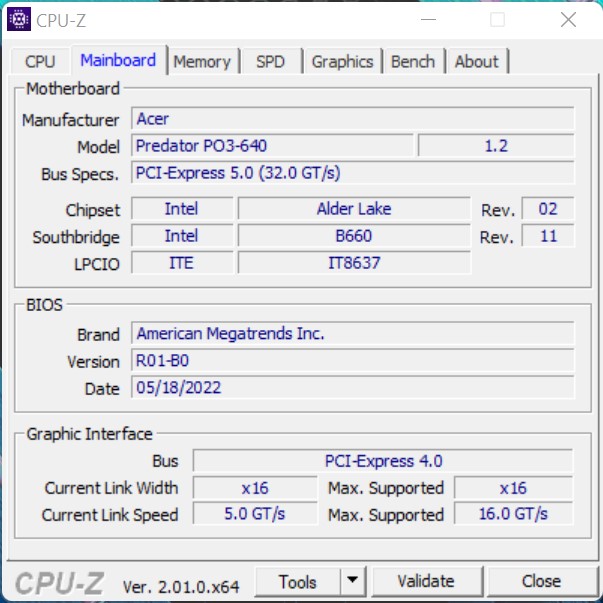
Le boîtier de l'Acer Predator Orion 3000 PO3-640 ressemble à première vue à un boîtier ATX standard. Cependant, le fabricant s'écarte ici de la norme car les connecteurs frontaux sont situés directement sur la carte mère et ne sont pas reliés à la carte mère par un câble. Avec de telles constructions, le remplacement de la carte mère est presque impossible. Cependant, d'autres fabricants vont dans le même sens et installent des cartes mères propriétaires dans des boîtiers propriétaires. Le boîtier est bien fabriqué, bien que son aspect soit vraiment une question de goût. La livraison comprend également un panneau latéral avec une fenêtre de visualisation pour mieux mettre en valeur les composants installés. Cependant, en raison du flux d'air déjà très limité, nous nous sommes abstenus d'utiliser le panneau latéral optiquement chic pendant le test. Au moins le couvercle métallique offre-t-il quelques trous pour aspirer l'air frais.
Équipement
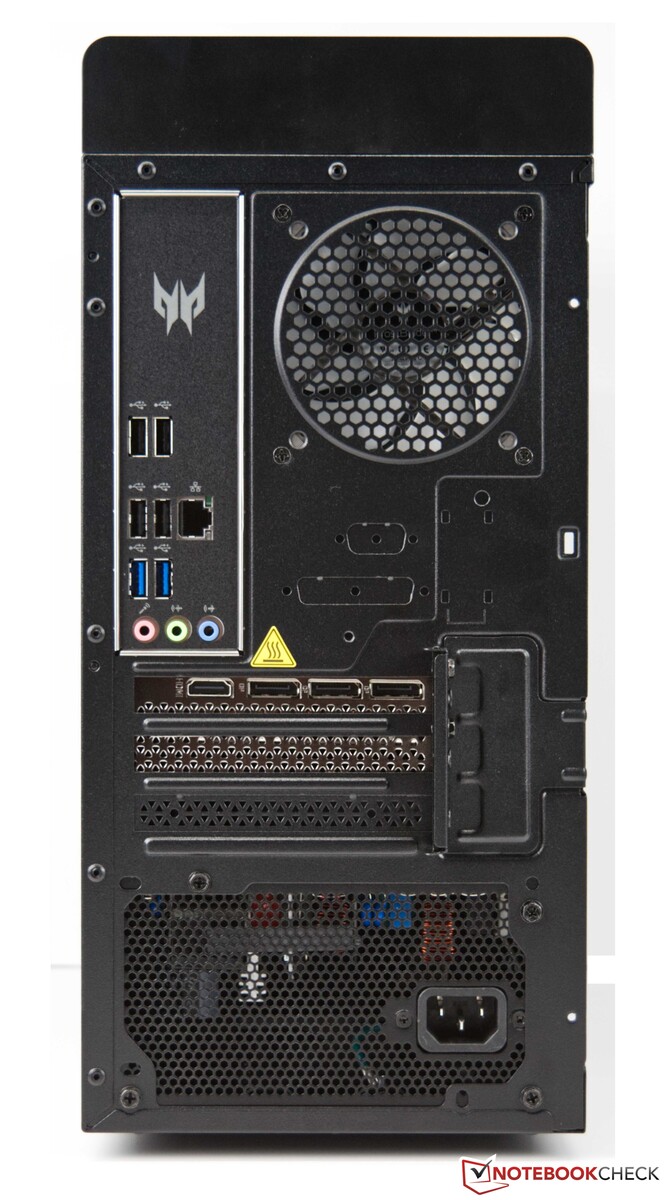
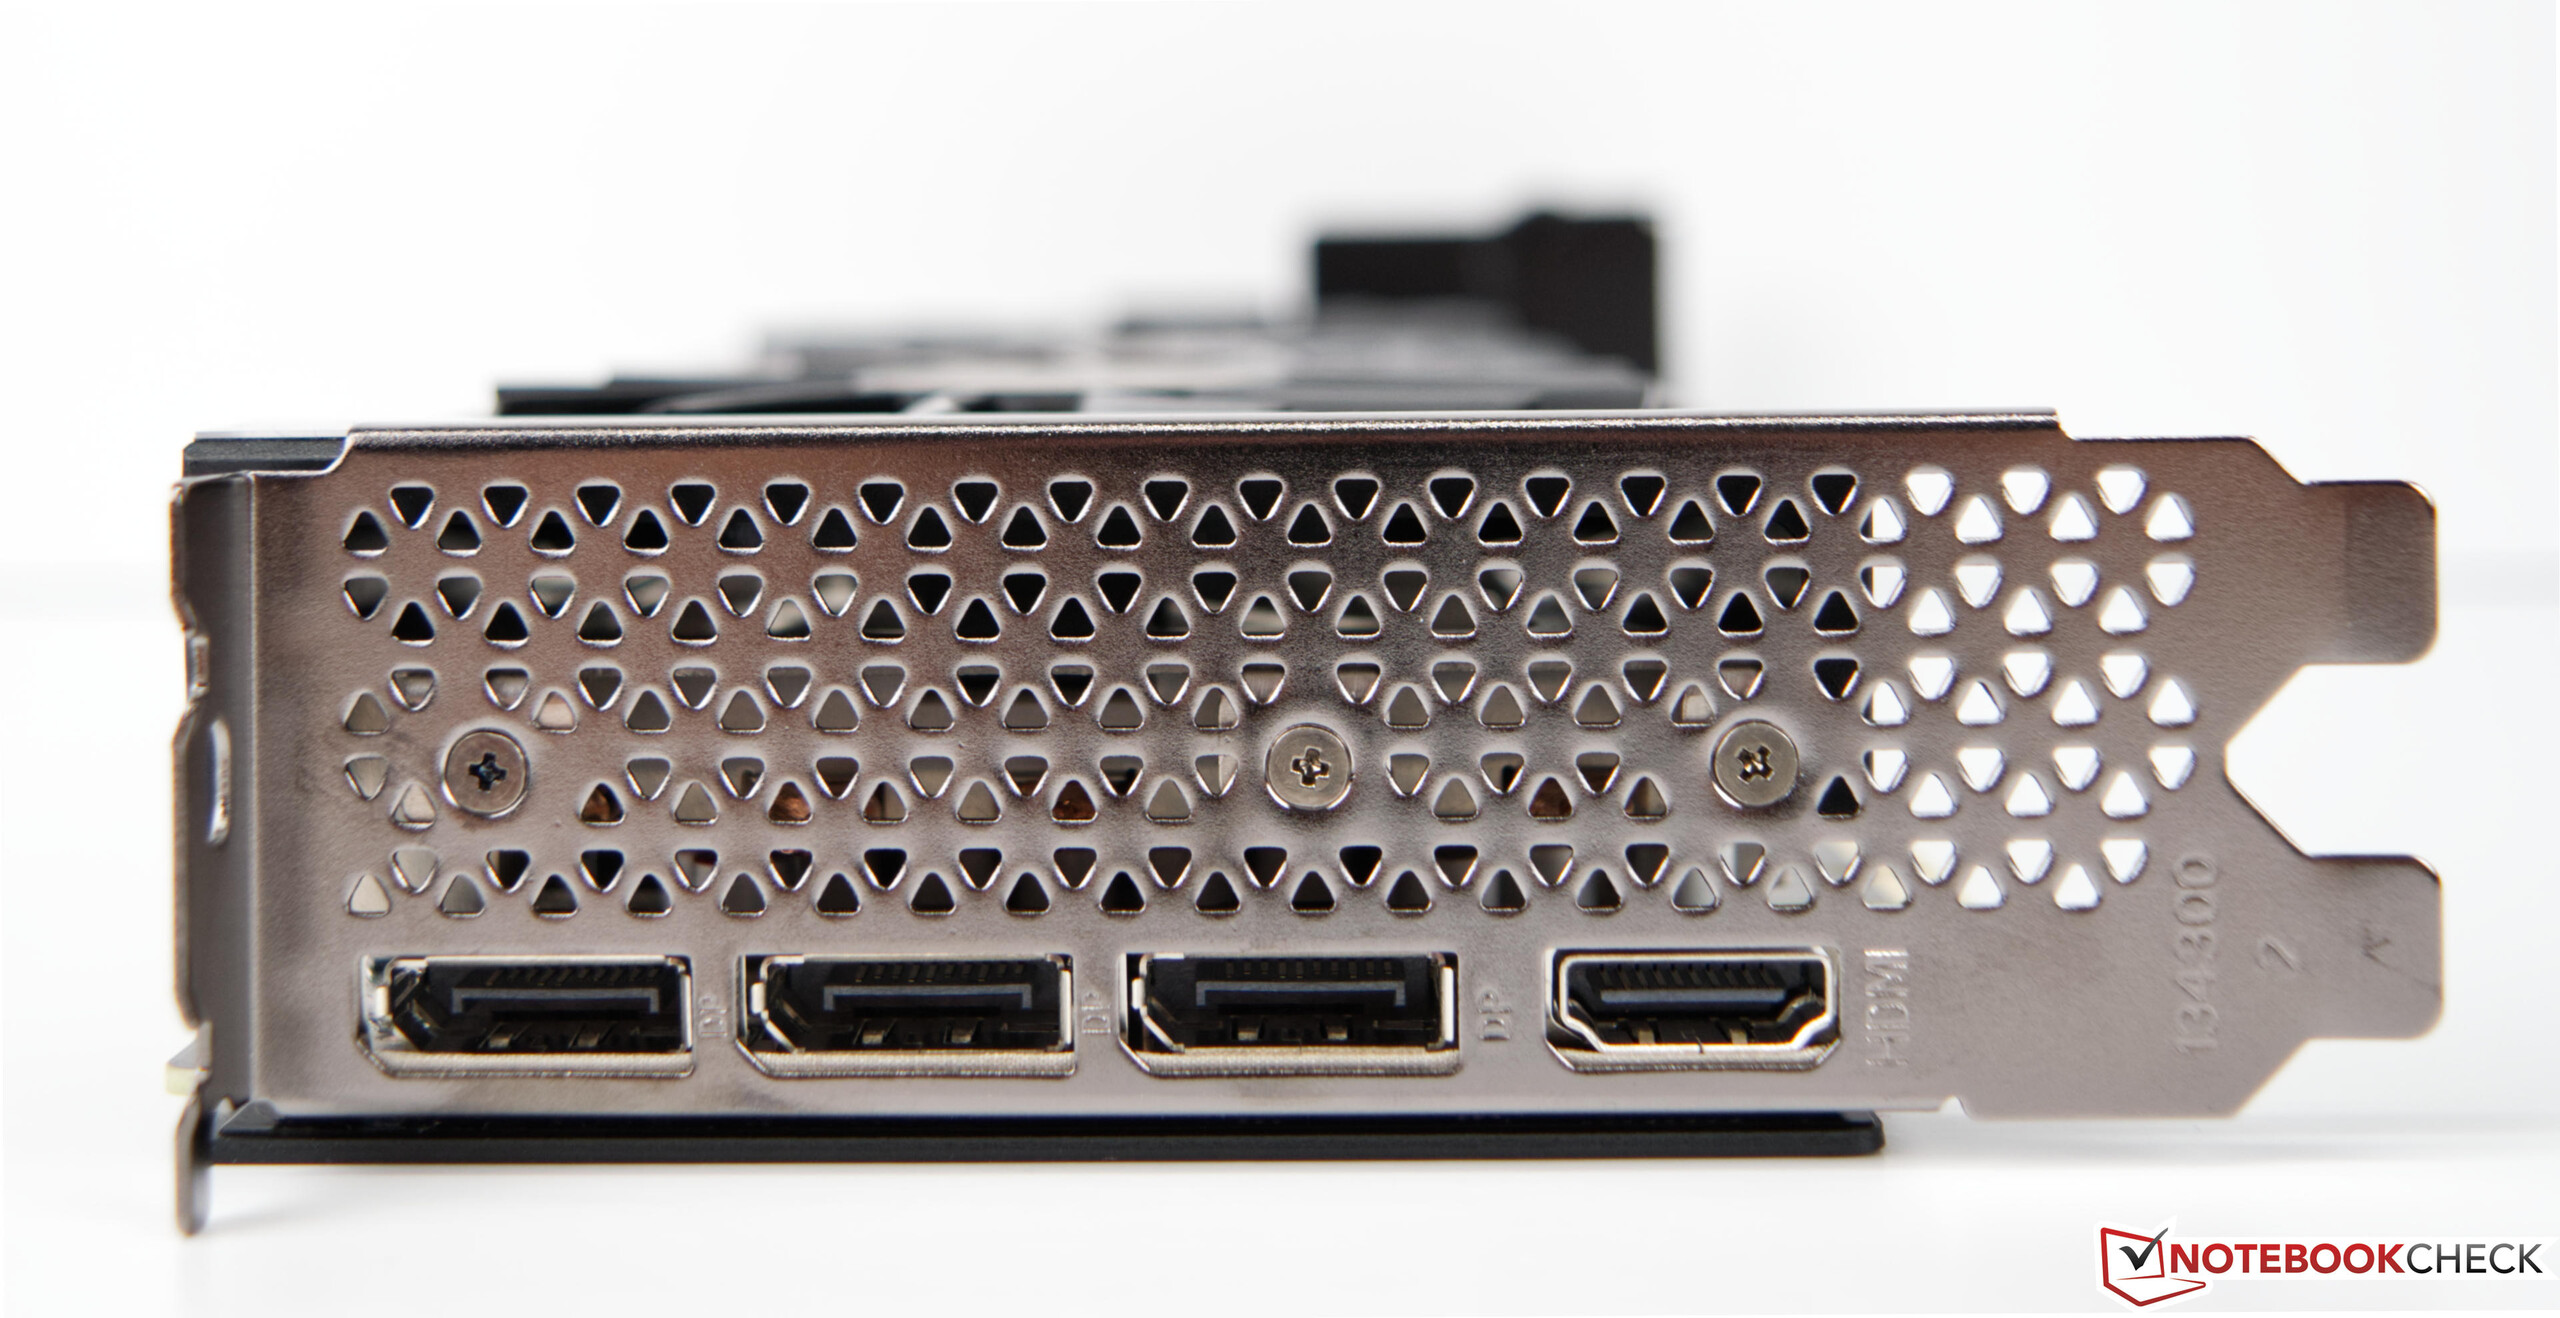
Il n'y a pas grand-chose à critiquer dans le choix de l'interface. Il y a un total de 8 ports USB, qui sont divisés en 7 TypeA et 1x Type-C. Le GPU offre 3x DisplayPort et HDMI en standard. Cependant, il n'y a que le Gigabit LAN comme interface réseau. Nous aurions souhaité un port LAN 2,5G ou 5G plus rapide. Il n'y a pas non plus de lecteur de carte SD. La répartition des ports est typique pour une classe d'appareil. Il n'est donc pas surprenant que la plupart des interfaces se trouvent à l'arrière. Toutefois, les ports USB situés à l'avant sont un peu difficiles à atteindre en raison de la construction du boîtier.
Communication
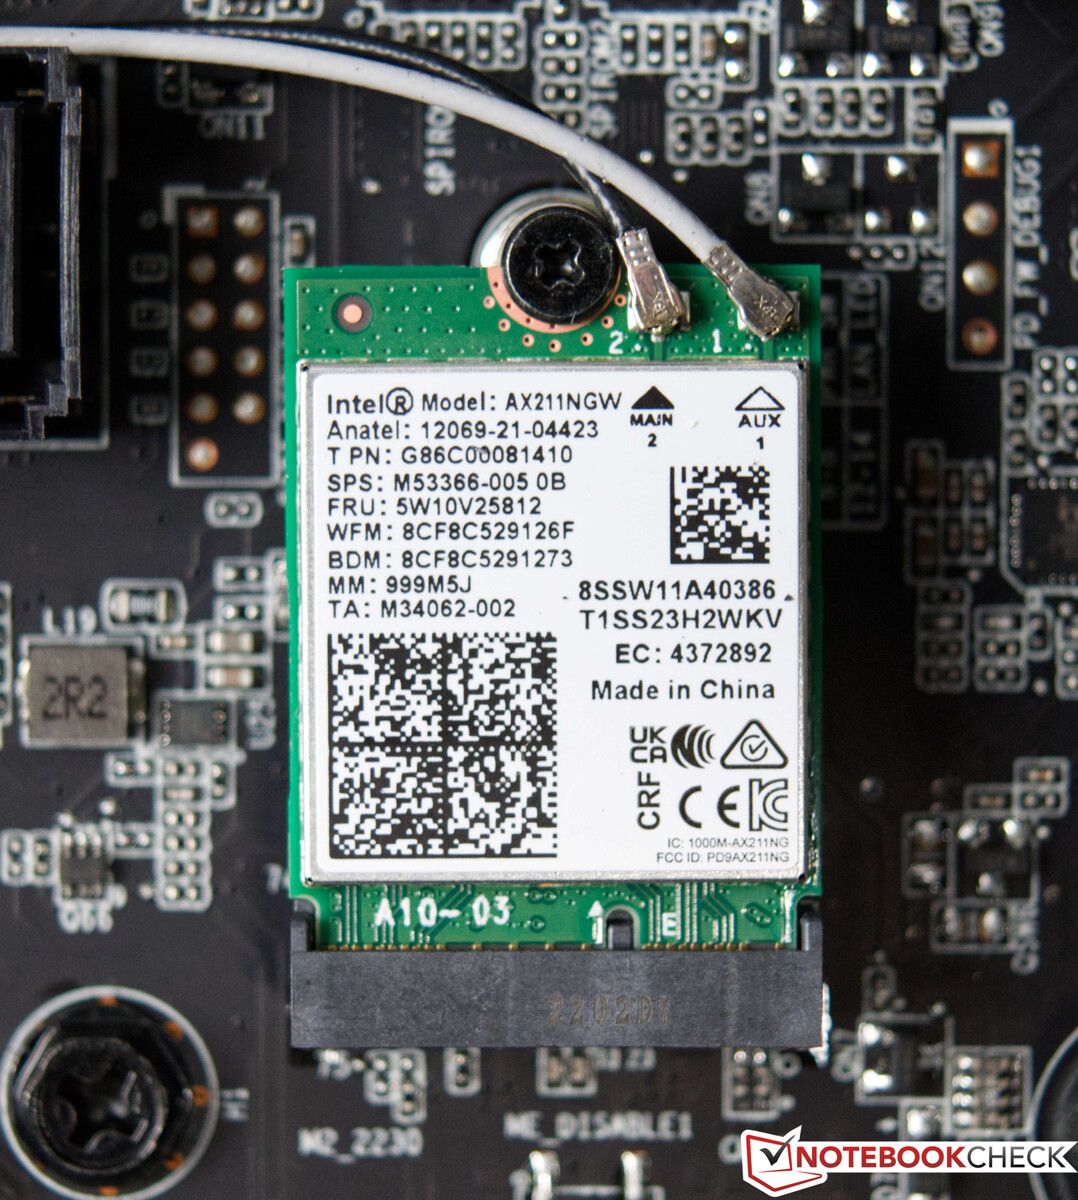
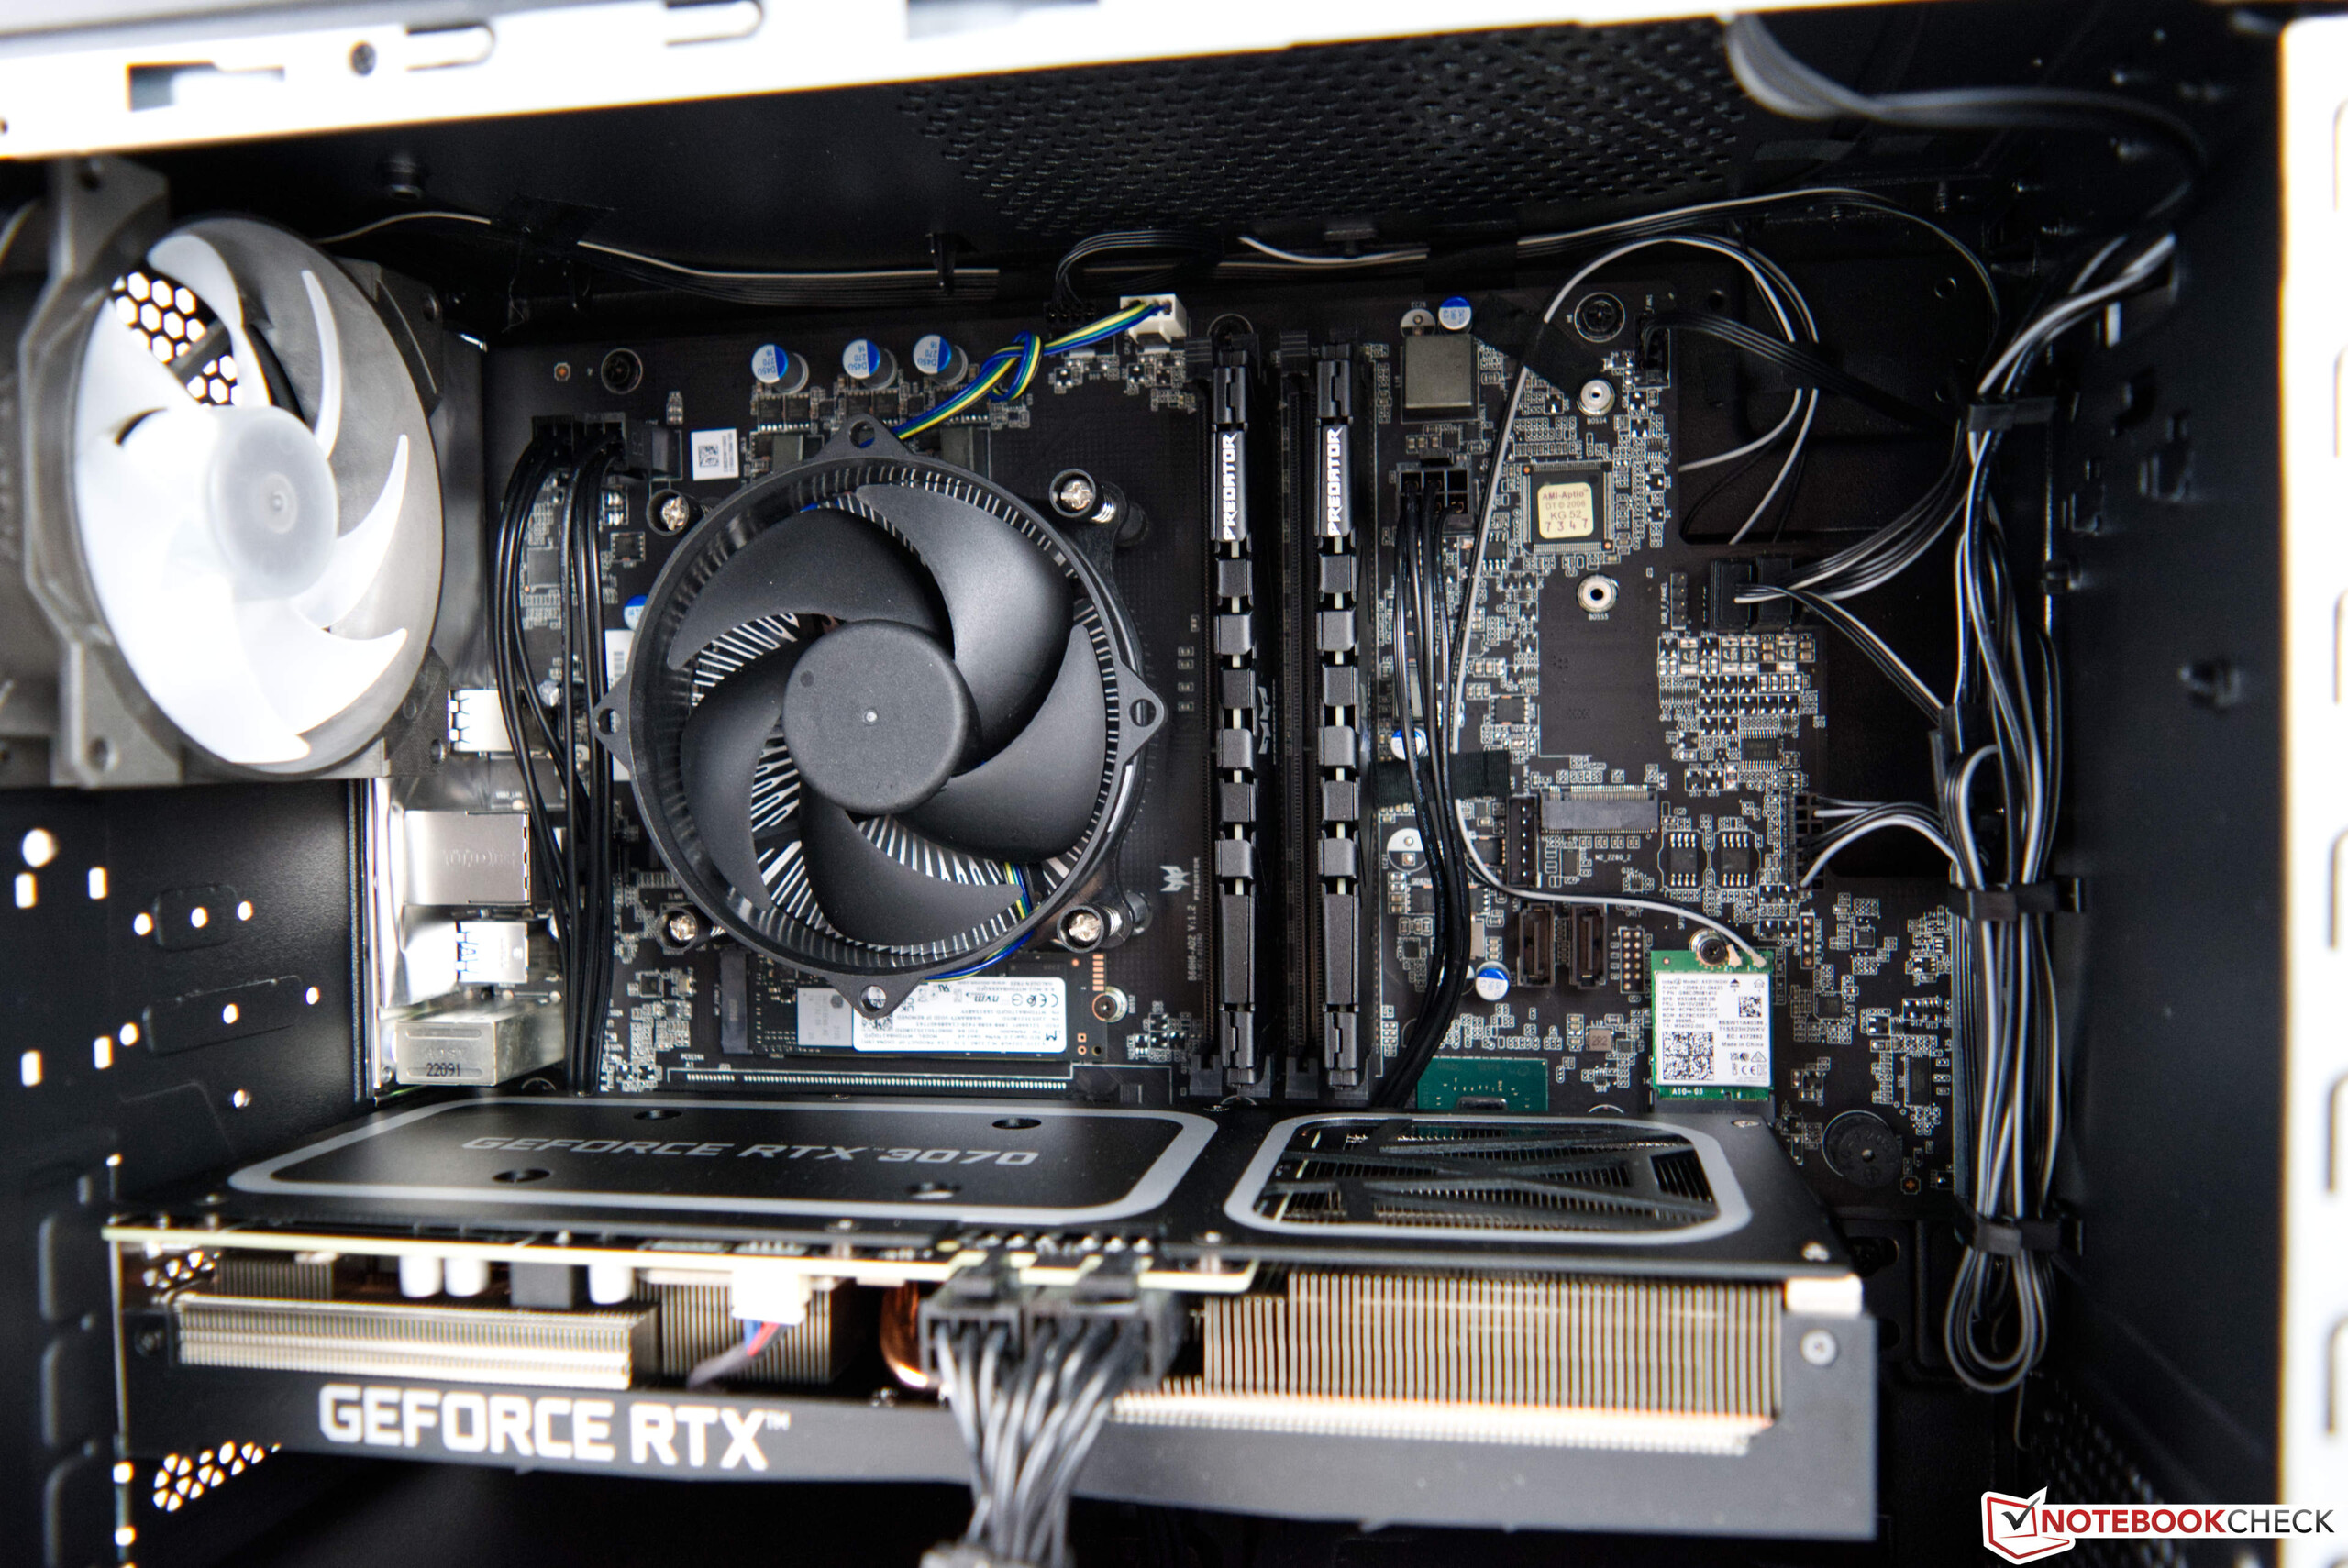
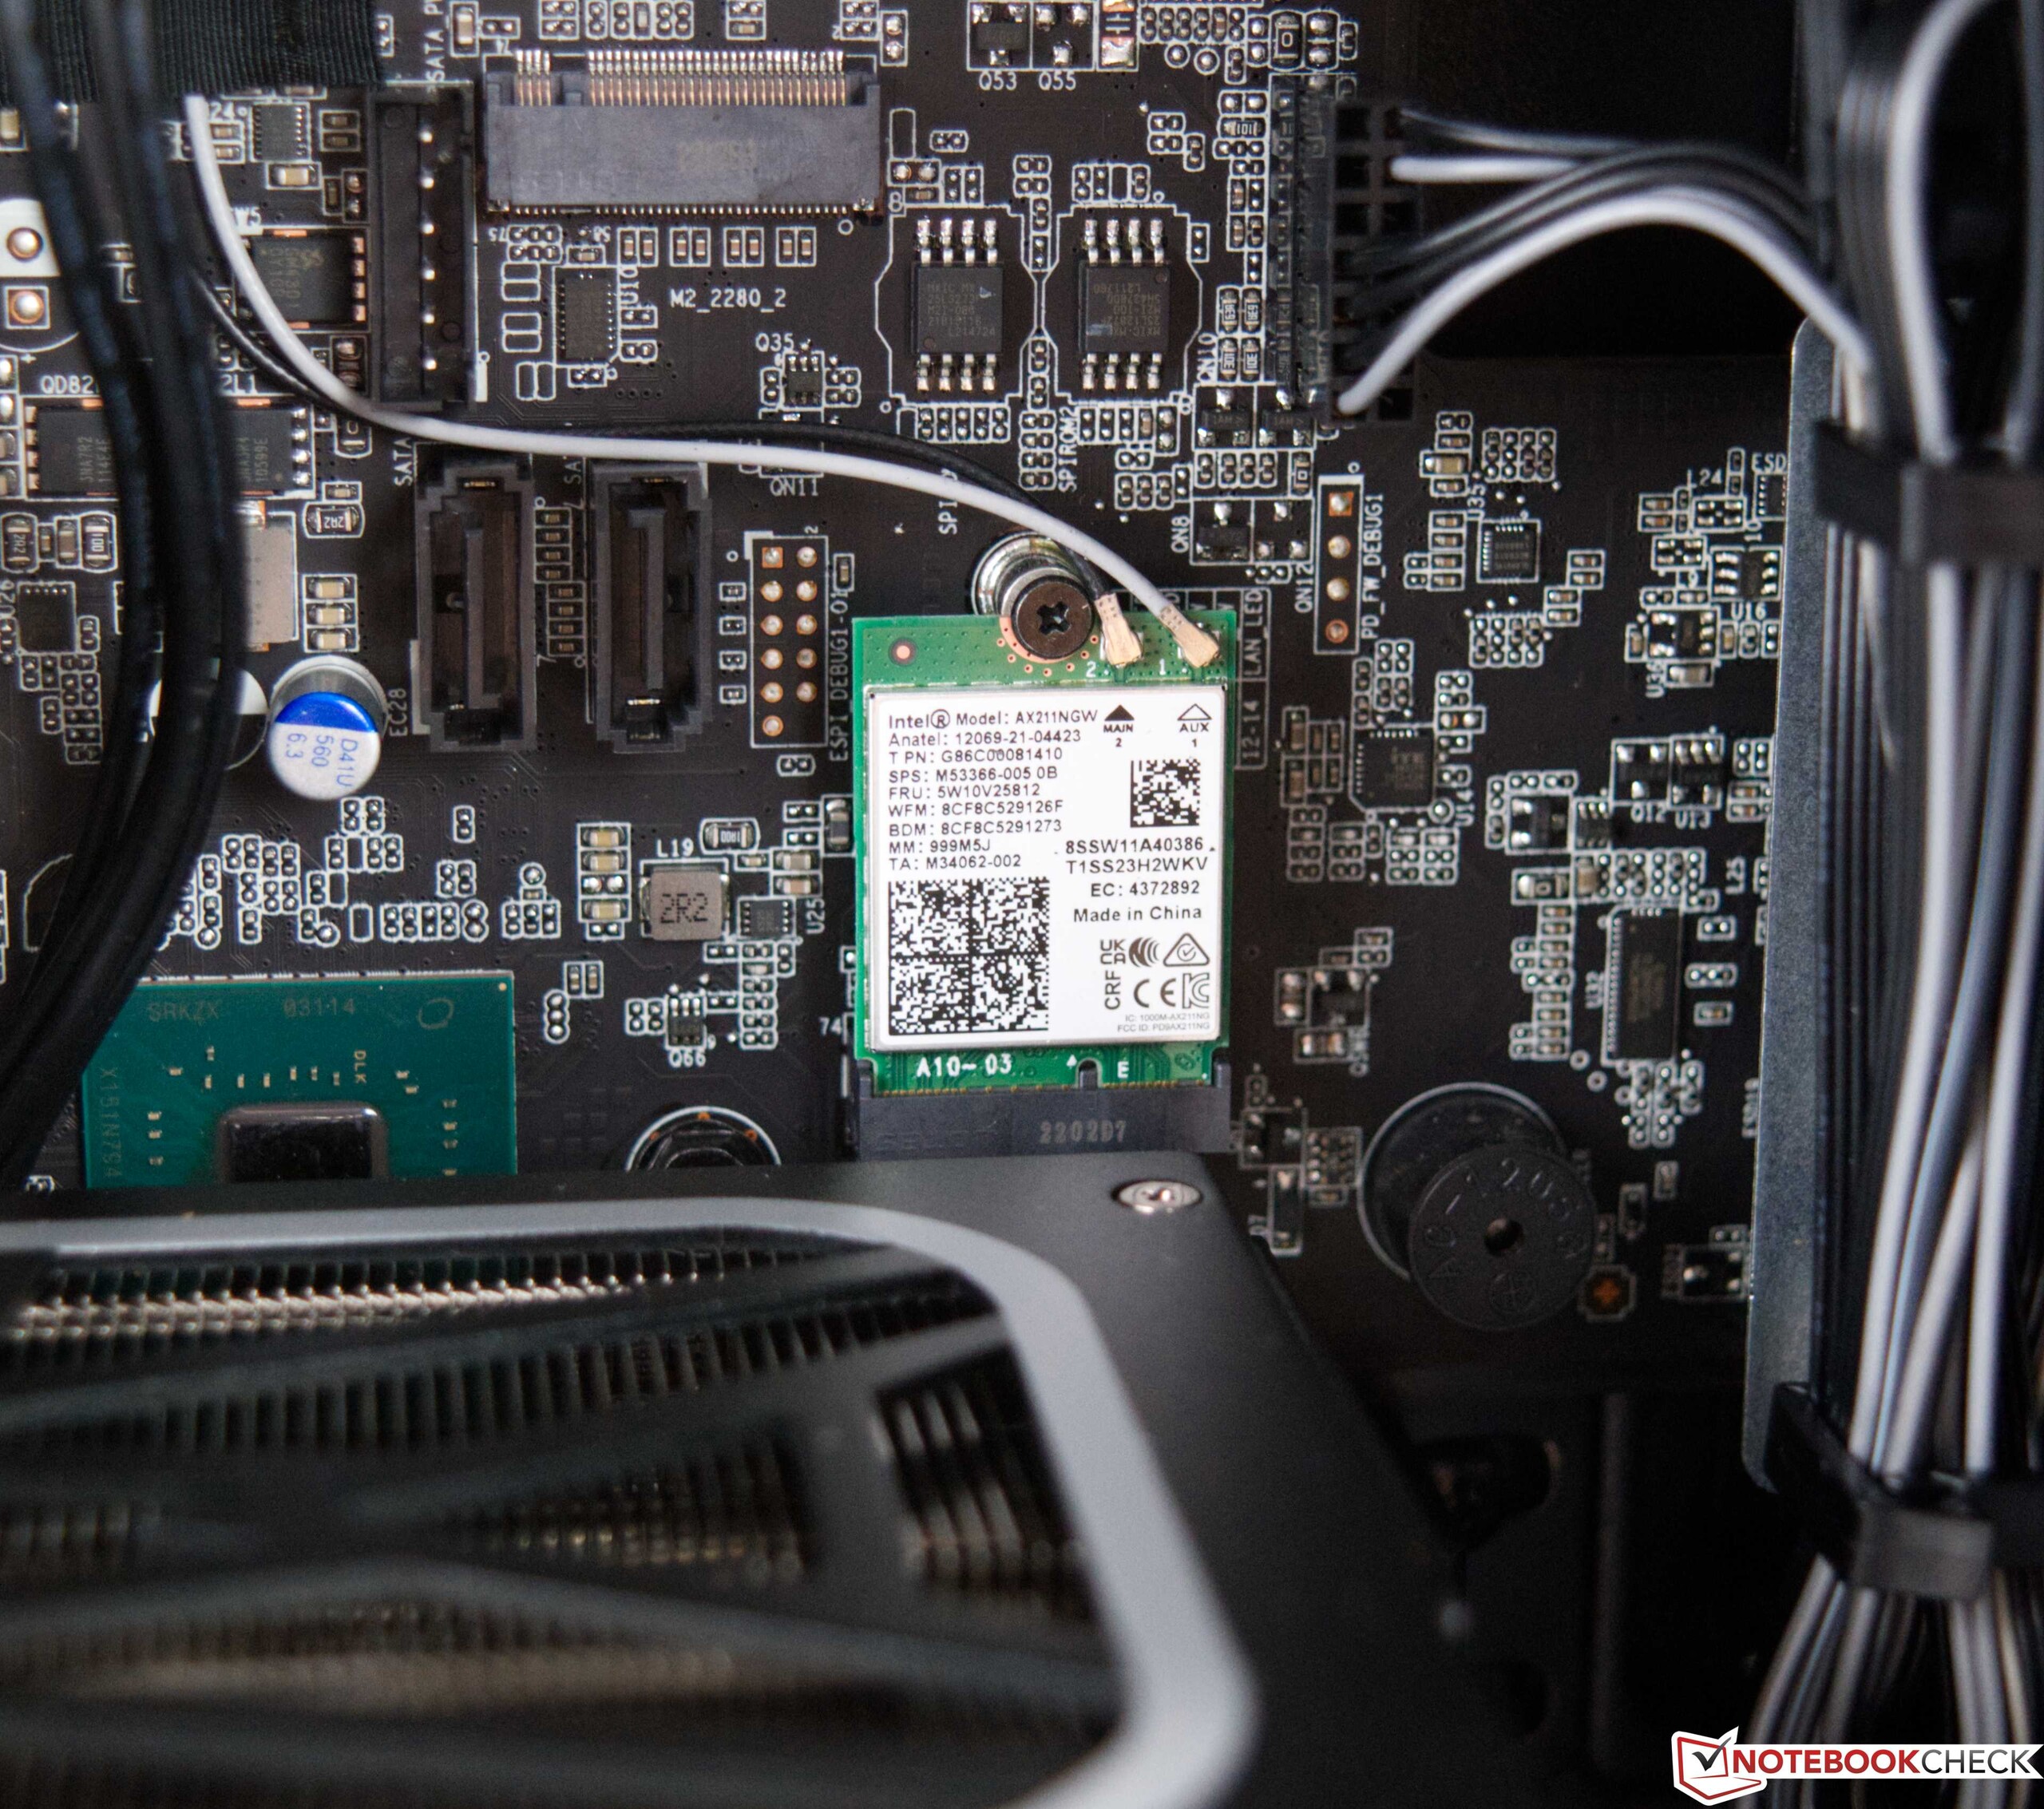
Acer équipe également le Predator d'un module Intel Wi-Fi 6E AX211. Il se présente sous la forme d'une carte enfichable M.2 directement sur la carte mère et offre des taux de transfert relativement bons. Néanmoins, les performances de l'Intel Wi-Fi 6E AX211 en matière de réception de données ne sont pas à la hauteur des bons taux en émission. Les appareils de comparaison fournissent en partie de meilleurs taux ici. Cependant, le test quotidien a montré que vous pouvez également vous débrouiller avec le module WLAN installé. Nous n'avons rencontré aucun problème avec la connexion sans fil. Comme alternative, l'utilisateur peut utiliser un port RJ45 qui s'appuie sur une puce E2600 tueuse. Malheureusement, celle-ci n'offre qu'un maximum de 1 GBit/s.
Accessoires
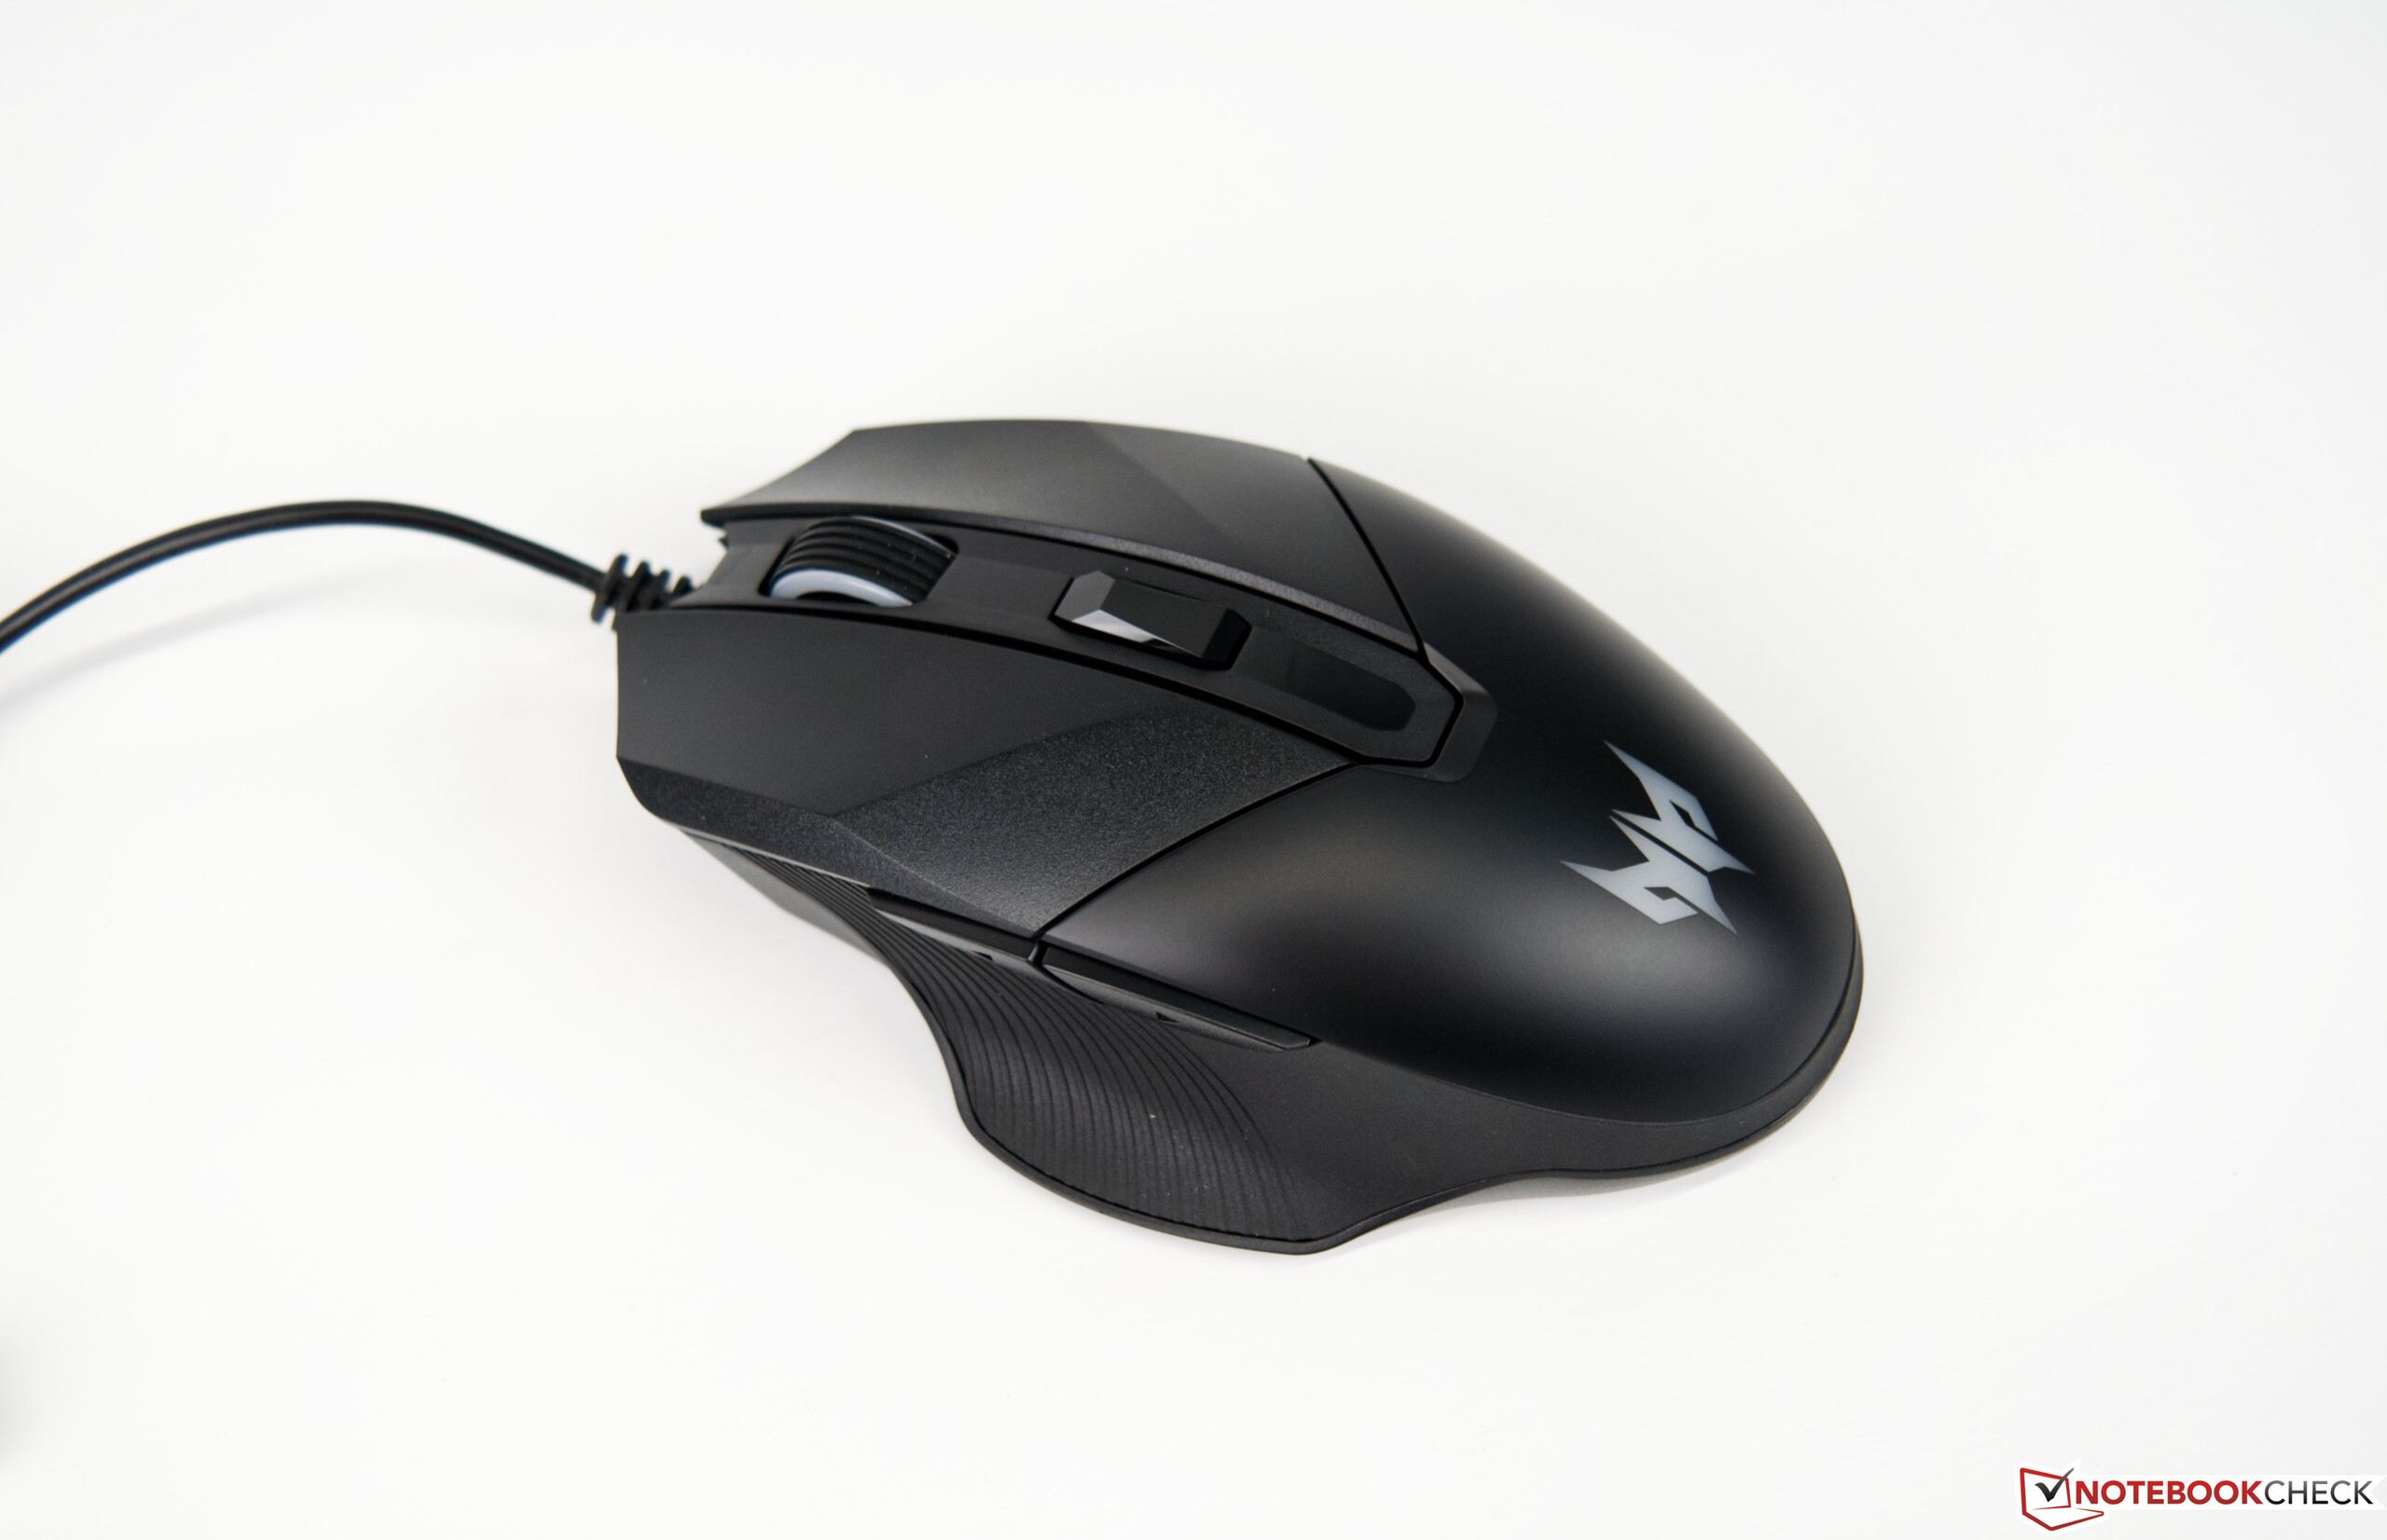
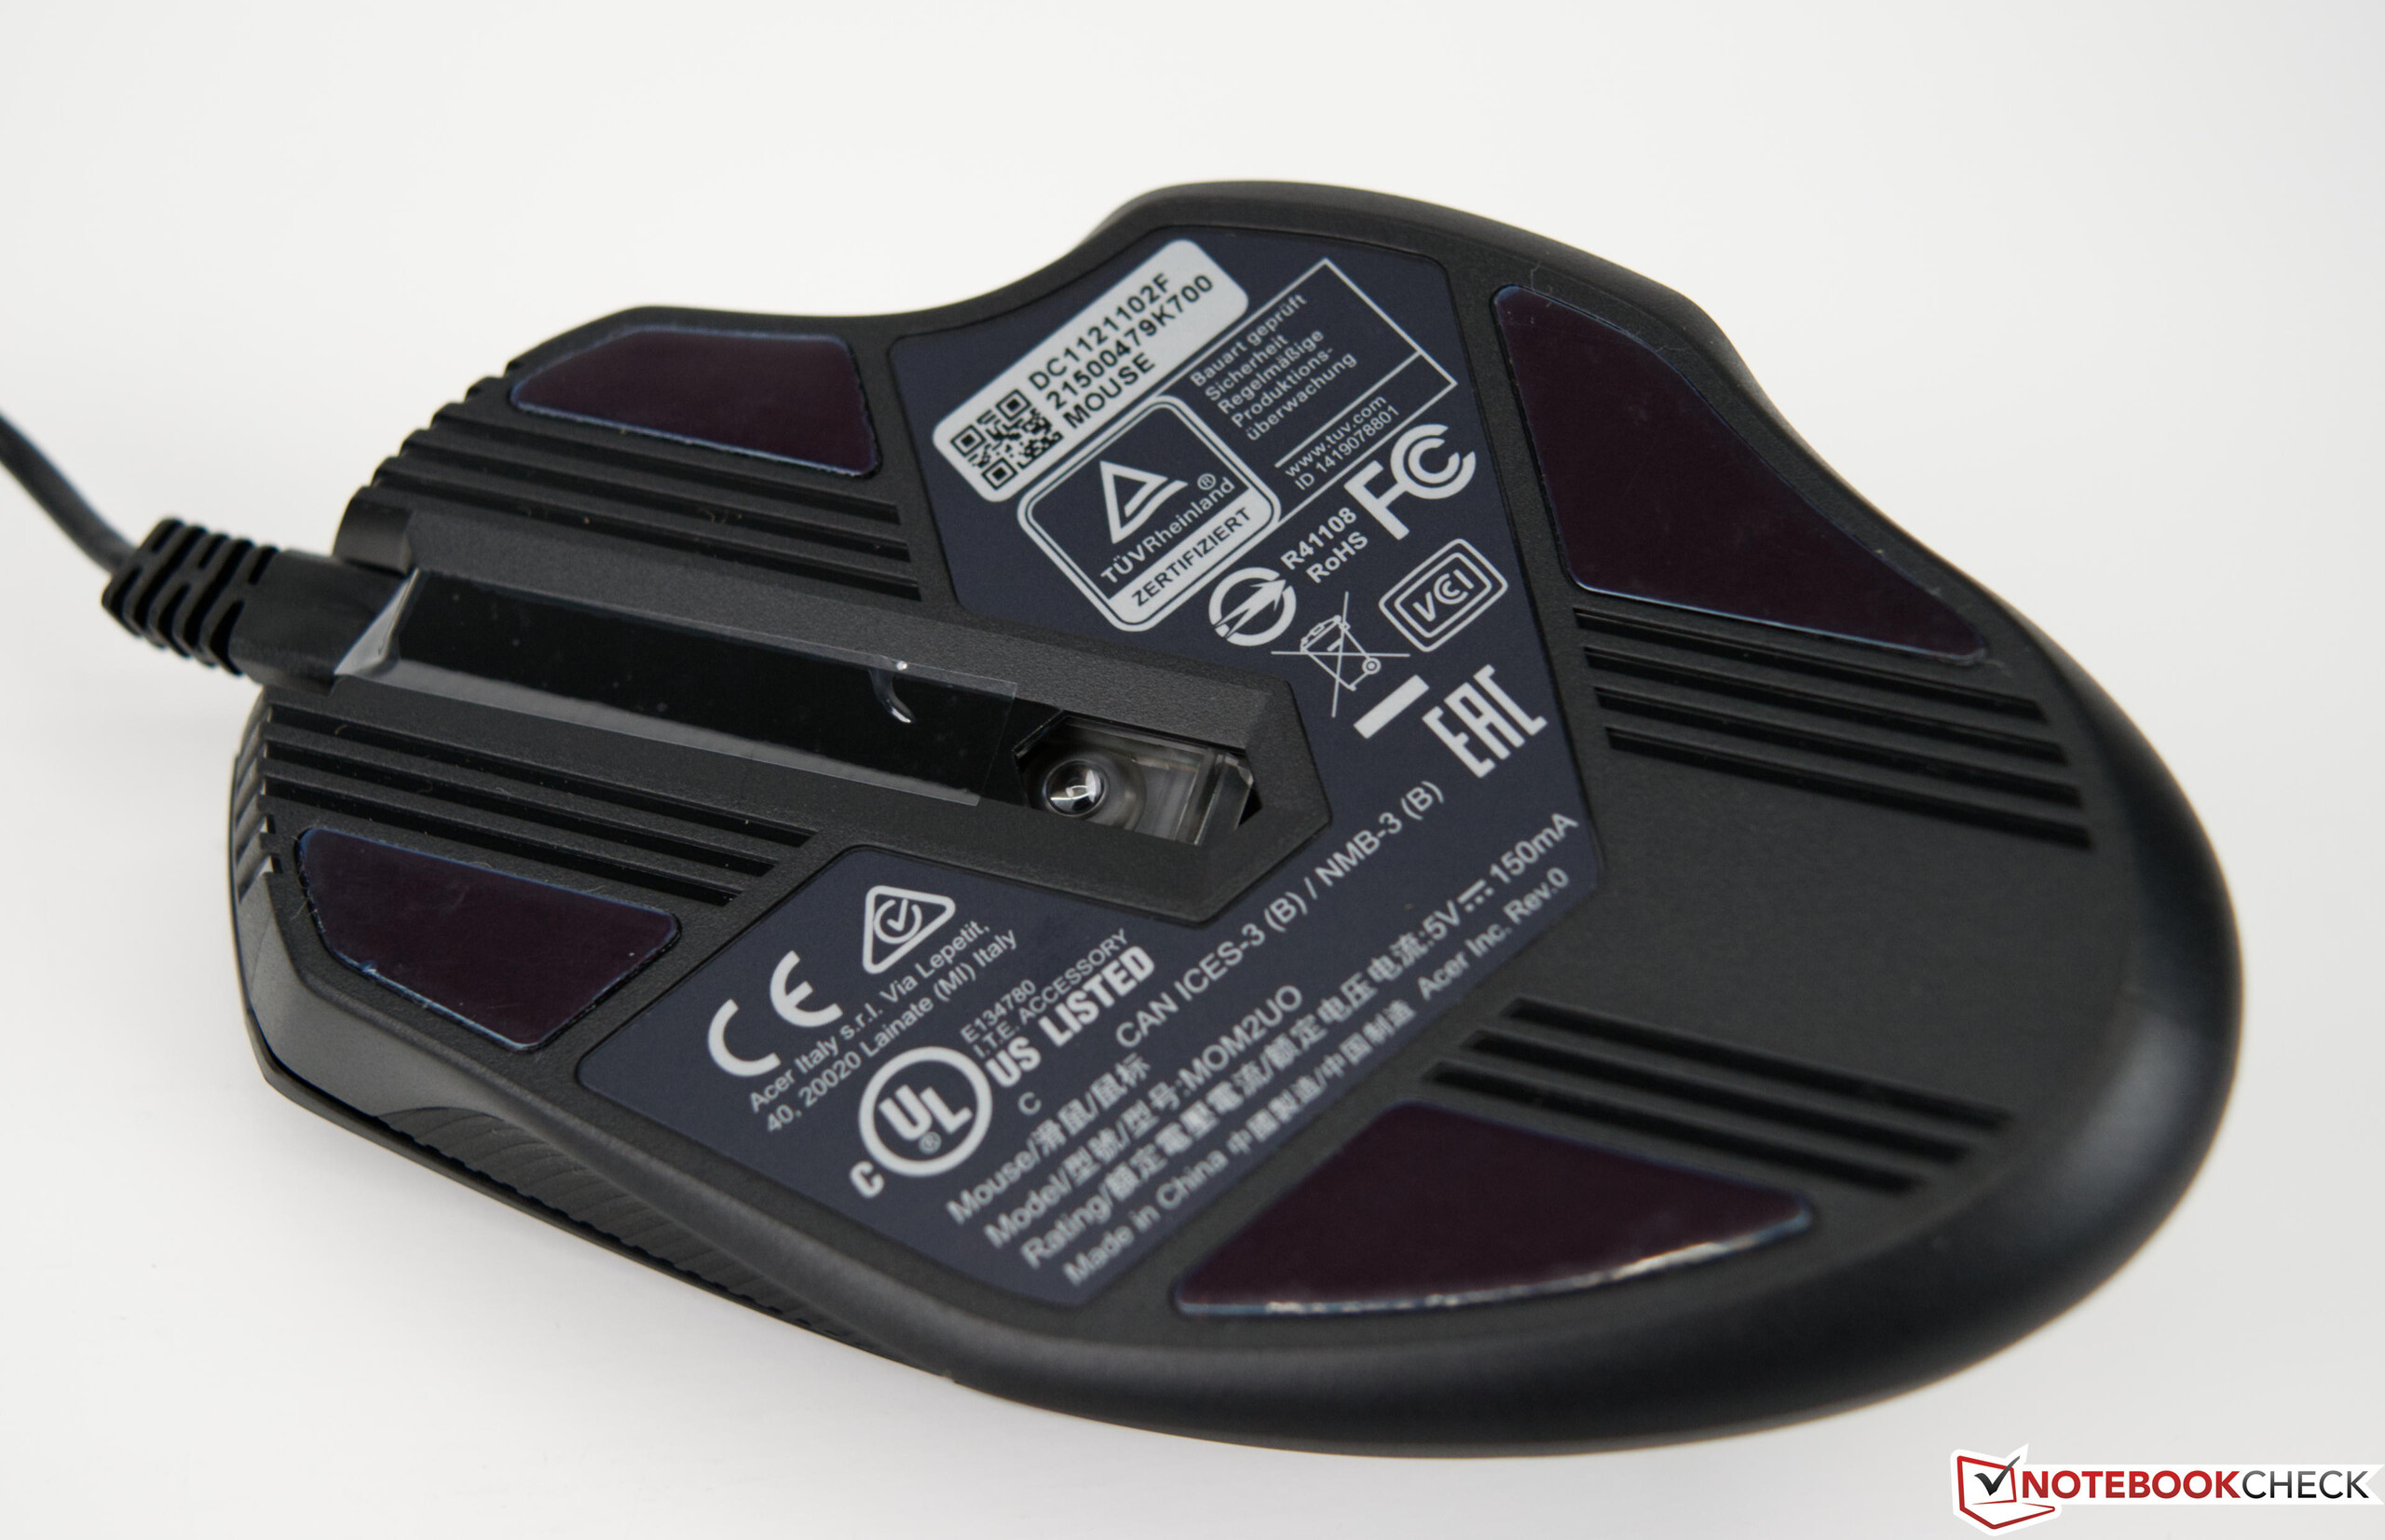
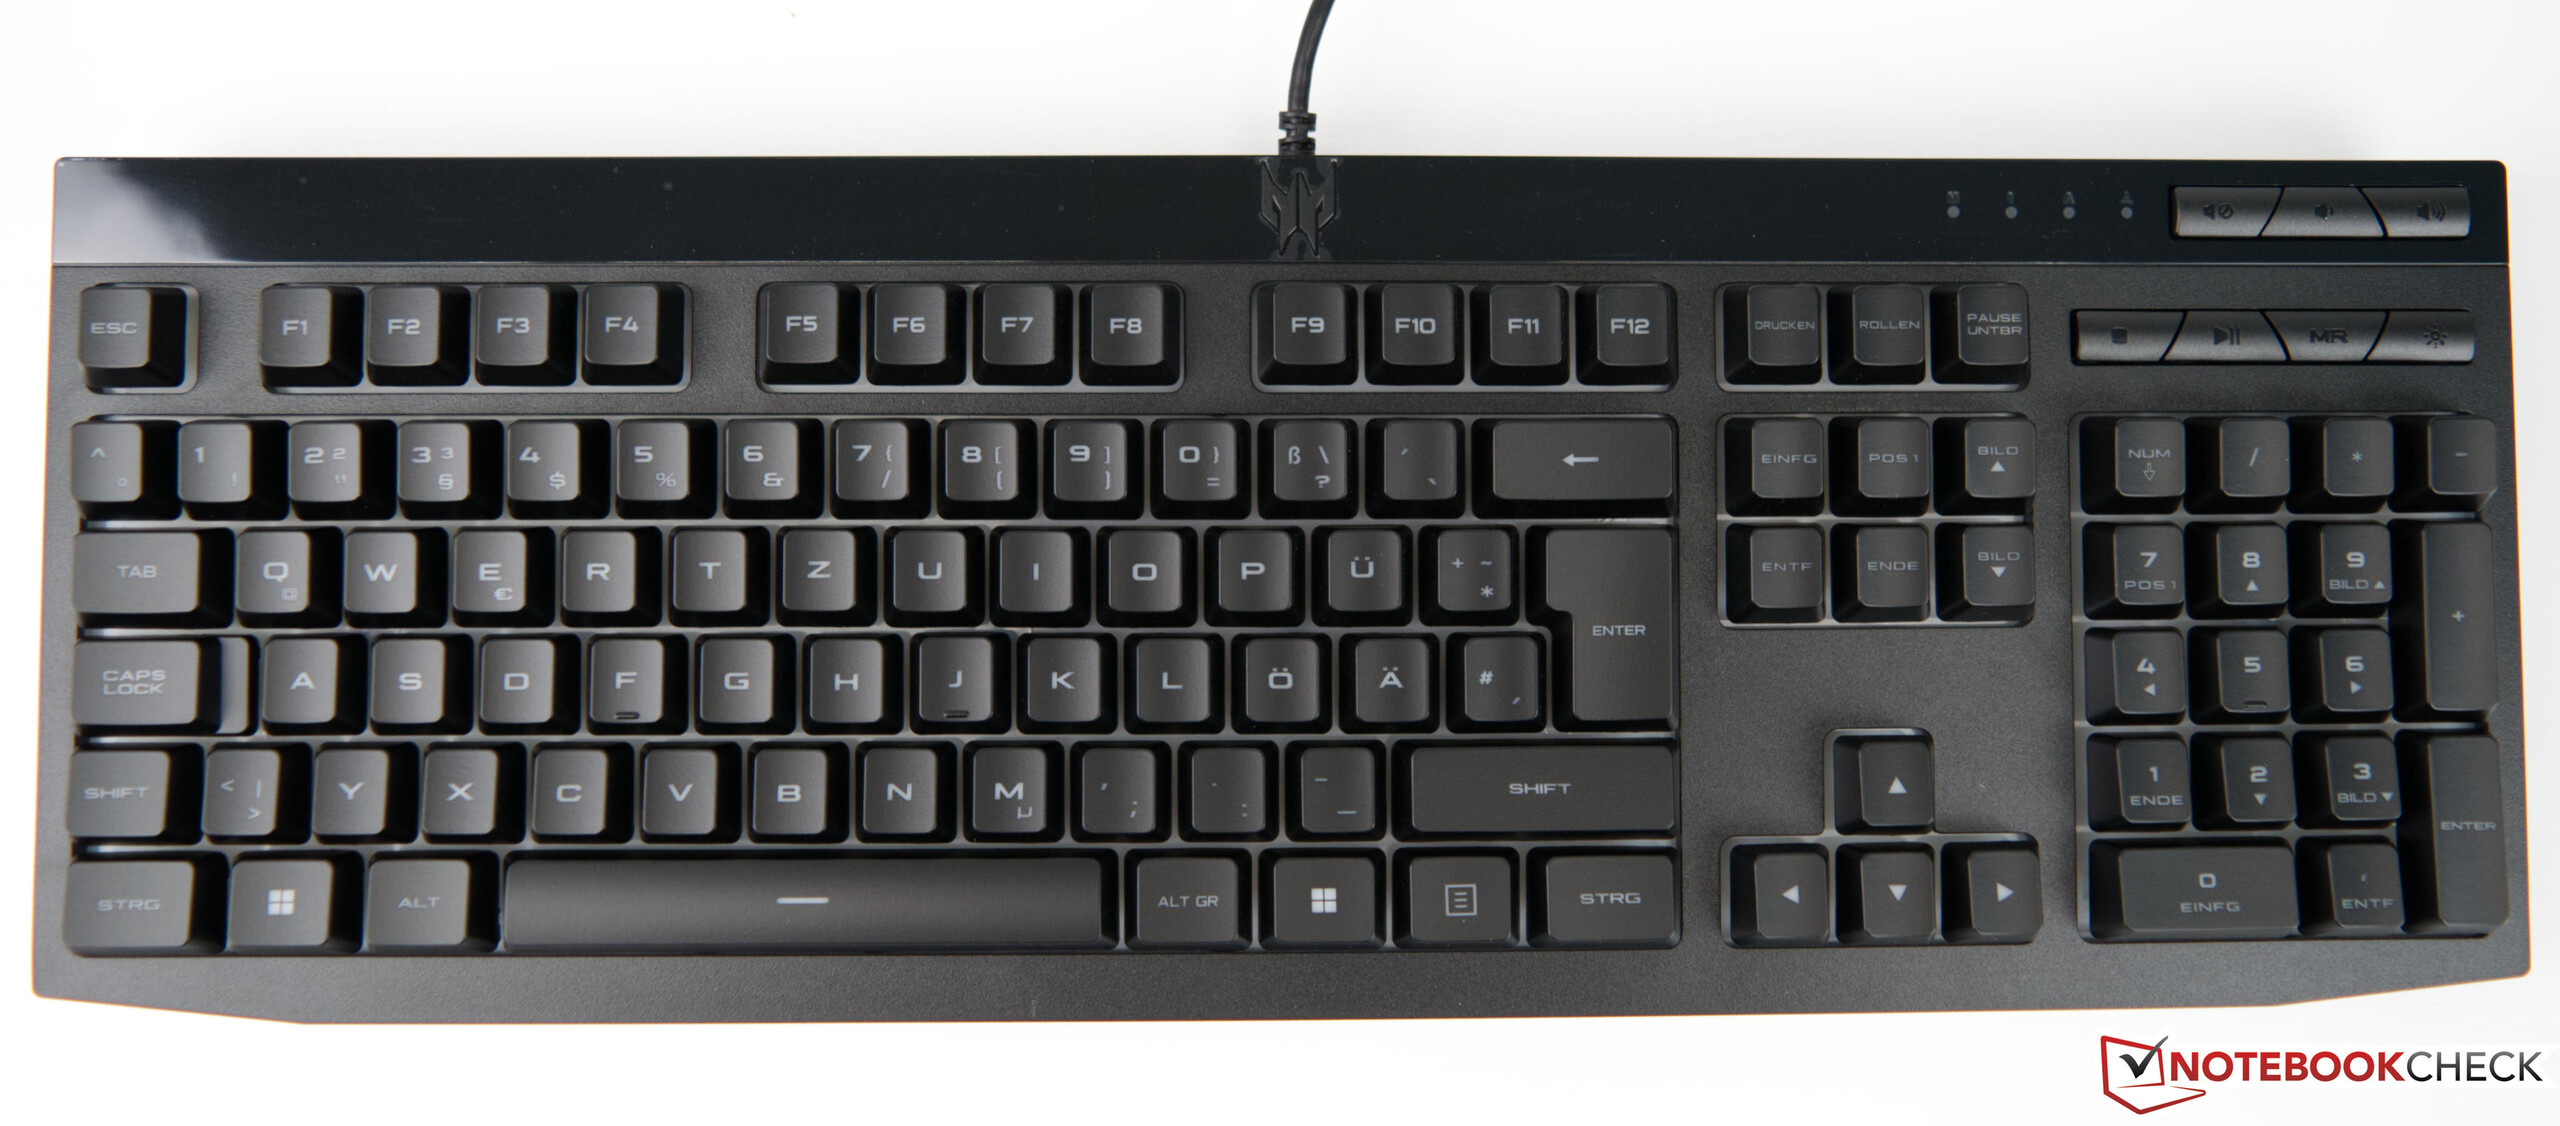
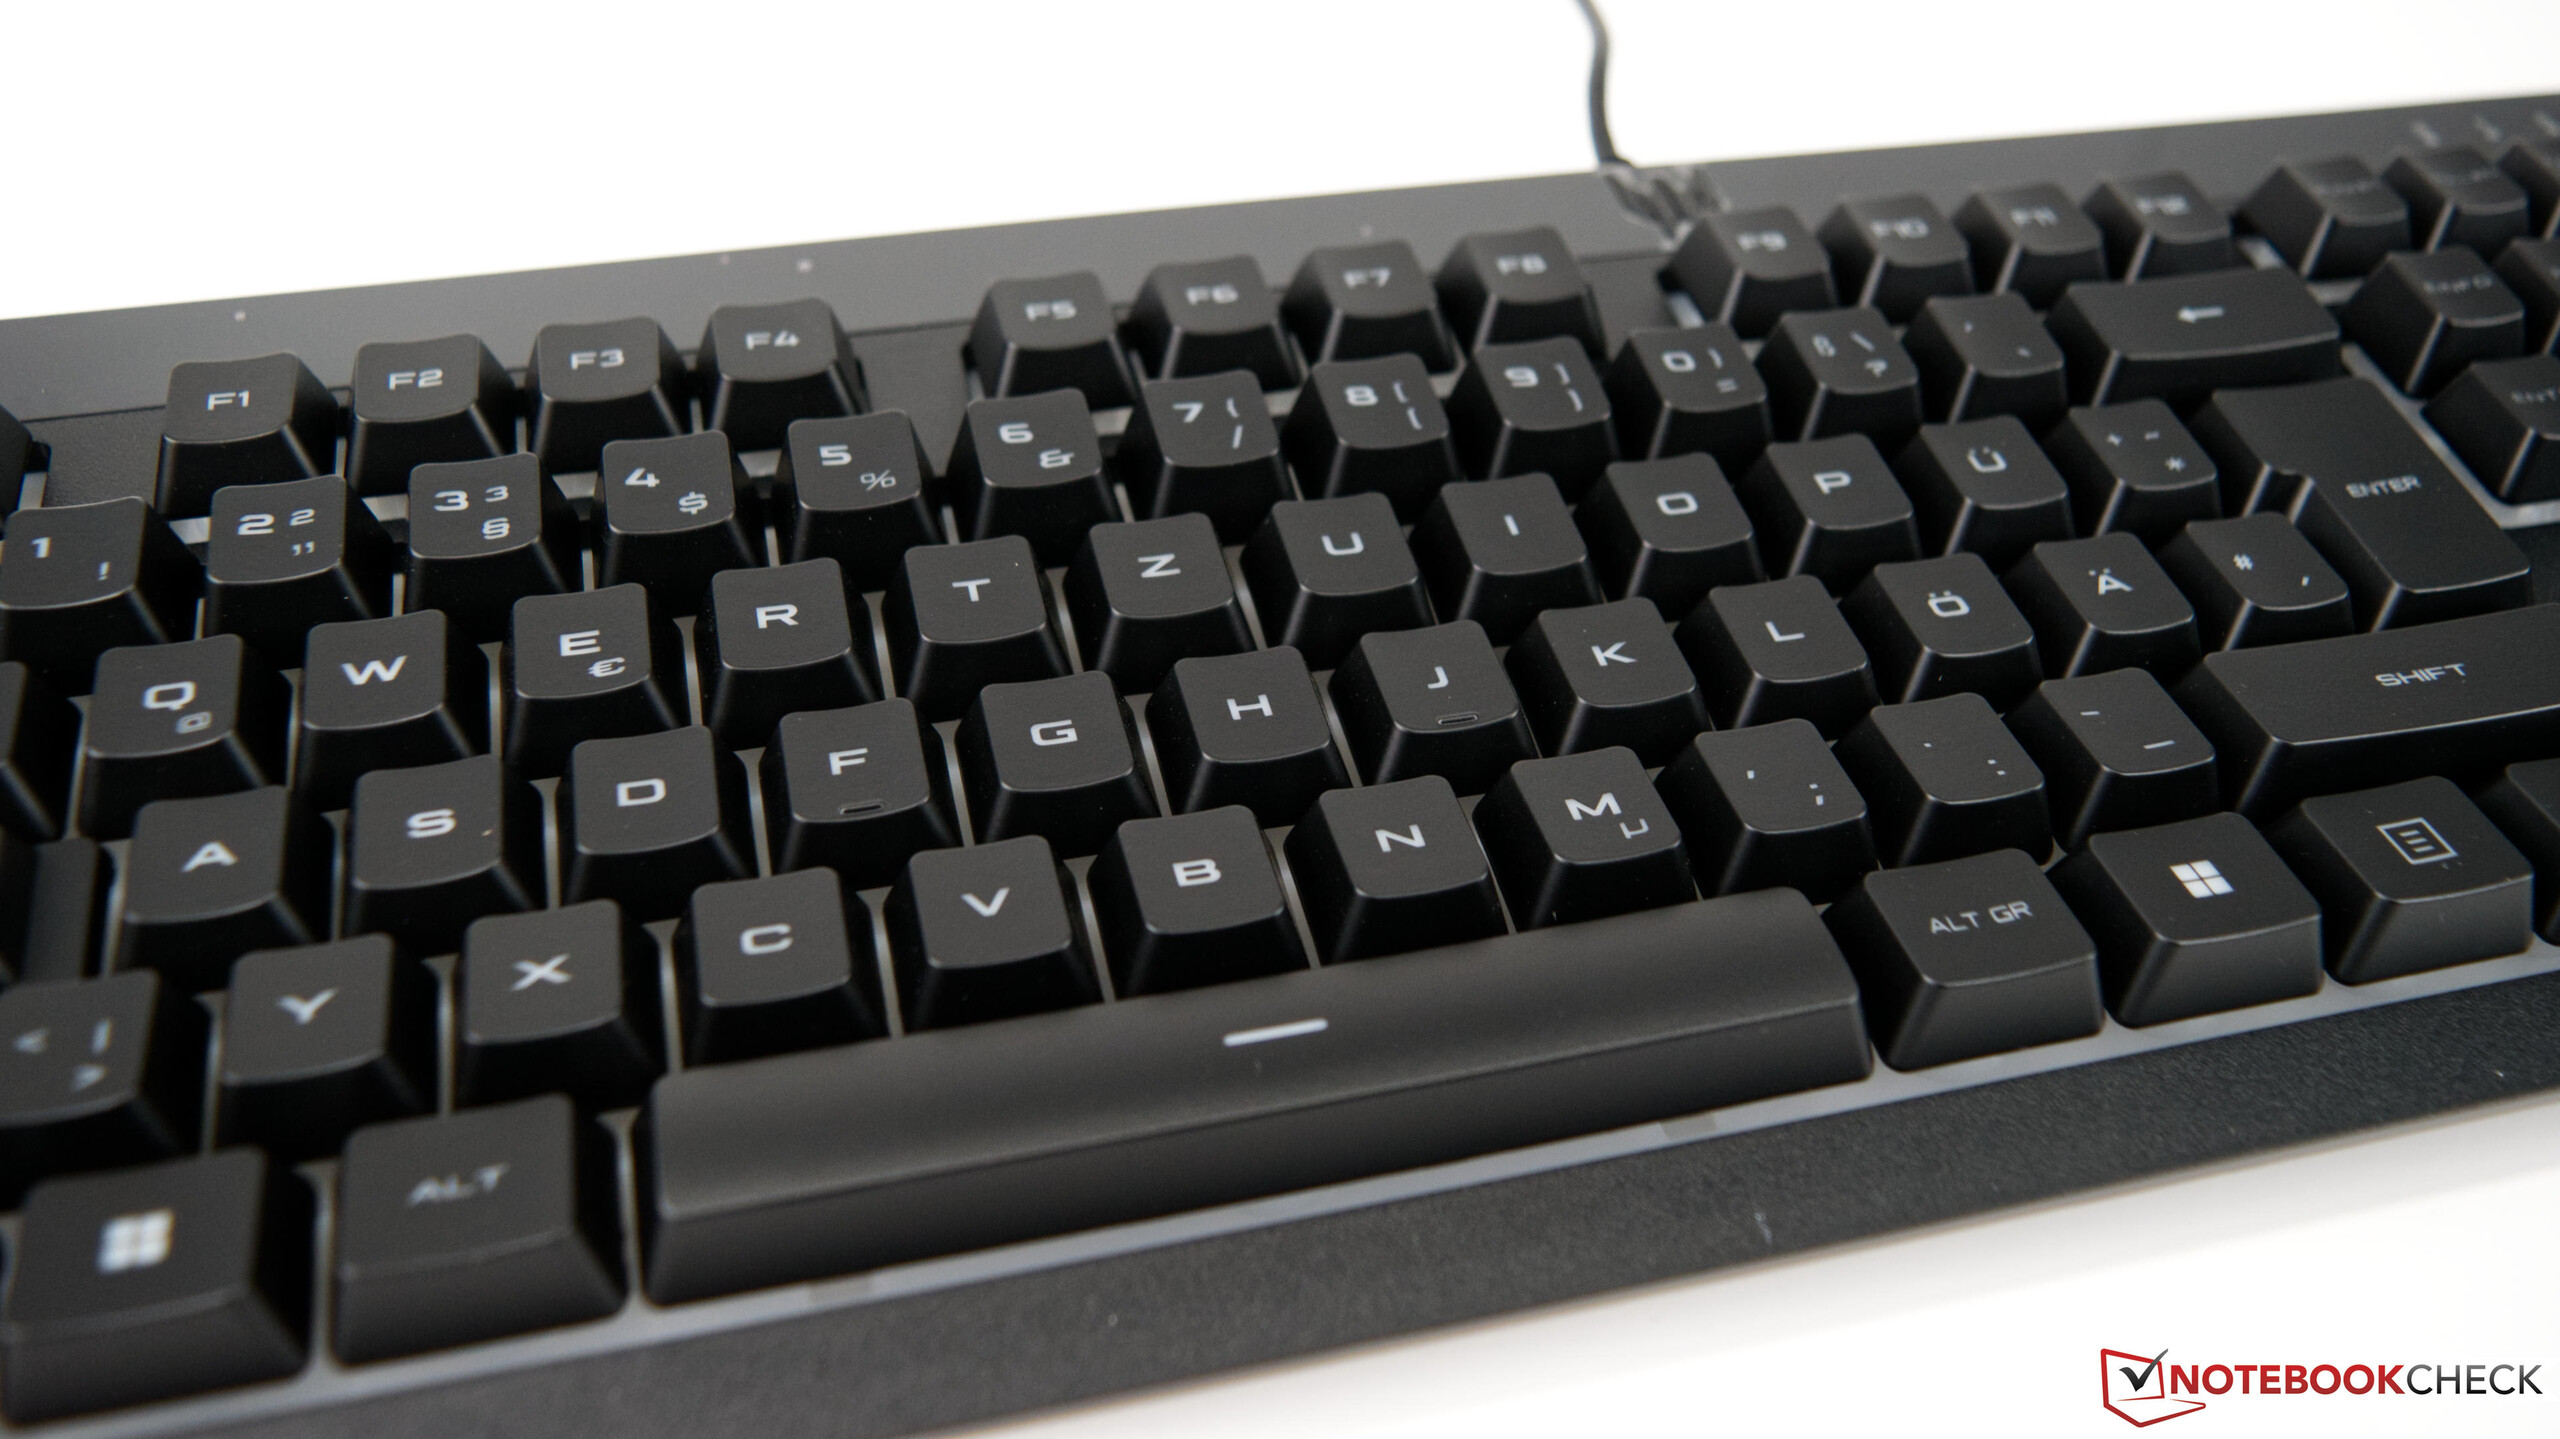
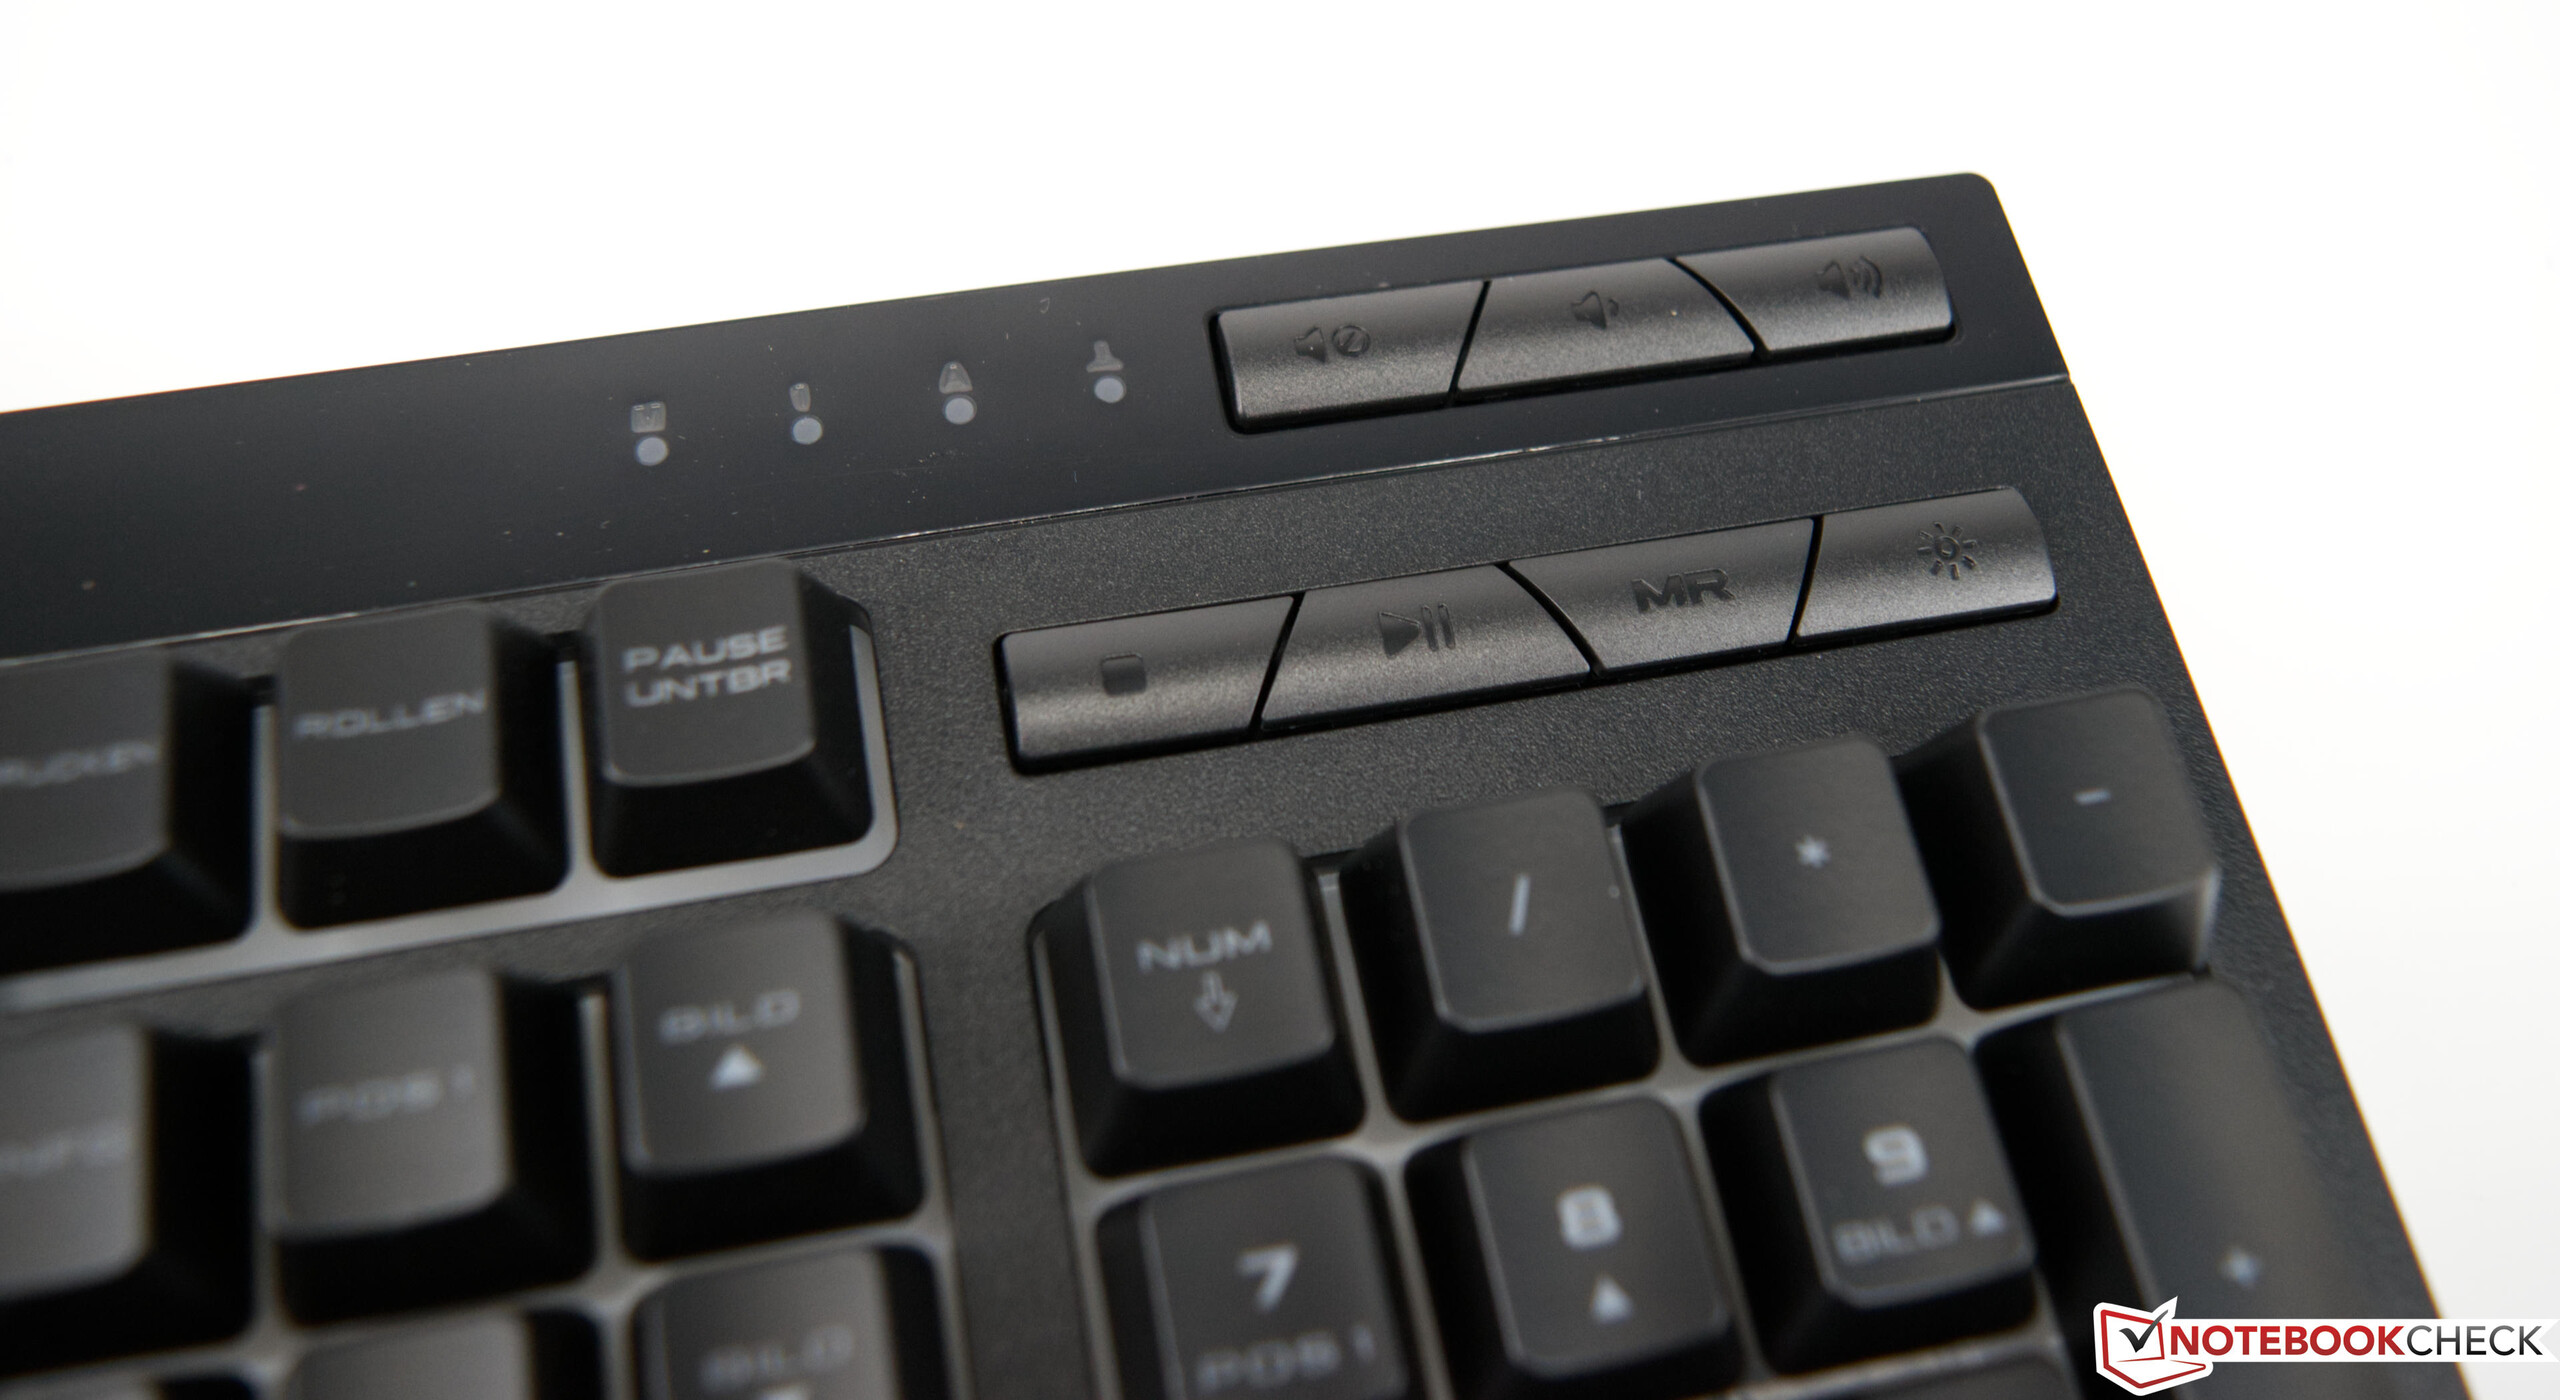
Si vous achetez un Acer Predator Orion 3000, vous recevrez également un clavier optiquement assorti et une souris de jeu, également de style Predator. Ainsi, vous êtes bien préparé pour le départ et le matériel donne une impression générale cohérente. La tour peut également être mise à niveau avec le panneau latéral optionnel comprenant une fenêtre de visualisation. Celle-ci permet de mettre en valeur l'éclairage RGB intégré.
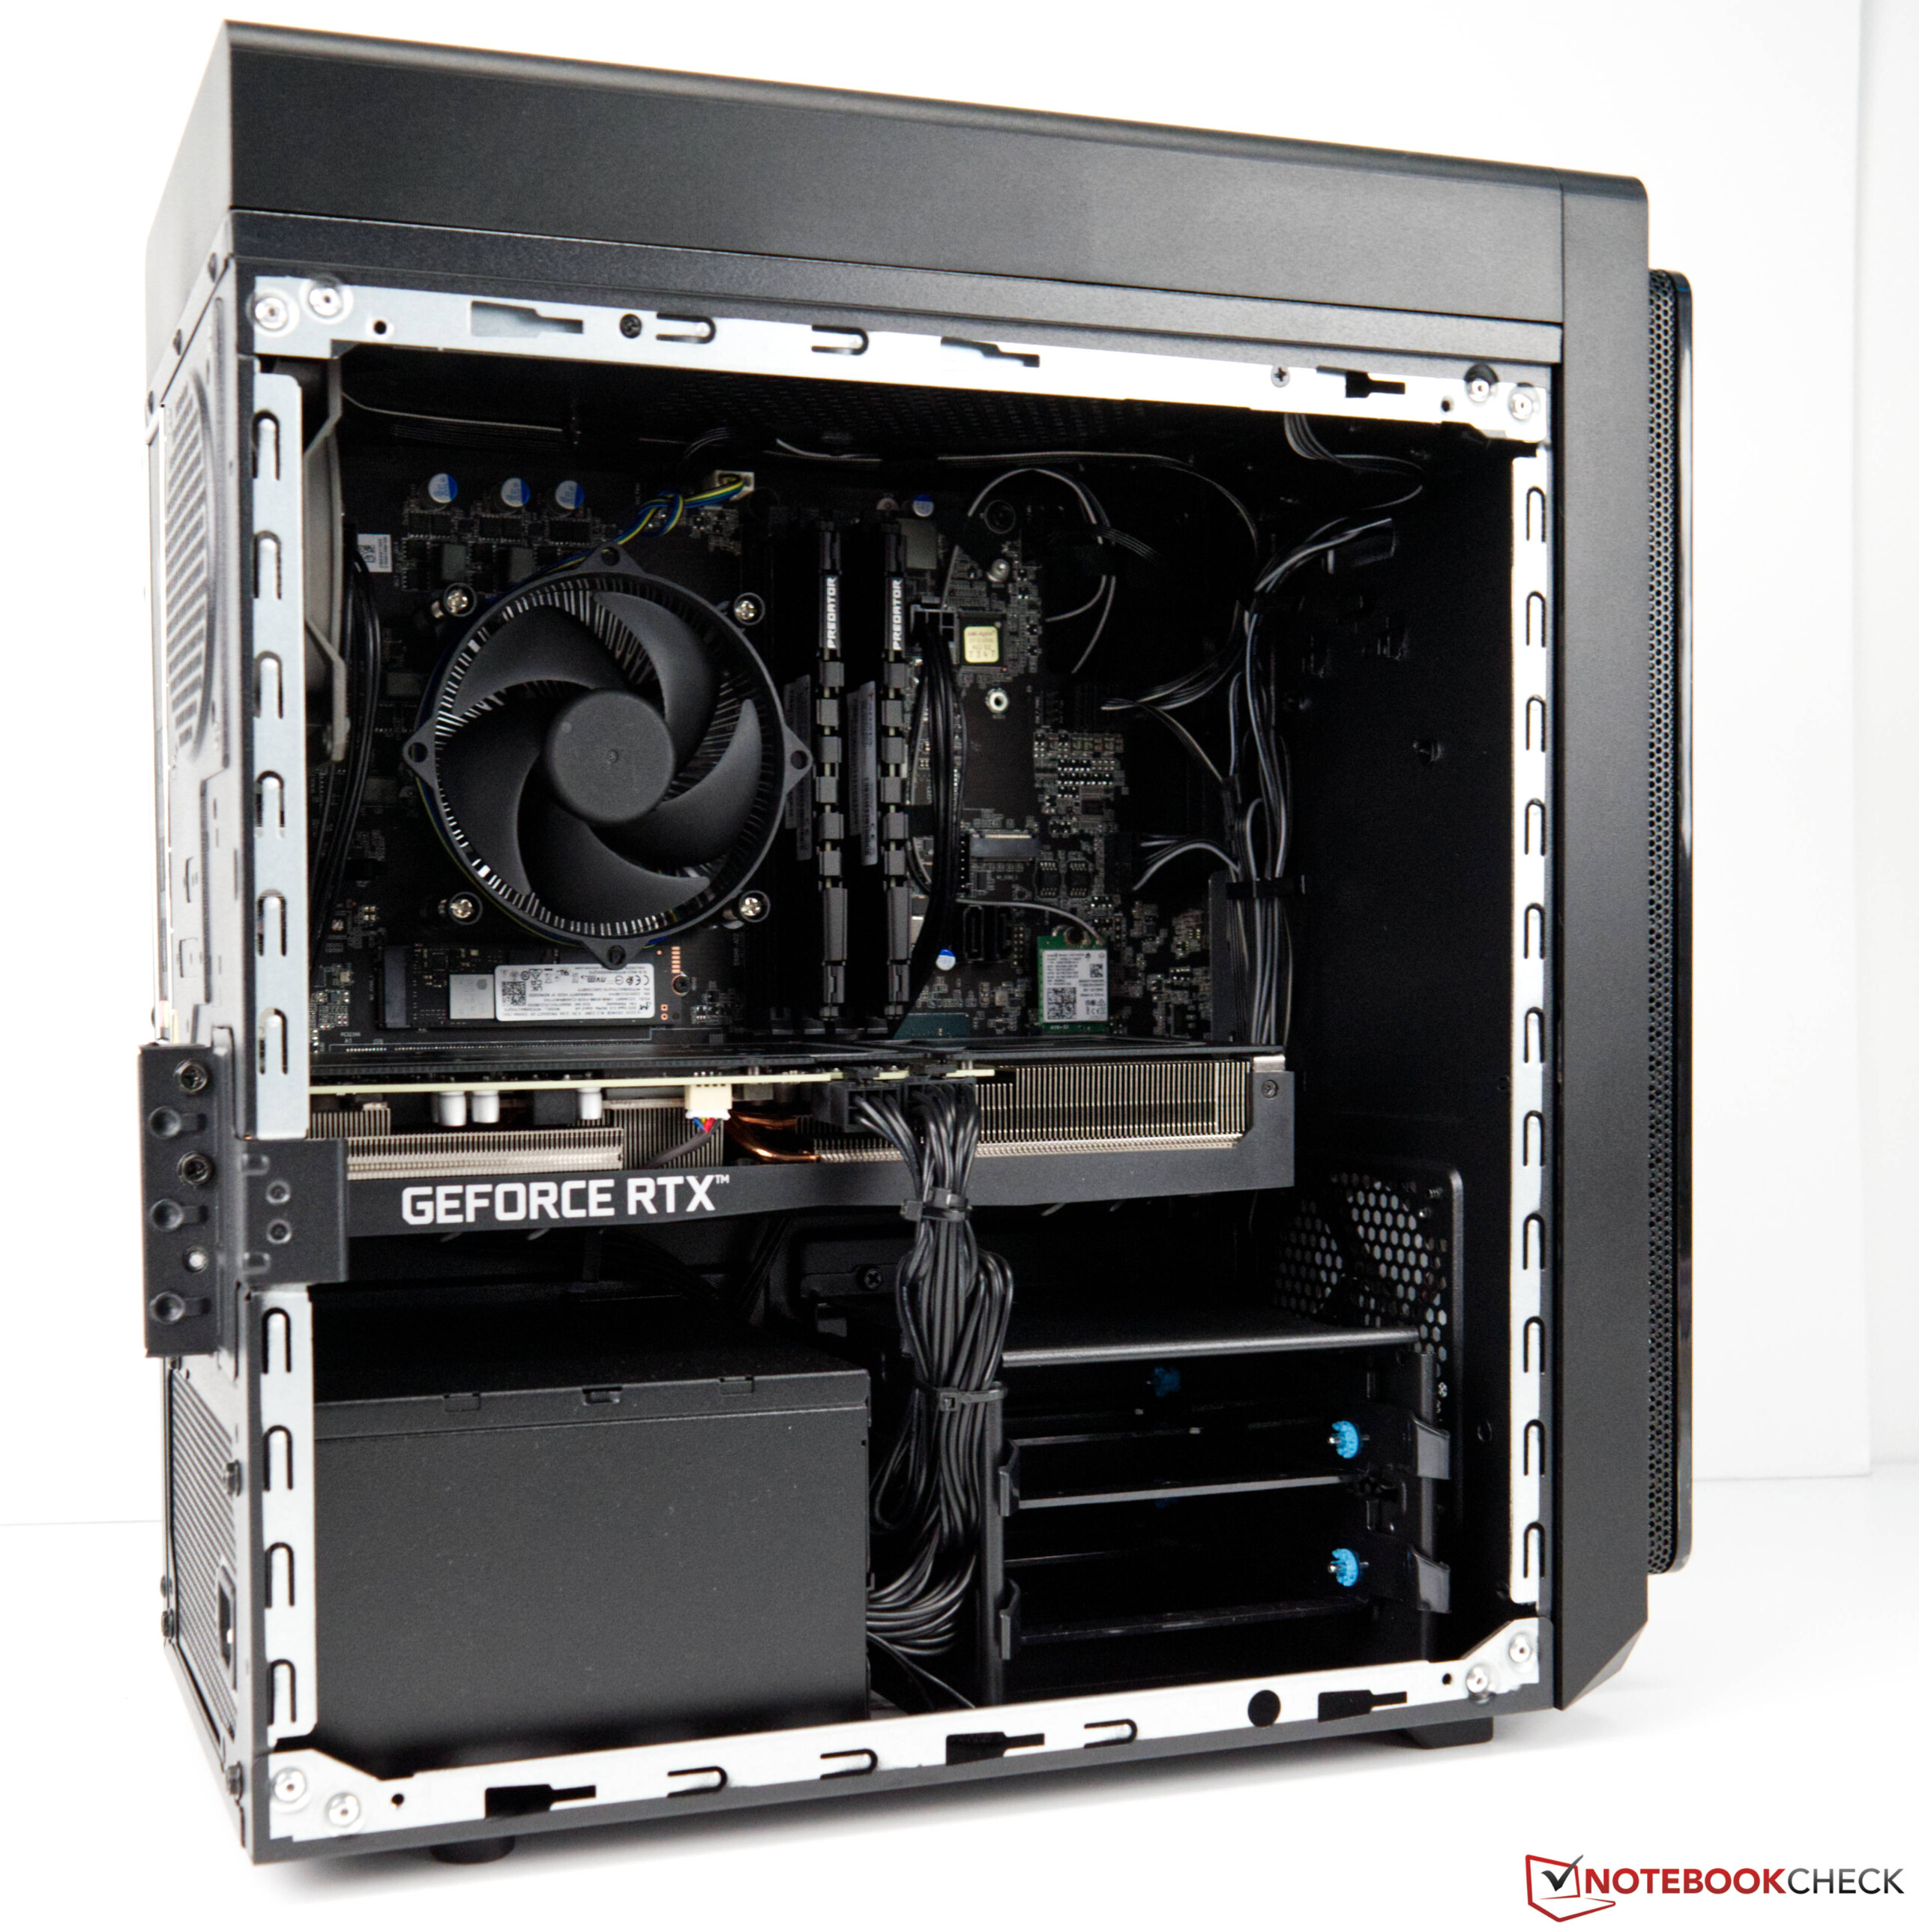
Maintenance
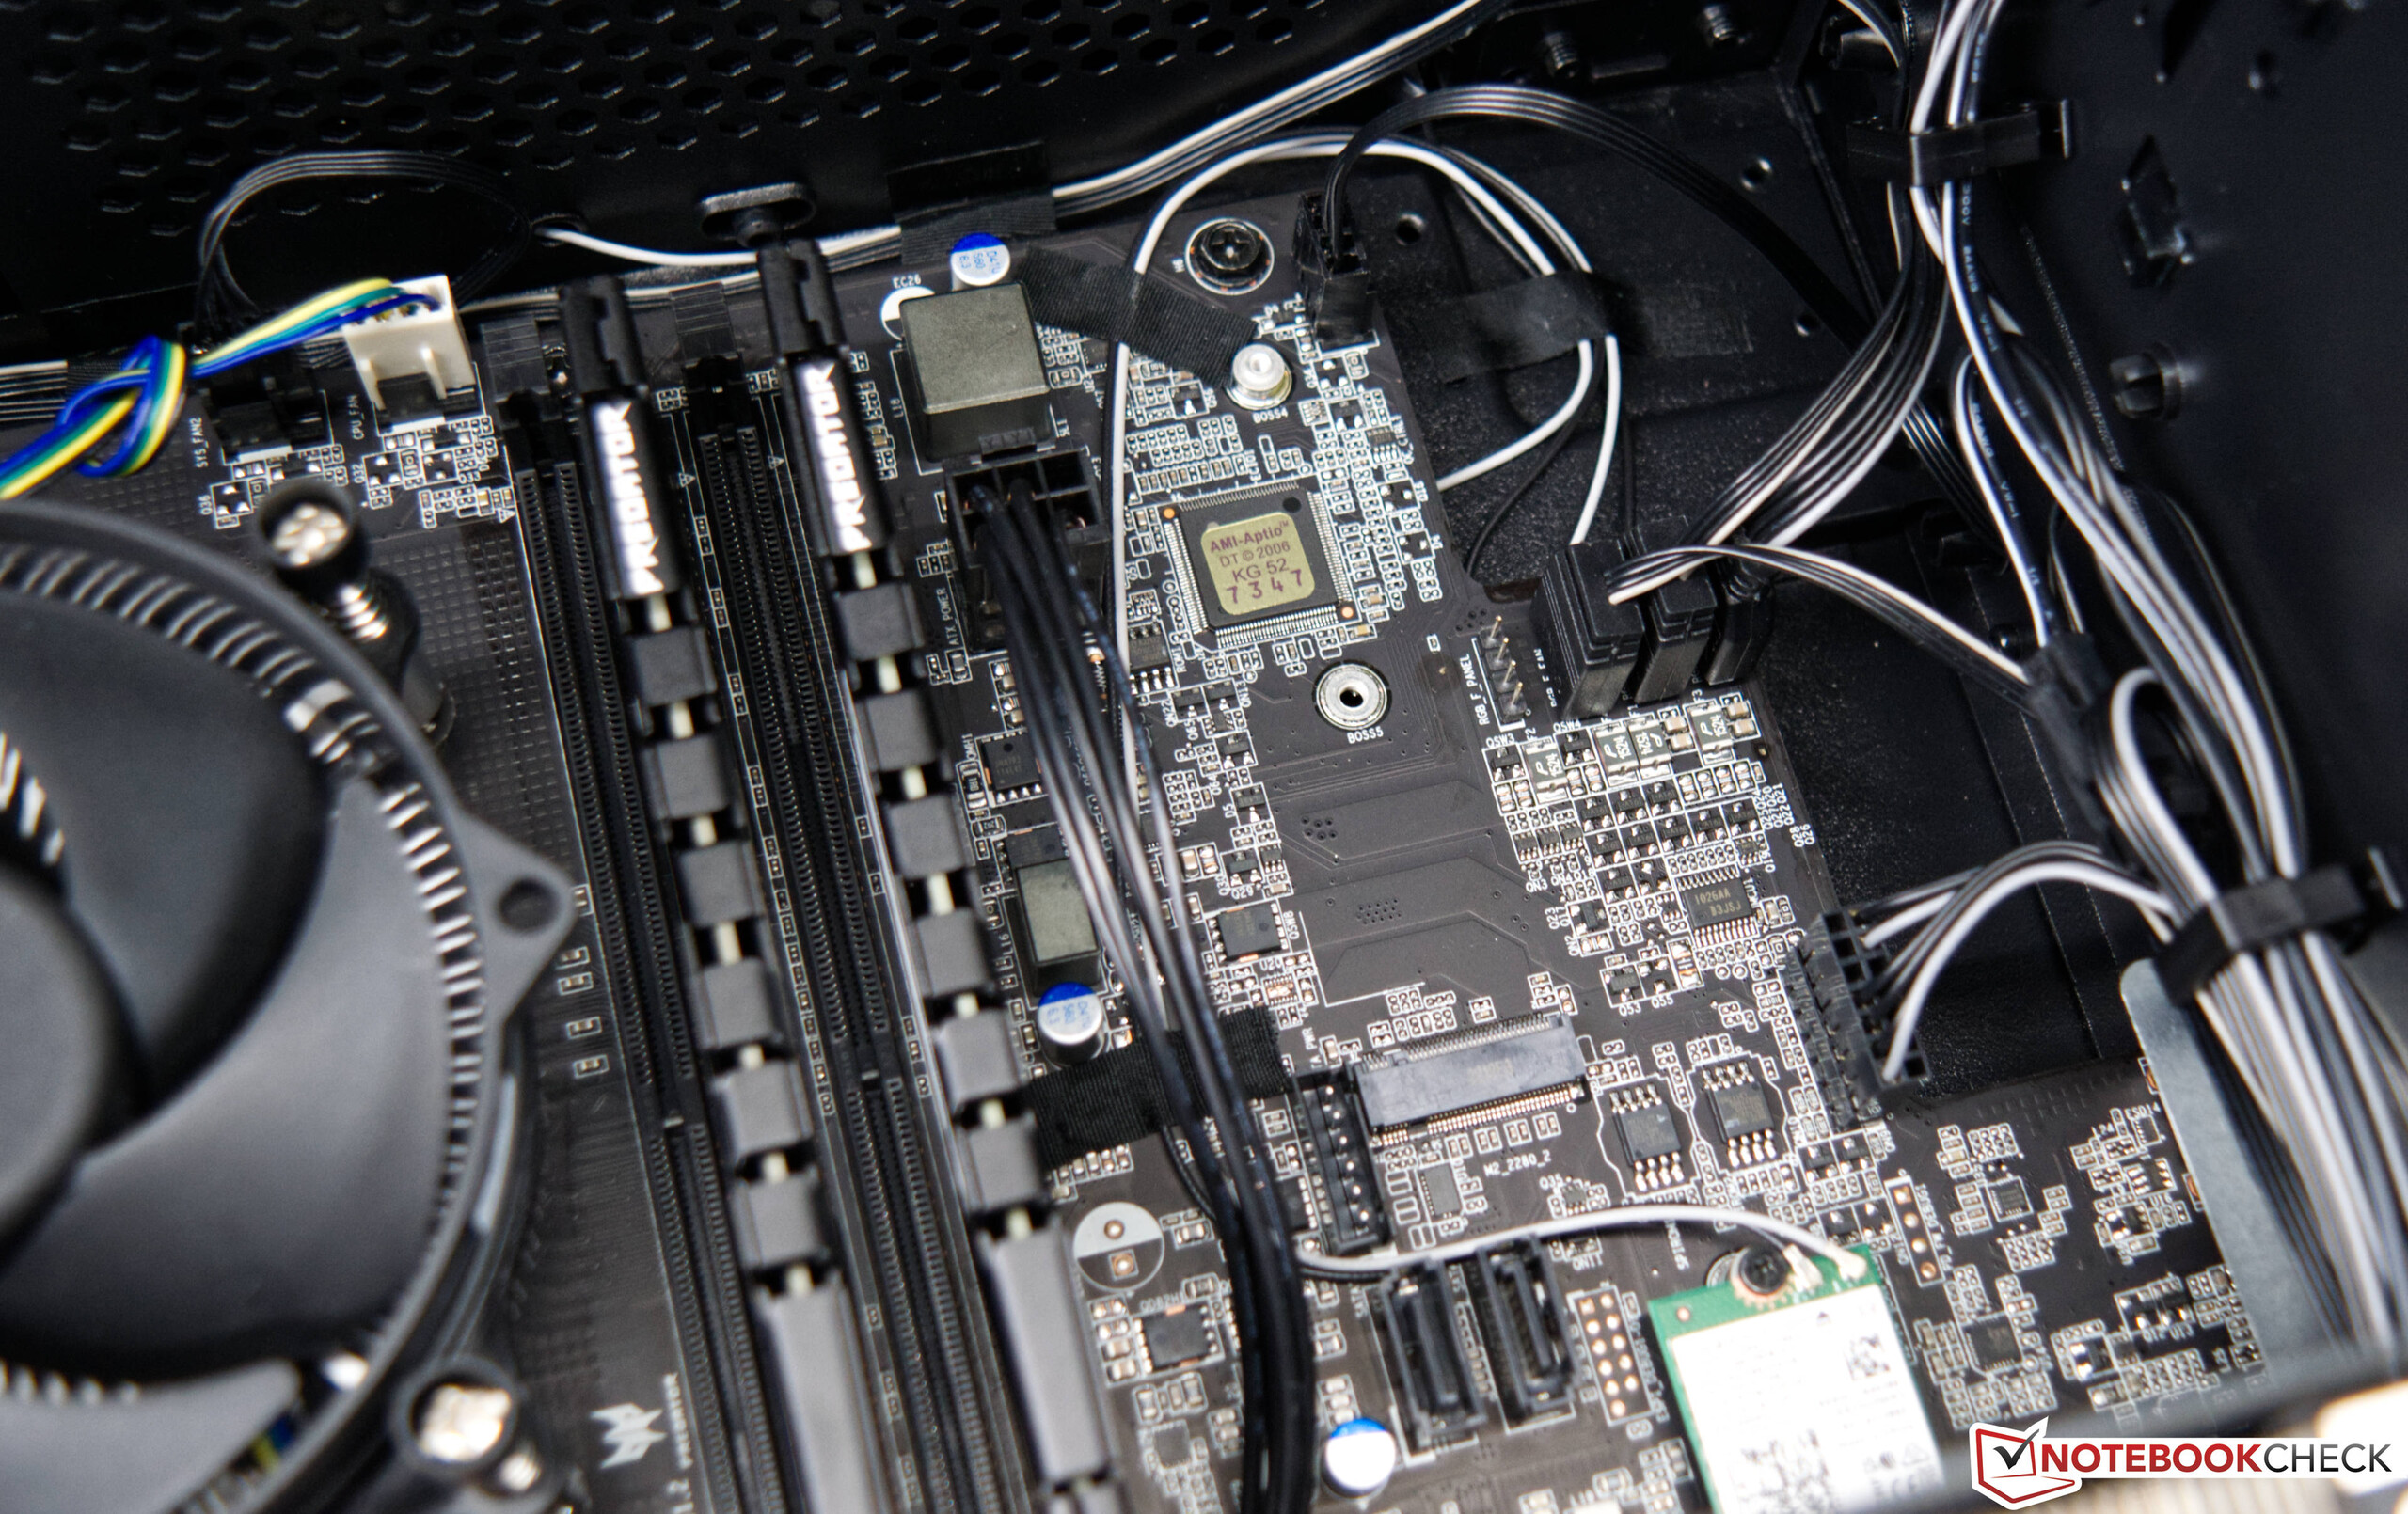
L'entretien n'est pas un gros problème pour l'Acer Predator Orion 3000. Le panneau latéral est fixé par deux vis et peut être retiré facilement. Les composants internes sont faciles d'accès. Par exemple, le stockage de masse peut être étendu avec un deuxième module M.2. Il est également possible de loger jusqu'à deux disques durs classiques de 3,5 pouces.
Performance - Core i7-12700F freinée
La version actuelle du Predator Orion 3000 d'Acer est toujours équipée d'un frugal processeur de 65 watts. Ainsi, le modèle le plus puissant est équipé du Intel Core i7-12700F. Ce dernier offre de très bonnes performances et peut toujours fournir la meilleure vitesse pour l'application respective grâce à l'architecture hybride avec des cœurs E et P. Dans une configuration moins chère, vous pouvez également obtenir le Predator Orion 3000 avec un Intel Core i5-12400. Ce dernier offre également de bonnes performances de jeu mais doit se passer des noyaux E. En ce qui concerne la carte graphique, vous obtenez au moins une GeForce RTX 3060qui est conçue pour les jeux 1080p. Des performances supérieures sont disponibles avec la GeForce RTX 3070qui permet également de jouer en 1440p.
Conditions d'essai
Nous avons effectué tous les tests avec le profil énergétique de performance maximale
. Nous n'avons pas non plus utilisé le panneau latéral transparent du boîtier. La vitesse des ventilateurs peut également être configurée via l'outil Predator Sense
. Nous avons conservé le réglage automatique pour obtenir un bon compromis entre le bruit et les performances.
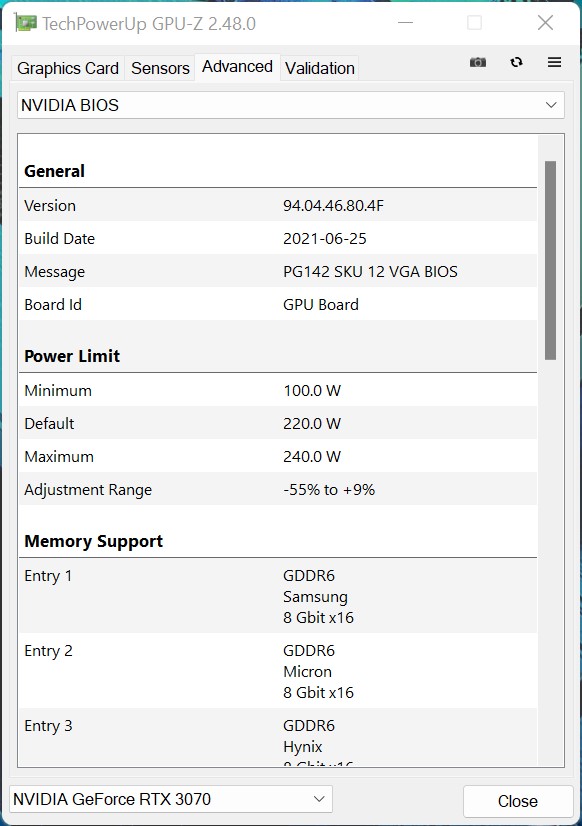
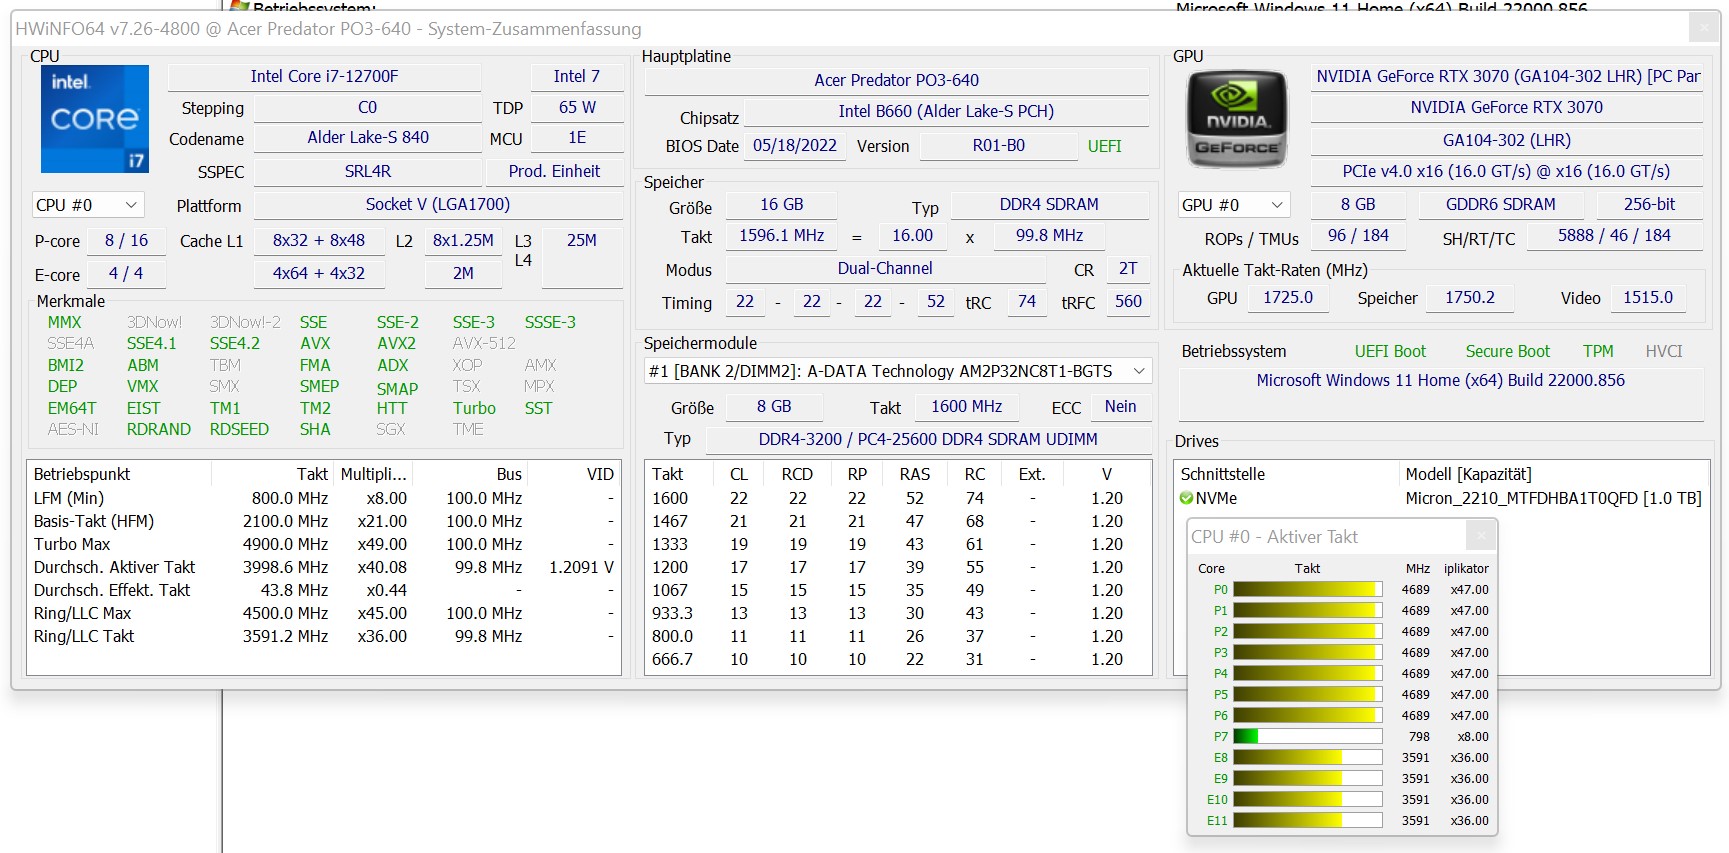
Processeur
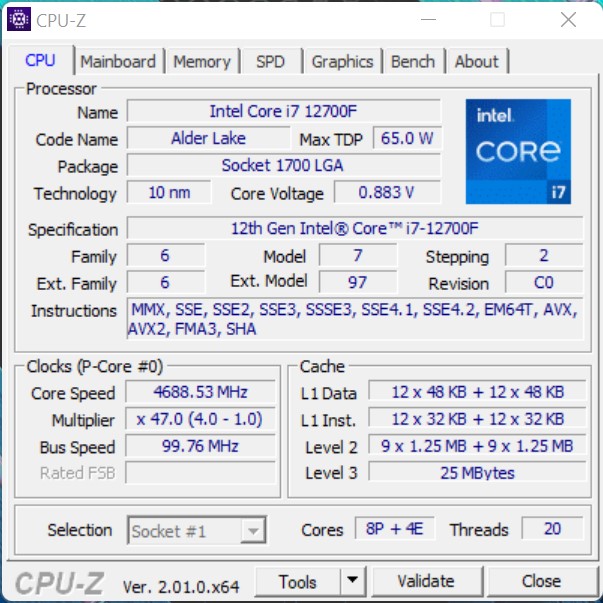
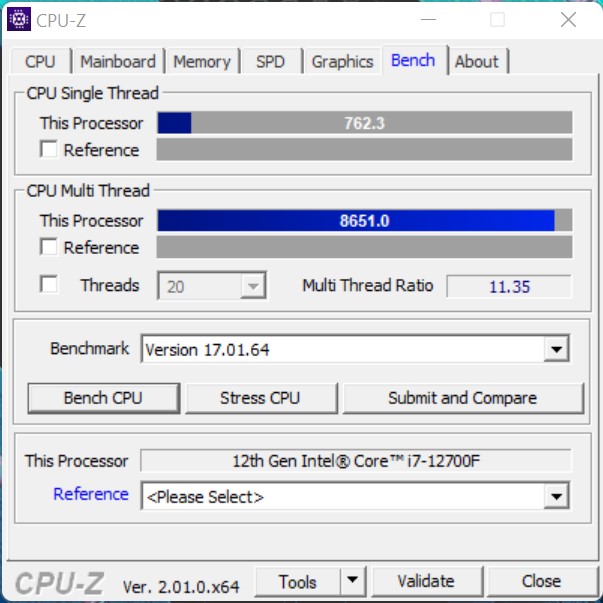
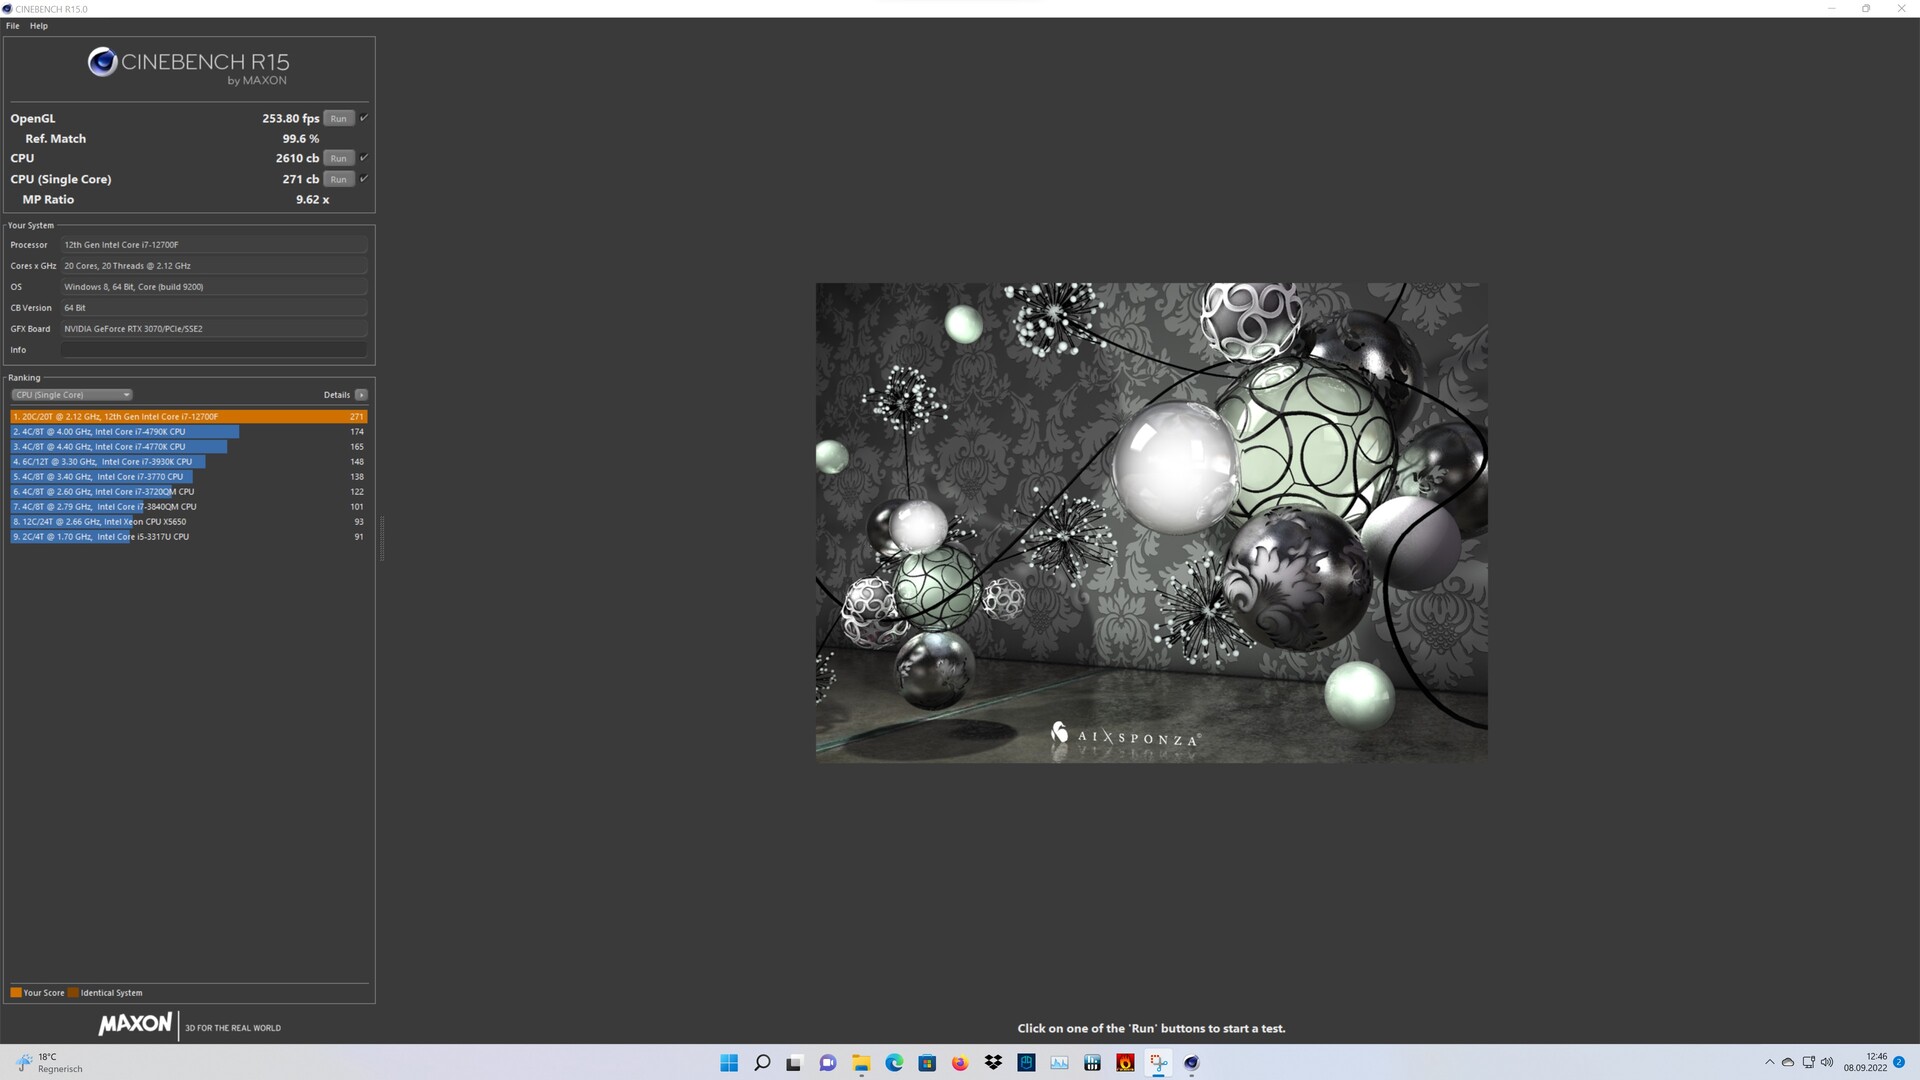
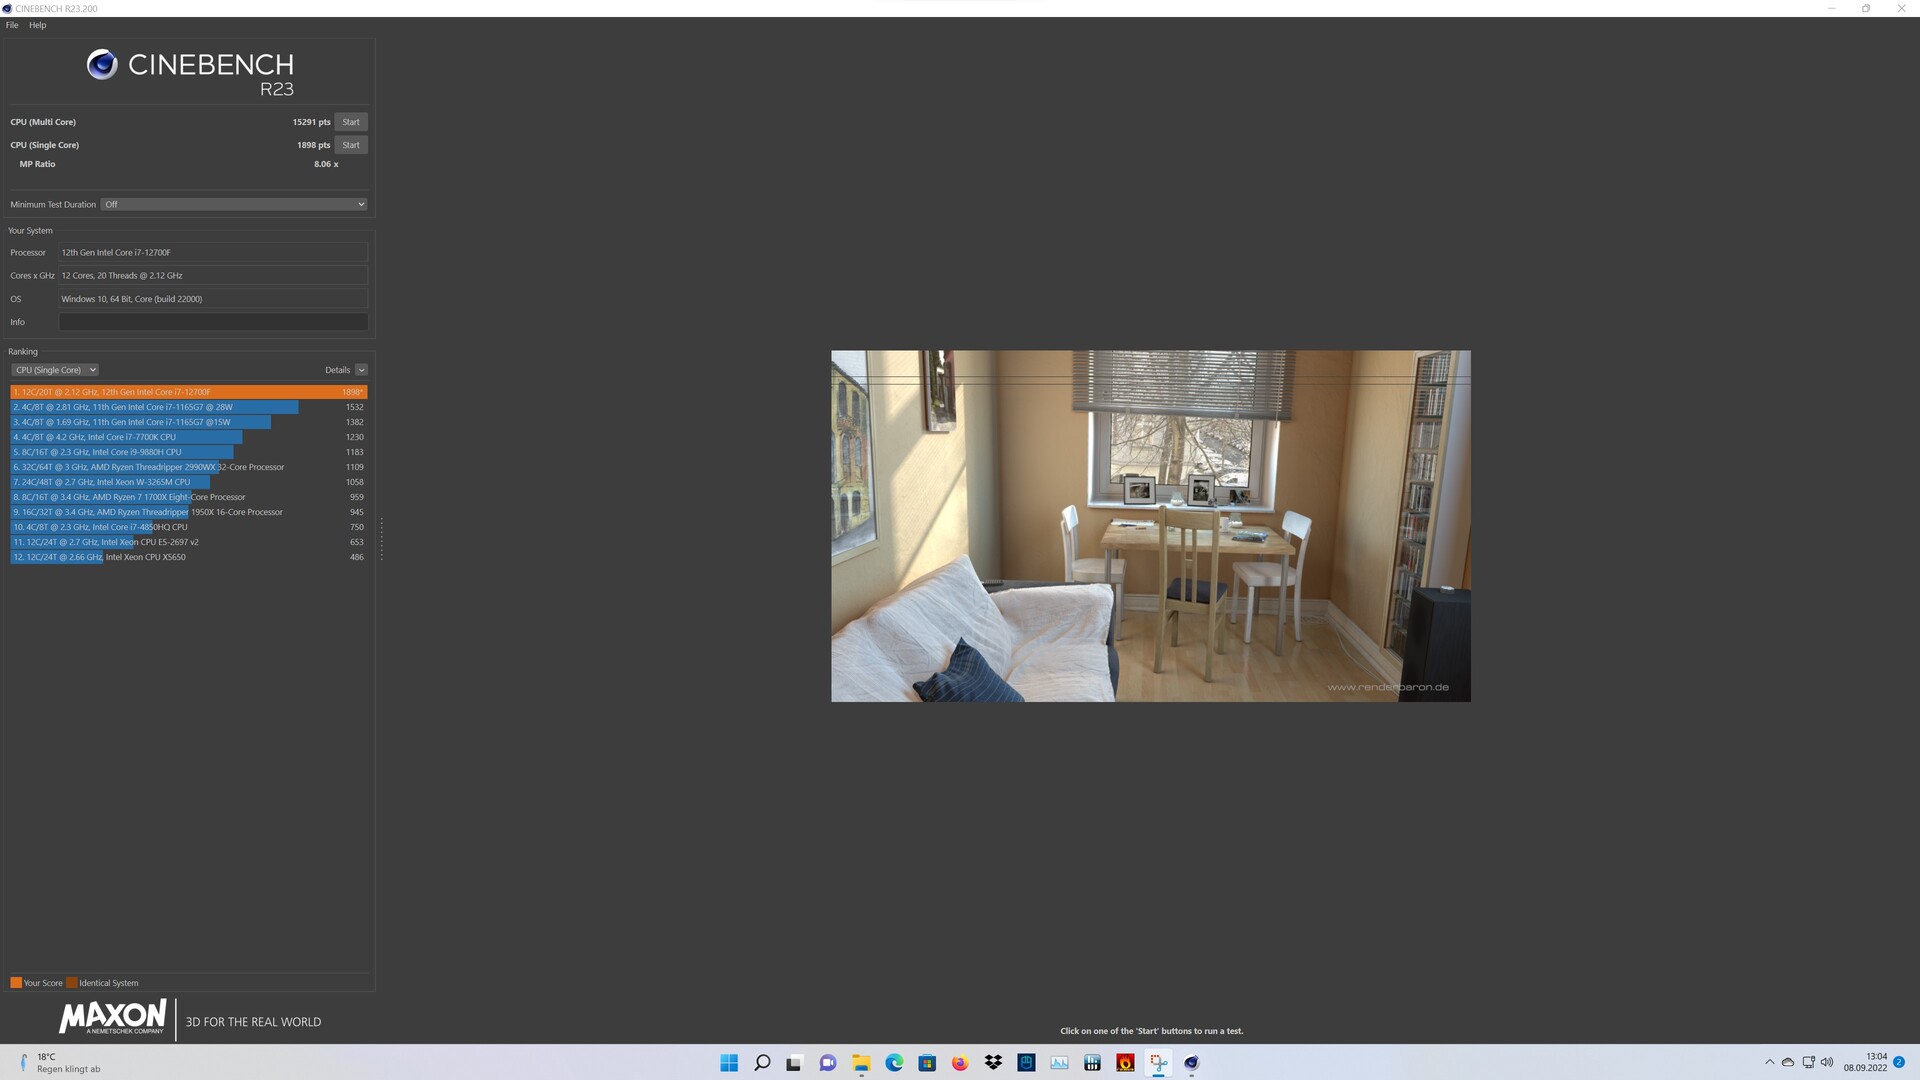
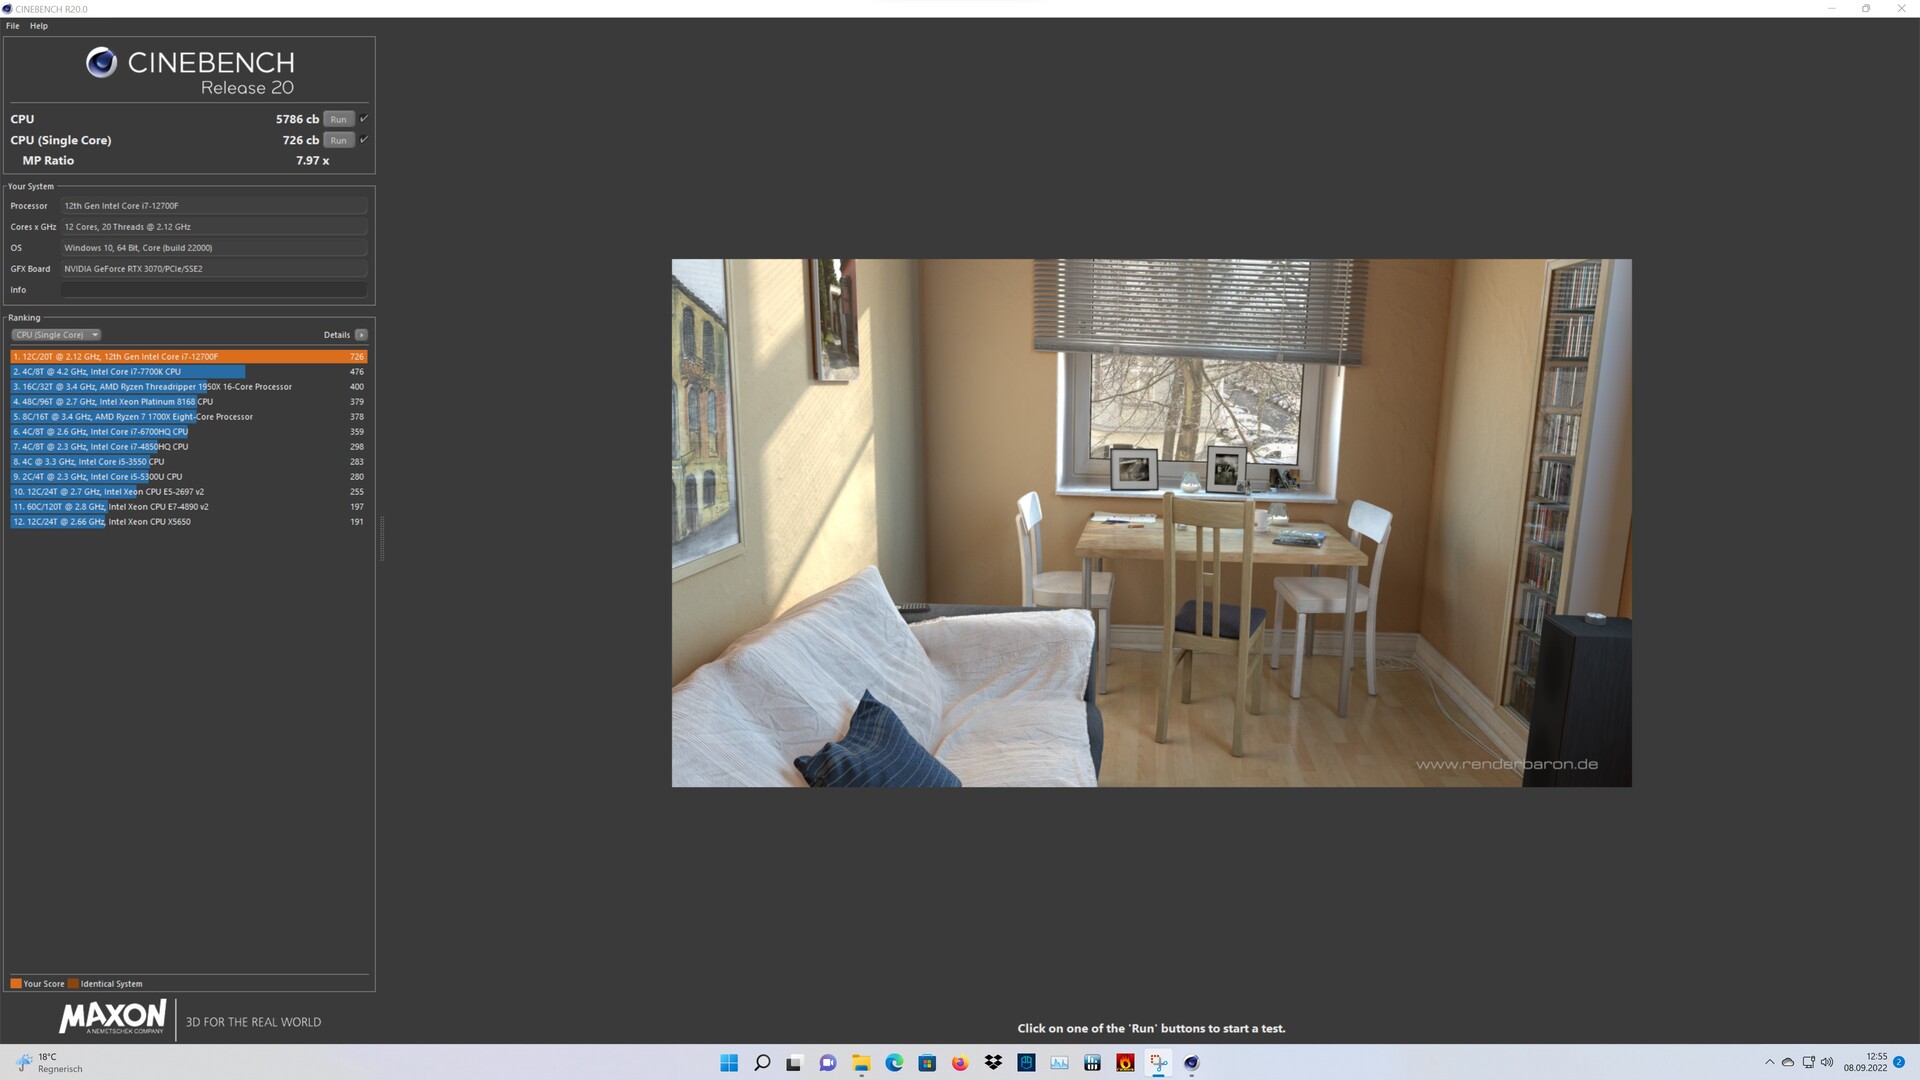
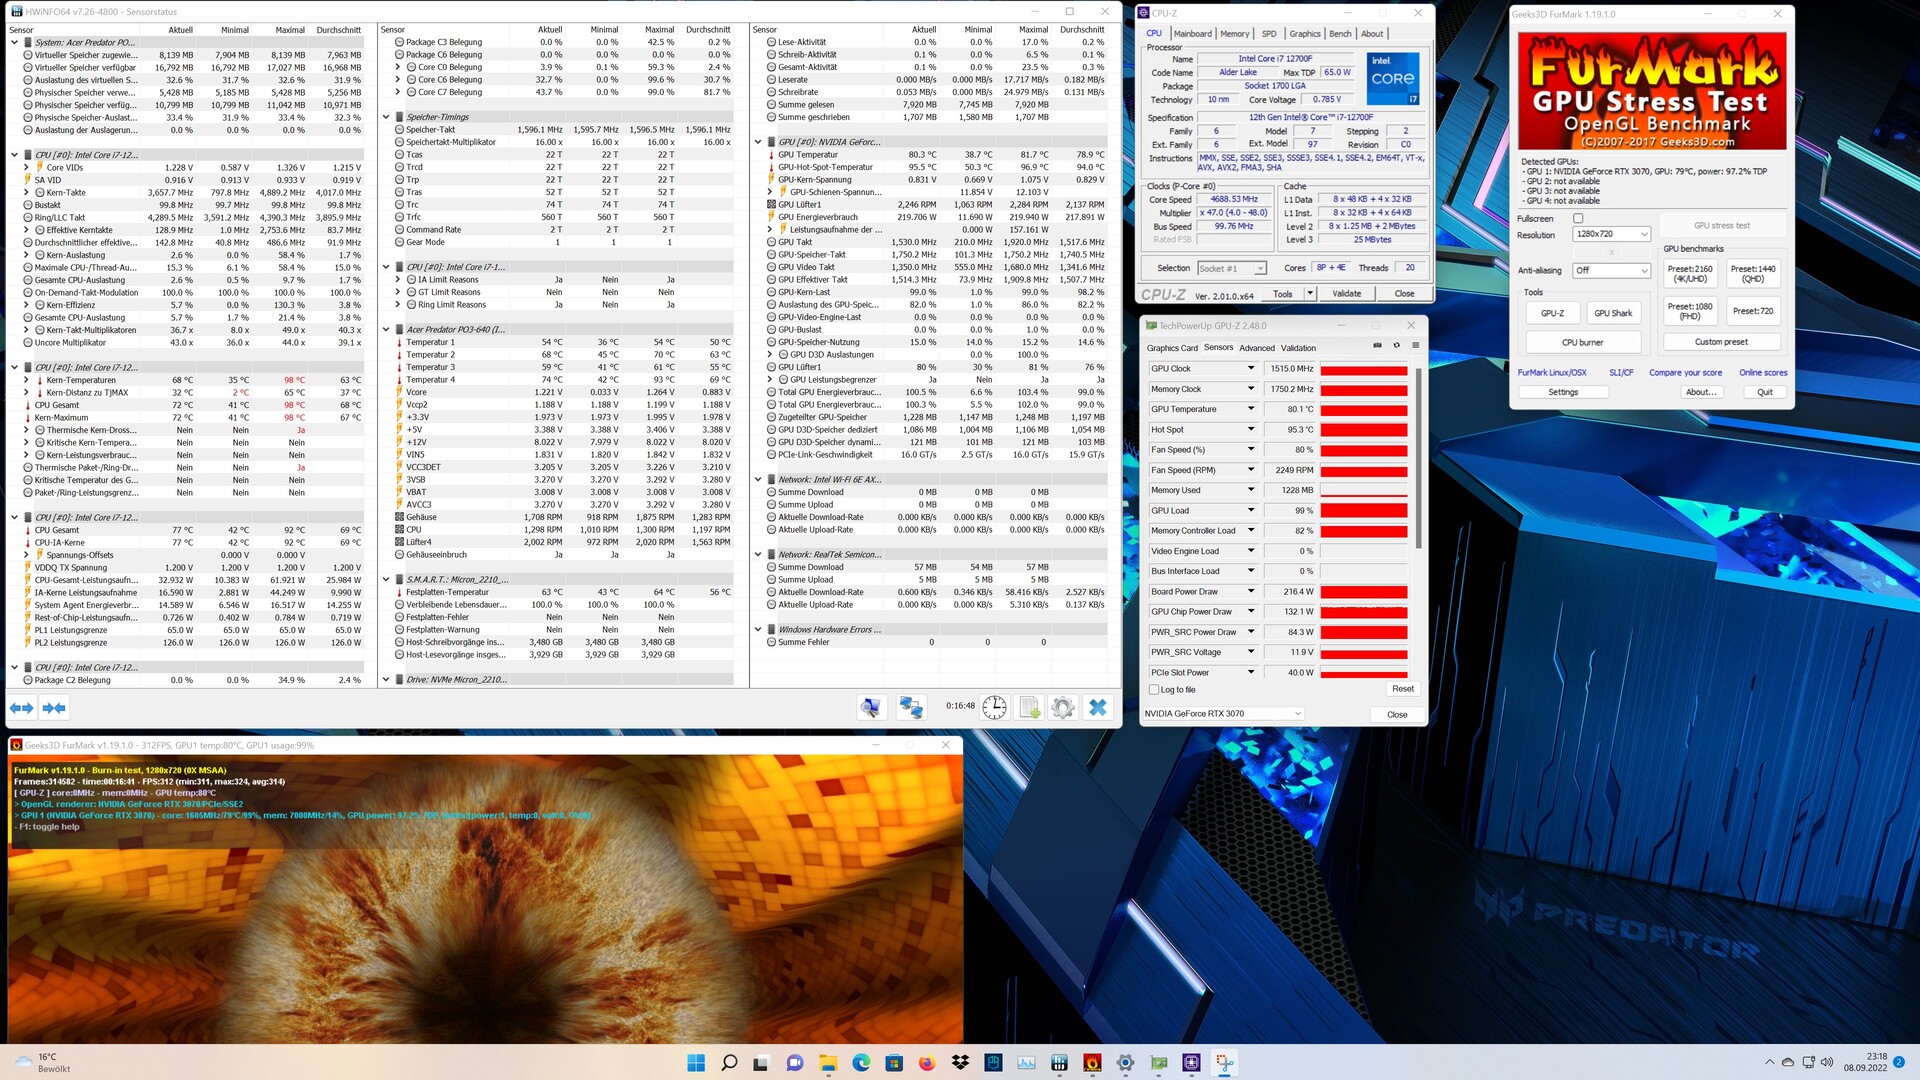
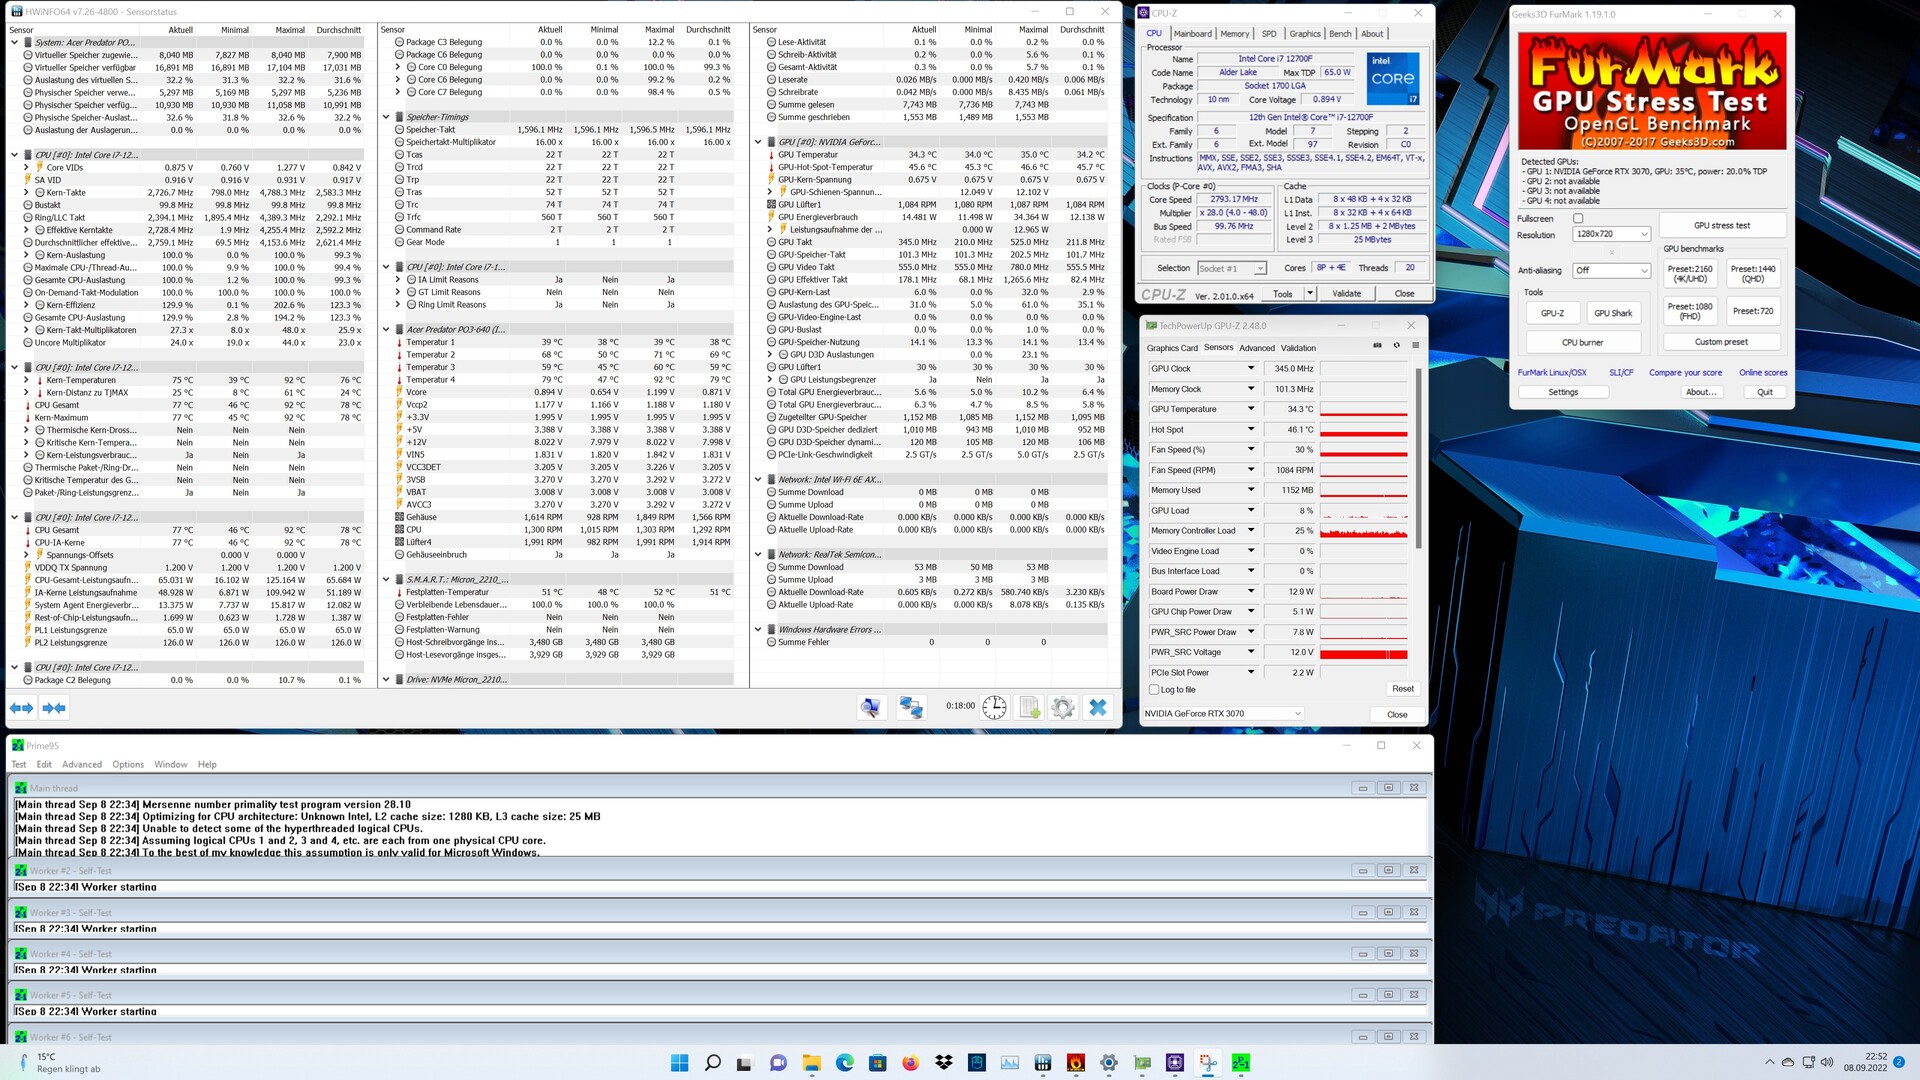
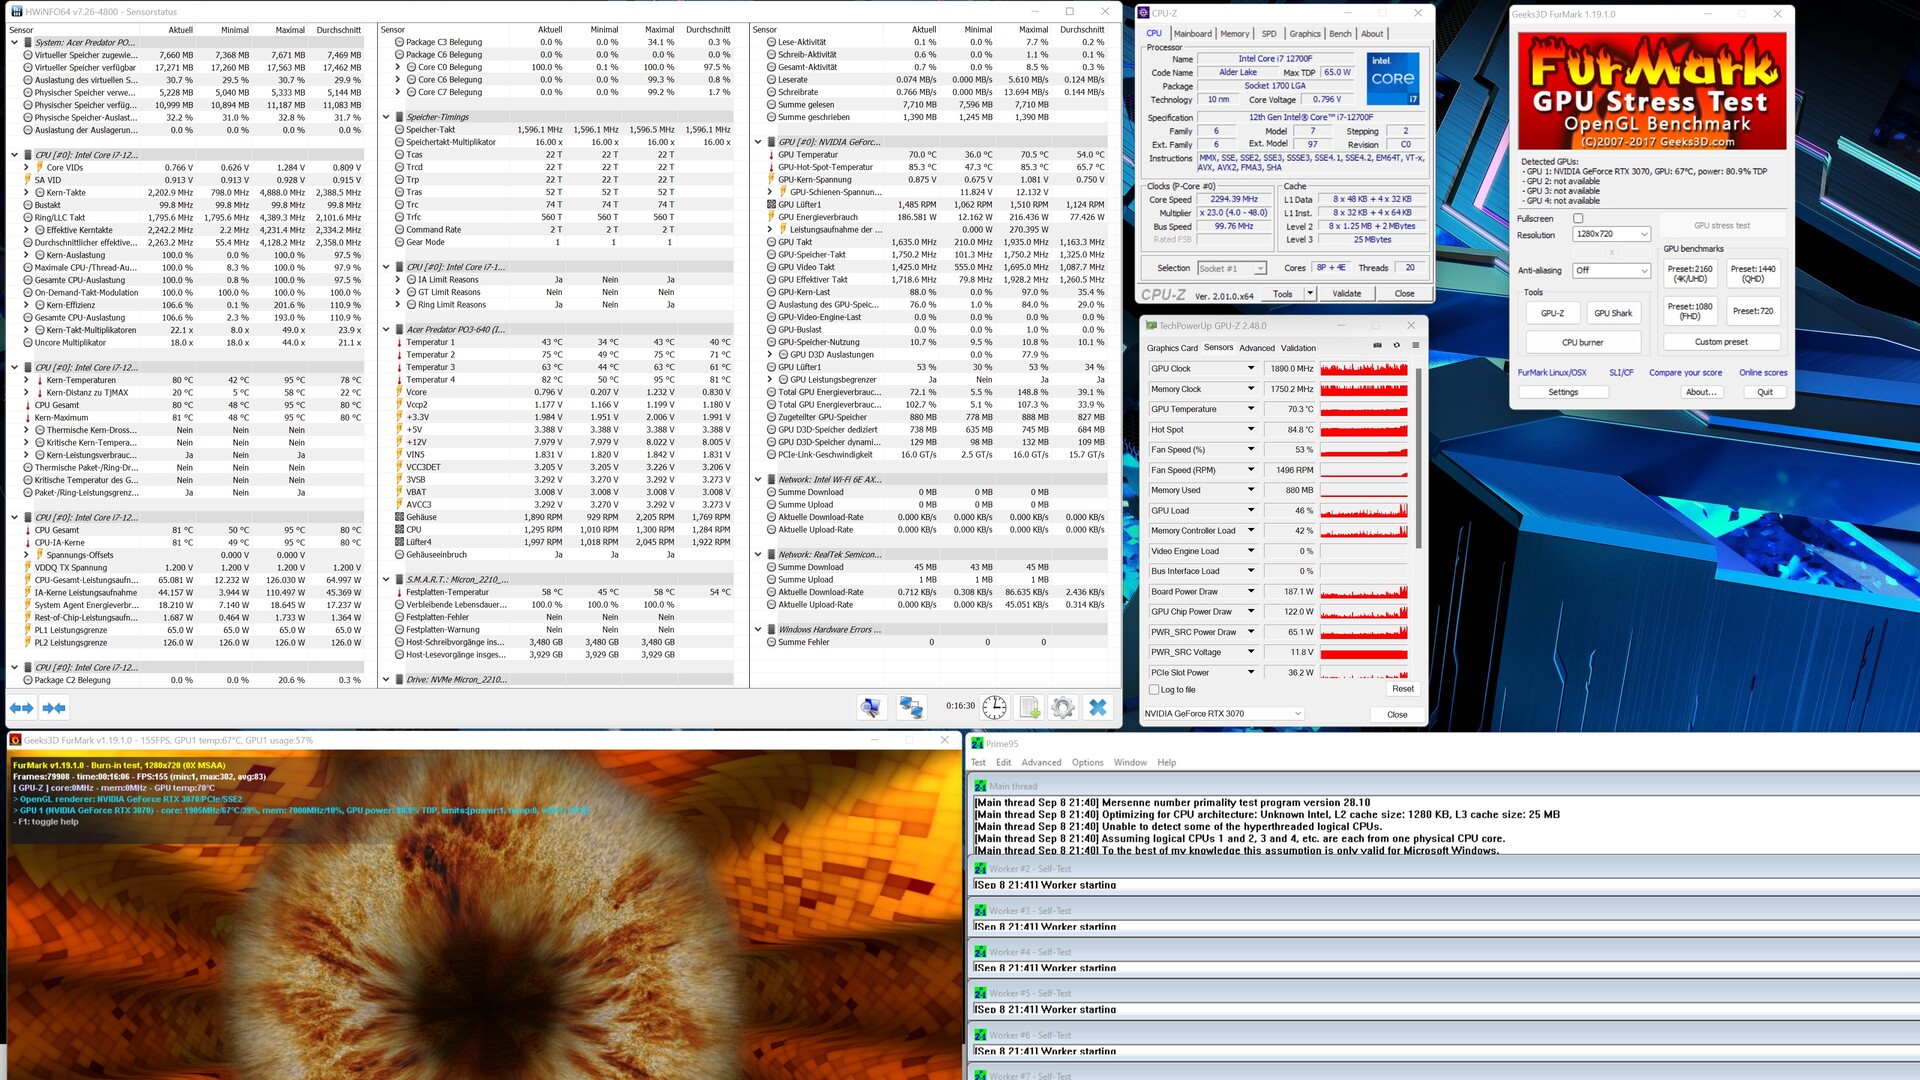
Avec le Intel Core i7-12700Fle Predator Orion 3000 de cette revue est équipé du modèle le plus rapide qu'Acer propose pour ce PC. Le SoC de 65 watts offre 8 P-cores et 4 E-cores, qui ensemble peuvent traiter jusqu'à 20 threads simultanément. Cependant, Acer restreint quelque peu l'Intel Core i7-12700F en ce qui concerne la puissance maximale, puisque le PL2 est normalement de 180 watts pour ce modèle. Acer, en revanche, limite ici la consommation électrique maximale à 126 watts pour un maximum de 28 secondes. Par rapport aux autres appareils de comparaison, l'Acer Predator Orion 3000 peut tout de même obtenir un bon résultat. Néanmoins, le fabricant cède des performances pour un meilleur résultat global.
Pour d'autres comparaisons et benchmarks, nous vous renvoyons à notreTableau comparatif des CPU.
* ... Moindre est la valeur, meilleures sont les performances
AIDA64: FP32 Ray-Trace | FPU Julia | CPU SHA3 | CPU Queen | FPU SinJulia | FPU Mandel | CPU AES | CPU ZLib | FP64 Ray-Trace | CPU PhotoWorxx
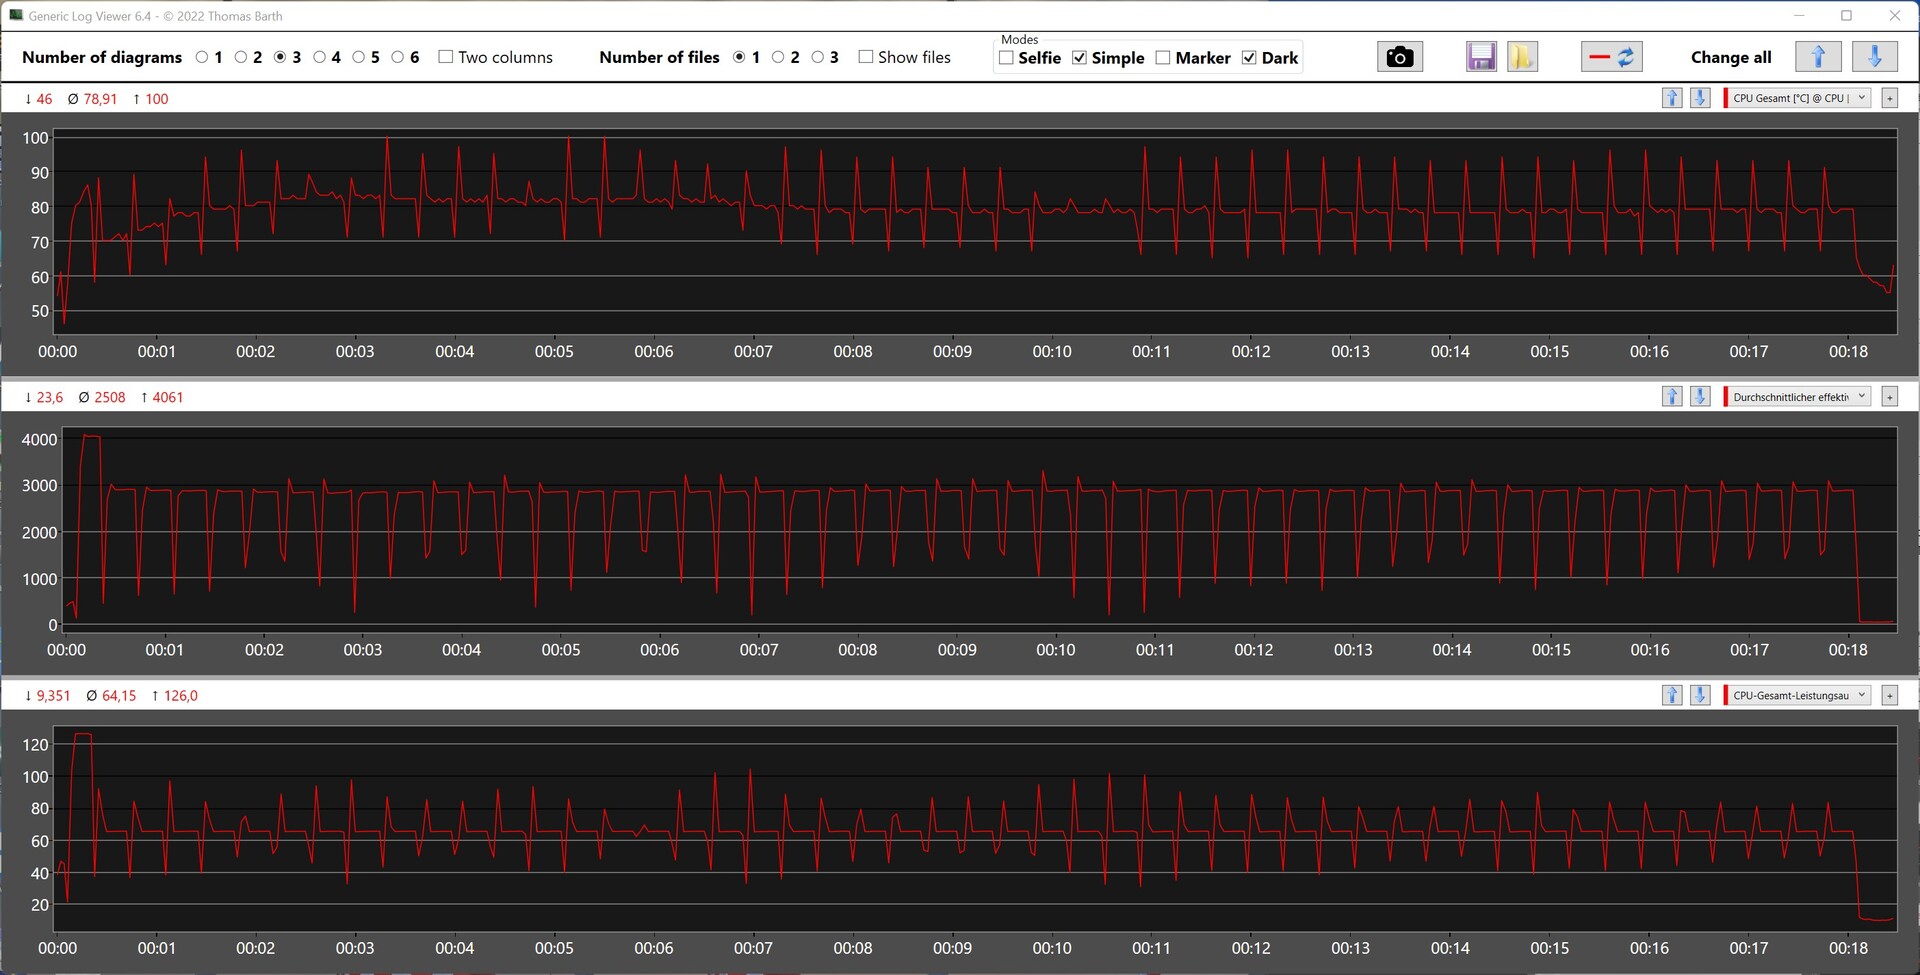
Acer Predator Orion 3000 dans la boucle multiple de Cinebench R15
Nous avons un premier aperçu de l'efficacité du refroidissement intégré lors de la boucle continue de Cinebench R15. Après la première exécution, les performances chutent drastiquement car l'augmentation du PL2 ne peut être maintenue que plus longtemps lors de la première exécution que lors des exécutions suivantes. Les mesures du CPU enregistrées pendant le test le montrent très bien.
Performance du système
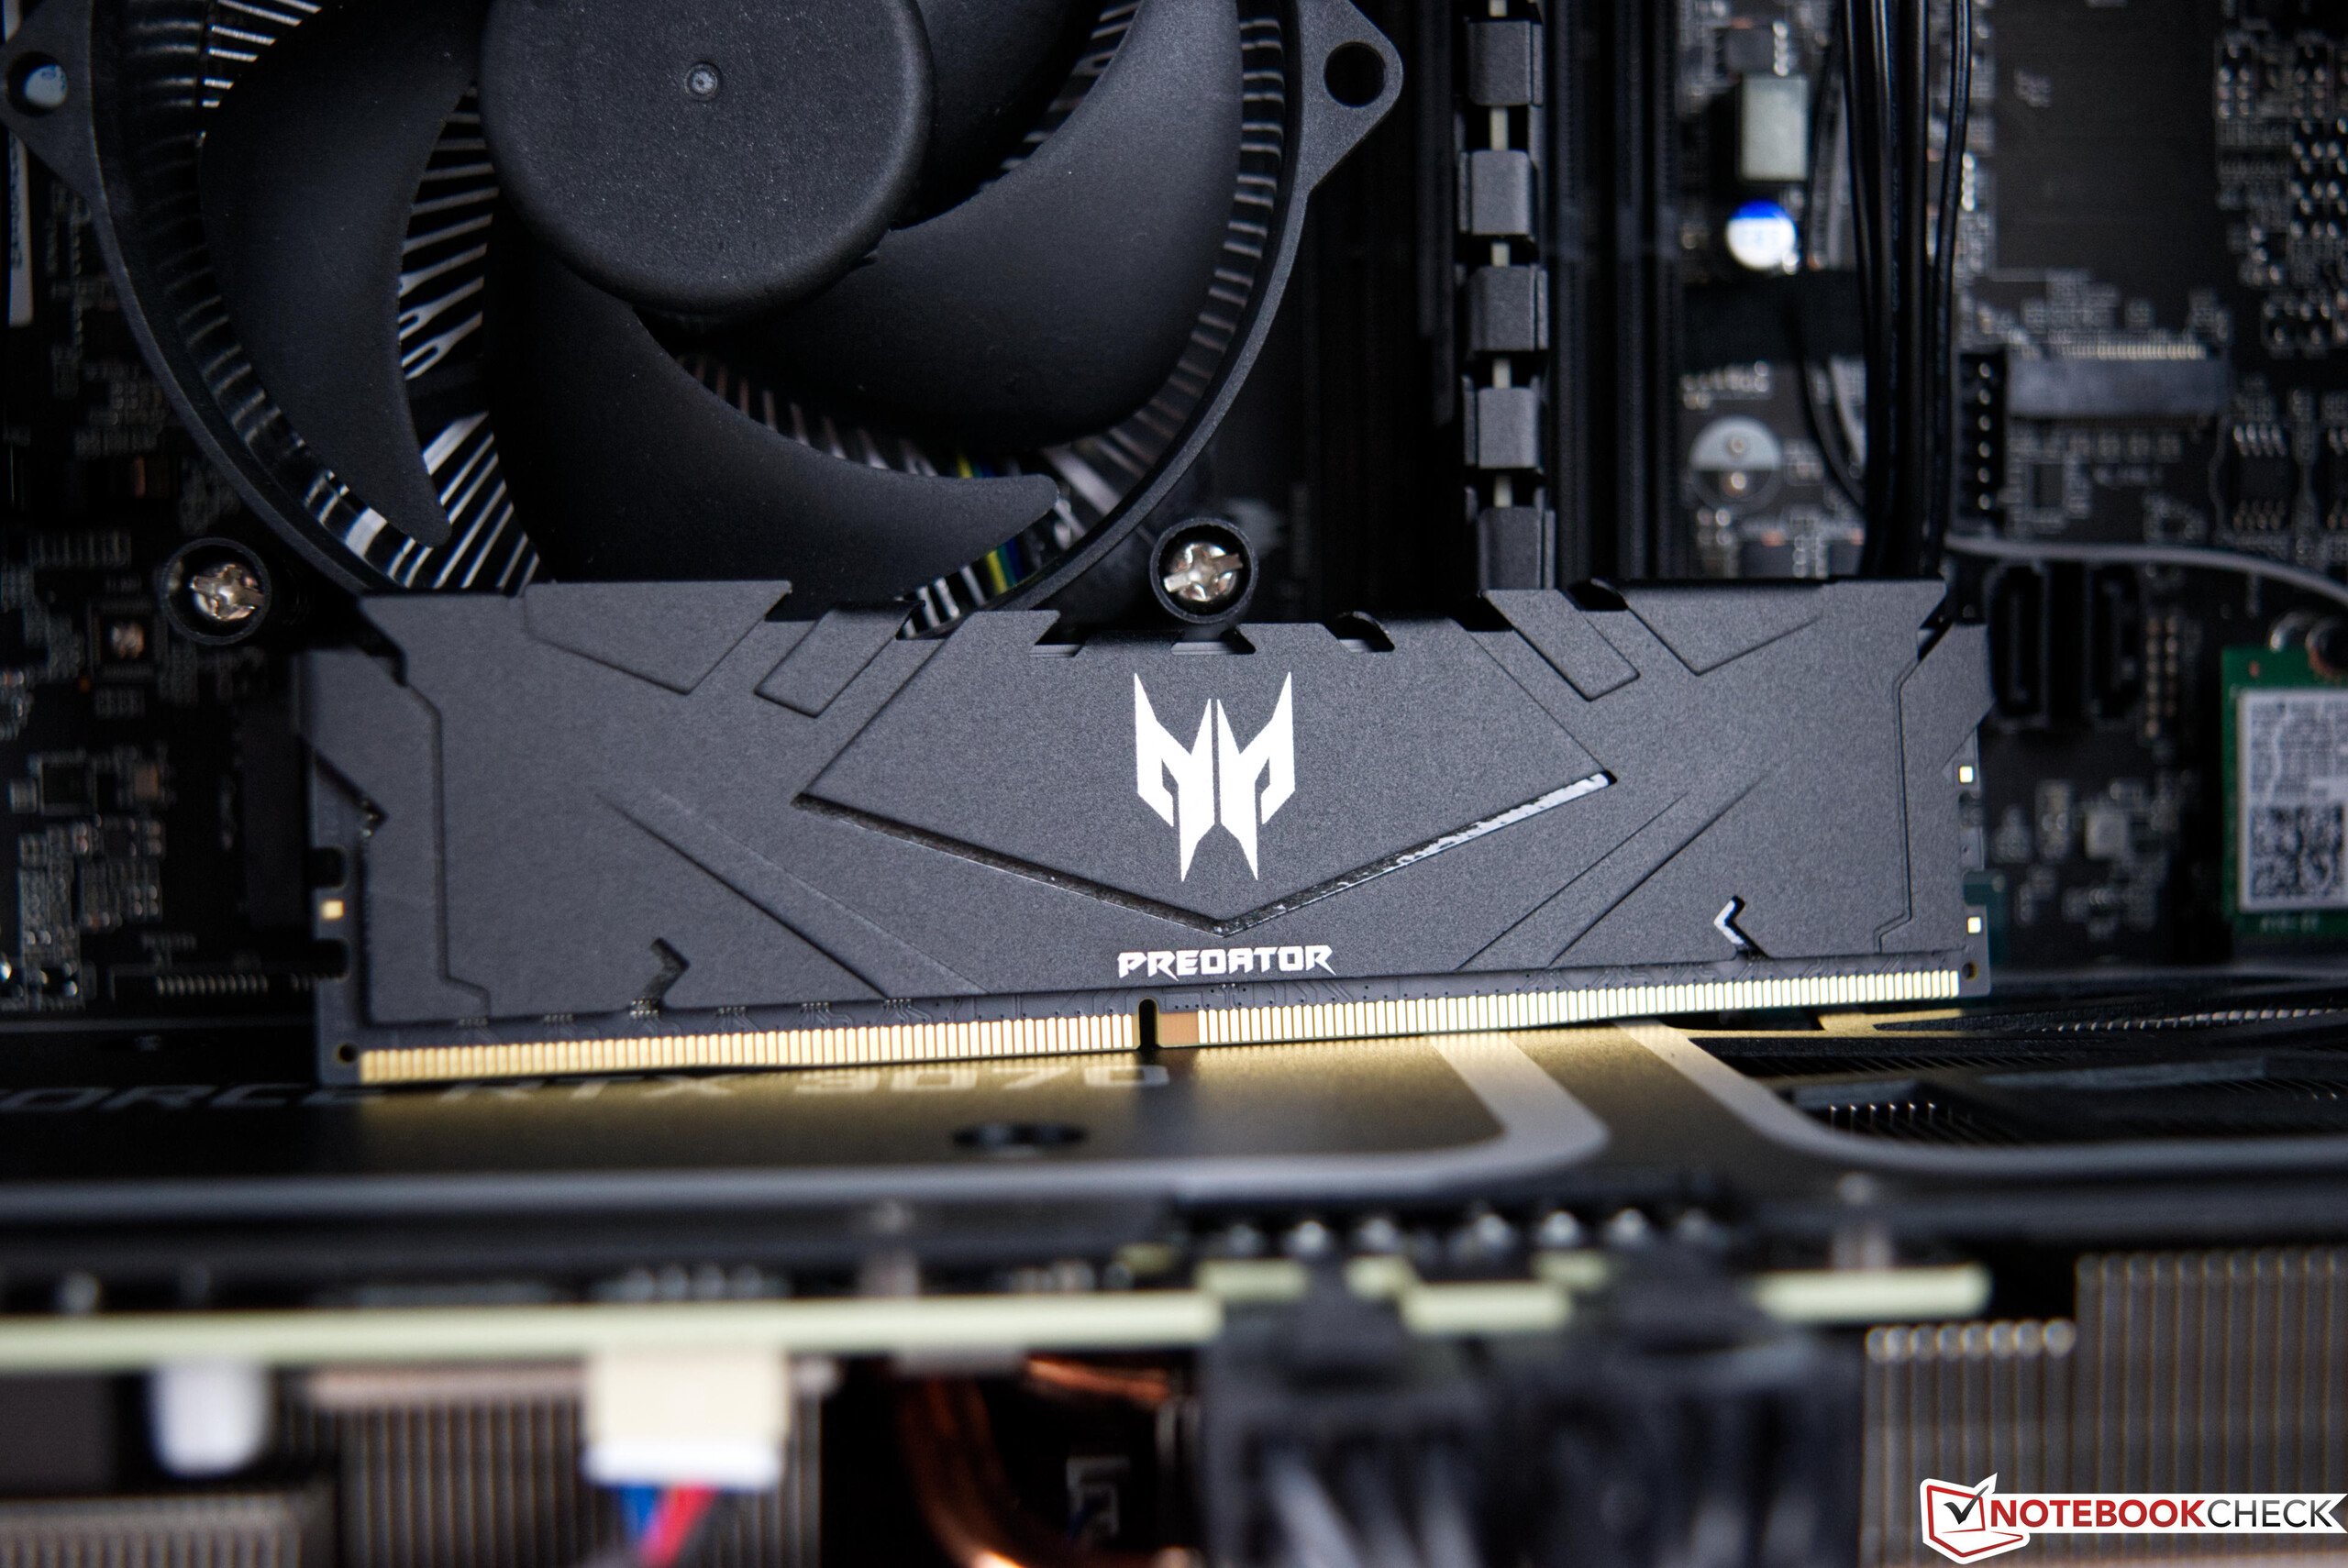
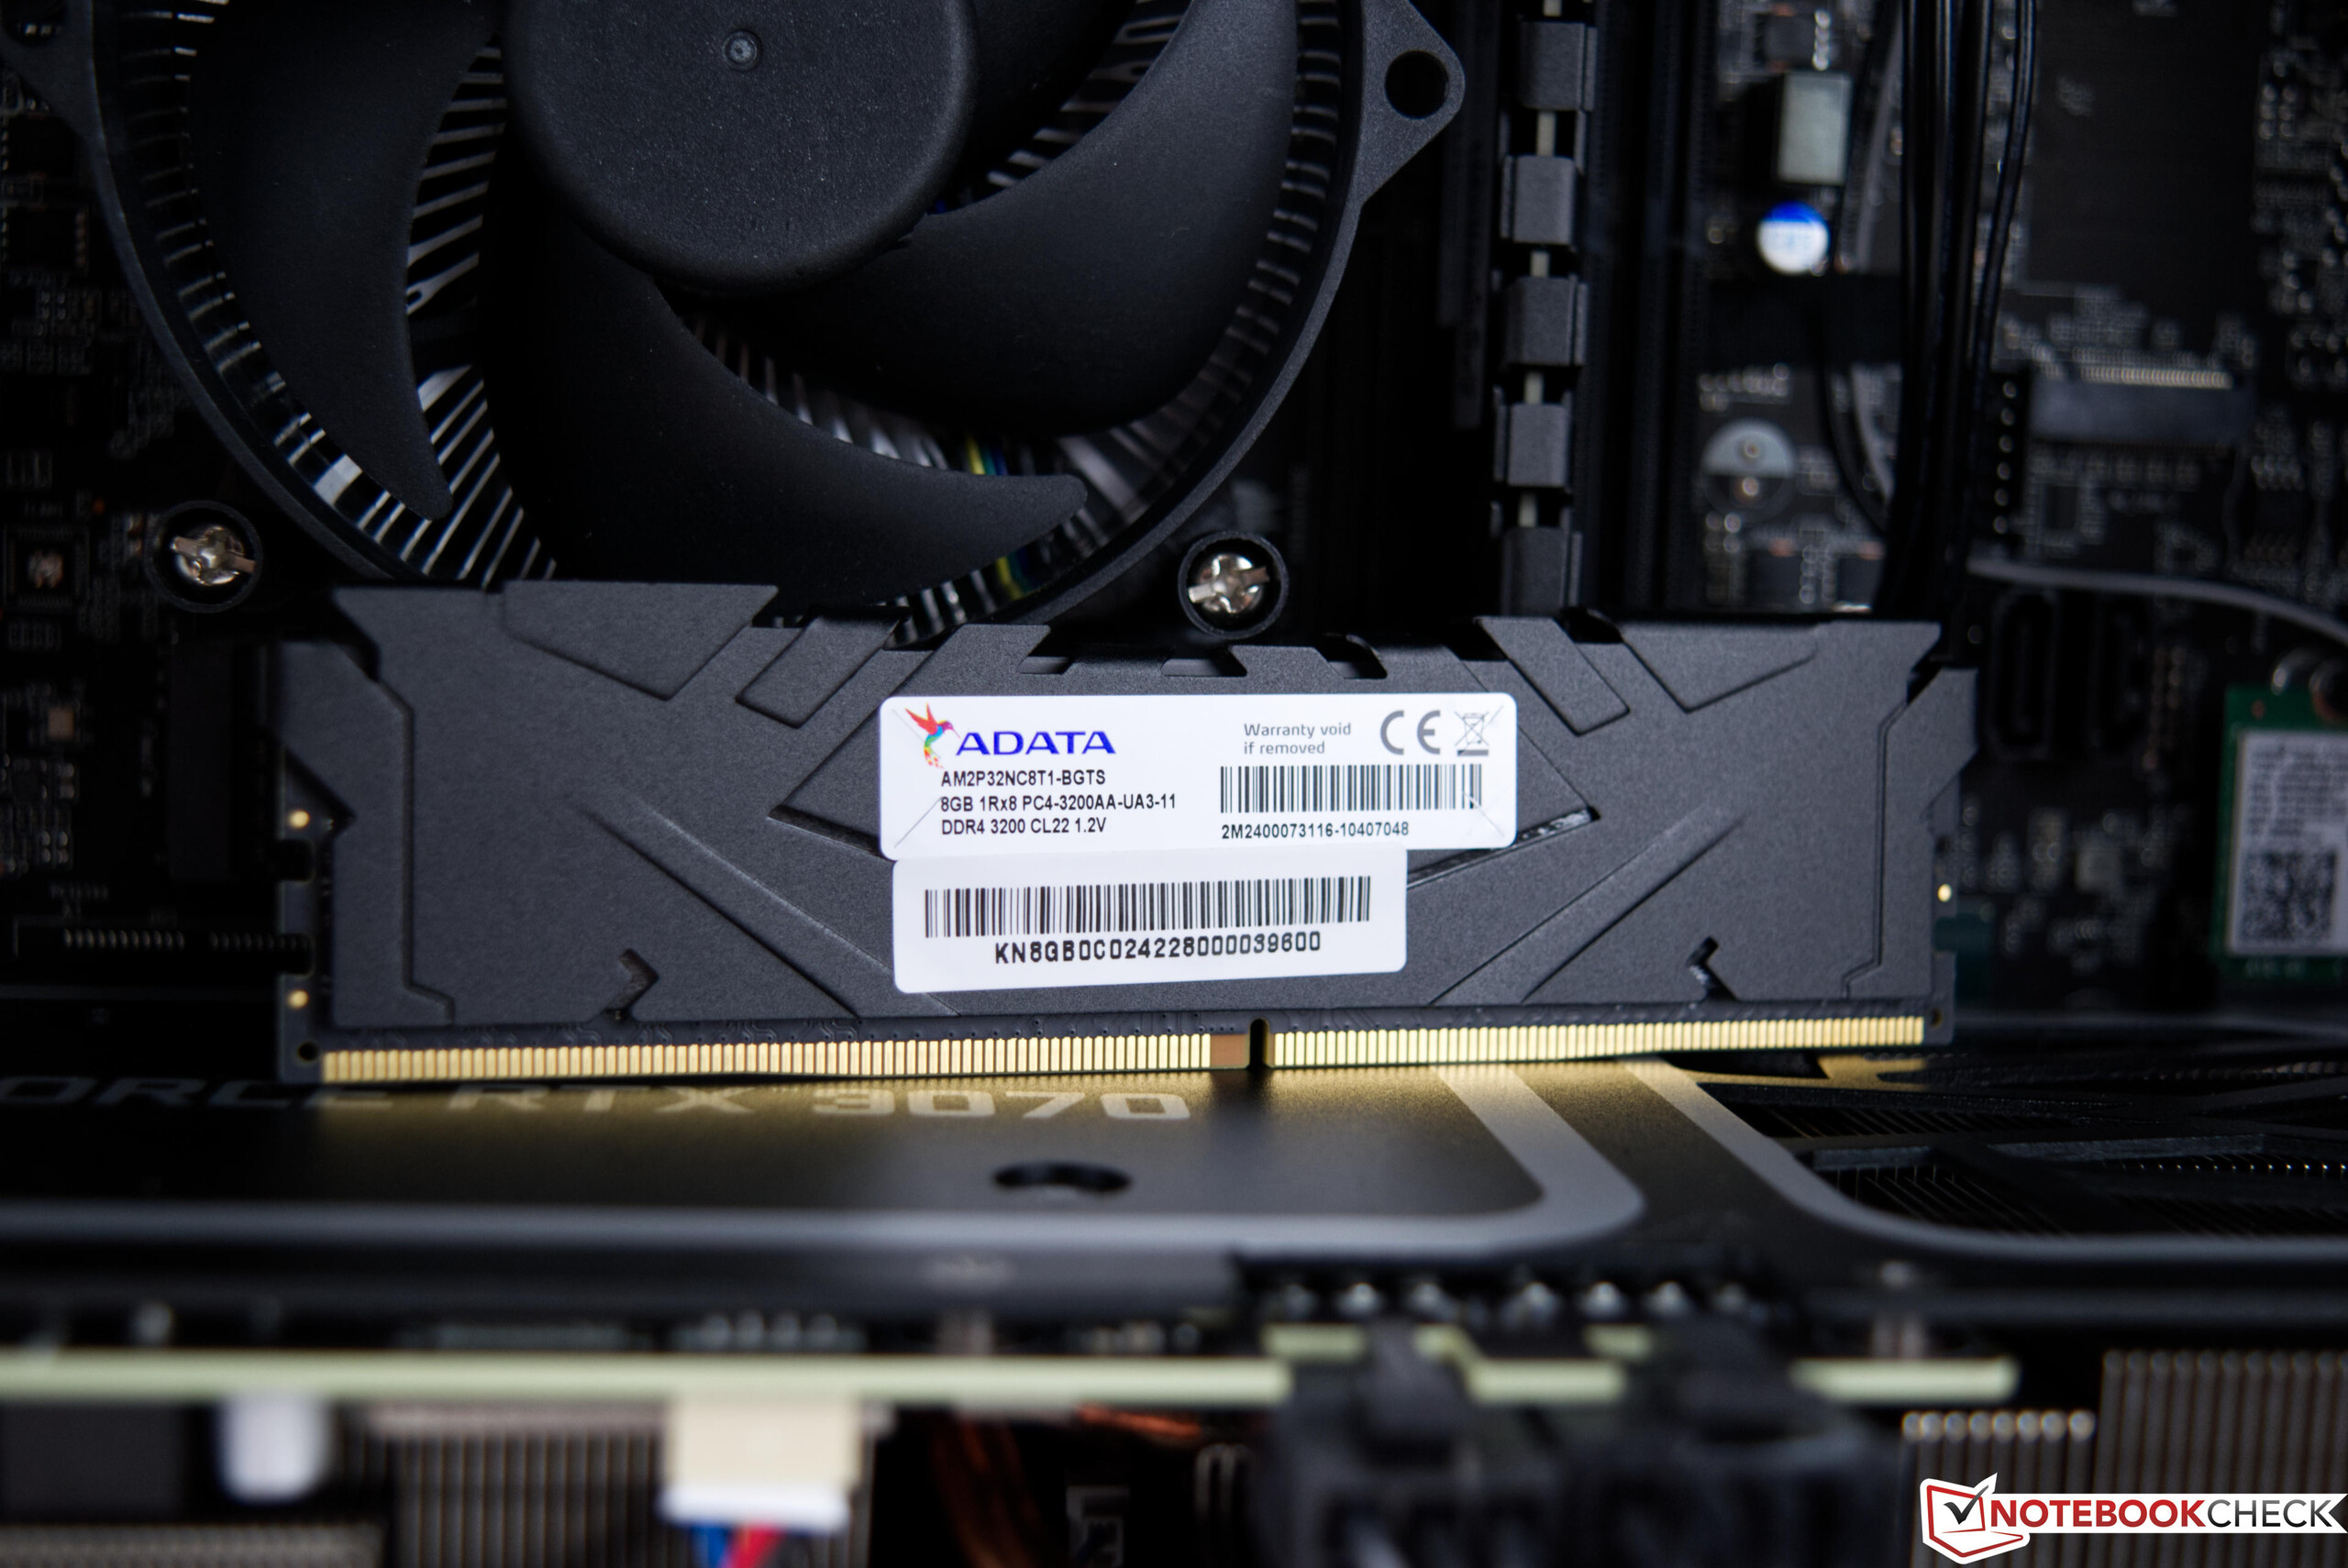
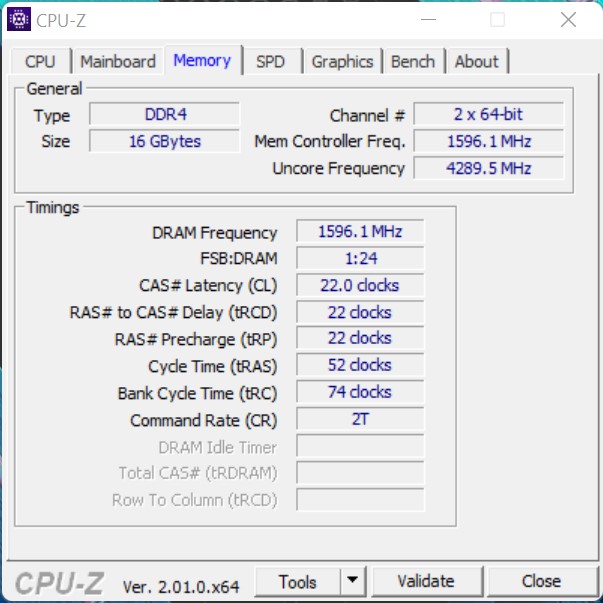
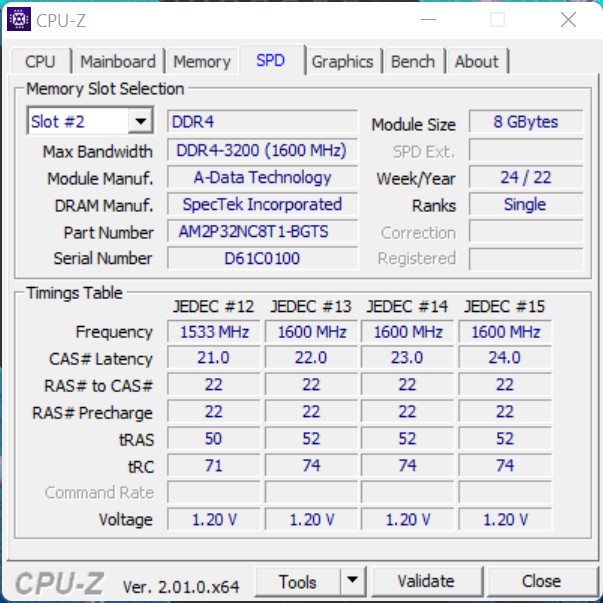
Le fait que les benchmarks de performance du système ne fassent pas appel à la totalité des performances en permanence convient clairement à l'Acer Predator Orion 3000. Les résultats sont bons et ne sont inférieurs que de quelques points de pourcentage à ceux du NUC Intel Dragon Canyon avec Intel Core i9-12900. La mémoire de travail se comporte assez bien par rapport aux appareils de comparaison ici dans le test, bien qu'un peu plus de performance pourrait être atteint avec une RAM plus rapide et des latences plus faibles.
| AIDA64 / Memory Copy | |
| Moyenne de la classe Desktop (54743 - 98416, n=21, 2 dernières années) | |
| Acer Predator Orion 3000 PO3-640 | |
| Moyenne Intel Core i7-12700F (n=1) | |
| Intel Beast Canyon NUC | |
| Intel Dragon Canyon NUC - RTX 3060 | |
| Zotac ZBOX Magnus EN173070C | |
| Zotac MEK Mini (RTX 2070 Super) | |
| AIDA64 / Memory Read | |
| Moyenne de la classe Desktop (58375 - 110448, n=21, 2 dernières années) | |
| Zotac ZBOX Magnus EN173070C | |
| Acer Predator Orion 3000 PO3-640 | |
| Moyenne Intel Core i7-12700F (n=1) | |
| Intel Beast Canyon NUC | |
| Intel Dragon Canyon NUC - RTX 3060 | |
| Zotac MEK Mini (RTX 2070 Super) | |
| AIDA64 / Memory Write | |
| Moyenne de la classe Desktop (60635 - 93889, n=21, 2 dernières années) | |
| Zotac ZBOX Magnus EN173070C | |
| Intel Beast Canyon NUC | |
| Intel Dragon Canyon NUC - RTX 3060 | |
| Acer Predator Orion 3000 PO3-640 | |
| Moyenne Intel Core i7-12700F (n=1) | |
| Zotac MEK Mini (RTX 2070 Super) | |
| AIDA64 / Memory Latency | |
| Moyenne de la classe Desktop (68.5 - 168, n=21, 2 dernières années) | |
| Intel Beast Canyon NUC | |
| Intel Dragon Canyon NUC - RTX 3060 | |
| Zotac ZBOX Magnus EN173070C | |
| Acer Predator Orion 3000 PO3-640 | |
| Moyenne Intel Core i7-12700F (n=1) | |
| Zotac MEK Mini (RTX 2070 Super) | |
* ... Moindre est la valeur, meilleures sont les performances
Latences DPC
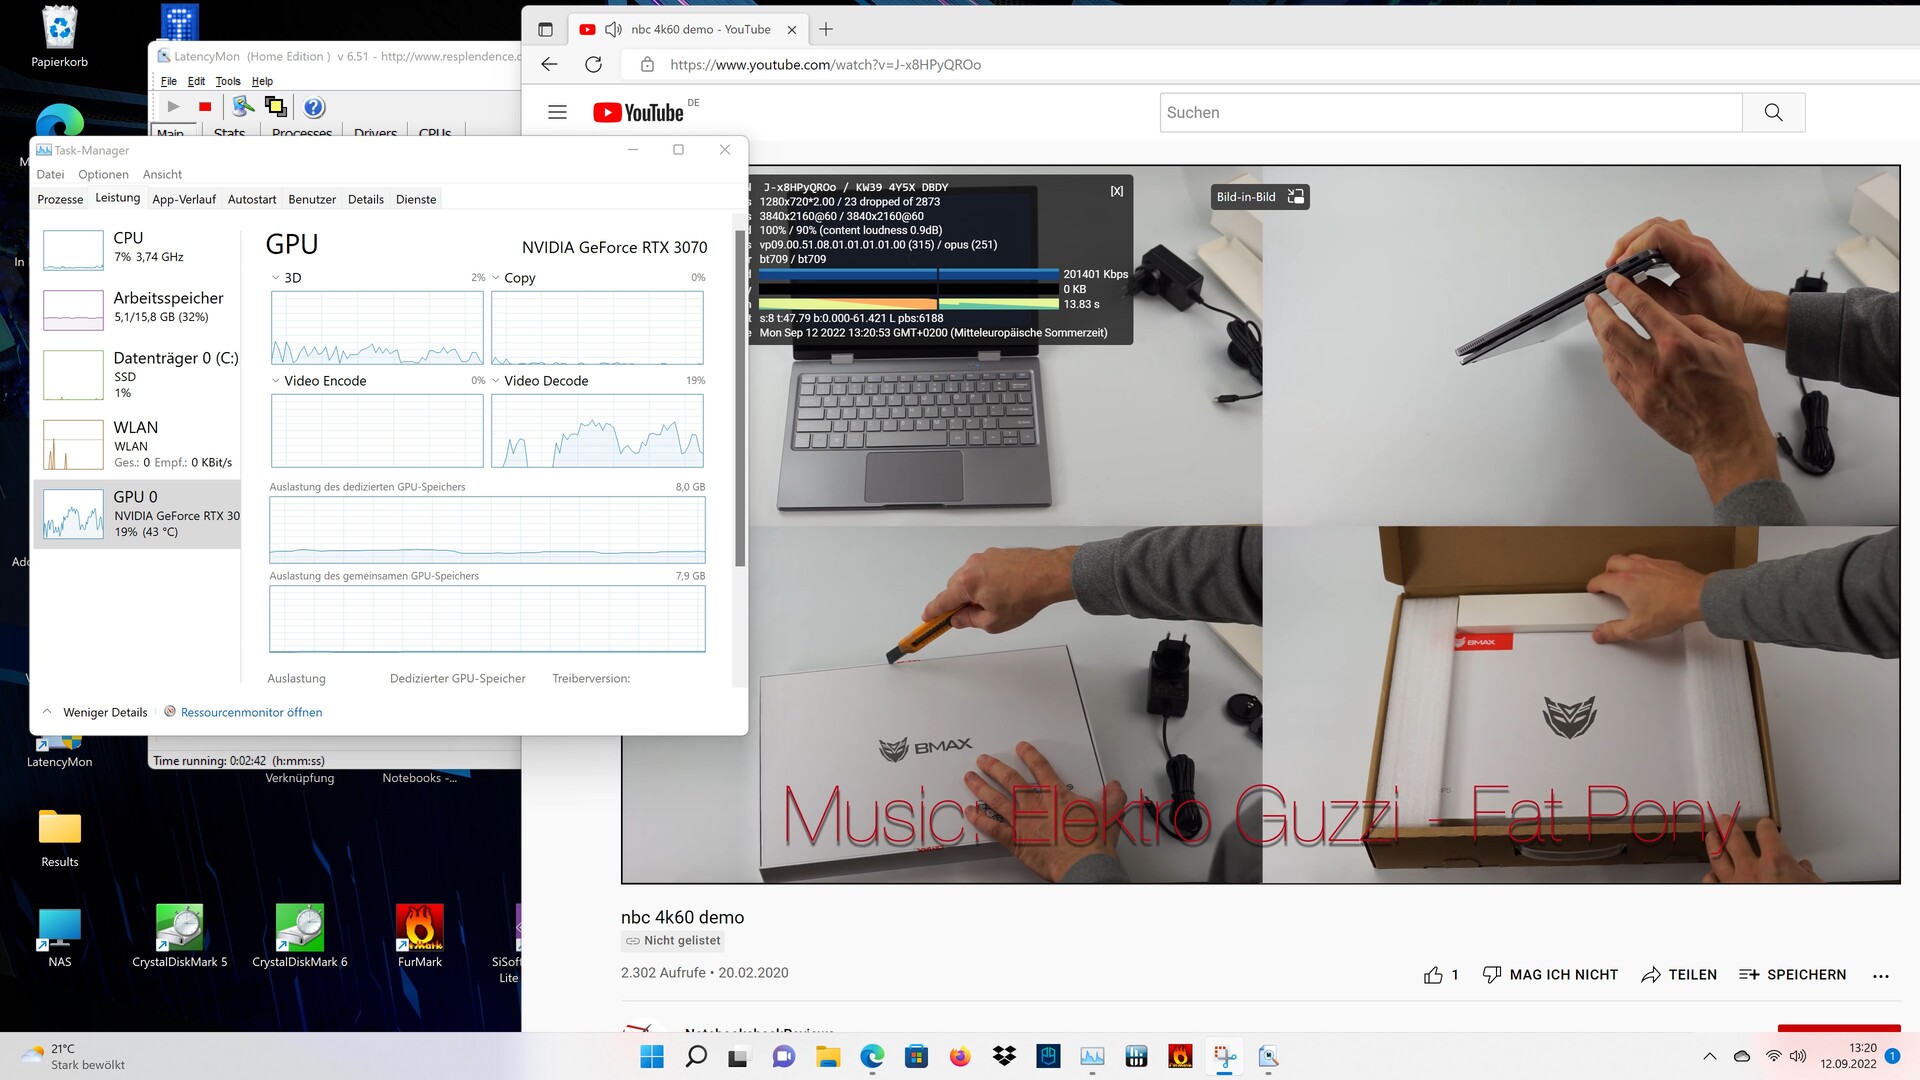
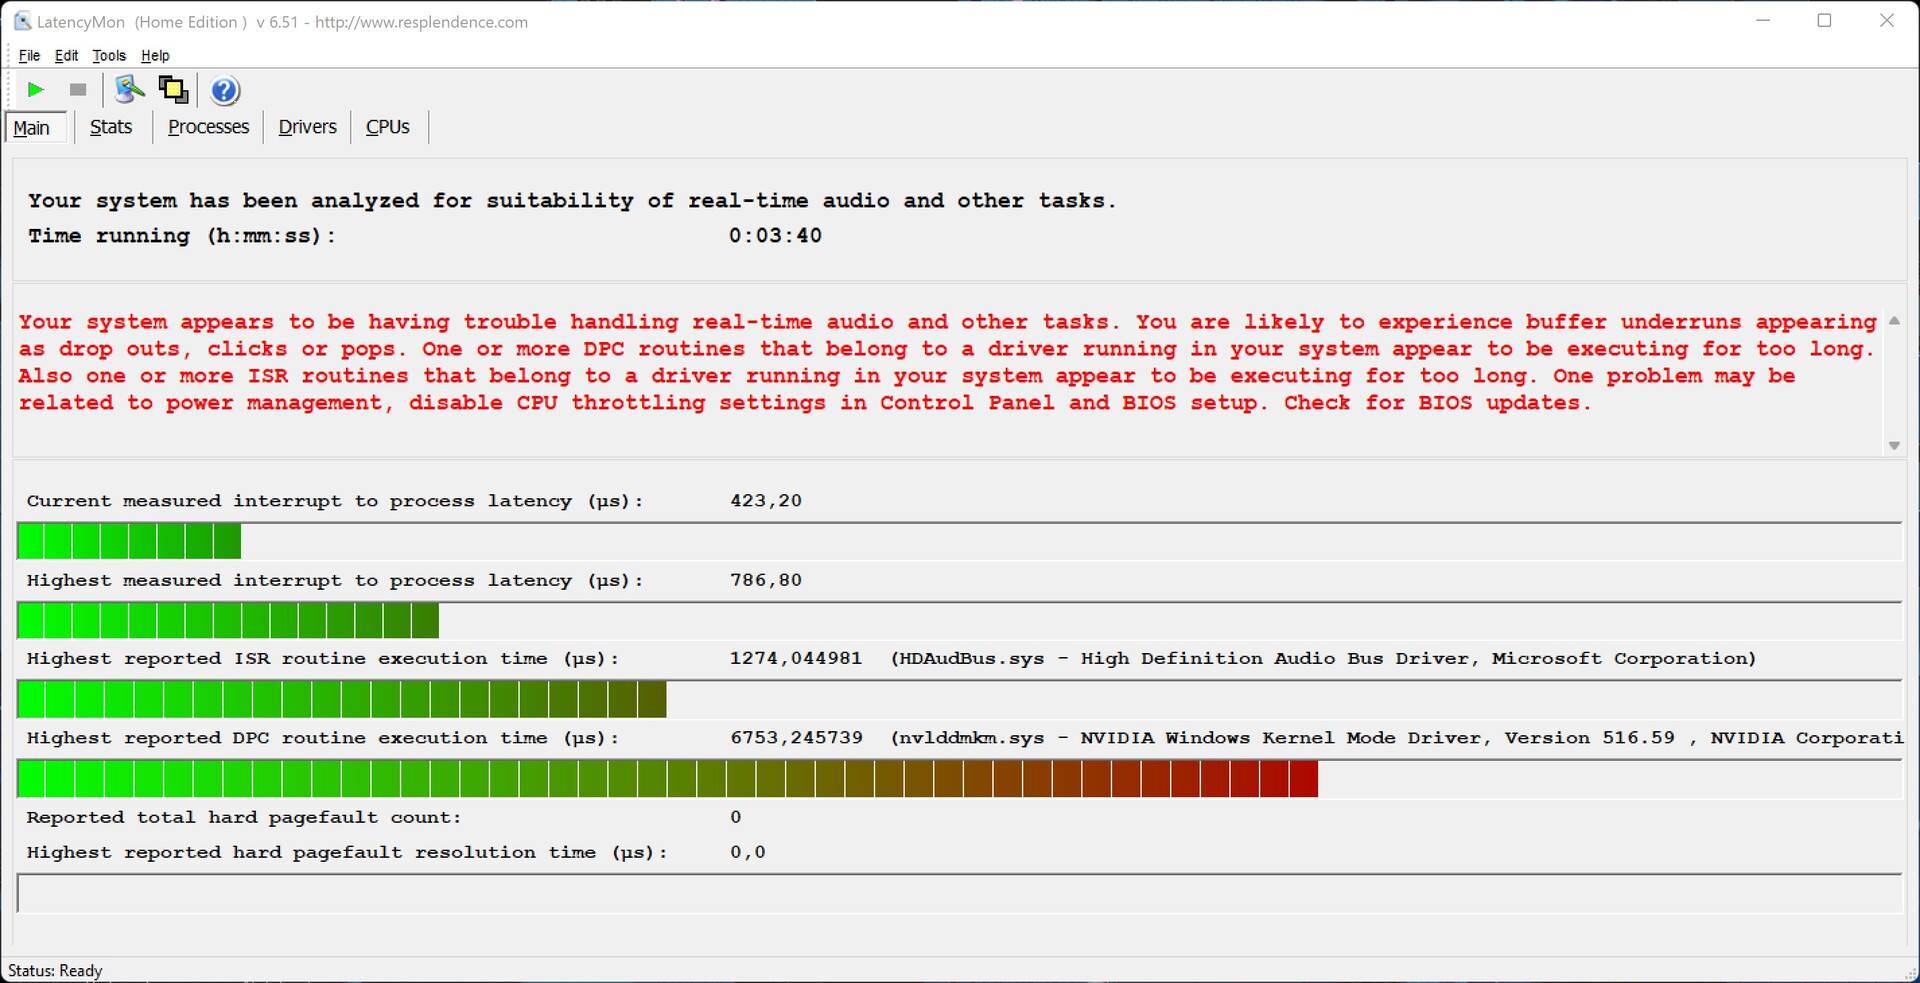
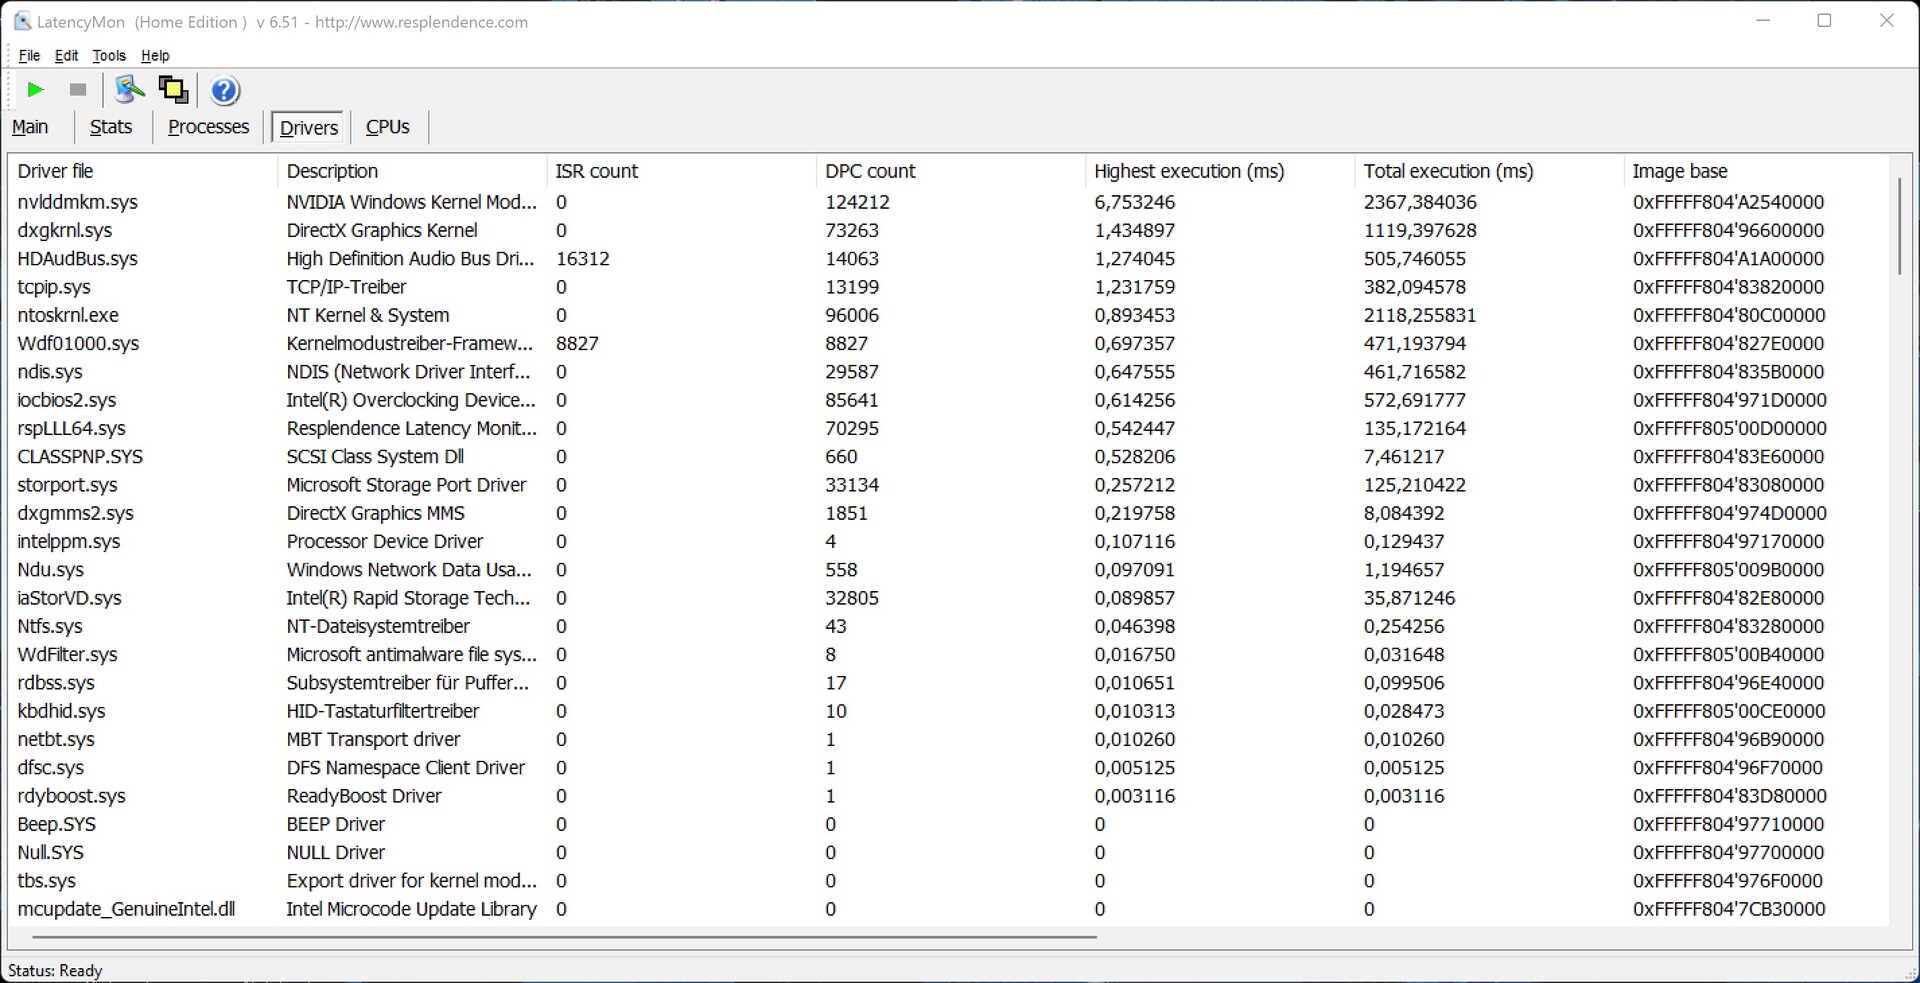
LatencyMon signale déjà des problèmes de latence lors de l'ouverture de plusieurs onglets dans Edge. Les pilotes ne semblent pas encore être optimisés à ce niveau.
| DPC Latencies / LatencyMon - interrupt to process latency (max), Web, Youtube, Prime95 | |
| Acer Predator Orion 3000 PO3-640, Intel Core i7-12700F | |
| Minisforum EliteMini B550, AMD Ryzen 7 5700G | |
| Asus ExpertCenter D9 SFF, Intel Core i7-11700 | |
| Zotac ZBOX Magnus EN173070C, Intel Core i7-11800H | |
| Minisforum EliteMini HX90, AMD Ryzen 9 5900HX | |
* ... Moindre est la valeur, meilleures sont les performances
Mémoire de masse
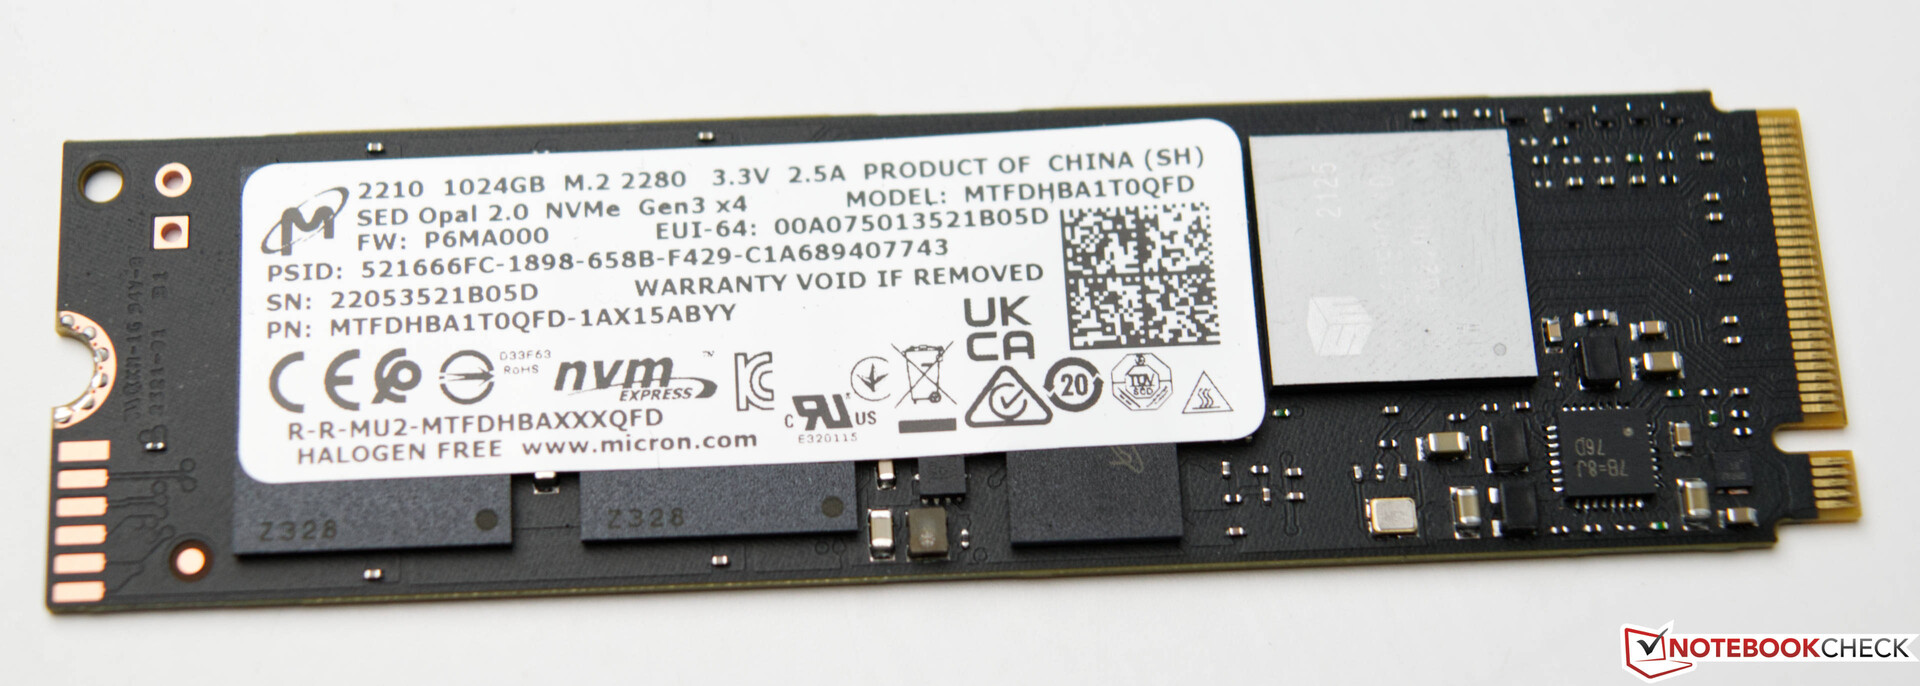
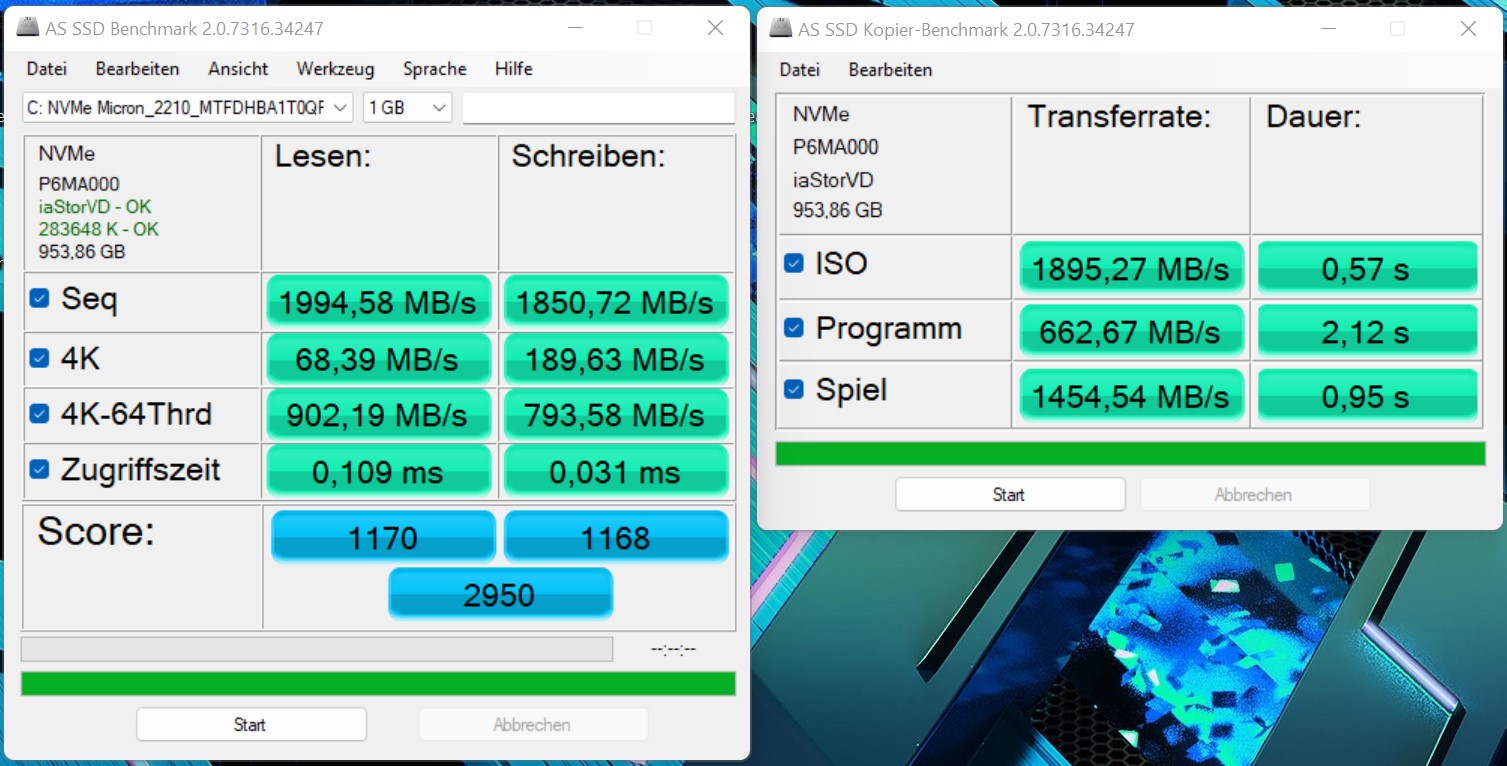
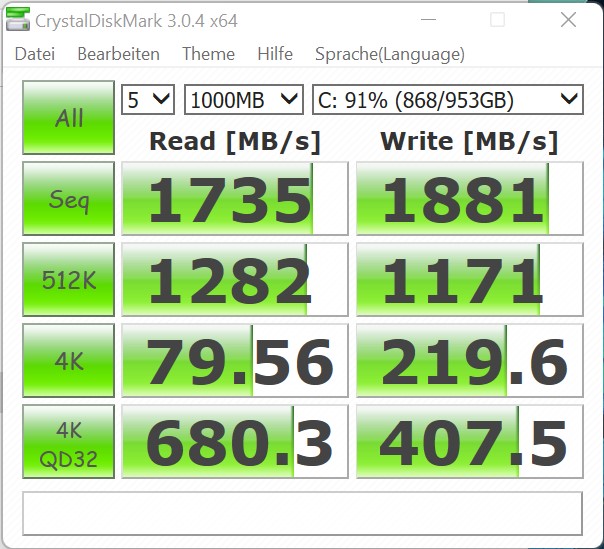
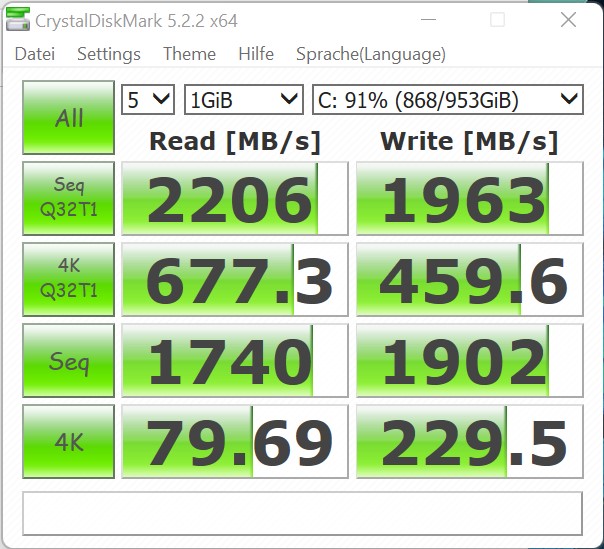
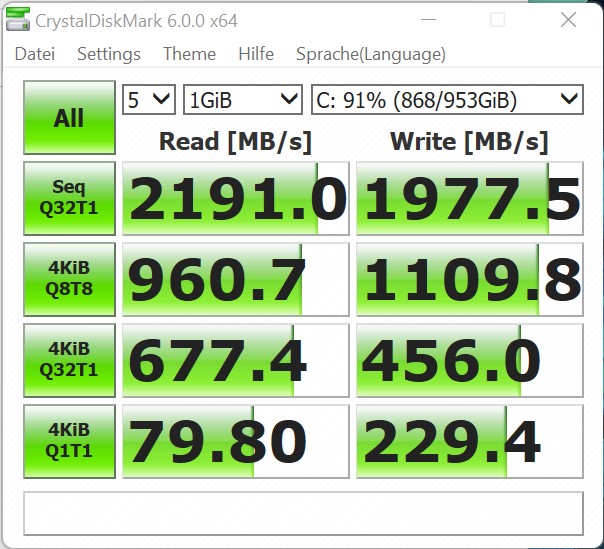
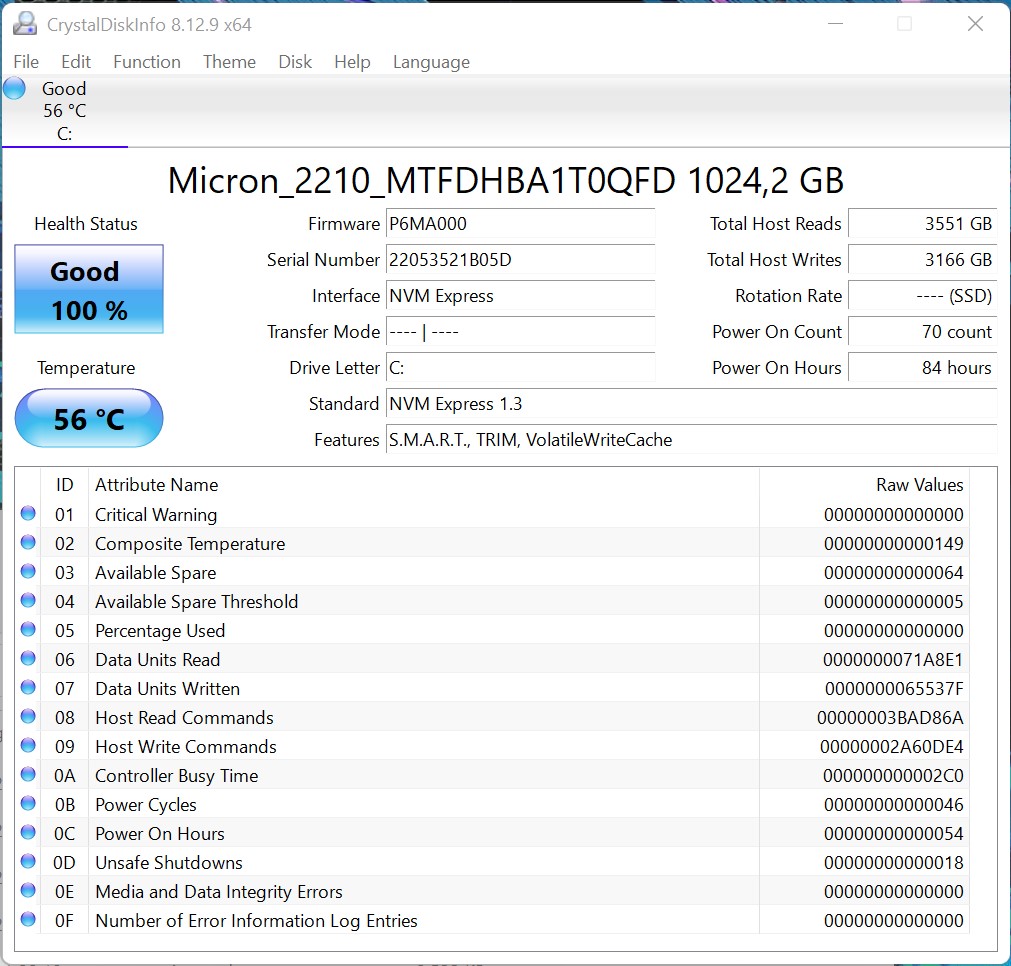
Notre échantillon de test est équipé d'un SSD de 1 To de Micron. Le module M.2 offre de bons taux de transfert, même si les valeurs maximales ne sont pas tout à fait à la hauteur des appareils de comparaison. Toutefois, cela se remarque à peine dans l'utilisation quotidienne. Le taux de lecture 4K, par exemple, a un impact beaucoup plus important, ce qui s'avère très bien dans l'Acer Predator Orion 3000. La capacité de stockage de 1 To est suffisante et ne devrait pas être plus petite pour un appareil de jeu à notre avis. La mémoire de masse de l'Acer Predator Orion 3000 peut être étendue relativement facilement. Un deuxième module M.2 peut être installé sur la carte mère. En outre, il y a également de la place pour deux disques durs de 3,5 pouces dans le boîtier. Tous les câbles de connexion nécessaires sont fournis avec l'appareil
Pour d'autres comparaisons et benchmarks, veuillez vous référer à notreTableau comparatif.

* ... Moindre est la valeur, meilleures sont les performances
Disk Throttling: DiskSpd Read Loop, Queue Depth 8
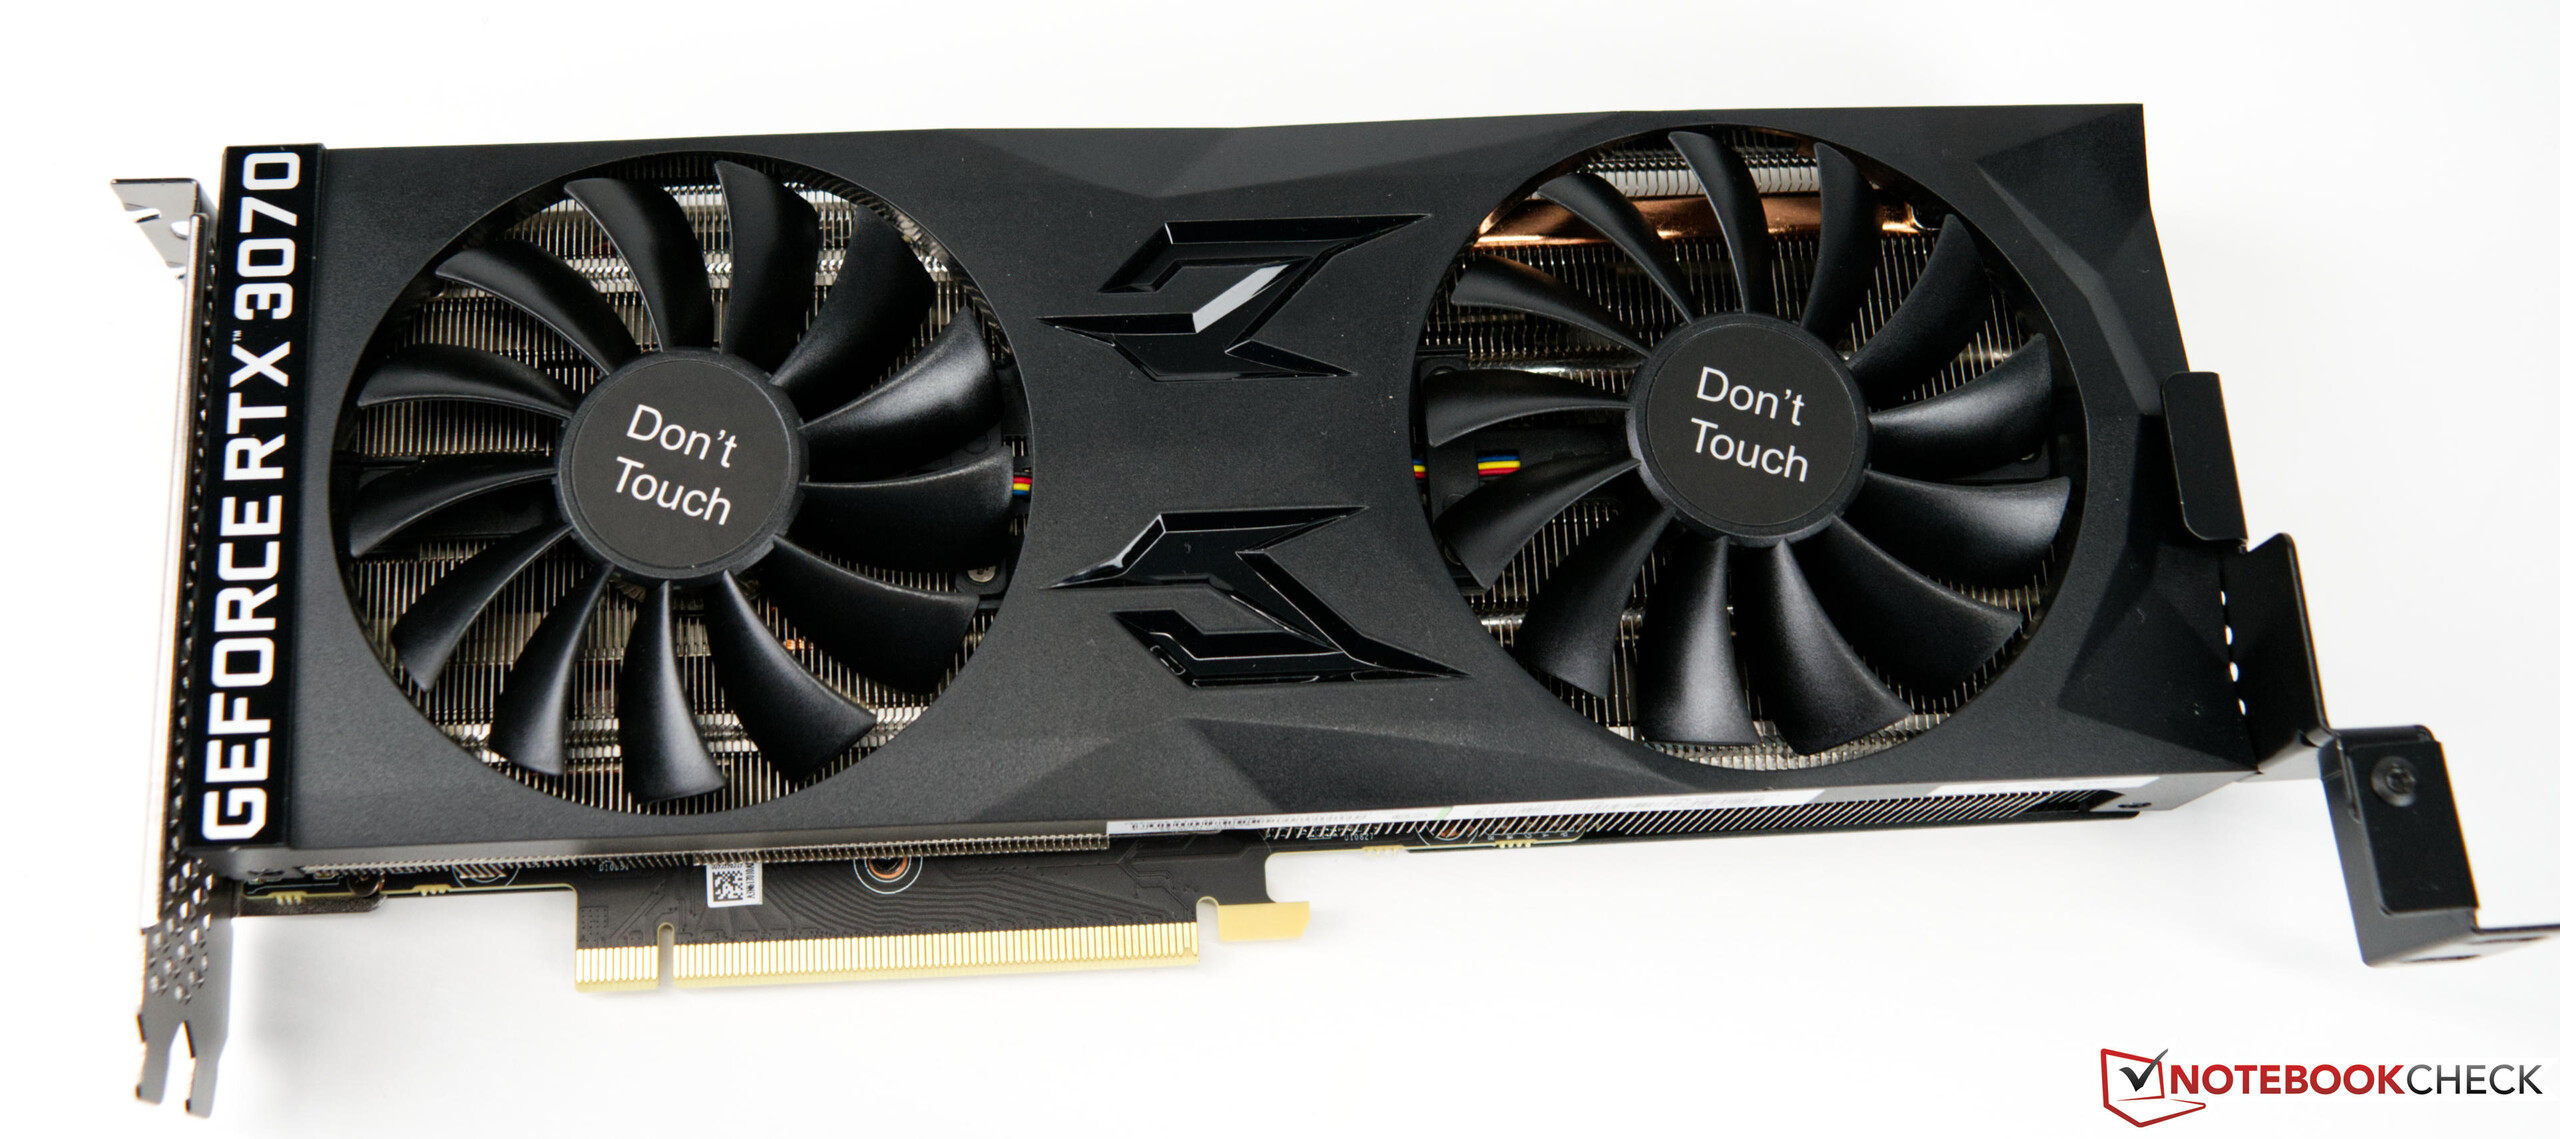
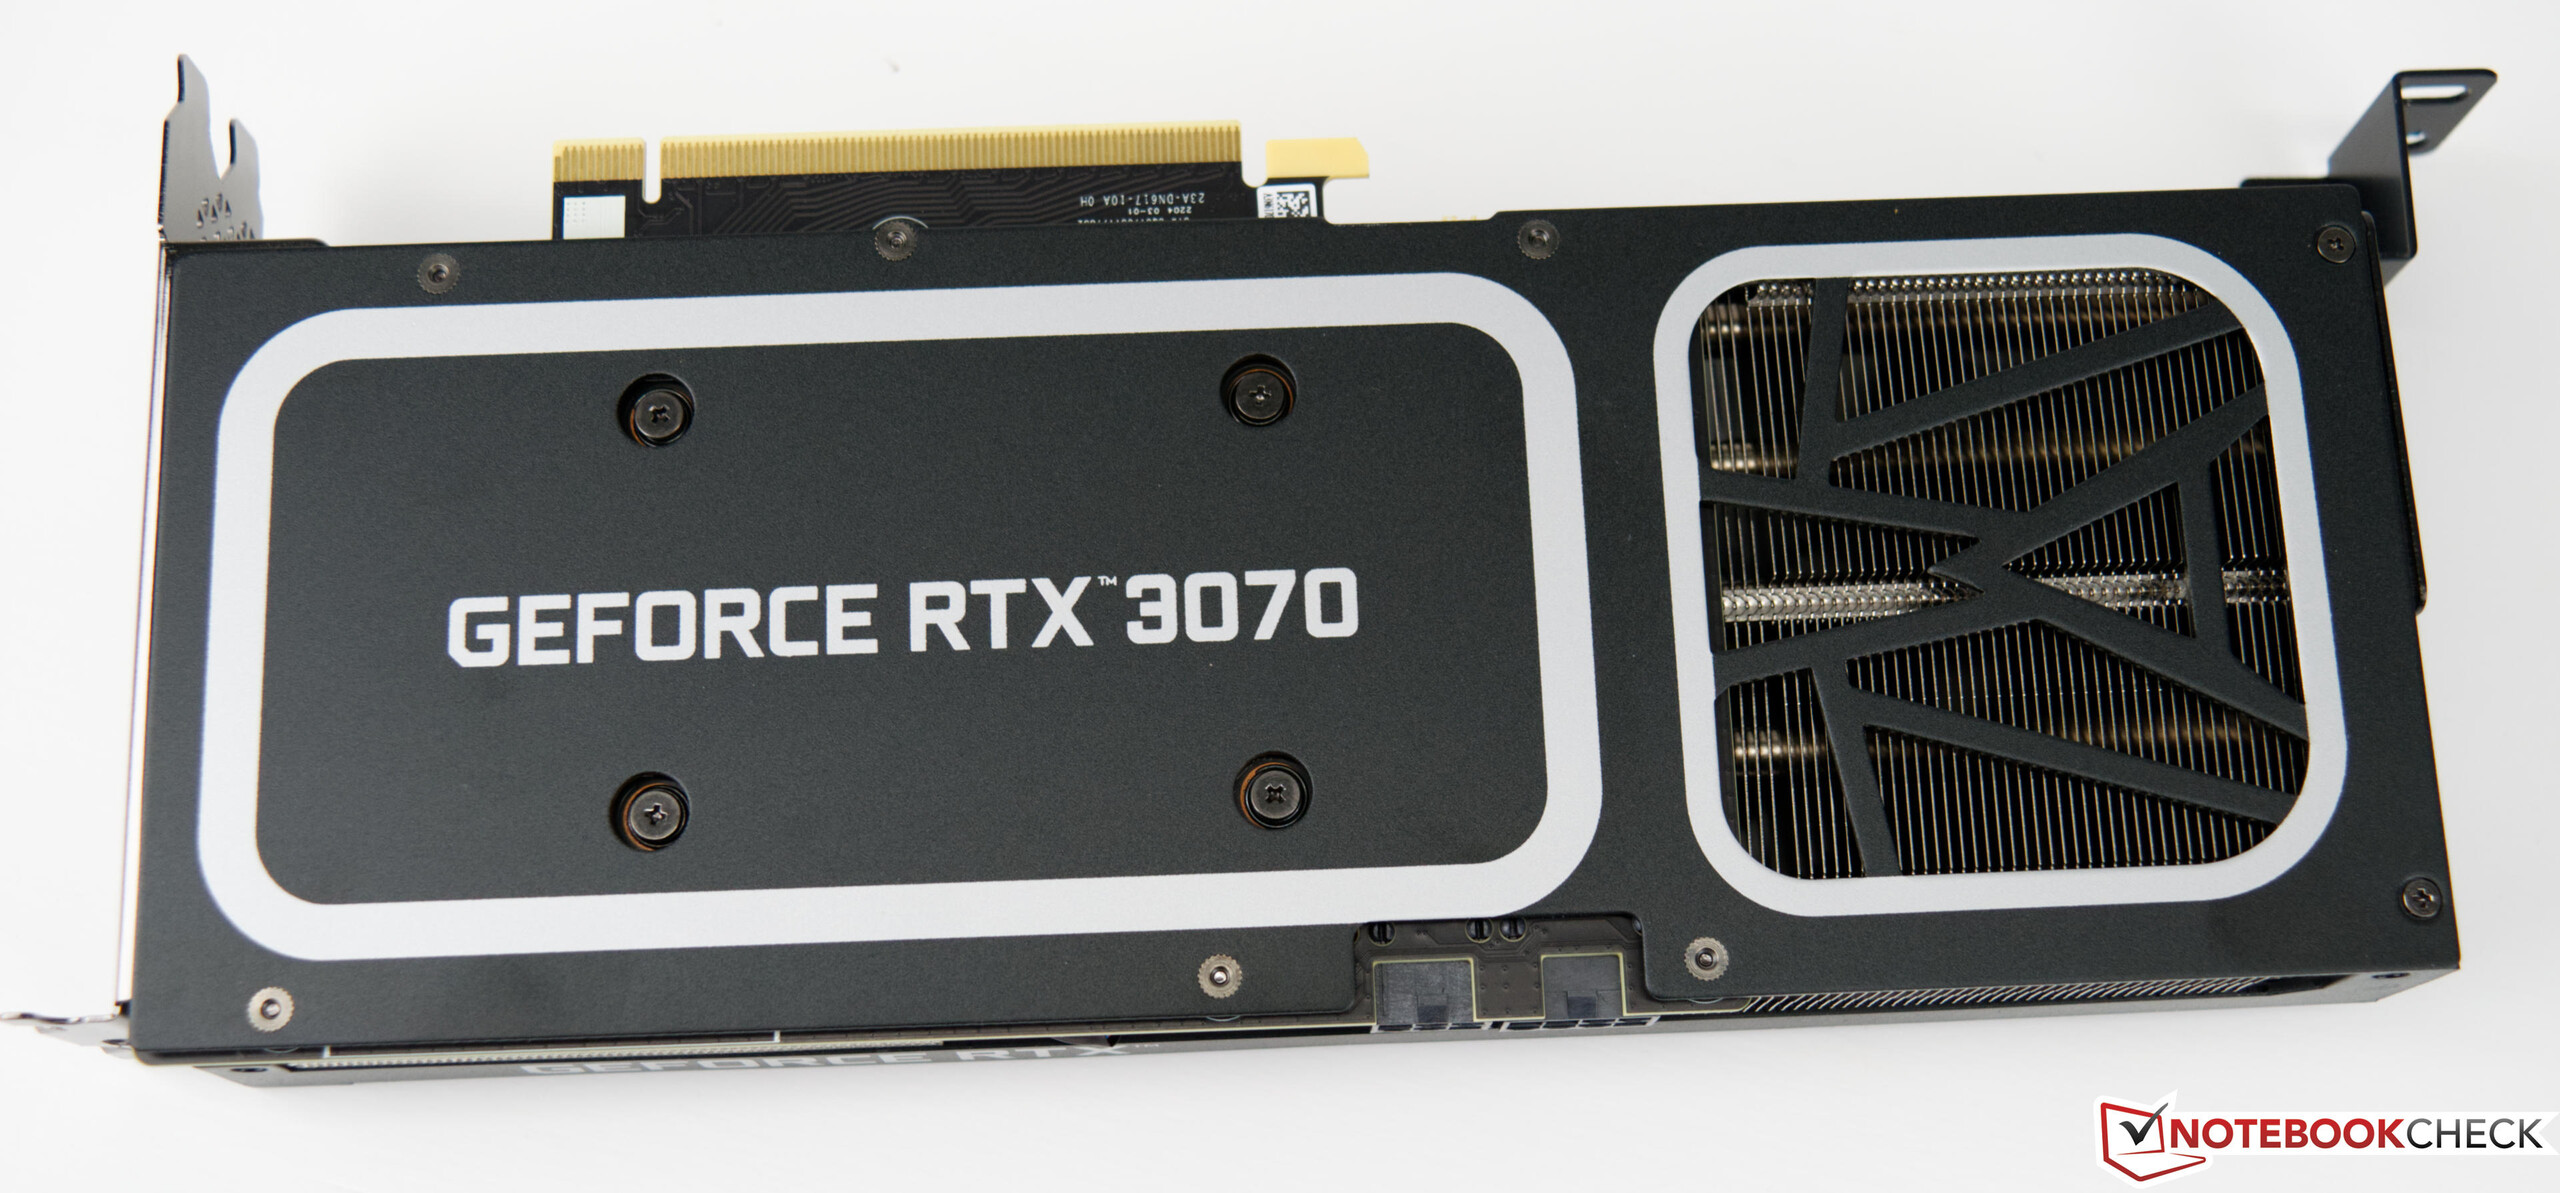
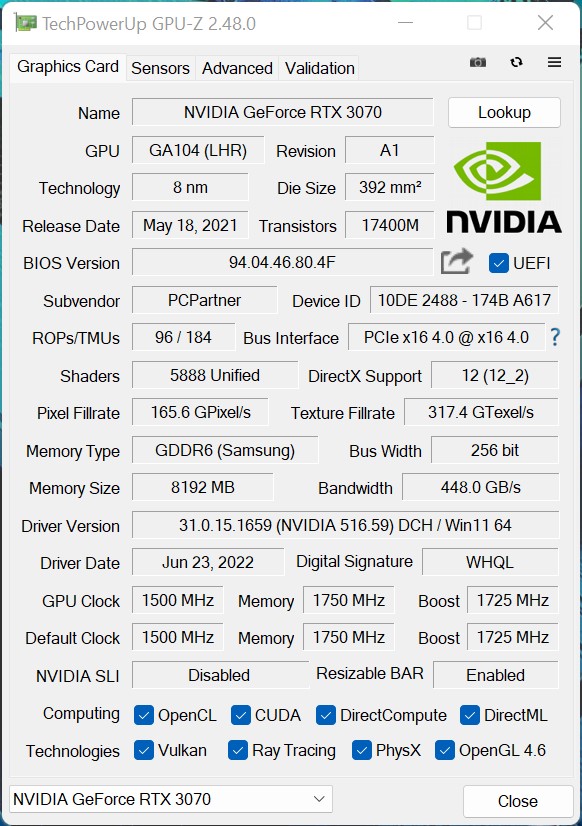
Carte graphique
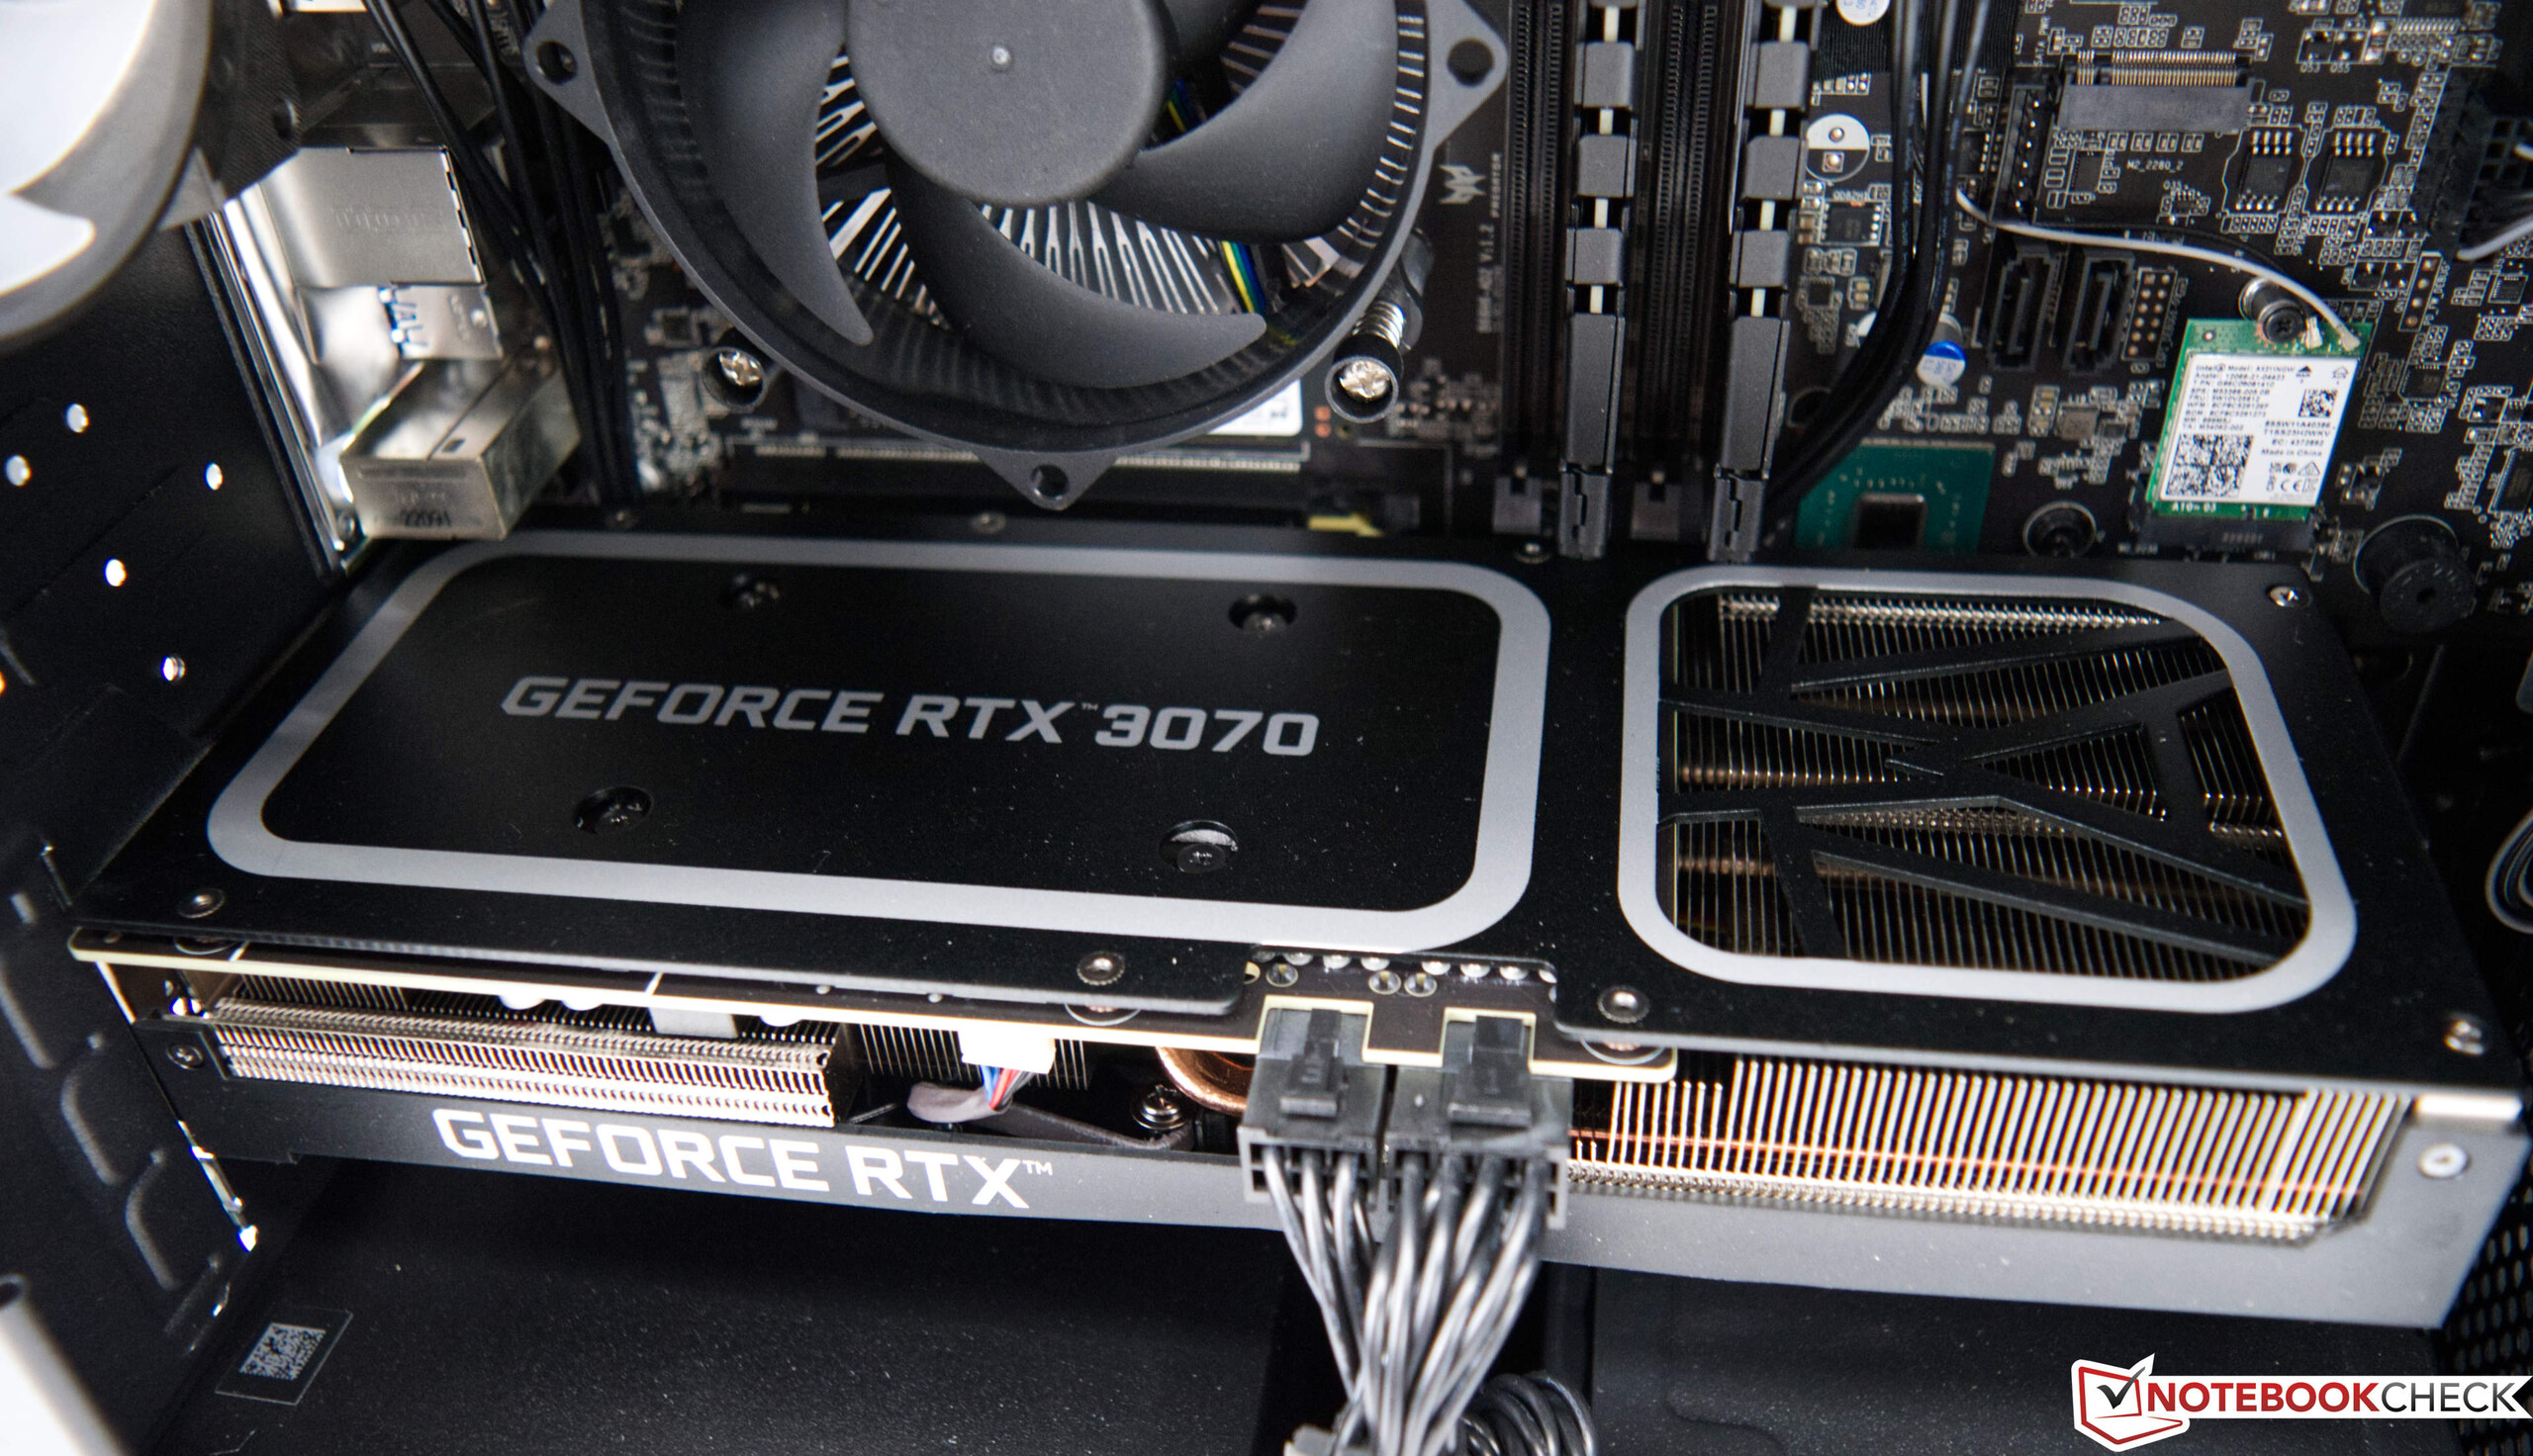
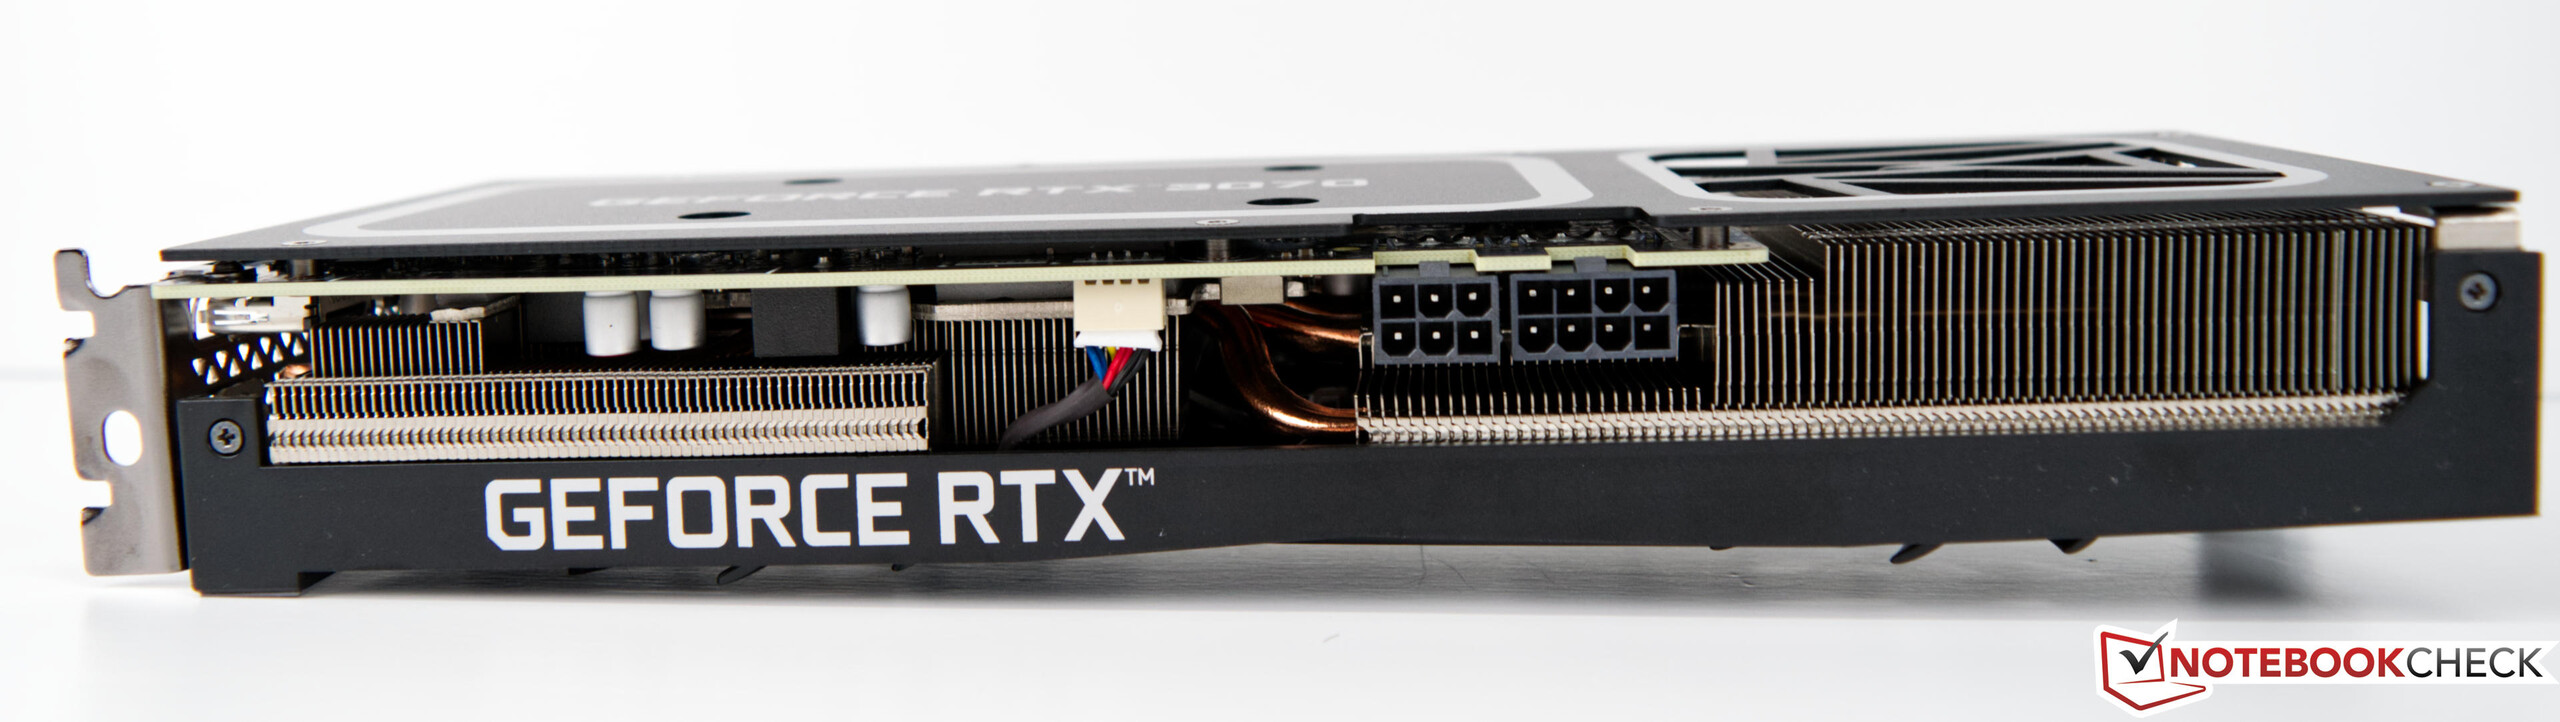
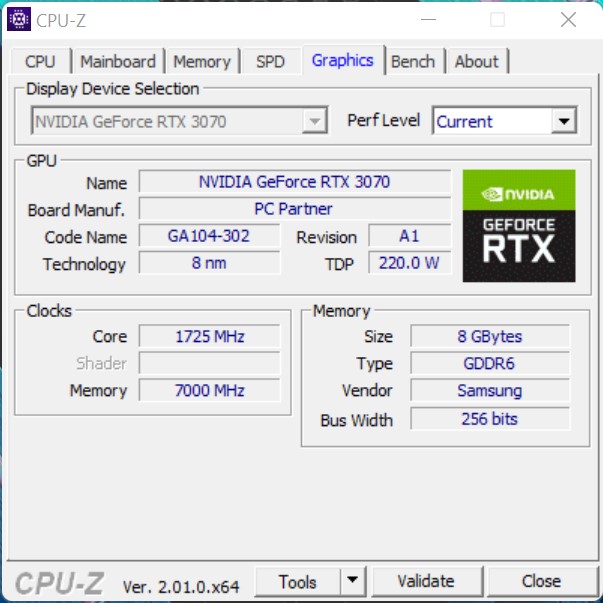
Avec la Nvidia GeForce RTX 3070nous avons l'Acer Predator Orion 3000 dans la configuration la plus forte du test. En tenant compte de la performance du CPU quelque peu étranglée, la performance 3D dans les tests synthétiques s'avère très bonne. Le modèle inconnu de la GeForce RTX 3070 fonctionne exactement selon les spécifications données par Nvidia. Cela signifie une horloge GPU de 1 500 MHz, qui est spécifiée avec 1 750 MHz en Boost. En ce qui concerne la VRAM, la RTX 3070 dispose généralement de 8 Go de GDDR6 et la consommation totale du modèle installé est de 220 watts. Par rapport à la Zotac Magnus One l'Acer Predator Orion 3000 peut l'emporter grâce à son meilleur processeur.
Plus de benchmarks de la Nvidia GeForce RTX 3070 peuvent être trouvésici
| Performance rating - Percent | |
| Acer Predator Orion 3000 PO3-640 | |
| Zotac Magnus One (ECM73070C) | |
| Zotac ZBOX Magnus EN173070C | |
| Intel Dragon Canyon NUC - RTX 3060 | |
| Intel Beast Canyon NUC | |
| Unigine Valley 1.0 | |
| 1920x1080 Extreme HD DirectX AA:x8 | |
| Acer Predator Orion 3000 PO3-640 | |
| Zotac Magnus One (ECM73070C) | |
| Zotac ZBOX Magnus EN173070C | |
| Intel Dragon Canyon NUC - RTX 3060 | |
| Intel Beast Canyon NUC | |
| 1920x1080 Extreme HD Preset OpenGL AA:x8 | |
| Acer Predator Orion 3000 PO3-640 | |
| Zotac Magnus One (ECM73070C) | |
| Zotac ZBOX Magnus EN173070C | |
| Intel Dragon Canyon NUC - RTX 3060 | |
| Intel Beast Canyon NUC | |
| 3DMark 05 Standard | 58568 points | |
| 3DMark 06 Standard Score | 59134 points | |
| 3DMark Vantage P Result | 91011 points | |
| 3DMark 11 Performance | 36421 points | |
| 3DMark Ice Storm Standard Score | 237580 points | |
| 3DMark Cloud Gate Standard Score | 59231 points | |
| 3DMark Fire Strike Score | 25739 points | |
| 3DMark Fire Strike Extreme Score | 15841 points | |
| 3DMark Time Spy Score | 12665 points | |
Aide | ||
Performances de jeu
L'Acer Predator Orion 3000 profite très bien du processeur Alder Lake dans les tests de jeu. Ce processeur offre une très haute performance par horloge (IPC, Instructions par Cycle), ce qui conduit à un boost décent lors des jeux. Le Predator Orion 3000 peut très bien le mettre en œuvre malgré les limitations du TDP, car les jeux n'exigent pas toujours la pleine puissance du CPU. Avec leNvidia GeForce RTX 3070même les jeux les plus récents peuvent être joués sans problème. Vous devriez vous limiter à une résolution maximale de 1440p, bien que la GeForce RTX 3070 puisse également maîtriser de nombreux jeux à 2160p. Pour un aperçu des performances de tous les jeux testés par rapport à d'autres modèles, nous vous renvoyons à notre Liste de jeux GPU.
| GTA V | |
| 1920x1080 Highest AA:4xMSAA + FX AF:16x | |
| KFA2 GeForce RTX 3080 SG | |
| Acer Predator Orion 3000 PO3-640 | |
| Moyenne NVIDIA GeForce RTX 3070 (91.1 - 122.4, n=5) | |
| Zotac ZBOX Magnus EN173070C | |
| Intel Beast Canyon NUC | |
| Intel Dragon Canyon NUC - RTX 3060 | |
| Zotac Magnus One (ECM73070C) | |
| 1920x1080 High/On (Advanced Graphics Off) AA:2xMSAA + FX AF:8x | |
| KFA2 GeForce RTX 3080 SG | |
| Acer Predator Orion 3000 PO3-640 | |
| Intel Beast Canyon NUC | |
| Intel Dragon Canyon NUC - RTX 3060 | |
| Moyenne NVIDIA GeForce RTX 3070 (157 - 177.7, n=5) | |
| Zotac ZBOX Magnus EN173070C | |
| Zotac Magnus One (ECM73070C) | |
| The Witcher 3 | |
| 1920x1080 High Graphics & Postprocessing (Nvidia HairWorks Off) | |
| KFA2 GeForce RTX 3080 SG | |
| Acer Predator Orion 3000 PO3-640 | |
| Zotac Magnus One (ECM73070C) | |
| Moyenne NVIDIA GeForce RTX 3070 (100 - 264, n=8) | |
| Zotac ZBOX Magnus EN173070C | |
| Intel Dragon Canyon NUC - RTX 3060 | |
| Zotac MEK Mini (RTX 2070 Super) | |
| 1920x1080 Ultra Graphics & Postprocessing (HBAO+) | |
| KFA2 GeForce RTX 3080 SG | |
| Acer Predator Orion 3000 PO3-640 | |
| Zotac Magnus One (ECM73070C) | |
| Moyenne NVIDIA GeForce RTX 3070 (52.8 - 132.2, n=7) | |
| Zotac ZBOX Magnus EN173070C | |
| Zotac MEK Mini (RTX 2070 Super) | |
| Intel Dragon Canyon NUC - RTX 3060 | |
| Bas | Moyen | Élevé | Ultra | QHD | 4K | |
|---|---|---|---|---|---|---|
| GTA V (2015) | 184.7 | 181.6 | 177.7 | 122.4 | 113.1 | 125.9 |
| The Witcher 3 (2015) | 507 | 408 | 264 | 132.2 | 93.9 | |
| Dota 2 Reborn (2015) | 146.5 | 133.9 | 129.3 | 121.4 | 122.7 | |
| Rise of the Tomb Raider (2016) | 376 | 266 | 182.9 | 153.7 | 76.7 | |
| Final Fantasy XV Benchmark (2018) | 195.8 | 172.3 | 129.7 | 99.3 | 58.2 | |
| X-Plane 11.11 (2018) | 150.6 | 137.4 | 111.3 | 98.4 | ||
| Far Cry 5 (2018) | 179 | 159 | 151 | 141 | 125 | 72 |
| Strange Brigade (2018) | 466 | 328 | 268 | 233 | 173.2 | 98.7 |
| Shadow of the Tomb Raider (2018) | 194.8 | 173.8 | 166.8 | 157.1 | 114.8 | 62.6 |
| Far Cry New Dawn (2019) | 162 | 140 | 135 | 121 | 113 | 74 |
| Metro Exodus (2019) | 224 | 156.8 | 121.9 | 97.7 | 78.3 | 49.7 |
| Anno 1800 (2019) | 167.5 | 164.1 | 130.8 | 74.7 | 69.3 | 41.8 |
| Control (2019) | 240 | 167.7 | 124.9 | 81.3 | 40.6 | |
| Borderlands 3 (2019) | 171.5 | 144.7 | 127.9 | 108.9 | 82.9 | 46.3 |
| F1 2020 (2020) | 351 | 302 | 288 | 215 | 162.2 | 92.7 |
| Watch Dogs Legion (2020) | 125 | 123 | 109 | 89 | 67 | 37 |
| Dirt 5 (2020) | 248.1 | 191.8 | 157 | 122.1 | 99 | 65.3 |
| F1 2021 (2021) | 407 | 361 | 304 | 158 | 118 | 67.3 |
| New World (2021) | 166.9 | 139.5 | 128.3 | 117.5 | 95 | 48.9 |
| Far Cry 6 (2021) | 154.9 | 138.3 | 121.1 | 114.2 | 95.9 | 26.4 |
| Forza Horizon 5 (2021) | 247 | 171 | 160 | 115 | 100 | 73 |
| God of War (2022) | 142.3 | 140.5 | 117.8 | 83.5 | 69.3 | 49.8 |
| GRID Legends (2022) | 249 | 224 | 198 | 151 | 127 | 84 |
| Cyberpunk 2077 1.6 (2022) | 146.7 | 145.1 | 136 | 90.3 | 60.6 | 29 |
| Tiny Tina's Wonderlands (2022) | 248 | 204 | 145.8 | 113.9 | 80.7 | 44.4 |
| F1 22 (2022) | 258 | 249 | 228 | 81 | 52 | 25 |
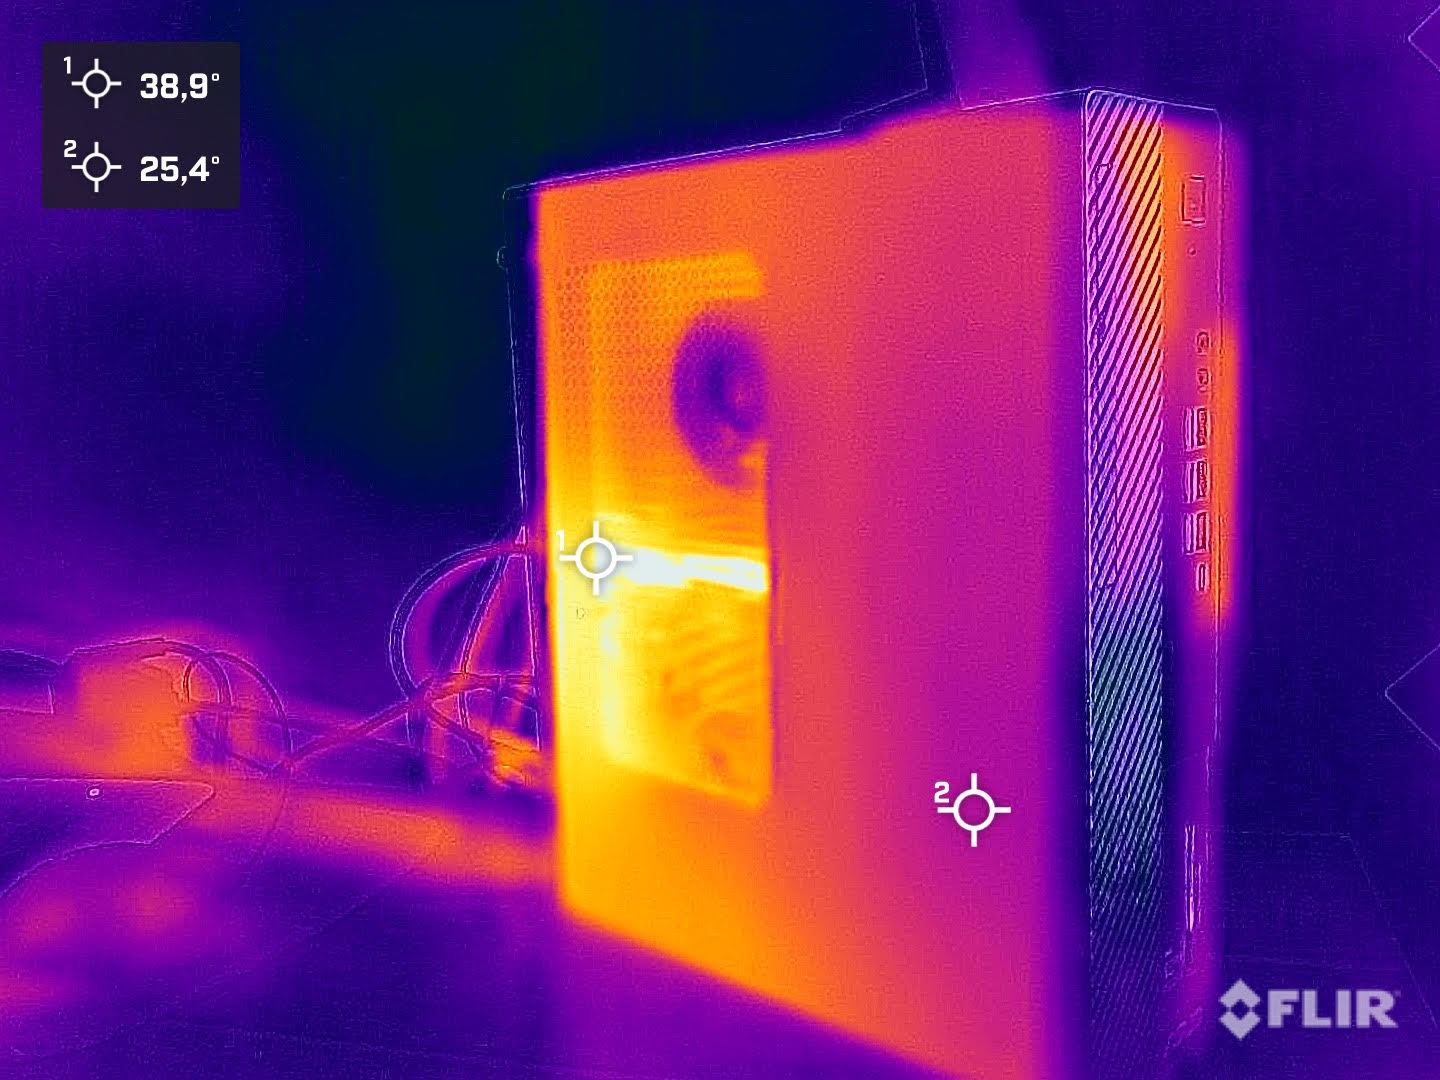
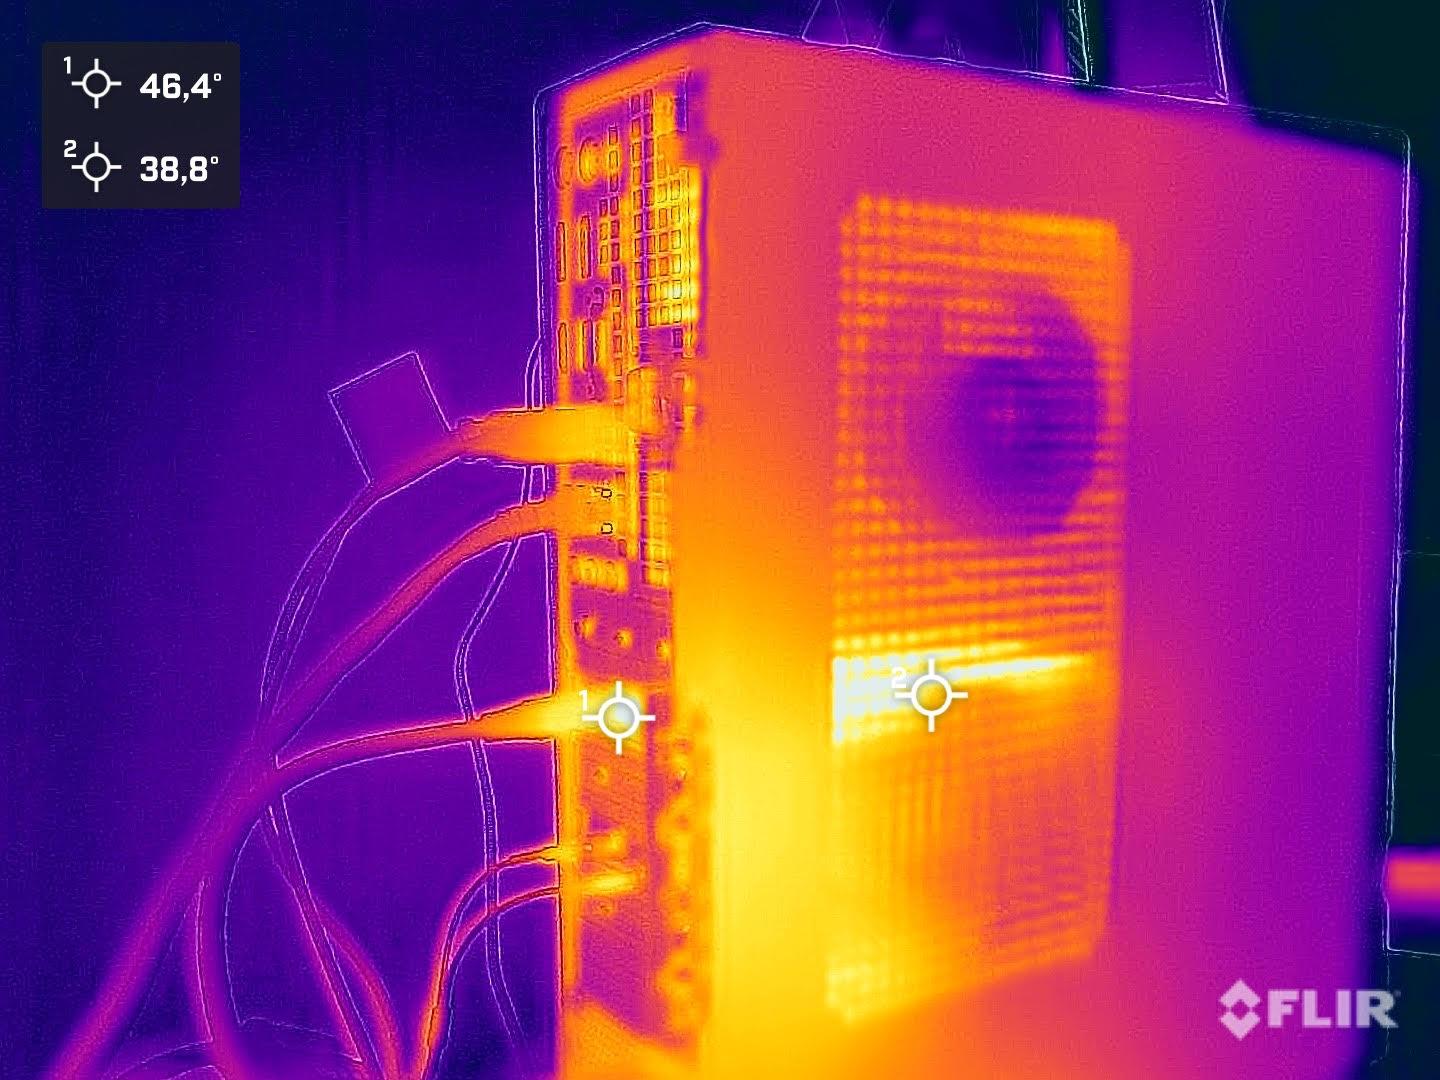
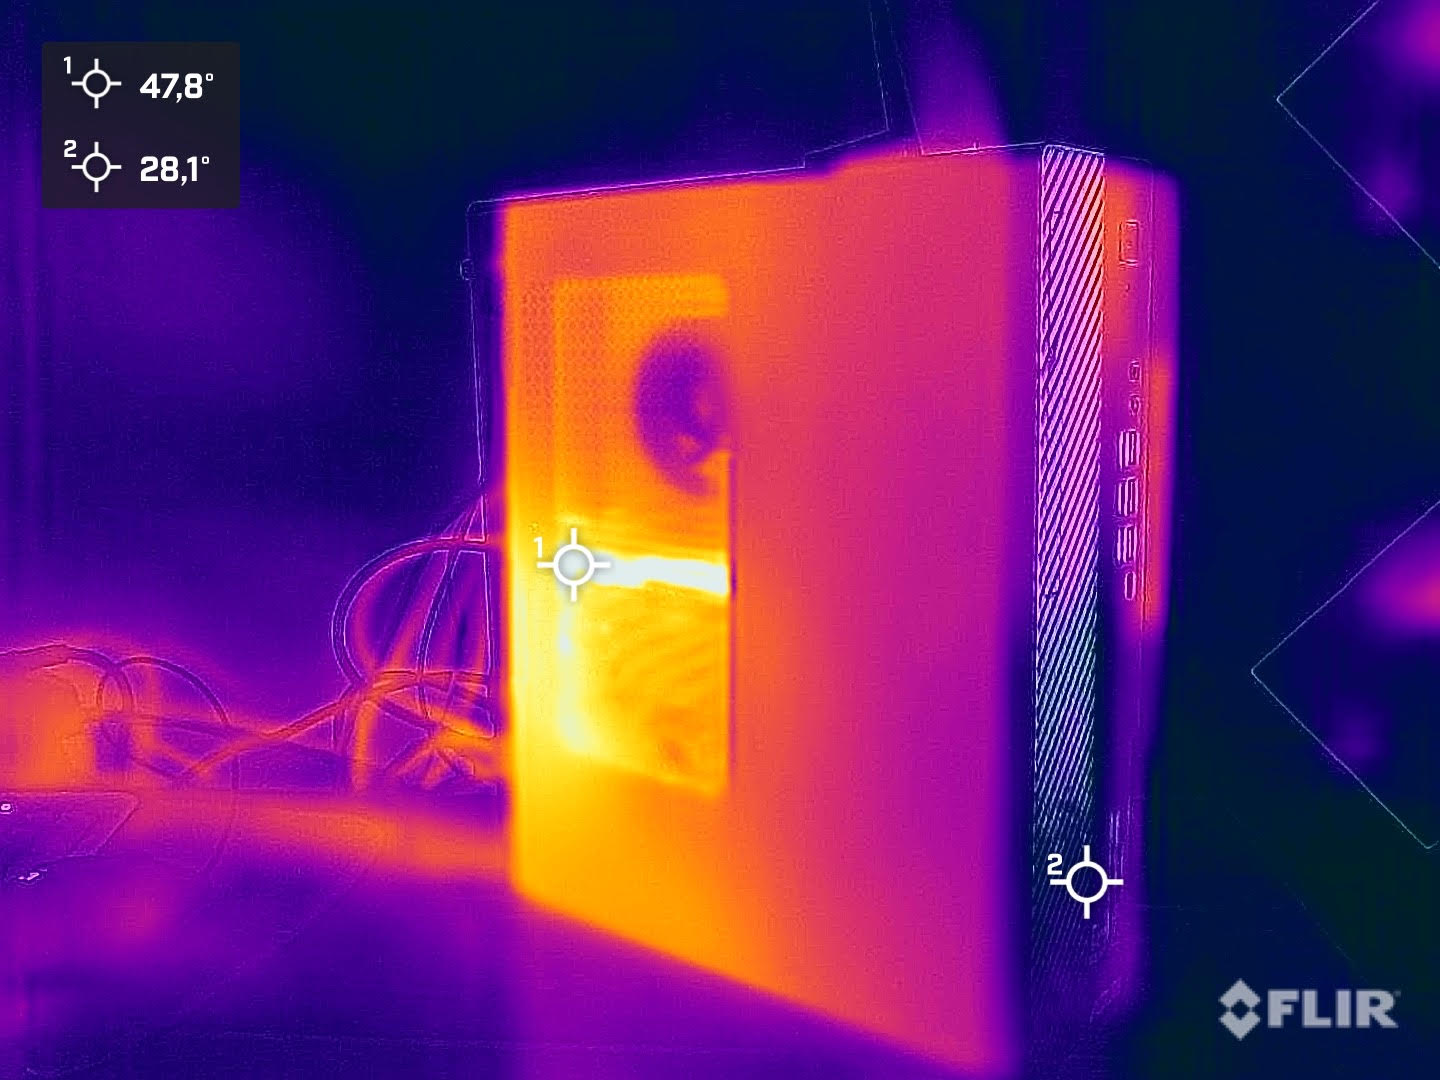
Émissions - Faiblesse du système de refroidissement
Émissions sonores
Le système de refroidissement de l'Acer Predator Orion 3000 se compose d'un ventilateur à l'avant, qui aspire l'air frais, et d'un ventilateur à l'arrière, qui est censé transporter l'air chaud hors du boîtier. En théorie, cela semble très bien, mais en pratique, il s'avère que ce n'est pas optimal. Ce n'est pas pour rien qu'Acer limite la consommation d'énergie maximale du processeur du Predator Orion 3000. Cependant, le PC ne se distingue pas négativement dans le test avec seulement 31,6 dB(A) en veille malgré le très petit refroidisseur du CPU. Le système est également relativement silencieux en charge et atteint environ 38 dB(A) dans le test de stress. Cependant, si nous laissons les ventilateurs tourner à pleine vitesse (via le mode de jeu Predator Sense), notre appareil de mesure indique 54 dB(A).
Degré de la nuisance sonore
| Au repos |
| 31.5 / 31.6 / 31.6 dB(A) |
| Fortement sollicité |
| 32.7 / 38.1 dB(A) |
 | ||
30 dB silencieux 40 dB(A) audible 50 dB(A) bruyant |
||
min: | ||
| Acer Predator Orion 3000 PO3-640 i7-12700F, GeForce RTX 3070 | Zotac Magnus One (ECM73070C) i7-10700, GeForce RTX 3070 | Zotac ZBOX Magnus EN173070C i7-11800H, GeForce RTX 3070 Laptop GPU | Intel Dragon Canyon NUC - RTX 3060 i9-12900, GeForce RTX 3060 | |
|---|---|---|---|---|
| Noise | -18% | -10% | -2% | |
| arrêt / environnement * (dB) | 29.8 | 30 -1% | 30.7 -3% | 30.2 -1% |
| Idle Minimum * (dB) | 31.5 | 33.58 -7% | 32.7 -4% | 30.2 4% |
| Idle Average * (dB) | 31.6 | 32.8 -4% | 30.4 4% | |
| Idle Maximum * (dB) | 31.6 | 32.8 -4% | 30.8 3% | |
| Load Average * (dB) | 32.7 | 44.25 -35% | 41.7 -28% | |
| Load Maximum * (dB) | 38.1 | 48.72 -28% | 45.4 -19% | 45.1 -18% |
* ... Moindre est la valeur, meilleures sont les performances
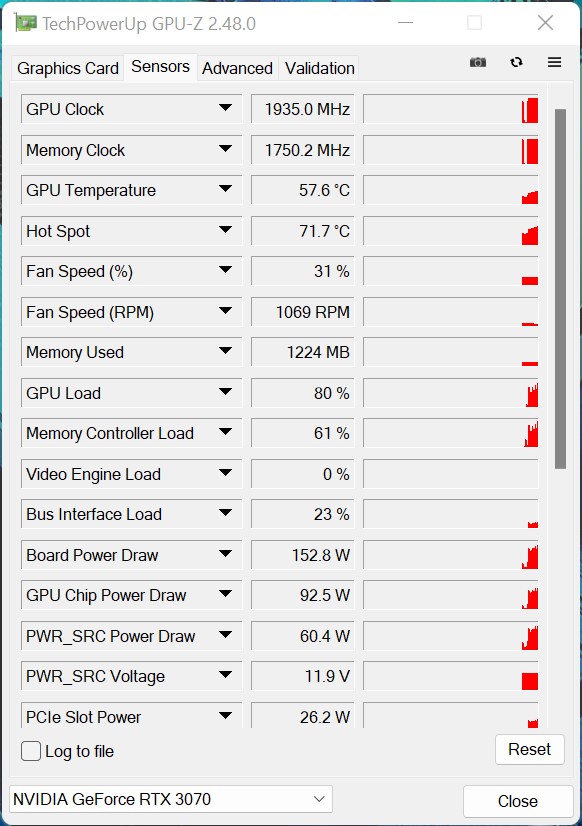
Température
Le boîtier de l'Acer Predator Orion 3000 chauffe un peu sous charge, mais ce n'est pas un problème. Le ventilateur unique à l'arrière, par contre, évacue l'air très chaud du boîtier. Une dissipation de chaleur supplémentaire vers le haut serait encore plus efficace ici. Nous notons la valeur maximale du processeur de 98 °C sous charge. Cela montre que Acer est déjà à la limite avec le refroidissement installé, même si le Intel Core i7-12700F aurait encore des réserves. Néanmoins, le Predator Orion 3000 a pu fournir une bonne performance dans le test. La température maximale du GPU est considérablement plus basse, à 70,5 °C
Consommation d'énergie
L'Acer Predator Orion 3000 est étonnamment économe au ralenti et sous faible charge. Notre compteur n'affiche qu'un peu moins de 30 watts. Il monte à 361 watts pendant un court moment dans le test de stress, bien que seulement 186 watts soient disponibles en moyenne. Cela est dû à la PL2, qui n'est autorisée que pour un maximum de 28 secondes. La consommation d'énergie du système est en moyenne de 338 watts pendant le jeu. Nous avons documenté des pics à court terme allant jusqu'à 364 watts. Une alimentation ATX de 500 watts est installée, ce qui permet de répondre aux exigences du matériel.
| Éteint/en veille | |
| Au repos | |
| Fortement sollicité |
|
Légende:
min: | |
| Acer Predator Orion 3000 PO3-640 i7-12700F, GeForce RTX 3070 | Zotac ZBOX Magnus EN173070C i7-11800H, GeForce RTX 3070 Laptop GPU | Moyenne NVIDIA GeForce RTX 3070 | Moyenne de la classe Desktop | |
|---|---|---|---|---|
| Power Consumption | -27% | -93% | -4% | |
| Idle Minimum * (Watt) | 24.6 | 31.3 -27% | 56 ? -128% | 17.9 ? 27% |
| Idle Average * (Watt) | 24.6 | 35.1 -43% | 58.5 ? -138% | 37.2 ? -51% |
| Idle Maximum * (Watt) | 29.6 | 41.6 -41% | 70.5 ? -138% | 41.3 ? -40% |
| Load Average * (Watt) | 124.6 | 214 -72% | 122.1 ? 2% | 96.7 ? 22% |
| Witcher 3 ultra * (Watt) | 338.1 | 193.5 43% | ||
| Load Maximum * (Watt) | 186.1 | 231 -24% | 305 ? -64% | 141.6 ? 24% |
* ... Moindre est la valeur, meilleures sont les performances
Power Consumption with external Monitor
Points positifs
Points négatifs
Conclusion - PC de jeu rapide avec un refroidissement faible

Le Acer Predator Orion 3000 est un PC de jeu compact et est basé sur la génération actuelle de CPU d'Intel. Le site Intel Core i7-12700F offre de très bonnes performances et est suffisamment rapide pour répondre aux exigences des jeux actuels malgré la limitation PL2. On aurait pu faire mieux avec un meilleur refroidissement. Avec la Nvidia GeForce RTX 3070vous obtenez un modèle conventionnel qui correspond aux spécifications de Nvidia. Cependant, le modèle est performant et atteint des taux d'images fluides avec une résolution de 1440p dans les jeux actuels. Le reste de la configuration est plutôt standard avec un SSD de 1 To et 16 Go de RAM DDR4. L'utilisation d'une RAM DDR5 plus rapide aurait été une solution d'avenir.
Pour améliorer le look de l'Acer Predator Orion 3000, le panneau latéral gauche peut être remplacé par un panneau latéral avec une fenêtre de visualisation. Cela fait partie de l'étendue de la livraison. Il y a également un clavier et une souris, qui reprennent le look Acer Predator et offrent ainsi une image globale cohérente
Grâce au Intel Core i7-12700F et au Nvidia GeForce RTX 3070, l'Acer Predator Orion 3000 offre une bonne base en tant que PC de jeu. Malheureusement, le système de refroidissement doit accepter certains compromis.
Le plus gros point de critique est le refroidissement trop petit du processeur. Néanmoins, il est surprenant que l'Acer Predator Orion 3000 ne soit pas insupportablement bruyant. Le fabricant s'est probablement passé de vitesses plus élevées en mode automatique au détriment de températures plus élevées. Une courbe de ventilateur auto-ajustée peut fournir des températures légèrement meilleures sous charge. Cependant, les faibles émissions sonores sous charge font également partie du passé.
Prix et disponibilité
Le Acer Predator Orion 3000 est disponible directement sur le site Acer et coûte 2 200 euros dans notre configuration de test. Actuellement, vous pouvez également obtenir l'appareil sur Computer Universe pour seulement 1 900 euros.
Acer Predator Orion 3000 PO3-640
- 09/13/2022 v7 (old)
Sebastian Bade
Price comparison
