Courte critique du HP Pavilion Gaming 17 (i7-9750H, GTX 1660 Ti Max-Q, FHD) : enfin un portable de jeu silencieux
| SD Card Reader | |
| average JPG Copy Test (av. of 3 runs) | |
| Dell XPS 15 9570 Core i9 UHD (Toshiba Exceria Pro SDXC 64 GB UHS-II) | |
| HP Omen 17t-3AW55AV_1 (Toshiba Exceria Pro SDXC 64 GB UHS-II) | |
| HP Pavilion Gaming 17-cd0085cl (Toshiba Exceria Pro SDXC 64 GB UHS-II) | |
| MSI GP75 Leopard 9SD (Toshiba Exceria Pro SDXC 64 GB UHS-II) | |
| maximum AS SSD Seq Read Test (1GB) | |
| Dell XPS 15 9570 Core i9 UHD (Toshiba Exceria Pro SDXC 64 GB UHS-II) | |
| HP Omen 17t-3AW55AV_1 (Toshiba Exceria Pro SDXC 64 GB UHS-II) | |
| HP Pavilion Gaming 17-cd0085cl (Toshiba Exceria Pro SDXC 64 GB UHS-II) | |
| MSI GP75 Leopard 9SD (Toshiba Exceria Pro SDXC 64 GB UHS-II) | |
| |||||||||||||||||||||||||
Homogénéité de la luminosité: 86 %
Valeur mesurée au centre, sur batterie: 299.6 cd/m²
Contraste: 908:1 (Valeurs des noirs: 0.33 cd/m²)
ΔE ColorChecker Calman: 3.68 | ∀{0.5-29.43 Ø4.73}
calibrated: 3.15
ΔE Greyscale Calman: 3.8 | ∀{0.09-98 Ø4.97}
89.8% sRGB (Argyll 1.6.3 3D)
58.1% AdobeRGB 1998 (Argyll 1.6.3 3D)
64.3% AdobeRGB 1998 (Argyll 3D)
90.2% sRGB (Argyll 3D)
63.3% Display P3 (Argyll 3D)
Gamma: 2.12
CCT: 7240 K
| HP Pavilion Gaming 17-cd0085cl BOE0825, IPS, 17.3", 1920x1080 | Lenovo Legion Y740-17ICH AU Optronics B173HAN03.2, IPS, 17.3", 1920x1080 | HP Omen 17t-3AW55AV_1 AU Optronics AUO309D, IPS, 17.3", 1920x1080 | Asus TUF FX705DT-AU068T AU Optronics B173HAN04.2, IPS, 17.3", 1920x1080 | MSI GP75 Leopard 9SD Chi Mei N173HCE-G33 (CMN175C), IPS, 17.3", 1920x1080 | Razer Blade Pro 17 RTX 2080 Max-Q AU Optronics B173HAN04.0, IPS, 17.3", 1920x1080 | |
|---|---|---|---|---|---|---|
| Display | 1% | 2% | -1% | 2% | -3% | |
| Display P3 Coverage (%) | 63.3 | 64 1% | 65.4 3% | 62.3 -2% | 63.4 0% | 60.6 -4% |
| sRGB Coverage (%) | 90.2 | 90.4 0% | 90 0% | 89.1 -1% | 94.9 5% | 89 -1% |
| AdobeRGB 1998 Coverage (%) | 64.3 | 64.8 1% | 65.8 2% | 63.7 -1% | 65.1 1% | 62.1 -3% |
| Response Times | 43% | 47% | -42% | 65% | 65% | |
| Response Time Grey 50% / Grey 80% * (ms) | 31.6 ? | 15.6 ? 51% | 17.6 ? 44% | 41 ? -30% | 8 ? 75% | 6.8 ? 78% |
| Response Time Black / White * (ms) | 19.6 ? | 12.8 ? 35% | 10 ? 49% | 30 ? -53% | 8.8 ? 55% | 9.6 ? 51% |
| PWM Frequency (Hz) | 25510 ? | |||||
| Screen | -11% | 5% | 8% | 22% | 11% | |
| Brightness middle (cd/m²) | 299.6 | 299.1 0% | 343.6 15% | 316 5% | 420 40% | 299.3 0% |
| Brightness (cd/m²) | 285 | 273 -4% | 320 12% | 294 3% | 393 38% | 294 3% |
| Brightness Distribution (%) | 86 | 81 -6% | 87 1% | 84 -2% | 91 6% | 94 9% |
| Black Level * (cd/m²) | 0.33 | 0.27 18% | 0.34 -3% | 0.32 3% | 0.32 3% | 0.29 12% |
| Contrast (:1) | 908 | 1108 22% | 1011 11% | 988 9% | 1313 45% | 1032 14% |
| Colorchecker dE 2000 * | 3.68 | 5.07 -38% | 3.74 -2% | 3.39 8% | 3.04 17% | 2.55 31% |
| Colorchecker dE 2000 max. * | 8.05 | 10.55 -31% | 5.33 34% | 5.56 31% | 7.22 10% | 4.73 41% |
| Colorchecker dE 2000 calibrated * | 3.15 | 3.31 -5% | 3.49 -11% | 2.14 32% | 0.89 72% | 2.9 8% |
| Greyscale dE 2000 * | 3.8 | 6.8 -79% | 3.7 3% | 3.17 17% | 3.91 -3% | 3.5 8% |
| Gamma | 2.12 104% | 2.46 89% | 2.36 93% | 2.39 92% | 2.26 97% | 2.28 96% |
| CCT | 7240 90% | 7805 83% | 6388 102% | 7098 92% | 7138 91% | 7101 92% |
| Color Space (Percent of AdobeRGB 1998) (%) | 58.1 | 58.5 1% | 58 0% | 51 -12% | 60 3% | 57 -2% |
| Color Space (Percent of sRGB) (%) | 89.8 | 89.9 0% | 90 0% | 89 -1% | 95 6% | 88.7 -1% |
| Moyenne finale (programmes/paramètres) | 11% /
-2% | 18% /
10% | -12% /
0% | 30% /
23% | 24% /
15% |
* ... Moindre est la valeur, meilleures sont les performances
Temps de réponse de l'écran
| ↔ Temps de réponse noir à blanc | ||
|---|---|---|
| 19.6 ms ... hausse ↗ et chute ↘ combinées | ↗ 10.8 ms hausse | 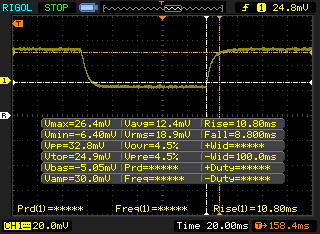 |
| ↘ 8.8 ms chute | ||
| L'écran montre de bons temps de réponse, mais insuffisant pour du jeu compétitif. En comparaison, tous les appareils testés affichent entre 0.1 (minimum) et 240 (maximum) ms. » 43 % des appareils testés affichent de meilleures performances. Cela signifie que les latences relevées sont similaires à la moyenne (19.9 ms) de tous les appareils testés. | ||
| ↔ Temps de réponse gris 50% à gris 80% | ||
| 31.6 ms ... hausse ↗ et chute ↘ combinées | ↗ 14 ms hausse | 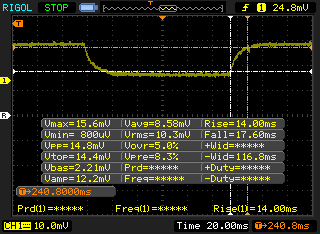 |
| ↘ 17.6 ms chute | ||
| L'écran souffre de latences très élevées, à éviter pour le jeu. En comparaison, tous les appareils testés affichent entre 0.165 (minimum) et 636 (maximum) ms. » 42 % des appareils testés affichent de meilleures performances. Cela signifie que les latences relevées sont similaires à la moyenne (31.1 ms) de tous les appareils testés. | ||
Scintillement / MLI (Modulation de largeur d'impulsion)
| Scintillement / MLI (Modulation de largeur d'impulsion) non décelé | 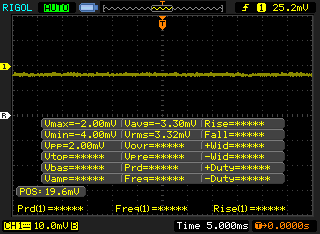 | ||
En comparaison, 52 % des appareils testés n'emploient pas MDI pour assombrir leur écran. Nous avons relevé une moyenne à 7798 (minimum : 5 - maximum : 343500) Hz dans le cas où une MDI était active. | |||
| wPrime 2.10 - 1024m | |
| Asus FX503VM-EH73 | |
| Asus ROG Zephyrus G15 GA502DU | |
| Moyenne Intel Core i7-9750H (n=1) | |
| HP Omen 17t-3AW55AV_1 | |
| MSI GE75 9SG | |
* ... Moindre est la valeur, meilleures sont les performances
| PCMark 8 Home Score Accelerated v2 | 4148 points | |
| PCMark 8 Work Score Accelerated v2 | 5222 points | |
| PCMark 10 Score | 5429 points | |
Aide | ||
| HP Pavilion Gaming 17-cd0085cl Samsung SSD PM981 MZVLB256HAHQ | HP Omen 17t-3AW55AV_1 Samsung SSD PM981 MZVLB512HAJQ | Asus TUF FX705DT-AU068T WDC PC SN520 SDAPNUW-256G | Asus ROG Zephyrus G15 GA502DU Intel SSD 660p SSDPEKNW512G8 | Schenker XMG Ultra 15 Turing Samsung SSD 970 EVO Plus 1TB | |
|---|---|---|---|---|---|
| AS SSD | 8% | -35% | -30% | 51% | |
| Seq Read (MB/s) | 1709 | 1473 -14% | 1546 -10% | 907 -47% | 2739 60% |
| Seq Write (MB/s) | 1345 | 1962 46% | 1182 -12% | 926 -31% | 2650 97% |
| 4K Read (MB/s) | 49.73 | 31.66 -36% | 36.54 -27% | 47.26 -5% | 27.86 -44% |
| 4K Write (MB/s) | 108.2 | 84.4 -22% | 109.2 1% | 98.7 -9% | 134.7 24% |
| 4K-64 Read (MB/s) | 731 | 1125 54% | 612 -16% | 321.5 -56% | 1651 126% |
| 4K-64 Write (MB/s) | 1233 | 1866 51% | 436.6 -65% | 736 -40% | 2190 78% |
| Access Time Read * (ms) | 0.073 | 0.071 3% | 0.113 -55% | 0.064 12% | 0.031 58% |
| Access Time Write * (ms) | 0.034 | 0.047 -38% | 0.034 -0% | 0.045 -32% | 0.028 18% |
| Score Read (Points) | 951 | 1304 37% | 803 -16% | 459 -52% | 1953 105% |
| Score Write (Points) | 1476 | 2147 45% | 664 -55% | 927 -37% | 2590 75% |
| Score Total (Points) | 2909 | 4142 42% | 1869 -36% | 1641 -44% | 5529 90% |
| Copy ISO MB/s (MB/s) | 1284 | 1080 -16% | 698 -46% | 905 -30% | 2031 58% |
| Copy Program MB/s (MB/s) | 589 | 481.1 -18% | 114.1 -81% | 496.9 -16% | 452.1 -23% |
| Copy Game MB/s (MB/s) | 1107 | 875 -21% | 379.6 -66% | 819 -26% | 1043 -6% |
* ... Moindre est la valeur, meilleures sont les performances

| 3DMark 11 Performance | 16005 points | |
| 3DMark Cloud Gate Standard Score | 35562 points | |
| 3DMark Fire Strike Score | 11904 points | |
| 3DMark Time Spy Score | 5245 points | |
Aide | ||
| Bas | Moyen | Élevé | Ultra | |
|---|---|---|---|---|
| BioShock Infinite (2013) | 331.3 | 282 | 259.9 | 130 |
| The Witcher 3 (2015) | 256.8 | 173.3 | 92.1 | 48.5 |
| Shadow of the Tomb Raider (2018) | 126 | 83 | 74 | 64 |
| HP Pavilion Gaming 17-cd0085cl GeForce GTX 1660 Ti Max-Q, i7-9750H, Samsung SSD PM981 MZVLB256HAHQ | Lenovo Legion Y740-17ICH GeForce RTX 2080 Max-Q, i7-8750H, Samsung SSD PM981 MZVLB256HAHQ | HP Omen 17t-3AW55AV_1 GeForce GTX 1070 Mobile, i7-8750H, Samsung SSD PM981 MZVLB512HAJQ | Asus TUF FX705DT-AU068T GeForce GTX 1650 Mobile, R5 3550H, WDC PC SN520 SDAPNUW-256G | MSI GP75 Leopard 9SD GeForce GTX 1660 Ti Mobile, i7-9750H, Kingston RBUSNS8154P3256GJ1 | Eurocom Nightsky RX17 GeForce RTX 2070 Mobile, i7-9750H, 2x Samsung SSD 970 Pro 512GB (RAID 0) | |
|---|---|---|---|---|---|---|
| Noise | -6% | -11% | -6% | -24% | -15% | |
| arrêt / environnement * (dB) | 28.2 | 28.3 -0% | 27.8 1% | 30.8 -9% | 29 -3% | 28 1% |
| Idle Minimum * (dB) | 30.1 | 31.5 -5% | 31.1 -3% | 30.8 -2% | 29 4% | 28 7% |
| Idle Average * (dB) | 30.1 | 31.6 -5% | 31.1 -3% | 30.8 -2% | 34 -13% | 28.4 6% |
| Idle Maximum * (dB) | 30.1 | 31.6 -5% | 35 -16% | 32.2 -7% | 37 -23% | 32.9 -9% |
| Load Average * (dB) | 34.2 | 32.3 6% | 42 -23% | 38.6 -13% | 53 -55% | 45 -32% |
| Witcher 3 ultra * (dB) | 34.2 | 43 -26% | 44.5 -30% | 51 -49% | 53.2 -56% | |
| Load Maximum * (dB) | 43.8 | 45.5 -4% | 46.5 -6% | 44.8 -2% | 55 -26% | 53.2 -21% |
* ... Moindre est la valeur, meilleures sont les performances
Degré de la nuisance sonore
| Au repos |
| 30.1 / 30.1 / 30.1 dB(A) |
| Fortement sollicité |
| 34.2 / 43.8 dB(A) |
 | ||
30 dB silencieux 40 dB(A) audible 50 dB(A) bruyant |
||
min: | ||
(±) La température maximale du côté supérieur est de 42.6 °C / 109 F, par rapport à la moyenne de 40.4 °C / 105 F, allant de 21.2 à 68.8 °C pour la classe Gaming.
(-) Le fond chauffe jusqu'à un maximum de 49 °C / 120 F, contre une moyenne de 43.2 °C / 110 F
(+) En utilisation inactive, la température moyenne du côté supérieur est de 29.8 °C / 86 F, par rapport à la moyenne du dispositif de 33.9 °C / 93 F.
(±) En jouant à The Witcher 3, la température moyenne du côté supérieur est de 33.7 °C / 93 F, alors que la moyenne de l'appareil est de 33.9 °C / 93 F.
(+) Les repose-poignets et le pavé tactile sont plus froids que la température de la peau avec un maximum de 29.2 °C / 84.6 F et sont donc froids au toucher.
(±) La température moyenne de la zone de l'appui-paume de dispositifs similaires était de 28.8 °C / 83.8 F (-0.4 °C / #-0.8 F).
HP Pavilion Gaming 17-cd0085cl analyse audio
(±) | le niveau sonore du haut-parleur est moyen mais bon (74.3# dB)
Analysis not possible as minimum curve is missing or too high
Apple MacBook 12 (Early 2016) 1.1 GHz analyse audio
(+) | les haut-parleurs peuvent jouer relativement fort (83.6# dB)
Basses 100 - 315 Hz
(±) | basse réduite - en moyenne 11.3% inférieure à la médiane
(±) | la linéarité des basses est moyenne (14.2% delta à la fréquence précédente)
Médiums 400 - 2000 Hz
(+) | médiane équilibrée - seulement 2.4% de la médiane
(+) | les médiums sont linéaires (5.5% delta à la fréquence précédente)
Aiguës 2 - 16 kHz
(+) | des sommets équilibrés - à seulement 2% de la médiane
(+) | les aigus sont linéaires (4.5% delta à la fréquence précédente)
Globalement 100 - 16 000 Hz
(+) | le son global est linéaire (10.2% différence à la médiane)
Par rapport à la même classe
» 7% de tous les appareils testés de cette catégorie étaient meilleurs, 2% similaires, 91% pires
» Le meilleur avait un delta de 5%, la moyenne était de 18%, le pire était de 53%.
Par rapport à tous les appareils testés
» 5% de tous les appareils testés étaient meilleurs, 1% similaires, 94% pires
» Le meilleur avait un delta de 4%, la moyenne était de 24%, le pire était de 134%.
| Éteint/en veille | |
| Au repos | |
| Fortement sollicité |
|
Légende:
min: | |
| HP Pavilion Gaming 17-cd0085cl i7-9750H, GeForce GTX 1660 Ti Max-Q, Samsung SSD PM981 MZVLB256HAHQ, IPS, 1920x1080, 17.3" | Lenovo Legion Y740-17ICH i7-8750H, GeForce RTX 2080 Max-Q, Samsung SSD PM981 MZVLB256HAHQ, IPS, 1920x1080, 17.3" | HP Omen 17t-3AW55AV_1 i7-8750H, GeForce GTX 1070 Mobile, Samsung SSD PM981 MZVLB512HAJQ, IPS, 1920x1080, 17.3" | MSI GP75 Leopard 9SD i7-9750H, GeForce GTX 1660 Ti Mobile, Kingston RBUSNS8154P3256GJ1, IPS, 1920x1080, 17.3" | Eurocom Nightsky RX17 i7-9750H, GeForce RTX 2070 Mobile, 2x Samsung SSD 970 Pro 512GB (RAID 0), IPS, 1920x1080, 17.3" | Asus ROG Zephyrus G15 GA502DU R7 3750H, GeForce GTX 1660 Ti Max-Q, Intel SSD 660p SSDPEKNW512G8, IPS, 1920x1080, 15.6" | |
|---|---|---|---|---|---|---|
| Power Consumption | -105% | -101% | -48% | -96% | -31% | |
| Idle Minimum * (Watt) | 5.4 | 20.2 -274% | 17.8 -230% | 10 -85% | 18.6 -244% | 7.4 -37% |
| Idle Average * (Watt) | 9.2 | 27.2 -196% | 24.7 -168% | 15 -63% | 22.6 -146% | 8.6 7% |
| Idle Maximum * (Watt) | 13 | 28.7 -121% | 29.6 -128% | 22 -69% | 23 -77% | 39.1 -201% |
| Load Average * (Watt) | 85.9 | 90.8 -6% | 110 -28% | 92 -7% | 93.4 -9% | 65.9 23% |
| Witcher 3 ultra * (Watt) | 107.9 | 152.1 -41% | 167.8 -56% | 153 -42% | 186.4 -73% | 106.9 1% |
| Load Maximum * (Watt) | 182.2 | 165.4 9% | 178.6 2% | 216 -19% | 233.6 -28% | 141.3 22% |
* ... Moindre est la valeur, meilleures sont les performances
| HP Pavilion Gaming 17-cd0085cl i7-9750H, GeForce GTX 1660 Ti Max-Q, 52.5 Wh | Lenovo Legion Y740-17ICH i7-8750H, GeForce RTX 2080 Max-Q, 76 Wh | HP Omen 17t-3AW55AV_1 i7-8750H, GeForce GTX 1070 Mobile, 86 Wh | Asus TUF FX705DT-AU068T R5 3550H, GeForce GTX 1650 Mobile, 64 Wh | MSI GP75 Leopard 9SD i7-9750H, GeForce GTX 1660 Ti Mobile, 51 Wh | Razer Blade Pro 17 RTX 2080 Max-Q i7-9750H, GeForce RTX 2080 Max-Q, 70 Wh | Eurocom Nightsky RX17 i7-9750H, GeForce RTX 2070 Mobile, 62 Wh | |
|---|---|---|---|---|---|---|---|
| Autonomie de la batterie | -44% | -9% | 55% | -48% | -12% | -36% | |
| Reader / Idle (h) | 11.6 | 4.5 -61% | 13.6 17% | 4.8 -59% | 4.9 -58% | 4.2 -64% | |
| WiFi v1.3 (h) | 5.7 | 3.2 -44% | 4.2 -26% | 7.8 37% | 3.2 -44% | 4.7 -18% | 2 -65% |
| Load (h) | 1 | 1.6 60% | 2.1 110% | 0.6 -40% | 1.4 40% | 1.2 20% |
Points positifs
Points négatifs
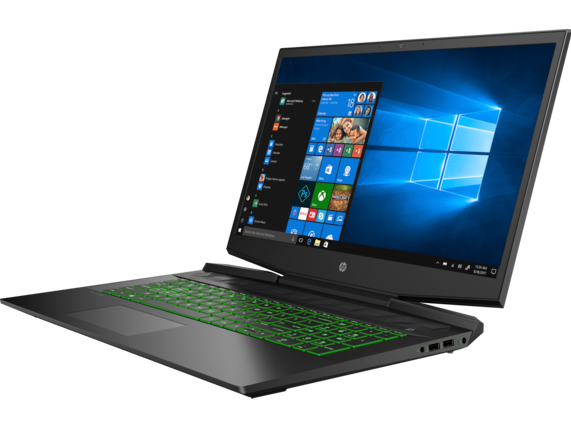
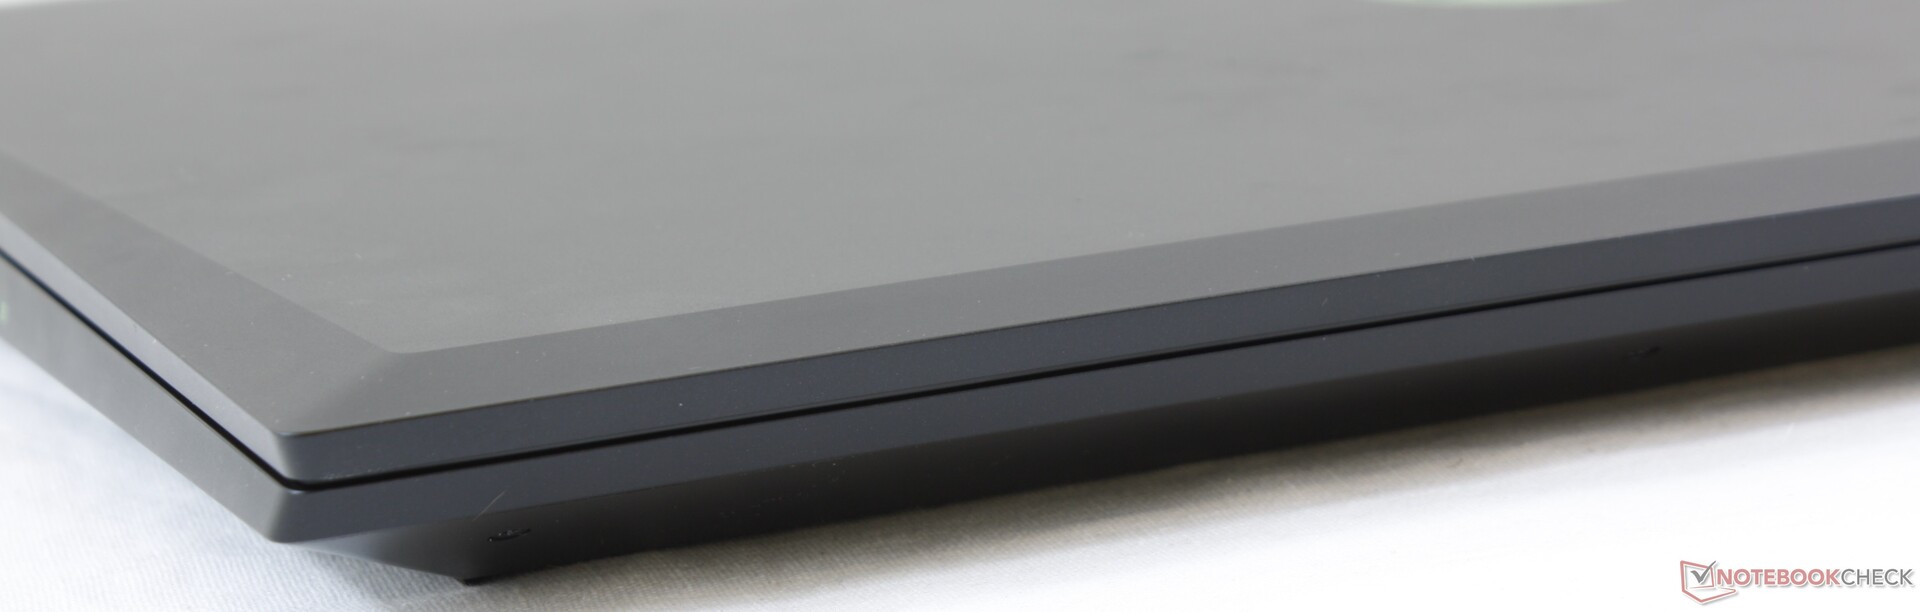
Un mot résume notre impression générale du Pavilion Gaming 17 : l’étonnement. La série Pavilion de HP constitue son offre bas de gamme, conçue pour les utilisateurs à petit budget, si bien que nous ajustons nos attentes en fonction. Ce modèle en particulier nous a pris par surprise, en étant l’un des portables de jeu les plus silencieux testés jusqu’à aujourd’hui, et également l’un des Pavilion les plus fins et les plus solides. HP commence à être clairement plus attentif à ses portables de jeu d’entrée de gamme, et le démontre avec le Pavilion Gaming 17.
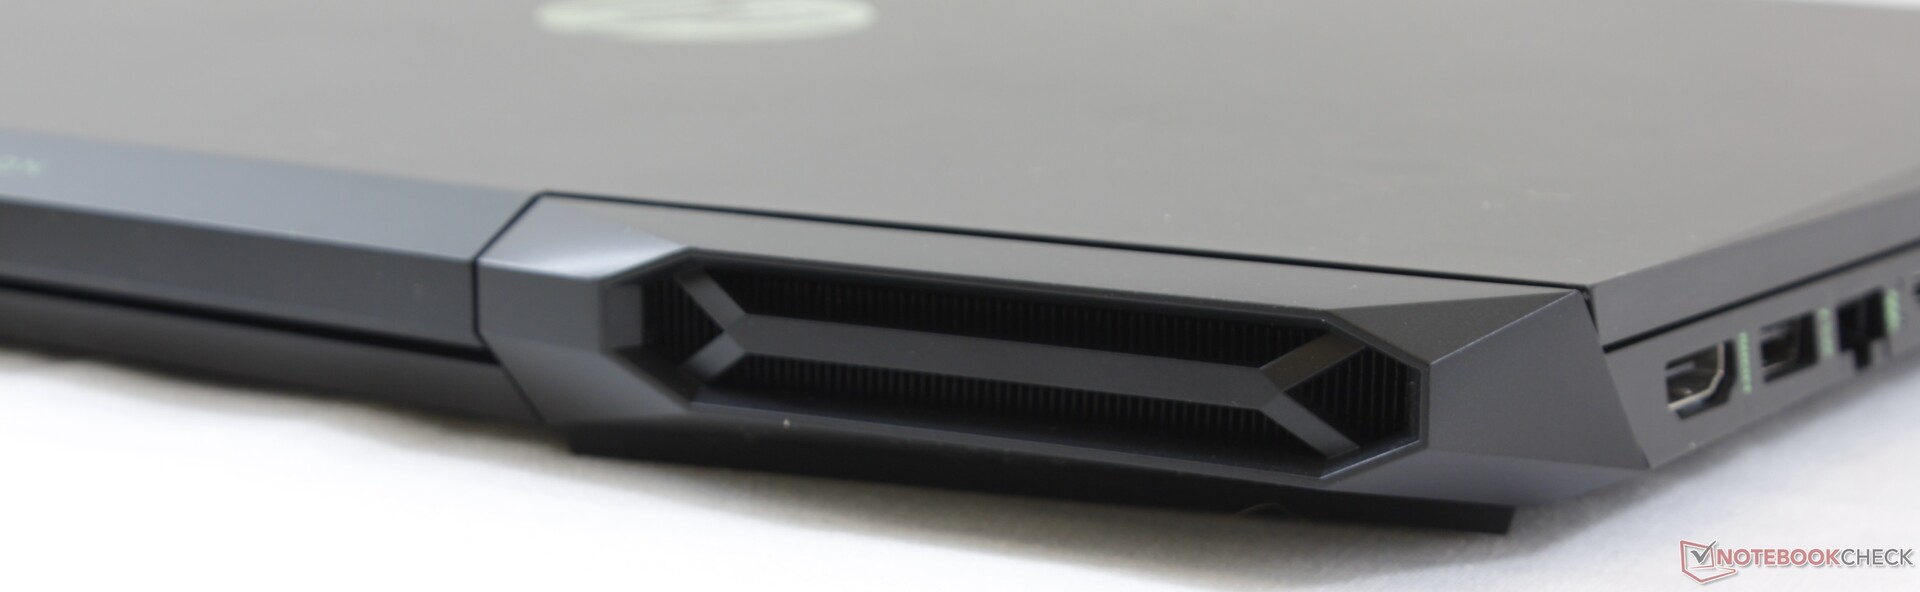
Il y a toujours des éléments cheap qui pourraient être améliorés. Le clickpad étroit, la partie écran flexible, les haut-parleurs médiocres, et les grilles arrière fragiles donnent l’impression d’appartenir à un portable bien moins cher.
Notre plus grosse réserve ici est que le Pavilion Gaming 17 avec i9-9750H et GTX 1660 Ti Max-Q est plus cher que les systèmes avec des spécifications similaires. À 1 300 $, il n’est que de 100 à 200 $ moins cher que le MSI GL73, le MSI GP75, l’Asus TUF FX705, ou que l’Asus ROG GL731GU, en fonction de la RAM, du stockage et de l’écran. Mais le Pavilion reste néanmoins une bonne affaire, tout simplement grâce à son faible niveau sonore en jeu.
Un Pavilion qui se hisse au-dessus de la catégorie à bas coût. Non seulement il est plutôt silencieux pour un portable de jeu, mais sa construction solide élève la barre de ce que les futurs portables Pavilion pourront proposer.
L’intégralité de cette critique est disponible en anglais en suivant ce lien.
HP Pavilion Gaming 17-cd0085cl
- 09/20/2019 v7 (old)
Allen Ngo
Price comparison
