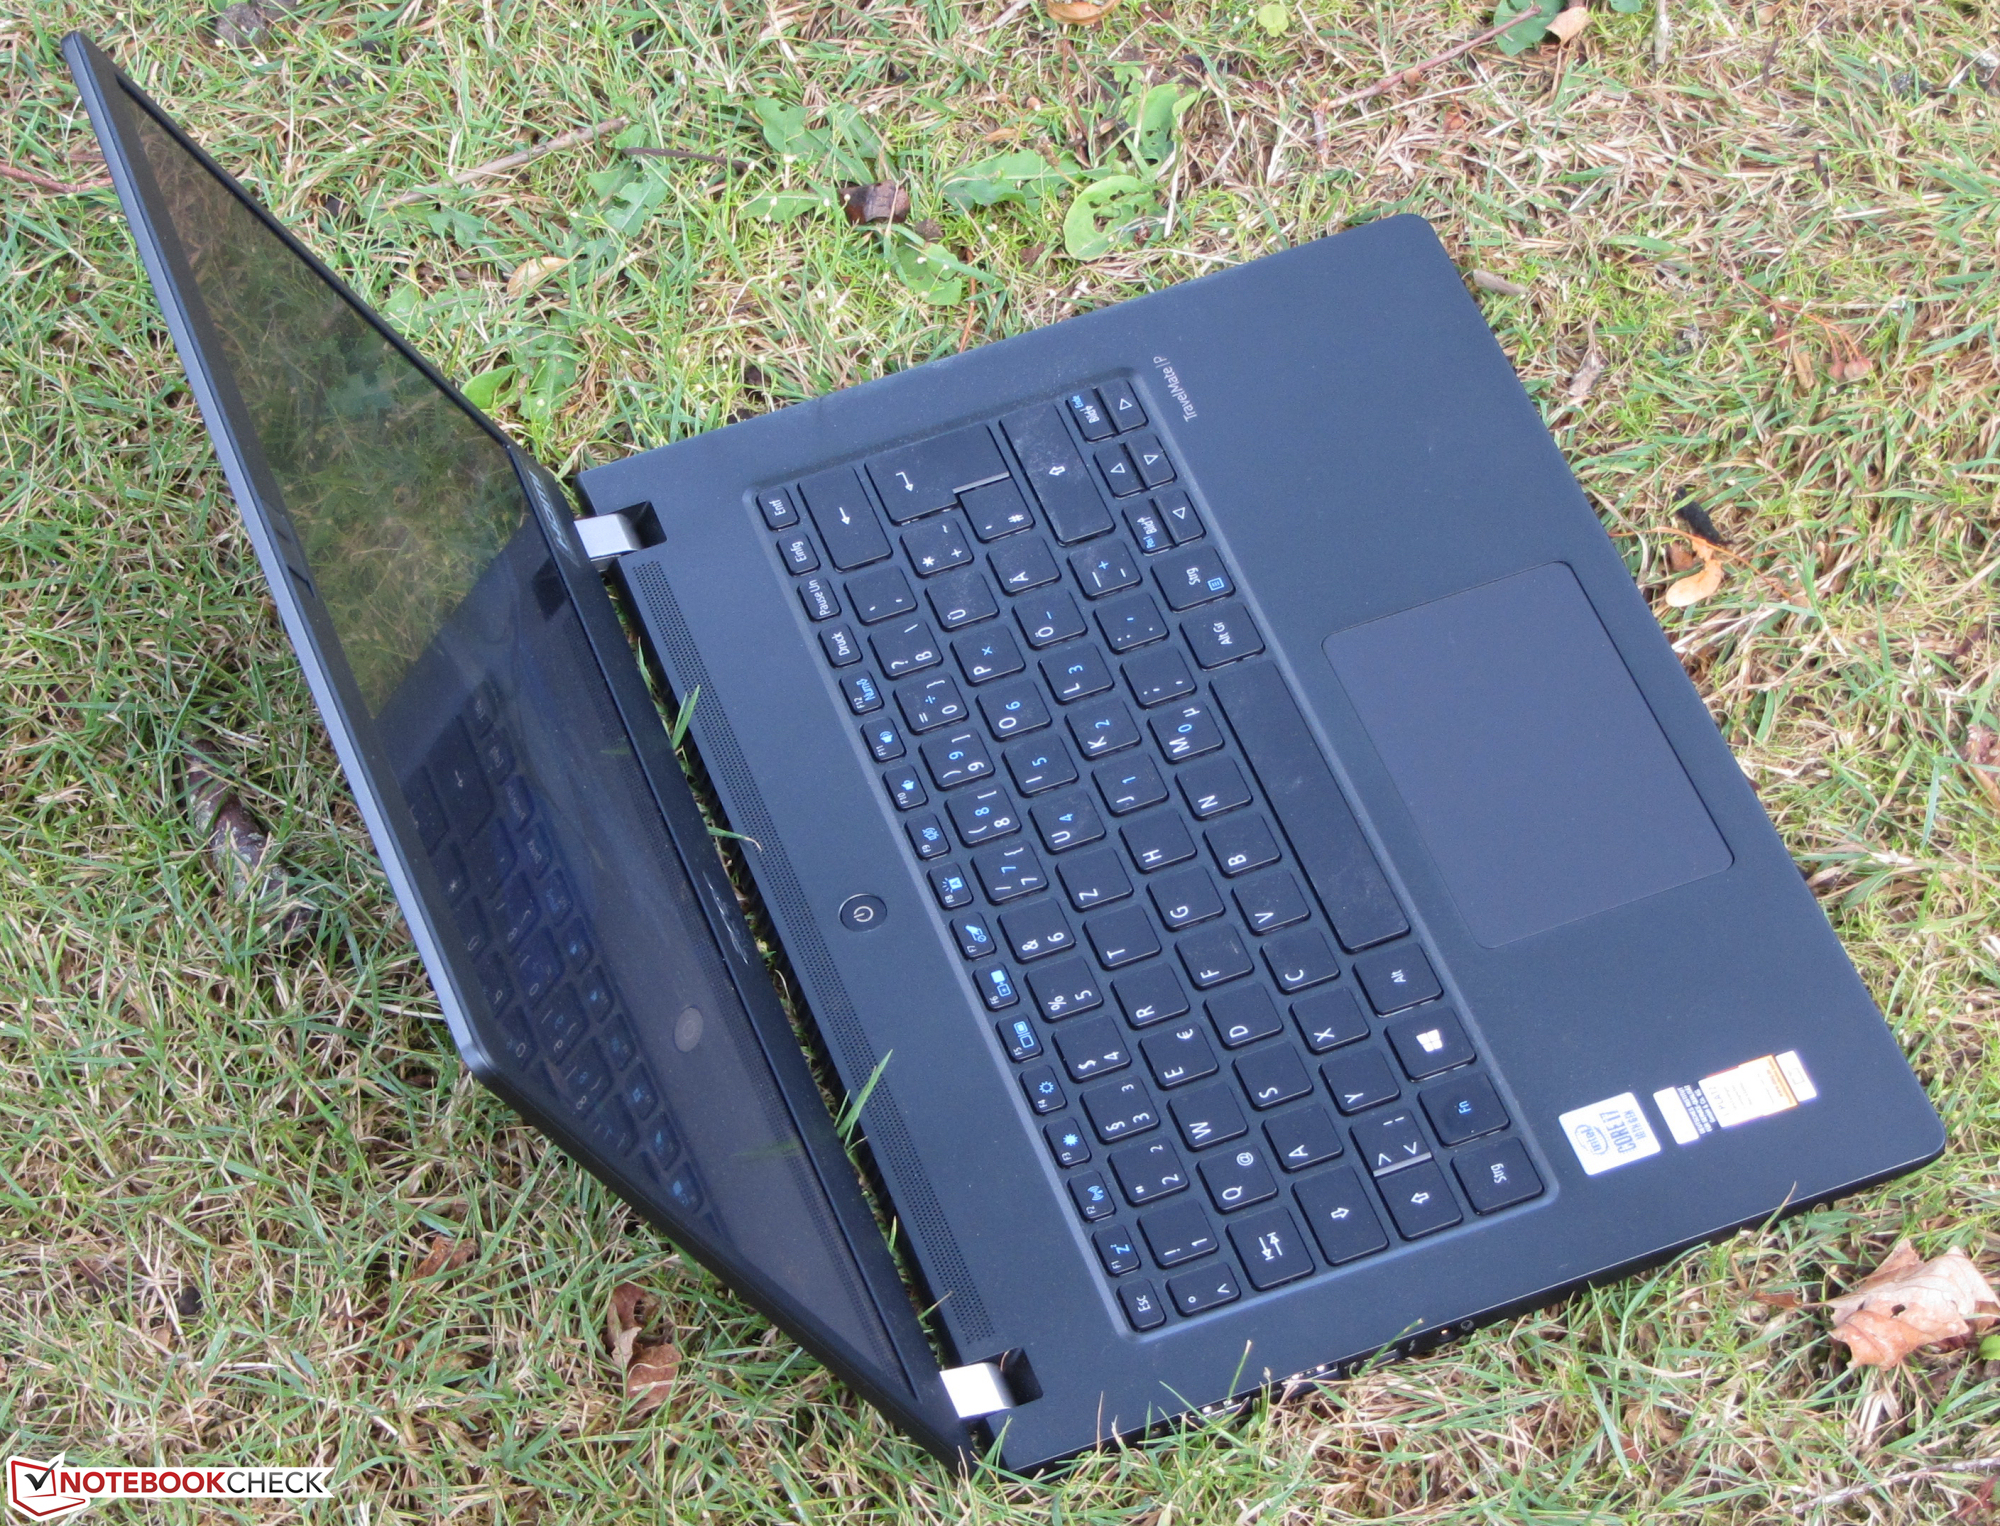
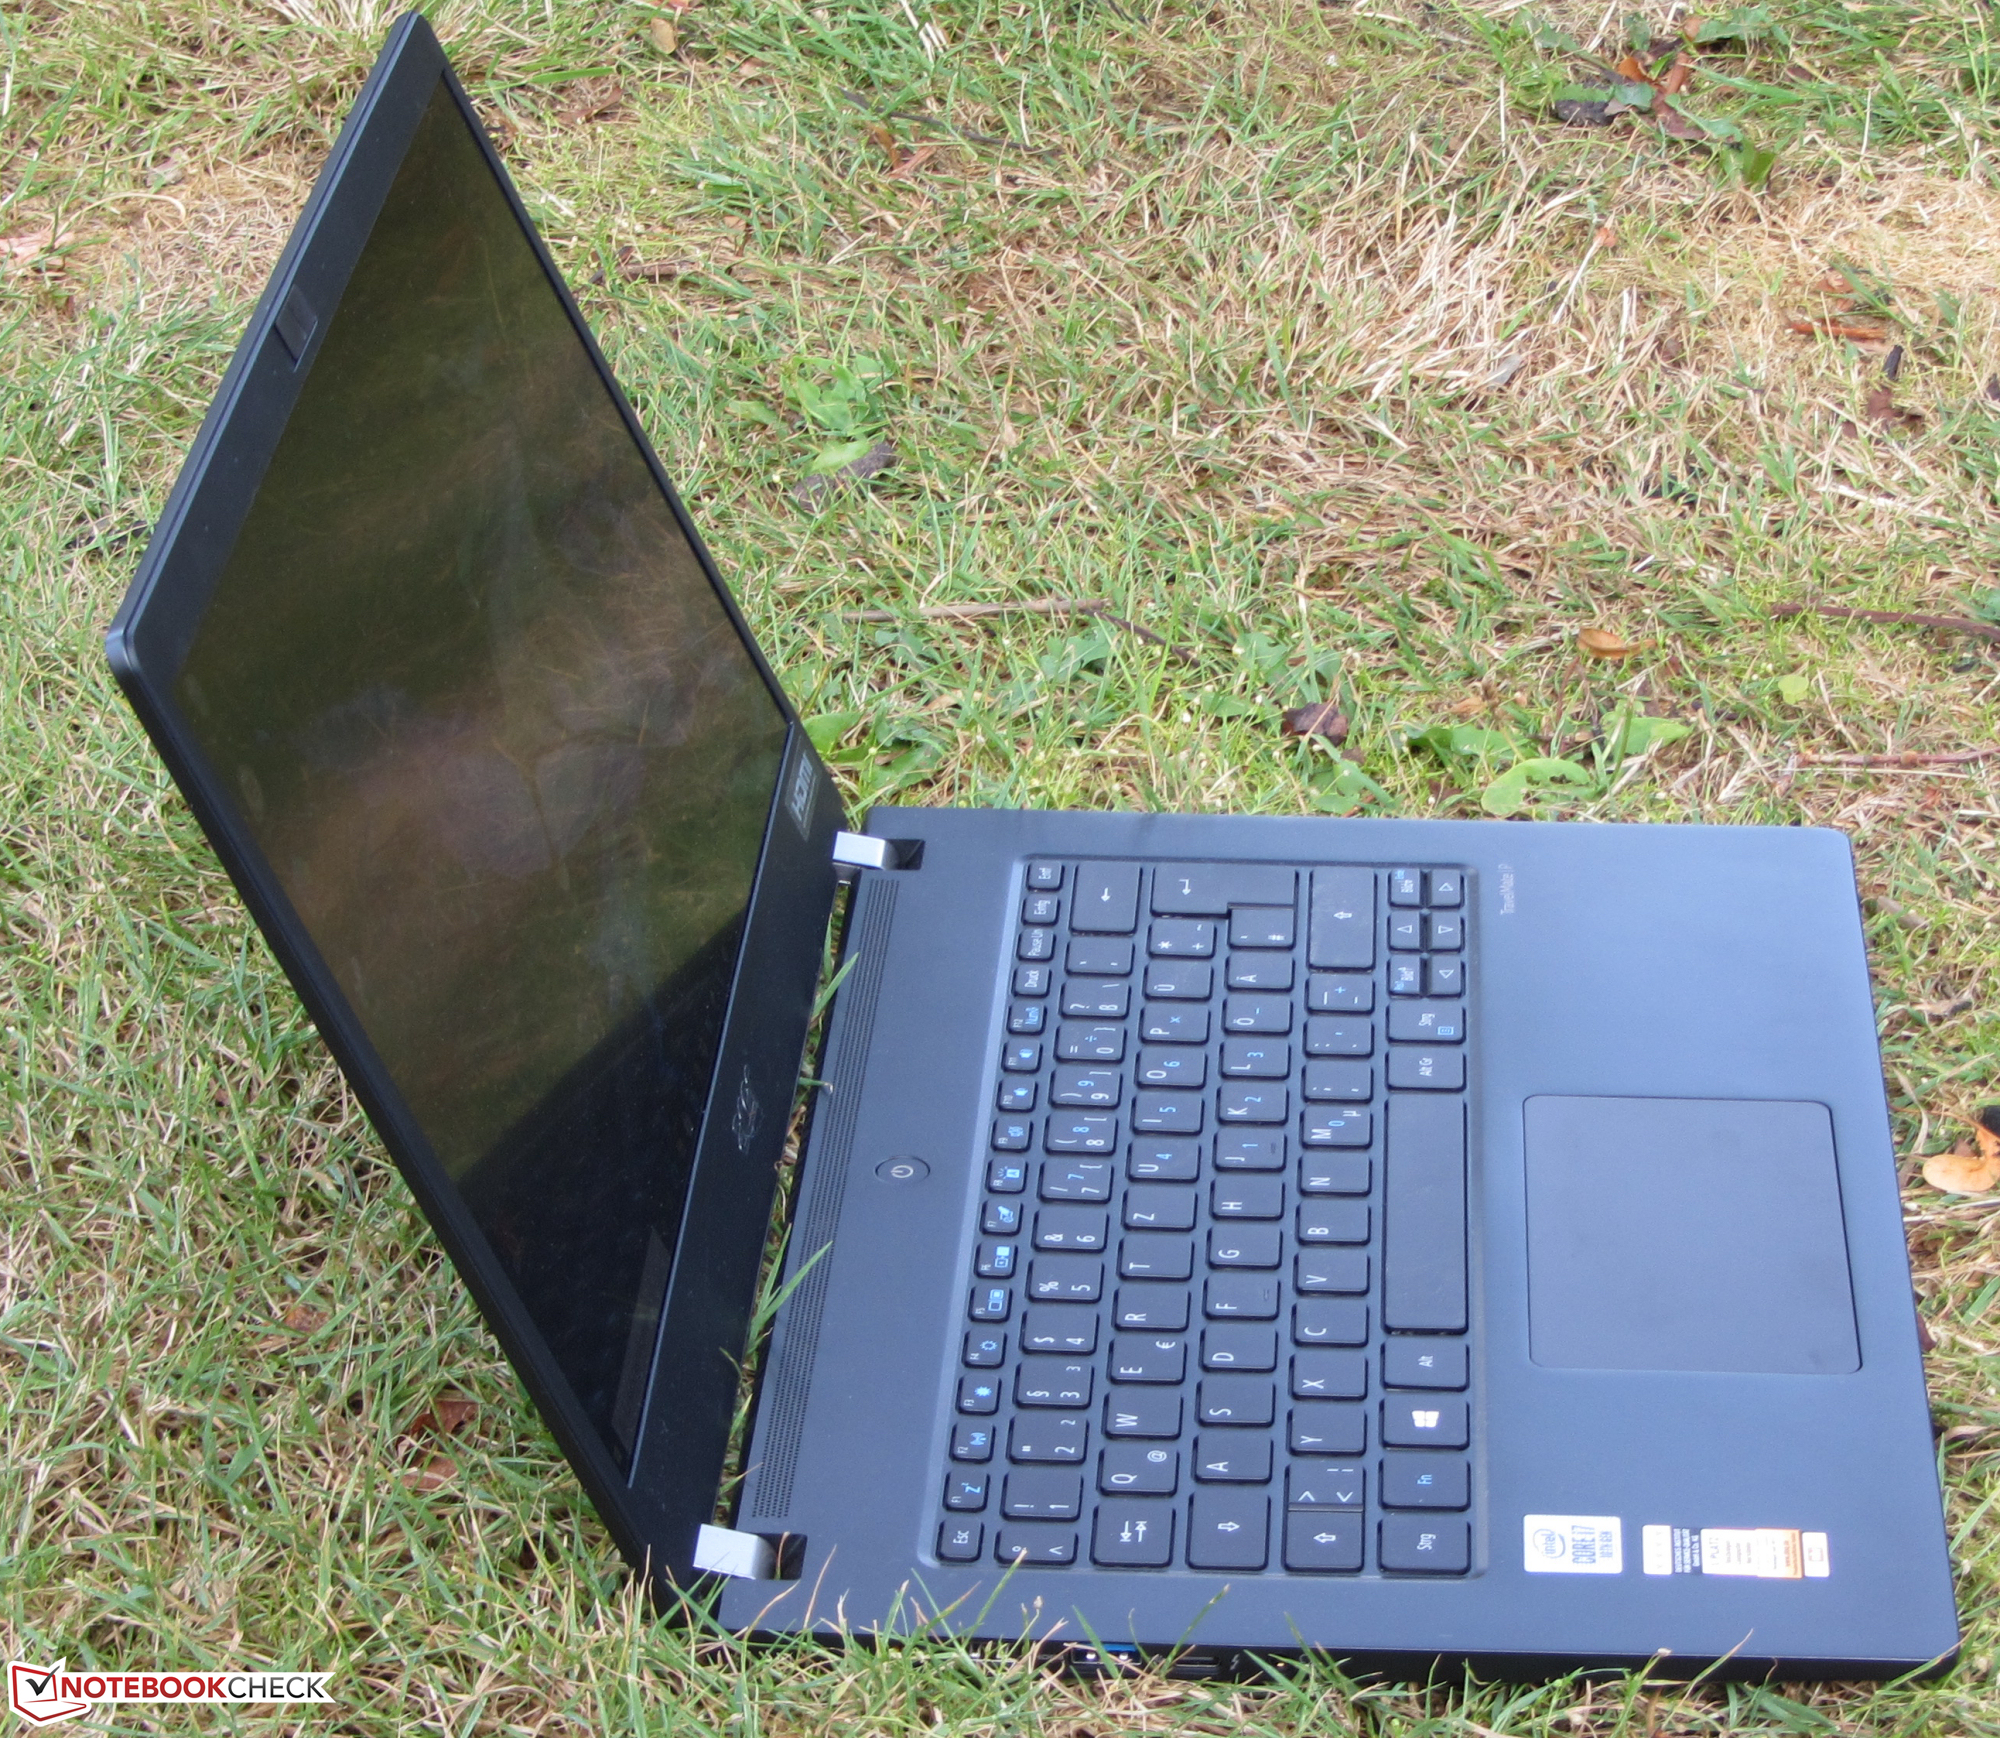
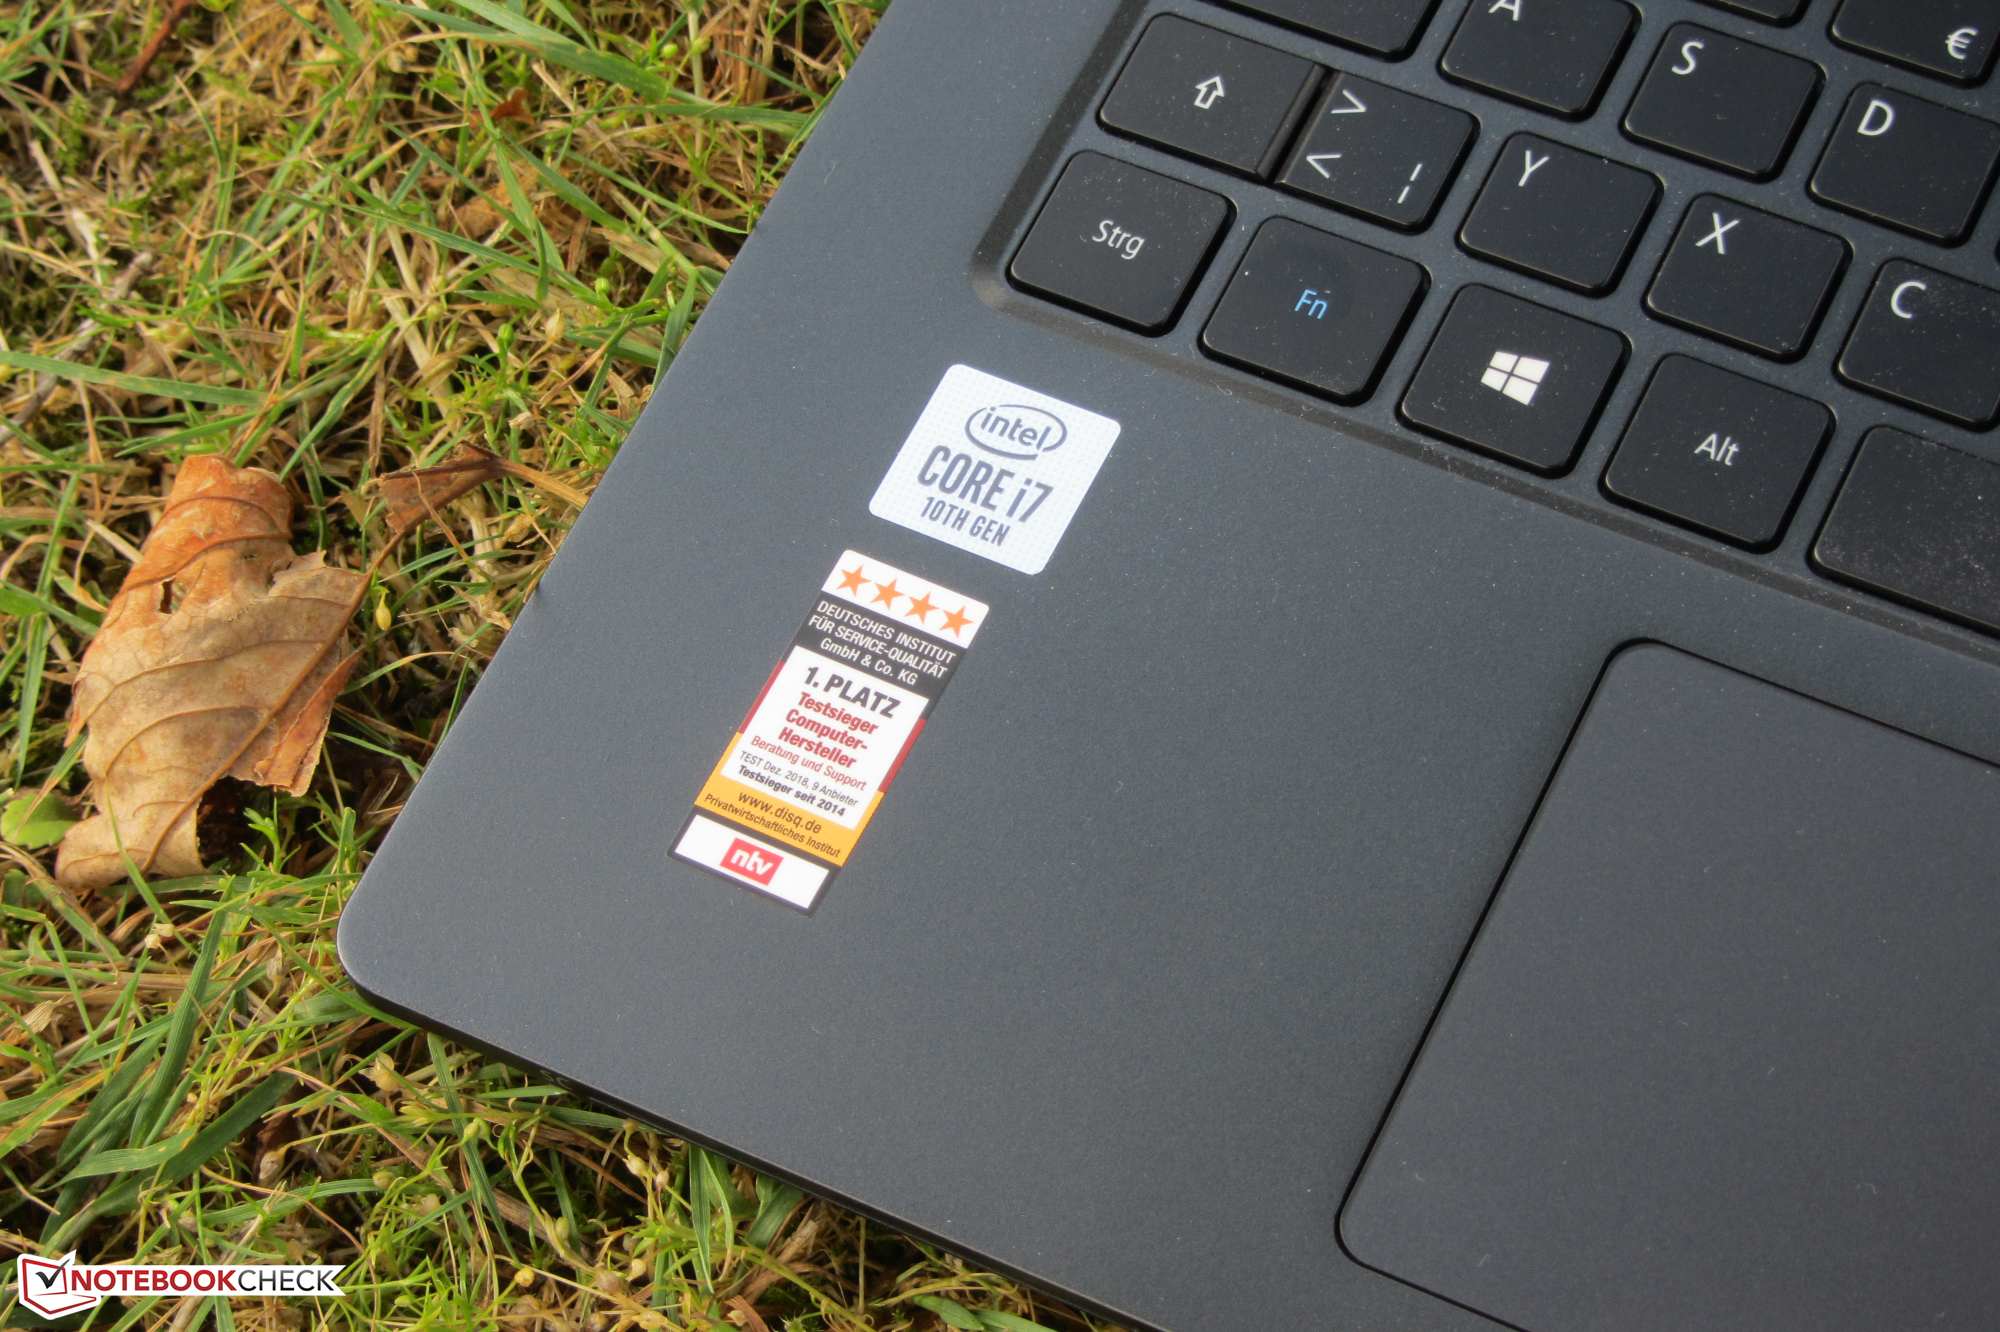
Test de l'Acer TravelMate P6 (i7-10510U, UHD620, FHD) : PC portable professionnel léger avec une bonne autonomie
Note | Date | Modèle | Poids | Épaisseur | Taille | Résolution | Prix |
|---|---|---|---|---|---|---|---|
| 87 % v7 (old) | 09/20 | Acer TravelMate P6 P614-51T-G2-72ZU i7-10510U, UHD Graphics 620 | 1.2 kg | 16.6 mm | 14.00" | 1920x1080 | |
| 90.2 % v7 (old) | 08/20 | Lenovo ThinkPad X1 Carbon 2020-20UAS04T00 i7-10510U, UHD Graphics 620 | 1.1 kg | 14.9 mm | 14.00" | 1920x1080 | |
| 88.8 % v7 (old) | 09/20 | Lenovo ThinkPad T14s-20T00044GE i5-10210U, UHD Graphics 620 | 1.3 kg | 16.1 mm | 14.00" | 1920x1080 | |
| 90.5 % v7 (old) | 09/20 | Lenovo ThinkPad T14s-20UJS00K00 R7 PRO 4750U, Vega 7 | 1.3 kg | 16.1 mm | 14.00" | 1920x1080 | |
| 88.9 % v7 (old) | 08/20 | Dell Latitude 7410 i7-10610U, UHD Graphics 620 | 1.4 kg | 19.3 mm | 14.00" | 3840x2160 | |
| 87.5 % v7 (old) | 09/20 | Asus ZenBook 13 UX325JA i7-1065G7, Iris Plus Graphics G7 (Ice Lake 64 EU) | 1.1 kg | 13.9 mm | 13.30" | 1920x1080 | |
| 92.1 % v7 (old) | 07/20 | Apple MacBook Pro 13 2020 2GHz i5 10th-Gen i5-1038NG7, Iris Plus Graphics G7 (Ice Lake 64 EU) | 1.4 kg | 15.6 mm | 13.30" | 2560x1600 |


| SD Card Reader | |
| average JPG Copy Test (av. of 3 runs) | |
| Dell Latitude 7410 (Toshiba Exceria Pro M501 64 GB UHS-II) | |
| Lenovo ThinkPad T14s-20UJS00K00 (Toshiba Exceria Pro M501 64 GB UHS-II) | |
| Asus ZenBook 13 UX325JA (Toshiba Exceria Pro M501 microSDXC 64GB) | |
| HP ProBook 445 G7 175W4EA (Toshiba Exceria Pro SDXC 64 GB UHS-II) | |
| Moyenne de la classe Office (19.8 - 198.5, n=22, 2 dernières années) | |
| Lenovo ThinkPad T14s-20T00044GE (Toshiba Exceria Pro M501 64 GB UHS-II) | |
| Acer TravelMate P6 P614-51T-G2-72ZU (Toshiba Exceria Pro M501 microSDXC 64GB) | |
| maximum AS SSD Seq Read Test (1GB) | |
| Dell Latitude 7410 (Toshiba Exceria Pro M501 64 GB UHS-II) | |
| HP ProBook 445 G7 175W4EA (Toshiba Exceria Pro SDXC 64 GB UHS-II) | |
| Asus ZenBook 13 UX325JA (Toshiba Exceria Pro M501 microSDXC 64GB) | |
| Lenovo ThinkPad T14s-20UJS00K00 (Toshiba Exceria Pro M501 64 GB UHS-II) | |
| Moyenne de la classe Office (27.4 - 249, n=21, 2 dernières années) | |
| Lenovo ThinkPad T14s-20T00044GE (Toshiba Exceria Pro M501 64 GB UHS-II) | |
| Acer TravelMate P6 P614-51T-G2-72ZU (Toshiba Exceria Pro M501 microSDXC 64GB) | |


, i5-1038NG7, Apple SSD SM0512F")
, i5-1038NG7, Apple SSD SM0512F")


, i7-1065G7, Intel SSD 660p 1TB SSDPEKNW010T8")
, i7-1065G7, Intel SSD 660p 1TB SSDPEKNW010T8")


| |||||||||||||||||||||||||
Homogénéité de la luminosité: 90 %
Valeur mesurée au centre, sur batterie: 323 cd/m²
Contraste: 923:1 (Valeurs des noirs: 0.35 cd/m²)
ΔE ColorChecker Calman: 3.07 | ∀{0.5-29.43 Ø4.72}
calibrated: 3.07
ΔE Greyscale Calman: 2.99 | ∀{0.09-98 Ø4.97}
93% sRGB (Argyll 1.6.3 3D)
61% AdobeRGB 1998 (Argyll 1.6.3 3D)
68.6% AdobeRGB 1998 (Argyll 3D)
93.7% sRGB (Argyll 3D)
69.2% Display P3 (Argyll 3D)
Gamma: 2.32
CCT: 6097 K
| Acer TravelMate P6 P614-51T-G2-72ZU AU Optronics B140HAK02.5, IPS, 1920x1080, 14" | Lenovo ThinkPad X1 Carbon 2020-20UAS04T00 BOE NE140FHM-N61, IPS, 1920x1080, 14" | Lenovo ThinkPad T14s-20T00044GE B140HAN05.7, LTPS AHVA-IPS LED, 1920x1080, 14" | Lenovo ThinkPad T14s-20UJS00K00 N140HCG-GQ2, IPS , 1920x1080, 14" | Dell Latitude 7410 AU Optronics B140ZAN, IPS, 3840x2160, 14" | Asus ZenBook 13 UX325JA Sharp LQ133M1JW40, IPS, 1920x1080, 13.3" | Apple MacBook Pro 13 2020 2GHz i5 10th-Gen APPA03D, IPS, 2560x1600, 13.3" | HP ProBook 445 G7 175W4EA BOE0868, IPS, 1920x1080, 14" | |
|---|---|---|---|---|---|---|---|---|
| Display | -1% | -1% | 1% | 5% | -4% | 25% | -39% | |
| Display P3 Coverage (%) | 69.2 | 68.9 0% | 66.6 -4% | 66.8 -3% | 71.8 4% | 63.8 -8% | 98.8 43% | 39.92 -42% |
| sRGB Coverage (%) | 93.7 | 91.6 -2% | 96.8 3% | 97.9 4% | 99.3 6% | 94.5 1% | 99.9 7% | 59.6 -36% |
| AdobeRGB 1998 Coverage (%) | 68.6 | 67.1 -2% | 67.6 -1% | 69 1% | 72.4 6% | 64.9 -5% | 86.4 26% | 41.25 -40% |
| Response Times | -46% | -40% | 27% | 4% | -4% | -25% | -12% | |
| Response Time Grey 50% / Grey 80% * (ms) | 37 ? | 64.8 ? -75% | 63.2 ? -71% | 32.4 ? 12% | 39.2 ? -6% | 47 ? -27% | 46 ? -24% | 40 ? -8% |
| Response Time Black / White * (ms) | 26 ? | 30.4 ? -17% | 28 ? -8% | 15.2 ? 42% | 22.4 ? 14% | 21 ? 19% | 32.4 ? -25% | 30 ? -15% |
| PWM Frequency (Hz) | 2404 ? | 26040 ? | 250 ? | 113600 ? | 192 ? | |||
| Screen | -5% | 25% | 27% | -7% | 5% | 39% | -36% | |
| Brightness middle (cd/m²) | 323 | 422 31% | 404 25% | 404 25% | 388.6 20% | 435 35% | 512 59% | 277 -14% |
| Brightness (cd/m²) | 308 | 395 28% | 397 29% | 371 20% | 365 19% | 404 31% | 491 59% | 270 -12% |
| Brightness Distribution (%) | 90 | 90 0% | 92 2% | 88 -2% | 82 -9% | 83 -8% | 91 1% | 88 -2% |
| Black Level * (cd/m²) | 0.35 | 0.27 23% | 0.21 40% | 0.34 3% | 0.35 -0% | 0.565 -61% | 0.32 9% | 0.285 19% |
| Contrast (:1) | 923 | 1563 69% | 1924 108% | 1188 29% | 1110 20% | 770 -17% | 1600 73% | 972 5% |
| Colorchecker dE 2000 * | 3.07 | 4.7 -53% | 3.1 -1% | 1.4 54% | 4.04 -32% | 2.66 13% | 1.7 45% | 5.53 -80% |
| Colorchecker dE 2000 max. * | 5.8 | 10 -72% | 4.7 19% | 3.2 45% | 9.2 -59% | 4.73 18% | 3.4 41% | 10.68 -84% |
| Colorchecker dE 2000 calibrated * | 3.07 | 2 35% | 1.3 58% | 0.8 74% | 1.25 59% | 1.19 61% | 1 67% | 4.43 -44% |
| Greyscale dE 2000 * | 2.99 | 6.4 -114% | 3.4 -14% | 1.6 46% | 6.4 -114% | 3.65 -22% | 1.9 36% | 6.2 -107% |
| Gamma | 2.32 95% | 2.12 104% | 2.38 92% | 2.13 103% | 2.3 96% | 2.34 94% | 2.19 100% | 2.34 94% |
| CCT | 6097 107% | 7106 91% | 7070 92% | 6480 100% | 6957 93% | 7109 91% | 6817 95% | 7342 89% |
| Color Space (Percent of AdobeRGB 1998) (%) | 61 | 59.5 -2% | 61.8 1% | 63 3% | 66.4 9% | 60 -2% | 77.4 27% | 38 -38% |
| Color Space (Percent of sRGB) (%) | 93 | 91.5 -2% | 96.6 4% | 97.9 5% | 99.4 7% | 95 2% | 99.9 7% | 59 -37% |
| Moyenne finale (programmes/paramètres) | -17% /
-10% | -5% /
12% | 18% /
22% | 1% /
-4% | -1% /
2% | 13% /
28% | -29% /
-33% |
* ... Moindre est la valeur, meilleures sont les performances
Temps de réponse de l'écran
| ↔ Temps de réponse noir à blanc | ||
|---|---|---|
| 26 ms ... hausse ↗ et chute ↘ combinées | ↗ 14 ms hausse | 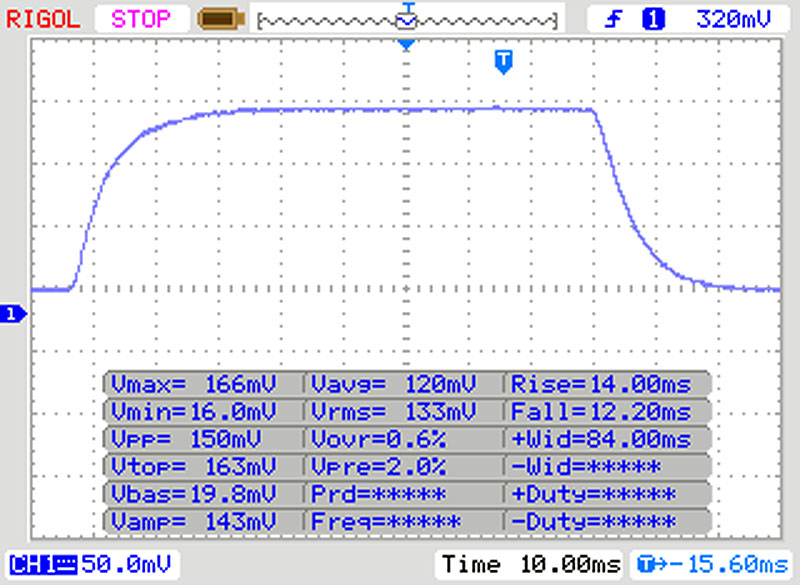 |
| ↘ 12 ms chute | ||
| L'écran souffre de latences relativement élevées, insuffisant pour le jeu. En comparaison, tous les appareils testés affichent entre 0.1 (minimum) et 240 (maximum) ms. » 62 % des appareils testés affichent de meilleures performances. Cela signifie que les latences relevées sont moins bonnes que la moyenne (19.8 ms) de tous les appareils testés. | ||
| ↔ Temps de réponse gris 50% à gris 80% | ||
| 37 ms ... hausse ↗ et chute ↘ combinées | ↗ 18 ms hausse | 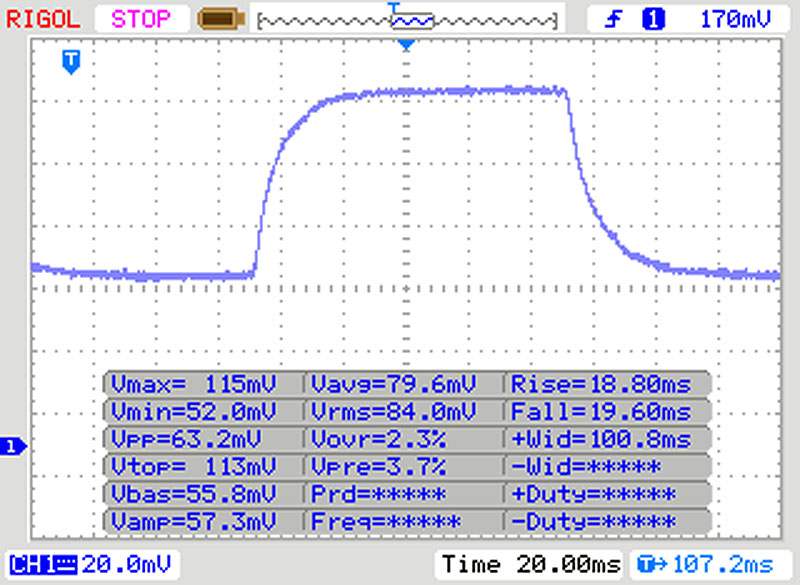 |
| ↘ 19 ms chute | ||
| L'écran souffre de latences très élevées, à éviter pour le jeu. En comparaison, tous les appareils testés affichent entre 0.165 (minimum) et 636 (maximum) ms. » 53 % des appareils testés affichent de meilleures performances. Cela signifie que les latences relevées sont moins bonnes que la moyenne (31 ms) de tous les appareils testés. | ||
Scintillement / MLI (Modulation de largeur d'impulsion)
| Scintillement / MLI (Modulation de largeur d'impulsion) non décelé | 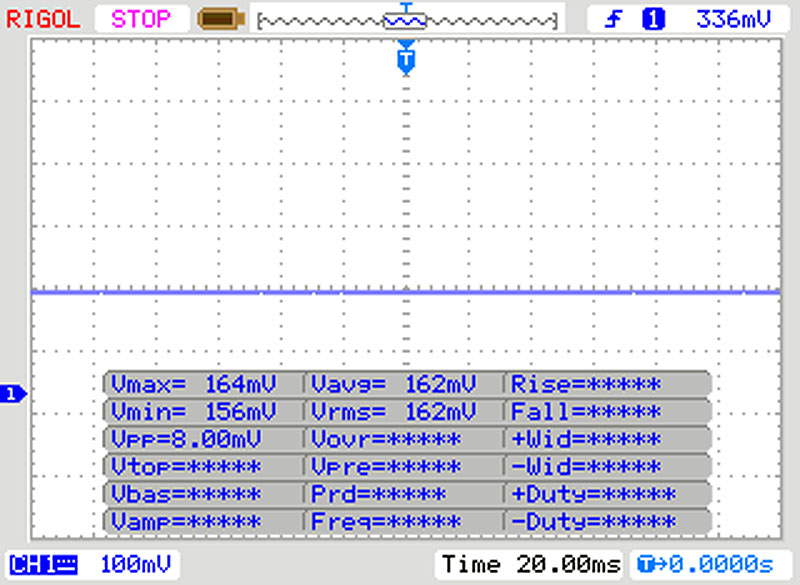 | ||
En comparaison, 52 % des appareils testés n'emploient pas MDI pour assombrir leur écran. Nous avons relevé une moyenne à 7772 (minimum : 5 - maximum : 343500) Hz dans le cas où une MDI était active. | |||
* ... Moindre est la valeur, meilleures sont les performances
| PCMark 8 Home Score Accelerated v2 | 3323 points | |
| PCMark 8 Creative Score Accelerated v2 | 3981 points | |
| PCMark 8 Work Score Accelerated v2 | 5171 points | |
| PCMark 10 Score | 4438 points | |
Aide | ||
| DPC Latencies / LatencyMon - interrupt to process latency (max), Web, Youtube, Prime95 | |
| Acer TravelMate P6 P614-51T-G2-72ZU | |
| Asus ZenBook 13 UX325JA | |
| Lenovo ThinkPad T14s-20T00044GE | |
| Lenovo ThinkPad T14s-20UJS00K00 | |
| HP ProBook 445 G7 175W4EA | |
| Dell Latitude 7410 | |
| Lenovo ThinkPad X1 Carbon 2020-20UAS04T00 | |
* ... Moindre est la valeur, meilleures sont les performances

| Acer TravelMate P6 P614-51T-G2-72ZU Samsung PM991 MZVLQ512HALU | Lenovo ThinkPad X1 Carbon 2020-20UAS04T00 Samsung SSD PM981a MZVLB512HBJQ | Lenovo ThinkPad T14s-20T00044GE Samsung SSD PM981a MZVLB256HBHQ | Lenovo ThinkPad T14s-20UJS00K00 WDC PC SN730 SDBPNTY-1T00 | Dell Latitude 7410 Toshiba XG6 KXG60ZNV512G | Asus ZenBook 13 UX325JA Intel SSD 660p 1TB SSDPEKNW010T8 | Apple MacBook Pro 13 2020 2GHz i5 10th-Gen Apple SSD SM0512F | HP ProBook 445 G7 175W4EA Samsung PM991 MZVLQ512HALU | Moyenne Samsung PM991 MZVLQ512HALU | |
|---|---|---|---|---|---|---|---|---|---|
| CrystalDiskMark 5.2 / 6 | 34% | 13% | 27% | 25% | -2% | -21% | -8% | -6% | |
| Write 4K (MB/s) | 151.8 | 185 22% | 117.5 -23% | 108 -29% | 133.4 -12% | 139.7 -8% | 28.16 -81% | 144.6 -5% | 131.8 ? -13% |
| Read 4K (MB/s) | 55 | 50.6 -8% | 40.81 -26% | 39.82 -28% | 51.3 -7% | 56.4 3% | 17.5 -68% | 38.08 -31% | 44.9 ? -18% |
| Write Seq (MB/s) | 1292 | 1543 19% | 2031 57% | 2028 57% | 1897 47% | 1265 -2% | 1195 -8% | 1320 2% | 1162 ? -10% |
| Read Seq (MB/s) | 1668 | 1509 -10% | 1970 18% | 1826 9% | 2202 32% | 1492 -11% | 1470 -12% | 1397 -16% | 1473 ? -12% |
| Write 4K Q32T1 (MB/s) | 440.7 | 488.8 11% | 395.5 -10% | 570 29% | 384.9 -13% | 402.5 -9% | 205 -53% | 324.2 -26% | 399 ? -9% |
| Read 4K Q32T1 (MB/s) | 477.4 | 579 21% | 361.4 -24% | 401.5 -16% | 318.7 -33% | 329.3 -31% | 692 45% | 434.8 -9% | 426 ? -11% |
| Write Seq Q32T1 (MB/s) | 1169 | 2986 155% | 2330 99% | 3091 164% | 2866 145% | 1786 53% | 1475 26% | 1382 18% | 1348 ? 15% |
| Read Seq Q32T1 (MB/s) | 2245 | 3555 58% | 2530 13% | 2872 28% | 3122 39% | 1923 -14% | 1920 -14% | 2354 5% | 2398 ? 7% |
| AS SSD | 61% | 6% | 34% | -7% | -21% | -79% | -2% | -6% | |
| Seq Read (MB/s) | 2057 | 2659 29% | 2631 28% | 2291 11% | 1837 -11% | 1587 -23% | 1300 -37% | 1936 -6% | 1921 ? -7% |
| Seq Write (MB/s) | 1244 | 2551 105% | 1191 -4% | 1343 8% | 1438 16% | 938 -25% | 1518 22% | 1213 -2% | 1128 ? -9% |
| 4K Read (MB/s) | 48.07 | 56.4 17% | 44.76 -7% | 42.56 -11% | 48.1 0% | 51 6% | 14.09 -71% | 44.09 -8% | 47.6 ? -1% |
| 4K Write (MB/s) | 125.8 | 158 26% | 124.7 -1% | 132.2 5% | 132.1 5% | 141.9 13% | 24.25 -81% | 118.5 -6% | 137.9 ? 10% |
| 4K-64 Read (MB/s) | 875 | 1317 51% | 756 -14% | 850 -3% | 660 -25% | 576 -34% | 725 -17% | 867 -1% | 878 ? 0% |
| 4K-64 Write (MB/s) | 785 | 1786 128% | 1300 66% | 2262 188% | 1163 48% | 584 -26% | 169.6 -78% | 838 7% | 782 ? 0% |
| Access Time Read * (ms) | 0.047 | 0.089 | 0.05 | 0.059 | 0.083 | 0.172 | 0.122 | 0.09367 ? | |
| Access Time Write * (ms) | 0.031 | 0.024 23% | 0.03 3% | 0.028 10% | 0.096 -210% | 0.04 -29% | 0.155 -400% | 0.034 -10% | 0.03708 ? -20% |
| Score Read (Points) | 1129 | 1640 45% | 1064 -6% | 1121 -1% | 891 -21% | 785 -30% | 869 -23% | 1105 -2% | 1118 ? -1% |
| Score Write (Points) | 1035 | 2199 112% | 1544 49% | 2529 144% | 1439 39% | 820 -21% | 346 -67% | 1078 4% | 1033 ? 0% |
| Score Total (Points) | 2712 | 4682 73% | 3090 14% | 4185 54% | 2780 3% | 1990 -27% | 1667 -39% | 2721 0% | 2694 ? -1% |
| Copy ISO MB/s (MB/s) | 1600 | 1813 13% | 2546 59% | 2089 31% | 1311 -18% | 1347 ? -16% | |||
| Copy Program MB/s (MB/s) | 517 | 524 1% | 428.6 -17% | 548 6% | 310.3 -40% | 421 ? -19% | |||
| Copy Game MB/s (MB/s) | 1009 | 350.5 -65% | 943 -7% | 1226 22% | 801 -21% | 825 ? -18% | |||
| Moyenne finale (programmes/paramètres) | 48% /
49% | 10% /
9% | 31% /
31% | 9% /
5% | -12% /
-14% | -50% /
-53% | -5% /
-5% | -6% /
-6% |
* ... Moindre est la valeur, meilleures sont les performances
Continuous load read: DiskSpd Read Loop, Queue Depth 8
| 3DMark 11 Performance | 2250 points | |
| 3DMark Ice Storm Standard Score | 72931 points | |
| 3DMark Cloud Gate Standard Score | 10028 points | |
| 3DMark Fire Strike Score | 1230 points | |
Aide | ||
| BioShock Infinite - 1366x768 High Preset | |
| Asus ZenBook 13 UX325JA | |
| Acer TravelMate P6 P614-51T-G2-72ZU | |
| Moyenne Intel UHD Graphics 620 (8.1 - 35.9, n=187) | |
| Bas | Moyen | Élevé | Ultra | |
|---|---|---|---|---|
| Tomb Raider (2013) | 114.4 | 56.5 | 36 | 16.4 |
| BioShock Infinite (2013) | 79.2 | 42.7 | 35.8 | 11.5 |
| Dota 2 Reborn (2015) | 77.8 | 50.3 | 22 | 19.6 |
| X-Plane 11.11 (2018) | 20.3 | 13.4 | 12.8 | |
| Total War: Three Kingdoms (2019) | 29.5 | 7.9 | 4.6 | 3.2 |
| F1 2020 (2020) | 28 | 13 | 10 |
Degré de la nuisance sonore
| Au repos |
| 27 / 27 / 27 dB(A) |
| Fortement sollicité |
| 35 / 32.8 dB(A) |
 | ||
30 dB silencieux 40 dB(A) audible 50 dB(A) bruyant |
||
min: | ||
| Acer TravelMate P6 P614-51T-G2-72ZU i7-10510U, UHD Graphics 620 | Lenovo ThinkPad X1 Carbon 2020-20UAS04T00 i7-10510U, UHD Graphics 620 | Lenovo ThinkPad T14s-20T00044GE i5-10210U, UHD Graphics 620 | Lenovo ThinkPad T14s-20UJS00K00 R7 PRO 4750U, Vega 7 | Dell Latitude 7410 i7-10610U, UHD Graphics 620 | Asus ZenBook 13 UX325JA i7-1065G7, Iris Plus Graphics G7 (Ice Lake 64 EU) | Apple MacBook Pro 13 2020 2GHz i5 10th-Gen i5-1038NG7, Iris Plus Graphics G7 (Ice Lake 64 EU) | Moyenne Intel UHD Graphics 620 | Moyenne de la classe Office | |
|---|---|---|---|---|---|---|---|---|---|
| Noise | -5% | -2% | -3% | -4% | -9% | -11% | -7% | 2% | |
| arrêt / environnement * (dB) | 27 | 29.5 -9% | 29.3 -9% | 29.2 -8% | 28.1 -4% | 30.1 -11% | 29.6 -10% | 29 ? -7% | 24.2 ? 10% |
| Idle Minimum * (dB) | 27 | 29.5 -9% | 29.3 -9% | 29.2 -8% | 28.1 -4% | 30.1 -11% | 29.6 -10% | 29.1 ? -8% | 24.4 ? 10% |
| Idle Average * (dB) | 27 | 29.5 -9% | 29.3 -9% | 29.2 -8% | 28.1 -4% | 30.1 -11% | 29.6 -10% | 29.1 ? -8% | 24.6 ? 9% |
| Idle Maximum * (dB) | 27 | 29.5 -9% | 29.3 -9% | 29.6 -10% | 28.1 -4% | 30.1 -11% | 29.6 -10% | 29.7 ? -10% | 25.4 ? 6% |
| Load Average * (dB) | 35 | 31.6 10% | 30 14% | 30.2 14% | 30 14% | 32.7 7% | 34.4 2% | 33.5 ? 4% | 33.9 ? 3% |
| Load Maximum * (dB) | 32.8 | 33.9 -3% | 30 9% | 32.3 2% | 39.3 -20% | 38.5 -17% | 42.1 -28% | 36.1 ? -10% | 41.1 ? -25% |
| Witcher 3 ultra * (dB) | 32.3 | 38.6 | 36.1 |
* ... Moindre est la valeur, meilleures sont les performances
(±) La température maximale du côté supérieur est de 40.4 °C / 105 F, par rapport à la moyenne de 34.3 °C / 94 F, allant de 21.2 à 62.5 °C pour la classe Office.
(±) Le fond chauffe jusqu'à un maximum de 40 °C / 104 F, contre une moyenne de 36.8 °C / 98 F
(+) En utilisation inactive, la température moyenne du côté supérieur est de 27.6 °C / 82 F, par rapport à la moyenne du dispositif de 29.5 °C / 85 F.
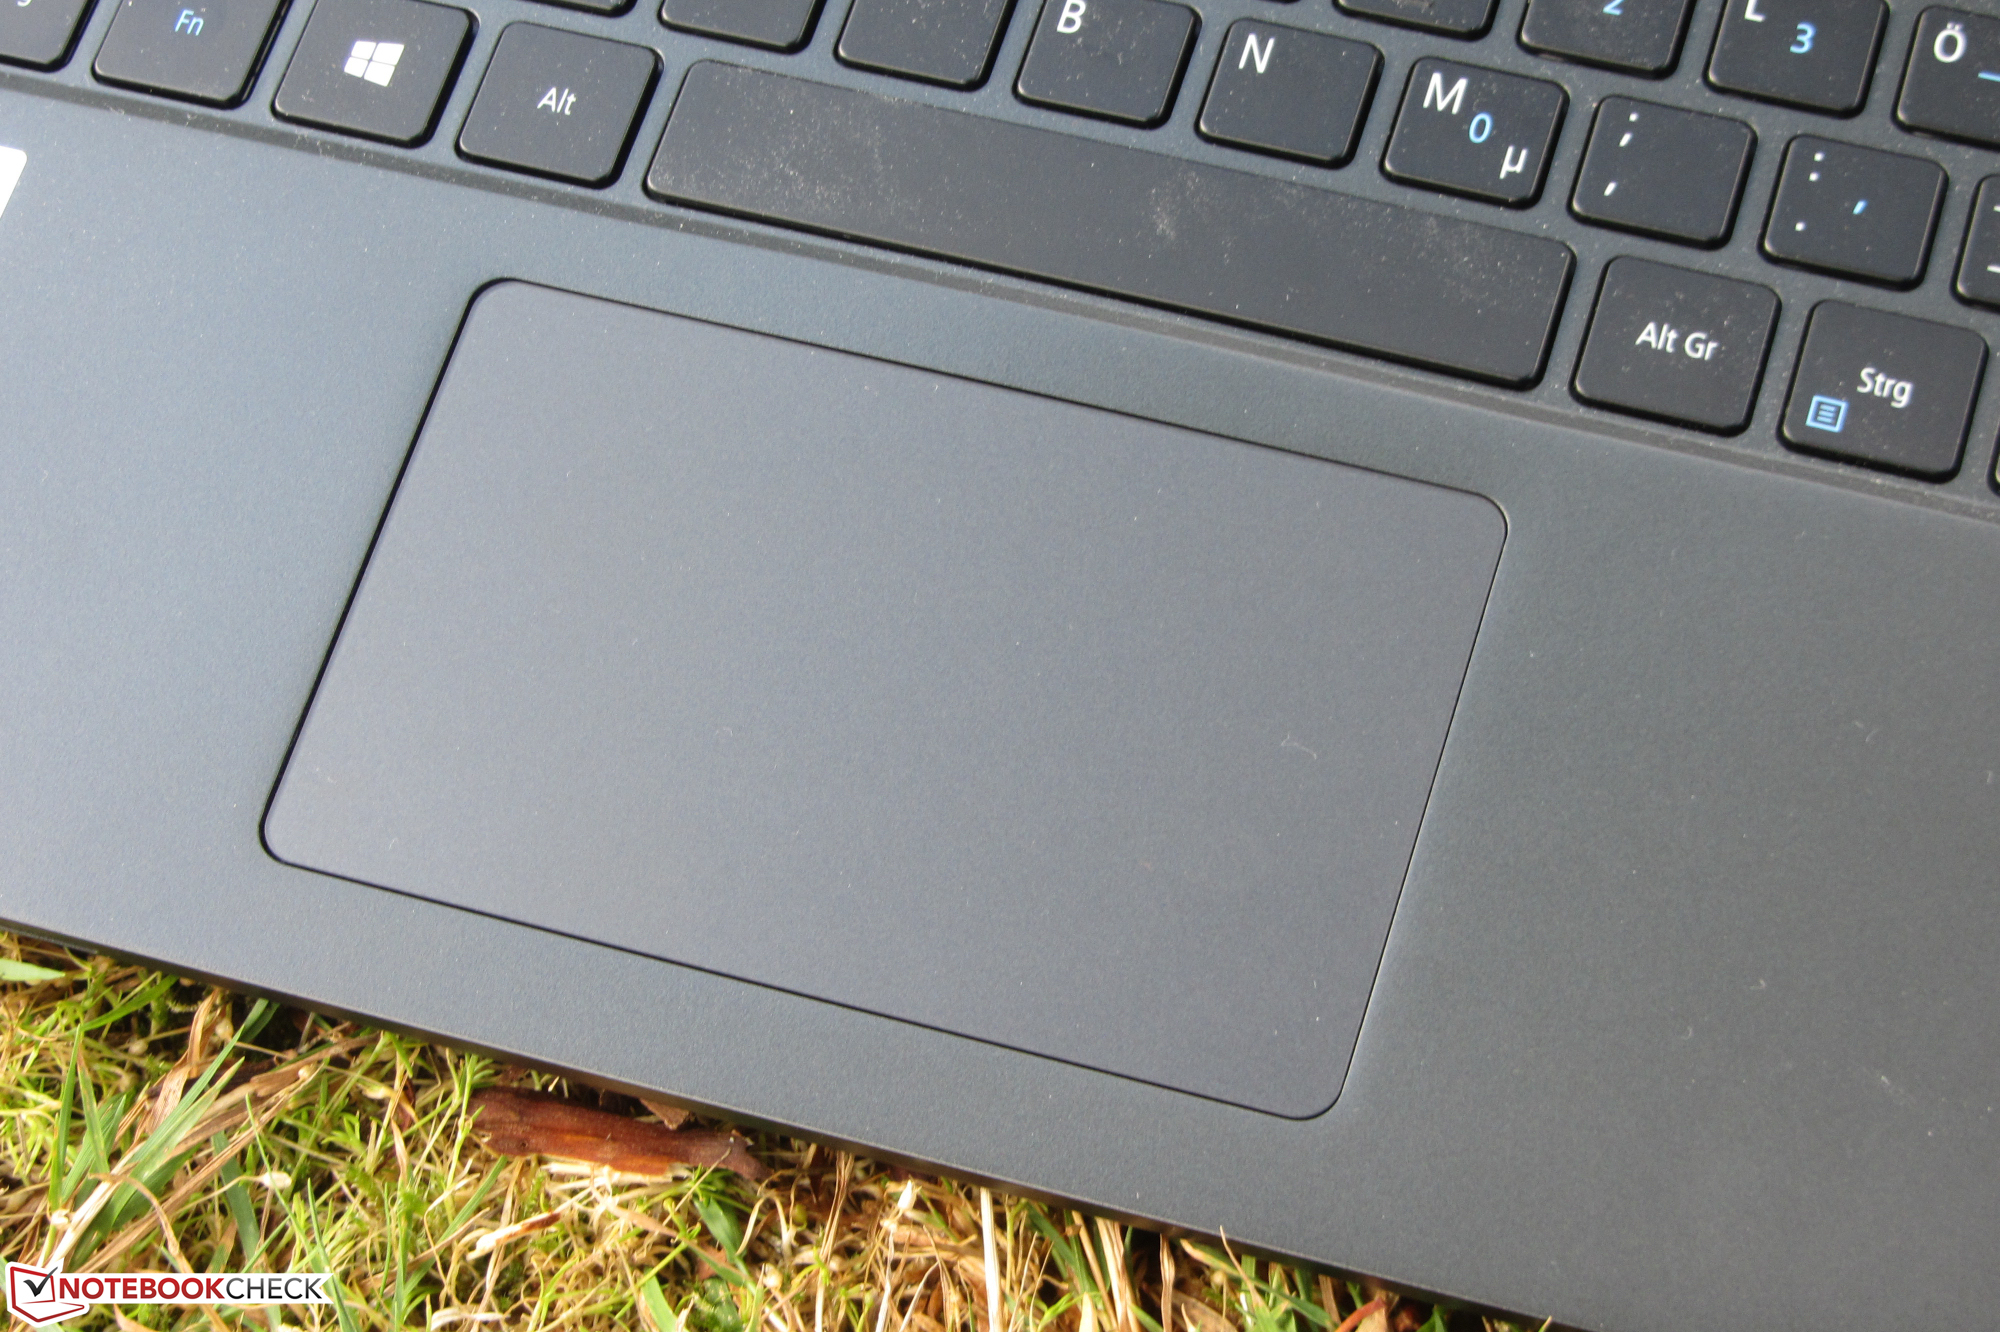
(+) Les repose-poignets et le pavé tactile sont plus froids que la température de la peau avec un maximum de 29.7 °C / 85.5 F et sont donc froids au toucher.
(-) La température moyenne de la zone de l'appui-paume de dispositifs similaires était de 27.5 °C / 81.5 F (-2.2 °C / #-4 F).
| Acer TravelMate P6 P614-51T-G2-72ZU i7-10510U, UHD Graphics 620 | Lenovo ThinkPad X1 Carbon 2020-20UAS04T00 i7-10510U, UHD Graphics 620 | Lenovo ThinkPad T14s-20T00044GE i5-10210U, UHD Graphics 620 | Lenovo ThinkPad T14s-20UJS00K00 R7 PRO 4750U, Vega 7 | Dell Latitude 7410 i7-10610U, UHD Graphics 620 | Asus ZenBook 13 UX325JA i7-1065G7, Iris Plus Graphics G7 (Ice Lake 64 EU) | Apple MacBook Pro 13 2020 2GHz i5 10th-Gen i5-1038NG7, Iris Plus Graphics G7 (Ice Lake 64 EU) | Moyenne Intel UHD Graphics 620 | Moyenne de la classe Office | |
|---|---|---|---|---|---|---|---|---|---|
| Heat | 0% | -1% | -1% | -9% | 1% | 6% | -1% | -1% | |
| Maximum Upper Side * (°C) | 40.4 | 45.2 -12% | 47.1 -17% | 44.7 -11% | 44.6 -10% | 39.7 2% | 40.7 -1% | 41.1 ? -2% | 40.6 ? -0% |
| Maximum Bottom * (°C) | 40 | 45.7 -14% | 45.7 -14% | 44.6 -12% | 48.4 -21% | 39.9 -0% | 39.4 1% | 44.3 ? -11% | 42.8 ? -7% |
| Idle Upper Side * (°C) | 28.8 | 24.7 14% | 24.9 14% | 25.6 11% | 28.8 -0% | 28.7 -0% | 25.4 12% | 26.8 ? 7% | 27.3 ? 5% |
| Idle Bottom * (°C) | 28.6 | 25 13% | 24.8 13% | 25.6 10% | 29.8 -4% | 28.5 -0% | 25.1 12% | 27.7 ? 3% | 28.5 ? -0% |
* ... Moindre est la valeur, meilleures sont les performances
Acer TravelMate P6 P614-51T-G2-72ZU analyse audio
(-) | haut-parleurs pas très forts (68.3 dB)
Basses 100 - 315 Hz
(-) | presque aucune basse - en moyenne 20.1% plus bas que la médiane
(±) | la linéarité des basses est moyenne (12.7% delta à la fréquence précédente)
Médiums 400 - 2000 Hz
(+) | médiane équilibrée - seulement 2.6% de la médiane
(±) | la linéarité des médiums est moyenne (7.3% delta à la fréquence précédente)
Aiguës 2 - 16 kHz
(±) | sommets plus élevés - en moyenne 5.4% plus élevés que la médiane
(+) | les aigus sont linéaires (2.7% delta à la fréquence précédente)
Globalement 100 - 16 000 Hz
(±) | la linéarité du son global est moyenne (19.3% de différence avec la médiane)
Par rapport à la même classe
» 38% de tous les appareils testés de cette catégorie étaient meilleurs, 7% similaires, 54% pires
» Le meilleur avait un delta de 7%, la moyenne était de 21%, le pire était de 53%.
Par rapport à tous les appareils testés
» 47% de tous les appareils testés étaient meilleurs, 8% similaires, 46% pires
» Le meilleur avait un delta de 4%, la moyenne était de 24%, le pire était de 134%.
| Éteint/en veille | |
| Au repos | |
| Fortement sollicité |
|
Légende:
min: | |
| Acer TravelMate P6 P614-51T-G2-72ZU i7-10510U, UHD Graphics 620 | Lenovo ThinkPad X1 Carbon 2020-20UAS04T00 i7-10510U, UHD Graphics 620 | Lenovo ThinkPad T14s-20T00044GE i5-10210U, UHD Graphics 620 | Lenovo ThinkPad T14s-20UJS00K00 R7 PRO 4750U, Vega 7 | Dell Latitude 7410 i7-10610U, UHD Graphics 620 | Asus ZenBook 13 UX325JA i7-1065G7, Iris Plus Graphics G7 (Ice Lake 64 EU) | Apple MacBook Pro 13 2020 2GHz i5 10th-Gen i5-1038NG7, Iris Plus Graphics G7 (Ice Lake 64 EU) | Moyenne Intel UHD Graphics 620 | Moyenne de la classe Office | |
|---|---|---|---|---|---|---|---|---|---|
| Power Consumption | -18% | -1% | -30% | -22% | 11% | -39% | -11% | -30% | |
| Idle Minimum * (Watt) | 3.6 | 2.96 18% | 2.6 28% | 5.7 -58% | 3.7 -3% | 2.4 33% | 3.8 -6% | 3.81 ? -6% | 4.41 ? -23% |
| Idle Average * (Watt) | 5.8 | 5.9 -2% | 5.5 5% | 8.9 -53% | 6.2 -7% | 4.6 21% | 8.6 -48% | 6.94 ? -20% | 7.37 ? -27% |
| Idle Maximum * (Watt) | 9.5 | 9.1 4% | 7.5 21% | 11 -16% | 7 26% | 9 5% | 10.3 -8% | 8.75 ? 8% | 8.58 ? 10% |
| Load Average * (Watt) | 42 | 42.1 -0% | 28.2 33% | 38.2 9% | 43.2 -3% | 36 14% | 52.1 -24% | 35 ? 17% | 43 ? -2% |
| Load Maximum * (Watt) | 31 | 65.1 -110% | 59.6 -92% | 40.2 -30% | 68.6 -121% | 36 -16% | 65.2 -110% | 47.5 ? -53% | 64.6 ? -108% |
| Witcher 3 ultra * (Watt) | 27 | 48.2 |
* ... Moindre est la valeur, meilleures sont les performances
| Acer TravelMate P6 P614-51T-G2-72ZU i7-10510U, UHD Graphics 620, 60 Wh | Lenovo ThinkPad X1 Carbon 2020-20UAS04T00 i7-10510U, UHD Graphics 620, 51 Wh | Lenovo ThinkPad T14s-20T00044GE i5-10210U, UHD Graphics 620, 57 Wh | Lenovo ThinkPad T14s-20UJS00K00 R7 PRO 4750U, Vega 7, 57 Wh | Dell Latitude 7410 i7-10610U, UHD Graphics 620, 68 Wh | Asus ZenBook 13 UX325JA i7-1065G7, Iris Plus Graphics G7 (Ice Lake 64 EU), 67 Wh | Apple MacBook Pro 13 2020 2GHz i5 10th-Gen i5-1038NG7, Iris Plus Graphics G7 (Ice Lake 64 EU), 58 Wh | Moyenne de la classe Office | |
|---|---|---|---|---|---|---|---|---|
| Autonomie de la batterie | -13% | 3% | -4% | 17% | 24% | -2% | 1% | |
| Reader / Idle (h) | 25.8 | 31.3 21% | 26.6 3% | 23.7 ? -8% | ||||
| H.264 (h) | 12.9 | 12.8 -1% | 14.7 14% | 13.2 2% | 16.5 28% | 11.5 -11% | 15 ? 16% | |
| WiFi v1.3 (h) | 11.3 | 10.1 -11% | 13.2 17% | 10.2 -10% | 11 -3% | 13.8 22% | 12.1 7% | 12.9 ? 14% |
| Load (h) | 2.2 | 1.6 -27% | 1.7 -23% | 2.1 -5% | 2.9 32% | 3.1 41% | 1.794 ? -18% |
Points positifs
Points négatifs
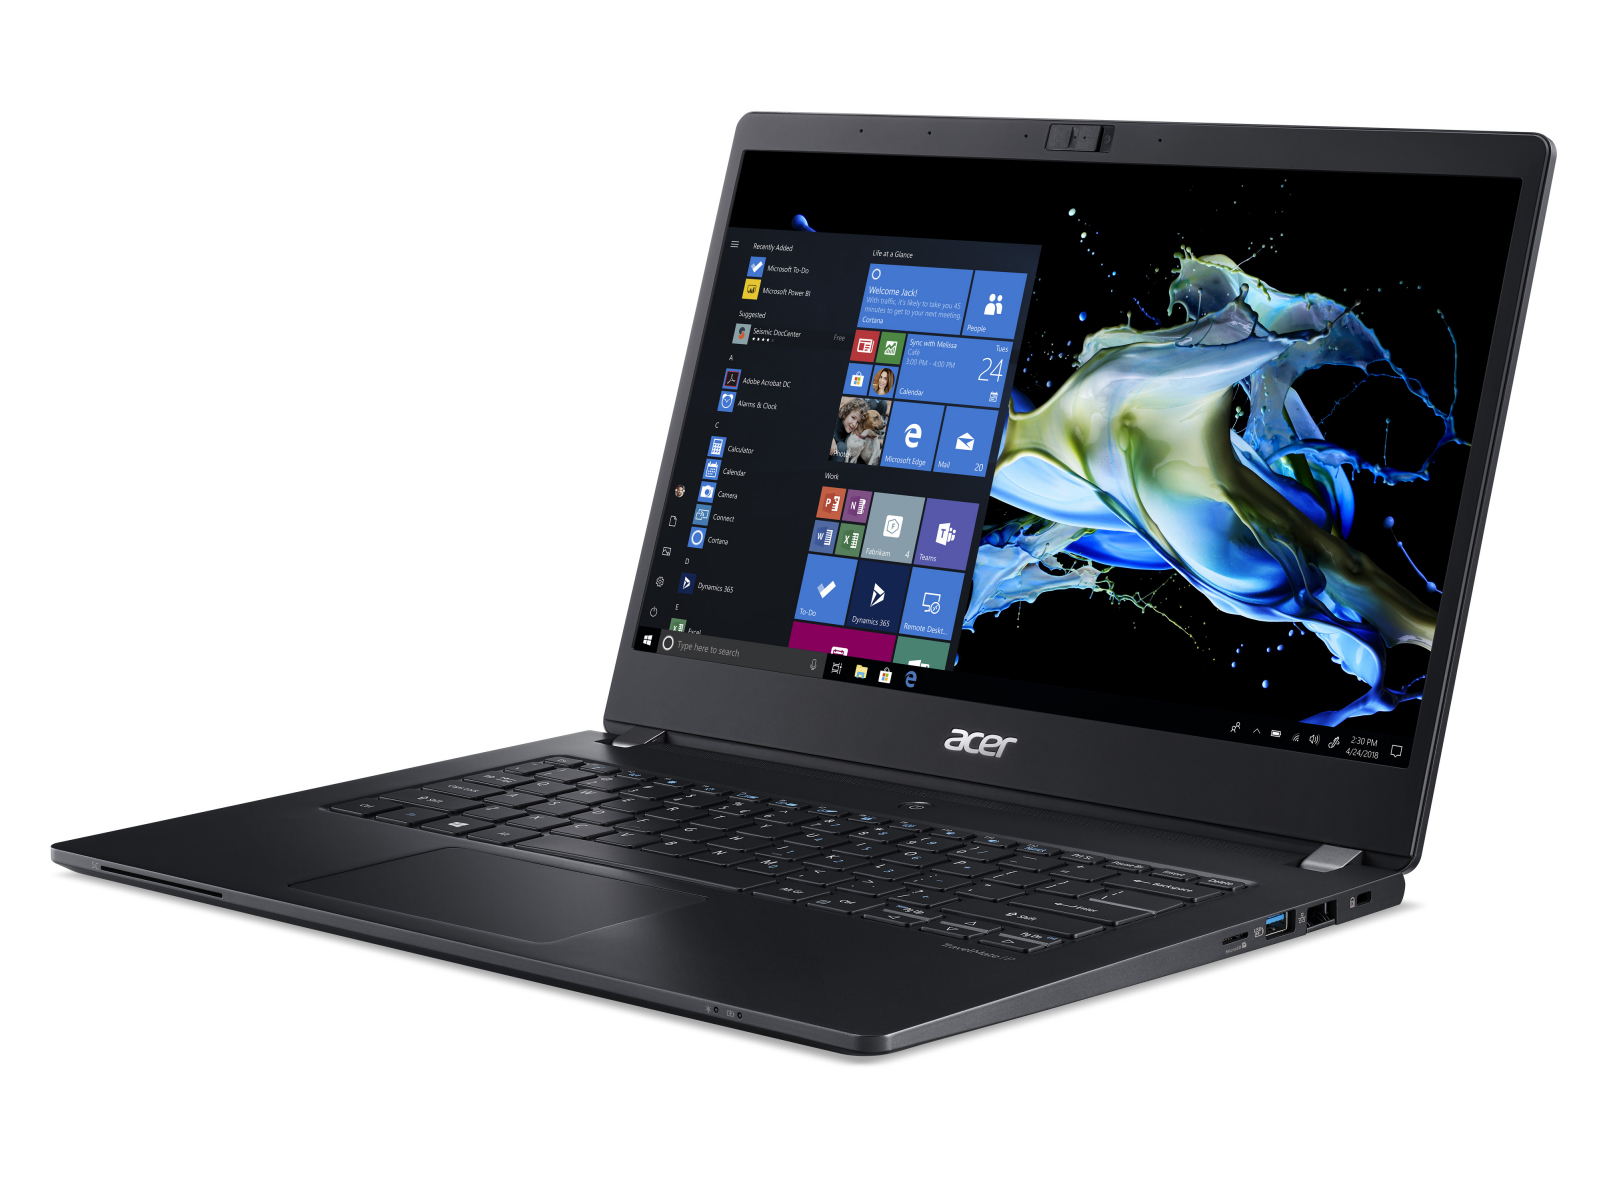
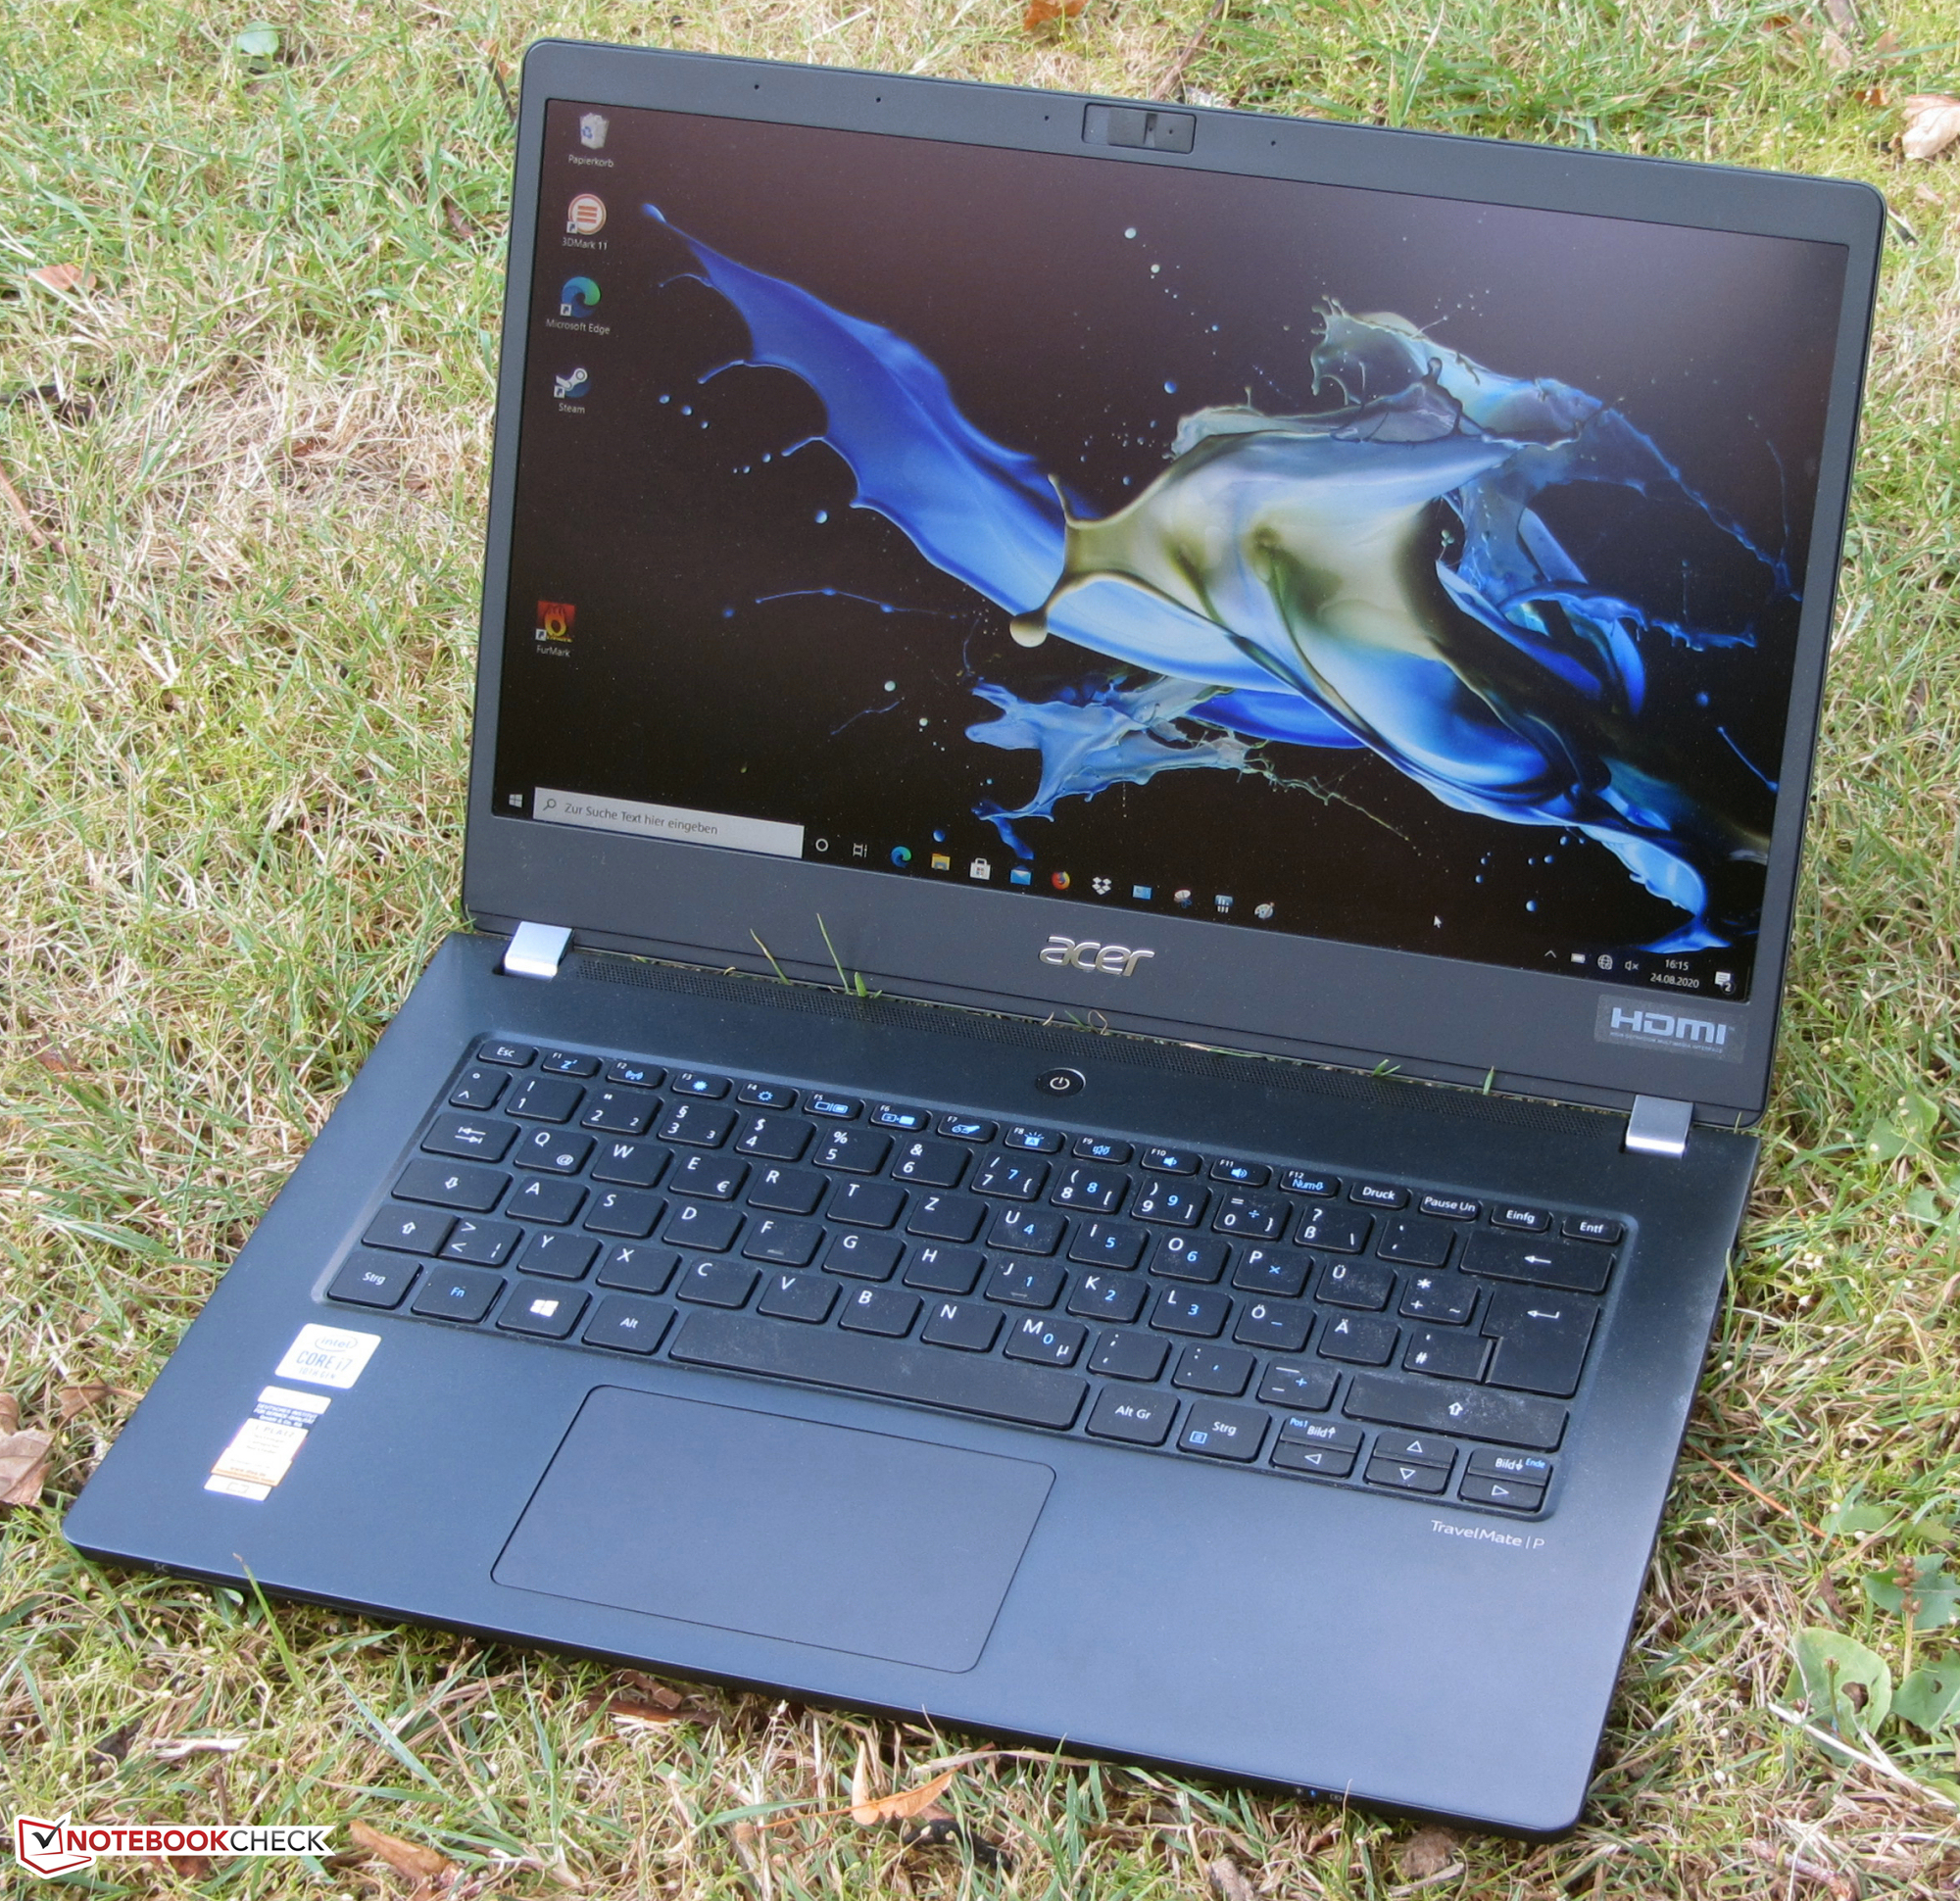
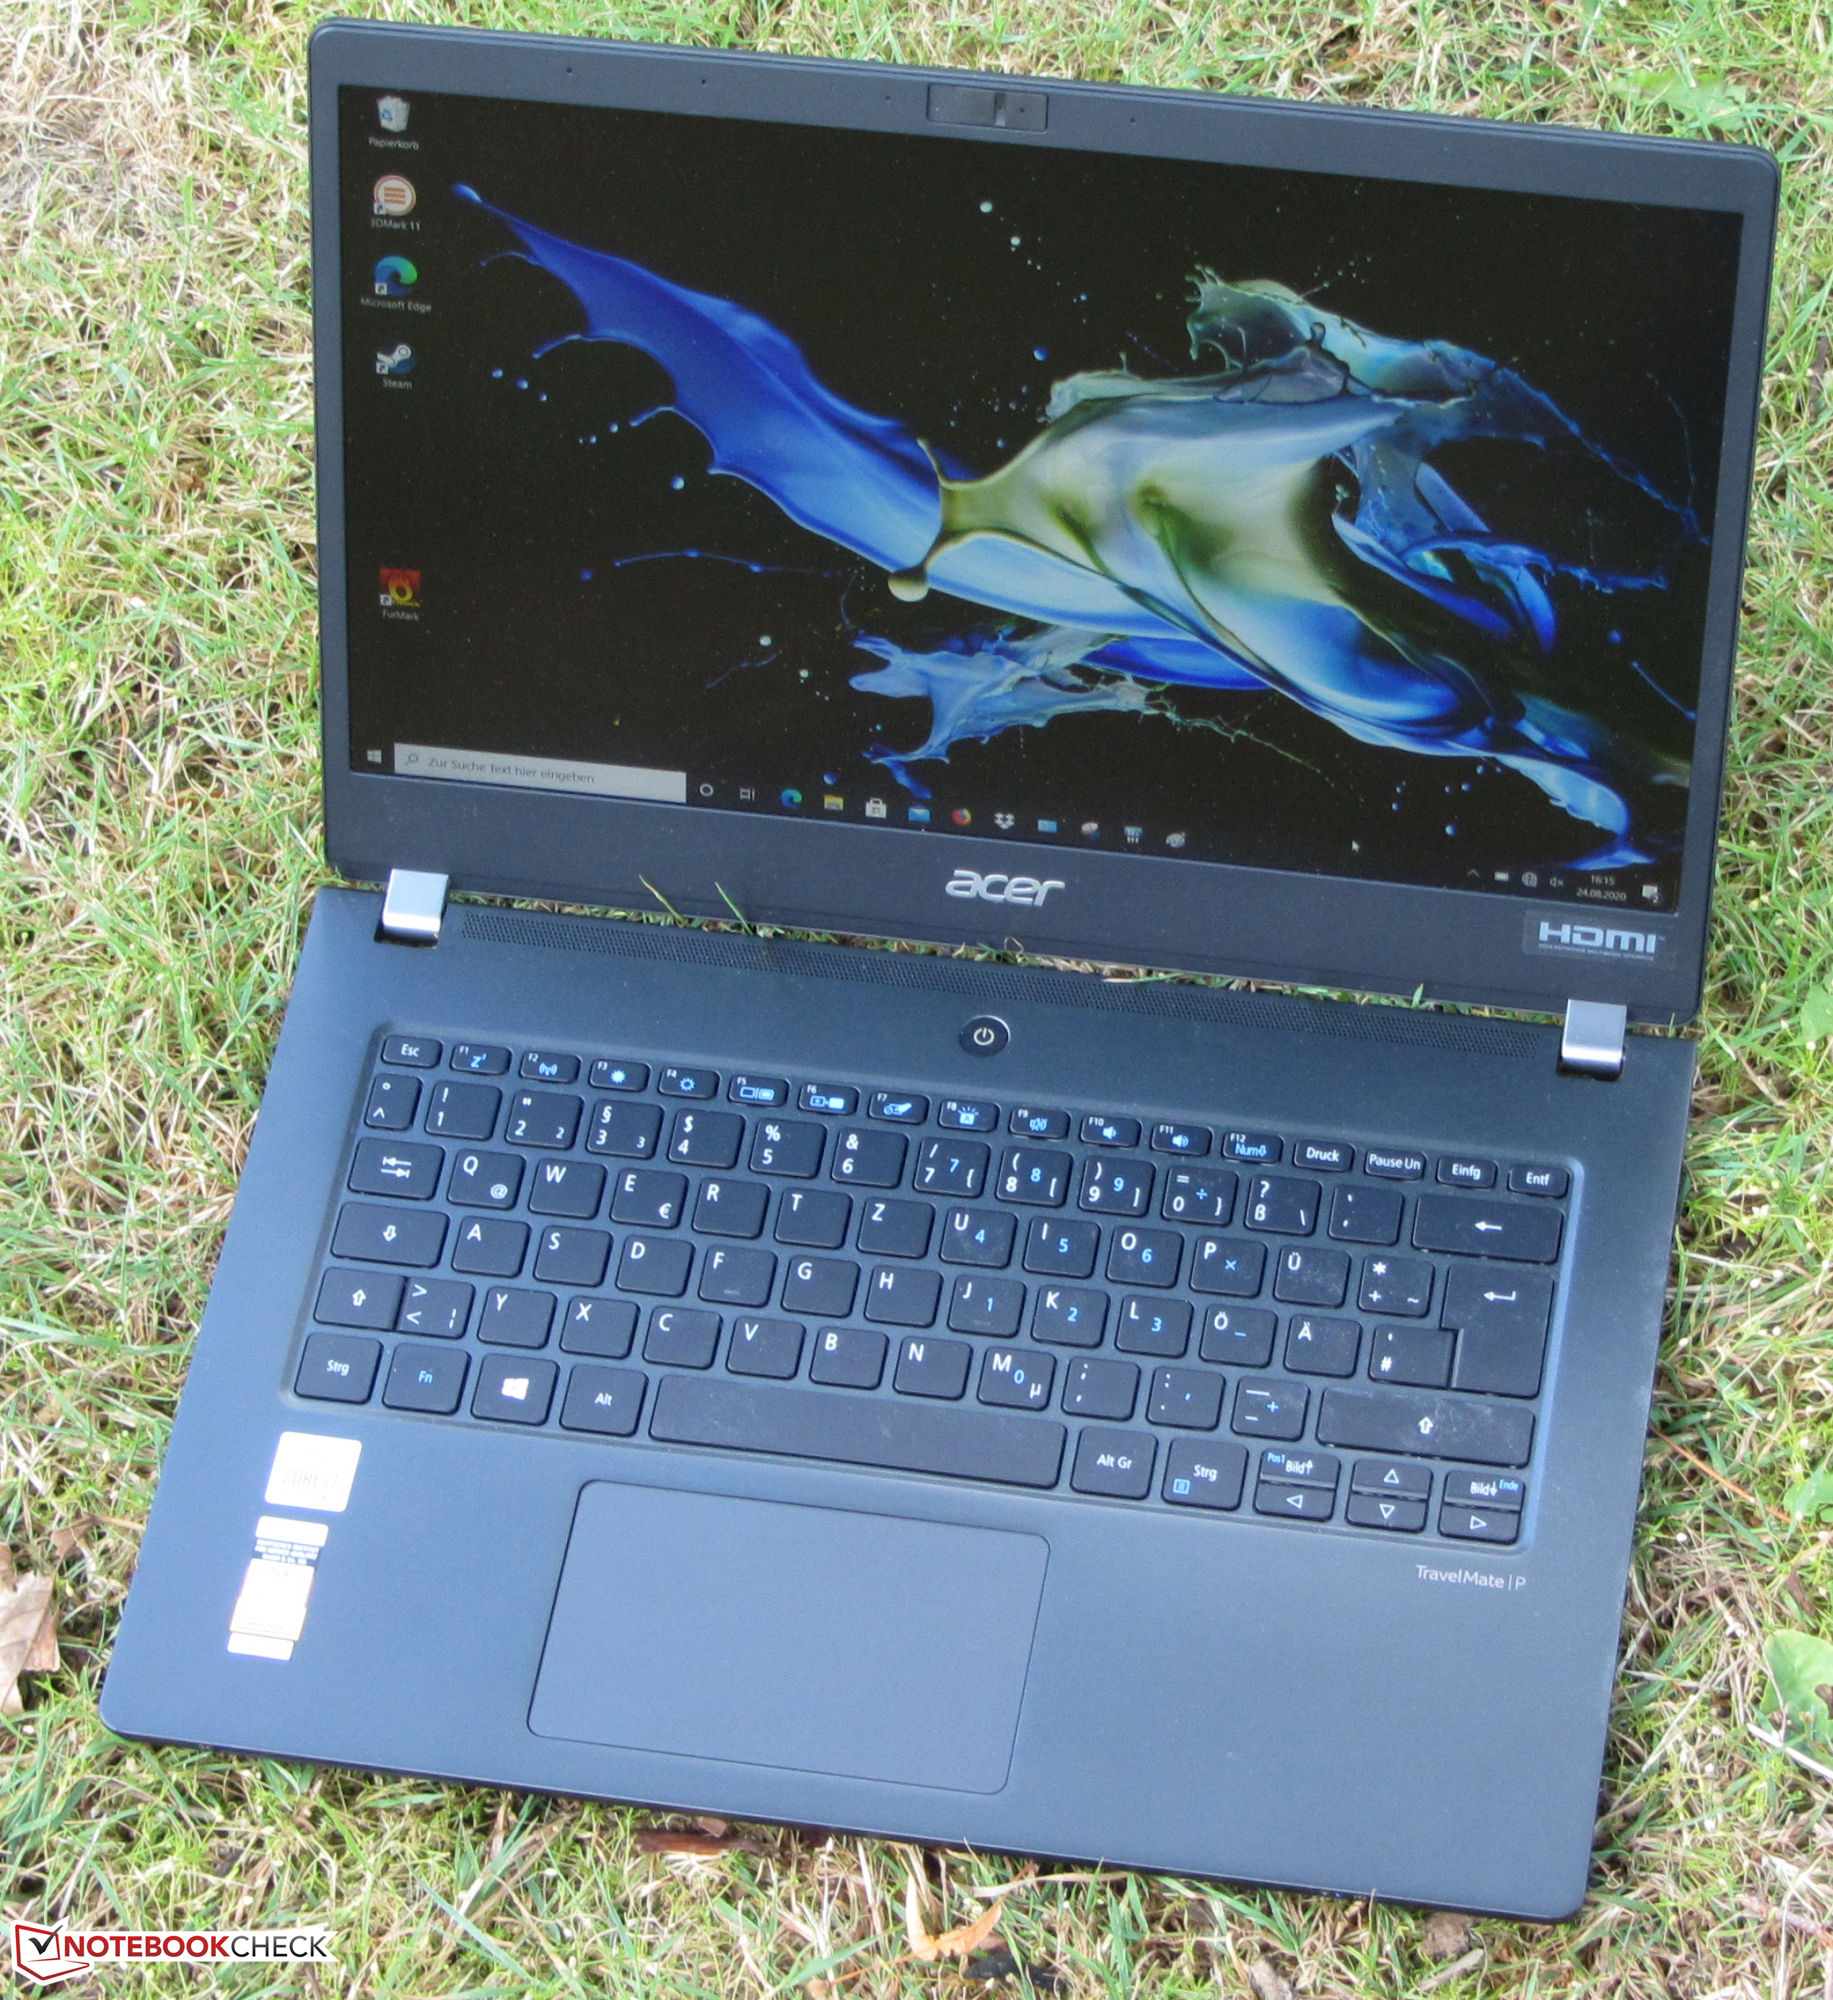
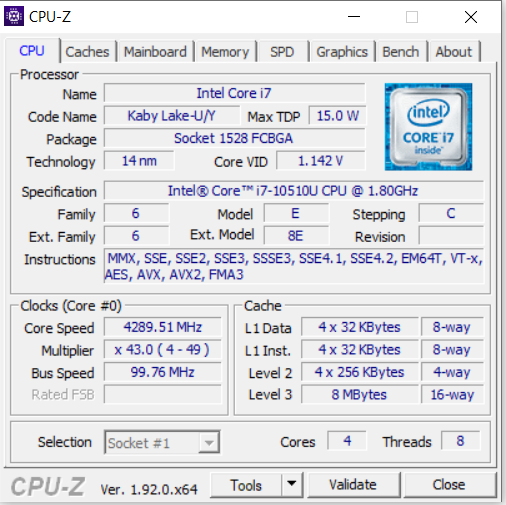
Avec le TravelMate P6, Acer propose un PC portable pro de 14 pouces léger et compact, équipé d'un processeur Core i7 de génération Comet Lake. Celui-ci est suffisamment puissant pour la bureautique et Internet. Le PC portable tourne de façon silencieuse et au maximum chauffe modérément.
Avec l'Acer TravelMate P6 614-51T-G2, vous aurez un outil de travail léger, silencieux et autonome.
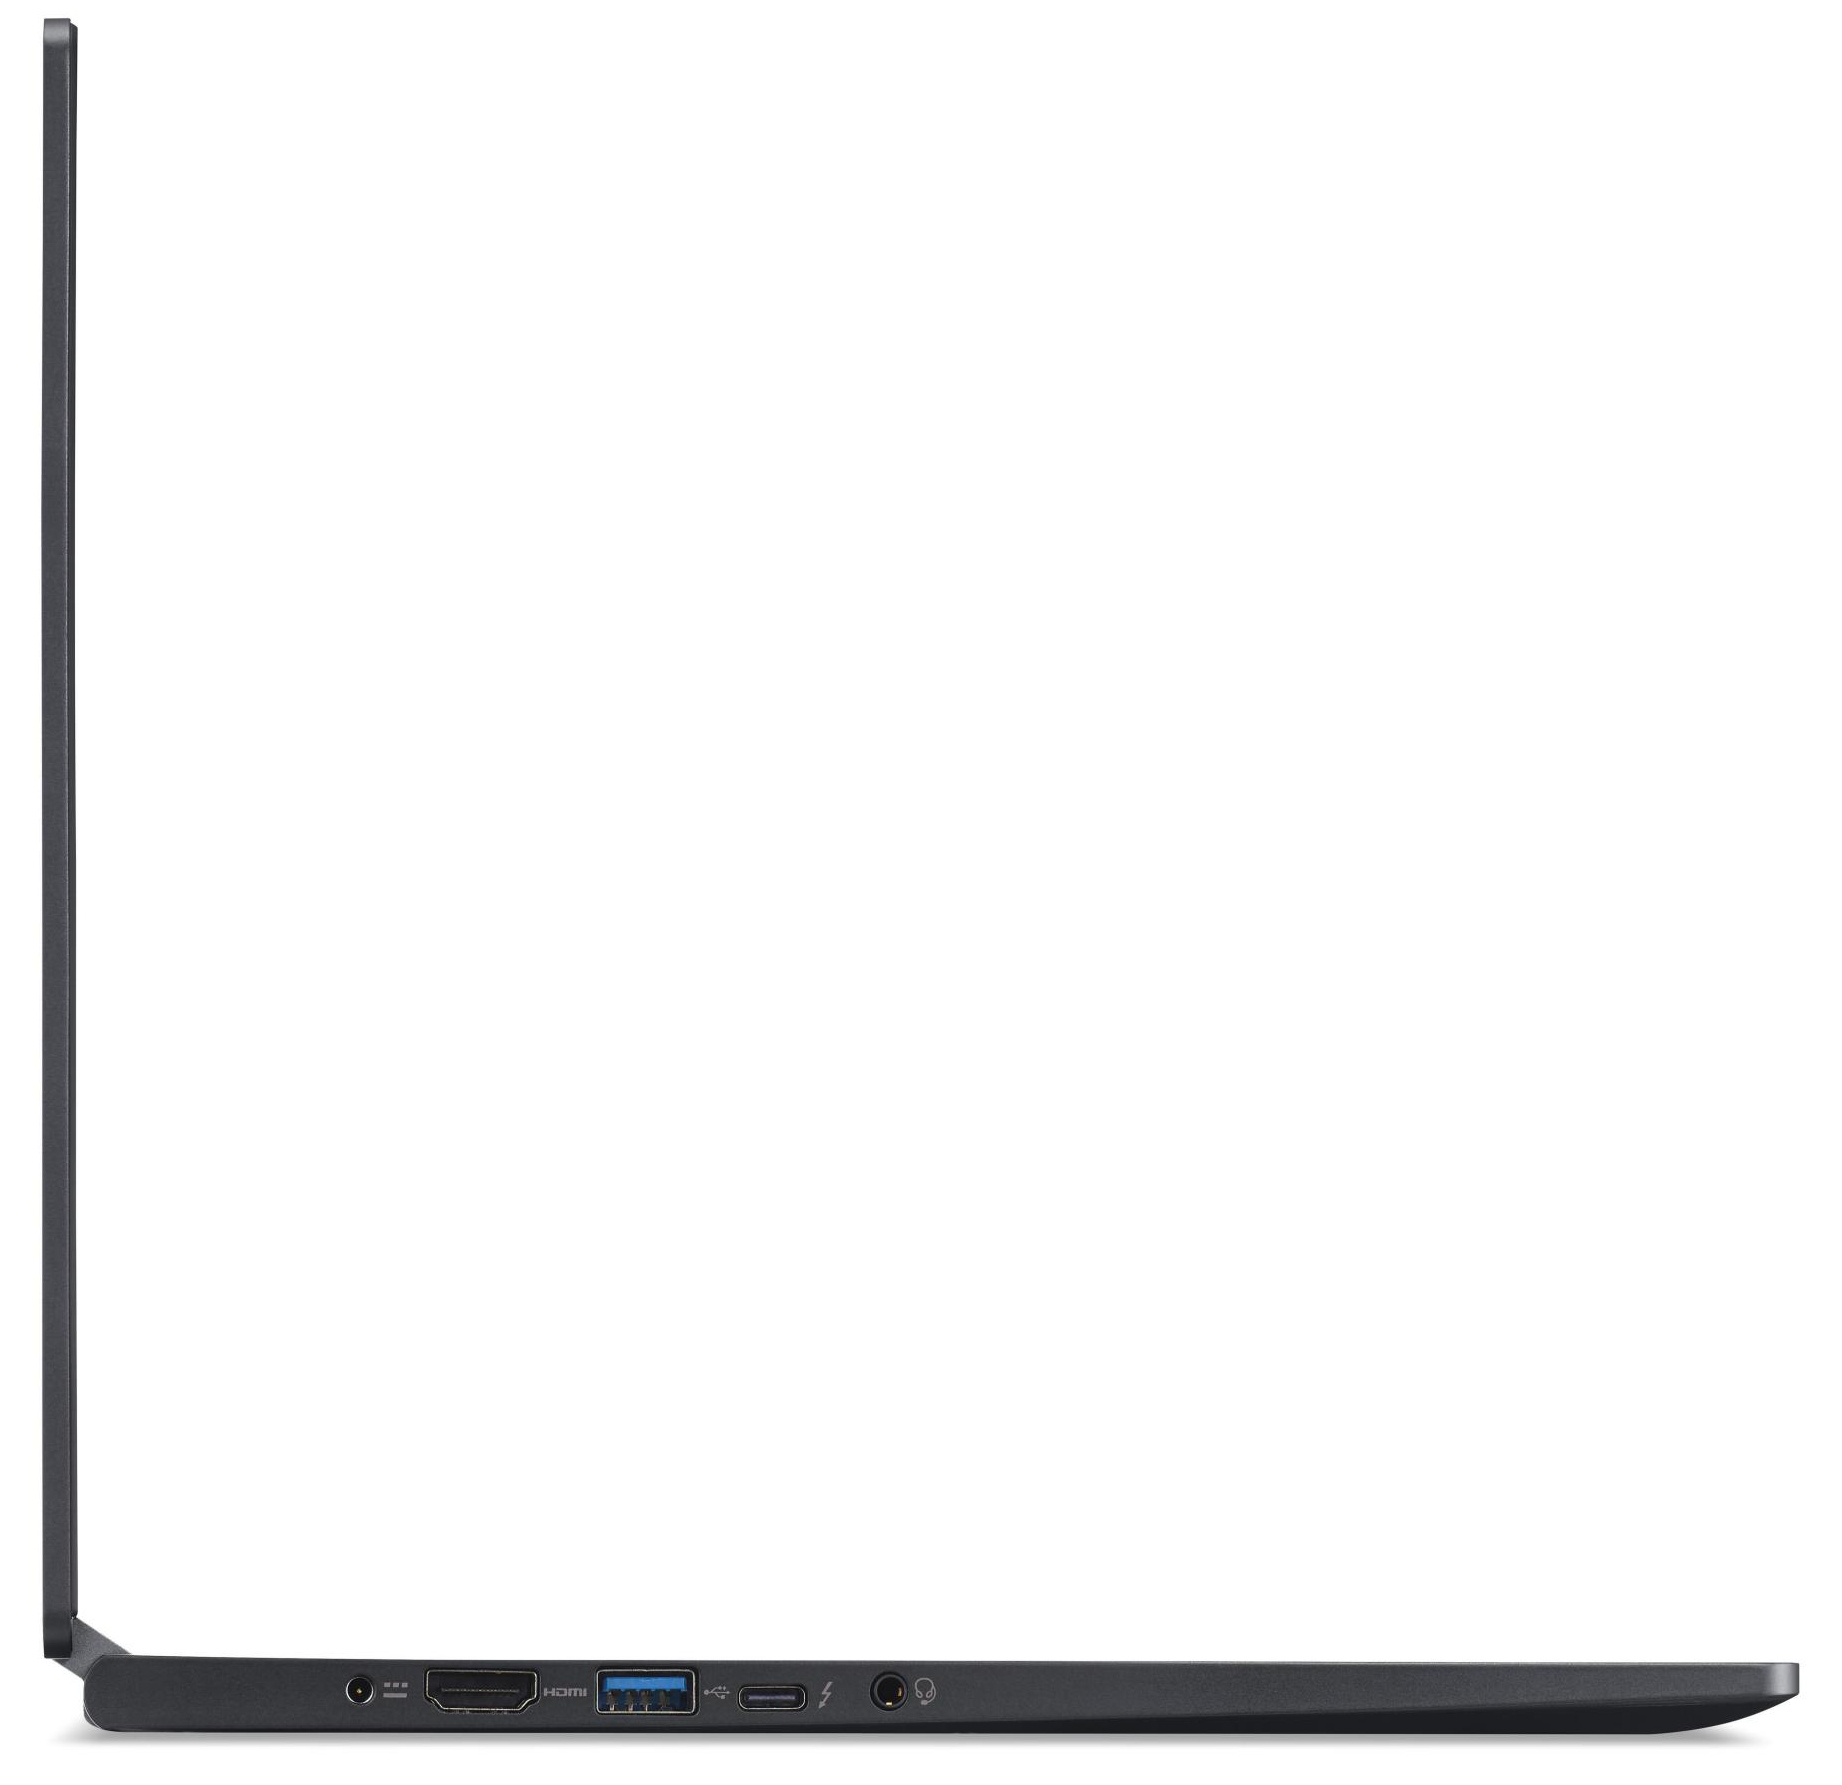
L'autonomie est excellente. Avec une seule charge, l'appareil atteint une autonomie pratique comprise entre 11 et 13h. La plupart des gens pourront tenir la journée sans avoir à brancher la machine. De plus, le PC portable peut être chargé via le port propriétaire, ou via un adaptateur USB universel (grâce au port Thunderbolt 3).
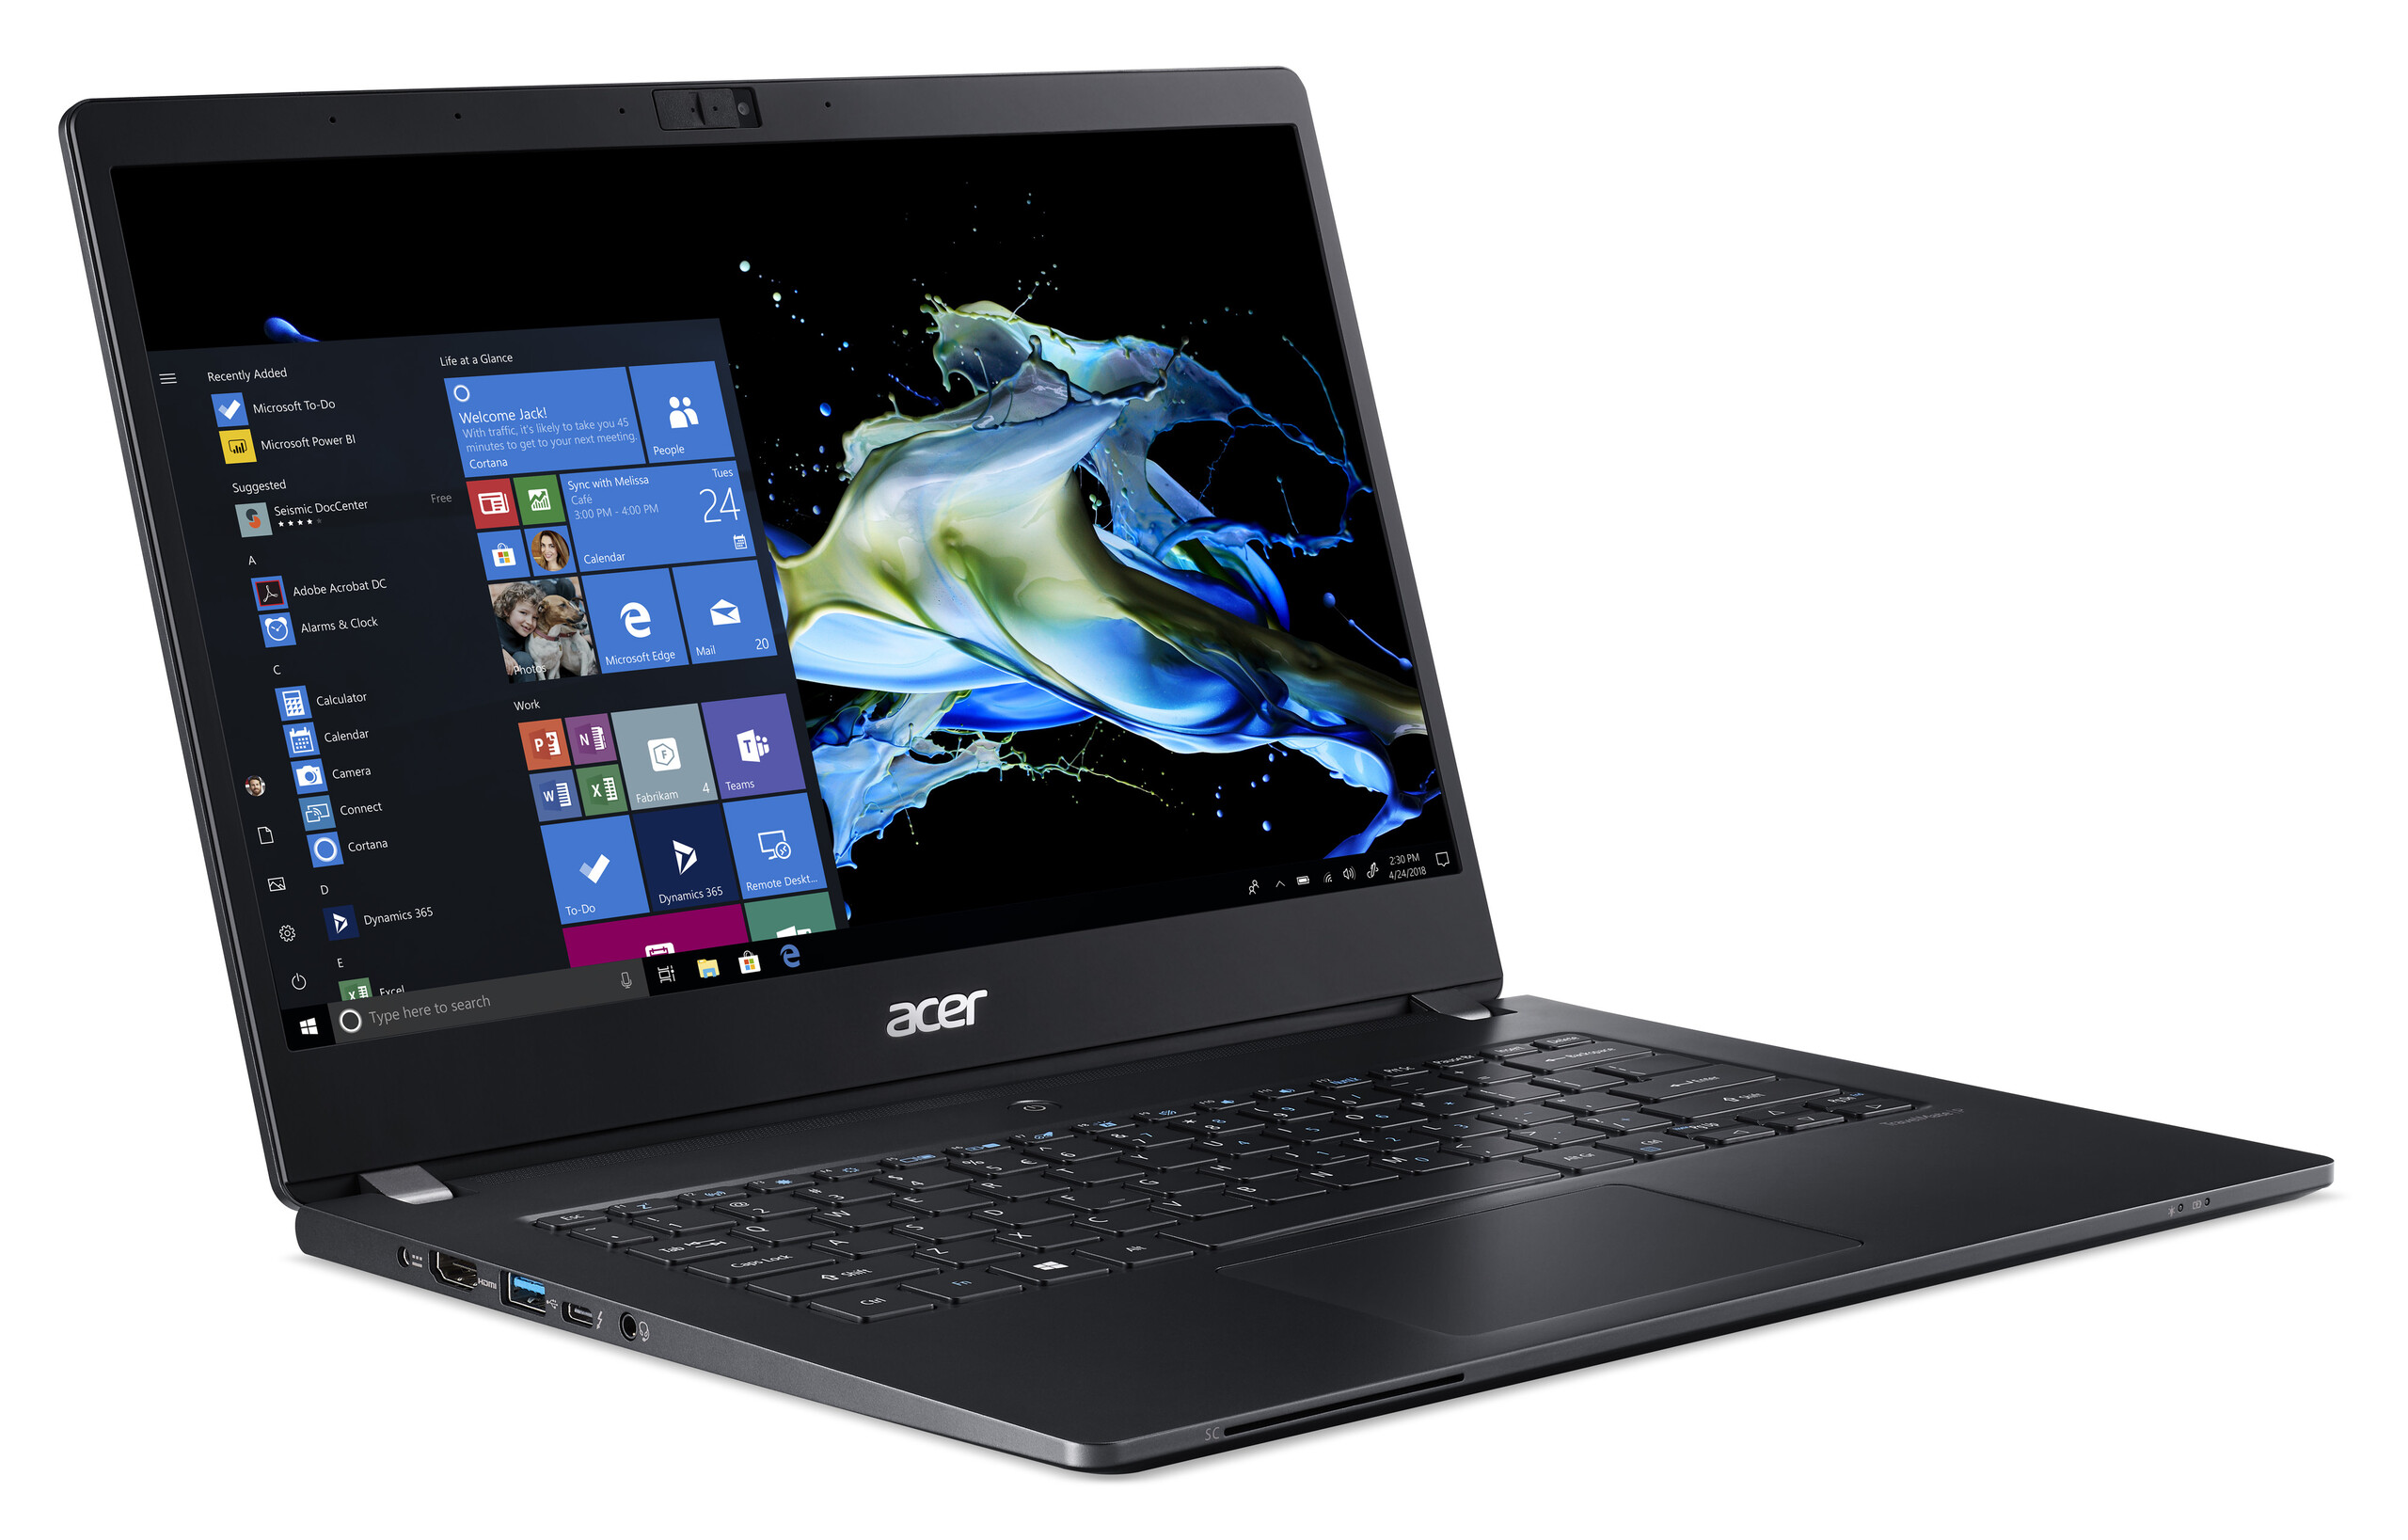
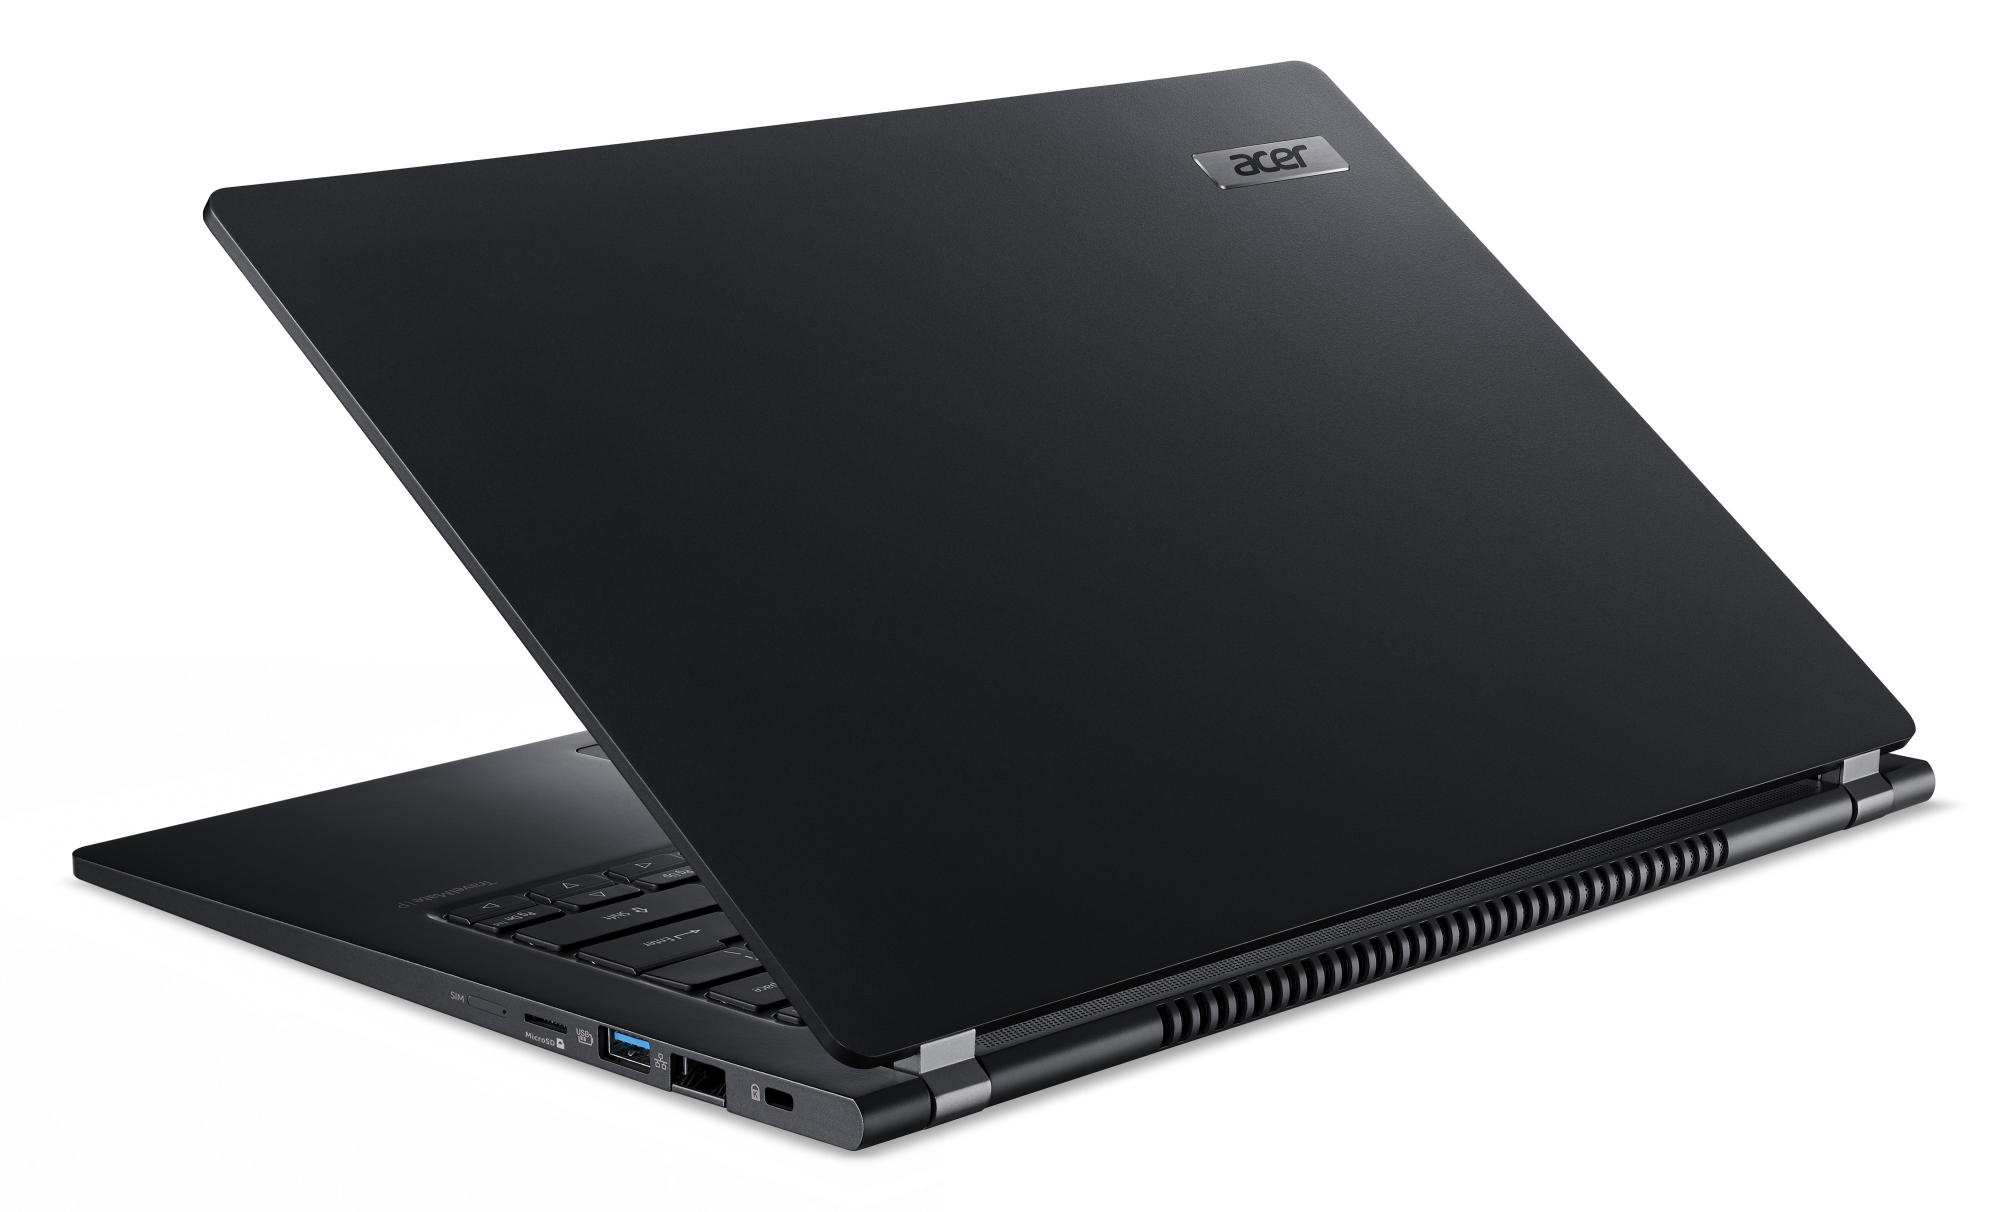
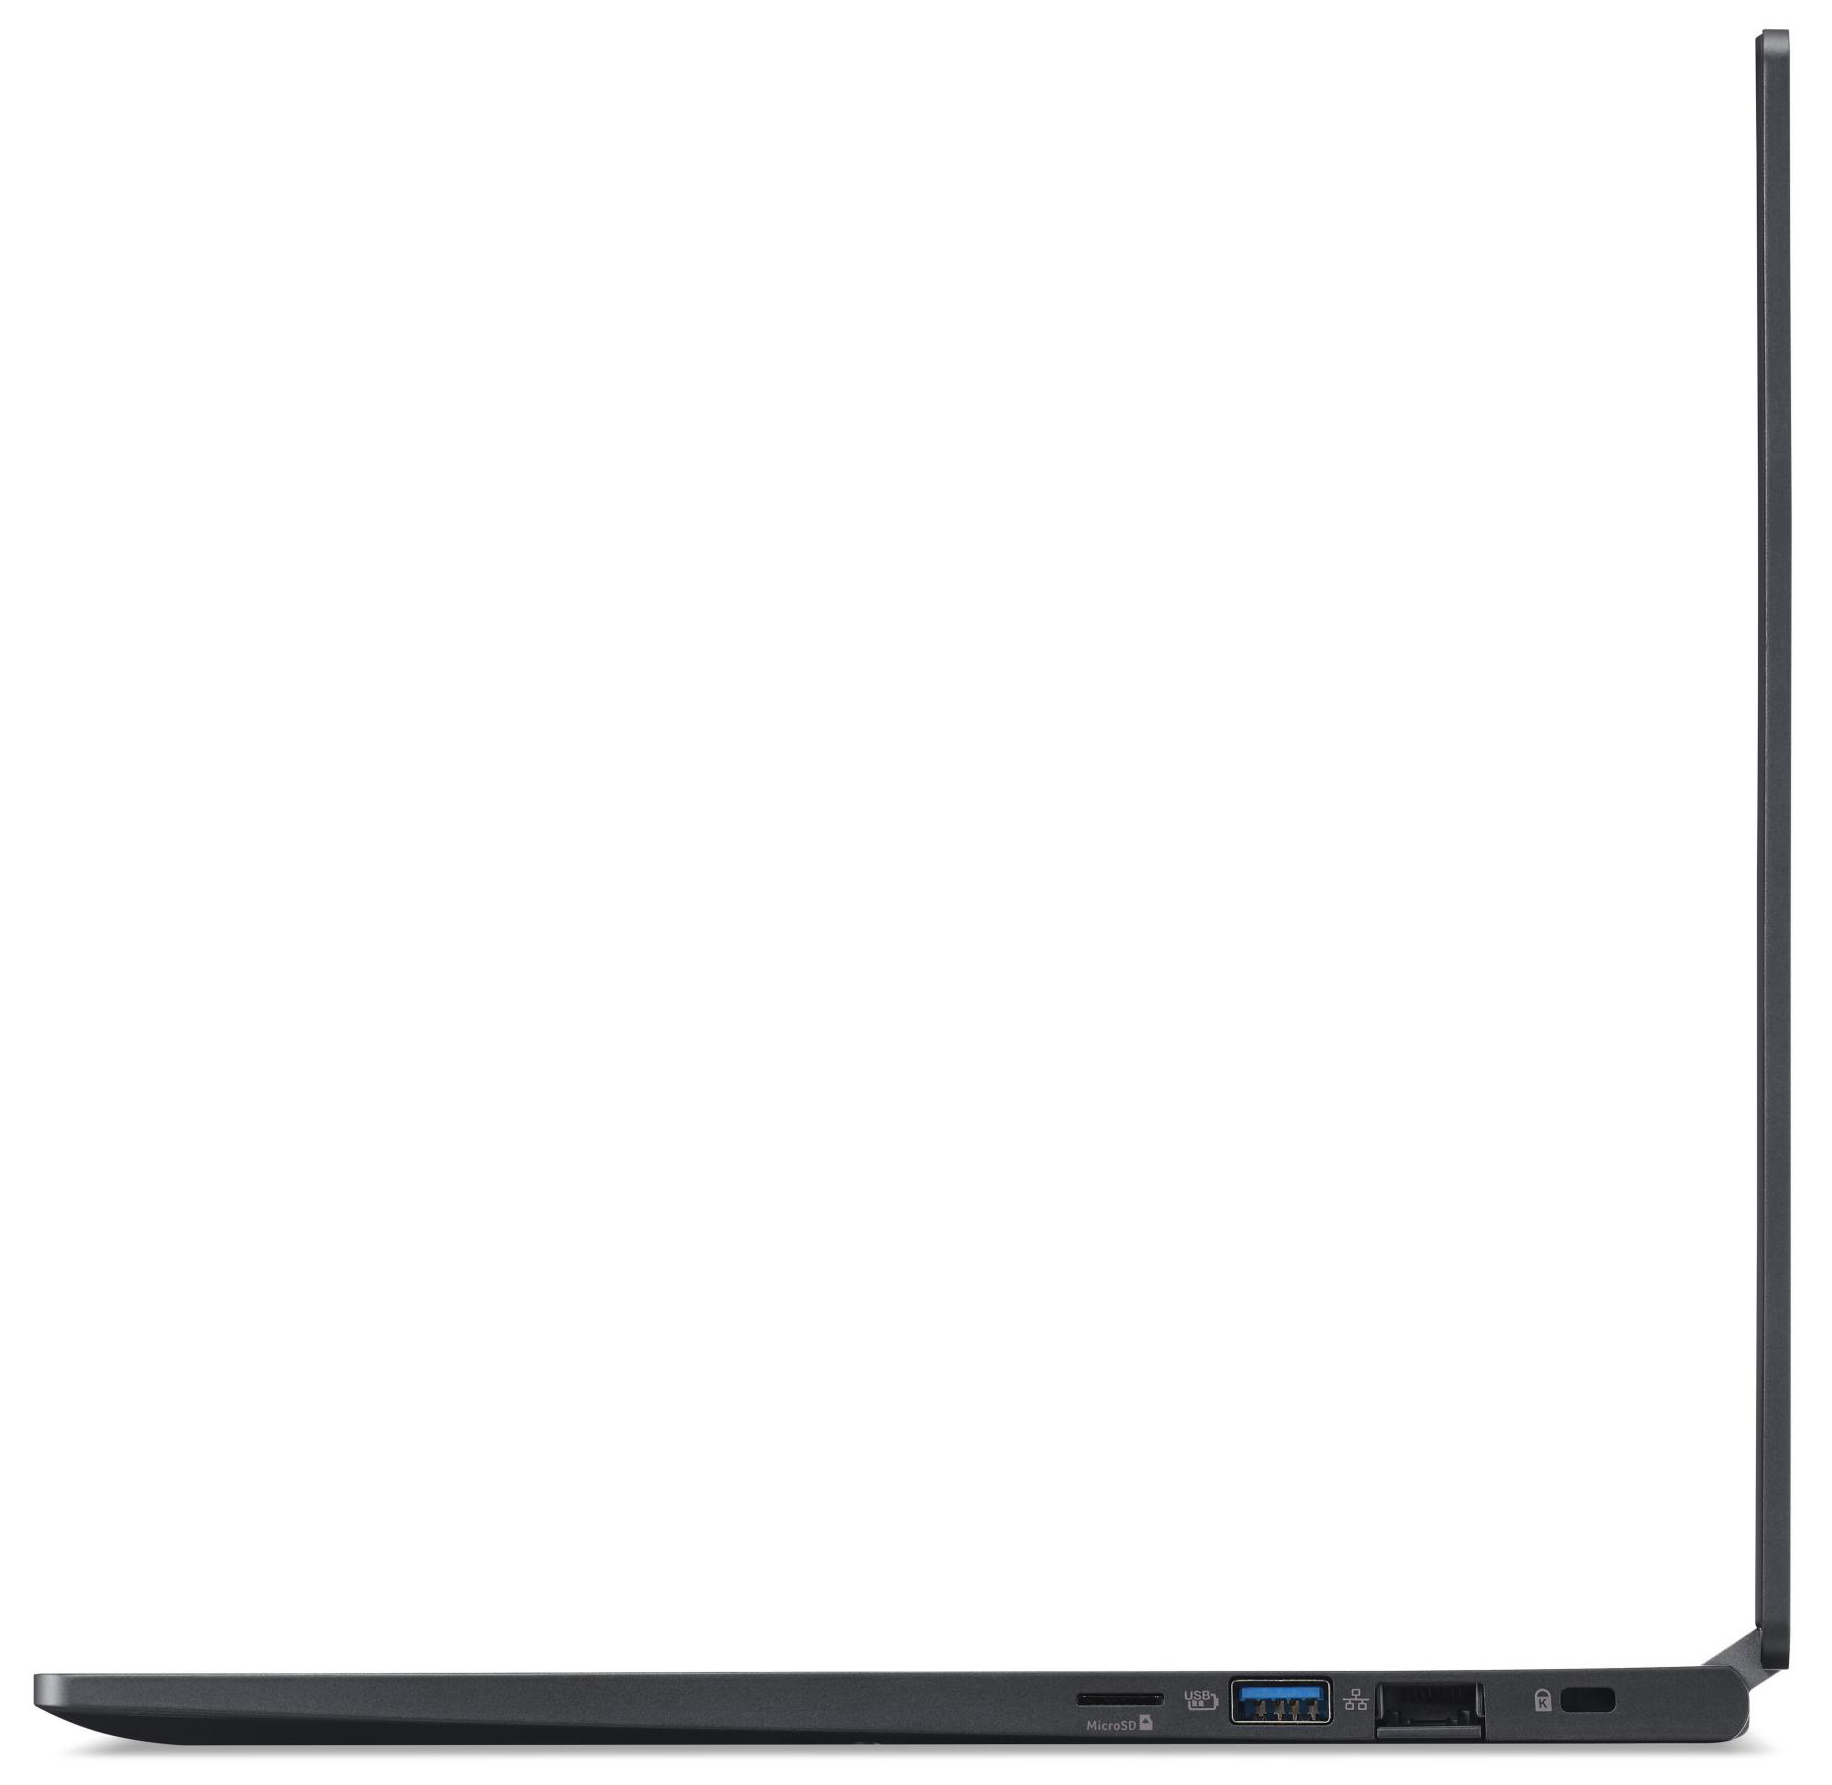
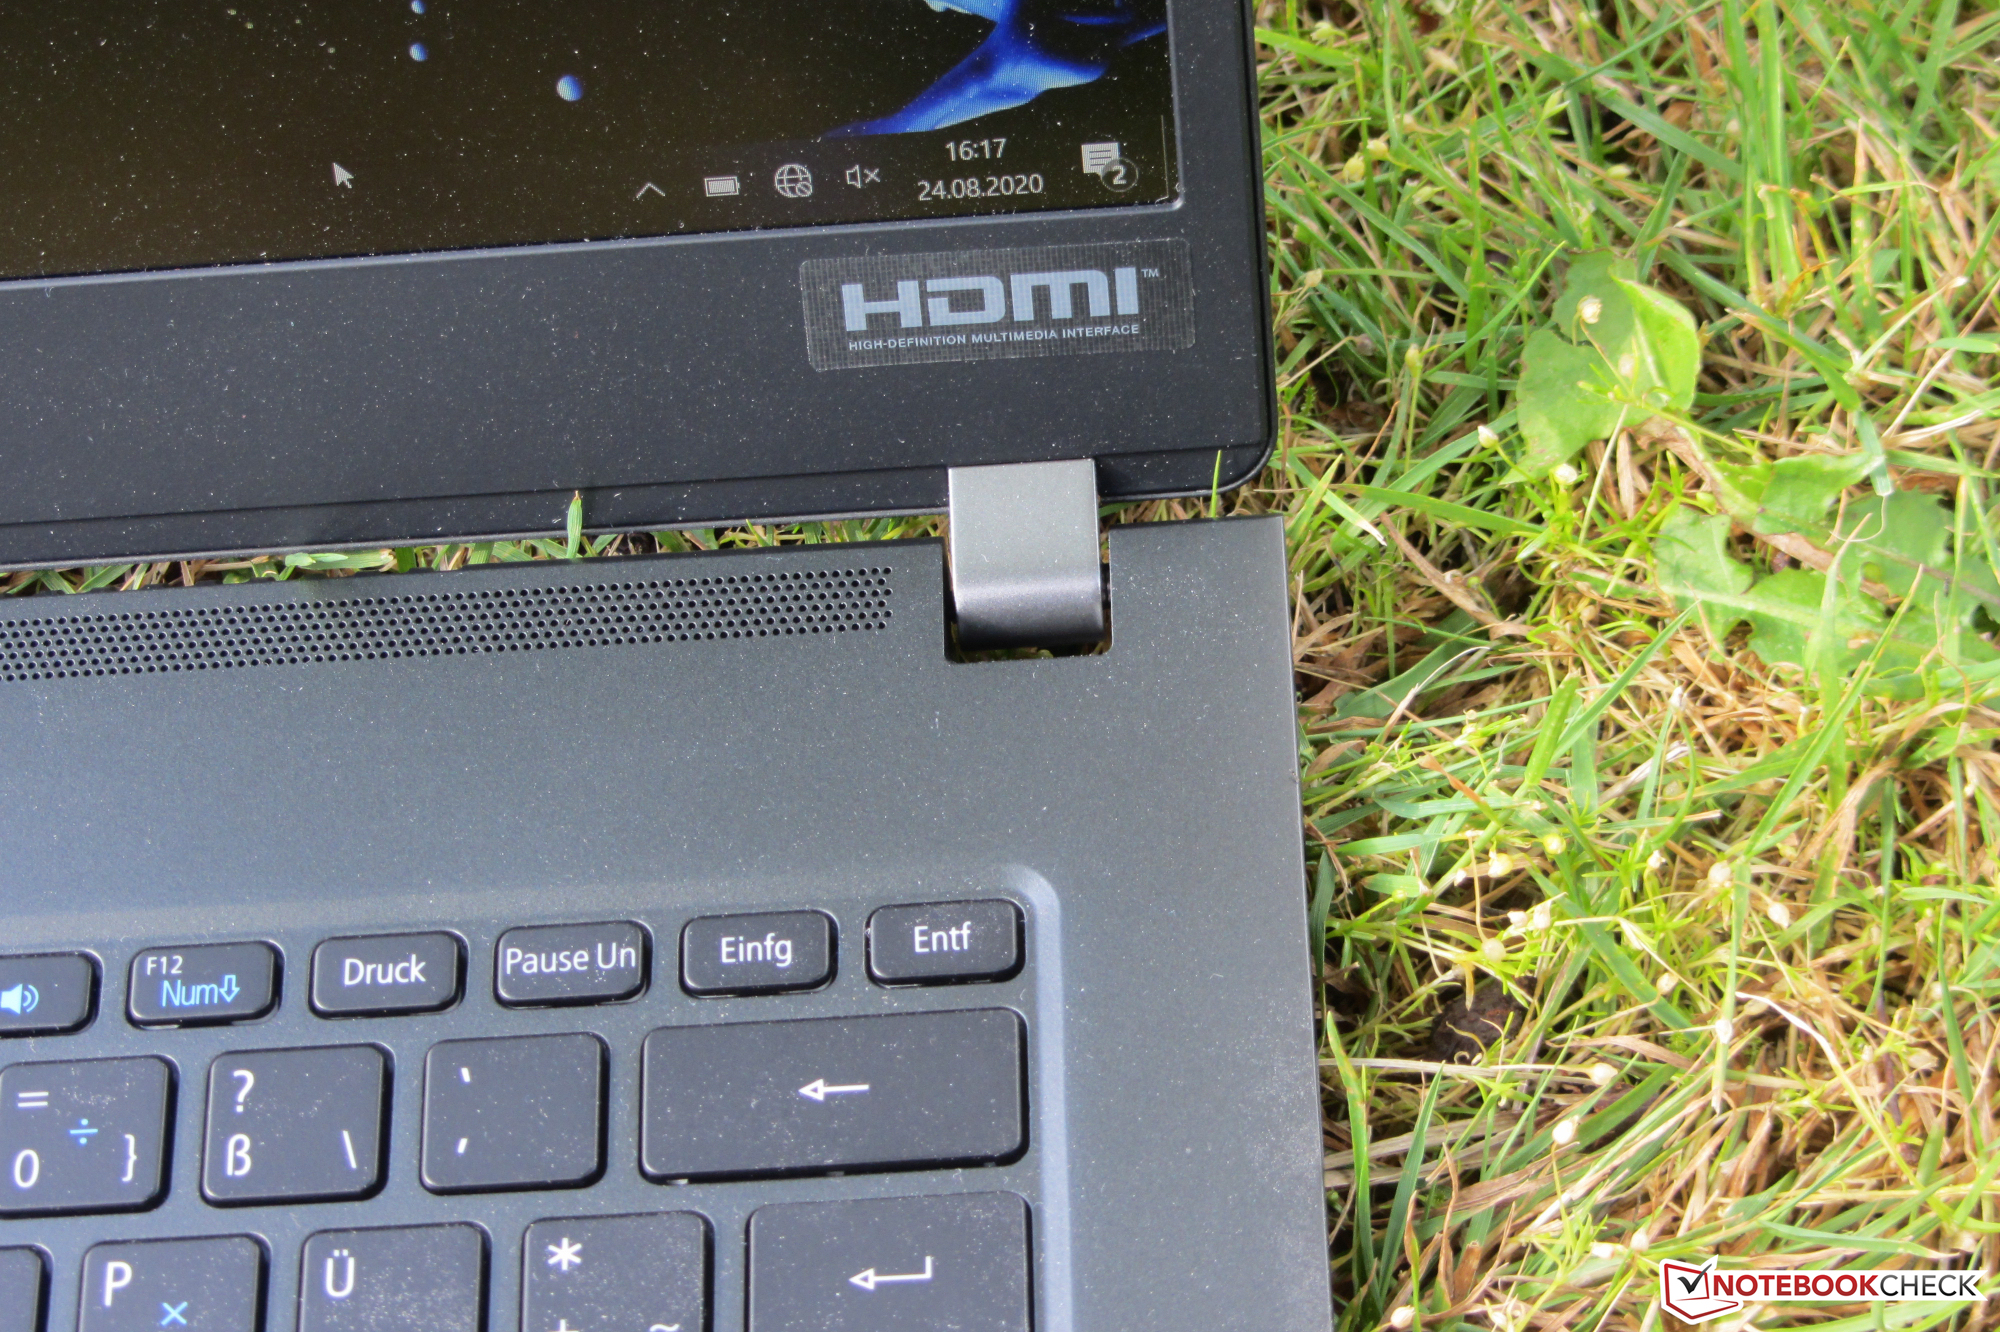
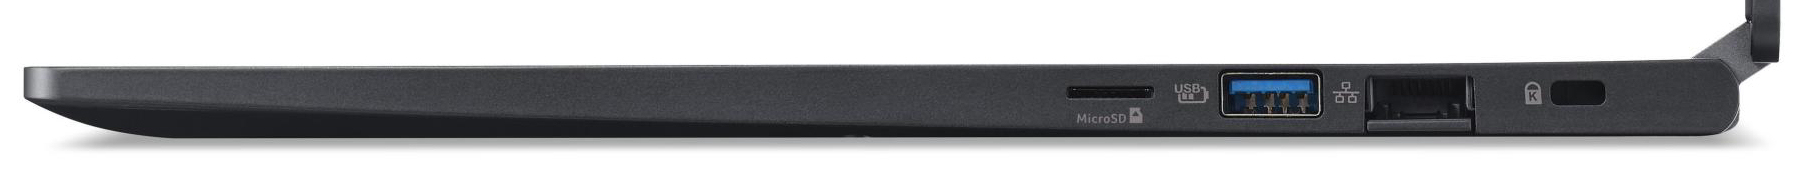
Les ports, bien équilibrés, peuvent être complétés par une station d'accueil, grâce au port Thunderbolt 3. Celui-ci permet également la connexion d'un GPU externe. Notre appareil de test ne possède pas de modem LTE, et il ne peut être ajouté. Mais dans cette série TravelMate P6, des versions en sont équipées.
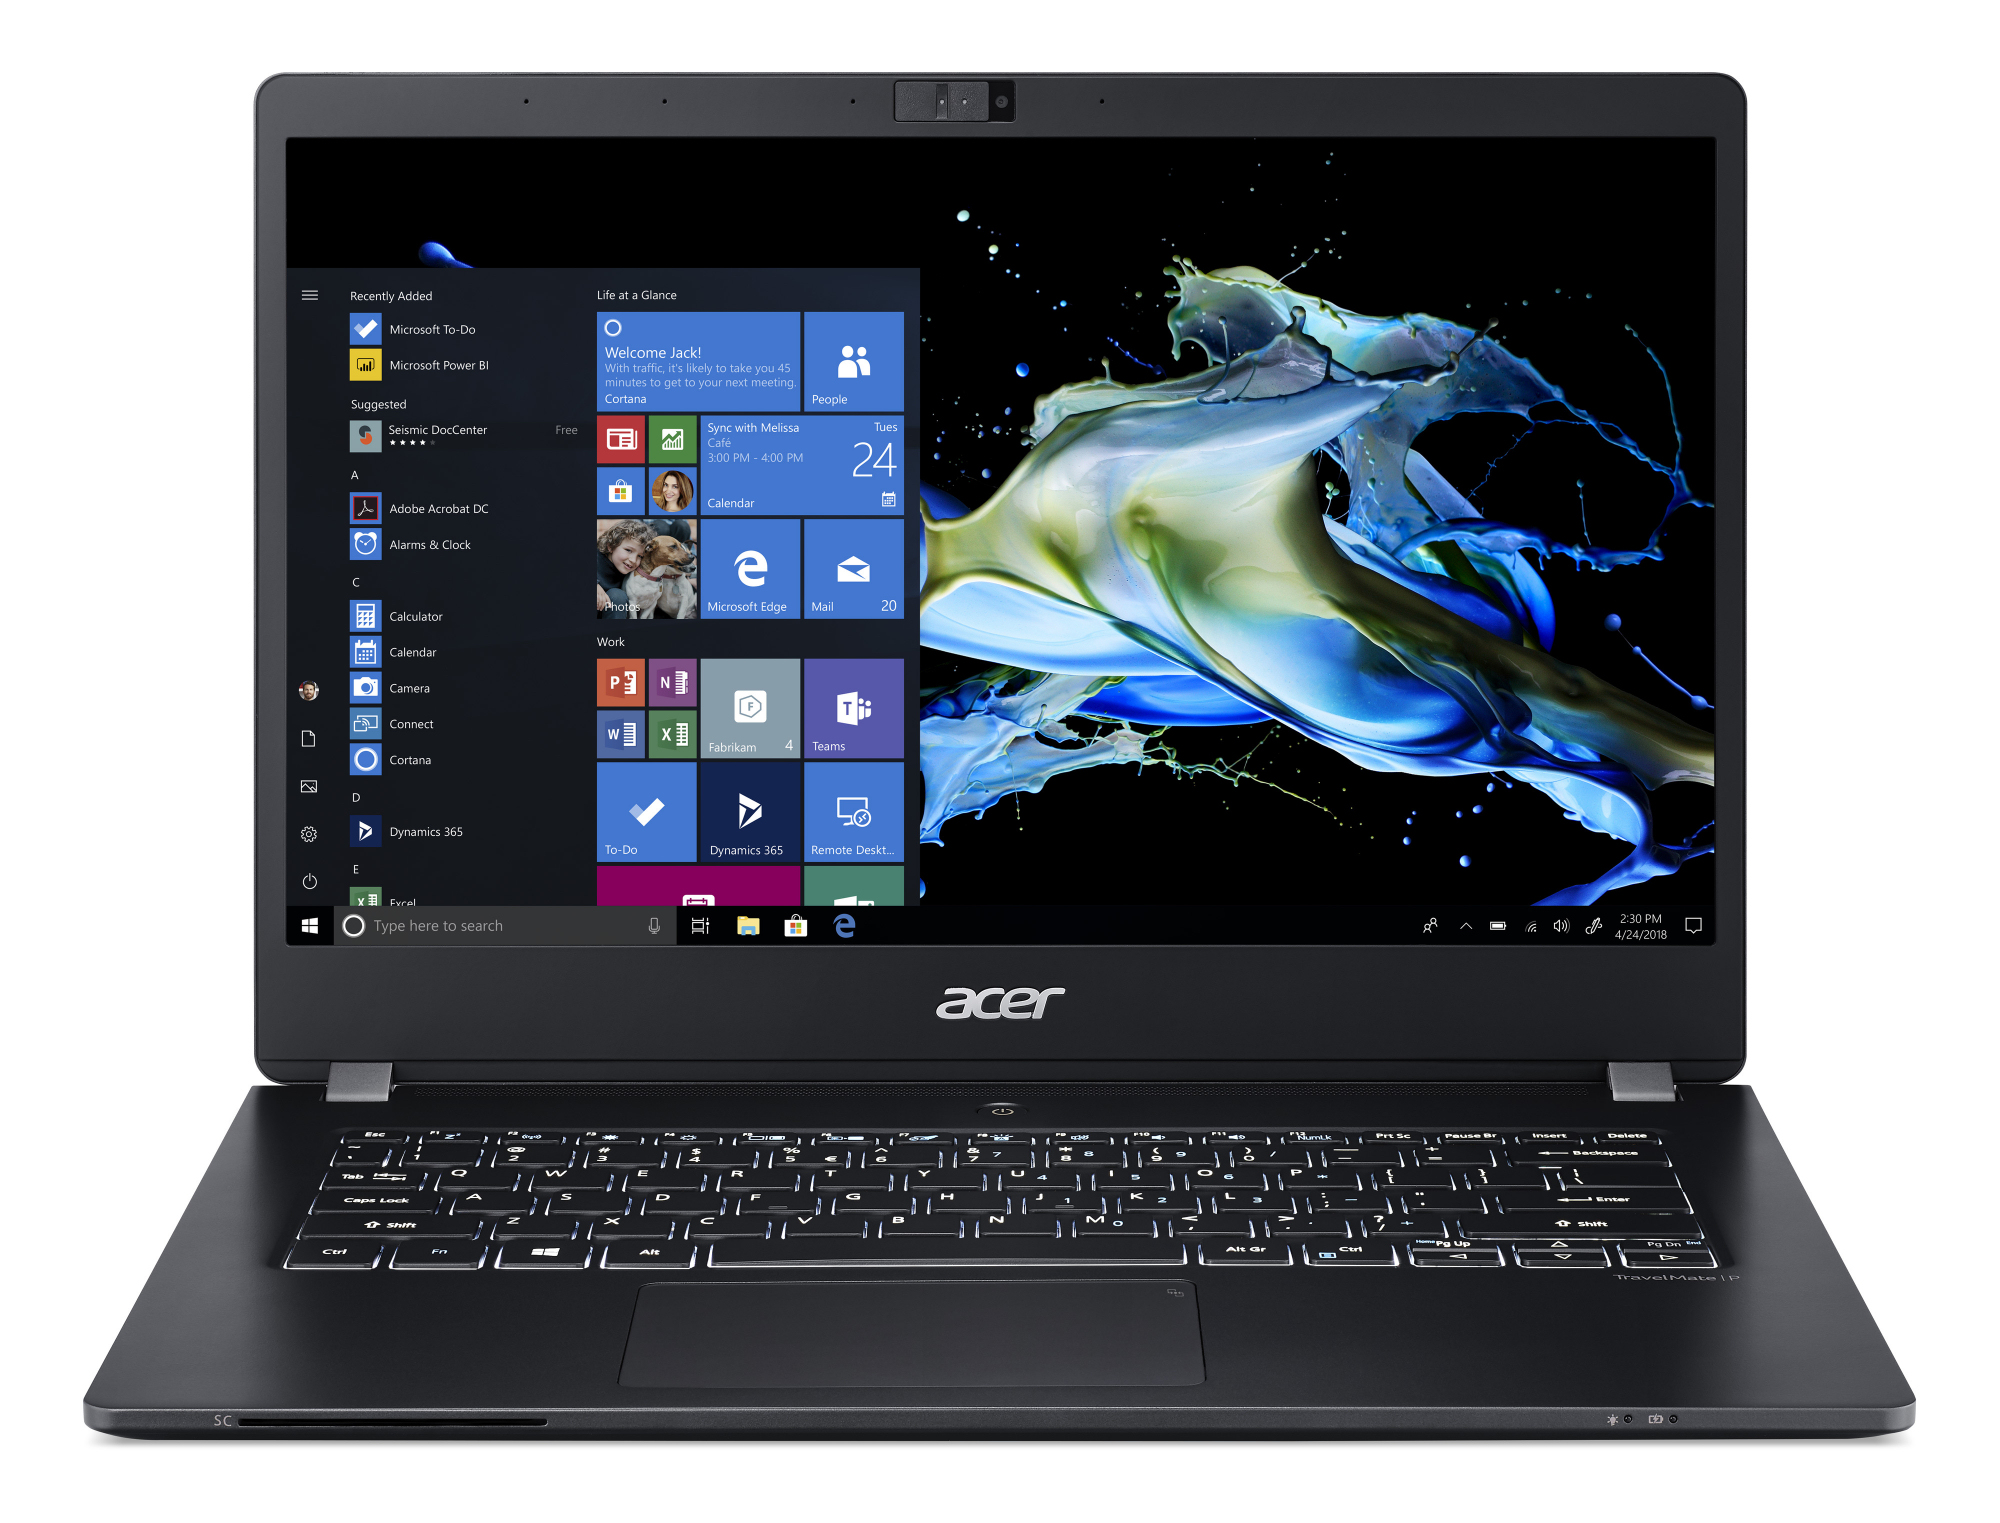
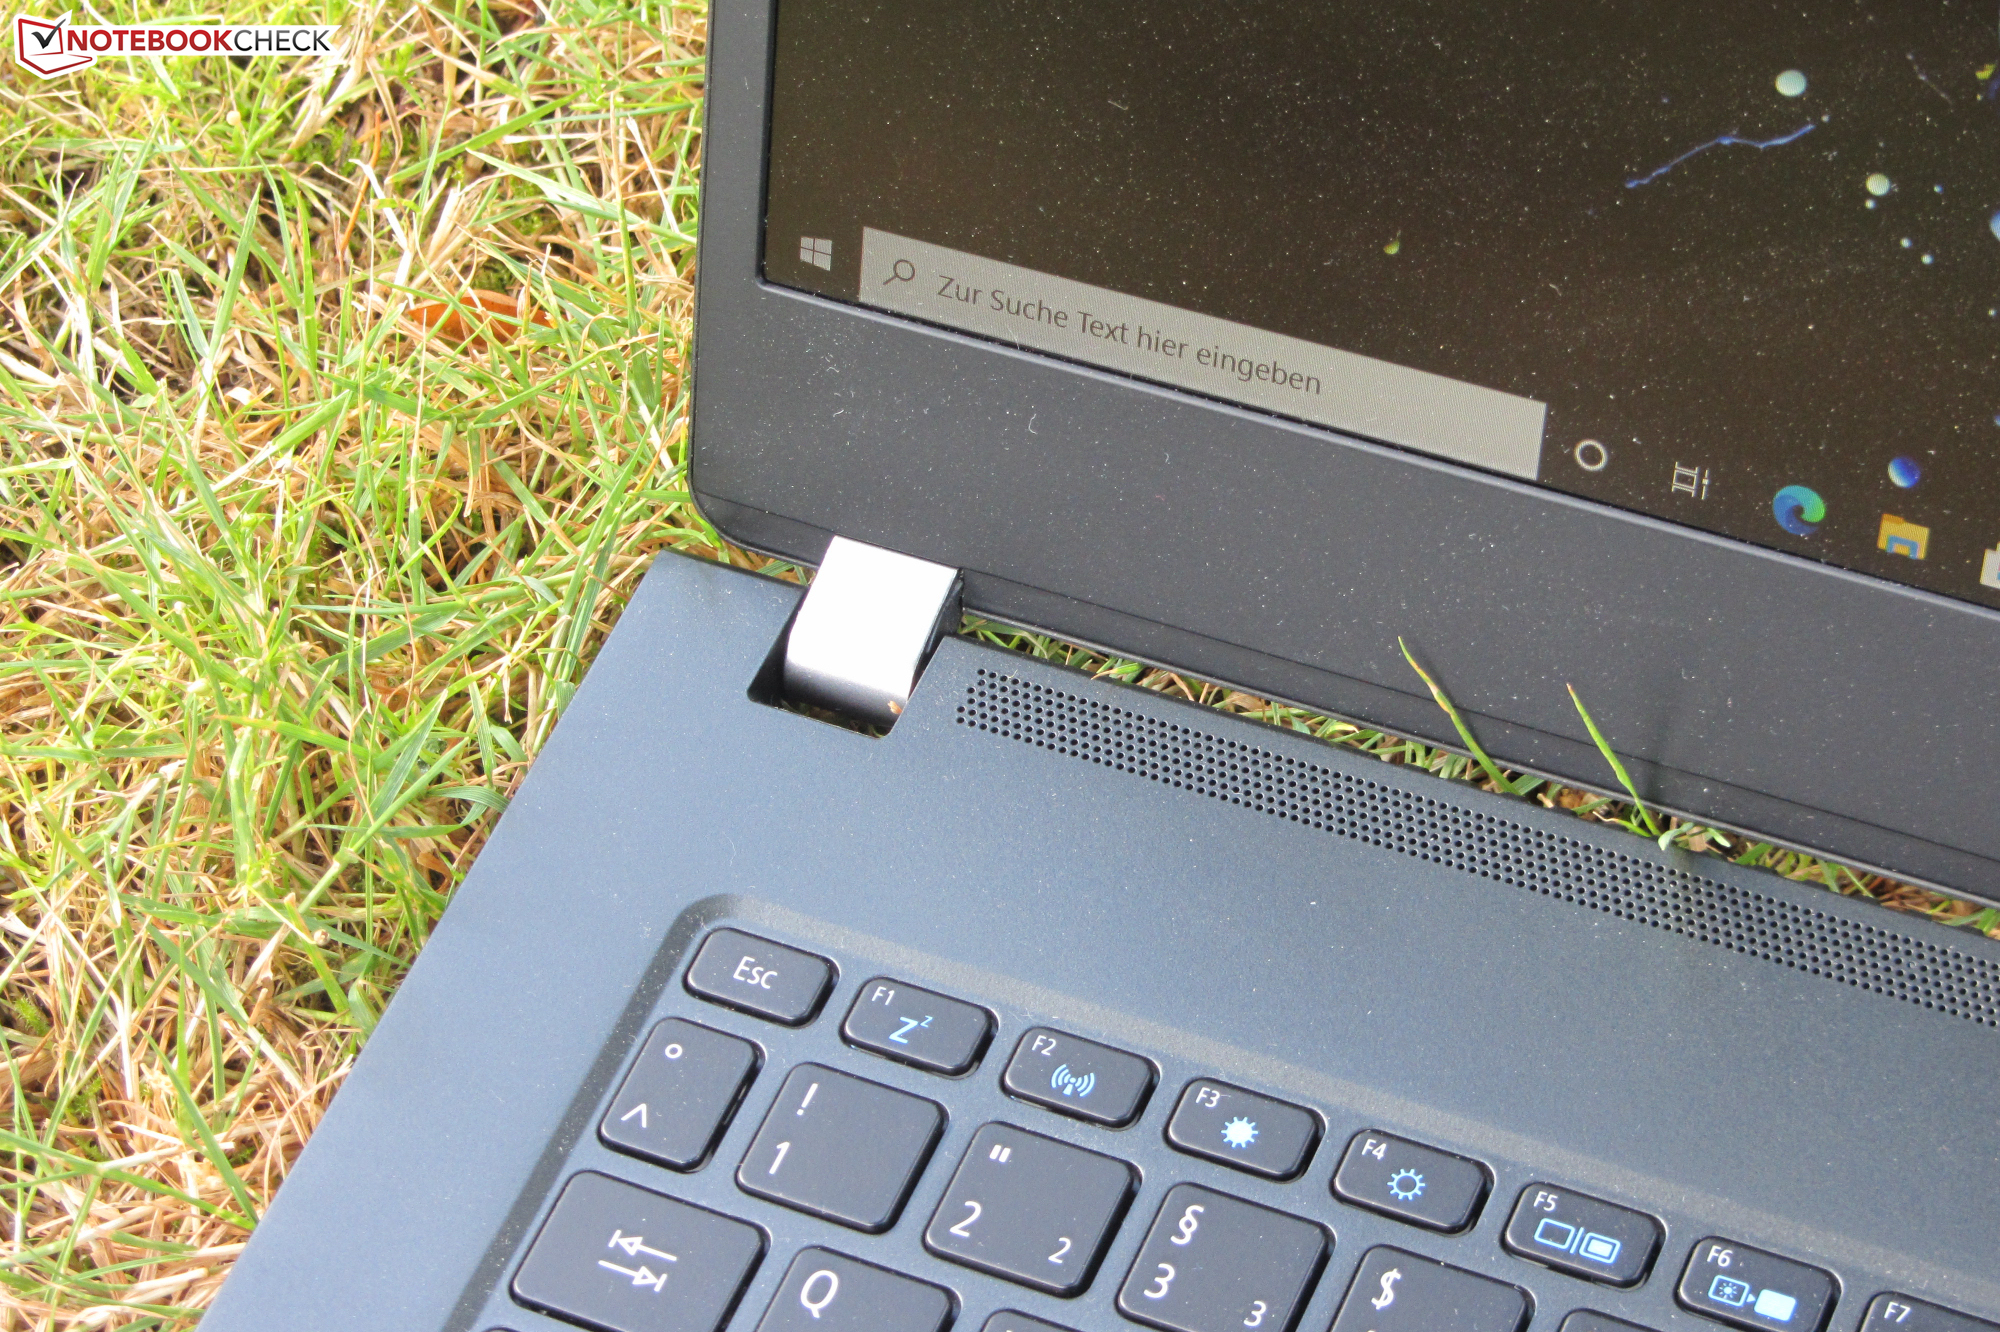
L'écran tactile de 14 pouces marque des points avec ses angles de vision, sa surface matte, la fidélité de ses couleurs, et sa couverture des espaces colorimétriques. La luminosité et le contraste sont à peu près bons, mais pourraient être meilleurs dans un appareil à ce prix.
L’intégralité de cette critique est disponible en anglais en suivant ce lien.
Acer TravelMate P6 P614-51T-G2-72ZU
- 08/28/2020 v7 (old)
Sascha Mölck
Price comparison
