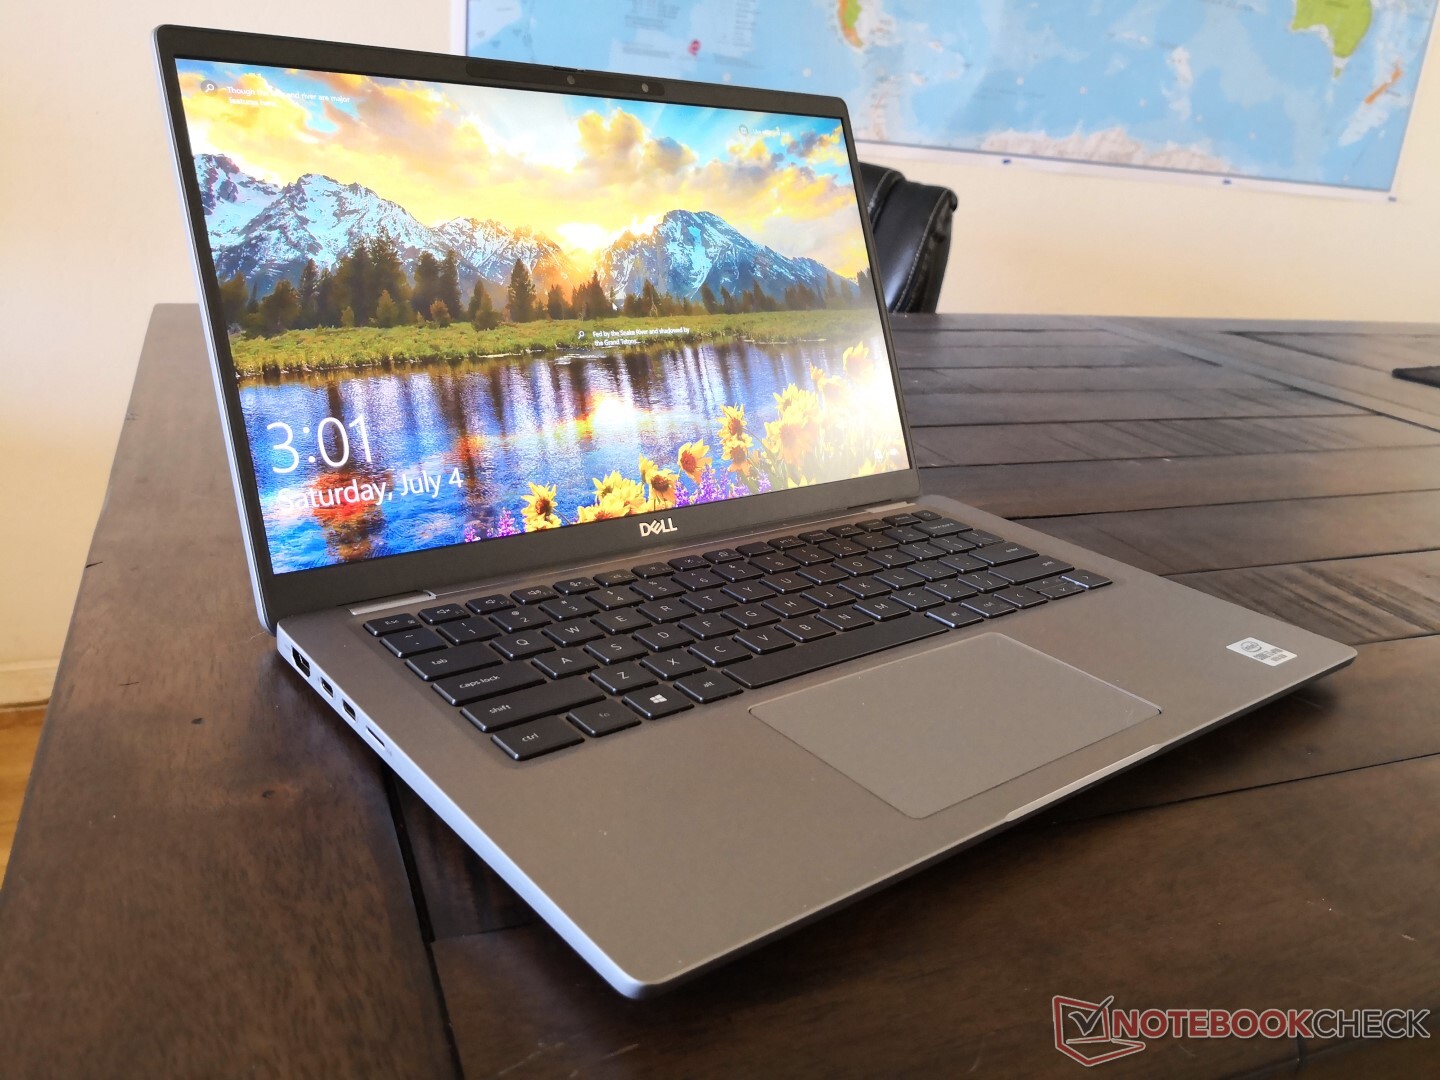
Test du Dell Latitude 7410 (i7-10610U, UHD 620, 4K UHD) : le Lenovo X1 Carbon a trouvé son concurrent
Note | Date | Modèle | Poids | Épaisseur | Taille | Résolution | Prix |
|---|---|---|---|---|---|---|---|
| 88.9 % v7 (old) | 08/20 | Dell Latitude 7410 i7-10610U, UHD Graphics 620 | 1.4 kg | 19.3 mm | 14.00" | 3840x2160 | |
| 87.2 % v7 (old) | 09/19 | Dell Latitude 7400-8N6DH i7-8665U, UHD Graphics 620 | 1.5 kg | 18.9 mm | 14.00" | 1920x1080 | |
| 90.2 % v7 (old) | 08/20 | Lenovo ThinkPad X1 Carbon 2020-20UAS04T00 i7-10510U, UHD Graphics 620 | 1.1 kg | 14.9 mm | 14.00" | 1920x1080 | |
| 80.9 % v7 (old) | 02/20 | MSI Modern 14 A10RB-459US i5-10210U, GeForce MX250 | 1.2 kg | 16 mm | 14.00" | 1920x1080 | |
| 90.5 % v7 (old) | 02/19 | HP Elitebook x360 1040 G5 i7-8650U, UHD Graphics 620 | 1.4 kg | 16.9 mm | 14.00" | 1920x1080 |
| SD Card Reader | |
| average JPG Copy Test (av. of 3 runs) | |
| Dell Latitude 7400-8N6DH (Toshiba Exceria Pro M501 64 GB UHS-II) | |
| Dell Latitude 7410 (Toshiba Exceria Pro M501 64 GB UHS-II) | |
| Dell XPS 13 9300 4K UHD (Toshiba Exceria Pro M501 64 GB UHS-II) | |
| MSI Modern 14 A10RB-459US (Toshiba Exceria Pro SDXC 64 GB UHS-II) | |
| Asus VivoBook S14 S433FL (Toshiba Exceria Pro M501 microSDXC 64GB) | |
| maximum AS SSD Seq Read Test (1GB) | |
| Dell Latitude 7400-8N6DH (Toshiba Exceria Pro M501 64 GB UHS-II) | |
| Dell XPS 13 9300 4K UHD (Toshiba Exceria Pro M501 64 GB UHS-II) | |
| Dell Latitude 7410 (Toshiba Exceria Pro M501 64 GB UHS-II) | |
| MSI Modern 14 A10RB-459US (Toshiba Exceria Pro SDXC 64 GB UHS-II) | |
| Asus VivoBook S14 S433FL (Toshiba Exceria Pro M501 microSDXC 64GB) | |


| |||||||||||||||||||||||||
Homogénéité de la luminosité: 82 %
Valeur mesurée au centre, sur batterie: 388.6 cd/m²
Contraste: 1110:1 (Valeurs des noirs: 0.35 cd/m²)
ΔE ColorChecker Calman: 4.04 | ∀{0.5-29.43 Ø4.71}
calibrated: 1.25
ΔE Greyscale Calman: 6.4 | ∀{0.09-98 Ø4.96}
99.4% sRGB (Argyll 1.6.3 3D)
66.4% AdobeRGB 1998 (Argyll 1.6.3 3D)
72.4% AdobeRGB 1998 (Argyll 3D)
99.3% sRGB (Argyll 3D)
71.8% Display P3 (Argyll 3D)
Gamma: 2.3
CCT: 6957 K
| Dell Latitude 7410 AU Optronics B140ZAN, IPS, 14", 3840x2160 | Dell Latitude 7400-8N6DH AU Optronics B140HAN, IPS, 14", 1920x1080 | Huawei MateBook X Pro 2020 i7 JDI LPM139M422A, LTPS, 13.9", 3000x2000 | Lenovo ThinkPad X1 Carbon 2020-20UAS04T00 BOE NE140FHM-N61, IPS, 14", 1920x1080 | MSI Modern 14 A10RB-459US Chi Mei N140HCE-EN2, IPS, 14", 1920x1080 | HP Elitebook x360 1040 G5 AU Optronics AUO533D, IPS, 14", 1920x1080 | |
|---|---|---|---|---|---|---|
| Display | -6% | -4% | -6% | -9% | -8% | |
| Display P3 Coverage (%) | 71.8 | 66.1 -8% | 66.6 -7% | 68.9 -4% | 64.2 -11% | 64.3 -10% |
| sRGB Coverage (%) | 99.3 | 95.3 -4% | 99.4 0% | 91.6 -8% | 94.8 -5% | 94.1 -5% |
| AdobeRGB 1998 Coverage (%) | 72.4 | 67.5 -7% | 68.6 -5% | 67.1 -7% | 65.4 -10% | 65.5 -10% |
| Response Times | -63% | -33% | -51% | -30% | -68% | |
| Response Time Grey 50% / Grey 80% * (ms) | 39.2 ? | 62 ? -58% | 49.6 ? -27% | 64.8 ? -65% | 39.2 ? -0% | 70.8 ? -81% |
| Response Time Black / White * (ms) | 22.4 ? | 37.6 ? -68% | 30.8 ? -38% | 30.4 ? -36% | 35.6 ? -59% | 34.4 ? -54% |
| PWM Frequency (Hz) | 29070 ? | 2404 ? | 25000 ? | 735 ? | ||
| Screen | 5% | 36% | -1% | 18% | 11% | |
| Brightness middle (cd/m²) | 388.6 | 289 -26% | 557 43% | 422 9% | 324.1 -17% | 416.3 7% |
| Brightness (cd/m²) | 365 | 286 -22% | 532 46% | 395 8% | 301 -18% | 400 10% |
| Brightness Distribution (%) | 82 | 91 11% | 87 6% | 90 10% | 87 6% | 89 9% |
| Black Level * (cd/m²) | 0.35 | 0.16 54% | 0.33 6% | 0.27 23% | 0.22 37% | 0.29 17% |
| Contrast (:1) | 1110 | 1806 63% | 1688 52% | 1563 41% | 1473 33% | 1436 29% |
| Colorchecker dE 2000 * | 4.04 | 4.7 -16% | 1.4 65% | 4.7 -16% | 1.63 60% | 2.69 33% |
| Colorchecker dE 2000 max. * | 9.2 | 8.7 5% | 2.5 73% | 10 -9% | 4.25 54% | 4.95 46% |
| Colorchecker dE 2000 calibrated * | 1.25 | 1.3 -4% | 0.7 44% | 2 -60% | 1.42 -14% | 2.13 -70% |
| Greyscale dE 2000 * | 6.4 | 6.4 -0% | 2 69% | 6.4 -0% | 2.2 66% | 2.9 55% |
| Gamma | 2.3 96% | 2.54 87% | 2.14 103% | 2.12 104% | 2.26 97% | 2.4 92% |
| CCT | 6957 93% | 5977 109% | 6689 97% | 7106 91% | 6887 94% | 6623 98% |
| Color Space (Percent of AdobeRGB 1998) (%) | 66.4 | 61.2 -8% | 62.5 -6% | 59.5 -10% | 60.2 -9% | 60.1 -9% |
| Color Space (Percent of sRGB) (%) | 99.4 | 95.1 -4% | 99.5 0% | 91.5 -8% | 95 -4% | 94.5 -5% |
| Moyenne finale (programmes/paramètres) | -21% /
-6% | -0% /
20% | -19% /
-8% | -7% /
7% | -22% /
-2% |
* ... Moindre est la valeur, meilleures sont les performances
Temps de réponse de l'écran
| ↔ Temps de réponse noir à blanc | ||
|---|---|---|
| 22.4 ms ... hausse ↗ et chute ↘ combinées | ↗ 12.4 ms hausse | 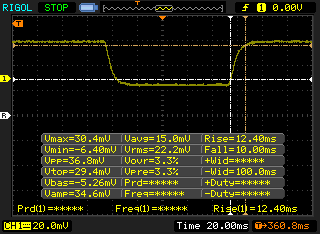 |
| ↘ 10 ms chute | ||
| L'écran montre de bons temps de réponse, mais insuffisant pour du jeu compétitif. En comparaison, tous les appareils testés affichent entre 0.1 (minimum) et 240 (maximum) ms. » 51 % des appareils testés affichent de meilleures performances. Cela signifie que les latences relevées sont moins bonnes que la moyenne (19.8 ms) de tous les appareils testés. | ||
| ↔ Temps de réponse gris 50% à gris 80% | ||
| 39.2 ms ... hausse ↗ et chute ↘ combinées | ↗ 20.4 ms hausse | 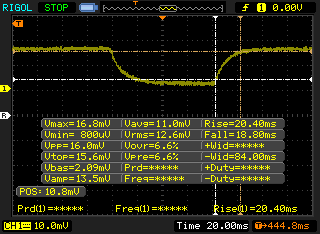 |
| ↘ 18.8 ms chute | ||
| L'écran souffre de latences très élevées, à éviter pour le jeu. En comparaison, tous les appareils testés affichent entre 0.165 (minimum) et 636 (maximum) ms. » 60 % des appareils testés affichent de meilleures performances. Cela signifie que les latences relevées sont moins bonnes que la moyenne (31 ms) de tous les appareils testés. | ||
Scintillement / MLI (Modulation de largeur d'impulsion)
| Scintillement / MLI (Modulation de largeur d'impulsion) non décelé |  | ||
En comparaison, 52 % des appareils testés n'emploient pas MDI pour assombrir leur écran. Nous avons relevé une moyenne à 7751 (minimum : 5 - maximum : 343500) Hz dans le cas où une MDI était active. | |||
Cinebench R15: CPU Multi 64Bit | CPU Single 64Bit
Blender: v2.79 BMW27 CPU
7-Zip 18.03: 7z b 4 -mmt1 | 7z b 4
Geekbench 5.5: Single-Core | Multi-Core
HWBOT x265 Benchmark v2.2: 4k Preset
LibreOffice : 20 Documents To PDF
R Benchmark 2.5: Overall mean
| Geekbench 5.5 / Single-Core | |
| Dell XPS 13 9300 4K UHD | |
| Dell Latitude 7410 | |
| Lenovo ThinkPad X1 Carbon 2020-20UAS04T00 | |
| HP ProBook 455 G7-175W8EA | |
| HP ProBook 445 G7 175W4EA | |
| Acer Swift 3 SF314-42-R27B | |
| Geekbench 5.5 / Multi-Core | |
| Dell XPS 13 9300 4K UHD | |
| HP ProBook 455 G7-175W8EA | |
| HP ProBook 445 G7 175W4EA | |
| Lenovo ThinkPad X1 Carbon 2020-20UAS04T00 | |
| Dell Latitude 7410 | |
| Acer Swift 3 SF314-42-R27B | |
| LibreOffice / 20 Documents To PDF | |
| HP ProBook 455 G7-175W8EA | |
| Dell XPS 13 9300 4K UHD | |
| HP ProBook 445 G7 175W4EA | |
| Acer Swift 3 SF314-42-R27B | |
| Dell Latitude 7410 | |
| Lenovo ThinkPad X1 Carbon 2020-20UAS04T00 | |
| R Benchmark 2.5 / Overall mean | |
| Acer Swift 3 SF314-42-R27B | |
| Dell XPS 13 9300 4K UHD | |
| Lenovo ThinkPad X1 Carbon 2020-20UAS04T00 | |
| Dell Latitude 7410 | |
| HP ProBook 455 G7-175W8EA | |
Cinebench R15: CPU Multi 64Bit | CPU Single 64Bit
Blender: v2.79 BMW27 CPU
7-Zip 18.03: 7z b 4 -mmt1 | 7z b 4
Geekbench 5.5: Single-Core | Multi-Core
HWBOT x265 Benchmark v2.2: 4k Preset
LibreOffice : 20 Documents To PDF
R Benchmark 2.5: Overall mean
* ... Moindre est la valeur, meilleures sont les performances
| PCMark 8 Home Score Accelerated v2 | 3334 points | |
| PCMark 8 Work Score Accelerated v2 | 4528 points | |
| PCMark 10 Score | 4348 points | |
Aide | ||
| DPC Latencies / LatencyMon - interrupt to process latency (max), Web, Youtube, Prime95 | |
| Dell XPS 13 9300 4K UHD | |
| Lenovo ThinkPad X1 Yoga 20SA000GUS | |
| HP ProBook 455 G7-175W8EA | |
| HP ProBook 445 G7 175W4EA | |
| Acer Swift 3 SF314-42-R27B | |
| Dell Latitude 7410 | |
| Lenovo ThinkPad X1 Carbon 2020-20UAS04T00 | |
| Asus VivoBook S14 S433FL | |
* ... Moindre est la valeur, meilleures sont les performances
| Dell Latitude 7410 Toshiba XG6 KXG60ZNV512G | Dell Latitude 7400-8N6DH Samsung SSD PM981 MZVLB512HAJQ | Huawei MateBook X Pro 2020 i7 Samsung PM981a MZVLB1T0HBLR | MSI Modern 14 A10RB-459US Kingston RBUSNS8154P3512GJ | HP Elitebook x360 1040 G5 Samsung SSD PM981 MZVLB512HAJQ | |
|---|---|---|---|---|---|
| AS SSD | 3% | 63% | -27% | 17% | |
| Seq Read (MB/s) | 1837 | 2381 30% | 2737 49% | 1061 -42% | 1816 -1% |
| Seq Write (MB/s) | 1438 | 1290 -10% | 2530 76% | 953 -34% | 1270 -12% |
| 4K Read (MB/s) | 48.1 | 52 8% | 54 12% | 35.59 -26% | 46.25 -4% |
| 4K Write (MB/s) | 132.1 | 134.8 2% | 152.5 15% | 87 -34% | 104.1 -21% |
| 4K-64 Read (MB/s) | 660 | 530 -20% | 2011 205% | 769 17% | 1342 103% |
| 4K-64 Write (MB/s) | 1163 | 1177 1% | 1260 8% | 733 -37% | 1209 4% |
| Access Time Read * (ms) | 0.059 | 0.05 15% | 0.066 -12% | 0.084 -42% | 0.043 27% |
| Access Time Write * (ms) | 0.096 | 0.032 67% | 0.024 75% | 0.136 -42% | 0.035 64% |
| Score Read (Points) | 891 | 820 -8% | 2339 163% | 911 2% | 1569 76% |
| Score Write (Points) | 1439 | 1441 0% | 1666 16% | 916 -36% | 1440 0% |
| Score Total (Points) | 2780 | 2652 -5% | 5191 87% | 2294 -17% | 3790 36% |
| Copy ISO MB/s (MB/s) | 2089 | 1719 -18% | 956 -54% | 2034 -3% | |
| Copy Program MB/s (MB/s) | 548 | 499.6 -9% | 496.5 -9% | 450.3 -18% | |
| Copy Game MB/s (MB/s) | 1226 | 1091 -11% | 872 -29% | 1024 -16% | |
| CrystalDiskMark 5.2 / 6 | -7% | 12% | -27% | -3% | |
| Write 4K (MB/s) | 133.4 | 118.6 -11% | 165.6 24% | 107.7 -19% | 122.7 -8% |
| Read 4K (MB/s) | 51.3 | 44.68 -13% | 50.2 -2% | 39.73 -23% | 46.57 -9% |
| Write Seq (MB/s) | 1897 | 1866 -2% | 1905 0% | 926 -51% | 1725 -9% |
| Read Seq (MB/s) | 2202 | 2173 -1% | 1669 -24% | 1014 -54% | 2392 9% |
| Write 4K Q32T1 (MB/s) | 384.9 | 330.9 -14% | 474.6 23% | 343.6 -11% | 470.6 22% |
| Read 4K Q32T1 (MB/s) | 318.7 | 343.1 8% | 508 59% | 499.1 57% | 313.2 -2% |
| Write Seq Q32T1 (MB/s) | 2866 | 1927 -33% | 3007 5% | 1033 -64% | 1869 -35% |
| Read Seq Q32T1 (MB/s) | 3122 | 3528 13% | 3556 14% | 1604 -49% | 3380 8% |
| Moyenne finale (programmes/paramètres) | -2% /
-1% | 38% /
42% | -27% /
-27% | 7% /
10% |
* ... Moindre est la valeur, meilleures sont les performances

Disk Throttling: DiskSpd Read Loop, Queue Depth 8
| 3DMark 06 Standard Score | 13918 points | |
| 3DMark 11 Performance | 2189 points | |
| 3DMark Ice Storm Standard Score | 43546 points | |
| 3DMark Cloud Gate Standard Score | 8771 points | |
| 3DMark Fire Strike Score | 1216 points | |
| 3DMark Time Spy Score | 473 points | |
Aide | ||
| Bas | Moyen | Élevé | Ultra | |
|---|---|---|---|---|
| Dota 2 Reborn (2015) | 82.4 | 50.6 | 22.6 | 20 |
| X-Plane 11.11 (2018) | 12.1 | 10.3 | 13.8 |
| Dell Latitude 7410 UHD Graphics 620, i7-10610U, Toshiba XG6 KXG60ZNV512G | Dell Latitude 7400-8N6DH UHD Graphics 620, i7-8665U, Samsung SSD PM981 MZVLB512HAJQ | Huawei MateBook X Pro 2020 i7 GeForce MX250, i7-10510U, Samsung PM981a MZVLB1T0HBLR | Lenovo ThinkPad X1 Carbon 2020-20UAS04T00 UHD Graphics 620, i7-10510U, Samsung SSD PM981a MZVLB512HBJQ | MSI Modern 14 A10RB-459US GeForce MX250, i5-10210U, Kingston RBUSNS8154P3512GJ | HP Elitebook x360 1040 G5 UHD Graphics 620, i7-8650U, Samsung SSD PM981 MZVLB512HAJQ | |
|---|---|---|---|---|---|---|
| Noise | -2% | -8% | -2% | -5% | -1% | |
| arrêt / environnement * (dB) | 28.1 | 28.6 -2% | 29.6 -5% | 29.5 -5% | 28.7 -2% | 28.3 -1% |
| Idle Minimum * (dB) | 28.1 | 28.6 -2% | 29.6 -5% | 29.5 -5% | 29.5 -5% | 28.3 -1% |
| Idle Average * (dB) | 28.1 | 28.6 -2% | 29.6 -5% | 29.5 -5% | 29.5 -5% | 28.3 -1% |
| Idle Maximum * (dB) | 28.1 | 29.1 -4% | 30.3 -8% | 29.5 -5% | 29.5 -5% | 28.3 -1% |
| Load Average * (dB) | 30 | 31.5 -5% | 38 -27% | 31.6 -5% | 33.4 -11% | 32.6 -9% |
| Load Maximum * (dB) | 39.3 | 36.9 6% | 38 3% | 33.9 14% | 40.5 -3% | 36.6 7% |
| Witcher 3 ultra * (dB) | 38 | 37.9 |
* ... Moindre est la valeur, meilleures sont les performances
Degré de la nuisance sonore
| Au repos |
| 28.1 / 28.1 / 28.1 dB(A) |
| Fortement sollicité |
| 30 / 39.3 dB(A) |
 | ||
30 dB silencieux 40 dB(A) audible 50 dB(A) bruyant |
||
min: | ||
(±) La température maximale du côté supérieur est de 44.6 °C / 112 F, par rapport à la moyenne de 34.3 °C / 94 F, allant de 21.2 à 62.5 °C pour la classe Office.
(-) Le fond chauffe jusqu'à un maximum de 48.4 °C / 119 F, contre une moyenne de 36.8 °C / 98 F
(+) En utilisation inactive, la température moyenne du côté supérieur est de 27.2 °C / 81 F, par rapport à la moyenne du dispositif de 29.5 °C / 85 F.
(±) Les repose-poignets et le pavé tactile peuvent devenir très chauds au toucher, avec un maximum de 36 °C / 96.8# F.
(-) La température moyenne de la zone de l'appui-paume de dispositifs similaires était de 27.5 °C / 81.5 F (-8.5 °C / #-15.3 F).
| Éteint/en veille | |
| Au repos | |
| Fortement sollicité |
|
Légende:
min: | |
| Dell Latitude 7410 i7-10610U, UHD Graphics 620, Toshiba XG6 KXG60ZNV512G, IPS, 3840x2160, 14" | Dell Latitude 7400-8N6DH i7-8665U, UHD Graphics 620, Samsung SSD PM981 MZVLB512HAJQ, IPS, 1920x1080, 14" | Huawei MateBook X Pro 2020 i7 i7-10510U, GeForce MX250, Samsung PM981a MZVLB1T0HBLR, LTPS, 3000x2000, 13.9" | Lenovo ThinkPad X1 Carbon 2020-20UAS04T00 i7-10510U, UHD Graphics 620, Samsung SSD PM981a MZVLB512HBJQ, IPS, 1920x1080, 14" | MSI Modern 14 A10RB-459US i5-10210U, GeForce MX250, Kingston RBUSNS8154P3512GJ, IPS, 1920x1080, 14" | HP Elitebook x360 1040 G5 i7-8650U, UHD Graphics 620, Samsung SSD PM981 MZVLB512HAJQ, IPS, 1920x1080, 14" | |
|---|---|---|---|---|---|---|
| Power Consumption | -3% | -28% | 1% | -11% | -1% | |
| Idle Minimum * (Watt) | 3.7 | 3.9 -5% | 4.3 -16% | 2.96 20% | 4.2 -14% | 2.7 27% |
| Idle Average * (Watt) | 6.2 | 6.1 2% | 8.5 -37% | 5.9 5% | 5.9 5% | 6.5 -5% |
| Idle Maximum * (Watt) | 7 | 8.2 -17% | 12 -71% | 9.1 -30% | 7.2 -3% | 11.5 -64% |
| Load Average * (Watt) | 43.2 | 41 5% | 54.8 -27% | 42.1 3% | 63.4 -47% | 38.7 10% |
| Load Maximum * (Watt) | 68.6 | 69.7 -2% | 61.5 10% | 65.1 5% | 67.4 2% | 50.5 26% |
| Witcher 3 ultra * (Watt) | 47.1 | 53.5 |
* ... Moindre est la valeur, meilleures sont les performances
| Dell Latitude 7410 i7-10610U, UHD Graphics 620, 68 Wh | Dell Latitude 7400-8N6DH i7-8665U, UHD Graphics 620, 60 Wh | Huawei MateBook X Pro 2020 i7 i7-10510U, GeForce MX250, 57.4 Wh | Lenovo ThinkPad X1 Carbon 2020-20UAS04T00 i7-10510U, UHD Graphics 620, 51 Wh | MSI Modern 14 A10RB-459US i5-10210U, GeForce MX250, 50 Wh | HP Elitebook x360 1040 G5 i7-8650U, UHD Graphics 620, 56 Wh | |
|---|---|---|---|---|---|---|
| Autonomie de la batterie | -6% | -11% | -27% | -36% | -3% | |
| Reader / Idle (h) | 31.3 | 16.4 -48% | 27.9 -11% | |||
| WiFi v1.3 (h) | 11 | 11.6 5% | 10.4 -5% | 10.1 -8% | 8.6 -22% | 10.4 -5% |
| Load (h) | 2.9 | 2.4 -17% | 2.4 -17% | 1.6 -45% | 1.8 -38% | 3.1 7% |
Points positifs
Points négatifs
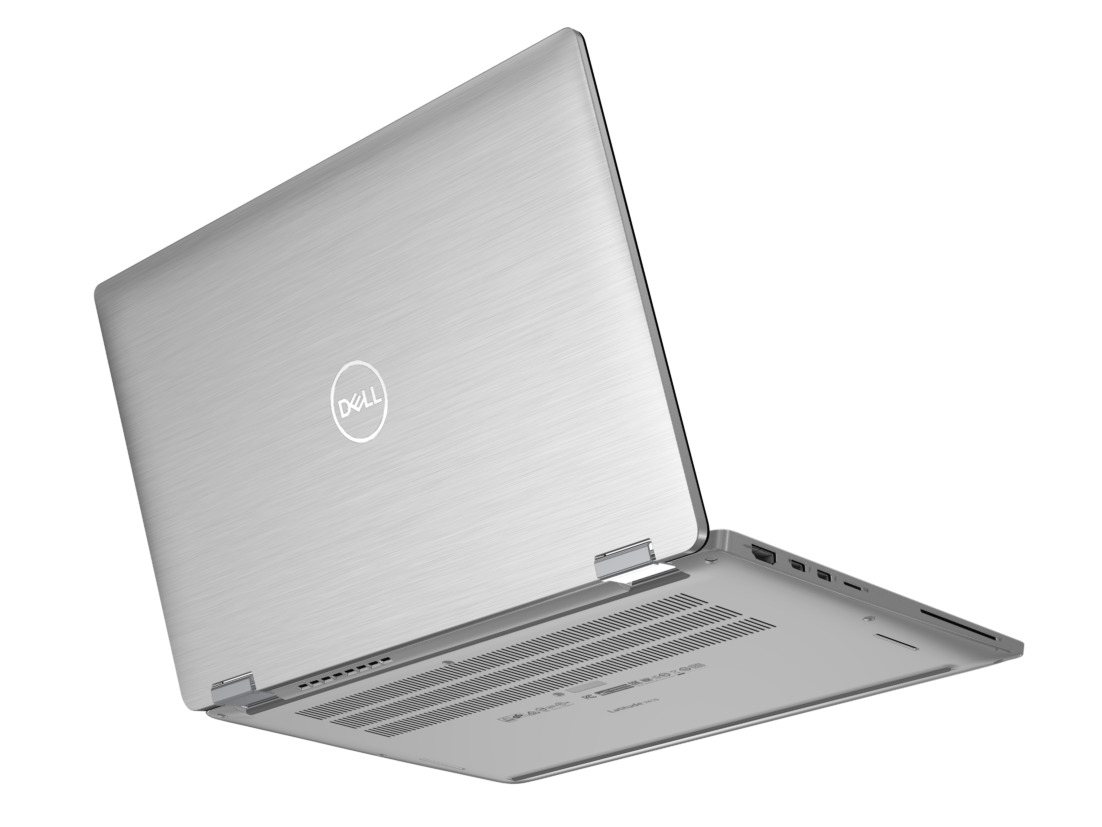
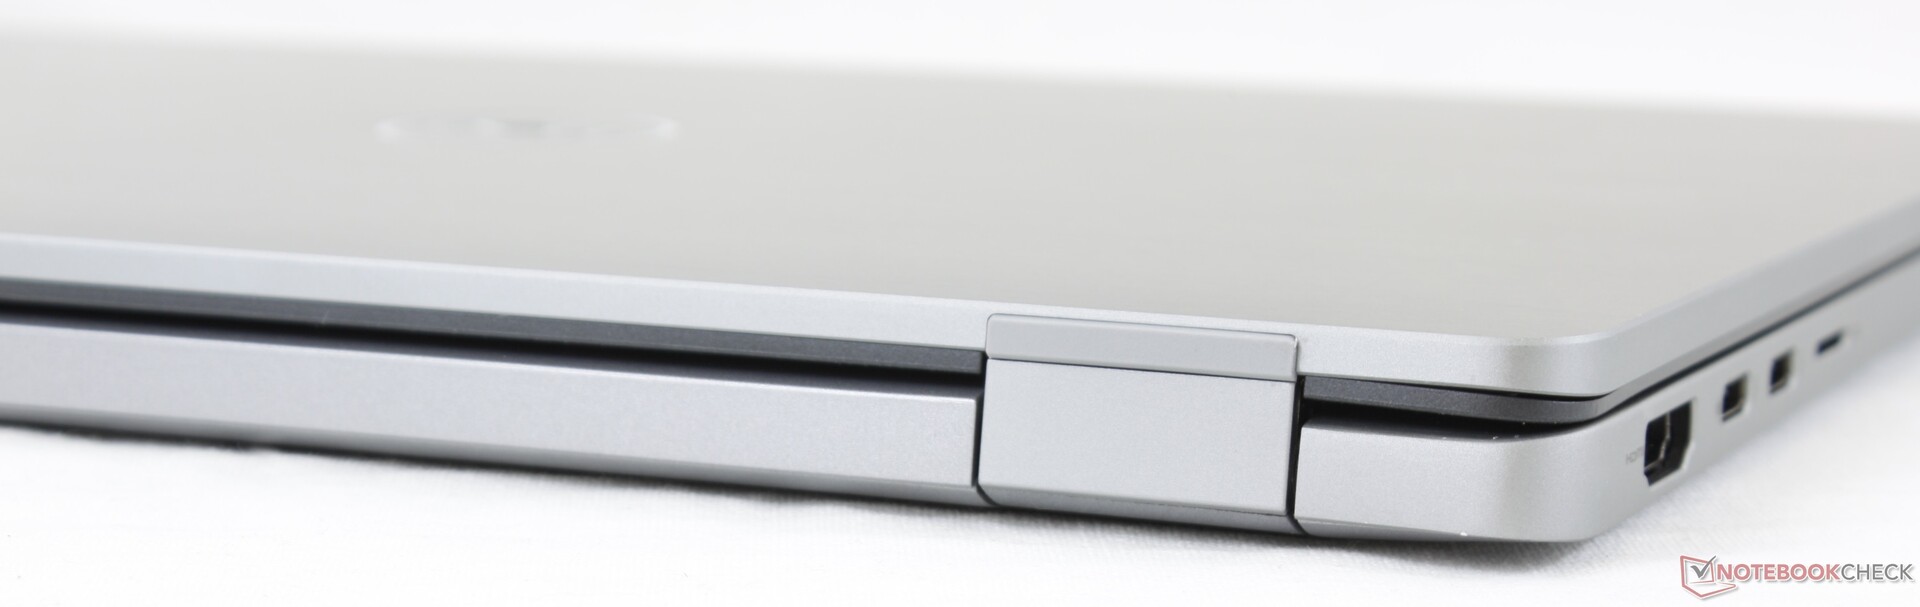
Le Latitude 7410 est un solide PC portable pro sans fioritures. Son châssis et ses charnières semblent plus robustes que ce que Lenovo ou HP peuvent proposer dans cette catégorie - nous pouvons espérer voir ce système tenir facilement plusieurs années dans un environnement professionnel.
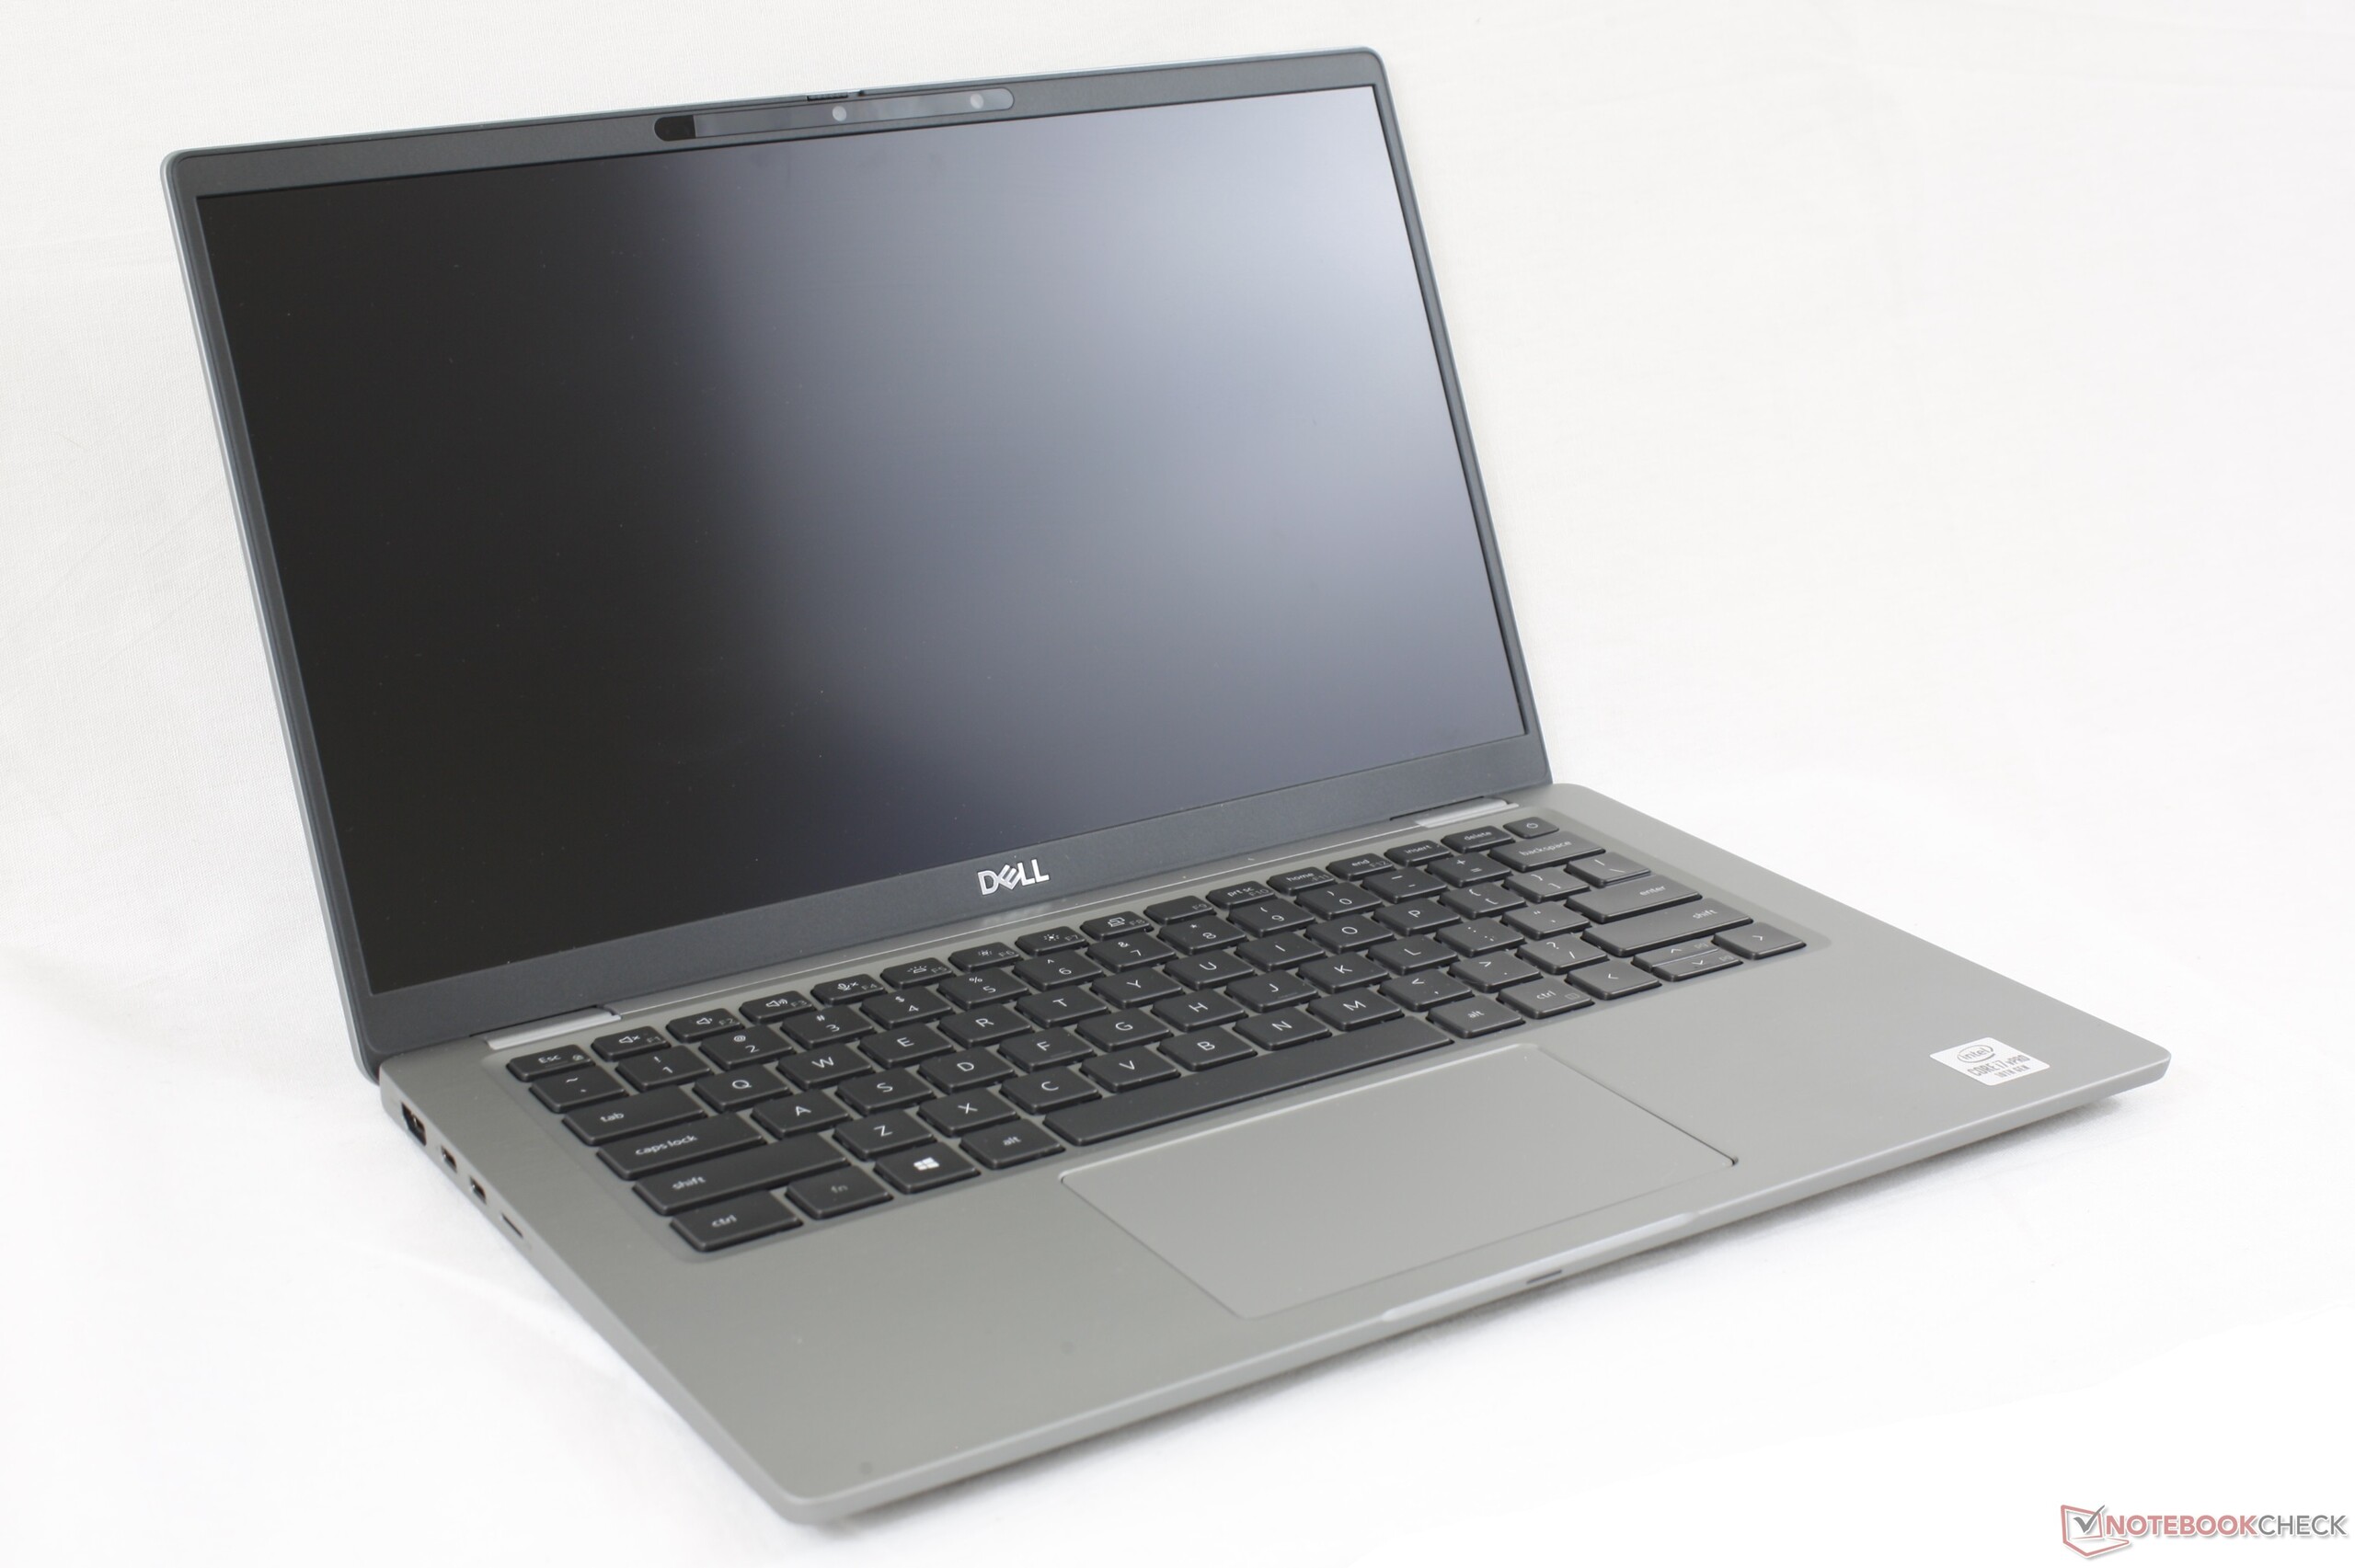
Le principal défaut de l'appareil est qu'il n'est pas assez équipé vu son prix et son poids. PC portable pro, il aurait dû intégrer plus de fonctionnalités pros pour mieux coller à sa cible. Le Lenovo X1 Carbon et le HP EliteBook, par exemple, possèdent un TrackPoint ou des touches dédiées pour la visioconférence, et sont tous deux bien plus légers que le Dell. Ceux qui choisiront le Latitude 7410 devront abandonner quelques fonctionnalités au profit d'un châssis plus robuste et plus lourd.
Le processeur et la carte graphique sont également un peu limites, ce qui bride le système à du travail de bureautique. Le rapport performances par euro n'est pas bon, surtout quand on voit que le Core i7-8665U tourne aussi vite que notre Core i7-10610U. Des alternatives comme le Lenovo ThinkBook 14 proposent des versions Ryen 4000U, pour les utilisateurs pros plus exigeants.
Si une machine une plus plus épaisse et lourde ne vous dérange pas, alors le rigide Dell Latitude 7410 sera un compagnon fiable et sans fioriture, qui tiendra la distance.
L’intégralité de cette critique est disponible en anglais en suivant ce lien.
Dell Latitude 7410
- 07/07/2020 v7 (old)
Allen Ngo
Price comparison
