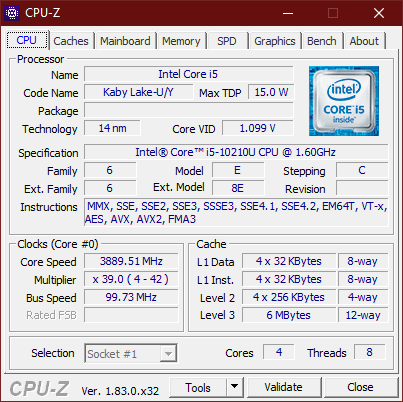
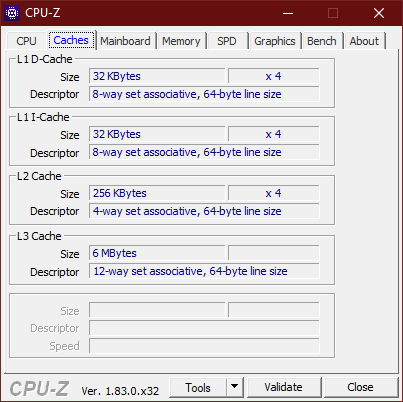
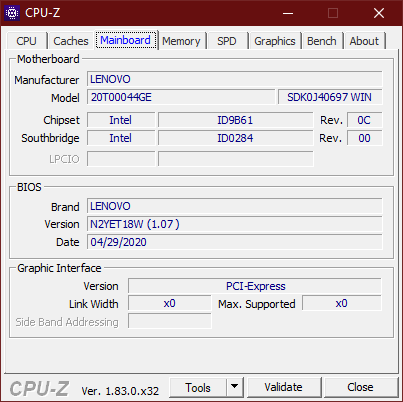
Test du Lenovo ThinkPad T14s Gen 1 (i5-10210U, UHD 620, FHD) : Intel est le moins bon choix...
Note | Date | Modèle | Poids | Épaisseur | Taille | Résolution | Prix |
|---|---|---|---|---|---|---|---|
| 88.8 % v7 (old) | 09/20 | Lenovo ThinkPad T14s-20T00044GE i5-10210U, UHD Graphics 620 | 1.3 kg | 16.1 mm | 14.00" | 1920x1080 | |
| 90.2 % v7 (old) | 08/20 | Lenovo ThinkPad X1 Carbon 2020-20UAS04T00 i7-10510U, UHD Graphics 620 | 1.1 kg | 14.9 mm | 14.00" | 1920x1080 | |
| 88 % v7 (old) | 08/20 | Lenovo ThinkPad T14-20S1S06B00 i5-10210U, UHD Graphics 620 | 1.5 kg | 17.9 mm | 14.00" | 1920x1080 | |
| 88.9 % v7 (old) | 08/20 | Dell Latitude 7410 i7-10610U, UHD Graphics 620 | 1.4 kg | 19.3 mm | 14.00" | 3840x2160 | |
| 89.3 % v7 (old) | 06/19 | Lenovo ThinkPad T490s-20NYS02A00 i5-8265U, UHD Graphics 620 | 1.3 kg | 16.1 mm | 14.00" | 1920x1080 |

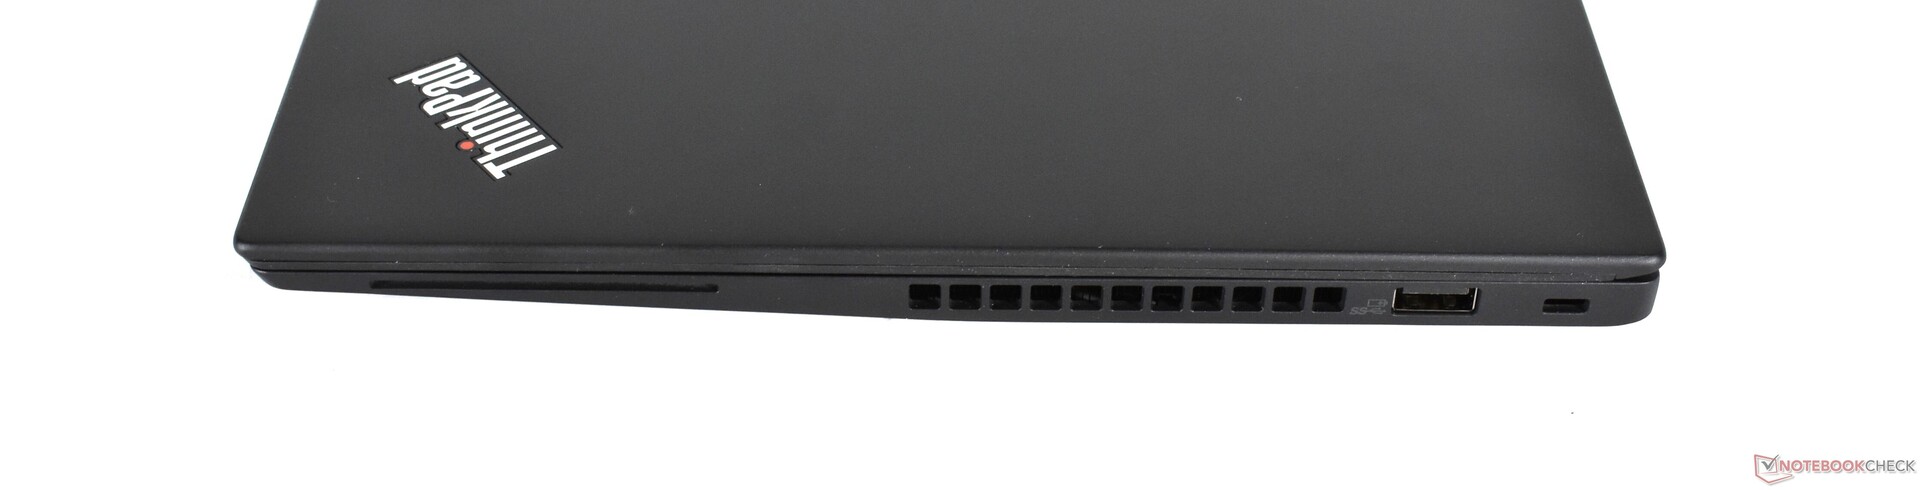
| SD Card Reader | |
| average JPG Copy Test (av. of 3 runs) | |
| Dell Latitude 7410 (Toshiba Exceria Pro M501 64 GB UHS-II) | |
| Lenovo ThinkPad T14-20S1S06B00 (Toshiba Exceria Pro M501 64 GB UHS-II) | |
| Lenovo ThinkPad T490s-20NYS02A00 (Toshiba Exceria Pro M501) | |
| Moyenne de la classe Office (19.8 - 198.5, n=22, 2 dernières années) | |
| Lenovo ThinkPad T14s-20T00044GE (Toshiba Exceria Pro M501 64 GB UHS-II) | |
| maximum AS SSD Seq Read Test (1GB) | |
| Dell Latitude 7410 (Toshiba Exceria Pro M501 64 GB UHS-II) | |
| Lenovo ThinkPad T490s-20NYS02A00 (Toshiba Exceria Pro M501) | |
| Lenovo ThinkPad T14-20S1S06B00 (Toshiba Exceria Pro M501 64 GB UHS-II) | |
| Moyenne de la classe Office (27.4 - 249, n=21, 2 dernières années) | |
| Lenovo ThinkPad T14s-20T00044GE (Toshiba Exceria Pro M501 64 GB UHS-II) | |


| |||||||||||||||||||||||||
Homogénéité de la luminosité: 92 %
Valeur mesurée au centre, sur batterie: 404 cd/m²
Contraste: 1924:1 (Valeurs des noirs: 0.21 cd/m²)
ΔE ColorChecker Calman: 3.1 | ∀{0.5-29.43 Ø4.73}
calibrated: 1.3
ΔE Greyscale Calman: 3.4 | ∀{0.09-98 Ø4.97}
96.6% sRGB (Argyll 1.6.3 3D)
61.8% AdobeRGB 1998 (Argyll 1.6.3 3D)
67.6% AdobeRGB 1998 (Argyll 3D)
96.8% sRGB (Argyll 3D)
66.6% Display P3 (Argyll 3D)
Gamma: 2.38
CCT: 7070 K
| Lenovo ThinkPad T14s-20T00044GE B140HAN05.7, LTPS AHVA-IPS LED, 1920x1080, 14" | Lenovo ThinkPad X1 Carbon 2020-20UAS04T00 BOE NE140FHM-N61, IPS, 1920x1080, 14" | Lenovo ThinkPad T14-20S1S06B00 B140HAN05.7, LTPS IPS LED, 1920x1080, 14" | Dell Latitude 7410 AU Optronics B140ZAN, IPS, 3840x2160, 14" | Lenovo ThinkPad T490s-20NYS02A00 B140HAN05.7, IPS, 1920x1080, 14" | |
|---|---|---|---|---|---|
| Display | -1% | -1% | 6% | 1% | |
| Display P3 Coverage (%) | 66.6 | 68.9 3% | 66 -1% | 71.8 8% | 67.1 1% |
| sRGB Coverage (%) | 96.8 | 91.6 -5% | 96.8 0% | 99.3 3% | 97.6 1% |
| AdobeRGB 1998 Coverage (%) | 67.6 | 67.1 -1% | 67.1 -1% | 72.4 7% | 68.5 1% |
| Response Times | -6% | 7% | 29% | -18% | |
| Response Time Grey 50% / Grey 80% * (ms) | 63.2 ? | 64.8 ? -3% | 58.4 ? 8% | 39.2 ? 38% | 61.6 ? 3% |
| Response Time Black / White * (ms) | 28 ? | 30.4 ? -9% | 26.4 ? 6% | 22.4 ? 20% | 38.8 ? -39% |
| PWM Frequency (Hz) | 2404 ? | ||||
| Screen | -33% | -4% | -30% | -4% | |
| Brightness middle (cd/m²) | 404 | 422 4% | 397 -2% | 388.6 -4% | 391 -3% |
| Brightness (cd/m²) | 397 | 395 -1% | 394 -1% | 365 -8% | 389 -2% |
| Brightness Distribution (%) | 92 | 90 -2% | 90 -2% | 82 -11% | 87 -5% |
| Black Level * (cd/m²) | 0.21 | 0.27 -29% | 0.2 5% | 0.35 -67% | 0.23 -10% |
| Contrast (:1) | 1924 | 1563 -19% | 1985 3% | 1110 -42% | 1700 -12% |
| Colorchecker dE 2000 * | 3.1 | 4.7 -52% | 3.6 -16% | 4.04 -30% | 3.4 -10% |
| Colorchecker dE 2000 max. * | 4.7 | 10 -113% | 5.9 -26% | 9.2 -96% | 4.7 -0% |
| Colorchecker dE 2000 calibrated * | 1.3 | 2 -54% | 1.2 8% | 1.25 4% | 1.1 15% |
| Greyscale dE 2000 * | 3.4 | 6.4 -88% | 3.9 -15% | 6.4 -88% | 4 -18% |
| Gamma | 2.38 92% | 2.12 104% | 2.48 89% | 2.3 96% | 2.49 88% |
| CCT | 7070 92% | 7106 91% | 7090 92% | 6957 93% | 6809 95% |
| Color Space (Percent of AdobeRGB 1998) (%) | 61.8 | 59.5 -4% | 61.4 -1% | 66.4 7% | 62.4 1% |
| Color Space (Percent of sRGB) (%) | 96.6 | 91.5 -5% | 96.6 0% | 99.4 3% | 97.4 1% |
| Moyenne finale (programmes/paramètres) | -13% /
-24% | 1% /
-2% | 2% /
-16% | -7% /
-5% |
* ... Moindre est la valeur, meilleures sont les performances
Temps de réponse de l'écran
| ↔ Temps de réponse noir à blanc | ||
|---|---|---|
| 28 ms ... hausse ↗ et chute ↘ combinées | ↗ 12.4 ms hausse | 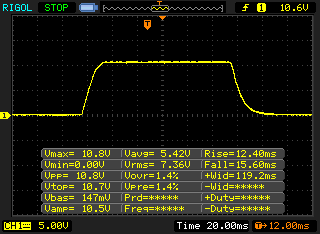 |
| ↘ 15.6 ms chute | ||
| L'écran souffre de latences relativement élevées, insuffisant pour le jeu. En comparaison, tous les appareils testés affichent entre 0.1 (minimum) et 240 (maximum) ms. » 71 % des appareils testés affichent de meilleures performances. Cela signifie que les latences relevées sont moins bonnes que la moyenne (19.9 ms) de tous les appareils testés. | ||
| ↔ Temps de réponse gris 50% à gris 80% | ||
| 63.2 ms ... hausse ↗ et chute ↘ combinées | ↗ 31.6 ms hausse | 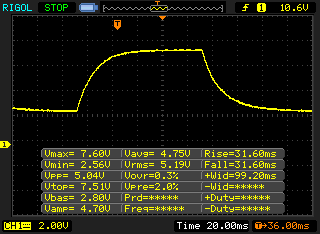 |
| ↘ 31.6 ms chute | ||
| L'écran souffre de latences très élevées, à éviter pour le jeu. En comparaison, tous les appareils testés affichent entre 0.165 (minimum) et 636 (maximum) ms. » 97 % des appareils testés affichent de meilleures performances. Cela signifie que les latences relevées sont moins bonnes que la moyenne (31.1 ms) de tous les appareils testés. | ||
Scintillement / MLI (Modulation de largeur d'impulsion)
| Scintillement / MLI (Modulation de largeur d'impulsion) non décelé | 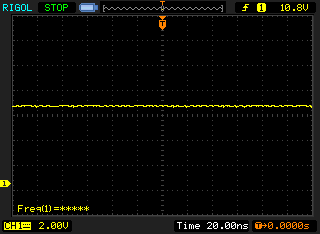 | ||
En comparaison, 52 % des appareils testés n'emploient pas MDI pour assombrir leur écran. Nous avons relevé une moyenne à 7784 (minimum : 5 - maximum : 343500) Hz dans le cas où une MDI était active. | |||
Cinebench R15: CPU Single 64Bit | CPU Multi 64Bit
Blender: v2.79 BMW27 CPU
7-Zip 18.03: 7z b 4 -mmt1 | 7z b 4
Geekbench 5.5: Single-Core | Multi-Core
HWBOT x265 Benchmark v2.2: 4k Preset
LibreOffice : 20 Documents To PDF
R Benchmark 2.5: Overall mean
| Cinebench R20 / CPU (Single Core) | |
| Moyenne de la classe Office (345 - 816, n=73, 2 dernières années) | |
| Lenovo ThinkPad T14s-20UJS00K00 | |
| Lenovo ThinkPad X1 Carbon 2020-20UAS04T00 | |
| Lenovo ThinkPad T14-20S1S06B00 | |
| Lenovo ThinkPad T14s-20T00044GE | |
| Moyenne Intel Core i5-10210U (322 - 428, n=30) | |
| Lenovo ThinkPad T490s-20NYS02A00 | |
| Dell Latitude 7410 | |
| Cinebench R20 / CPU (Multi Core) | |
| Moyenne de la classe Office (648 - 8840, n=73, 2 dernières années) | |
| Lenovo ThinkPad T14s-20UJS00K00 | |
| Lenovo ThinkPad T490s-20NYS02A00 | |
| Lenovo ThinkPad T14-20S1S06B00 | |
| Lenovo ThinkPad X1 Carbon 2020-20UAS04T00 | |
| Lenovo ThinkPad T14s-20T00044GE | |
| Moyenne Intel Core i5-10210U (722 - 1820, n=30) | |
| Dell Latitude 7410 | |
| Cinebench R15 / CPU Single 64Bit | |
| Moyenne de la classe Office (99.5 - 312, n=75, 2 dernières années) | |
| Lenovo ThinkPad X1 Carbon 2020-20UAS04T00 | |
| Lenovo ThinkPad T14s-20UJS00K00 | |
| Dell Latitude 7410 | |
| Lenovo ThinkPad T14-20S1S06B00 | |
| Moyenne Intel Core i5-10210U (134 - 174, n=35) | |
| Lenovo ThinkPad T14s-20T00044GE | |
| Lenovo ThinkPad T490s-20NYS02A00 | |
| Cinebench R15 / CPU Multi 64Bit | |
| Moyenne de la classe Office (250 - 3380, n=75, 2 dernières années) | |
| Lenovo ThinkPad T14s-20UJS00K00 | |
| Lenovo ThinkPad X1 Carbon 2020-20UAS04T00 | |
| Lenovo ThinkPad T14-20S1S06B00 | |
| Lenovo ThinkPad T490s-20NYS02A00 | |
| Lenovo ThinkPad T14s-20T00044GE | |
| Moyenne Intel Core i5-10210U (320 - 790, n=35) | |
| Dell Latitude 7410 | |
| Blender / v2.79 BMW27 CPU | |
| Moyenne Intel Core i5-10210U (585 - 1339, n=24) | |
| Lenovo ThinkPad T14-20S1S06B00 | |
| Dell Latitude 7410 | |
| Lenovo ThinkPad T14s-20T00044GE | |
| Lenovo ThinkPad T490s-20NYS02A00 | |
| Lenovo ThinkPad X1 Carbon 2020-20UAS04T00 | |
| Lenovo ThinkPad T14s-20UJS00K00 | |
| Moyenne de la classe Office (158 - 1940, n=74, 2 dernières années) | |
| 7-Zip 18.03 / 7z b 4 -mmt1 | |
| Moyenne de la classe Office (3387 - 6469, n=75, 2 dernières années) | |
| Dell Latitude 7410 | |
| Lenovo ThinkPad X1 Carbon 2020-20UAS04T00 | |
| Lenovo ThinkPad T14s-20UJS00K00 | |
| Lenovo ThinkPad T14-20S1S06B00 | |
| Lenovo ThinkPad T14s-20T00044GE | |
| Moyenne Intel Core i5-10210U (3504 - 4467, n=24) | |
| Lenovo ThinkPad T490s-20NYS02A00 | |
| 7-Zip 18.03 / 7z b 4 | |
| Moyenne de la classe Office (7098 - 76886, n=75, 2 dernières années) | |
| Lenovo ThinkPad T14s-20UJS00K00 | |
| Lenovo ThinkPad T490s-20NYS02A00 | |
| Lenovo ThinkPad X1 Carbon 2020-20UAS04T00 | |
| Lenovo ThinkPad T14-20S1S06B00 | |
| Lenovo ThinkPad T14s-20T00044GE | |
| Dell Latitude 7410 | |
| Moyenne Intel Core i5-10210U (10920 - 21679, n=24) | |
| Geekbench 5.5 / Single-Core | |
| Moyenne de la classe Office (811 - 2128, n=71, 2 dernières années) | |
| Dell Latitude 7410 | |
| Lenovo ThinkPad X1 Carbon 2020-20UAS04T00 | |
| Lenovo ThinkPad T14s-20UJS00K00 | |
| Lenovo ThinkPad T14s-20T00044GE | |
| Moyenne Intel Core i5-10210U (949 - 1133, n=27) | |
| Lenovo ThinkPad T14-20S1S06B00 | |
| Geekbench 5.5 / Multi-Core | |
| Moyenne de la classe Office (1483 - 16999, n=71, 2 dernières années) | |
| Lenovo ThinkPad T14s-20UJS00K00 | |
| Lenovo ThinkPad X1 Carbon 2020-20UAS04T00 | |
| Lenovo ThinkPad T14s-20T00044GE | |
| Dell Latitude 7410 | |
| Moyenne Intel Core i5-10210U (2079 - 4256, n=27) | |
| Lenovo ThinkPad T14-20S1S06B00 | |
| HWBOT x265 Benchmark v2.2 / 4k Preset | |
| Moyenne de la classe Office (2.21 - 26, n=74, 2 dernières années) | |
| Lenovo ThinkPad T14s-20UJS00K00 | |
| Lenovo ThinkPad X1 Carbon 2020-20UAS04T00 | |
| Lenovo ThinkPad T490s-20NYS02A00 | |
| Lenovo ThinkPad T14s-20T00044GE | |
| Dell Latitude 7410 | |
| Lenovo ThinkPad T14-20S1S06B00 | |
| Moyenne Intel Core i5-10210U (2.36 - 6.28, n=24) | |
| LibreOffice / 20 Documents To PDF | |
| Moyenne Intel Core i5-10210U (49.6 - 80.3, n=18) | |
| Lenovo ThinkPad T14s-20UJS00K00 | |
| Lenovo ThinkPad T14-20S1S06B00 | |
| Moyenne de la classe Office (39.9 - 102.3, n=74, 2 dernières années) | |
| Dell Latitude 7410 | |
| Lenovo ThinkPad T14s-20T00044GE | |
| Lenovo ThinkPad X1 Carbon 2020-20UAS04T00 | |
| R Benchmark 2.5 / Overall mean | |
| Moyenne Intel Core i5-10210U (0.658 - 0.901, n=24) | |
| Lenovo ThinkPad T14s-20T00044GE | |
| Lenovo ThinkPad T14-20S1S06B00 | |
| Lenovo ThinkPad X1 Carbon 2020-20UAS04T00 | |
| Dell Latitude 7410 | |
| Lenovo ThinkPad T14s-20UJS00K00 | |
| Moyenne de la classe Office (0.4098 - 0.888, n=74, 2 dernières années) | |
* ... Moindre est la valeur, meilleures sont les performances
| PCMark 8 Home Score Accelerated v2 | 3673 points | |
| PCMark 8 Work Score Accelerated v2 | 5032 points | |
| PCMark 10 Score | 3929 points | |
Aide | ||
| DPC Latencies / LatencyMon - interrupt to process latency (max), Web, Youtube, Prime95 | |
| Lenovo ThinkPad T14s-20T00044GE | |
* ... Moindre est la valeur, meilleures sont les performances
| Lenovo ThinkPad T14s-20T00044GE Samsung SSD PM981a MZVLB256HBHQ | Lenovo ThinkPad X1 Carbon 2020-20UAS04T00 Samsung SSD PM981a MZVLB512HBJQ | Lenovo ThinkPad T14-20S1S06B00 Lite-On CA5-8D512 | Dell Latitude 7410 Toshiba XG6 KXG60ZNV512G | Lenovo ThinkPad T490s-20NYS02A00 Intel SSD Pro 7600p SSDPEKKF512G8L | Moyenne Samsung SSD PM981a MZVLB256HBHQ | |
|---|---|---|---|---|---|---|
| CrystalDiskMark 5.2 / 6 | 23% | 5% | 10% | -7% | 8% | |
| Write 4K (MB/s) | 117.5 | 185 57% | 114.1 -3% | 133.4 14% | 122 4% | 135.2 ? 15% |
| Read 4K (MB/s) | 40.81 | 50.6 24% | 53.6 31% | 51.3 26% | 45.56 12% | 44.6 ? 9% |
| Write Seq (MB/s) | 2031 | 1543 -24% | 1743 -14% | 1897 -7% | 1497 -26% | 2091 ? 3% |
| Read Seq (MB/s) | 1970 | 1509 -23% | 2092 6% | 2202 12% | 2385 21% | 2097 ? 6% |
| Write 4K Q32T1 (MB/s) | 395.5 | 488.8 24% | 394.8 0% | 384.9 -3% | 240.9 -39% | 370 ? -6% |
| Read 4K Q32T1 (MB/s) | 361.4 | 579 60% | 372.6 3% | 318.7 -12% | 338 -6% | 372 ? 3% |
| Write Seq Q32T1 (MB/s) | 2330 | 2986 28% | 2176 -7% | 2866 23% | 1528 -34% | 2308 ? -1% |
| Read Seq Q32T1 (MB/s) | 2530 | 3555 41% | 3204 27% | 3122 23% | 2915 15% | 3395 ? 34% |

Continuous Read Speed: DiskSpd Read Loop, Queue Depth 8
| 3DMark 11 Performance | 2056 points | |
| 3DMark Cloud Gate Standard Score | 8720 points | |
| 3DMark Fire Strike Score | 1122 points | |
| 3DMark Time Spy Score | 461 points | |
Aide | ||
| Bas | Moyen | Élevé | Ultra | |
|---|---|---|---|---|
| The Witcher 3 (2015) | 16.8 | |||
| Dota 2 Reborn (2015) | 80.5 | 46.9 | 21.5 | 18.9 |
| X-Plane 11.11 (2018) | 23.1 | 15.5 | 13.7 | |
| Shadow of the Tomb Raider (2018) | 16.6 | |||
| Total War: Three Kingdoms (2019) | 27.4 |
Degré de la nuisance sonore
| Au repos |
| 29.3 / 29.3 / 29.3 dB(A) |
| Fortement sollicité |
| 30 / 30 dB(A) |
 | ||
30 dB silencieux 40 dB(A) audible 50 dB(A) bruyant |
||
min: | ||
(-) La température maximale du côté supérieur est de 47.1 °C / 117 F, par rapport à la moyenne de 34.3 °C / 94 F, allant de 21.2 à 62.5 °C pour la classe Office.
(-) Le fond chauffe jusqu'à un maximum de 45.7 °C / 114 F, contre une moyenne de 36.8 °C / 98 F
(+) En utilisation inactive, la température moyenne du côté supérieur est de 24.2 °C / 76 F, par rapport à la moyenne du dispositif de 29.5 °C / 85 F.
(+) Les repose-poignets et le pavé tactile atteignent la température maximale de la peau (32.6 °C / 90.7 F) et ne sont donc pas chauds.
(-) La température moyenne de la zone de l'appui-paume de dispositifs similaires était de 27.5 °C / 81.5 F (-5.1 °C / #-9.2 F).
Lenovo ThinkPad T14s-20T00044GE analyse audio
(±) | le niveau sonore du haut-parleur est moyen mais bon (73.7# dB)
Basses 100 - 315 Hz
(±) | basse réduite - en moyenne 12.3% inférieure à la médiane
(±) | la linéarité des basses est moyenne (10.5% delta à la fréquence précédente)
Médiums 400 - 2000 Hz
(±) | médiane supérieure - en moyenne 8.3% supérieure à la médiane
(+) | les médiums sont linéaires (5.3% delta à la fréquence précédente)
Aiguës 2 - 16 kHz
(+) | des sommets équilibrés - à seulement 4.9% de la médiane
(±) | la linéarité des aigus est moyenne (9.8% delta à la fréquence précédente)
Globalement 100 - 16 000 Hz
(±) | la linéarité du son global est moyenne (27.7% de différence avec la médiane)
Par rapport à la même classe
» 86% de tous les appareils testés de cette catégorie étaient meilleurs, 4% similaires, 10% pires
» Le meilleur avait un delta de 7%, la moyenne était de 21%, le pire était de 53%.
Par rapport à tous les appareils testés
» 84% de tous les appareils testés étaient meilleurs, 3% similaires, 13% pires
» Le meilleur avait un delta de 4%, la moyenne était de 24%, le pire était de 134%.
Lenovo ThinkPad T490s-20NYS02A00 analyse audio
(-) | haut-parleurs pas très forts (70.2 dB)
Basses 100 - 315 Hz
(-) | presque aucune basse - en moyenne 19.1% plus bas que la médiane
(±) | la linéarité des basses est moyenne (10% delta à la fréquence précédente)
Médiums 400 - 2000 Hz
(±) | médiane supérieure - en moyenne 5.2% supérieure à la médiane
(+) | les médiums sont linéaires (6.5% delta à la fréquence précédente)
Aiguës 2 - 16 kHz
(+) | des sommets équilibrés - à seulement 2.5% de la médiane
(+) | les aigus sont linéaires (6.3% delta à la fréquence précédente)
Globalement 100 - 16 000 Hz
(±) | la linéarité du son global est moyenne (27% de différence avec la médiane)
Par rapport à la même classe
» 83% de tous les appareils testés de cette catégorie étaient meilleurs, 6% similaires, 11% pires
» Le meilleur avait un delta de 7%, la moyenne était de 21%, le pire était de 53%.
Par rapport à tous les appareils testés
» 83% de tous les appareils testés étaient meilleurs, 4% similaires, 14% pires
» Le meilleur avait un delta de 4%, la moyenne était de 24%, le pire était de 134%.
Lenovo ThinkPad X1 Carbon 2019-20QE000VGE analyse audio
(±) | le niveau sonore du haut-parleur est moyen mais bon (76.8# dB)
Basses 100 - 315 Hz
(±) | basse réduite - en moyenne 11.2% inférieure à la médiane
(±) | la linéarité des basses est moyenne (7.1% delta à la fréquence précédente)
Médiums 400 - 2000 Hz
(±) | médiane supérieure - en moyenne 5.1% supérieure à la médiane
(+) | les médiums sont linéaires (5.4% delta à la fréquence précédente)
Aiguës 2 - 16 kHz
(+) | des sommets équilibrés - à seulement 2.9% de la médiane
(±) | la linéarité des aigus est moyenne (9.1% delta à la fréquence précédente)
Globalement 100 - 16 000 Hz
(±) | la linéarité du son global est moyenne (16.7% de différence avec la médiane)
Par rapport à la même classe
» 21% de tous les appareils testés de cette catégorie étaient meilleurs, 8% similaires, 71% pires
» Le meilleur avait un delta de 7%, la moyenne était de 21%, le pire était de 53%.
Par rapport à tous les appareils testés
» 29% de tous les appareils testés étaient meilleurs, 7% similaires, 64% pires
» Le meilleur avait un delta de 4%, la moyenne était de 24%, le pire était de 134%.
| Éteint/en veille | |
| Au repos | |
| Fortement sollicité |
|
Légende:
min: | |
| Lenovo ThinkPad T14s-20T00044GE i5-10210U, UHD Graphics 620, Samsung SSD PM981a MZVLB256HBHQ, LTPS AHVA-IPS LED, 1920x1080, 14" | Lenovo ThinkPad X1 Carbon 2020-20UAS04T00 i7-10510U, UHD Graphics 620, Samsung SSD PM981a MZVLB512HBJQ, IPS, 1920x1080, 14" | Lenovo ThinkPad T14-20S1S06B00 i5-10210U, UHD Graphics 620, Lite-On CA5-8D512, LTPS IPS LED, 1920x1080, 14" | Dell Latitude 7410 i7-10610U, UHD Graphics 620, Toshiba XG6 KXG60ZNV512G, IPS, 3840x2160, 14" | Lenovo ThinkPad T490s-20NYS02A00 i5-8265U, UHD Graphics 620, Intel SSD Pro 7600p SSDPEKKF512G8L, IPS, 1920x1080, 14" | Moyenne Intel UHD Graphics 620 | Moyenne de la classe Office | |
|---|---|---|---|---|---|---|---|
| Power Consumption | -20% | -30% | -23% | -12% | -19% | -36% | |
| Idle Minimum * (Watt) | 2.6 | 2.96 -14% | 3.2 -23% | 3.7 -42% | 2.62 -1% | 3.81 ? -47% | 4.41 ? -70% |
| Idle Average * (Watt) | 5.5 | 5.9 -7% | 6.1 -11% | 6.2 -13% | 5.16 6% | 6.94 ? -26% | 7.37 ? -34% |
| Idle Maximum * (Watt) | 7.5 | 9.1 -21% | 10.4 -39% | 7 7% | 8.7 -16% | 8.75 ? -17% | 8.58 ? -14% |
| Load Average * (Watt) | 28.2 | 42.1 -49% | 45.6 -62% | 43.2 -53% | 40 -42% | 35 ? -24% | 43 ? -52% |
| Load Maximum * (Watt) | 59.6 | 65.1 -9% | 68.6 -15% | 68.6 -15% | 64 -7% | 47.5 ? 20% | 64.6 ? -8% |
* ... Moindre est la valeur, meilleures sont les performances
| Lenovo ThinkPad T14s-20T00044GE i5-10210U, UHD Graphics 620, 57 Wh | Lenovo ThinkPad X1 Carbon 2020-20UAS04T00 i7-10510U, UHD Graphics 620, 51 Wh | Lenovo ThinkPad T14-20S1S06B00 i5-10210U, UHD Graphics 620, 50 Wh | Dell Latitude 7410 i7-10610U, UHD Graphics 620, 68 Wh | Lenovo ThinkPad T490s-20NYS02A00 i5-8265U, UHD Graphics 620, 57 Wh | Moyenne de la classe Office | |
|---|---|---|---|---|---|---|
| Autonomie de la batterie | -14% | -23% | 27% | -9% | 2% | |
| H.264 (h) | 14.7 | 12.8 -13% | 10.4 -29% | 13.9 -5% | 15 ? 2% | |
| WiFi v1.3 (h) | 13.2 | 10.1 -23% | 11 -17% | 11 -17% | 10.1 -23% | 12.9 ? -2% |
| Load (h) | 1.7 | 1.6 -6% | 1.3 -24% | 2.9 71% | 1.7 0% | 1.794 ? 6% |
Points positifs
Points négatifs
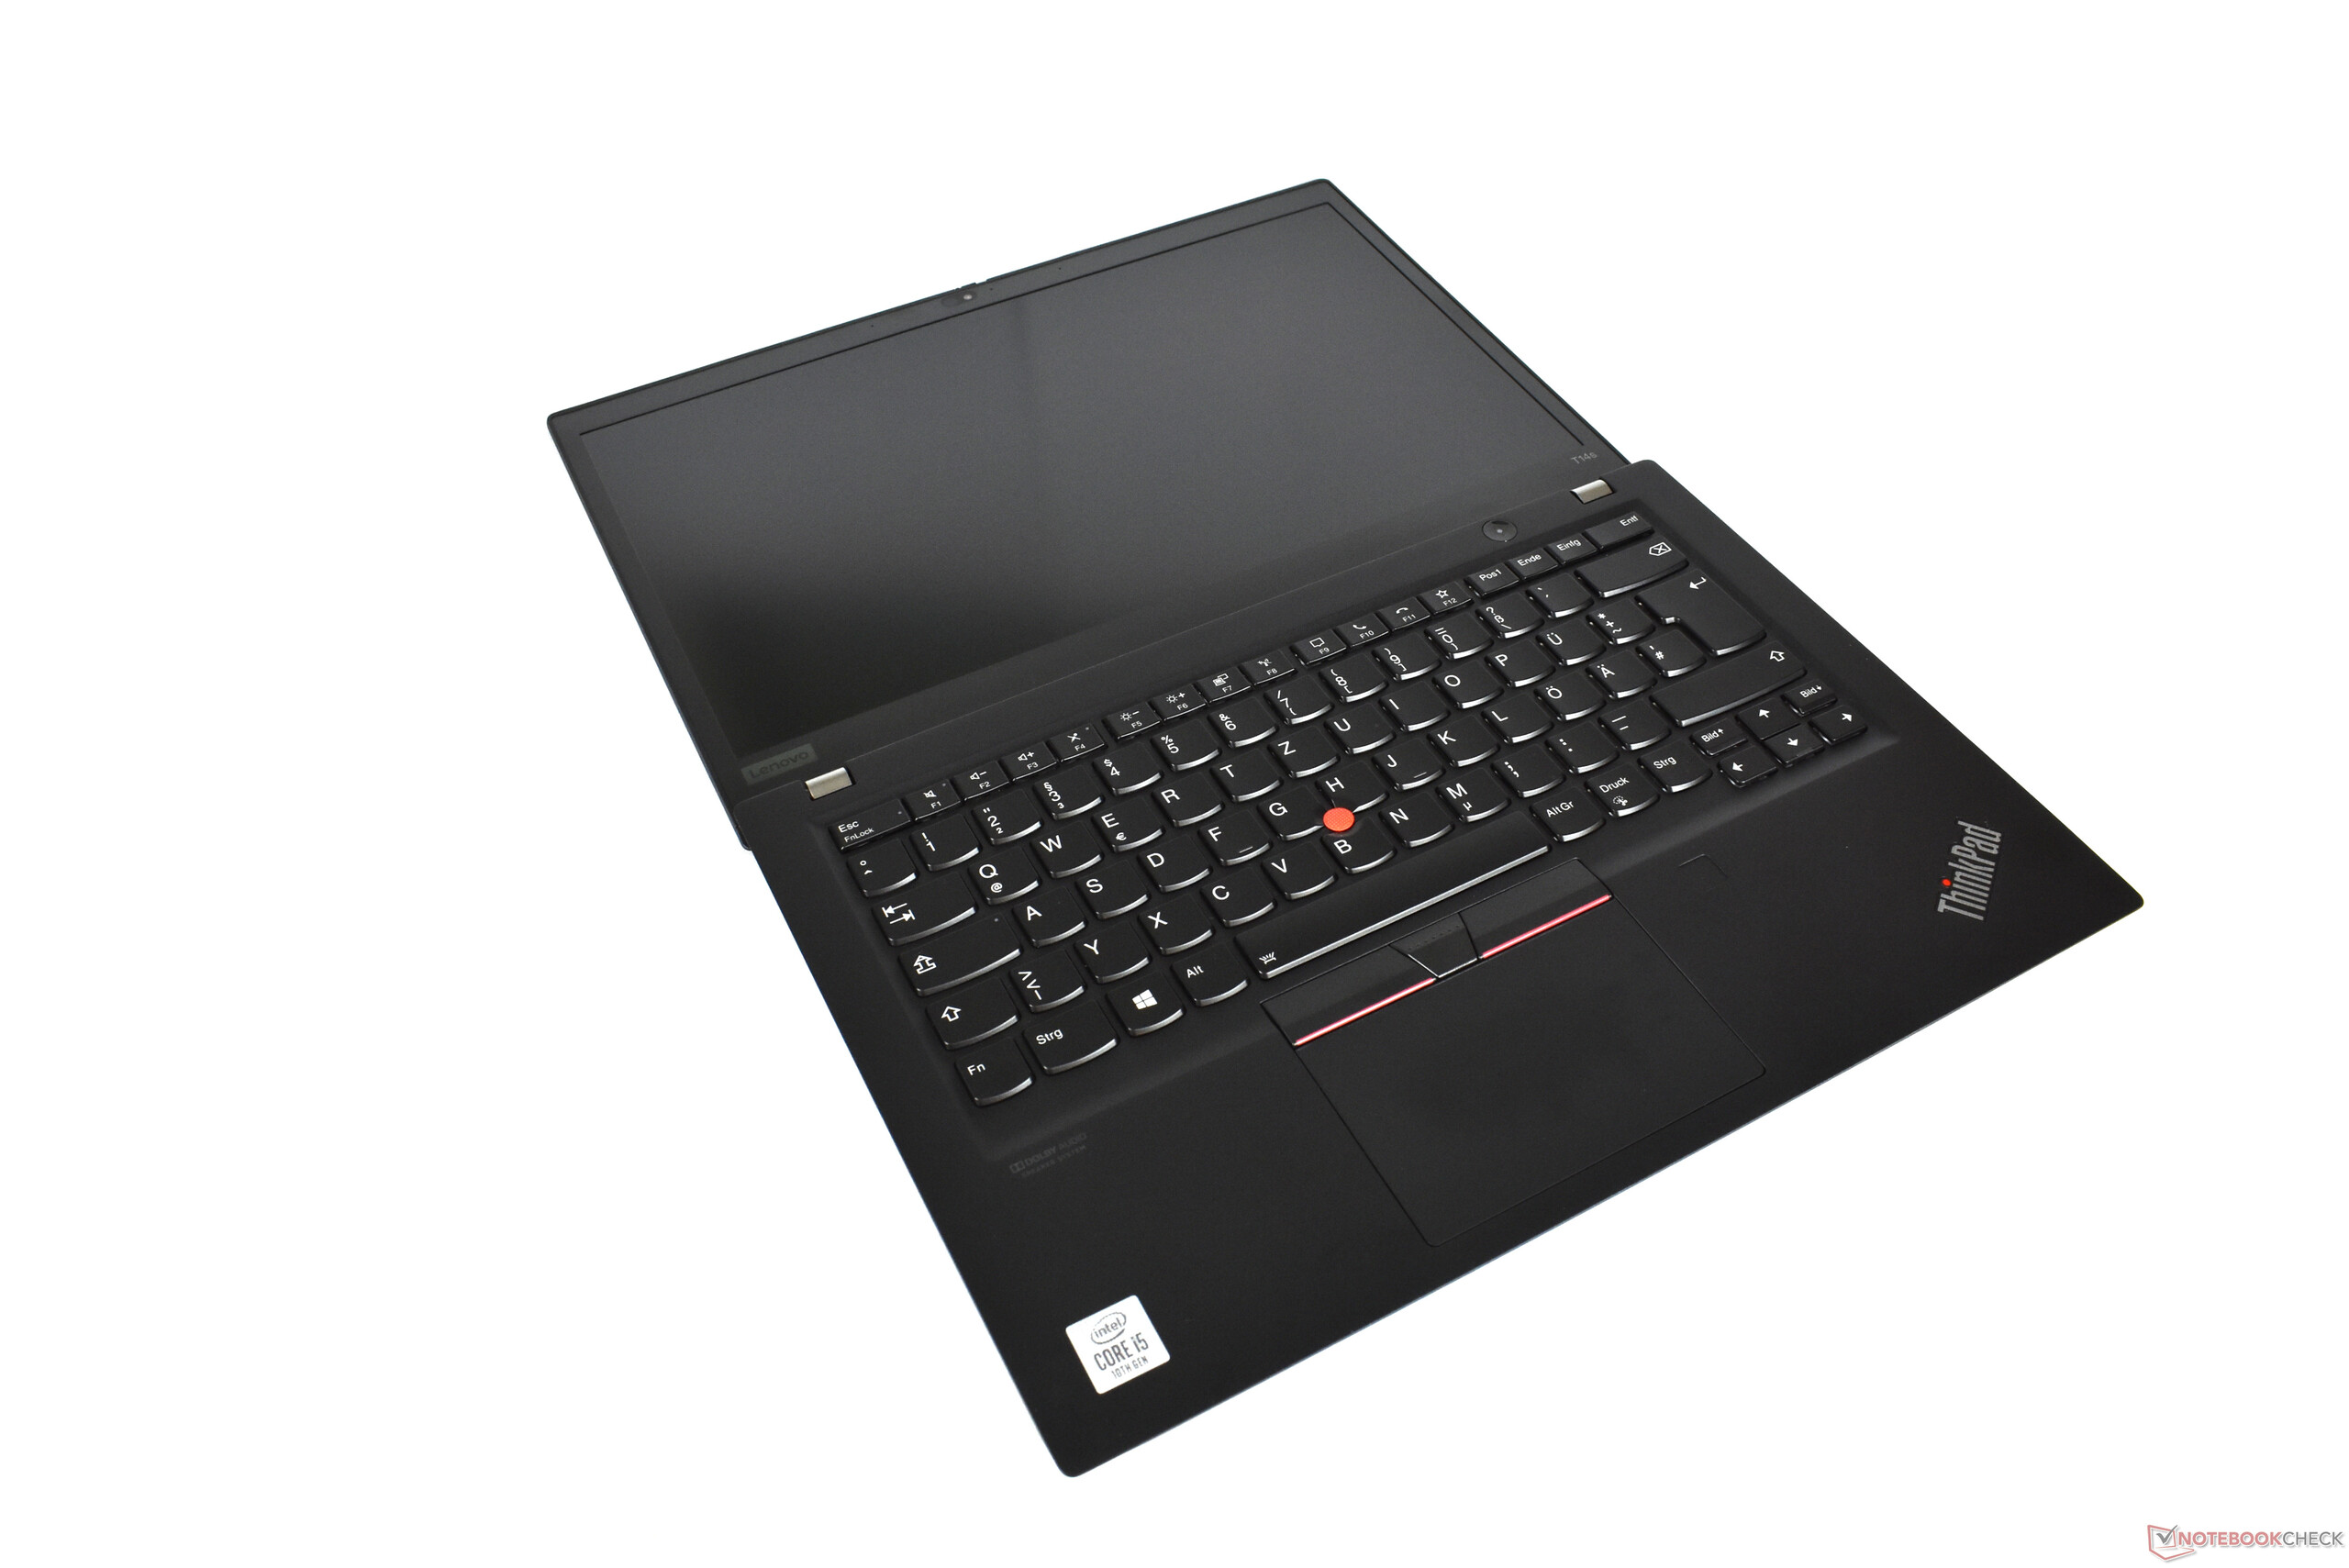
Le Lenovo ThinkPad T14 s Gen 1 est une petite mise à jour du Lenovo ThinkPad T490s de l'an dernier, en tout cas dans sa version Intel.
A la différence des T490s et T495s de l'an dernier, les modèles AMD sont cette année bien plus puissants. Les puces AMD font mieux de plus du double dans les tests multicœur. Les modèles proposent pour leur part des écrans 4K et des ports Thunderbolt 3.
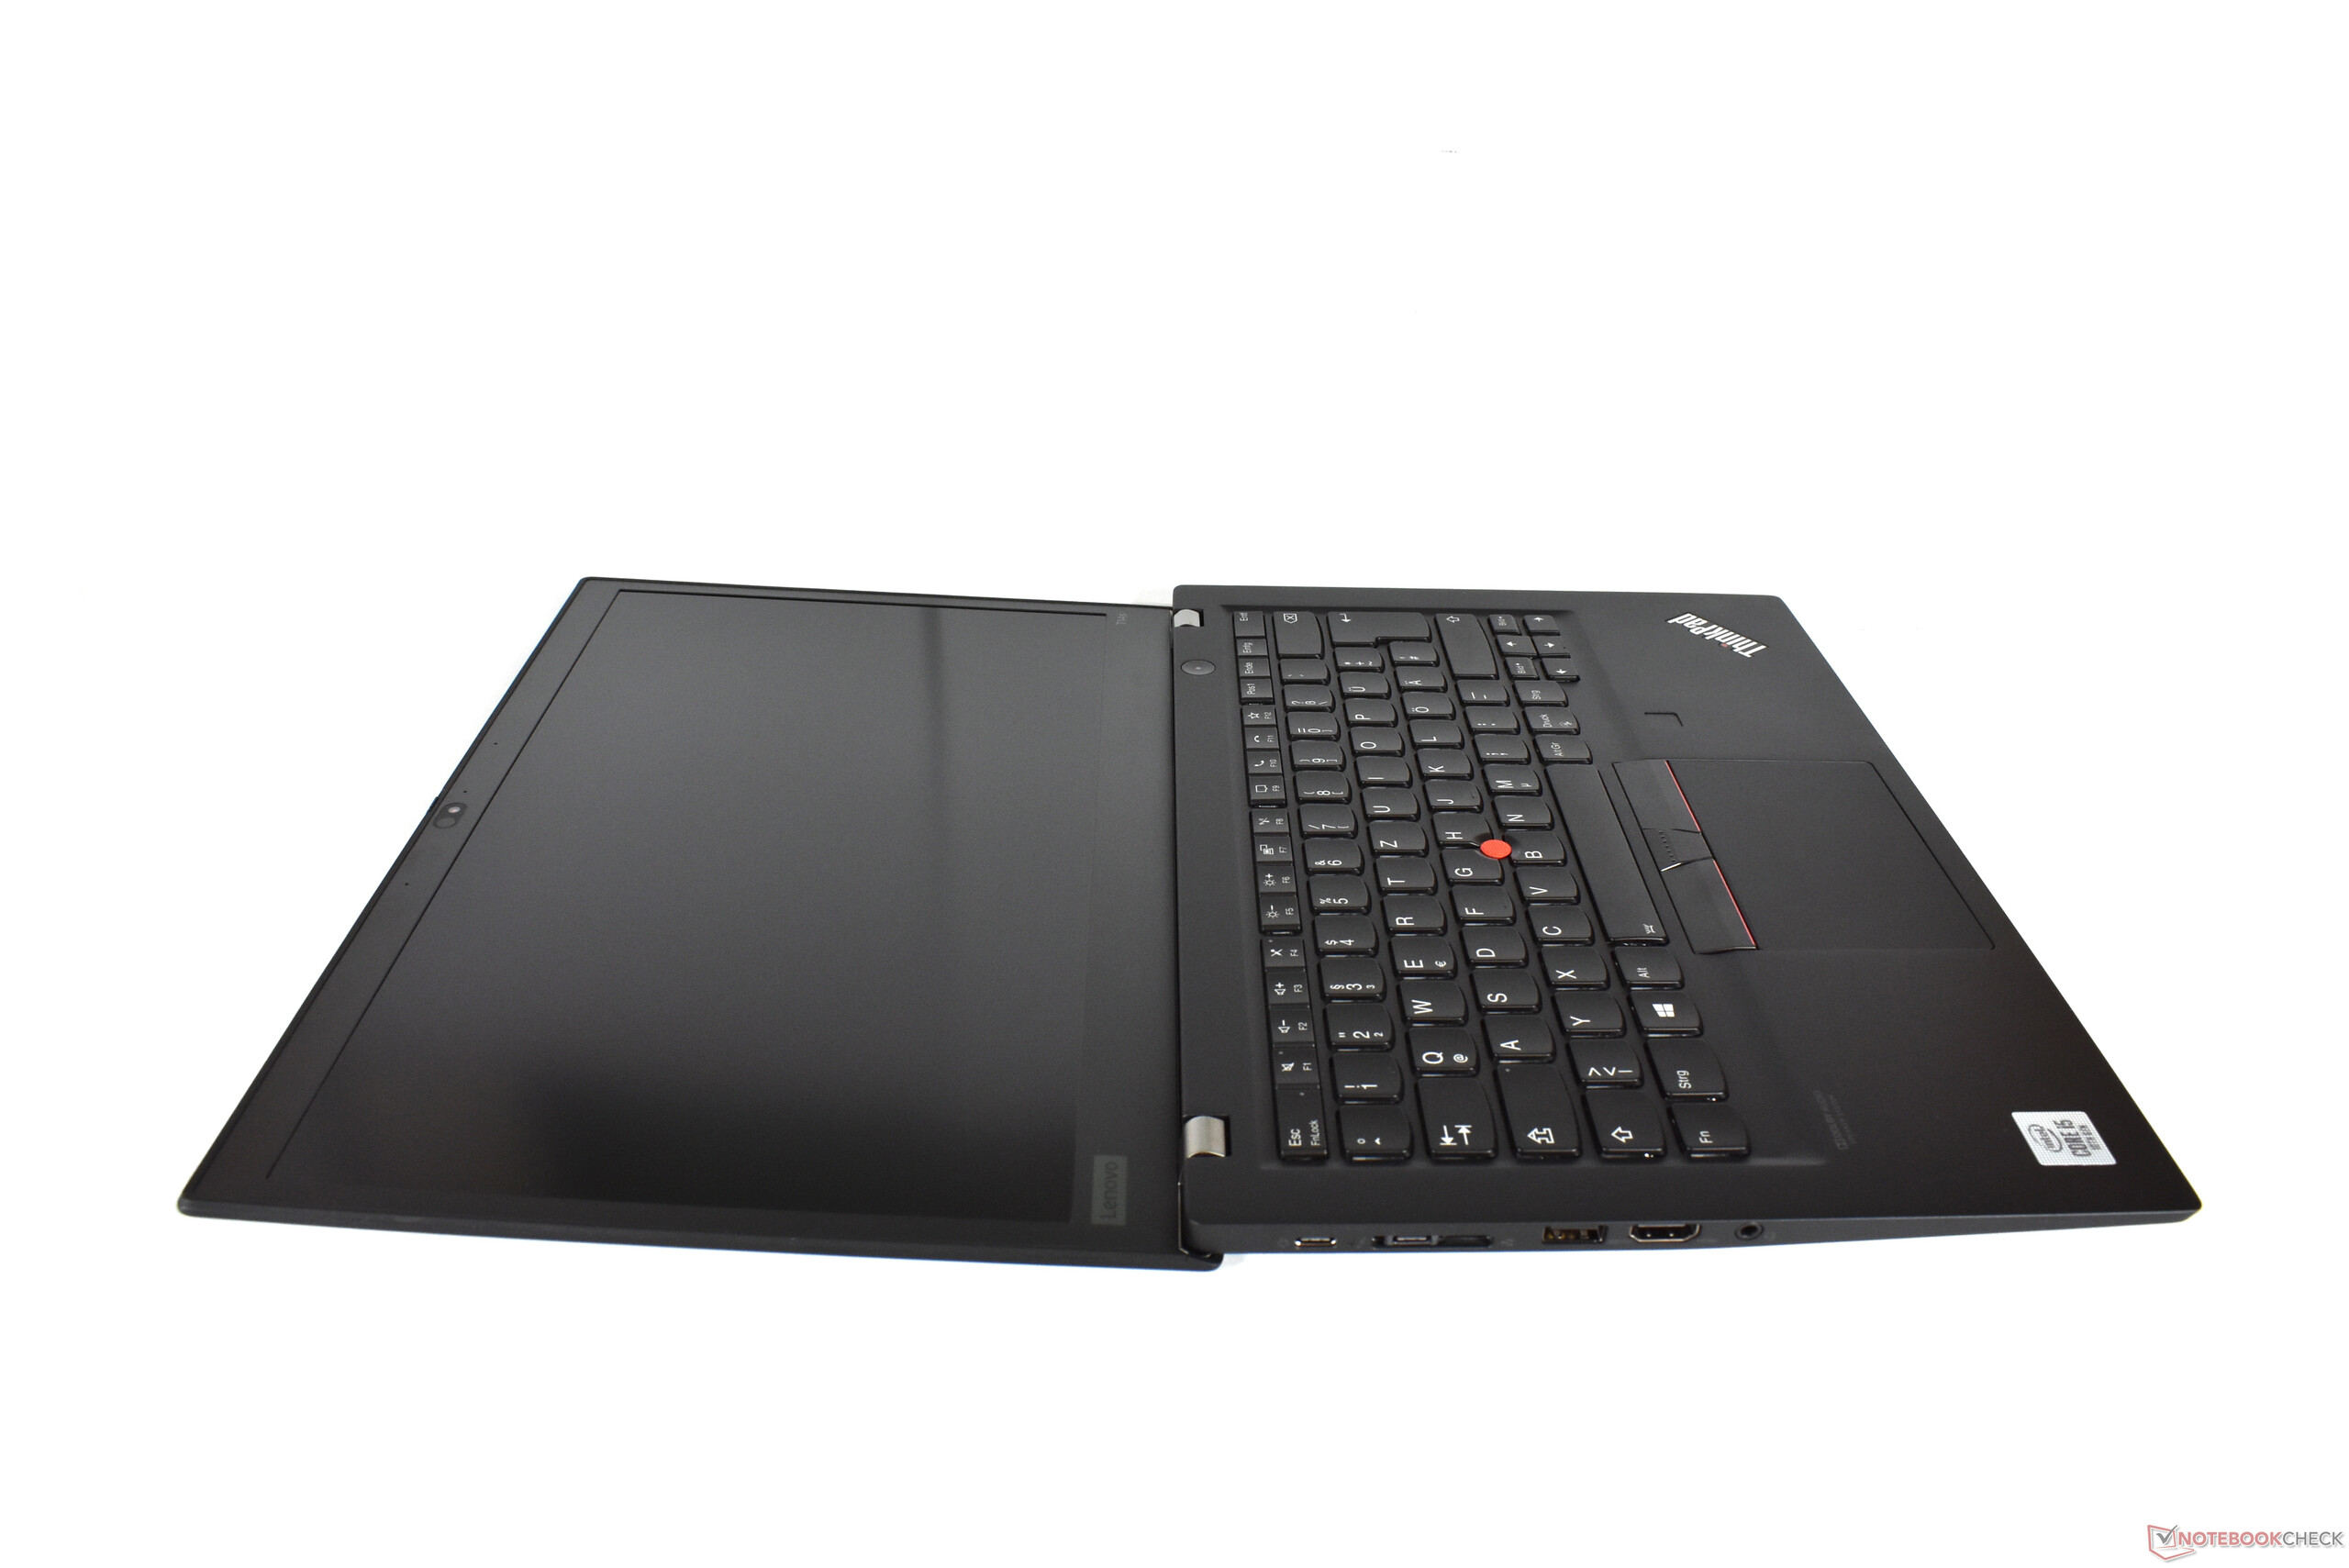
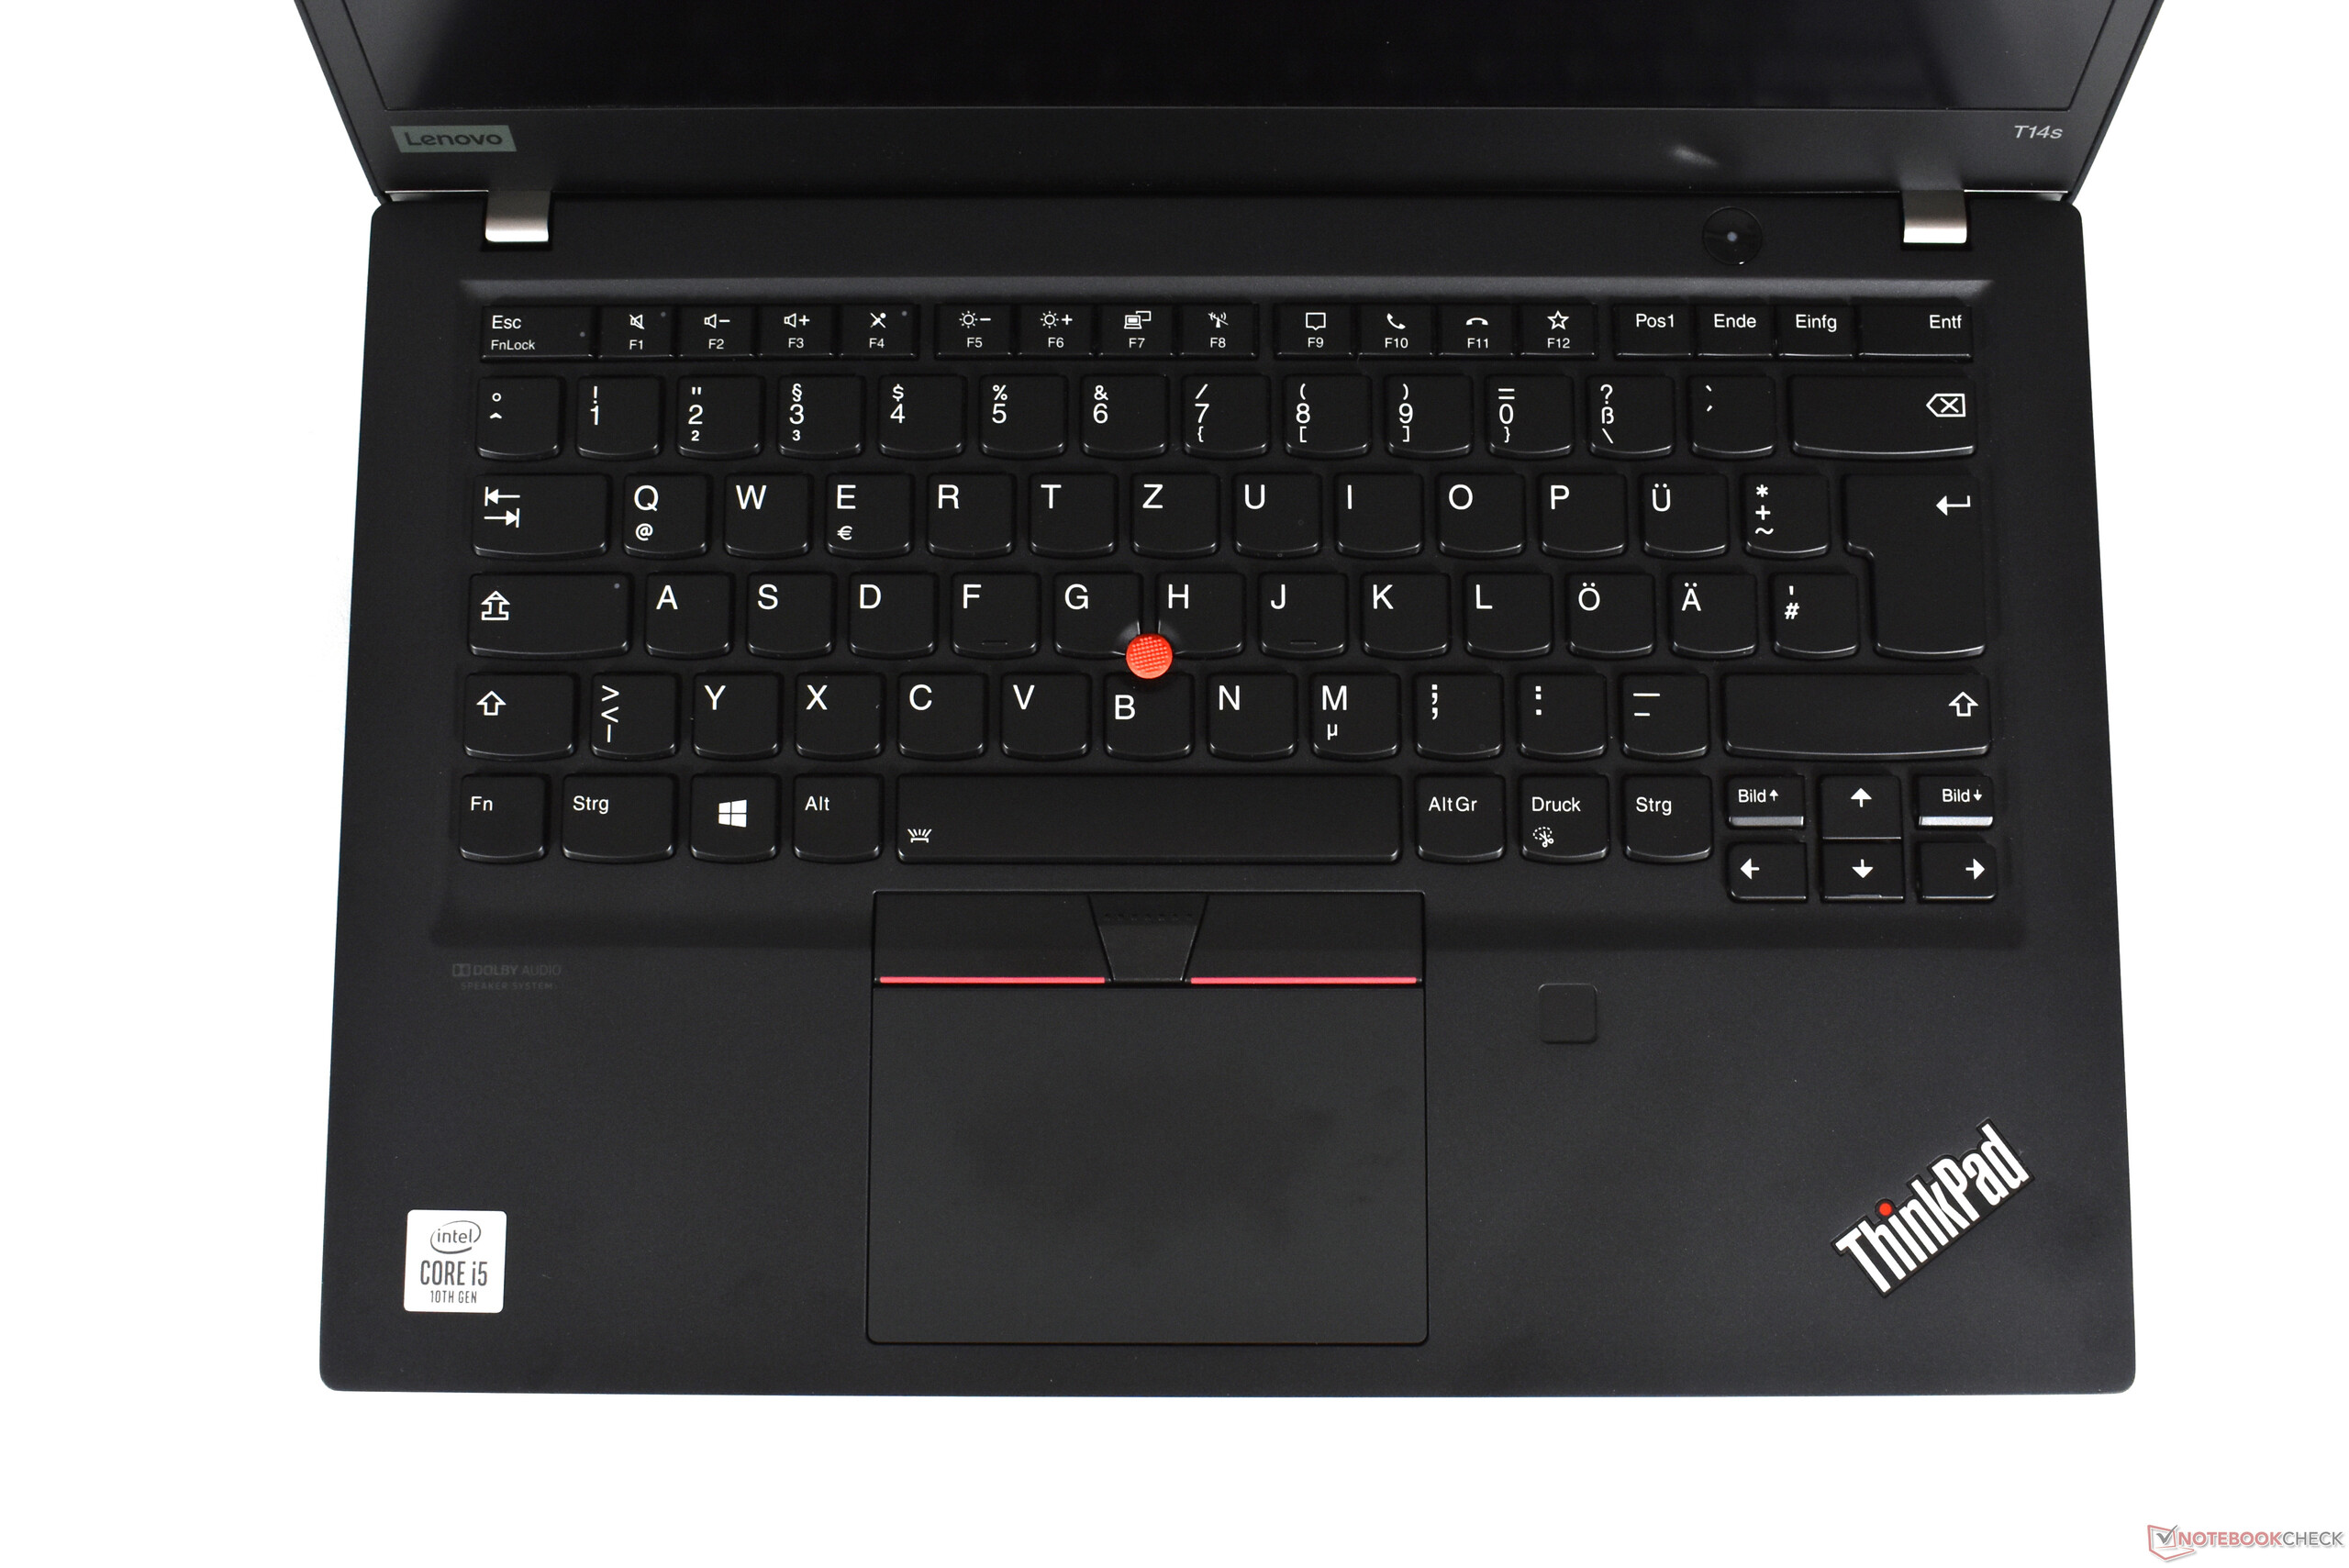
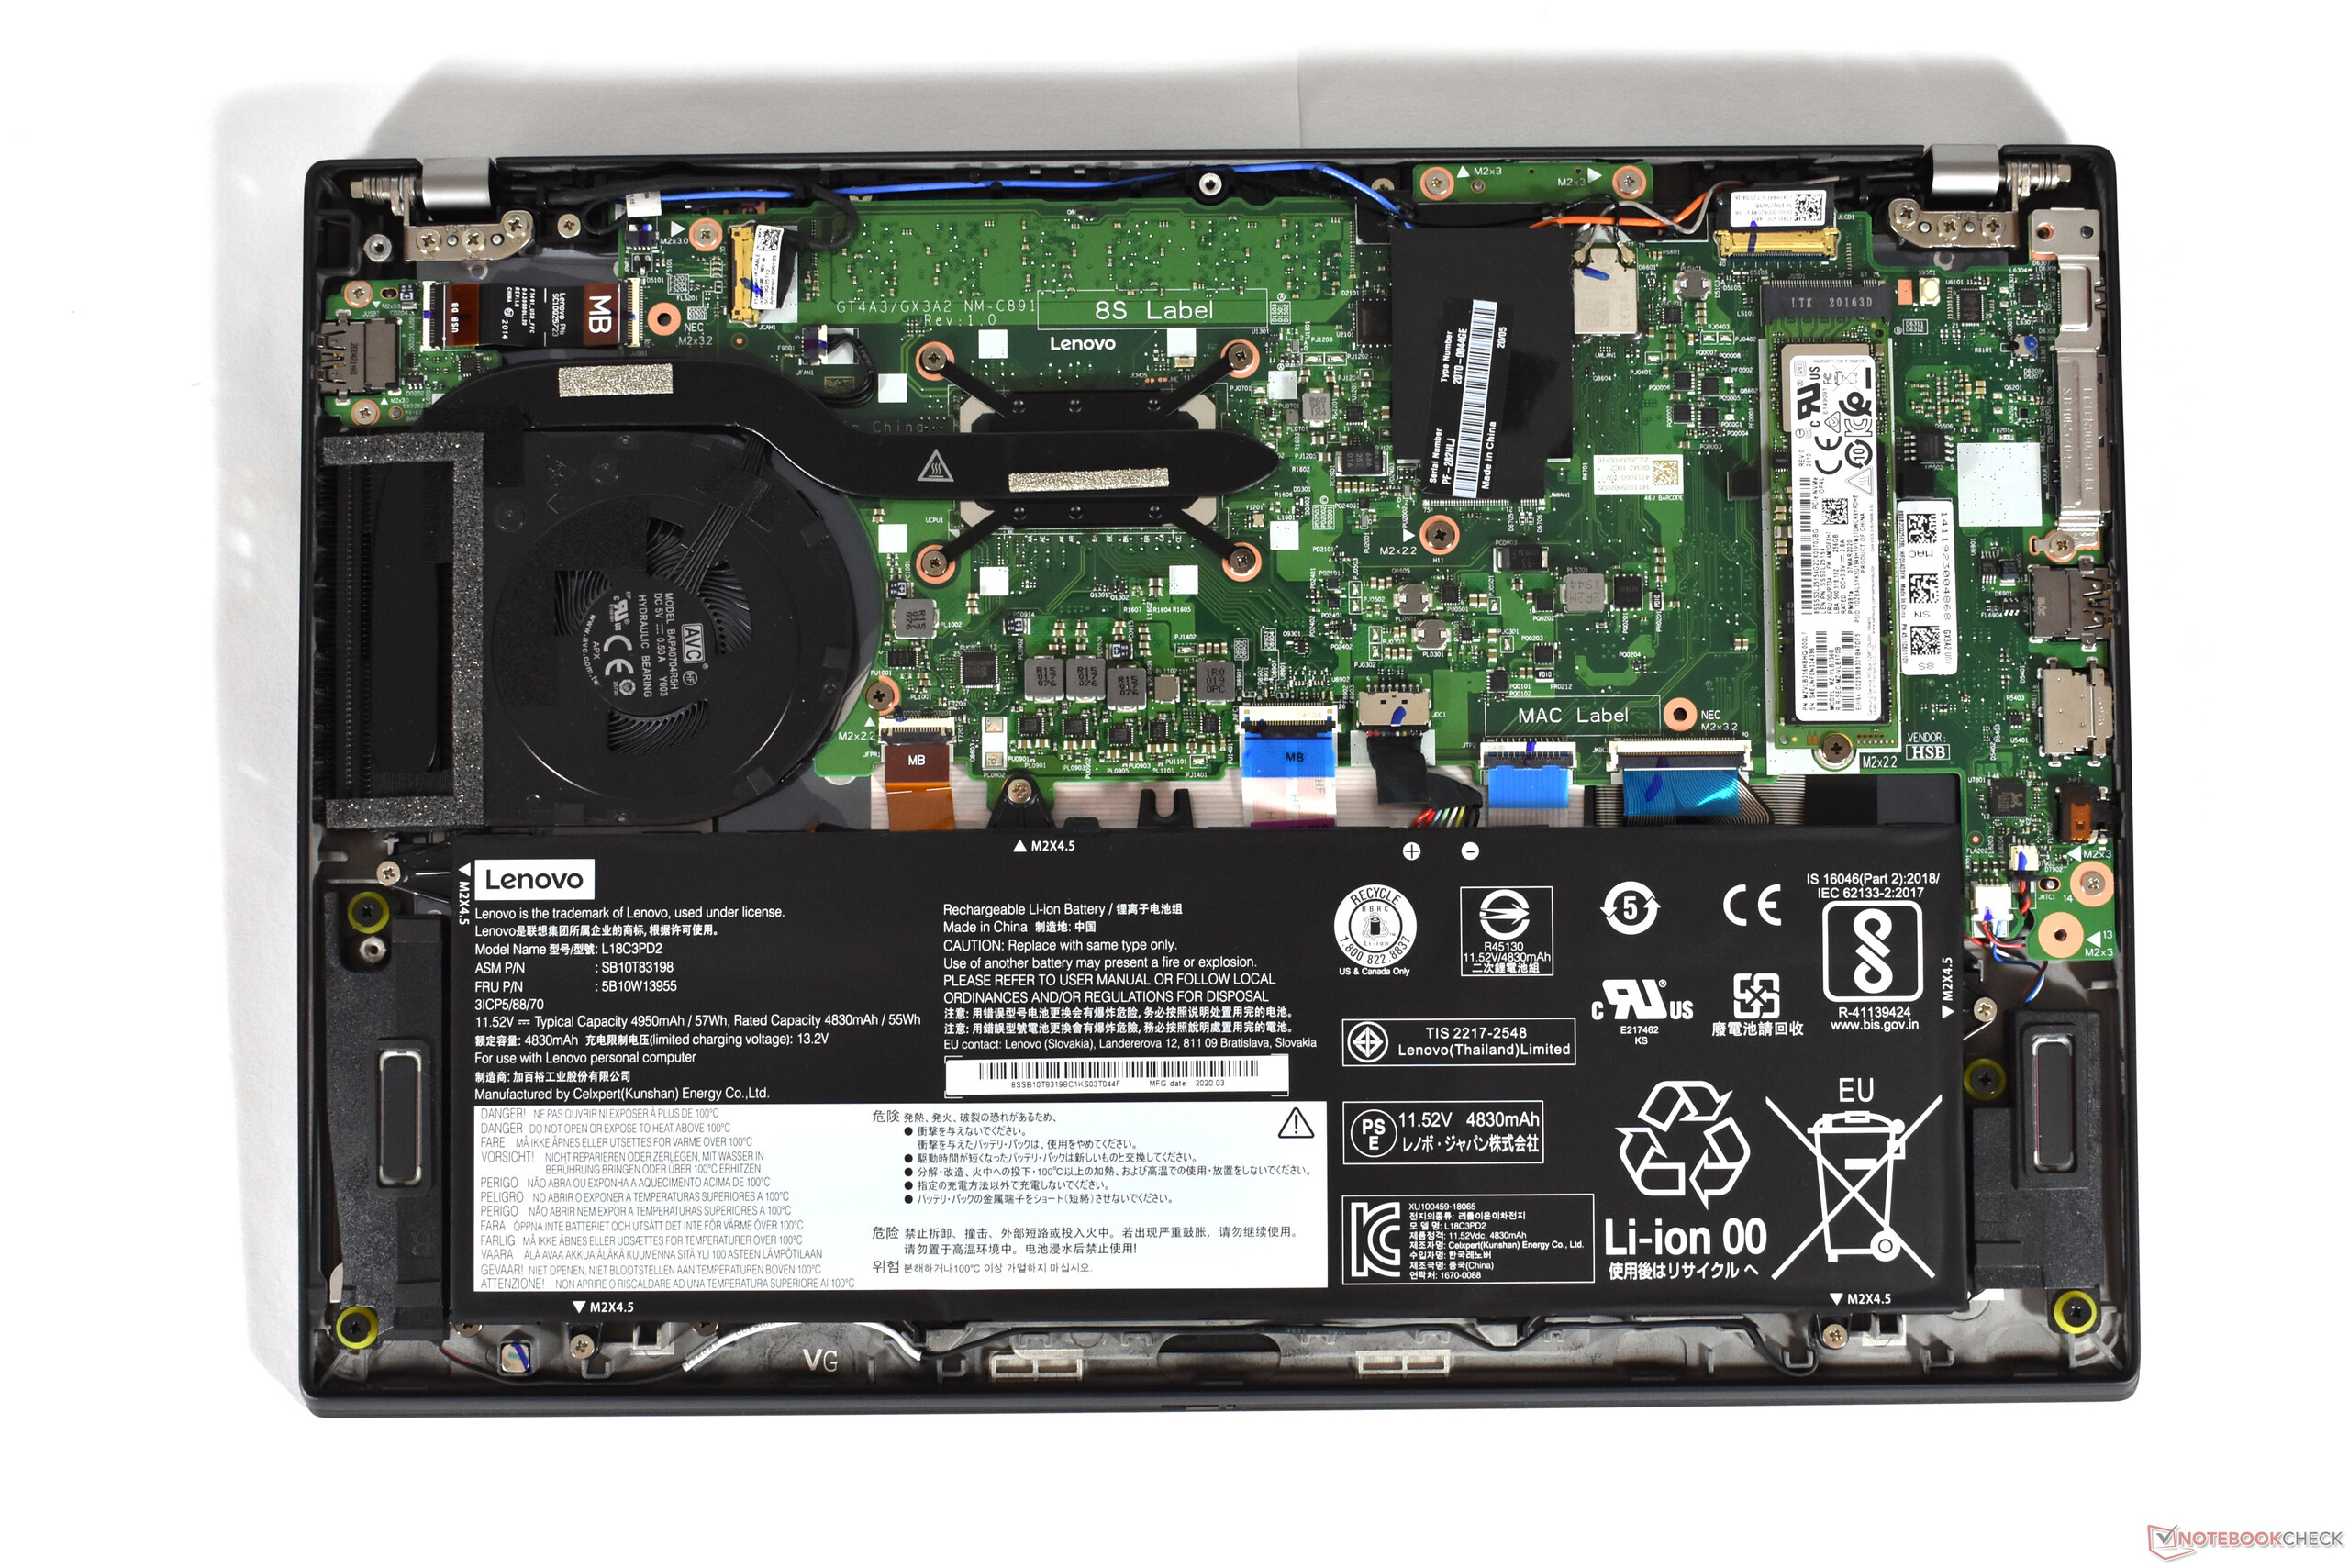
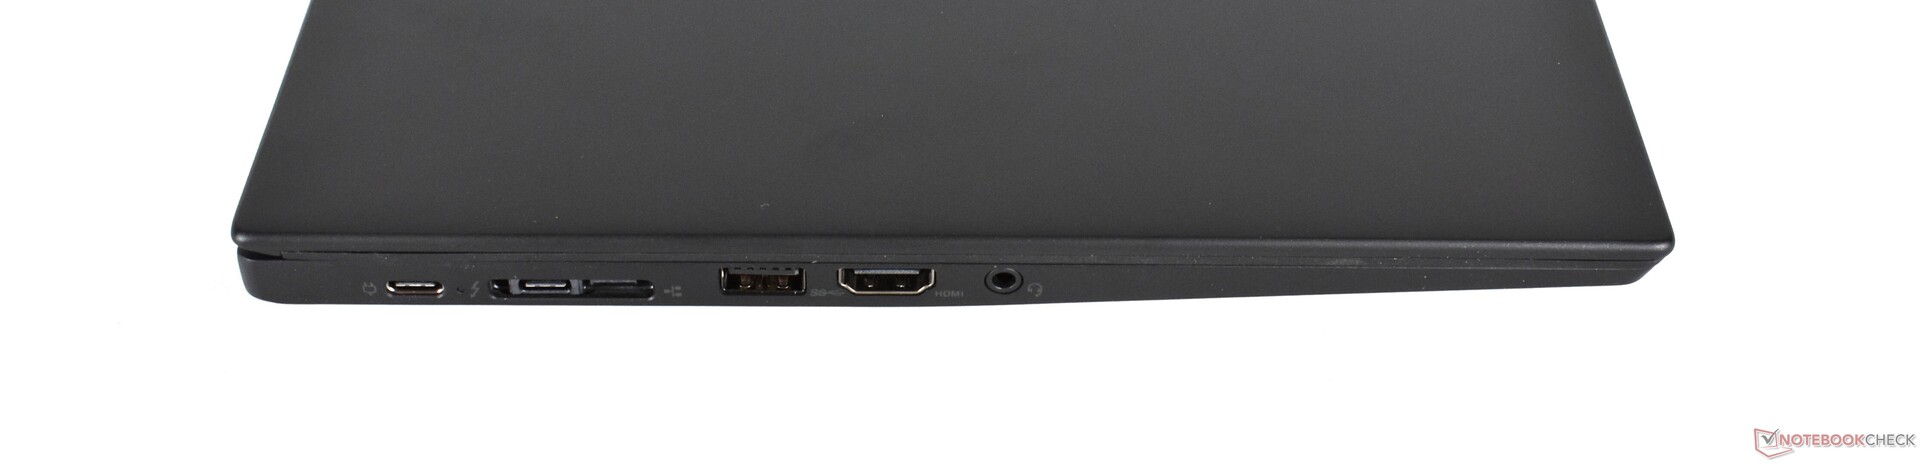
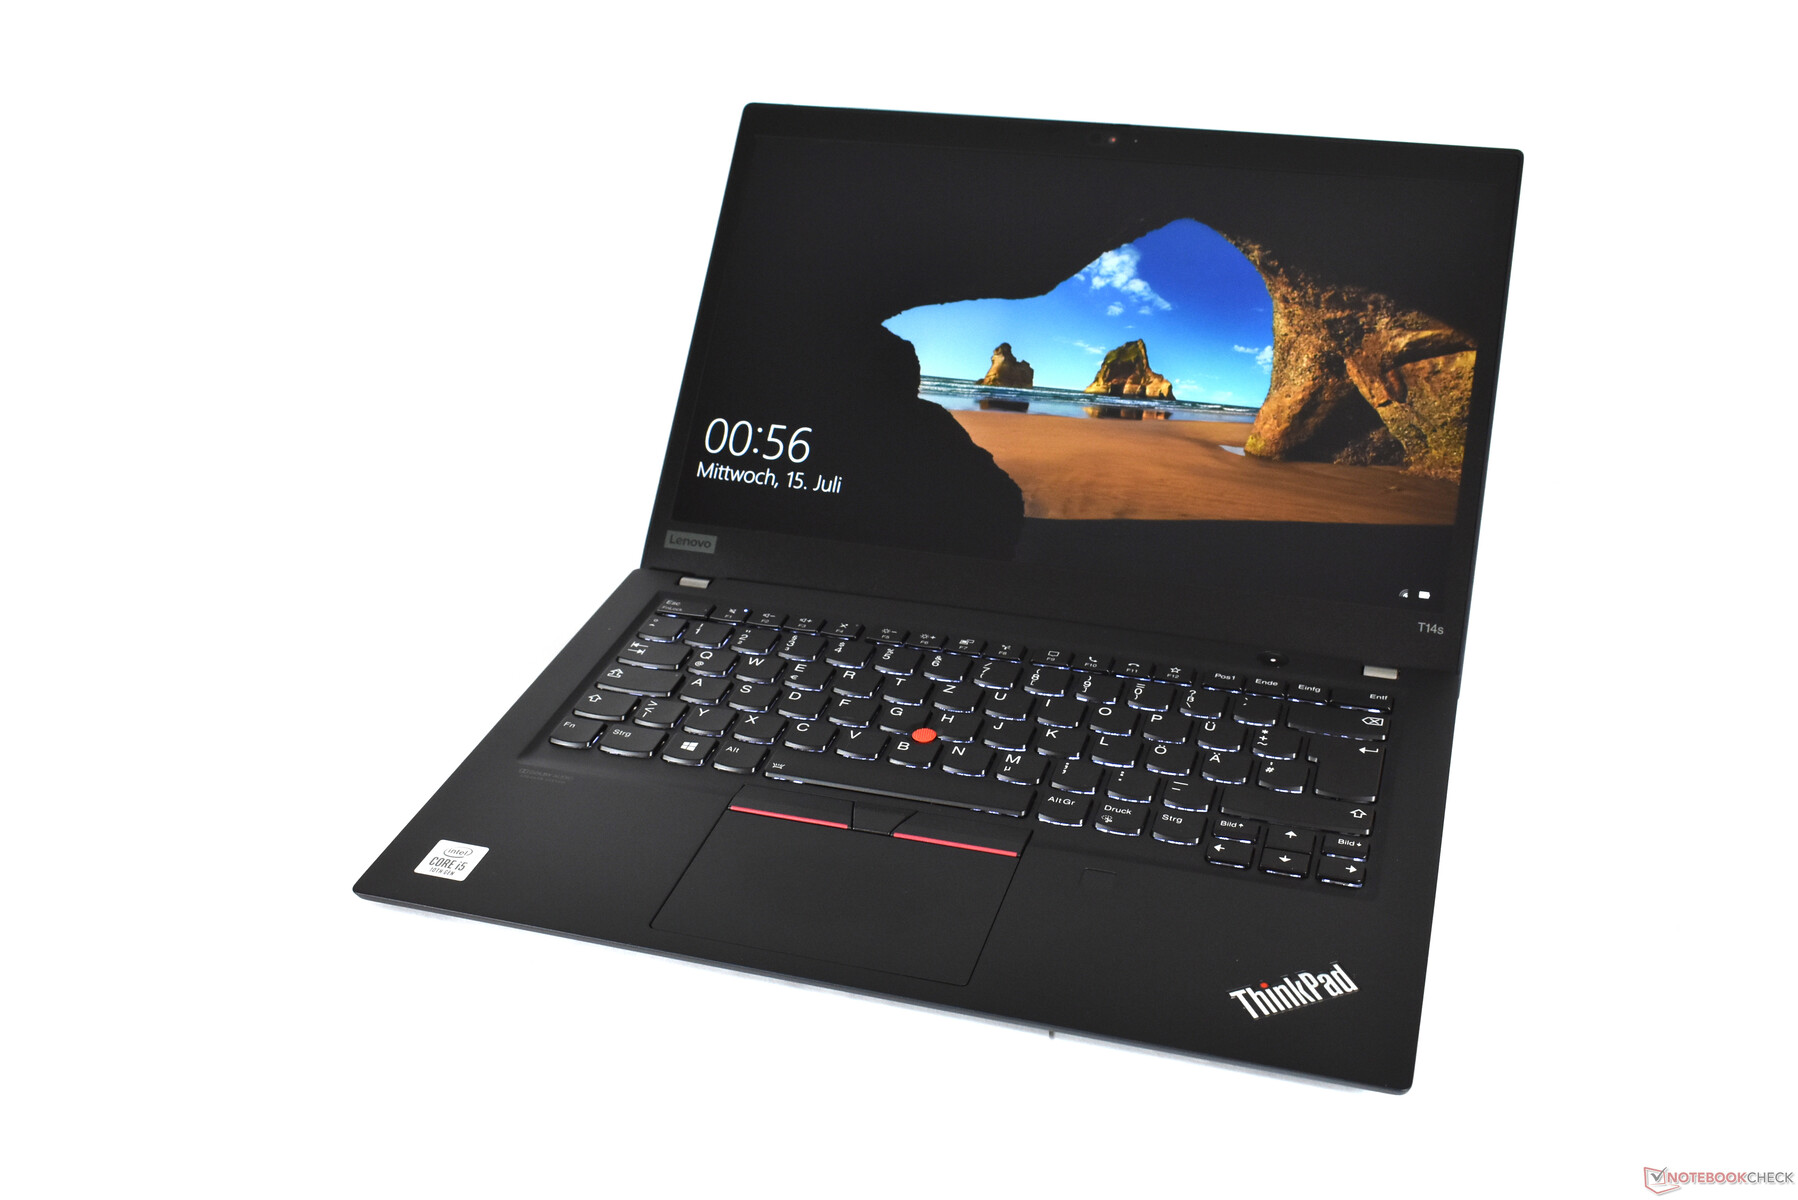
Le Lenovo ThinkPad T14s est un excellent PC portable professionnel. Son châssis de 14 pouces est léger et robuste, son clavier est l'un des meilleurs du marché, et il possède un écran mat lumineux. Et il possède une batterie plutôt grosse, et une sélection de ports complète. Les défauts incluent de la RAM soudée, un lecteur de carte difficile à atteindre, et du coil whine - au moins avec le modèle Intel.
Être très bon ne suffit pas toujours : le Lenovo ThinkPad T14s avec un processeur Intel impressionne, mais il n'est pas le meilleur, à cause des modèles AMD plus puissants.
Nous pouvons recommander le Lenovo ThinkPad T14s avec puce Intel, mais seulement à ceux qui veulent absolument un port Thunderbolt 3. Pour les autres, le modèle AMD semble bien meilleur cette année - son test va arriver.
L’intégralité de cette critique est disponible en anglais en suivant ce lien.
Lenovo ThinkPad T14s-20T00044GE
- 07/29/2020 v7 (old)
Benjamin Herzig