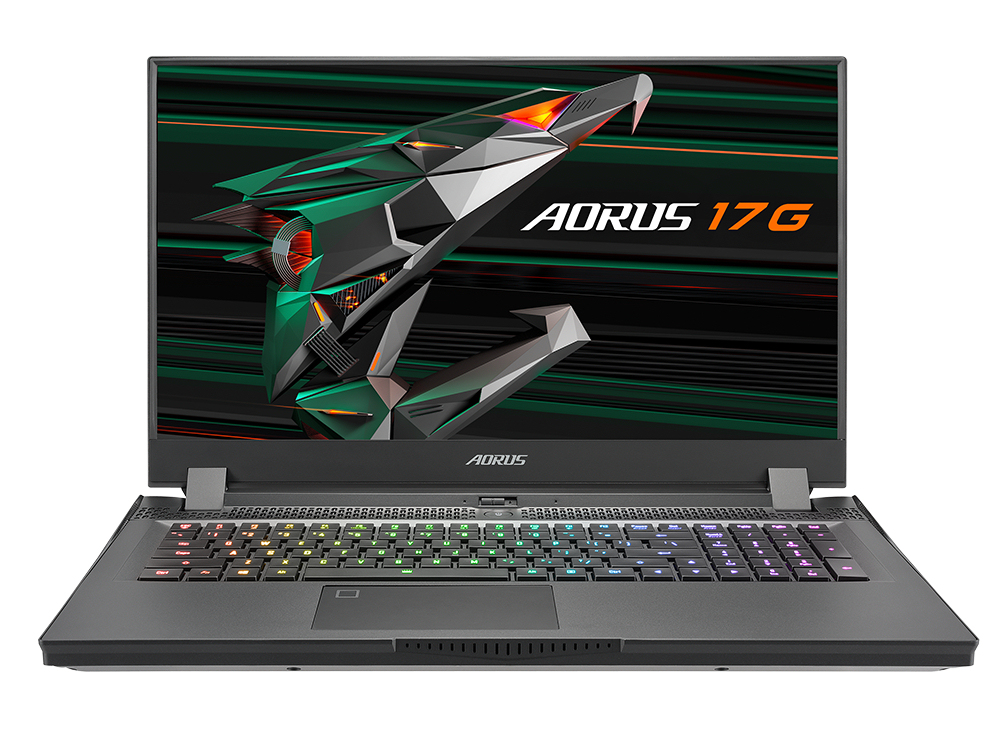
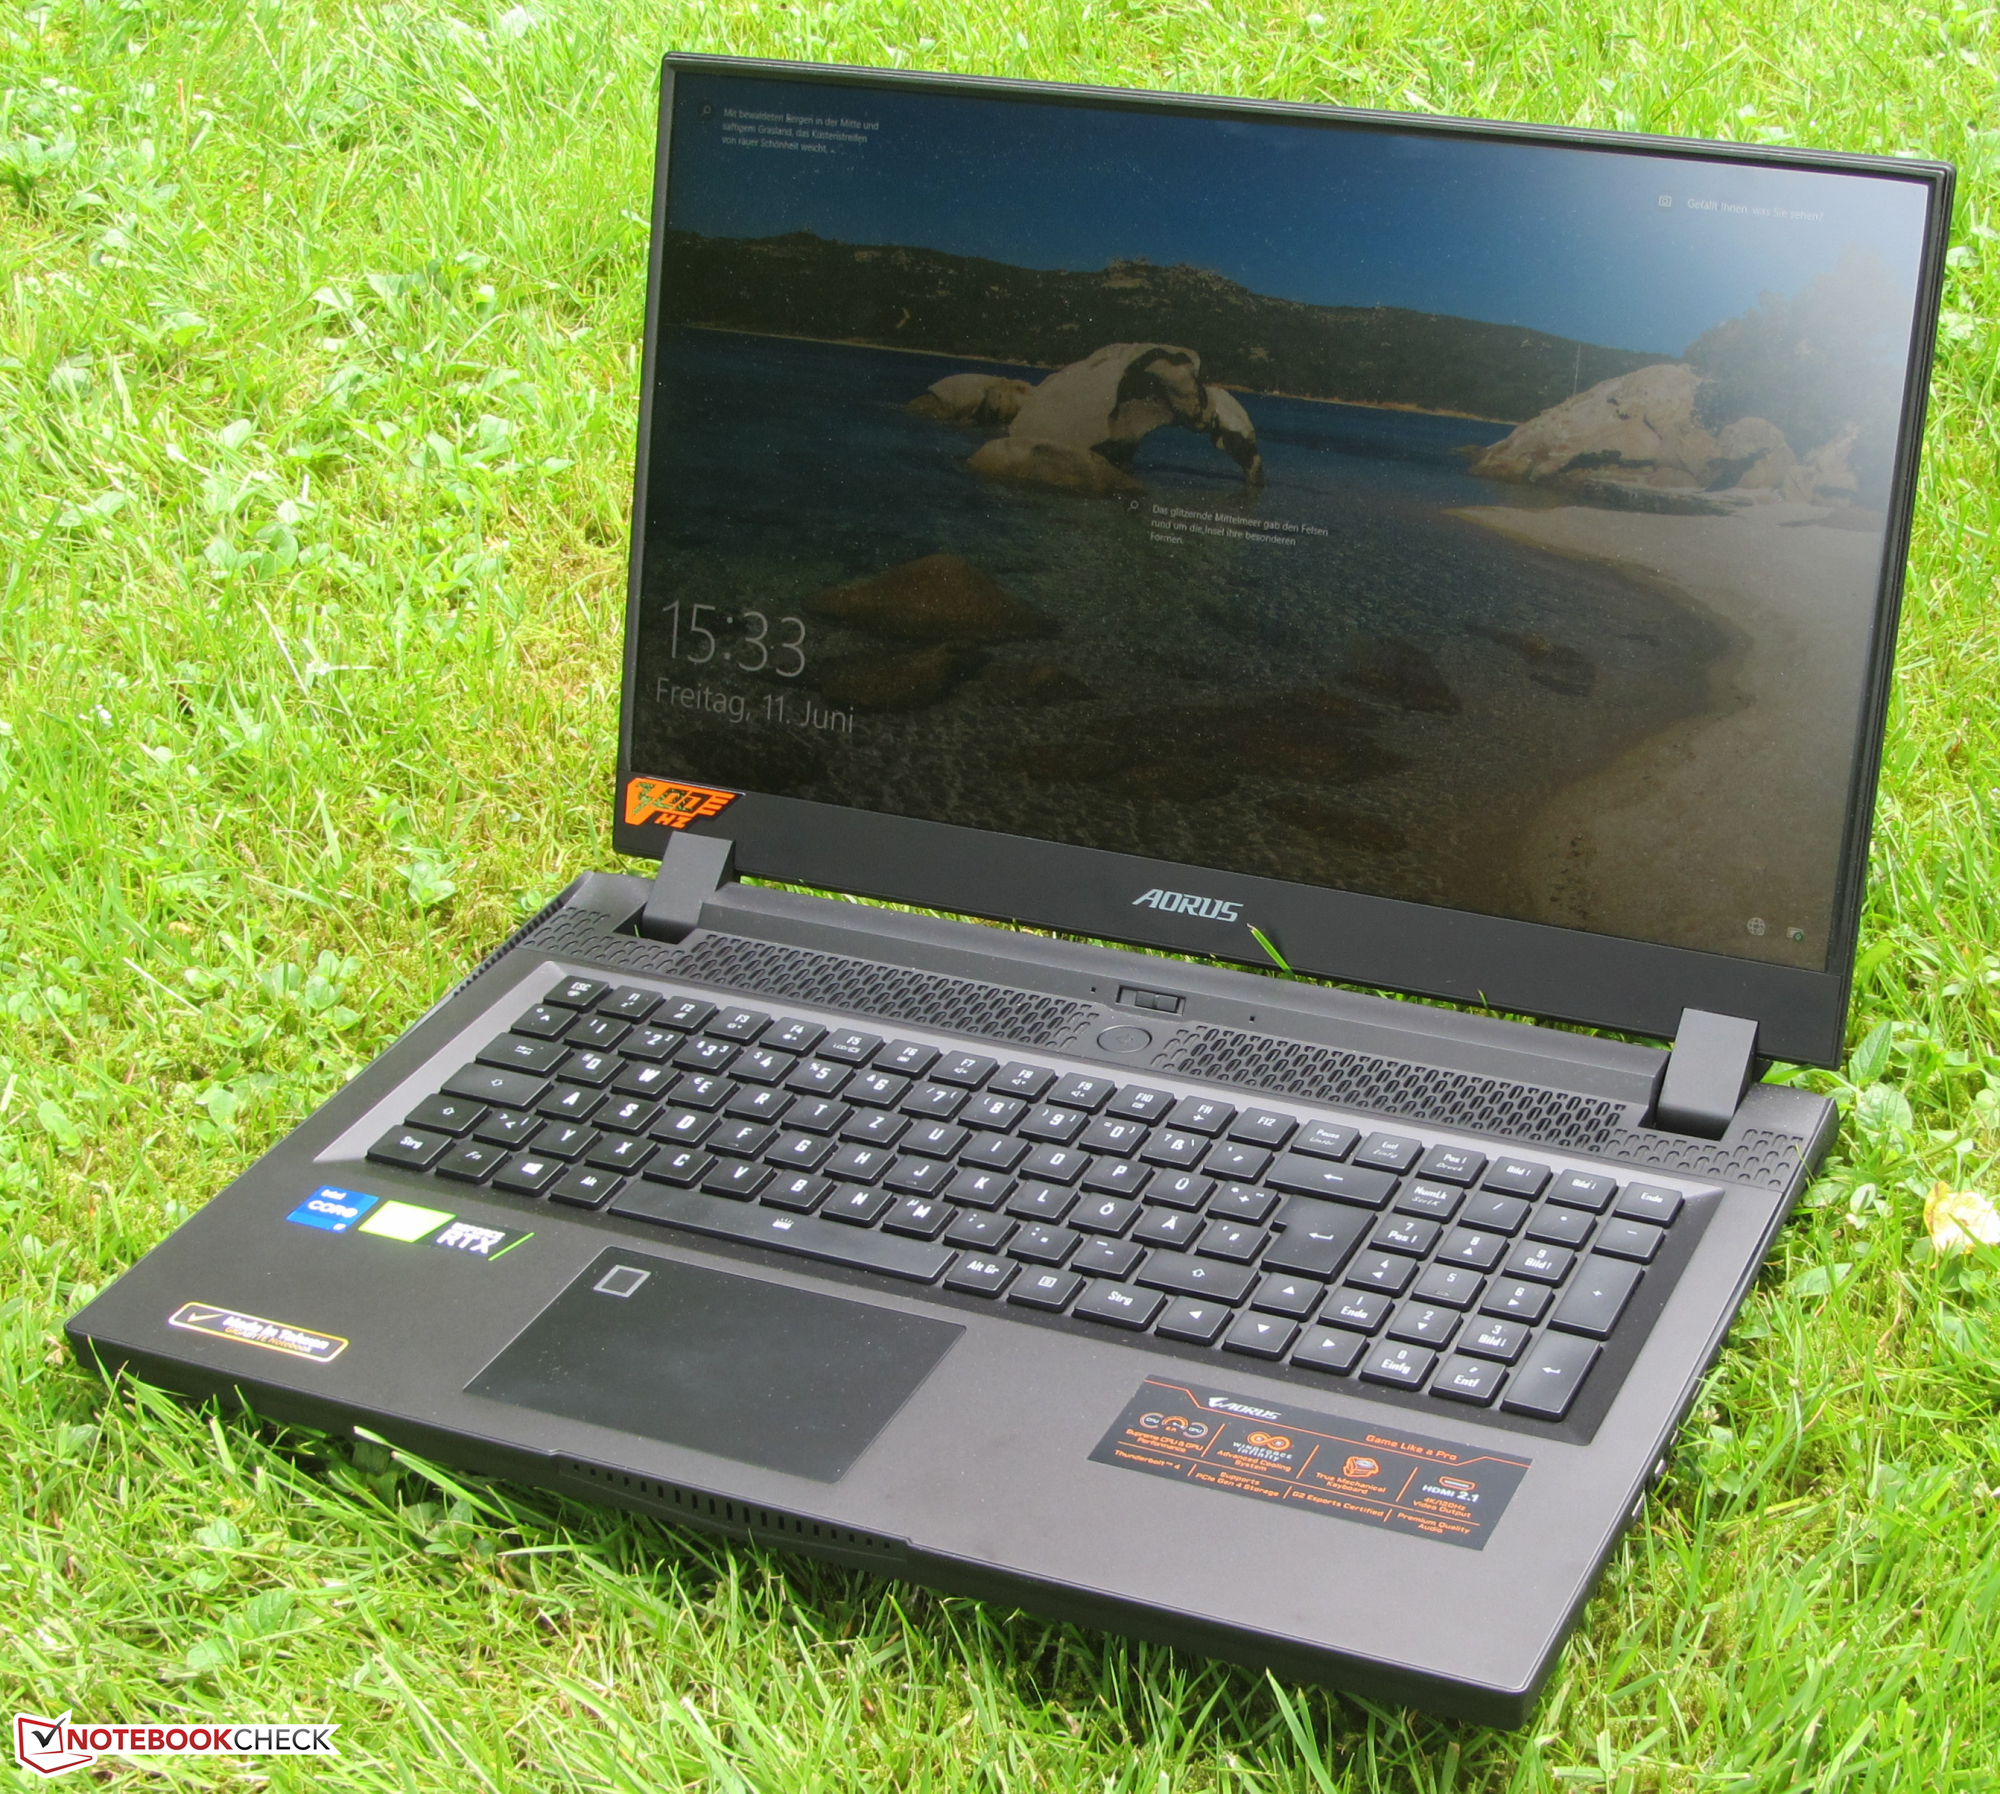
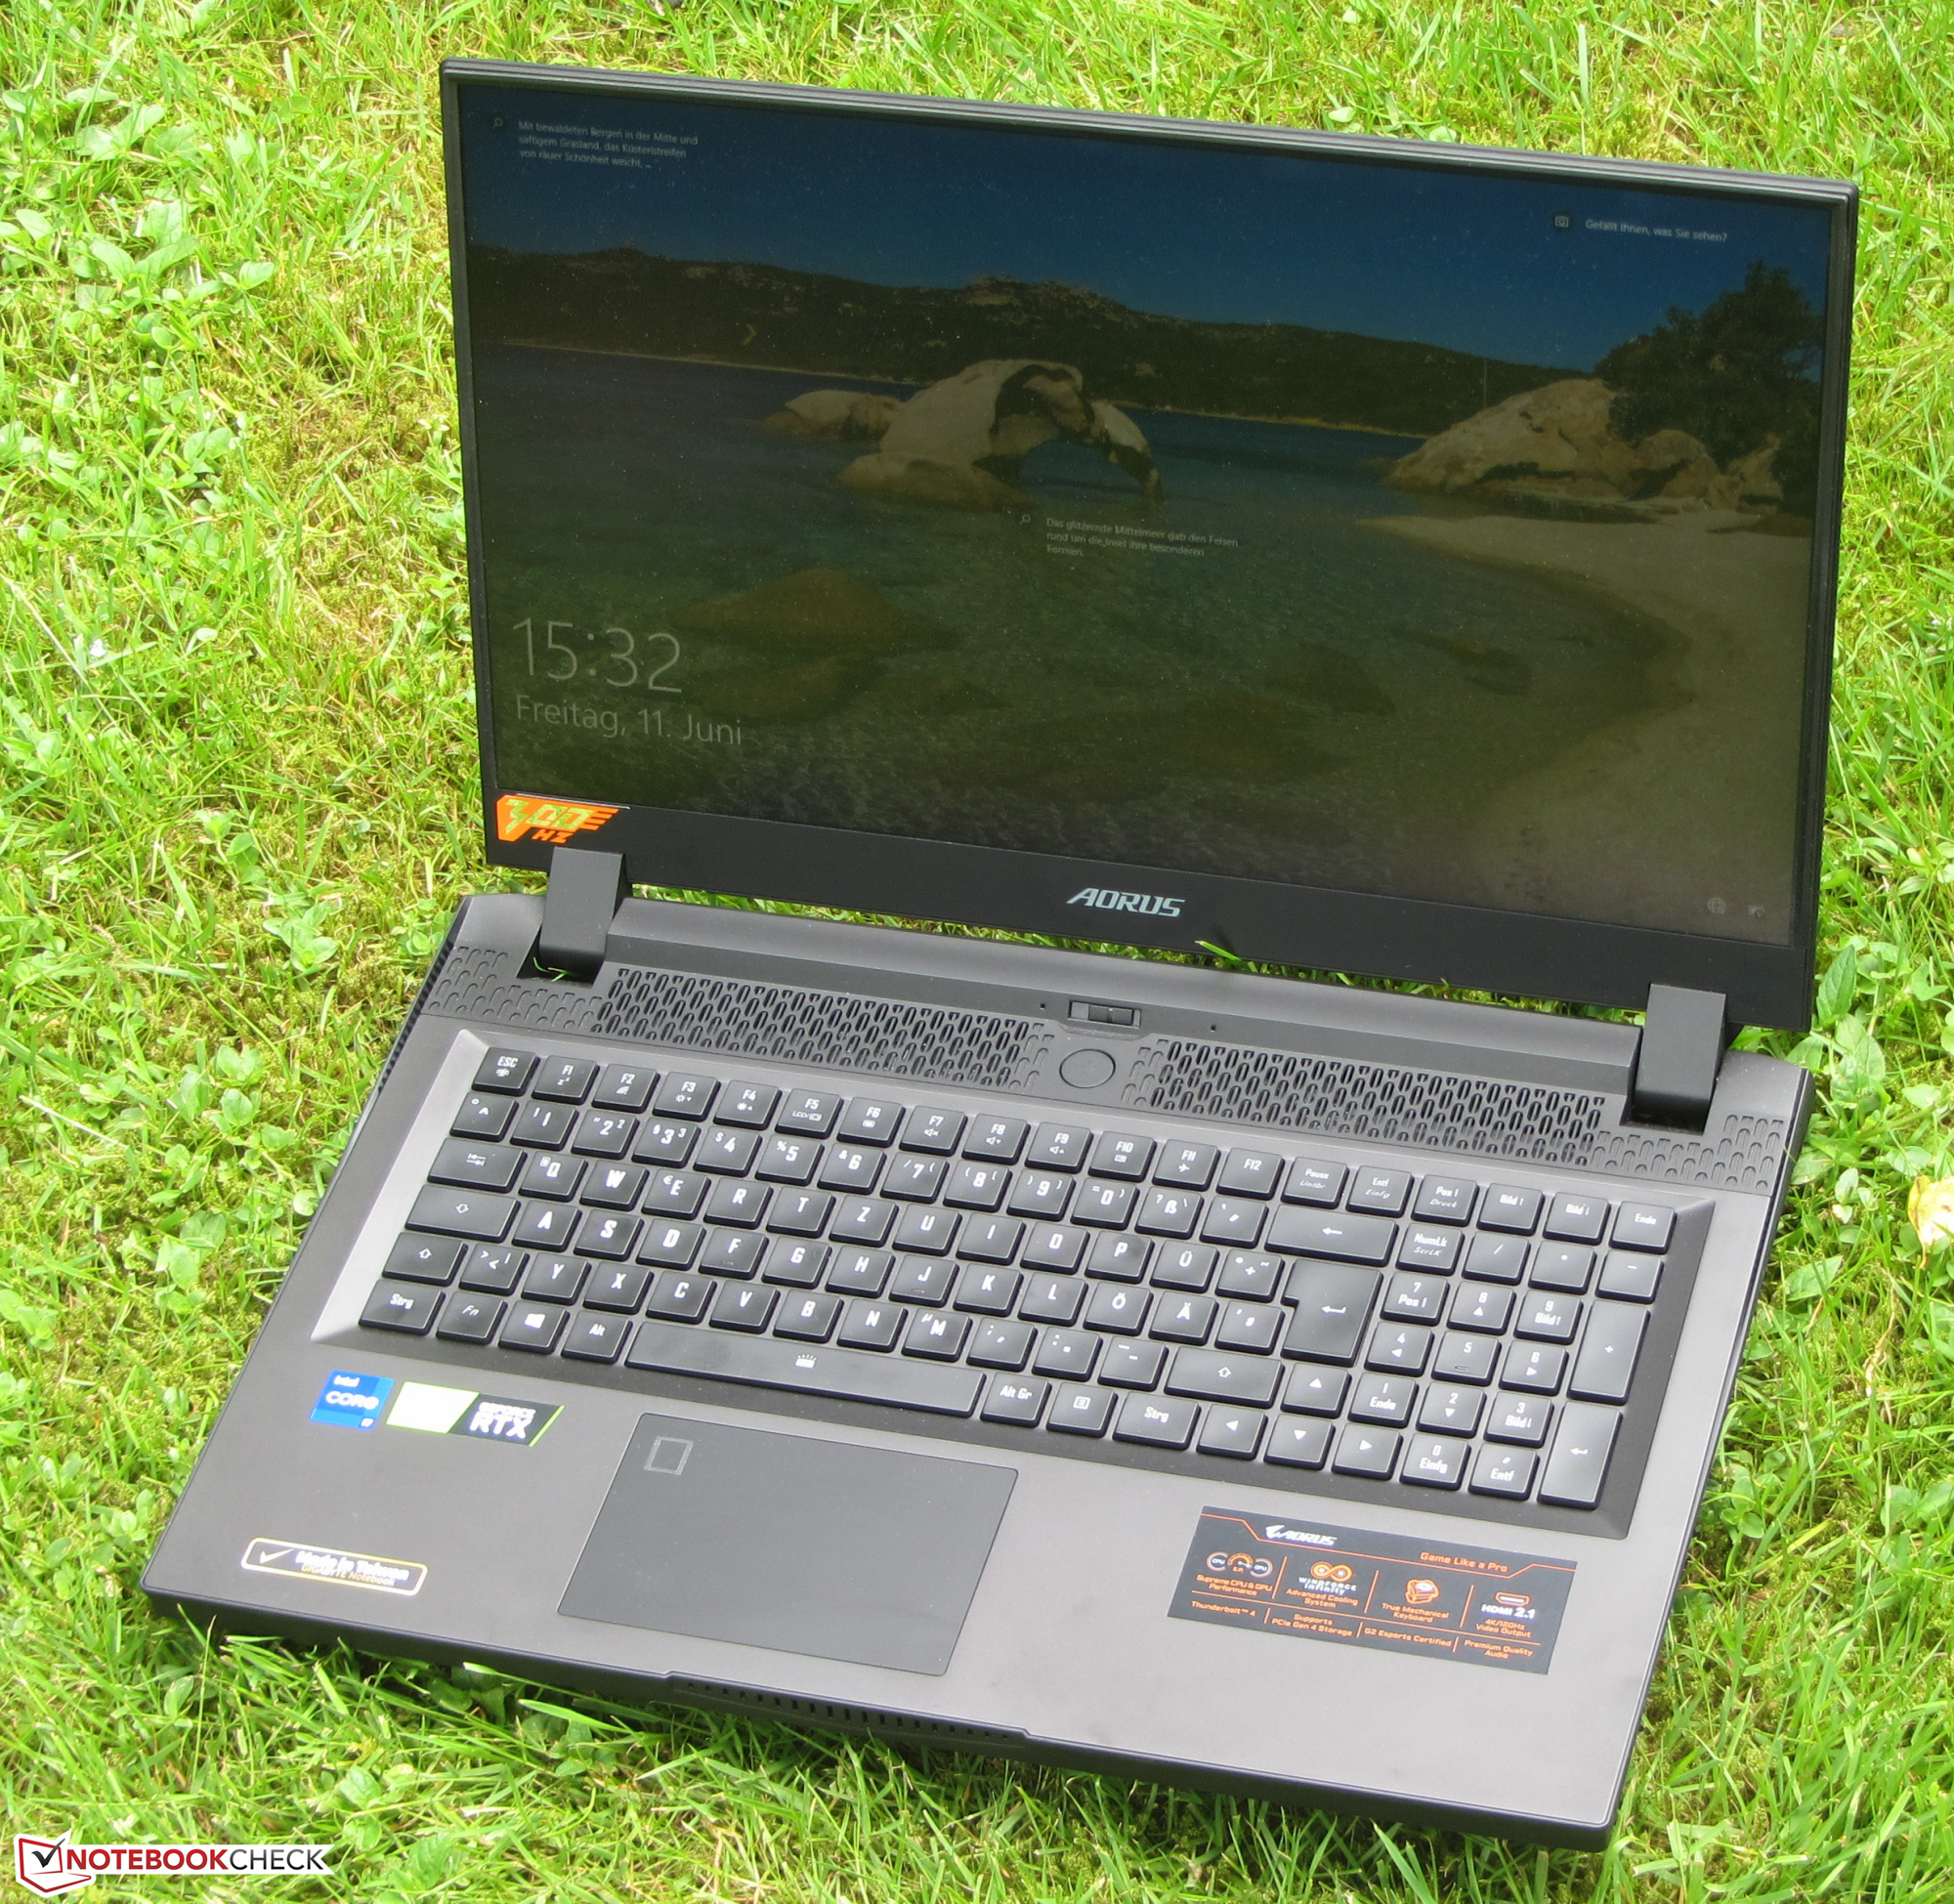
Test de l'Aorus 17G YD : un PC portable de jeu bruyant avec un bon clavier mécanique

Gigabyte présente un ordinateur portable de jeu moderne au format 17,3 pouces avec l'Aorus 17G YD. Il s'agit du même modèle que l'Aorus 17G XBTest de l'Aorus 17G XB (i7-10875H, RTX 2070 Super Max-Q, FHD, 240 Hz) : l'excellence du clavier mécanique que nous avons déjà examiné. Parmi les concurrents figurent des appareils comme le Asus Strix Scar 17 G733QSA, leLenovo Legion 7 16ACHg6, leSchenker XMG Neo 17 (Early 2021), leAlienware m17 R4, et le MSI GE76 Raider 10UH.
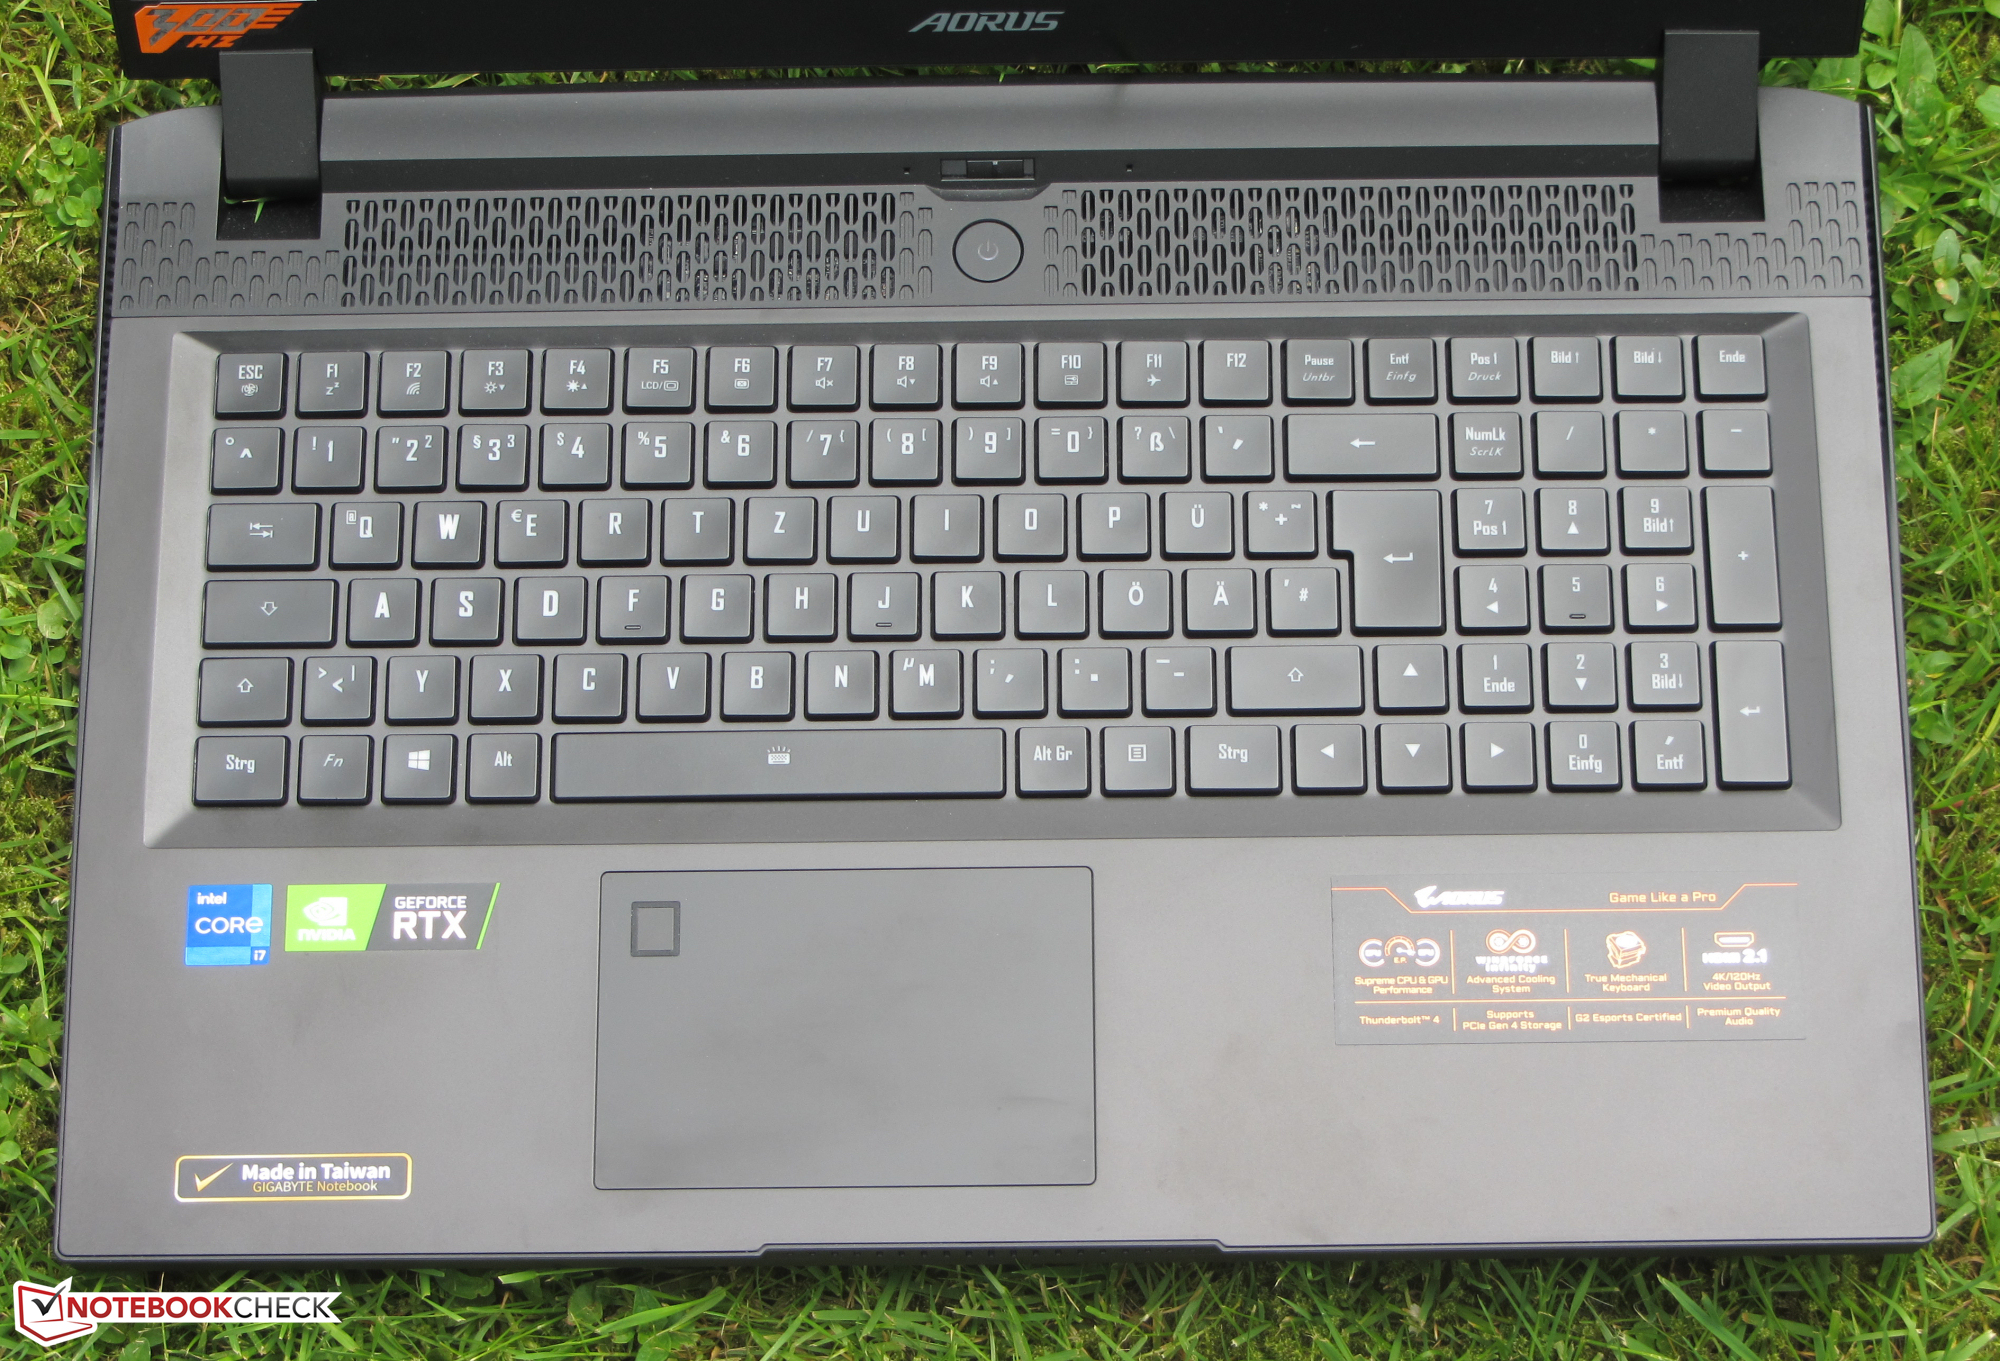
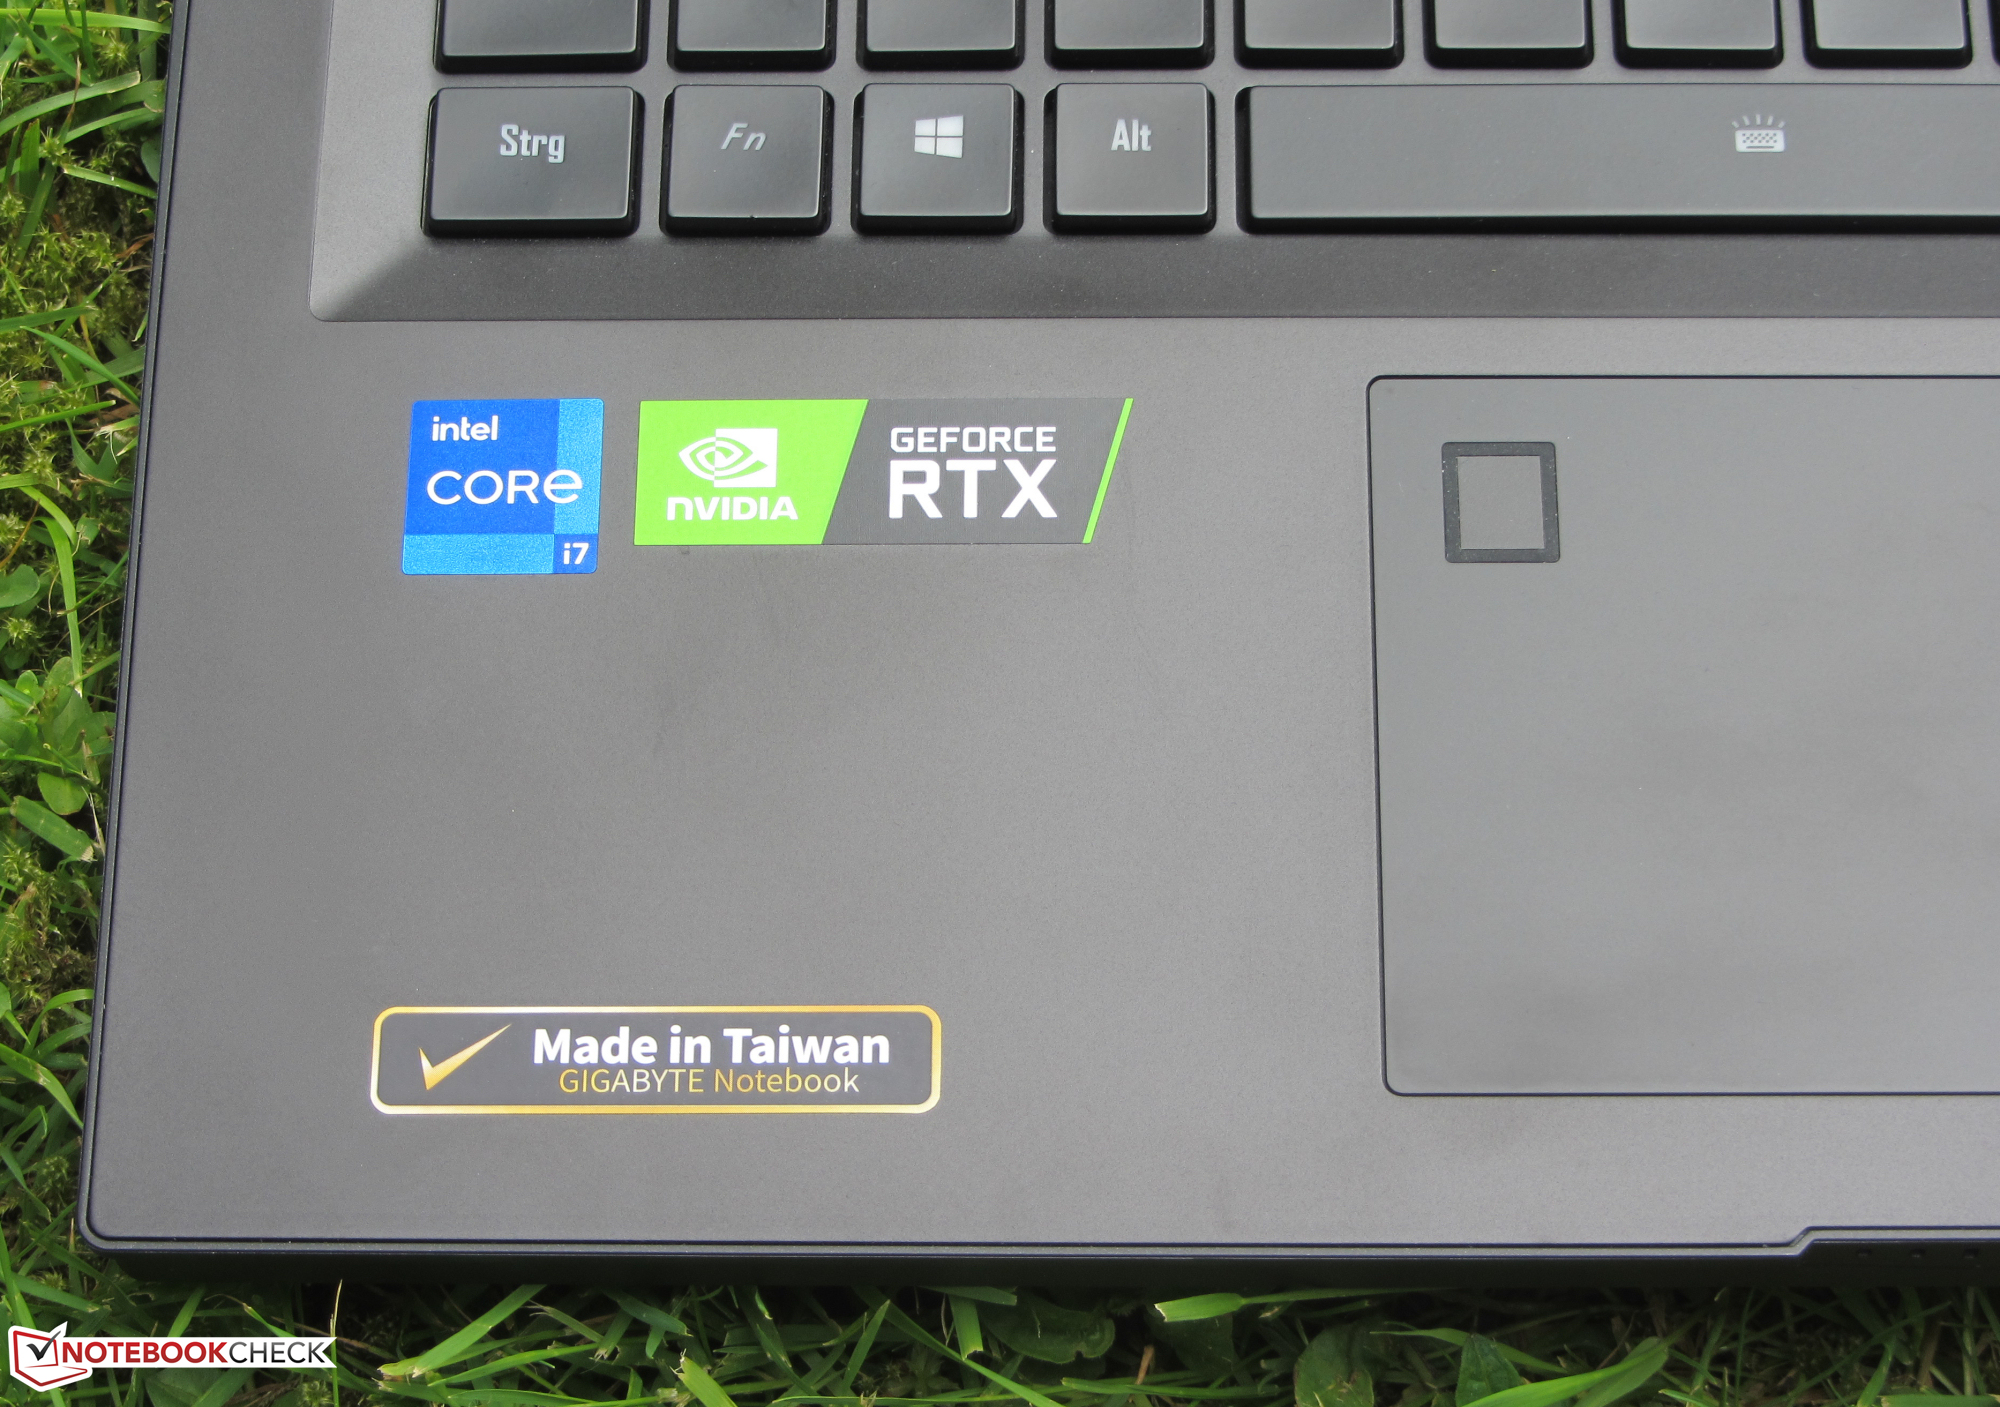
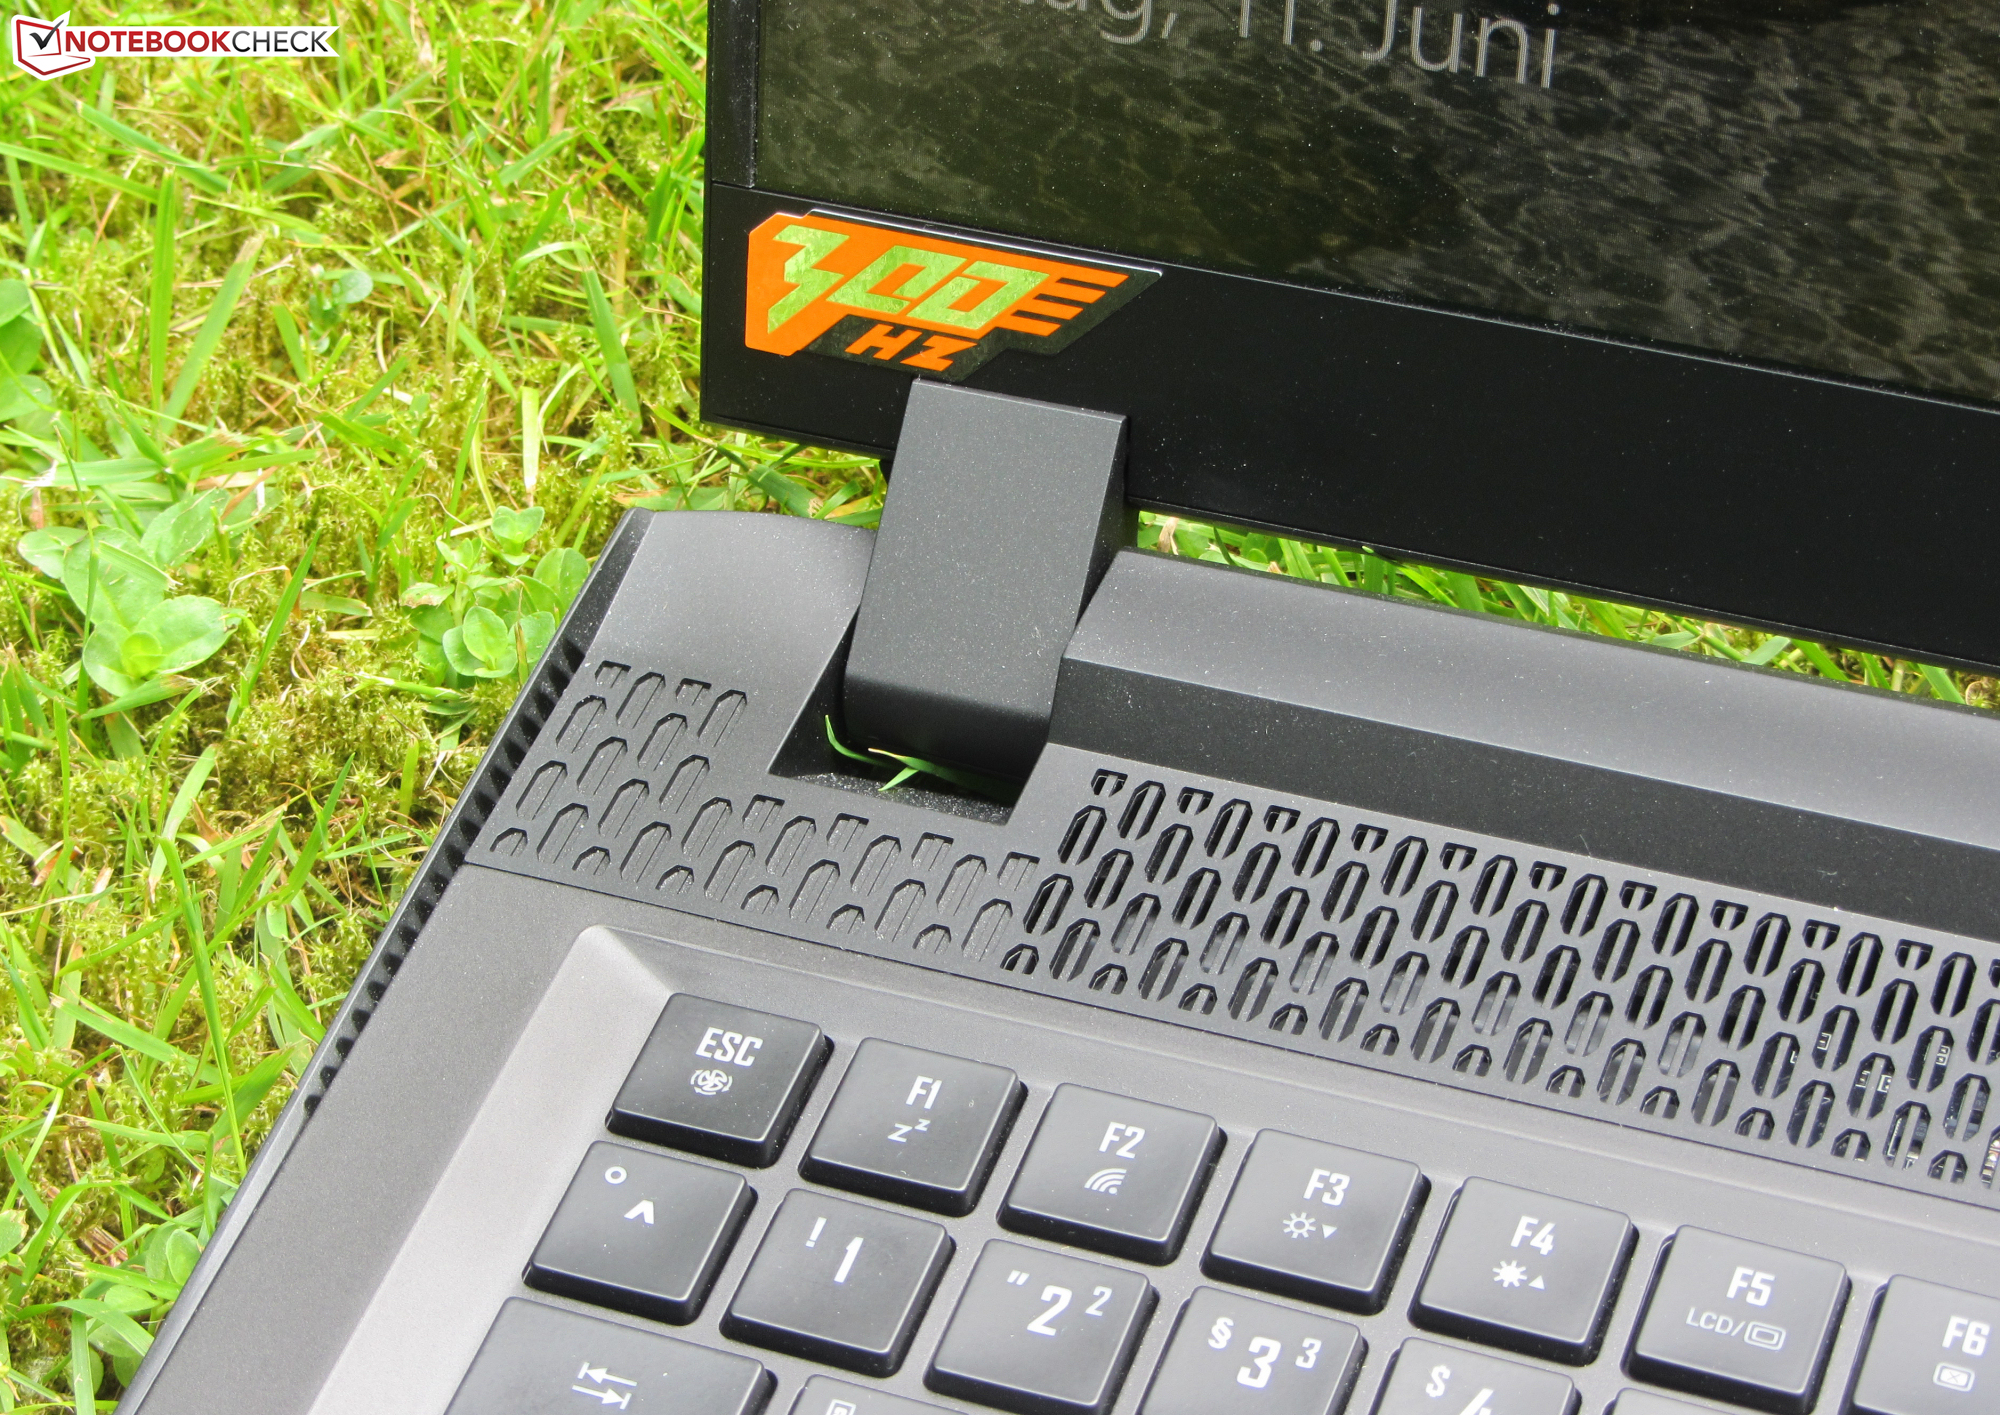
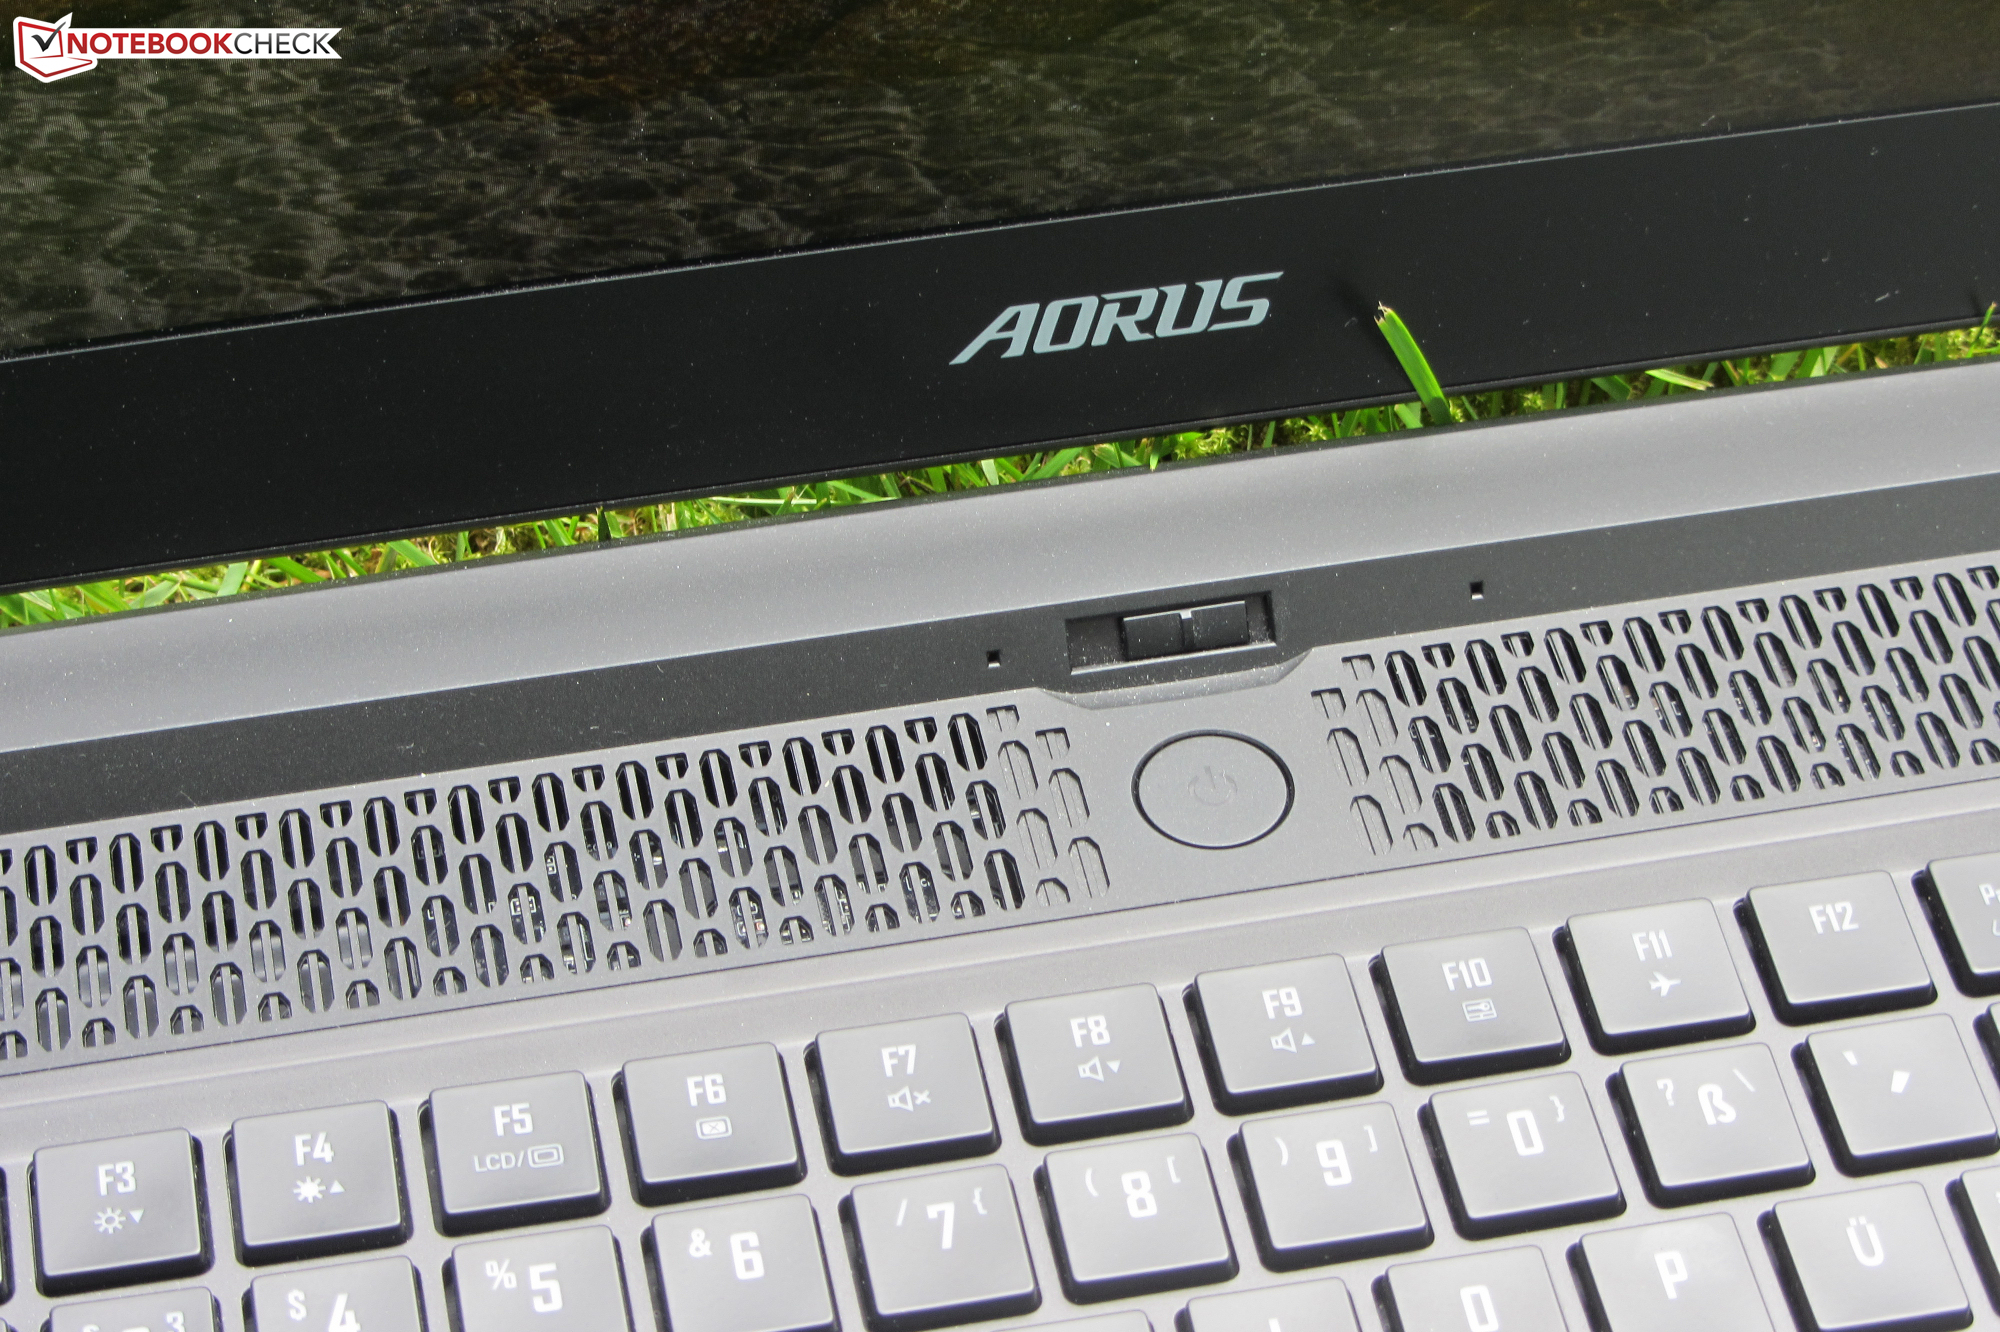
Les deux modèles Aorus 17G étant identiques dans leur construction, nous ne nous étendrons pas davantage sur le boîtier, la connectivité, les périphériques d'entrée et les haut-parleurs. Les informations correspondantes peuvent être trouvées dans larevuede l'Aorus 17G XB.
Possible contenders in comparison
Note | Date | Modèle | Poids | Épaisseur | Taille | Résolution | Prix |
|---|---|---|---|---|---|---|---|
| 86 % v7 (old) | 06/21 | Aorus 17G YD i7-11800H, GeForce RTX 3080 Laptop GPU | 2.8 kg | 26 mm | 17.30" | 1920x1080 | |
| 86.6 % v7 (old) | 05/21 | Asus Strix Scar 17 G733QSA-XS99 R9 5900HX, GeForce RTX 3080 Laptop GPU | 2.8 kg | 28.3 mm | 17.30" | 1920x1080 | |
| 88.1 % v7 (old) | 06/21 | Lenovo Legion 7 16ACHg6 R9 5900HX, GeForce RTX 3080 Laptop GPU | 2.5 kg | 23.5 mm | 16.00" | 2560x1600 | |
| 85.1 % v7 (old) | 01/21 | Schenker XMG Neo 17 (Early 2021, RTX 3070, 5800H) R7 5800H, GeForce RTX 3070 Laptop GPU | 2.5 kg | 27 mm | 17.30" | 2560x1440 | |
| 85.3 % v7 (old) | 04/21 | Alienware m17 R4 i9-10980HK, GeForce RTX 3080 Laptop GPU | 3 kg | 22 mm | 17.30" | 1920x1080 | |
| 87.1 % v7 (old) | 03/21 | MSI GE76 Raider 10UH i7-10870H, GeForce RTX 3080 Laptop GPU | 3 kg | 27.4 mm | 17.30" | 1920x1080 |
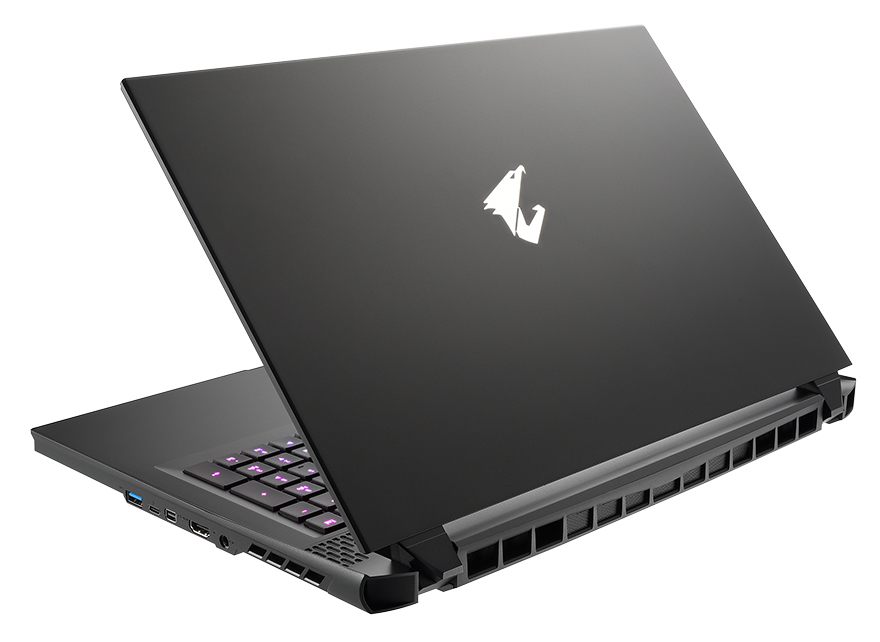
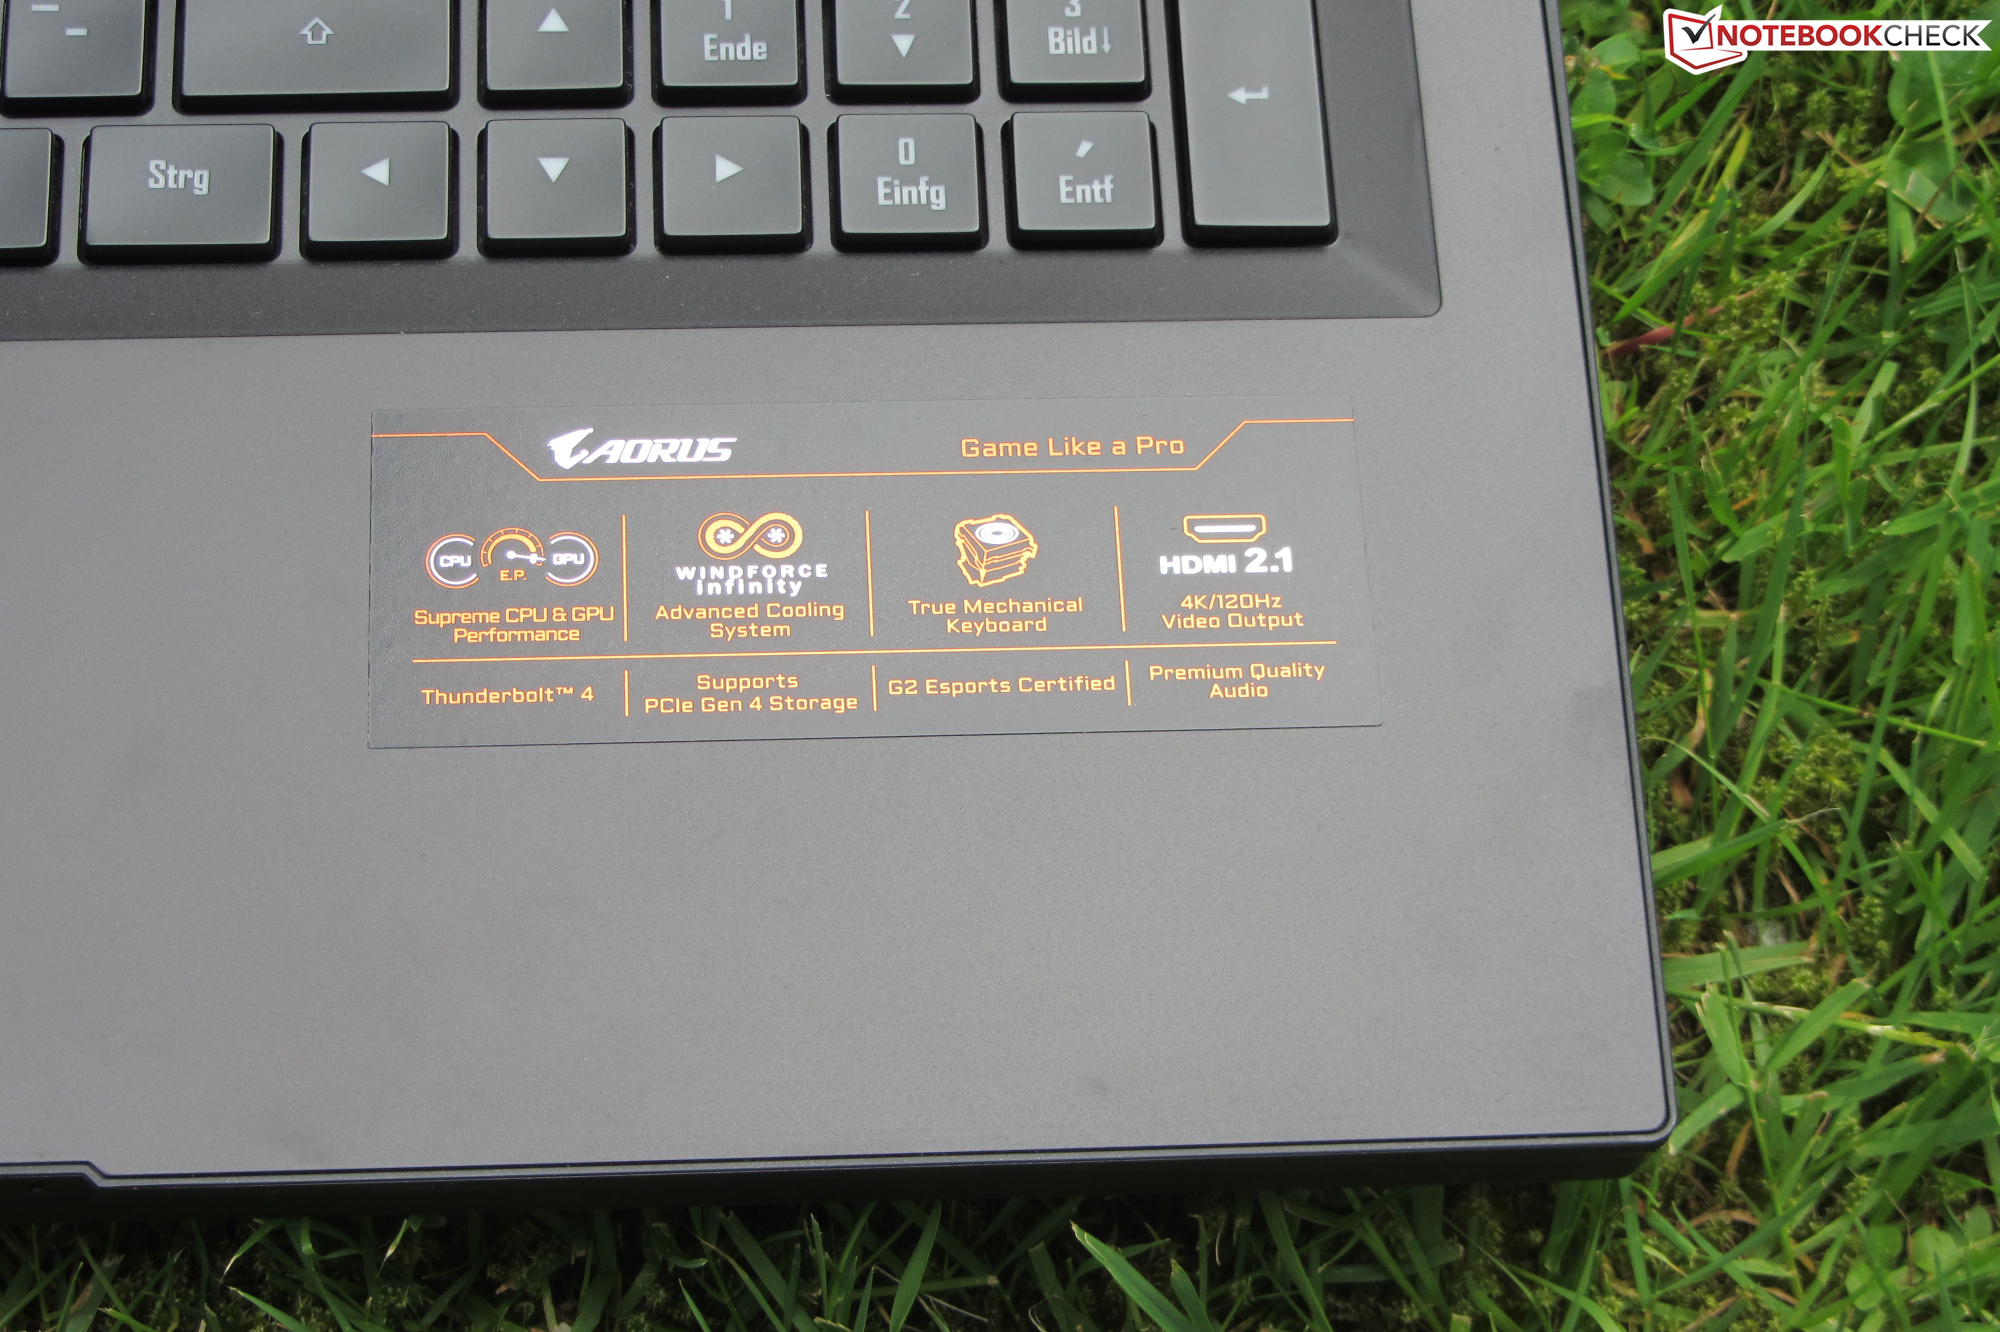
Connectivité - Maintenant avec Thunderbolt 4
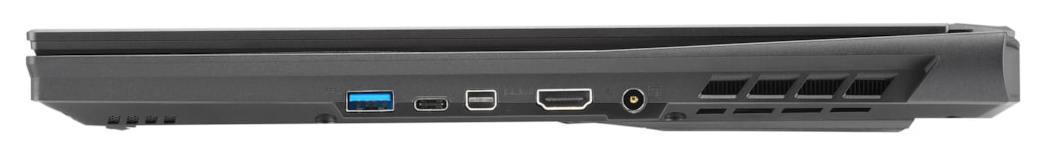
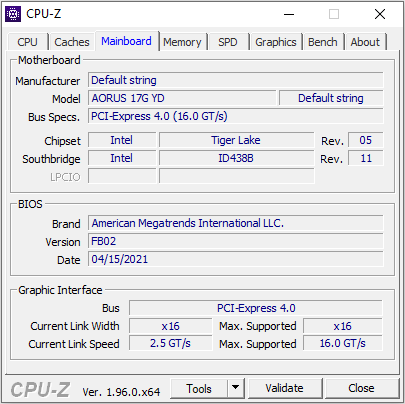
Par rapport au Aorus 17G XB, le 17G YD a reçu quelques améliorations en termes de ports. Le port HDMI prend en charge la norme 2.1 (XB : 2.0), ce qui permet des résolutions et des fréquences d'images plus élevées. Le modèle 17G actuel est également doté d'un port Thunderbolt 4 au lieu d'un port Thunderbolt 3. DisplayPort via USB-C et Power Delivery sont pris en charge
| SD Card Reader | |
| average JPG Copy Test (av. of 3 runs) | |
| Aorus 17G XB (Toshiba Exceria Pro SDXC 64 GB UHS-II) | |
| MSI GE76 Raider 10UH (Toshiba Exceria Pro SDXC 64 GB UHS-II) | |
| Aorus 17G YD (AV PRO microSD 128 GB V60) | |
| Alienware m17 R4 (AV PRO microSD 128 GB V60) | |
| Moyenne de la classe Gaming (20.9 - 210, n=55, 2 dernières années) | |
| Schenker XMG Neo 17 (Early 2021, RTX 3070, 5800H) (Toshiba Exceria Pro SDXC 64 GB UHS-II) | |
| maximum AS SSD Seq Read Test (1GB) | |
| Aorus 17G XB (Toshiba Exceria Pro SDXC 64 GB UHS-II) | |
| Alienware m17 R4 (AV PRO microSD 128 GB V60) | |
| MSI GE76 Raider 10UH (Toshiba Exceria Pro SDXC 64 GB UHS-II) | |
| Aorus 17G YD (AV PRO microSD 128 GB V60) | |
| Moyenne de la classe Gaming (25.5 - 261, n=52, 2 dernières années) | |
| Schenker XMG Neo 17 (Early 2021, RTX 3070, 5800H) (Toshiba Exceria Pro SDXC 64 GB UHS-II) | |


 GeForce RTX 3070 Laptop GPU, R7 5800H, Samsung SSD 970 EVO Plus 500GB")
 GeForce RTX 3070 Laptop GPU, R7 5800H, Samsung SSD 970 EVO Plus 500GB")


")
")


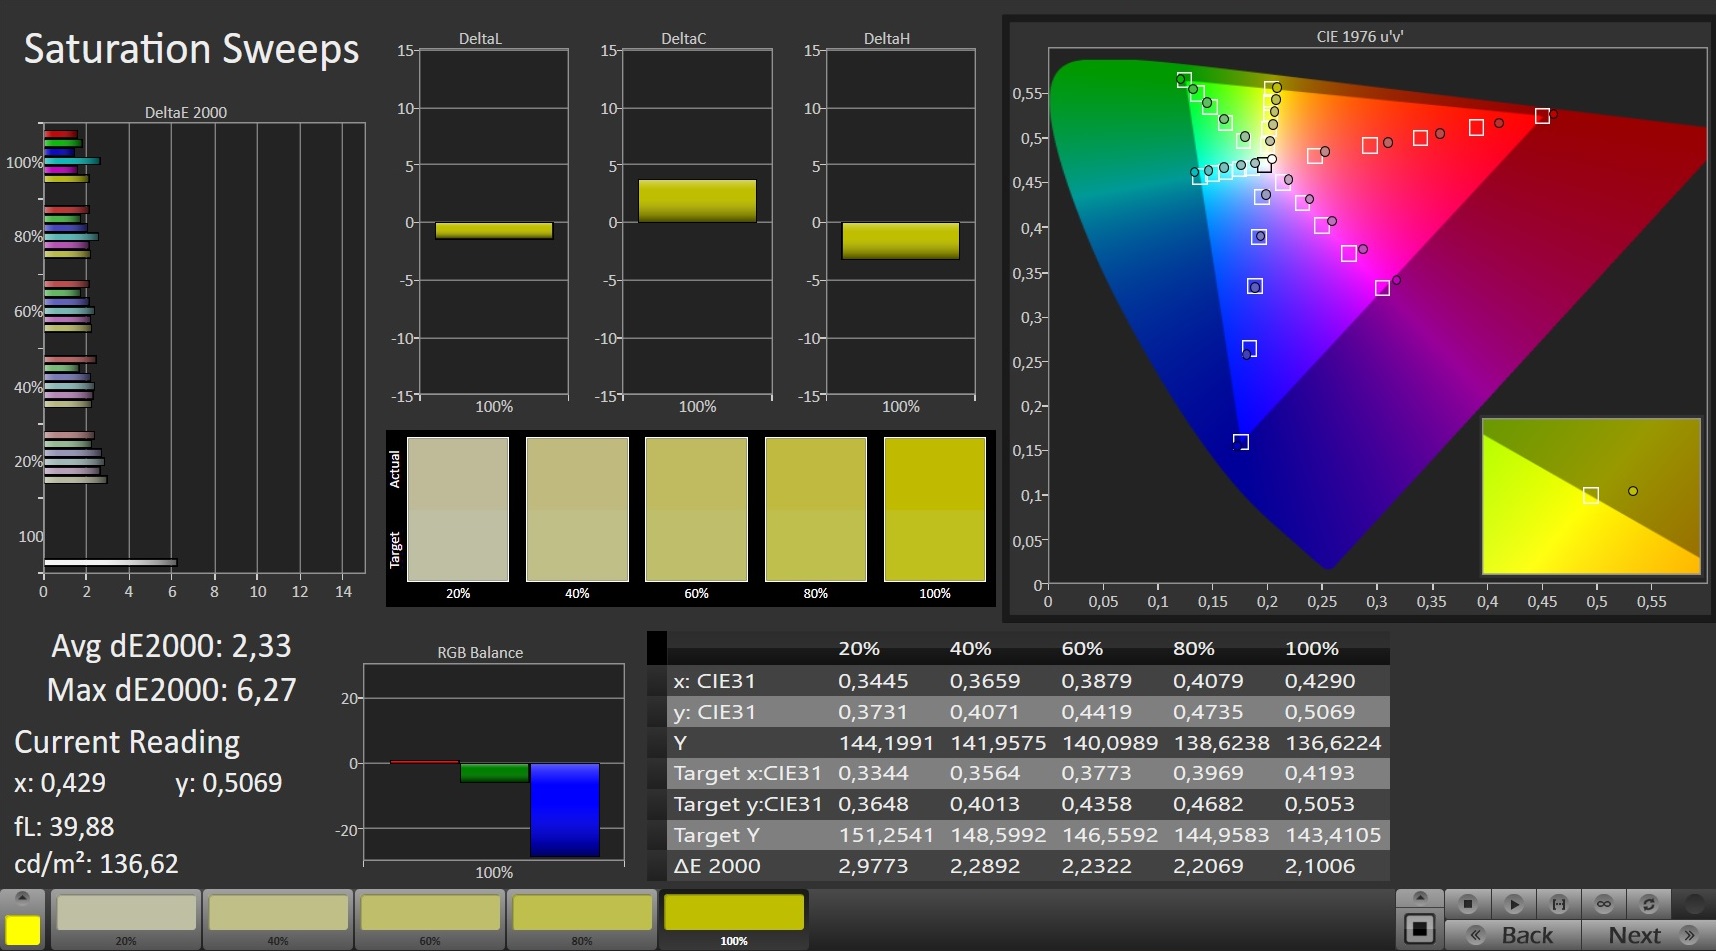
Écran - Panneau IPS 300 Hz
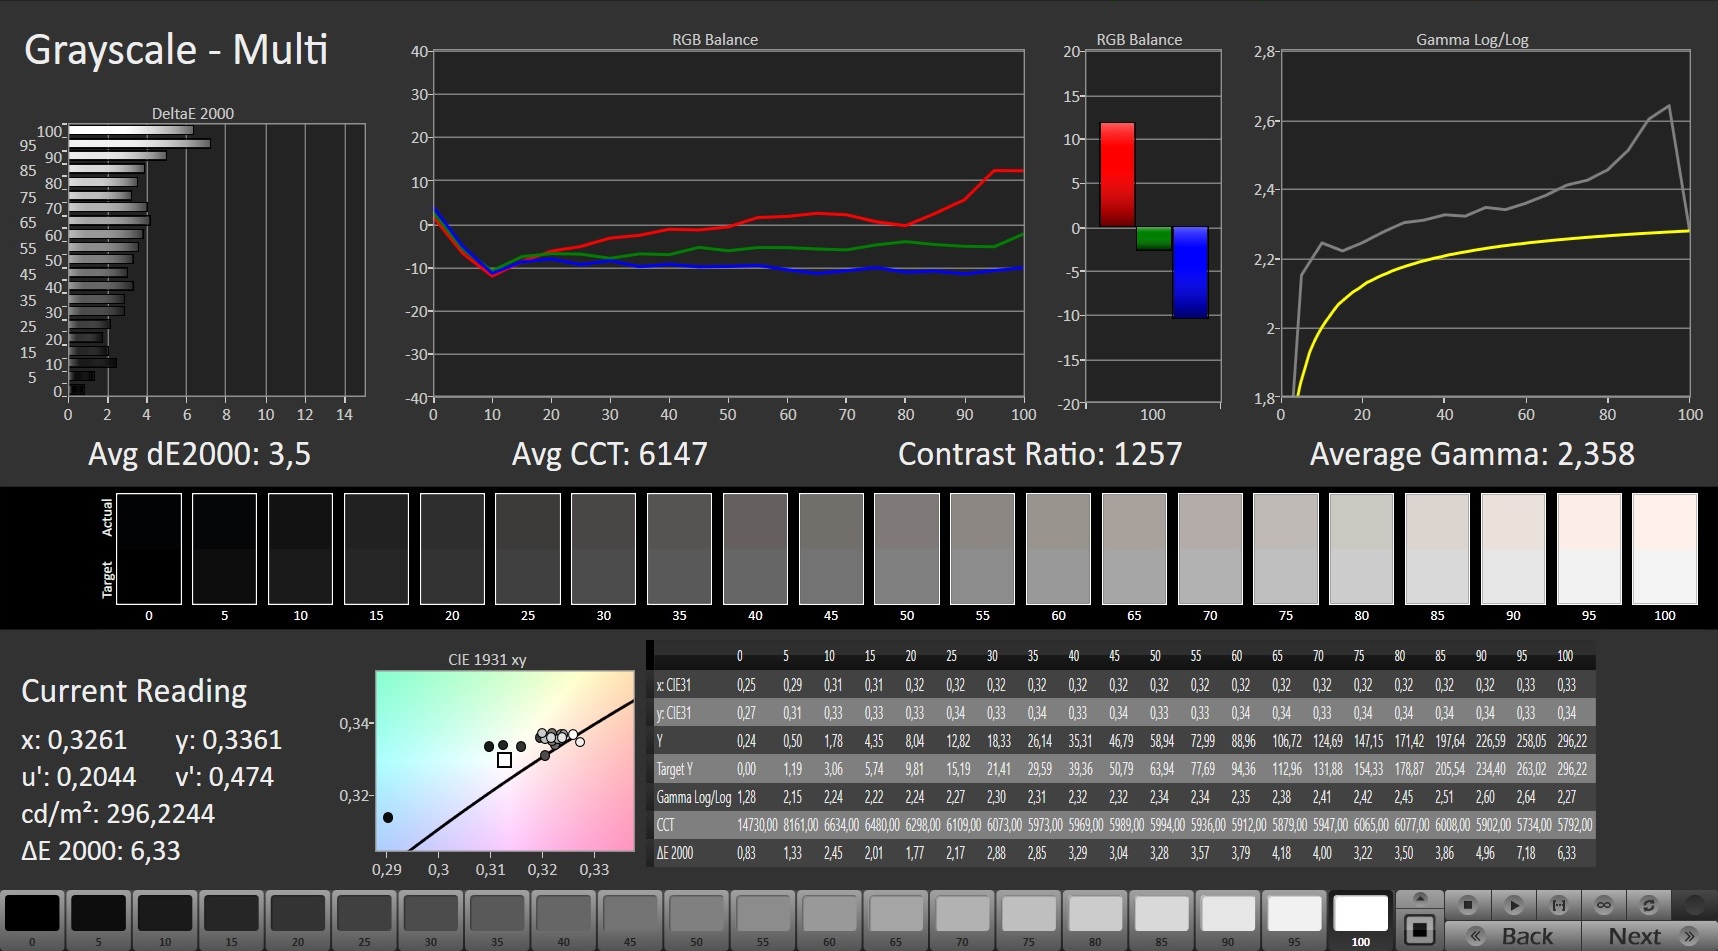
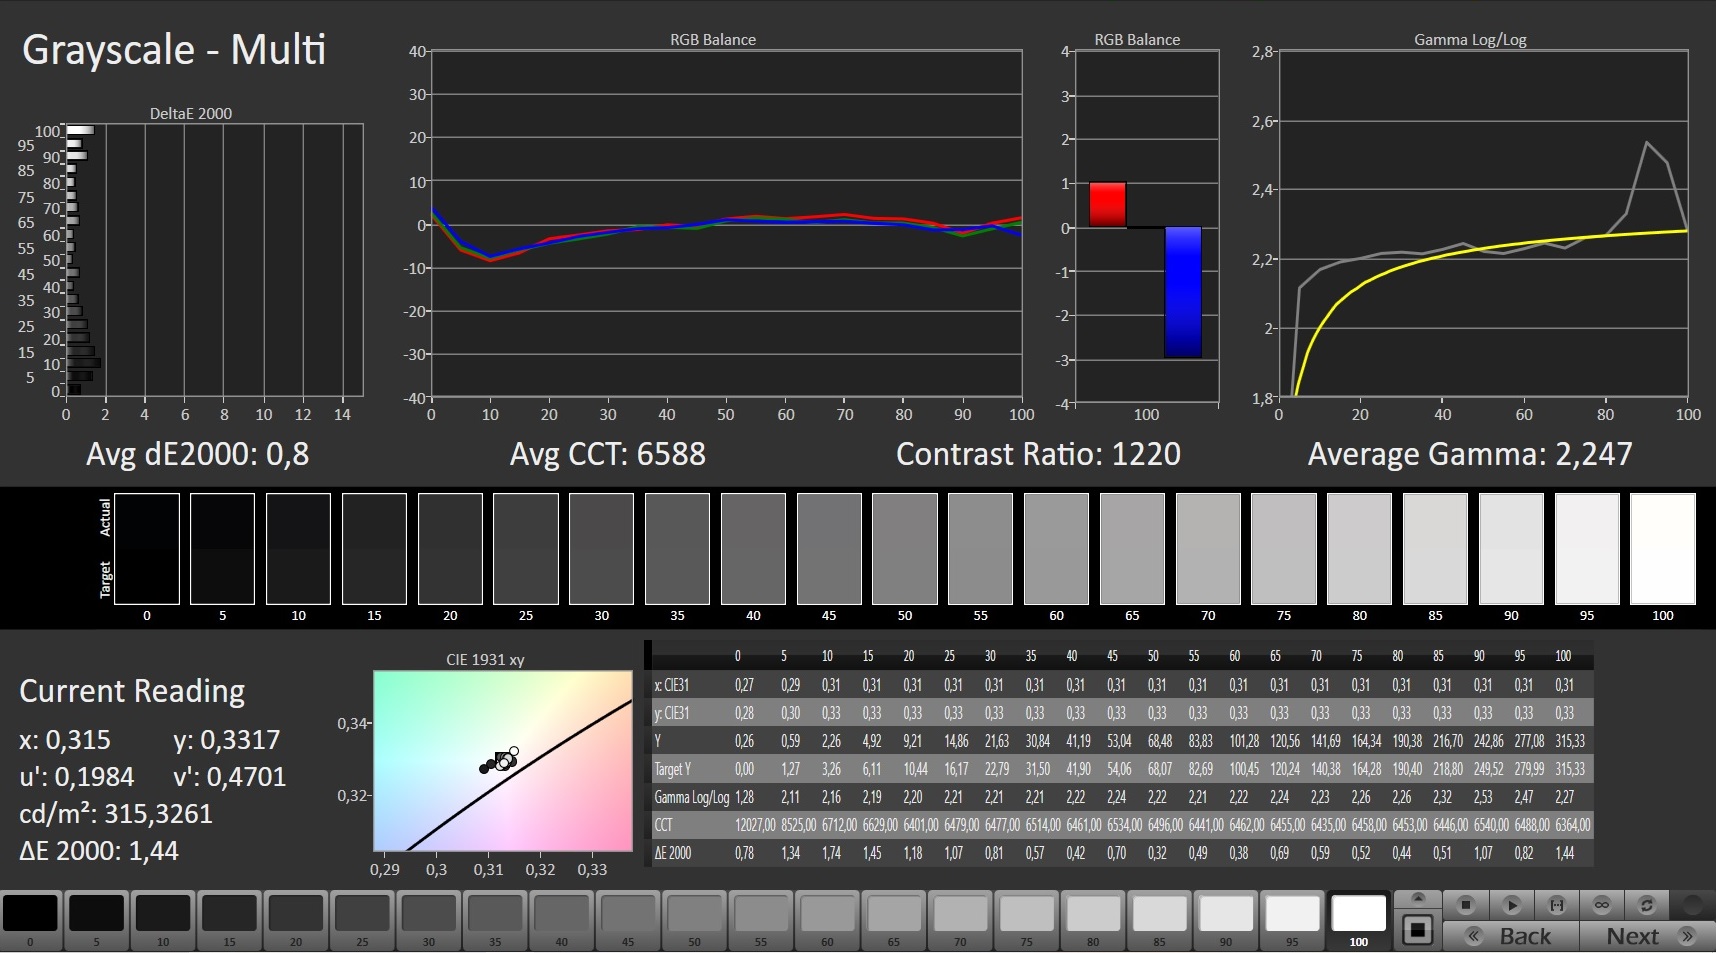
Si le contraste (1 192:1) de l'écran mat de 17,3 pouces (1 920 x 1 080 pixels) atteint l'objectif (> 1 000:1), la luminosité moyenne (282,4 cd/m²) est trop faible. Nous considérons que les valeurs supérieures à 300 cd/m² sont bonnes. L'écran présente également une répartition inégale de la luminosité. Cependant, le panneau 300 Hz a des temps de réponse rapides et ne présente aucun scintillement PWM
| |||||||||||||||||||||||||
Homogénéité de la luminosité: 73 %
Valeur mesurée au centre, sur batterie: 286 cd/m²
Contraste: 1192:1 (Valeurs des noirs: 0.24 cd/m²)
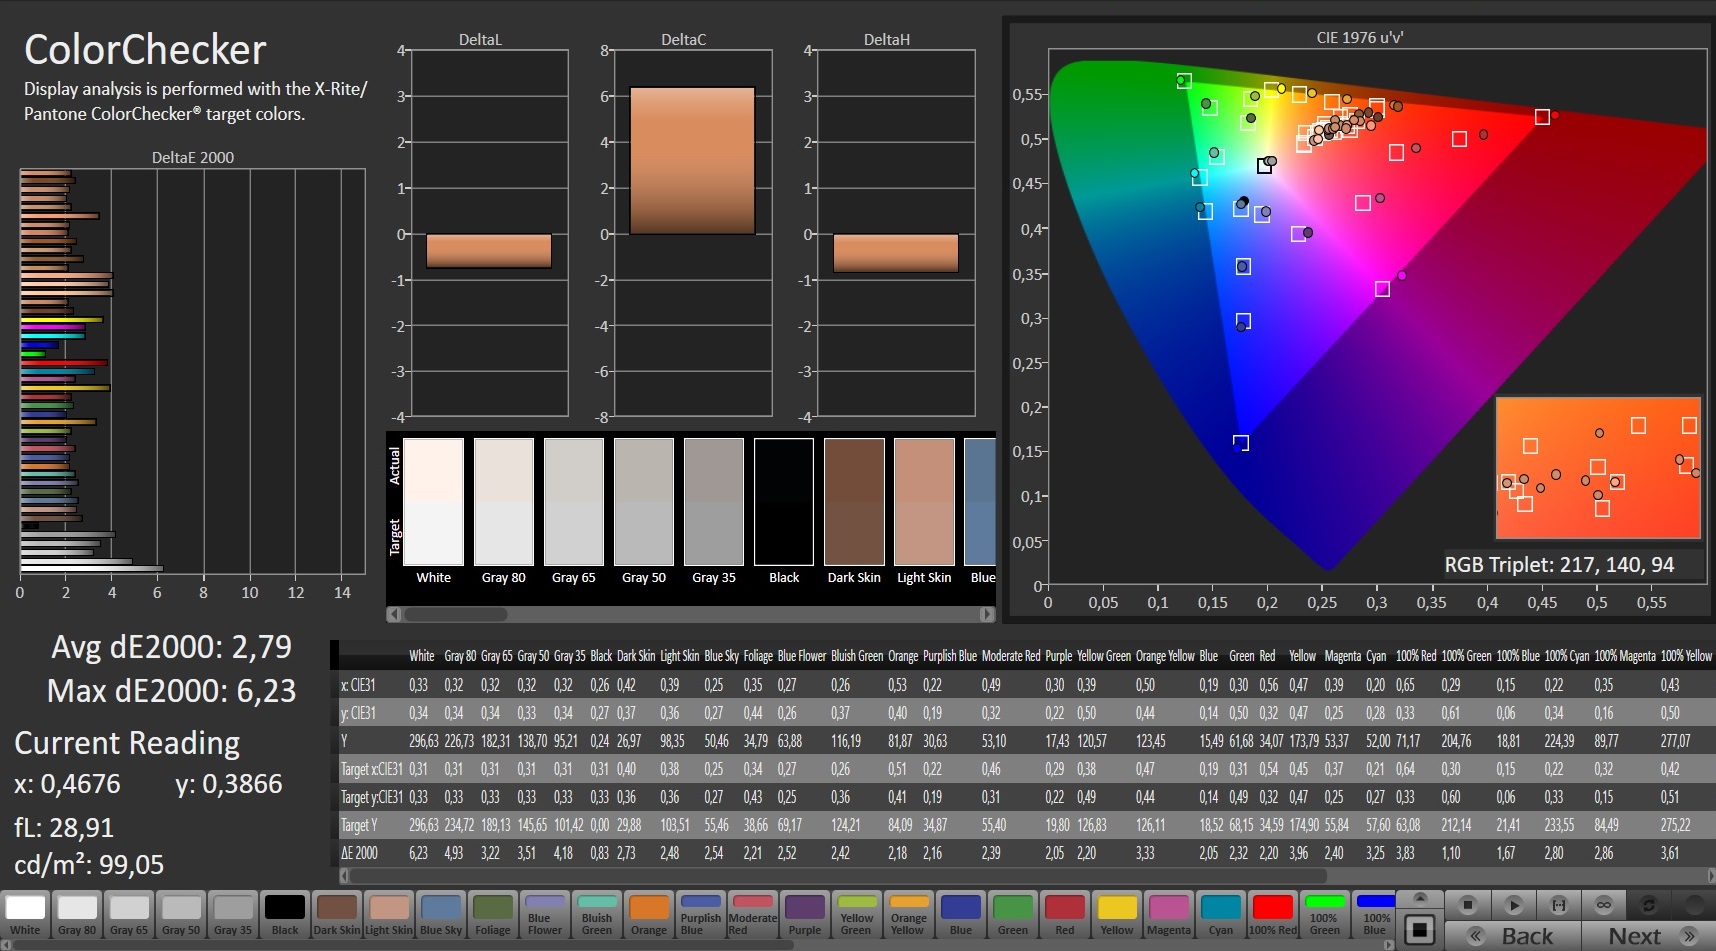
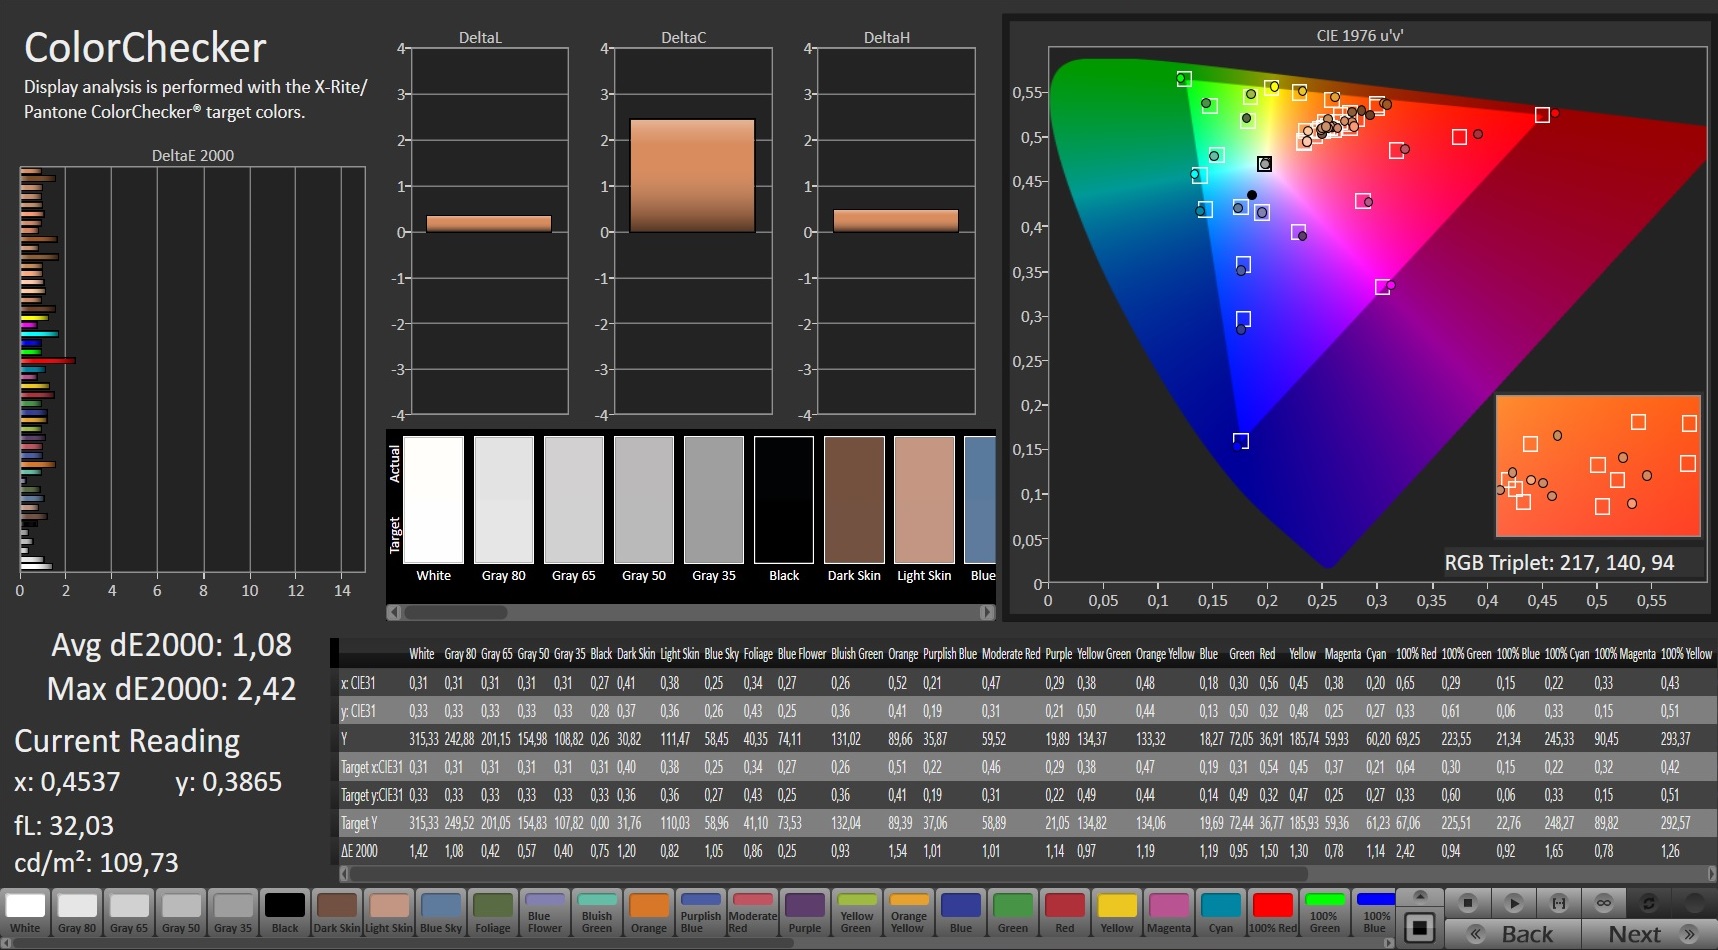
ΔE ColorChecker Calman: 2.79 | ∀{0.5-29.43 Ø4.73}
calibrated: 0.82
ΔE Greyscale Calman: 3.5 | ∀{0.09-98 Ø4.97}
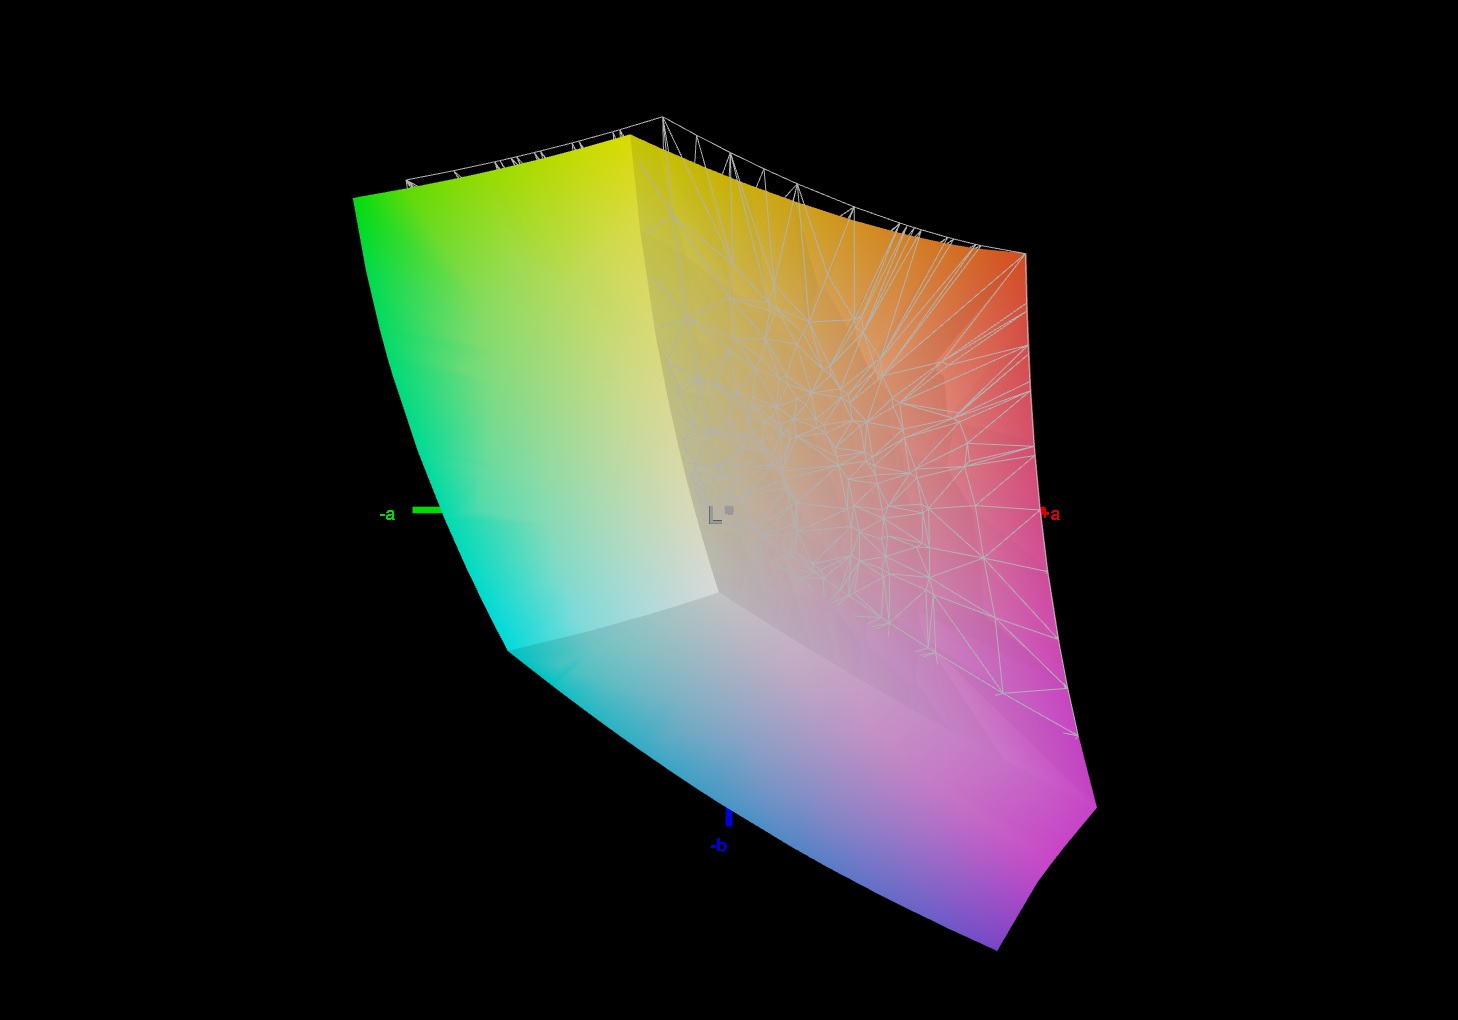
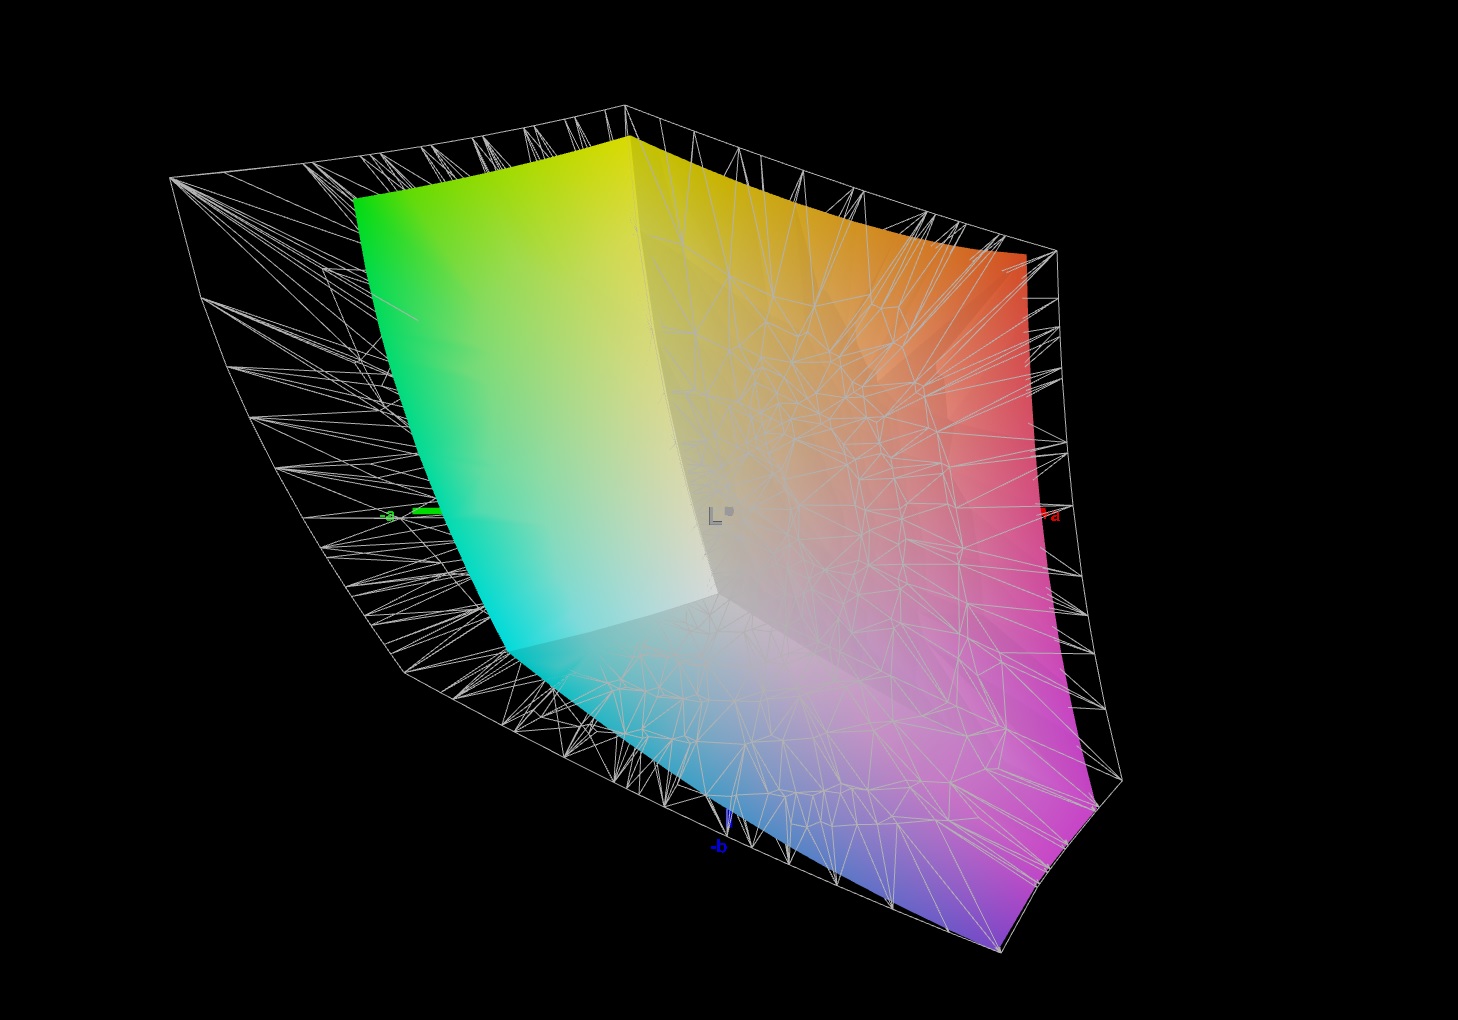
96% sRGB (Argyll 1.6.3 3D)
74% AdobeRGB 1998 (Argyll 1.6.3 3D)
73.7% AdobeRGB 1998 (Argyll 3D)
100% sRGB (Argyll 3D)
72.3% Display P3 (Argyll 3D)
Gamma: 2.358
CCT: 6147 K
| Aorus 17G YD Sharp LQ173M1JW04, IPS, 1920x1080, 17.3" | Asus Strix Scar 17 G733QSA-XS99 AU Optronics B173HAN05.4, IPS, 1920x1080, 17.3" | Lenovo Legion 7 16ACHg6 CSOT T3 MNG007DA1-1, IPS, 2560x1600, 16" | Schenker XMG Neo 17 (Early 2021, RTX 3070, 5800H) BOE NE173QHM-NY2 (BOE0977), IPS, 2560x1440, 17.3" | Aorus 17G XB AU Optronics B173HAN05.0 (AUO509D), IPS, 1920x1080, 17.3" | Alienware m17 R4 AU Optronics AUOEC91, IPS, 1920x1080, 17.3" | MSI GE76 Raider 10UH AU Optronics B173HAN05.1, IPS, 1920x1080, 17.3" | |
|---|---|---|---|---|---|---|---|
| Display | -2% | -2% | -2% | -2% | -2% | -1% | |
| Display P3 Coverage (%) | 72.3 | 71 -2% | 70.3 -3% | 70.5 -2% | 70.6 -2% | 69.8 -3% | 71.8 -1% |
| sRGB Coverage (%) | 100 | 99.4 -1% | 99.4 -1% | 99.5 0% | 97.2 -3% | 99.7 0% | 98.1 -2% |
| AdobeRGB 1998 Coverage (%) | 73.7 | 72.2 -2% | 72.7 -1% | 71.8 -3% | 72.8 -1% | 71.6 -3% | 73.9 0% |
| Response Times | 17% | 14% | -17% | -24% | 2% | -30% | |
| Response Time Grey 50% / Grey 80% * (ms) | 13.6 ? | 6.6 ? 51% | 14 ? -3% | 16.8 ? -24% | 16 ? -18% | 13.2 ? 3% | 20.4 ? -50% |
| Response Time Black / White * (ms) | 9.2 ? | 10.8 ? -17% | 6.4 ? 30% | 10 ? -9% | 12 ? -30% | 9.2 ? -0% | 10 ? -9% |
| PWM Frequency (Hz) | 151500 | ||||||
| Screen | 6% | 21% | 2% | 17% | 21% | -21% | |
| Brightness middle (cd/m²) | 286 | 303.8 6% | 489 71% | 410 43% | 293 2% | 305 7% | 324.6 13% |
| Brightness (cd/m²) | 282 | 292 4% | 469 66% | 381 35% | 285 1% | 301 7% | 312 11% |
| Brightness Distribution (%) | 73 | 85 16% | 92 26% | 88 21% | 95 30% | 93 27% | 87 19% |
| Black Level * (cd/m²) | 0.24 | 0.23 4% | 0.38 -58% | 0.37 -54% | 0.24 -0% | 0.19 21% | 0.28 -17% |
| Contrast (:1) | 1192 | 1321 11% | 1287 8% | 1108 -7% | 1221 2% | 1605 35% | 1159 -3% |
| Colorchecker dE 2000 * | 2.79 | 1.87 33% | 1.45 48% | 2.55 9% | 1.27 54% | 1.31 53% | 3.87 -39% |
| Colorchecker dE 2000 max. * | 6.23 | 3.26 48% | 2.16 65% | 4.33 30% | 2.24 64% | 2.32 63% | 9.35 -50% |
| Colorchecker dE 2000 calibrated * | 0.82 | 1.45 -77% | 1.16 -41% | 1.28 -56% | 1.06 -29% | 0.91 -11% | 1.42 -73% |
| Greyscale dE 2000 * | 3.5 | 2.7 23% | 1.6 54% | 3.4 3% | 1.34 62% | 2.3 34% | 6.5 -86% |
| Gamma | 2.358 93% | 2.26 97% | 2.197 100% | 2.275 97% | 2.38 92% | 2.281 96% | 2.23 99% |
| CCT | 6147 106% | 6436 101% | 6377 102% | 6637 98% | 6542 99% | 6449 101% | 5702 114% |
| Color Space (Percent of AdobeRGB 1998) (%) | 74 | 65.6 -11% | 73 -1% | 72 -3% | 73 -1% | 72 -3% | 66.3 -10% |
| Color Space (Percent of sRGB) (%) | 96 | 99.4 4% | 94 -2% | 95 -1% | 94 -2% | 94 -2% | 98 2% |
| Moyenne finale (programmes/paramètres) | 7% /
6% | 11% /
16% | -6% /
-1% | -3% /
8% | 7% /
14% | -17% /
-18% |
* ... Moindre est la valeur, meilleures sont les performances
Dès sa sortie de l'emballage, l'écran présente une bonne reproduction des couleurs et atteint l'objectif avec un écart de couleur de 2,79 (DeltaE inférieur à 3). De plus, il ne souffre pas d'une teinte bleue. L'étalonnage permet d'obtenir des améliorations. L'écart de couleur tombe à 1,08, et les niveaux de gris sont représentés de manière plus équilibrée. L'espace couleur sRGB est couvert à 100%, tandis que l'espace couleur AdobeRGB est couvert à 74%

Temps de réponse de l'écran
| ↔ Temps de réponse noir à blanc | ||
|---|---|---|
| 9.2 ms ... hausse ↗ et chute ↘ combinées | ↗ 5.2 ms hausse | 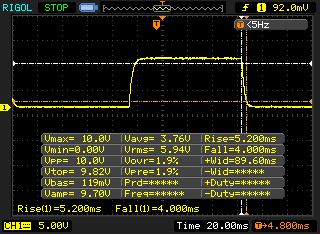 |
| ↘ 4 ms chute | ||
| L'écran montre de faibles temps de réponse, un bon écran pour jouer. En comparaison, tous les appareils testés affichent entre 0.1 (minimum) et 240 (maximum) ms. » 25 % des appareils testés affichent de meilleures performances. Cela signifie que les latences relevées sont meilleures que la moyenne (19.9 ms) de tous les appareils testés. | ||
| ↔ Temps de réponse gris 50% à gris 80% | ||
| 13.6 ms ... hausse ↗ et chute ↘ combinées | ↗ 6.8 ms hausse | 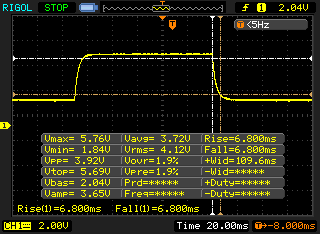 |
| ↘ 6.8 ms chute | ||
| L'écran montre de bons temps de réponse, mais insuffisant pour du jeu compétitif. En comparaison, tous les appareils testés affichent entre 0.165 (minimum) et 636 (maximum) ms. » 27 % des appareils testés affichent de meilleures performances. Cela signifie que les latences relevées sont meilleures que la moyenne (31.1 ms) de tous les appareils testés. | ||
Scintillement / MLI (Modulation de largeur d'impulsion)
| Scintillement / MLI (Modulation de largeur d'impulsion) non décelé | 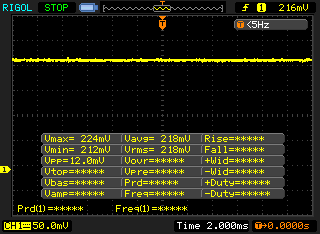 | ||
En comparaison, 52 % des appareils testés n'emploient pas MDI pour assombrir leur écran. Nous avons relevé une moyenne à 7798 (minimum : 5 - maximum : 343500) Hz dans le cas où une MDI était active. | |||
L'écran IPS à angle de vision stable est lisible dans toutes les positions. La lecture du contenu de l'écran en extérieur est possible lorsque le soleil n'est pas trop fort

Performance - Tiger Lake rencontre Ampère
Avec l'Aorus 17G YD, Gigabyte propose un ordinateur portable de 17,3 pouces pour le jeu, qui permet à tous les jeux modernes de s'afficher en douceur à l'écran et qui est également très performant dans tous les autres domaines d'application
Conditions d'essai
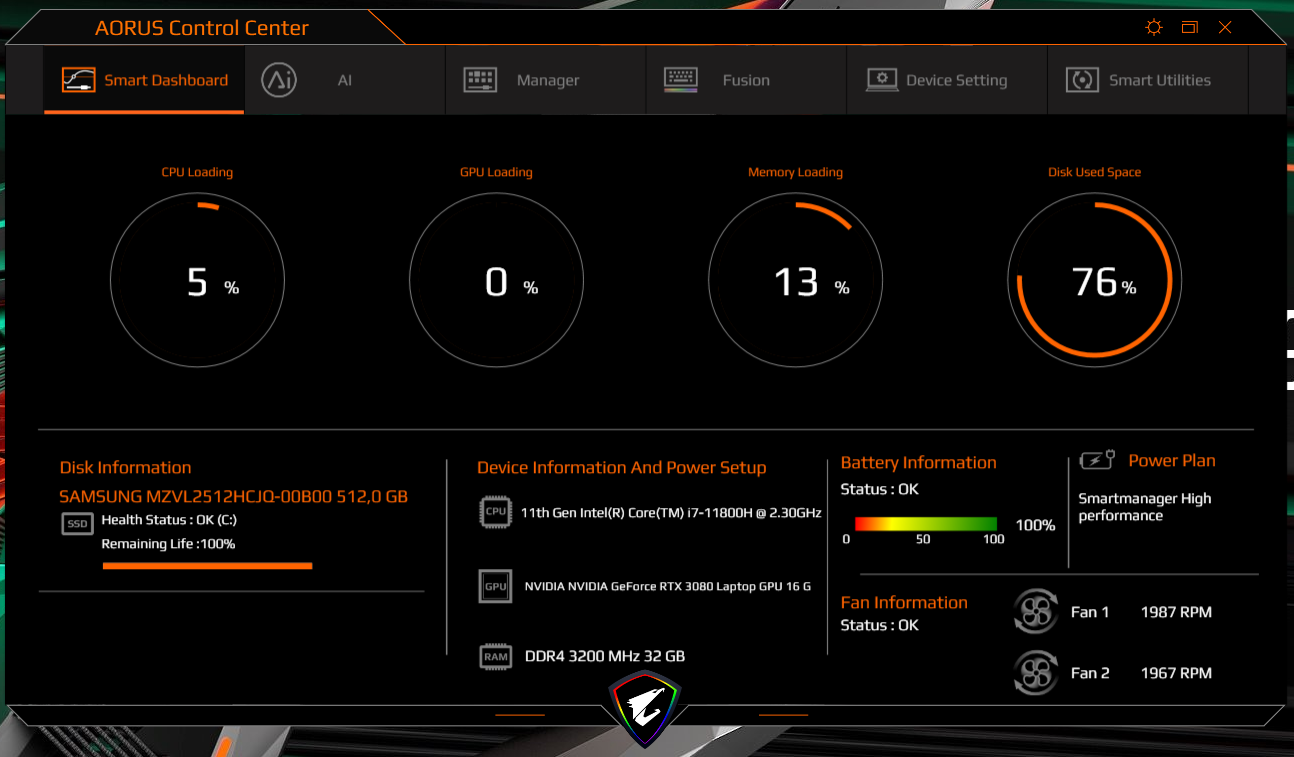
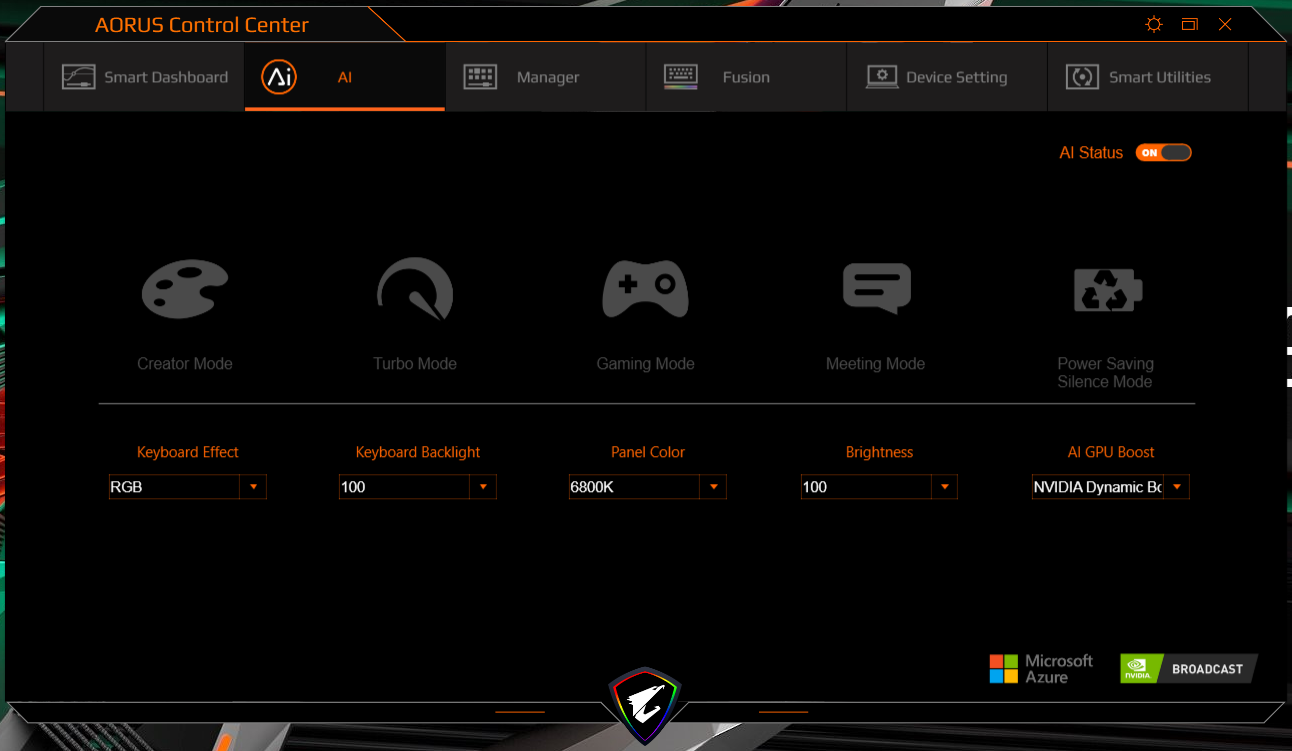
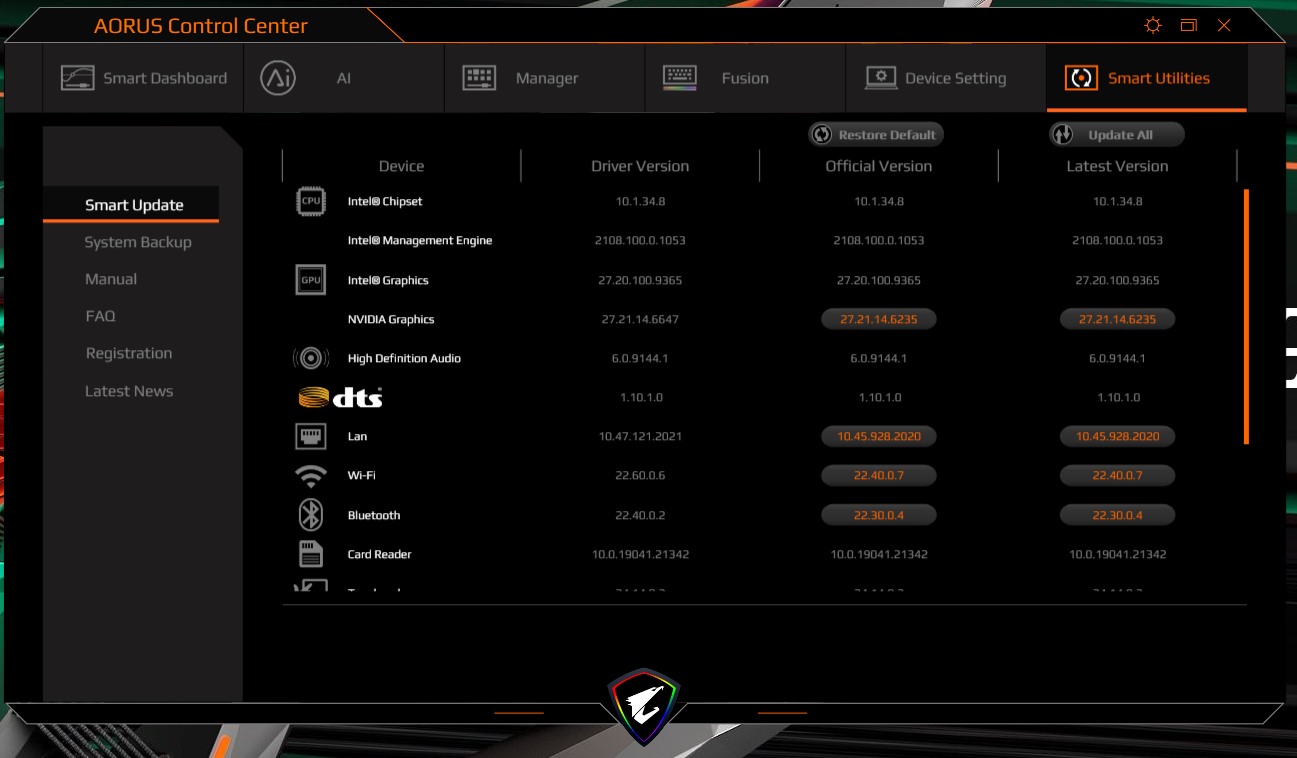
Le centre de contrôle Aorus préinstallé offre la possibilité de spécifier un profil énergétique, entre autres choses. Nous avons utilisé ici la fonction d'IA automatique. Ainsi, le centre de contrôle choisit lui-même les paramètres appropriés. Cela comprend non seulement la puissance de calcul et l'overclocking du CPU et du GPU, mais aussi la luminosité de l'écran, la température des couleurs et le rétroéclairage du clavier.
Certains benchmarks ont également été exécutés avec le profil "Turbo Mode" activé. Ce dernier permet au processeur et au GPU de fonctionner en permanence à des performances maximales. Par rapport à la sélection automatique du profil, les différences sont faibles. Ce profil n'est pas recommandé pour une utilisation prolongée car il fait tourner les ventilateurs à pleine puissance.

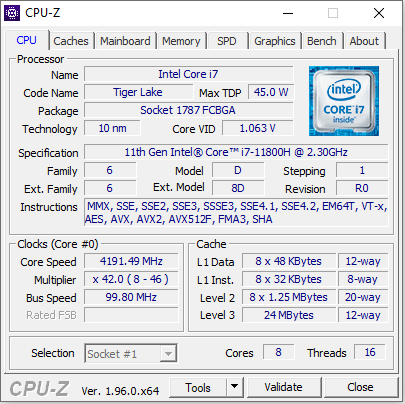
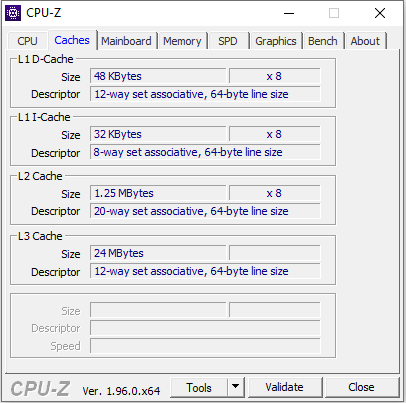
Processeur
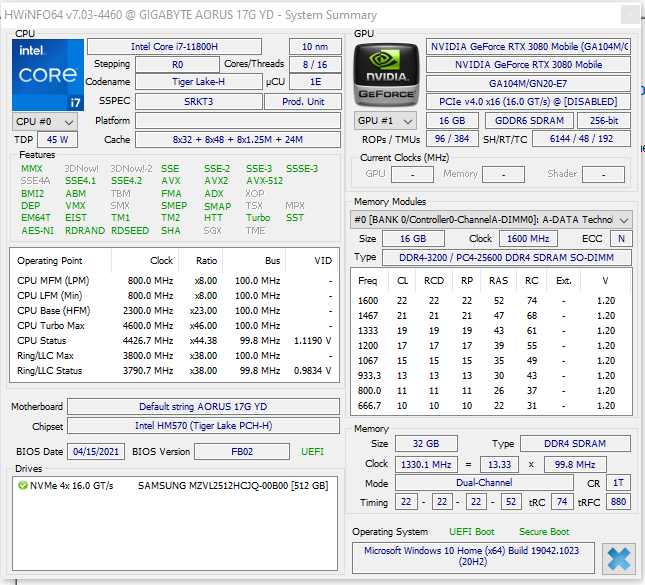
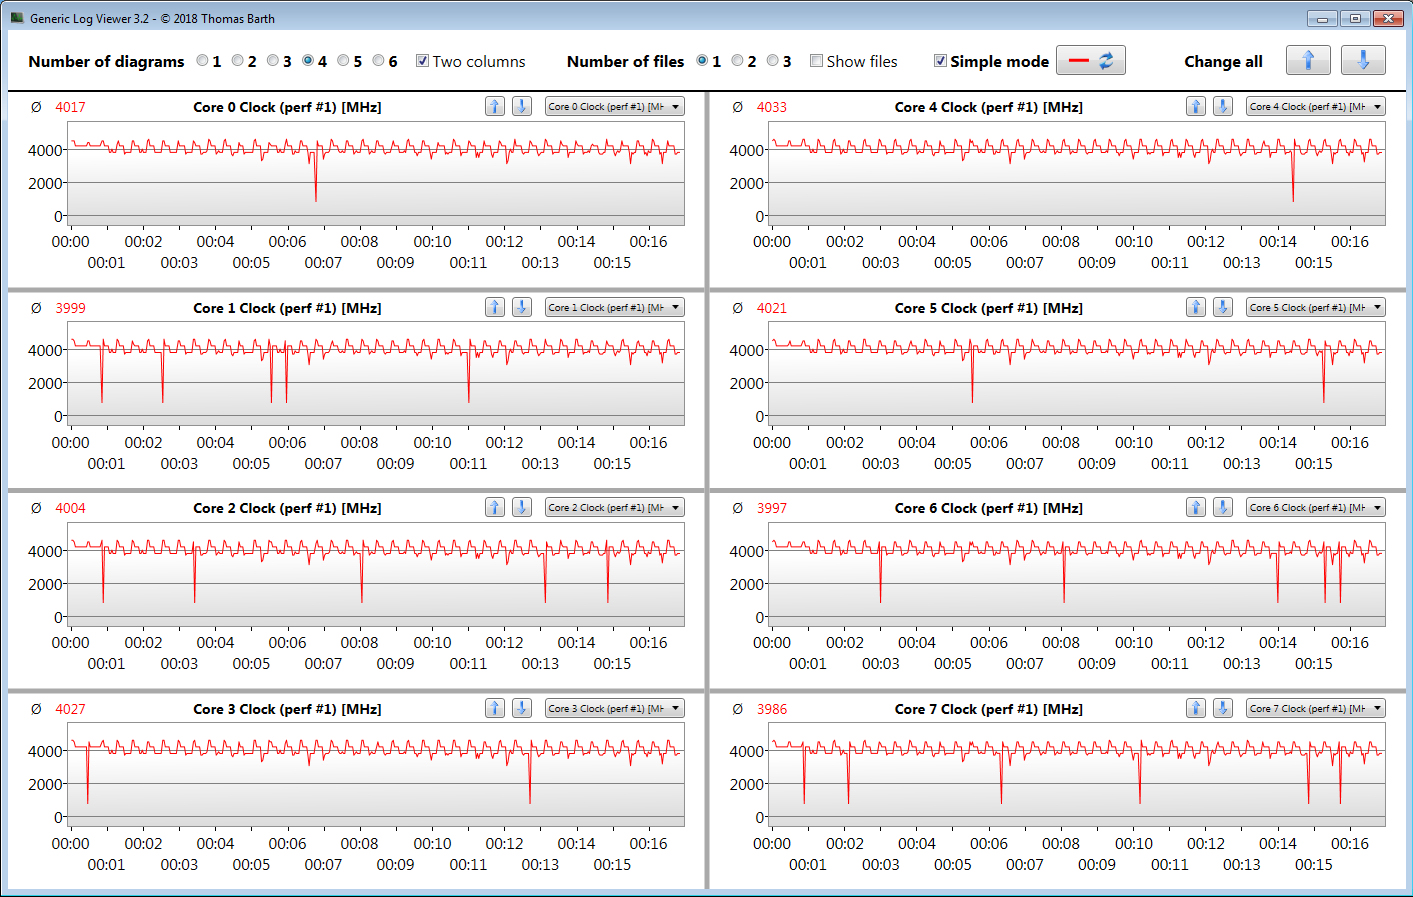
Le processeurocta-coreCore-i7-11800H (Tiger Lake) fonctionne à une vitesse d'horloge de base de 2,3 GHz. Une augmentation à 4,2 GHz (huit cœurs) ou 4,6 GHz (un cœur) est possible via Turbo. L'Hyper-Threading (deux threads par cœur) est pris en charge.
Les tests CPU du benchmark Cinebench R15 sont exécutés à 4,2 GHz (multithread) et 4,2 à 4,5 GHz (single-thread), respectivement. Sur batterie, le processeur fonctionne entre 1,6 et 4,3 GHz (multithread) et entre 3,2 et 4,5 GHz (single-thread).
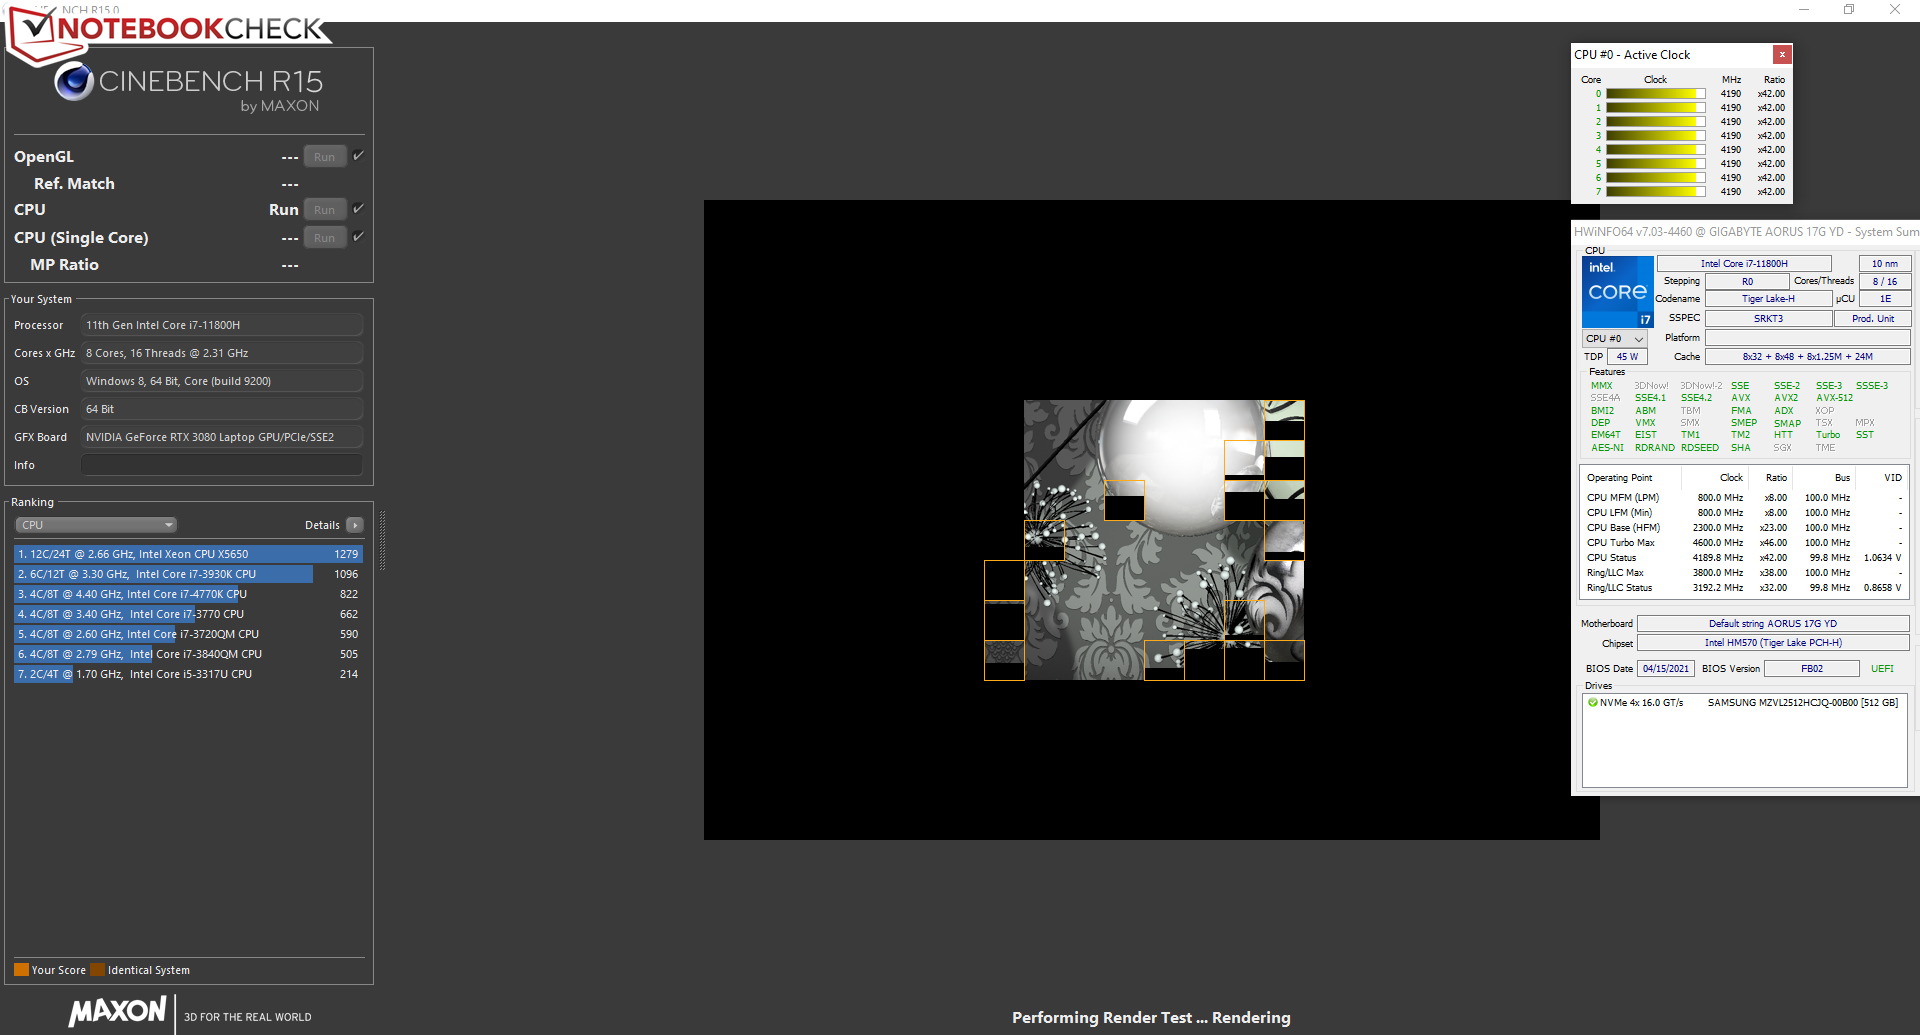
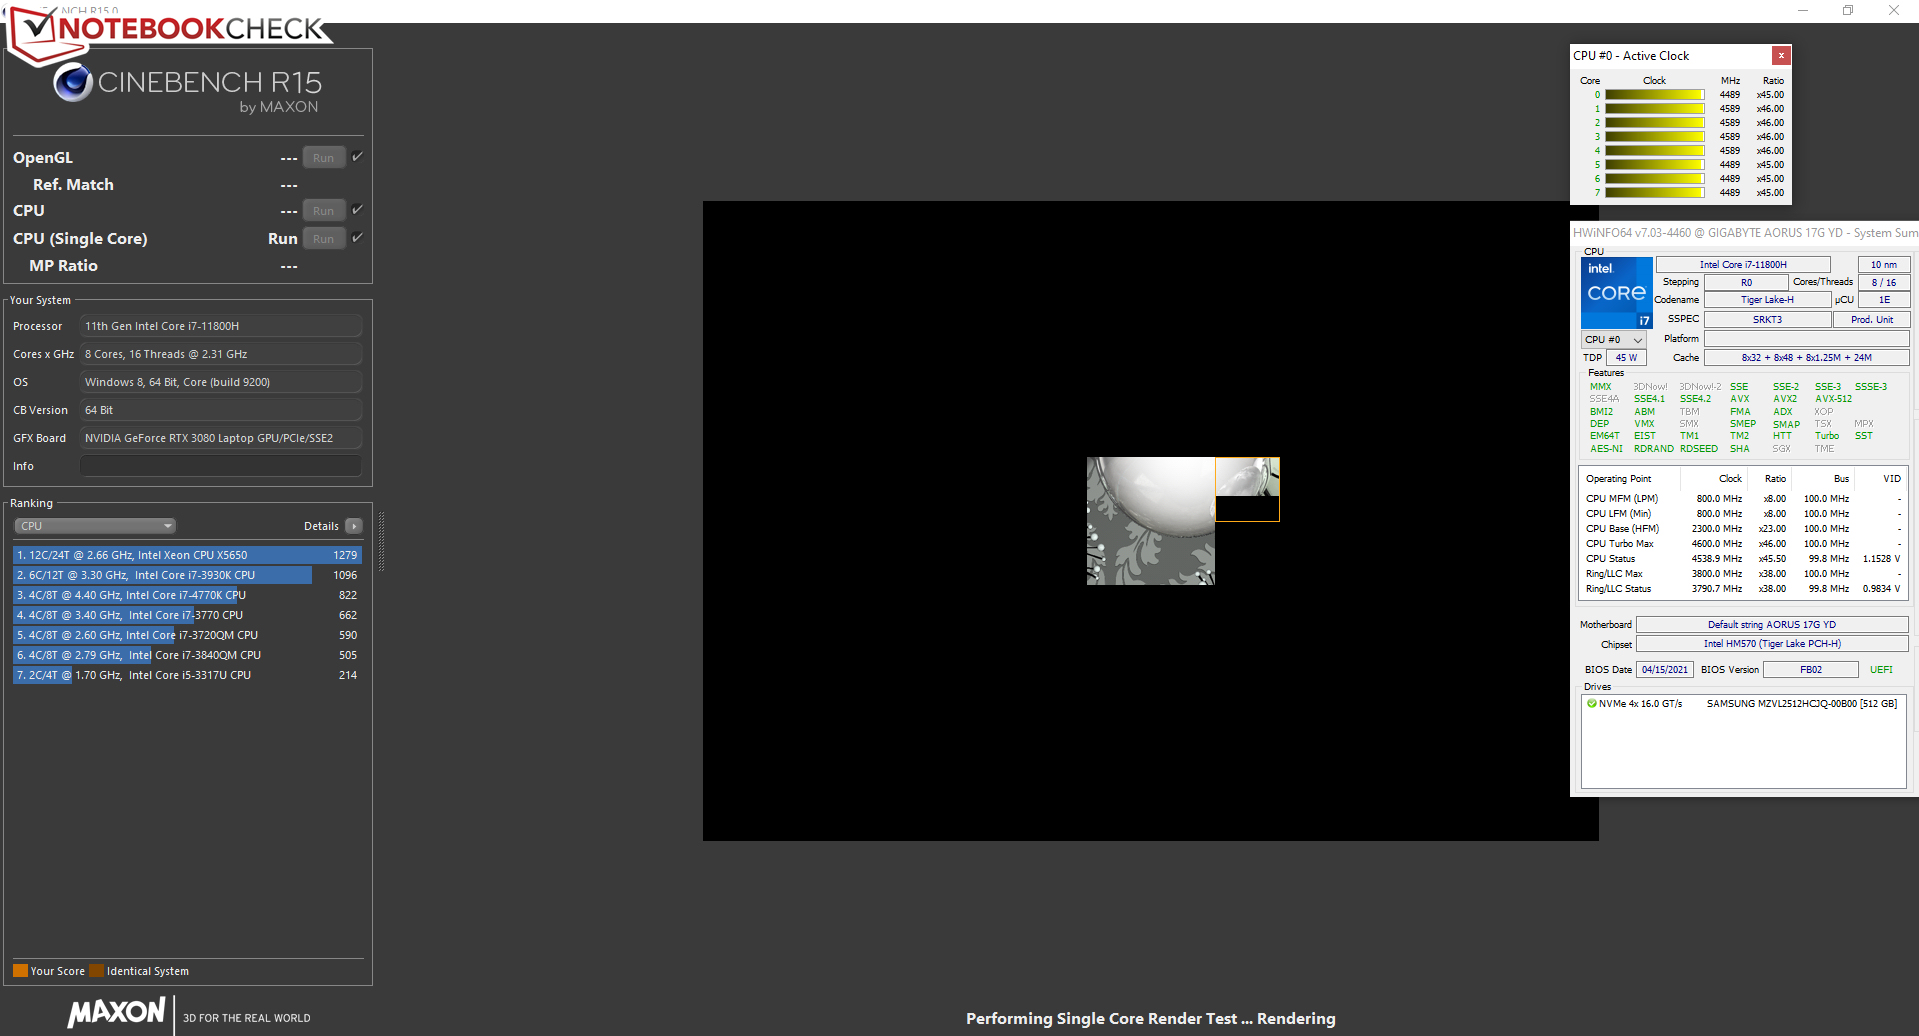
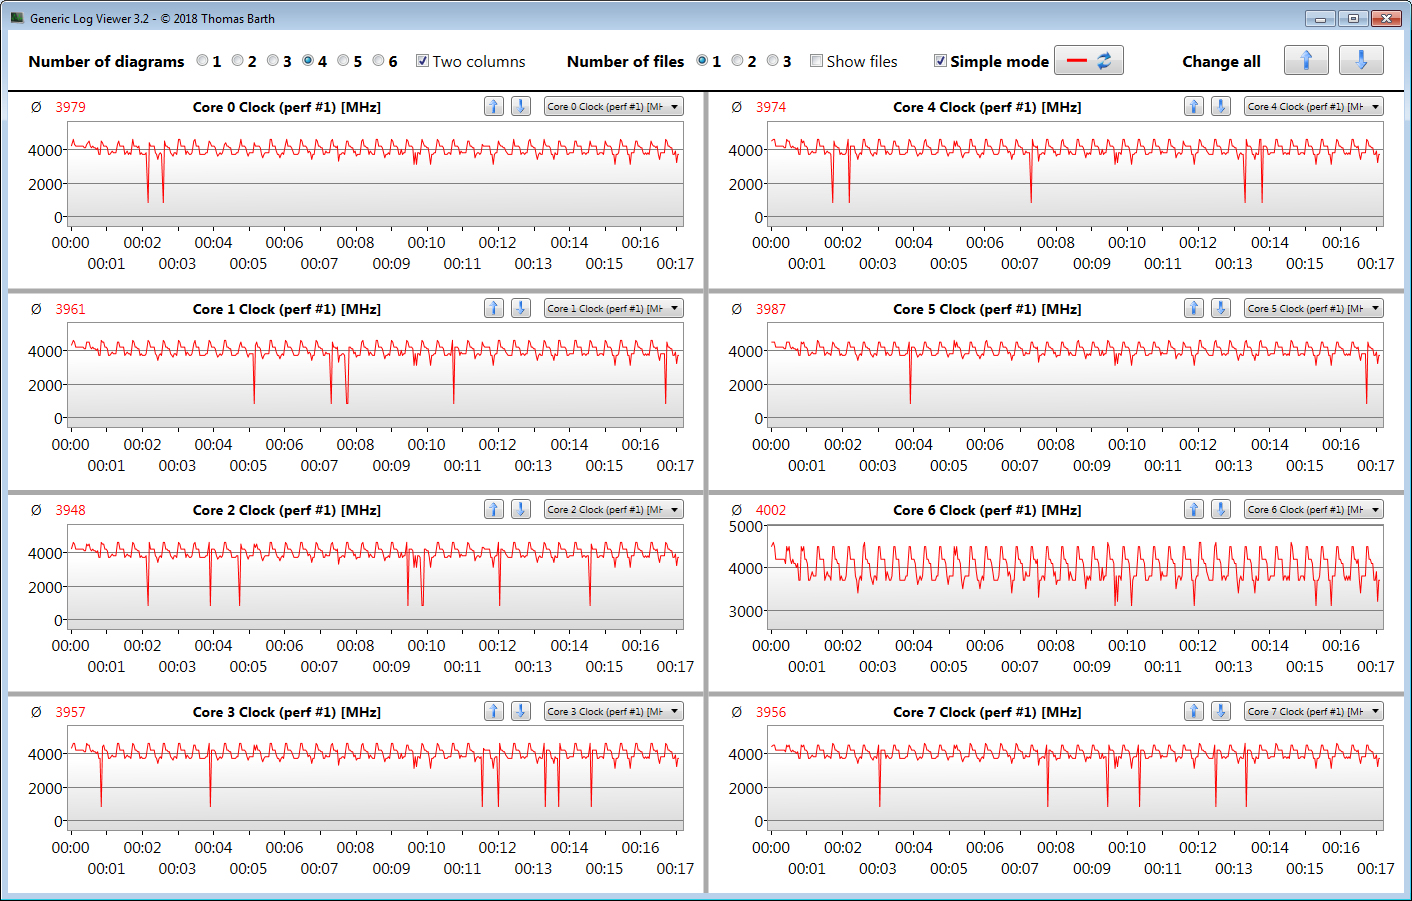
Nous vérifions si le CPU Turbo est également utilisé de manière constante lorsqu'il est branché en exécutant le test multithread du benchmark Cinebench R15 en boucle continue pendant au moins 30 minutes. Le Turbo fonctionne presque à pleine puissance.
| HWBOT x265 Benchmark v2.2 - 4k Preset | |
| Moyenne de la classe Gaming (11.5 - 44.3, n=111, 2 dernières années) | |
| Asus Strix Scar 17 G733QSA-XS99 | |
| Lenovo Legion 7 16ACHg6 | |
| Aorus 17G YD (Turbo Mode) | |
| Aorus 17G YD | |
| Schenker XMG Neo 17 (Early 2021, RTX 3070, 5800H) | |
| Alienware m17 R4 | |
| Moyenne Intel Core i7-11800H (7.38 - 17.4, n=46) | |
| MSI GE76 Raider 10UH | |
| Aorus 17G XB | |
* ... Moindre est la valeur, meilleures sont les performances
Performance du système
Le système fonctionne bien et sans problème. Nous n'avons rencontré aucun problème, hormis les latences élevées du DPC. Le matériel fournit une puissance de calcul plus que suffisante pour les applications exigeantes en termes de performances, comme les jeux. Cela s'accompagne de bons résultats dans PCMark
| PCMark 8 Home Score Accelerated v2 | 5265 points | |
| PCMark 8 Creative Score Accelerated v2 | 7359 points | |
| PCMark 8 Work Score Accelerated v2 | 7104 points | |
| PCMark 10 Score | 7073 points | |
Aide | ||
| PCMark 8 | |
| Home Score Accelerated v2 | |
| Moyenne de la classe Gaming (n=12 dernières années) | |
| Aorus 17G YD | |
| Moyenne Intel Core i7-11800H, NVIDIA GeForce RTX 3080 Laptop GPU (3941 - 5640, n=3) | |
| Work Score Accelerated v2 | |
| Aorus 17G YD | |
| Moyenne Intel Core i7-11800H, NVIDIA GeForce RTX 3080 Laptop GPU (4756 - 7104, n=3) | |
| Moyenne de la classe Gaming (n=12 dernières années) | |
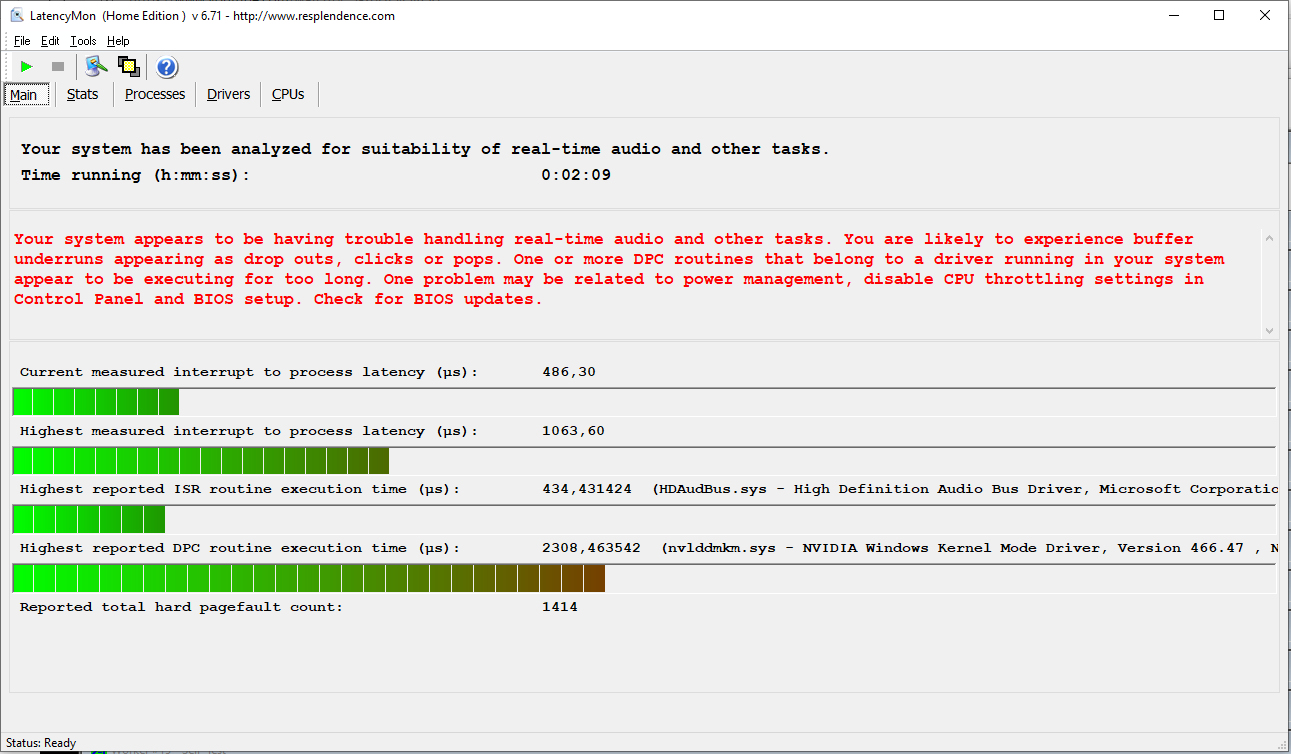
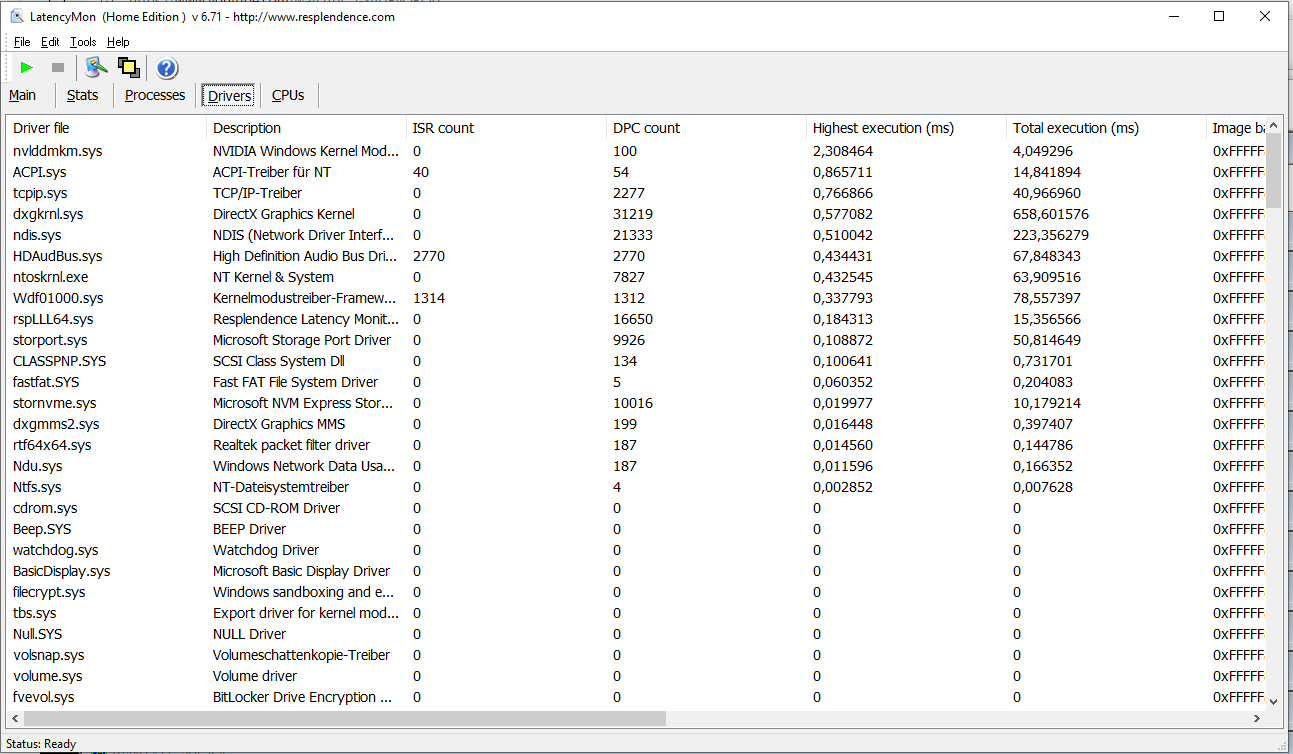
Latences DPC
Notre test de surveillance de la latence standardisée (navigation web, lecture vidéo 4K, Prime95 à forte charge) a révélé des problèmes de latences DPC. Le système ne semble pas adapté à l'édition vidéo et audio en temps réel
| DPC Latencies / LatencyMon - interrupt to process latency (max), Web, Youtube, Prime95 | |
| Aorus 17G XB | |
| Schenker XMG Neo 17 (Early 2021, RTX 3070, 5800H) | |
| MSI GP76 Leopard 10UG | |
| Aorus 17G YD | |
| Asus Strix Scar 17 G733QSA-XS99 | |
| Lenovo Legion 7 16ACHg6 | |
* ... Moindre est la valeur, meilleures sont les performances
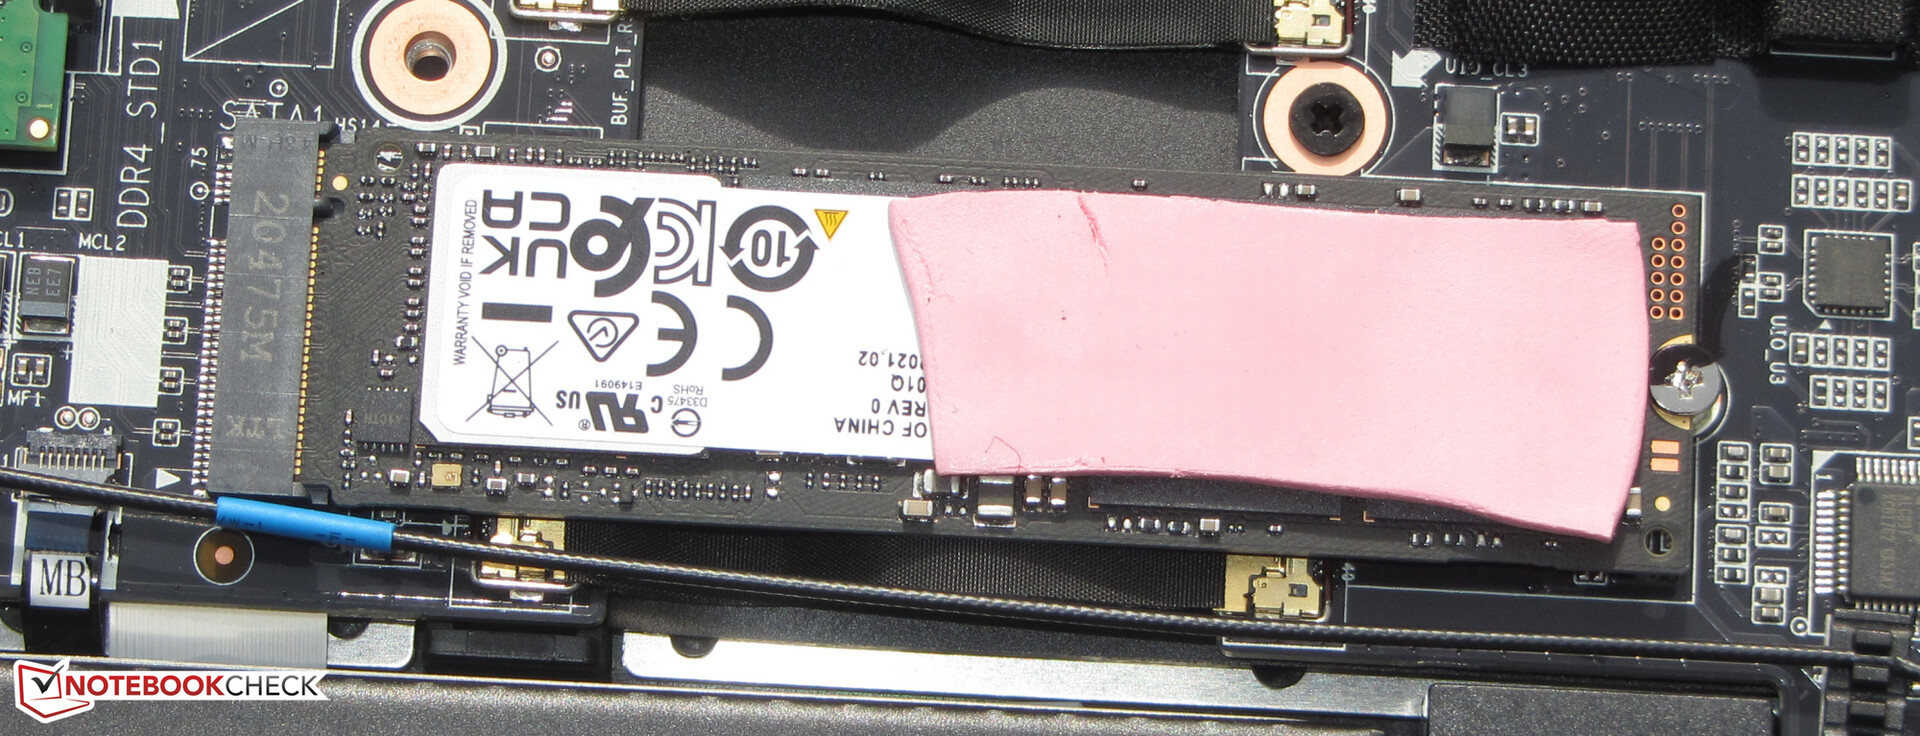
Stockage
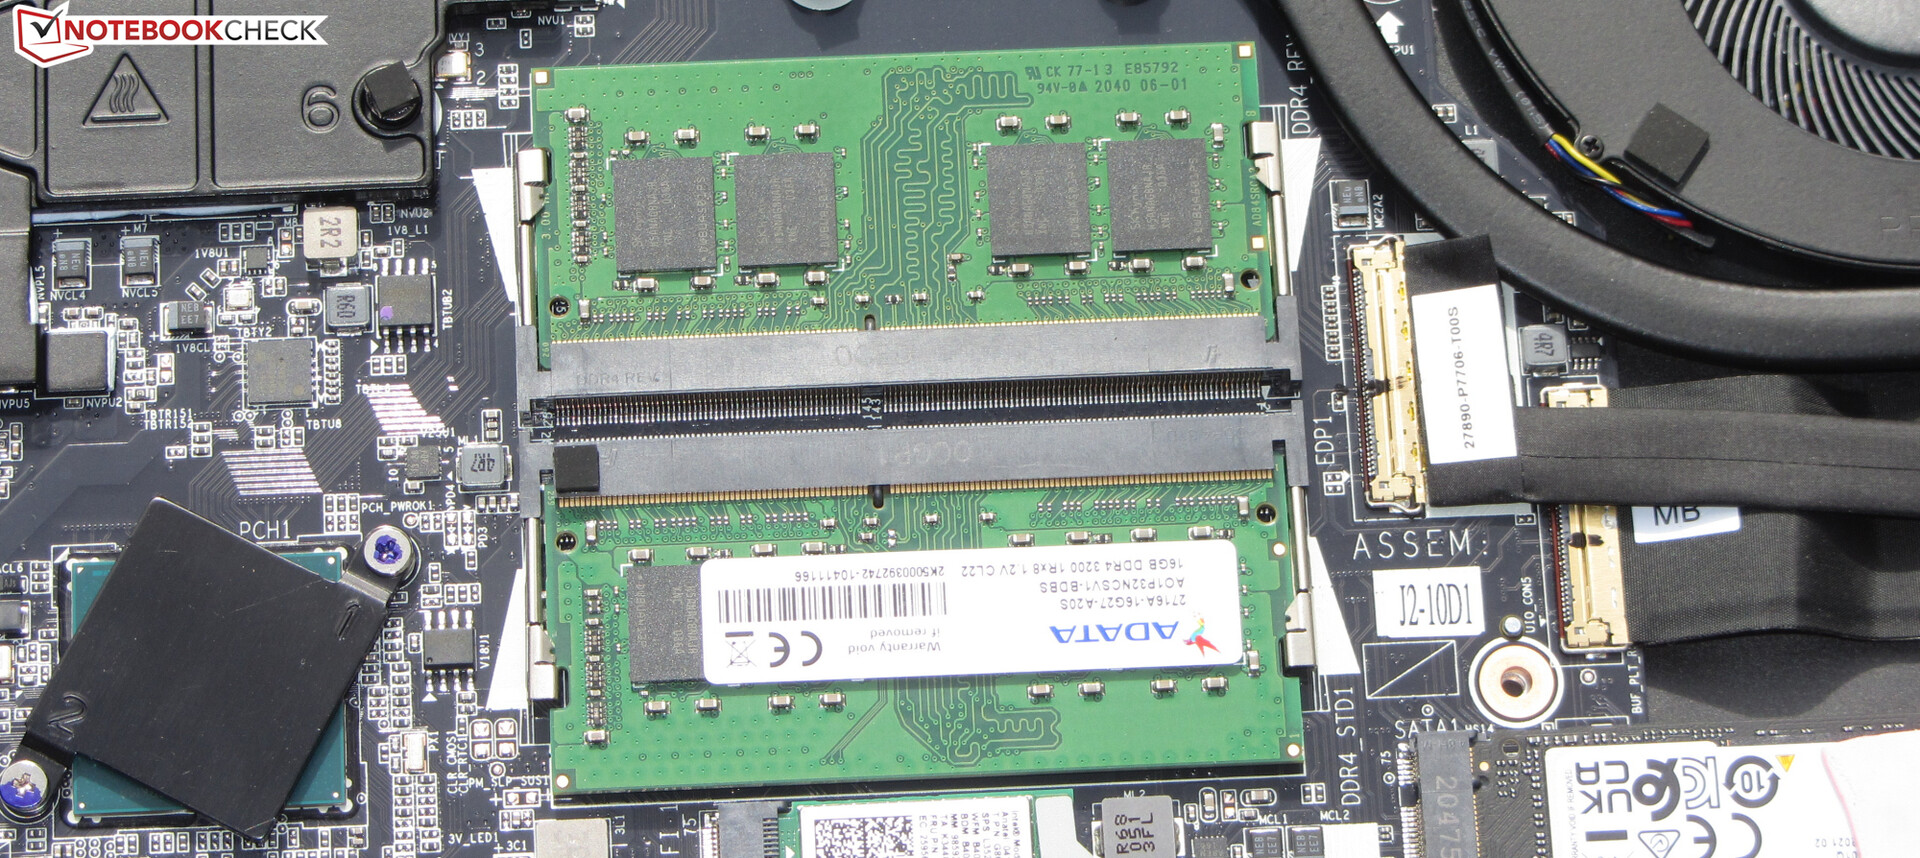
Un SSD NVMe (M.2-2280) de 512 Go de Samsung fait office de lecteur système, et il offre d'excellents taux de transfert grâce à sa connexion PCI Express 4.0. Au total, l'ordinateur portable peut accueillir deux SSD M.2-2280 (1x PCIe 4.0, 1x PCIe 3.0/SATA). Le RAID 0/1 n'est toutefois pas pris en charge

| Aorus 17G YD Samsung PM9A1 MZVL2512HCJQ | MSI GP76 Leopard 10UG Kingston OM8PCP3512F-AB | Asus Strix Scar 17 G733QSA-XS99 2x Samsung PM981a MZVLB1T0HBLR (RAID 0) | Lenovo Legion 7 16ACHg6 WDC PC SN730 SDBPNTY-1T00 | Schenker XMG Neo 17 (Early 2021, RTX 3070, 5800H) Samsung SSD 970 EVO Plus 500GB | Aorus 17G XB Samsung SSD PM981a MZVLB512HBJQ | Moyenne Samsung PM9A1 MZVL2512HCJQ | |
|---|---|---|---|---|---|---|---|
| CrystalDiskMark 5.2 / 6 | -50% | 36% | -12% | -4% | -17% | 12% | |
| Write 4K (MB/s) | 227.4 | 143.7 -37% | 235.9 4% | 157.6 -31% | 206.1 -9% | 123.4 -46% | 179.1 ? -21% |
| Read 4K (MB/s) | 91.3 | 45.1 -51% | 48.02 -47% | 48.97 -46% | 53 -42% | 45.02 -51% | 75.6 ? -17% |
| Write Seq (MB/s) | 2241 | 978 -56% | 4822 115% | 2789 24% | 3018 35% | 2526 13% | 3016 ? 35% |
| Read Seq (MB/s) | 4496 | 1163 -74% | 5043 12% | 2494 -45% | 2575 -43% | 2062 -54% | 3350 ? -25% |
| Write 4K Q32T1 (MB/s) | 661 | 519 -21% | 625 -5% | 456.7 -31% | 535 -19% | 497.9 -25% | 459 ? -31% |
| Read 4K Q32T1 (MB/s) | 712 | 302.7 -57% | 392.3 -45% | 575 -19% | 608 -15% | 579 -19% | 554 ? -22% |
| Write Seq Q32T1 (MB/s) | 1540 | 981 -36% | 5350 247% | 3088 101% | 3242 111% | 2982 94% | 4346 ? 182% |
| Read Seq Q32T1 (MB/s) | 6806 | 1983 -71% | 7130 5% | 3388 -50% | 3617 -47% | 3440 -49% | 6346 ? -7% |
| AS SSD | -59% | -9% | -30% | -9% | -25% | -12% | |
| Seq Read (MB/s) | 5150 | 1659 -68% | 4981 -3% | 2944 -43% | 3020 -41% | 1791 -65% | 4656 ? -10% |
| Seq Write (MB/s) | 3920 | 921 -77% | 3050 -22% | 2657 -32% | 2631 -33% | 2193 -44% | 2742 ? -30% |
| 4K Read (MB/s) | 46.6 | 51 9% | 57 22% | 41.86 -10% | 60.3 29% | 50.7 9% | 67 ? 44% |
| 4K Write (MB/s) | 145.8 | 120.1 -18% | 261.3 79% | 111.3 -24% | 171.6 18% | 116.8 -20% | 173.8 ? 19% |
| 4K-64 Read (MB/s) | 2071 | 463.5 -78% | 1205 -42% | 1733 -16% | 1410 -32% | 1525 -26% | 1514 ? -27% |
| 4K-64 Write (MB/s) | 3267 | 909 -72% | 1290 -61% | 2119 -35% | 2324 -29% | 1958 -40% | 2355 ? -28% |
| Access Time Read * (ms) | 0.078 | 0.179 -129% | 0.032 59% | 0.157 -101% | 0.045 42% | 0.07 10% | 0.04867 ? 38% |
| Access Time Write * (ms) | 0.029 | 0.032 -10% | 0.044 -52% | 0.035 -21% | 0.024 17% | 0.032 -10% | 0.03605 ? -24% |
| Score Read (Points) | 2633 | 680 -74% | 1760 -33% | 2070 -21% | 1773 -33% | 1755 -33% | 2047 ? -22% |
| Score Write (Points) | 2805 | 1121 -60% | 1857 -34% | 2496 -11% | 2759 -2% | 2294 -18% | 2778 ? -1% |
| Score Total (Points) | 7716 | 2130 -72% | 4428 -43% | 5607 -27% | 5429 -30% | 4972 -36% | 5812 ? -25% |
| Copy ISO MB/s (MB/s) | 3190 | 3357 5% | 2310 -28% | 2192 ? -31% | |||
| Copy Program MB/s (MB/s) | 987 | 966 -2% | 748 -24% | 629 ? -36% | |||
| Copy Game MB/s (MB/s) | 2096 | 2051 -2% | 1523 -27% | 1393 ? -34% | |||
| Moyenne finale (programmes/paramètres) | -55% /
-55% | 14% /
7% | -21% /
-24% | -7% /
-6% | -21% /
-22% | 0% /
-3% |
* ... Moindre est la valeur, meilleures sont les performances
Continuous load read: DiskSpd Read Loop, Queue Depth 8
Carte graphique
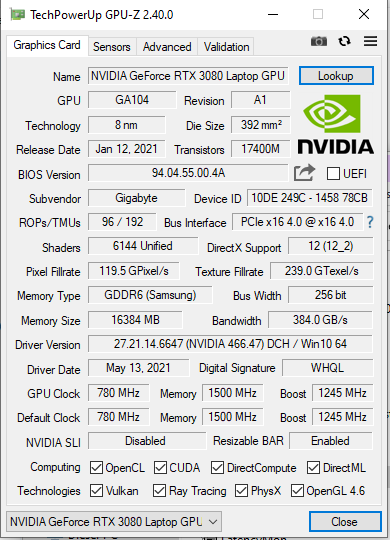
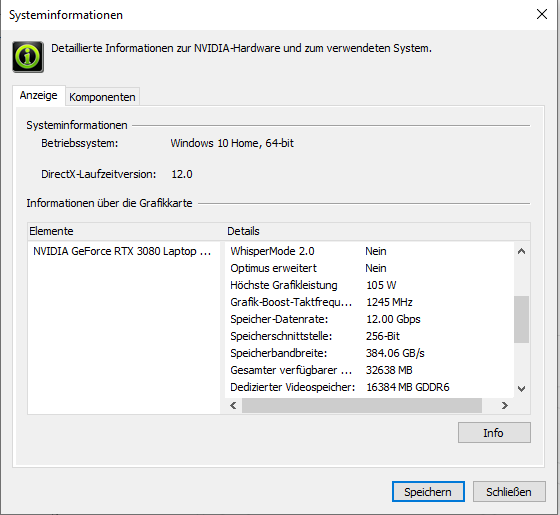
Les performances réelles d'un cœur graphique RTX 3000 dépendent du TGP maximal que le fabricant de l'ordinateur portable a choisi dans les limites définies par Nvidia. Avec un TGP de 105 watts (90 watts + 15 watts de Dynamic Boost), Gigabyte reste a opté pour la gamme inférieure des possibilités dans le cas du GeForce RTX 3080 laptopGPU installé ici (aperçu de tous les RTX 3080 laptops incluant leurs TGP).
Les résultats de 3DMark se situent entre la moyenne et en dessous de la moyenne par rapport aux ordinateurs portables RTX 3080 que nous avons testés jusqu'à présent. En raison du faible TGP, le 17G doit s'avouer vaincu face auMSI GP76 Leopard 10UGqui est équipé d'unGPU RTX 3070GeForce nominalement plus faible. Les limitations techniques de la RTX 3070 par rapport à la RTX 3080 sont plus que compensées par le TGP plus élevé (140 watts).
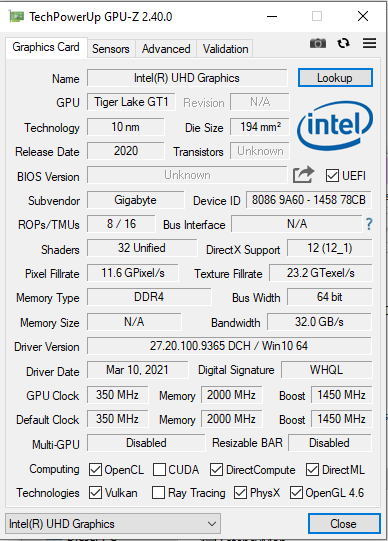
Le RTX 3080 peut accéder à la mémoire graphique rapide GDDR6 (16 Go). LeGPUUHD Graphics Xe 750 intégré au processeur est actif, et l'ordinateur portable fonctionne avec la solution de commutation graphique Optimus de Nvidia.
| 3DMark 11 Performance | 28733 points | |
| 3DMark Cloud Gate Standard Score | 49494 points | |
| 3DMark Fire Strike Score | 22898 points | |
| 3DMark Time Spy Score | 10195 points | |
Aide | ||
Performances de jeu
Le matériel installé permet d'afficher à l'écran tous les jeux les plus récents en toute fluidité. La résolution Full HD et le niveau de qualité maximal peuvent généralement être sélectionnés. Le GPU peut également gérer des résolutions supérieures à la Full HD (pour cela, il faut connecter un moniteur approprié), avec des paramètres de qualité réduits dans certains cas.
Comparé aux ordinateurs portables RTX 3080 testés jusqu'à présent, le 17G a des performances décentes et offre des taux de trame moyens à légèrement inférieurs à la moyenne.
| The Witcher 3 - 1920x1080 Ultra Graphics & Postprocessing (HBAO+) | |
| Moyenne de la classe Gaming (95 - 240, n=8, 2 dernières années) | |
| Lenovo Legion 7 16ACHg6 | |
| MSI GP76 Leopard 10UG | |
| Aorus 17G YD | |
| Asus Strix Scar 17 G733QSA-XS99 | |
| Moyenne NVIDIA GeForce RTX 3080 Laptop GPU (85.1 - 123, n=40) | |
| Schenker XMG Neo 17 (Early 2021, RTX 3070, 5800H) | |
| Aorus 17G XB | |
| Dota 2 Reborn - 1920x1080 ultra (3/3) best looking | |
| Moyenne de la classe Gaming (84.8 - 248, n=113, 2 dernières années) | |
| Aorus 17G YD | |
| Aorus 17G XB | |
| Schenker XMG Neo 17 (Early 2021, RTX 3070, 5800H) | |
| Aorus 17G YD (Turbo Mode) | |
| Moyenne NVIDIA GeForce RTX 3080 Laptop GPU (98 - 156, n=45) | |
| Lenovo Legion 7 16ACHg6 | |
| Asus Strix Scar 17 G733QSA-XS99 | |
| MSI GP76 Leopard 10UG | |
| X-Plane 11.11 - 1920x1080 high (fps_test=3) | |
| Moyenne de la classe Gaming (52.1 - 143.5, n=116, 2 dernières années) | |
| Aorus 17G XB | |
| Moyenne NVIDIA GeForce RTX 3080 Laptop GPU (65.6 - 113, n=44) | |
| Aorus 17G YD (Turbo Mode) | |
| Aorus 17G YD | |
| Lenovo Legion 7 16ACHg6 | |
| MSI GP76 Leopard 10UG | |
| Asus Strix Scar 17 G733QSA-XS99 | |
| Schenker XMG Neo 17 (Early 2021, RTX 3070, 5800H) | |
| Final Fantasy XV Benchmark - 1920x1080 High Quality | |
| Moyenne de la classe Gaming (41 - 215, n=104, 2 dernières années) | |
| Lenovo Legion 7 16ACHg6 (1.3) | |
| Asus Strix Scar 17 G733QSA-XS99 (1.3) | |
| Moyenne NVIDIA GeForce RTX 3080 Laptop GPU (55.5 - 115, n=34) | |
| Aorus 17G YD (1.3, Turbo Mode) | |
| Aorus 17G YD (1.3) | |
| MSI GP76 Leopard 10UG | |
| Strange Brigade - 1920x1080 ultra AA:ultra AF:16 | |
| Moyenne de la classe Gaming (76.3 - 456, n=94, 2 dernières années) | |
| Lenovo Legion 7 16ACHg6 (1.47.22.14 D3D12) | |
| Moyenne NVIDIA GeForce RTX 3080 Laptop GPU (117 - 219, n=34) | |
| Asus Strix Scar 17 G733QSA-XS99 (1.47.22.14 D3D12) | |
| Aorus 17G YD (1.47.22.14 D3D12) | |
| Dirt 5 - 1920x1080 Ultra High Preset | |
| Lenovo Legion 7 16ACHg6 | |
| Aorus 17G YD | |
| Moyenne NVIDIA GeForce RTX 3080 Laptop GPU (52 - 110, n=11) | |
Afin de vérifier si les fréquences d'images restent largement constantes sur une période prolongée, nous avons laissé le jeu The Witcher 3 tourner pendant environ 60 minutes en résolution Full HD et avec les paramètres de qualité maximum. Le personnage n'est pas déplacé. Une baisse des taux d'images n'a pas été constatée
| Bas | Moyen | Élevé | Ultra | |
|---|---|---|---|---|
| GTA V (2015) | 183 | 176 | 158 | 95.7 |
| The Witcher 3 (2015) | 365 | 267 | 183 | 106 |
| Dota 2 Reborn (2015) | 164 | 146 | 139 | 130 |
| Final Fantasy XV Benchmark (2018) | 172 | 123 | 93.8 | |
| X-Plane 11.11 (2018) | 123 | 103 | 82.9 | |
| Far Cry 5 (2018) | 153 | 119 | 115 | 108 |
| Strange Brigade (2018) | 420 | 225 | 184 | 163 |
| Horizon Zero Dawn (2020) | 133 | 119 | 109 | 100 |
| Serious Sam 4 (2020) | 152 | 107 | 93.6 | 85 |
| Dirt 5 (2020) | 178 | 123 | 104 | 87.5 |
| Yakuza Like a Dragon (2020) | 141 | 121 | 117 | 108 |
| Outriders (2021) | 119 | 101 | 110 | 106 |
| Mass Effect Legendary Edition (2021) | 135 | 115 | ||
| Days Gone (2021) | 175 | 139 | 126 | 98.2 |
Emissions - L'ordinateur portable Aorus est très bruyant sous charge
Émissions sonores
Même en utilisation au ralenti, les ventilateurs sont parfois clairement audibles avec des niveaux de pression sonore allant jusqu'à 39 dB(A). Le bruit est encore plus fort en charge avec des niveaux de pression sonore maximum de 61 dB(A) (test de stress) et 52 dB(A)( testThe Witcher 3 ), respectivement. L'utilisation d'un casque est pratiquement inévitable
Degré de la nuisance sonore
| Au repos |
| 32 / 33 / 39 dB(A) |
| Fortement sollicité |
| 43 / 61 dB(A) |
 | ||
30 dB silencieux 40 dB(A) audible 50 dB(A) bruyant |
||
min: | ||
| Aorus 17G YD i7-11800H, GeForce RTX 3080 Laptop GPU | MSI GP76 Leopard 10UG i7-10750H, GeForce RTX 3070 Laptop GPU | Asus Strix Scar 17 G733QSA-XS99 R9 5900HX, GeForce RTX 3080 Laptop GPU | Lenovo Legion 7 16ACHg6 R9 5900HX, GeForce RTX 3080 Laptop GPU | Schenker XMG Neo 17 (Early 2021, RTX 3070, 5800H) R7 5800H, GeForce RTX 3070 Laptop GPU | Aorus 17G XB i7-10875H, GeForce RTX 2070 Super Max-Q | Moyenne de la classe Gaming | |
|---|---|---|---|---|---|---|---|
| Noise | 4% | 18% | 10% | 2% | -3% | 12% | |
| arrêt / environnement * (dB) | 25 | 24 4% | 25 -0% | 26 -4% | 24 4% | 30 -20% | 24.1 ? 4% |
| Idle Minimum * (dB) | 32 | 25 22% | 25.2 21% | 26 19% | 29 9% | 35 -9% | 25.8 ? 19% |
| Idle Average * (dB) | 33 | 32 3% | 25.2 24% | 30 9% | 32 3% | 36 -9% | 27.5 ? 17% |
| Idle Maximum * (dB) | 39 | 34 13% | 25.2 35% | 35 10% | 38 3% | 41 -5% | 30 ? 23% |
| Load Average * (dB) | 43 | 54 -26% | 30.7 29% | 40 7% | 49 -14% | 47 -9% | 43.1 ? -0% |
| Witcher 3 ultra * (dB) | 52 | 51 2% | 51.3 1% | 46 12% | 53 -2% | 48 8% | |
| Load Maximum * (dB) | 61 | 54 11% | 51.3 16% | 50 18% | 55 10% | 49 20% | 54 ? 11% |
* ... Moindre est la valeur, meilleures sont les performances
Température
Notre test de stress (Prime95 et FurMark exécutés pendant au moins une heure) est exécuté par le CPU et le GPU à 2,9 GHz et 1 425 MHz, respectivement. Le test de stress représente un scénario extrême. Nous utilisons ce test pour vérifier que le système reste stable à pleine charge
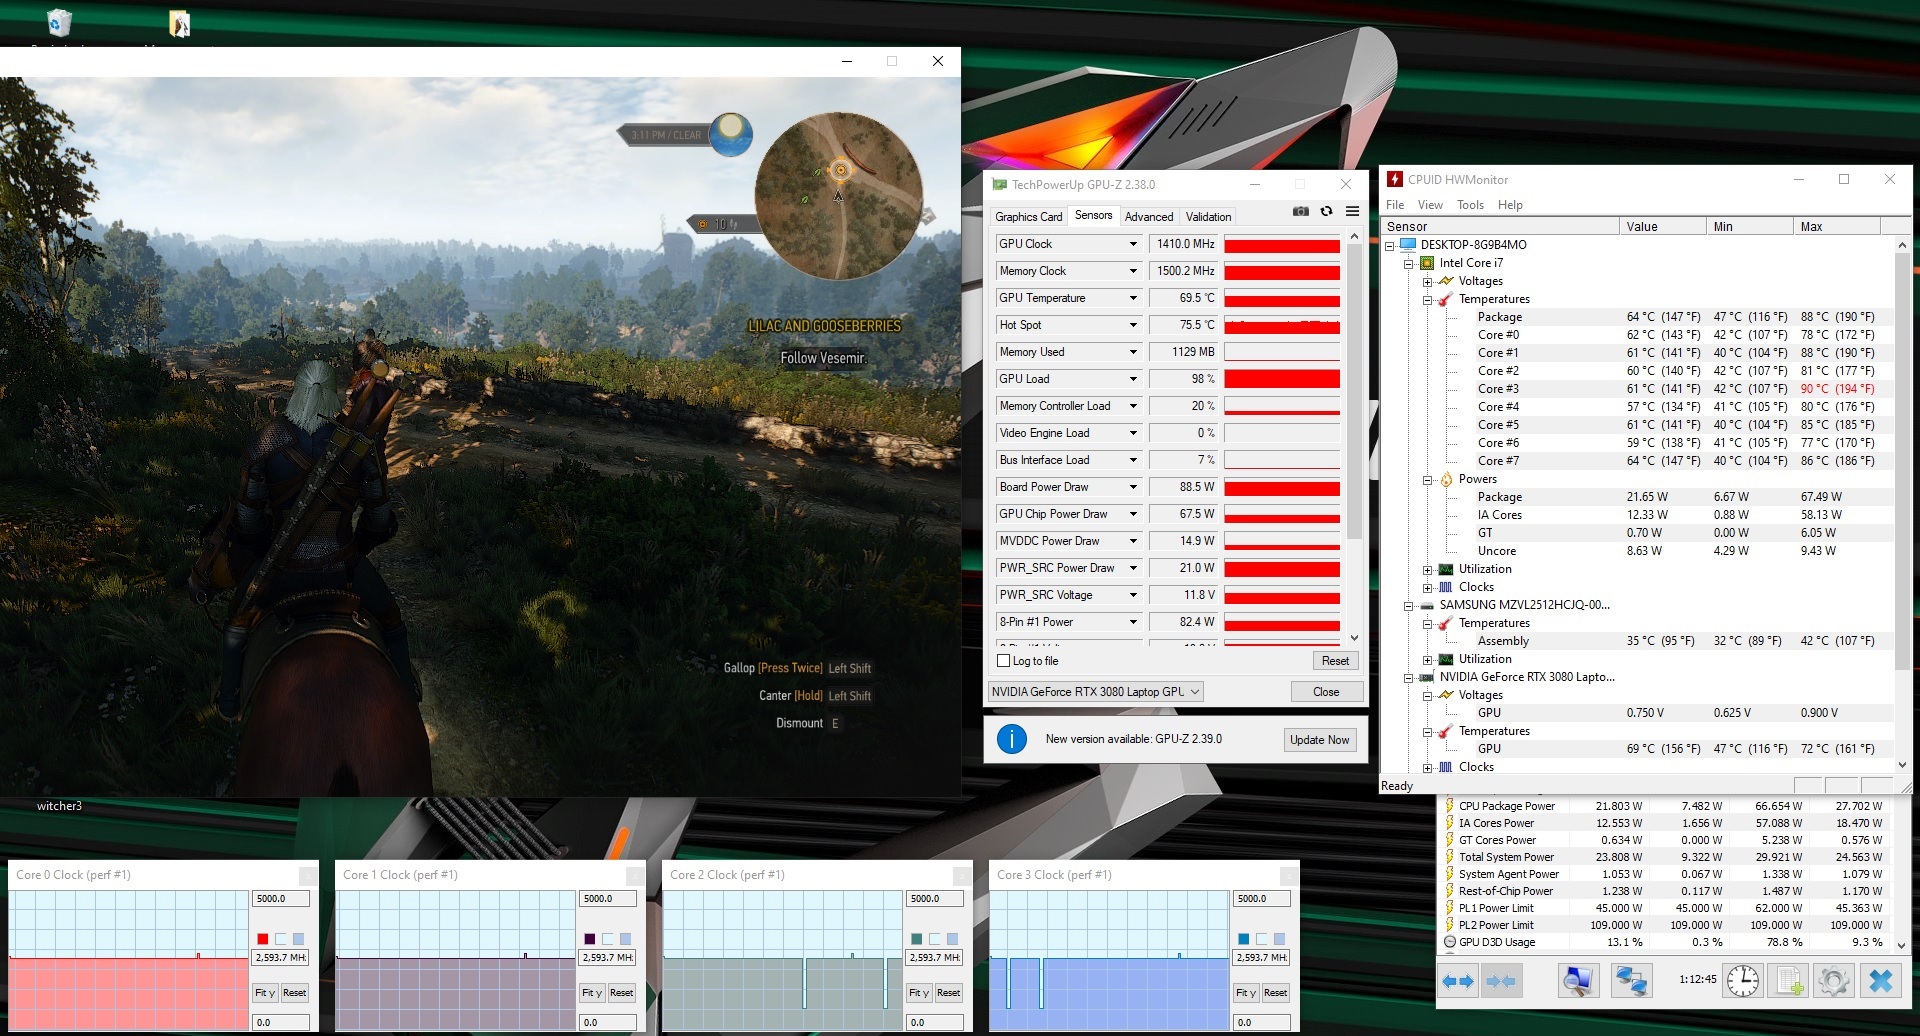
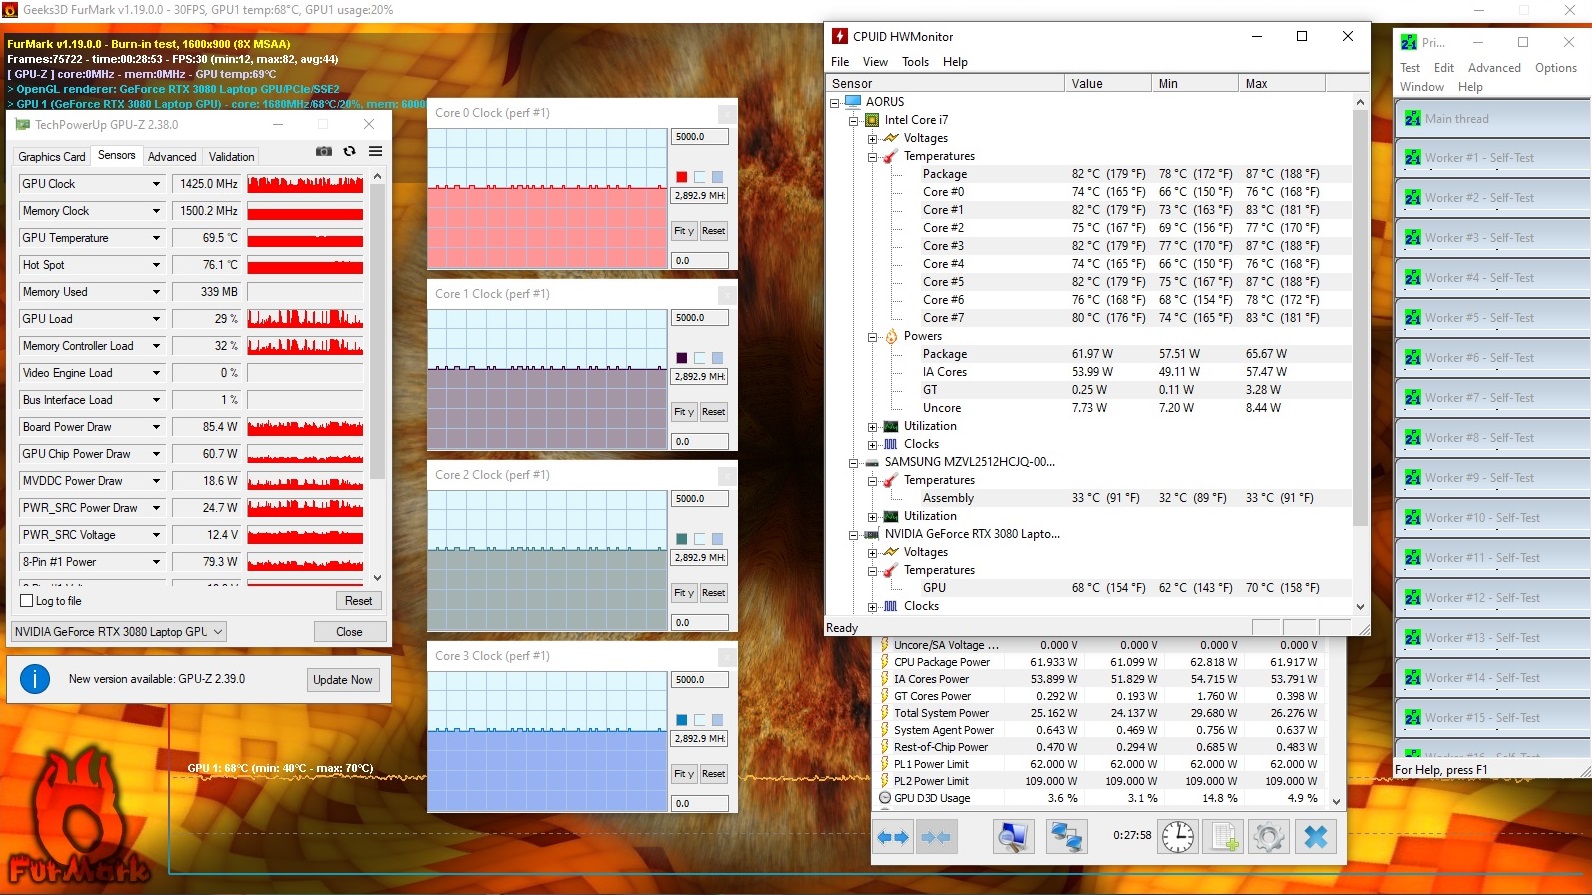
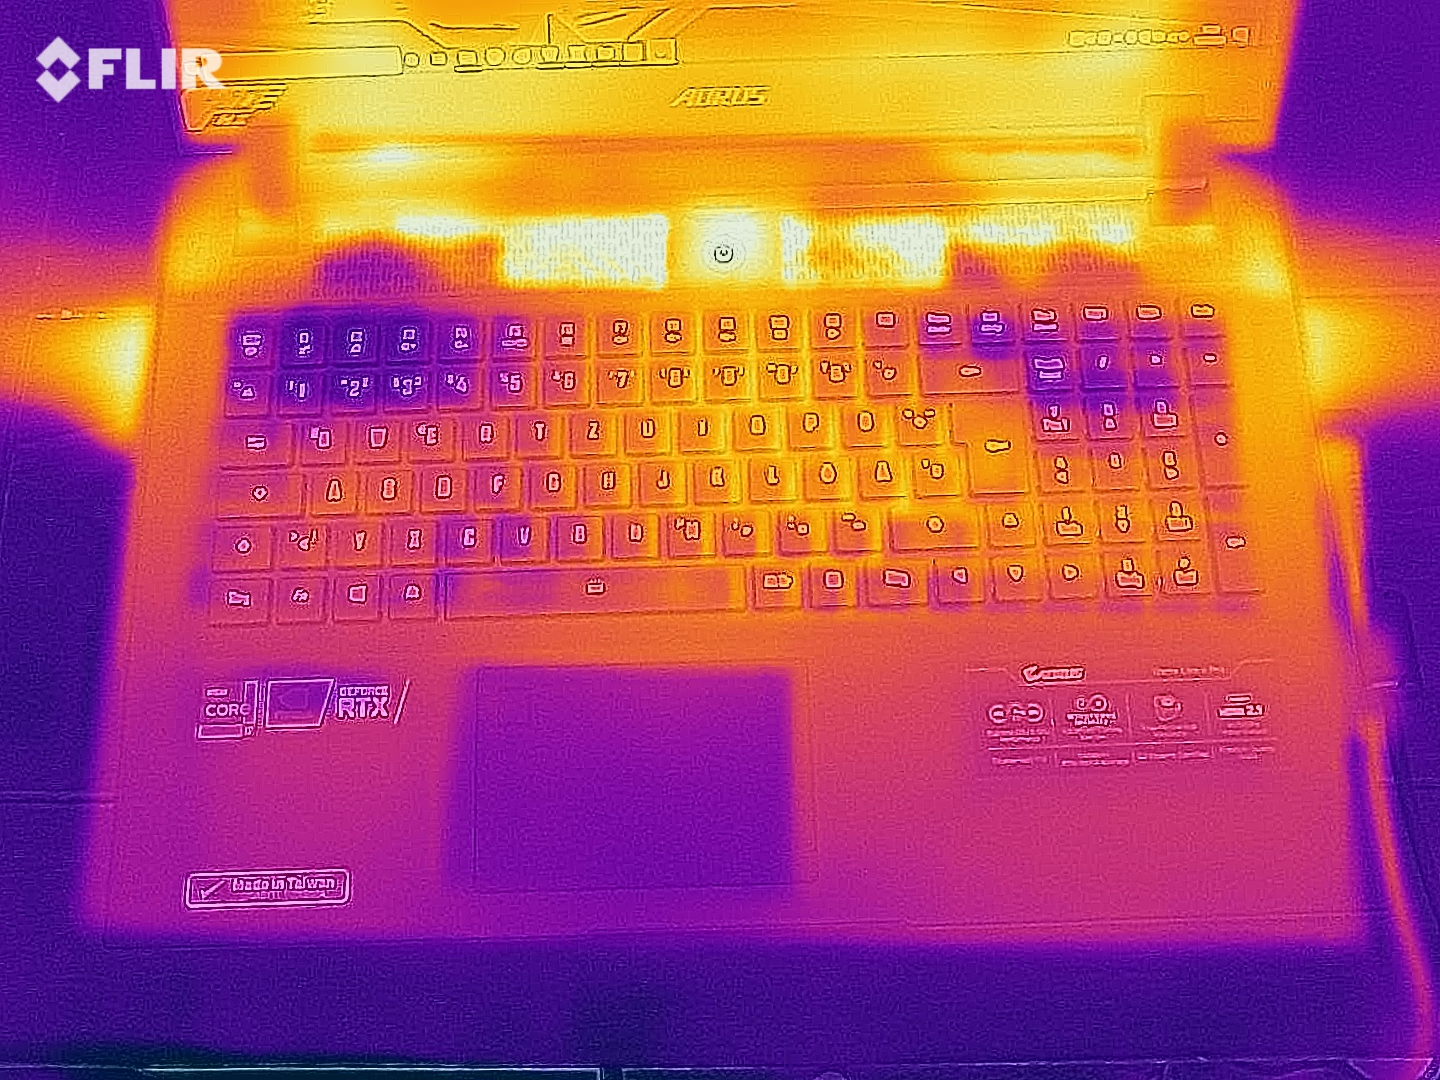
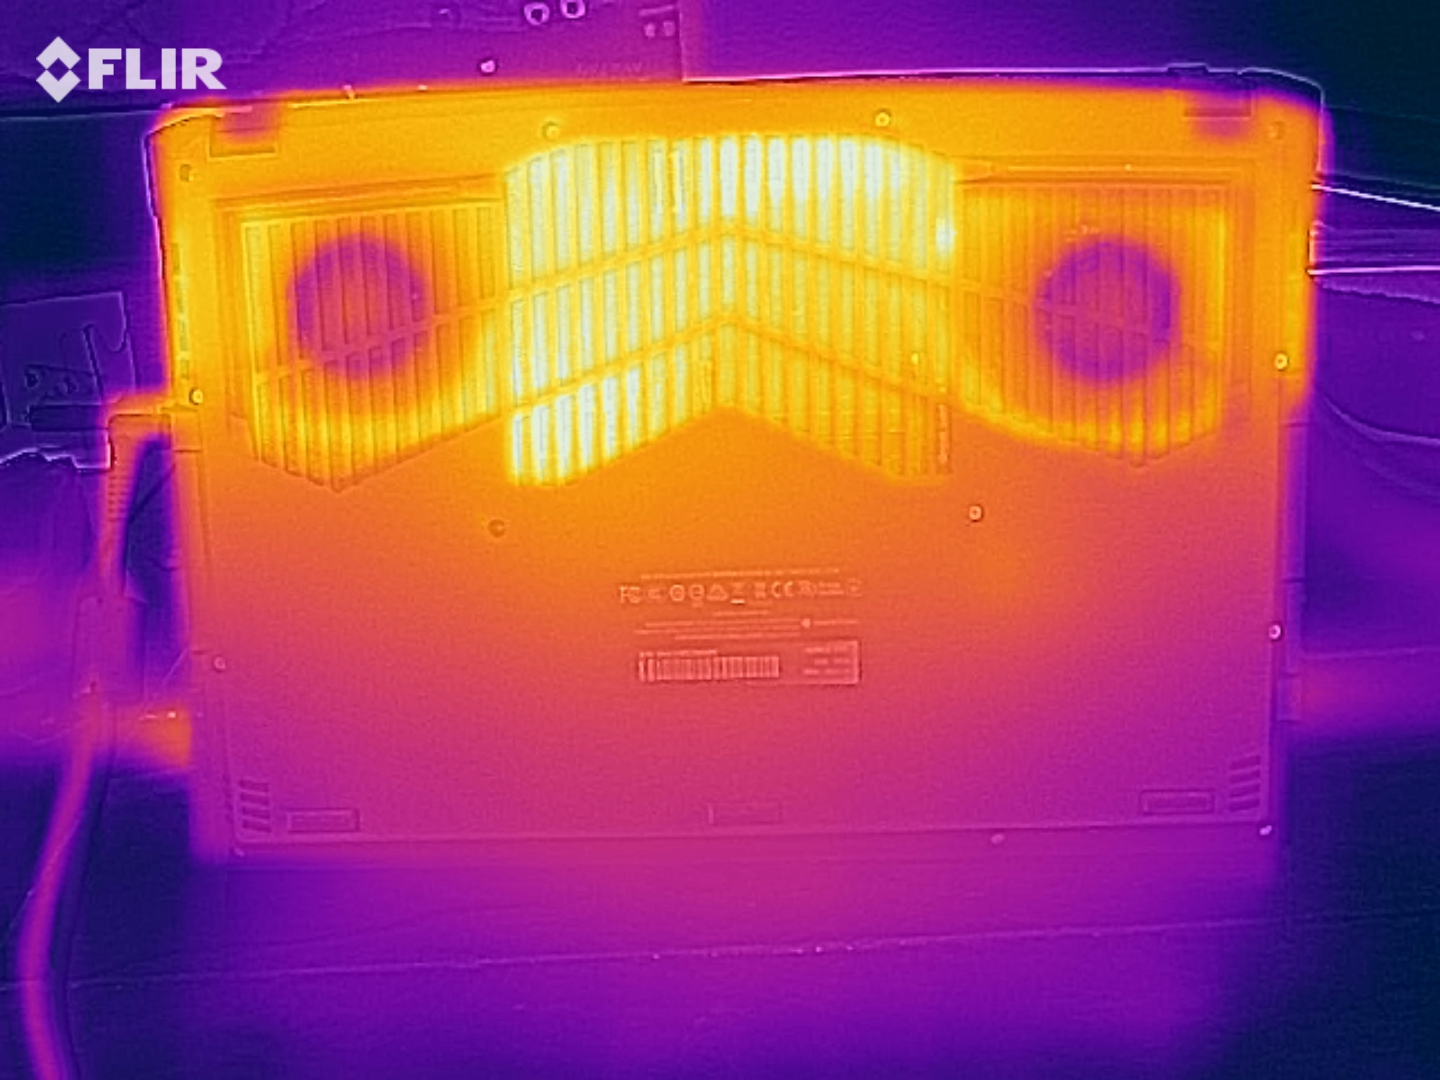
L'ordinateur portable chauffe sensiblement. Pendant le test de stress, nous enregistrons des températures inférieures à 50 °C en plusieurs points de mesure sur le fond. Le développement de chaleur est légèrement plus élevé lorsque nous exécutons notre test The Witcher 3. Dans les deux cas, l'appareil ne doit pas être placé sur les genoux
(+) La température maximale du côté supérieur est de 36 °C / 97 F, par rapport à la moyenne de 40.4 °C / 105 F, allant de 21.2 à 68.8 °C pour la classe Gaming.
(-) Le fond chauffe jusqu'à un maximum de 52 °C / 126 F, contre une moyenne de 43.2 °C / 110 F
(+) En utilisation inactive, la température moyenne du côté supérieur est de 27.7 °C / 82 F, par rapport à la moyenne du dispositif de 33.9 °C / 93 F.
(±) En jouant à The Witcher 3, la température moyenne du côté supérieur est de 33 °C / 91 F, alors que la moyenne de l'appareil est de 33.9 °C / 93 F.
(+) Les repose-poignets et le pavé tactile sont plus froids que la température de la peau avec un maximum de 29 °C / 84.2 F et sont donc froids au toucher.
(±) La température moyenne de la zone de l'appui-paume de dispositifs similaires était de 28.8 °C / 83.8 F (-0.2 °C / #-0.4 F).
| Aorus 17G YD i7-11800H, GeForce RTX 3080 Laptop GPU | MSI GP76 Leopard 10UG i7-10750H, GeForce RTX 3070 Laptop GPU | Asus Strix Scar 17 G733QSA-XS99 R9 5900HX, GeForce RTX 3080 Laptop GPU | Lenovo Legion 7 16ACHg6 R9 5900HX, GeForce RTX 3080 Laptop GPU | Schenker XMG Neo 17 (Early 2021, RTX 3070, 5800H) R7 5800H, GeForce RTX 3070 Laptop GPU | Aorus 17G XB i7-10875H, GeForce RTX 2070 Super Max-Q | Moyenne de la classe Gaming | |
|---|---|---|---|---|---|---|---|
| Heat | -3% | -6% | -21% | -13% | -6% | -8% | |
| Maximum Upper Side * (°C) | 36 | 43 -19% | 40 -11% | 51 -42% | 47 -31% | 48 -33% | 45.2 ? -26% |
| Maximum Bottom * (°C) | 52 | 47 10% | 39.8 23% | 52 -0% | 51 2% | 59 -13% | 48.2 ? 7% |
| Idle Upper Side * (°C) | 29 | 30 -3% | 34.6 -19% | 37 -28% | 32 -10% | 26 10% | 31.1 ? -7% |
| Idle Bottom * (°C) | 33 | 33 -0% | 38.4 -16% | 38 -15% | 37 -12% | 29 12% | 34.3 ? -4% |
* ... Moindre est la valeur, meilleures sont les performances
Haut-parleurs
Aorus 17G YD analyse audio
(+) | les haut-parleurs peuvent jouer relativement fort (83# dB)
Basses 100 - 315 Hz
(-) | presque aucune basse - en moyenne 31.4% plus bas que la médiane
(±) | la linéarité des basses est moyenne (14.2% delta à la fréquence précédente)
Médiums 400 - 2000 Hz
(±) | médiane supérieure - en moyenne 5.4% supérieure à la médiane
(±) | la linéarité des médiums est moyenne (7.1% delta à la fréquence précédente)
Aiguës 2 - 16 kHz
(+) | des sommets équilibrés - à seulement 1.4% de la médiane
(+) | les aigus sont linéaires (3% delta à la fréquence précédente)
Globalement 100 - 16 000 Hz
(±) | la linéarité du son global est moyenne (20.6% de différence avec la médiane)
Par rapport à la même classe
» 74% de tous les appareils testés de cette catégorie étaient meilleurs, 5% similaires, 21% pires
» Le meilleur avait un delta de 6%, la moyenne était de 18%, le pire était de 132%.
Par rapport à tous les appareils testés
» 55% de tous les appareils testés étaient meilleurs, 8% similaires, 37% pires
» Le meilleur avait un delta de 4%, la moyenne était de 24%, le pire était de 134%.
Asus Strix Scar 17 G733QSA-XS99 analyse audio
(±) | le niveau sonore du haut-parleur est moyen mais bon (73.7# dB)
Basses 100 - 315 Hz
(+) | bonne basse - seulement 2.1% loin de la médiane
(±) | la linéarité des basses est moyenne (7% delta à la fréquence précédente)
Médiums 400 - 2000 Hz
(+) | médiane équilibrée - seulement 1.4% de la médiane
(+) | les médiums sont linéaires (4.8% delta à la fréquence précédente)
Aiguës 2 - 16 kHz
(±) | sommets plus élevés - en moyenne 5.9% plus élevés que la médiane
(±) | la linéarité des aigus est moyenne (8.7% delta à la fréquence précédente)
Globalement 100 - 16 000 Hz
(+) | le son global est linéaire (10.7% différence à la médiane)
Par rapport à la même classe
» 7% de tous les appareils testés de cette catégorie étaient meilleurs, 2% similaires, 91% pires
» Le meilleur avait un delta de 6%, la moyenne était de 18%, le pire était de 132%.
Par rapport à tous les appareils testés
» 6% de tous les appareils testés étaient meilleurs, 2% similaires, 93% pires
» Le meilleur avait un delta de 4%, la moyenne était de 24%, le pire était de 134%.
Gestion de l'énergie - La 17G offre une très bonne autonomie de la batterie
Consommation d'énergie
Nous enregistrons une consommation maximale de 38 watts en utilisation inactive - un taux assez élevé si l'on considère que la commutation graphique est activée. Le test de stress et notre test The Witcher 3 font monter la demande jusqu'à 230 watts et une moyenne de 164 watts, respectivement. La puissance nominale de l'adaptateur d'alimentation est de 230 watts
| Éteint/en veille | |
| Au repos | |
| Fortement sollicité |
|
Légende:
min: | |
| Aorus 17G YD i7-11800H, GeForce RTX 3080 Laptop GPU | MSI GP76 Leopard 10UG i7-10750H, GeForce RTX 3070 Laptop GPU | Asus Strix Scar 17 G733QSA-XS99 R9 5900HX, GeForce RTX 3080 Laptop GPU | Lenovo Legion 7 16ACHg6 R9 5900HX, GeForce RTX 3080 Laptop GPU | Schenker XMG Neo 17 (Early 2021, RTX 3070, 5800H) R7 5800H, GeForce RTX 3070 Laptop GPU | Aorus 17G XB i7-10875H, GeForce RTX 2070 Super Max-Q | Moyenne de la classe Gaming | |
|---|---|---|---|---|---|---|---|
| Power Consumption | 19% | 18% | -16% | 11% | 4% | 18% | |
| Idle Minimum * (Watt) | 24 | 12 50% | 10.9 55% | 31 -29% | 13 46% | 20 17% | 13.3 ? 45% |
| Idle Average * (Watt) | 26 | 16 38% | 14.7 43% | 33 -27% | 16 38% | 23 12% | 19 ? 27% |
| Idle Maximum * (Watt) | 38 | 28 26% | 26.8 29% | 46 -21% | 26 32% | 38 -0% | 24.5 ? 36% |
| Load Average * (Watt) | 101 | 92 9% | 106.7 -6% | 110 -9% | 125 -24% | 105 -4% | 108.1 ? -7% |
| Witcher 3 ultra * (Watt) | 164 | 198 -21% | 192.4 -17% | 180 -10% | 187 -14% | 158 4% | |
| Load Maximum * (Watt) | 230 | 210 9% | 228.4 1% | 235 -2% | 259 -13% | 243 -6% | 254 ? -10% |
* ... Moindre est la valeur, meilleures sont les performances
Durée de vie de la batterie
L'ordinateur de 17,3 pouces atteint des durées d'exécution de 6 heures et 6 heures 10 dans le test Wi-Fi (accès à des sites Web à l'aide d'un script) et le test vidéo (le court-métrage Big Buck Bunny
(codage H.264, Full HD) tournant en boucle), respectivement. Les fonctions d'économie d'énergie de l'ordinateur portable sont désactivées pendant les deux tests, et la luminosité de l'écran est réglée à environ 150 cd/m². En outre, les modules sans fil sont désactivés pour le test vidéo.Les tests d'autonomie de la batterie ont été effectués sans l'option de profil automatique supporté par l'IA du Centre de contrôle. Les profils d'alimentation standard ont été utilisés.
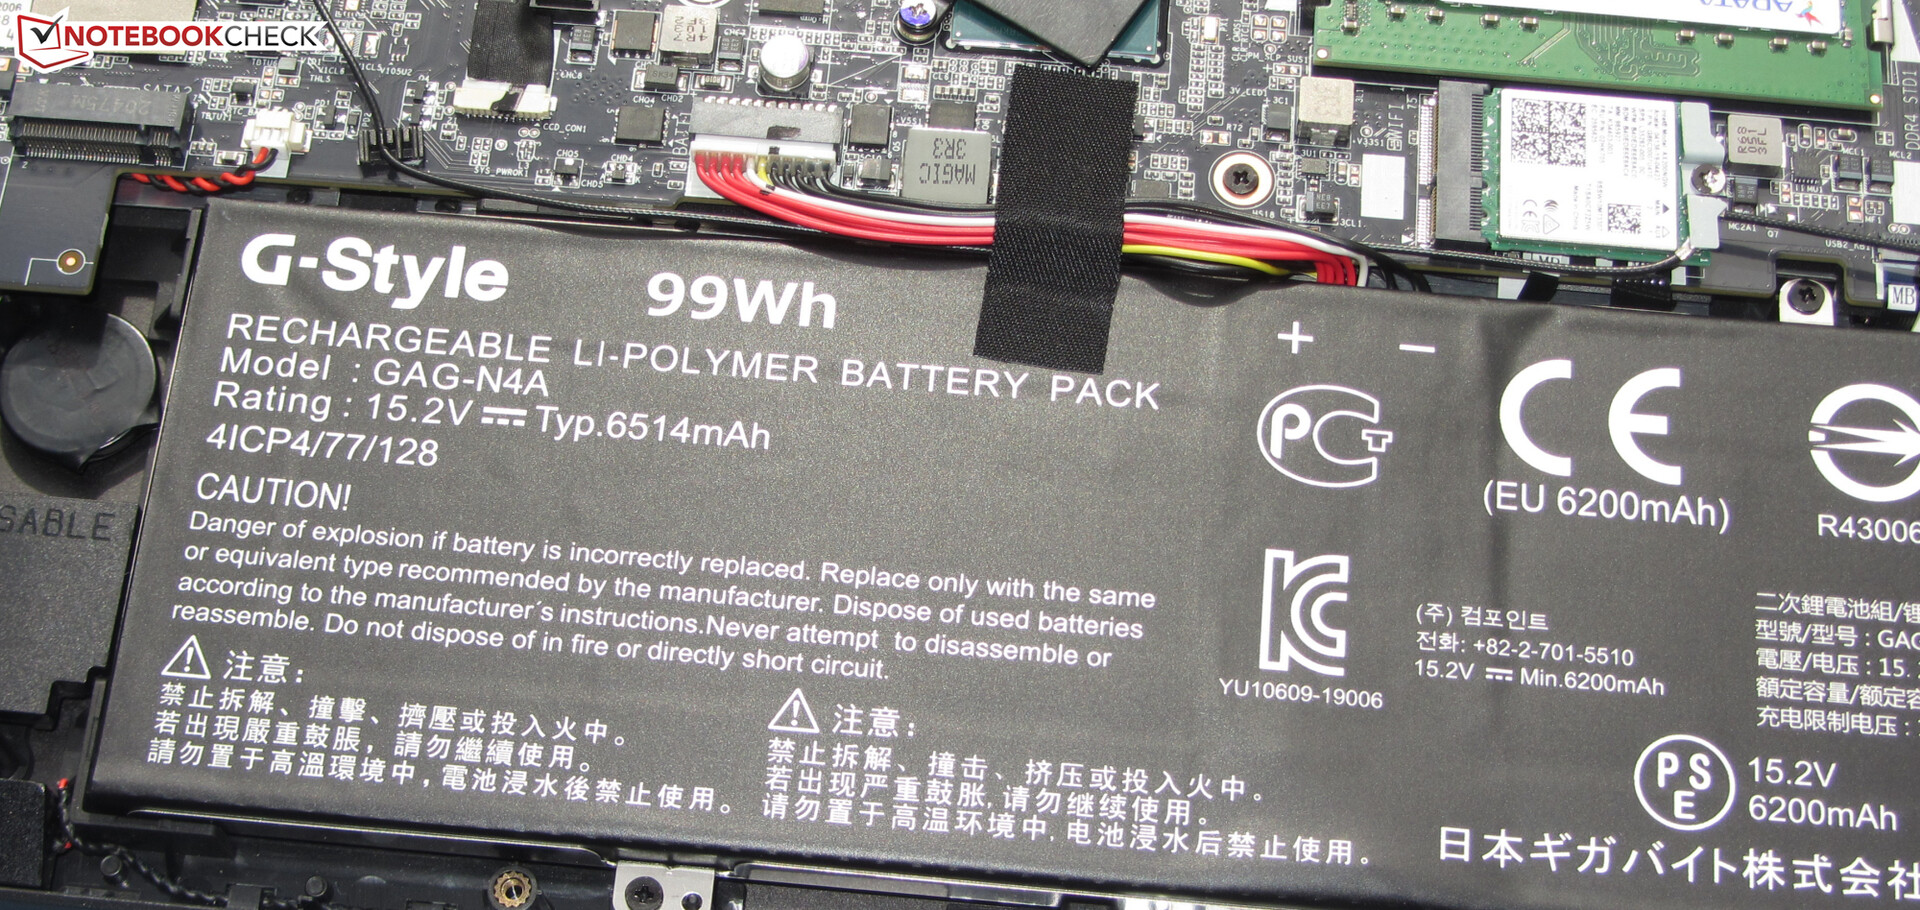
| Aorus 17G YD i7-11800H, GeForce RTX 3080 Laptop GPU, 99 Wh | MSI GP76 Leopard 10UG i7-10750H, GeForce RTX 3070 Laptop GPU, 65 Wh | Asus Strix Scar 17 G733QSA-XS99 R9 5900HX, GeForce RTX 3080 Laptop GPU, 90 Wh | Lenovo Legion 7 16ACHg6 R9 5900HX, GeForce RTX 3080 Laptop GPU, 80 Wh | Schenker XMG Neo 17 (Early 2021, RTX 3070, 5800H) R7 5800H, GeForce RTX 3070 Laptop GPU, 62 Wh | Aorus 17G XB i7-10875H, GeForce RTX 2070 Super Max-Q, 94 Wh | Moyenne de la classe Gaming | |
|---|---|---|---|---|---|---|---|
| Autonomie de la batterie | -39% | 30% | 4% | -49% | 25% | 10% | |
| Reader / Idle (h) | 9 | 5.6 -38% | 13.3 48% | 8.2 -9% | 4.7 -48% | 10 11% | 8.71 ? -3% |
| H.264 (h) | 6.2 | 6.8 10% | 8.26 ? 33% | ||||
| WiFi v1.3 (h) | 6 | 4.2 -30% | 9.3 55% | 6.8 13% | 3.5 -42% | 7.5 25% | 7.01 ? 17% |
| Load (h) | 1.6 | 0.8 -50% | 1.4 -13% | 1.6 0% | 0.7 -56% | 2.2 38% | 1.47 ? -8% |
Points positifs
Points négatifs
Verdict : l'Aorus 17G est à la pointe de la technologie
Le 17G YD ne fait pas partie des meilleurs ordinateurs portables RTX 3080 en raison de son TGP relativement faible de 105 watts. Les performances de jeu de l'appareil sont moyennes pour un RTX 3080. Pour des performances maximales, il est recommandé d'utiliser des concurrents comme leLenovo Legion 7 16ACHg6ou leAlienware m17 R4.
Avec l'Aorus 17G YD, Gigabyte livre un ordinateur portable de jeu bien équilibré. Cependant, l'appareil génère un niveau sonore élevé.
Le Throttling n'est pas un problème. Le CPU et le GPU peuvent développer leurs performances de manière uniforme. Néanmoins, l'appareil produit beaucoup de bruit en charge - plus que de nombreux concurrents. Gigabyte pourrait être en mesure d'améliorer cela avec une mise à jour du BIOS. La consommation d'énergie en mode veille est également un peu trop élevée.
Le clavier mécanique (avec éclairage RVB) a laissé une bonne impression et sera un facteur important pour de nombreux acheteurs potentiels. Les utilisateurs qui n'ont jamais utilisé ce type de clavier devront s'habituer à l'expérience de frappe. L'autonomie de la batterie est correcte, mais elle est inférieure à celle du modèle frère - bien que la batterie ait une capacité légèrement supérieure (94 Wh contre 99 Wh).
L'écran (Full HD, IPS, 300 Hz) offre des angles de vision stables, un bon contraste, une surface mate, des temps de réponse rapides, une bonne reproduction des couleurs et une bonne couverture de l'espace couleur (sRGB : 100%). Cependant, la luminosité maximale est trop faible. Un ordinateur portable dans cette gamme de prix devrait offrir plus à cet égard.
Prix et disponibilité
Aorus 17G YD
- 06/21/2021 v7 (old)
Sascha Mölck
Price comparison

