Test du BMAX B5 Pro G7H8 : les débuts de l'Intel Core i5-8260U dans ce mini-PC
Tout comme Chuwi, BMax est spécialisé dans les ordinateurs portables, les moniteurs et les mini-PC bon marché qui sont généralement des centaines de dollars moins chers que les produits les plus basiques de fabricants plus importants et plus connus. Leur secret est l'utilisation de processeurs d'ancienne génération qui permettent de réduire considérablement le coût des appareils
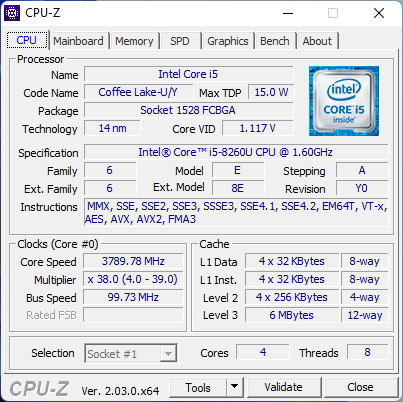
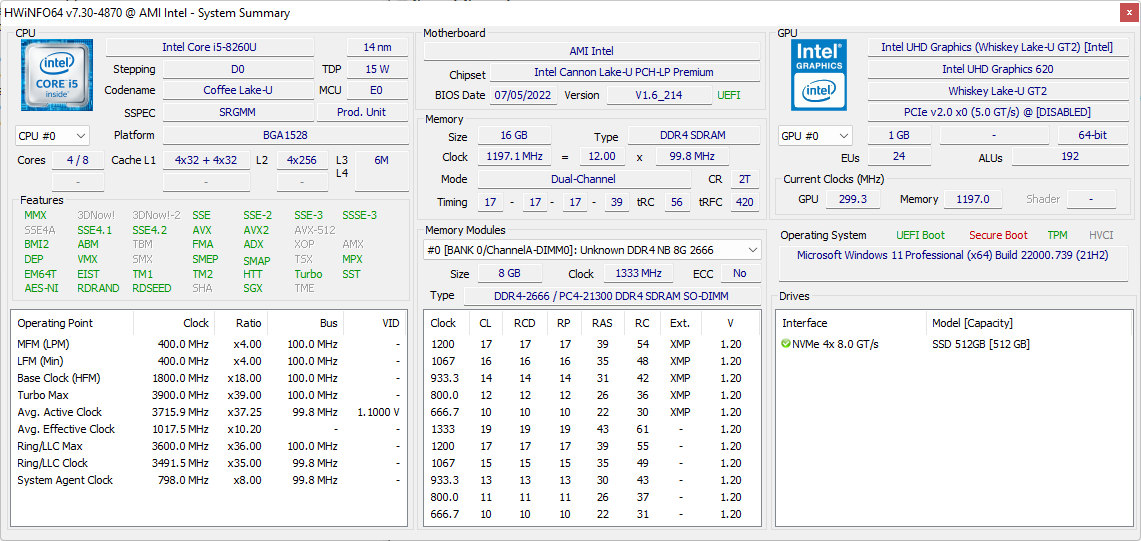
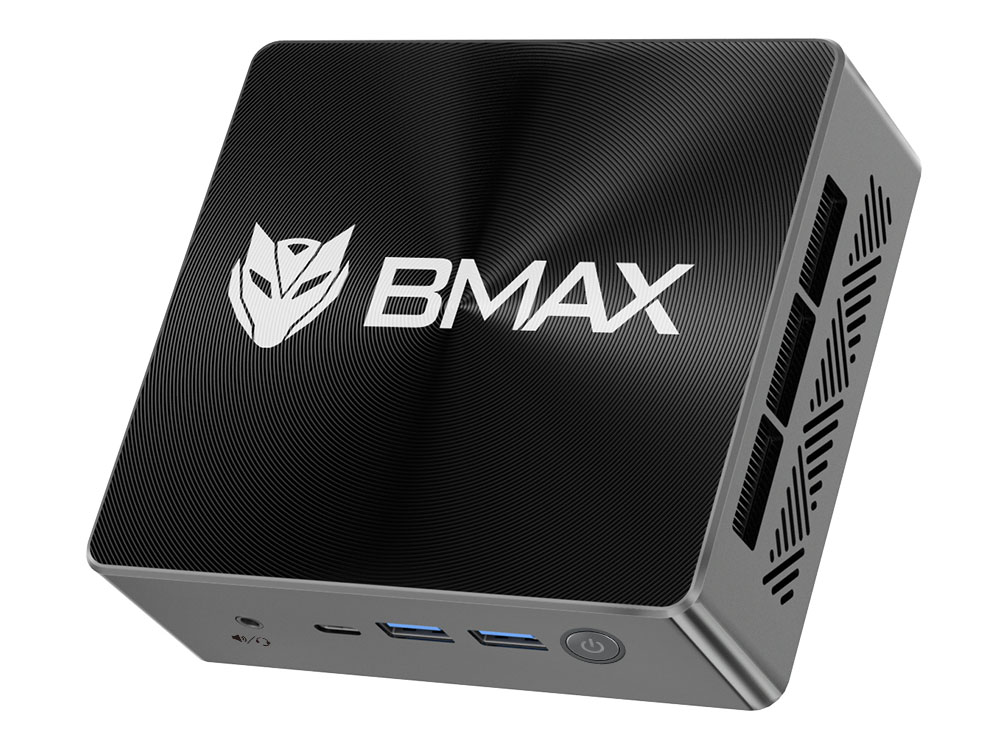
Le BMax B5 Pro est le dernier mini-PC du fabricant qui cible les utilisateurs de HTPC aux budgets plus serrés. Il se distingue par l'utilisation d'un ancien processeur Intel Core U-series de 8e génération, alors que les mini-PC les plus récents utilisent des options de 12e génération. Notre configuration spécifique est équipée d'un processeur Core i5-8260U Coffee Lake peu courant, de 16 Go de RAM, d'un SSD NVMe de 512 Go et de Windows 11 préchargé pour seulement 280 USD au moment de la rédaction. Le B5 Pro est en concurrence directe avec d'autres mini PC bon marché comme le Beelink SEi8 Test du Beelink SEi8 : un Core i3-8109U peu commun pour un nouveau mini PC ou le GMK NucBox 2 Test du GMK NucBox 2 : mini-PC au prix raisonnable et avec une bonne évolutivité .
Plus de commentaires sur le BMax :
Comparaison avec les concurrents potentiels
Note | Date | Modèle | Poids | Épaisseur | Taille | Résolution | Prix |
|---|---|---|---|---|---|---|---|
v (old) | 11/22 | BMAX B5 Pro G7H8 i5-8260U, UHD Graphics 620 | 369 g | 43.2 mm | x | ||
v (old) | 09/22 | Beelink SEi11 Pro i5-11320H, Iris Xe G7 96EUs | 440 g | 40 mm | x | ||
v (old) | 09/22 | Beelink U59 N5105 Celeron N5105, UHD Graphics (Jasper Lake 24 EU) | 320 g | 42 mm | x | ||
v (old) | 04/22 | Beelink SEi8 i3-8109U, Iris Plus Graphics 655 | 346 g | 41 mm | x | ||
v (old) | 10/22 | Beelink SER Pro Ryzen 5 5600H R5 5600H, Vega 7 | 498 g | 42 mm | x | ||
v (old) | 04/21 | Intel NUC11TNKi5 i5-1135G7, Iris Xe G7 80EUs | 504 g | 37 mm | x |
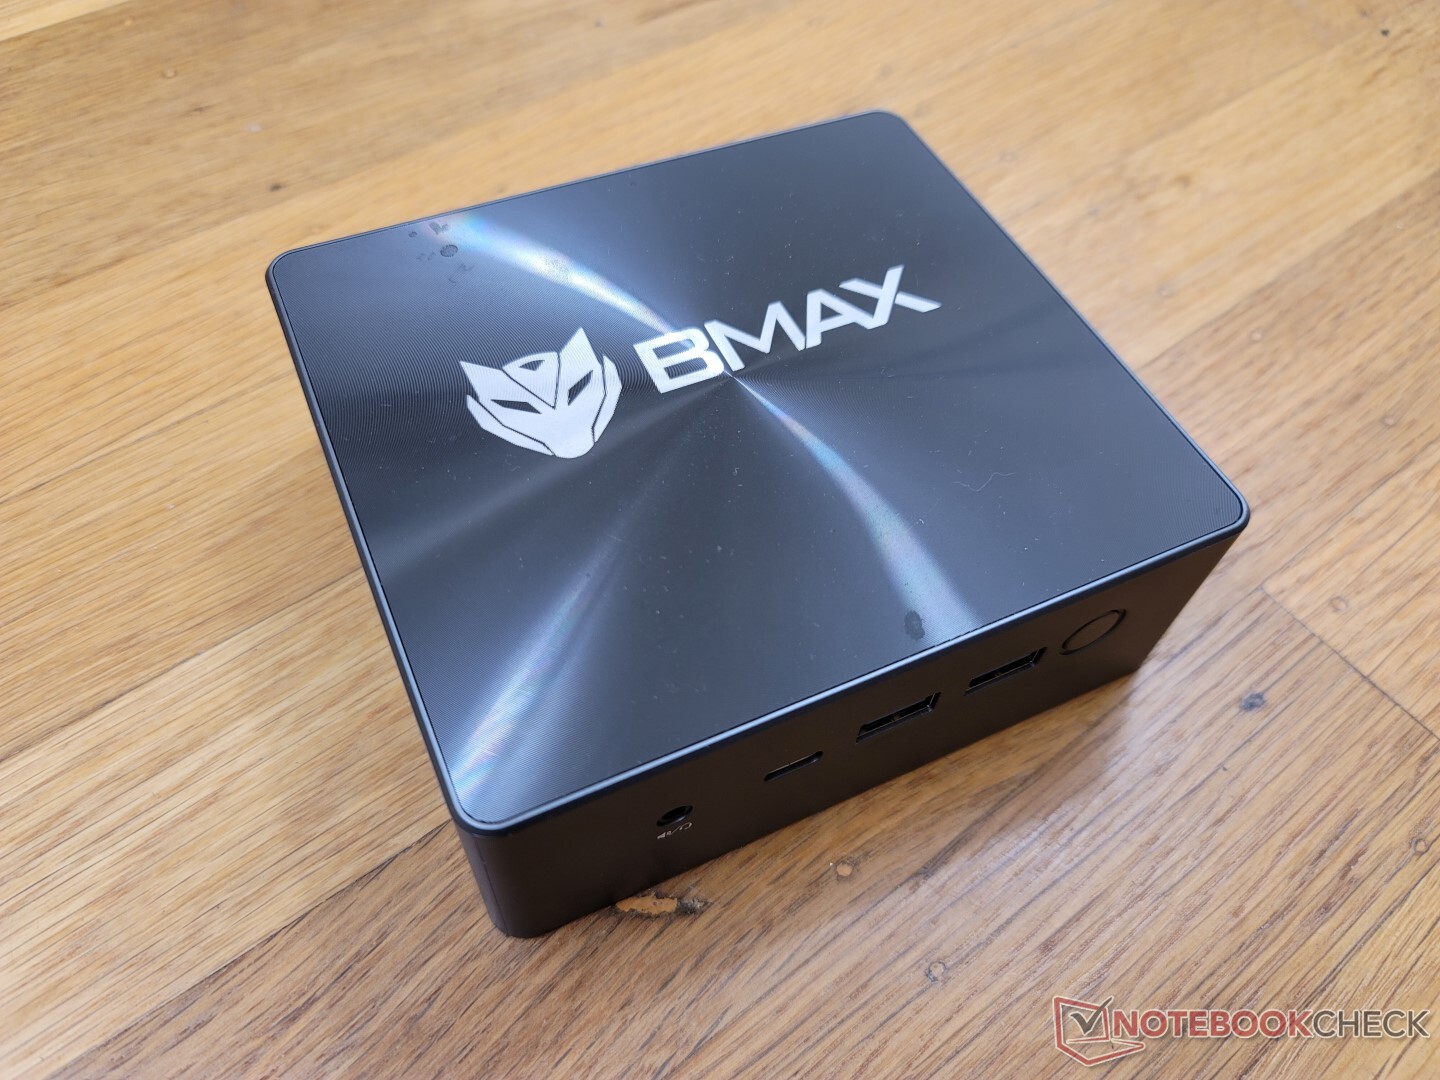
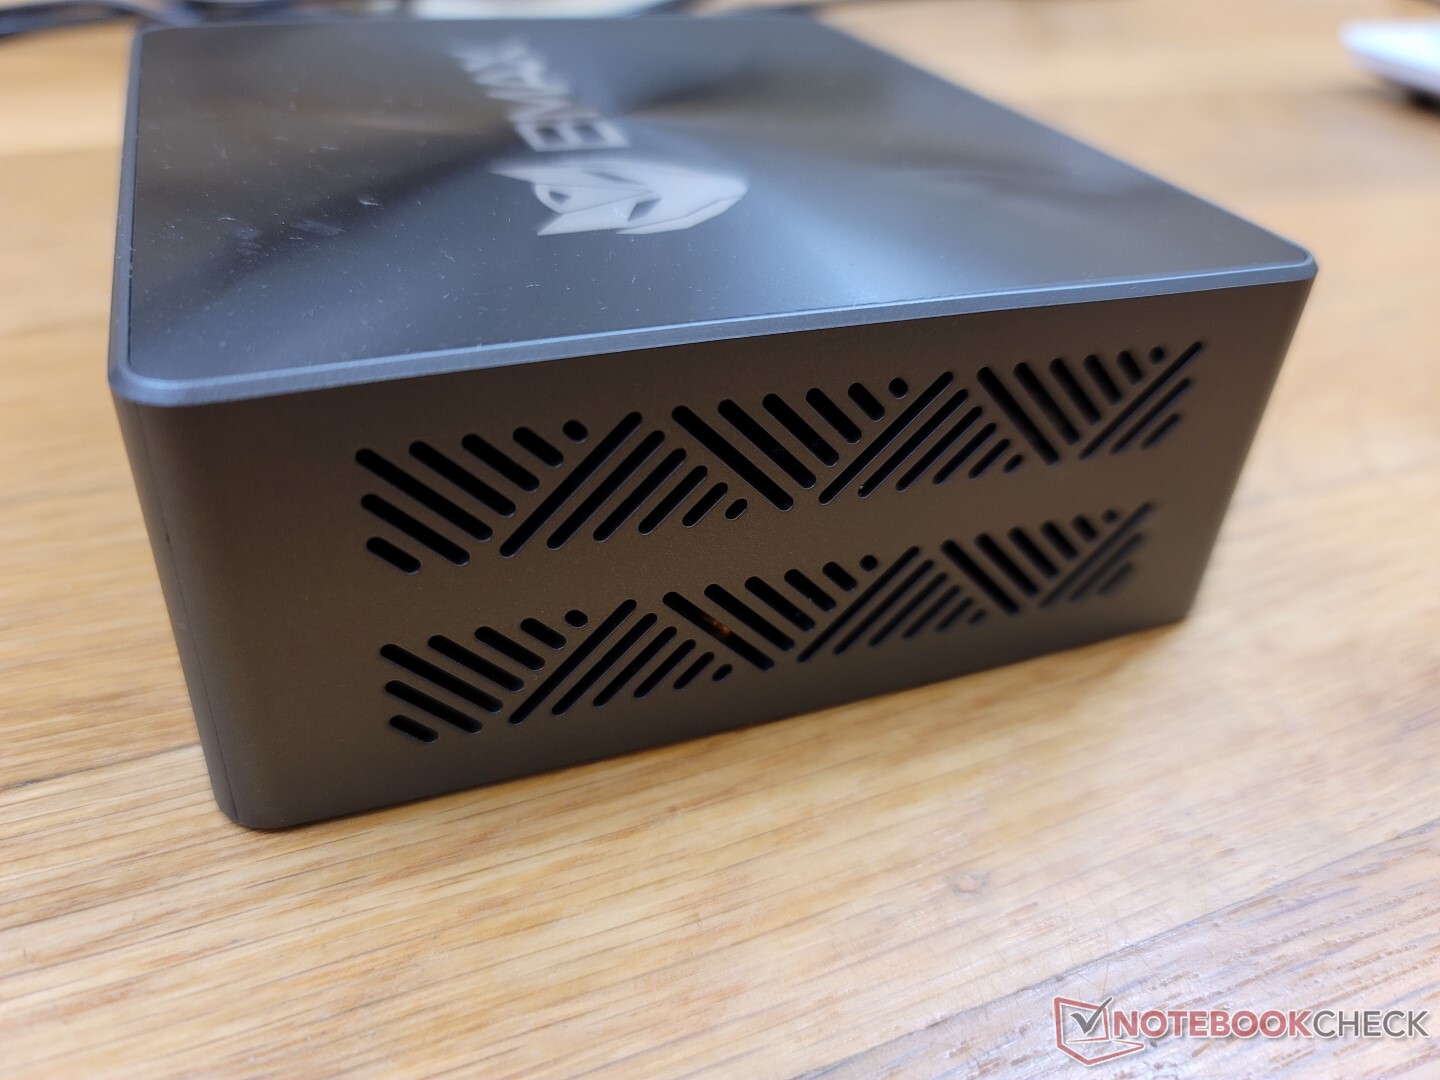
Cas - Rien d'extraordinaire
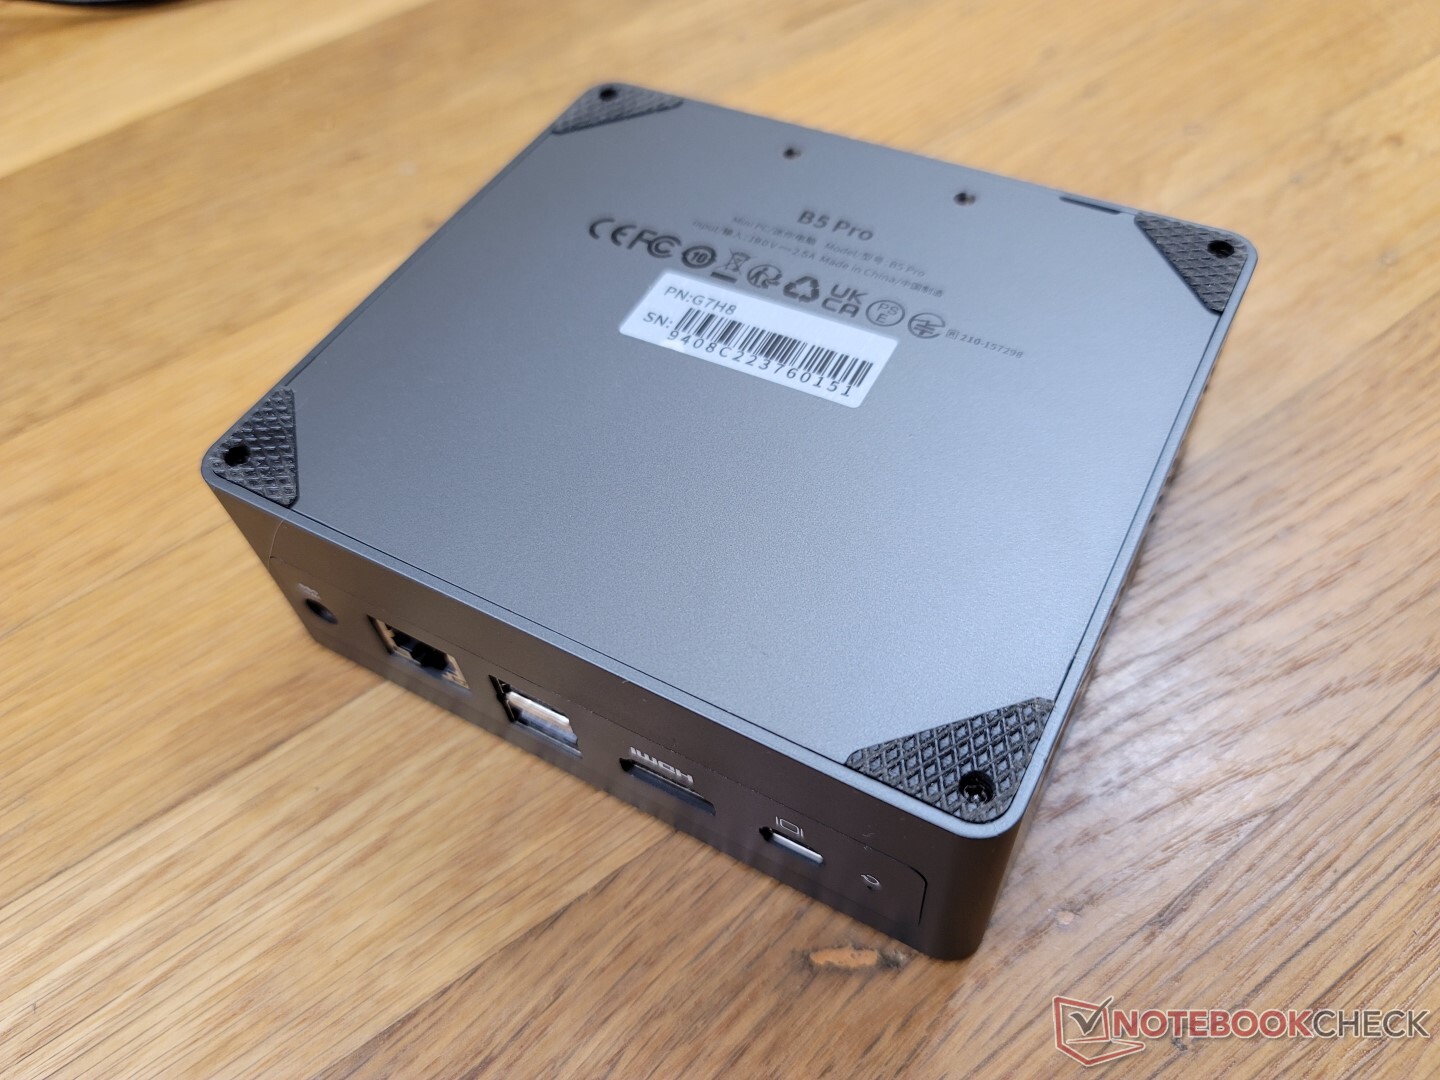
Le boîtier est légèrement plus épais que le Intel NUC11TNKi5 pour être presque identique au Beelink SEi8. La rigidité est forte autour des bords et du fond puisque ces zones sont en métal alors que le dessus est en plastique moins cher et plus susceptible de se déformer. C'est toujours une conception solide sans défauts évidents même si elle n'est pas aussi lourde qu'un Intel NUC.
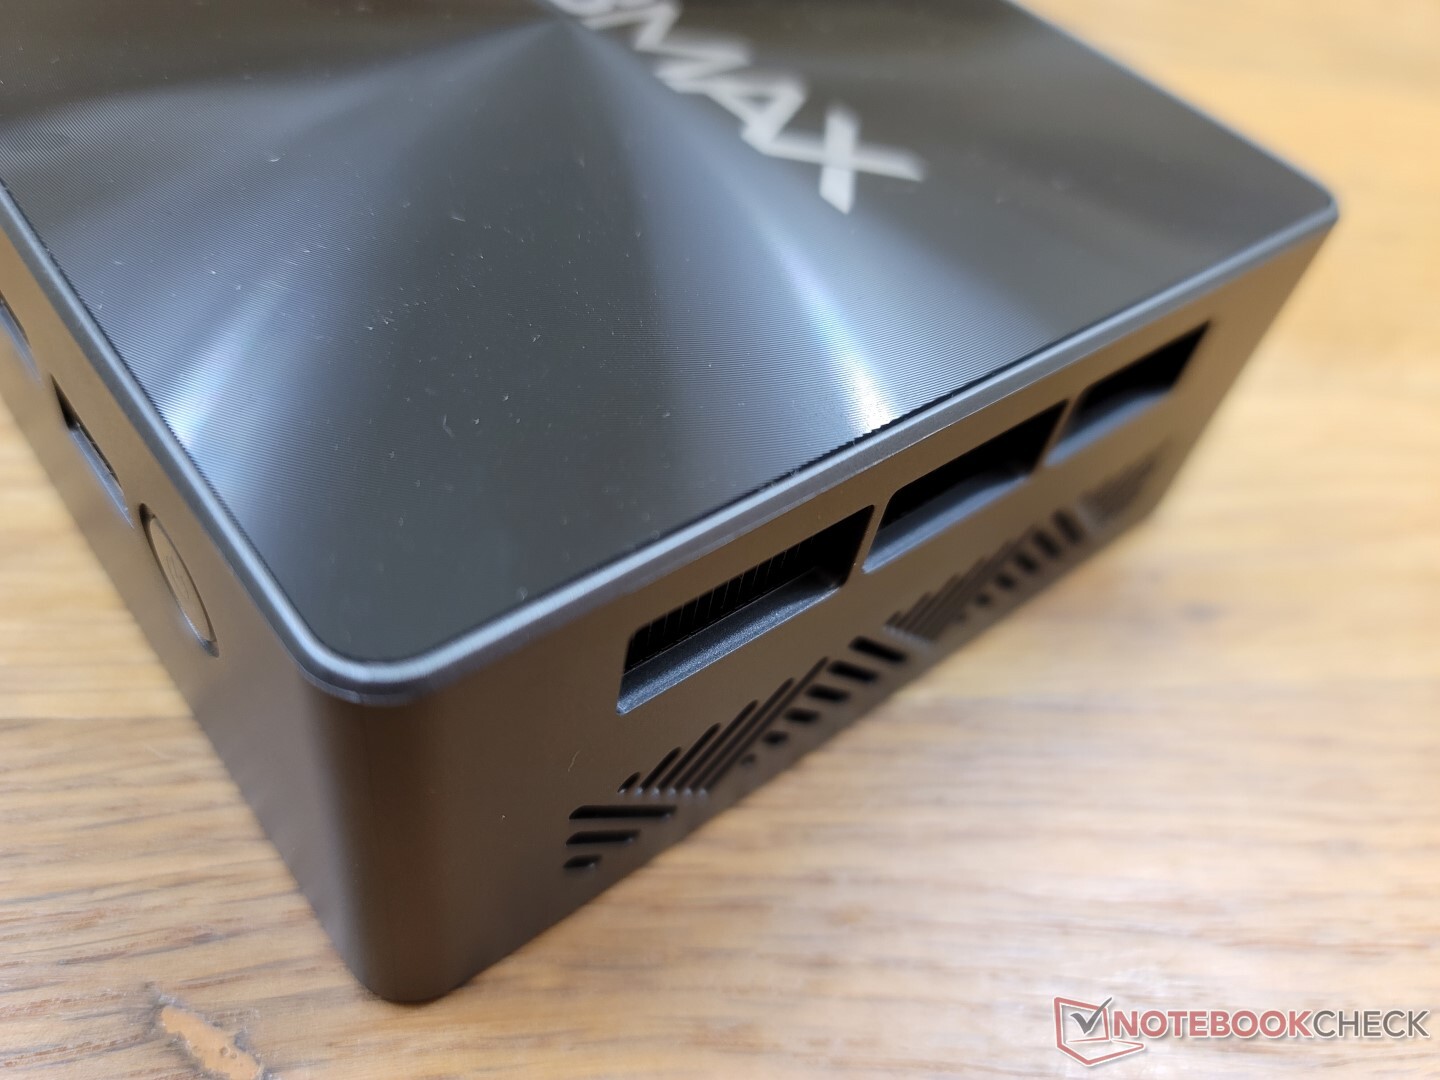
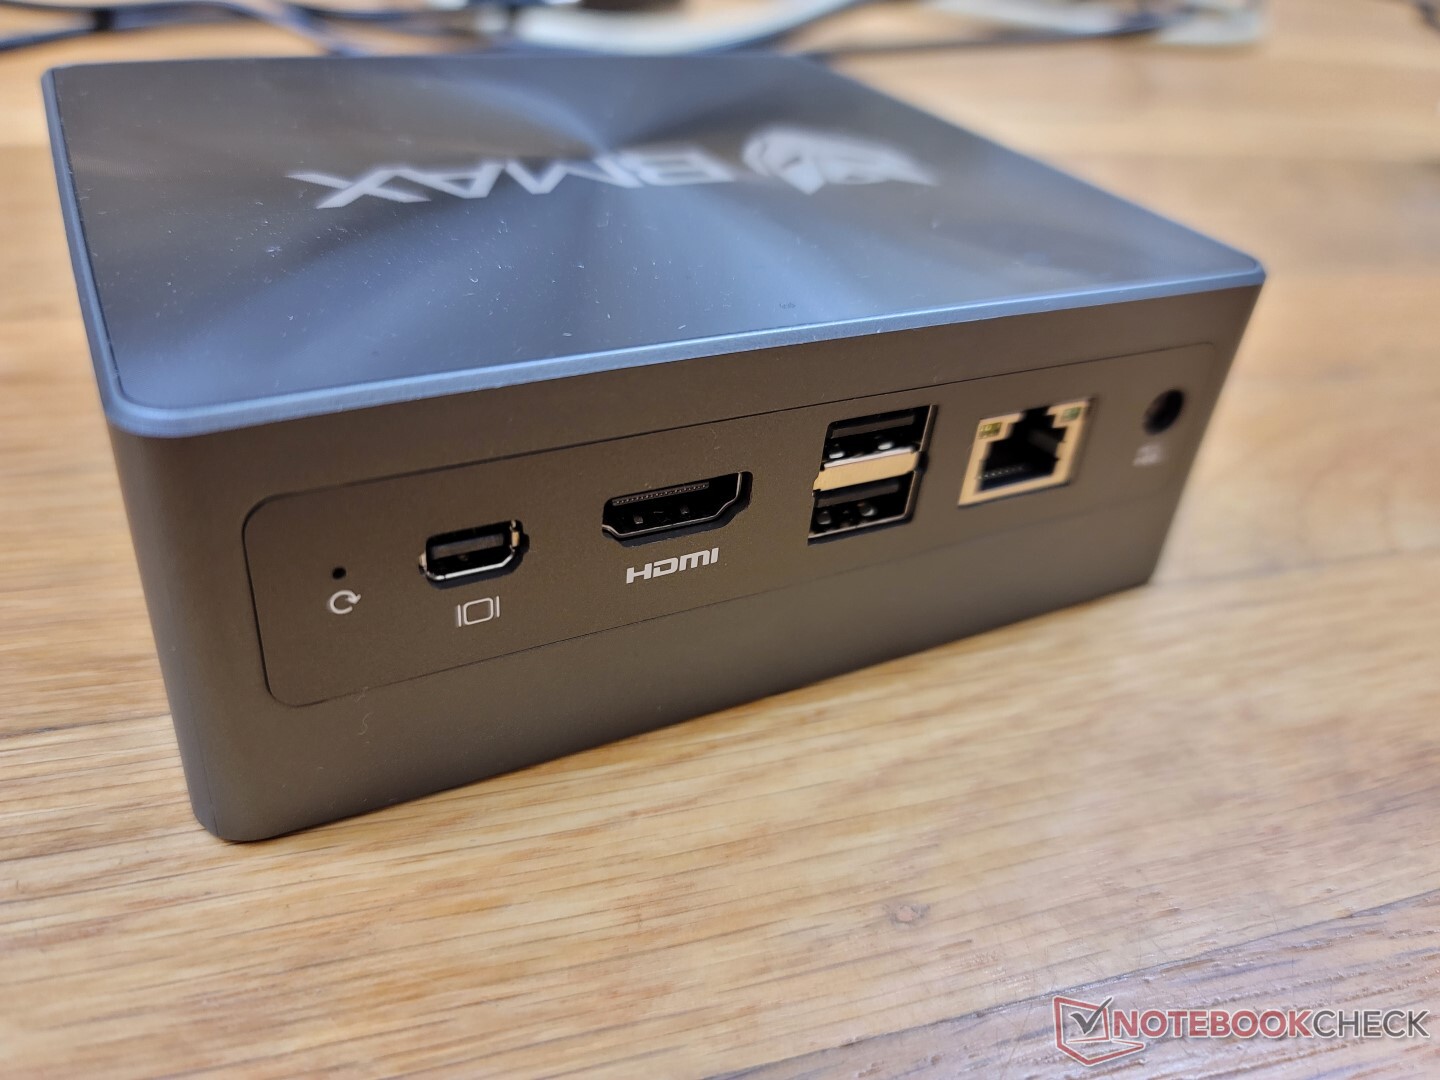
Connectivité - Pas de support Thunderbolt
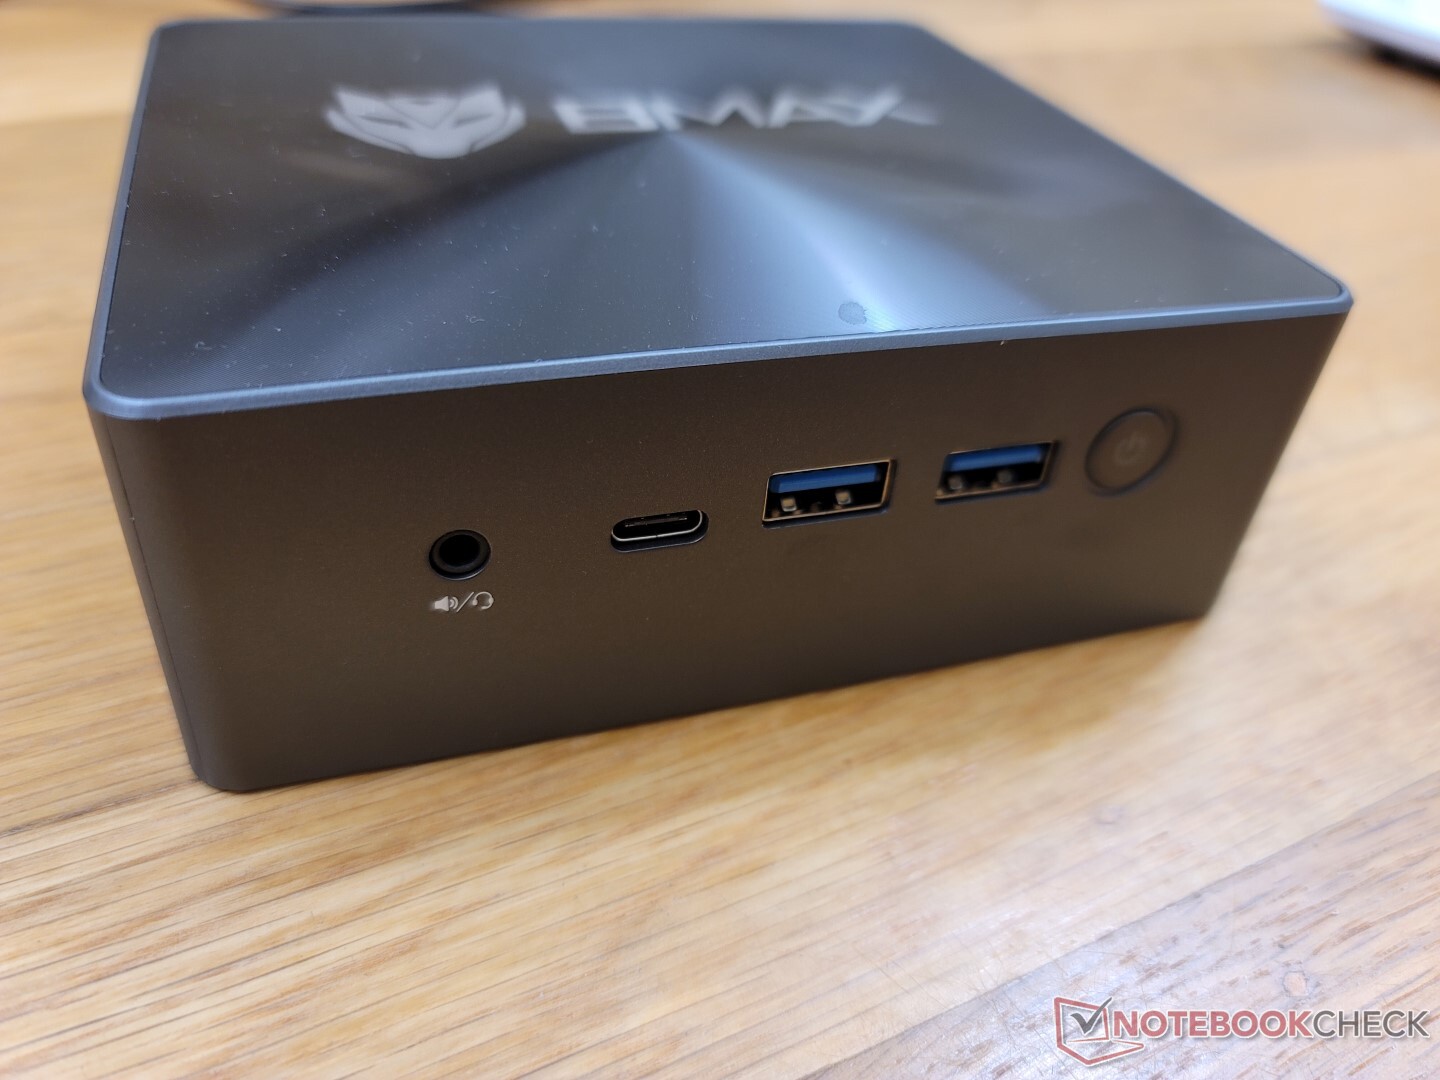
Le port le plus remarquable du B5 Pro est le mini DisplayPort, car la plupart des autres mini-PC dans cette gamme de prix n'en ont pas du tout. les moniteurs 4K à 60 Hz ne sont pas pris en charge par le HDMI.
Le port USB-C en façade prend en charge les moniteurs externes, mais il ne prend pas en charge Power-in ou Thunderbolt.
Communication
Un RealTek RTL8852BE est fourni en standard pour la connectivité Wi-Fi 6 et Bluetooth 5.2. Il n'y a pas de support Wi-Fi 6E, probablement pour économiser sur les coûts. Les taux de transfert sont autrement réguliers et sans aucun problème, même s'ils ne sont pas aussi rapides que la série Intel AX200/201 plus commune.
| Networking | |
| iperf3 transmit AX12 | |
| Intel NUC11TNKi5 | |
| Beelink SEi8 | |
| iperf3 receive AX12 | |
| Intel NUC11TNKi5 | |
| Beelink SEi8 | |
| iperf3 receive AXE11000 6GHz | |
| Beelink SER Pro Ryzen 5 5600H | |
| Beelink SEi11 Pro | |
| iperf3 receive AXE11000 | |
| BMAX B5 Pro G7H8 | |
| Beelink U59 N5105 | |
| iperf3 transmit AXE11000 6GHz | |
| Beelink SER Pro Ryzen 5 5600H | |
| Beelink SEi11 Pro | |
| iperf3 transmit AXE11000 | |
| BMAX B5 Pro G7H8 | |
| Beelink U59 N5105 | |
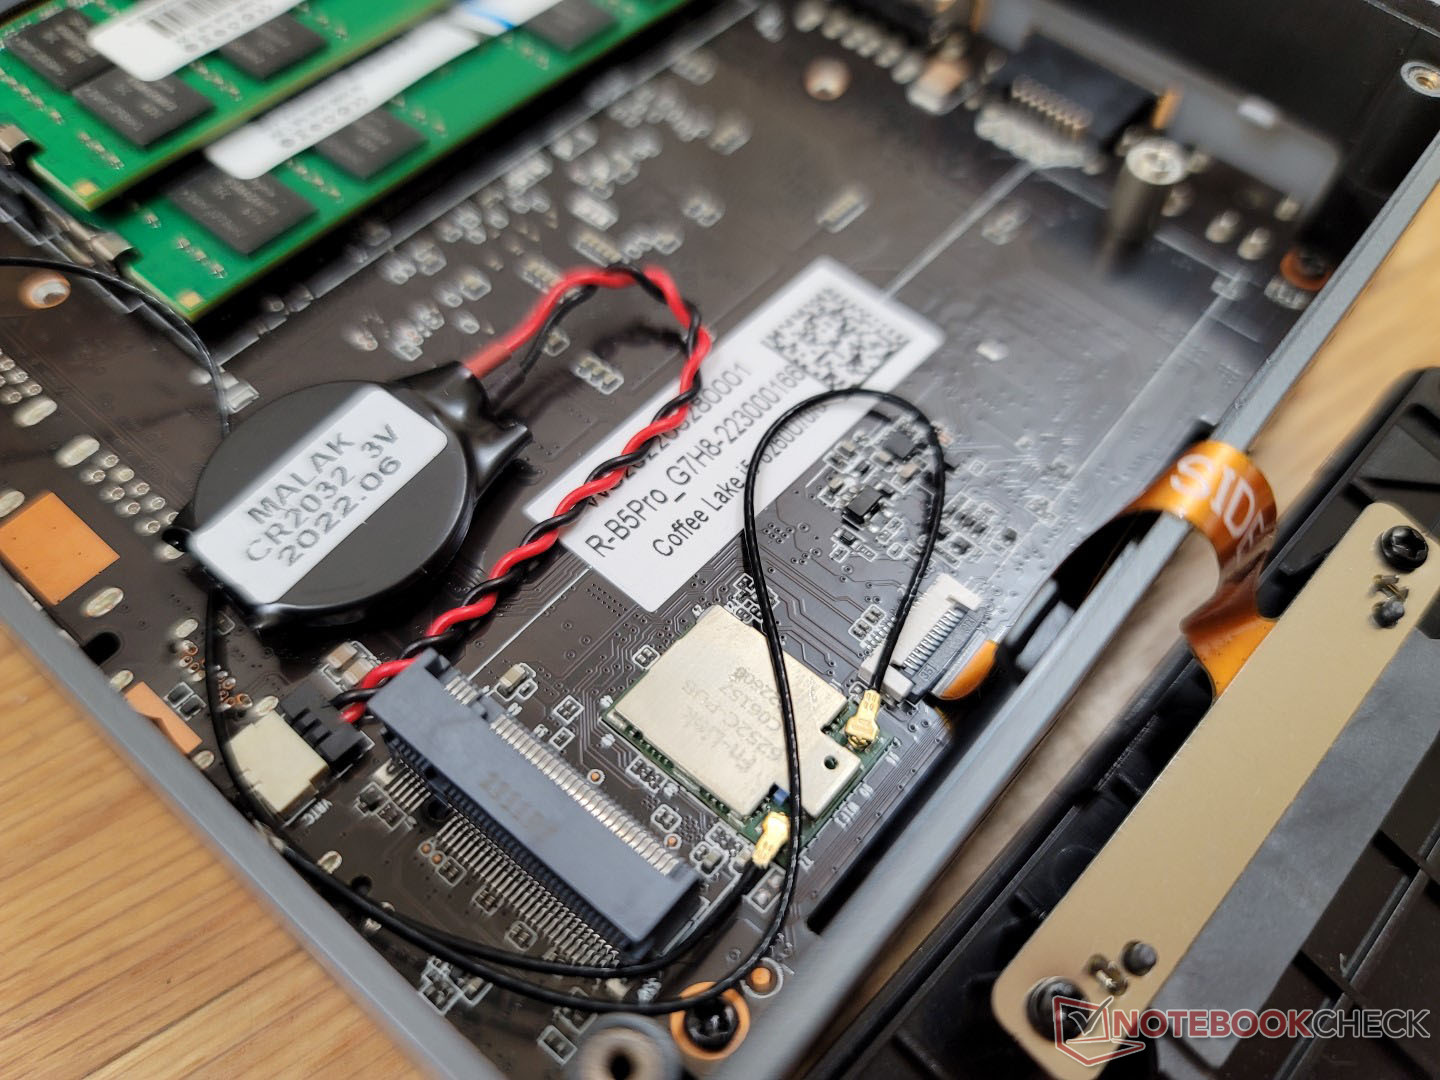
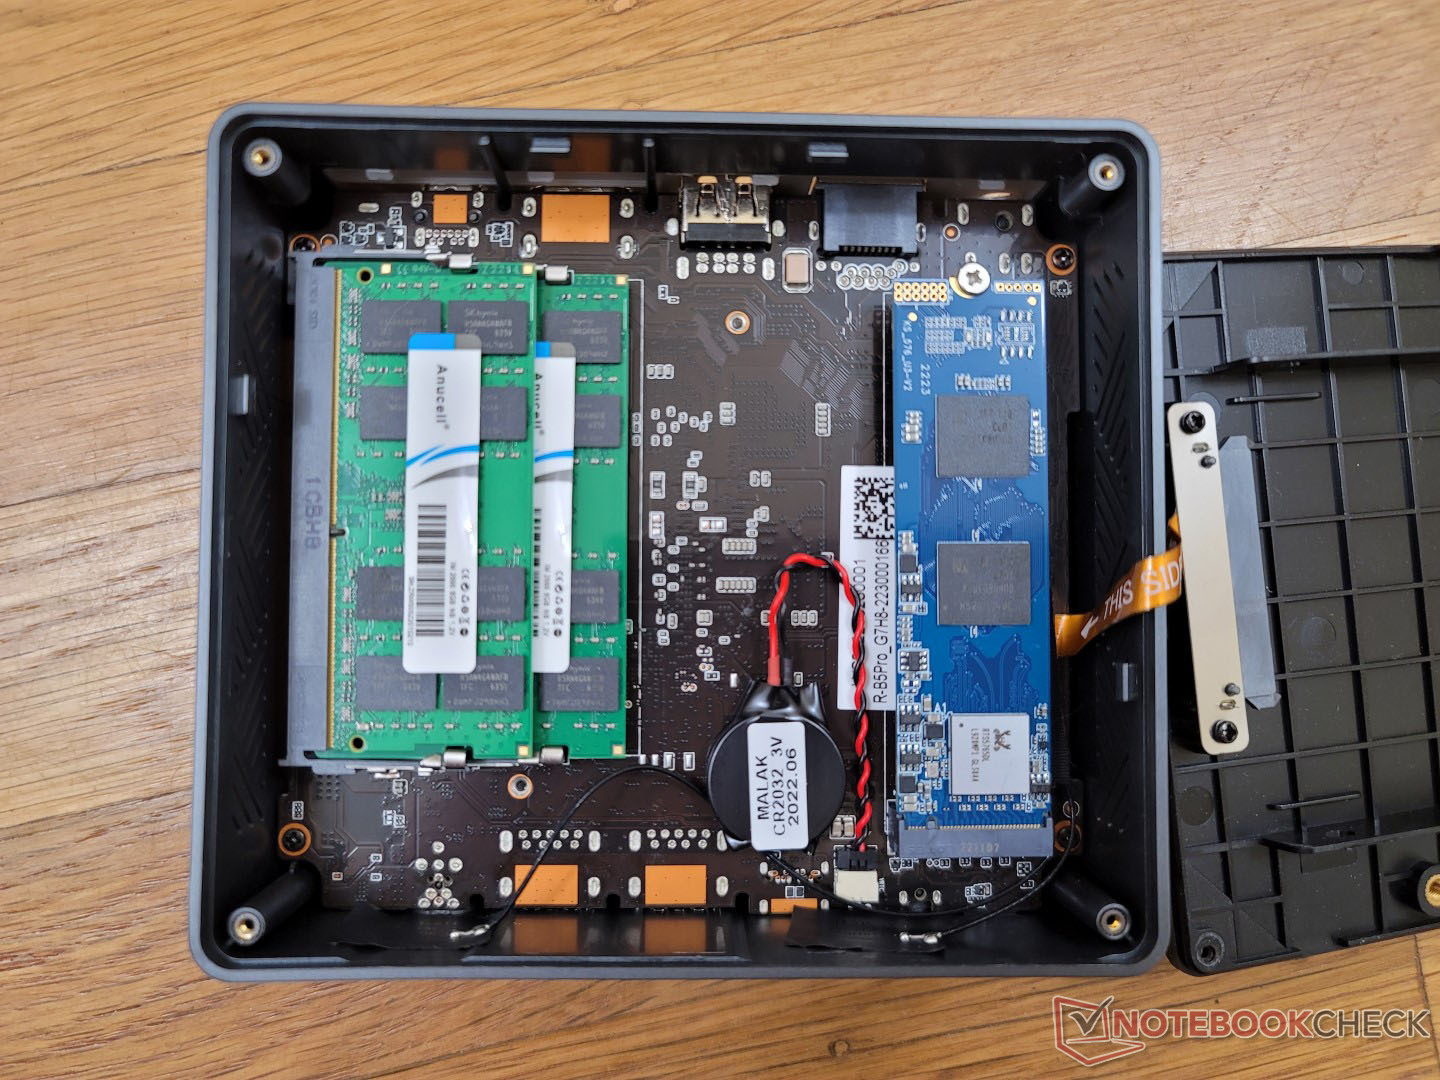
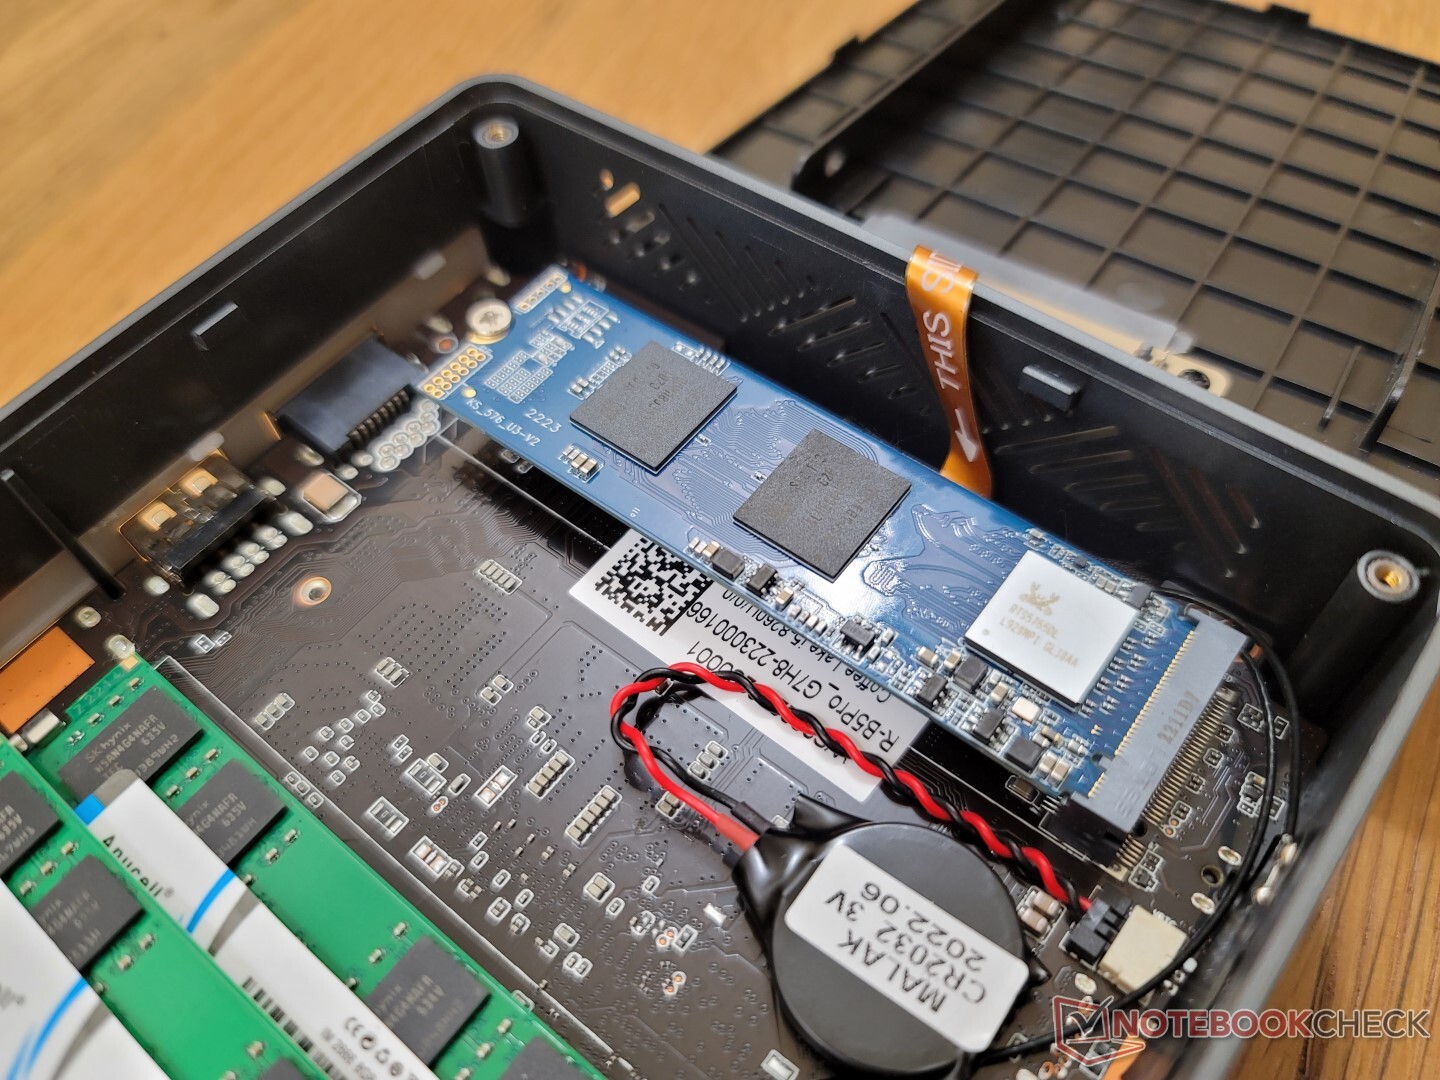
Maintenance
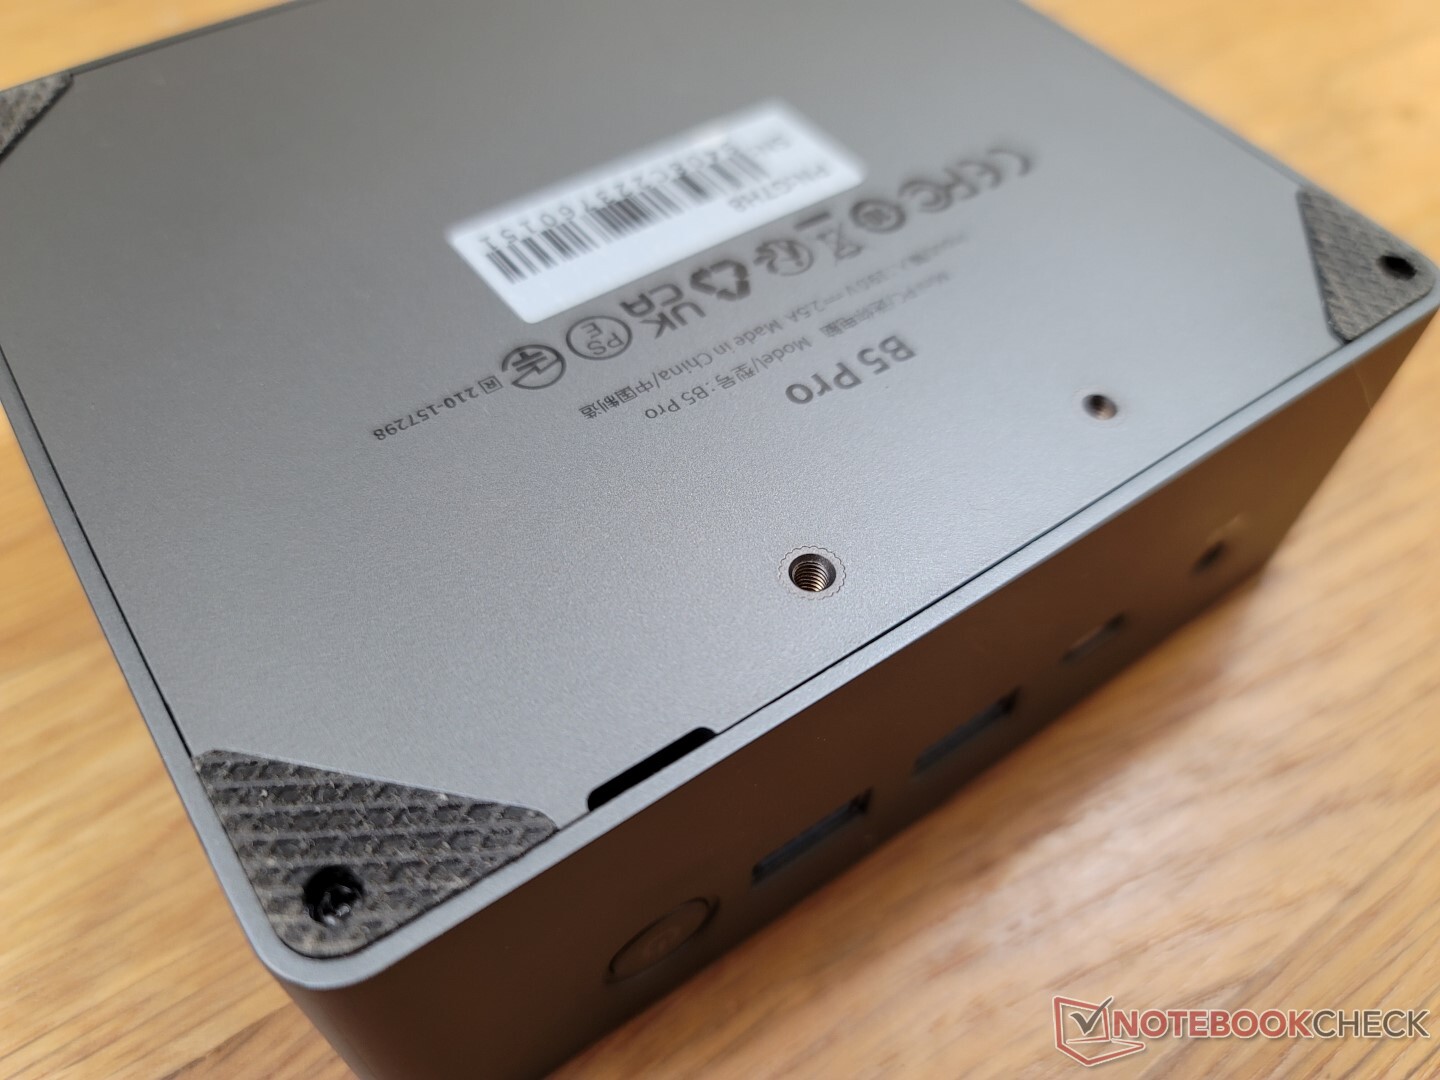
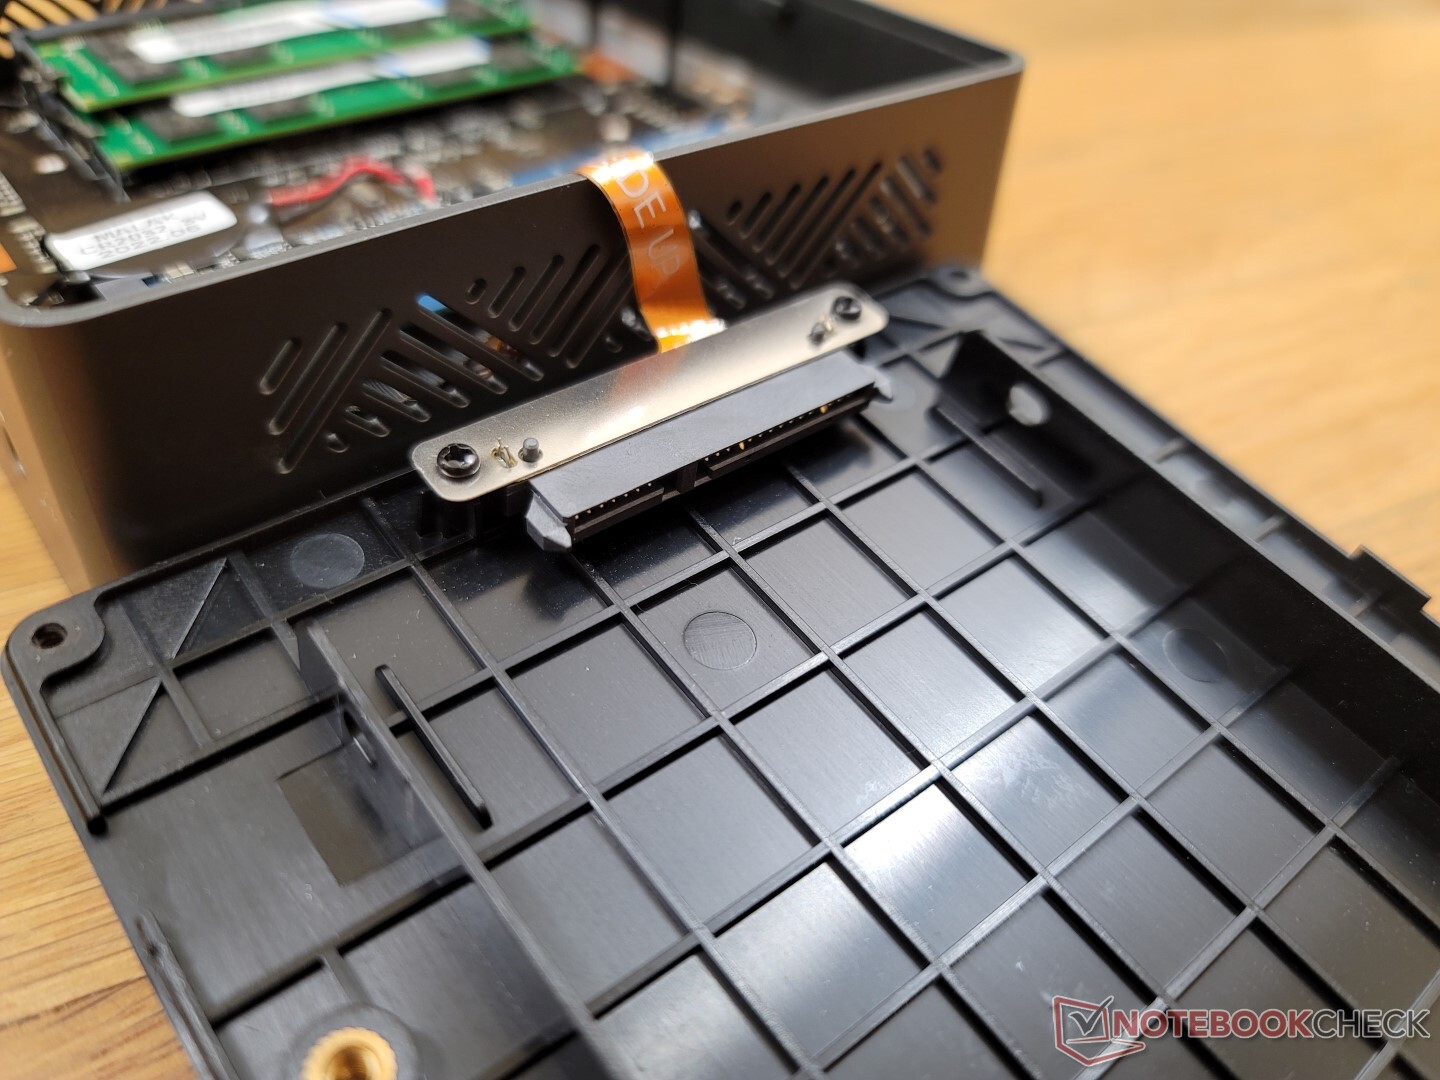
Le panneau inférieur est fixé par quatre vis Philips pour un entretien facile. Cependant, contrairement au Beelink SEi8, le panneau inférieur du BMax présente une petite fente le long d'un bord pour faciliter la prise en main et le retrait
Les utilisateurs peuvent installer jusqu'à deux modules SODIMM DDR4 et jusqu'à deux disques de stockage à l'intérieur.
Accessoires et garantie
La boîte de détail comprend un câble HDMI et un support de montage VESA amovible avec vis, ainsi que l'adaptateur secteur. La garantie limitée standard d'un an s'applique si l'appareil est acheté aux États-Unis.
Performances - 8e génération vs. 12e génération
Conditions d'essai
Nous avons réglé notre appareil en mode Performance via Windows avant d'exécuter les benchmarks ci-dessous pour obtenir les meilleurs résultats possibles. Il n'y a pas d'applications préinstallées par le fabricant pour une expérience utilisateur Windows propre.
Processeur
Les performances brutes du processeur sont généralement comparables à celles du Core i7-1065G7 ouCore i5-8259U. Bien que beaucoup plus lent que le Core i5-1135G7 jusqu'à 50 %, il reste suffisamment rapide pour les applications multimédias courantes telles que la navigation sur le Web, la diffusion de vidéos en continu et un fonctionnement multitâche modéré.
La 12e génération de Core i5-1235Ude 12e génération, qui a plusieurs générations d'avance sur notre Core i5-8260U, offre des performances monofil et multifil respectivement 60 % et 80 % plus rapides.
La durabilité des performances est décente. Lors de l'exécution de CineBench R15 xT en boucle, les performances baissent d'environ 11 % au fil du temps.
Cinebench R15 Multi Loop
Cinebench R23: Multi Core | Single Core
Cinebench R15: CPU Multi 64Bit | CPU Single 64Bit
Blender: v2.79 BMW27 CPU
7-Zip 18.03: 7z b 4 | 7z b 4 -mmt1
Geekbench 5.5: Multi-Core | Single-Core
HWBOT x265 Benchmark v2.2: 4k Preset
LibreOffice : 20 Documents To PDF
R Benchmark 2.5: Overall mean
| Cinebench R20 / CPU (Multi Core) | |
| Beelink SER Pro Ryzen 5 5600H | |
| Beelink SEi11 Pro | |
| Asus Vivobook 15 K513EQ | |
| Intel NUC11TNKi5 | |
| BMAX B5 Pro G7H8 | |
| Geekom Mini IT8-GM08i5T | |
| Infinix INBook X2 | |
| Fujitsu Lifebook U939 i5 | |
| Beelink U59 N5105 | |
| Beelink SEi8 | |
| Cinebench R20 / CPU (Single Core) | |
| Asus Vivobook 15 K513EQ | |
| Beelink SEi11 Pro | |
| Beelink SER Pro Ryzen 5 5600H | |
| Intel NUC11TNKi5 | |
| Infinix INBook X2 | |
| BMAX B5 Pro G7H8 | |
| Fujitsu Lifebook U939 i5 | |
| Geekom Mini IT8-GM08i5T | |
| Beelink SEi8 | |
| Beelink U59 N5105 | |
| Cinebench R23 / Multi Core | |
| Beelink SER Pro Ryzen 5 5600H | |
| Beelink SEi11 Pro | |
| Asus Vivobook 15 K513EQ | |
| Intel NUC11TNKi5 | |
| Geekom Mini IT8-GM08i5T | |
| Infinix INBook X2 | |
| BMAX B5 Pro G7H8 | |
| Beelink U59 N5105 | |
| Beelink SEi8 | |
| Cinebench R23 / Single Core | |
| Asus Vivobook 15 K513EQ | |
| Beelink SEi11 Pro | |
| Intel NUC11TNKi5 | |
| Beelink SER Pro Ryzen 5 5600H | |
| Infinix INBook X2 | |
| Beelink SEi8 | |
| BMAX B5 Pro G7H8 | |
| Beelink U59 N5105 | |
| Cinebench R15 / CPU Multi 64Bit | |
| Beelink SER Pro Ryzen 5 5600H | |
| Asus Vivobook 15 K513EQ | |
| Beelink SEi11 Pro | |
| Intel NUC11TNKi5 | |
| BMAX B5 Pro G7H8 | |
| Geekom Mini IT8-GM08i5T | |
| Infinix INBook X2 | |
| Fujitsu Lifebook U939 i5 | |
| Beelink U59 N5105 | |
| Beelink SEi8 | |
| Cinebench R15 / CPU Single 64Bit | |
| Asus Vivobook 15 K513EQ | |
| Beelink SER Pro Ryzen 5 5600H | |
| Beelink SEi11 Pro | |
| Intel NUC11TNKi5 | |
| Fujitsu Lifebook U939 i5 | |
| BMAX B5 Pro G7H8 | |
| Infinix INBook X2 | |
| Geekom Mini IT8-GM08i5T | |
| Beelink SEi8 | |
| Beelink U59 N5105 | |
| Blender / v2.79 BMW27 CPU | |
| Beelink U59 N5105 | |
| Beelink SEi8 | |
| Fujitsu Lifebook U939 i5 | |
| Infinix INBook X2 | |
| BMAX B5 Pro G7H8 | |
| Geekom Mini IT8-GM08i5T | |
| Intel NUC11TNKi5 | |
| Asus Vivobook 15 K513EQ | |
| Beelink SEi11 Pro | |
| Beelink SER Pro Ryzen 5 5600H | |
| 7-Zip 18.03 / 7z b 4 | |
| Beelink SER Pro Ryzen 5 5600H | |
| Geekom Mini IT8-GM08i5T | |
| Asus Vivobook 15 K513EQ | |
| Beelink SEi11 Pro | |
| Intel NUC11TNKi5 | |
| BMAX B5 Pro G7H8 | |
| Infinix INBook X2 | |
| Fujitsu Lifebook U939 i5 | |
| Beelink U59 N5105 | |
| Beelink SEi8 | |
| 7-Zip 18.03 / 7z b 4 -mmt1 | |
| Beelink SER Pro Ryzen 5 5600H | |
| Asus Vivobook 15 K513EQ | |
| Beelink SEi11 Pro | |
| Intel NUC11TNKi5 | |
| BMAX B5 Pro G7H8 | |
| Fujitsu Lifebook U939 i5 | |
| Geekom Mini IT8-GM08i5T | |
| Beelink SEi8 | |
| Infinix INBook X2 | |
| Beelink U59 N5105 | |
| Geekbench 5.5 / Multi-Core | |
| Beelink SER Pro Ryzen 5 5600H | |
| Beelink SEi11 Pro | |
| Intel NUC11TNKi5 | |
| Geekom Mini IT8-GM08i5T | |
| Fujitsu Lifebook U939 i5 | |
| Infinix INBook X2 | |
| Beelink U59 N5105 | |
| Beelink SEi8 | |
| BMAX B5 Pro G7H8 | |
| Geekbench 5.5 / Single-Core | |
| Beelink SEi11 Pro | |
| Beelink SER Pro Ryzen 5 5600H | |
| Intel NUC11TNKi5 | |
| Infinix INBook X2 | |
| Fujitsu Lifebook U939 i5 | |
| Geekom Mini IT8-GM08i5T | |
| Beelink SEi8 | |
| Beelink U59 N5105 | |
| BMAX B5 Pro G7H8 | |
| HWBOT x265 Benchmark v2.2 / 4k Preset | |
| Beelink SER Pro Ryzen 5 5600H | |
| Beelink SEi11 Pro | |
| Asus Vivobook 15 K513EQ | |
| Intel NUC11TNKi5 | |
| Geekom Mini IT8-GM08i5T | |
| Infinix INBook X2 | |
| Fujitsu Lifebook U939 i5 | |
| Beelink SEi8 | |
| Beelink U59 N5105 | |
| BMAX B5 Pro G7H8 | |
| LibreOffice / 20 Documents To PDF | |
| BMAX B5 Pro G7H8 | |
| Beelink U59 N5105 | |
| Beelink SEi8 | |
| Geekom Mini IT8-GM08i5T | |
| Infinix INBook X2 | |
| Fujitsu Lifebook U939 i5 | |
| Beelink SER Pro Ryzen 5 5600H | |
| Intel NUC11TNKi5 | |
| Beelink SEi11 Pro | |
| Asus Vivobook 15 K513EQ | |
| R Benchmark 2.5 / Overall mean | |
| BMAX B5 Pro G7H8 | |
| Beelink U59 N5105 | |
| Beelink SEi8 | |
| Geekom Mini IT8-GM08i5T | |
| Infinix INBook X2 | |
| Fujitsu Lifebook U939 i5 | |
| Intel NUC11TNKi5 | |
| Beelink SEi11 Pro | |
| Asus Vivobook 15 K513EQ | |
| Beelink SER Pro Ryzen 5 5600H | |
* ... Moindre est la valeur, meilleures sont les performances
AIDA64: FP32 Ray-Trace | FPU Julia | CPU SHA3 | CPU Queen | FPU SinJulia | FPU Mandel | CPU AES | CPU ZLib | FP64 Ray-Trace | CPU PhotoWorxx
| Performance rating | |
| Beelink SER Pro Ryzen 5 5600H | |
| Beelink SEi11 Pro | |
| Intel NUC11TNKi5 | |
| BMAX B5 Pro G7H8 | |
| Beelink SEi8 | |
| Beelink U59 N5105 | |
| AIDA64 / FP32 Ray-Trace | |
| Beelink SER Pro Ryzen 5 5600H | |
| Beelink SEi11 Pro | |
| Intel NUC11TNKi5 | |
| BMAX B5 Pro G7H8 | |
| Beelink SEi8 | |
| Beelink U59 N5105 | |
| AIDA64 / FPU Julia | |
| Beelink SER Pro Ryzen 5 5600H | |
| Beelink SEi11 Pro | |
| Intel NUC11TNKi5 | |
| BMAX B5 Pro G7H8 | |
| Beelink SEi8 | |
| Beelink U59 N5105 | |
| AIDA64 / CPU SHA3 | |
| Beelink SER Pro Ryzen 5 5600H | |
| Beelink SEi11 Pro | |
| Intel NUC11TNKi5 | |
| BMAX B5 Pro G7H8 | |
| Beelink SEi8 | |
| Beelink U59 N5105 | |
| AIDA64 / CPU Queen | |
| Beelink SER Pro Ryzen 5 5600H | |
| Beelink SEi11 Pro | |
| Intel NUC11TNKi5 | |
| BMAX B5 Pro G7H8 | |
| Beelink SEi8 | |
| Beelink U59 N5105 | |
| AIDA64 / FPU SinJulia | |
| Beelink SER Pro Ryzen 5 5600H | |
| Beelink SEi11 Pro | |
| Intel NUC11TNKi5 | |
| BMAX B5 Pro G7H8 | |
| Beelink SEi8 | |
| Beelink U59 N5105 | |
| AIDA64 / FPU Mandel | |
| Beelink SER Pro Ryzen 5 5600H | |
| Beelink SEi11 Pro | |
| Intel NUC11TNKi5 | |
| BMAX B5 Pro G7H8 | |
| Beelink SEi8 | |
| Beelink U59 N5105 | |
| AIDA64 / CPU AES | |
| Beelink SER Pro Ryzen 5 5600H | |
| Beelink SEi11 Pro | |
| Intel NUC11TNKi5 | |
| Beelink U59 N5105 | |
| BMAX B5 Pro G7H8 | |
| Beelink SEi8 | |
| AIDA64 / CPU ZLib | |
| Beelink SER Pro Ryzen 5 5600H | |
| Intel NUC11TNKi5 | |
| Beelink SEi11 Pro | |
| BMAX B5 Pro G7H8 | |
| Beelink U59 N5105 | |
| Beelink SEi8 | |
| AIDA64 / FP64 Ray-Trace | |
| Beelink SER Pro Ryzen 5 5600H | |
| Beelink SEi11 Pro | |
| Intel NUC11TNKi5 | |
| BMAX B5 Pro G7H8 | |
| Beelink SEi8 | |
| Beelink U59 N5105 | |
| AIDA64 / CPU PhotoWorxx | |
| Beelink SEi11 Pro | |
| Beelink SER Pro Ryzen 5 5600H | |
| BMAX B5 Pro G7H8 | |
| Intel NUC11TNKi5 | |
| Beelink SEi8 | |
| Beelink U59 N5105 | |
Performance du système
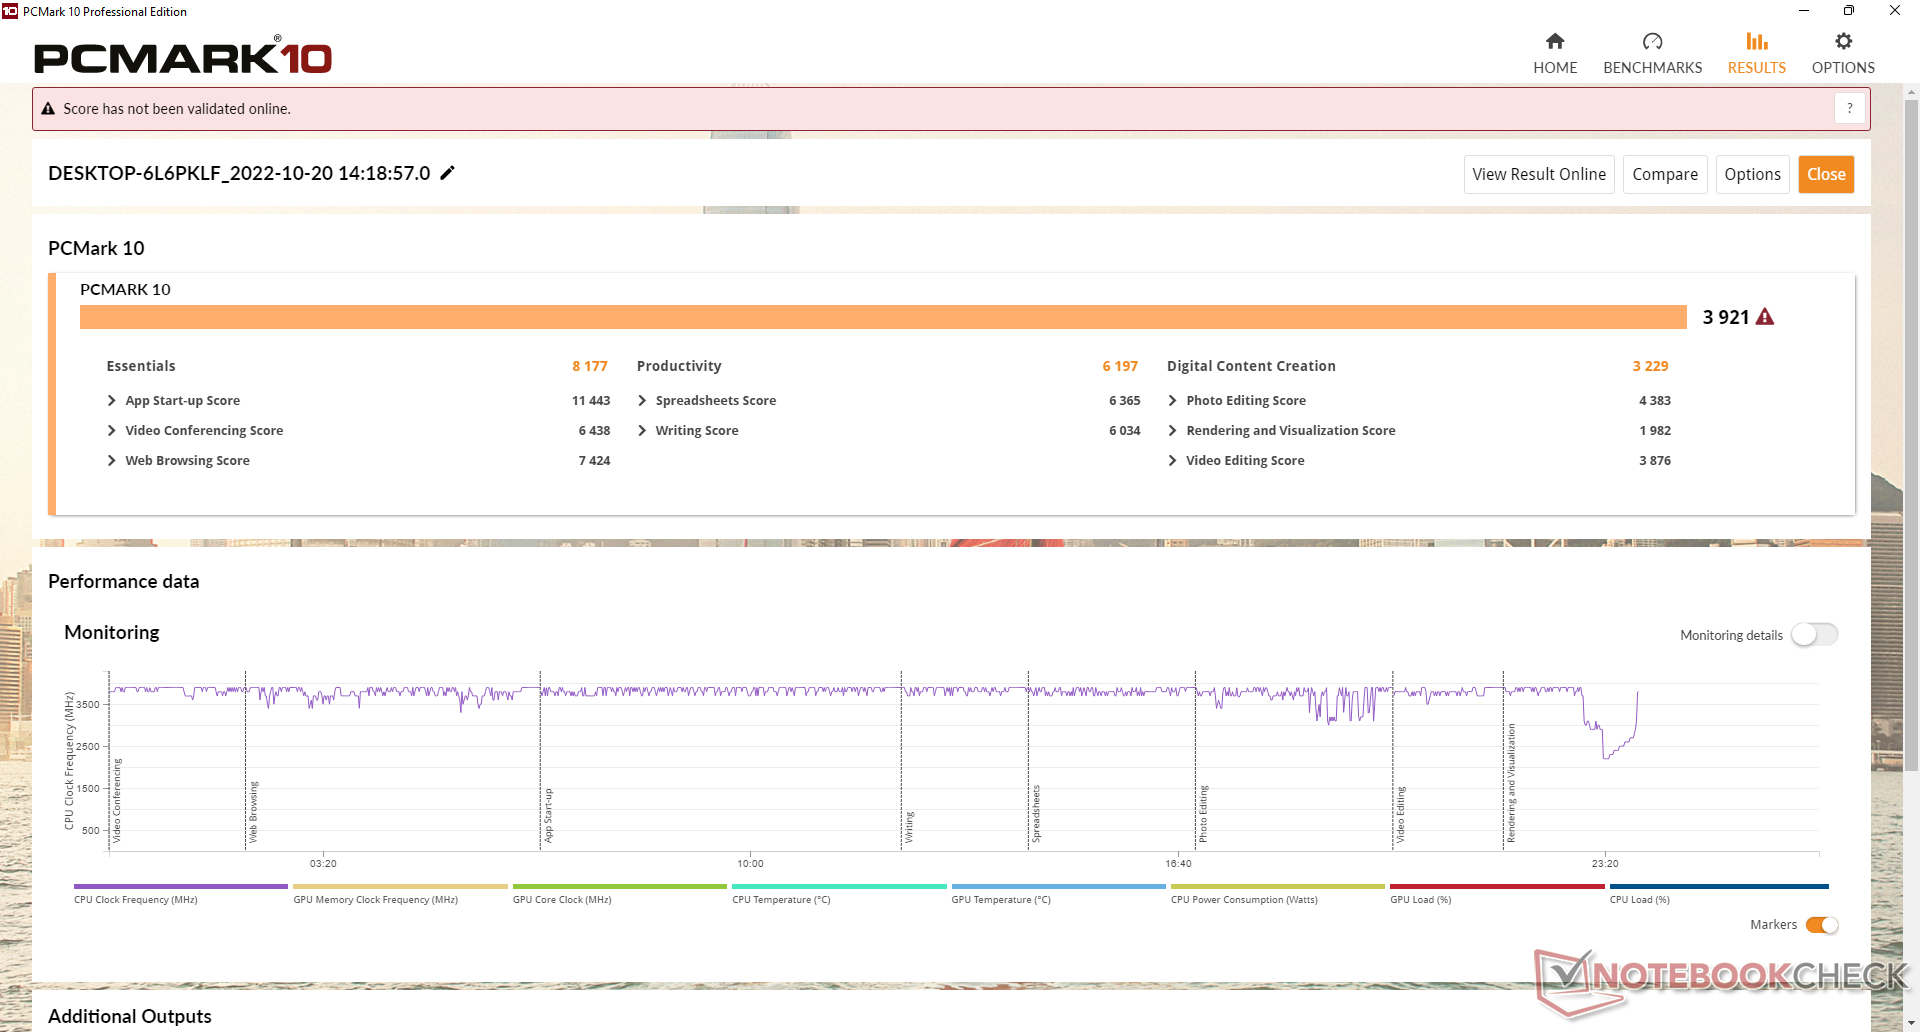
Les résultats de PCMark 10 sont comparables à ceux du Beelink SEi8 qui utilise également un ancien CPU Core de 8e génération. Les mini-PC dotés de CPU de 11e génération plus récents, comme le NUC11TNKi5 d'Intel, sont capables d'offrir des scores de création de contenu numérique nettement plus élevés grâce à leurs GPU intégrés plus rapides.
CrossMark: Overall | Productivity | Creativity | Responsiveness
| PCMark 10 / Score | |
| Beelink SER Pro Ryzen 5 5600H | |
| Beelink SEi11 Pro | |
| Intel NUC11TNKi5 | |
| BMAX B5 Pro G7H8 | |
| Beelink SEi8 | |
| Beelink U59 N5105 | |
| PCMark 10 / Essentials | |
| Beelink SER Pro Ryzen 5 5600H | |
| Beelink SEi11 Pro | |
| Intel NUC11TNKi5 | |
| BMAX B5 Pro G7H8 | |
| Beelink SEi8 | |
| Beelink U59 N5105 | |
| PCMark 10 / Productivity | |
| Beelink SER Pro Ryzen 5 5600H | |
| Beelink SEi11 Pro | |
| BMAX B5 Pro G7H8 | |
| Intel NUC11TNKi5 | |
| Beelink SEi8 | |
| Beelink U59 N5105 | |
| PCMark 10 / Digital Content Creation | |
| Beelink SER Pro Ryzen 5 5600H | |
| Beelink SEi11 Pro | |
| Intel NUC11TNKi5 | |
| BMAX B5 Pro G7H8 | |
| Beelink SEi8 | |
| Beelink U59 N5105 | |
| CrossMark / Overall | |
| Beelink SEi11 Pro | |
| Beelink SER Pro Ryzen 5 5600H | |
| BMAX B5 Pro G7H8 | |
| Beelink U59 N5105 | |
| CrossMark / Productivity | |
| Beelink SEi11 Pro | |
| Beelink SER Pro Ryzen 5 5600H | |
| BMAX B5 Pro G7H8 | |
| Beelink U59 N5105 | |
| CrossMark / Creativity | |
| Beelink SER Pro Ryzen 5 5600H | |
| Beelink SEi11 Pro | |
| BMAX B5 Pro G7H8 | |
| Beelink U59 N5105 | |
| CrossMark / Responsiveness | |
| Beelink SEi11 Pro | |
| Beelink SER Pro Ryzen 5 5600H | |
| BMAX B5 Pro G7H8 | |
| Beelink U59 N5105 | |
| PCMark 10 Score | 3921 points | |
Aide | ||
| AIDA64 / Memory Copy | |
| Beelink SER Pro Ryzen 5 5600H | |
| Beelink SEi11 Pro | |
| Beelink SEi8 | |
| BMAX B5 Pro G7H8 | |
| Beelink U59 N5105 | |
| Intel NUC11TNKi5 | |
| AIDA64 / Memory Read | |
| Beelink SER Pro Ryzen 5 5600H | |
| Beelink SEi11 Pro | |
| BMAX B5 Pro G7H8 | |
| Beelink SEi8 | |
| Intel NUC11TNKi5 | |
| Beelink U59 N5105 | |
| AIDA64 / Memory Write | |
| Beelink SEi11 Pro | |
| Beelink SER Pro Ryzen 5 5600H | |
| BMAX B5 Pro G7H8 | |
| Beelink U59 N5105 | |
| Intel NUC11TNKi5 | |
| Beelink SEi8 | |
| AIDA64 / Memory Latency | |
| BMAX B5 Pro G7H8 | |
| Intel NUC11TNKi5 | |
| Beelink SEi11 Pro | |
| Beelink SER Pro Ryzen 5 5600H | |
| Beelink U59 N5105 | |
| Beelink SEi8 | |
* ... Moindre est la valeur, meilleures sont les performances
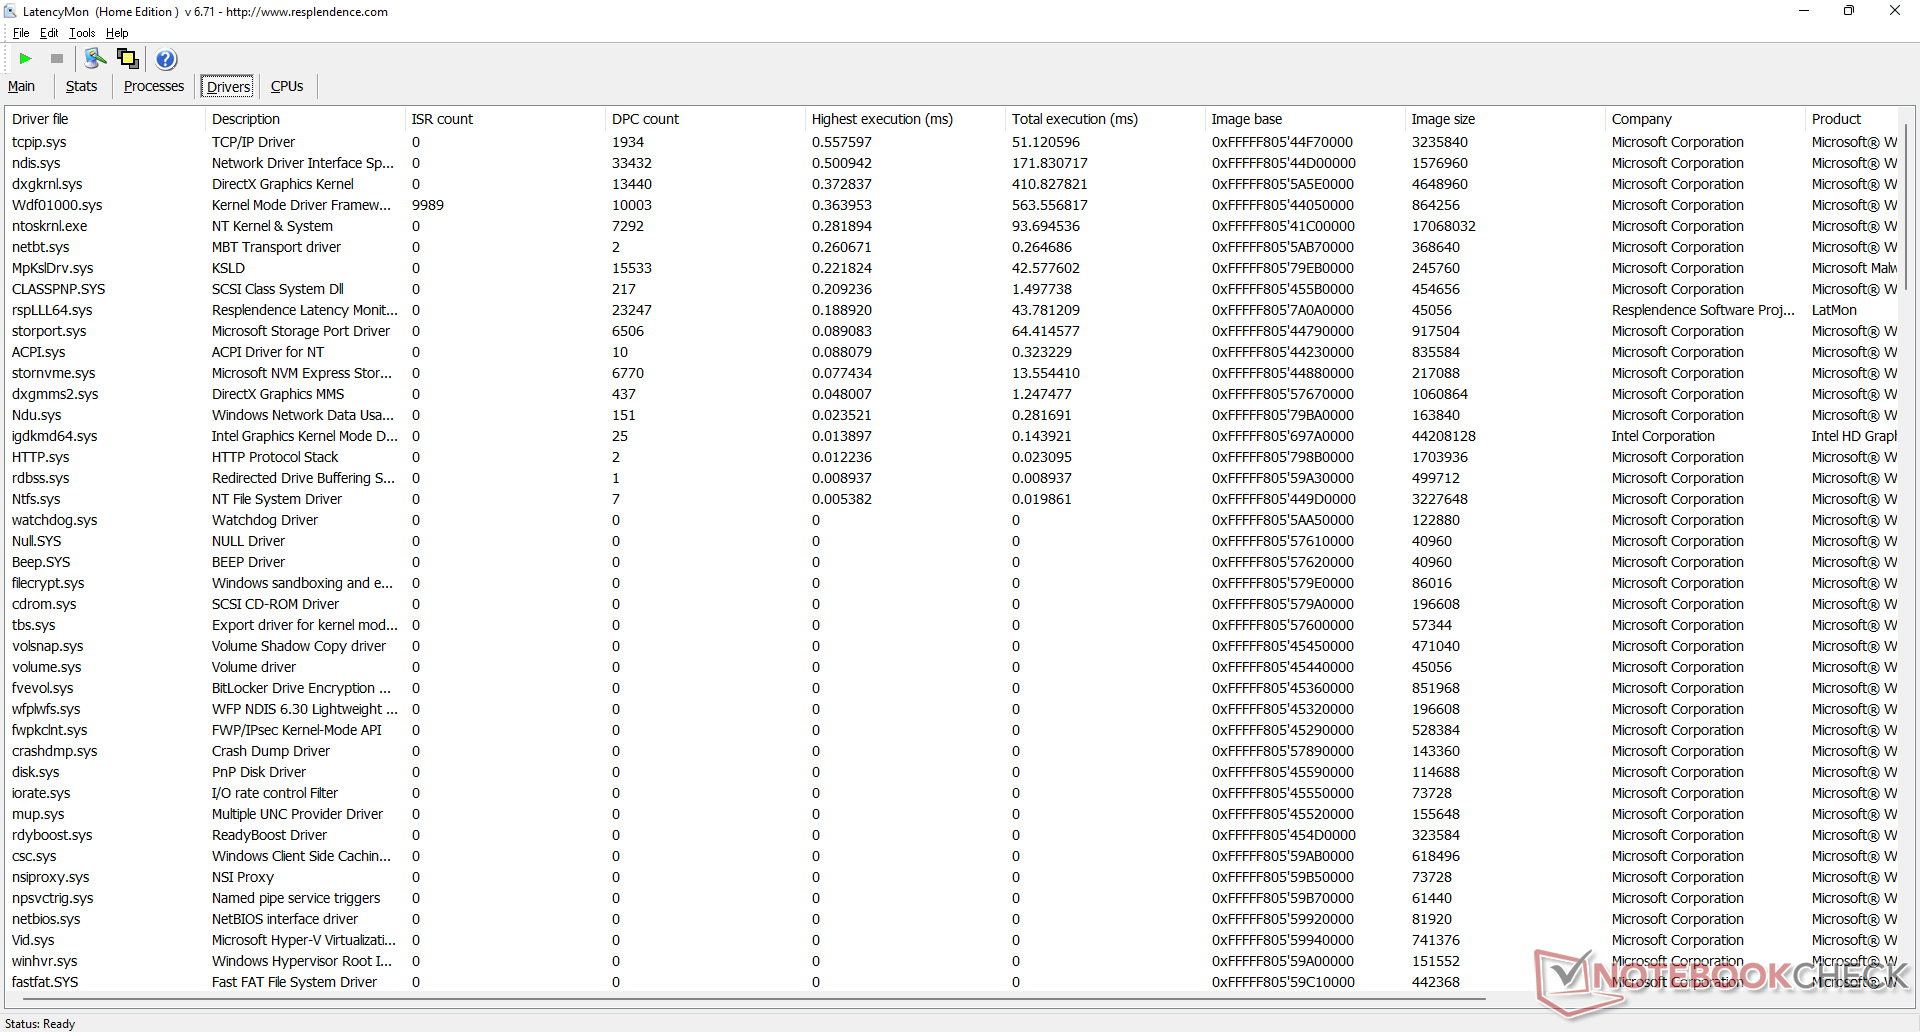
Latence DPC
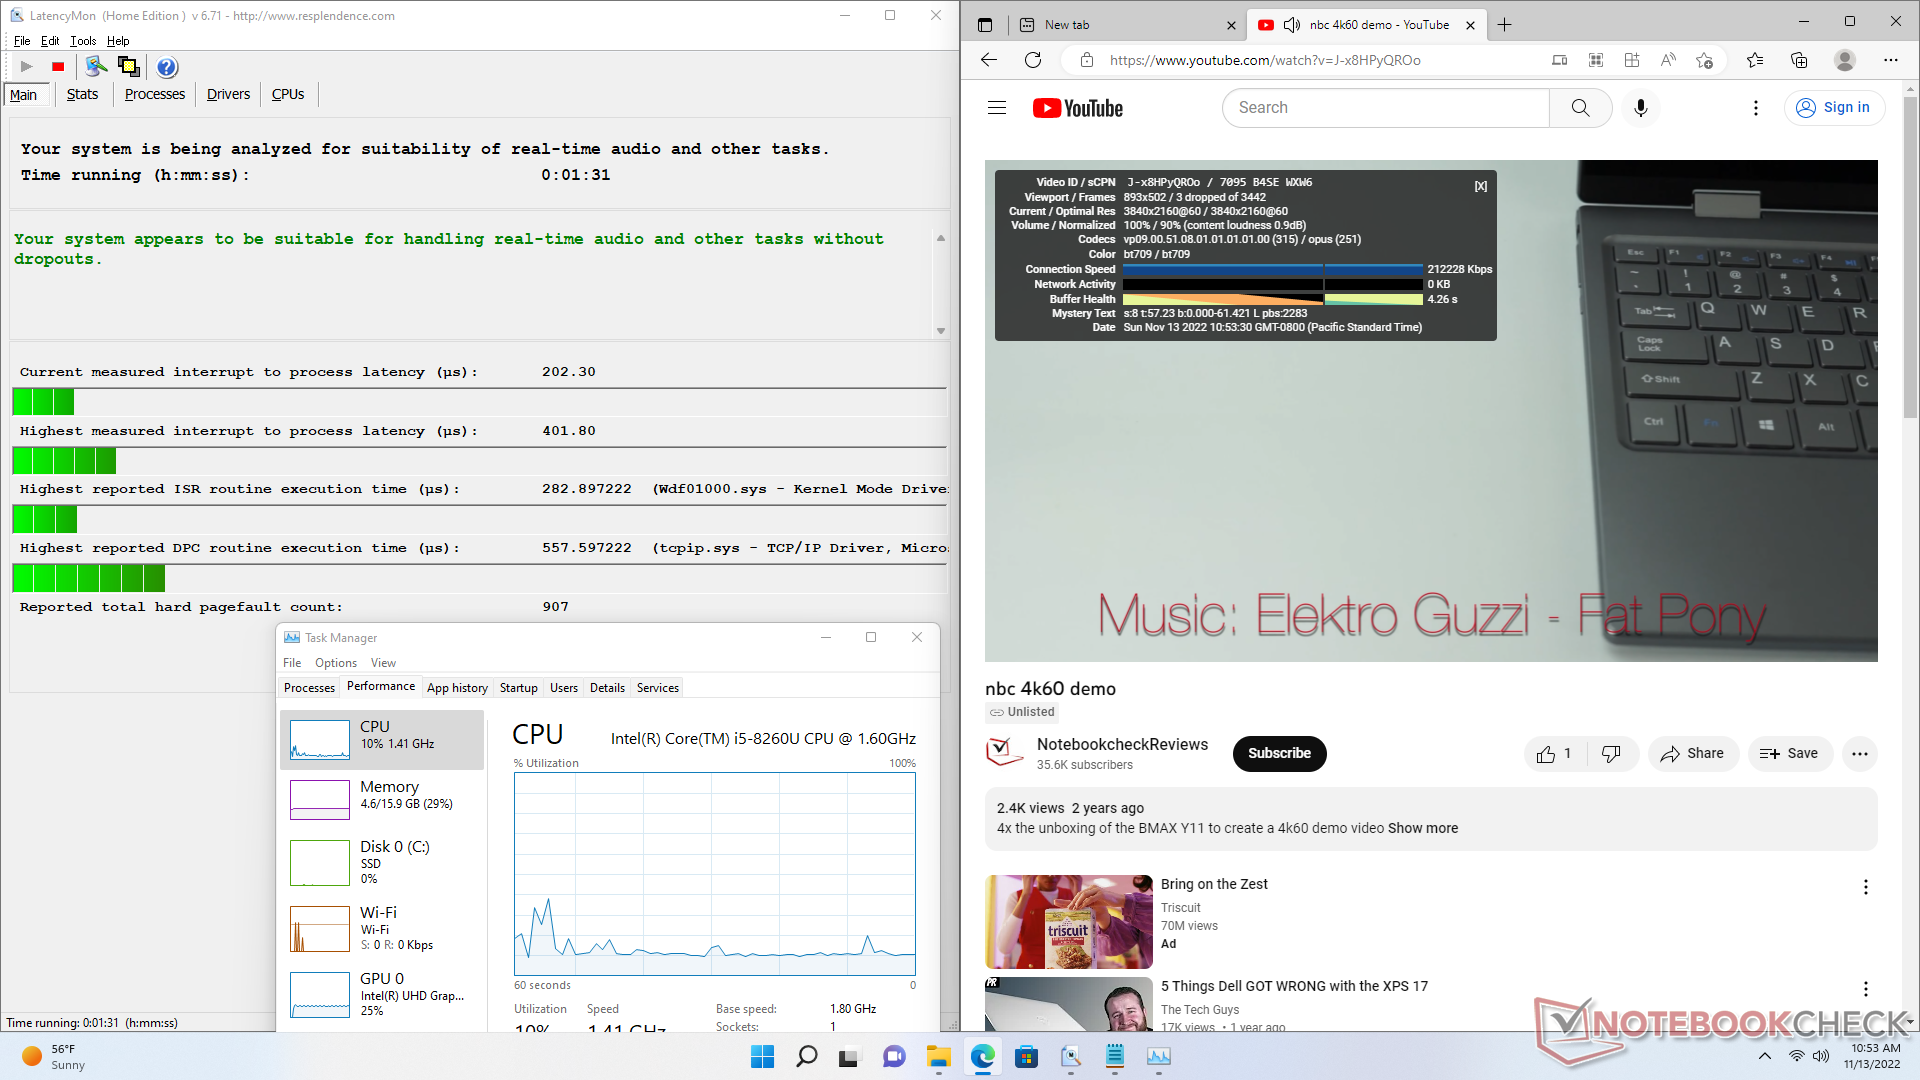
LatencyMon ne révèle aucun problème majeur de DPC lors de la navigation sur le web. la lecture de vidéos 4K à 60 FPS est également excellente, avec seulement 3 images perdues pendant notre test de lecture d'une minute.
| DPC Latencies / LatencyMon - interrupt to process latency (max), Web, Youtube, Prime95 | |
| Beelink SEi8 | |
| Beelink U59 N5105 | |
| Beelink SER Pro Ryzen 5 5600H | |
| Intel NUC11TNKi5 | |
| BMAX B5 Pro G7H8 | |
| Beelink SEi11 Pro | |
* ... Moindre est la valeur, meilleures sont les performances
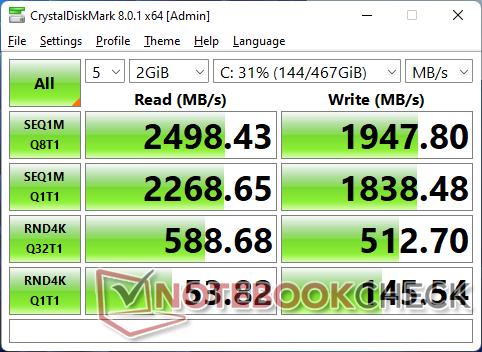
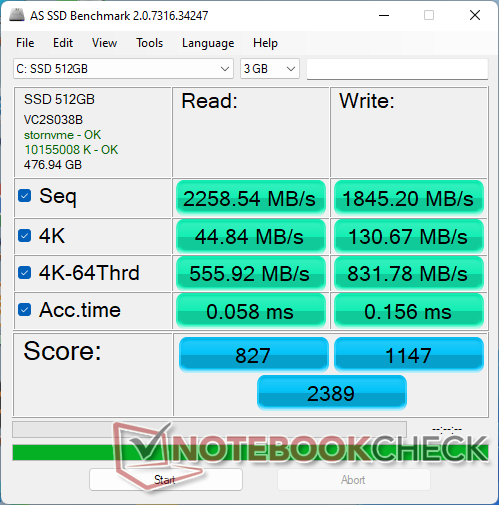
Périphériques de stockage - Jusqu'à deux disques
Le B5 Pro utilise un SSD générique M.2 PCIe3 x4 avec un contrôleur RealTek RTS5763DL Contrôleur RealTek RTS5763DL afin d'économiser sur les coûts. Les performances ne sont pas optimales, cependant, car les taux de lecture tombent de leur niveau initial de ~2400 Mo/s à seulement ~1700 Mo/s lorsque le disque est sollicité.

| Drive Performance rating - Percent | |
| Beelink SER Pro Ryzen 5 5600H -11! | |
| BMAX B5 Pro G7H8 | |
| Beelink SEi11 Pro | |
| Beelink SEi8 | |
| Beelink U59 N5105 | |
| Intel NUC11TNKi5 | |
* ... Moindre est la valeur, meilleures sont les performances
Disk Throttling: DiskSpd Read Loop, Queue Depth 8
Performances du GPU
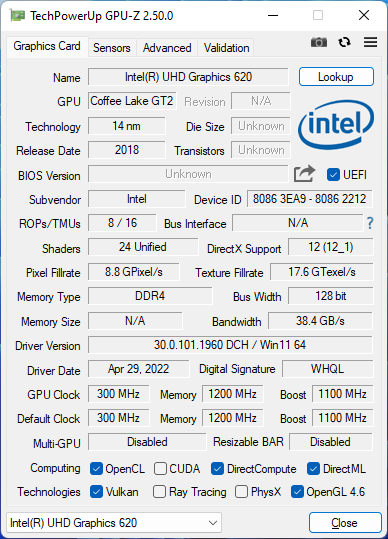
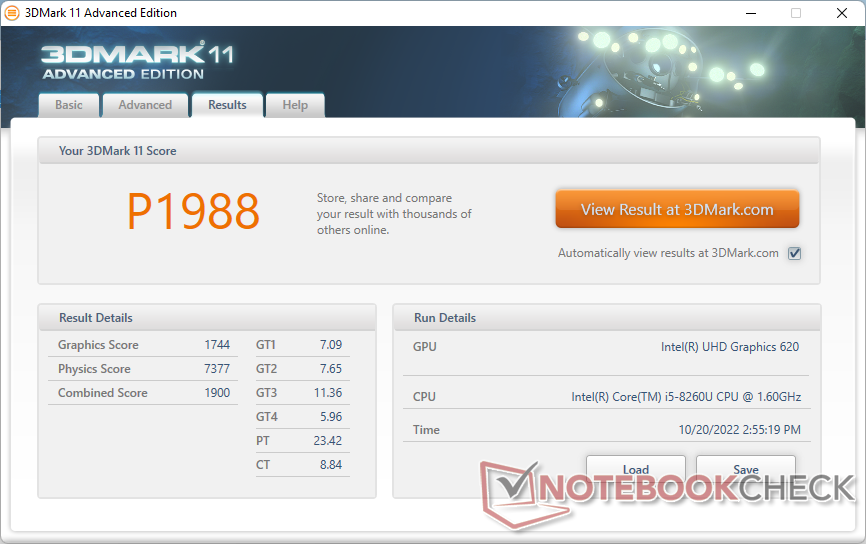
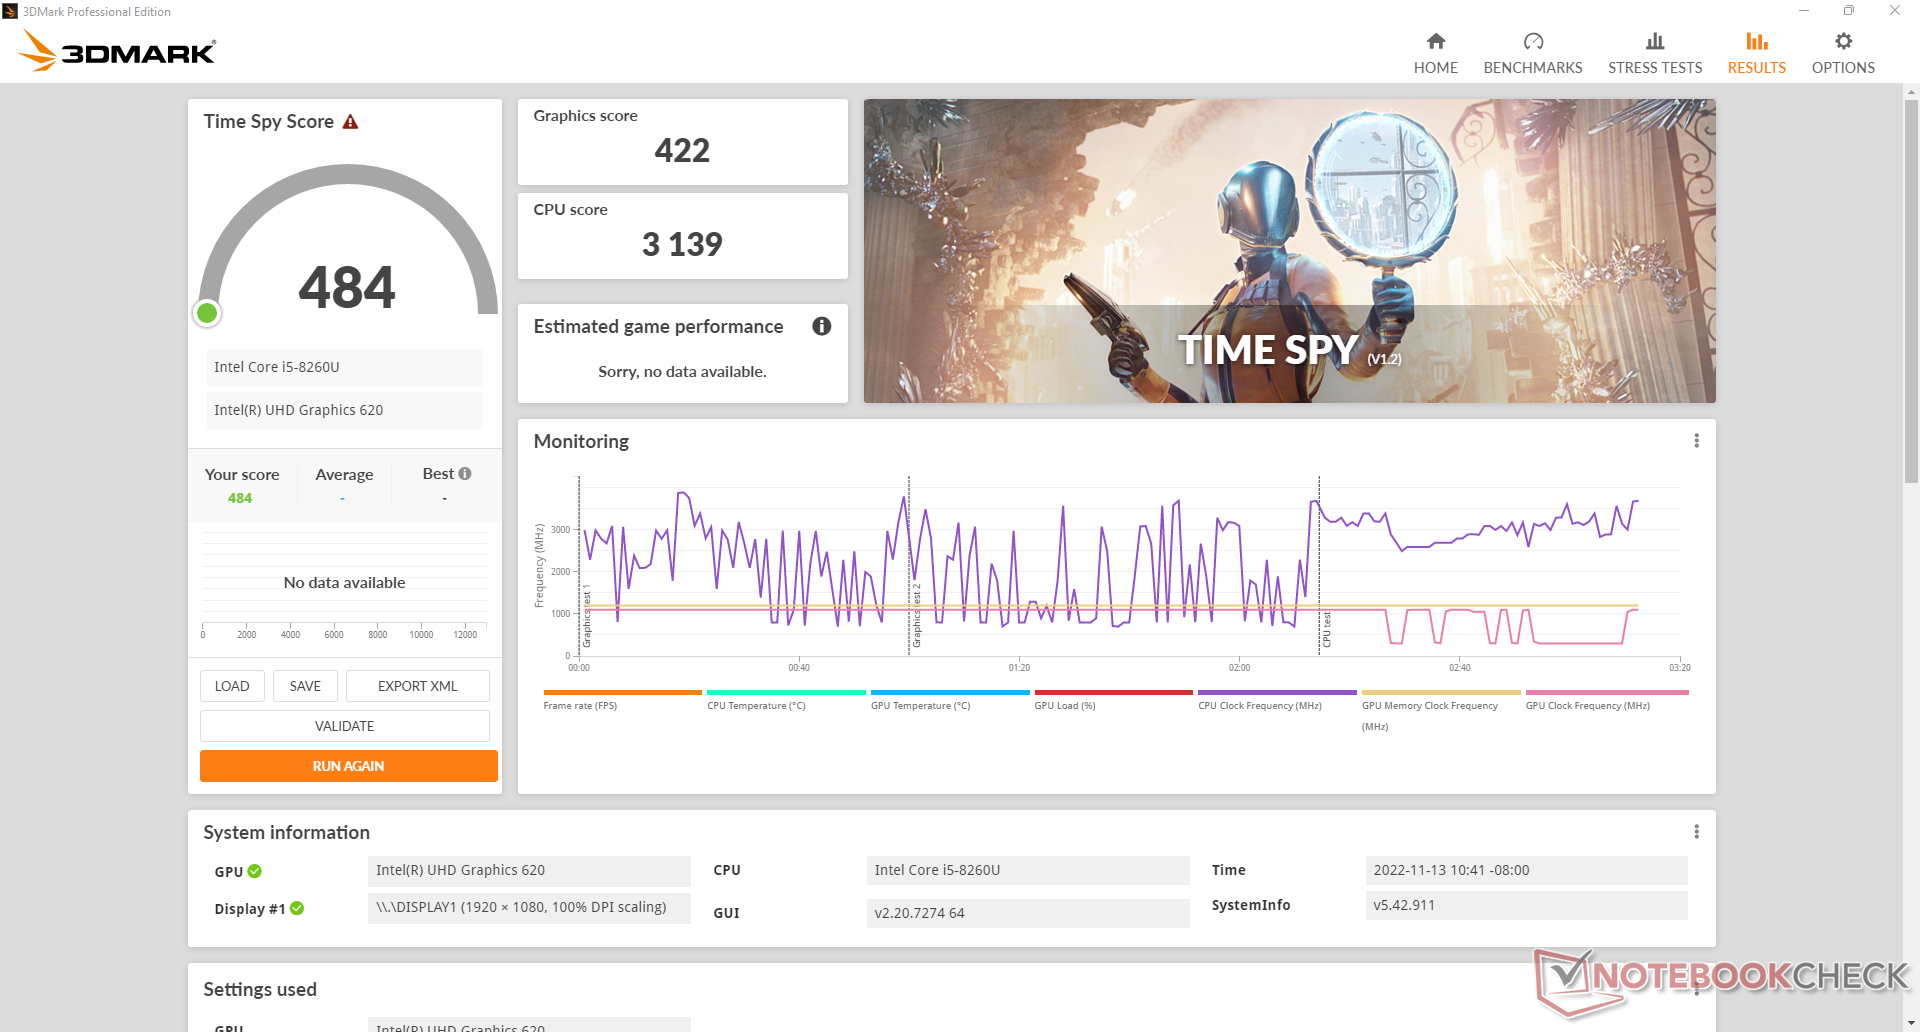
Les performances graphiques sont médiocres par rapport aux normes actuelles. Le site Iris Xe 80 EUs dans de nombreux processeurs Core i5 série U modernes, par exemple, offrent des performances de 2 à 2,5 fois plus rapides que notre vieille UHD Graphics 620. La plupart des jeux sont injouables et certains ne se lancent même pas du tout, notamment X-Plane.
| 3DMark 11 - 1280x720 Performance GPU | |
| Beelink SEi11 Pro | |
| Asus Vivobook 15 K513EQ | |
| Beelink SER Pro Ryzen 5 5600H | |
| Intel NUC11TNKi5 | |
| Infinix INBook X2 | |
| Geekom Mini IT8-GM08i5T | |
| Beelink SEi8 | |
| BMAX B5 Pro G7H8 | |
| Fujitsu Lifebook U939 i5 | |
| Beelink U59 N5105 | |
| 3DMark 11 Performance | 1988 points | |
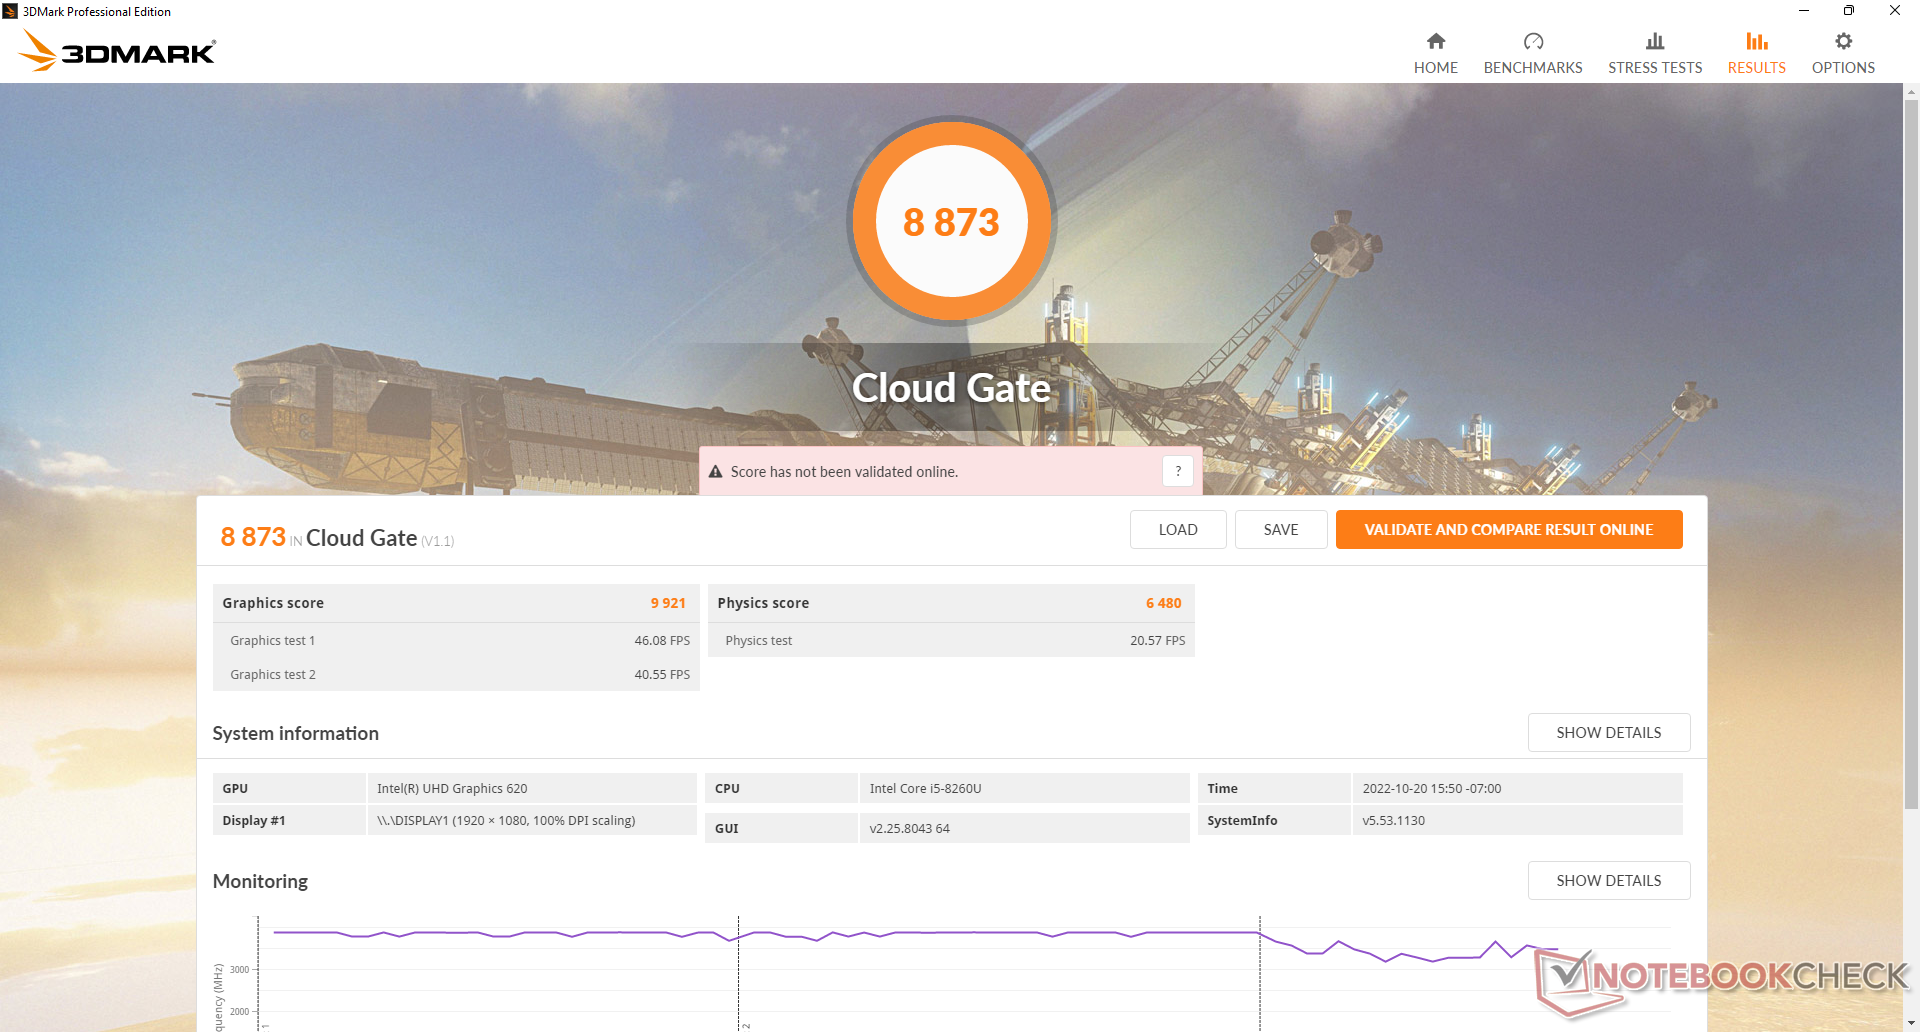
| 3DMark Cloud Gate Standard Score | 8873 points | |
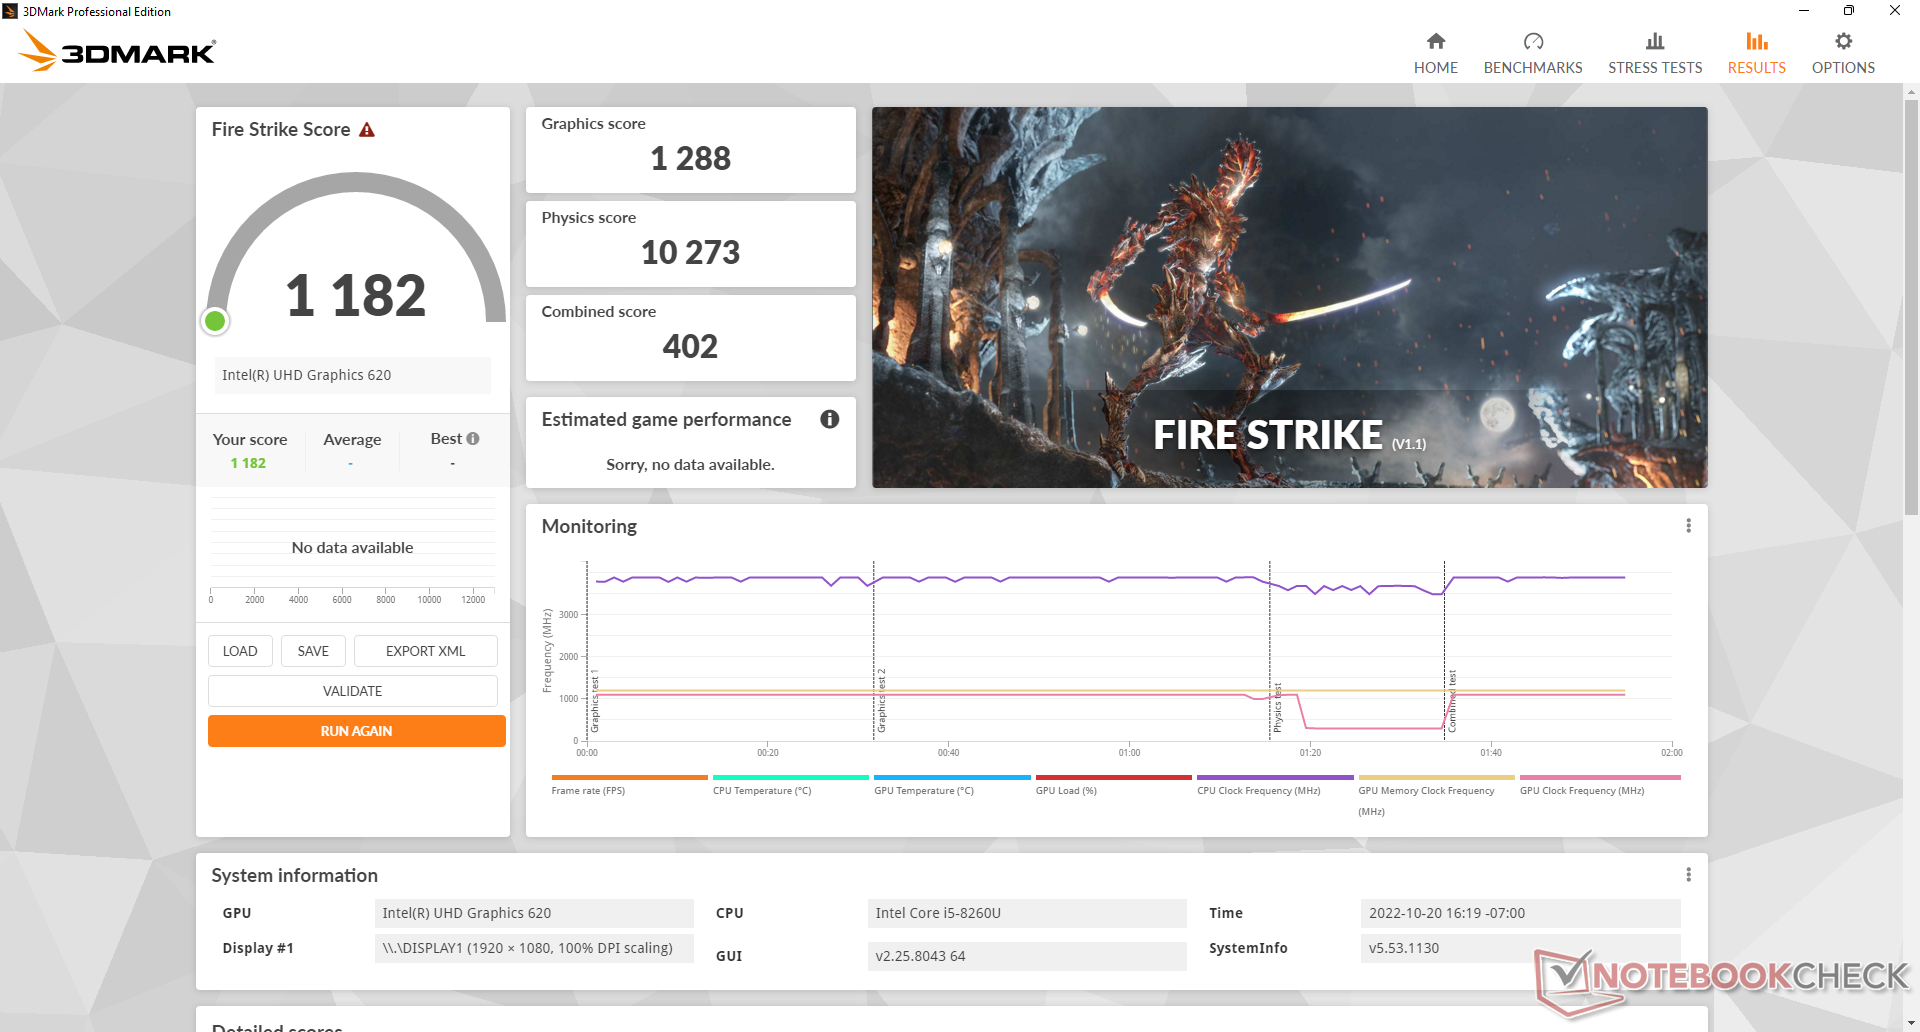
| 3DMark Fire Strike Score | 1182 points | |
| 3DMark Time Spy Score | 484 points | |
Aide | ||
| Blender - v3.3 Classroom CPU (Classer selon les valeurs) | |
| BMAX B5 Pro G7H8 | |
| Beelink SEi11 Pro | |
| Beelink U59 N5105 | |
| Beelink SER Pro Ryzen 5 5600H | |
* ... Moindre est la valeur, meilleures sont les performances
| Performance rating - Percent | |
| Asus Vivobook 15 K513EQ | |
| Beelink SER Pro Ryzen 5 5600H | |
| Beelink SEi11 Pro -1! | |
| Intel NUC11TNKi5 -3! | |
| Infinix INBook X2 -2! | |
| Beelink SEi8 -3! | |
| Fujitsu Lifebook U939 i5 -4! | |
| Beelink U59 N5105 -3! | |
| BMAX B5 Pro G7H8 -5! | |
| The Witcher 3 - 1920x1080 Ultra Graphics & Postprocessing (HBAO+) | |
| Asus Vivobook 15 K513EQ | |
| Beelink SER Pro Ryzen 5 5600H | |
| Beelink SEi11 Pro | |
| Infinix INBook X2 | |
| Beelink U59 N5105 | |
| GTA V - 1920x1080 Highest AA:4xMSAA + FX AF:16x | |
| Asus Vivobook 15 K513EQ | |
| Beelink SER Pro Ryzen 5 5600H | |
| Final Fantasy XV Benchmark - 1920x1080 High Quality | |
| Beelink SEi11 Pro | |
| Asus Vivobook 15 K513EQ | |
| Beelink SER Pro Ryzen 5 5600H | |
| Intel NUC11TNKi5 | |
| Infinix INBook X2 | |
| Beelink SEi8 | |
| Strange Brigade - 1920x1080 ultra AA:ultra AF:16 | |
| Beelink SER Pro Ryzen 5 5600H | |
| Beelink SEi11 Pro | |
| Asus Vivobook 15 K513EQ | |
| Dota 2 Reborn - 1920x1080 ultra (3/3) best looking | |
| Asus Vivobook 15 K513EQ | |
| Beelink SER Pro Ryzen 5 5600H | |
| Beelink SEi11 Pro | |
| Intel NUC11TNKi5 | |
| Infinix INBook X2 | |
| Beelink SEi8 | |
| Fujitsu Lifebook U939 i5 | |
| Beelink U59 N5105 | |
| BMAX B5 Pro G7H8 | |
| X-Plane 11.11 - 1920x1080 high (fps_test=3) | |
| Asus Vivobook 15 K513EQ | |
| Beelink SEi11 Pro | |
| Beelink SER Pro Ryzen 5 5600H | |
| Intel NUC11TNKi5 | |
| Infinix INBook X2 | |
| Fujitsu Lifebook U939 i5 | |
| Beelink SEi8 | |
| Beelink U59 N5105 | |
| The Witcher 3 | |
| 1024x768 Low Graphics & Postprocessing | |
| Beelink SEi11 Pro | |
| Asus Vivobook 15 K513EQ | |
| Beelink SER Pro Ryzen 5 5600H | |
| Intel NUC11TNKi5 | |
| Infinix INBook X2 | |
| BMAX B5 Pro G7H8 | |
| Beelink U59 N5105 | |
| Fujitsu Lifebook U939 i5 | |
| 1366x768 Medium Graphics & Postprocessing | |
| Beelink SEi11 Pro | |
| Beelink SER Pro Ryzen 5 5600H | |
| Asus Vivobook 15 K513EQ | |
| Infinix INBook X2 | |
| Beelink U59 N5105 | |
| BMAX B5 Pro G7H8 | |
| 1920x1080 High Graphics & Postprocessing (Nvidia HairWorks Off) | |
| Asus Vivobook 15 K513EQ | |
| Beelink SEi11 Pro | |
| Beelink SER Pro Ryzen 5 5600H | |
| Infinix INBook X2 | |
| Beelink U59 N5105 | |
| BMAX B5 Pro G7H8 | |
| Final Fantasy XV Benchmark - 1280x720 Lite Quality | |
| Asus Vivobook 15 K513EQ | |
| Beelink SER Pro Ryzen 5 5600H | |
| Beelink SEi11 Pro | |
| Intel NUC11TNKi5 | |
| Infinix INBook X2 | |
| Geekom Mini IT8-GM08i5T | |
| Beelink SEi8 | |
| Beelink U59 N5105 | |
| BMAX B5 Pro G7H8 | |
| Dota 2 Reborn | |
| 1280x720 min (0/3) fastest | |
| Beelink SER Pro Ryzen 5 5600H | |
| Asus Vivobook 15 K513EQ | |
| Beelink SEi11 Pro | |
| Beelink SEi8 | |
| Infinix INBook X2 | |
| Intel NUC11TNKi5 | |
| Beelink U59 N5105 | |
| Fujitsu Lifebook U939 i5 | |
| BMAX B5 Pro G7H8 | |
| 1366x768 med (1/3) | |
| Asus Vivobook 15 K513EQ | |
| Beelink SER Pro Ryzen 5 5600H | |
| Beelink SEi11 Pro | |
| Infinix INBook X2 | |
| Intel NUC11TNKi5 | |
| Fujitsu Lifebook U939 i5 | |
| Beelink SEi8 | |
| Beelink U59 N5105 | |
| BMAX B5 Pro G7H8 | |
| 1920x1080 high (2/3) | |
| Asus Vivobook 15 K513EQ | |
| Beelink SER Pro Ryzen 5 5600H | |
| Beelink SEi11 Pro | |
| Intel NUC11TNKi5 | |
| Infinix INBook X2 | |
| Beelink SEi8 | |
| Fujitsu Lifebook U939 i5 | |
| Beelink U59 N5105 | |
| BMAX B5 Pro G7H8 | |
| 1920x1080 ultra (3/3) best looking | |
| Asus Vivobook 15 K513EQ | |
| Beelink SER Pro Ryzen 5 5600H | |
| Beelink SEi11 Pro | |
| Intel NUC11TNKi5 | |
| Infinix INBook X2 | |
| Beelink SEi8 | |
| Fujitsu Lifebook U939 i5 | |
| Beelink U59 N5105 | |
| BMAX B5 Pro G7H8 | |
Witcher 3 FPS Chart
| Bas | Moyen | Élevé | Ultra | |
|---|---|---|---|---|
| The Witcher 3 (2015) | 23.8 | 13.5 | 7.3 | |
| Dota 2 Reborn (2015) | 42.4 | 8.6 | 5.6 | 5.6 |
| Final Fantasy XV Benchmark (2018) | 5.61 |
Émissions
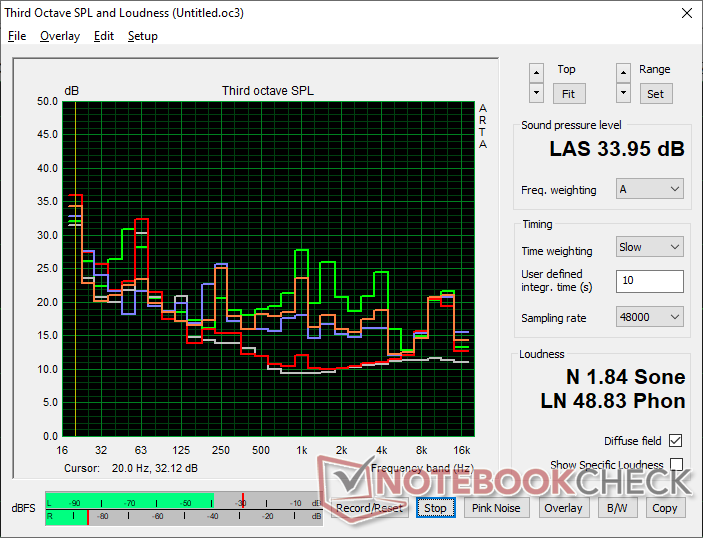
Bruit du système - Pas fort du tout
Le ventilateur interne est presque toujours actif à environ 25 dB(A) contre un bruit de fond de 23 dB(A), même si aucune application n'est en cours d'exécution. Heureusement, ce niveau de bruit est suffisamment faible pour ne pas être perçu dans la plupart des cas. L'exécution de charges plus élevées comme les jeux induit un bruit de ventilateur dans la gamme de 30 à 34 dB(A) qui est encore très silencieux, en particulier dans les environnements HTPC.
Degré de la nuisance sonore
| Au repos |
| 25.1 / 25.1 / 25.1 dB(A) |
| Fortement sollicité |
| 28.6 / 34 dB(A) |
 | ||
30 dB silencieux 40 dB(A) audible 50 dB(A) bruyant |
||
min: | ||
| BMAX B5 Pro G7H8 UHD Graphics 620, i5-8260U | Beelink SEi11 Pro Iris Xe G7 96EUs, i5-11320H, Kingston NV1 SNVS/500GCN | Beelink U59 N5105 UHD Graphics (Jasper Lake 24 EU), Celeron N5105, Silicon Motion AZW 512G NV428 | Beelink SEi8 Iris Plus Graphics 655, i3-8109U, Intel SSD 660p SSDPEKNW512G8 | Beelink SER Pro Ryzen 5 5600H Vega 7, R5 5600H, Kingston NV1 SNVS/500GCN | Intel NUC11TNKi5 Iris Xe G7 80EUs, i5-1135G7, Transcend M.2 SSD 430S TS512GMTS430S | |
|---|---|---|---|---|---|---|
| Noise | -5% | 14% | -14% | -7% | -32% | |
| arrêt / environnement * (dB) | 23 | 22.8 1% | 21.5 7% | 24.5 -7% | 22.8 1% | 24.8 -8% |
| Idle Minimum * (dB) | 25.1 | 24.7 2% | 22.1 12% | 26.5 -6% | 26.1 -4% | 35.6 -42% |
| Idle Average * (dB) | 25.1 | 24.7 2% | 22.1 12% | 26.5 -6% | 26.1 -4% | 35.6 -42% |
| Idle Maximum * (dB) | 25.1 | 25.3 -1% | 22.1 12% | 31.1 -24% | 28.7 -14% | 35.6 -42% |
| Load Average * (dB) | 28.6 | 33.2 -16% | 23.9 16% | 37.7 -32% | 32.3 -13% | 36.2 -27% |
| Witcher 3 ultra * (dB) | 30.1 | 34.5 -15% | 24.4 19% | 32.8 -9% | 38 -26% | |
| Load Maximum * (dB) | 34 | 37.8 -11% | 26.8 21% | 37.5 -10% | 36.4 -7% | 47.6 -40% |
* ... Moindre est la valeur, meilleures sont les performances
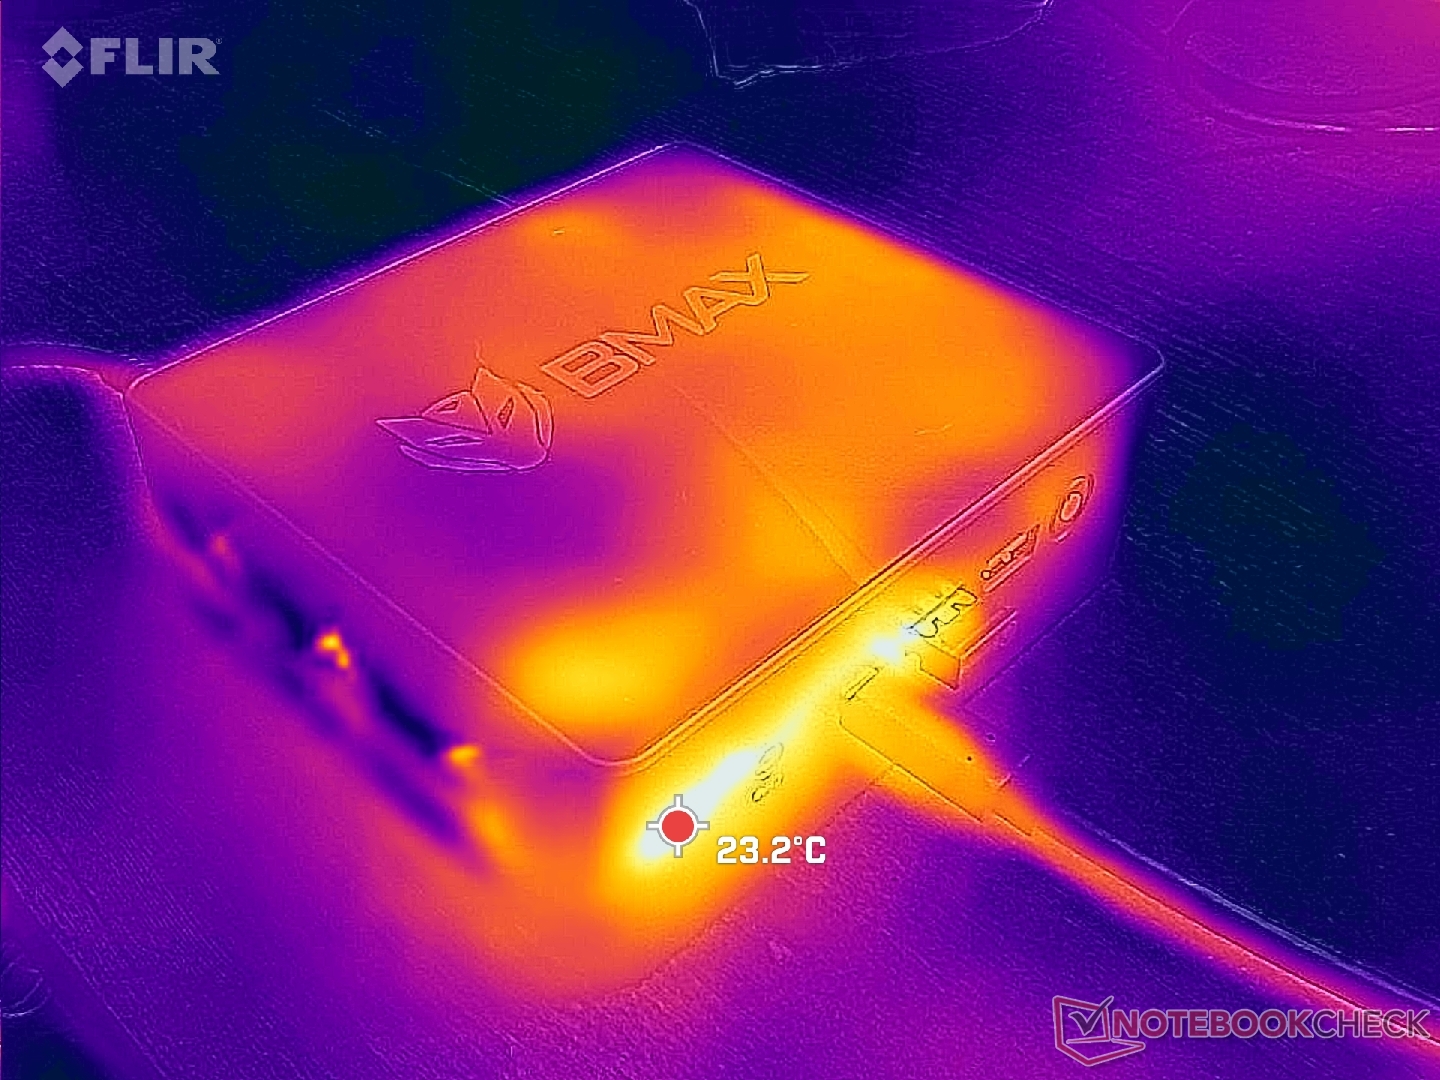
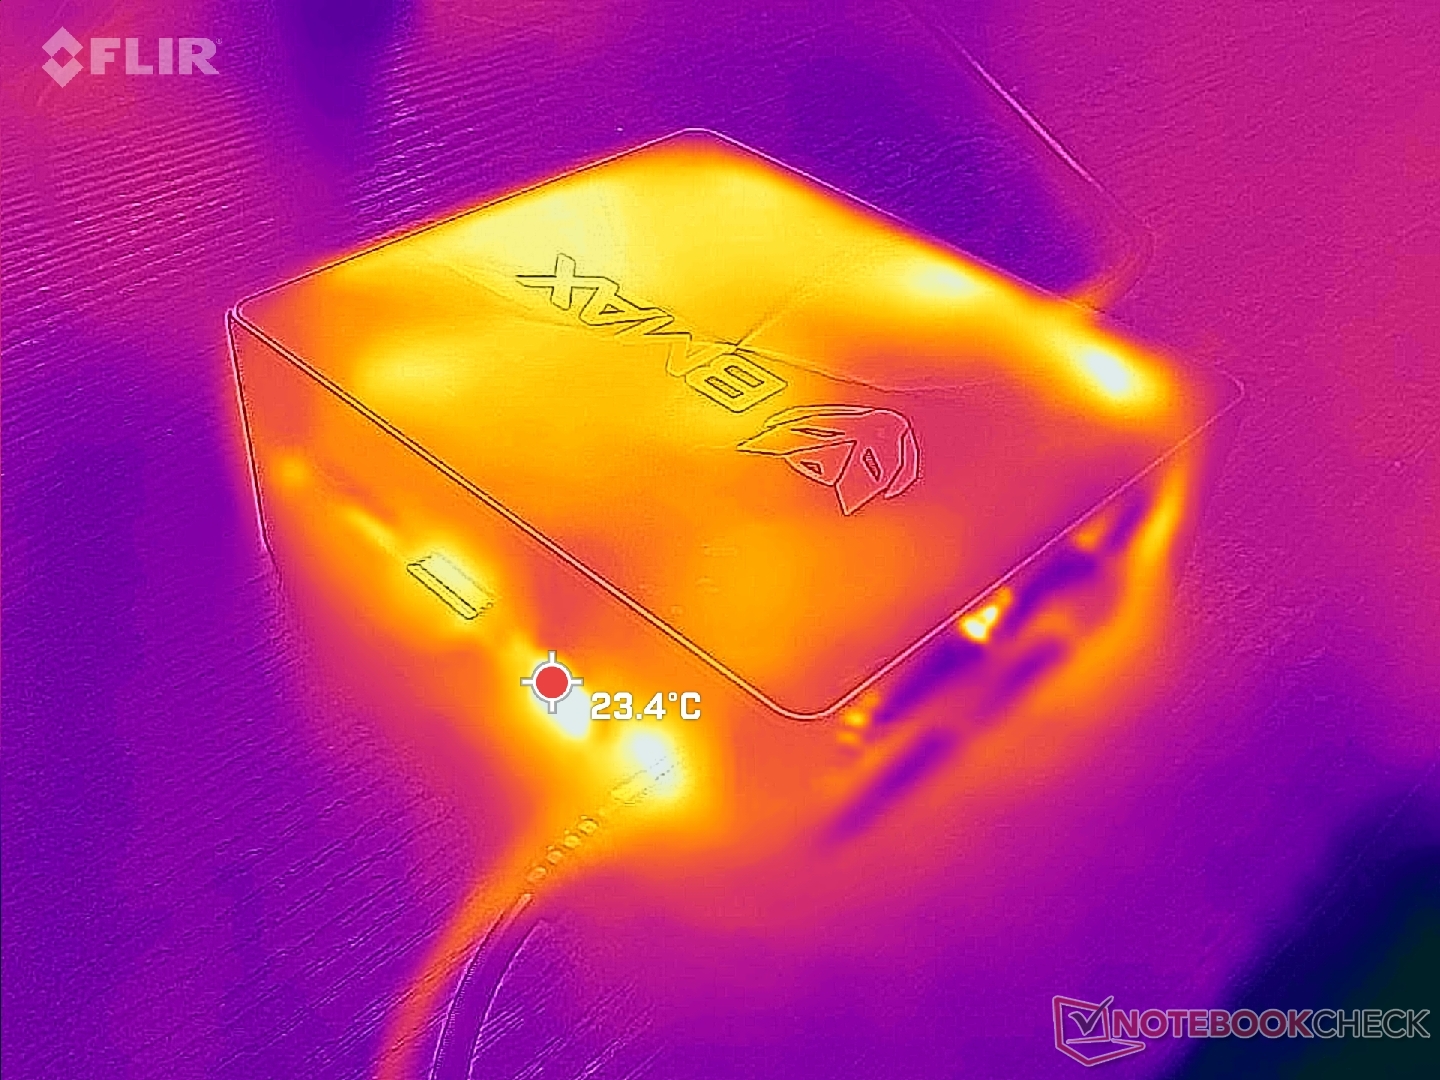
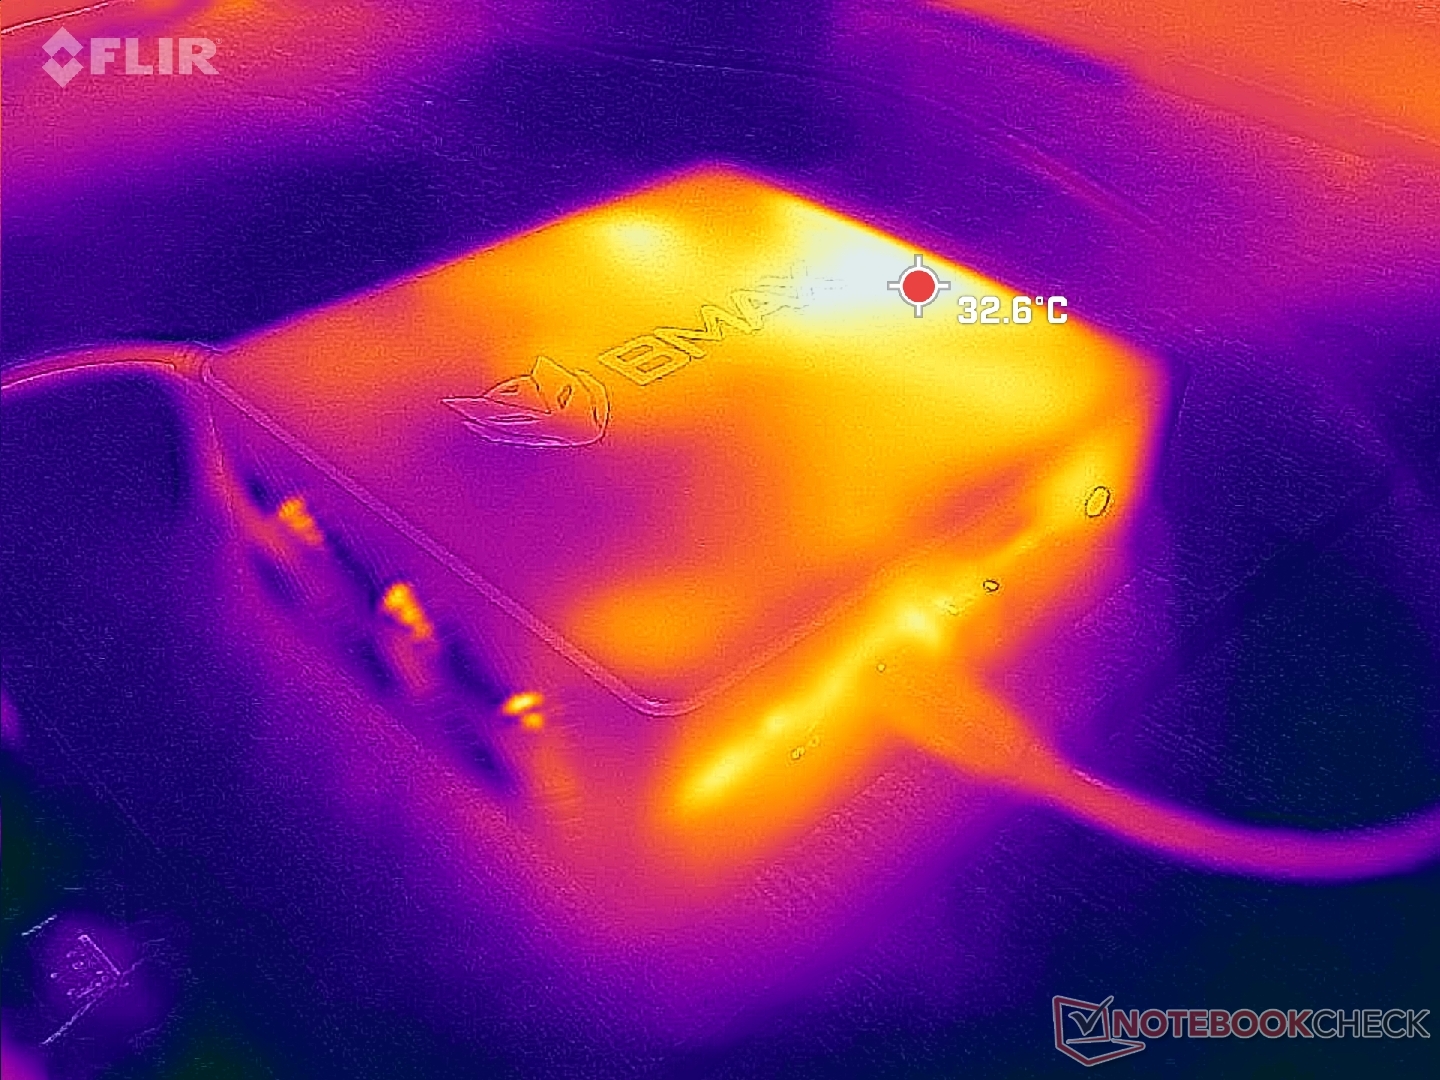
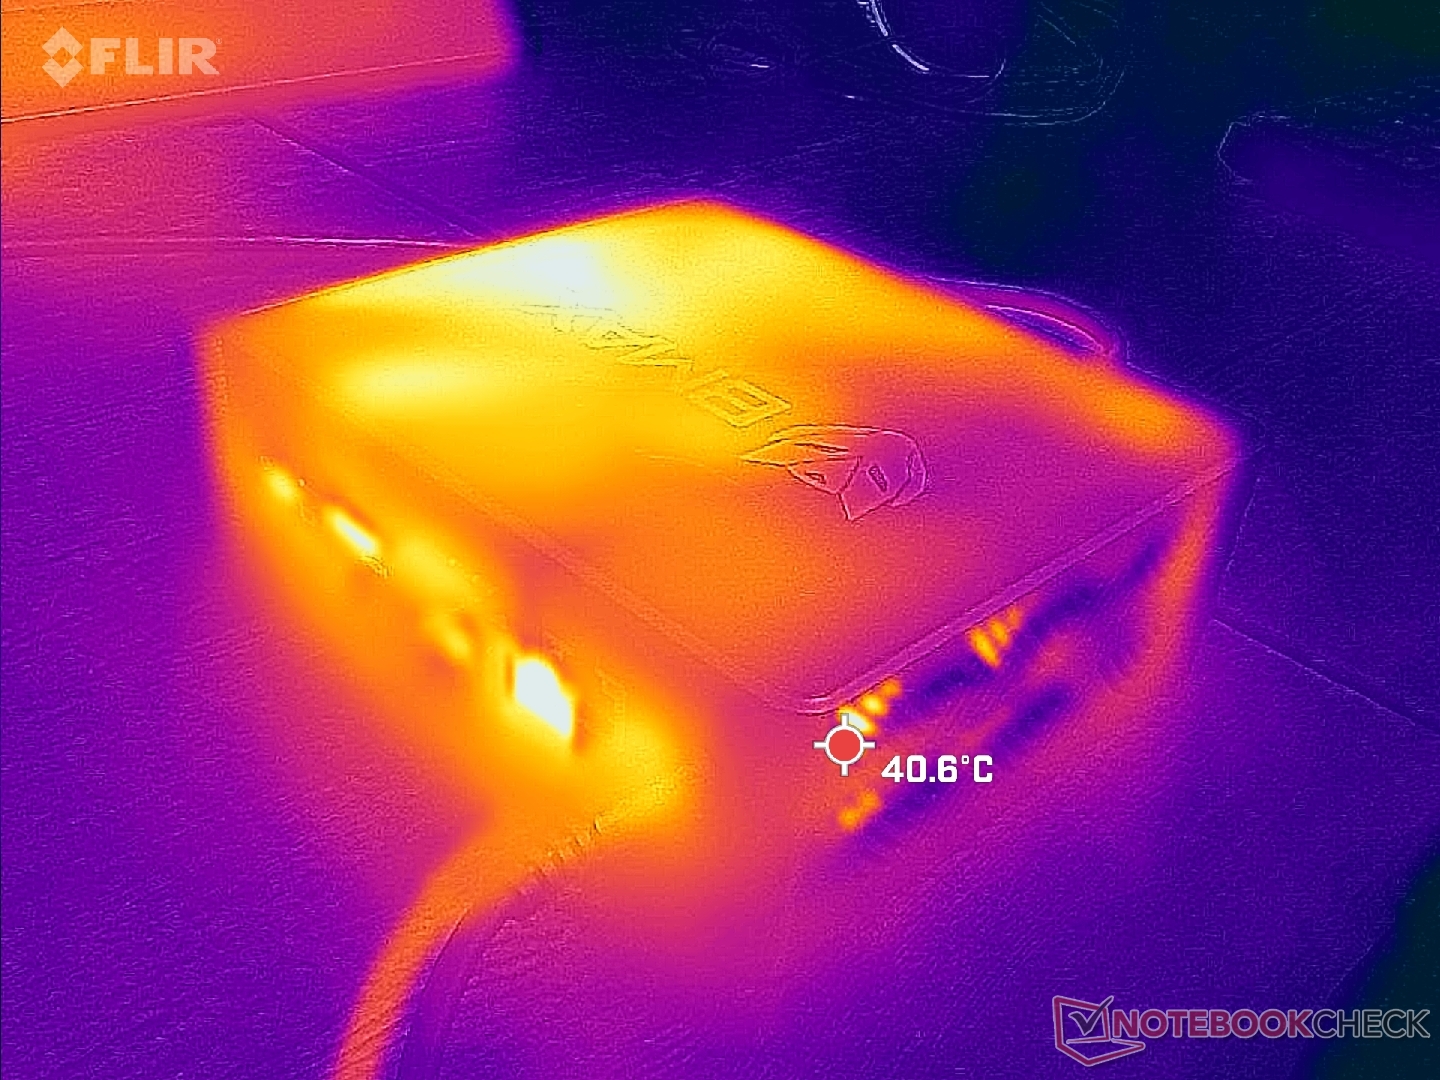
Température
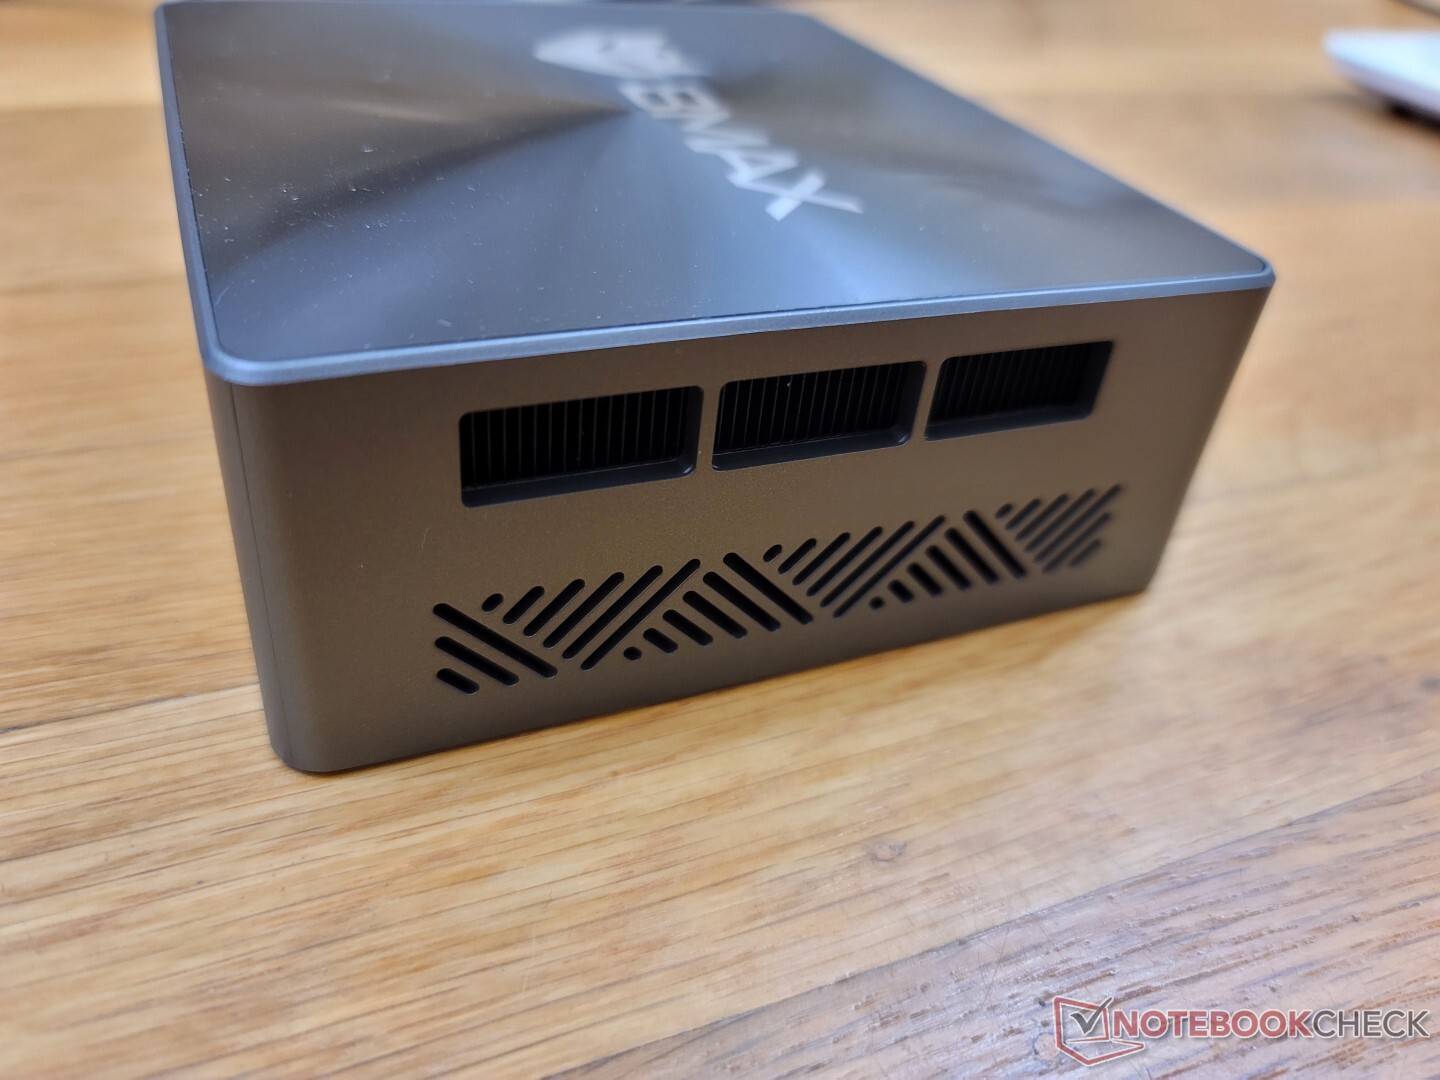
Les températures de surface ne sont jamais inconfortablement chaudes. Le point chaud sur le dessus, par exemple, n'atteint que 33 °C environ lorsqu'il est soumis à des contraintes de traitement élevées. La chaleur s'échappe par le côté droit du châssis, contrairement au NUC d'Intel où elle s'échappe par l'arrière
Les objets peuvent être placés en toute sécurité sur le dessus de l'unité car il n'y a pas de grilles de ventilation à cet endroit.
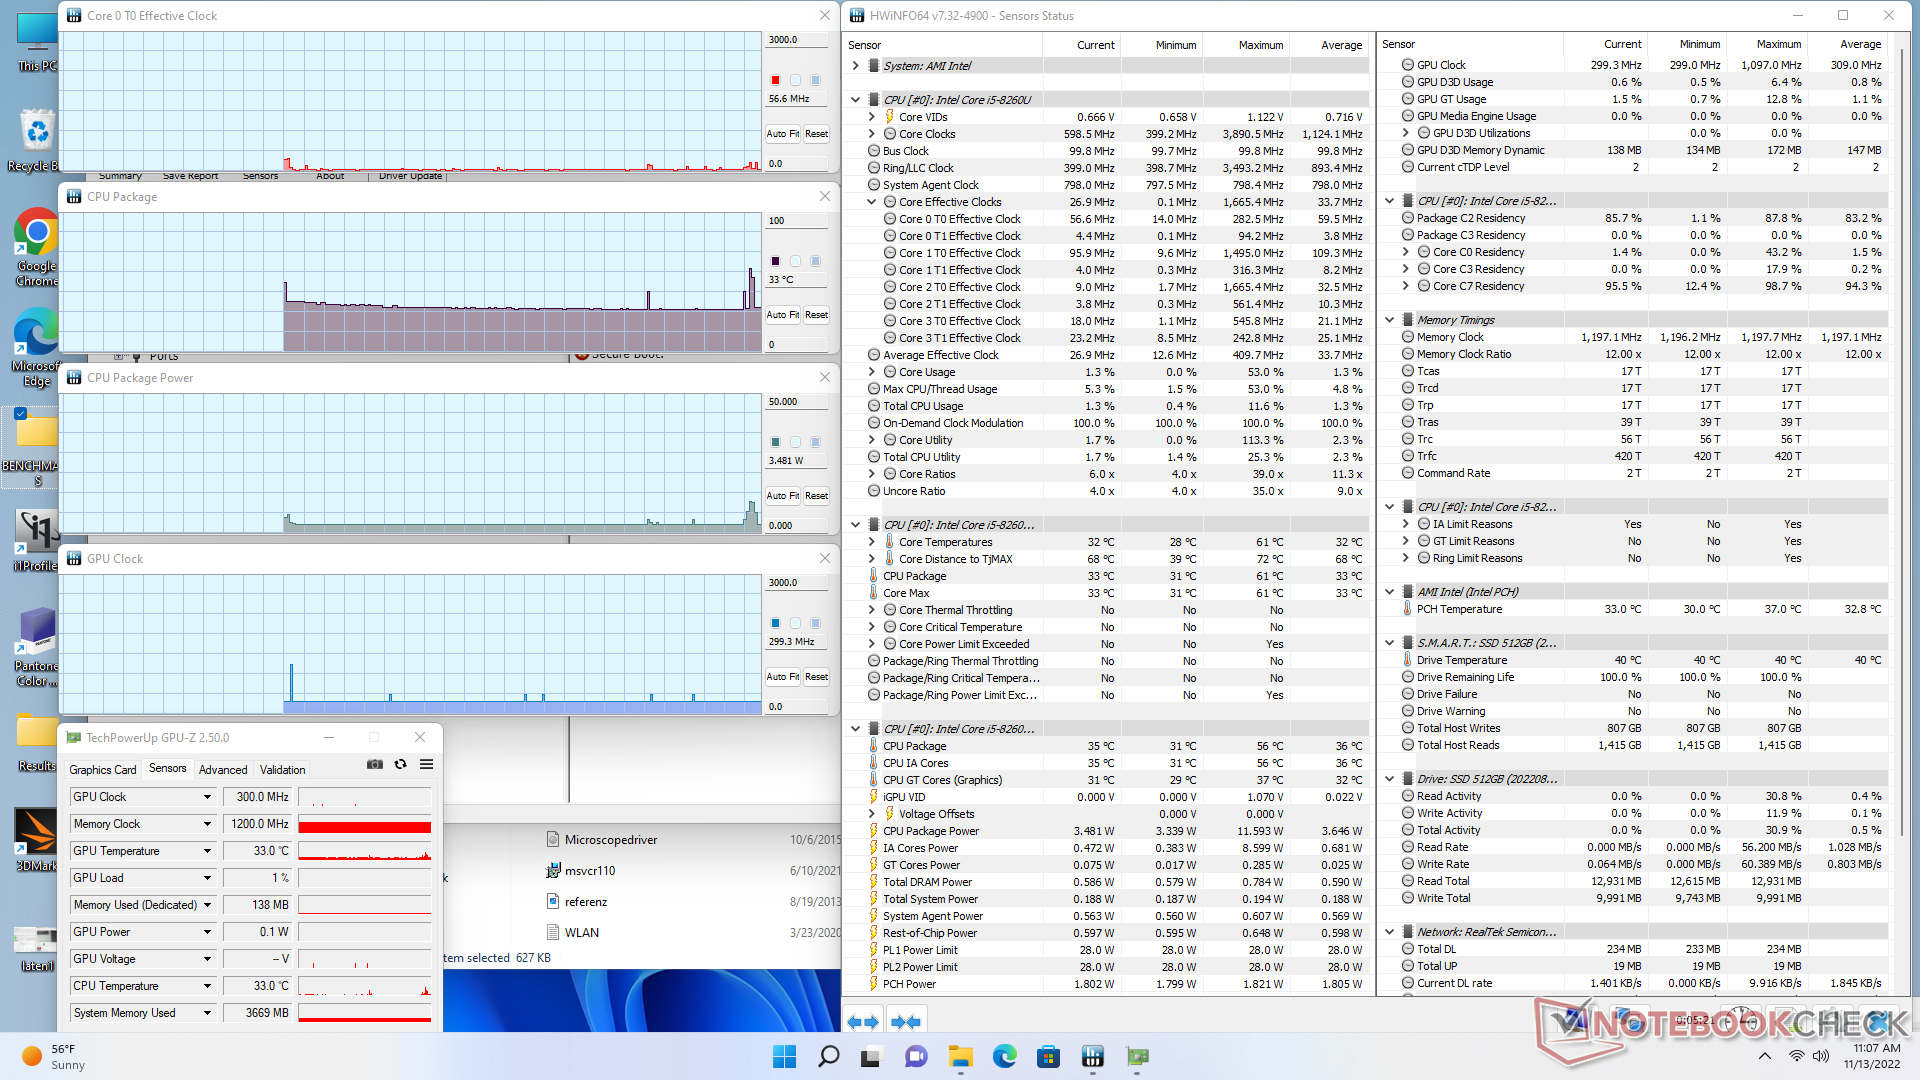
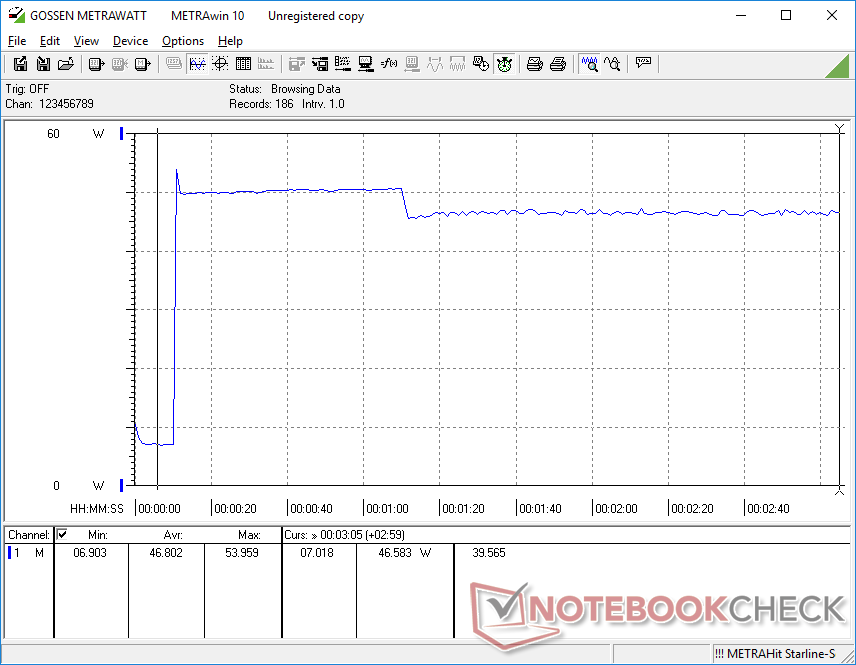
Test de stress
Lorsqu'il est soumis à Prime95, le CPU passe à 2,8 GHz et à 28 W pendant environ 20 secondes ou jusqu'à ce que la température centrale atteigne 76 C. Les fréquences d'horloge et la consommation d'énergie de la carte se stabilisent alors à 1,5 GHz et 12 W, respectivement, afin de maintenir une température centrale plus fraîche de 60 C. En répétant ce même test sur la carte Beelink SEi8, on obtient une température centrale plus basse Beelink SEi8 se traduirait par des horloges centrales plus rapides et des températures plus chaudes de 2,8 GHz et 80 C, respectivement. Le potentiel Turbo Boost du B5 Pro est donc limité, ce qui suit ce que nous avons observé pendant notre test de stress CineBench ci-dessus.
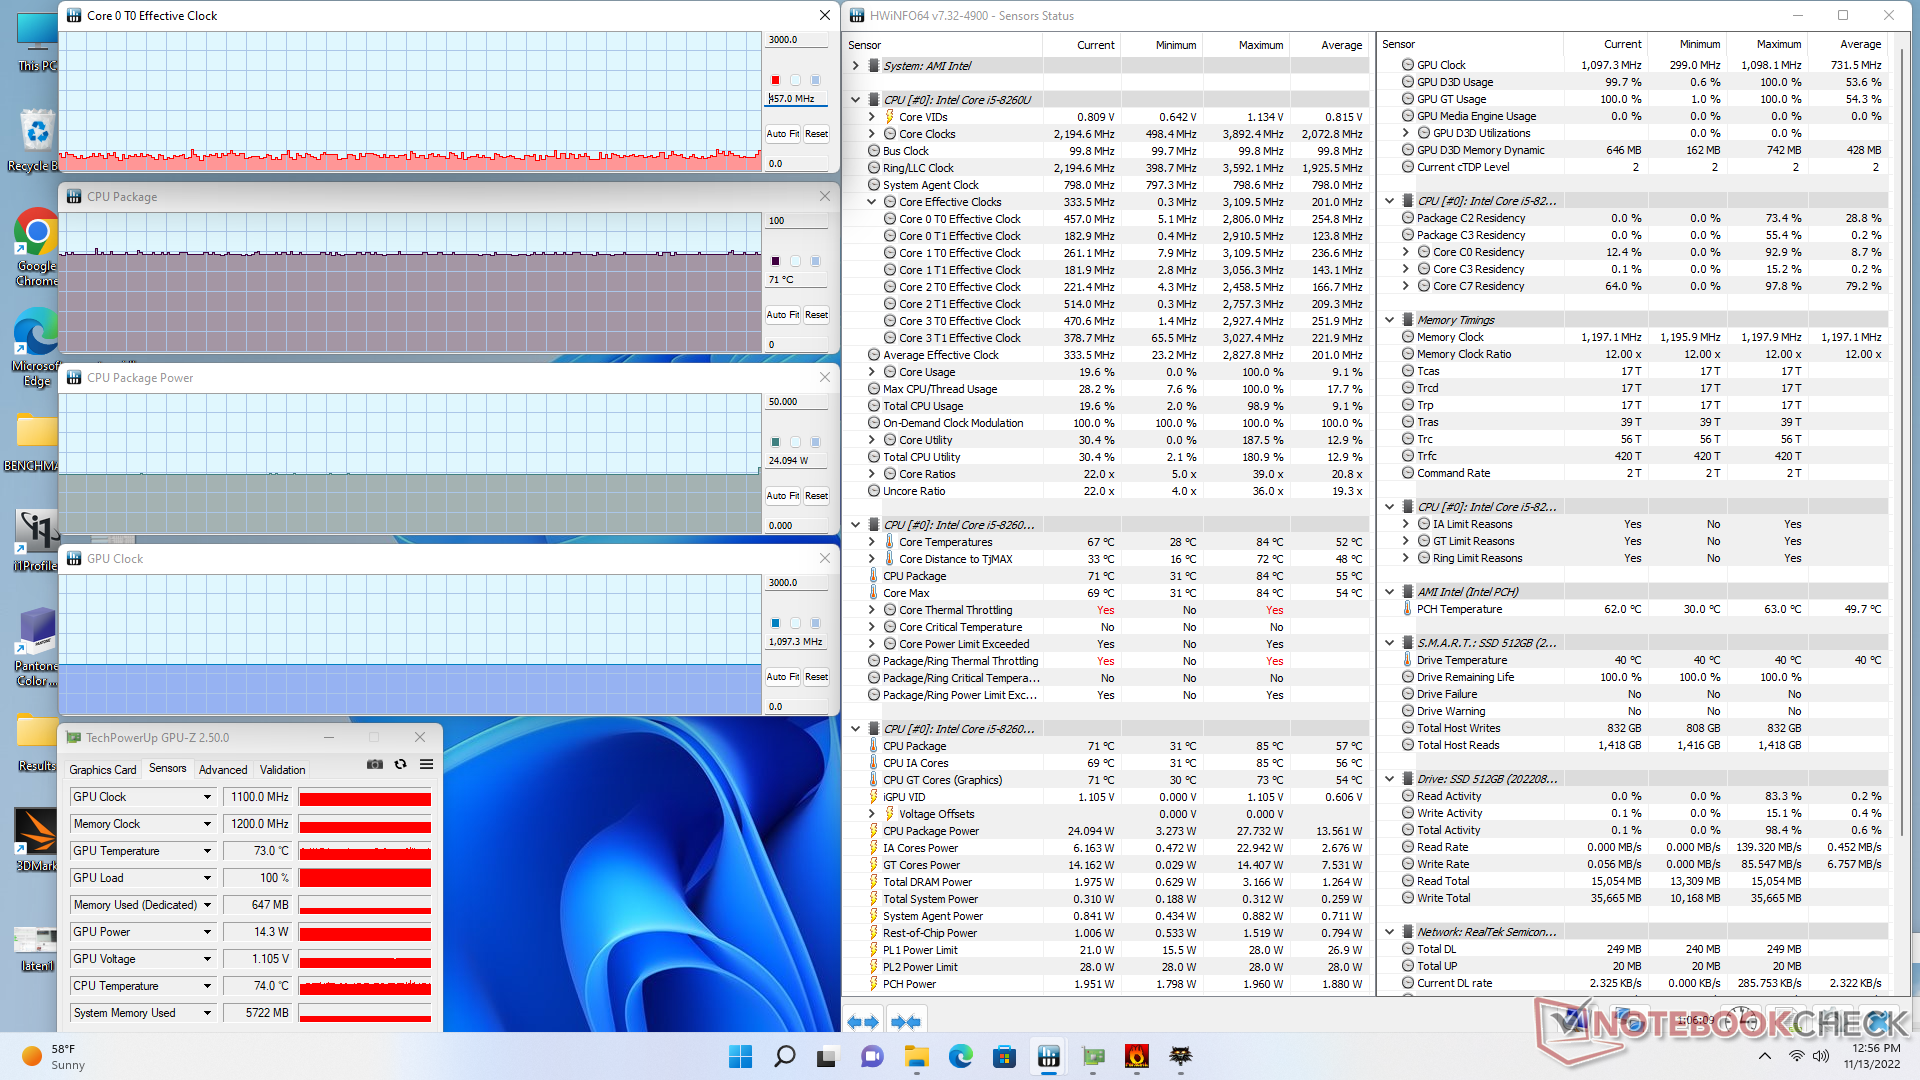
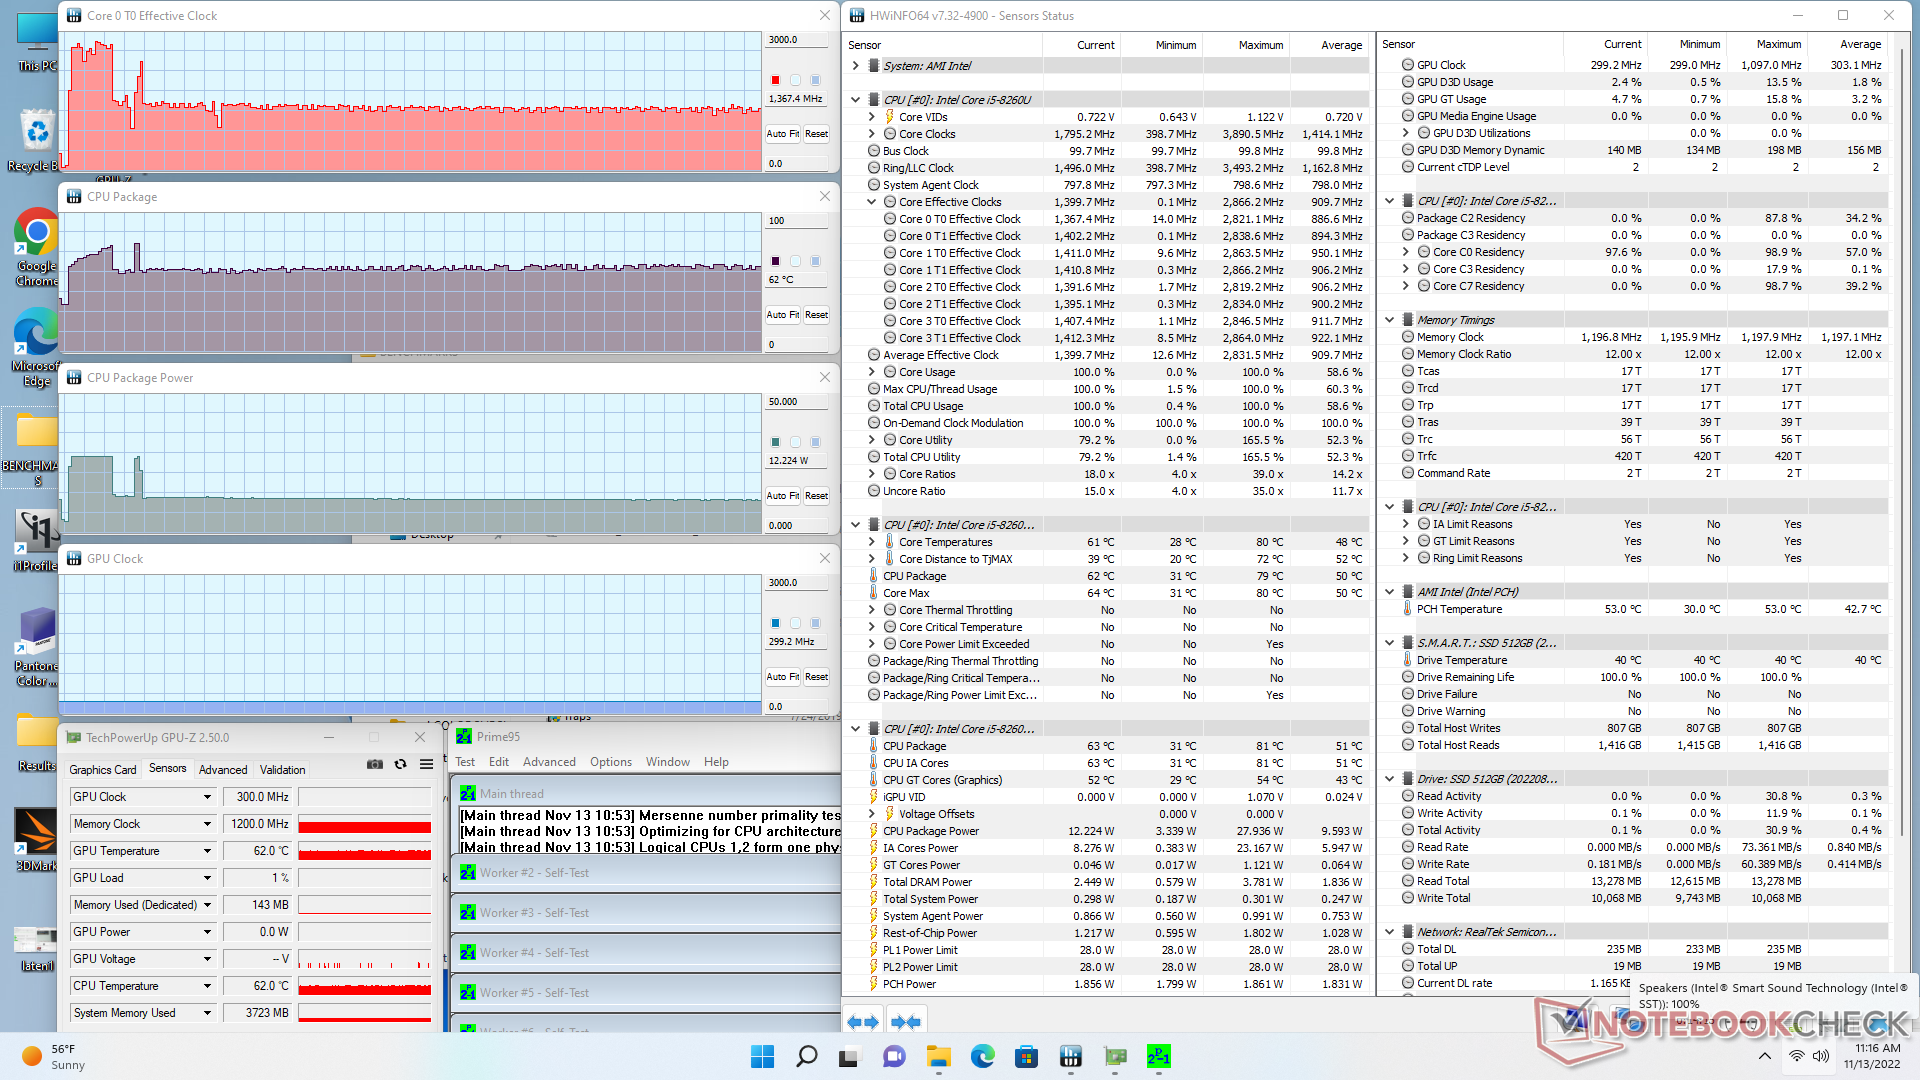
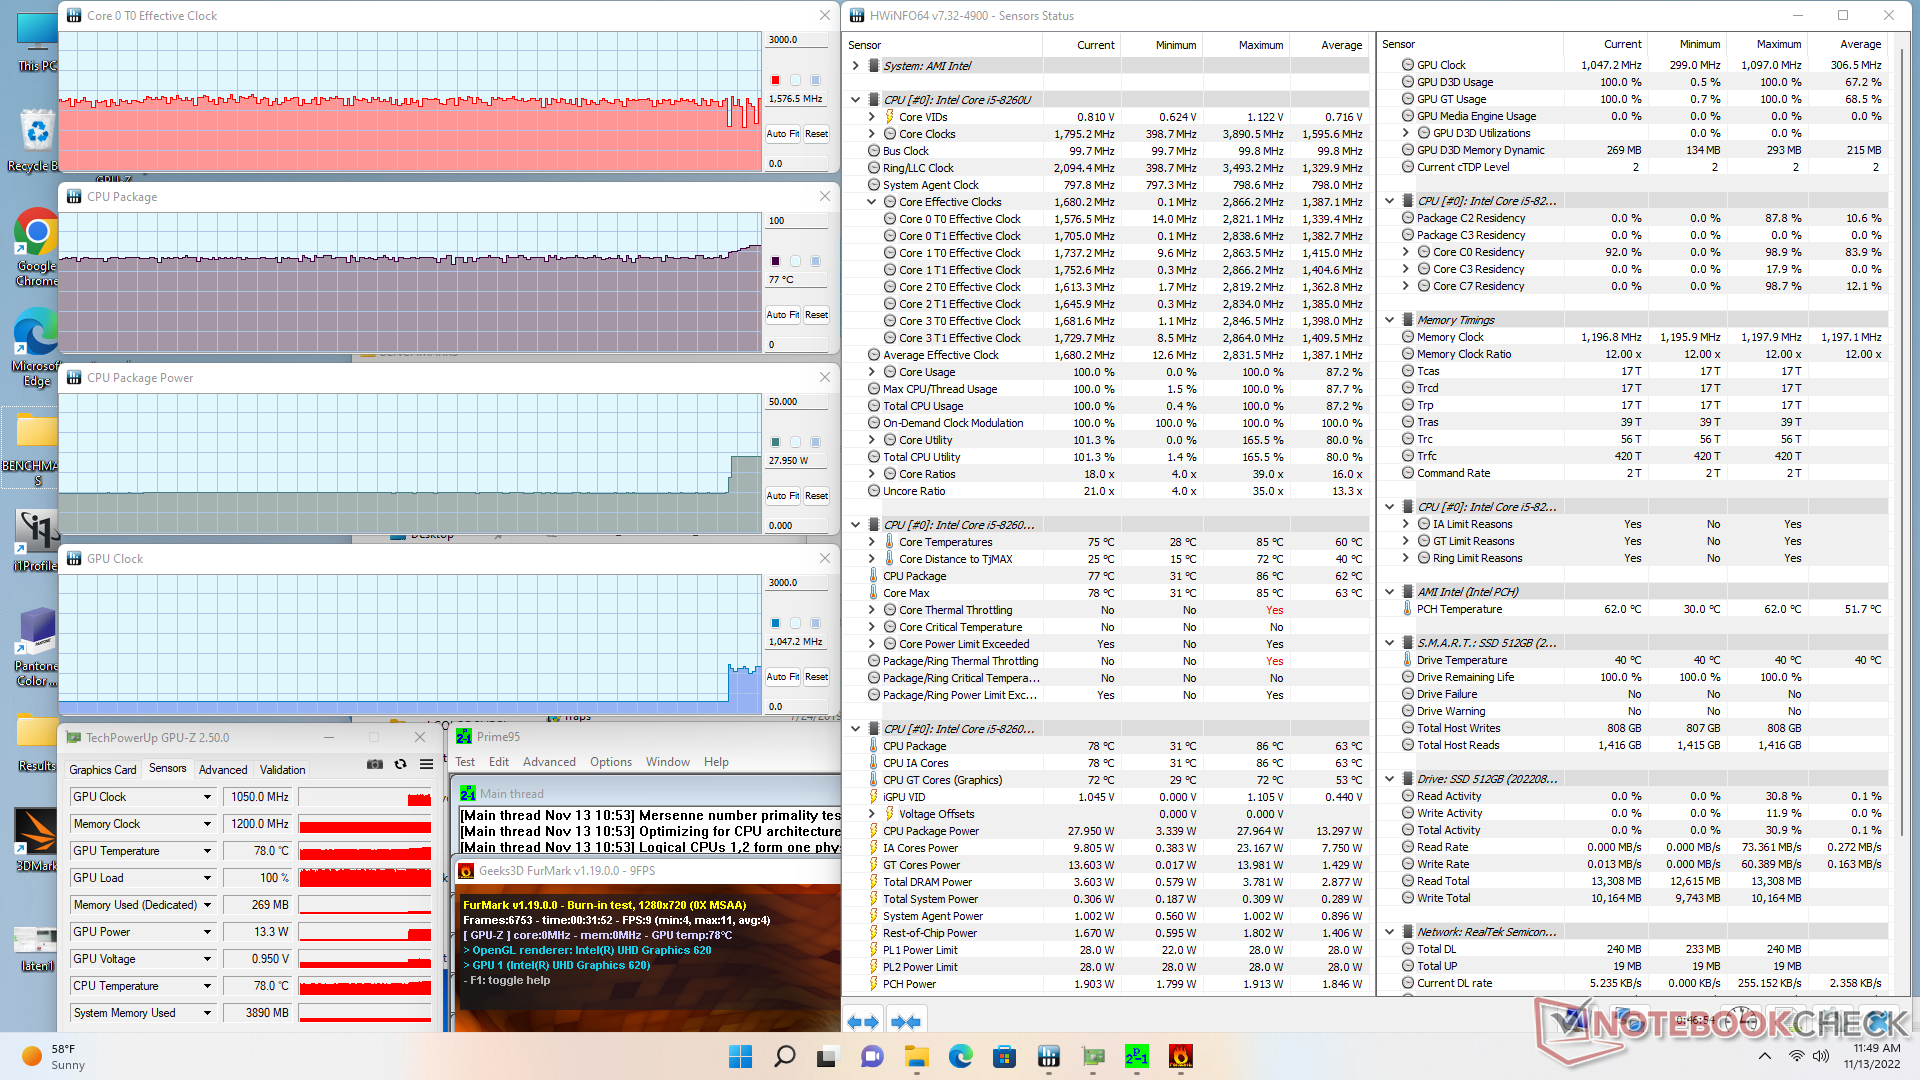
| Fréquence du CPU (GHz) | Fréquence du GPU (MHz) | Température moyenne du CPU (°C) | |
| Système au repos | -- | -- | 33 |
| Prime95 Stress | 1.3 | -- | 62 |
| Prime95 + FurMark Stress | 1.6 | 300 | 67 |
| Witcher 3 Stress | ~400 | 1100 | 71 |
Gestion de l'énergie
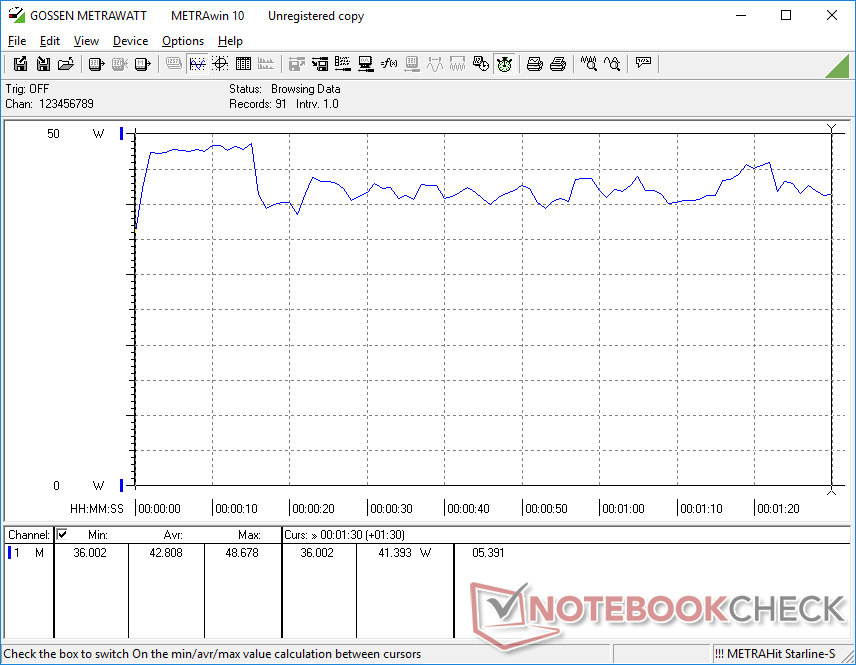
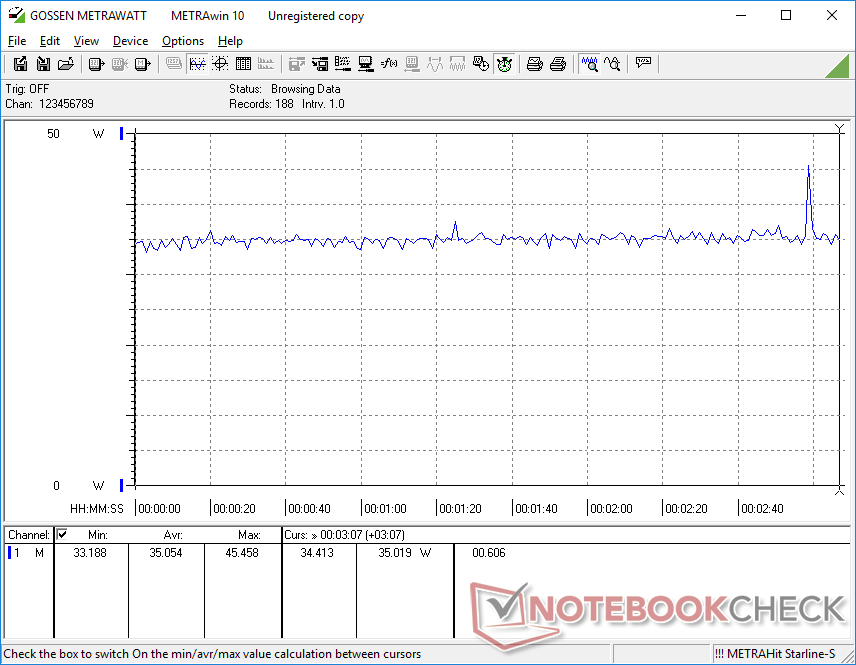
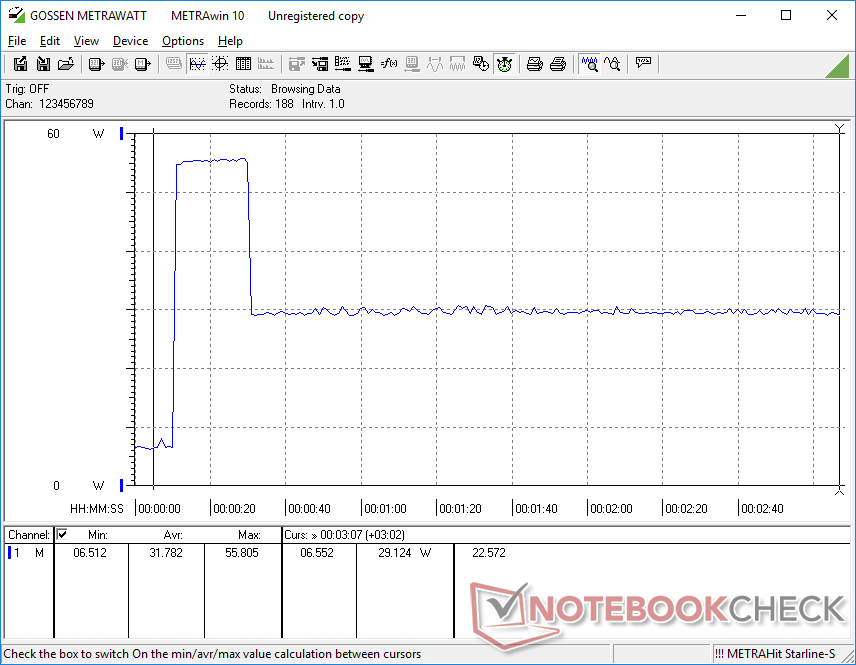
Consommation d'énergie - Très peu exigeante
La consommation globale est inférieure à celle de nombreux mini-PC équipés de CPU plus récents, comme le NUC11TNKi5 d'Intel et son Core i5-1135G7 de 11e génération. La performance par watt, cependant, favorise ce dernier de manière significative. Bien que les utilisateurs puissent économiser quelques watts avec le BMax, les mini-PC équipés de CPU de dernière génération comme le NUC susmentionné peuvent offrir des performances graphiques plus de deux fois supérieures ou des performances CPU 50 % plus élevées
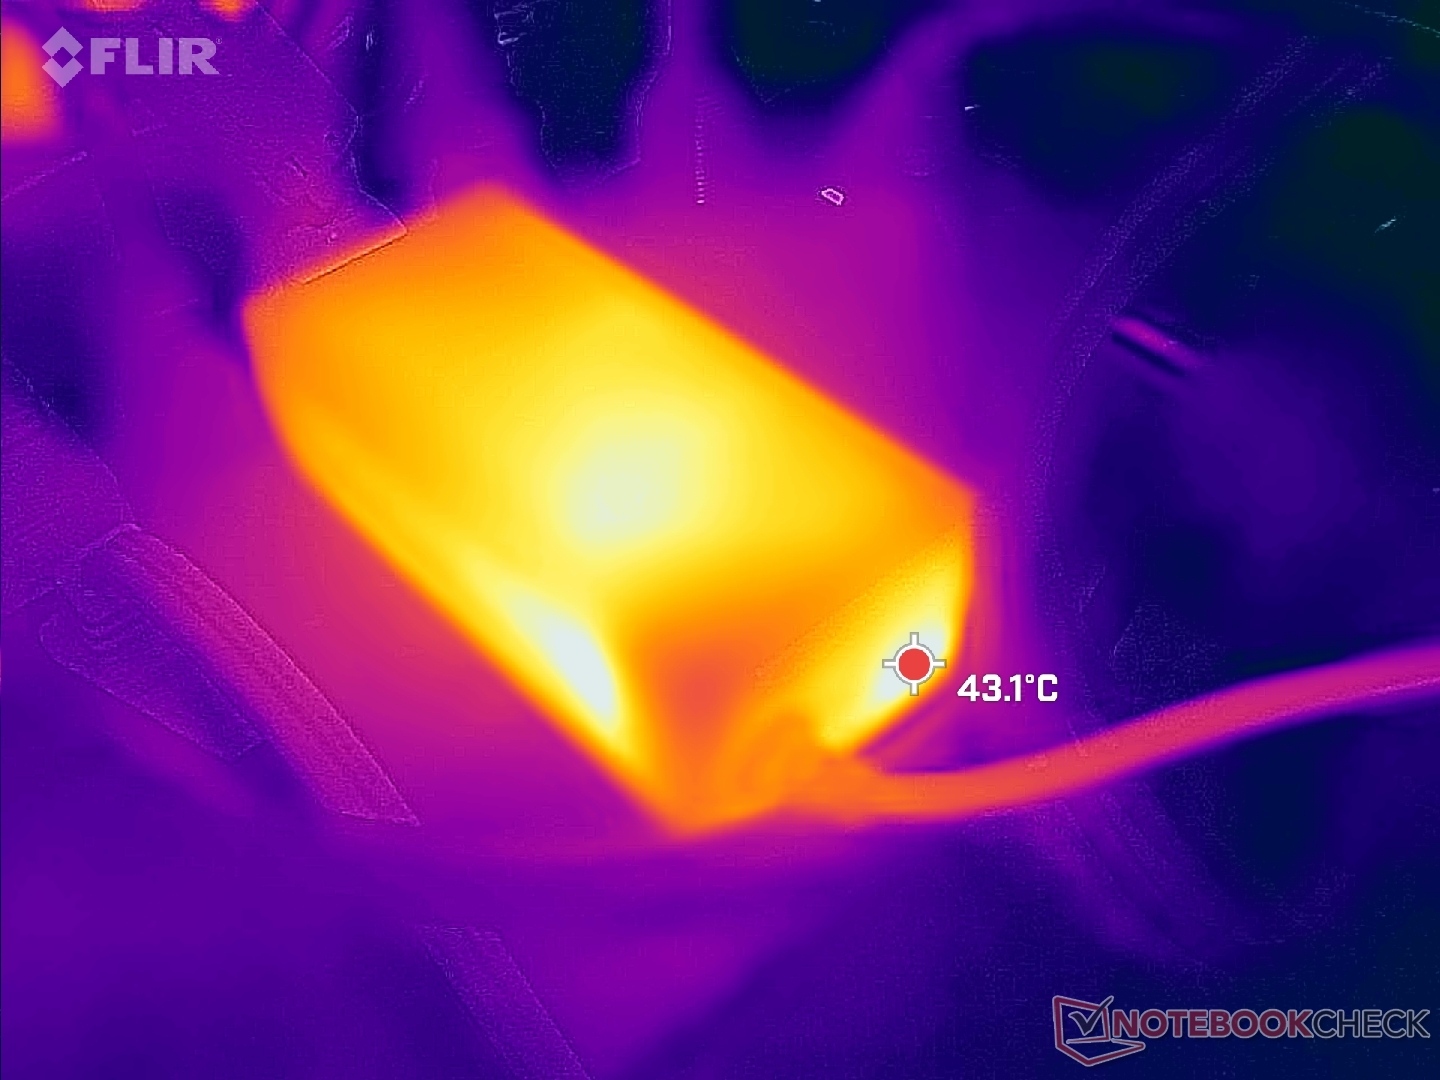
Nous avons pu enregistrer une consommation maximale de 55,9 W sur le petit adaptateur secteur de 48 W (~9,8 x 4,3 x 3,7 cm) lorsque le CPU est utilisé à 100 %. Ce taux n'est que temporaire comme le montrent nos graphiques ci-dessous.
| Éteint/en veille | |
| Au repos | |
| Fortement sollicité |
|
Légende:
min: | |
| BMAX B5 Pro G7H8 i5-8260U, UHD Graphics 620, , , x, | Beelink SEi11 Pro i5-11320H, Iris Xe G7 96EUs, Kingston NV1 SNVS/500GCN, , x, | Beelink U59 N5105 Celeron N5105, UHD Graphics (Jasper Lake 24 EU), Silicon Motion AZW 512G NV428, , x, | Beelink SEi8 i3-8109U, Iris Plus Graphics 655, Intel SSD 660p SSDPEKNW512G8, , x, | Beelink SER Pro Ryzen 5 5600H R5 5600H, Vega 7, Kingston NV1 SNVS/500GCN, , x, | Intel NUC11TNKi5 i5-1135G7, Iris Xe G7 80EUs, Transcend M.2 SSD 430S TS512GMTS430S, , x, | |
|---|---|---|---|---|---|---|
| Power Consumption | -47% | 2% | -13% | -15% | -58% | |
| Idle Minimum * (Watt) | 6 | 9.8 -63% | 6.7 -12% | 7.5 -25% | 5.4 10% | 11.5 -92% |
| Idle Average * (Watt) | 6.2 | 10.3 -66% | 8.1 -31% | 7.6 -23% | 8.2 -32% | 12.4 -100% |
| Idle Maximum * (Watt) | 6.3 | 10.5 -67% | 11.6 -84% | 9.2 -46% | 8.3 -32% | 12.9 -105% |
| Load Average * (Watt) | 42.8 | 54.2 -27% | 23.9 44% | 41.1 4% | 49.3 -15% | 40.7 5% |
| Witcher 3 ultra * (Watt) | 35 | 53.1 -52% | 19.1 45% | 46.1 -32% | 43.9 -25% | |
| Load Maximum * (Watt) | 55.8 | 59 -6% | 28.8 48% | 41.4 26% | 50.2 10% | 73.5 -32% |
* ... Moindre est la valeur, meilleures sont les performances
Power Consumption Witcher 3 / Stresstest
Power Consumption external Monitor
Points positifs
Points négatifs
Verdict : une option bon marché pour les besoins HTPC de base
Si vous cherchez à maximiser votre rapport qualité-prix, le BMax B5 Pro devrait figurer en tête de votre liste. Il offre un spacieux SSD NVMe de 512 Go, de l'espace pour un deuxième SSD, 16 Go de RAM amovible, la licence Windows 11 Pro déjà installée, un ventilateur silencieux et un processeur comparable au 10e génération Core i7-1065G7 le tout pour moins de 300 dollars américains. Le Core i5-8260U surpasse tous les Core i3, Celeron, Atom ou Ryzen 3 actuels qui sont trop courants dans cette gamme de prix.
Le BMax B5 Pro est un ensemble complet pour près de la moitié du prix d'un NUC Intel barebones sans avoir à se contenter de processeurs Celeron ou Atom de bas de gamme.
Le principal inconvénient de ce modèle est sa faible performance graphique, ce qui ne devrait pas être un problème car personne ne devrait acheter le B5 Pro pour jouer. Les performances graphiques restent suffisantes pour un streaming 4K60 confortable.
Nous aimerions voir plus de ports USB-C, la prise en charge de USB-C Power Delivery et un port HDMI 2.0 ou mieux sur les futures révisions.
Prix et disponibilité
Amazon livre actuellement notre configuration exacte du BMax B5 Pro pour 380 USD ou 280 USD après application du code de réduction au moment de la publication.
Price comparison

