Test du Beelink SEi8 : un Core i3-8109U peu commun pour un nouveau mini PC
Beelink est en train de devenir une alternative majeure à la série Intel NUC avec sa gamme croissante de mini PC. Le récent SER4, par exemple, s'est avéré tout aussi rapide que de nombreux modèles Intel NUC équipés de processeurs Core U-series de 11e génération, tout en coûtant des centaines de dollars de moins
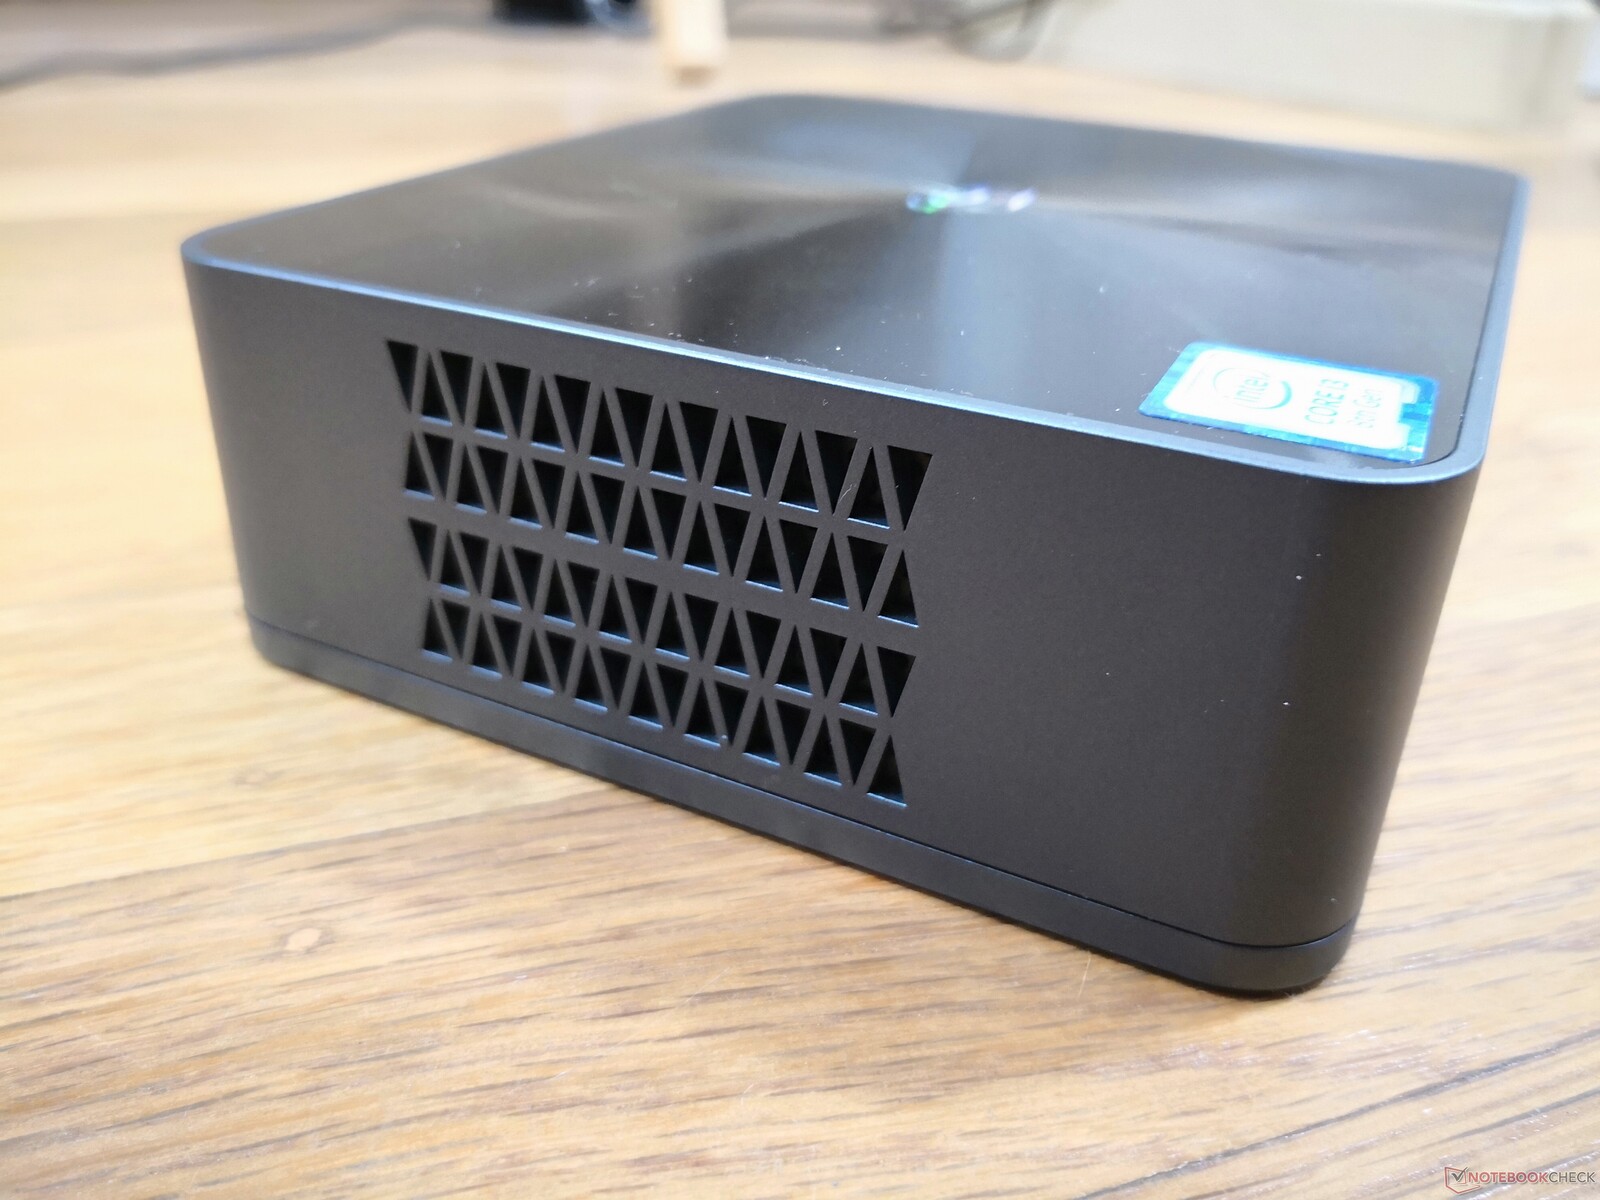
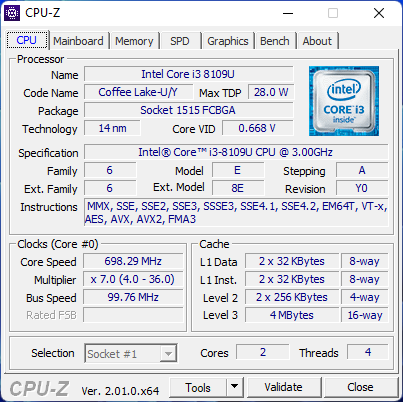
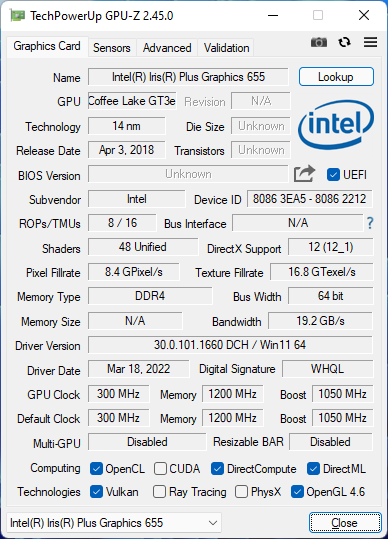
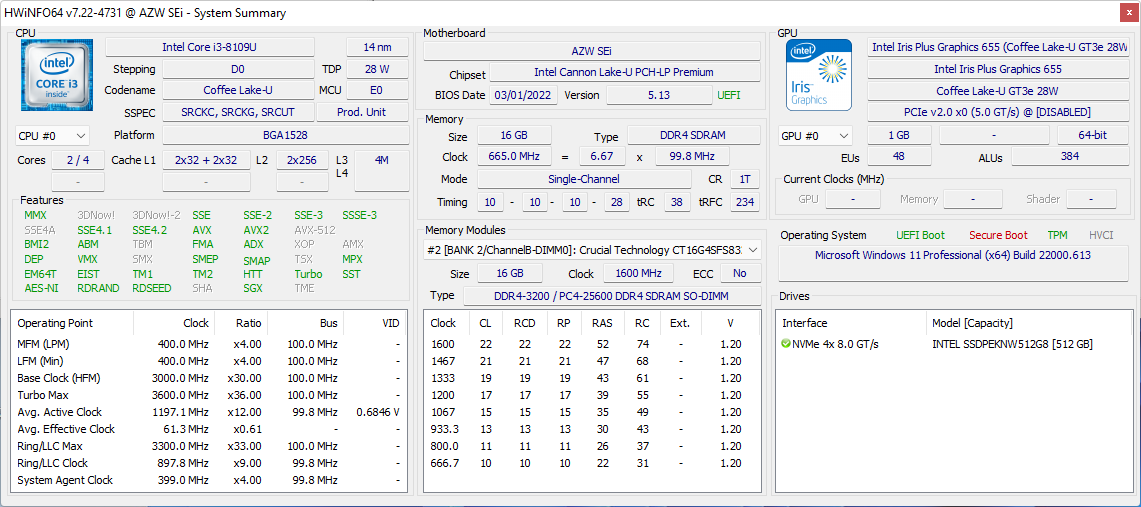
Le SEi8 est équipé d'un ancien Core i3-8109U ou Core i5-8259U de 8e génération, tandis que le SEi10 de l'année dernière est équipé d'options Core U-series de 10e génération. L'ancien Core i3 rend le modèle encore plus abordable et constitue une alternative attrayante aux NUC Intel équipés de Core i3
Beelink livre actuellement le SEi8 à partir de $320 USD avec 8 GB de RAM ou $380 avec 16 GB de RAM. S'il est configuré avec le Core i5-8279U, le prix passe à 400 dollars américains
Plus de commentaires sur Beelink :
Comparaison avec les concurrents potentiels
Note | Date | Modèle | Poids | Épaisseur | Taille | Résolution | Prix |
|---|---|---|---|---|---|---|---|
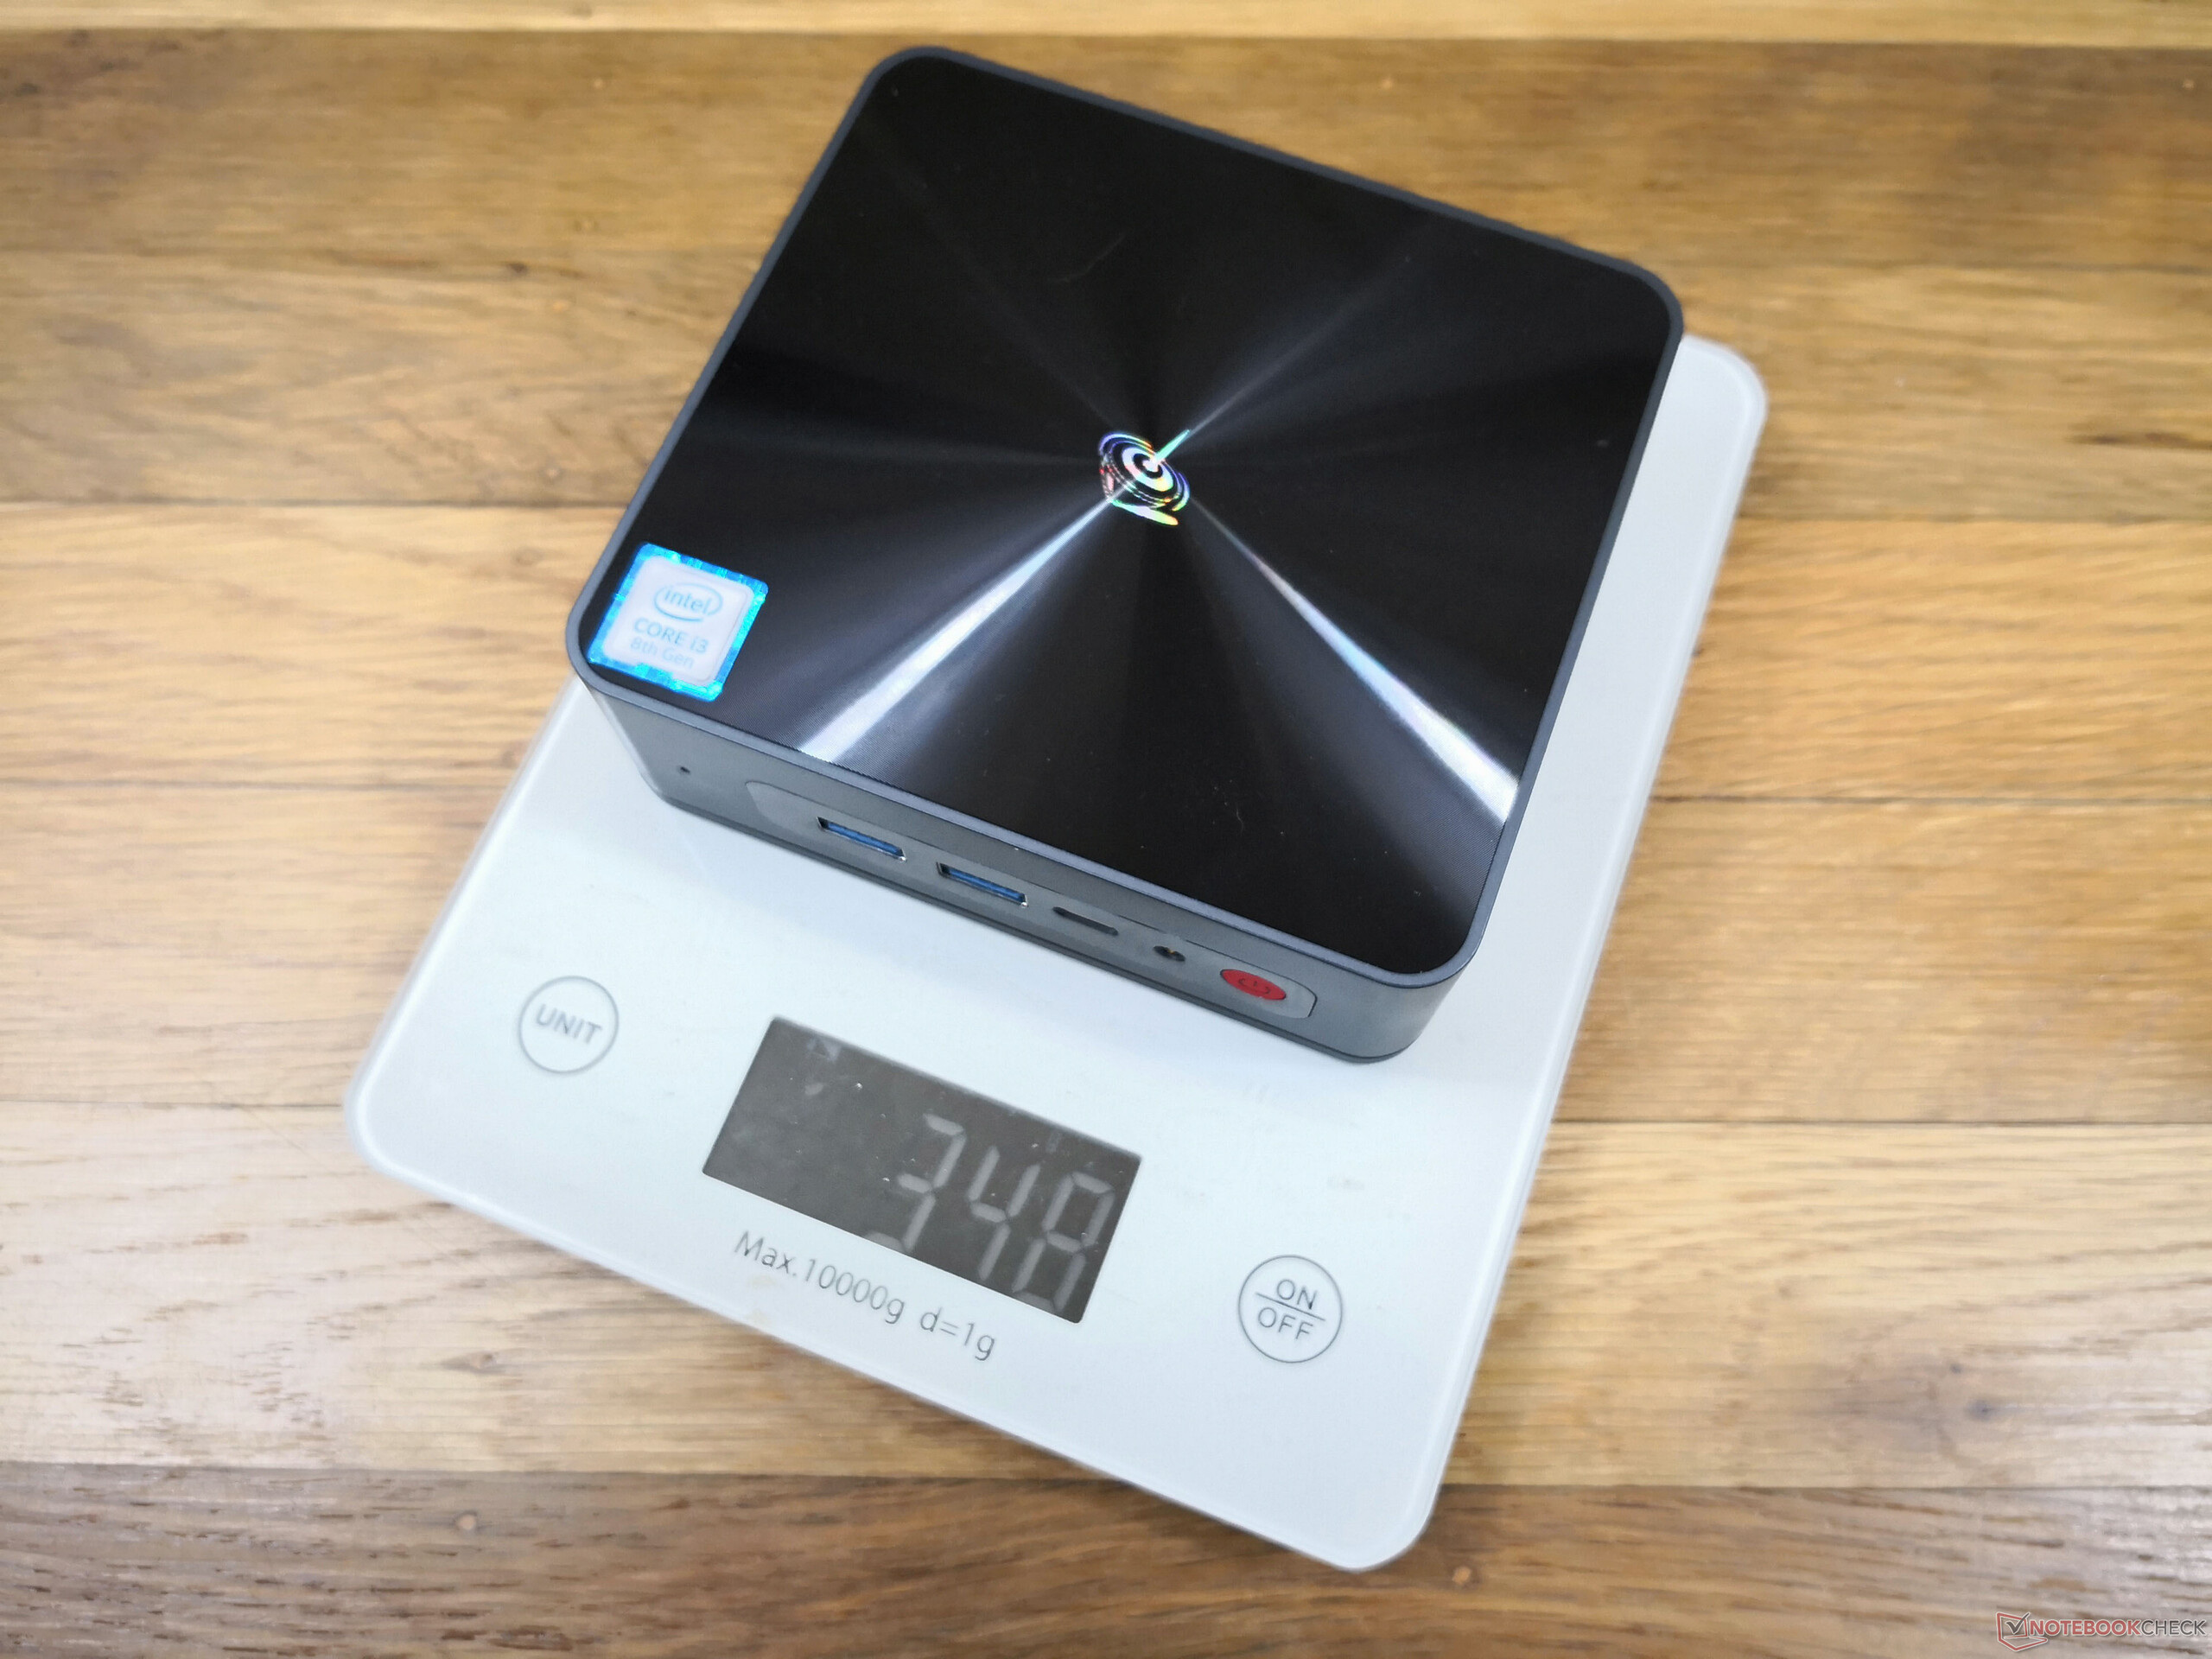
v (old) | 04/22 | Beelink SEi8 i3-8109U, Iris Plus Graphics 655 | 346 g | 41 mm | x | ||
v (old) | Beelink SEi10 i3-1005G1, UHD Graphics G1 (Ice Lake 32 EU) | 350 g | 41 mm | x | |||
v (old) | 04/22 | Beelink SER4 R7 4800U, Vega 8 | 494 g | 40 mm | x | ||
v (old) | 04/21 | Intel NUC11TNKi5 i5-1135G7, Iris Xe G7 80EUs | 504 g | 37 mm | x | ||
v (old) | 11/18 | Intel NUC8i7BE i7-8559U, Iris Plus Graphics 655 | 683 g | 51 mm | x | ||
v (old) | 03/21 | GMK NucBox 2 i5-8259U, Iris Plus Graphics 655 | 430 g | 50 mm | x |
Cas
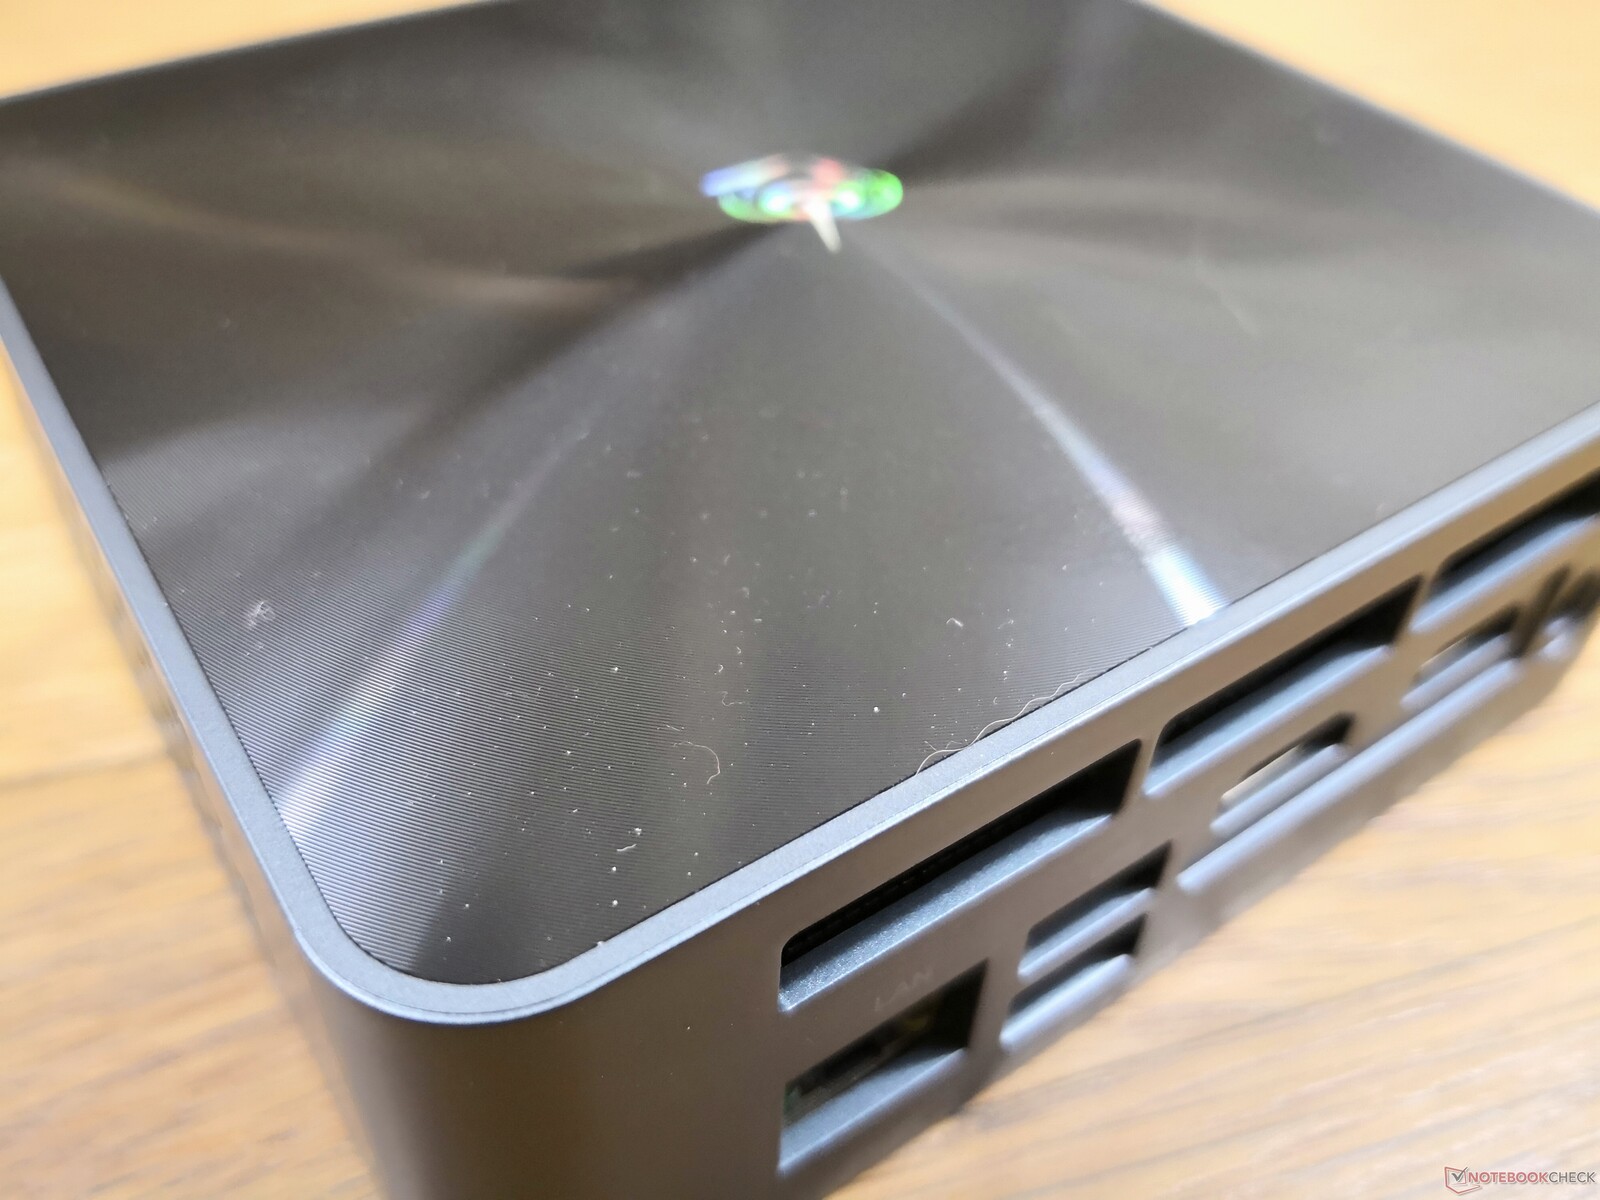
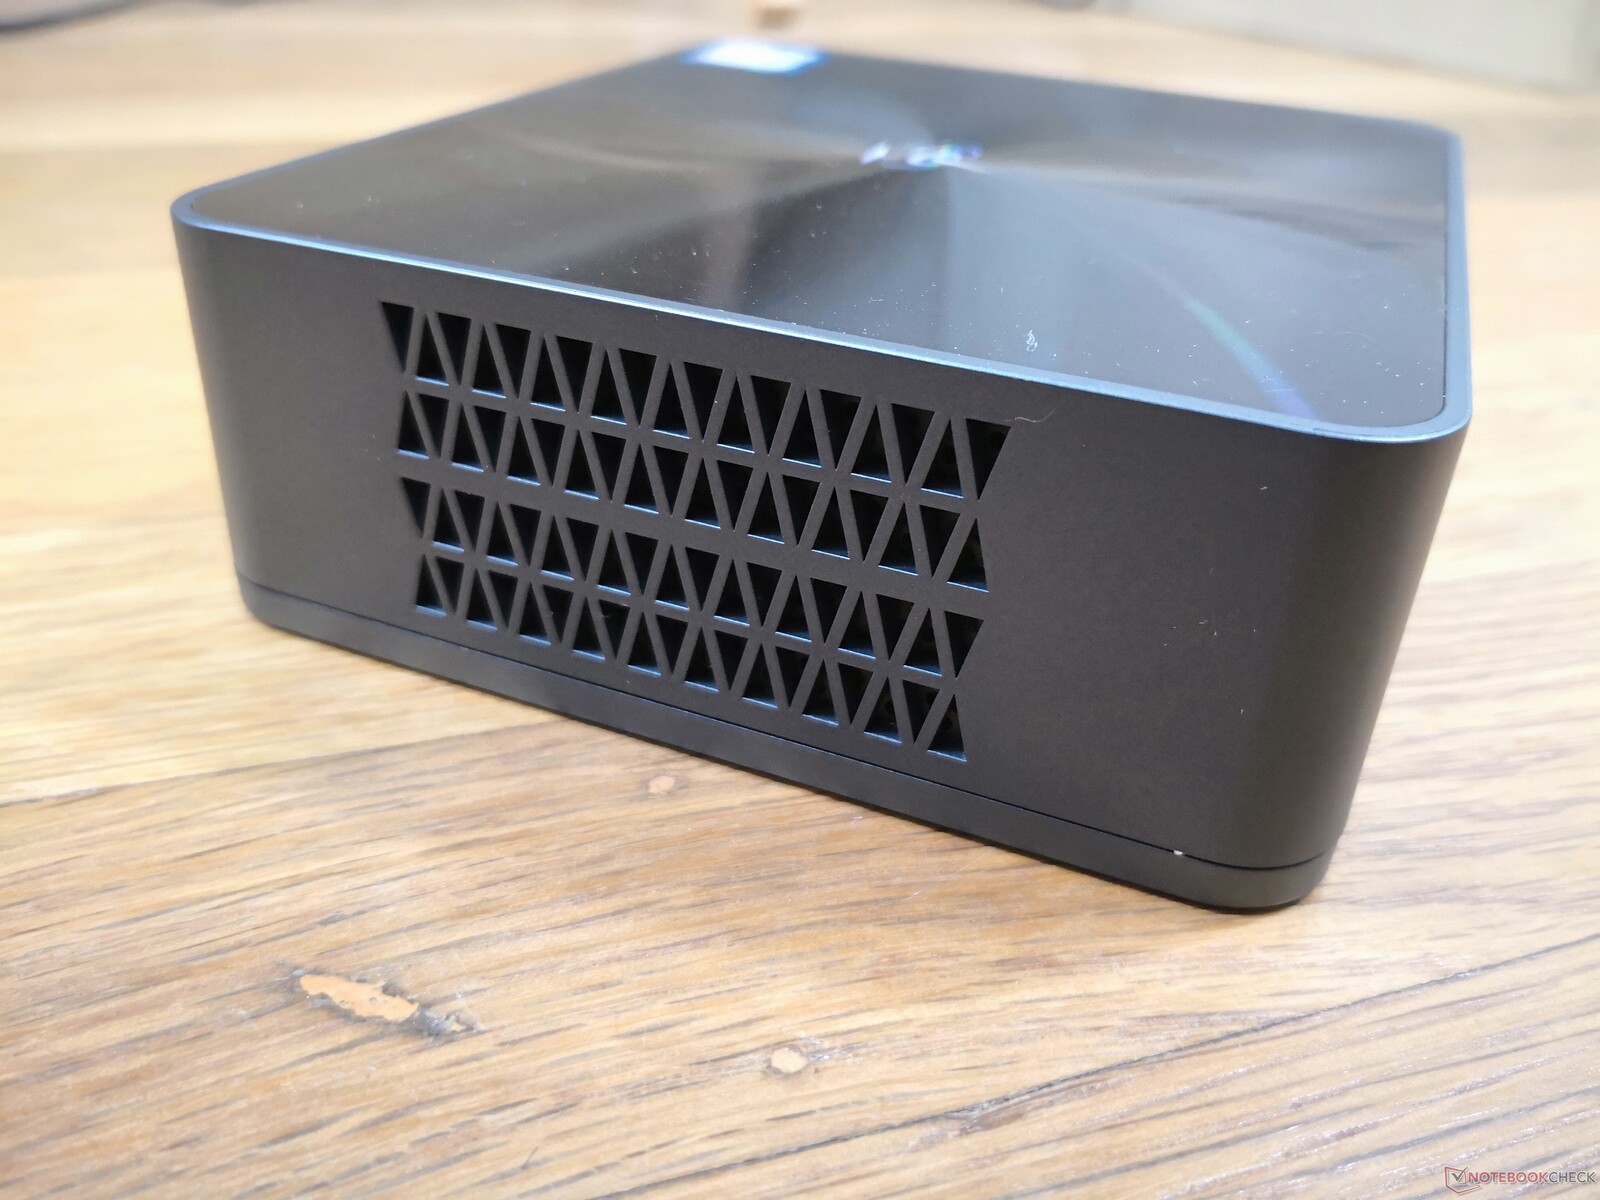
Le châssis externe est identique à celui du SEi10. Sa conception est remarquable car il fait à peu près la même taille qu'un Intel NUC tout en étant 30 % plus léger. Le matériau du châssis, tout en restant rigide, est loin d'être aussi épais ou solide qu'un NUC.
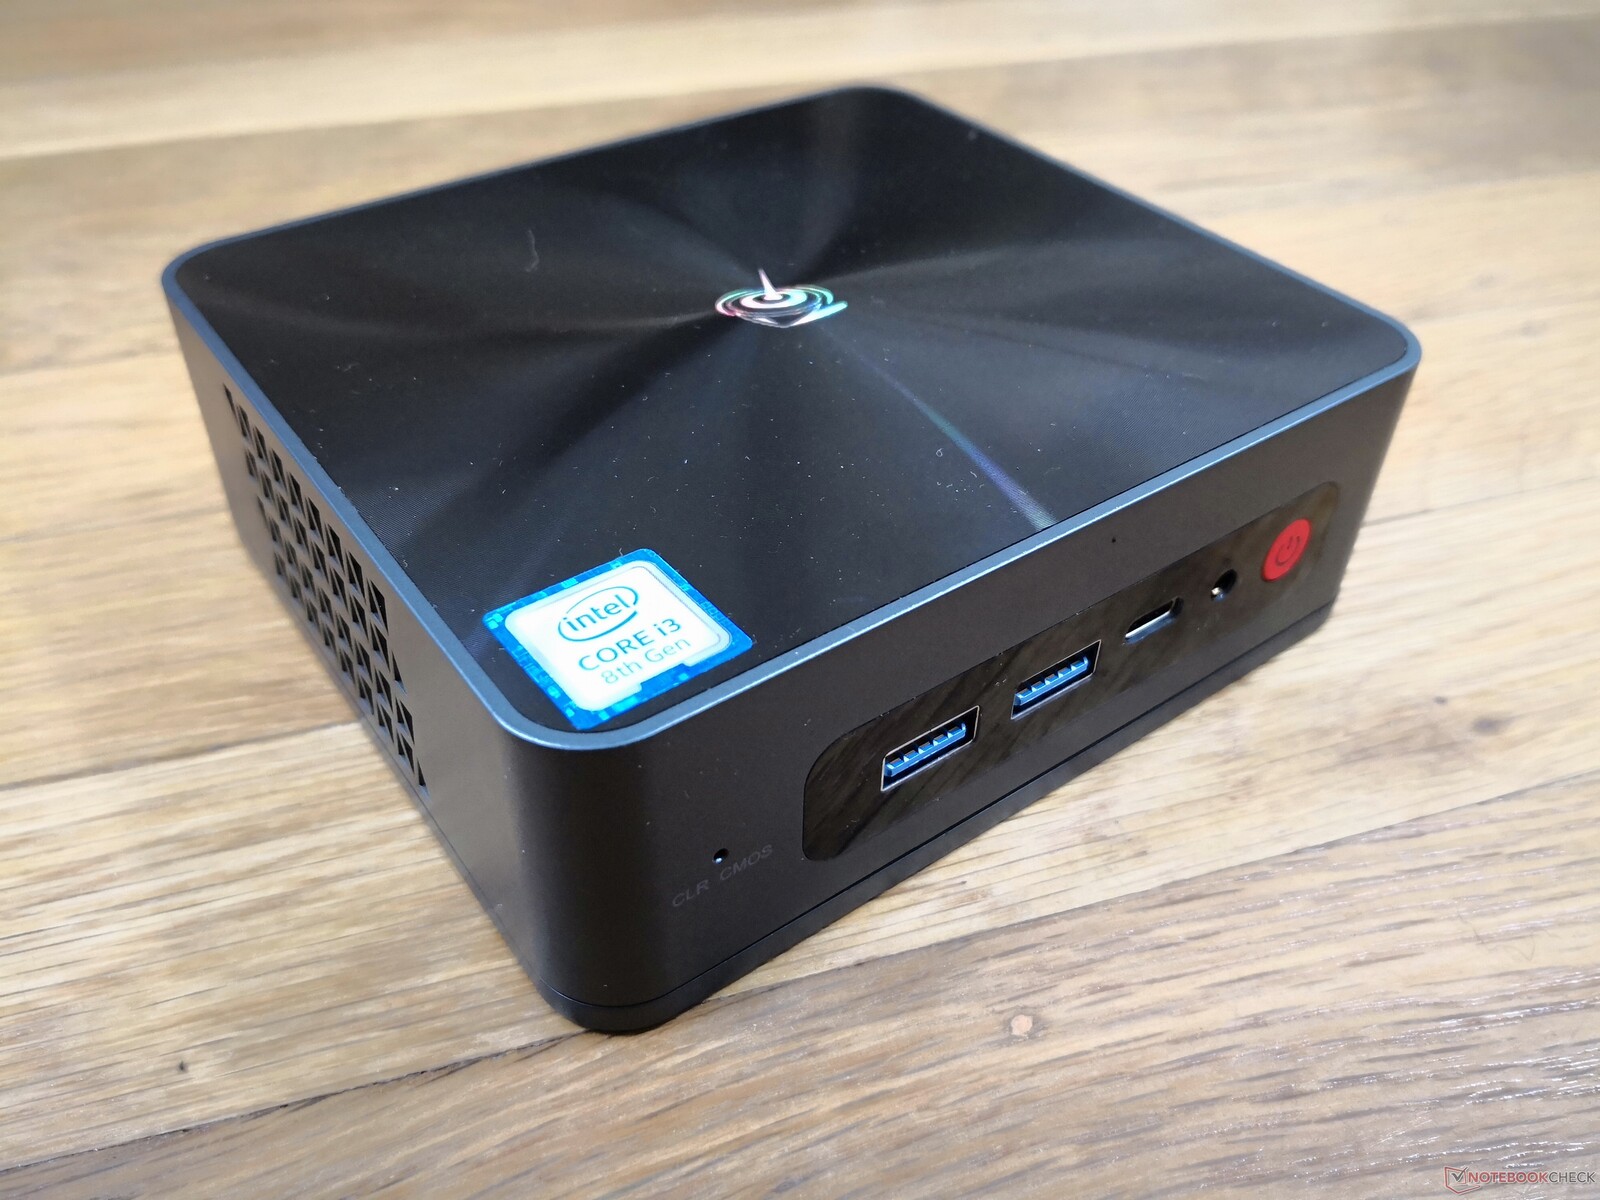
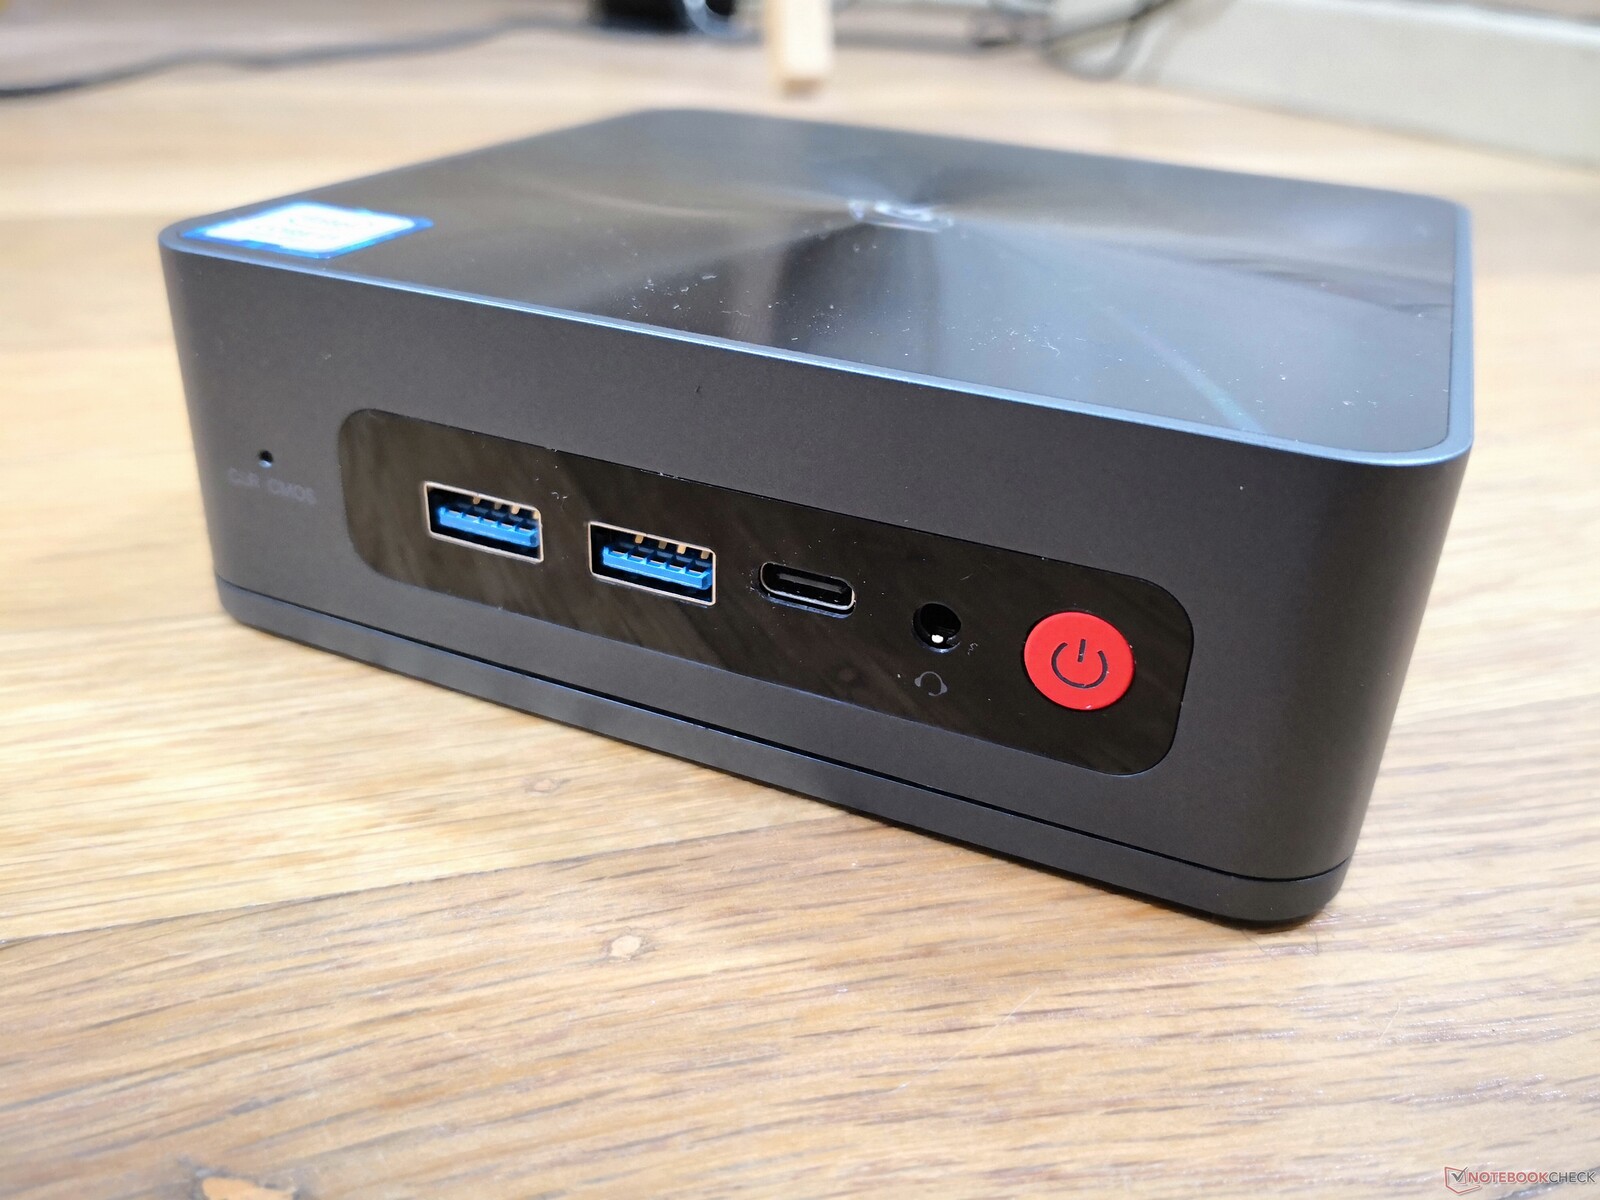
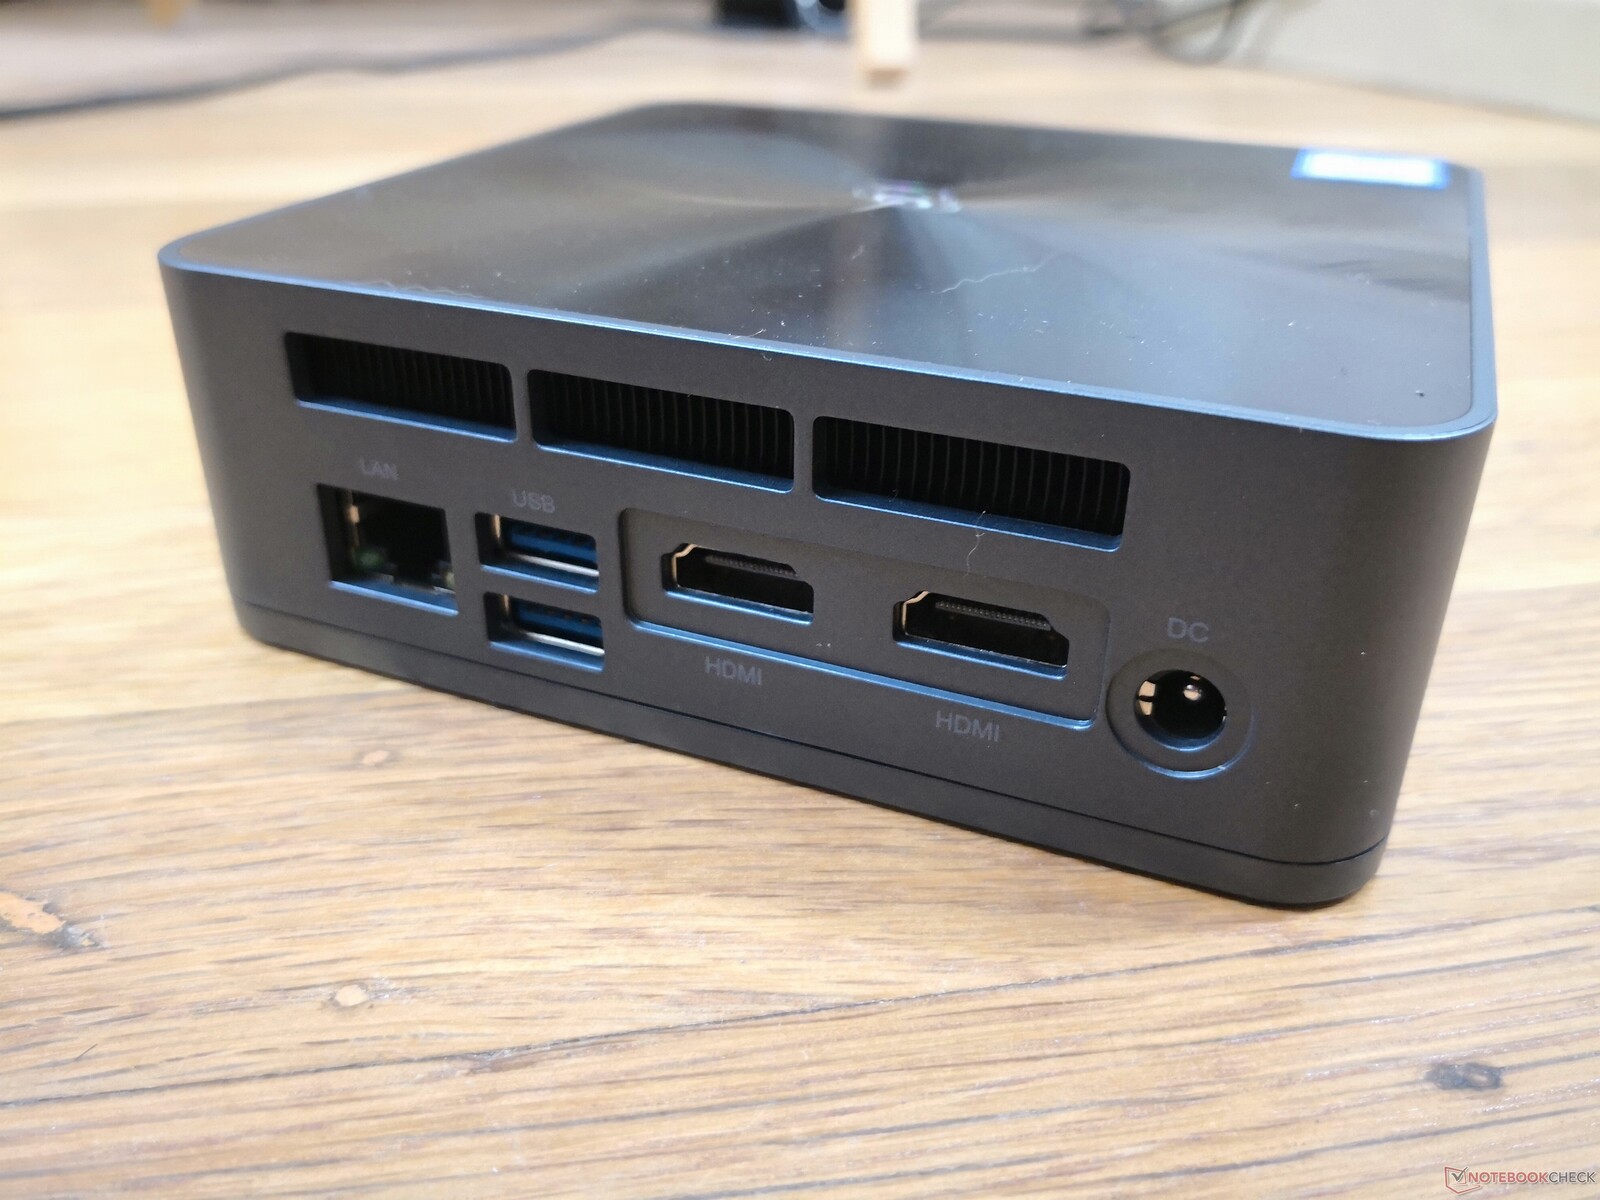
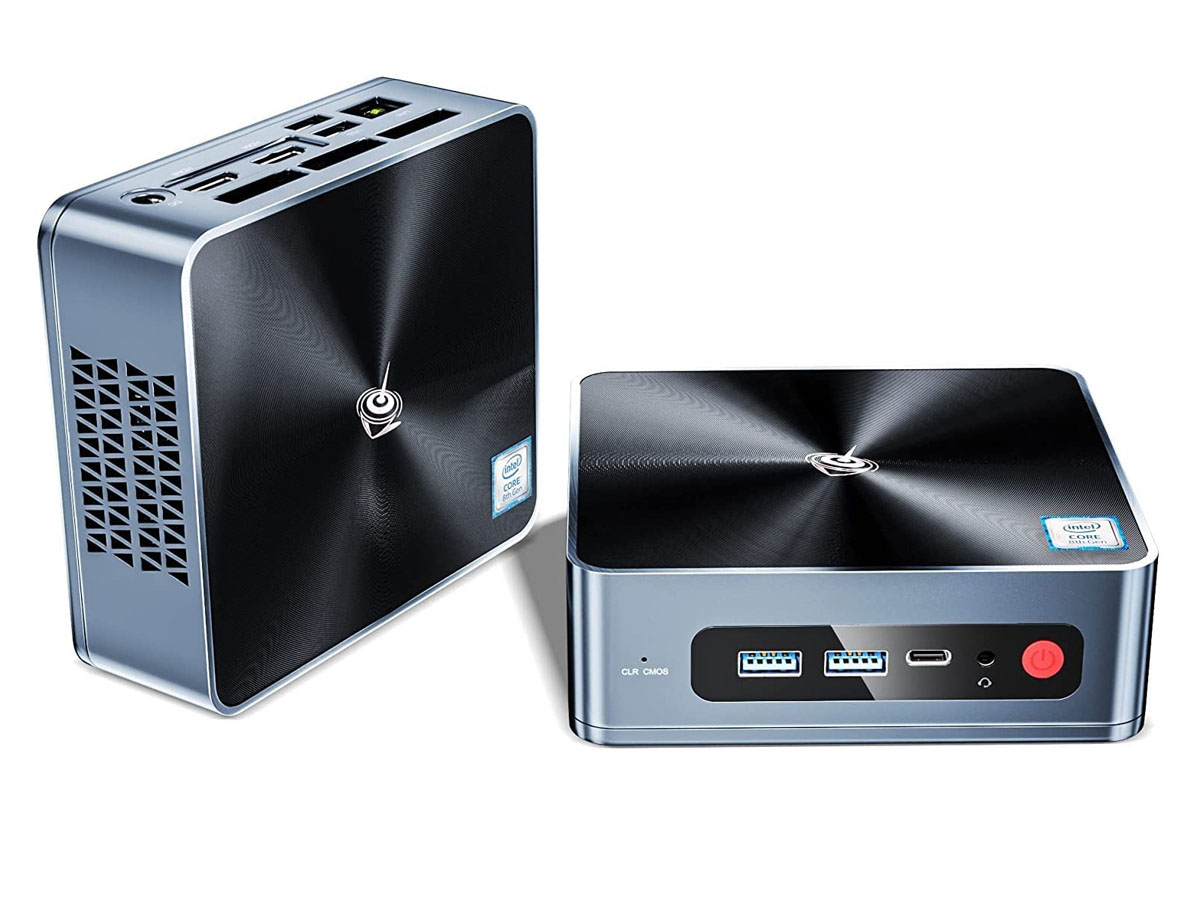
Connectivité
Les options de port sont identiques à celles du SEi10, sauf que Thunderbolt n'est pas pris en charge et qu'il n'y a plus de lecteur de carte SD intégré. Nous pouvons confirmer que le port USB-C prend toujours en charge le DisplayPort, mais il ne peut pas être utilisé pour alimenter le mini PC, contrairement à ce qui se passe sur le SER4.
Communication
Modules de communication filaires et sans fil intégrés, comparaison des données de test du réseau avec celles des concurrents, solutions alternatives disponibles (5G/LTE) ?, Irrégularités (réception radio) ?
| Networking | |
| iperf3 transmit AX12 | |
| Intel NUC11TNKi5 | |
| Beelink SER4 | |
| Beelink SEi10 | |
| Intel NUC8i7BE | |
| GMK NucBox 2 | |
| Beelink SEi8 | |
| iperf3 receive AX12 | |
| Intel NUC11TNKi5 | |
| Beelink SEi10 | |
| Beelink SER4 | |
| GMK NucBox 2 | |
| Intel NUC8i7BE | |
| Beelink SEi8 | |
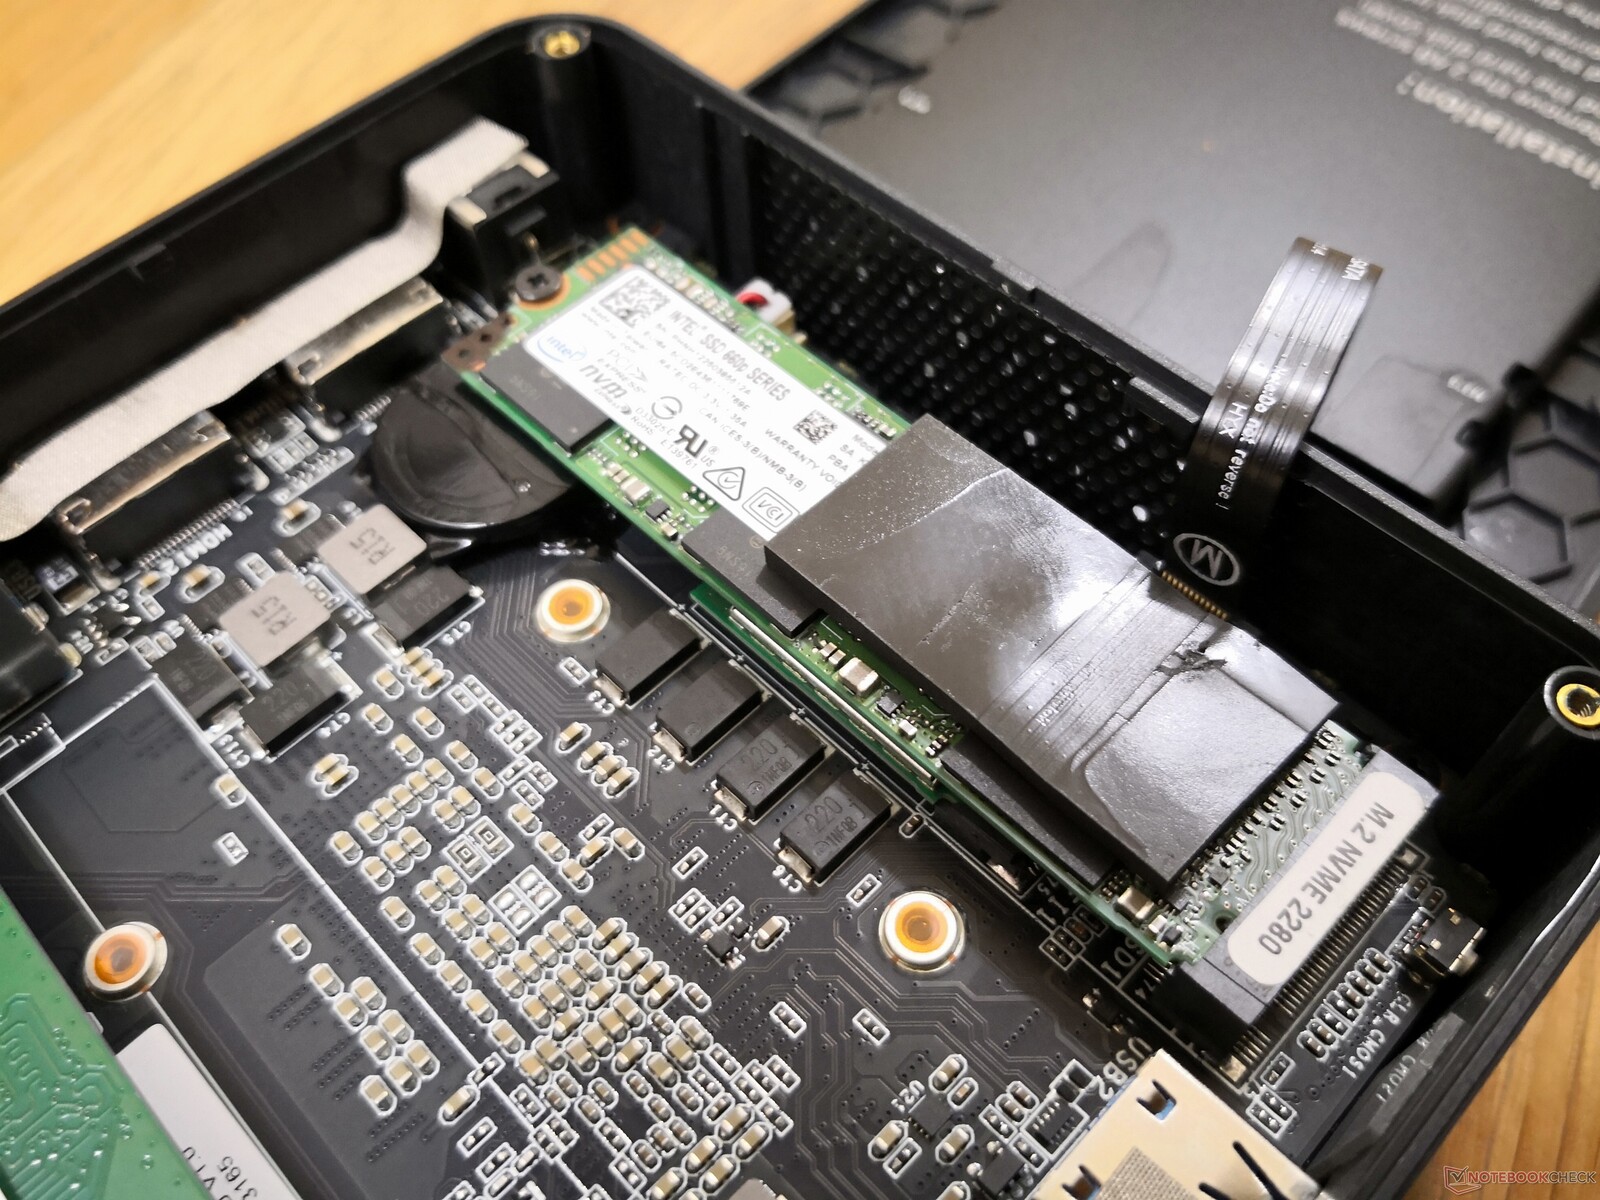
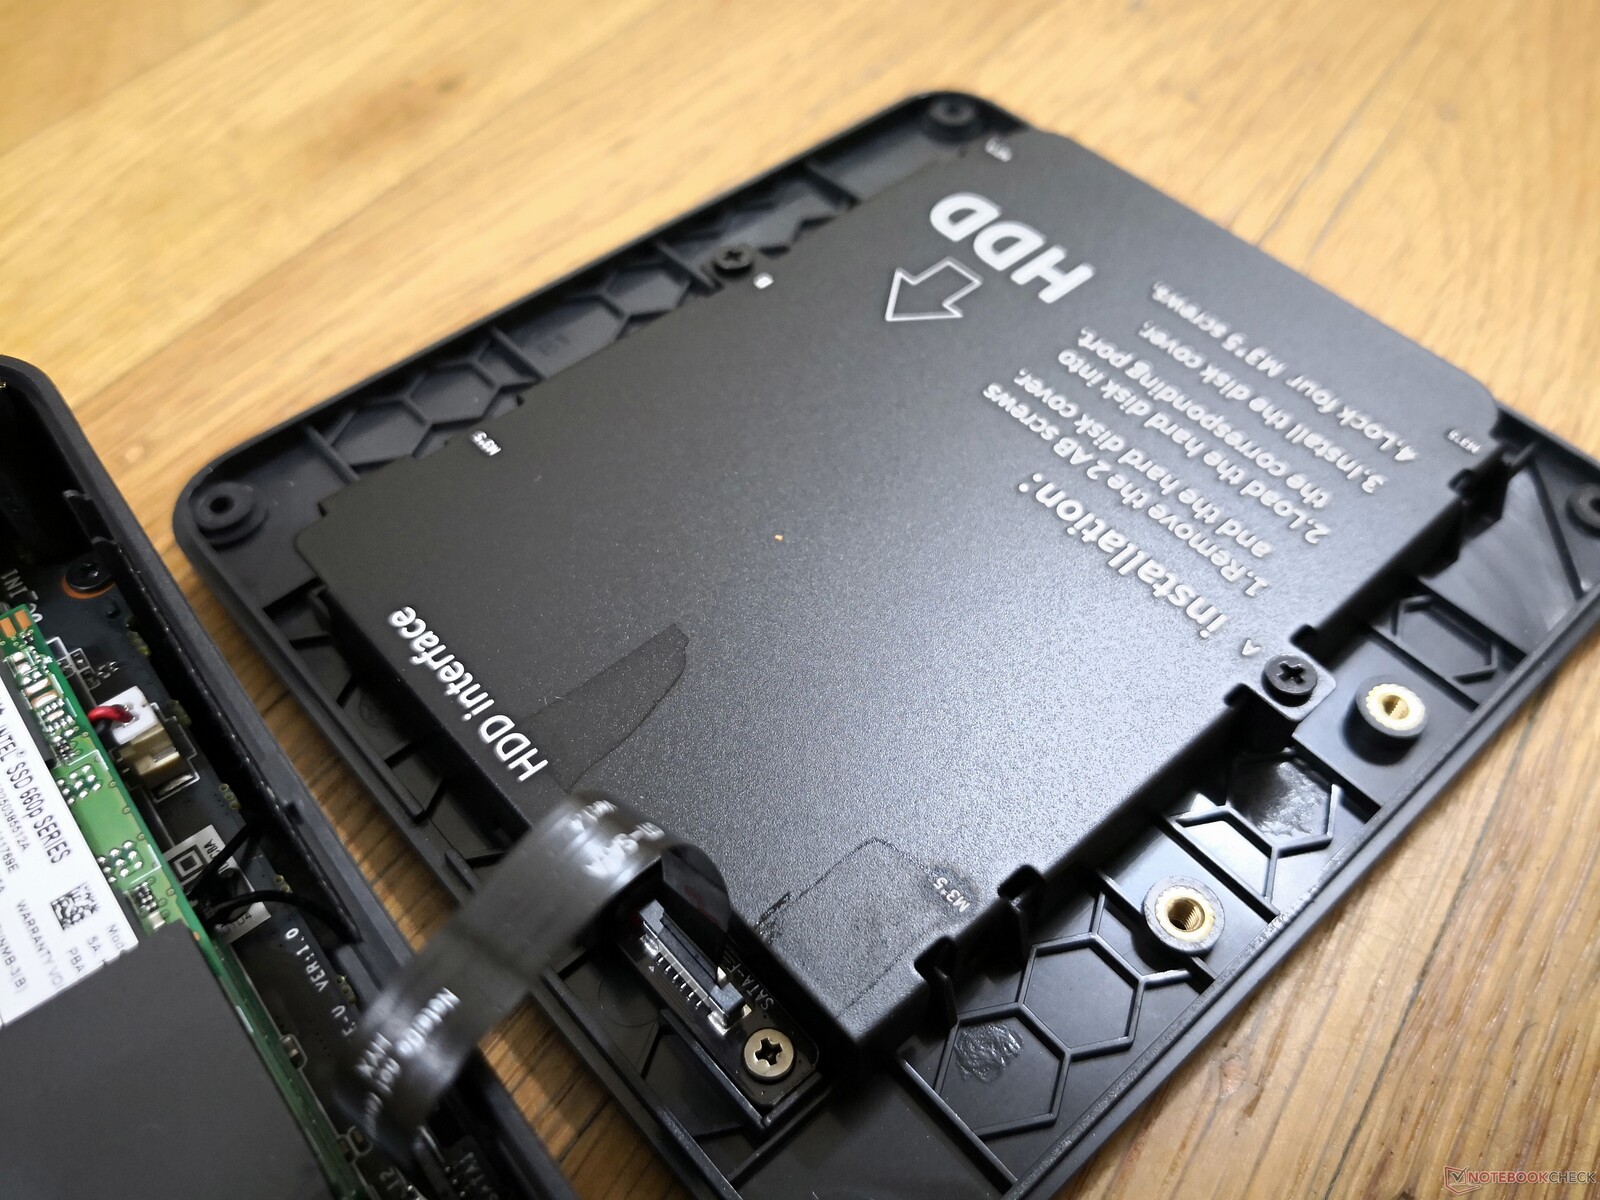
Maintenance
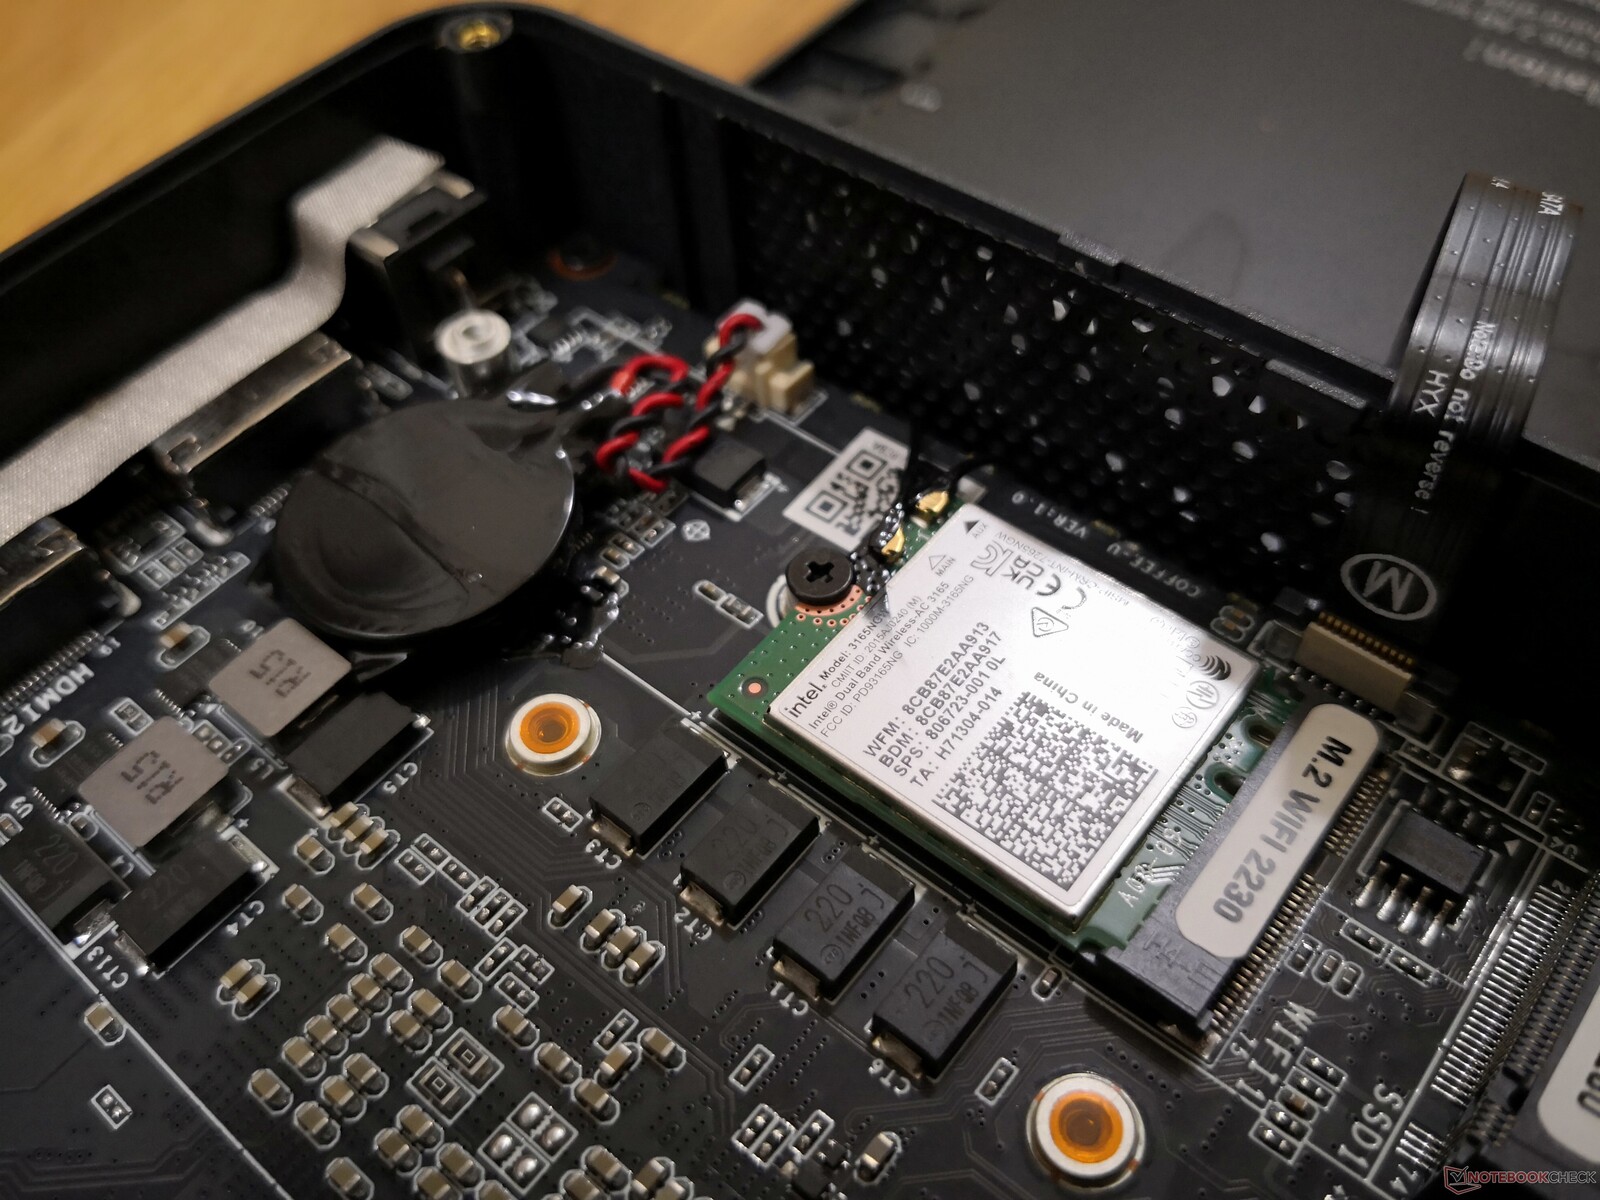
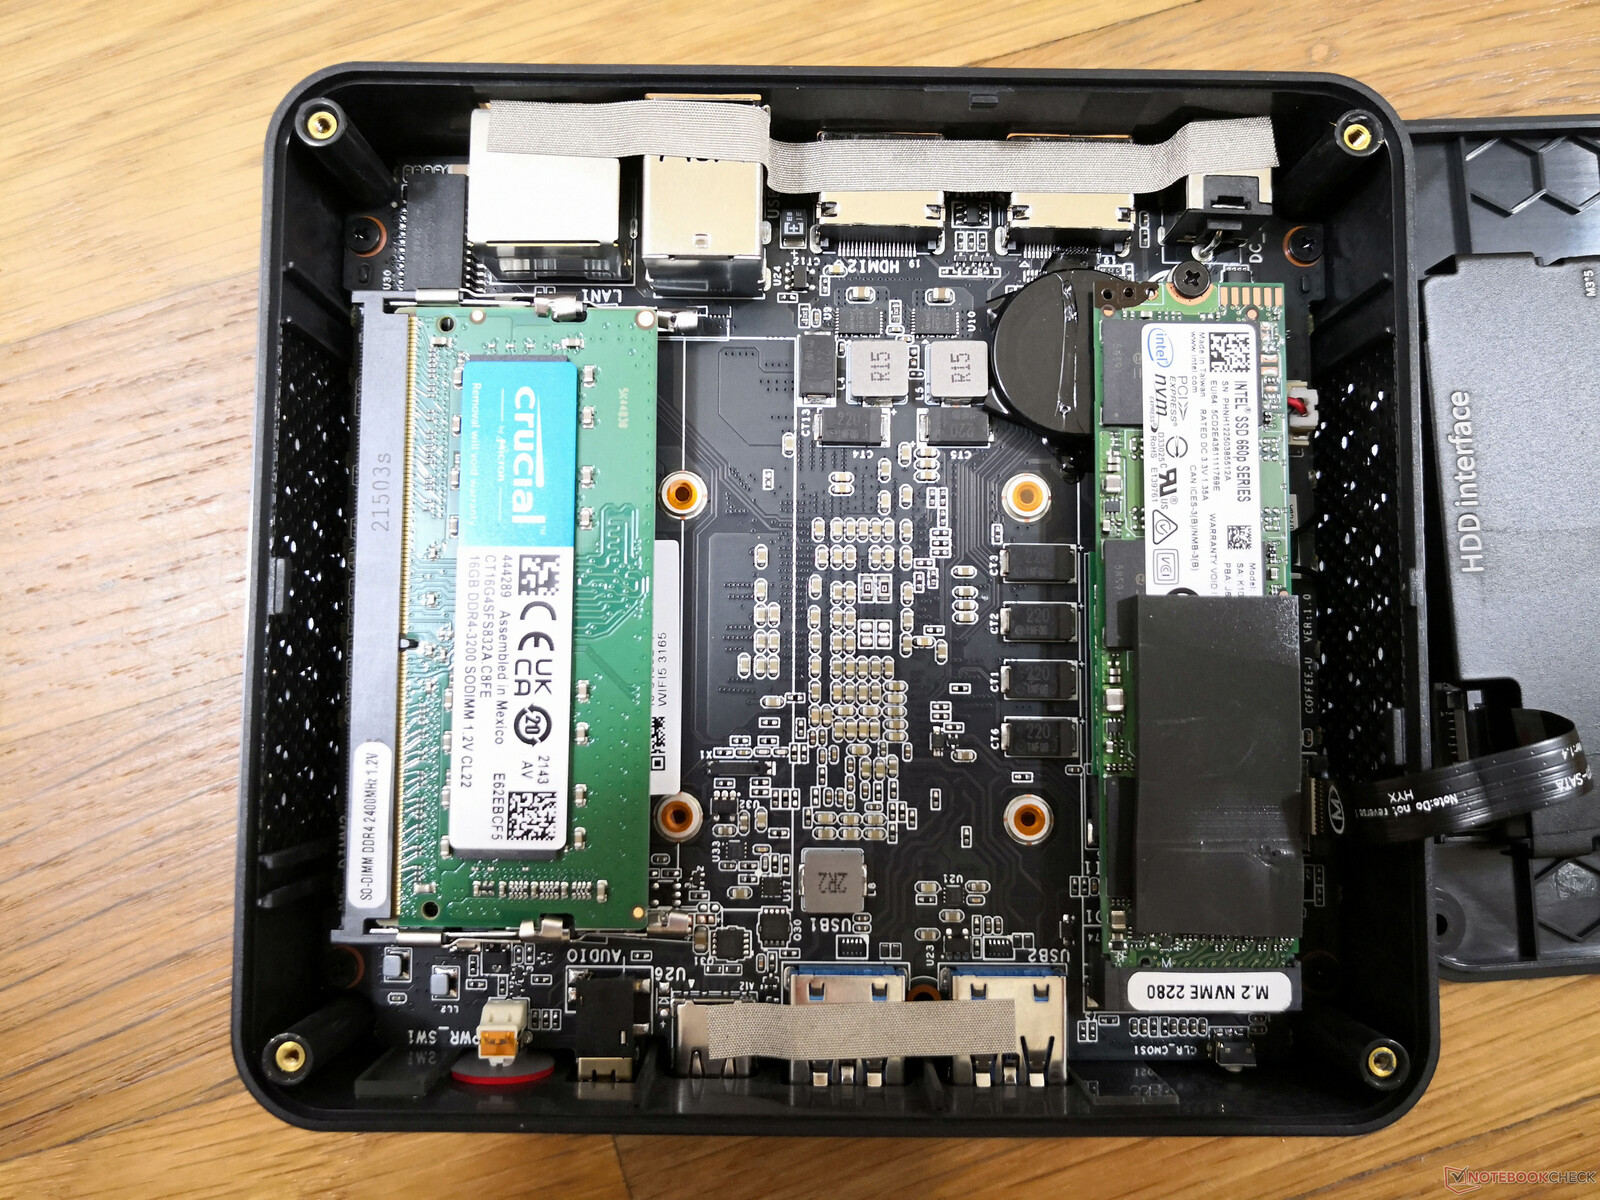
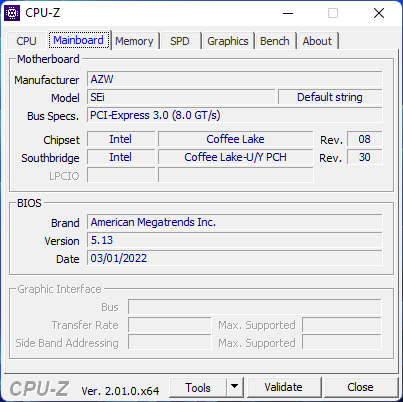
La carte mère du SEi8 est légèrement différente de celle du SEi10. L'emplacement pour SSD M.2, par exemple, est désormais orienté dans la direction opposée, tandis que la batterie du BIOS est désormais plus facilement accessible.
Accessoires et garantie
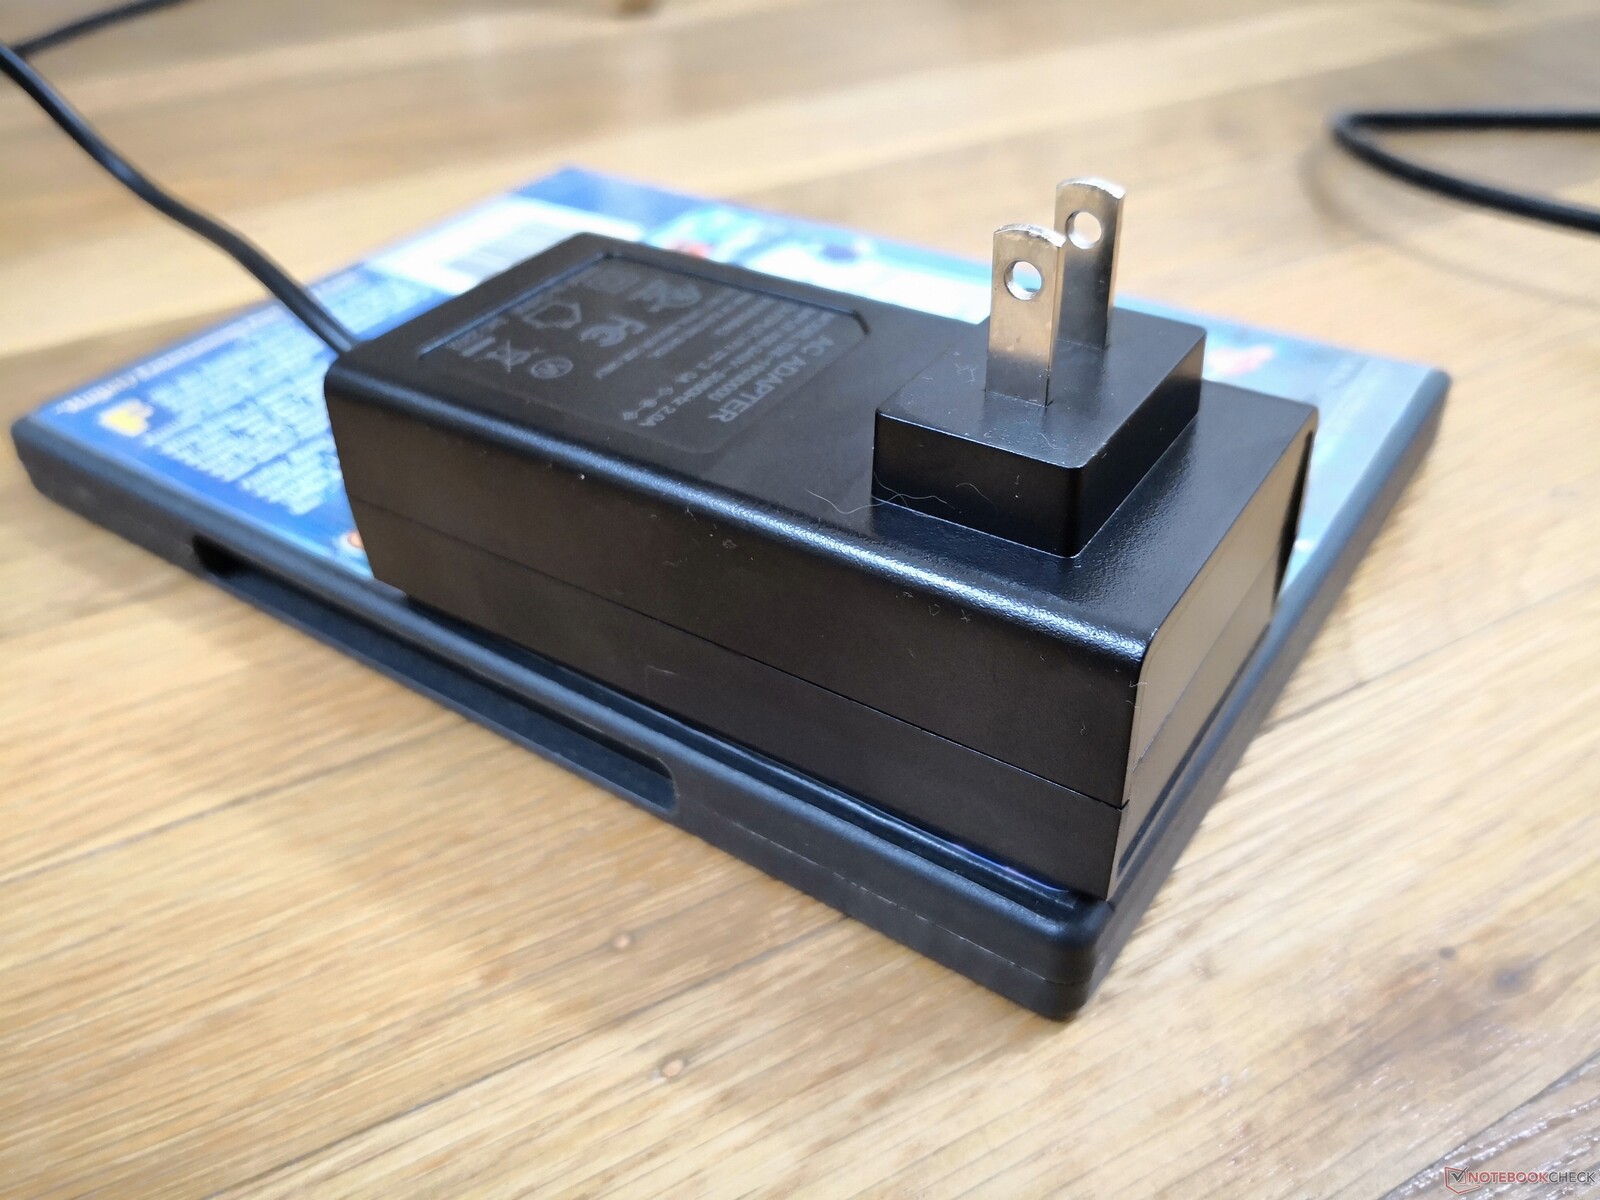
La boîte de détail comprend des vis supplémentaires, un manuel et un support VESA amovible. Il peut être difficile de faire valoir la garantie, car cela peut impliquer un envoi à l'étranger. Seule une garantie de base d'un an est fournie, contrairement aux trois ans de la plupart des NUC d'Intel.
Performance
Conditions d'essai
Notre appareil a été réglé sur le mode Performance de Windows avant d'effectuer les tests de référence ci-dessous.
Processeur
Les performances brutes du processeur se situent entre celles des séries Celeron et Atom et celles de la série U du Core i5, plus haut de gamme. Peut-être plus particulièrement, il est sensiblement plus rapide que le concurrent Ryzen 3 3200U et le refroidisseur passif Core i3-10100Y que l'on trouve sur le Microsoft Surface Go 3. Le processeur du Surface Go 3 a été fortement critiqué pour sa lenteur par rapport au Surface Pro
Beelink propose le SEi8 avec Core i5-8279U en tant que mise à niveau, ce qui permettrait d'obtenir des performances monofilaires environ 20 % plus rapides et des performances multi-filaires plus de deux fois supérieures à celles de notre Core i3-8109U.
Cinebench R15 Multi Loop
Cinebench R23: Multi Core | Single Core
Cinebench R15: CPU Multi 64Bit | CPU Single 64Bit
Blender: v2.79 BMW27 CPU
7-Zip 18.03: 7z b 4 | 7z b 4 -mmt1
Geekbench 5.5: Multi-Core | Single-Core
HWBOT x265 Benchmark v2.2: 4k Preset
LibreOffice : 20 Documents To PDF
R Benchmark 2.5: Overall mean
| Cinebench R20 / CPU (Multi Core) | |
| Beelink SER4 | |
| Intel NUC11TNKi5 | |
| Apple MacBook Pro 13 2019 i5 4TB3 | |
| Intel NUC8i7BE | |
| Acer Swift 3 SF314-42-R27B | |
| GMK NucBox 2 | |
| Beelink SEi10 | |
| Beelink U59 | |
| Beelink SEi8 | |
| Moyenne Intel Core i3-8109U (n=1) | |
| Microsoft Surface Go 3 Core i3 | |
| HP 255 G7 159P1EA | |
| GMK NucBox 3 | |
| Chuwi LapBook Plus | |
| Teclast Tbook 16 Power | |
| Cinebench R20 / CPU (Single Core) | |
| Intel NUC11TNKi5 | |
| Beelink SER4 | |
| Intel NUC8i7BE | |
| Acer Swift 3 SF314-42-R27B | |
| Apple MacBook Pro 13 2019 i5 4TB3 | |
| Beelink SEi10 | |
| GMK NucBox 2 | |
| Beelink SEi8 | |
| Moyenne Intel Core i3-8109U (n=1) | |
| Microsoft Surface Go 3 Core i3 | |
| HP 255 G7 159P1EA | |
| Beelink U59 | |
| GMK NucBox 3 | |
| Chuwi LapBook Plus | |
| Teclast Tbook 16 Power | |
| Cinebench R23 / Multi Core | |
| Beelink SER4 | |
| Intel NUC11TNKi5 | |
| GMK NucBox 2 | |
| Beelink U59 | |
| Beelink SEi8 | |
| Moyenne Intel Core i3-8109U (n=1) | |
| HP 255 G7 159P1EA | |
| Microsoft Surface Go 3 Core i3 | |
| GMK NucBox 3 | |
| Teclast Tbook 16 Power | |
| Cinebench R23 / Single Core | |
| Intel NUC11TNKi5 | |
| Beelink SER4 | |
| GMK NucBox 2 | |
| Beelink SEi8 | |
| Moyenne Intel Core i3-8109U (n=1) | |
| Microsoft Surface Go 3 Core i3 | |
| HP 255 G7 159P1EA | |
| Beelink U59 | |
| GMK NucBox 3 | |
| Teclast Tbook 16 Power | |
| Cinebench R15 / CPU Multi 64Bit | |
| Beelink SER4 | |
| Intel NUC8i7BE | |
| Intel NUC11TNKi5 | |
| Apple MacBook Pro 13 2019 i5 4TB3 | |
| Apple MacBook Pro 13 2019 i5 4TB3 | |
| GMK NucBox 2 | |
| Acer Swift 3 SF314-42-R27B | |
| Beelink SEi10 | |
| Beelink U59 | |
| HP 255 G7 159P1EA | |
| Moyenne Intel Core i3-8109U (324 - 381, n=2) | |
| Beelink SEi8 | |
| Microsoft Surface Go 3 Core i3 | |
| GMK NucBox 3 | |
| Teclast Tbook 16 Power | |
| Chuwi LapBook Plus | |
| Cinebench R15 / CPU Single 64Bit | |
| Intel NUC11TNKi5 | |
| Intel NUC8i7BE | |
| Beelink SER4 | |
| Apple MacBook Pro 13 2019 i5 4TB3 | |
| Apple MacBook Pro 13 2019 i5 4TB3 | |
| Acer Swift 3 SF314-42-R27B | |
| Beelink SEi10 | |
| GMK NucBox 2 | |
| Moyenne Intel Core i3-8109U (124.3 - 153, n=2) | |
| HP 255 G7 159P1EA | |
| Beelink SEi8 | |
| Microsoft Surface Go 3 Core i3 | |
| Beelink U59 | |
| GMK NucBox 3 | |
| Chuwi LapBook Plus | |
| Teclast Tbook 16 Power | |
| Blender / v2.79 BMW27 CPU | |
| Teclast Tbook 16 Power | |
| Chuwi LapBook Plus | |
| GMK NucBox 3 | |
| Microsoft Surface Go 3 Core i3 | |
| Beelink U59 | |
| HP 255 G7 159P1EA | |
| Beelink SEi8 | |
| Moyenne Intel Core i3-8109U (n=1) | |
| Beelink SEi10 | |
| Acer Swift 3 SF314-42-R27B | |
| GMK NucBox 2 | |
| Intel NUC8i7BE | |
| Intel NUC8i7BE | |
| Apple MacBook Pro 13 2019 i5 4TB3 | |
| Intel NUC11TNKi5 | |
| Beelink SER4 | |
| 7-Zip 18.03 / 7z b 4 | |
| Beelink SER4 | |
| Intel NUC8i7BE | |
| Intel NUC8i7BE | |
| Intel NUC11TNKi5 | |
| Apple MacBook Pro 13 2019 i5 4TB3 | |
| GMK NucBox 2 | |
| Acer Swift 3 SF314-42-R27B | |
| Beelink U59 | |
| Beelink SEi10 | |
| Beelink SEi8 | |
| Moyenne Intel Core i3-8109U (n=1) | |
| HP 255 G7 159P1EA | |
| Microsoft Surface Go 3 Core i3 | |
| GMK NucBox 3 | |
| Chuwi LapBook Plus | |
| 7-Zip 18.03 / 7z b 4 -mmt1 | |
| Intel NUC8i7BE | |
| Intel NUC8i7BE | |
| Intel NUC11TNKi5 | |
| Beelink SER4 | |
| Apple MacBook Pro 13 2019 i5 4TB3 | |
| Beelink SEi10 | |
| Acer Swift 3 SF314-42-R27B | |
| GMK NucBox 2 | |
| Beelink SEi8 | |
| Moyenne Intel Core i3-8109U (n=1) | |
| Microsoft Surface Go 3 Core i3 | |
| HP 255 G7 159P1EA | |
| Beelink U59 | |
| GMK NucBox 3 | |
| Chuwi LapBook Plus | |
| Geekbench 5.5 / Multi-Core | |
| Beelink SER4 | |
| Intel NUC11TNKi5 | |
| Intel NUC8i7BE | |
| GMK NucBox 2 | |
| Acer Swift 3 SF314-42-R27B | |
| Beelink SEi10 | |
| Microsoft Surface Go 3 Core i3 | |
| Beelink SEi8 | |
| Moyenne Intel Core i3-8109U (n=1) | |
| HP 255 G7 159P1EA | |
| GMK NucBox 3 | |
| Teclast Tbook 16 Power | |
| Geekbench 5.5 / Single-Core | |
| Intel NUC11TNKi5 | |
| Beelink SER4 | |
| Beelink SEi10 | |
| Acer Swift 3 SF314-42-R27B | |
| Microsoft Surface Go 3 Core i3 | |
| GMK NucBox 2 | |
| Beelink SEi8 | |
| Moyenne Intel Core i3-8109U (n=1) | |
| HP 255 G7 159P1EA | |
| Intel NUC8i7BE | |
| GMK NucBox 3 | |
| Teclast Tbook 16 Power | |
| HWBOT x265 Benchmark v2.2 / 4k Preset | |
| Beelink SER4 | |
| Intel NUC11TNKi5 | |
| Apple MacBook Pro 13 2019 i5 4TB3 | |
| Intel NUC8i7BE | |
| Intel NUC8i7BE | |
| GMK NucBox 2 | |
| Acer Swift 3 SF314-42-R27B | |
| Beelink SEi10 | |
| Beelink SEi8 | |
| Moyenne Intel Core i3-8109U (n=1) | |
| Beelink U59 | |
| Microsoft Surface Go 3 Core i3 | |
| HP 255 G7 159P1EA | |
| GMK NucBox 3 | |
| Chuwi LapBook Plus | |
| Teclast Tbook 16 Power | |
| LibreOffice / 20 Documents To PDF | |
| Teclast Tbook 16 Power | |
| GMK NucBox 3 | |
| Microsoft Surface Go 3 Core i3 | |
| Beelink U59 | |
| HP 255 G7 159P1EA | |
| Beelink SEi8 | |
| Moyenne Intel Core i3-8109U (n=1) | |
| GMK NucBox 2 | |
| Beelink SER4 | |
| Acer Swift 3 SF314-42-R27B | |
| Beelink SEi10 | |
| Intel NUC11TNKi5 | |
| R Benchmark 2.5 / Overall mean | |
| Teclast Tbook 16 Power | |
| GMK NucBox 3 | |
| Beelink U59 | |
| Microsoft Surface Go 3 Core i3 | |
| Beelink SEi8 | |
| Moyenne Intel Core i3-8109U (n=1) | |
| HP 255 G7 159P1EA | |
| GMK NucBox 2 | |
| Beelink SEi10 | |
| Acer Swift 3 SF314-42-R27B | |
| Intel NUC8i7BE | |
| Intel NUC11TNKi5 | |
| Beelink SER4 | |
Cinebench R23: Multi Core | Single Core
Cinebench R15: CPU Multi 64Bit | CPU Single 64Bit
Blender: v2.79 BMW27 CPU
7-Zip 18.03: 7z b 4 | 7z b 4 -mmt1
Geekbench 5.5: Multi-Core | Single-Core
HWBOT x265 Benchmark v2.2: 4k Preset
LibreOffice : 20 Documents To PDF
R Benchmark 2.5: Overall mean
* ... Moindre est la valeur, meilleures sont les performances
AIDA64: FP32 Ray-Trace | FPU Julia | CPU SHA3 | CPU Queen | FPU SinJulia | FPU Mandel | CPU AES | CPU ZLib | FP64 Ray-Trace | CPU PhotoWorxx
| Performance rating | |
| Beelink SER4 | |
| Intel NUC11TNKi5 | |
| Intel NUC8i7BE -1! | |
| GMK NucBox 2 | |
| Beelink SEi8 | |
| AIDA64 / FP32 Ray-Trace | |
| Beelink SER4 | |
| Intel NUC11TNKi5 | |
| Intel NUC8i7BE | |
| GMK NucBox 2 | |
| Beelink SEi8 | |
| AIDA64 / FPU Julia | |
| Beelink SER4 | |
| Intel NUC11TNKi5 | |
| Intel NUC8i7BE | |
| GMK NucBox 2 | |
| Beelink SEi8 | |
| AIDA64 / CPU SHA3 | |
| Intel NUC11TNKi5 | |
| Beelink SER4 | |
| GMK NucBox 2 | |
| Beelink SEi8 | |
| AIDA64 / CPU Queen | |
| Beelink SER4 | |
| Intel NUC8i7BE | |
| Intel NUC11TNKi5 | |
| GMK NucBox 2 | |
| Beelink SEi8 | |
| AIDA64 / FPU SinJulia | |
| Beelink SER4 | |
| Intel NUC8i7BE | |
| Intel NUC11TNKi5 | |
| GMK NucBox 2 | |
| Beelink SEi8 | |
| AIDA64 / FPU Mandel | |
| Beelink SER4 | |
| Intel NUC11TNKi5 | |
| Intel NUC8i7BE | |
| GMK NucBox 2 | |
| Beelink SEi8 | |
| AIDA64 / CPU AES | |
| Intel NUC11TNKi5 | |
| Beelink SER4 | |
| Intel NUC8i7BE | |
| GMK NucBox 2 | |
| Beelink SEi8 | |
| AIDA64 / CPU ZLib | |
| Beelink SER4 | |
| Intel NUC11TNKi5 | |
| Intel NUC8i7BE | |
| GMK NucBox 2 | |
| Beelink SEi8 | |
| AIDA64 / FP64 Ray-Trace | |
| Beelink SER4 | |
| Intel NUC11TNKi5 | |
| Intel NUC8i7BE | |
| GMK NucBox 2 | |
| Beelink SEi8 | |
| AIDA64 / CPU PhotoWorxx | |
| Beelink SER4 | |
| Intel NUC8i7BE | |
| Intel NUC11TNKi5 | |
| Beelink SEi8 | |
| GMK NucBox 2 | |
Performance du système
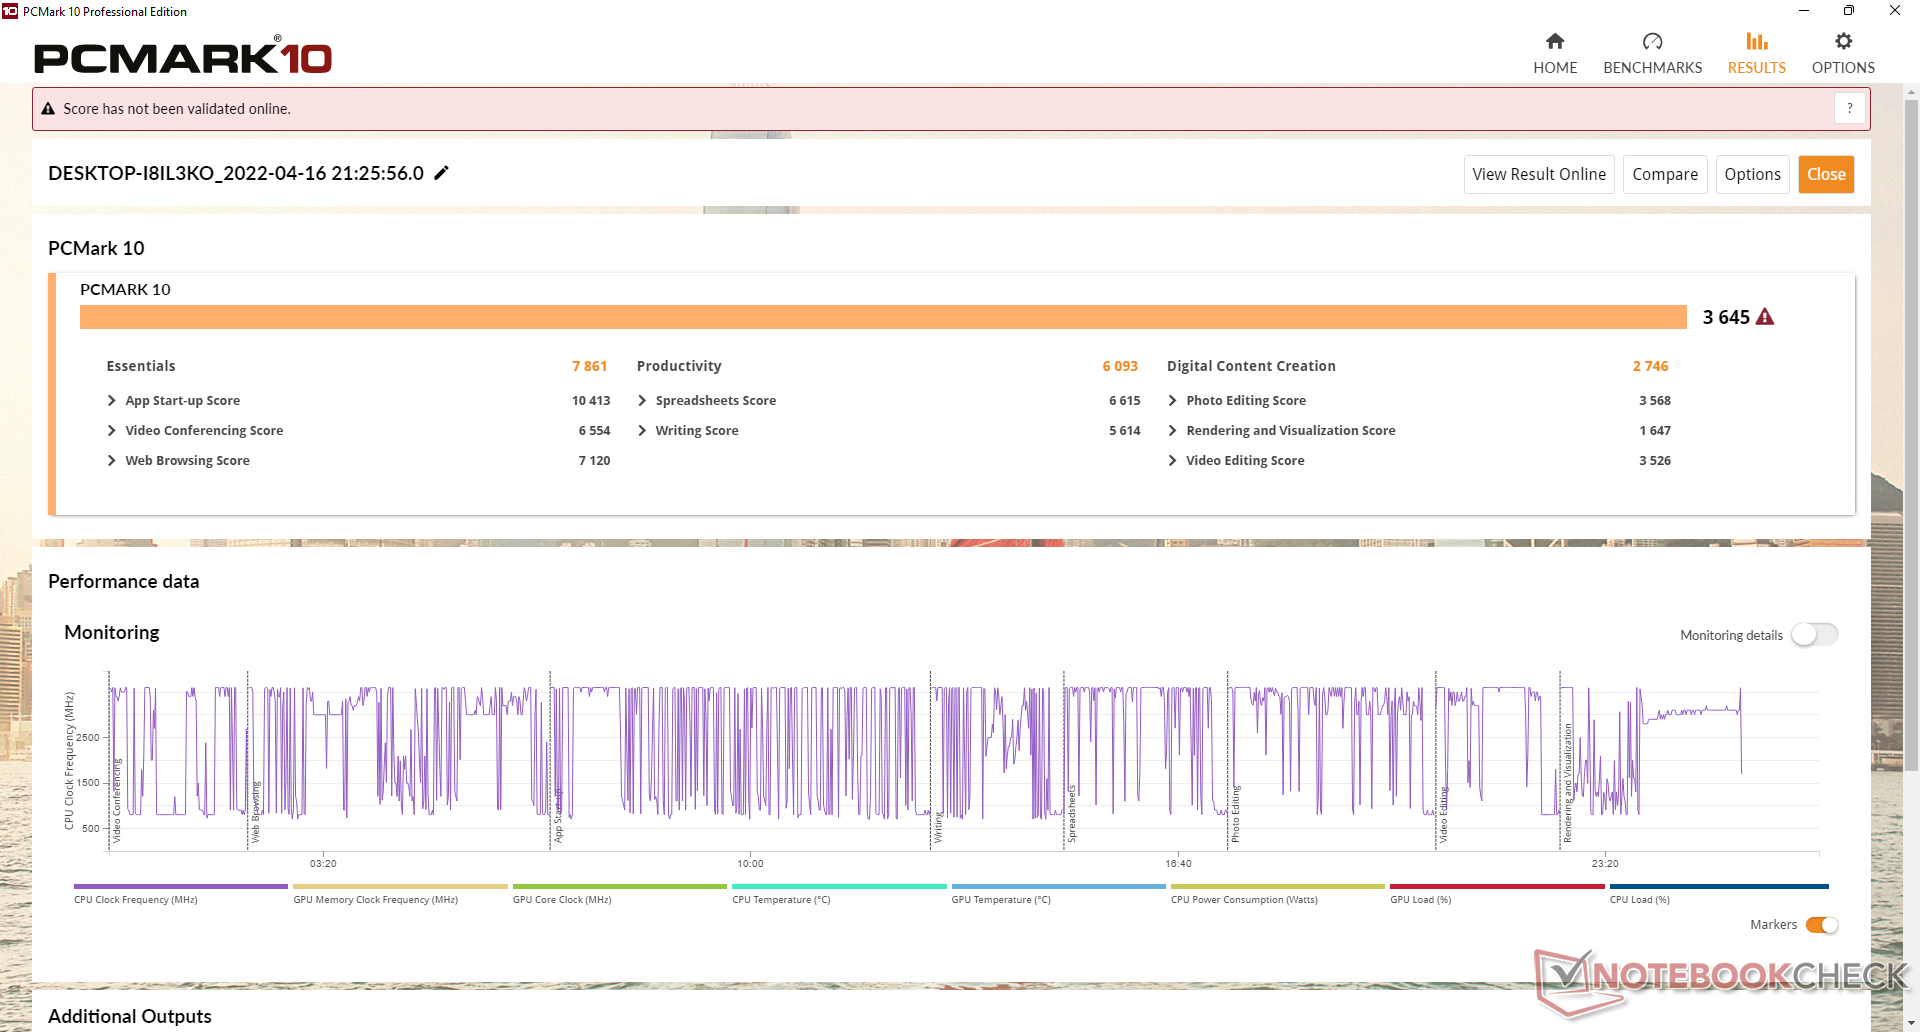
Les résultats de PCMark sont légèrement supérieurs à ceux du SEi10, probablement en raison des graphiques Iris intégrés plus rapides de notre SEi8. Nous n'avons rencontré aucun problème avec Windows 11 Pro sur notre unité de test, à part un ralentissement occasionnel lors du lancement d'applications ou pendant un multitâche modéré.
| PCMark 10 / Score | |
| Beelink SER4 | |
| Intel NUC8i7BE | |
| Intel NUC11TNKi5 | |
| GMK NucBox 2 | |
| Beelink SEi8 | |
| Beelink SEi10 | |
| PCMark 10 / Essentials | |
| Beelink SER4 | |
| Intel NUC11TNKi5 | |
| Intel NUC8i7BE | |
| GMK NucBox 2 | |
| Beelink SEi8 | |
| Beelink SEi10 | |
| PCMark 10 / Productivity | |
| Beelink SER4 | |
| Intel NUC8i7BE | |
| GMK NucBox 2 | |
| Intel NUC11TNKi5 | |
| Beelink SEi8 | |
| Beelink SEi10 | |
| PCMark 10 / Digital Content Creation | |
| Beelink SER4 | |
| Intel NUC11TNKi5 | |
| Intel NUC8i7BE | |
| GMK NucBox 2 | |
| Beelink SEi8 | |
| Beelink SEi10 | |
| PCMark 10 Score | 3645 points | |
Aide | ||
| AIDA64 / Memory Copy | |
| Intel NUC8i7BE | |
| GMK NucBox 2 | |
| Beelink SER4 | |
| Beelink SEi8 | |
| Intel NUC11TNKi5 | |
| AIDA64 / Memory Read | |
| Intel NUC8i7BE | |
| Beelink SER4 | |
| GMK NucBox 2 | |
| Beelink SEi8 | |
| Intel NUC11TNKi5 | |
| AIDA64 / Memory Write | |
| Intel NUC8i7BE | |
| GMK NucBox 2 | |
| Beelink SER4 | |
| Intel NUC11TNKi5 | |
| Beelink SEi8 | |
| AIDA64 / Memory Latency | |
| Beelink SER4 | |
| Intel NUC11TNKi5 | |
| Beelink SEi8 | |
| GMK NucBox 2 | |
| Intel NUC8i7BE | |
* ... Moindre est la valeur, meilleures sont les performances
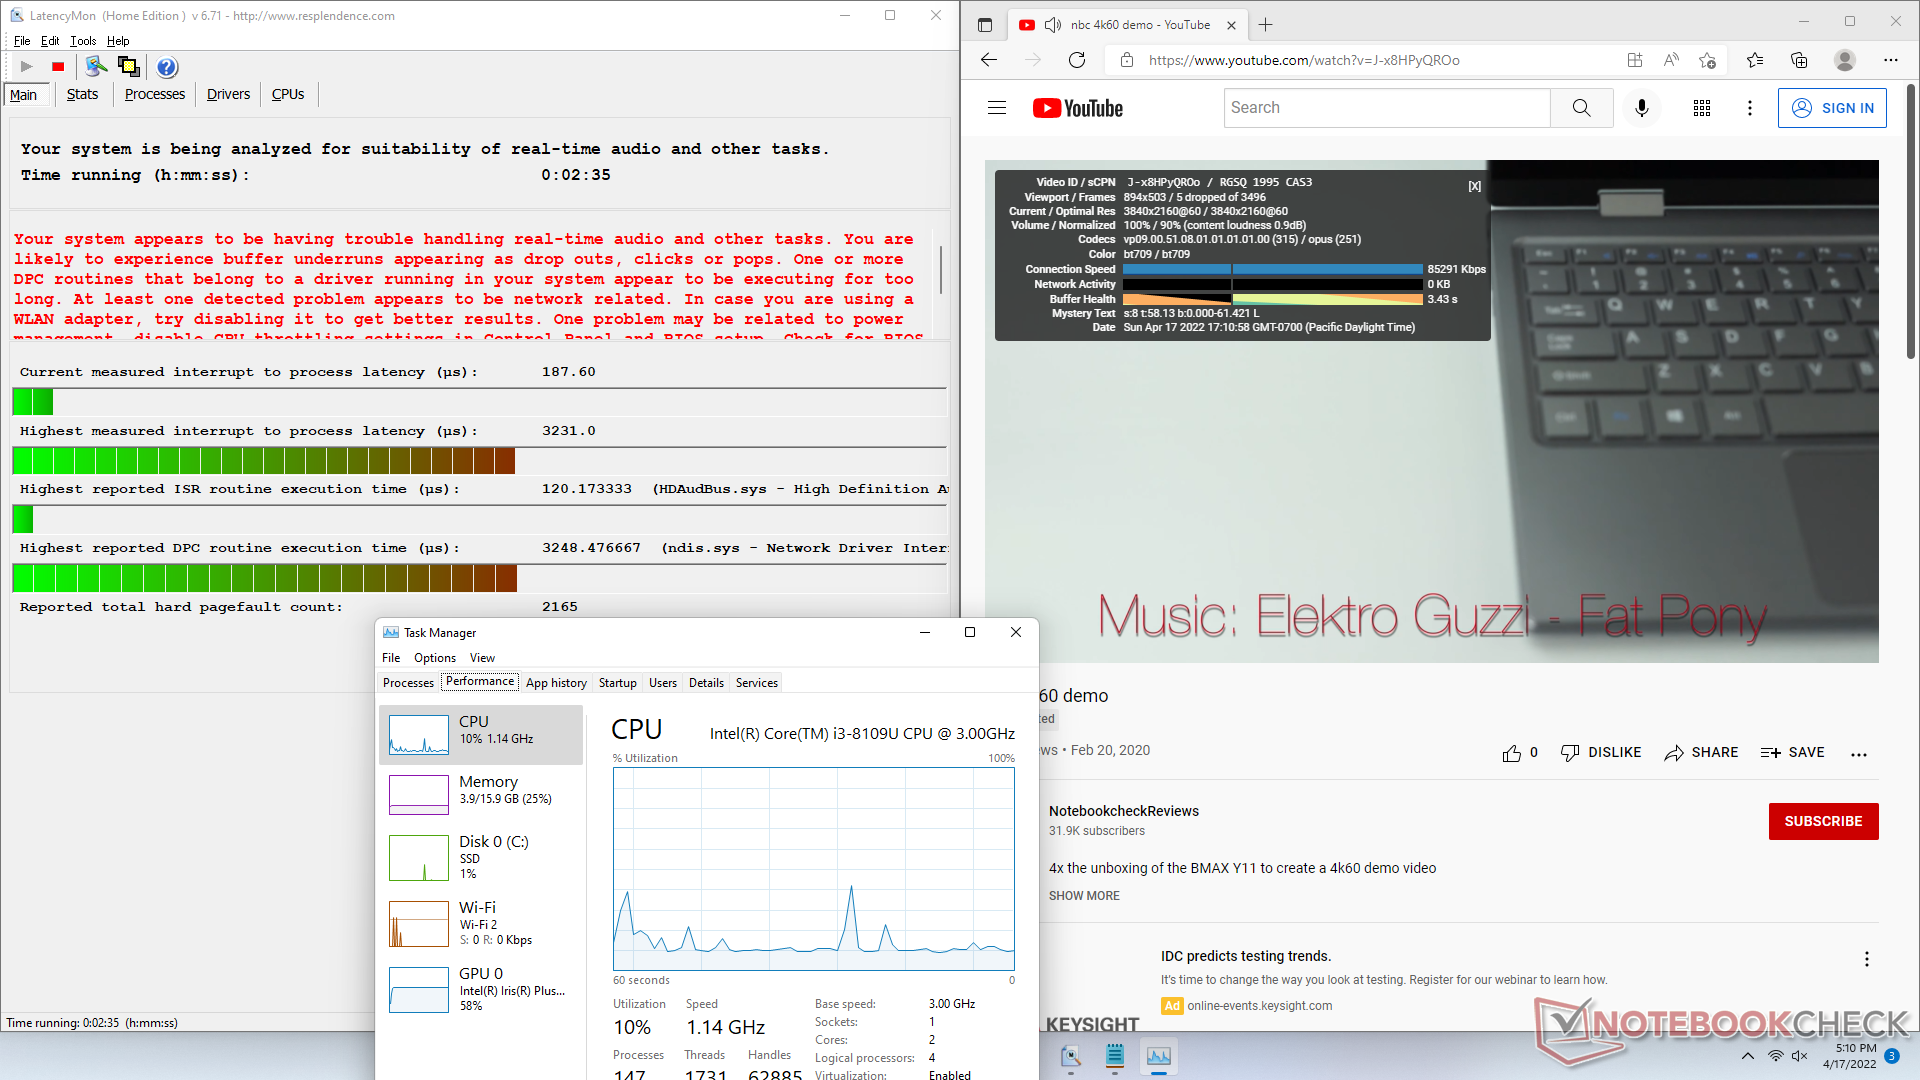
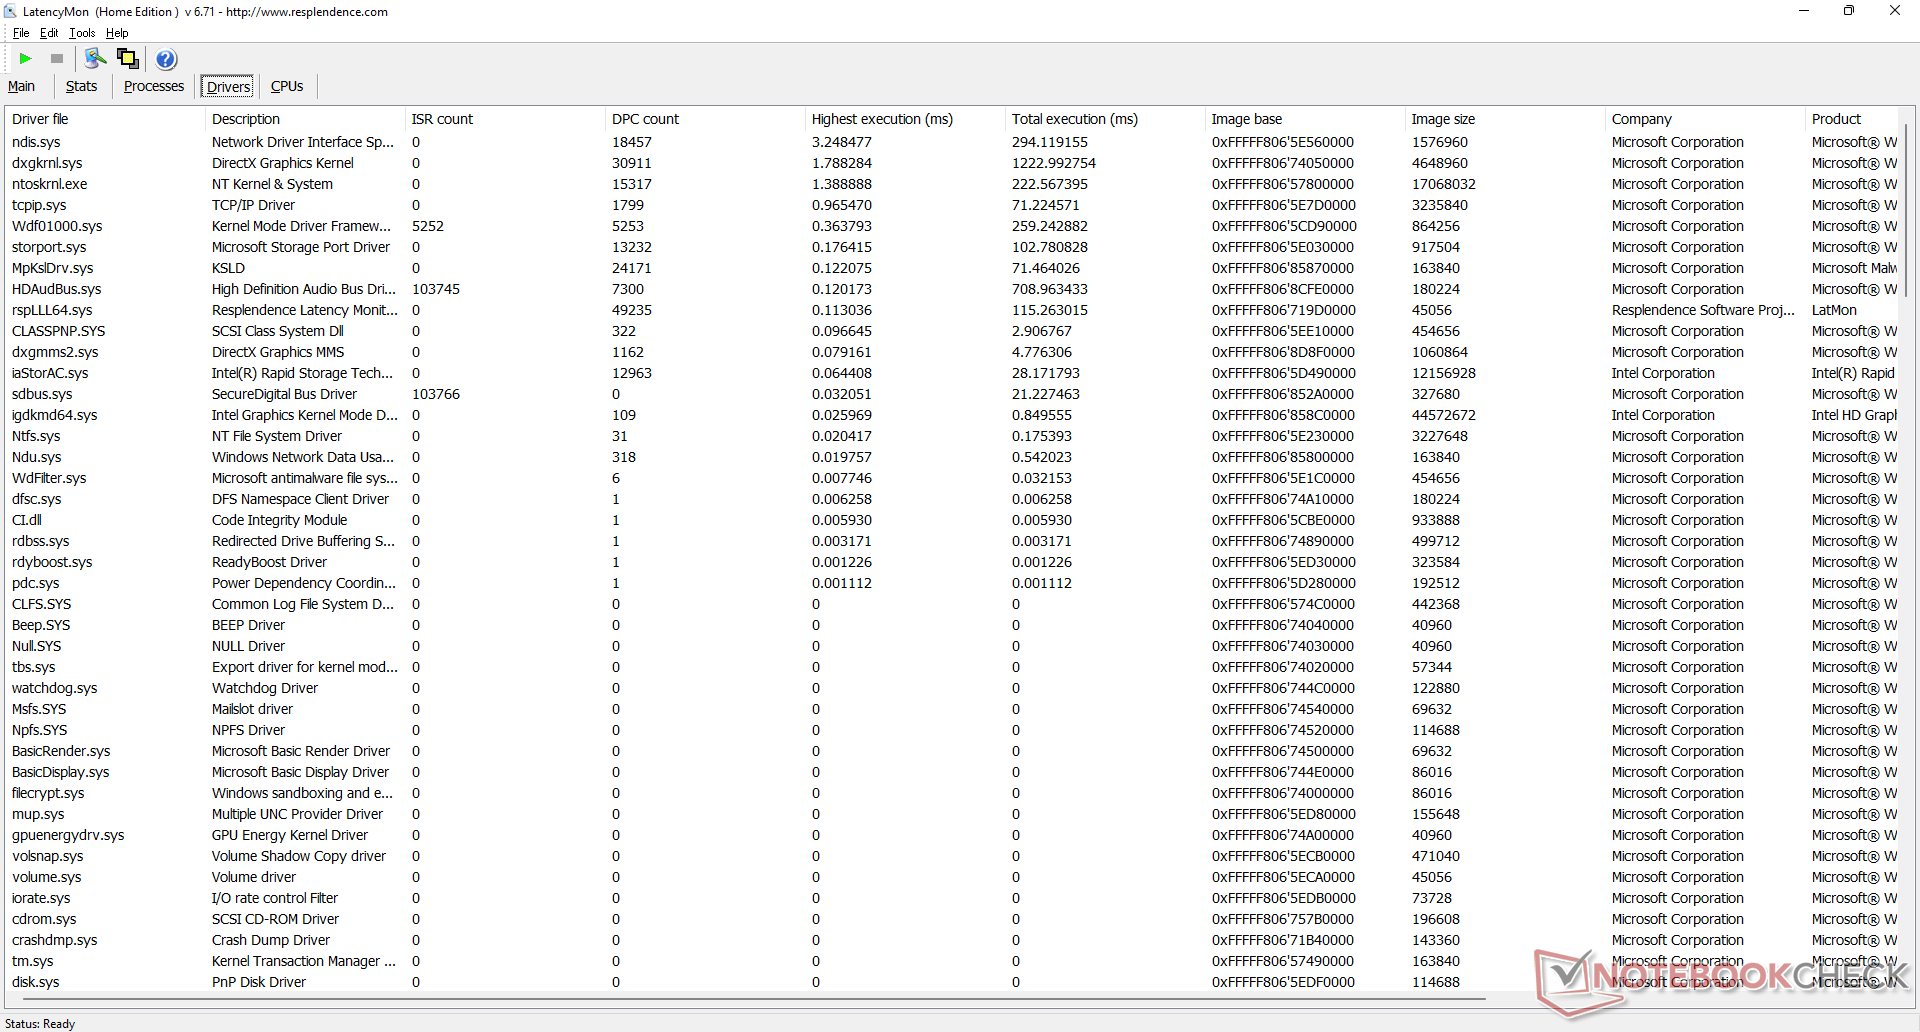
Latence DPC
LatencyMon révèle des problèmes de CPD lors de l'ouverture de plusieurs onglets de navigateur sur notre page d'accueil. la lecture de vidéos 4K est généralement fluide, avec seulement 5 images perdues pendant notre test vidéo d'une minute.
| DPC Latencies / LatencyMon - interrupt to process latency (max), Web, Youtube, Prime95 | |
| Beelink SEi8 | |
| Beelink SEi10 | |
| GMK NucBox 2 | |
| Intel NUC11TNKi5 | |
| Beelink SER4 | |
* ... Moindre est la valeur, meilleures sont les performances
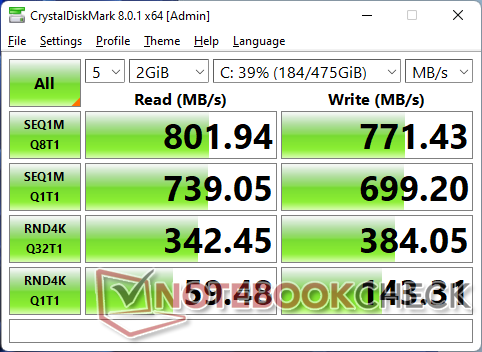
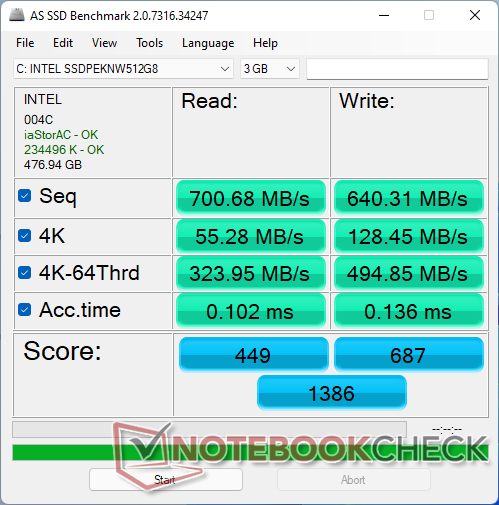
Périphériques de stockage
Notre unité est configurée avec un SSD 512 GB Intel 660p NVMe SSD. Bien que le disque lui-même soit capable d'atteindre des taux de lecture et d'écriture séquentiels allant jusqu'à 1500 Mo/s et 1000 Mo/s, respectivement, nous ne sommes en mesure d'enregistrer que des maximums de 800 Mo/s sur notre SEi8.

| Drive Performance rating - Percent | |
| Beelink SER4 | |
| GMK NucBox 2 | |
| Beelink SEi8 | |
| Beelink SEi10 | |
| Intel NUC11TNKi5 | |
| DiskSpd | |
| seq read | |
| GMK NucBox 2 | |
| Beelink SER4 | |
| Beelink SEi10 | |
| Beelink SEi8 | |
| Intel NUC11TNKi5 | |
| seq write | |
| GMK NucBox 2 | |
| Beelink SER4 | |
| Beelink SEi10 | |
| Beelink SEi8 | |
| Intel NUC11TNKi5 | |
| seq q8 t1 read | |
| GMK NucBox 2 | |
| Beelink SEi10 | |
| Beelink SER4 | |
| Beelink SEi8 | |
| Intel NUC11TNKi5 | |
| seq q8 t1 write | |
| GMK NucBox 2 | |
| Beelink SER4 | |
| Beelink SEi10 | |
| Beelink SEi8 | |
| Intel NUC11TNKi5 | |
| 4k q1 t1 read | |
| Beelink SER4 | |
| Beelink SEi8 | |
| Beelink SEi10 | |
| GMK NucBox 2 | |
| Intel NUC11TNKi5 | |
| 4k q1 t1 write | |
| Beelink SER4 | |
| Beelink SEi10 | |
| GMK NucBox 2 | |
| Beelink SEi8 | |
| Intel NUC11TNKi5 | |
| 4k q32 t16 read | |
| Beelink SEi10 | |
| Beelink SEi8 | |
| Beelink SER4 | |
| GMK NucBox 2 | |
| Intel NUC11TNKi5 | |
| 4k q32 t16 write | |
| Beelink SER4 | |
| GMK NucBox 2 | |
| Beelink SEi8 | |
| Beelink SEi10 | |
| Intel NUC11TNKi5 | |
| AS SSD | |
| Score Total | |
| Beelink SER4 | |
| GMK NucBox 2 | |
| Beelink SEi8 | |
| Beelink SEi10 | |
| Intel NUC11TNKi5 | |
| Score Read | |
| GMK NucBox 2 | |
| Beelink SER4 | |
| Beelink SEi10 | |
| Beelink SEi8 | |
| Intel NUC11TNKi5 | |
| Score Write | |
| Beelink SER4 | |
| Beelink SEi8 | |
| GMK NucBox 2 | |
| Intel NUC11TNKi5 | |
| Beelink SEi10 | |
| Seq Read | |
| GMK NucBox 2 | |
| Beelink SER4 | |
| Beelink SEi10 | |
| Beelink SEi8 | |
| Intel NUC11TNKi5 | |
| Seq Write | |
| GMK NucBox 2 | |
| Beelink SER4 | |
| Beelink SEi8 | |
| Intel NUC11TNKi5 | |
| Beelink SEi10 | |
| 4K Read | |
| Beelink SER4 | |
| Beelink SEi8 | |
| GMK NucBox 2 | |
| Beelink SEi10 | |
| Intel NUC11TNKi5 | |
| 4K Write | |
| Beelink SER4 | |
| GMK NucBox 2 | |
| Beelink SEi8 | |
| Beelink SEi10 | |
| Intel NUC11TNKi5 | |
| 4K-64 Read | |
| GMK NucBox 2 | |
| Beelink SEi10 | |
| Beelink SEi8 | |
| Beelink SER4 | |
| Intel NUC11TNKi5 | |
| 4K-64 Write | |
| Beelink SER4 | |
| Beelink SEi8 | |
| GMK NucBox 2 | |
| Intel NUC11TNKi5 | |
| Beelink SEi10 | |
| Access Time Read | |
| Intel NUC11TNKi5 | |
| Beelink SEi8 | |
| Beelink SER4 | |
| Beelink SEi10 | |
| GMK NucBox 2 | |
| Access Time Write | |
| Beelink SEi10 | |
| GMK NucBox 2 | |
| Intel NUC11TNKi5 | |
| Beelink SER4 | |
| Beelink SEi8 | |
* ... Moindre est la valeur, meilleures sont les performances
Disk Throttling: DiskSpd Read Loop, Queue Depth 8
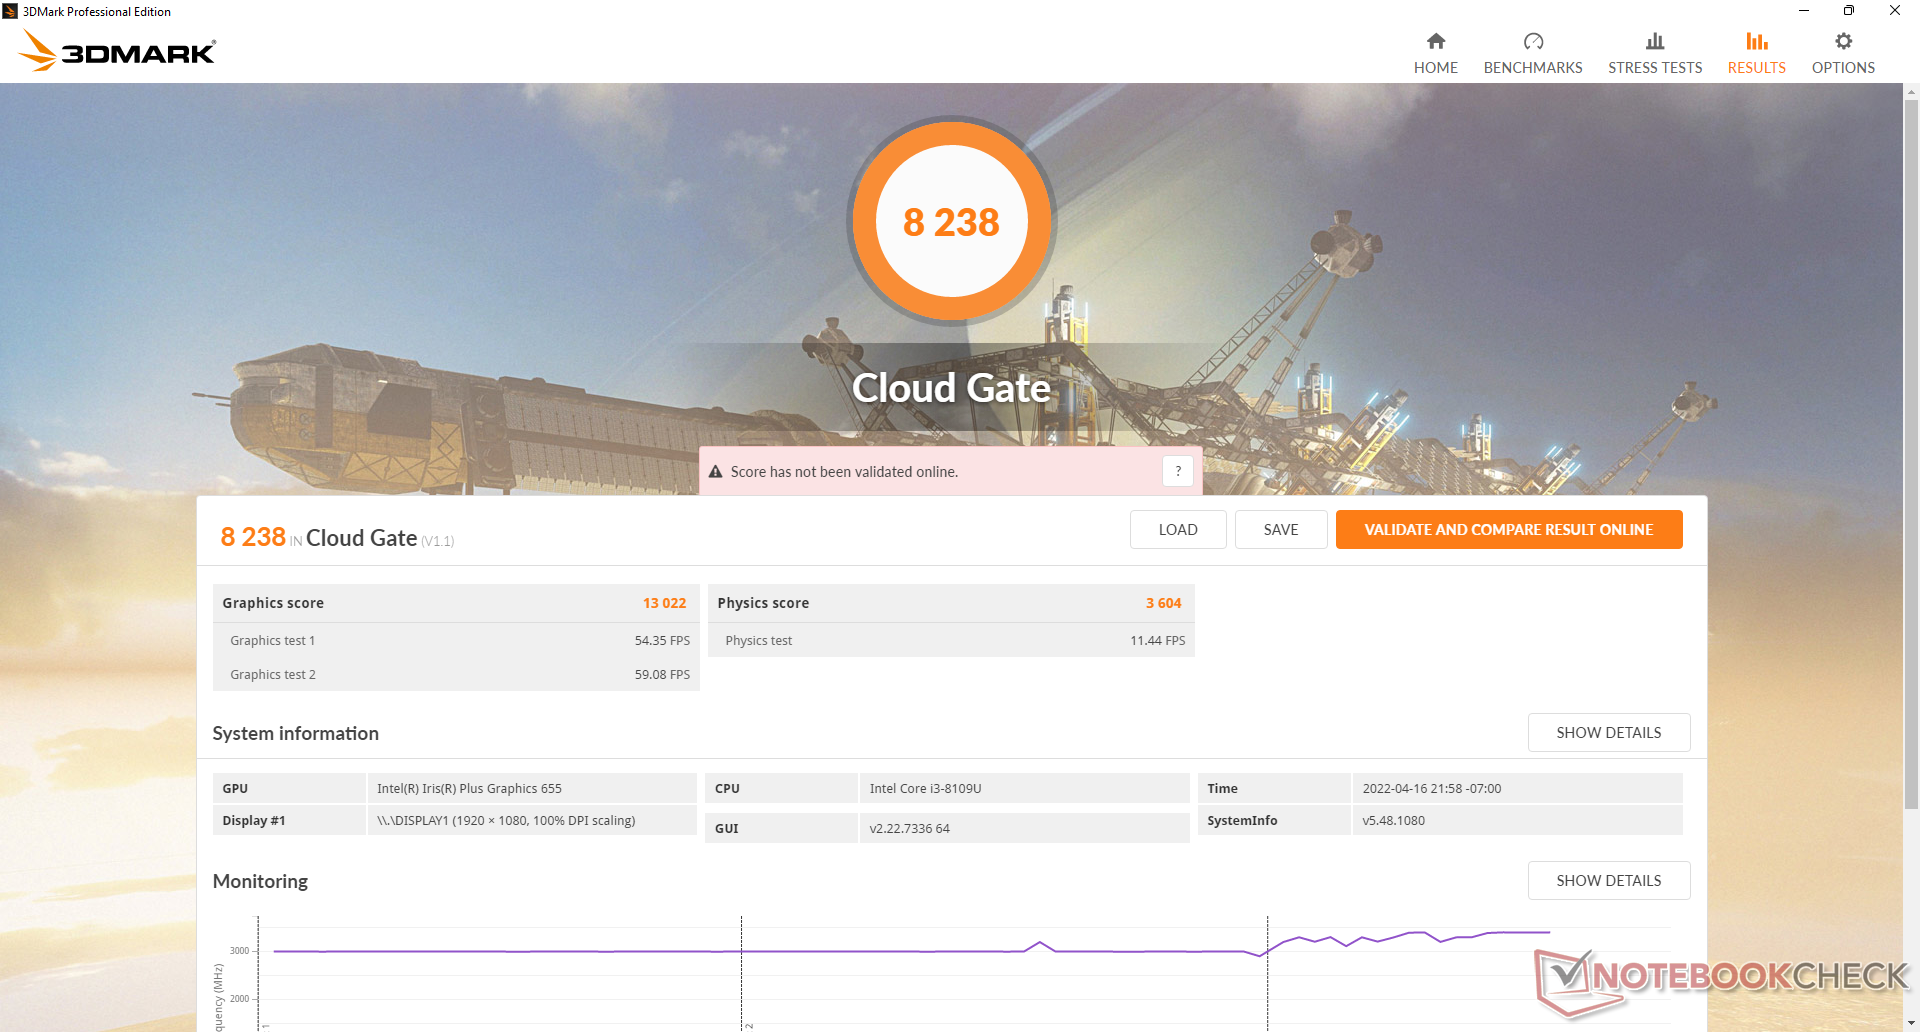
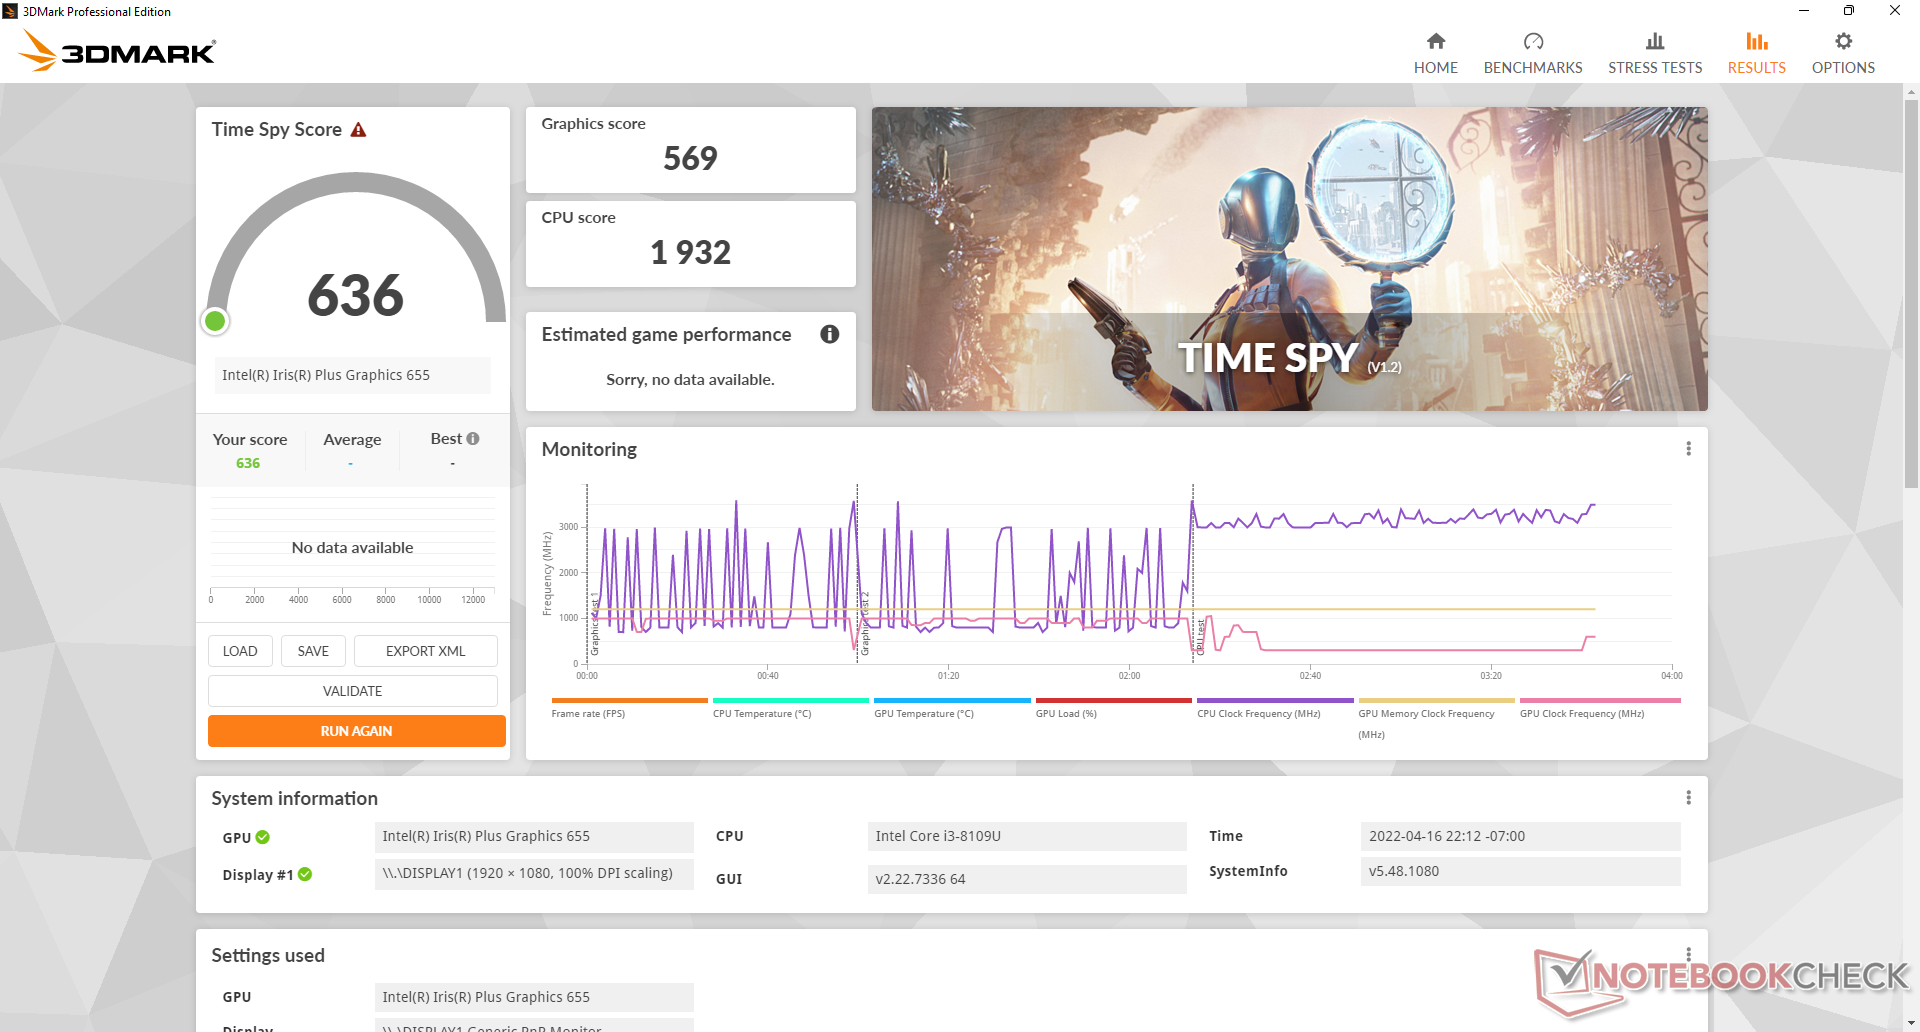
Performances du GPU
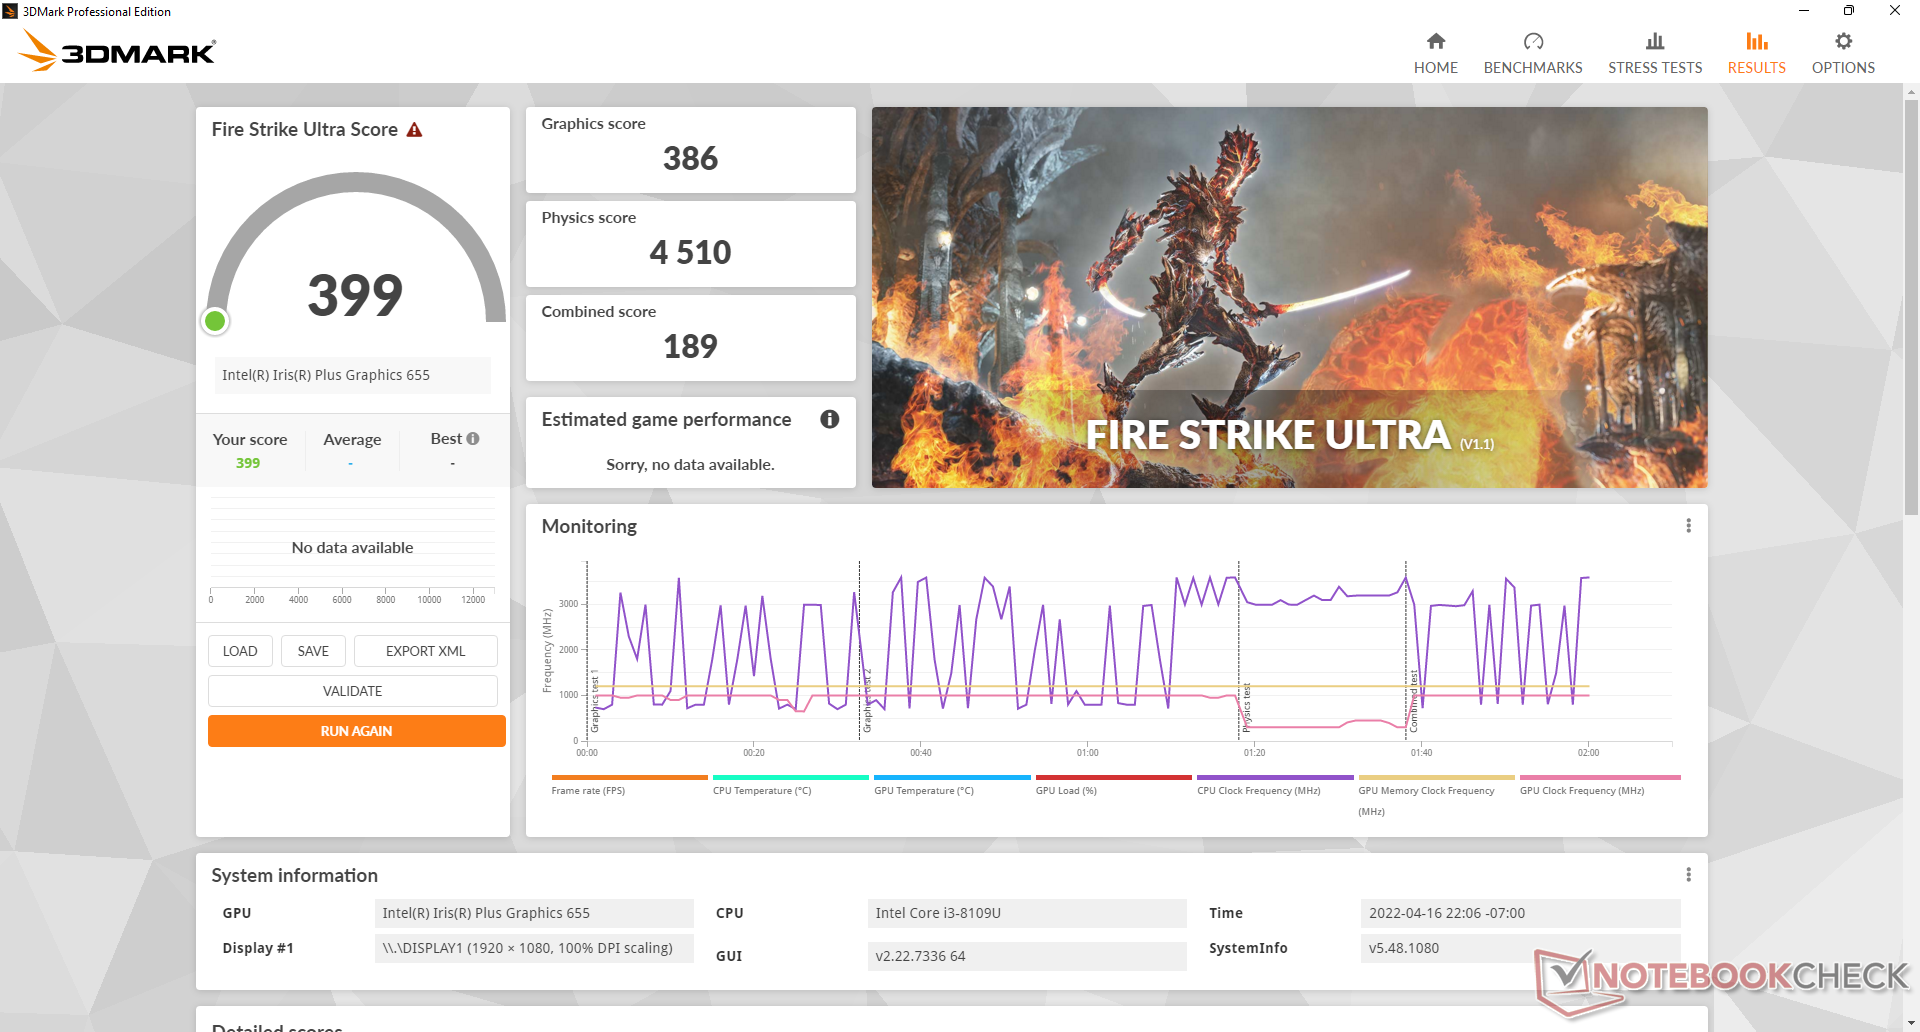
Les performances graphiques brutes de l Iris Plus 655 sont environ 40 à 50 % plus rapides que celles de la carte moyenne UHD Graphics 620 que l'on trouve sur de nombreux anciens mini-PC alimentés par Intel avant la 10e génération Ice Lake. L'augmentation des performances est respectable pour des tâches comme le streaming et la lecture de vidéos 4K, mais elle est loin d'être suffisante pour les jeux Witcher 3par exemple, notre unité de test a eu des difficultés à lancer le jeu, même après avoir mis à jour tous les pilotes Windows et graphiques
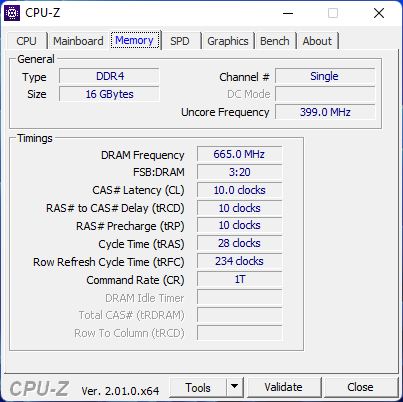
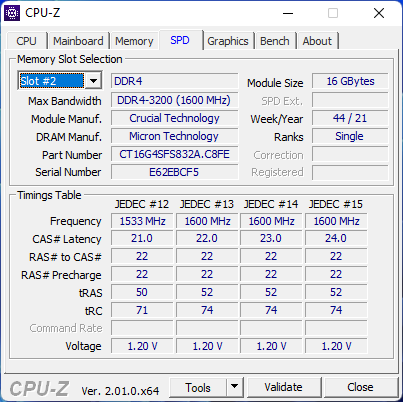
Notre unité de test étant livrée avec une mémoire à un seul canal, les résultats seront probablement plus rapides que ceux que nous avons enregistrés ci-dessous si elle est configurée avec une mémoire à deux canaux.
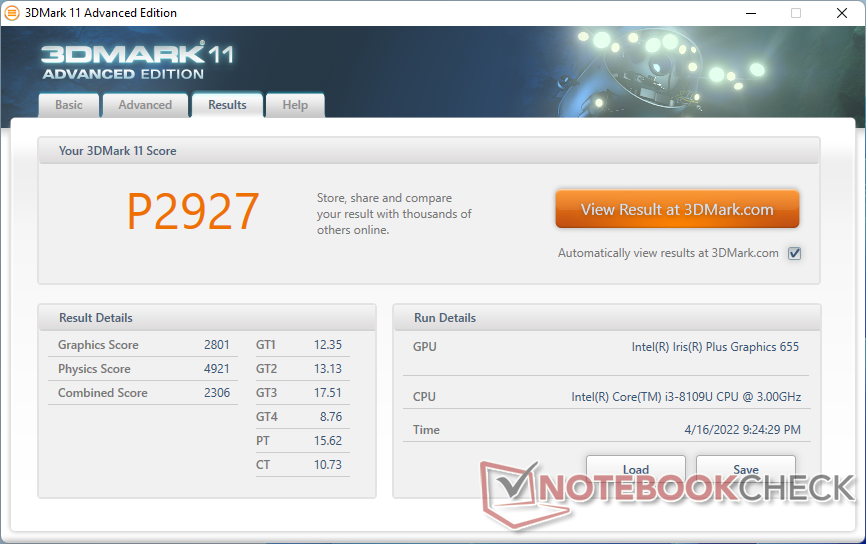
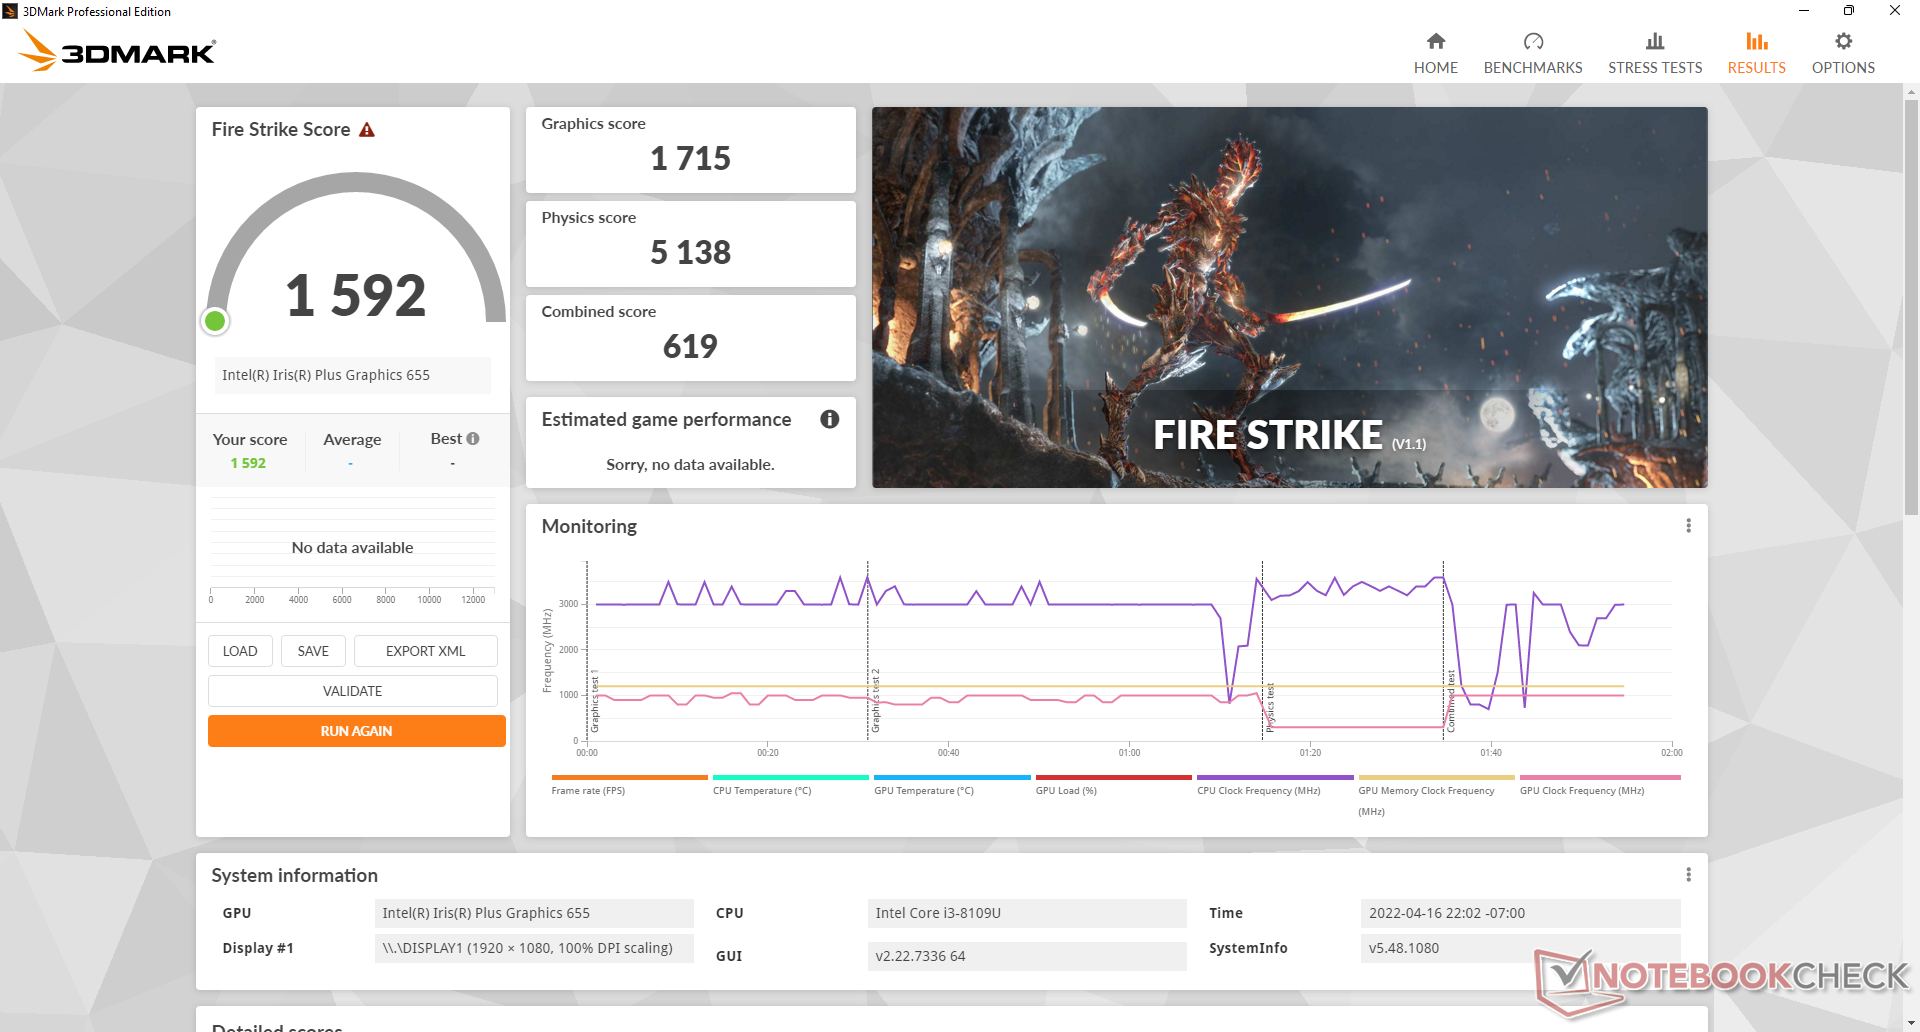
| 3DMark 11 Performance | 2927 points | |
| 3DMark Cloud Gate Standard Score | 8238 points | |
| 3DMark Fire Strike Score | 1592 points | |
| 3DMark Time Spy Score | 636 points | |
Aide | ||
| Final Fantasy XV Benchmark | |
| 1280x720 Lite Quality | |
| Beelink SER4 | |
| Intel NUC11TNKi5 | |
| GMK NucBox 2 | |
| Intel NUC8i7BE | |
| Beelink SEi8 | |
| Moyenne Intel Iris Plus Graphics 655 (9.11 - 18.1, n=8) | |
| Beelink U59 | |
| GMK NucBox 3 | |
| 1920x1080 Standard Quality | |
| Beelink SER4 | |
| Intel NUC11TNKi5 | |
| GMK NucBox 2 | |
| Moyenne Intel Iris Plus Graphics 655 (7.88 - 9.73, n=4) | |
| Beelink SEi8 | |
| 1920x1080 High Quality | |
| Beelink SER4 | |
| Intel NUC11TNKi5 | |
| Beelink SEi8 | |
| GMK NucBox 2 | |
| Moyenne Intel Iris Plus Graphics 655 (5.25 - 6.55, n=4) | |
| Bas | Moyen | Élevé | Ultra | |
|---|---|---|---|---|
| Dota 2 Reborn (2015) | 94.4 | 34.6 | 25.3 | 22.7 |
| Final Fantasy XV Benchmark (2018) | 16.6 | 8.8 | 6.08 | |
| X-Plane 11.11 (2018) | 22.4 | 15 | 12.3 |
Émissions
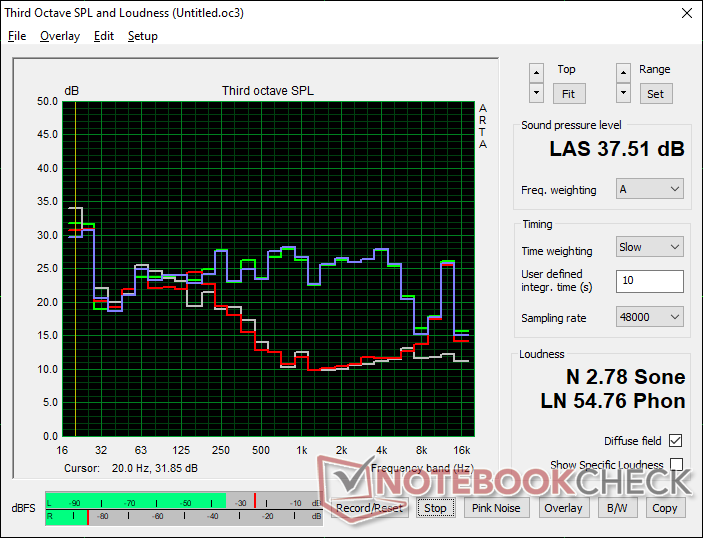
Bruit du système
Le bruit du ventilateur est en grande partie binaire dans le sens où les tours/minute ont tendance à fluctuer entre le minimum et le maximum avec très peu d'étapes entre les deux. En d'autres termes, attendez-vous à ce que le ventilateur passe de silencieux à bruyant assez fréquemment lorsque vous effectuez plusieurs tâches ou lancez des applications. Ce n'est pas aussi mauvais que sur les Beelink GTi11 series ou SER4 plus puissants, mais les changements de bruit du ventilateur sont néanmoins plus perceptibles et fréquents par rapport à un NUC.
Degré de la nuisance sonore
| Au repos |
| 26.5 / 26.5 / 31.1 dB(A) |
| Fortement sollicité |
| 37.7 / 37.5 dB(A) |
 | ||
30 dB silencieux 40 dB(A) audible 50 dB(A) bruyant |
||
min: | ||
| Beelink SEi8 Iris Plus Graphics 655, i3-8109U, Intel SSD 660p SSDPEKNW512G8 | Beelink SEi10 UHD Graphics G1 (Ice Lake 32 EU), i3-1005G1, Silicon Motion AZW 256G M.2280 NVMe 4X 200725 D | Beelink SER4 Vega 8, R7 4800U, Intel SSD 660p SSDPEKNW512G8 | Intel NUC11TNKi5 Iris Xe G7 80EUs, i5-1135G7, Transcend M.2 SSD 430S TS512GMTS430S | Intel NUC8i7BE Iris Plus Graphics 655, i7-8559U | GMK NucBox 2 Iris Plus Graphics 655, i5-8259U, Netac S930E8/256GPN | |
|---|---|---|---|---|---|---|
| Noise | -17% | -11% | -18% | -9% | 5% | |
| arrêt / environnement * (dB) | 24.5 | 27.5 -12% | 23.4 4% | 24.8 -1% | 28.7 -17% | 25.6 -4% |
| Idle Minimum * (dB) | 26.5 | 30.9 -17% | 33.2 -25% | 35.6 -34% | 28.7 -8% | 25.7 3% |
| Idle Average * (dB) | 26.5 | 33.5 -26% | 33.2 -25% | 35.6 -34% | 29.3 -11% | 25.7 3% |
| Idle Maximum * (dB) | 31.1 | 33.5 -8% | 33.2 -7% | 35.6 -14% | 31.8 -2% | 25.7 17% |
| Load Average * (dB) | 37.7 | 38.5 -2% | 38.6 -2% | 36.2 4% | 39 -3% | 35.3 6% |
| Load Maximum * (dB) | 37.5 | 51.6 -38% | 40.8 -9% | 47.6 -27% | 41.4 -10% | 35.1 6% |
| Witcher 3 ultra * (dB) | 39.2 | 38 | 39 |
* ... Moindre est la valeur, meilleures sont les performances
Température
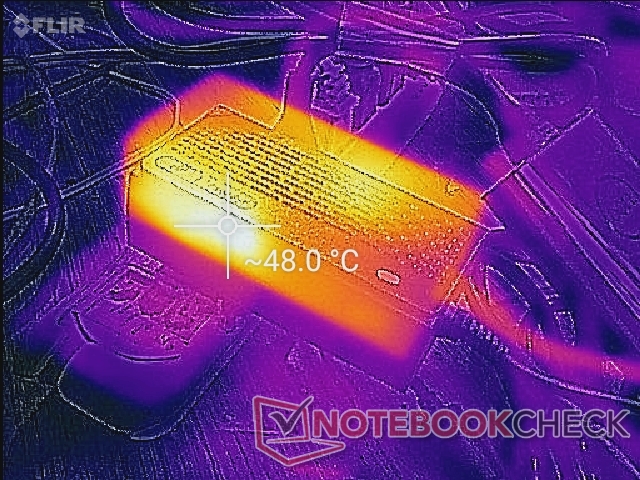
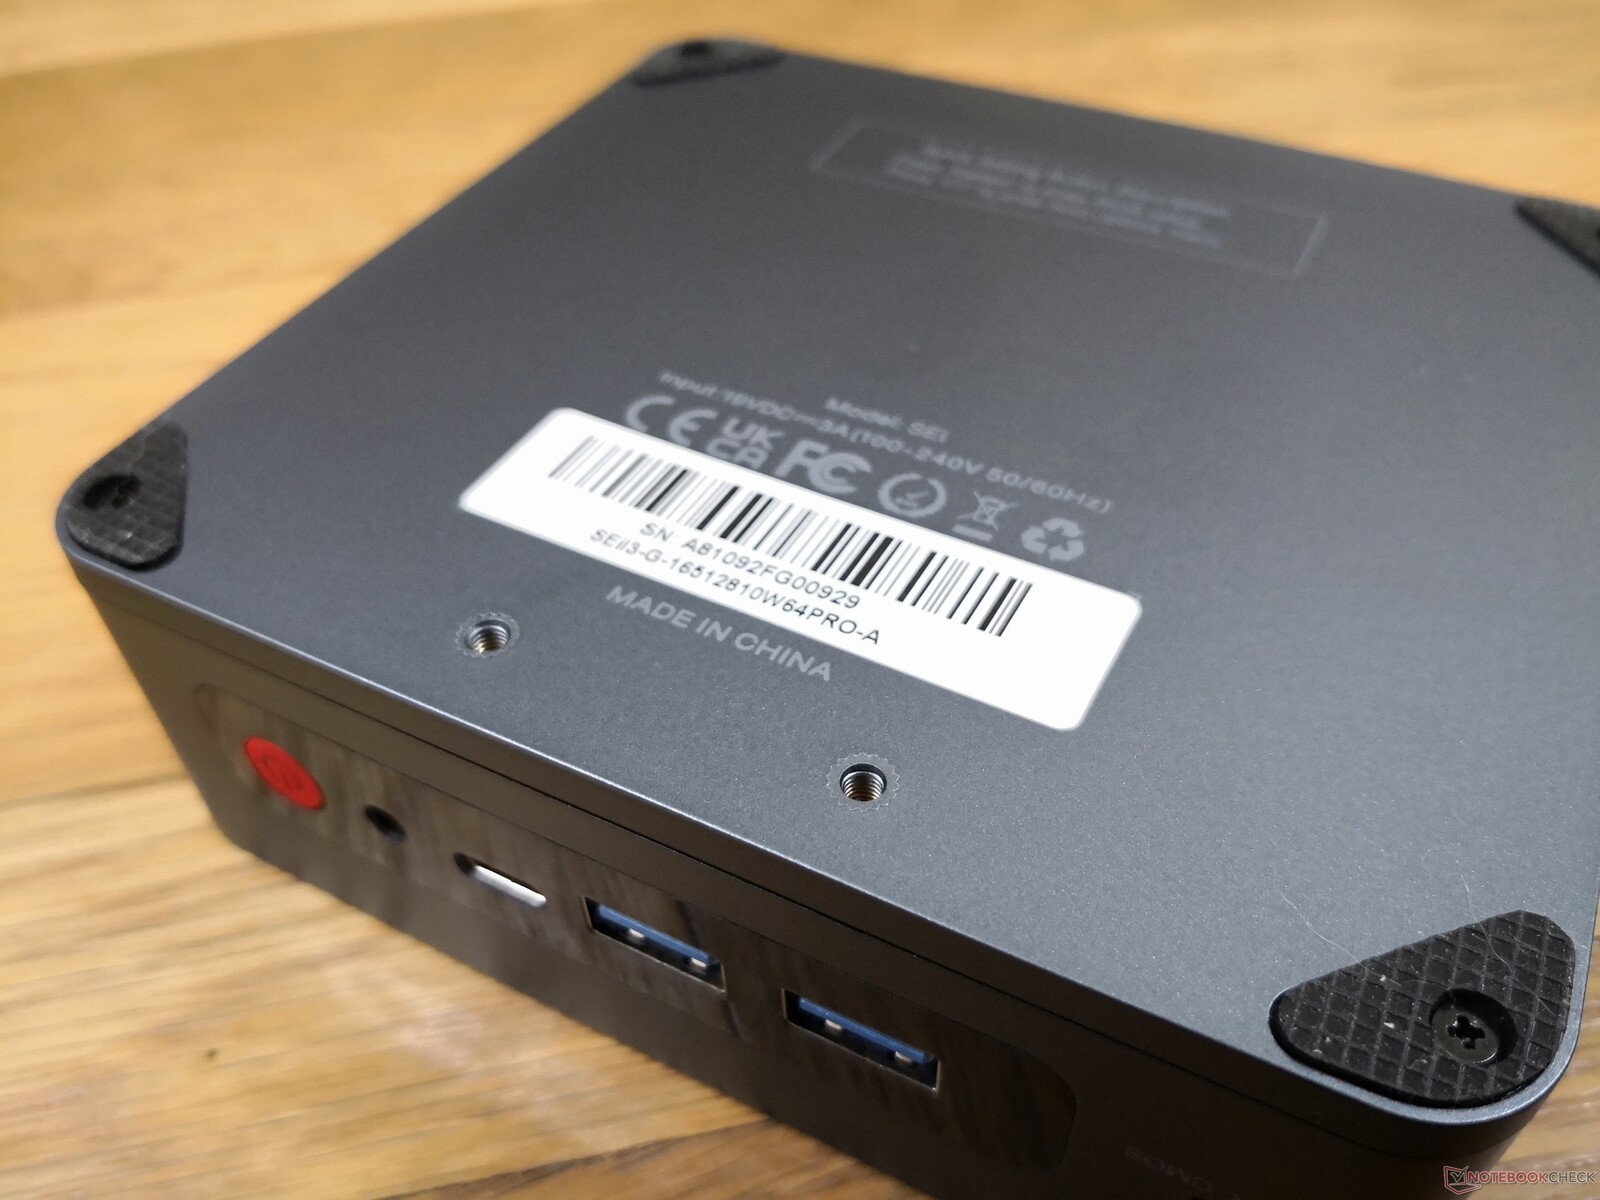
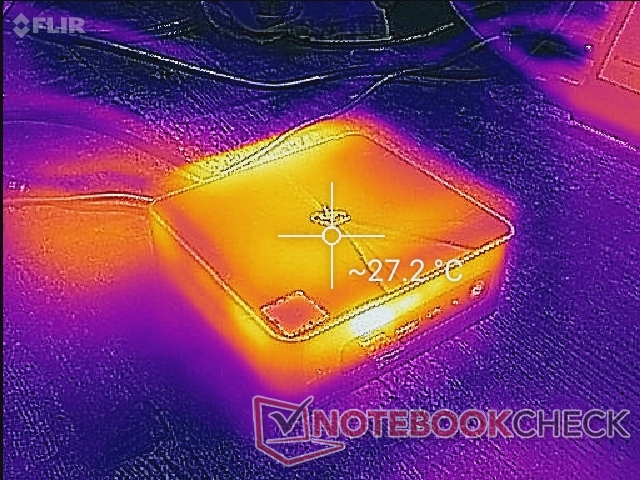
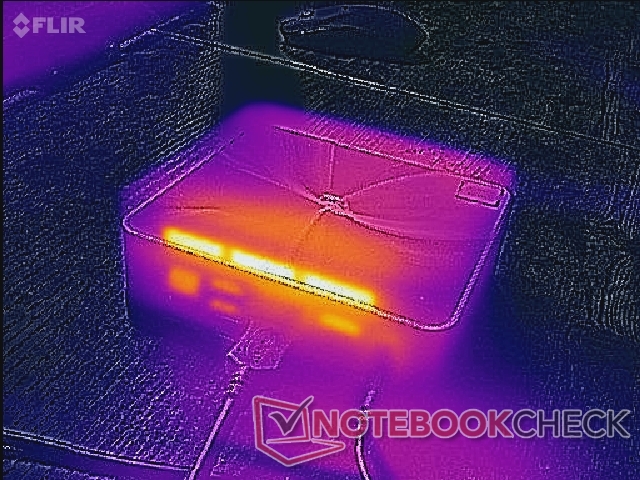
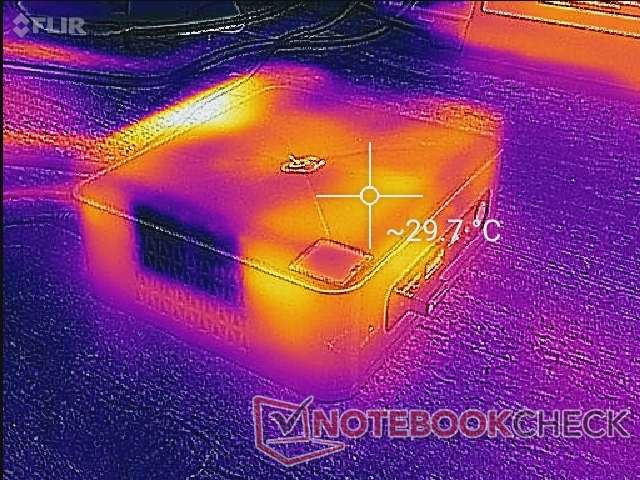
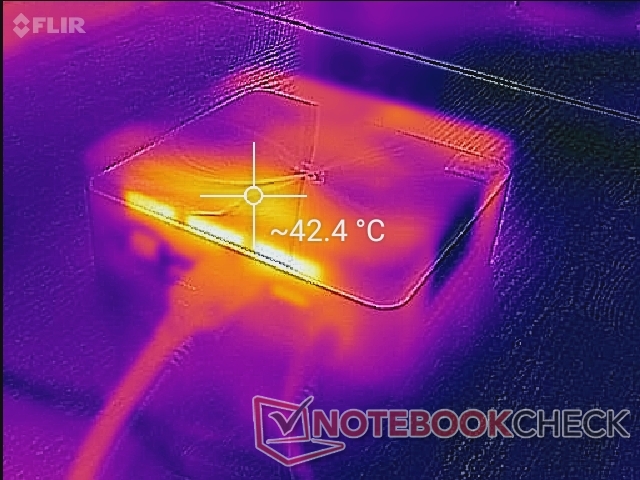
Contrairement au SER4, plus puissant, le SEi8 n'a pas de grilles de ventilation sur la surface supérieure et les utilisateurs peuvent donc placer en toute sécurité des papiers et autres objets sur le dessus sans que cela n'affecte le refroidissement. Les orifices d'admission d'air se trouvent uniquement le long des deux côtés du châssis. Le point chaud peut atteindre plus de 42 C sur le dessus le plus proche de l'arrière et à côté des grilles d'évacuation.
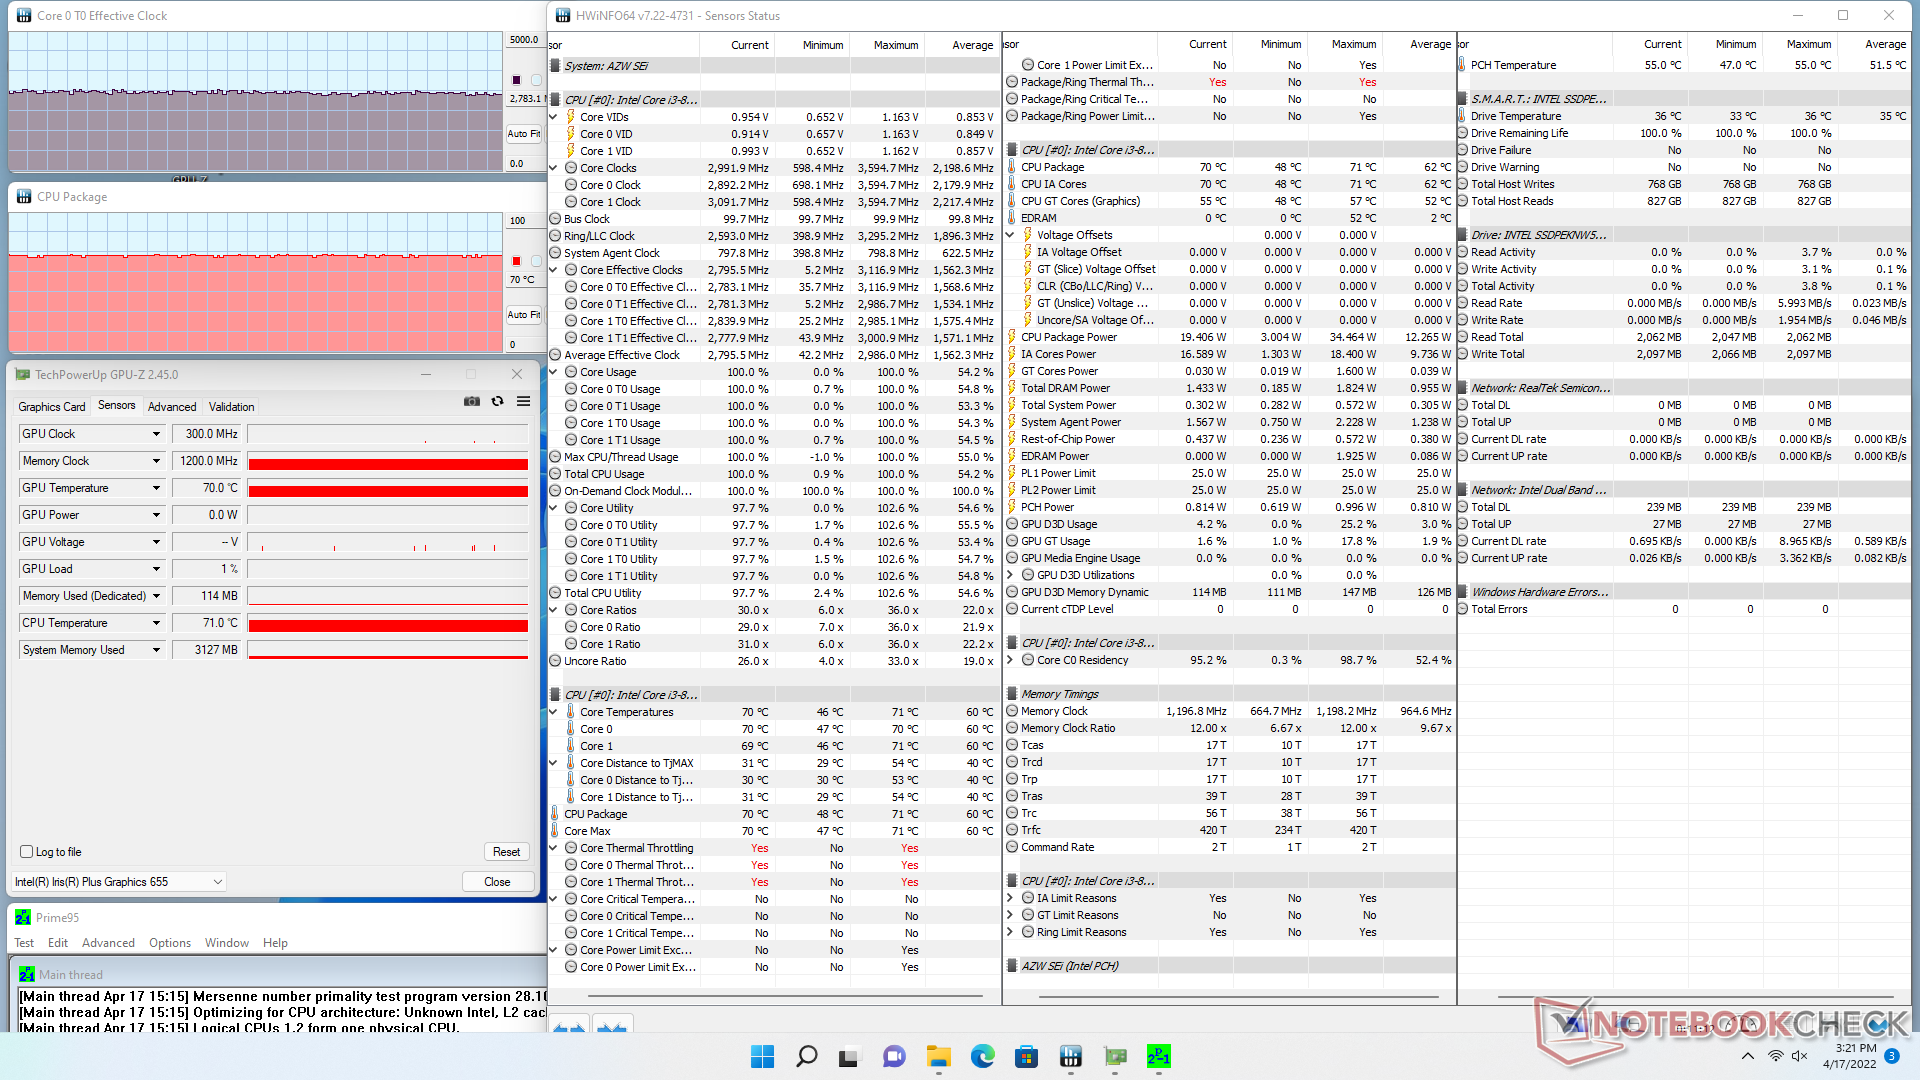
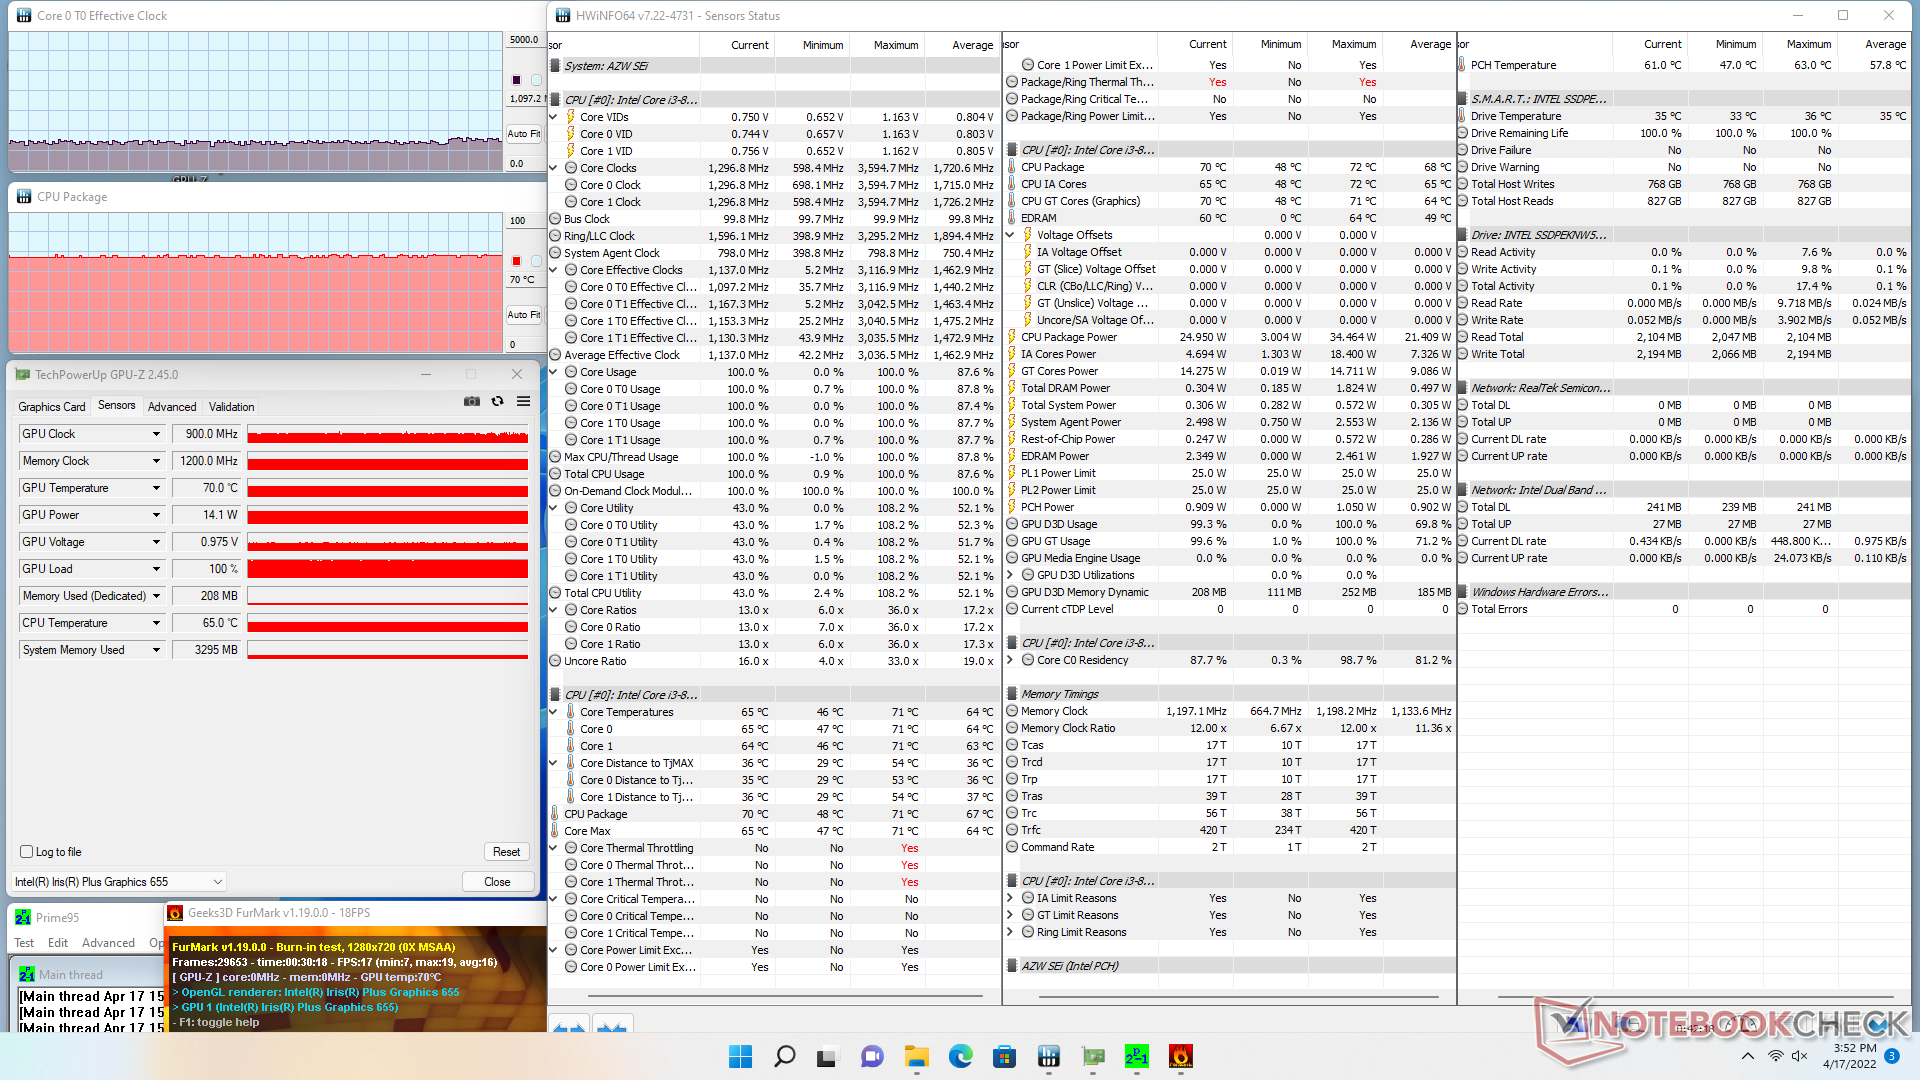
Test de stress
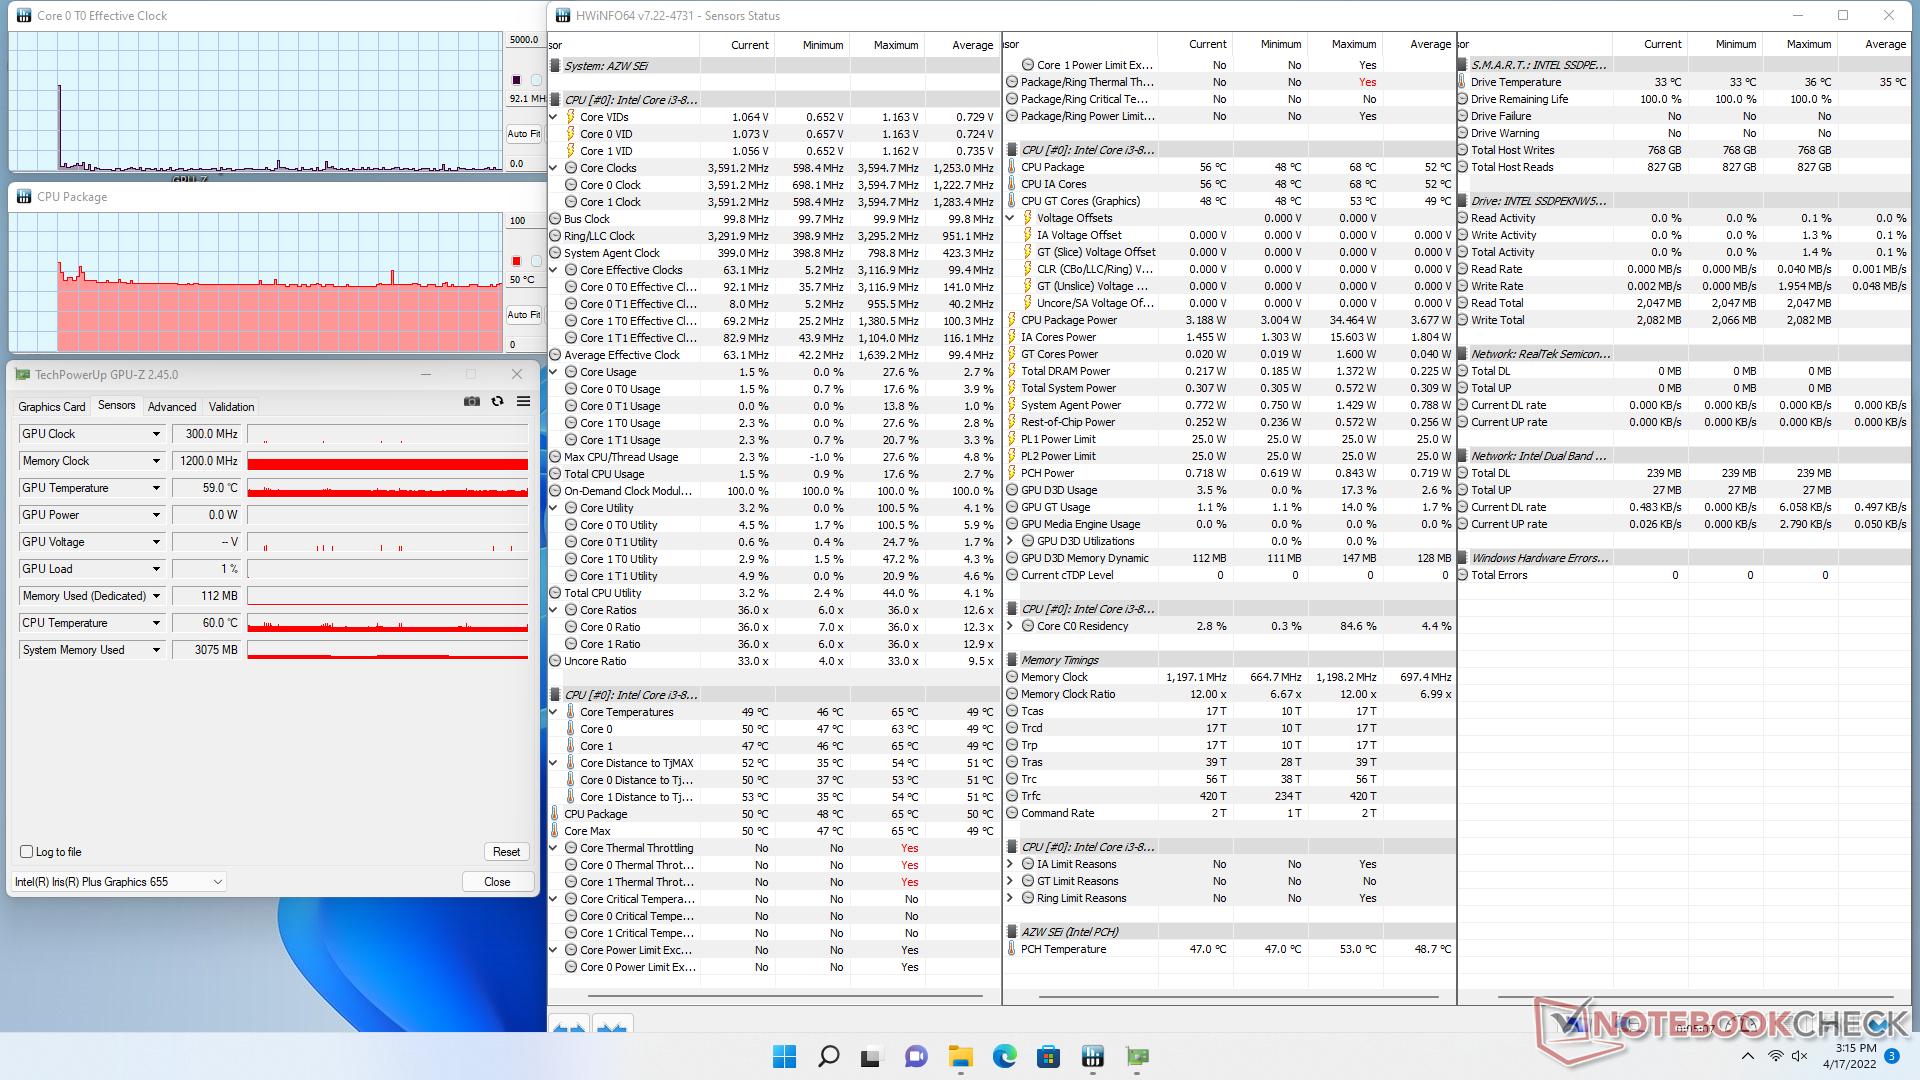
Lors de l'exécution de Prime95, le CPU montait jusqu'à 2,9 GHz avant de se stabiliser à 2,8 GHz et à 70 C. La puissance de l'ensemble du CPU atteignait également 34,4 W au début du test avant de baisser et de se stabiliser à 19,4 W. L'exécution de ce même test sur le SEi10 avec le tout nouveau Core i3-1005G1 de 10e génération, on observe des fréquences d'horloge plus élevées et des températures du cœur de 3,4 GHz et de 90 °C, respectivement.
| Fréquence du CPU (GHz) | Fréquence du GPU (MHz) | Température moyenne du CPU (°C) | |
| Système au repos | -- | -- | 50 |
| Prime95 Stress | 2.8 | -- | 70 |
| Prime95 + FurMark Stress | 1.1 | 900 | 70 |
Gestion de l'énergie
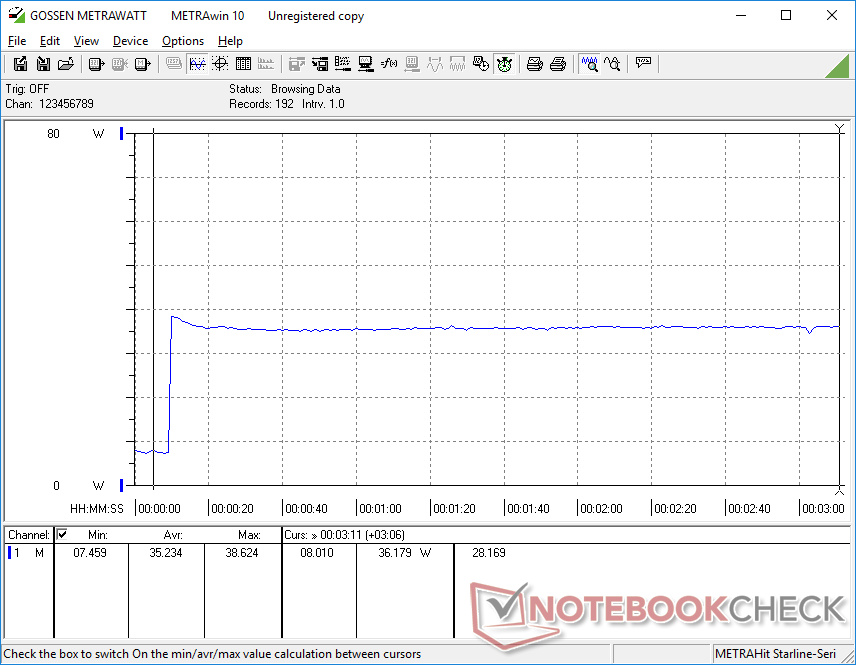
Consommation d'énergie
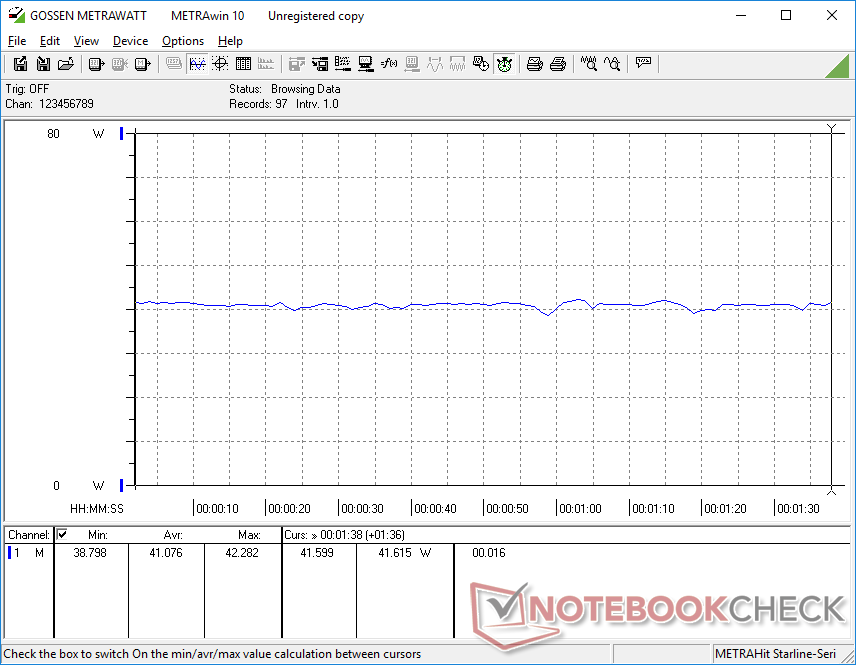
Le SEi8 consomme à peu près autant d'énergie que le NUC 11 équipé des nouveaux CPU de 11e génération, malgré les avantages en termes de performances de la série de CPU de 11e génération. Cela est dû au fait que la série de processeurs de 8e génération est beaucoup moins optimisée, notamment en termes de performances graphiques intégrées. Pour une meilleure performance par watt, les utilisateurs voudront plutôt considérer le SEi8 avec le Core i5-8279U ou la série SEi10.
Attendez-vous à ce que le système consomme un peu plus de 40 W lors de l'exécution de charges exigeantes.

| Éteint/en veille | |
| Au repos | |
| Fortement sollicité |
|
Légende:
min: | |
| Beelink SEi8 i3-8109U, Iris Plus Graphics 655, Intel SSD 660p SSDPEKNW512G8, , x, | Beelink SEi10 i3-1005G1, UHD Graphics G1 (Ice Lake 32 EU), Silicon Motion AZW 256G M.2280 NVMe 4X 200725 D, , x, | Beelink SER4 R7 4800U, Vega 8, Intel SSD 660p SSDPEKNW512G8, , x, | Intel NUC11TNKi5 i5-1135G7, Iris Xe G7 80EUs, Transcend M.2 SSD 430S TS512GMTS430S, , x, | Intel NUC8i7BE i7-8559U, Iris Plus Graphics 655, , , x, | GMK NucBox 2 i5-8259U, Iris Plus Graphics 655, Netac S930E8/256GPN, , x, | |
|---|---|---|---|---|---|---|
| Power Consumption | 16% | 32% | -47% | 4% | 3% | |
| Idle Minimum * (Watt) | 7.5 | 6.3 16% | 4.1 45% | 11.5 -53% | 2.7 64% | 6.1 19% |
| Idle Average * (Watt) | 7.6 | 6.6 13% | 4.1 46% | 12.4 -63% | 3.1 59% | 6.8 11% |
| Idle Maximum * (Watt) | 9.2 | 6.7 27% | 4.6 50% | 12.9 -40% | 6.3 32% | 7.3 21% |
| Load Average * (Watt) | 41.1 | 25.9 37% | 35.6 13% | 40.7 1% | 59.7 -45% | 46.3 -13% |
| Load Maximum * (Watt) | 41.4 | 46.7 -13% | 39.9 4% | 73.5 -78% | 78 -88% | 50.7 -22% |
| Witcher 3 ultra * (Watt) | 35.6 | 43.9 | 47.2 |
* ... Moindre est la valeur, meilleures sont les performances
Power Consumption Witcher 3 / Stresstest
Points positifs
Points négatifs
Verdict
Comme la plupart des autres mini-PC Beelink, le faible prix du SEi8 est son plus grand avantage par rapport à la concurrence. Un SEi8 tout équipé avec le processeur Core i3-3109U, 16 Go de RAM, Windows 11 Pro sous licence et 256 Go de SSD NVMe se vend environ 380 dollars US, tandis qu'un Intel NUC8I3BEK avec exactement le même processeur mais dans une configuration barebones peut être trouvé en ligne pour 350 dollars.
Pour un processeur vieux de quatre ans, le Core i3-8109U est juste assez rapide pour les applications HTPC de base comme la navigation, le streaming, la navigation dans le système d'exploitation et le multitâche léger, sans les ralentissements constants que l'on rencontre souvent sur les solutions plus faibles basées sur Celeron ou Atom. Si vous essayez d'être aussi bon marché que possible tout en minimisant l'impact sur l'expérience de l'interface utilisateur, alors le SEi8 Core i3 devrait être en haut de votre liste. Si vous passez au SEi8 Core i5, vous augmenterez considérablement les performances sans trop augmenter le prix pour les utilisateurs qui ont besoin d'un processeur plus rapide avec une plus grande autonomie et un meilleur potentiel multitâche.
Les inconvénients notables du NUC d'Intel sont les matériaux plus fins du châssis, le module WLAN plus lent, la garantie plus courte, les pulsations plus fréquentes du ventilateur, l'absence de lecteur de carte SD et les options BIOS plus limitées. Heureusement, ces inconvénients ne sont pas suffisants pour constituer un obstacle à l'installation d'un HTPC à petit budget.
Prix et disponibilité
Beelink expédie dès à présent le SEi8 en plusieurs configurations à partir de 319 USD. Les utilisateurs peuvent également commander sur Amazon à l'adresse https://www.bee-link.com/computer-73493777?tag=nbcnewsnet-20 pour 359 $US.
Price comparison

