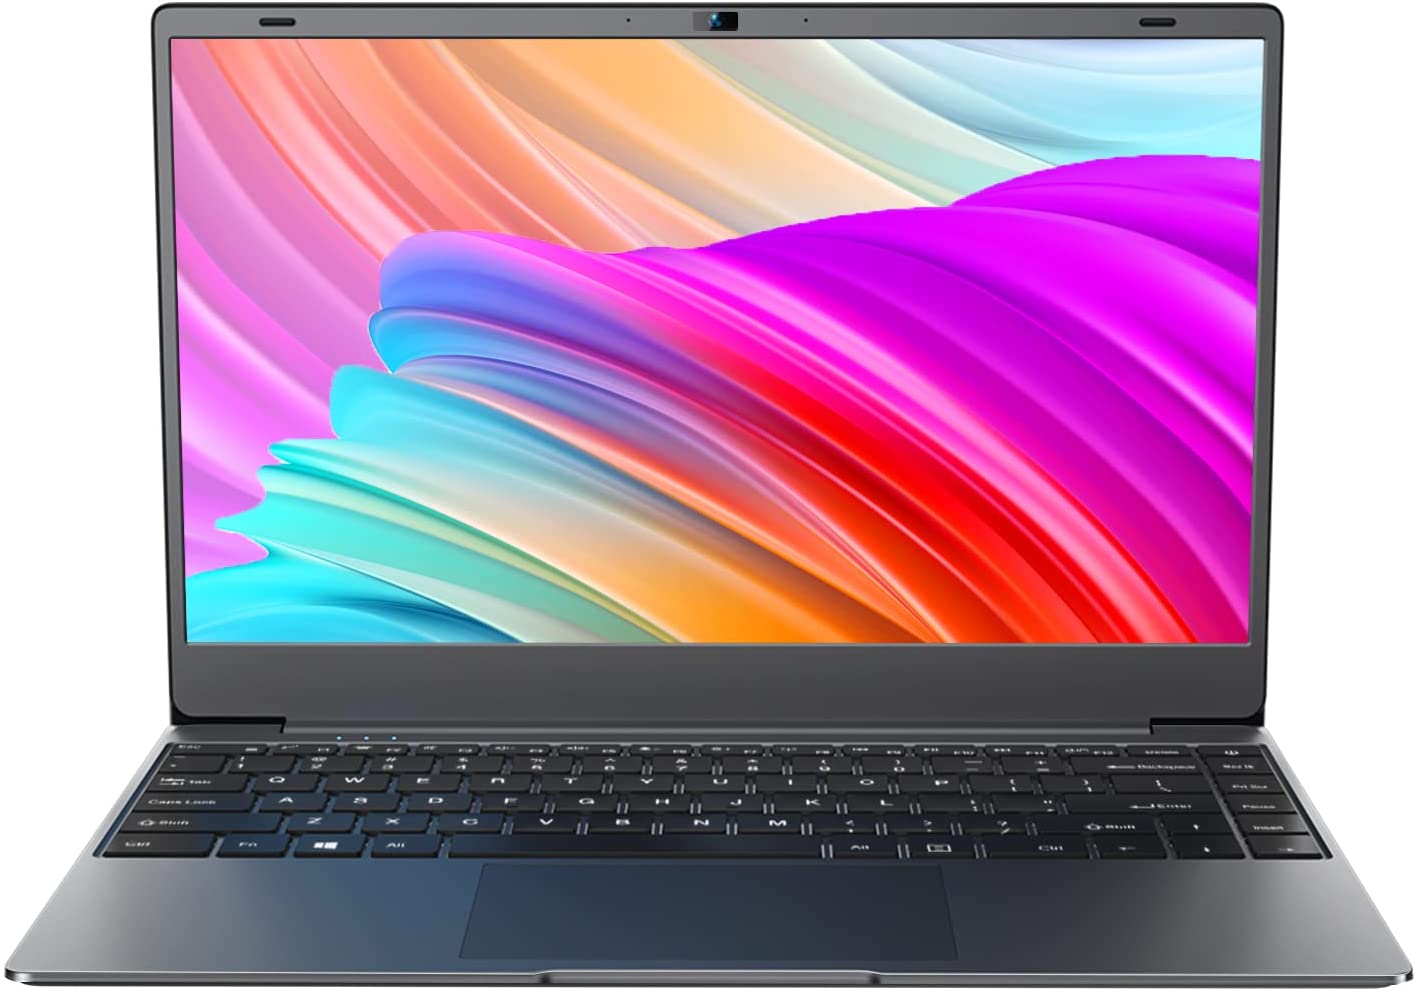
Test du BMAX X14 Pro : alléchant avec AMD Ryzen 5, à moins de 500 €
Le mini-ordinateur portable BMax X14 Pro de 14 pouces suit les traces du 11,6 pouces MaxBook Y11 lancé il y a deux ans. Tous deux sont des modèles économiques dans leurs catégories respectives, conçus pour avoir des profils en aluminium plus attrayants que les modèles concurrents dans la même gamme de prix
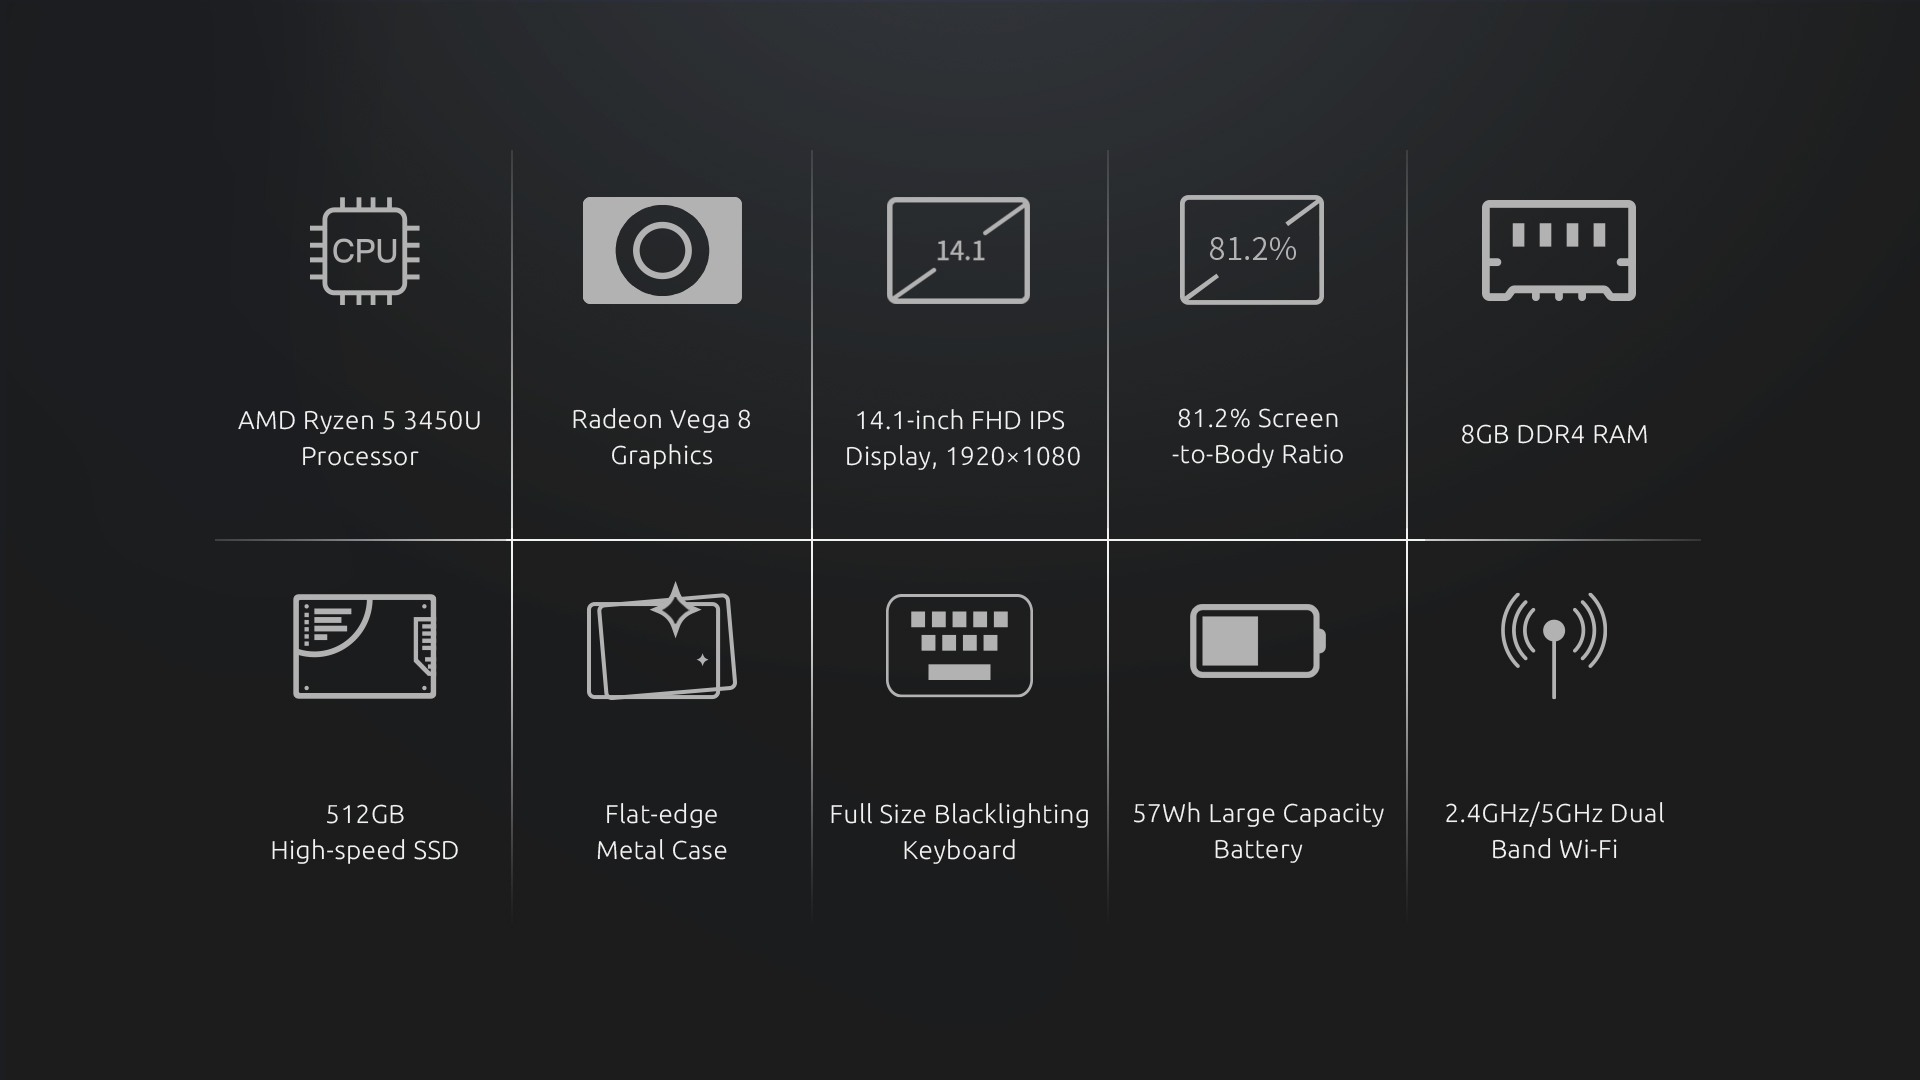
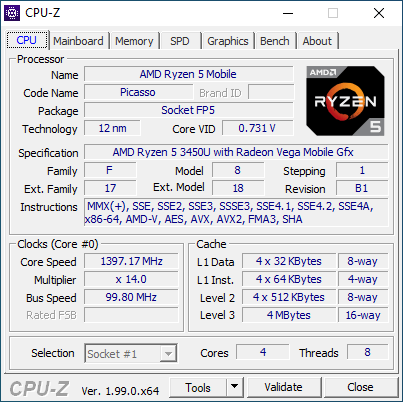
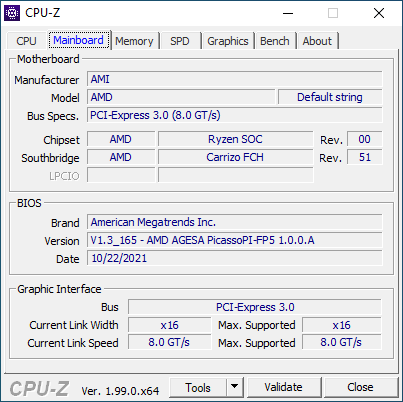
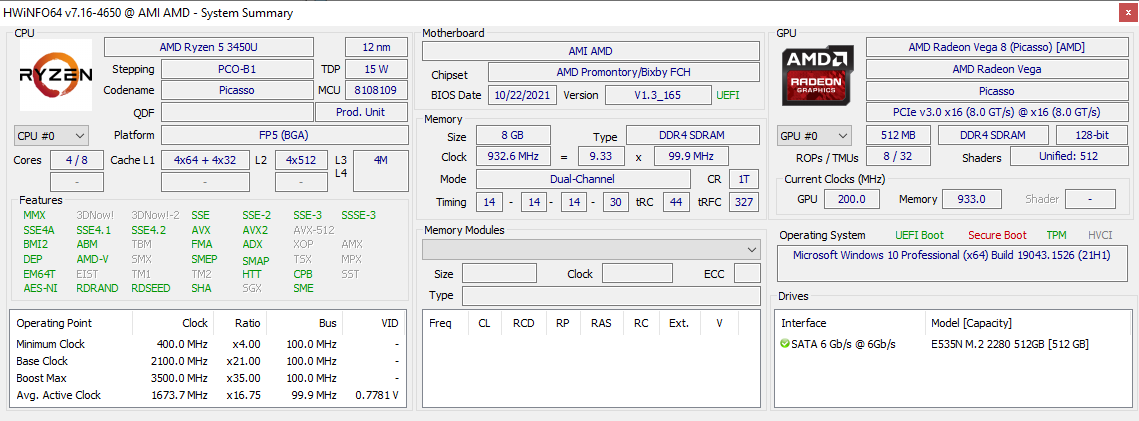
En interne, le BMax X14 Pro utilise l'ancien mais relativement peu courant AMD Zen+ Ryzen 5 3450U Qui devrait constituer une mise à niveau par rapport aux solutions Celeron ou Atom que l'on trouve généralement sur les ordinateurs portables concurrents à moins de 500 $. Parmi les autres caractéristiques, on trouve un écran IPS 1080p, un clavier rétroéclairé et un SSD spacieux de 512 Go qui sont plus typiques des ordinateurs portables plus chers
Les alternatives au X14 Pro incluent d'autres modèles bon marché de 14 pouces comme la Asus VivoBook series, La série Lenovo IdeaPad 3, Infinix INBook X2, Chuwi CoreBook Xou le Série Dell Inspiron 14 3000.
Comparaison avec les concurrents potentiels
Note | Date | Modèle | Poids | Épaisseur | Taille | Résolution | Prix |
|---|---|---|---|---|---|---|---|
| 76 % v7 (old) | 02/22 | BMAX X14 Pro R5 3450U, Vega 8 | 1.4 kg | 18.3 mm | 14.00" | 1920x1080 | |
| 85.5 % v7 (old) | 11/21 | Lenovo IdeaPad 5 Pro 14ACN6 R5 5600U, Vega 7 | 1.5 kg | 17.9 mm | 14.00" | 2240x1400 | |
| 82.9 % v7 (old) | 09/21 | Dell Inspiron 14 7400 7415 2-in-1 R7 5700U, Vega 8 | 1.5 kg | 17.95 mm | 14.00" | 1920x1080 | |
| 84.8 % v7 (old) | 01/22 | HP Pavilion 14-dv0357ng i5-1135G7, Iris Xe G7 80EUs | 1.4 kg | 19 mm | 14.00" | 1920x1080 | |
| 86.3 % v7 (old) | 12/20 | Huawei MateBook 14 2020 Intel i7-10510U, GeForce MX350 | 1.5 kg | 15.9 mm | 14.00" | 2160x1440 | |
| 79.5 % v7 (old) | 01/22 | Infinix INBook X2 i7-1065G7, Iris Plus Graphics G7 (Ice Lake 64 EU) | 1.2 kg | 14.8 mm | 14.00" | 1920x1080 |
Cas
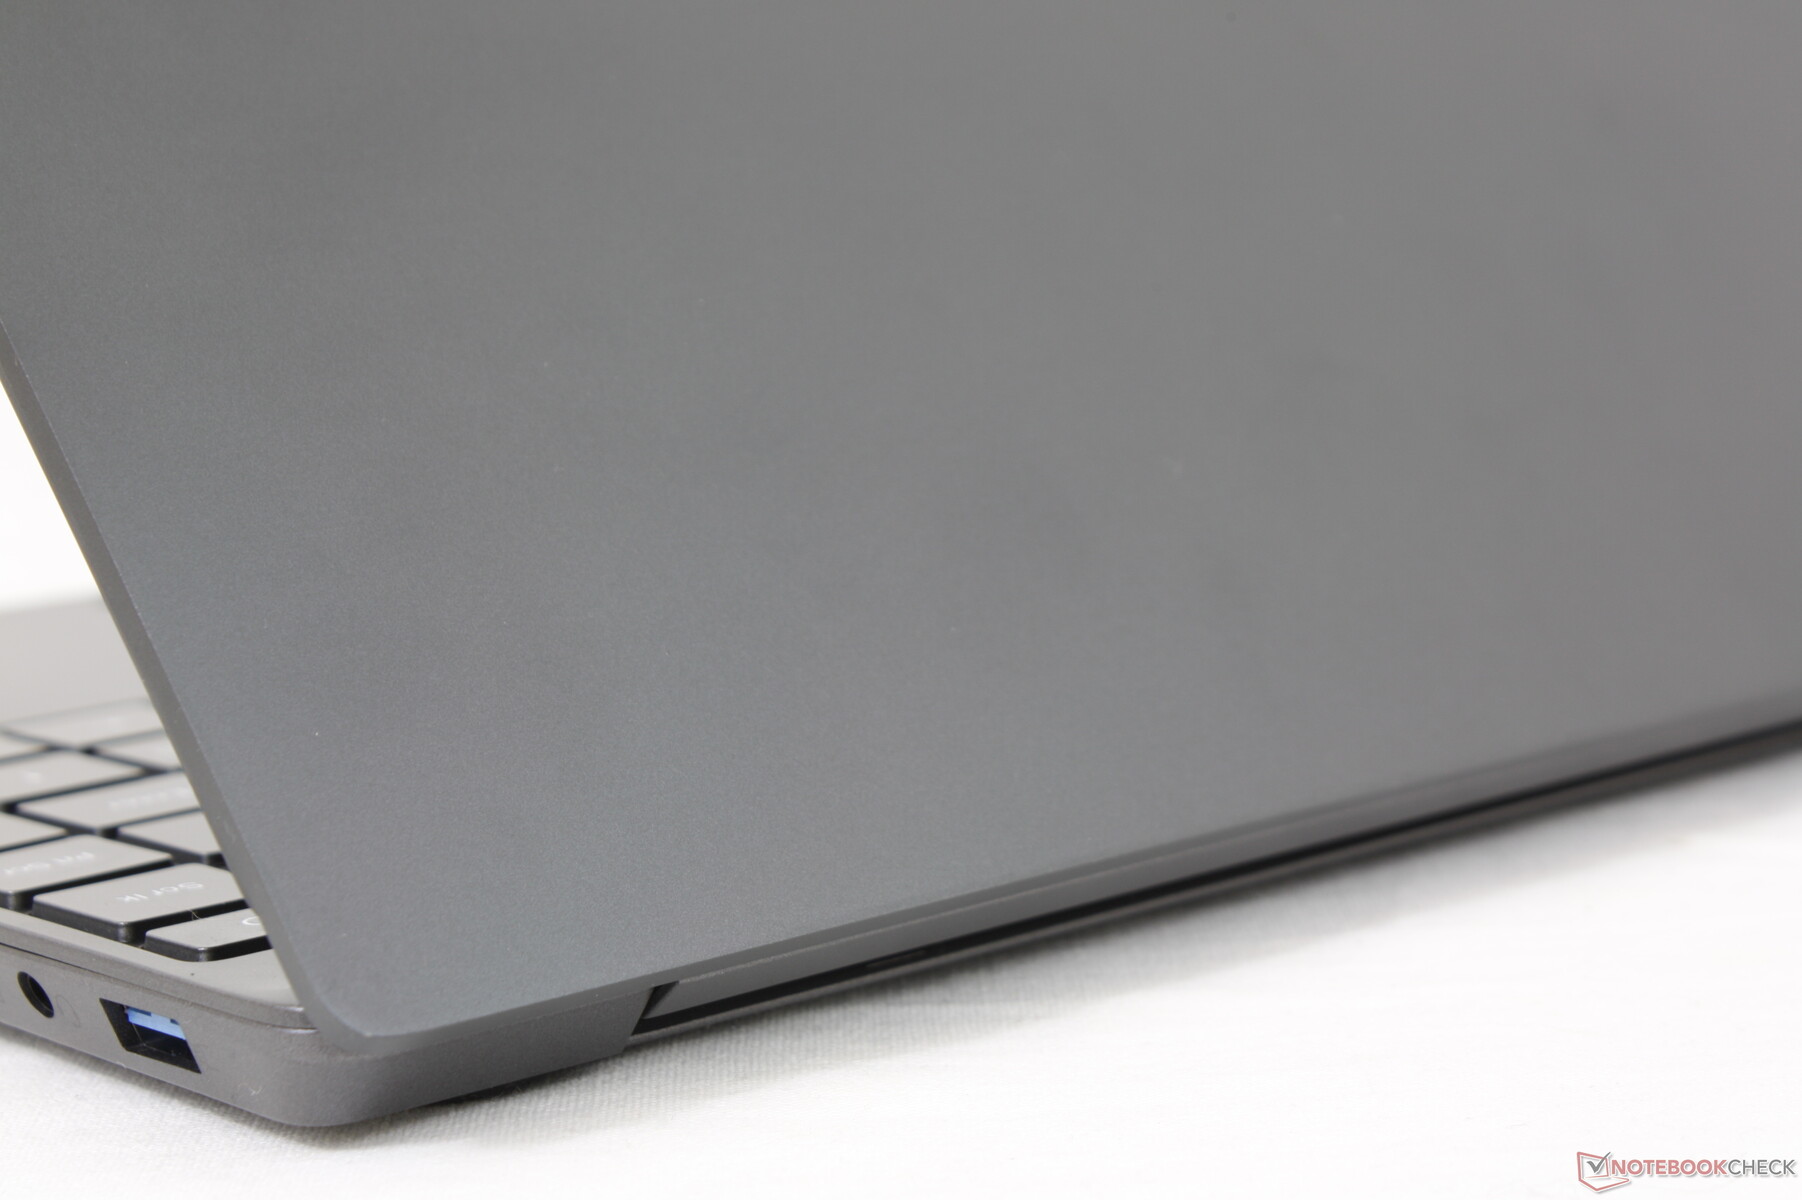
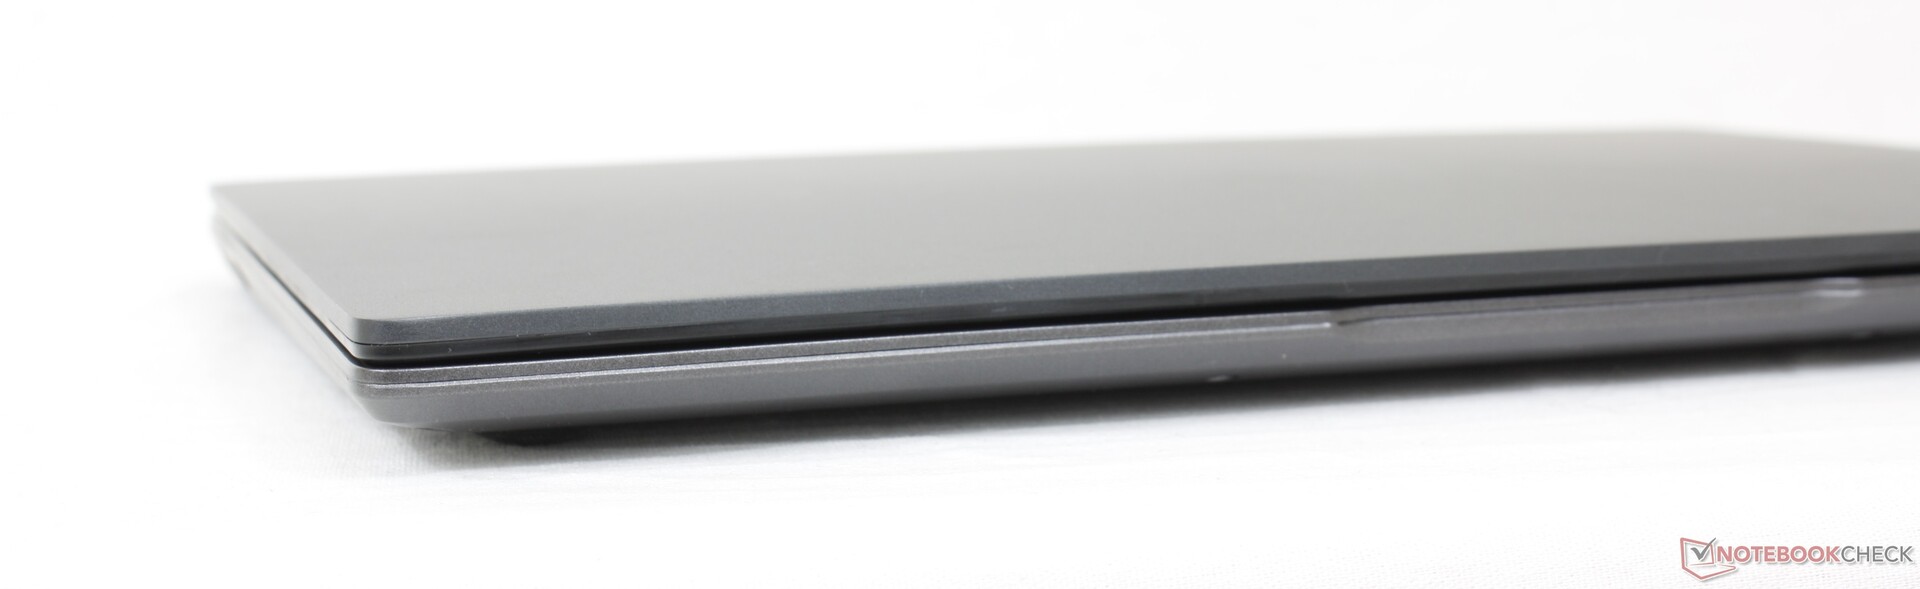
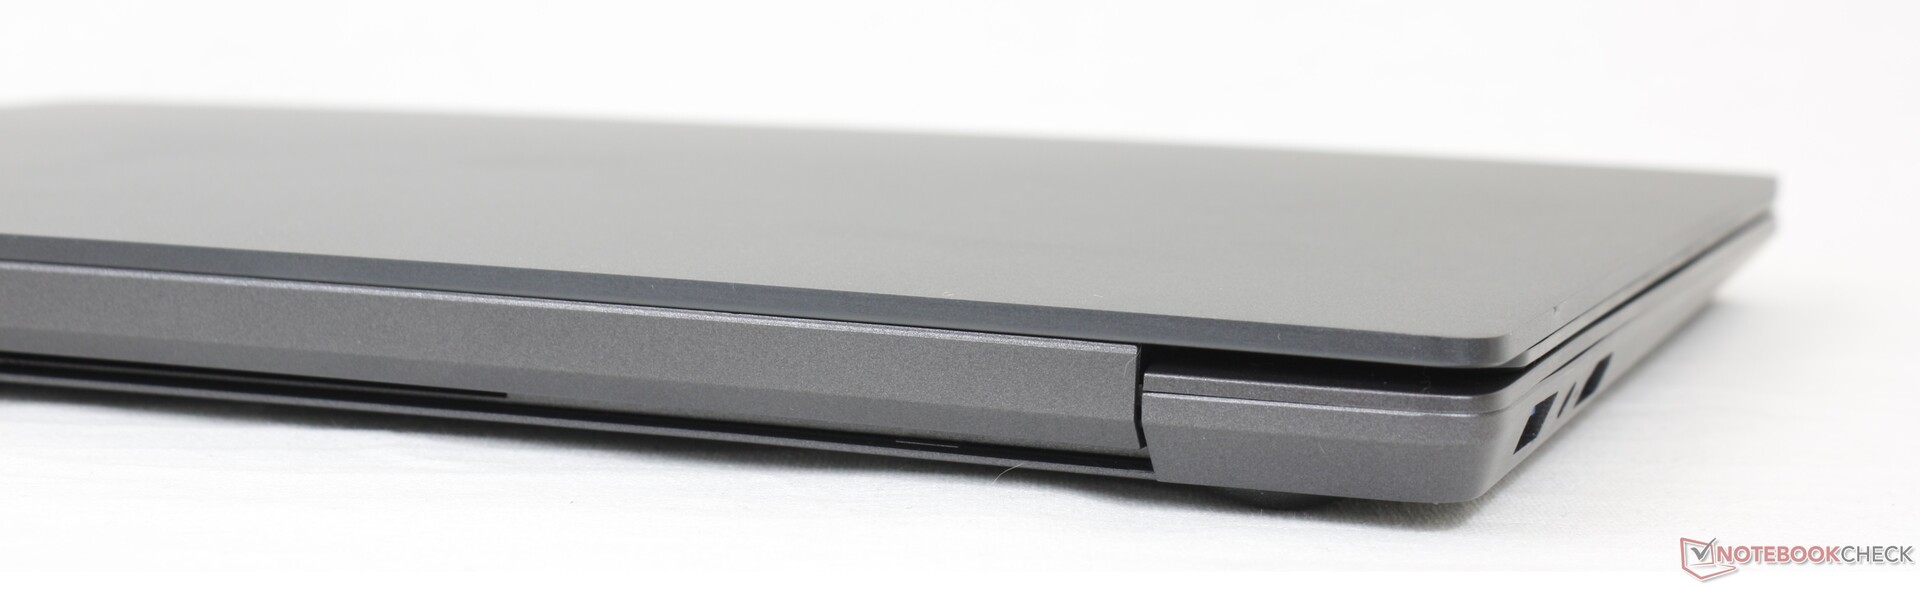
Le châssis semble excellent de loin, comme c'est le cas pour de nombreux ordinateurs portables Chuwi. Cependant, ses faiblesses deviennent plus apparentes une fois en main, car le châssis métallique fléchit et grince beaucoup plus facilement que les squelettes métalliques d'un Dell XPS, HP Spectre, ou Asus ZenBook. Les coins de la base, le centre du clavier, le couvercle extérieur et les charnières présentent tous des niveaux modérés de torsion. Ainsi, alors que le X14 Pro ressemble à un ordinateur portable qui devrait être vendu à plus de 500 $, il n'est pas plus solide ou plus rigide que d'autres modèles bon marché comme le Asus VivoBook ou le Lenovo IdeaPad 3 14 Lenovo IdeaPad 3 14 qui sont principalement en plastique.
Connectivité
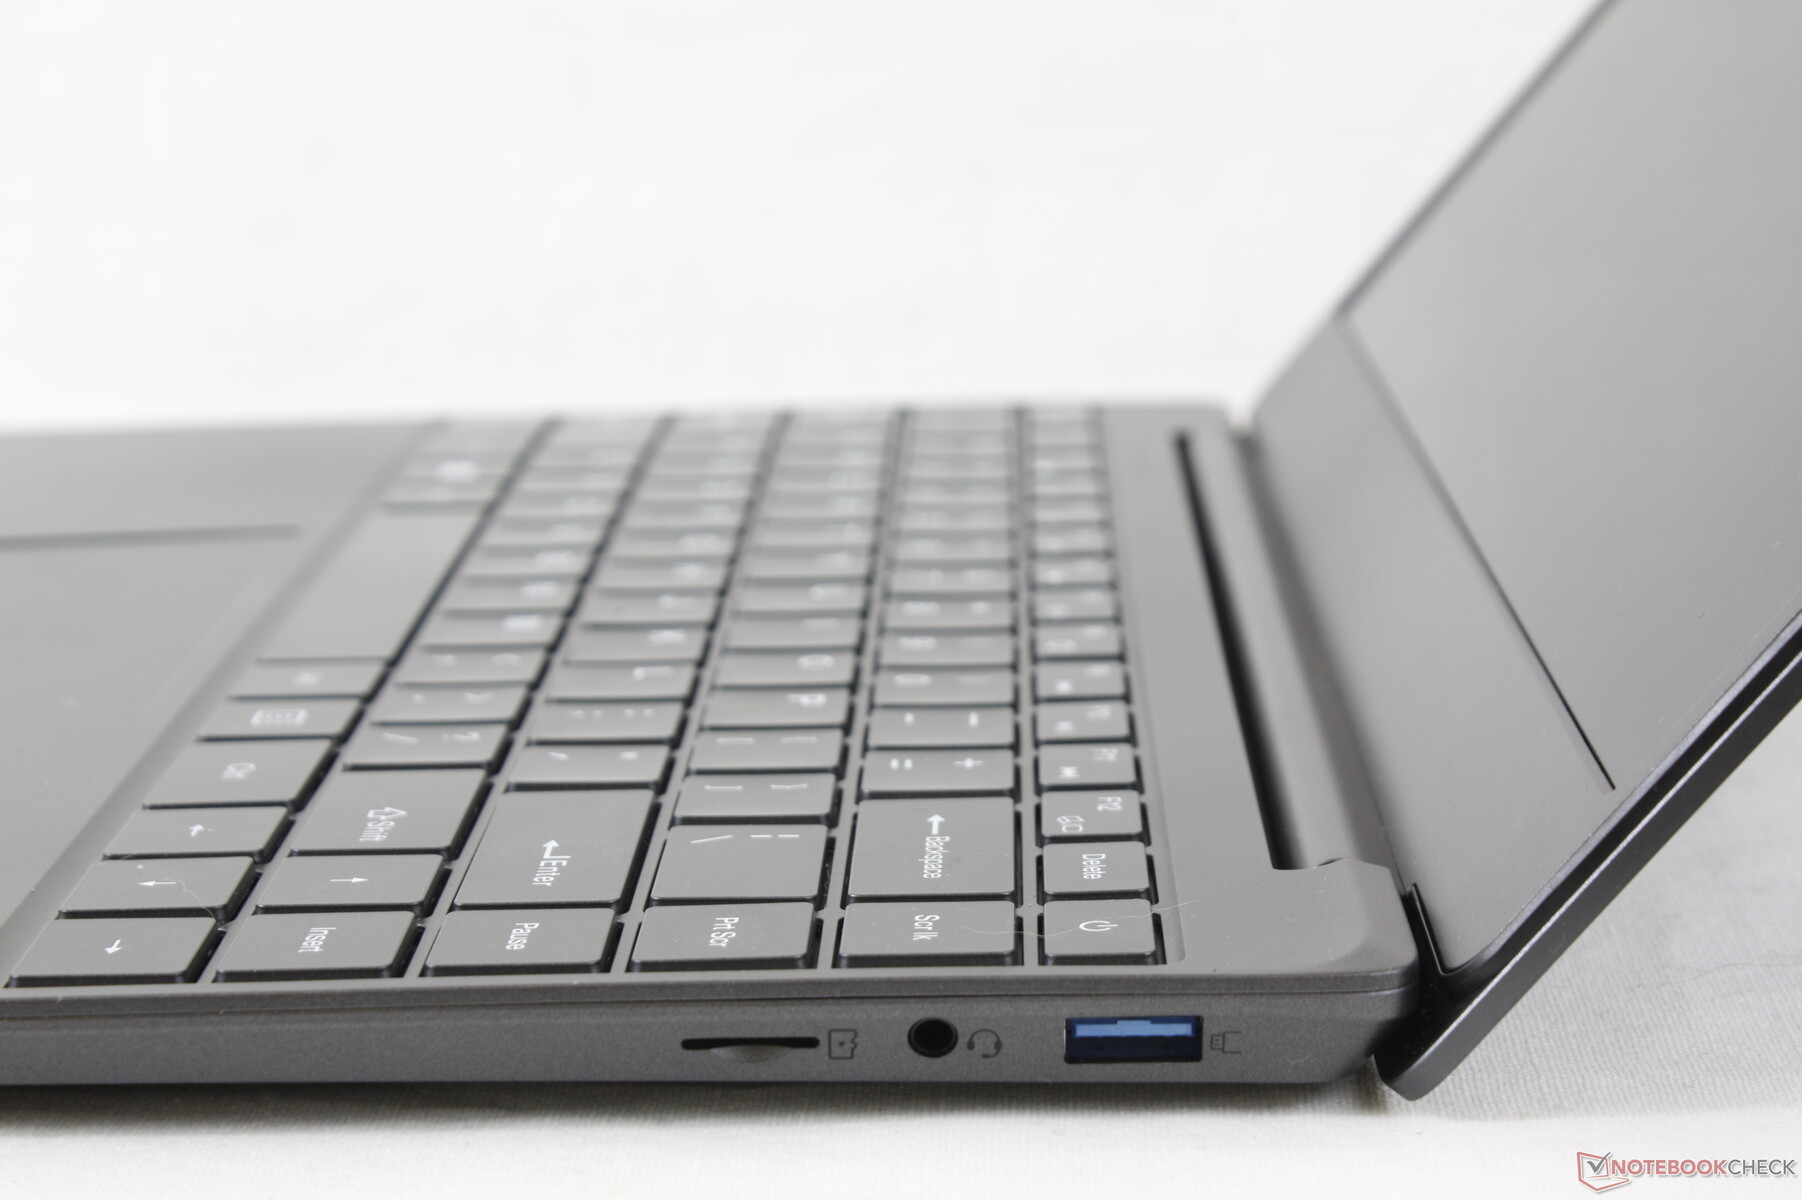
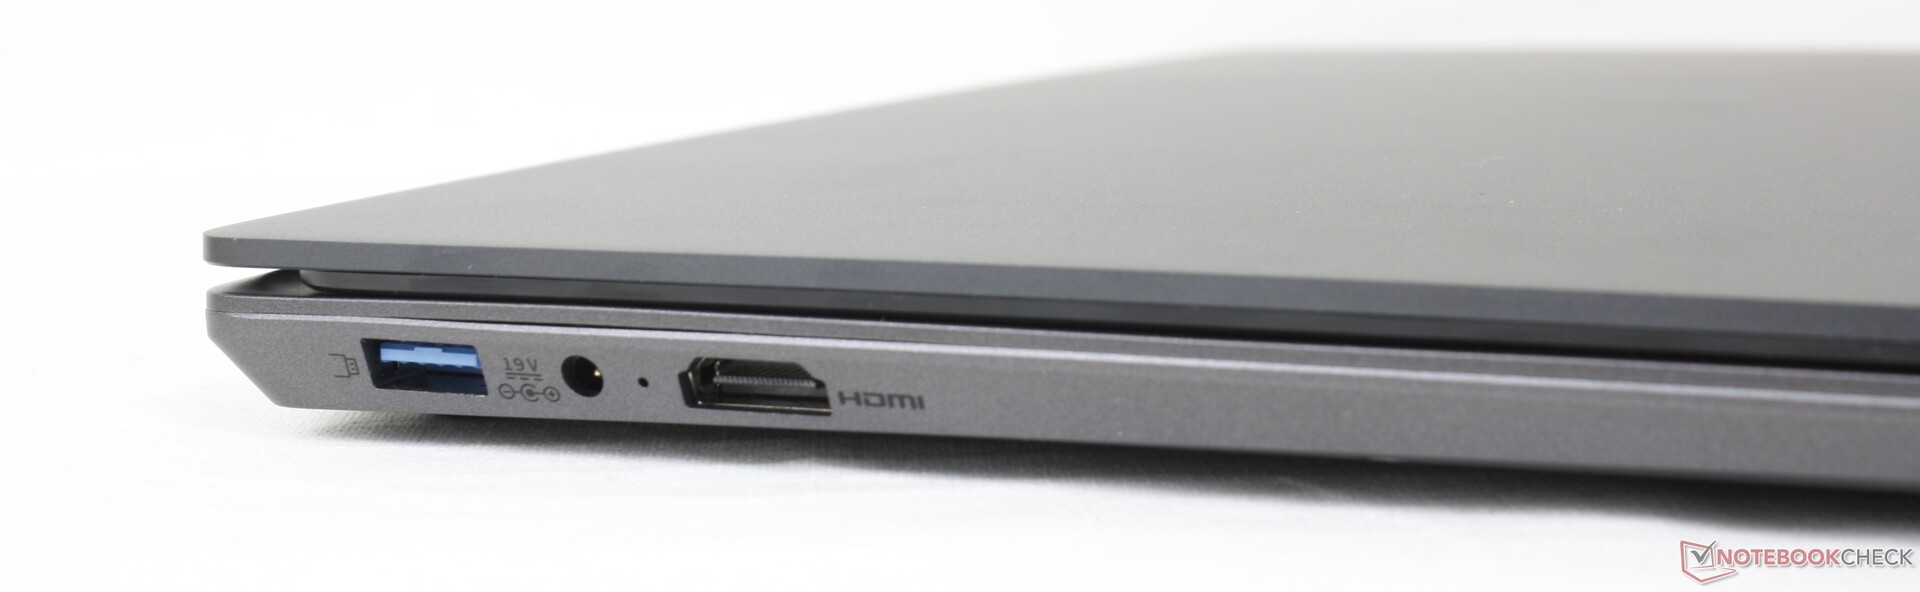
Les options de port sont raisonnables pour un ordinateur portable de 14 pouces, même si le positionnement peut être assez serré. Les câbles situés le long du bord gauche, par exemple, peuvent fréquemment s'emmêler
BMax n'annonce pas la version du port HDMI, mais nous pouvons confirmer qu'il s'agit d'un port HDMI 2.0 car il prend en charge les moniteurs externes en 4K et 60 Hz.
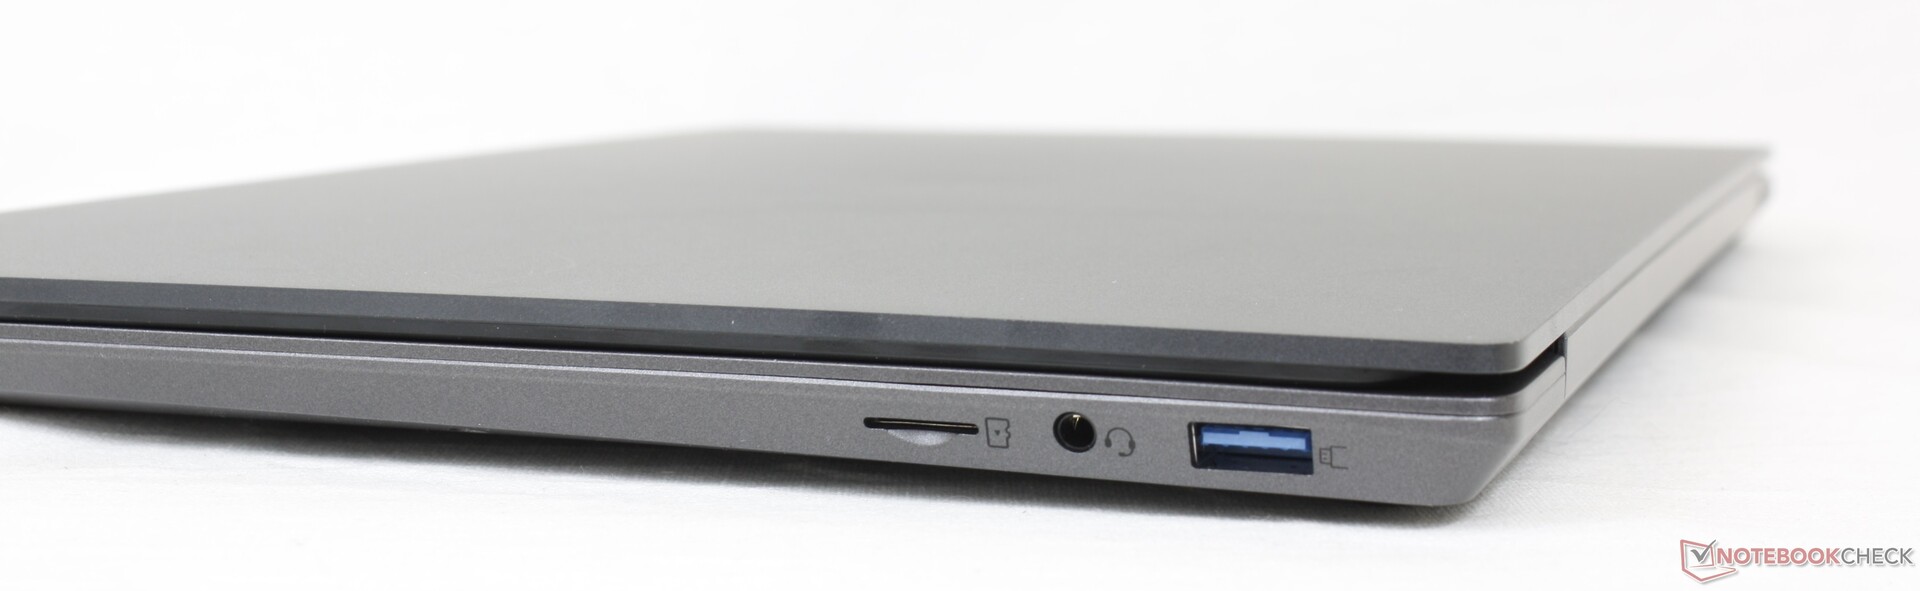
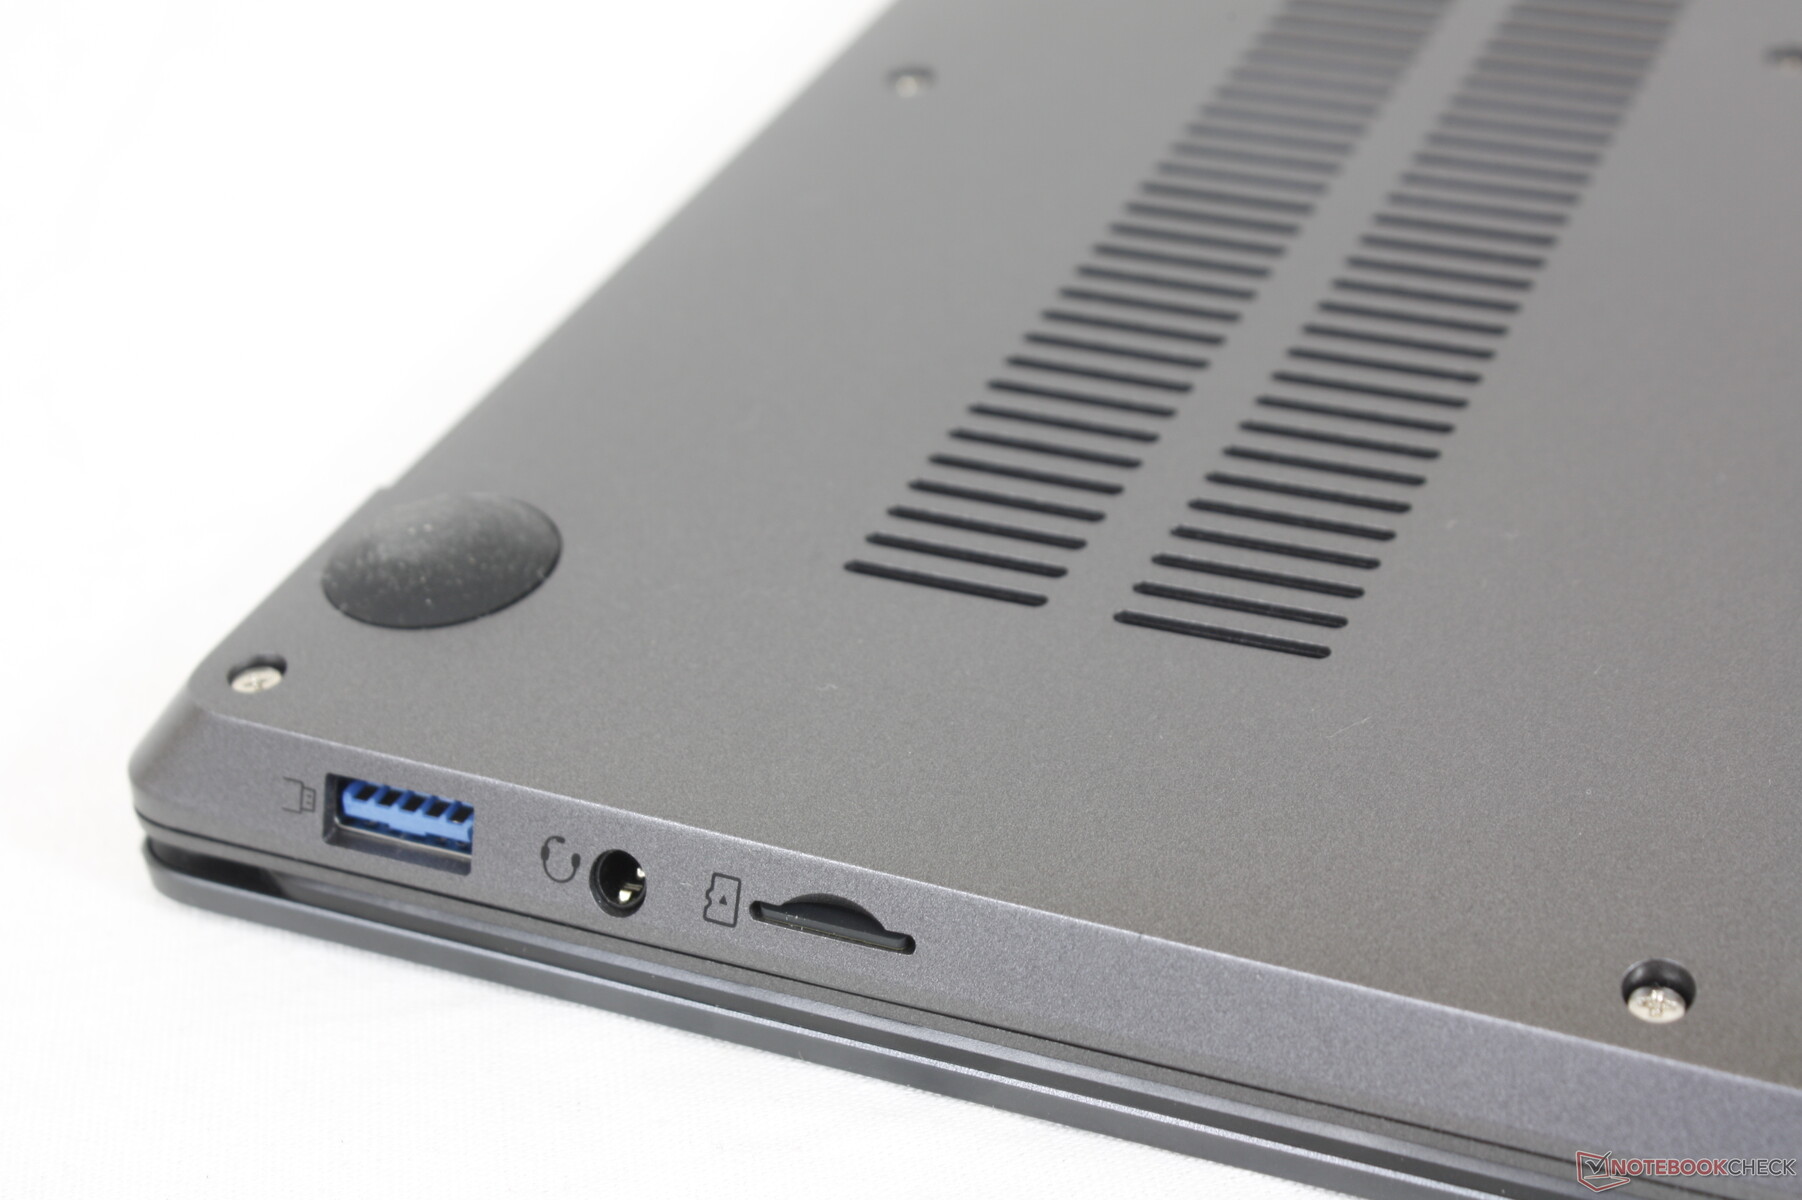
Lecteur de carte SD
Le lecteur MicroSD à ressort offre des taux de transfert lents. N'oubliez pas que la carte MicroSD doit être insérée à l'envers et qu'elle peut être difficile à éjecter.
| SD Card Reader | |
| average JPG Copy Test (av. of 3 runs) | |
| Lenovo IdeaPad 5 Pro 14ACN6 (AV PRO V60) | |
| HP Pavilion 14-dv0357ng | |
| BMAX X14 Pro (AV Pro V60) | |
| Dell Inspiron 14 7400 7415 2-in-1 (AV Pro V60) | |
| Infinix INBook X2 (AV Pro V60) | |
| maximum AS SSD Seq Read Test (1GB) | |
| HP Pavilion 14-dv0357ng | |
| Lenovo IdeaPad 5 Pro 14ACN6 (AV PRO V60) | |
| BMAX X14 Pro (AV Pro V60) | |
| Dell Inspiron 14 7400 7415 2-in-1 (AV Pro V60) | |
| Infinix INBook X2 (AV Pro V60) | |
Communication
Le module Wi-Fi 5 intégré est stable, mais très lent, avec des taux de transfert de 250 Mbps en moyenne dans les deux sens.
Webcam
webcam 720p sans prise en charge de Windows Hello ni volet de confidentialité.


Maintenance
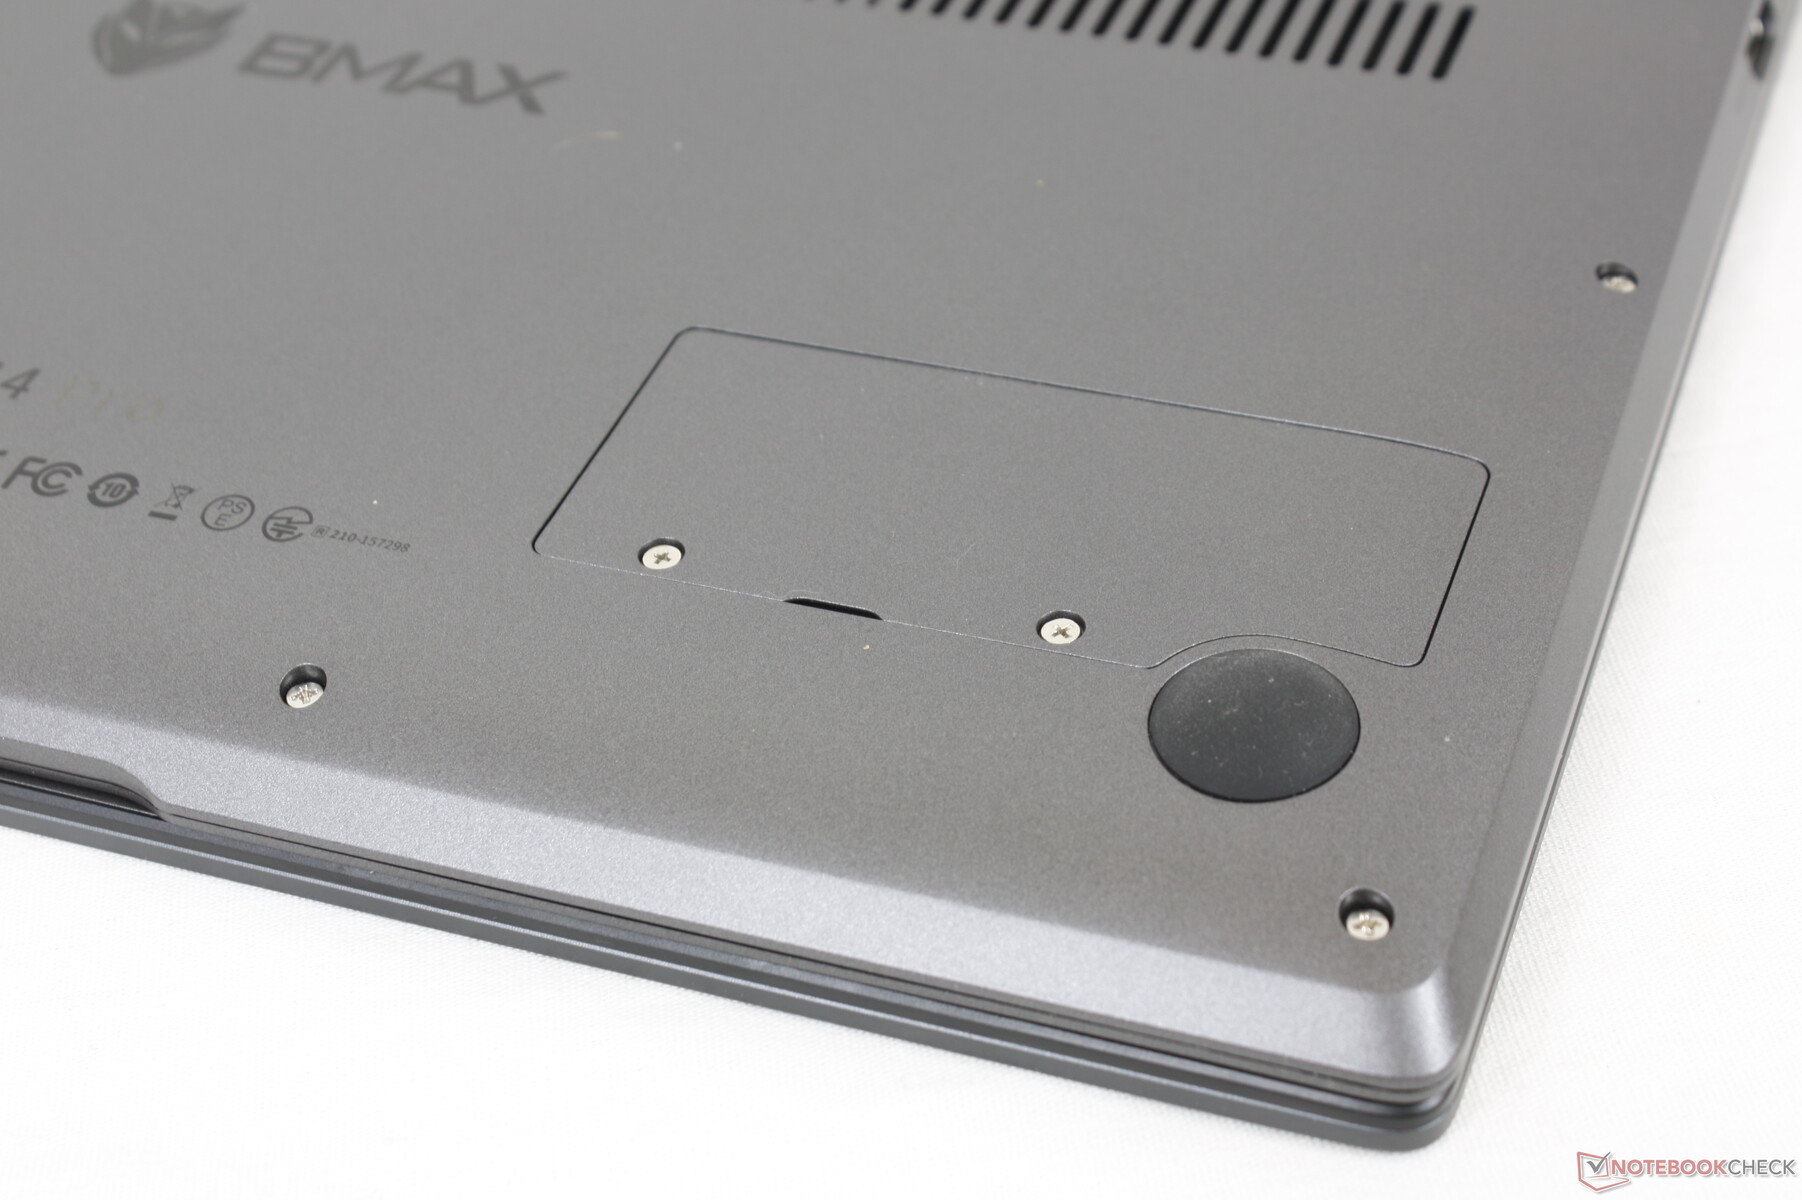
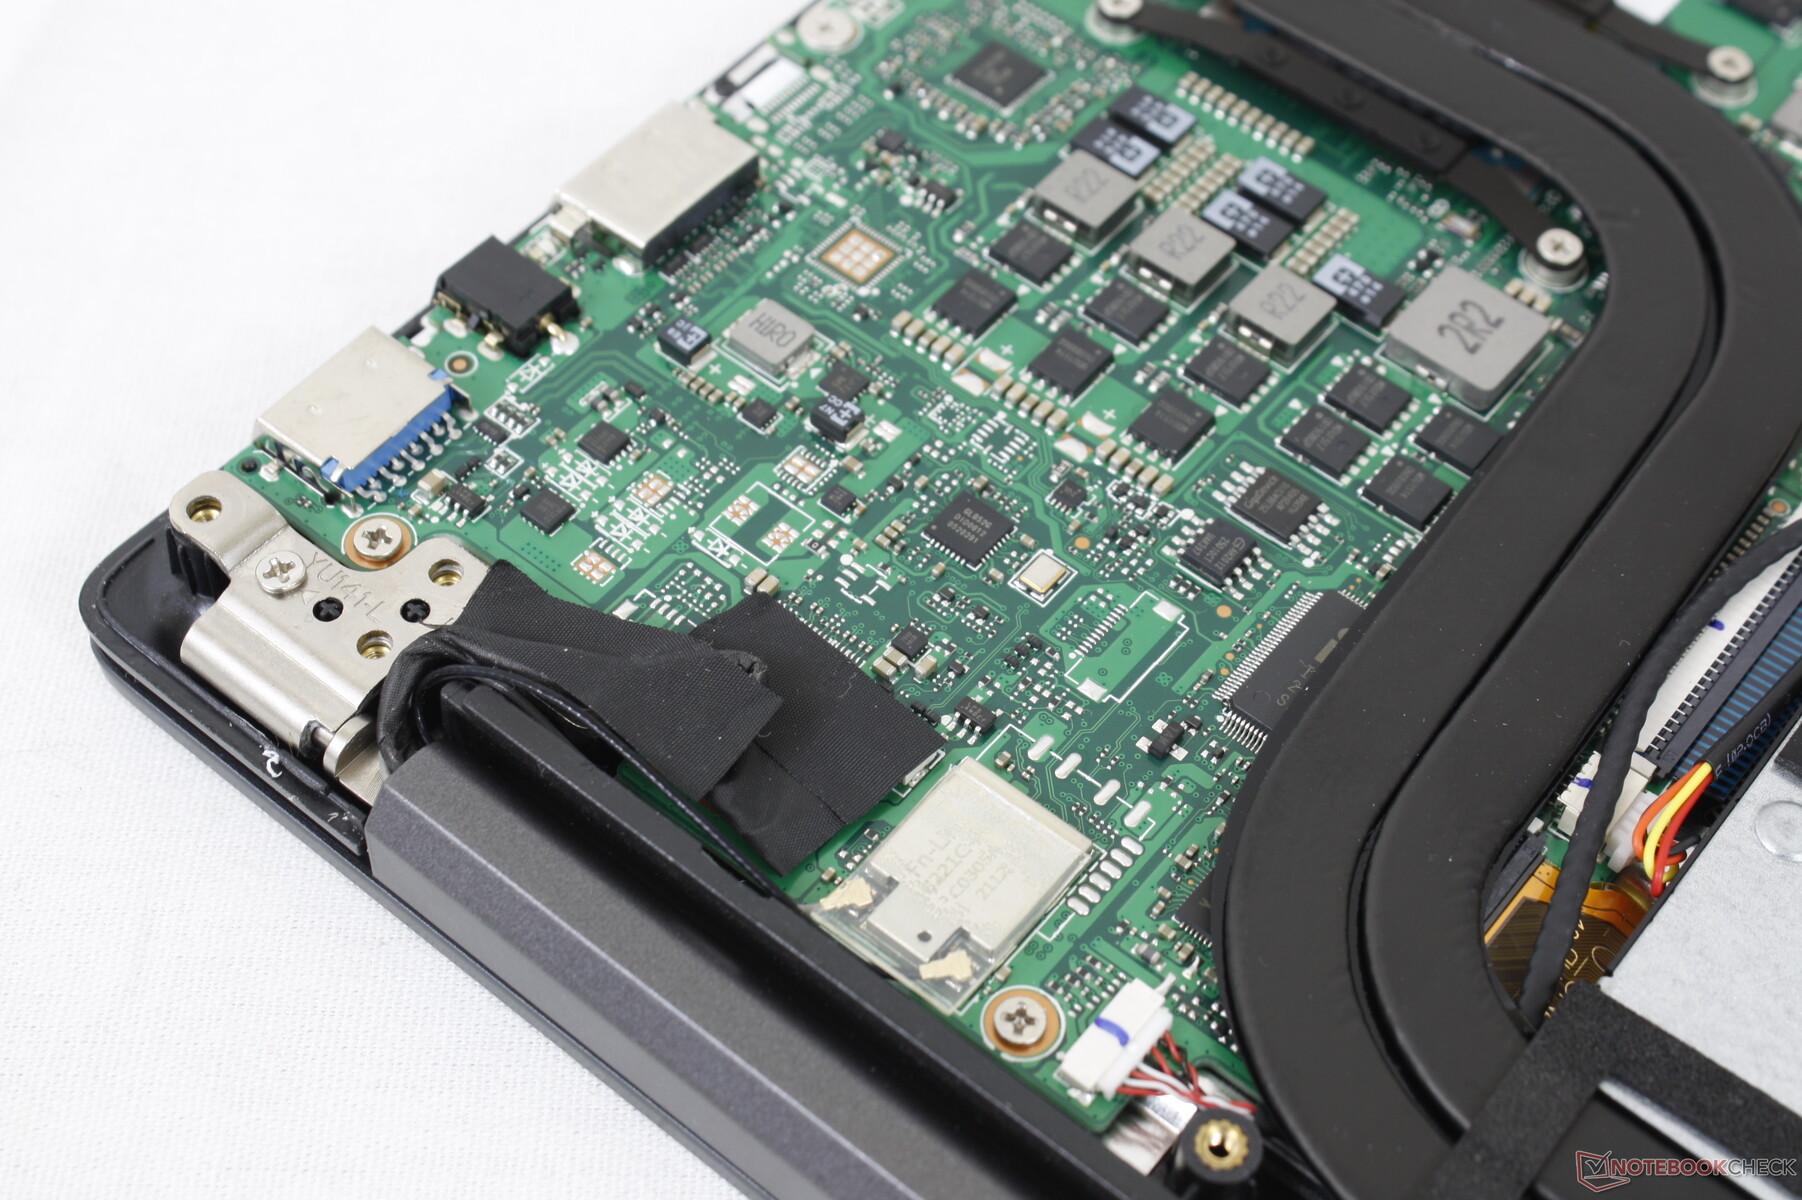
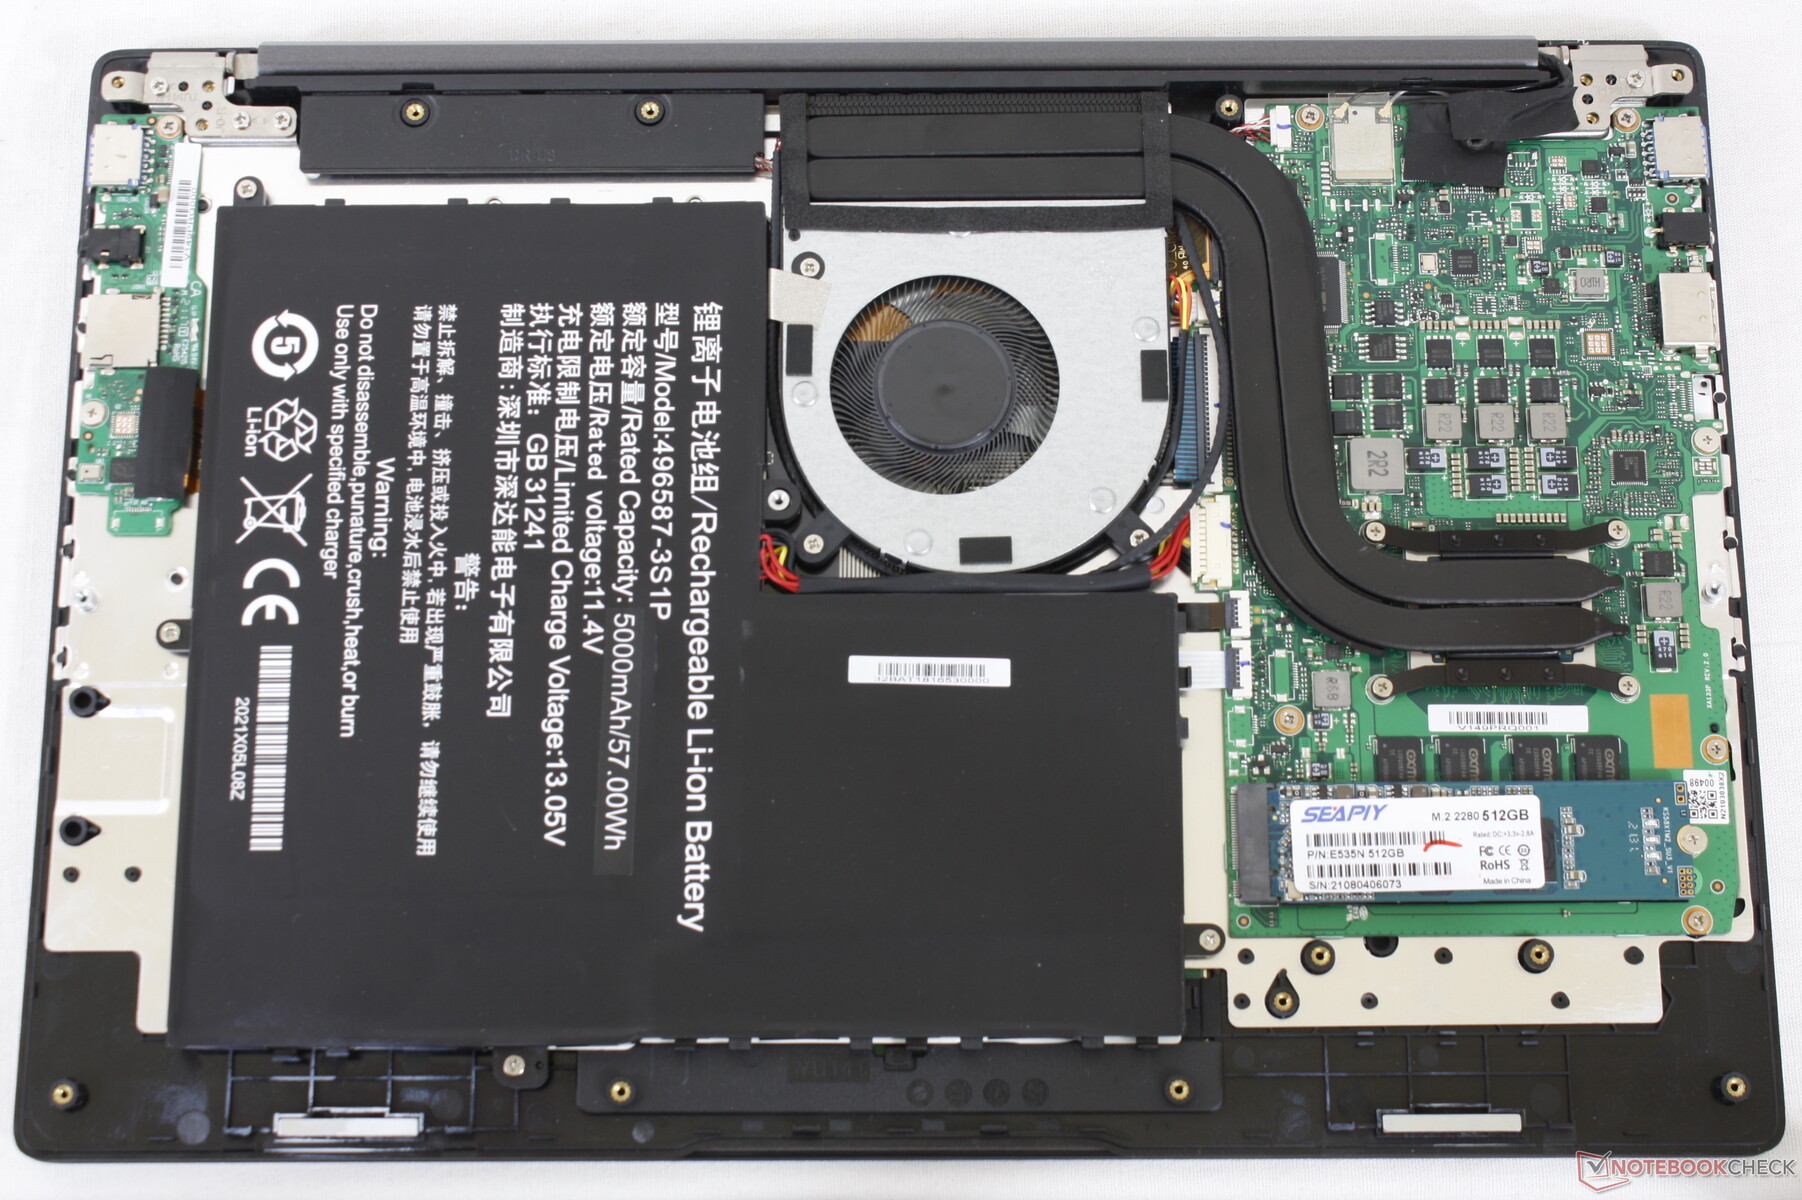
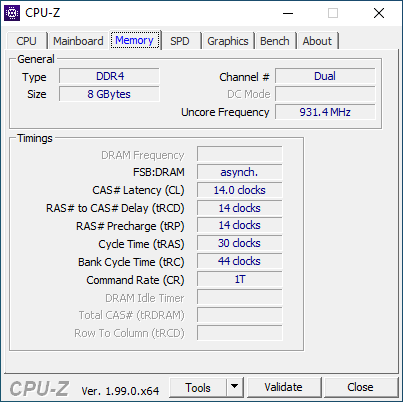
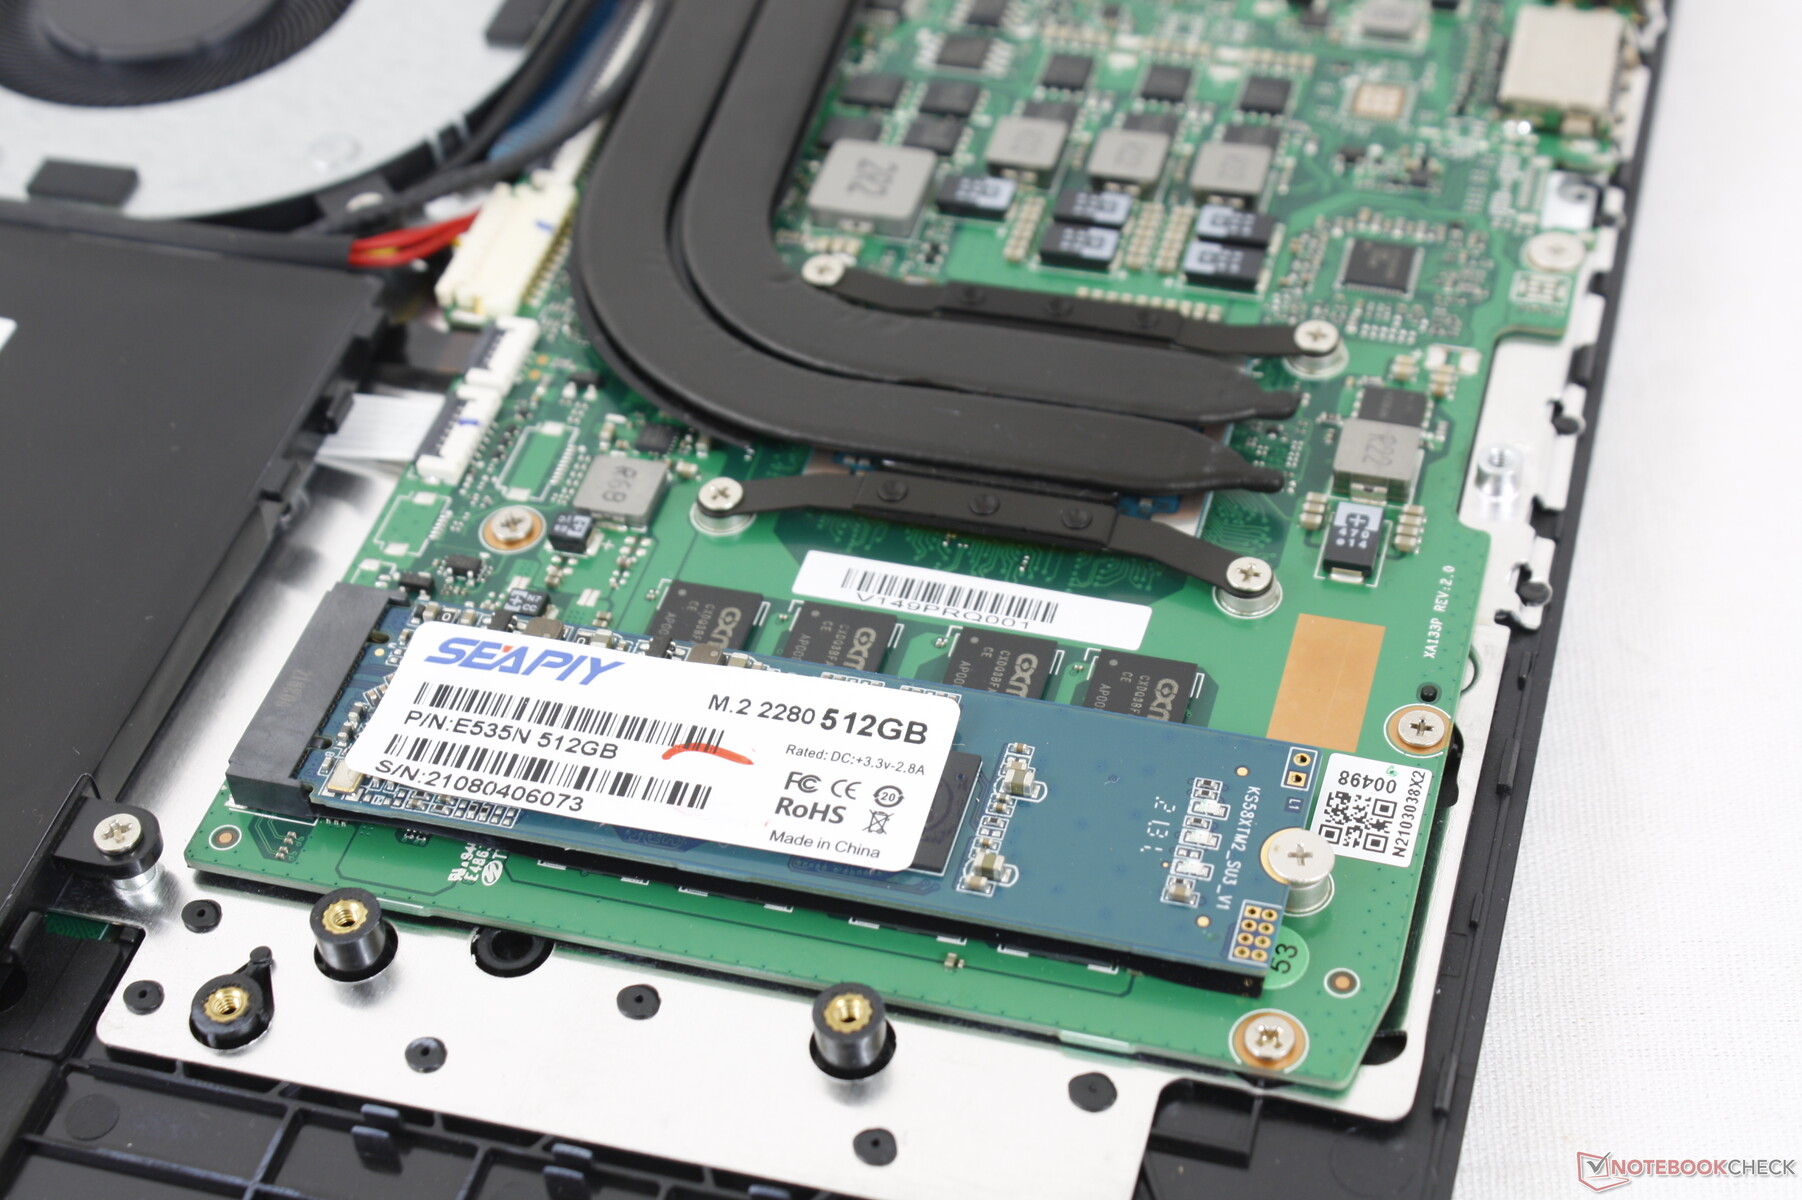
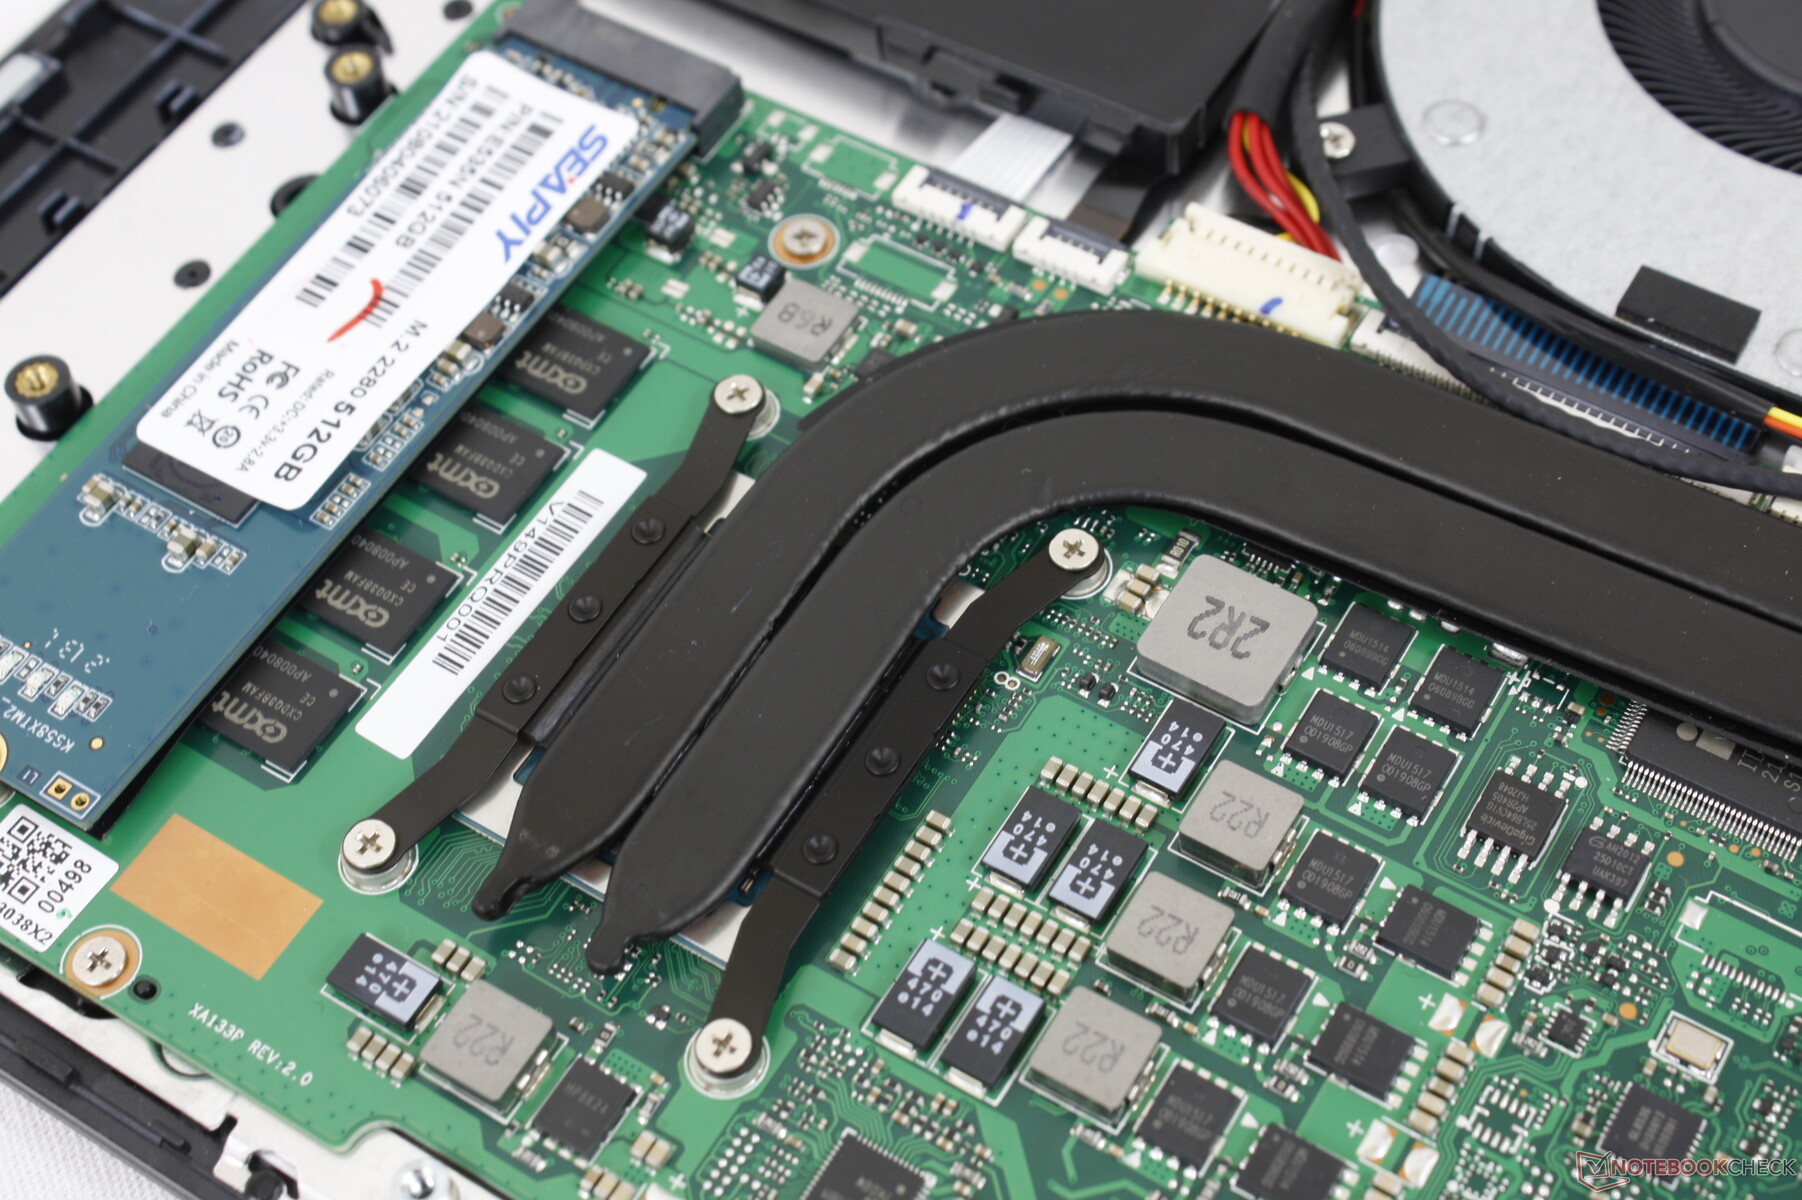
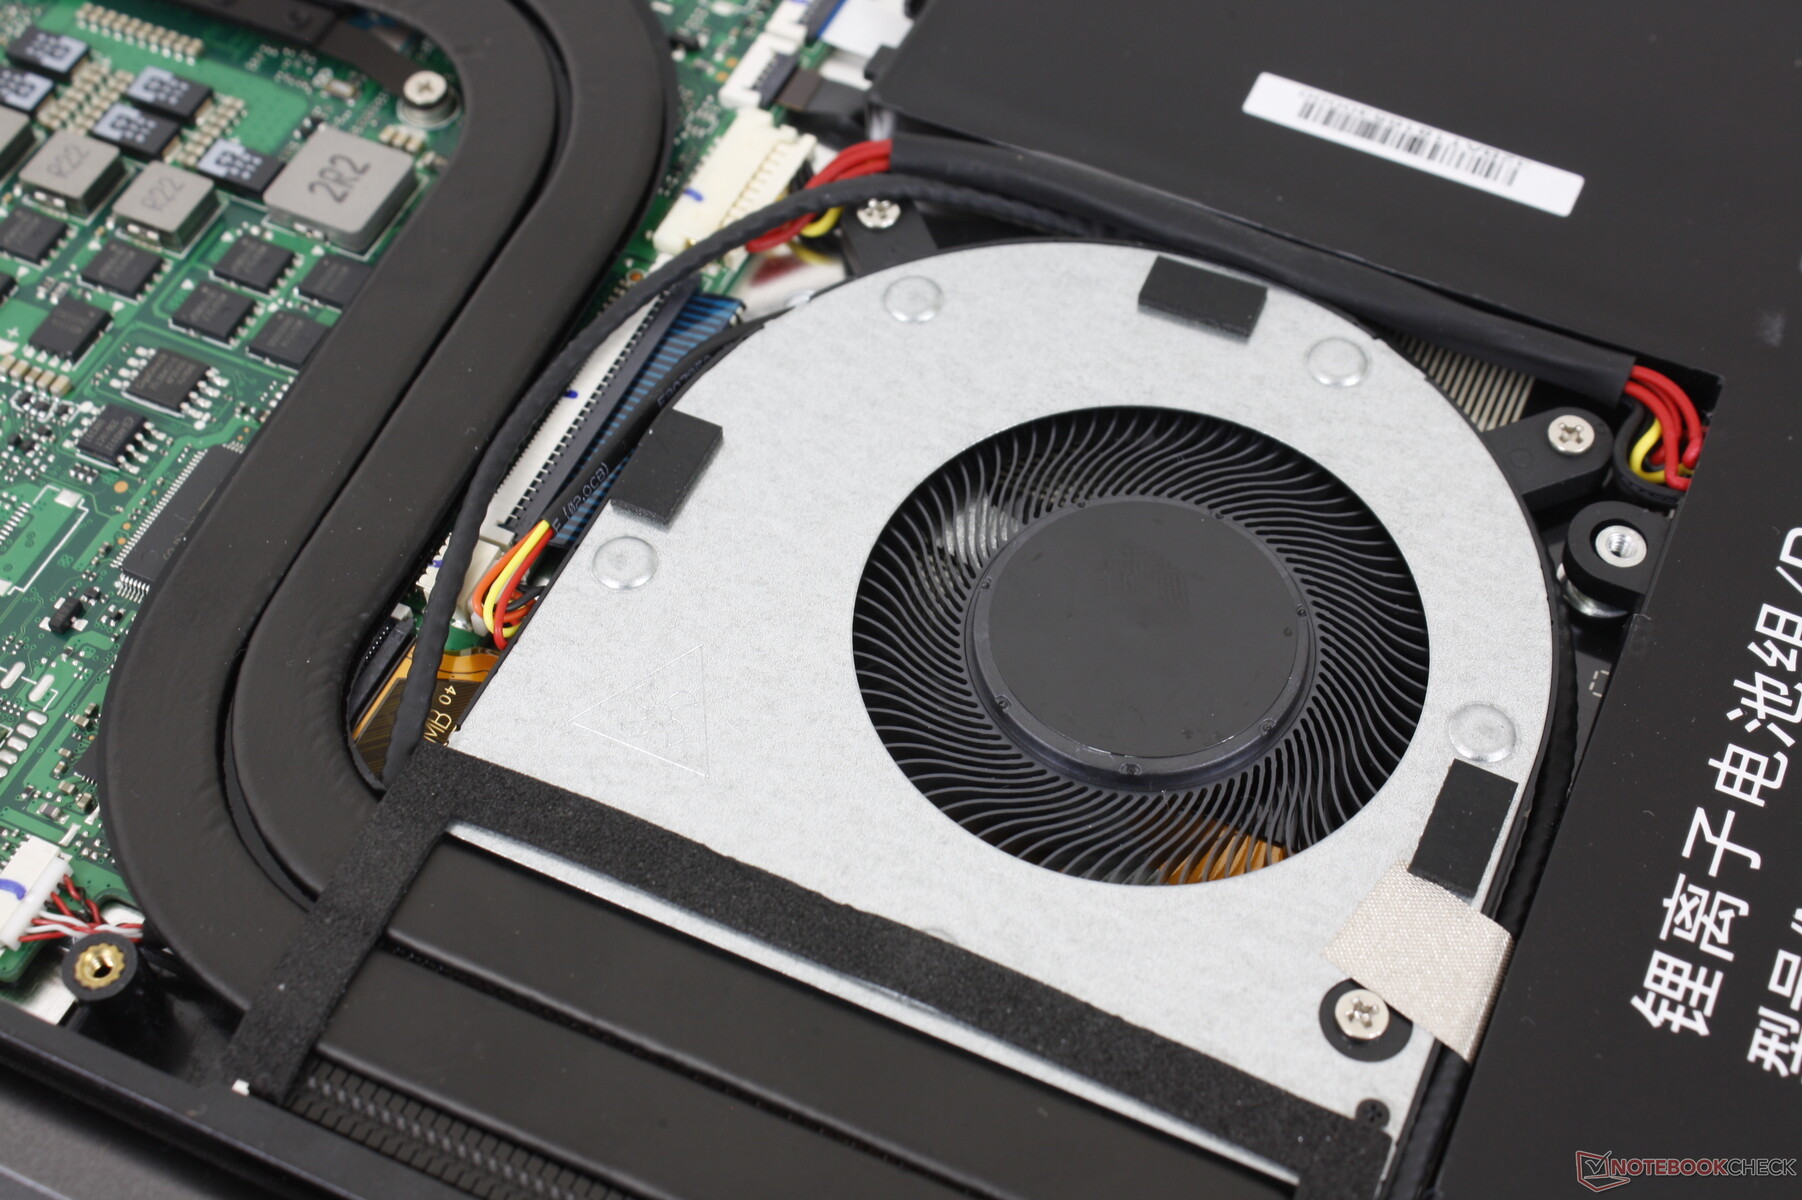
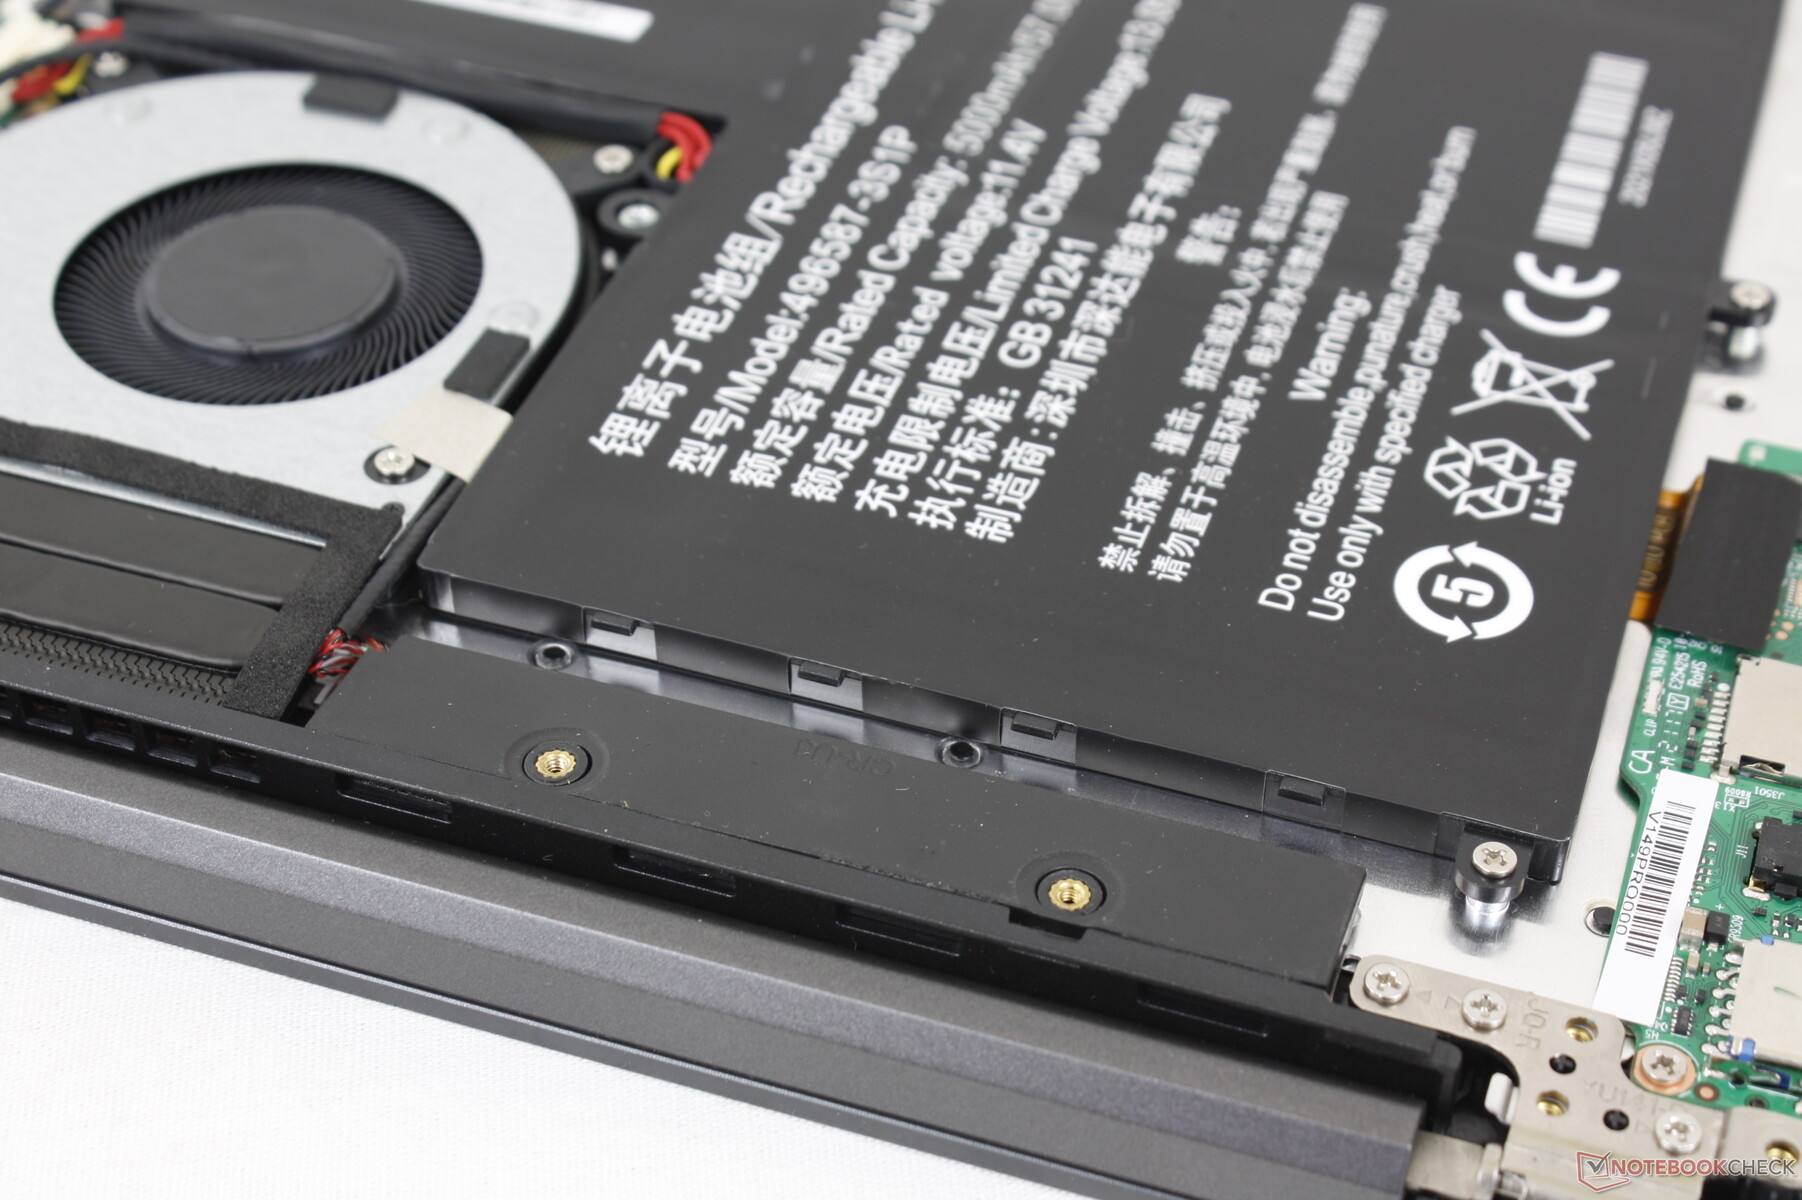
Le panneau inférieur est fixé par 11 vis Philips et 2 autres cachées sous les pieds en caoutchouc arrière. Les utilisateurs ne peuvent mettre à niveau que le stockage M.2 2280 car la RAM et les modules WLAN sont soudés. Heureusement, la RAM est en mode bicanal.
Accessoires et garantie
Il n'y a rien d'autre dans la boîte que l'adaptateur secteur et les documents. Le recours à la garantie du fabricant peut être long ou coûteux en raison de l'expédition outre-mer
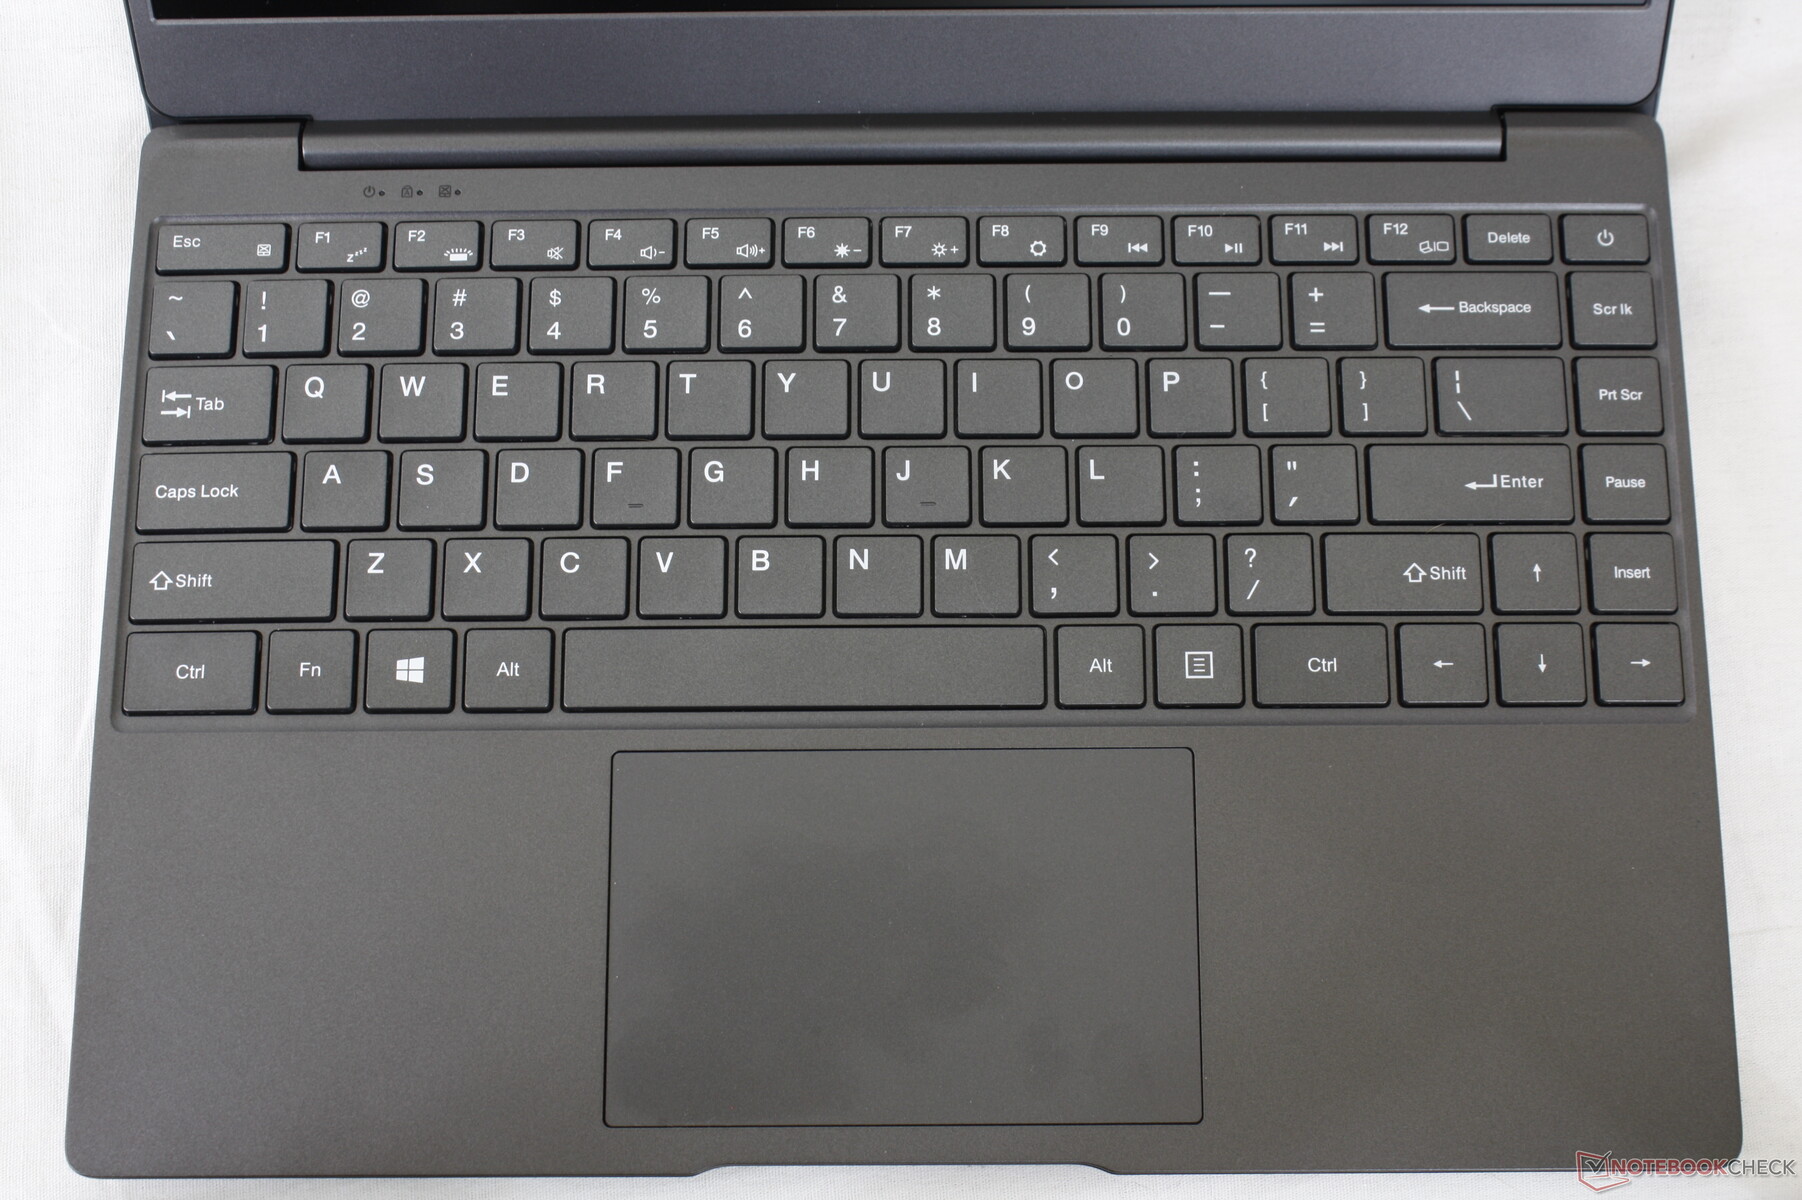
Périphériques d'entrée
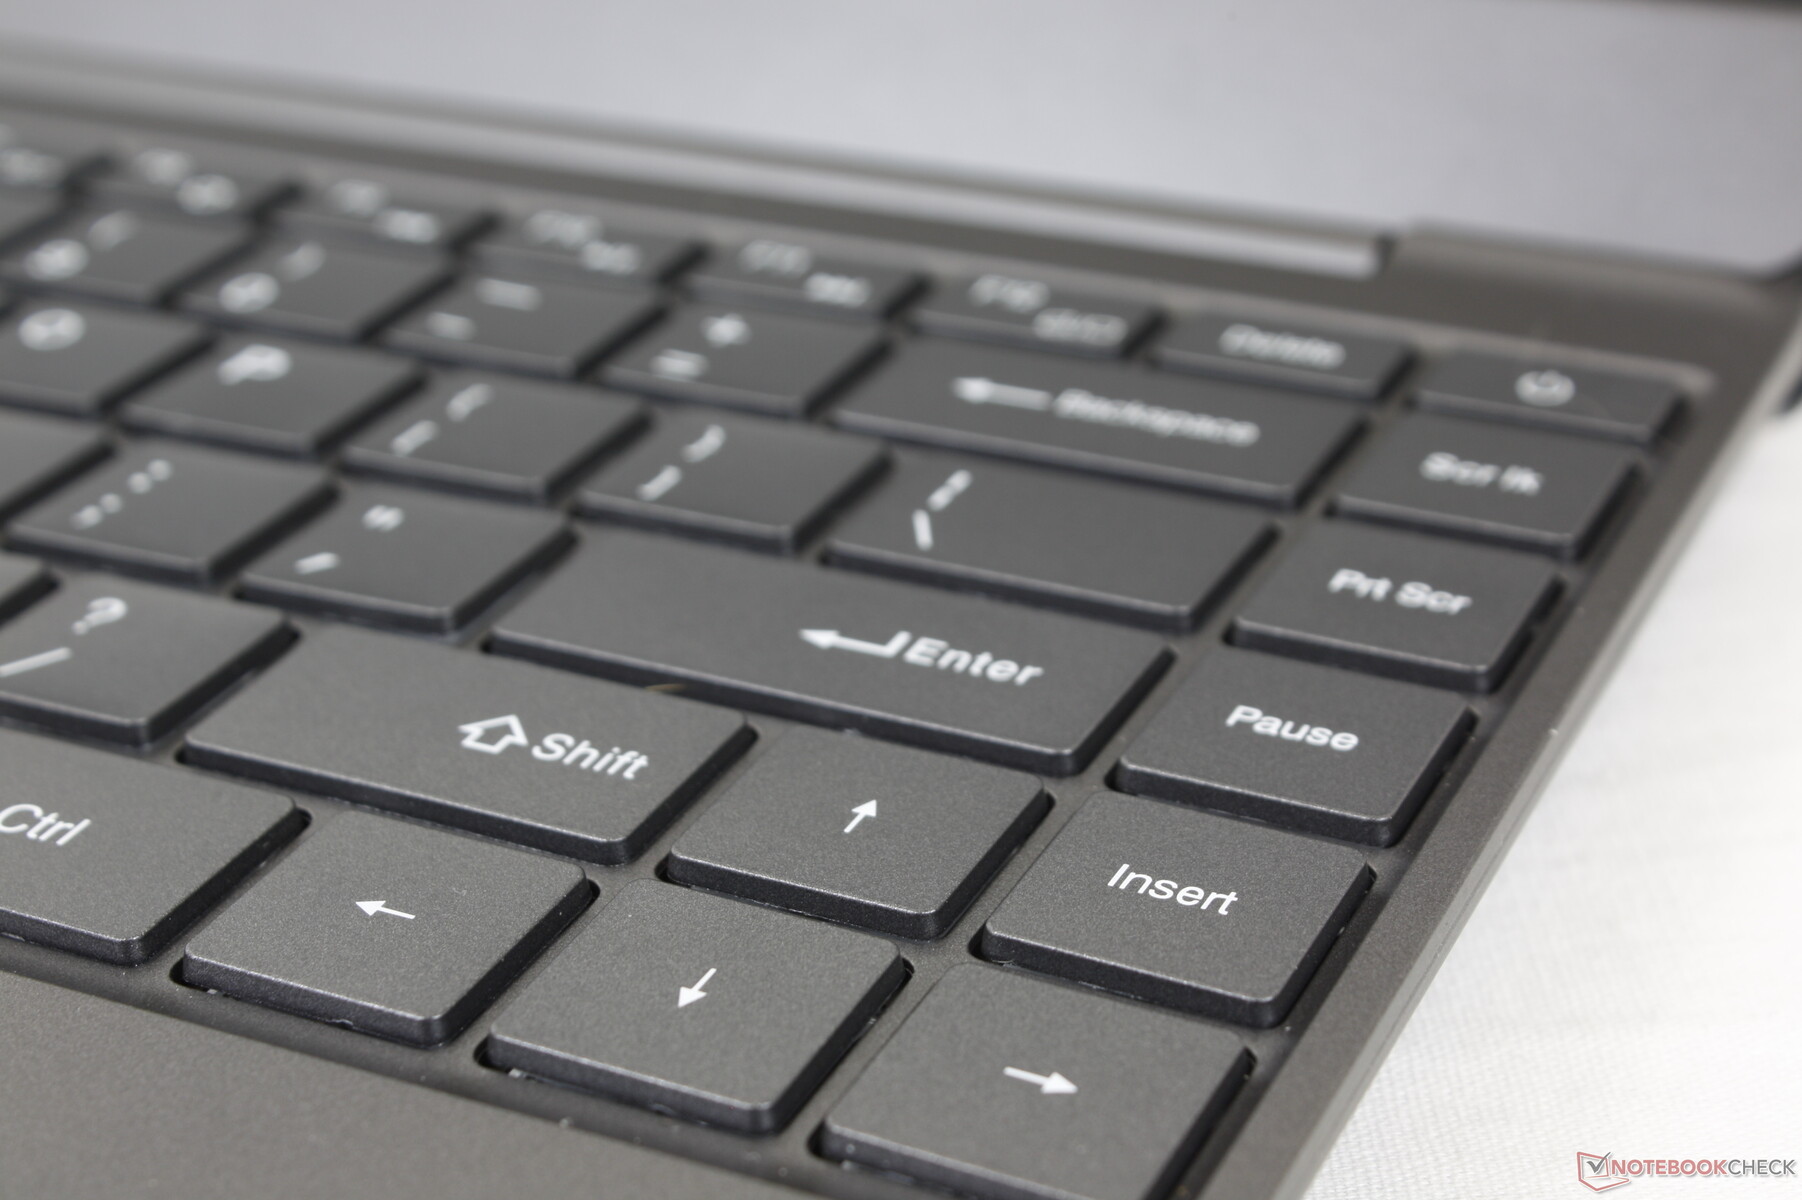
Clavier
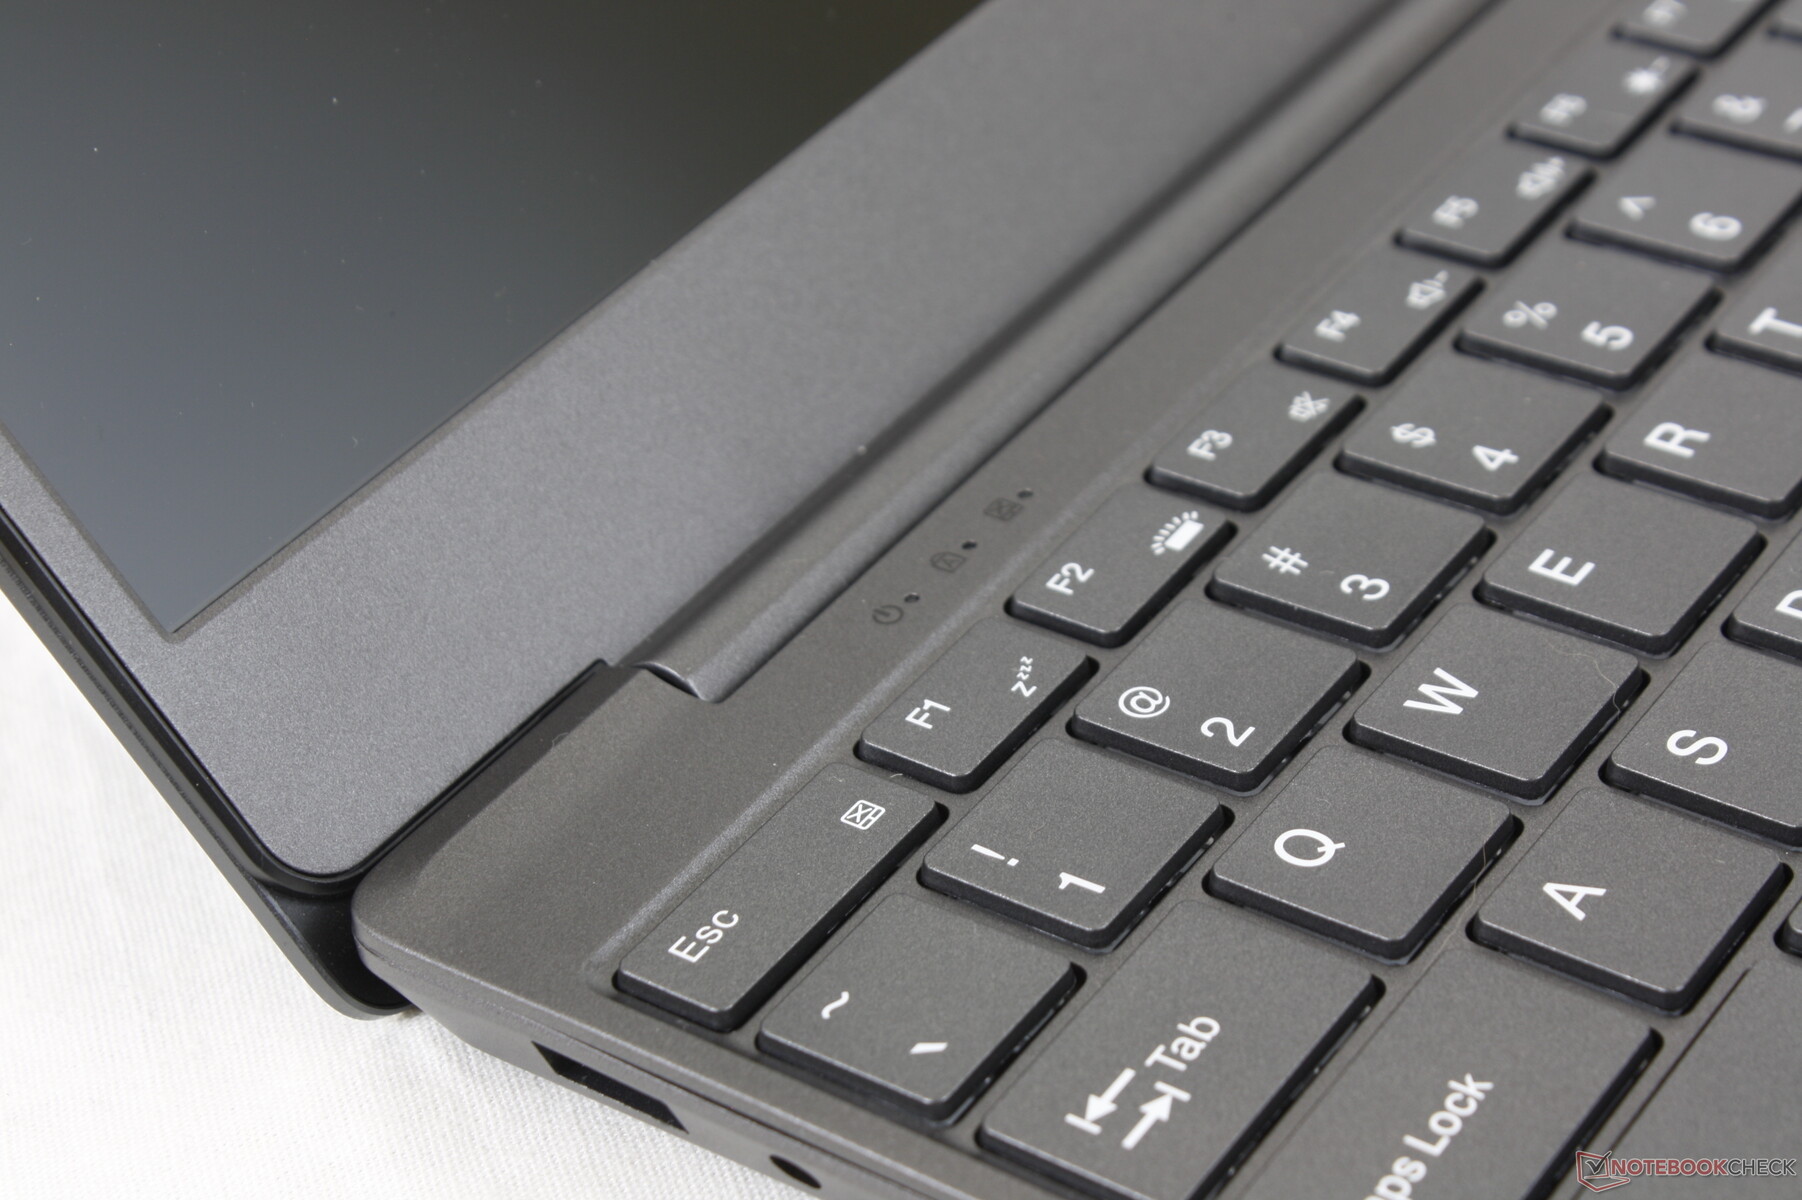
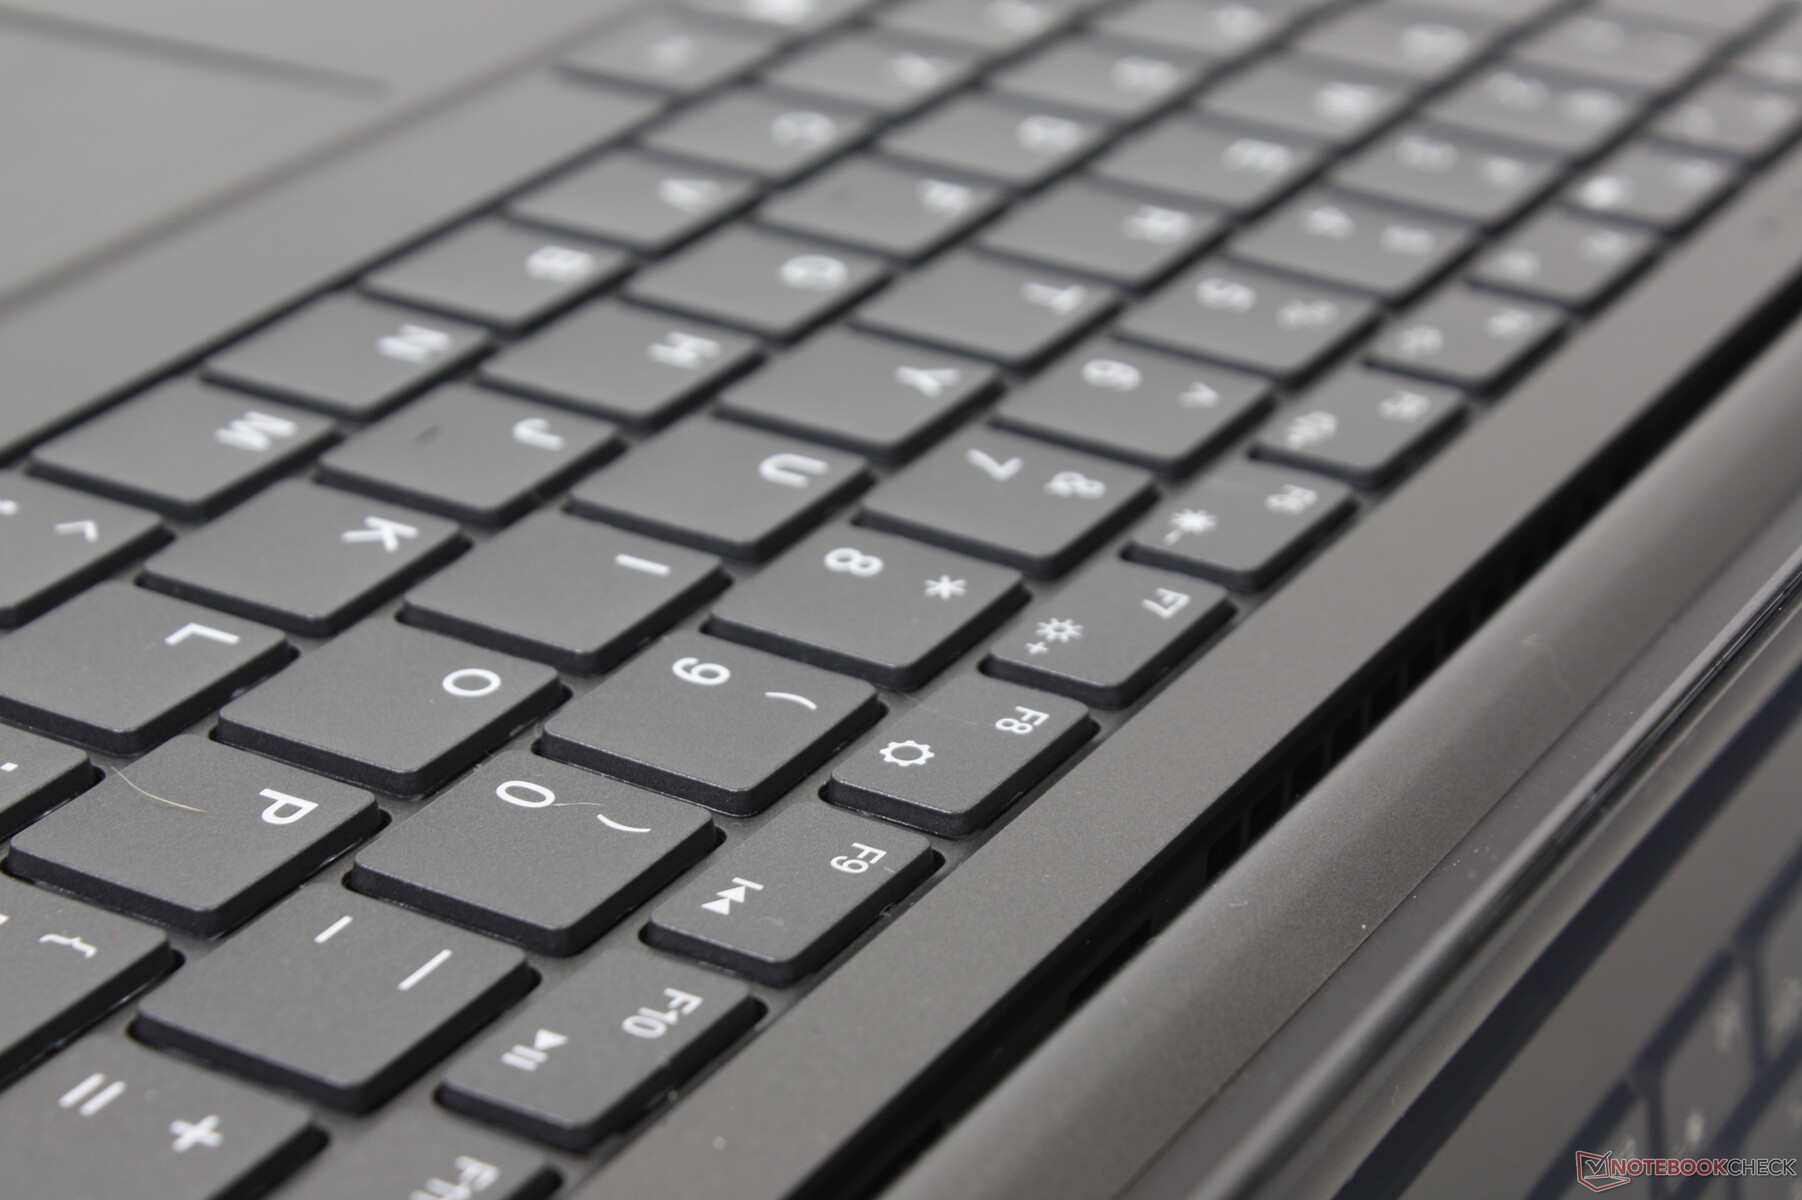
Le retour et la course des touches sont légèrement plus profonds et plus fermes que ceux des touches d'un ordinateur portable Lenovo IdeaPad. Cependant, l'uniformité du retour d'information des touches est médiocre car certaines touches sont beaucoup plus spongieuses que d'autres. La touche Espace, en particulier, est nettement plus molle, ce qui gâche l'expérience de frappe sur le BMax.
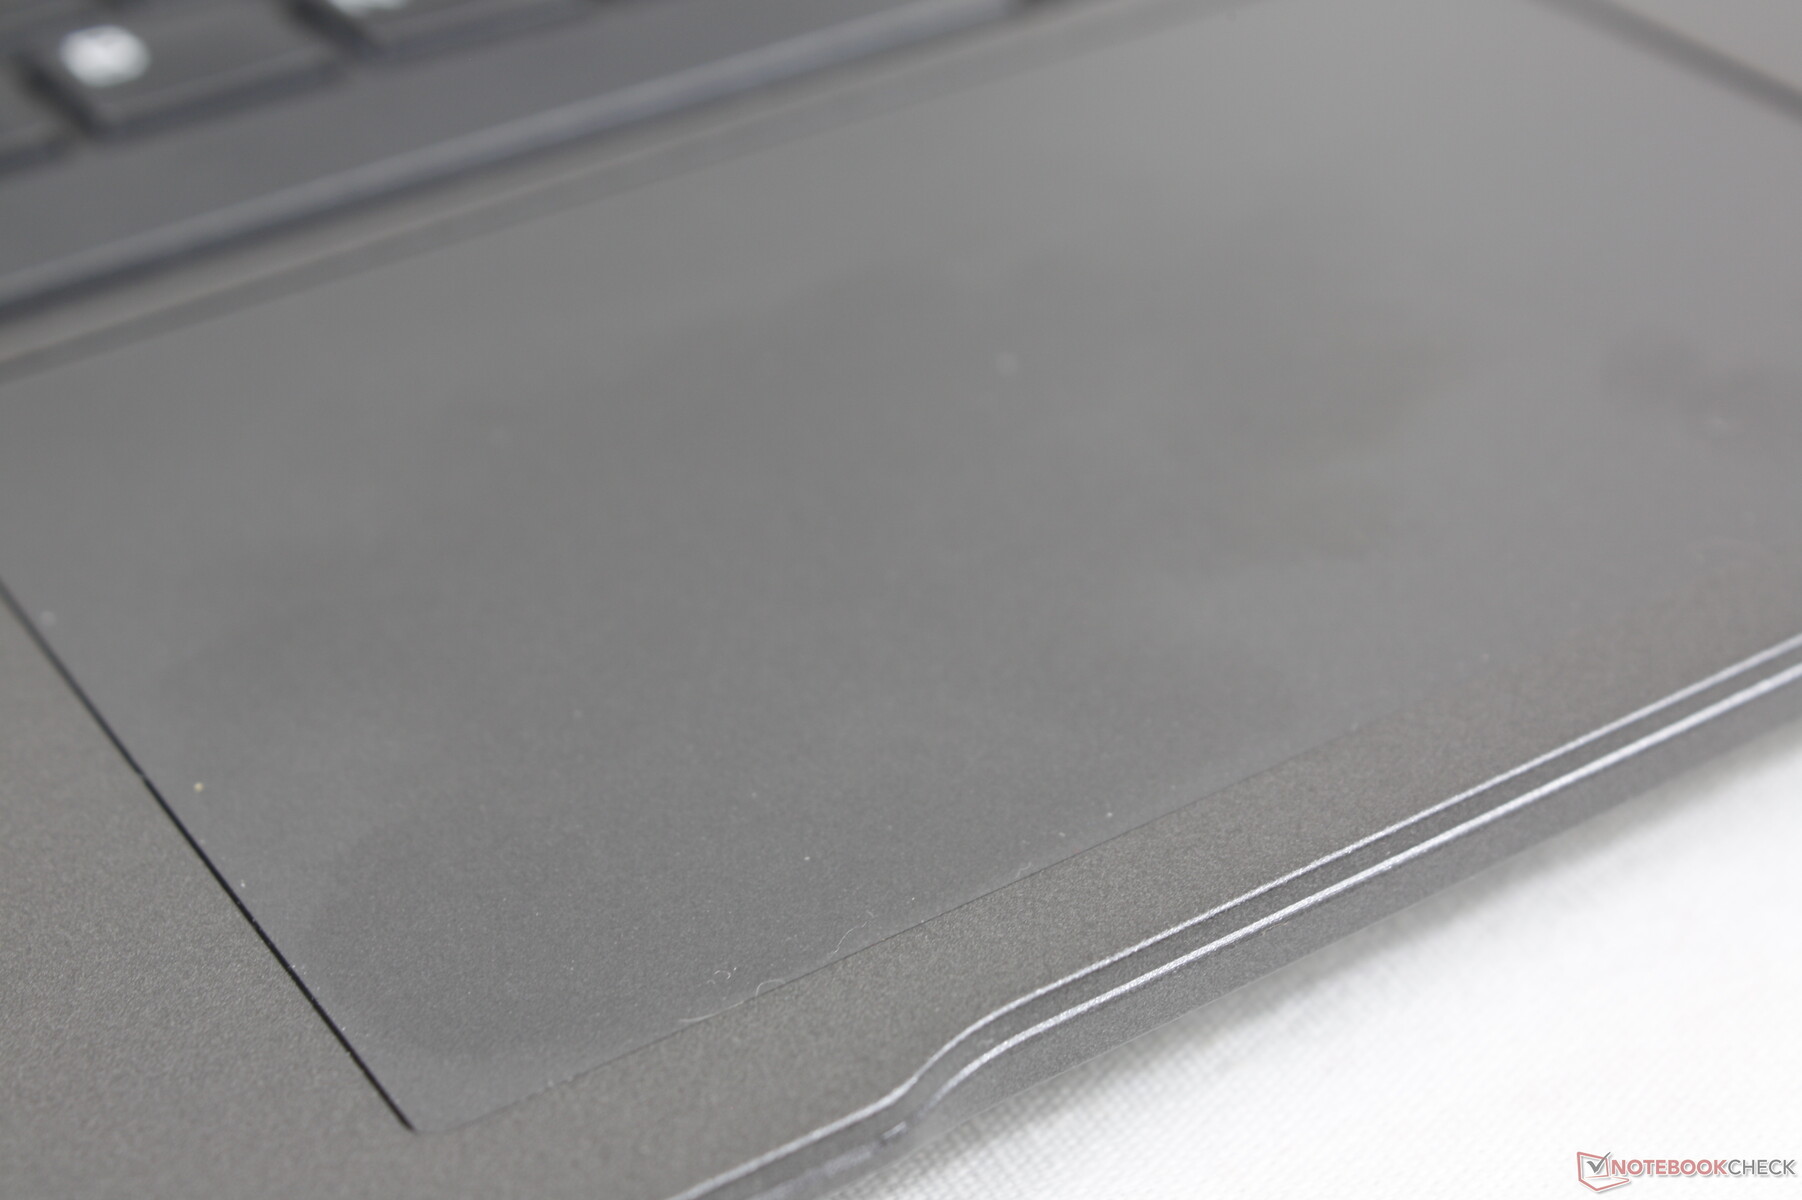
Pavé tactile
Le pavé tactile compatible avec le site Precision est raisonnablement grand (11,5 x 7,3 cm), contre 10,5 x 7 cm pour l'IdeaPad 5 Pro de Lenovo.Lenovo IdeaPad 5 Pro 14. Contrairement au clickpad de certains portables Chuwi, celui du BMax est fiable et sans problème de saut de curseur. Sa surface est lisse lorsqu'il glisse à des vitesses moyennes ou élevées, tandis que les vitesses inférieures ont tendance à être plus collantes.

Afficher
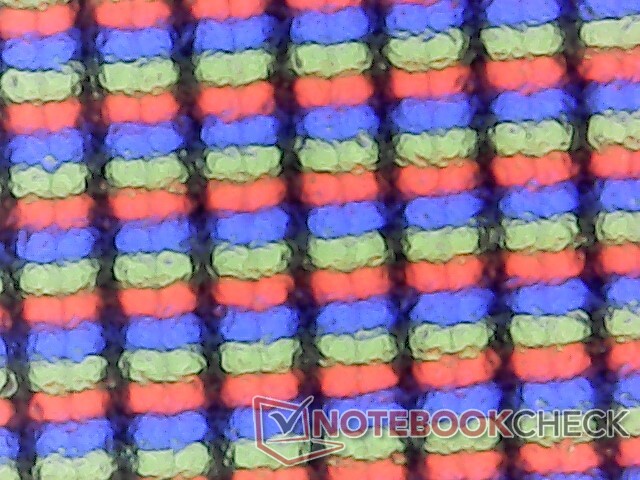
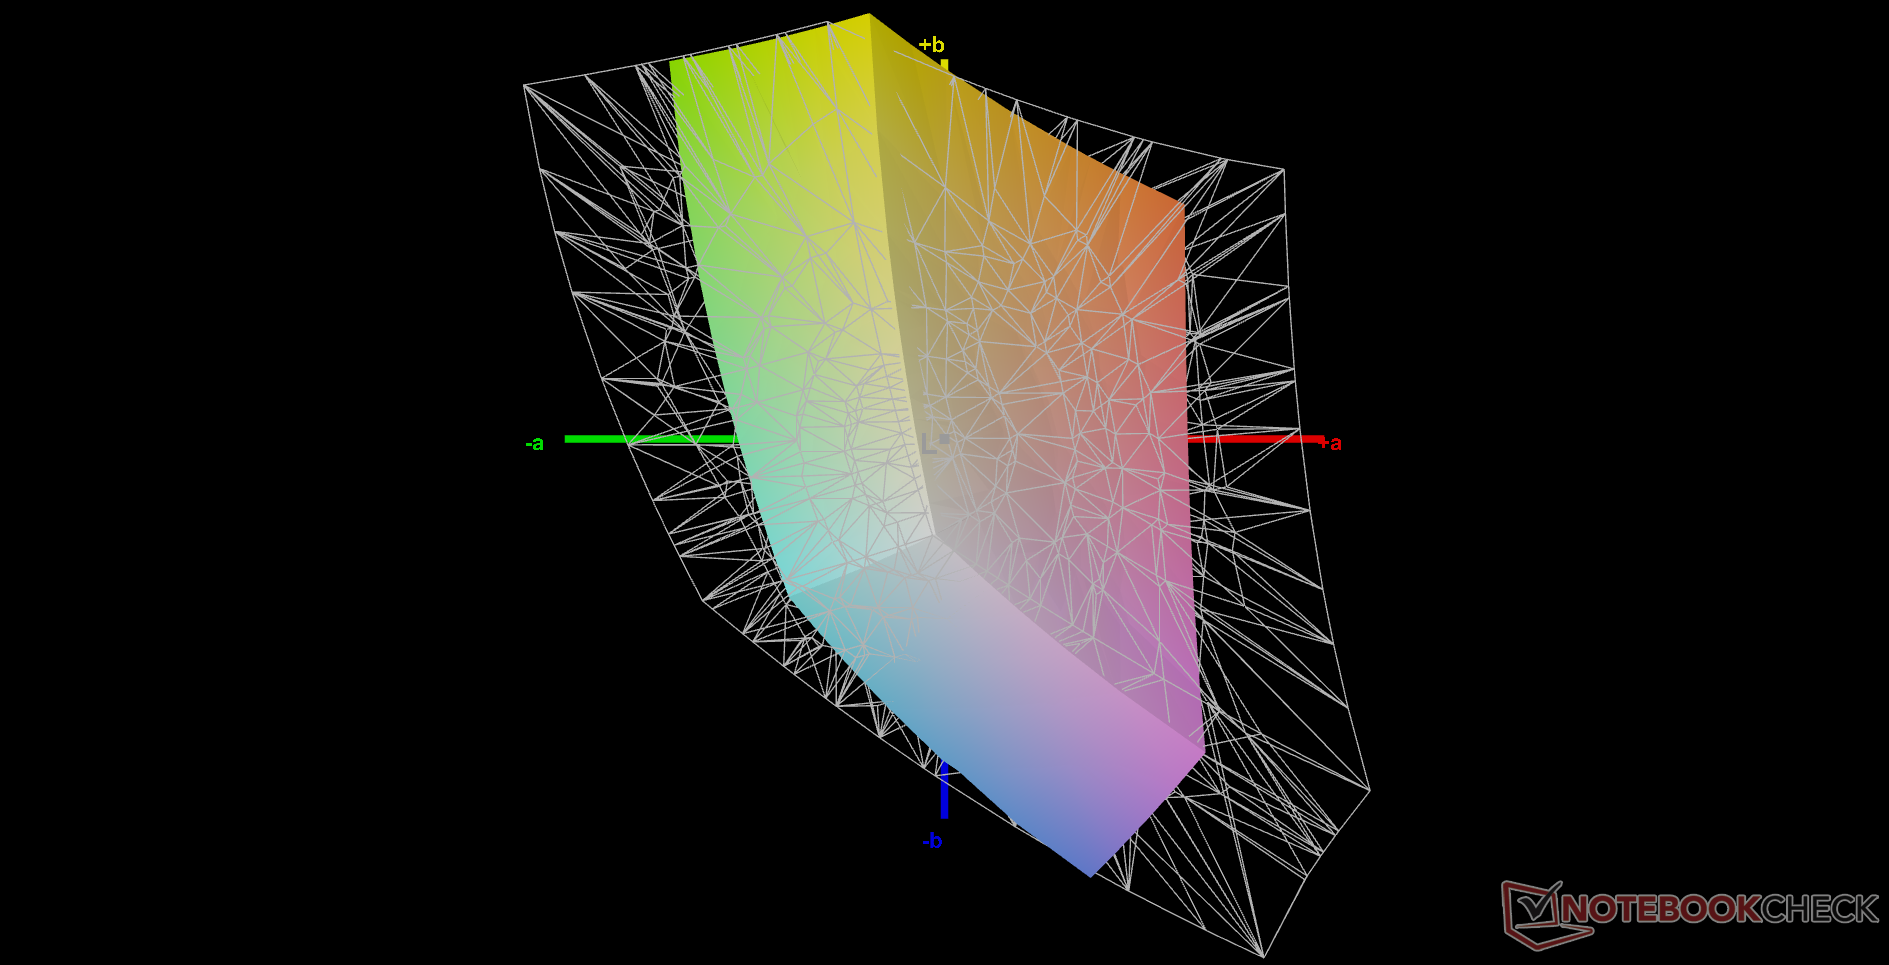
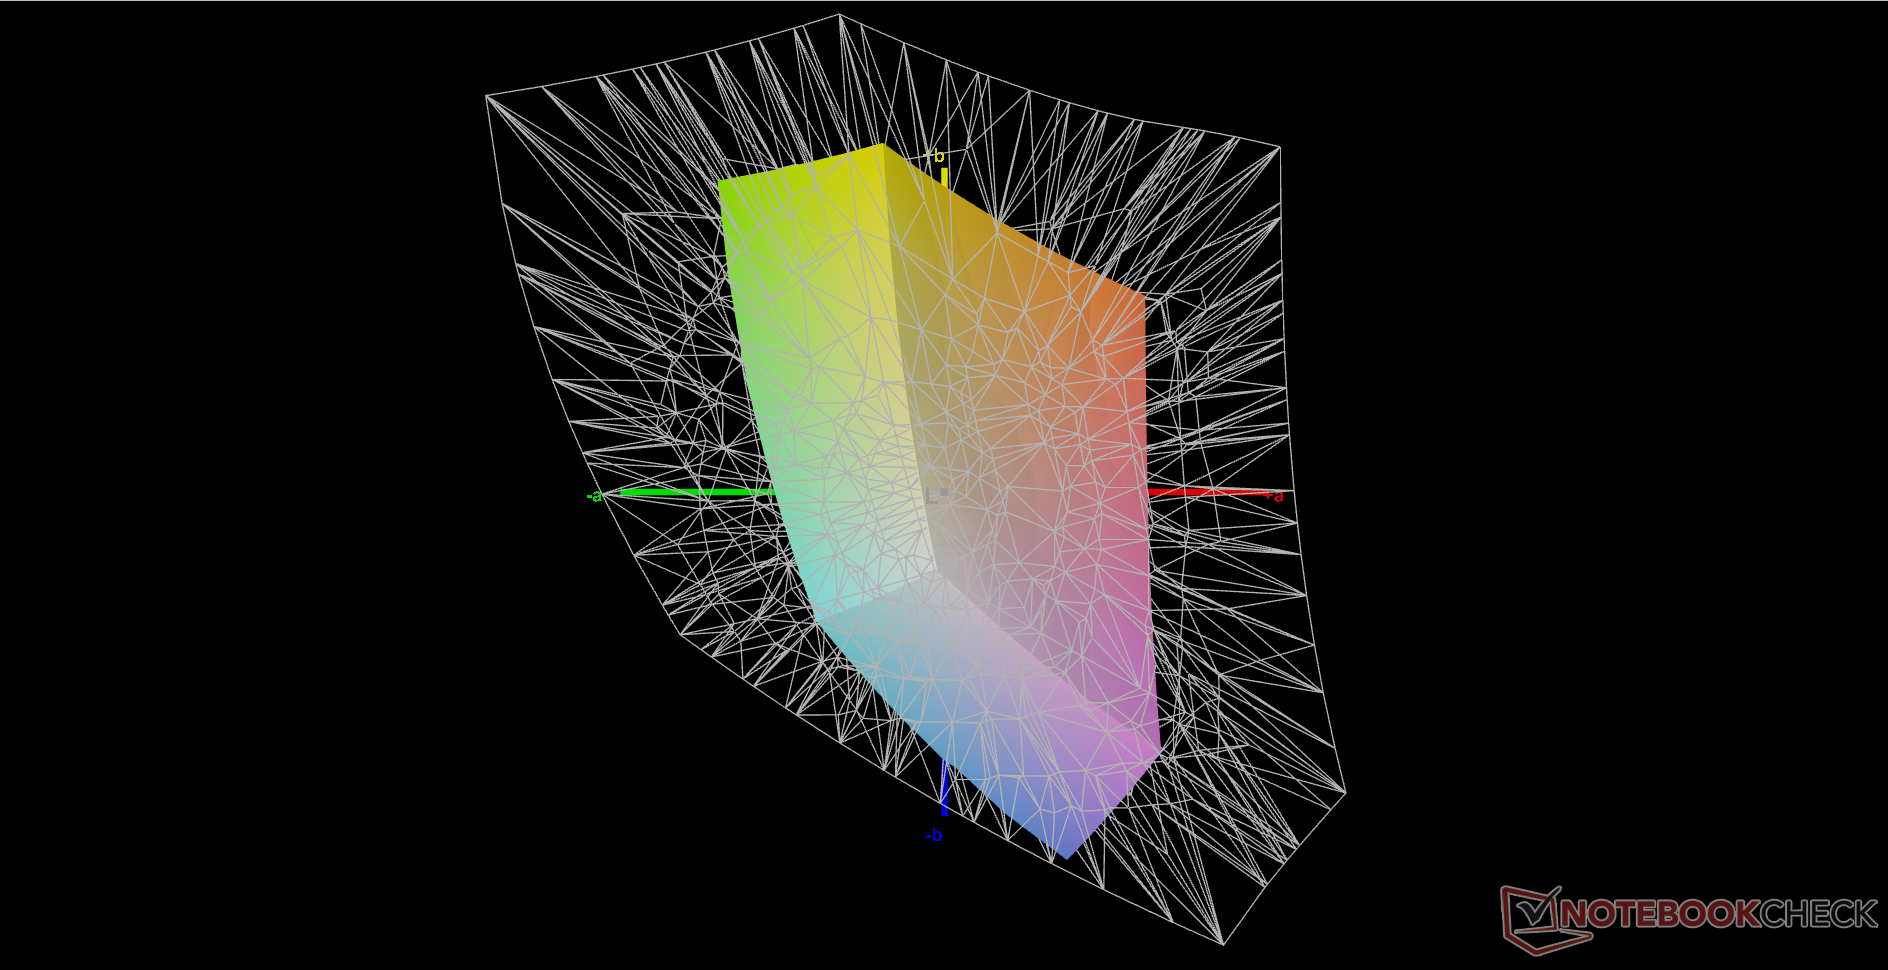
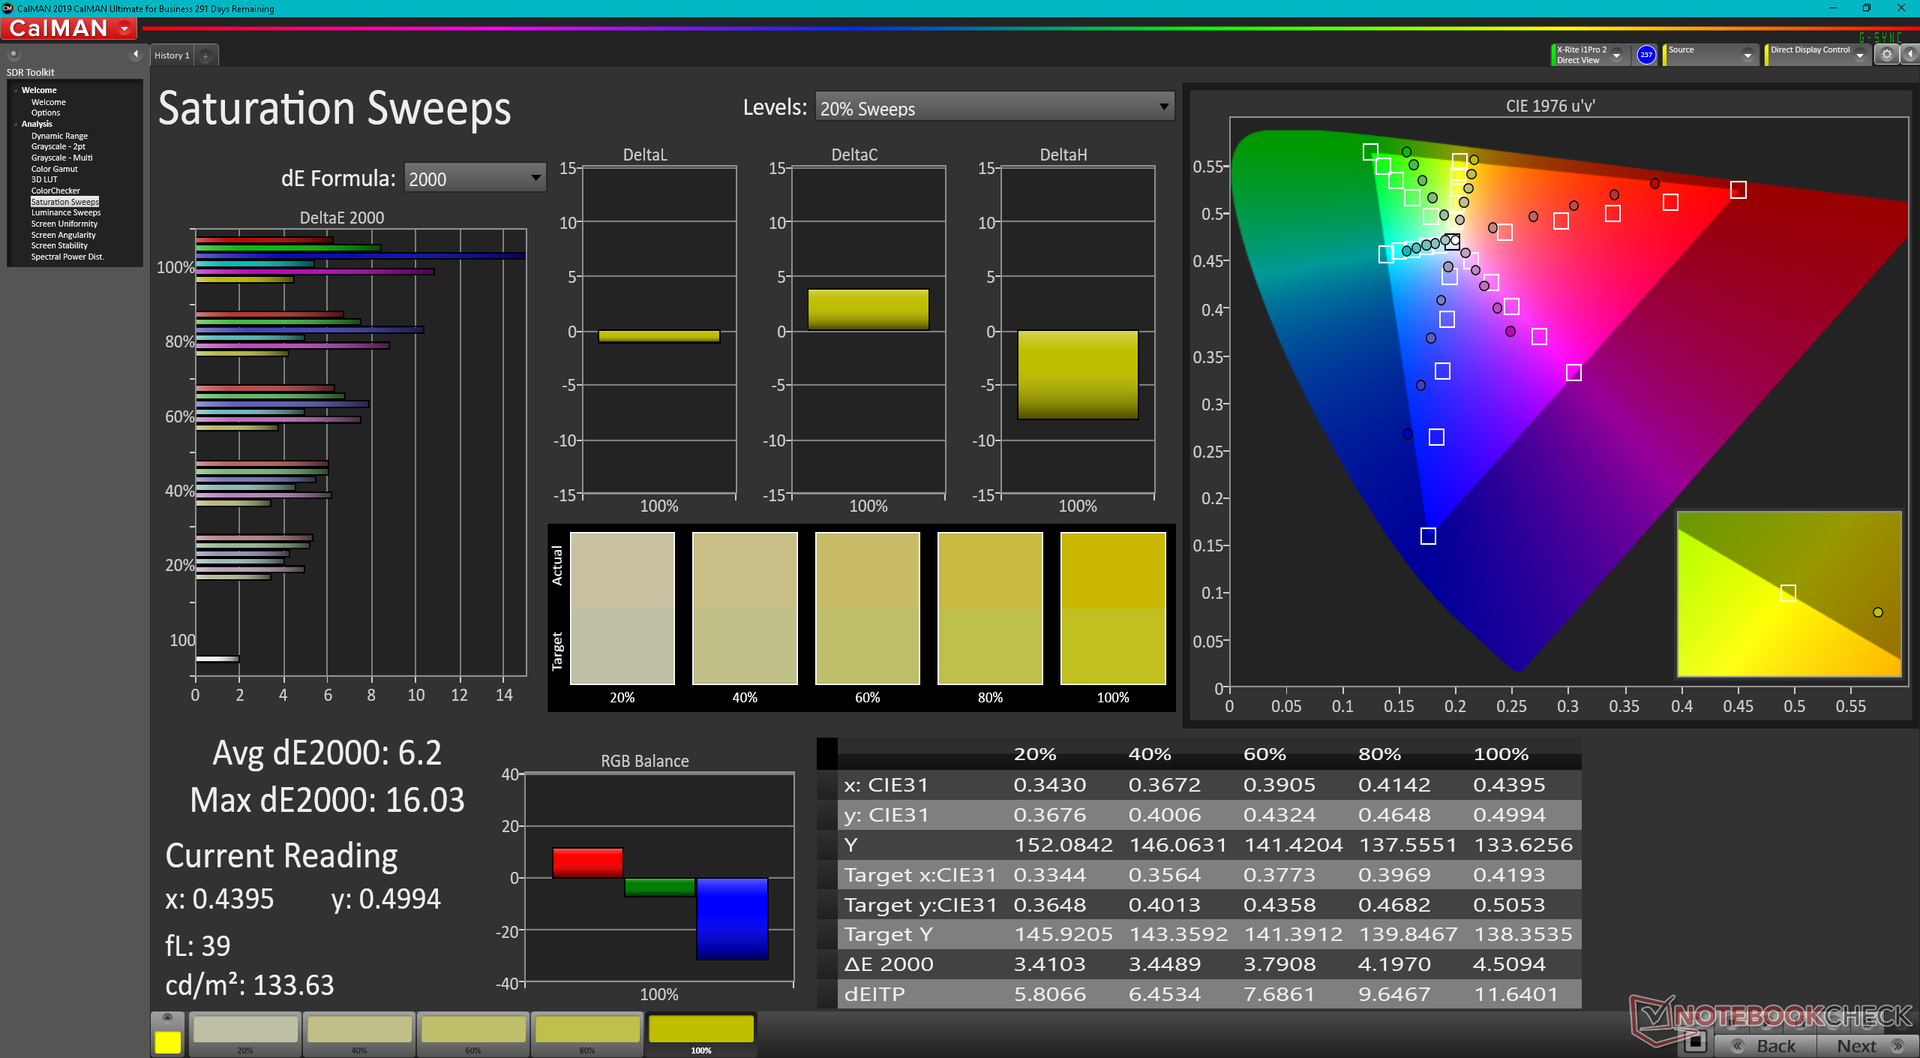
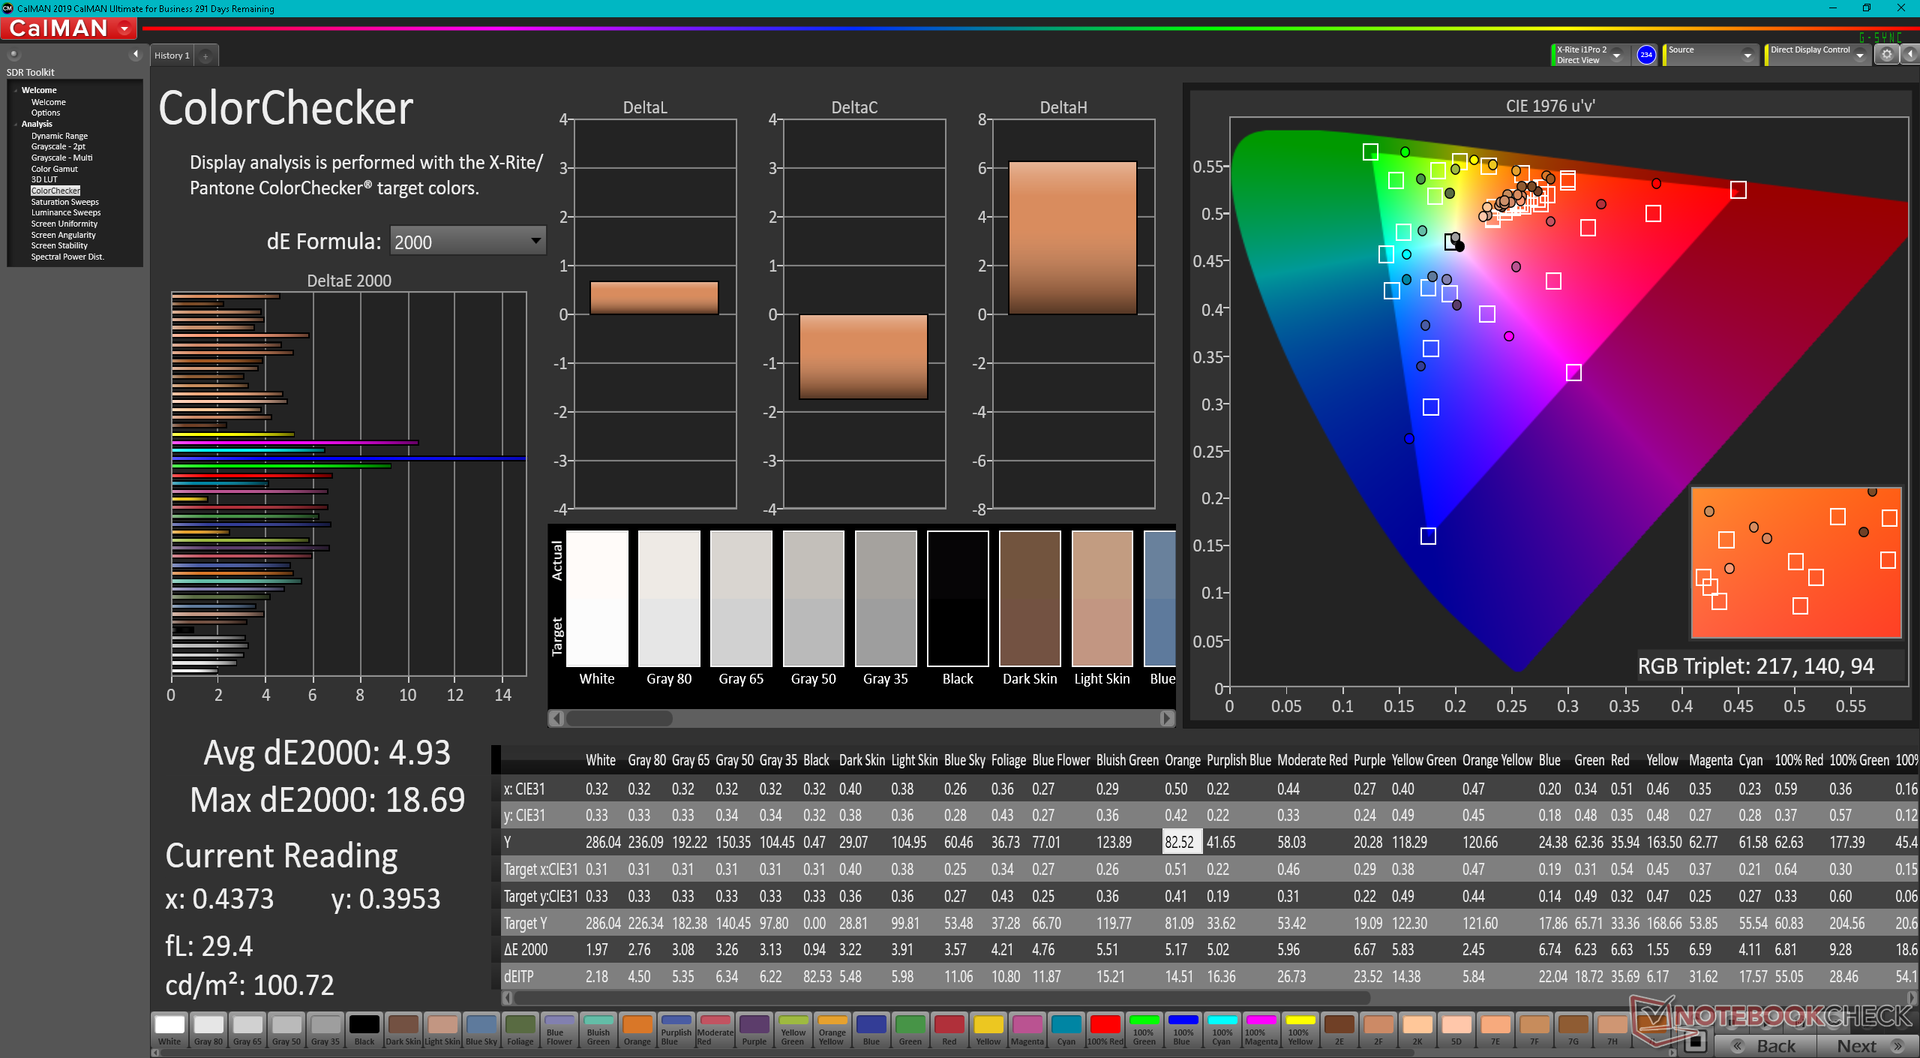
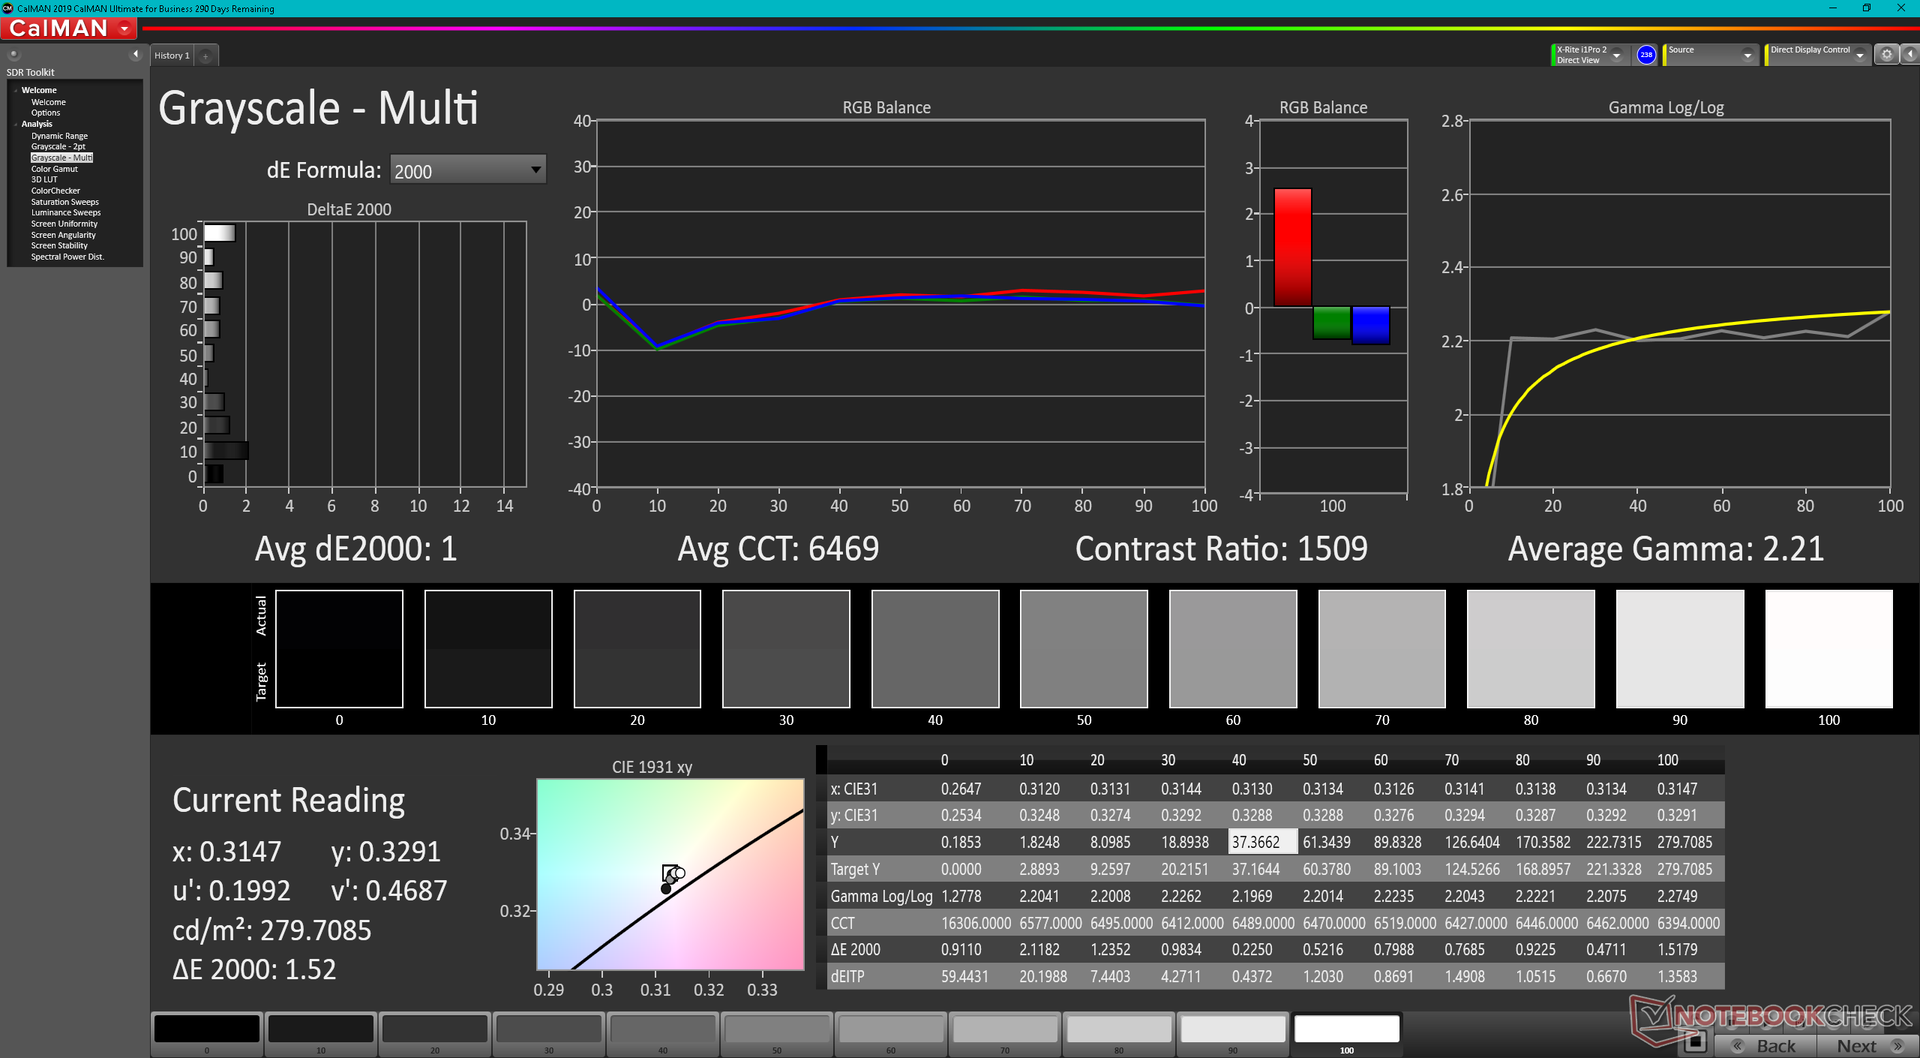
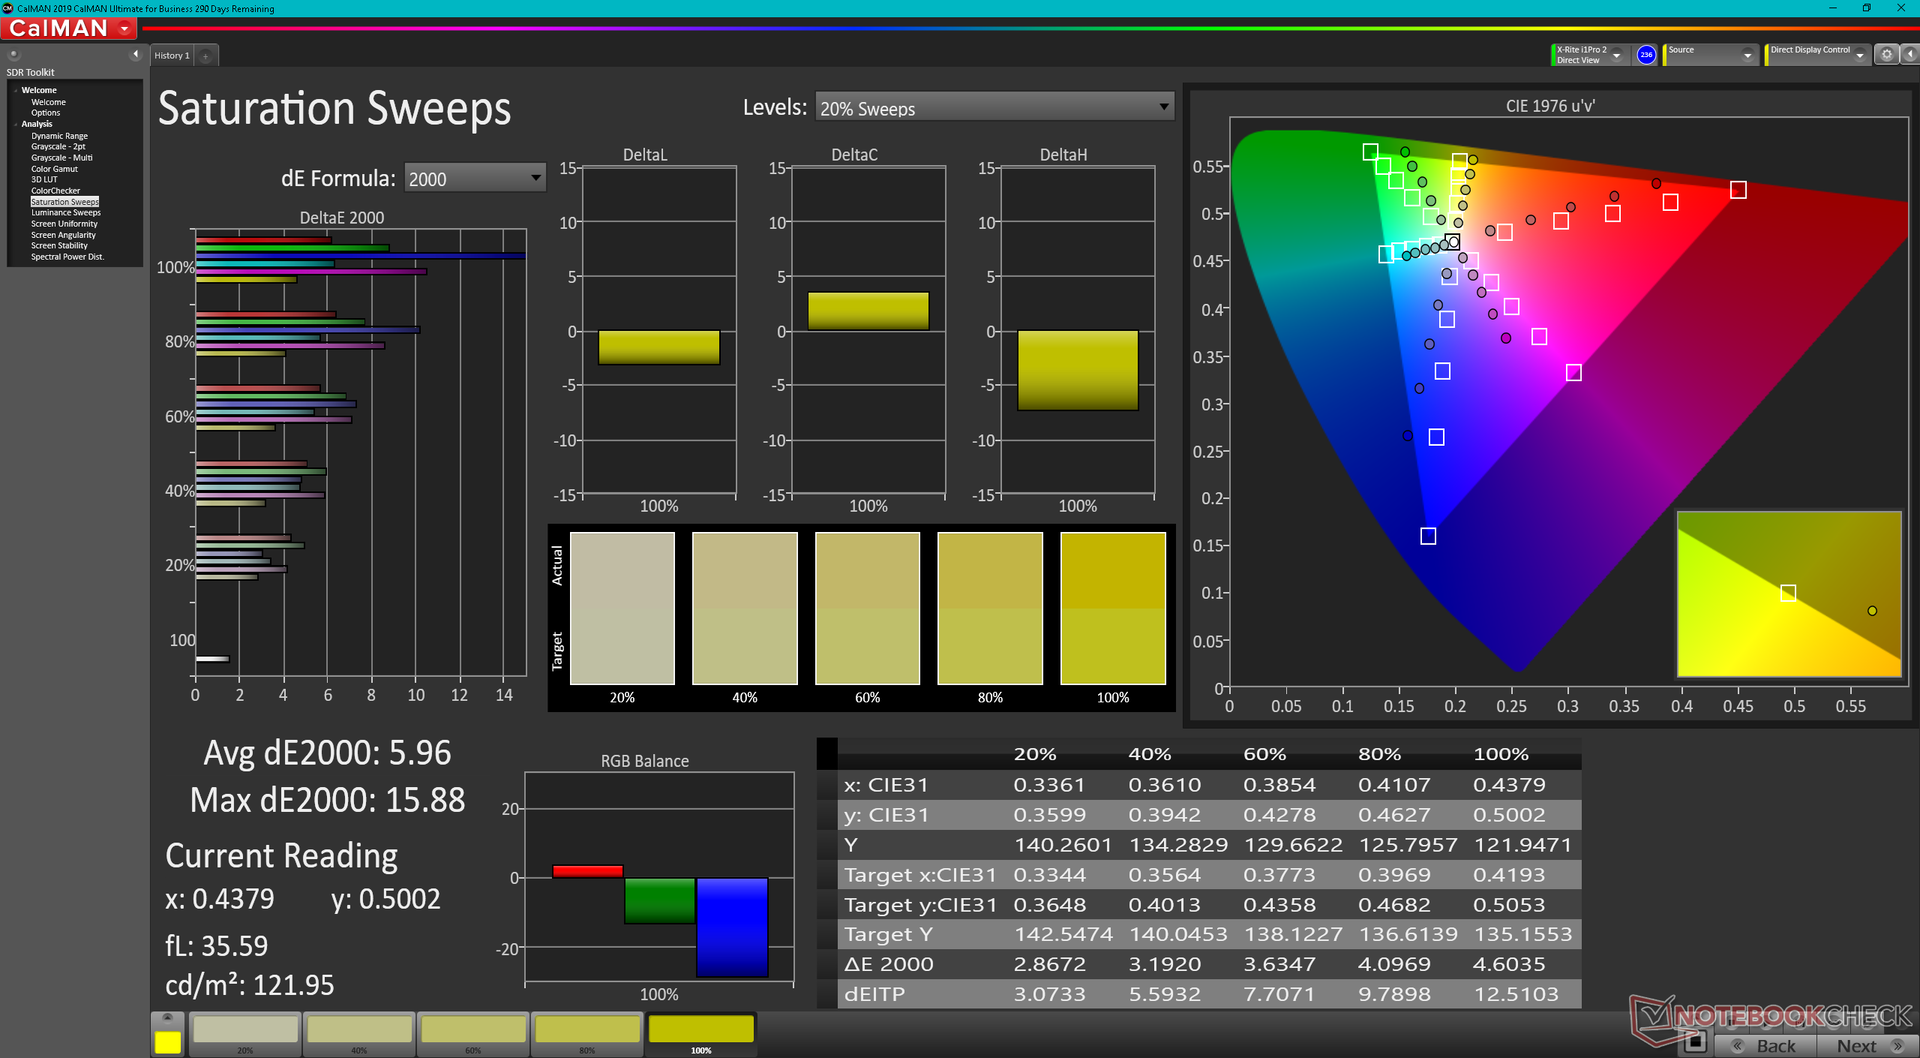
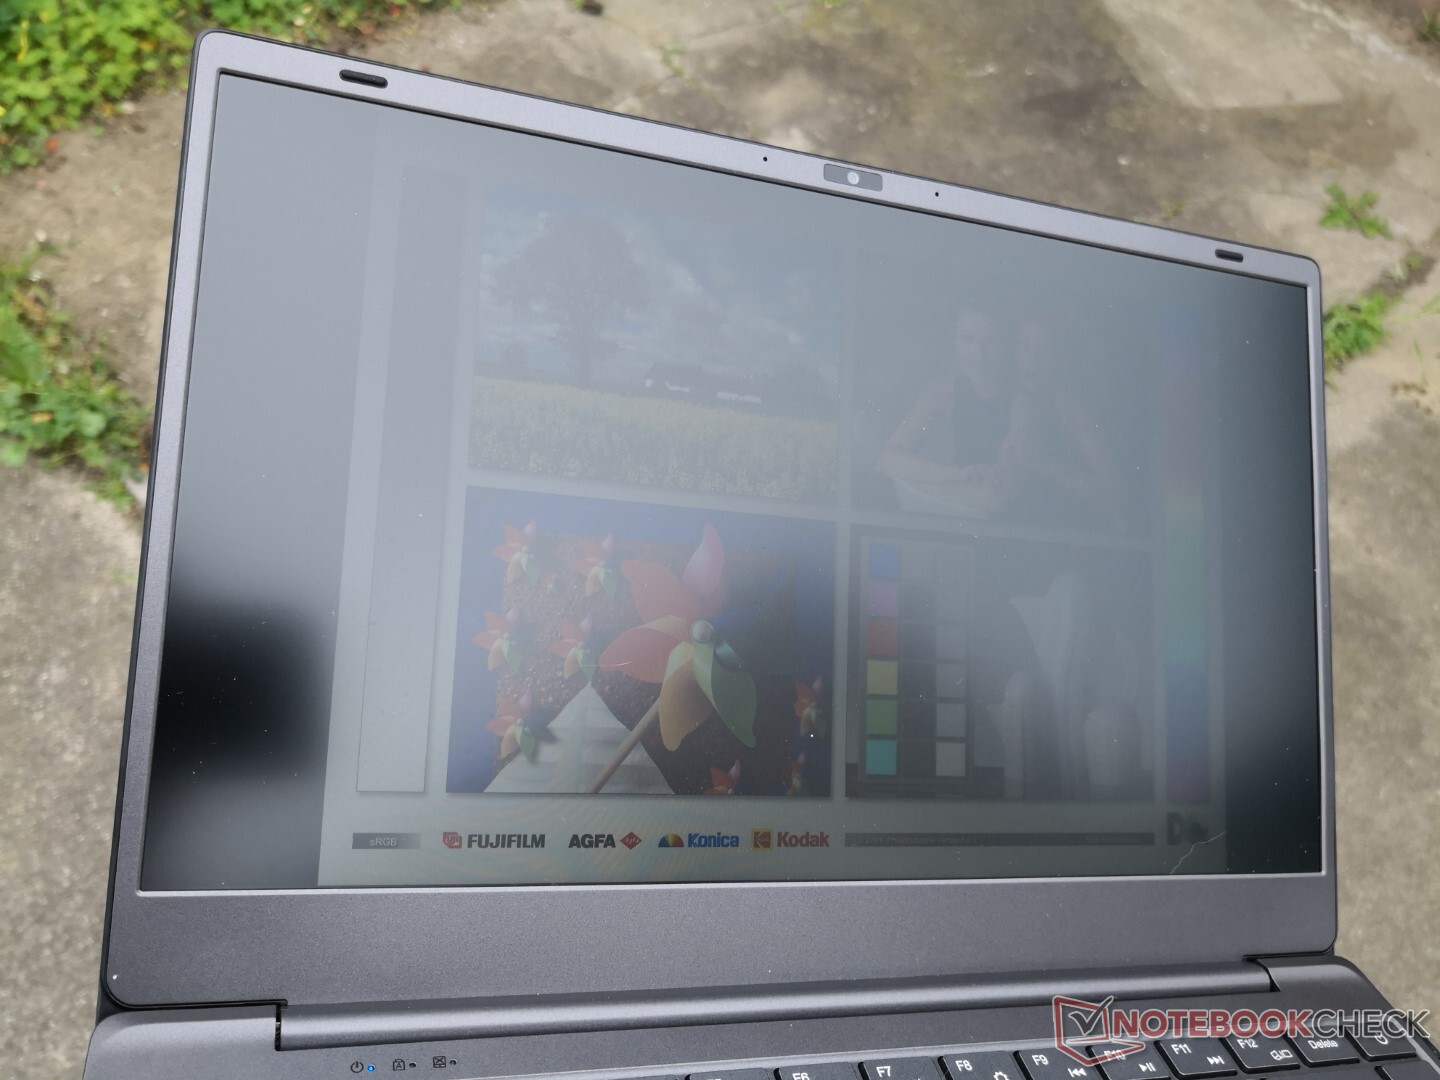
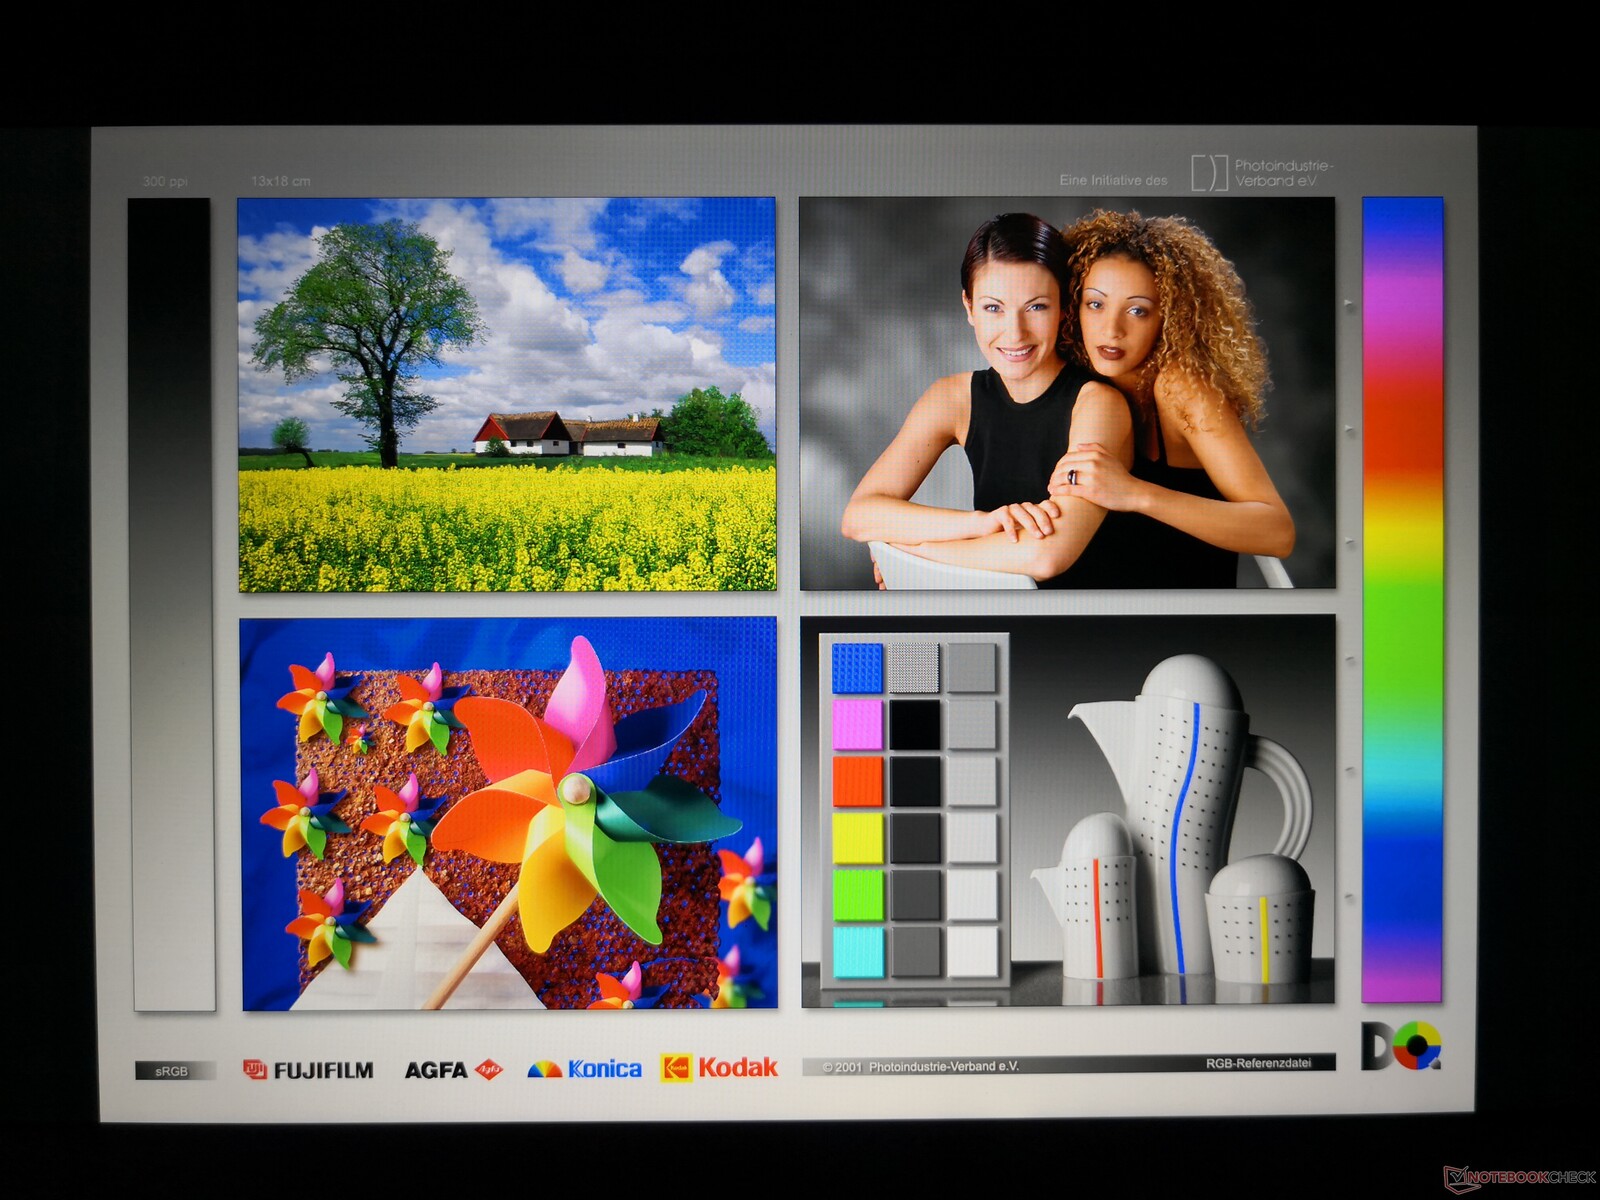
Le BMax utilise le même panneau BOE NV140FHM-N48 IPS que l'on trouve sur leLenovo ThinkPad E14,ThinkPad L14 G2ou IdeaPad S540. Il s'agit d'une dalle économique avec une couverture de couleur limitée, des temps de réponse noir-blanc et gris-gris lents, et un contraste limité comme le montrent nos mesures X-Rite ci-dessous.
Il convient de mentionner que le fabricant annonce actuellement un écran de 14,1 pouces avec une couverture sRGB complète. En réalité, le X14 Pro a un écran de 14,0 pouces avec une couverture sRGB de seulement 59%. Nous ne recommandons pas l'achat de ce BMax si la couverture sRGB complète est importante pour vos charges de travail.
| |||||||||||||||||||||||||
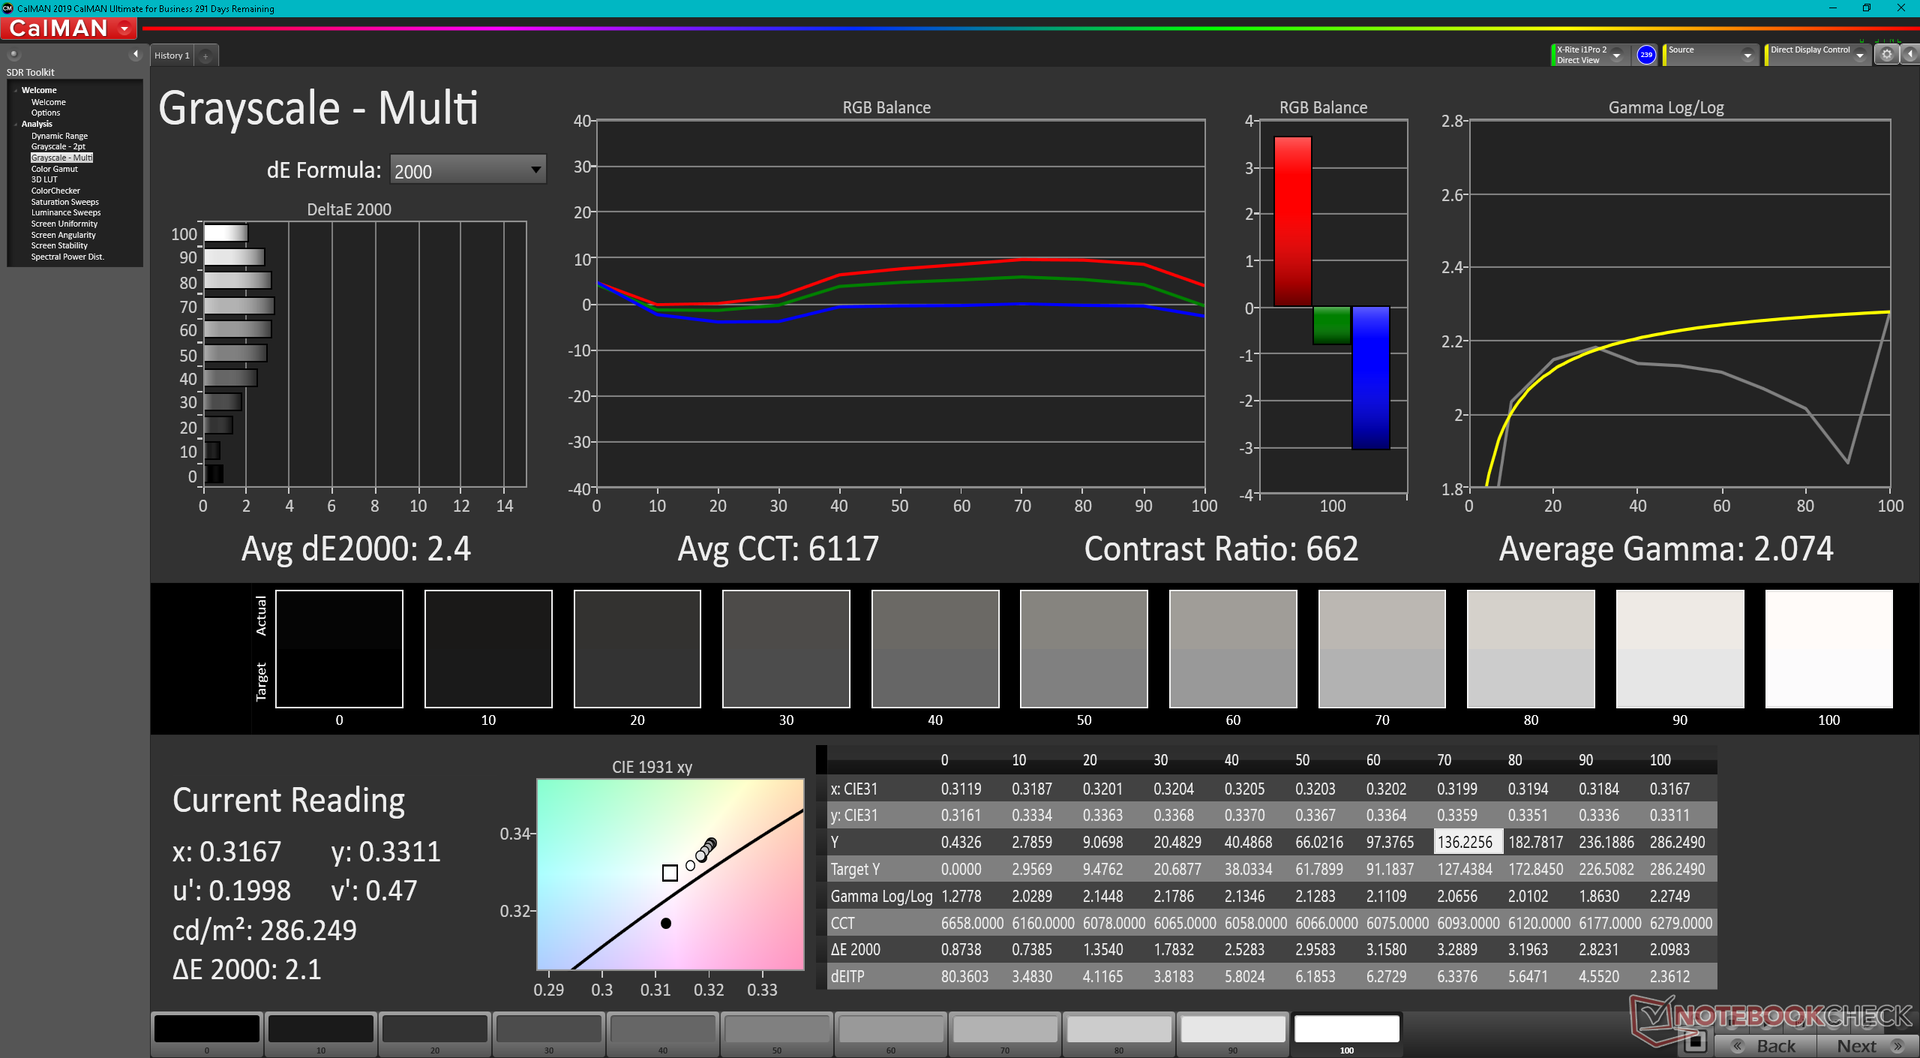
Homogénéité de la luminosité: 87 %
Valeur mesurée au centre, sur batterie: 285.4 cd/m²
Contraste: 571:1 (Valeurs des noirs: 0.5 cd/m²)
ΔE ColorChecker Calman: 4.93 | ∀{0.5-29.43 Ø4.71}
calibrated: 4.47
ΔE Greyscale Calman: 2.4 | ∀{0.09-98 Ø4.96}
41.7% AdobeRGB 1998 (Argyll 3D)
59.2% sRGB (Argyll 3D)
40.4% Display P3 (Argyll 3D)
Gamma: 2.07
CCT: 6117 K
| BMAX X14 Pro BOE NV140FHM-N48, IPS, 1920x1080, 14" | Lenovo IdeaPad 5 Pro 14ACN6 LEN140WUXGA+, IPS, 2240x1400, 14" | Dell Inspiron 14 7400 7415 2-in-1 Chi Mei 140HCA, IPS, 1920x1080, 14" | HP Pavilion 14-dv0357ng LGD0619, IPS, 1920x1080, 14" | Huawei MateBook 14 2020 Intel TV140WTM-NH0, IPS LED, 2160x1440, 14" | Infinix INBook X2 140PM42D1568, IPS, 1920x1080, 14" | |
|---|---|---|---|---|---|---|
| Display | 75% | 6% | 53% | 66% | 53% | |
| Display P3 Coverage (%) | 40.4 | 72.2 79% | 42.5 5% | 62 53% | 67.1 66% | 62.7 55% |
| sRGB Coverage (%) | 59.2 | 99.5 68% | 63.1 7% | 92 55% | 99.1 67% | 89.2 51% |
| AdobeRGB 1998 Coverage (%) | 41.7 | 74.3 78% | 44 6% | 63 51% | 69 65% | 64.1 54% |
| Response Times | 14% | 38% | 46% | 38% | -14% | |
| Response Time Grey 50% / Grey 80% * (ms) | 62.8 ? | 45.2 ? 28% | 28.8 ? 54% | 37 ? 41% | 37.6 ? 40% | 65.2 ? -4% |
| Response Time Black / White * (ms) | 34.8 ? | 35.2 ? -1% | 27.6 ? 21% | 17 ? 51% | 22.4 ? 36% | 43.2 ? -24% |
| PWM Frequency (Hz) | 59520 ? | 10000 ? | ||||
| Screen | 39% | -17% | 14% | 50% | 13% | |
| Brightness middle (cd/m²) | 285.4 | 310.6 9% | 262.7 -8% | 387 36% | 458 60% | 368 29% |
| Brightness (cd/m²) | 267 | 302 13% | 245 -8% | 359 34% | 448 68% | 331 24% |
| Brightness Distribution (%) | 87 | 92 6% | 84 -3% | 84 -3% | 89 2% | 82 -6% |
| Black Level * (cd/m²) | 0.5 | 0.22 56% | 0.37 26% | 0.55 -10% | 0.25 50% | 0.39 22% |
| Contrast (:1) | 571 | 1412 147% | 710 24% | 704 23% | 1832 221% | 944 65% |
| Colorchecker dE 2000 * | 4.93 | 2.67 46% | 6.23 -26% | 4.04 18% | 3.4 31% | 4.9 1% |
| Colorchecker dE 2000 max. * | 18.69 | 4.54 76% | 22.62 -21% | 8.28 56% | 6.7 64% | 8.22 56% |
| Colorchecker dE 2000 calibrated * | 4.47 | 2.33 48% | 1.8 60% | 1 78% | 1.7 62% | 1.59 64% |
| Greyscale dE 2000 * | 2.4 | 3.7 -54% | 7.1 -196% | 5 -108% | 4.9 -104% | 5.8 -142% |
| Gamma | 2.07 106% | 2.12 104% | 2.22 99% | 2.62 84% | 2.16 102% | 2.13 103% |
| CCT | 6117 106% | 6398 102% | 6241 104% | 7123 91% | 7704 84% | 7163 91% |
| Color Space (Percent of AdobeRGB 1998) (%) | 63.5 | |||||
| Color Space (Percent of sRGB) (%) | 99.1 | |||||
| Moyenne finale (programmes/paramètres) | 43% /
43% | 9% /
-4% | 38% /
27% | 51% /
52% | 17% /
18% |
* ... Moindre est la valeur, meilleures sont les performances
L'écran est correctement calibré dès sa sortie de l'emballage, malgré sa température de couleur chaude. Les valeurs DeltaE moyennes ne s'améliorent que marginalement après l'étalonnage avec notre colorimètre X-Rite en raison de l'espace colorimétrique étroit du panneau mentionné ci-dessus.
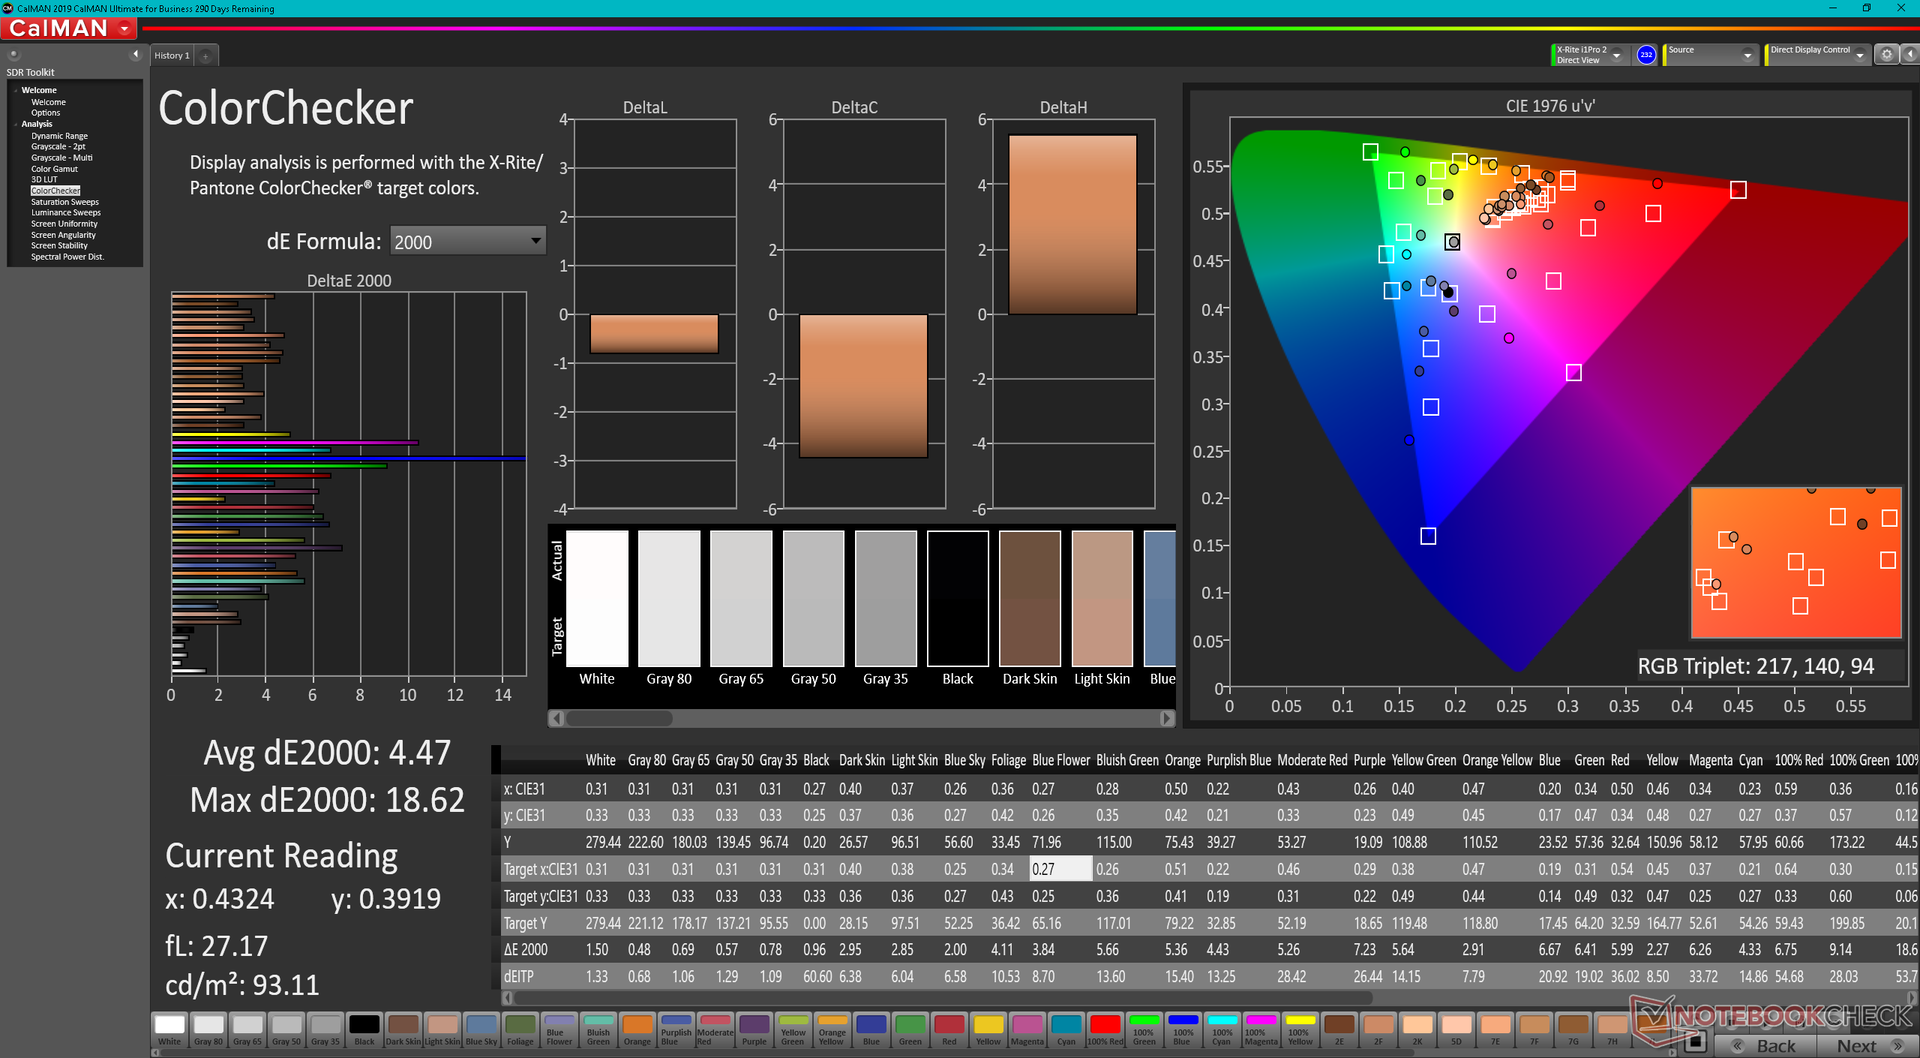
Temps de réponse de l'écran
| ↔ Temps de réponse noir à blanc | ||
|---|---|---|
| 34.8 ms ... hausse ↗ et chute ↘ combinées | ↗ 18.4 ms hausse | 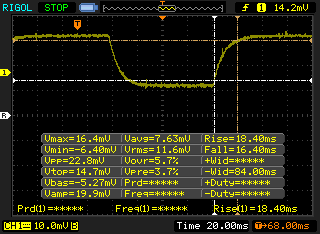 |
| ↘ 16.4 ms chute | ||
| L'écran souffre de latences très élevées, à éviter pour le jeu. En comparaison, tous les appareils testés affichent entre 0.1 (minimum) et 240 (maximum) ms. » 92 % des appareils testés affichent de meilleures performances. Cela signifie que les latences relevées sont moins bonnes que la moyenne (19.8 ms) de tous les appareils testés. | ||
| ↔ Temps de réponse gris 50% à gris 80% | ||
| 62.8 ms ... hausse ↗ et chute ↘ combinées | ↗ 32.8 ms hausse | 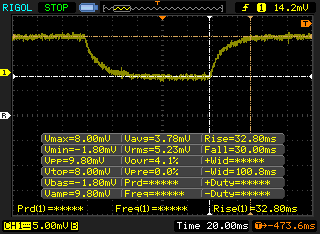 |
| ↘ 30 ms chute | ||
| L'écran souffre de latences très élevées, à éviter pour le jeu. En comparaison, tous les appareils testés affichent entre 0.165 (minimum) et 636 (maximum) ms. » 97 % des appareils testés affichent de meilleures performances. Cela signifie que les latences relevées sont moins bonnes que la moyenne (30.9 ms) de tous les appareils testés. | ||
Scintillement / MLI (Modulation de largeur d'impulsion)
| Scintillement / MLI (Modulation de largeur d'impulsion) non décelé |  | ||
En comparaison, 52 % des appareils testés n'emploient pas MDI pour assombrir leur écran. Nous avons relevé une moyenne à 7748 (minimum : 5 - maximum : 343500) Hz dans le cas où une MDI était active. | |||
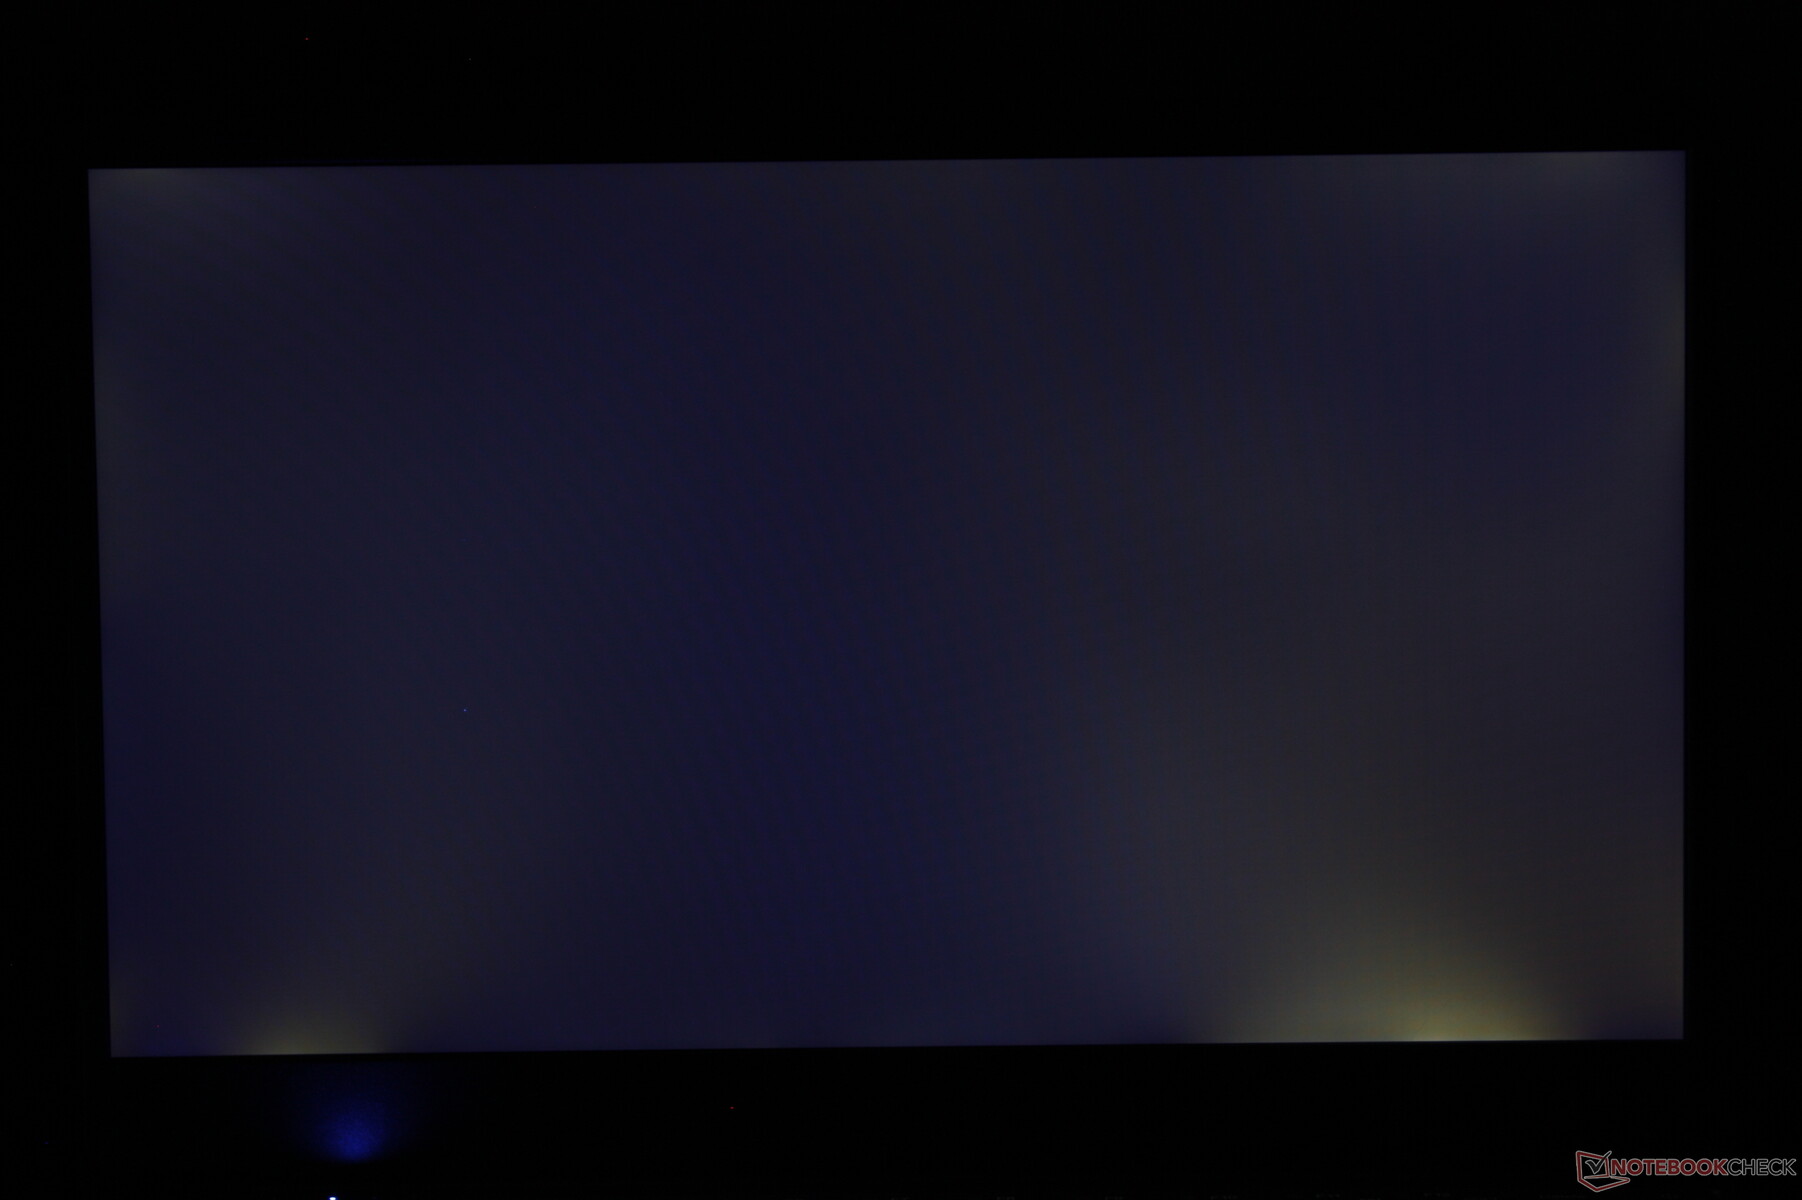
La visibilité extérieure est relativement faible à moyenne au mieux en raison du rétroéclairage <300 nit. Veillez à désactiver la fonction Vari-Bright d'AMD dans le menu Radeon Graphics, sinon la luminosité maximale de l'écran ne sera que de 166 nits lorsqu'il fonctionne sur batterie
Performance
Conditions d'essai
Notre appareil a été réglé en mode Performance avec les derniers pilotes AMD et les dernières mises à jour de Windows avant d'exécuter les benchmarks ci-dessous pour obtenir les meilleurs résultats possibles.
Processeur
Les performances brutes en multithread sont similaires à celles du 11ème Core i3-1115G4 tandis que les performances en mode single-thread sont plus lentes et plus similaires à celles du 10e génération Core i5-1035G1. La série Zen mobile d'AMD n'a pas vraiment décollé en termes de performances avant la génération Zen 2 et donc le Zen+ Ryzen 5 3450U n'est comparable qu'aux processeurs Intel Core bas de gamme.
Cinebench R15 Multi Loop
Cinebench R23: Multi Core | Single Core
Cinebench R15: CPU Multi 64Bit | CPU Single 64Bit
Blender: v2.79 BMW27 CPU
7-Zip 18.03: 7z b 4 | 7z b 4 -mmt1
Geekbench 5.5: Multi-Core | Single-Core
HWBOT x265 Benchmark v2.2: 4k Preset
LibreOffice : 20 Documents To PDF
R Benchmark 2.5: Overall mean
| Cinebench R20 / CPU (Multi Core) | |
| Lenovo IdeaPad 5 Pro 14ACN6 | |
| Dell Inspiron 14 7400 7415 2-in-1 | |
| Asus VivoBook Flip 14 TM420IA | |
| Asus ExpertBook B7 Flip B7402FEA | |
| HP Pavilion 14-dv0357ng | |
| Acer Swift 3 SF314-42-R27B | |
| Infinix INBook X2 | |
| Lenovo ThinkBook 14 G2 ITL 20VDS02G00 | |
| BMAX X14 Pro | |
| Moyenne AMD Ryzen 5 3450U (1089 - 1247, n=2) | |
| Lenovo IdeaPad 3 14IIL05 | |
| Cinebench R20 / CPU (Single Core) | |
| Asus ExpertBook B7 Flip B7402FEA | |
| Lenovo IdeaPad 5 Pro 14ACN6 | |
| Lenovo ThinkBook 14 G2 ITL 20VDS02G00 | |
| Dell Inspiron 14 7400 7415 2-in-1 | |
| Asus VivoBook Flip 14 TM420IA | |
| Acer Swift 3 SF314-42-R27B | |
| Infinix INBook X2 | |
| HP Pavilion 14-dv0357ng | |
| BMAX X14 Pro | |
| Lenovo IdeaPad 3 14IIL05 | |
| Moyenne AMD Ryzen 5 3450U (292 - 351, n=2) | |
| Cinebench R23 / Multi Core | |
| Lenovo IdeaPad 5 Pro 14ACN6 | |
| Dell Inspiron 14 7400 7415 2-in-1 | |
| Asus ExpertBook B7 Flip B7402FEA | |
| HP Pavilion 14-dv0357ng | |
| Infinix INBook X2 | |
| Lenovo ThinkBook 14 G2 ITL 20VDS02G00 | |
| BMAX X14 Pro | |
| Moyenne AMD Ryzen 5 3450U (2658 - 3195, n=2) | |
| Cinebench R23 / Single Core | |
| Asus ExpertBook B7 Flip B7402FEA | |
| Lenovo IdeaPad 5 Pro 14ACN6 | |
| Lenovo ThinkBook 14 G2 ITL 20VDS02G00 | |
| HP Pavilion 14-dv0357ng | |
| Dell Inspiron 14 7400 7415 2-in-1 | |
| Infinix INBook X2 | |
| BMAX X14 Pro | |
| Moyenne AMD Ryzen 5 3450U (858 - 892, n=2) | |
| Cinebench R15 / CPU Multi 64Bit | |
| Lenovo IdeaPad 5 Pro 14ACN6 | |
| Dell Inspiron 14 7400 7415 2-in-1 | |
| Asus VivoBook Flip 14 TM420IA | |
| Asus ExpertBook B7 Flip B7402FEA | |
| HP Pavilion 14-dv0357ng | |
| Acer Swift 3 SF314-42-R27B | |
| Infinix INBook X2 | |
| Moyenne AMD Ryzen 5 3450U (530 - 603, n=2) | |
| BMAX X14 Pro | |
| Lenovo ThinkBook 14 G2 ITL 20VDS02G00 | |
| Lenovo IdeaPad 3 14IIL05 | |
| Cinebench R15 / CPU Single 64Bit | |
| Asus ExpertBook B7 Flip B7402FEA | |
| Lenovo IdeaPad 5 Pro 14ACN6 | |
| Dell Inspiron 14 7400 7415 2-in-1 | |
| Asus VivoBook Flip 14 TM420IA | |
| Lenovo ThinkBook 14 G2 ITL 20VDS02G00 | |
| Acer Swift 3 SF314-42-R27B | |
| Lenovo IdeaPad 3 14IIL05 | |
| Infinix INBook X2 | |
| Moyenne AMD Ryzen 5 3450U (137 - 138, n=2) | |
| BMAX X14 Pro | |
| Blender / v2.79 BMW27 CPU | |
| Lenovo IdeaPad 3 14IIL05 | |
| Lenovo ThinkBook 14 G2 ITL 20VDS02G00 | |
| Moyenne AMD Ryzen 5 3450U (834 - 976, n=3) | |
| Acer Swift 3 SF314-42-R27B | |
| Infinix INBook X2 | |
| BMAX X14 Pro | |
| HP Pavilion 14-dv0357ng | |
| Asus ExpertBook B7 Flip B7402FEA | |
| Asus VivoBook Flip 14 TM420IA | |
| Dell Inspiron 14 7400 7415 2-in-1 | |
| Lenovo IdeaPad 5 Pro 14ACN6 | |
| 7-Zip 18.03 / 7z b 4 | |
| Lenovo IdeaPad 5 Pro 14ACN6 | |
| Dell Inspiron 14 7400 7415 2-in-1 | |
| Asus VivoBook Flip 14 TM420IA | |
| Asus ExpertBook B7 Flip B7402FEA | |
| HP Pavilion 14-dv0357ng | |
| BMAX X14 Pro | |
| Moyenne AMD Ryzen 5 3450U (15163 - 16305, n=3) | |
| Infinix INBook X2 | |
| Acer Swift 3 SF314-42-R27B | |
| Lenovo ThinkBook 14 G2 ITL 20VDS02G00 | |
| Lenovo IdeaPad 3 14IIL05 | |
| 7-Zip 18.03 / 7z b 4 -mmt1 | |
| Asus ExpertBook B7 Flip B7402FEA | |
| Lenovo IdeaPad 5 Pro 14ACN6 | |
| HP Pavilion 14-dv0357ng | |
| Lenovo ThinkBook 14 G2 ITL 20VDS02G00 | |
| Dell Inspiron 14 7400 7415 2-in-1 | |
| Asus VivoBook Flip 14 TM420IA | |
| Lenovo IdeaPad 3 14IIL05 | |
| Acer Swift 3 SF314-42-R27B | |
| Moyenne AMD Ryzen 5 3450U (3355 - 3411, n=3) | |
| BMAX X14 Pro | |
| Infinix INBook X2 | |
| Geekbench 5.5 / Multi-Core | |
| Asus VivoBook Flip 14 TM420IA | |
| Asus ExpertBook B7 Flip B7402FEA | |
| Infinix INBook X2 | |
| Acer Swift 3 SF314-42-R27B | |
| BMAX X14 Pro | |
| Moyenne AMD Ryzen 5 3450U (2565 - 3123, n=5) | |
| Lenovo ThinkBook 14 G2 ITL 20VDS02G00 | |
| Lenovo IdeaPad 3 14IIL05 | |
| Geekbench 5.5 / Single-Core | |
| Asus ExpertBook B7 Flip B7402FEA | |
| Lenovo ThinkBook 14 G2 ITL 20VDS02G00 | |
| Infinix INBook X2 | |
| Lenovo IdeaPad 3 14IIL05 | |
| Asus VivoBook Flip 14 TM420IA | |
| Acer Swift 3 SF314-42-R27B | |
| BMAX X14 Pro | |
| Moyenne AMD Ryzen 5 3450U (698 - 866, n=5) | |
| HWBOT x265 Benchmark v2.2 / 4k Preset | |
| Lenovo IdeaPad 5 Pro 14ACN6 | |
| Dell Inspiron 14 7400 7415 2-in-1 | |
| Asus VivoBook Flip 14 TM420IA | |
| Asus ExpertBook B7 Flip B7402FEA | |
| Infinix INBook X2 | |
| Acer Swift 3 SF314-42-R27B | |
| Lenovo IdeaPad 3 14IIL05 | |
| Lenovo ThinkBook 14 G2 ITL 20VDS02G00 | |
| BMAX X14 Pro | |
| Moyenne AMD Ryzen 5 3450U (2.77 - 3.43, n=3) | |
| LibreOffice / 20 Documents To PDF | |
| Moyenne AMD Ryzen 5 3450U (86.5 - 90.6, n=3) | |
| BMAX X14 Pro | |
| Infinix INBook X2 | |
| Acer Swift 3 SF314-42-R27B | |
| Dell Inspiron 14 7400 7415 2-in-1 | |
| Asus VivoBook Flip 14 TM420IA | |
| Lenovo IdeaPad 3 14IIL05 | |
| Lenovo IdeaPad 5 Pro 14ACN6 | |
| Asus ExpertBook B7 Flip B7402FEA | |
| Lenovo ThinkBook 14 G2 ITL 20VDS02G00 | |
| R Benchmark 2.5 / Overall mean | |
| Moyenne AMD Ryzen 5 3450U (0.76 - 0.806, n=3) | |
| BMAX X14 Pro | |
| Lenovo IdeaPad 3 14IIL05 | |
| Infinix INBook X2 | |
| Acer Swift 3 SF314-42-R27B | |
| Lenovo ThinkBook 14 G2 ITL 20VDS02G00 | |
| Asus VivoBook Flip 14 TM420IA | |
| Dell Inspiron 14 7400 7415 2-in-1 | |
| Asus ExpertBook B7 Flip B7402FEA | |
| Lenovo IdeaPad 5 Pro 14ACN6 | |
* ... Moindre est la valeur, meilleures sont les performances
AIDA64: FP32 Ray-Trace | FPU Julia | CPU SHA3 | CPU Queen | FPU SinJulia | FPU Mandel | CPU AES | CPU ZLib | FP64 Ray-Trace | CPU PhotoWorxx
| Performance rating | |
| Lenovo IdeaPad 5 Pro 14ACN6 | |
| Dell Inspiron 14 7400 7415 2-in-1 | |
| Infinix INBook X2 | |
| Huawei MateBook 14 2020 Intel | |
| BMAX X14 Pro | |
| Moyenne AMD Ryzen 5 3450U | |
| AIDA64 / FP32 Ray-Trace | |
| Lenovo IdeaPad 5 Pro 14ACN6 | |
| Dell Inspiron 14 7400 7415 2-in-1 | |
| Infinix INBook X2 | |
| Huawei MateBook 14 2020 Intel | |
| BMAX X14 Pro | |
| Moyenne AMD Ryzen 5 3450U (2205 - 2813, n=3) | |
| AIDA64 / FPU Julia | |
| Lenovo IdeaPad 5 Pro 14ACN6 | |
| Dell Inspiron 14 7400 7415 2-in-1 | |
| Huawei MateBook 14 2020 Intel | |
| Infinix INBook X2 | |
| BMAX X14 Pro | |
| Moyenne AMD Ryzen 5 3450U (12782 - 15357, n=3) | |
| AIDA64 / CPU SHA3 | |
| Lenovo IdeaPad 5 Pro 14ACN6 | |
| Dell Inspiron 14 7400 7415 2-in-1 | |
| Infinix INBook X2 | |
| Huawei MateBook 14 2020 Intel | |
| BMAX X14 Pro | |
| Moyenne AMD Ryzen 5 3450U (671 - 798, n=3) | |
| AIDA64 / CPU Queen | |
| Dell Inspiron 14 7400 7415 2-in-1 | |
| Lenovo IdeaPad 5 Pro 14ACN6 | |
| Huawei MateBook 14 2020 Intel | |
| Moyenne AMD Ryzen 5 3450U (41757 - 43786, n=3) | |
| BMAX X14 Pro | |
| Infinix INBook X2 | |
| AIDA64 / FPU SinJulia | |
| Dell Inspiron 14 7400 7415 2-in-1 | |
| Lenovo IdeaPad 5 Pro 14ACN6 | |
| BMAX X14 Pro | |
| Moyenne AMD Ryzen 5 3450U (4760 - 5335, n=3) | |
| Huawei MateBook 14 2020 Intel | |
| Infinix INBook X2 | |
| AIDA64 / FPU Mandel | |
| Lenovo IdeaPad 5 Pro 14ACN6 | |
| Dell Inspiron 14 7400 7415 2-in-1 | |
| Infinix INBook X2 | |
| Huawei MateBook 14 2020 Intel | |
| BMAX X14 Pro | |
| Moyenne AMD Ryzen 5 3450U (6504 - 7962, n=3) | |
| AIDA64 / CPU AES | |
| Lenovo IdeaPad 5 Pro 14ACN6 | |
| Dell Inspiron 14 7400 7415 2-in-1 | |
| Infinix INBook X2 | |
| BMAX X14 Pro | |
| Moyenne AMD Ryzen 5 3450U (23172 - 26298, n=3) | |
| Huawei MateBook 14 2020 Intel | |
| AIDA64 / CPU ZLib | |
| Dell Inspiron 14 7400 7415 2-in-1 | |
| Lenovo IdeaPad 5 Pro 14ACN6 | |
| BMAX X14 Pro | |
| Moyenne AMD Ryzen 5 3450U (271 - 295, n=3) | |
| Infinix INBook X2 | |
| Huawei MateBook 14 2020 Intel | |
| AIDA64 / FP64 Ray-Trace | |
| Dell Inspiron 14 7400 7415 2-in-1 | |
| Lenovo IdeaPad 5 Pro 14ACN6 | |
| Infinix INBook X2 | |
| Huawei MateBook 14 2020 Intel | |
| BMAX X14 Pro | |
| Moyenne AMD Ryzen 5 3450U (1181 - 1472, n=3) | |
| AIDA64 / CPU PhotoWorxx | |
| Infinix INBook X2 | |
| Huawei MateBook 14 2020 Intel | |
| Dell Inspiron 14 7400 7415 2-in-1 | |
| Lenovo IdeaPad 5 Pro 14ACN6 | |
| BMAX X14 Pro | |
| Moyenne AMD Ryzen 5 3450U (7659 - 15275, n=3) | |
Performance du système
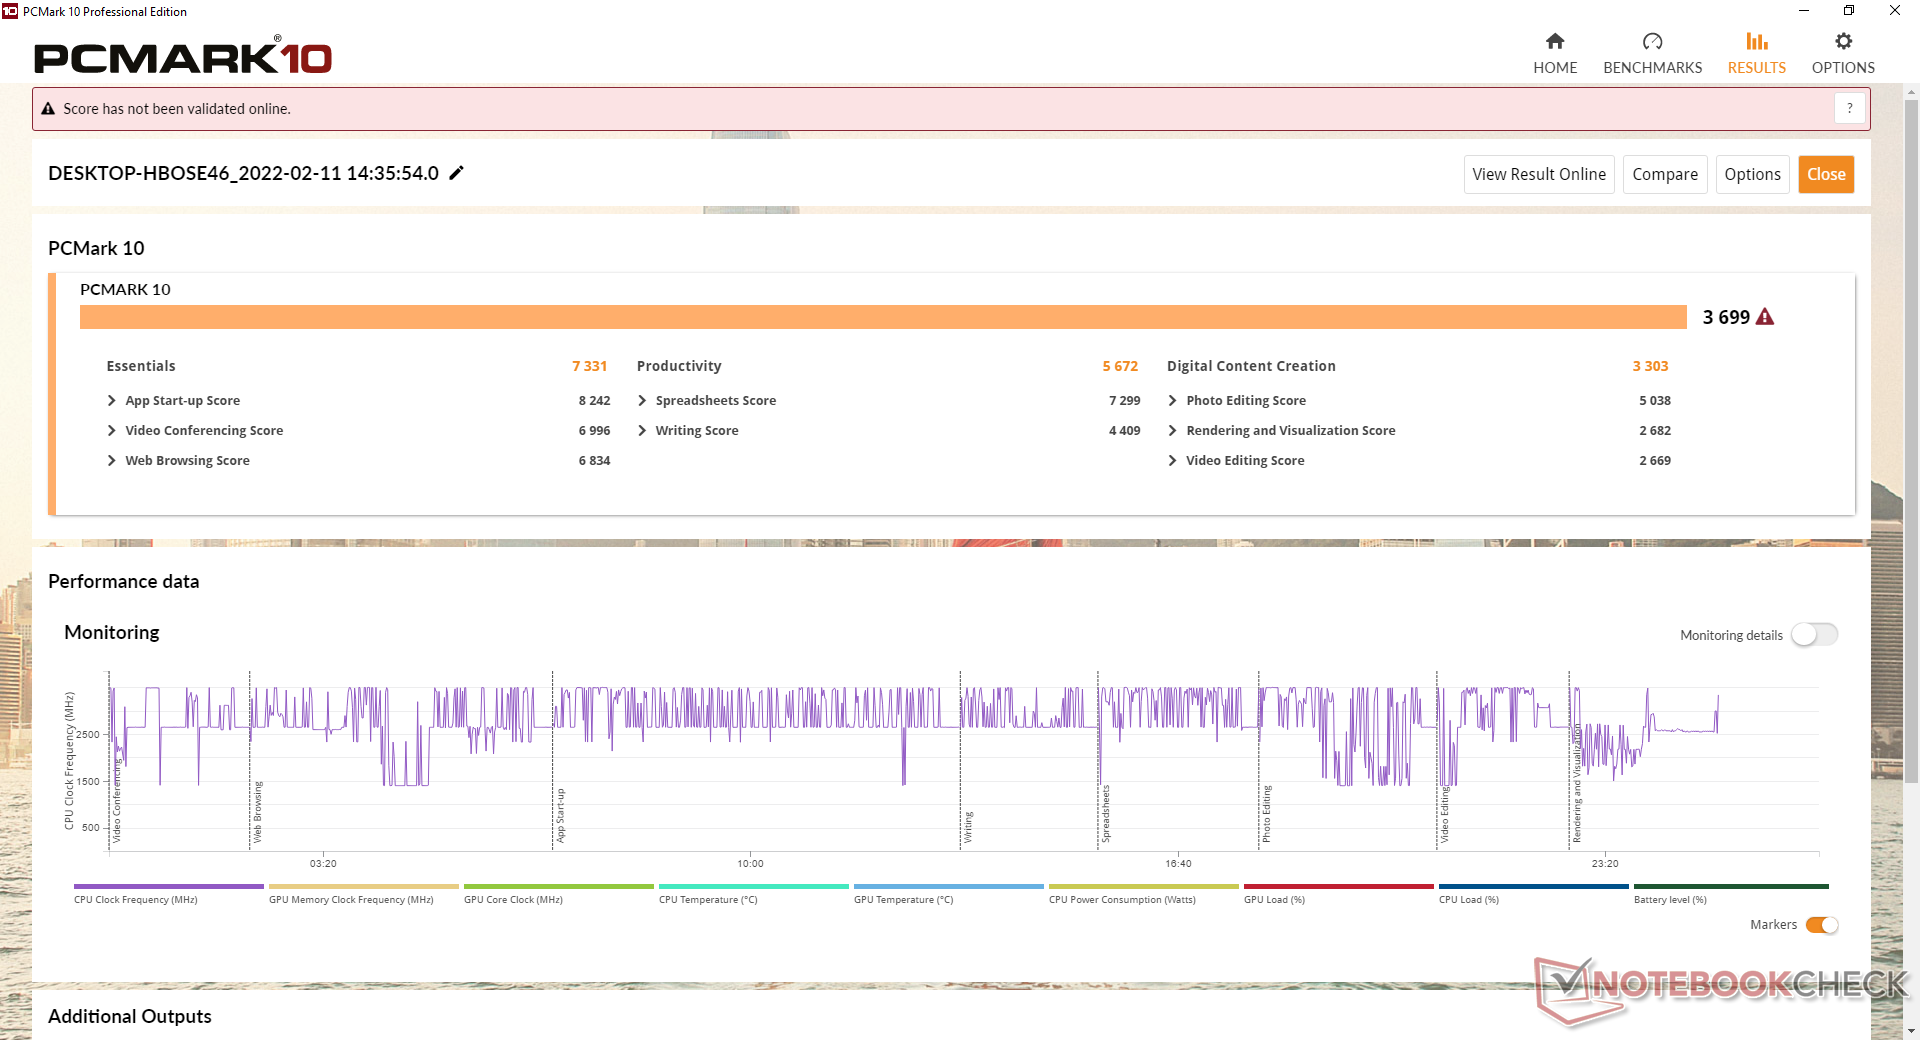
Les résultats de PCMark sont inférieurs à ceux de nombreuses alternatives Core i3 ou Core i5, probablement en raison des performances plus lentes du processeur Ryzen 3450U en matière de graphisme intégré et de thread unique
Le logiciel AMD Radeon plantait occasionnellement sur notre appareil, ce qui obligeait à réinstaller les pilotes.
| PCMark 10 / Score | |
| Lenovo IdeaPad 5 Pro 14ACN6 | |
| Dell Inspiron 14 7400 7415 2-in-1 | |
| HP Pavilion 14-dv0357ng | |
| Huawei MateBook 14 2020 Intel | |
| Infinix INBook X2 | |
| BMAX X14 Pro | |
| Moyenne AMD Ryzen 5 3450U, AMD Radeon RX Vega 8 (Ryzen 2000/3000) (3485 - 3699, n=2) | |
| PCMark 10 / Essentials | |
| Lenovo IdeaPad 5 Pro 14ACN6 | |
| HP Pavilion 14-dv0357ng | |
| Dell Inspiron 14 7400 7415 2-in-1 | |
| Huawei MateBook 14 2020 Intel | |
| Infinix INBook X2 | |
| BMAX X14 Pro | |
| Moyenne AMD Ryzen 5 3450U, AMD Radeon RX Vega 8 (Ryzen 2000/3000) (7067 - 7331, n=2) | |
| PCMark 10 / Productivity | |
| Lenovo IdeaPad 5 Pro 14ACN6 | |
| Dell Inspiron 14 7400 7415 2-in-1 | |
| Huawei MateBook 14 2020 Intel | |
| HP Pavilion 14-dv0357ng | |
| Moyenne AMD Ryzen 5 3450U, AMD Radeon RX Vega 8 (Ryzen 2000/3000) (5672 - 5801, n=2) | |
| BMAX X14 Pro | |
| Infinix INBook X2 | |
| PCMark 10 / Digital Content Creation | |
| Lenovo IdeaPad 5 Pro 14ACN6 | |
| Dell Inspiron 14 7400 7415 2-in-1 | |
| HP Pavilion 14-dv0357ng | |
| Infinix INBook X2 | |
| Huawei MateBook 14 2020 Intel | |
| BMAX X14 Pro | |
| Moyenne AMD Ryzen 5 3450U, AMD Radeon RX Vega 8 (Ryzen 2000/3000) (2802 - 3303, n=2) | |
| PCMark 10 Score | 3699 points | |
Aide | ||
| AIDA64 / Memory Copy | |
| Infinix INBook X2 | |
| Dell Inspiron 14 7400 7415 2-in-1 | |
| Lenovo IdeaPad 5 Pro 14ACN6 | |
| Huawei MateBook 14 2020 Intel | |
| BMAX X14 Pro | |
| Moyenne AMD Ryzen 5 3450U (15343 - 28077, n=3) | |
| AIDA64 / Memory Read | |
| Infinix INBook X2 | |
| Dell Inspiron 14 7400 7415 2-in-1 | |
| Lenovo IdeaPad 5 Pro 14ACN6 | |
| Huawei MateBook 14 2020 Intel | |
| BMAX X14 Pro | |
| Moyenne AMD Ryzen 5 3450U (17983 - 33524, n=3) | |
| AIDA64 / Memory Write | |
| Infinix INBook X2 | |
| Dell Inspiron 14 7400 7415 2-in-1 | |
| Lenovo IdeaPad 5 Pro 14ACN6 | |
| Huawei MateBook 14 2020 Intel | |
| BMAX X14 Pro | |
| Moyenne AMD Ryzen 5 3450U (17811 - 33371, n=3) | |
| AIDA64 / Memory Latency | |
| BMAX X14 Pro | |
| Moyenne AMD Ryzen 5 3450U (100 - 125, n=3) | |
| Infinix INBook X2 | |
| Dell Inspiron 14 7400 7415 2-in-1 | |
| Lenovo IdeaPad 5 Pro 14ACN6 | |
| Huawei MateBook 14 2020 Intel | |
* ... Moindre est la valeur, meilleures sont les performances
Latence DPC
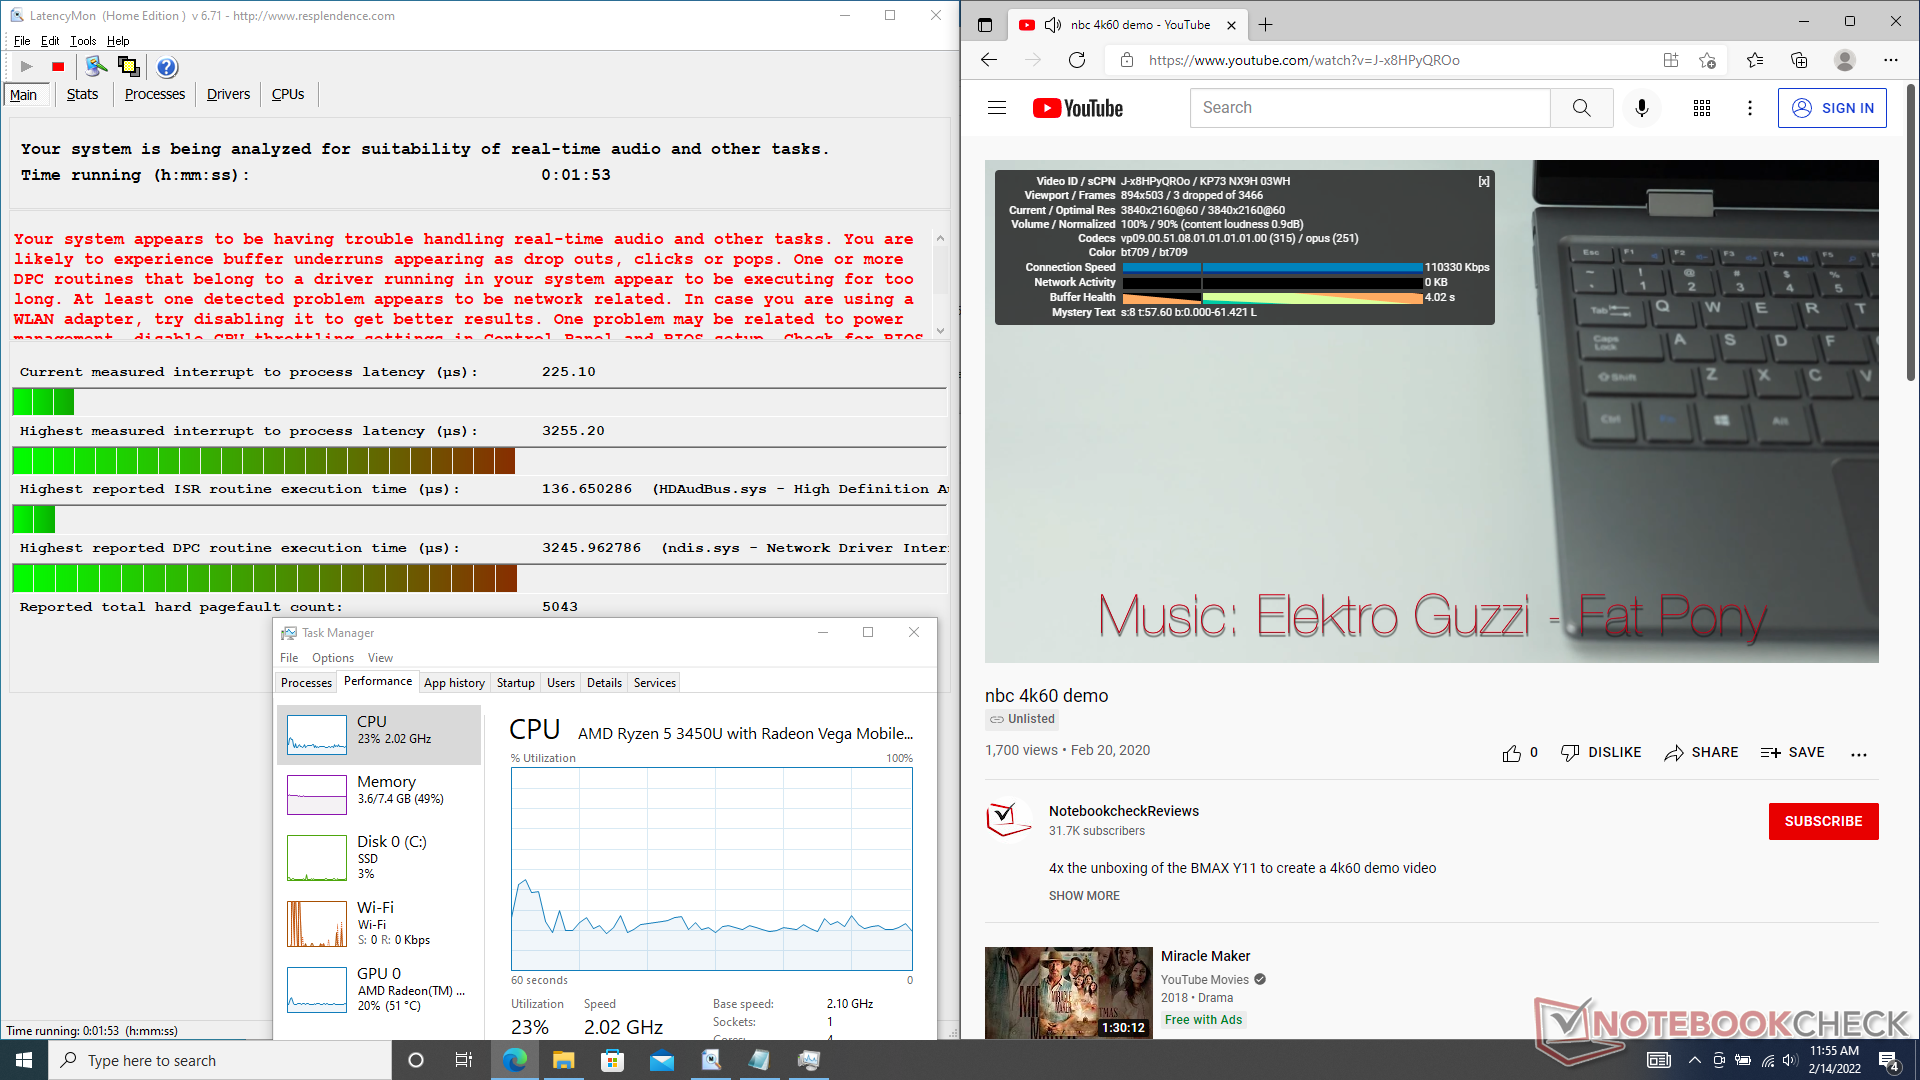
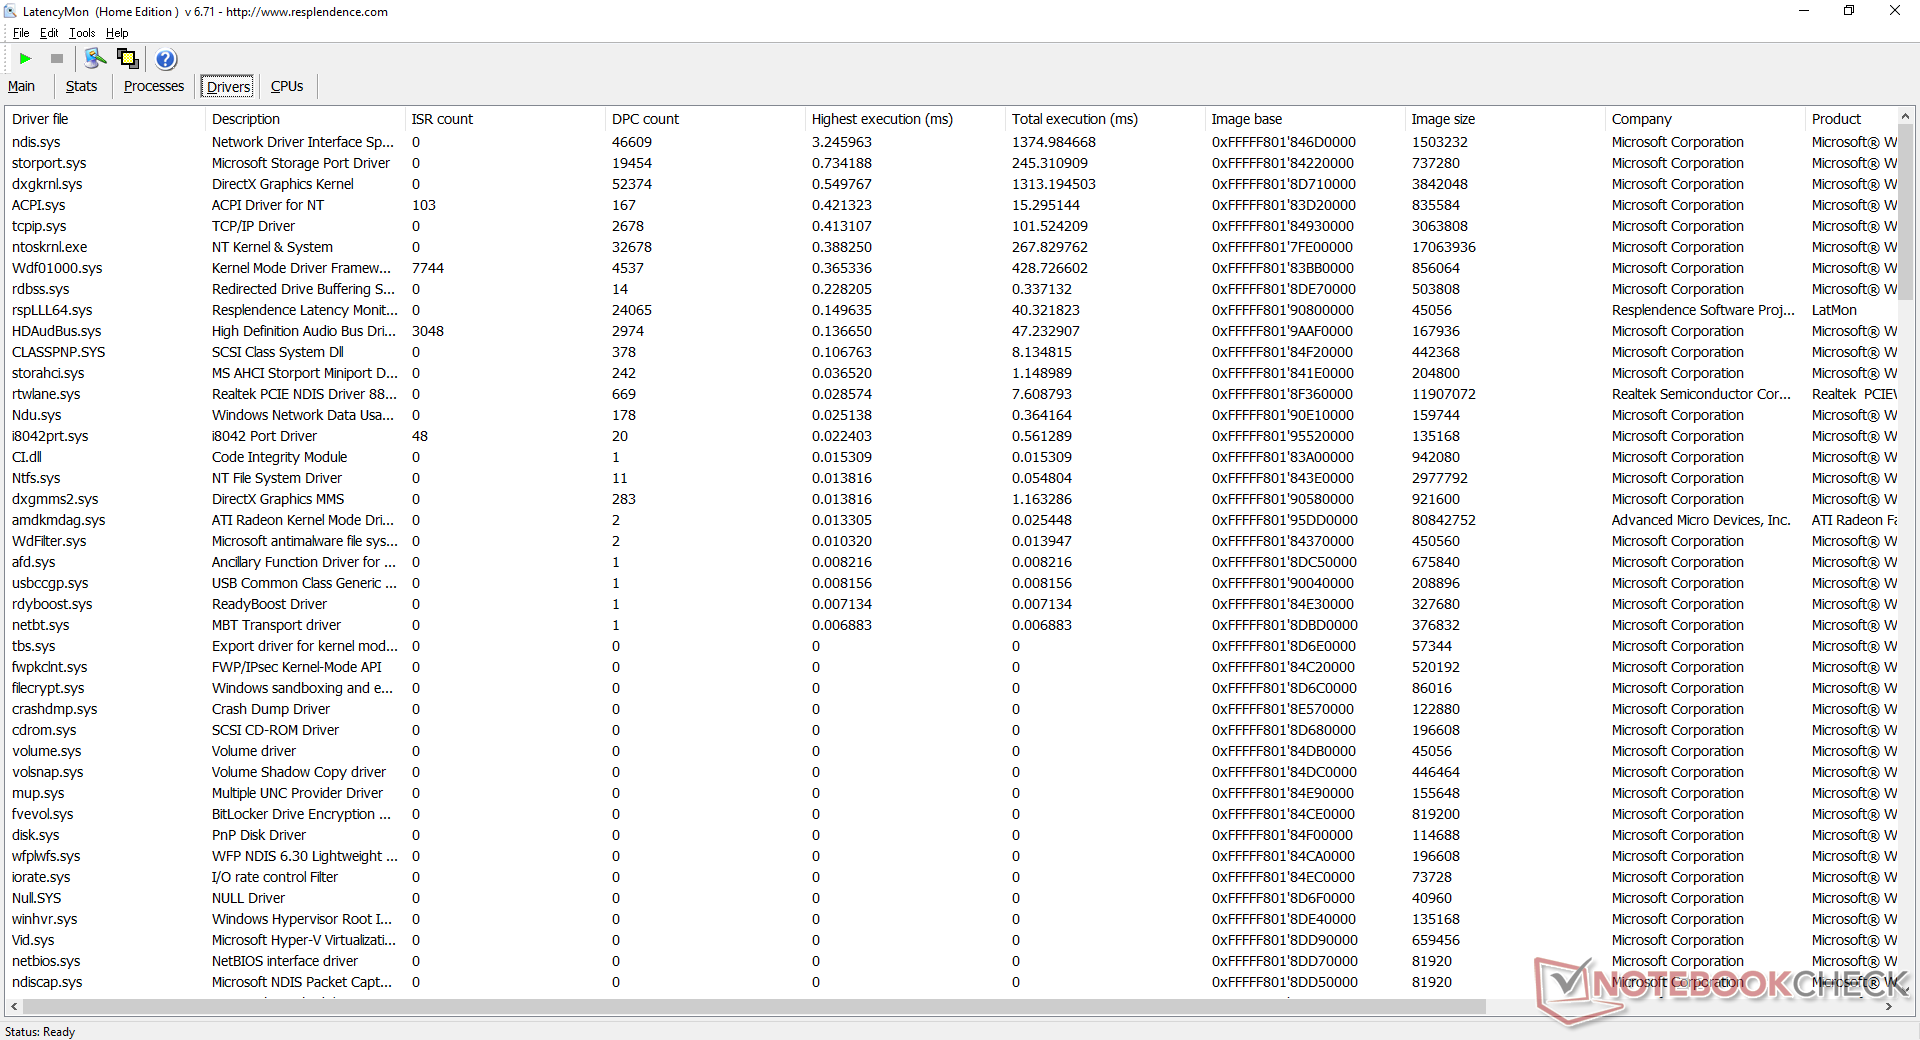
LatencyMon révèle des problèmes de DPC lors de l'ouverture de plusieurs onglets sur notre page d'accueil. la lecture de vidéos 4K à 60 FPS est autrement fluide, avec seulement 3 images perdues pendant notre vidéo de test d'une minute.
| DPC Latencies / LatencyMon - interrupt to process latency (max), Web, Youtube, Prime95 | |
| BMAX X14 Pro | |
| HP Pavilion 14-dv0357ng | |
| Dell Inspiron 14 7400 7415 2-in-1 | |
| Lenovo IdeaPad 5 Pro 14ACN6 | |
| Infinix INBook X2 | |
| Huawei MateBook 14 2020 Intel | |
* ... Moindre est la valeur, meilleures sont les performances
Périphériques de stockage
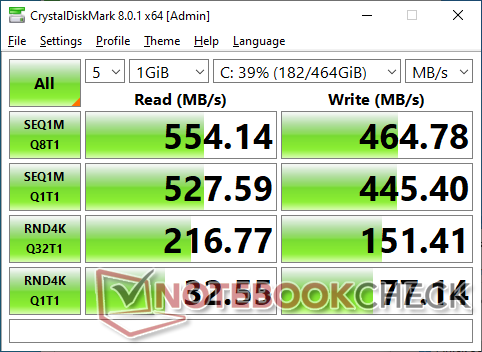
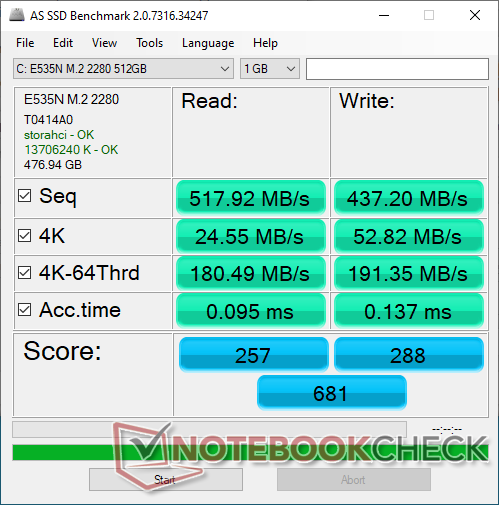
Le site SEAPIY M.2 SSD offre des taux de lecture et d'écriture séquentiels allant de 450 Mo/s à 550 Mo/s, ce qui est la norme pour la plupart des SSD SATA III. Néanmoins, le disque semble avoir des difficultés à maintenir ces taux de transfert plus élevés, comme l'illustrent les résultats de notre test en boucle DiskSpd ci-dessous.

| Drive Performance rating - Percent | |
| Huawei MateBook 14 2020 Intel | |
| Lenovo IdeaPad 5 Pro 14ACN6 | |
| Infinix INBook X2 | |
| Dell Inspiron 14 7400 7415 2-in-1 | |
| HP Pavilion 14-dv0357ng -8! | |
| BMAX X14 Pro | |
* ... Moindre est la valeur, meilleures sont les performances
Disk Throttling: DiskSpd Read Loop, Queue Depth 8
Performances du GPU
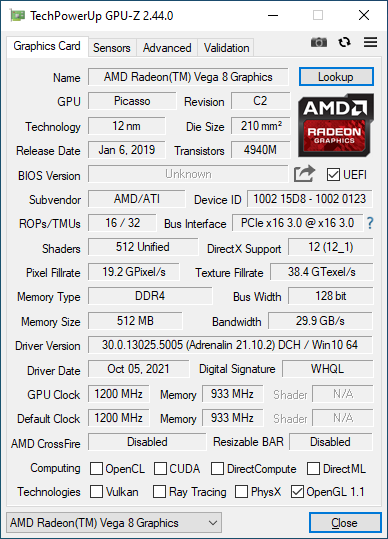
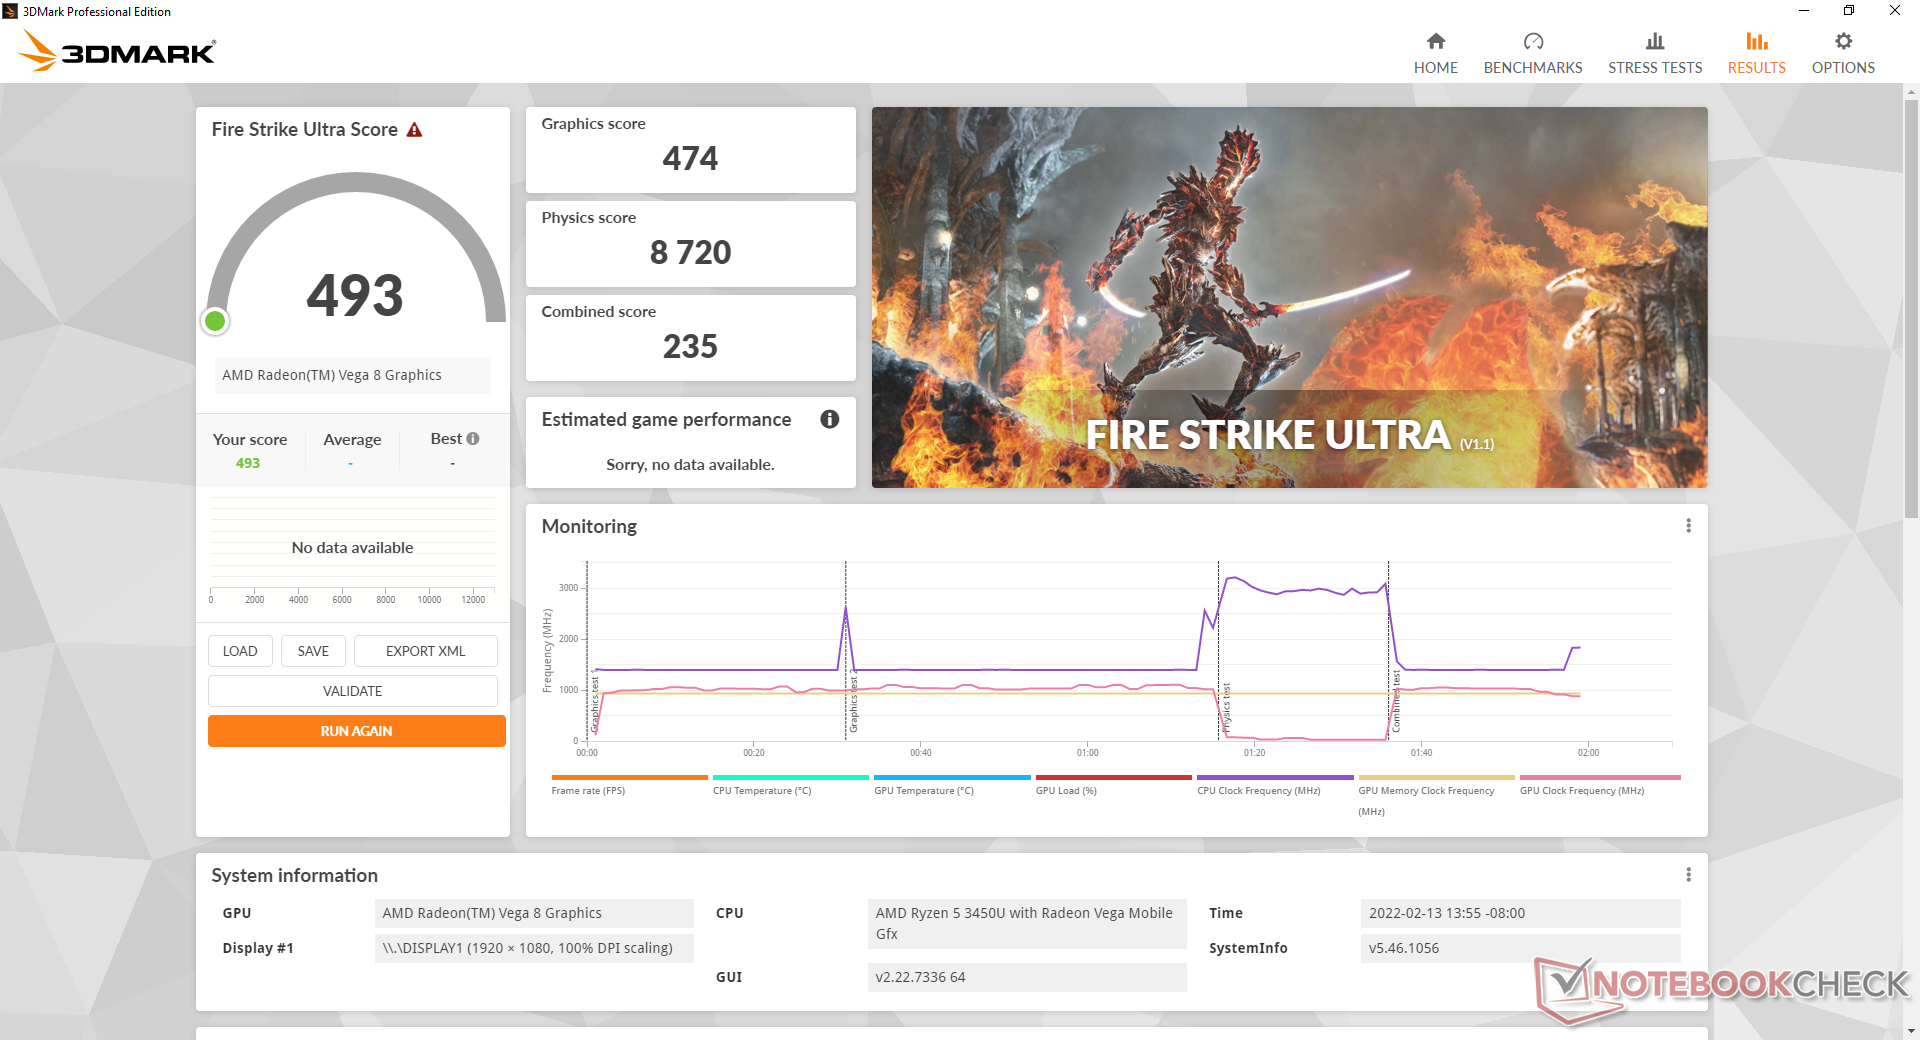
Les performances graphiques sont légèrement inférieures à celles de la carte intégrée Iris Plus Graphics G7 que l'on trouve sur la 10e génération de la série Intel Ice Lake. Bien que dépassée et généralement impropre au jeu, notreRadeon RX Vega 8 est toujours nettement plus rapide que la solution commune UHD Graphics.
| 3DMark 11 - 1280x720 Performance GPU | |
| Asus ExpertBook B7 Flip B7402FEA | |
| Dell Inspiron 14 7400 7415 2-in-1 | |
| HP Pavilion 14-dv0357ng | |
| Lenovo IdeaPad 5 Pro 14ACN6 | |
| Asus VivoBook Flip 14 TM420IA | |
| Infinix INBook X2 | |
| BMAX X14 Pro | |
| Acer Swift 3 SF314-42-R27B | |
| Moyenne AMD Radeon RX Vega 8 (Ryzen 2000/3000) (1668 - 4317, n=44) | |
| Lenovo ThinkBook 14 G2 ITL 20VDS02G00 | |
| Lenovo IdeaPad 3 14IIL05 | |
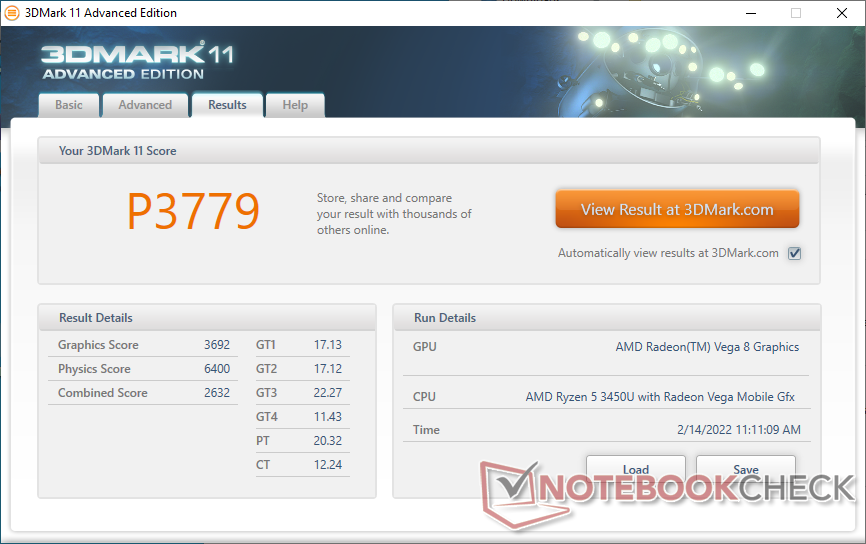
| 3DMark 11 Performance | 3779 points | |
| 3DMark Cloud Gate Standard Score | 12145 points | |
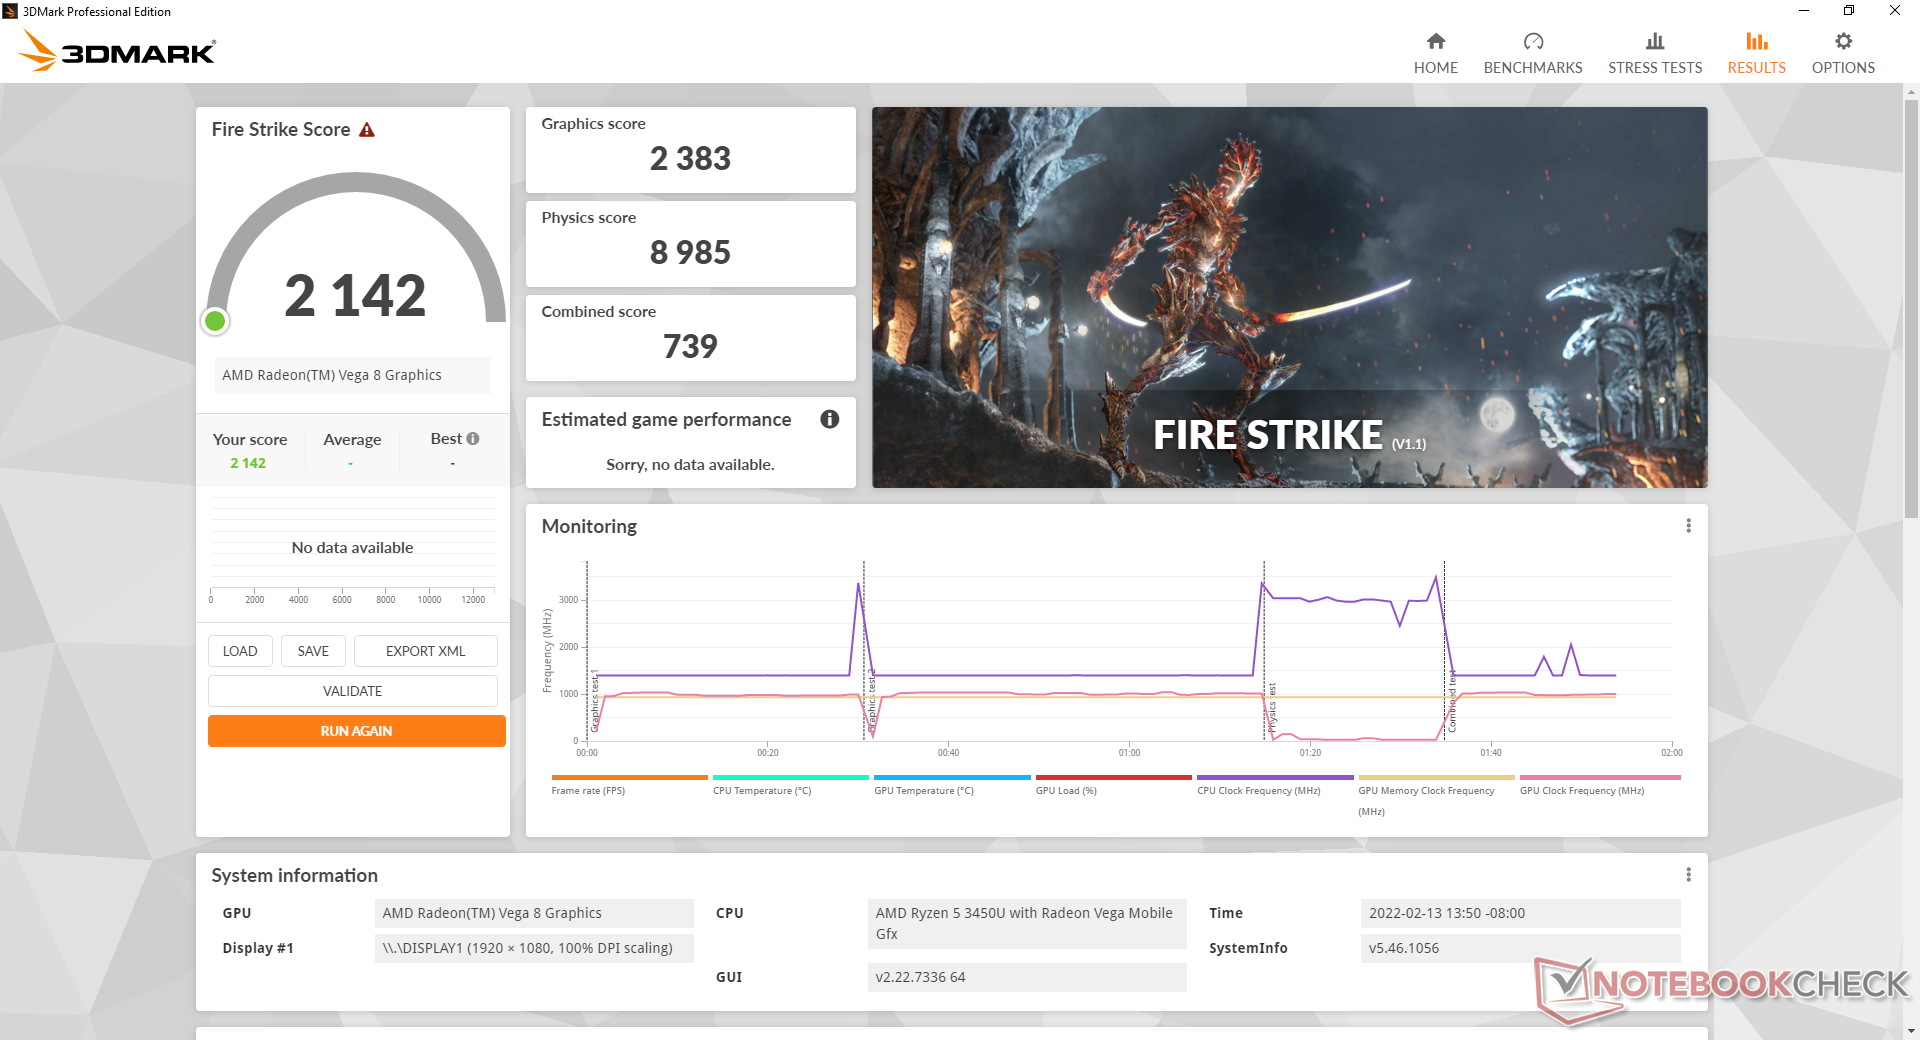
| 3DMark Fire Strike Score | 2142 points | |
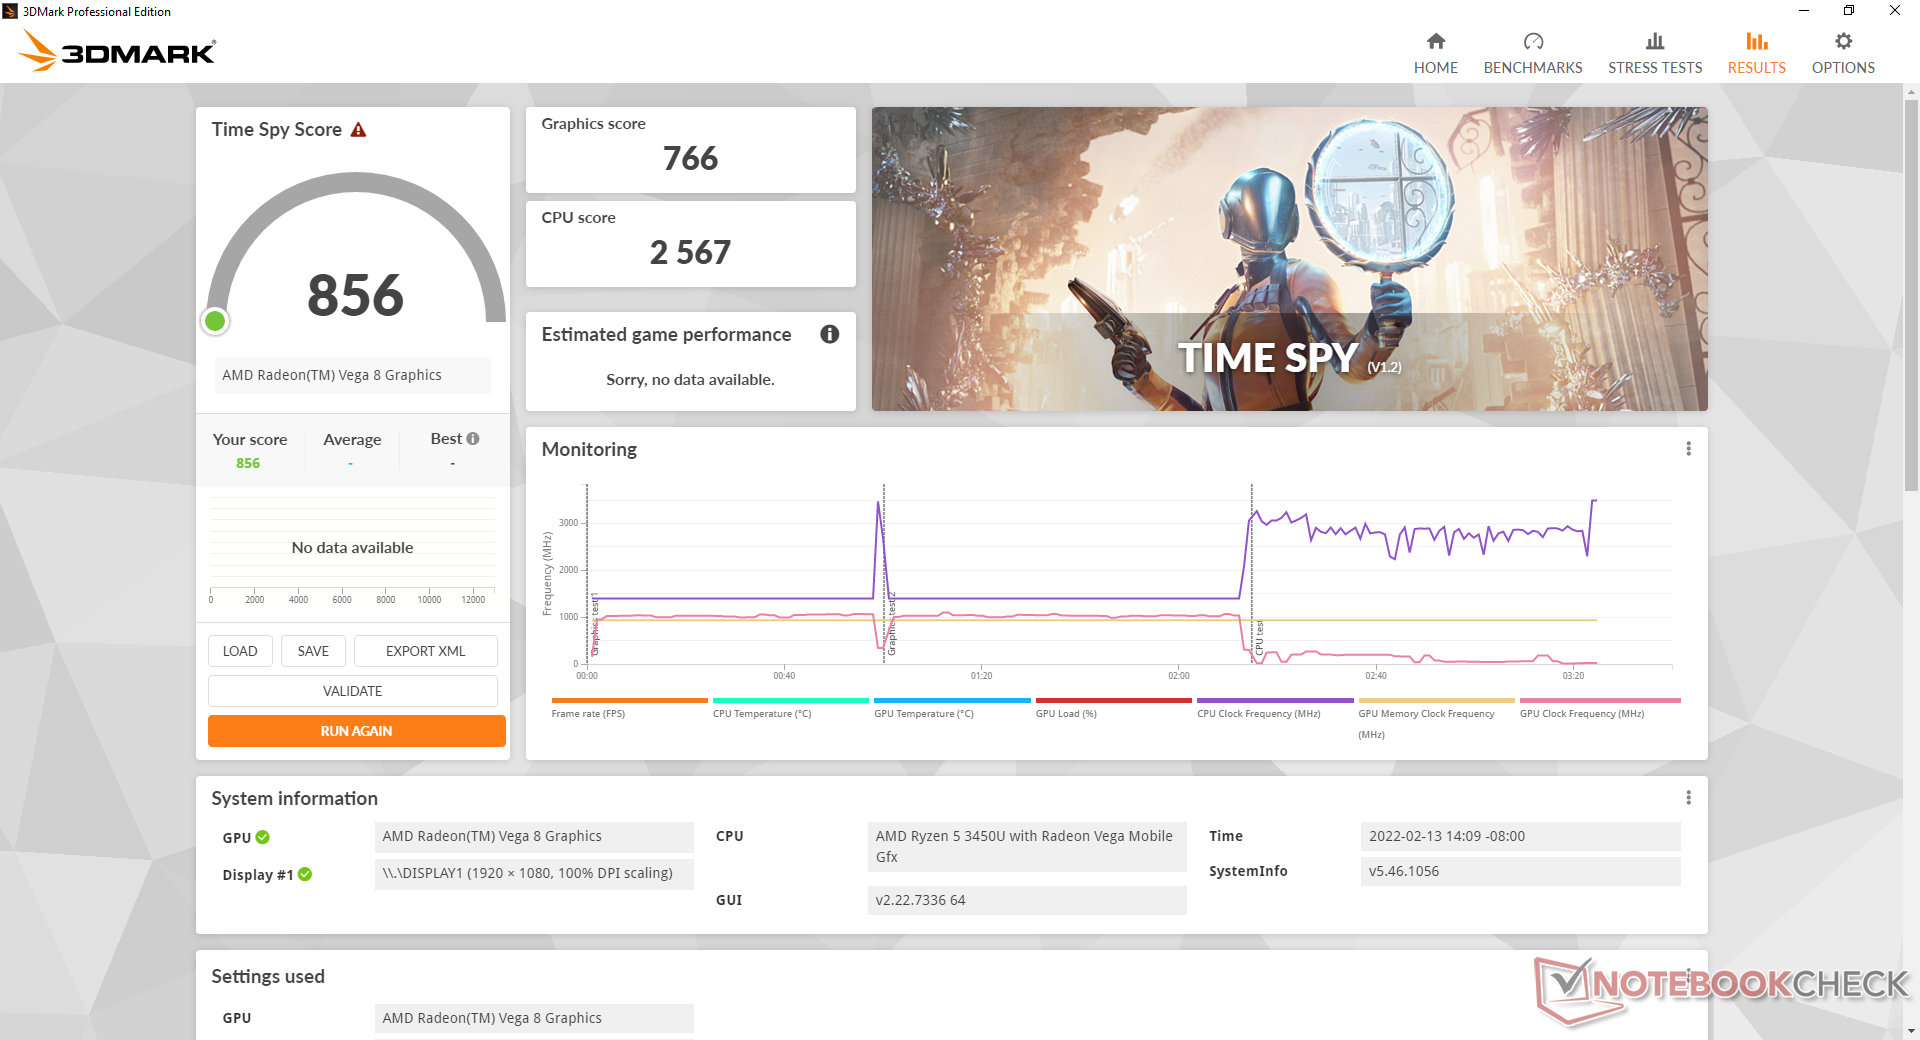
| 3DMark Time Spy Score | 856 points | |
Aide | ||
| X-Plane 11.11 | |
| 1280x720 low (fps_test=1) | |
| Lenovo IdeaPad 5 Pro 14ACN6 | |
| Asus VivoBook Flip 14 TM420IA | |
| Dell Inspiron 14 7400 7415 2-in-1 | |
| Acer Swift 3 SF314-42-R27B | |
| Lenovo ThinkBook 14 G2 ITL 20VDS02G00 | |
| Moyenne AMD Radeon RX Vega 8 (Ryzen 2000/3000) (11.5 - 39.9, n=26) | |
| BMAX X14 Pro | |
| Asus ExpertBook B7 Flip B7402FEA | |
| Lenovo IdeaPad 3 14IIL05 | |
| Infinix INBook X2 | |
| 1920x1080 med (fps_test=2) | |
| Lenovo IdeaPad 5 Pro 14ACN6 | |
| Asus VivoBook Flip 14 TM420IA | |
| Dell Inspiron 14 7400 7415 2-in-1 | |
| Acer Swift 3 SF314-42-R27B | |
| Asus ExpertBook B7 Flip B7402FEA | |
| Infinix INBook X2 | |
| Lenovo ThinkBook 14 G2 ITL 20VDS02G00 | |
| Moyenne AMD Radeon RX Vega 8 (Ryzen 2000/3000) (10.5 - 31, n=26) | |
| BMAX X14 Pro | |
| Lenovo IdeaPad 3 14IIL05 | |
| 1920x1080 high (fps_test=3) | |
| Lenovo IdeaPad 5 Pro 14ACN6 | |
| Asus VivoBook Flip 14 TM420IA | |
| Dell Inspiron 14 7400 7415 2-in-1 | |
| Acer Swift 3 SF314-42-R27B | |
| Asus ExpertBook B7 Flip B7402FEA | |
| Lenovo ThinkBook 14 G2 ITL 20VDS02G00 | |
| Infinix INBook X2 | |
| Moyenne AMD Radeon RX Vega 8 (Ryzen 2000/3000) (9.58 - 27.3, n=25) | |
| BMAX X14 Pro | |
| Lenovo IdeaPad 3 14IIL05 | |
Witcher 3 FPS Chart
| Bas | Moyen | Élevé | Ultra | |
|---|---|---|---|---|
| The Witcher 3 (2015) | 41.9 | 27.9 | 13.9 | 8.9 |
| Dota 2 Reborn (2015) | 68.5 | 57.6 | 36.1 | 31.2 |
| Final Fantasy XV Benchmark (2018) | 21.2 | 10.7 | 7.28 | |
| X-Plane 11.11 (2018) | 25.2 | 18.4 | 16.6 | |
| Far Cry 5 (2018) | 29 | 11 | 10 | 9 |
Émissions
Bruit du système
Le bruit du ventilateur est perceptible mais tolérable lors de la simple navigation sur le Web ou de la diffusion de vidéos en continu. Le ventilateur a tendance à plafonner à 30 dB(A) dans ces conditions, tandis que les charges plus élevées, comme les jeux, se situent entre 35 et 40 dB(A). Il s'agit d'une fourchette assez standard pour les ultrabooks équipés de processeurs de la série U.
Degré de la nuisance sonore
| Au repos |
| 25.7 / 25.7 / 25.7 dB(A) |
| Fortement sollicité |
| 34.5 / 40 dB(A) |
 | ||
30 dB silencieux 40 dB(A) audible 50 dB(A) bruyant |
||
min: | ||
| BMAX X14 Pro Vega 8, R5 3450U, SEAPIY E535N 512GB | Lenovo IdeaPad 5 Pro 14ACN6 Vega 7, R5 5600U, WDC PC SN730 SDBPNTY-512G | Dell Inspiron 14 7400 7415 2-in-1 Vega 8, R7 5700U, WDC PC SN530 SDBPTPZ-512G | HP Pavilion 14-dv0357ng Iris Xe G7 80EUs, i5-1135G7, Intel Optane Memory H10 with Solid State Storage 32GB + 1TB HBRPEKNX0203AH(L/H) | Huawei MateBook 14 2020 Intel GeForce MX350, i7-10510U, Lite-On CA5-8D512 | Infinix INBook X2 Iris Plus Graphics G7 (Ice Lake 64 EU), i7-1065G7, Foresee GSYAPGC-512G | |
|---|---|---|---|---|---|---|
| Noise | 5% | 4% | 2% | -7% | 4% | |
| arrêt / environnement * (dB) | 25.2 | 24.6 2% | 24.3 4% | 25.4 -1% | 29.3 -16% | 23.1 8% |
| Idle Minimum * (dB) | 25.7 | 24.6 4% | 24.3 5% | 25.4 1% | 29.3 -14% | 24.3 5% |
| Idle Average * (dB) | 25.7 | 24.6 4% | 24.3 5% | 25.4 1% | 29.3 -14% | 24.3 5% |
| Idle Maximum * (dB) | 25.7 | 25.1 2% | 24.3 5% | 25.4 1% | 30.8 -20% | 24.5 5% |
| Load Average * (dB) | 34.5 | 29.6 14% | 35.7 -3% | 35.4 -3% | 35.7 -3% | 35.2 -2% |
| Witcher 3 ultra * (dB) | 40 | 31.9 20% | 37.5 6% | 35.7 11% | 38 5% | |
| Load Maximum * (dB) | 40 | 45.5 -14% | 37.3 7% | 35.5 11% | 37.9 5% | 38 5% |
* ... Moindre est la valeur, meilleures sont les performances
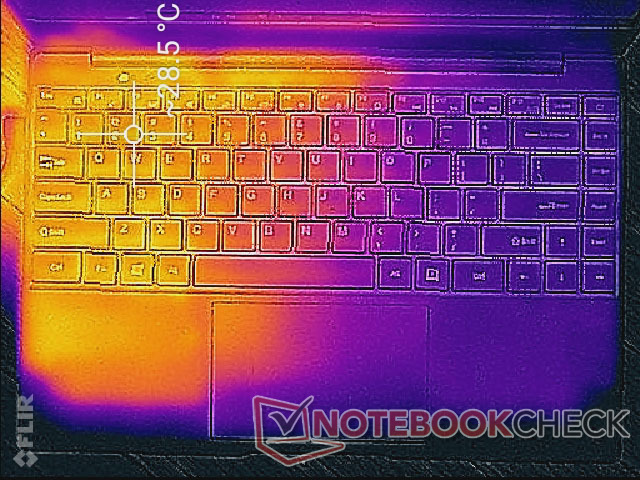
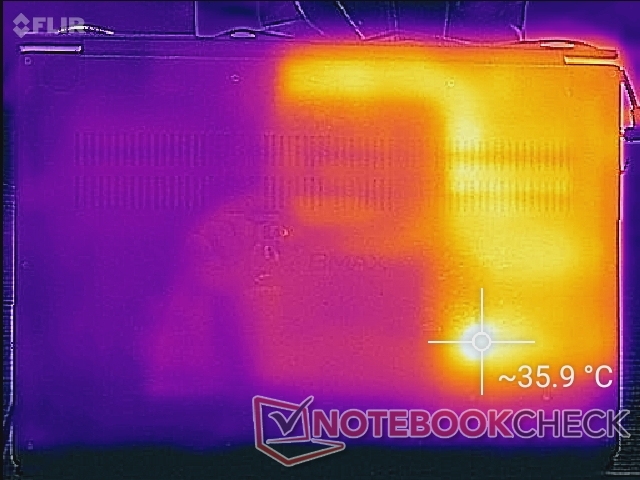
Température
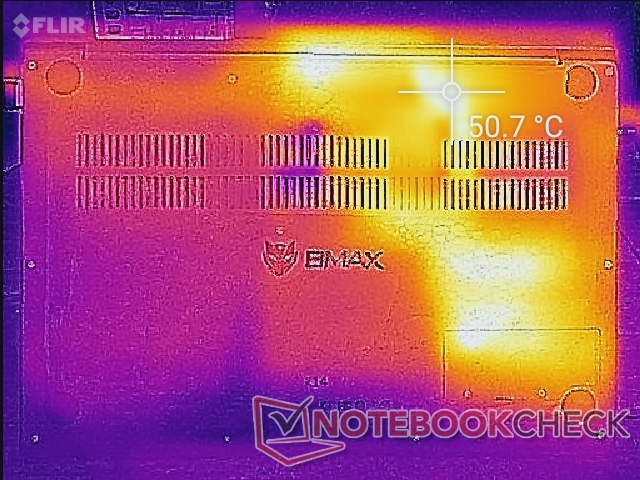
La moitié gauche de l'ordinateur portable sera toujours plus chaude que la moitié droite puisque le processeur, le SSD et les modules de RAM sont tous concentrés sur un côté du système. La différence de température entre les deux côtés du châssis peut être potentiellement inconfortable pour certains utilisateurs. Lors de l'utilisation de charges élevées pendant des périodes prolongées, par exemple, le repose-poignet gauche peut atteindre une température de 45 °C, contre seulement 30 °C pour le repose-poignet droit. La plupart des autres Ultrabooks n'ont pas ce problème car leurs processeurs et leurs caloducs sont presque toujours situés à l'arrière du châssis.
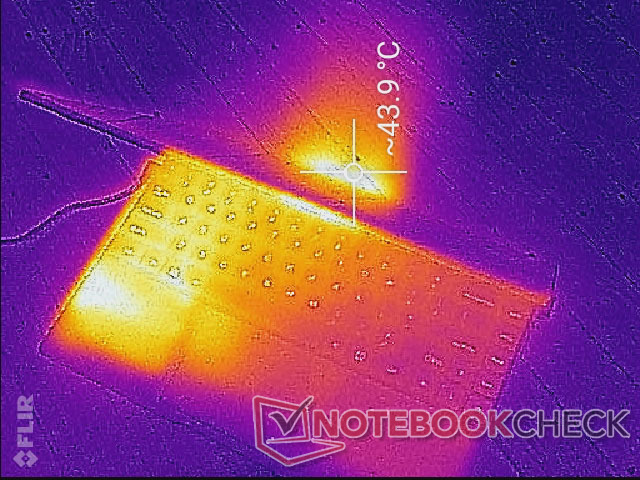
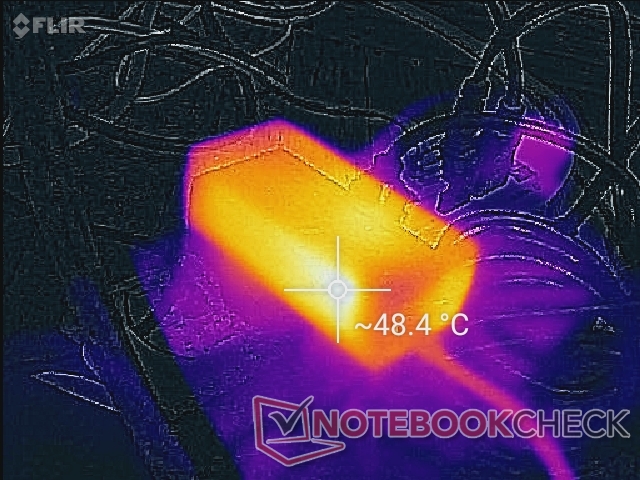
(-) La température maximale du côté supérieur est de 48.4 °C / 119 F, par rapport à la moyenne de 35.9 °C / 97 F, allant de 21.4 à 59 °C pour la classe Subnotebook.
(-) Le fond chauffe jusqu'à un maximum de 51.6 °C / 125 F, contre une moyenne de 39.2 °C / 103 F
(+) En utilisation inactive, la température moyenne du côté supérieur est de 25 °C / 77 F, par rapport à la moyenne du dispositif de 30.8 °C / 87 F.
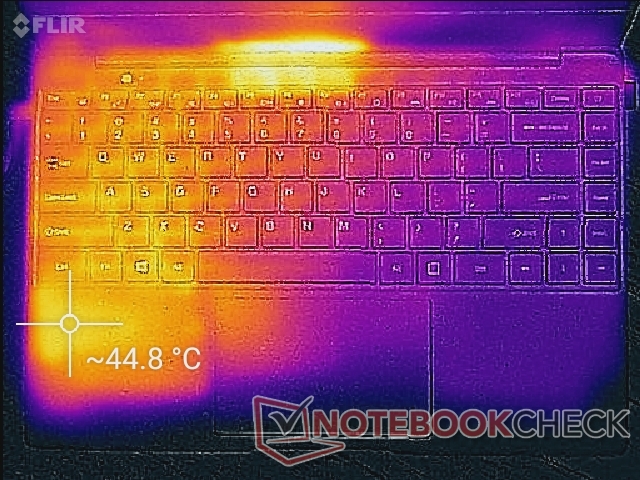
(-) Les repose-poignets et le pavé tactile peuvent devenir très chauds au toucher, avec un maximum de 44.8 °C / 112.6# F.
(-) La température moyenne de la zone de l'appui-paume de dispositifs similaires était de 28.2 °C / 82.8 F (-16.6 °C / #-29.8 F).
| BMAX X14 Pro AMD Ryzen 5 3450U, AMD Radeon RX Vega 8 (Ryzen 2000/3000) | Lenovo IdeaPad 5 Pro 14ACN6 AMD Ryzen 5 5600U, AMD Radeon RX Vega 7 | Dell Inspiron 14 7400 7415 2-in-1 AMD Ryzen 7 5700U, AMD Radeon RX Vega 8 (Ryzen 4000/5000) | HP Pavilion 14-dv0357ng Intel Core i5-1135G7, Intel Iris Xe Graphics G7 80EUs | Huawei MateBook 14 2020 Intel Intel Core i7-10510U, NVIDIA GeForce MX350 | Infinix INBook X2 Intel Core i7-1065G7, Intel Iris Plus Graphics G7 (Ice Lake 64 EU) | |
|---|---|---|---|---|---|---|
| Heat | 21% | 10% | 11% | 13% | 12% | |
| Maximum Upper Side * (°C) | 48.4 | 35.8 26% | 39.4 19% | 40.5 16% | 44 9% | 45 7% |
| Maximum Bottom * (°C) | 51.6 | 42.8 17% | 51 1% | 39.9 23% | 51.3 1% | 44.2 14% |
| Idle Upper Side * (°C) | 28.4 | 25 12% | 26.2 8% | 31.3 -10% | 25.1 12% | 26.2 8% |
| Idle Bottom * (°C) | 36.6 | 26.2 28% | 32.4 11% | 31.1 15% | 26.1 29% | 29.2 20% |
* ... Moindre est la valeur, meilleures sont les performances
Test de stress
Lors de l'exécution de Prime95 pour solliciter le processeur, les fréquences d'horloge ont augmenté jusqu'à 2,9 GHz pendant quelques secondes avant de retomber à 2,5 GHz et de se stabiliser à 2,2 GHz après quelques minutes. La température du cœur semble également atteindre un plateau à 59°C lorsqu'il est soumis à des conditions stressantes telles que le jeu.
Sur le site Witcher 3, les fréquences d'horloge du GPU commencent à être relativement élevées, entre 800 et 900 MHz, avant de tomber en dessous de 800 MHz, probablement en raison de limitations thermiques. Les fréquences d'images sont donc légèrement plus élevées pendant la première minute de jeu.
Le fonctionnement sur batterie ne limite pas les performances. Un test 3DMark 11 sur batteries donnerait des résultats presque identiques.
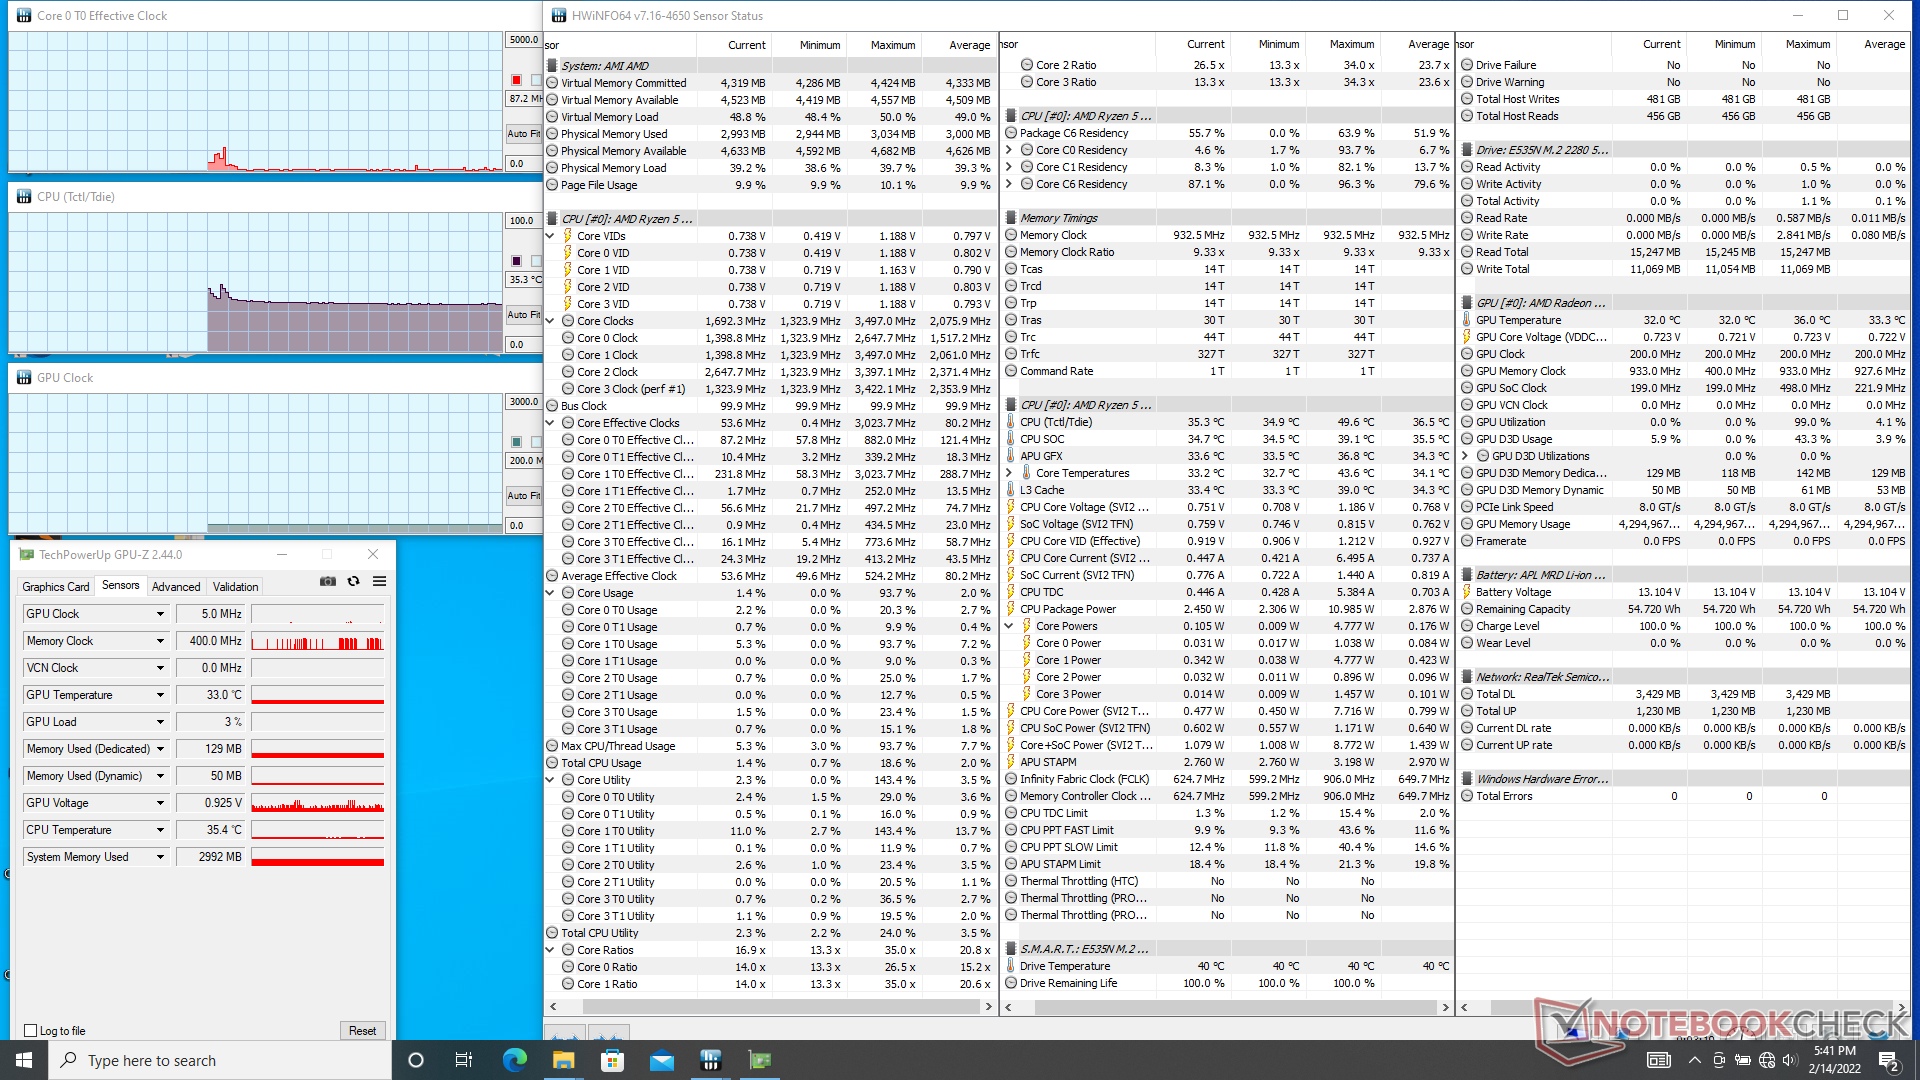
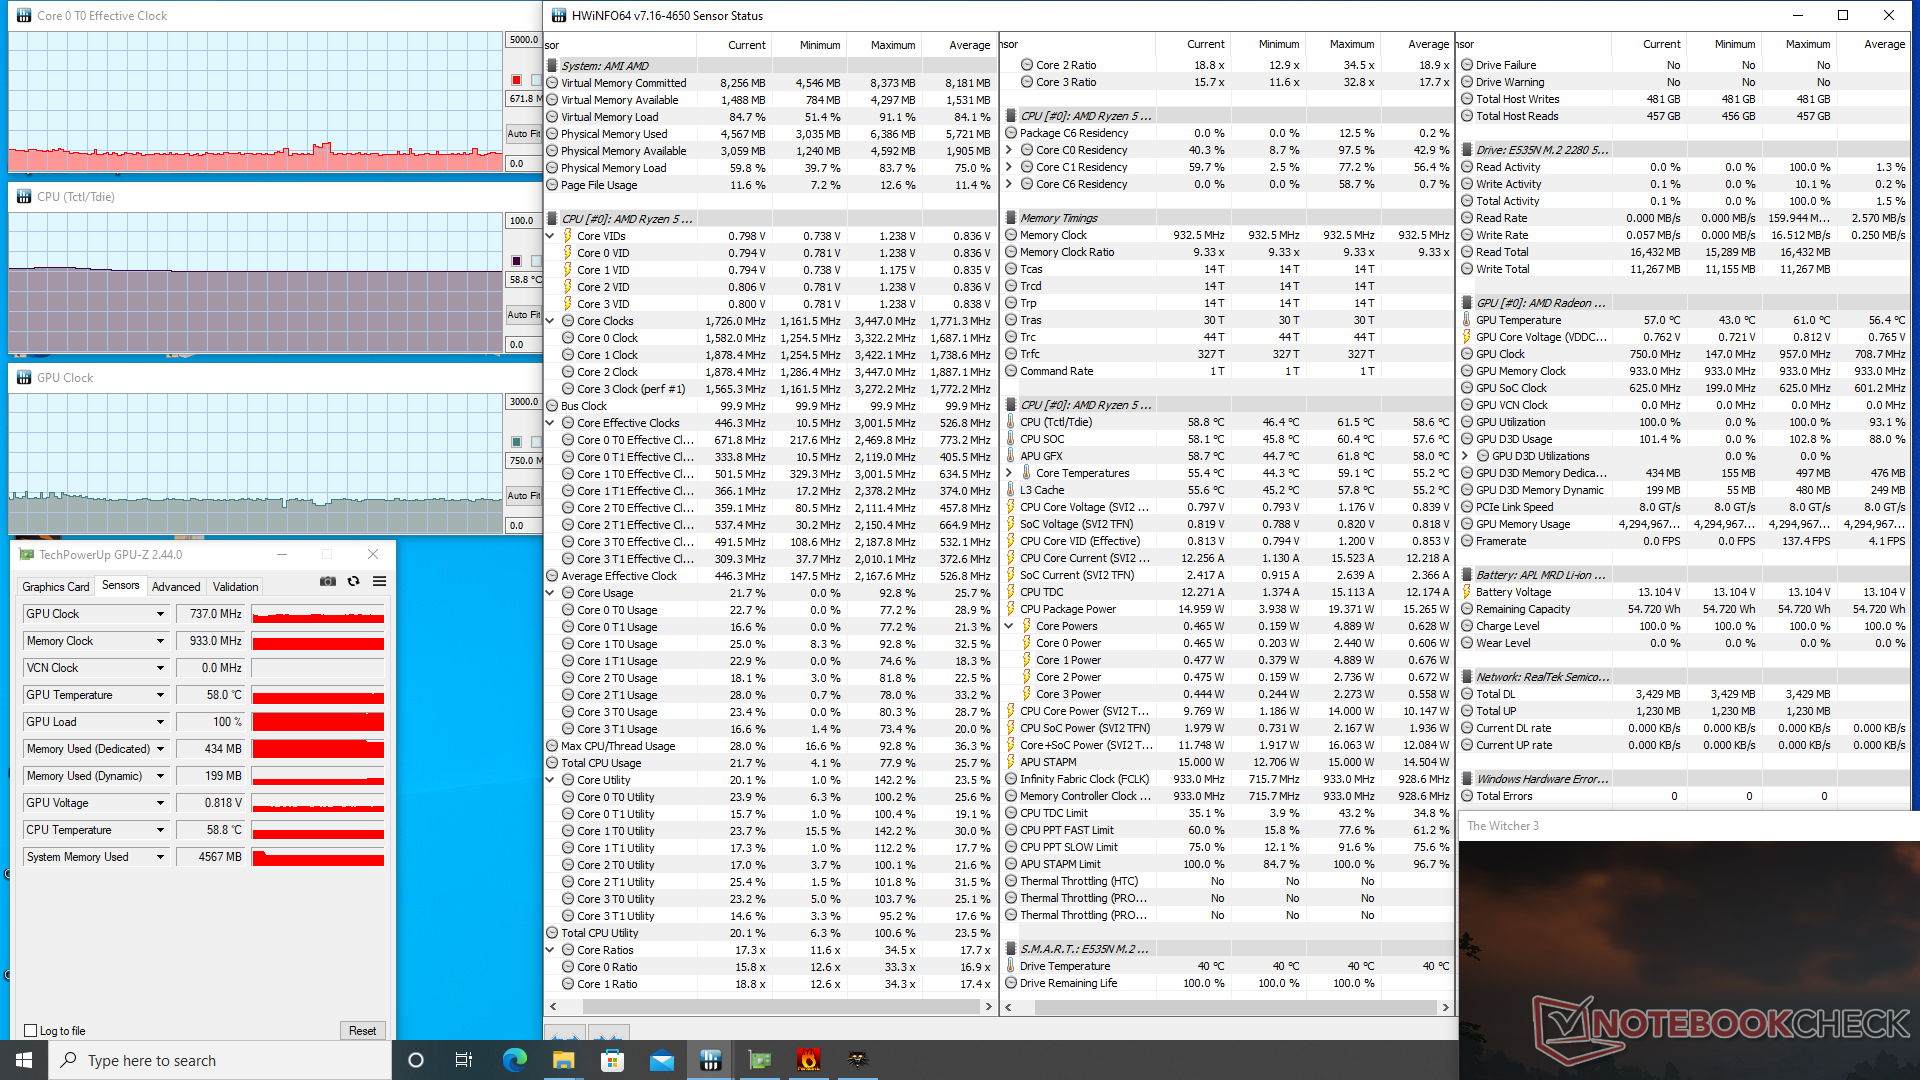
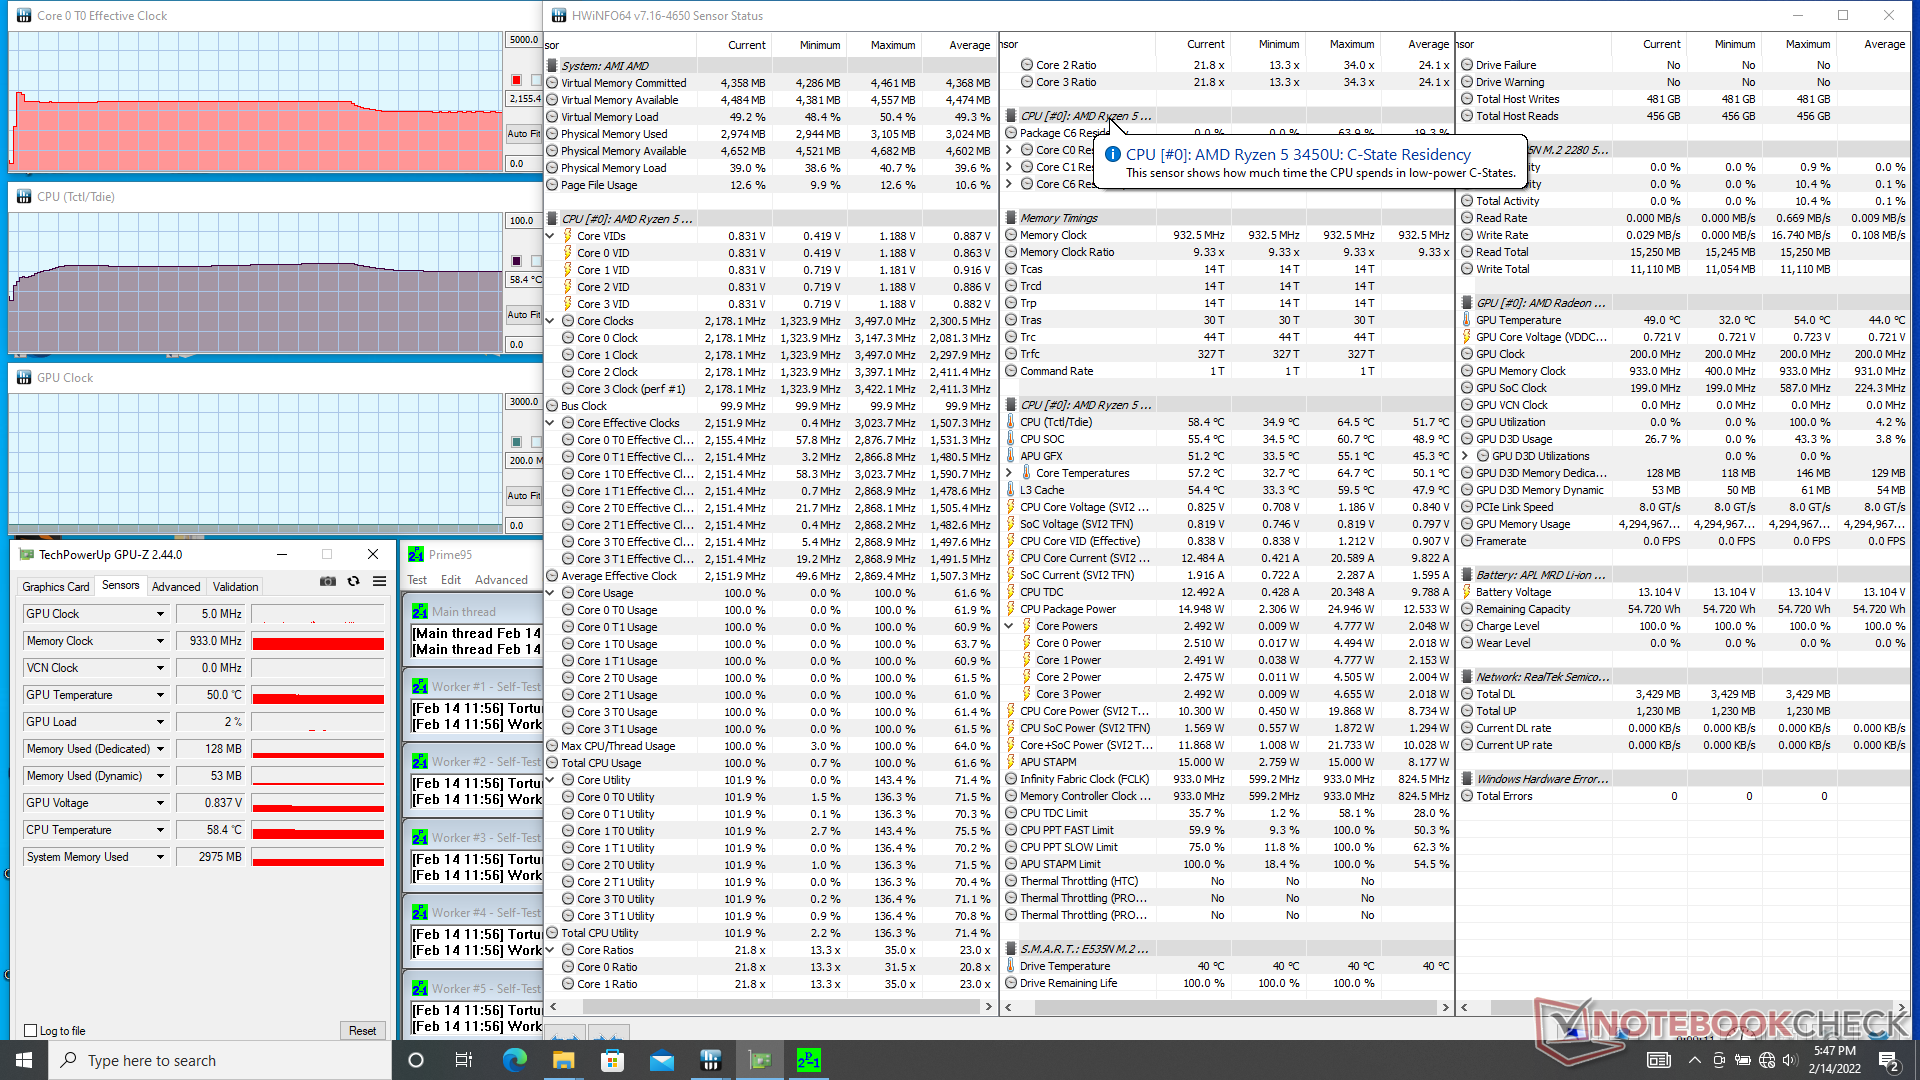
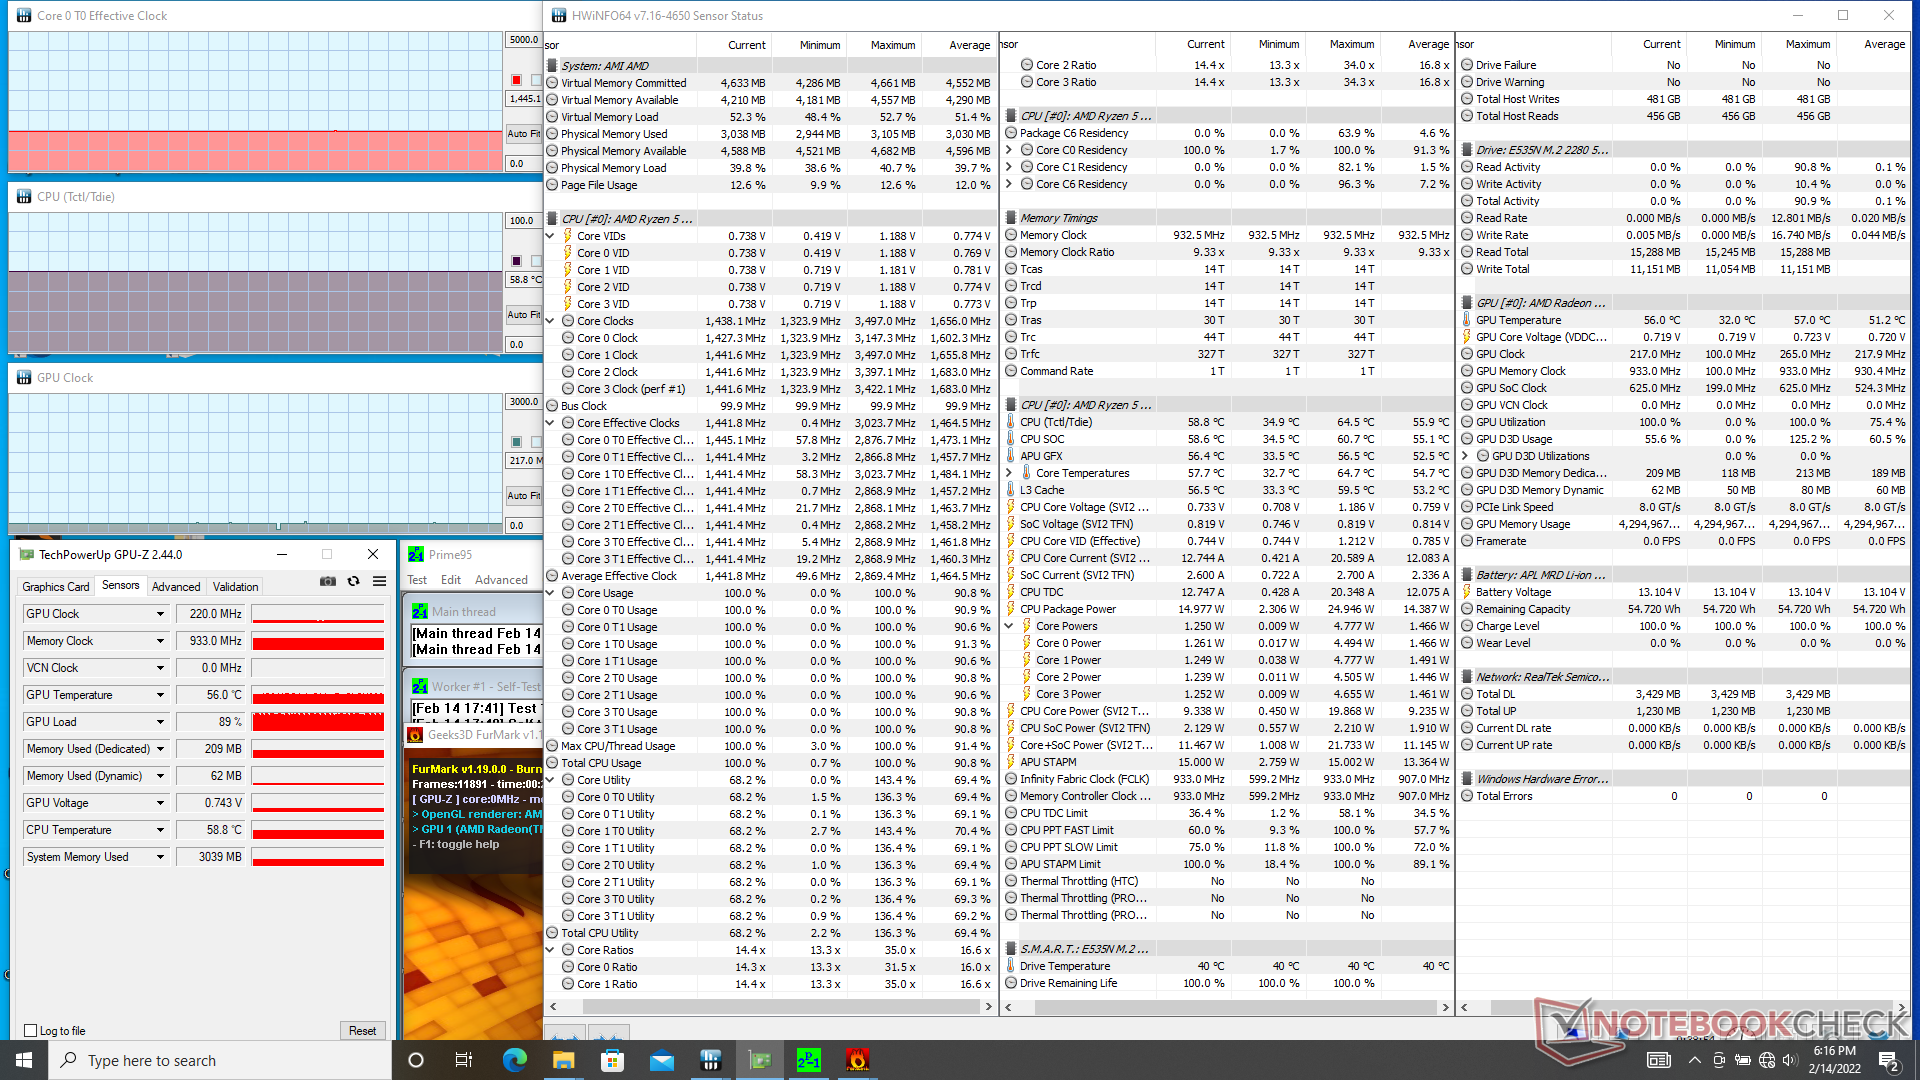
| Horloge du CPU (GHz) | Horloge du GPU (MHz) | Température moyenne du CPU Tctl/Tidle (°C) | |
| Système au repos | -- | -- | 35 |
| Prime95 Stress | 2.2 | -- | 59 |
| Prime95 + FurMark Stress | 1.5 | 220 | 59 |
| Witcher 3 Stress | 0.7 | 737 | 59 |
Haut-parleurs
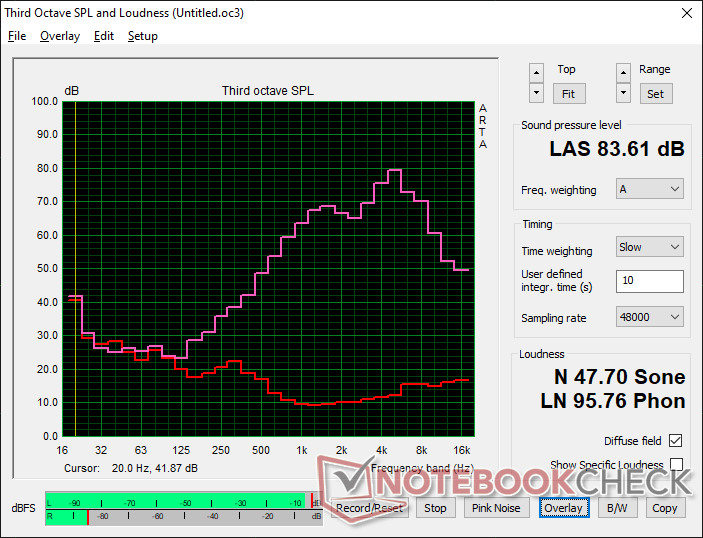
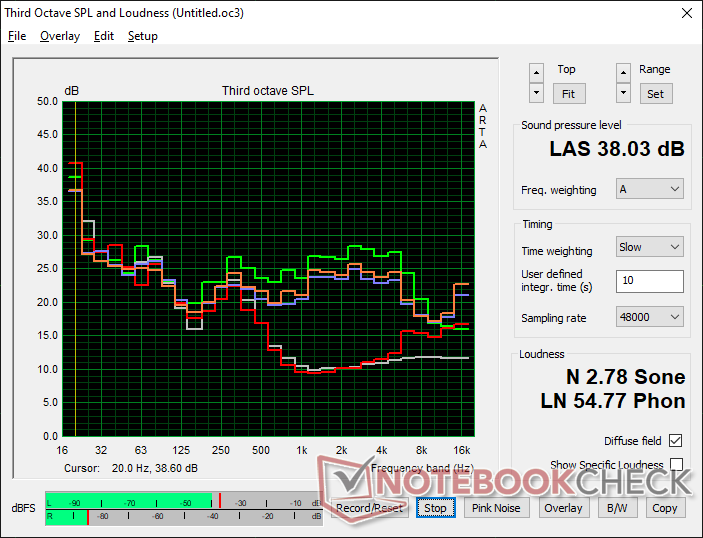
BMAX X14 Pro analyse audio
(+) | les haut-parleurs peuvent jouer relativement fort (83.6# dB)
Basses 100 - 315 Hz
(-) | presque aucune basse - en moyenne 29.2% plus bas que la médiane
(±) | la linéarité des basses est moyenne (7% delta à la fréquence précédente)
Médiums 400 - 2000 Hz
(±) | médiane réduite - en moyenne 7.8% inférieure à la médiane
(±) | la linéarité des médiums est moyenne (9.2% delta à la fréquence précédente)
Aiguës 2 - 16 kHz
(±) | sommets plus élevés - en moyenne 11.1% plus élevés que la médiane
(±) | la linéarité des aigus est moyenne (11.2% delta à la fréquence précédente)
Globalement 100 - 16 000 Hz
(-) | le son global n'est pas linéaire (33.5% de différence à la médiane)
Par rapport à la même classe
» 95% de tous les appareils testés de cette catégorie étaient meilleurs, 1% similaires, 3% pires
» Le meilleur avait un delta de 5%, la moyenne était de 18%, le pire était de 53%.
Par rapport à tous les appareils testés
» 92% de tous les appareils testés étaient meilleurs, 1% similaires, 6% pires
» Le meilleur avait un delta de 4%, la moyenne était de 23%, le pire était de 134%.
Apple MacBook Pro 16 2021 M1 Pro analyse audio
(+) | les haut-parleurs peuvent jouer relativement fort (84.7# dB)
Basses 100 - 315 Hz
(+) | bonne basse - seulement 3.8% loin de la médiane
(+) | les basses sont linéaires (5.2% delta à la fréquence précédente)
Médiums 400 - 2000 Hz
(+) | médiane équilibrée - seulement 1.3% de la médiane
(+) | les médiums sont linéaires (2.1% delta à la fréquence précédente)
Aiguës 2 - 16 kHz
(+) | des sommets équilibrés - à seulement 1.9% de la médiane
(+) | les aigus sont linéaires (2.7% delta à la fréquence précédente)
Globalement 100 - 16 000 Hz
(+) | le son global est linéaire (4.6% différence à la médiane)
Par rapport à la même classe
» 0% de tous les appareils testés de cette catégorie étaient meilleurs, 0% similaires, 100% pires
» Le meilleur avait un delta de 5%, la moyenne était de 17%, le pire était de 45%.
Par rapport à tous les appareils testés
» 0% de tous les appareils testés étaient meilleurs, 0% similaires, 100% pires
» Le meilleur avait un delta de 4%, la moyenne était de 23%, le pire était de 134%.
Gestion de l'énergie
Consommation d'énergie
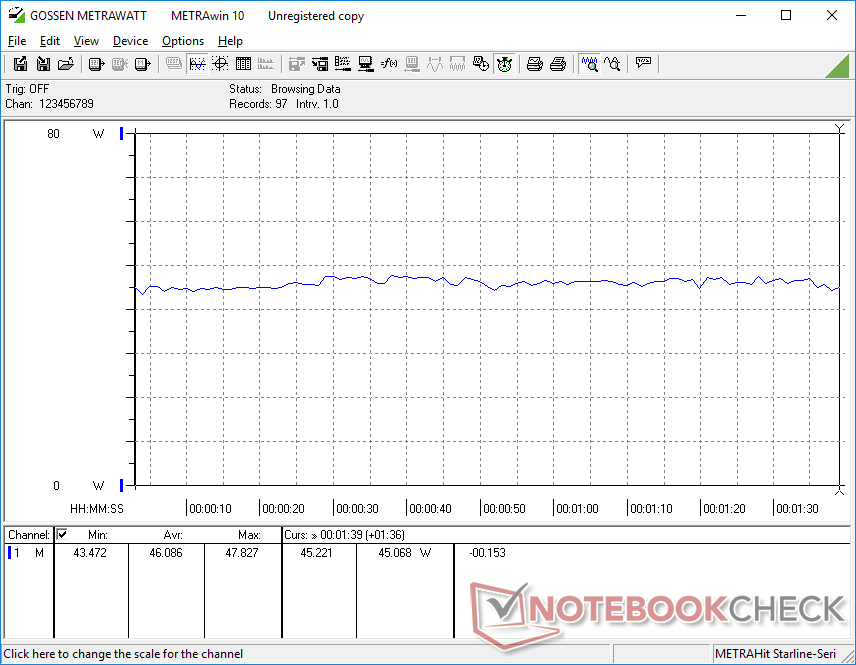
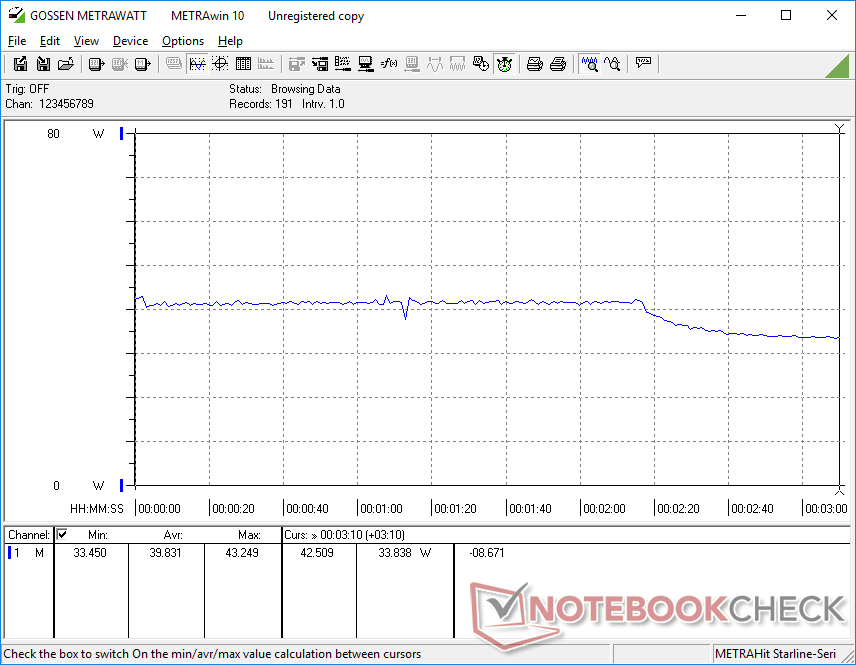
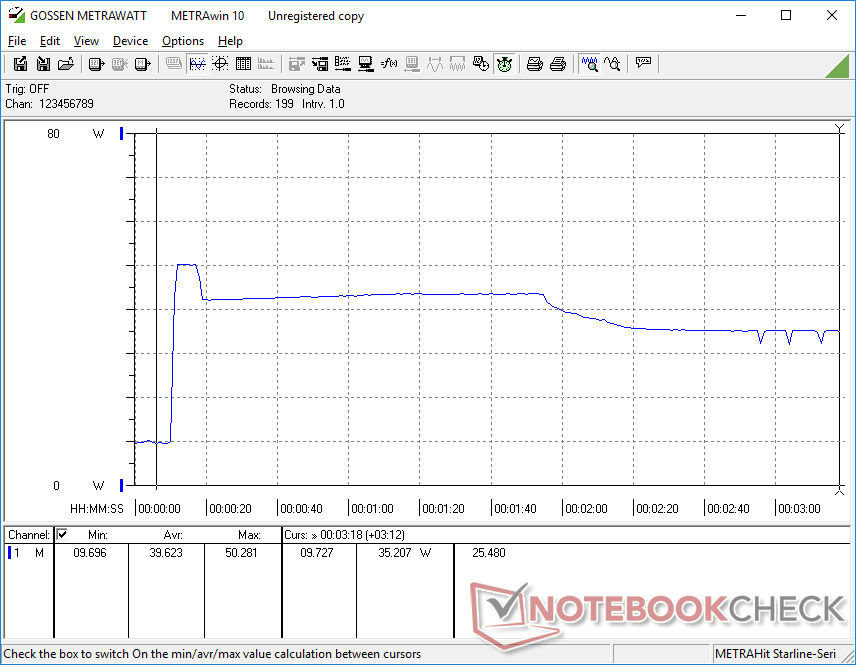
Le système consomme un peu plus d'énergie que la plupart des autres Ultrabooks récents car il utilise un CPU AMD d'ancienne génération. L'exécution de charges exigeantes consommera entre 40 W et 46 W, contre 35 W à 42 W pour le modèle Dell Inspiron 14 7400 ouHP Pavilion 14 même si le BMax est moins performant. La performance inférieure par watt est un prix courant à payer lorsqu'on choisit des processeurs d'ancienne génération.
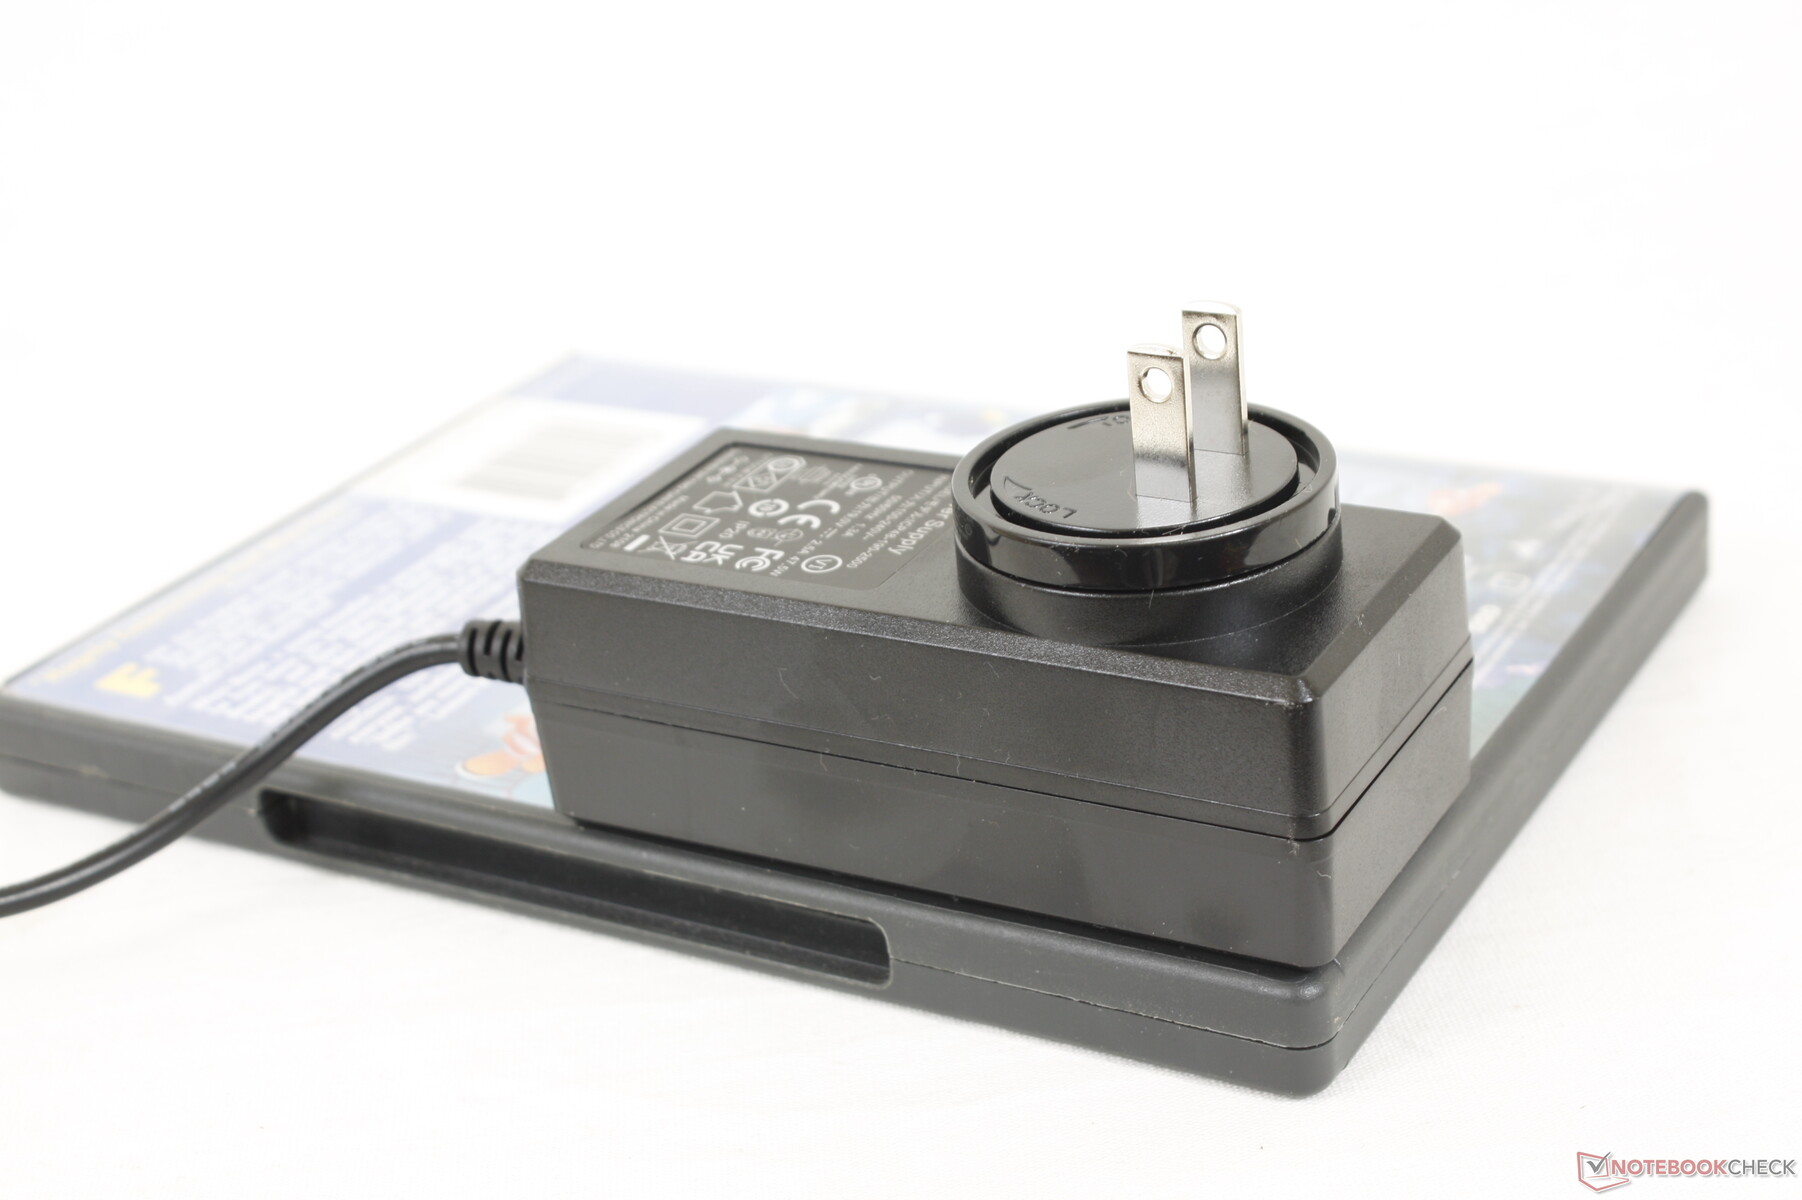
Nous avons pu enregistrer une consommation maximale temporaire de 50 W sur le petit adaptateur secteur de 47,5 W (~9,5 x 4,1 x 6 cm) lors de l'exécution simultanée de Prime95 et FurMark.

| Éteint/en veille | |
| Au repos | |
| Fortement sollicité |
|
Légende:
min: | |
| BMAX X14 Pro R5 3450U, Vega 8, SEAPIY E535N 512GB, IPS, 1920x1080, 14" | Lenovo IdeaPad 5 Pro 14ACN6 R5 5600U, Vega 7, WDC PC SN730 SDBPNTY-512G, IPS, 2240x1400, 14" | Dell Inspiron 14 7400 7415 2-in-1 R7 5700U, Vega 8, WDC PC SN530 SDBPTPZ-512G, IPS, 1920x1080, 14" | HP Pavilion 14-dv0357ng i5-1135G7, Iris Xe G7 80EUs, Intel Optane Memory H10 with Solid State Storage 32GB + 1TB HBRPEKNX0203AH(L/H), IPS, 1920x1080, 14" | Huawei MateBook 14 2020 Intel i7-10510U, GeForce MX350, Lite-On CA5-8D512, IPS LED, 2160x1440, 14" | Infinix INBook X2 i7-1065G7, Iris Plus Graphics G7 (Ice Lake 64 EU), Foresee GSYAPGC-512G, IPS, 1920x1080, 14" | |
|---|---|---|---|---|---|---|
| Power Consumption | 9% | 19% | 8% | -9% | 17% | |
| Idle Minimum * (Watt) | 6.3 | 3.8 40% | 4.5 29% | 4.8 24% | 3 52% | 4.3 32% |
| Idle Average * (Watt) | 9.6 | 6.9 28% | 6.5 32% | 8.5 11% | 9 6% | 6.3 34% |
| Idle Maximum * (Watt) | 9.9 | 8.8 11% | 7.1 28% | 12.4 -25% | 11 -11% | 9.6 3% |
| Load Average * (Watt) | 46 | 42.2 8% | 40.4 12% | 37.7 18% | 60.8 -32% | 40.7 12% |
| Witcher 3 ultra * (Watt) | 39.8 | 37.7 5% | 31.7 20% | 35.4 11% | 56 -41% | 36.9 7% |
| Load Maximum * (Watt) | 50.3 | 68.4 -36% | 54.3 -8% | 45.3 10% | 65.6 -30% | 44.4 12% |
* ... Moindre est la valeur, meilleures sont les performances
Power Consumption Witcher 3 / Stresstest
Power Consumption external Monitor
Autonomie de la batterie
L'autonomie du WLAN est assez bonne, avec environ 6,5 heures sur une charge complète. En revanche, le chargement du vide au plein est relativement lent, avec 3,5 heures, contre seulement 1,5 heure pour la plupart des autres Ultrabooks.
| BMAX X14 Pro R5 3450U, Vega 8, 55 Wh | Lenovo IdeaPad 5 Pro 14ACN6 R5 5600U, Vega 7, 57 Wh | Dell Inspiron 14 7400 7415 2-in-1 R7 5700U, Vega 8, 54 Wh | HP Pavilion 14-dv0357ng i5-1135G7, Iris Xe G7 80EUs, 43 Wh | Huawei MateBook 14 2020 Intel i7-10510U, GeForce MX350, 56 Wh | Infinix INBook X2 i7-1065G7, Iris Plus Graphics G7 (Ice Lake 64 EU), 50 Wh | |
|---|---|---|---|---|---|---|
| Autonomie de la batterie | 39% | 64% | -9% | 94% | 2% | |
| WiFi v1.3 (h) | 6.6 | 9.2 39% | 10.8 64% | 6 -9% | 12.8 94% | 6.7 2% |
| Reader / Idle (h) | 21.6 | 18.6 | ||||
| Load (h) | 1 | 2.3 | 2 | |||
| H.264 (h) | 5.9 | 13.9 | ||||
| Witcher 3 ultra (h) | 2 |
Points positifs
Points négatifs
Verdict
Les meilleurs aspects du BMax X14 Pro sont son prix bas de moins de 500 USD et son CPU AMD Ryzen 5 relativement rapide pour le prix. Il semble également plus cher qu'il ne l'est lorsqu'on le compare à d'autres modèles bon marché comme la série Dell Inspiron 3000, La série HP 14ou la série Lenovo IdeaPad 3.
Les inconvénients du X14 Pro sont similaires à ceux de nombreux ordinateurs portables Chuwi dans la mesure où le modèle se concentre sur le design visuel au détriment de l'assurance qualité ou d'autres coupes dans le matériel. Notre touche Espace, par exemple, est plus spongieuse que toutes les autres touches alors que le retour d'information devrait être uniforme, tandis que le châssis fléchit, se tord et grince plus facilement que nous le souhaiterions. Son écran ne couvre que 59 % de la gamme sRGB, alors qu'il est censé en couvrir 100 %.
Si vous recherchez un ordinateur portable de 14 pouces bon marché qui maximise les performances et la portabilité, alors le BMax X14 Pro peut remplir cette niche. Cependant, pour obtenir des couleurs plus riches et une meilleure fiabilité, vous devrez dépenser un peu plus pour des ultrabooks de milieu de gamme de fabricants plus connus, comme les modèles suivants Lenovo IdeaPad 5 series ou Série HP Envy.
Prix et disponibilité
Le BMax X14 Pro est maintenant expédié sur Amazon pour $499 USD ou $439 après avoir appliqué le code de réduction de $60.
BMAX X14 Pro
- 02/16/2022 v7 (old)
Allen Ngo
Price comparison

