Test du Beelink U59 : les débuts du Celeron N5105 Jasper Lake dans ce mini-PC
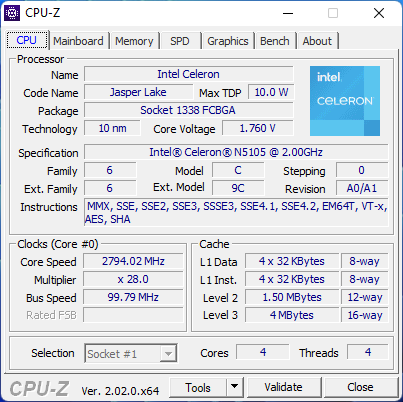
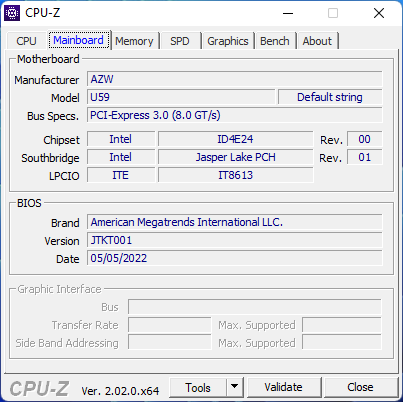
Beelink a mis à jour l'un de ses mini-PC les moins chers avec un processeur Intel Celeron N5105 de Jasper Lake plus rapide, en remplacement du Celeron N5095 du modèle précédent Modèle U59. Bien que le châssis reste presque le même que précédemment, il y a quelques différences importantes que nous allons noter dans la revue ci-dessous
Le Beelink U59 est en concurrence avec d'autres mini-PC bon marché comme le Zotac Nano series, La série GMK NucBoxou le Chuwi GBox
Plus de commentaires sur Beelink :
Comparaison avec les concurrents potentiels
Note | Date | Modèle | Poids | Épaisseur | Taille | Résolution | Prix |
|---|---|---|---|---|---|---|---|
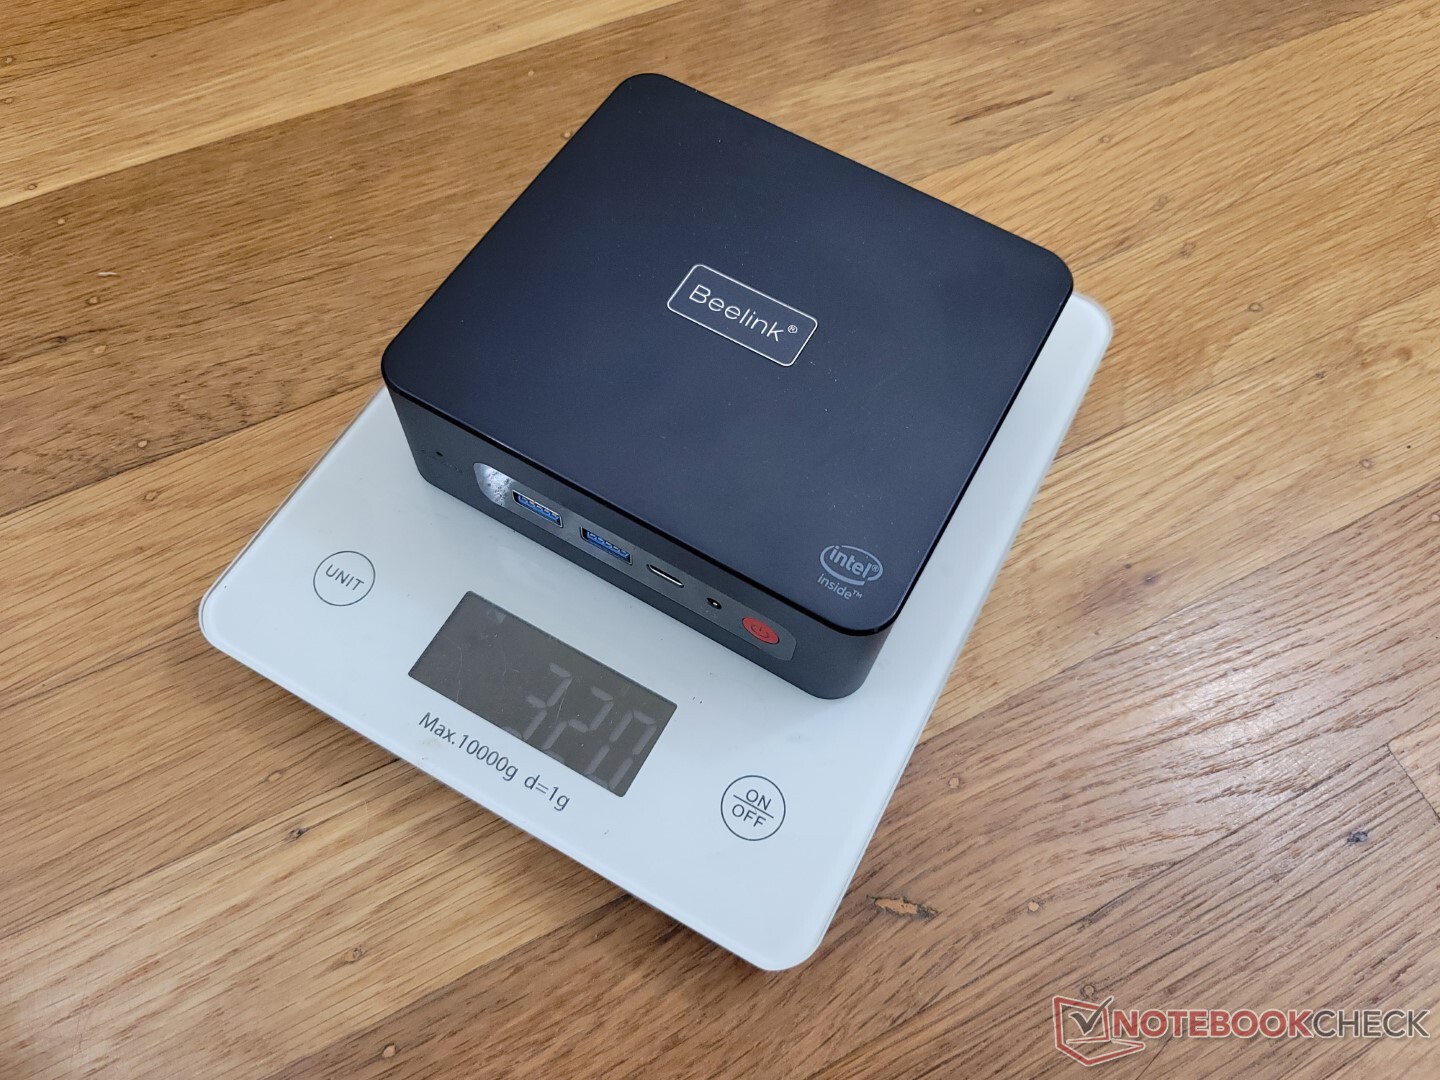
v (old) | 09/22 | Beelink U59 N5105 Celeron N5105, UHD Graphics (Jasper Lake 24 EU) | 320 g | 42 mm | x | ||
v (old) | 06/22 | Beelink U59 Mini-S Celeron N5095, UHD Graphics (Jasper Lake 16 EU) | 279 g | 41 mm | x | ||
v (old) | 04/22 | Beelink SER4 R7 4800U, Vega 8 | 494 g | 40 mm | x | ||
v (old) | 11/21 | Beelink SER3 R7 3750H, Vega 10 | 492 g | 40 mm | x | ||
v (old) | 04/21 | Intel NUC11TNKi5 i5-1135G7, Iris Xe G7 80EUs | 504 g | 37 mm | x | ||
v (old) | 07/22 | Zotac ZBOX PI336 pico Celeron N6211, UHD Graphics (Elkhart Lake 16 EU) | 293 g | 20.7 mm | x |
Cas
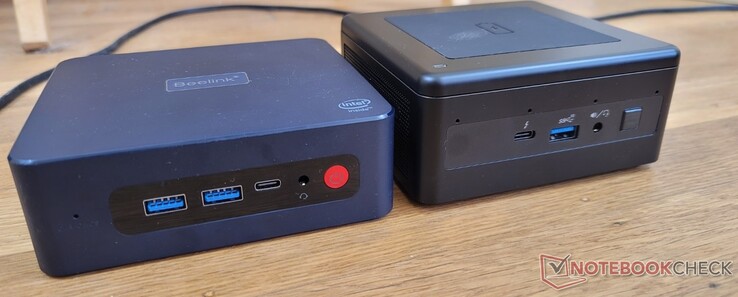
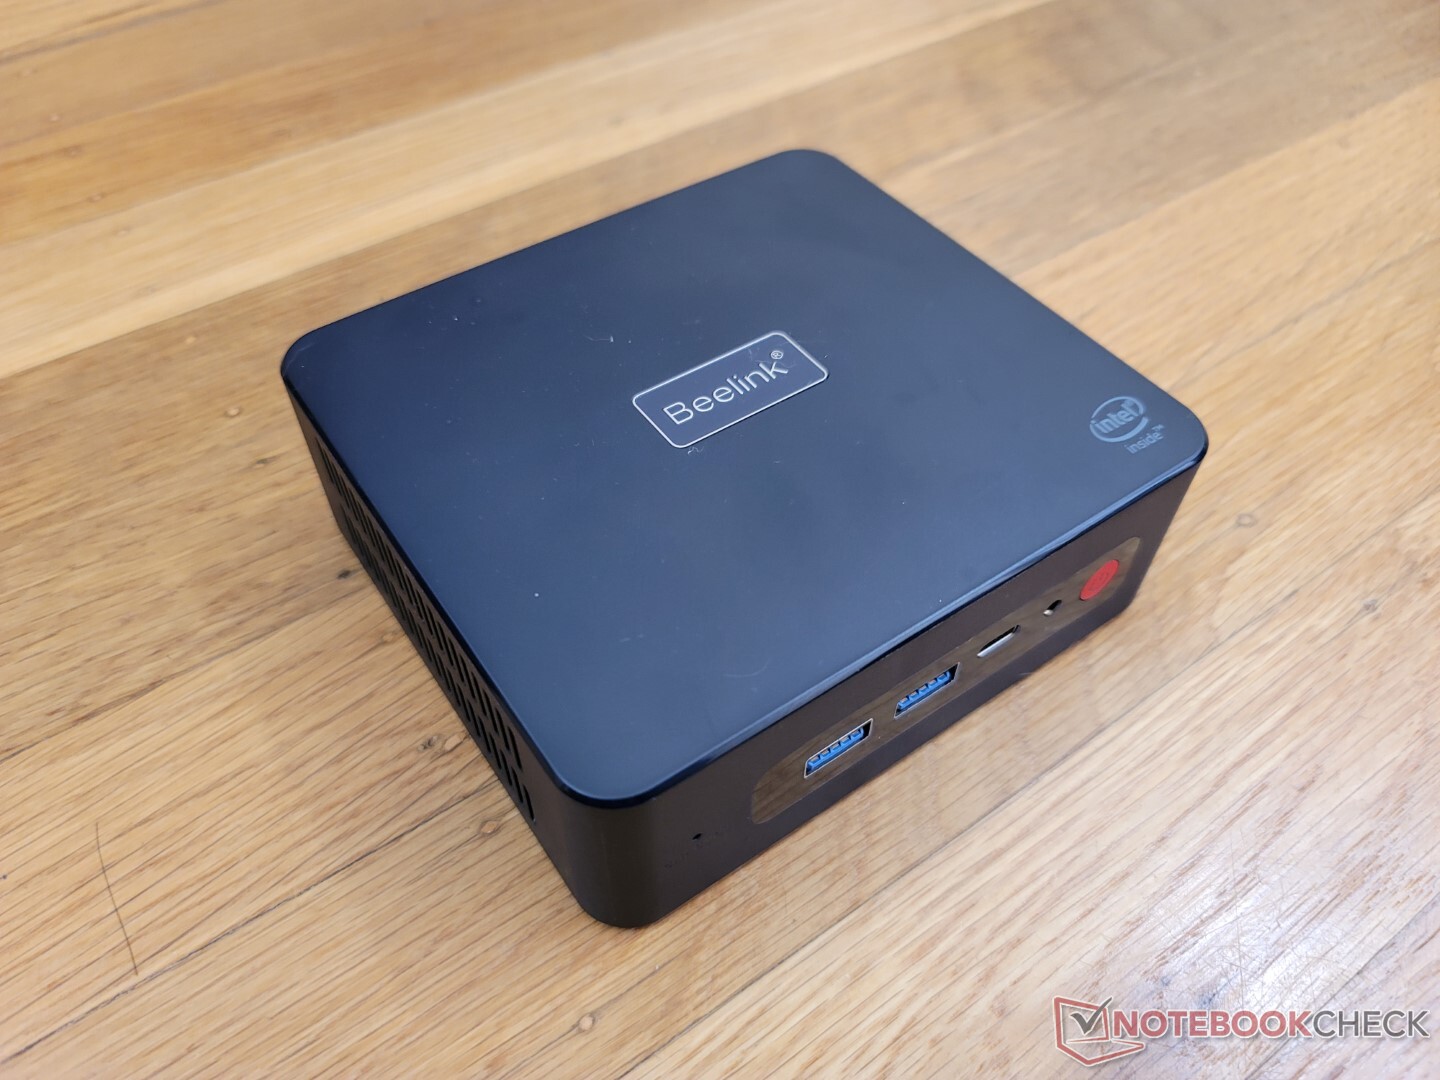
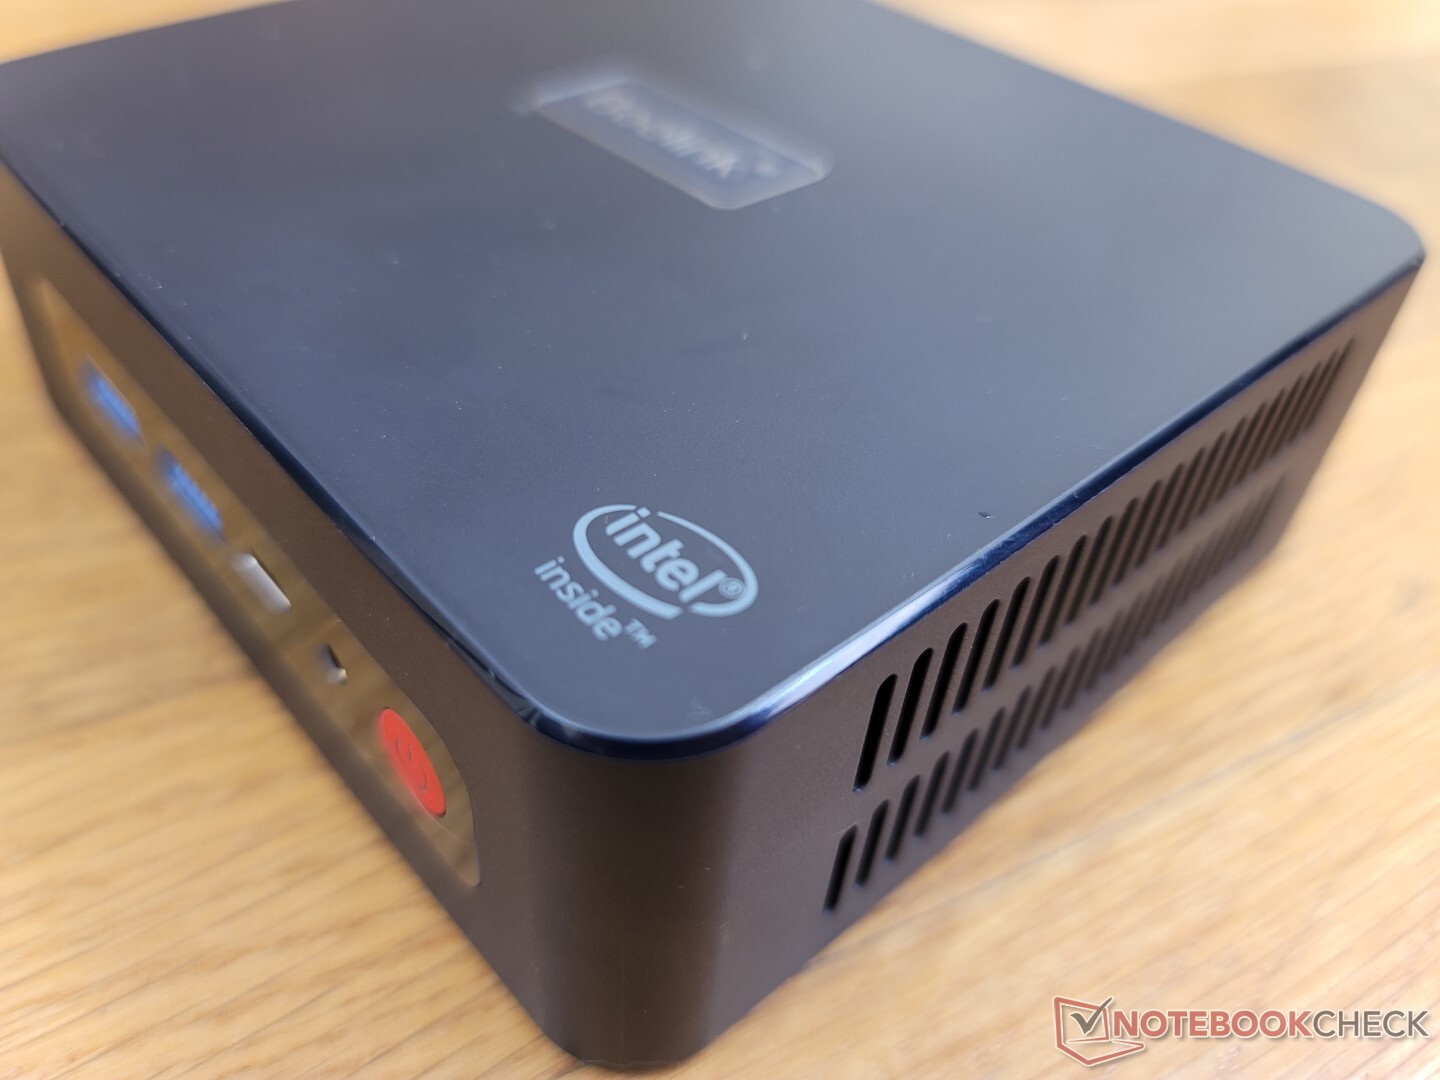
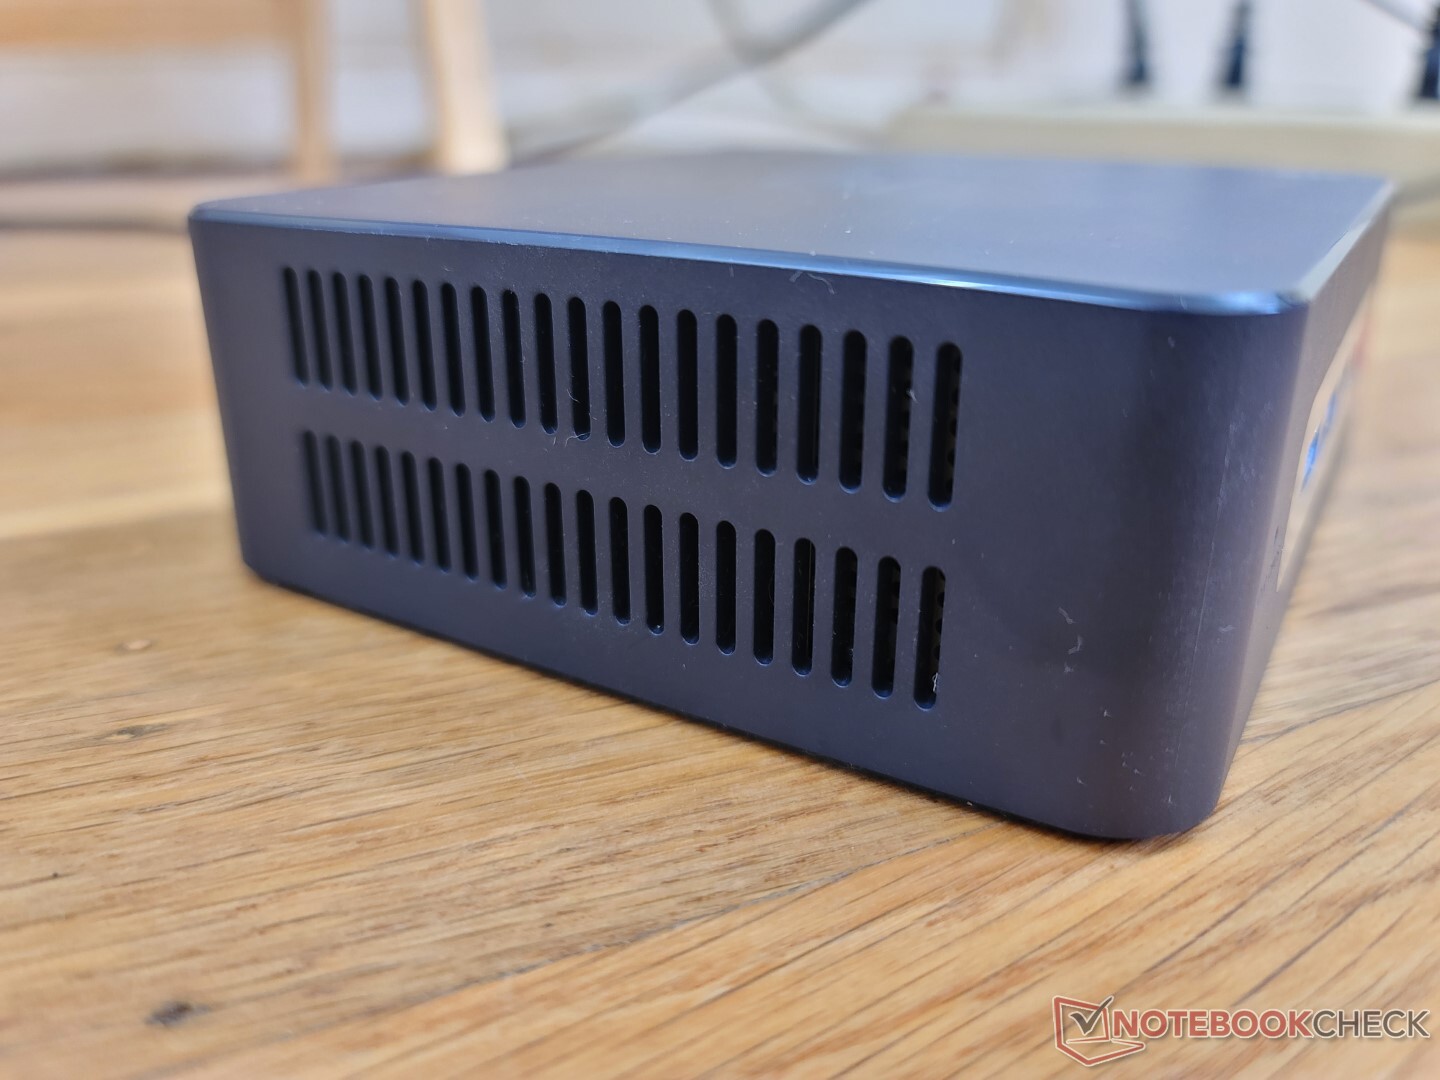
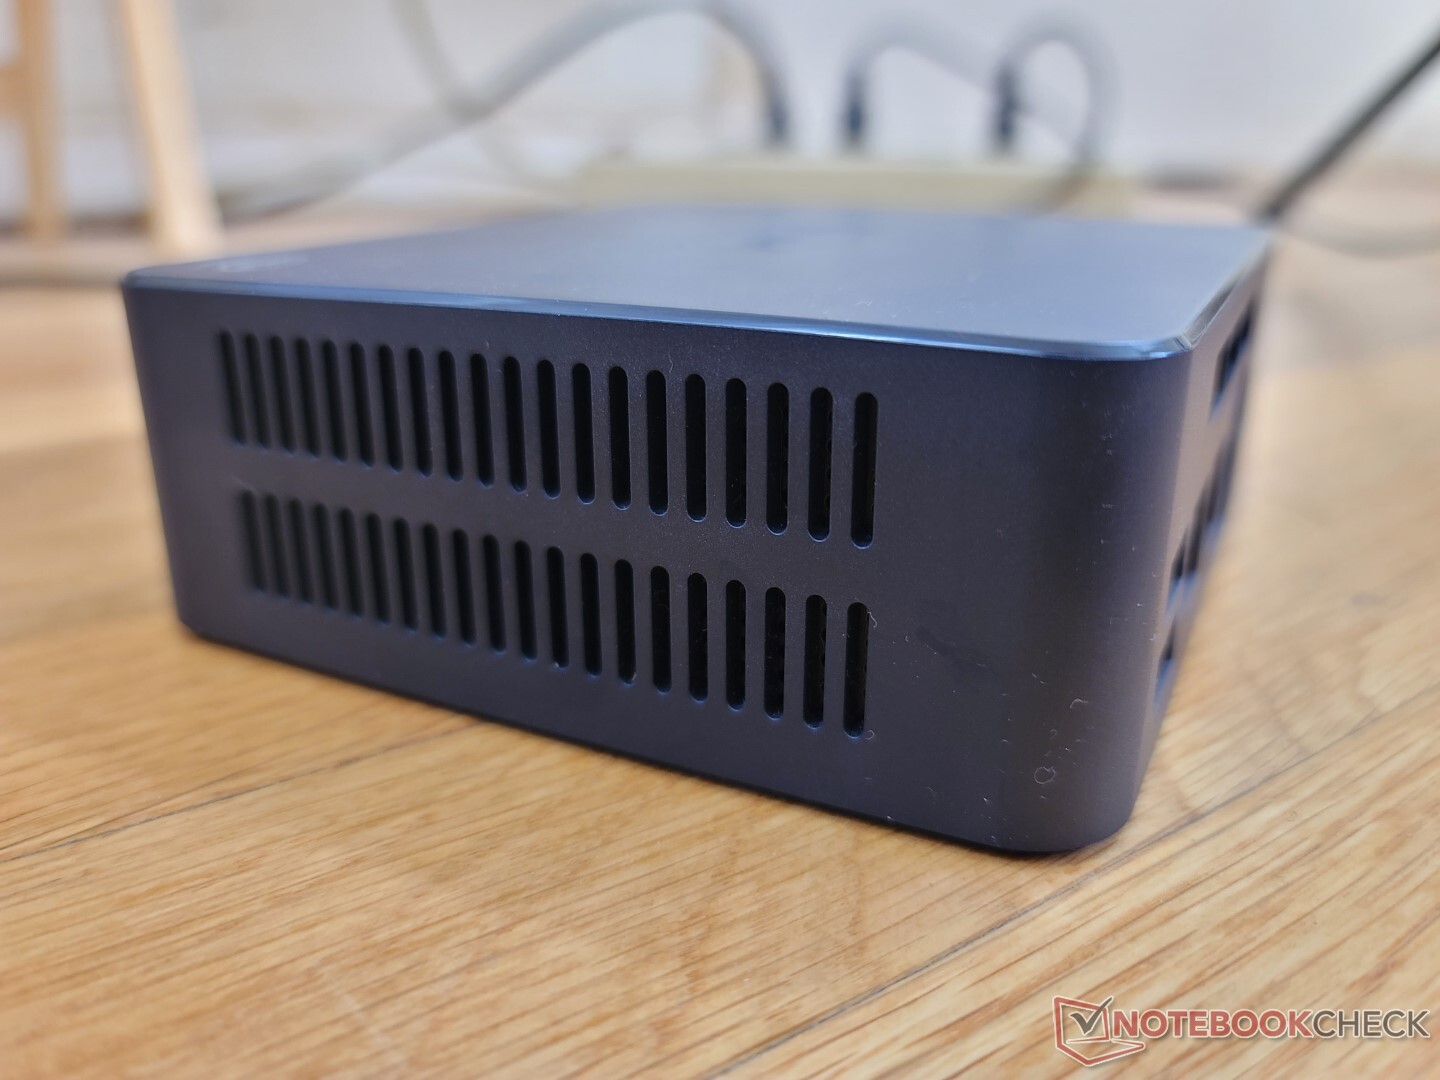
De manière ennuyeuse, Beelink propose trois différents U59 chacun avec des options de port, des designs et des caractéristiques internes légèrement différents. Leurs dimensions et leur poids sont par ailleurs presque identiques. Pour notre modèle de revue ici, le châssis a de plus grandes grilles de ventilation et un dessus et un logo entièrement mats par rapport aux petites grilles et aux dessus brillants des modèles précédents.
Connectivité
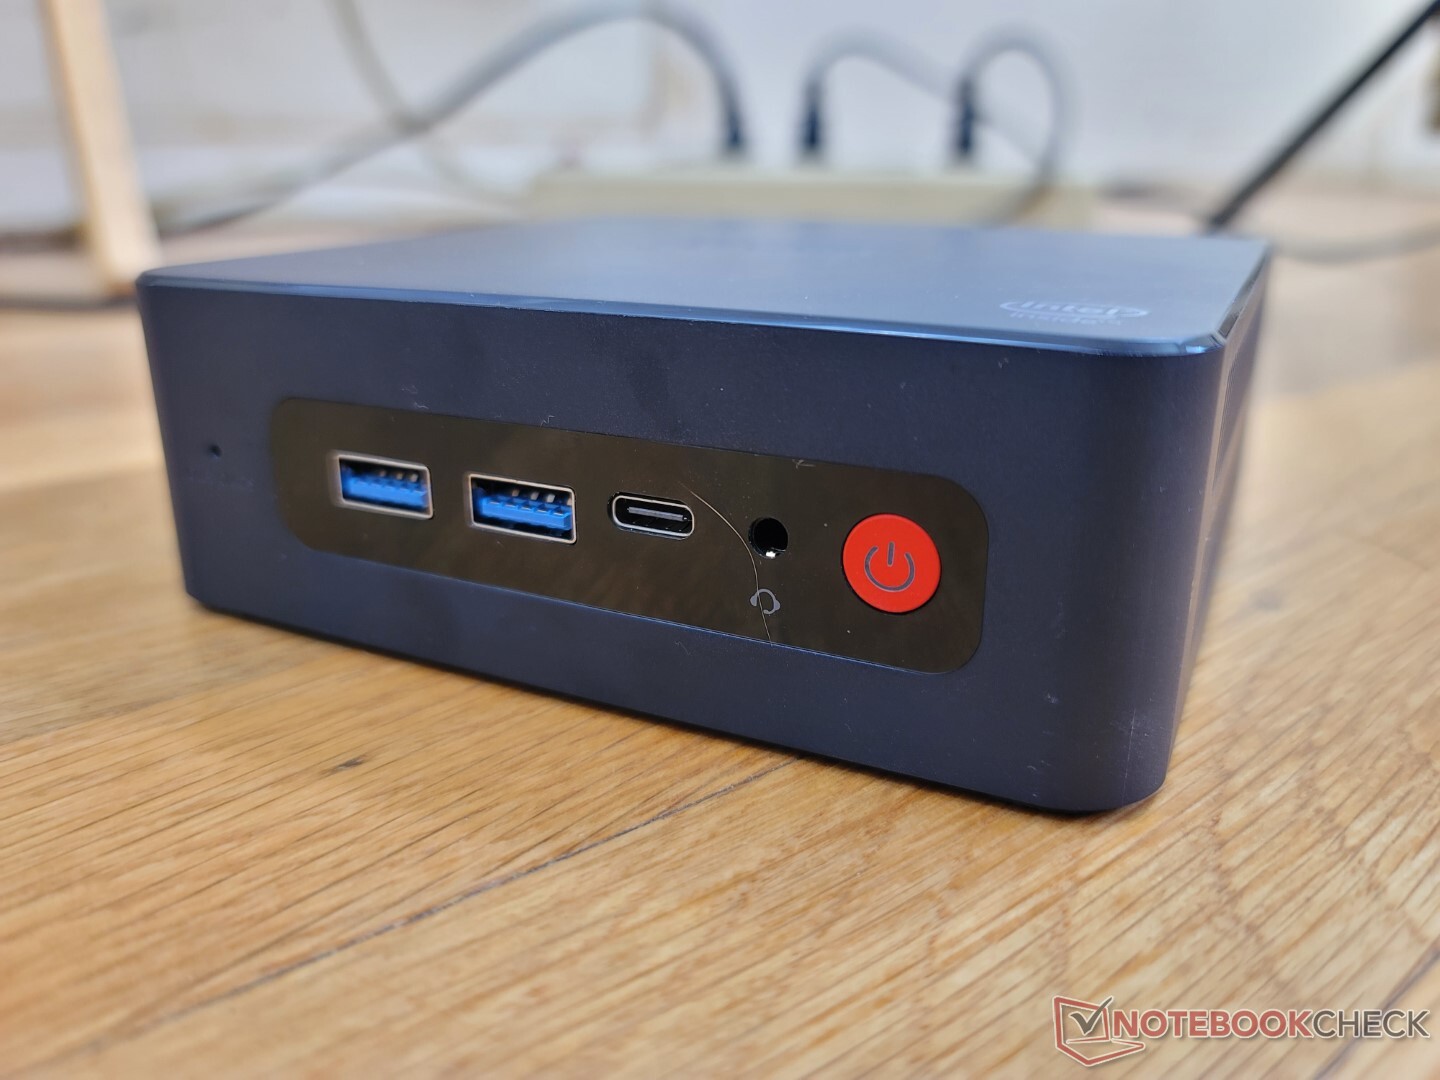
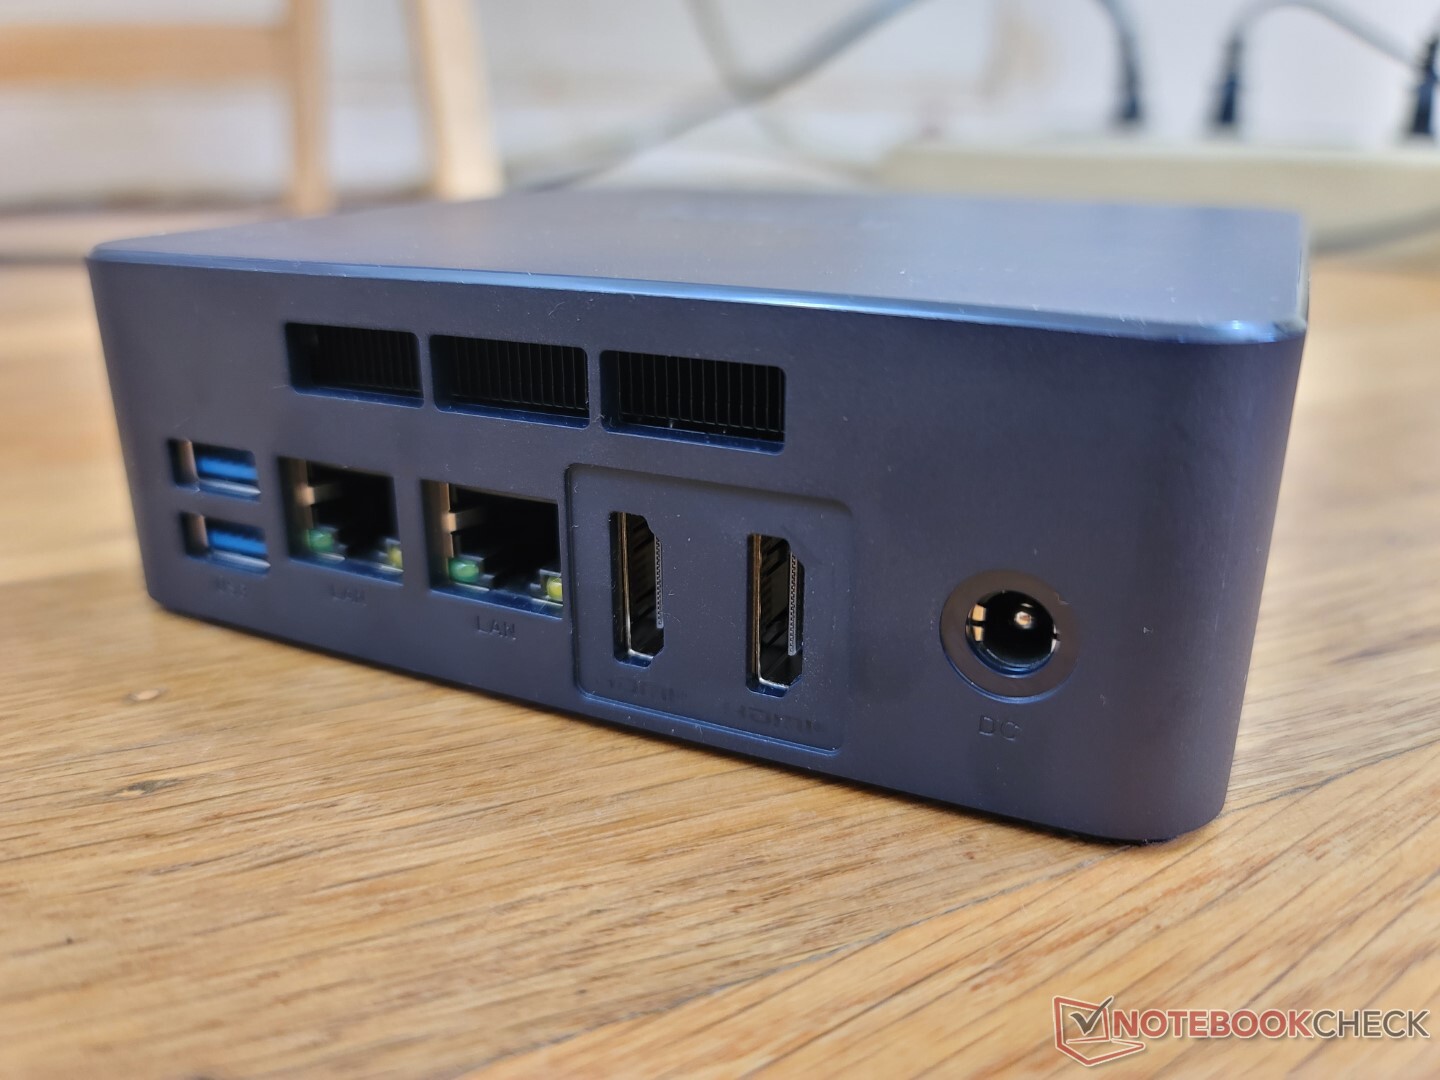
Les options de port sont pour la plupart identiques à celles du U59 original, notamment le port USB-C et l'absence de verrou Kensington. Pour ce modèle plus récent, cependant, le fabricant a intégré un deuxième port RJ-45 pour un total de deux. Notez que le port USB-C ici prend en charge DisplayPort mais pas Power Delivery et que le système dépend donc de son adaptateur secteur propriétaire pour l'alimentation.
Communication
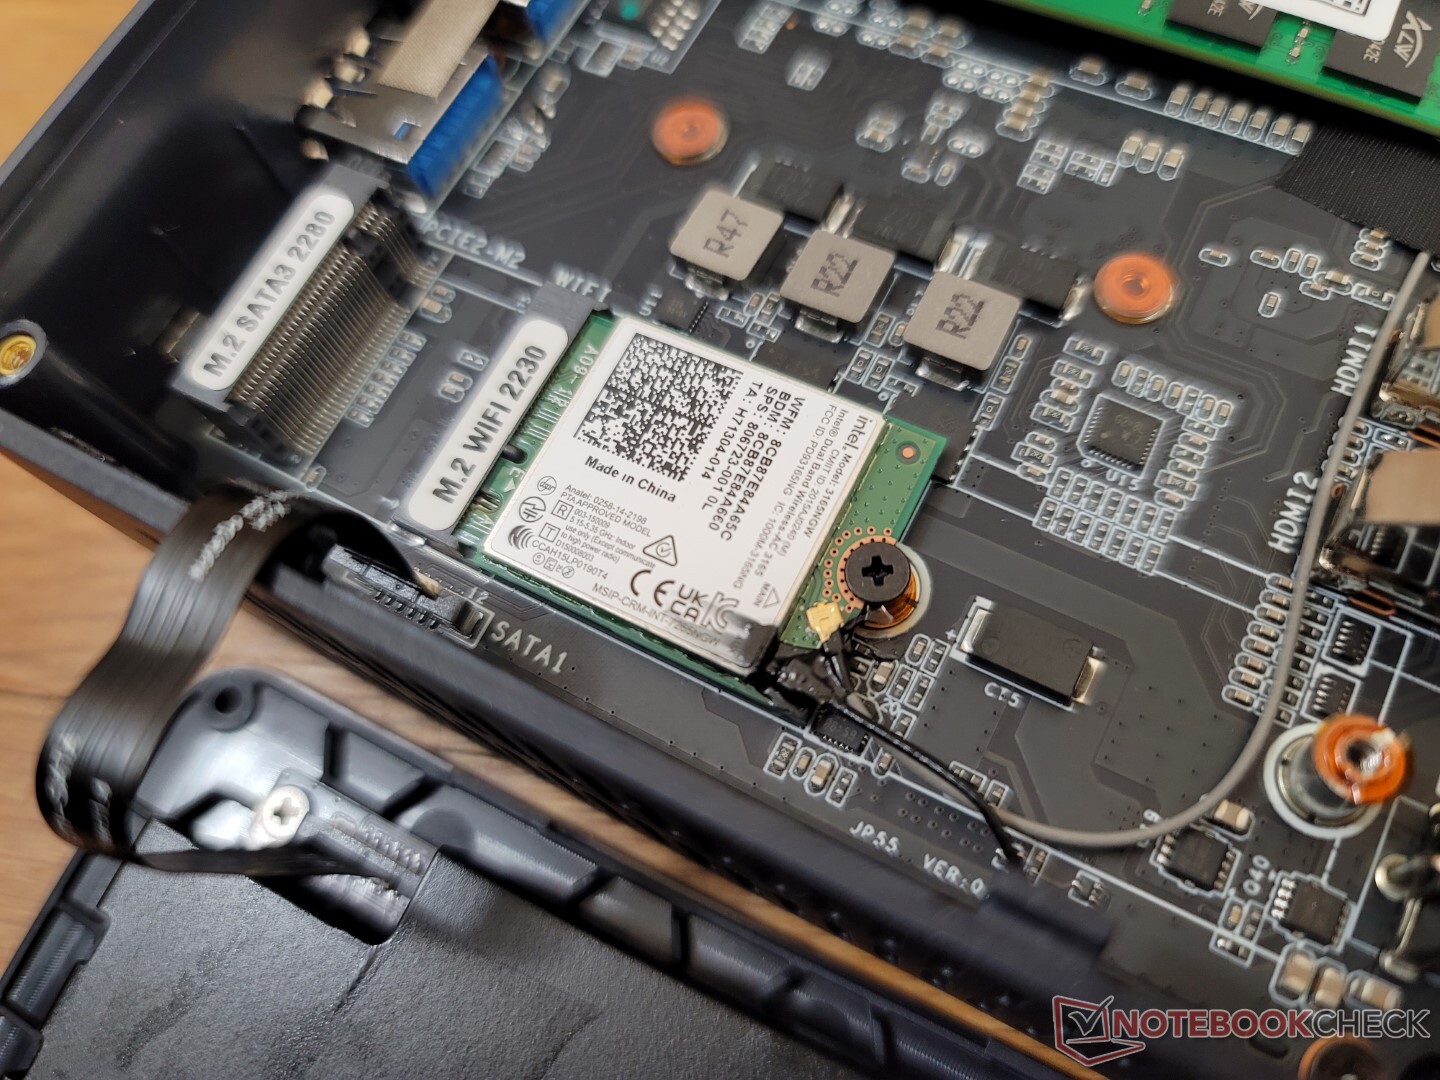
Le module WLAN Intel 3165 est amovible, contrairement à la version Mini-S du U59. Bien que lent, nous n'avons rencontré aucun problème de connectivité lors du streaming de contenu 4K.
| Networking | |
| iperf3 transmit AX12 | |
| Intel NUC11TNKi5 | |
| Beelink SER4 | |
| Beelink SER3 | |
| iperf3 receive AX12 | |
| Intel NUC11TNKi5 | |
| Beelink SER4 | |
| Beelink SER3 | |
| iperf3 receive AXE11000 | |
| Beelink U59 N5105 | |
| Beelink U59 Mini-S | |
| iperf3 transmit AXE11000 | |
| Beelink U59 N5105 | |
| Beelink U59 Mini-S | |
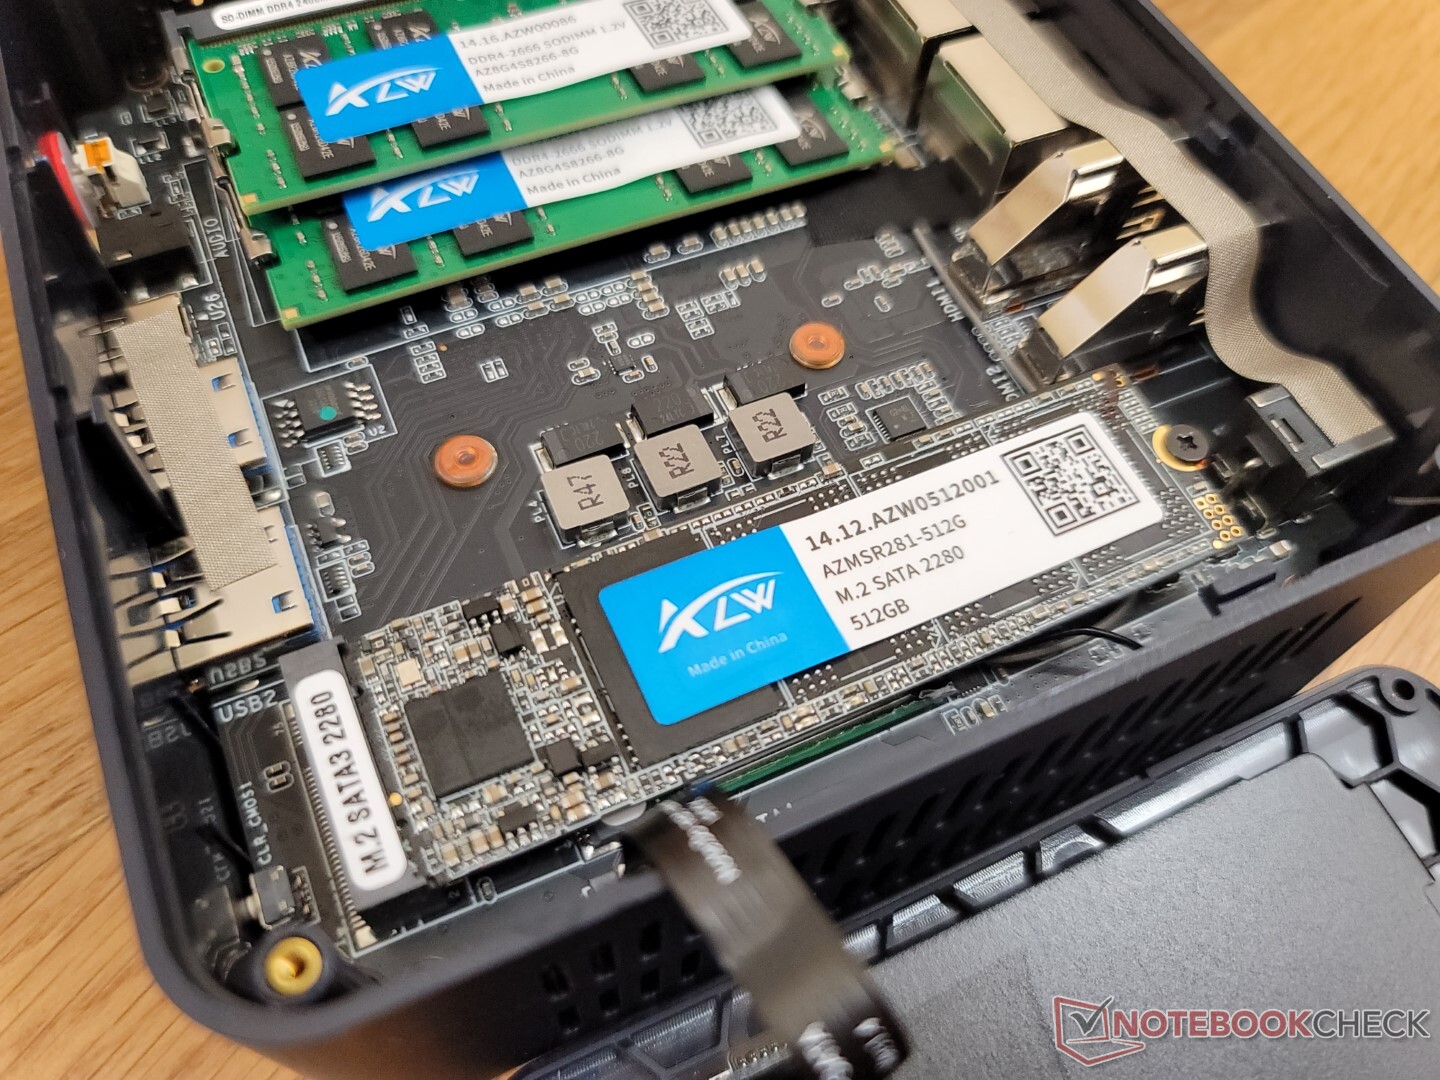
Maintenance
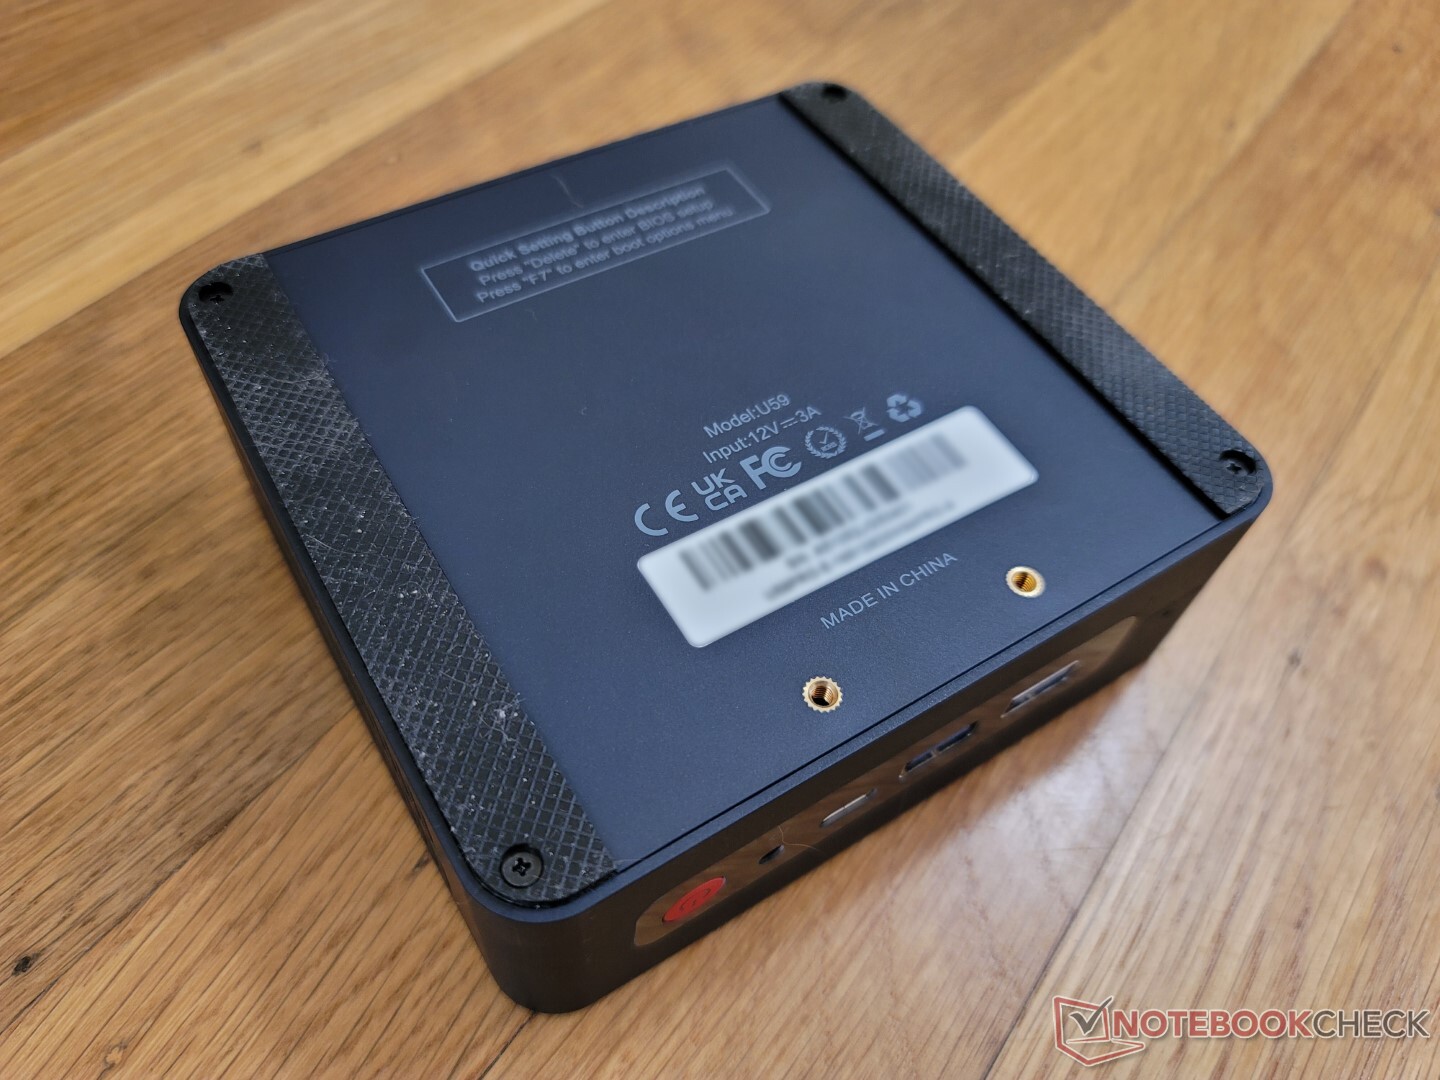
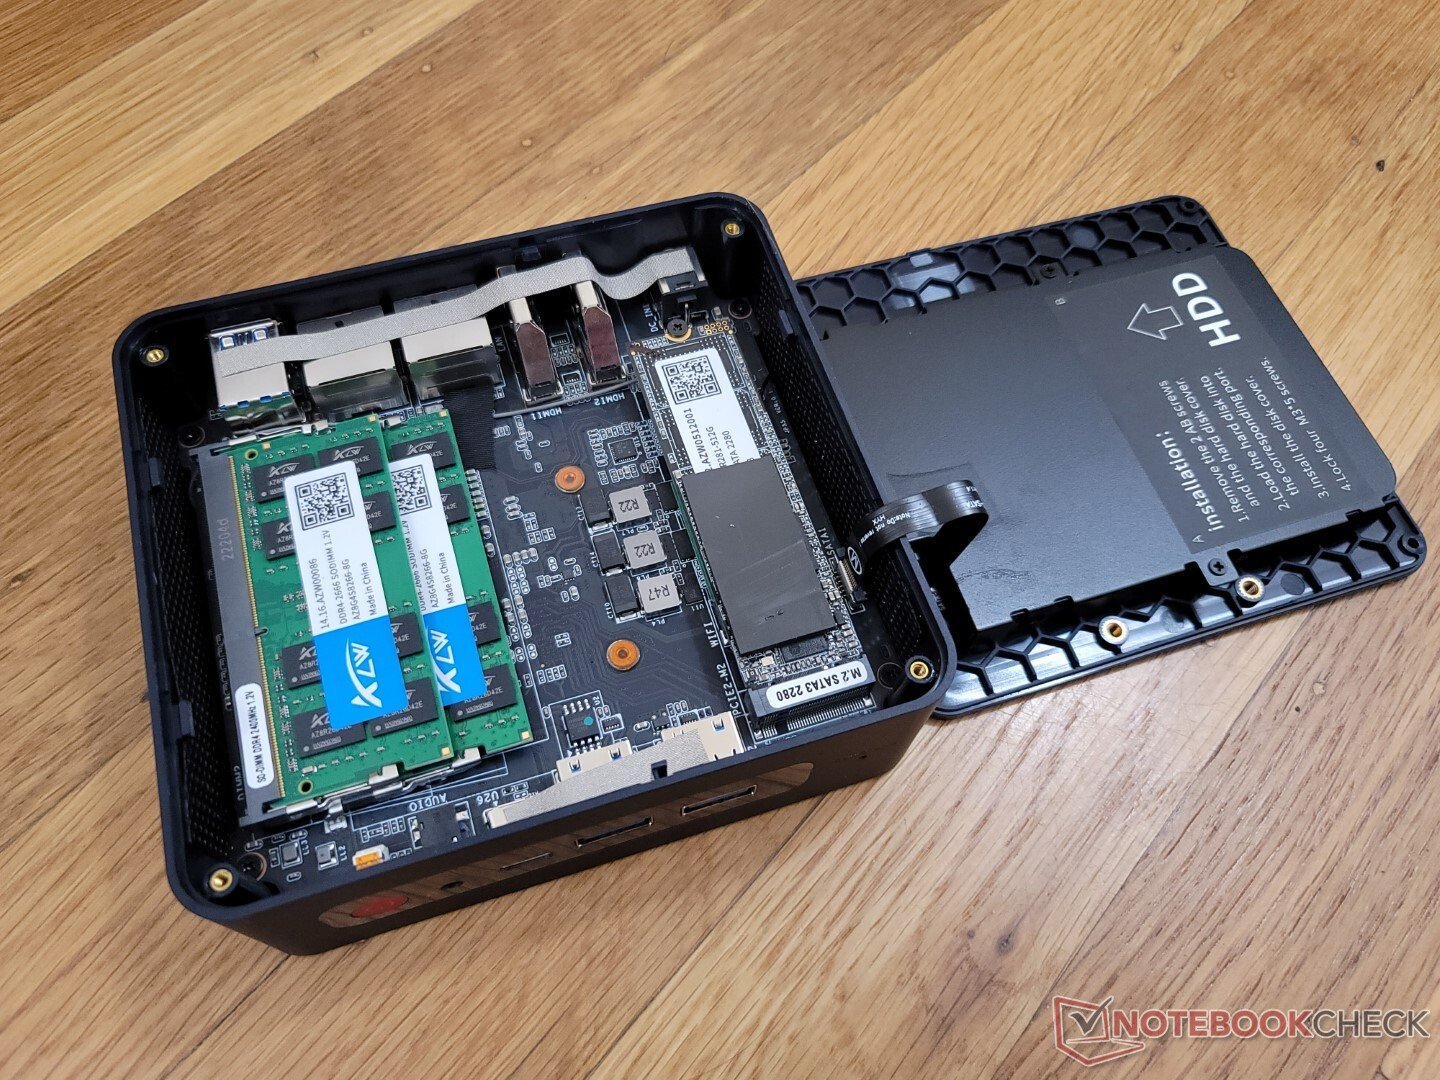
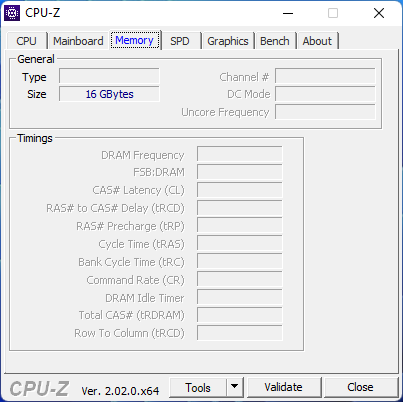
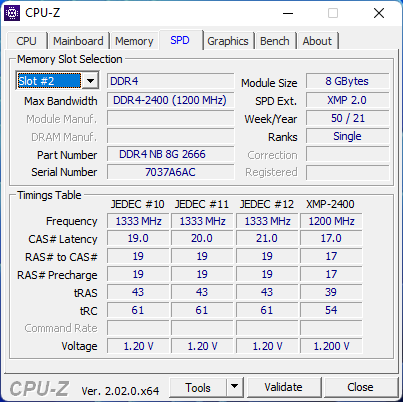
Le panneau inférieur peut être retiré à l'aide d'un simple tournevis Philips pour dévoiler 2 emplacements de stockage (M.2 SATA 2280 + 2,5 pouces SATA III), 2 emplacements SODIMM et le module WLAN M.2 amovible. En comparaison, le U59 Mini-S est limité à une mémoire monocanal avec son unique emplacement SODIMM.
Accessoires et garantie
La boîte contient deux câbles HDMI, un adaptateur secteur, des papiers et un support d'adaptation pour le montage VESA.
La garantie limitée standard d'un an s'applique en cas d'achat aux États-Unis.
Performance
Conditions d'essai
Nous avons réglé notre unité de test en mode Performance via Windows avant d'effectuer les tests ci-dessous. Il n'y a pas de programmes spécifiques au fabricant ou de caractéristiques du BIOS liés aux performances du mini PC.
Processeur
Les performances brutes du CPU sont à peine plus rapides que celles du N5095 tant dans les opérations monofilaires que multifilaires. La différence de performances est si faible que les deux processeurs pourraient tout aussi bien être les mêmes.
Cinebench R15 Multi Loop
Cinebench R23: Multi Core | Single Core
Cinebench R15: CPU Multi 64Bit | CPU Single 64Bit
Blender: v2.79 BMW27 CPU
7-Zip 18.03: 7z b 4 | 7z b 4 -mmt1
Geekbench 5.5: Multi-Core | Single-Core
HWBOT x265 Benchmark v2.2: 4k Preset
LibreOffice : 20 Documents To PDF
R Benchmark 2.5: Overall mean
| Cinebench R20 / CPU (Multi Core) | |
| Beelink SER4 | |
| Intel NUC11TNKi5 | |
| Beelink SER3 | |
| Lenovo IdeaPad 3 15ITL05 81X80074GE | |
| Beelink U59 N5105 | |
| Moyenne Intel Celeron N5105 (n=1) | |
| Teclast TBOLT F15 Pro | |
| Beelink U59 Mini-S | |
| Beelink SEi8 | |
| HP 17-by2437ng | |
| Zotac ZBOX PI336 pico | |
| Cinebench R20 / CPU (Single Core) | |
| Lenovo IdeaPad 3 15ITL05 81X80074GE | |
| Intel NUC11TNKi5 | |
| Beelink SER4 | |
| Teclast TBOLT F15 Pro | |
| HP 17-by2437ng | |
| Beelink SER3 | |
| Beelink SEi8 | |
| Beelink U59 N5105 | |
| Moyenne Intel Celeron N5105 (n=1) | |
| Beelink U59 Mini-S | |
| Zotac ZBOX PI336 pico | |
| Cinebench R23 / Multi Core | |
| Beelink SER4 | |
| Intel NUC11TNKi5 | |
| Beelink SER3 | |
| Lenovo IdeaPad 3 15ITL05 81X80074GE | |
| Beelink U59 N5105 | |
| Moyenne Intel Celeron N5105 (n=1) | |
| Beelink U59 Mini-S | |
| Teclast TBOLT F15 Pro | |
| Beelink SEi8 | |
| Zotac ZBOX PI336 pico | |
| Cinebench R23 / Single Core | |
| Intel NUC11TNKi5 | |
| Lenovo IdeaPad 3 15ITL05 81X80074GE | |
| Beelink SER4 | |
| Teclast TBOLT F15 Pro | |
| Beelink SER3 | |
| Beelink SEi8 | |
| Beelink U59 N5105 | |
| Moyenne Intel Celeron N5105 (n=1) | |
| Beelink U59 Mini-S | |
| Zotac ZBOX PI336 pico | |
| Cinebench R15 / CPU Multi 64Bit | |
| Beelink SER4 | |
| Intel NUC11TNKi5 | |
| Beelink SER3 | |
| Lenovo IdeaPad 3 15ITL05 81X80074GE | |
| Beelink U59 N5105 | |
| Moyenne Intel Celeron N5105 (n=1) | |
| Beelink U59 Mini-S | |
| Teclast TBOLT F15 Pro | |
| Beelink SEi8 | |
| HP 17-by2437ng | |
| Zotac ZBOX PI336 pico | |
| Cinebench R15 / CPU Single 64Bit | |
| Intel NUC11TNKi5 | |
| Beelink SER4 | |
| HP 17-by2437ng | |
| Teclast TBOLT F15 Pro | |
| Beelink SER3 | |
| Lenovo IdeaPad 3 15ITL05 81X80074GE | |
| Beelink SEi8 | |
| Beelink U59 N5105 | |
| Moyenne Intel Celeron N5105 (n=1) | |
| Beelink U59 Mini-S | |
| Zotac ZBOX PI336 pico | |
| Blender / v2.79 BMW27 CPU | |
| Zotac ZBOX PI336 pico | |
| Beelink U59 Mini-S | |
| Beelink U59 N5105 | |
| Moyenne Intel Celeron N5105 (n=1) | |
| Teclast TBOLT F15 Pro | |
| HP 17-by2437ng | |
| Beelink SEi8 | |
| Lenovo IdeaPad 3 15ITL05 81X80074GE | |
| Beelink SER3 | |
| Intel NUC11TNKi5 | |
| Beelink SER4 | |
| 7-Zip 18.03 / 7z b 4 | |
| Beelink SER4 | |
| Intel NUC11TNKi5 | |
| Beelink SER3 | |
| Lenovo IdeaPad 3 15ITL05 81X80074GE | |
| Beelink U59 N5105 | |
| Moyenne Intel Celeron N5105 (n=1) | |
| Beelink U59 Mini-S | |
| HP 17-by2437ng | |
| Teclast TBOLT F15 Pro | |
| Beelink SEi8 | |
| Zotac ZBOX PI336 pico | |
| 7-Zip 18.03 / 7z b 4 -mmt1 | |
| Intel NUC11TNKi5 | |
| Lenovo IdeaPad 3 15ITL05 81X80074GE | |
| Beelink SER4 | |
| HP 17-by2437ng | |
| Teclast TBOLT F15 Pro | |
| Beelink SER3 | |
| Beelink SEi8 | |
| Beelink U59 Mini-S | |
| Beelink U59 N5105 | |
| Moyenne Intel Celeron N5105 (n=1) | |
| Zotac ZBOX PI336 pico | |
| Geekbench 5.5 / Multi-Core | |
| Beelink SER4 | |
| Intel NUC11TNKi5 | |
| Lenovo IdeaPad 3 15ITL05 81X80074GE | |
| Teclast TBOLT F15 Pro | |
| Beelink U59 N5105 | |
| Moyenne Intel Celeron N5105 (n=1) | |
| HP 17-by2437ng | |
| Beelink U59 Mini-S | |
| Beelink SEi8 | |
| Zotac ZBOX PI336 pico | |
| Geekbench 5.5 / Single-Core | |
| Intel NUC11TNKi5 | |
| Lenovo IdeaPad 3 15ITL05 81X80074GE | |
| Beelink SER4 | |
| Teclast TBOLT F15 Pro | |
| HP 17-by2437ng | |
| Beelink SEi8 | |
| Beelink U59 N5105 | |
| Moyenne Intel Celeron N5105 (n=1) | |
| Beelink U59 Mini-S | |
| Zotac ZBOX PI336 pico | |
| HWBOT x265 Benchmark v2.2 / 4k Preset | |
| Beelink SER4 | |
| Intel NUC11TNKi5 | |
| Beelink SER3 | |
| Lenovo IdeaPad 3 15ITL05 81X80074GE | |
| Beelink SEi8 | |
| HP 17-by2437ng | |
| Teclast TBOLT F15 Pro | |
| Beelink U59 N5105 | |
| Moyenne Intel Celeron N5105 (n=1) | |
| Beelink U59 Mini-S | |
| Zotac ZBOX PI336 pico | |
| LibreOffice / 20 Documents To PDF | |
| Zotac ZBOX PI336 pico | |
| Beelink U59 Mini-S | |
| Beelink U59 N5105 | |
| Moyenne Intel Celeron N5105 (n=1) | |
| Beelink SER3 | |
| Teclast TBOLT F15 Pro | |
| Beelink SEi8 | |
| HP 17-by2437ng | |
| Beelink SER4 | |
| Intel NUC11TNKi5 | |
| Lenovo IdeaPad 3 15ITL05 81X80074GE | |
| R Benchmark 2.5 / Overall mean | |
| Zotac ZBOX PI336 pico | |
| Beelink U59 Mini-S | |
| Beelink U59 N5105 | |
| Moyenne Intel Celeron N5105 (n=1) | |
| Beelink SEi8 | |
| Teclast TBOLT F15 Pro | |
| HP 17-by2437ng | |
| Beelink SER3 | |
| Lenovo IdeaPad 3 15ITL05 81X80074GE | |
| Intel NUC11TNKi5 | |
| Beelink SER4 | |
* ... Moindre est la valeur, meilleures sont les performances
AIDA64: FP32 Ray-Trace | FPU Julia | CPU SHA3 | CPU Queen | FPU SinJulia | FPU Mandel | CPU AES | CPU ZLib | FP64 Ray-Trace | CPU PhotoWorxx
| Performance rating | |
| Beelink SER4 | |
| Intel NUC11TNKi5 | |
| Beelink SER3 | |
| Beelink U59 N5105 | |
| Beelink U59 Mini-S | |
| Zotac ZBOX PI336 pico | |
| AIDA64 / FP32 Ray-Trace | |
| Beelink SER4 | |
| Intel NUC11TNKi5 | |
| Beelink SER3 | |
| Beelink U59 Mini-S | |
| Beelink U59 N5105 | |
| Zotac ZBOX PI336 pico | |
| AIDA64 / FPU Julia | |
| Beelink SER4 | |
| Intel NUC11TNKi5 | |
| Beelink SER3 | |
| Beelink U59 N5105 | |
| Beelink U59 Mini-S | |
| Zotac ZBOX PI336 pico | |
| AIDA64 / CPU SHA3 | |
| Intel NUC11TNKi5 | |
| Beelink SER4 | |
| Beelink SER3 | |
| Beelink U59 N5105 | |
| Beelink U59 Mini-S | |
| Zotac ZBOX PI336 pico | |
| AIDA64 / CPU Queen | |
| Beelink SER4 | |
| Intel NUC11TNKi5 | |
| Beelink SER3 | |
| Beelink U59 N5105 | |
| Beelink U59 Mini-S | |
| Zotac ZBOX PI336 pico | |
| AIDA64 / FPU SinJulia | |
| Beelink SER4 | |
| Beelink SER3 | |
| Intel NUC11TNKi5 | |
| Beelink U59 Mini-S | |
| Beelink U59 N5105 | |
| Zotac ZBOX PI336 pico | |
| AIDA64 / FPU Mandel | |
| Beelink SER4 | |
| Intel NUC11TNKi5 | |
| Beelink SER3 | |
| Beelink U59 N5105 | |
| Beelink U59 Mini-S | |
| Zotac ZBOX PI336 pico | |
| AIDA64 / CPU AES | |
| Intel NUC11TNKi5 | |
| Beelink SER4 | |
| Beelink SER3 | |
| Beelink U59 N5105 | |
| Beelink U59 Mini-S | |
| Zotac ZBOX PI336 pico | |
| AIDA64 / CPU ZLib | |
| Beelink SER4 | |
| Intel NUC11TNKi5 | |
| Beelink SER3 | |
| Beelink U59 N5105 | |
| Beelink U59 Mini-S | |
| Zotac ZBOX PI336 pico | |
| AIDA64 / FP64 Ray-Trace | |
| Beelink SER4 | |
| Intel NUC11TNKi5 | |
| Beelink SER3 | |
| Beelink U59 N5105 | |
| Beelink U59 Mini-S | |
| Zotac ZBOX PI336 pico | |
| AIDA64 / CPU PhotoWorxx | |
| Beelink SER4 | |
| Intel NUC11TNKi5 | |
| Beelink U59 N5105 | |
| Beelink SER3 | |
| Beelink U59 Mini-S | |
| Zotac ZBOX PI336 pico | |
Performance du système
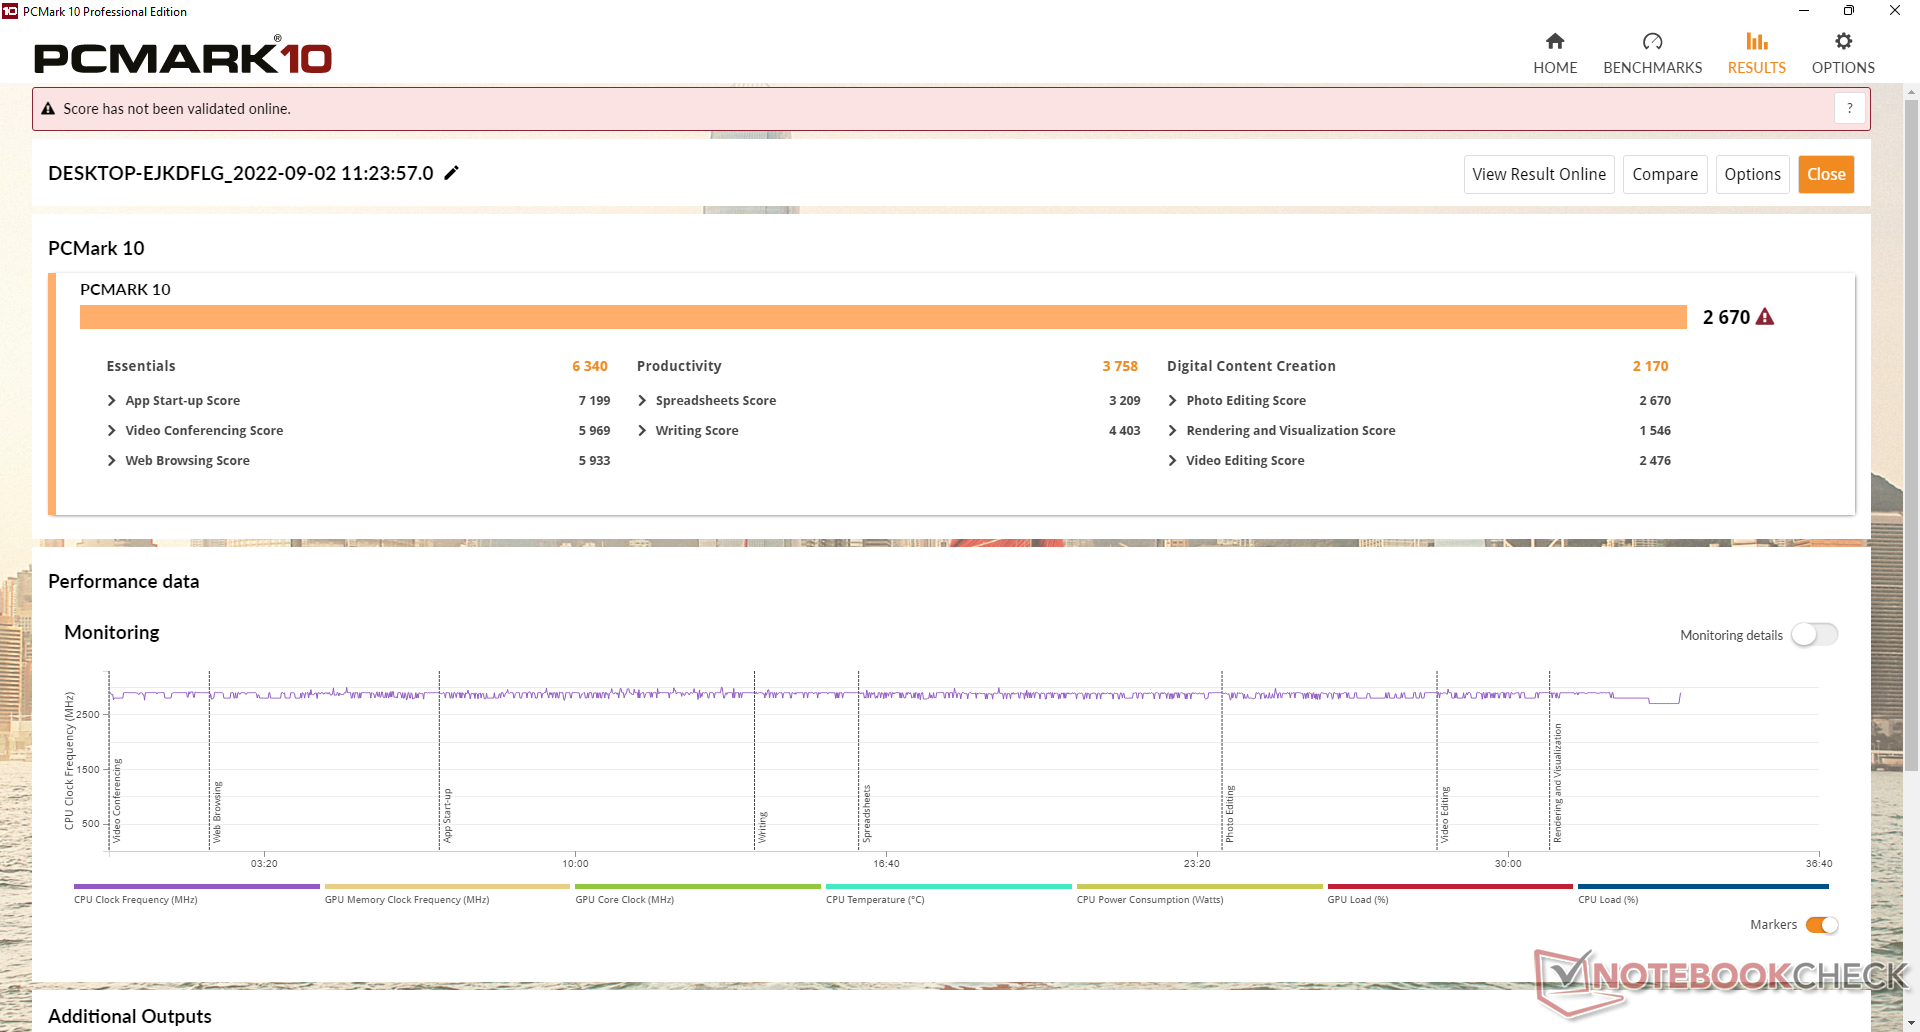
CrossMark: Overall | Productivity | Creativity | Responsiveness
| PCMark 10 / Score | |
| Beelink SER4 | |
| Intel NUC11TNKi5 | |
| Beelink SER3 | |
| Beelink U59 N5105 | |
| Moyenne Intel Celeron N5105, Intel UHD Graphics (Jasper Lake 24 EU) (n=1) | |
| Beelink U59 Mini-S | |
| PCMark 10 / Essentials | |
| Beelink SER4 | |
| Intel NUC11TNKi5 | |
| Beelink SER3 | |
| Beelink U59 N5105 | |
| Moyenne Intel Celeron N5105, Intel UHD Graphics (Jasper Lake 24 EU) (n=1) | |
| Beelink U59 Mini-S | |
| PCMark 10 / Productivity | |
| Beelink SER4 | |
| Intel NUC11TNKi5 | |
| Beelink SER3 | |
| Beelink U59 N5105 | |
| Moyenne Intel Celeron N5105, Intel UHD Graphics (Jasper Lake 24 EU) (n=1) | |
| Beelink U59 Mini-S | |
| PCMark 10 / Digital Content Creation | |
| Beelink SER4 | |
| Intel NUC11TNKi5 | |
| Beelink SER3 | |
| Beelink U59 N5105 | |
| Moyenne Intel Celeron N5105, Intel UHD Graphics (Jasper Lake 24 EU) (n=1) | |
| Beelink U59 Mini-S | |
| CrossMark / Overall | |
| Beelink U59 N5105 | |
| Moyenne Intel Celeron N5105, Intel UHD Graphics (Jasper Lake 24 EU) (n=1) | |
| Beelink U59 Mini-S | |
| CrossMark / Productivity | |
| Beelink U59 N5105 | |
| Moyenne Intel Celeron N5105, Intel UHD Graphics (Jasper Lake 24 EU) (n=1) | |
| Beelink U59 Mini-S | |
| CrossMark / Creativity | |
| Beelink U59 N5105 | |
| Moyenne Intel Celeron N5105, Intel UHD Graphics (Jasper Lake 24 EU) (n=1) | |
| Beelink U59 Mini-S | |
| CrossMark / Responsiveness | |
| Beelink U59 N5105 | |
| Moyenne Intel Celeron N5105, Intel UHD Graphics (Jasper Lake 24 EU) (n=1) | |
| Beelink U59 Mini-S | |
| PCMark 10 Score | 2670 points | |
Aide | ||
| AIDA64 / Memory Copy | |
| Beelink SER4 | |
| Beelink U59 N5105 | |
| Intel NUC11TNKi5 | |
| Beelink U59 Mini-S | |
| Beelink SER3 | |
| Zotac ZBOX PI336 pico | |
| AIDA64 / Memory Read | |
| Beelink SER4 | |
| Intel NUC11TNKi5 | |
| Beelink SER3 | |
| Beelink U59 N5105 | |
| Beelink U59 Mini-S | |
| Zotac ZBOX PI336 pico | |
| AIDA64 / Memory Write | |
| Beelink SER4 | |
| Beelink U59 N5105 | |
| Intel NUC11TNKi5 | |
| Beelink U59 Mini-S | |
| Beelink SER3 | |
| Zotac ZBOX PI336 pico | |
| AIDA64 / Memory Latency | |
| Beelink SER3 | |
| Beelink SER4 | |
| Intel NUC11TNKi5 | |
| Zotac ZBOX PI336 pico | |
| Beelink U59 N5105 | |
| Beelink U59 Mini-S | |
* ... Moindre est la valeur, meilleures sont les performances
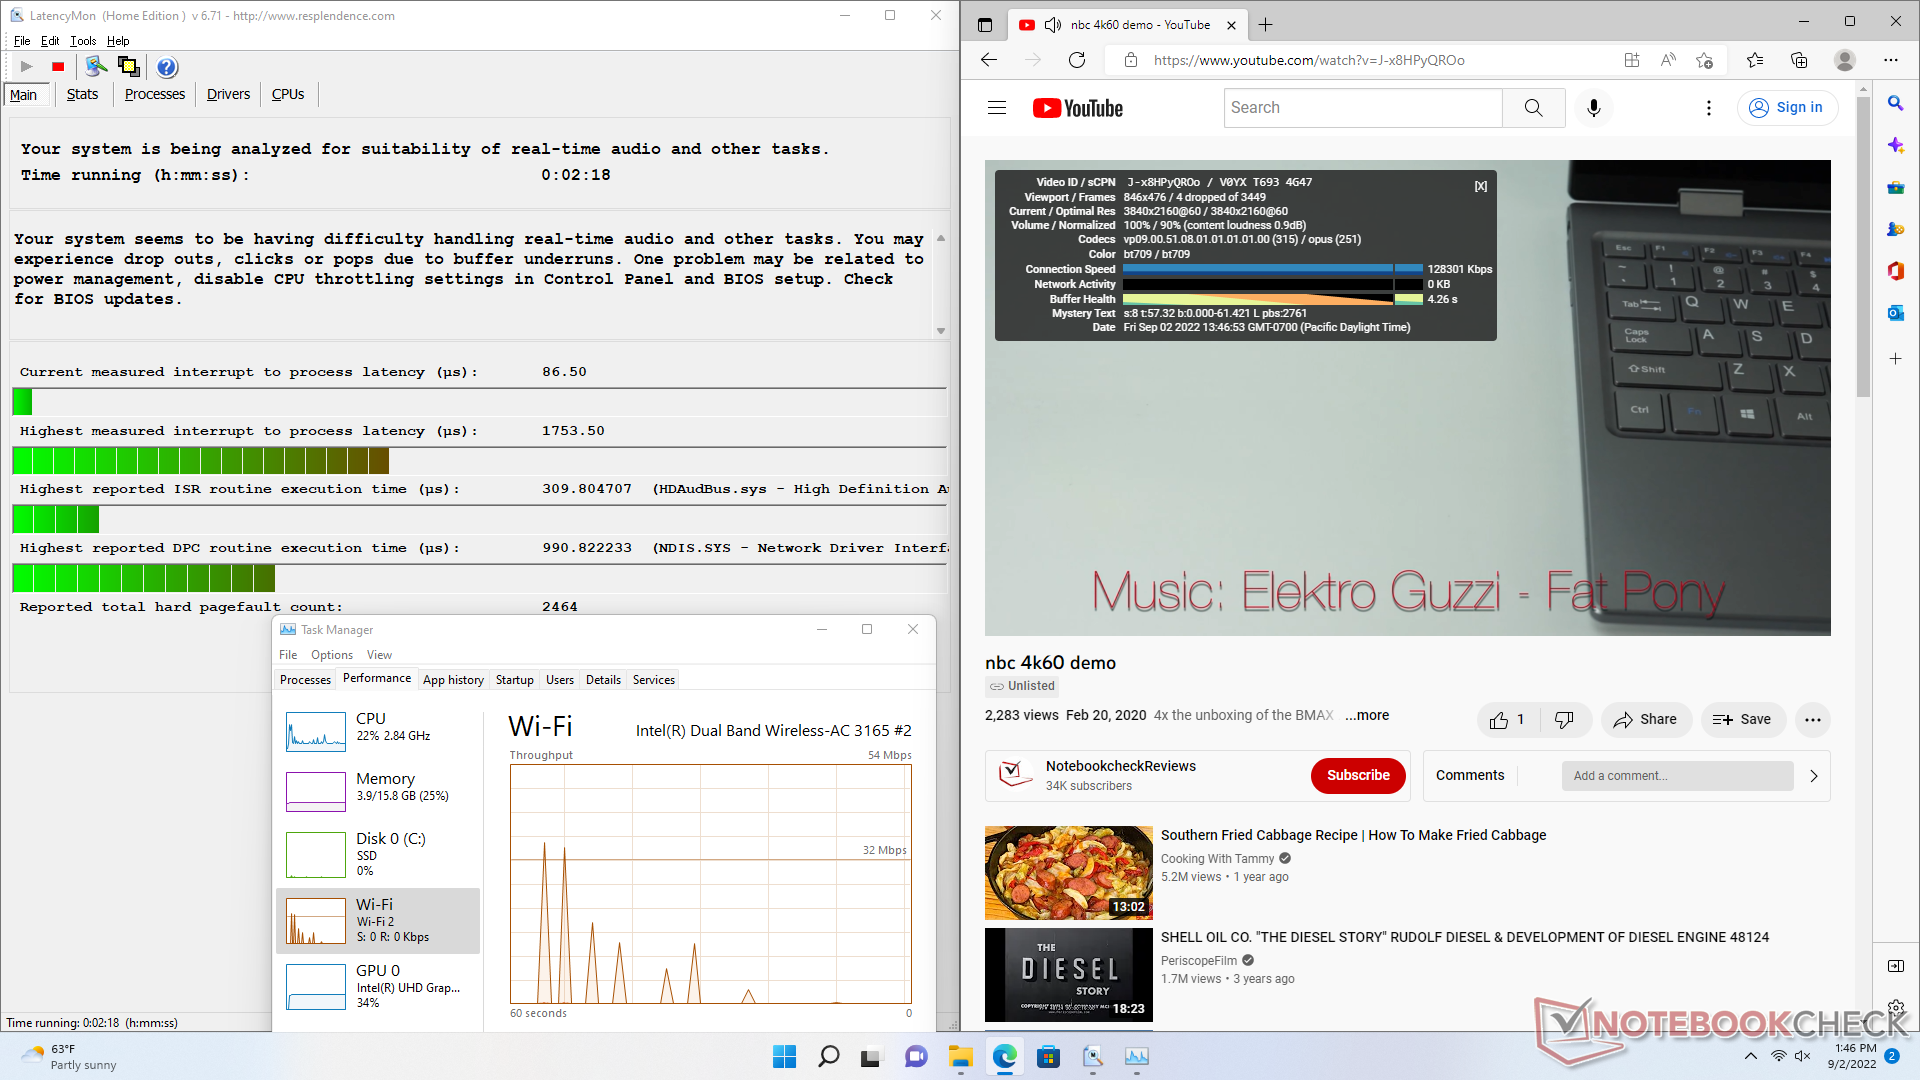
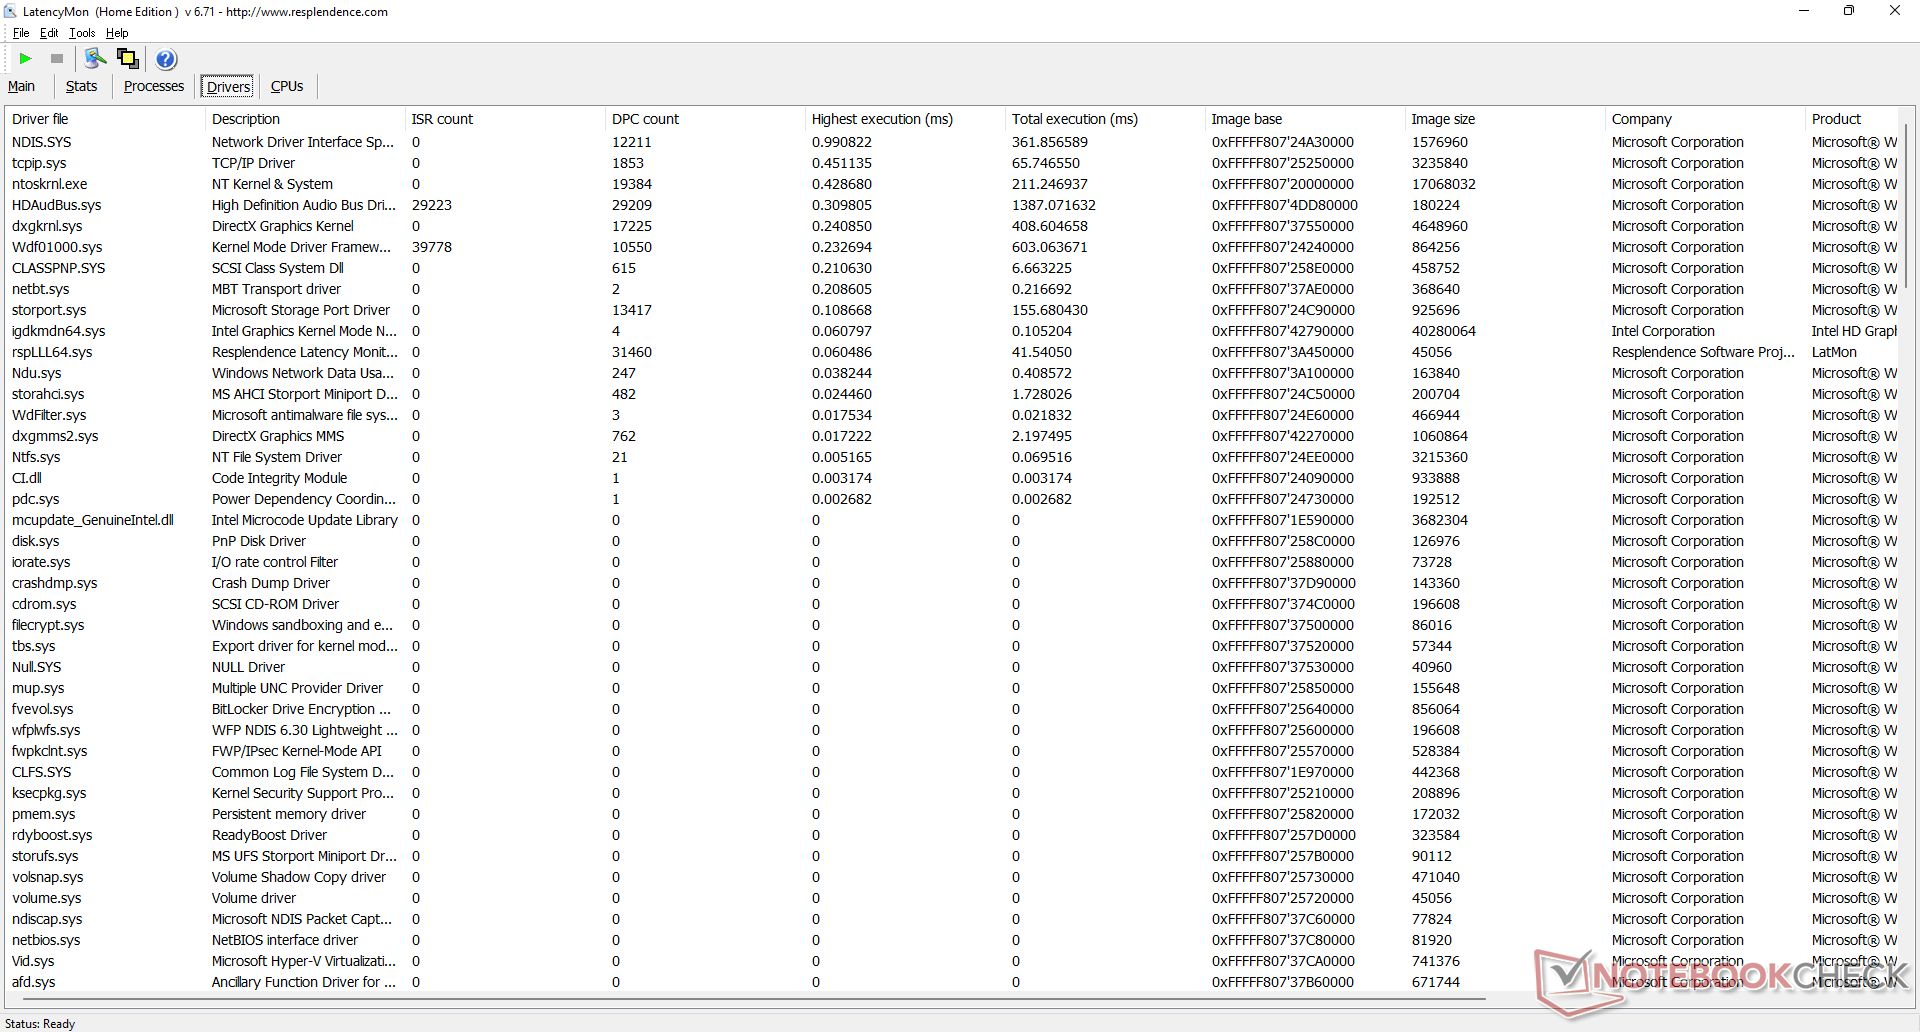
Latence DPC
LatencyMon révèle des problèmes de CPD lors de l'ouverture de plusieurs onglets de navigateur de notre page d'accueil. la lecture de vidéos 4K à 60 FPS est presque parfaite avec seulement 4 images perdues pendant notre vidéo de test d'une minute.
| DPC Latencies / LatencyMon - interrupt to process latency (max), Web, Youtube, Prime95 | |
| Beelink U59 N5105 | |
| Beelink U59 Mini-S | |
| Zotac ZBOX PI336 pico | |
| Beelink SER3 | |
| Intel NUC11TNKi5 | |
| Beelink SER4 | |
* ... Moindre est la valeur, meilleures sont les performances
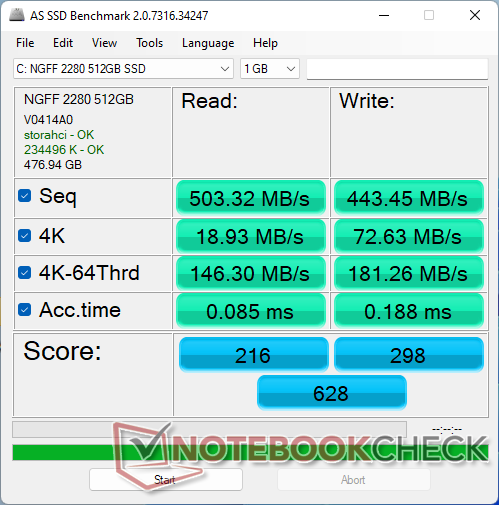
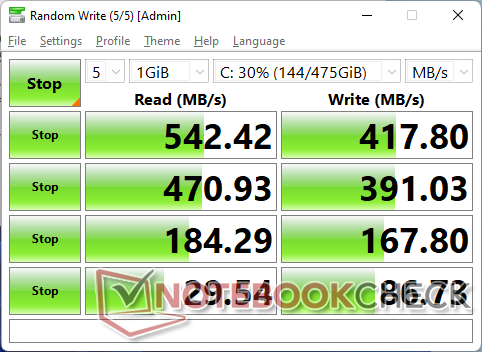
Périphériques de stockage
Le modèle est livré avec un disque M.2 SATA III au lieu d'un disque NVMe, probablement pour réduire les coûts. Compte tenu du processeur, cependant, un disque SATA III est acceptable. Le siteSilicon Motion AZW de Silicon Motion dans notre unité de test a permis d'obtenir des taux de lecture et d'écriture séquentielles supérieurs à 400 Mo/s chacun
Un petit coussin thermique pour le SSD est inclus, ce qui est surprenant de voir sur un mini PC économique comme le U59. Le tampon se trouve entre le SSD et le boîtier métallique SATA III de 2,5 pouces qui est fixé au panneau inférieur supérieur.

| Drive Performance rating - Percent | |
| Beelink SER3 | |
| Beelink SER4 | |
| Intel NUC11TNKi5 | |
| Beelink U59 N5105 | |
| Beelink U59 Mini-S | |
| Zotac ZBOX PI336 pico | |
* ... Moindre est la valeur, meilleures sont les performances
Disk Throttling: DiskSpd Read Loop, Queue Depth 8
Performances du GPU
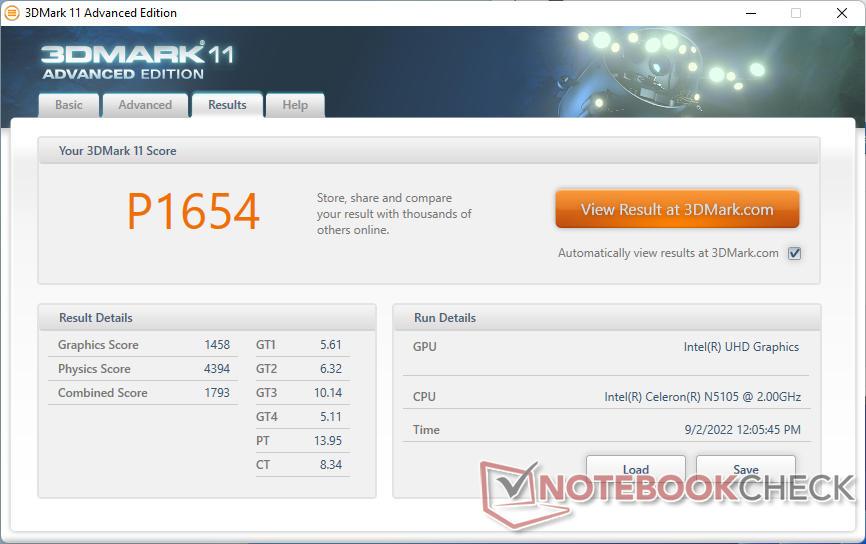
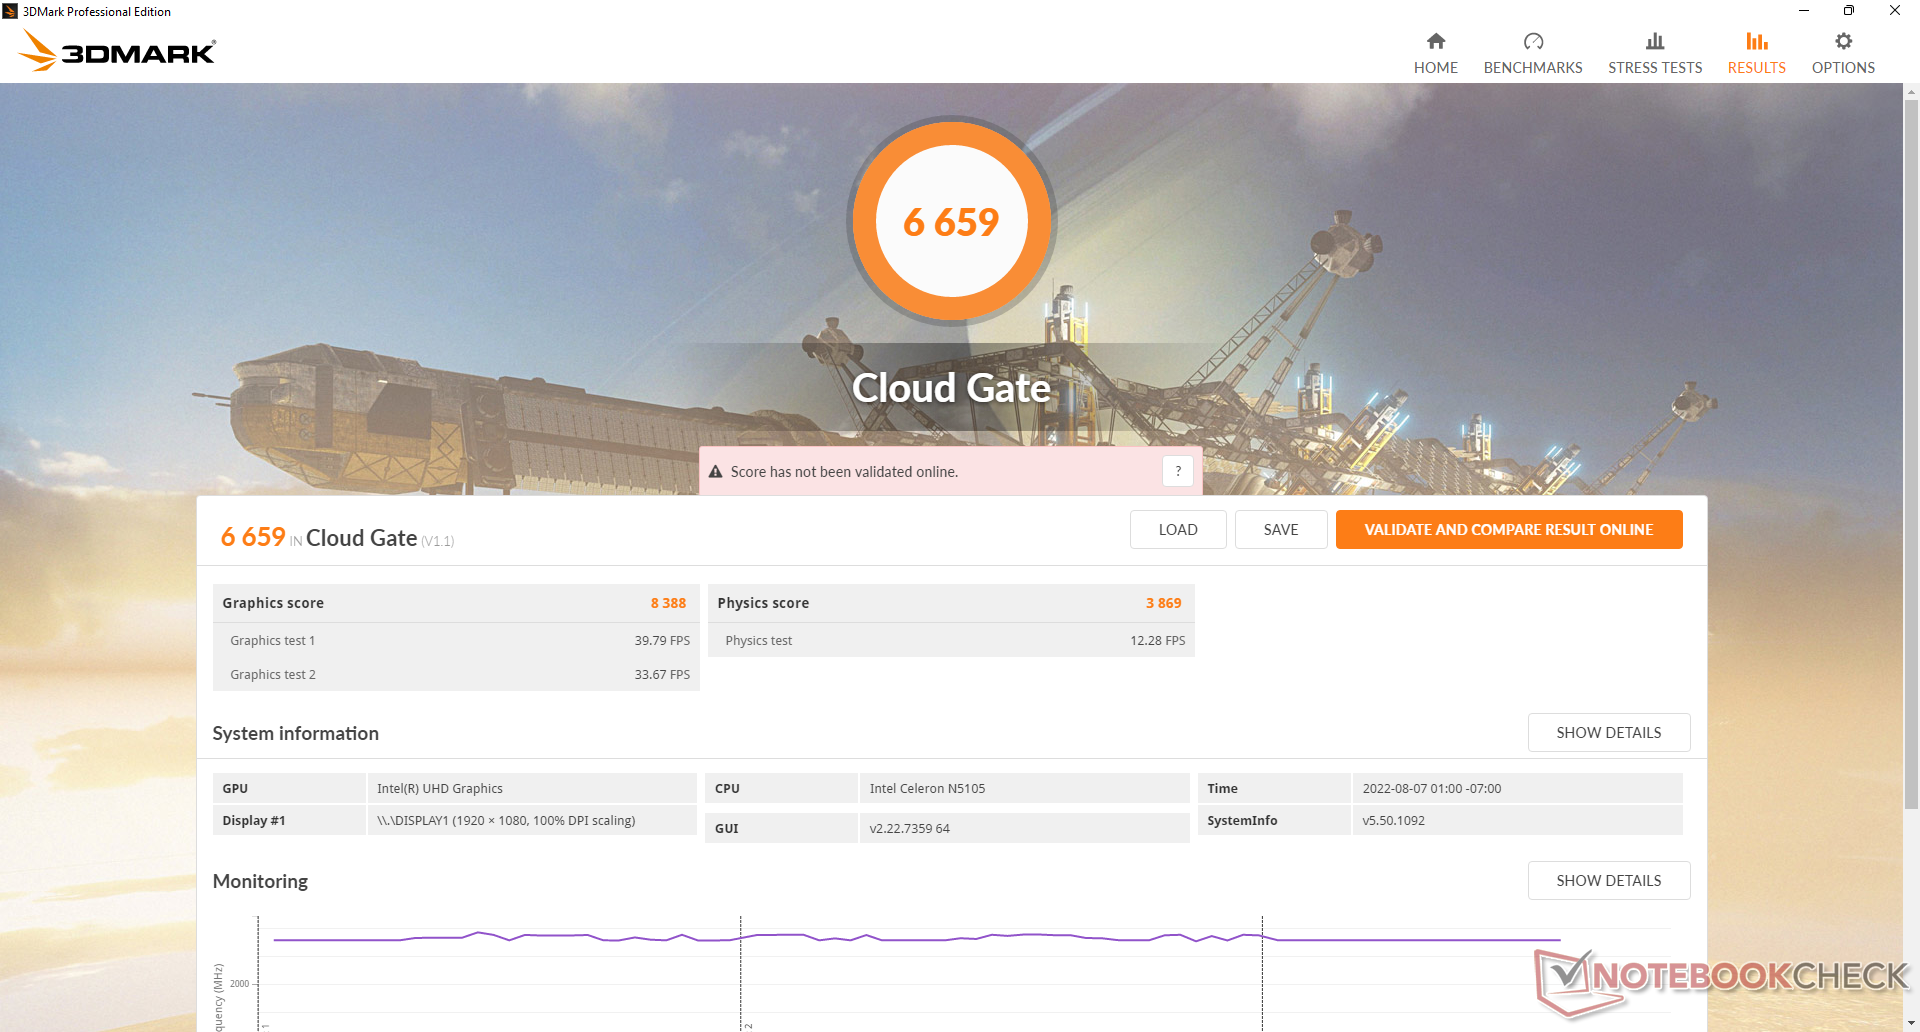
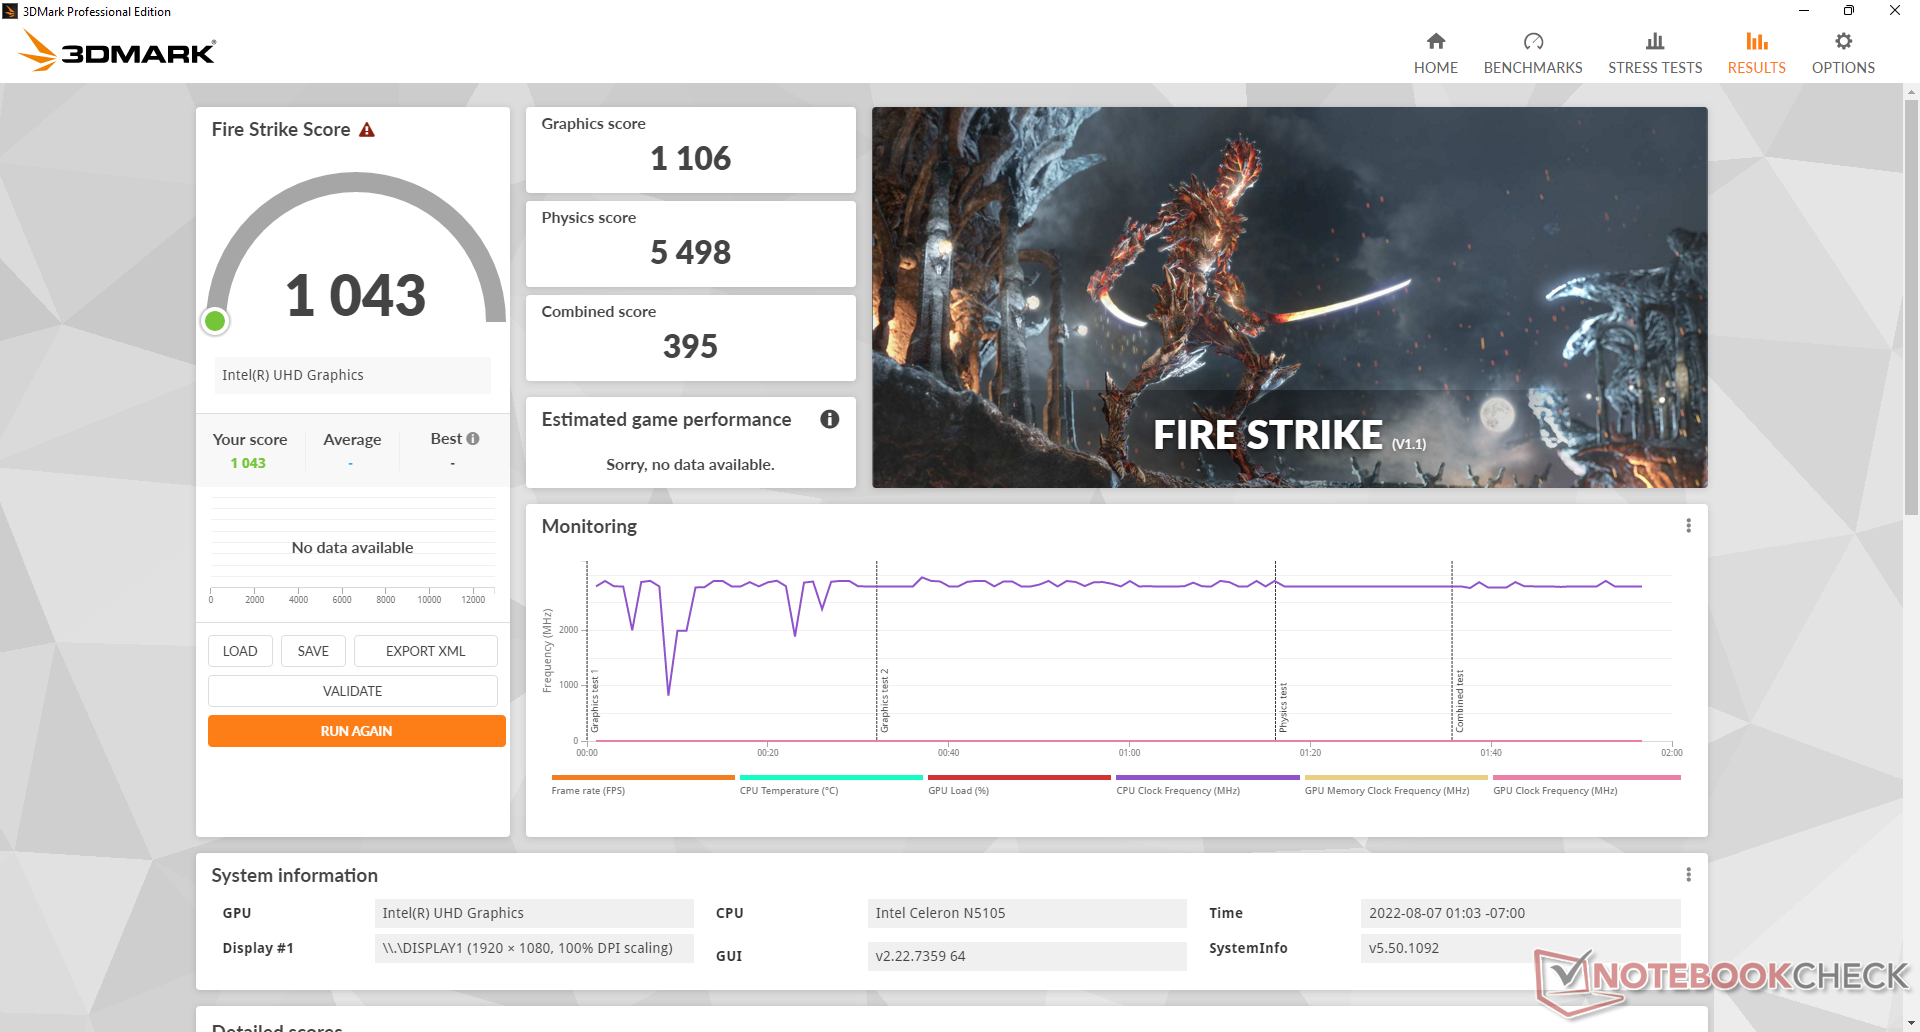
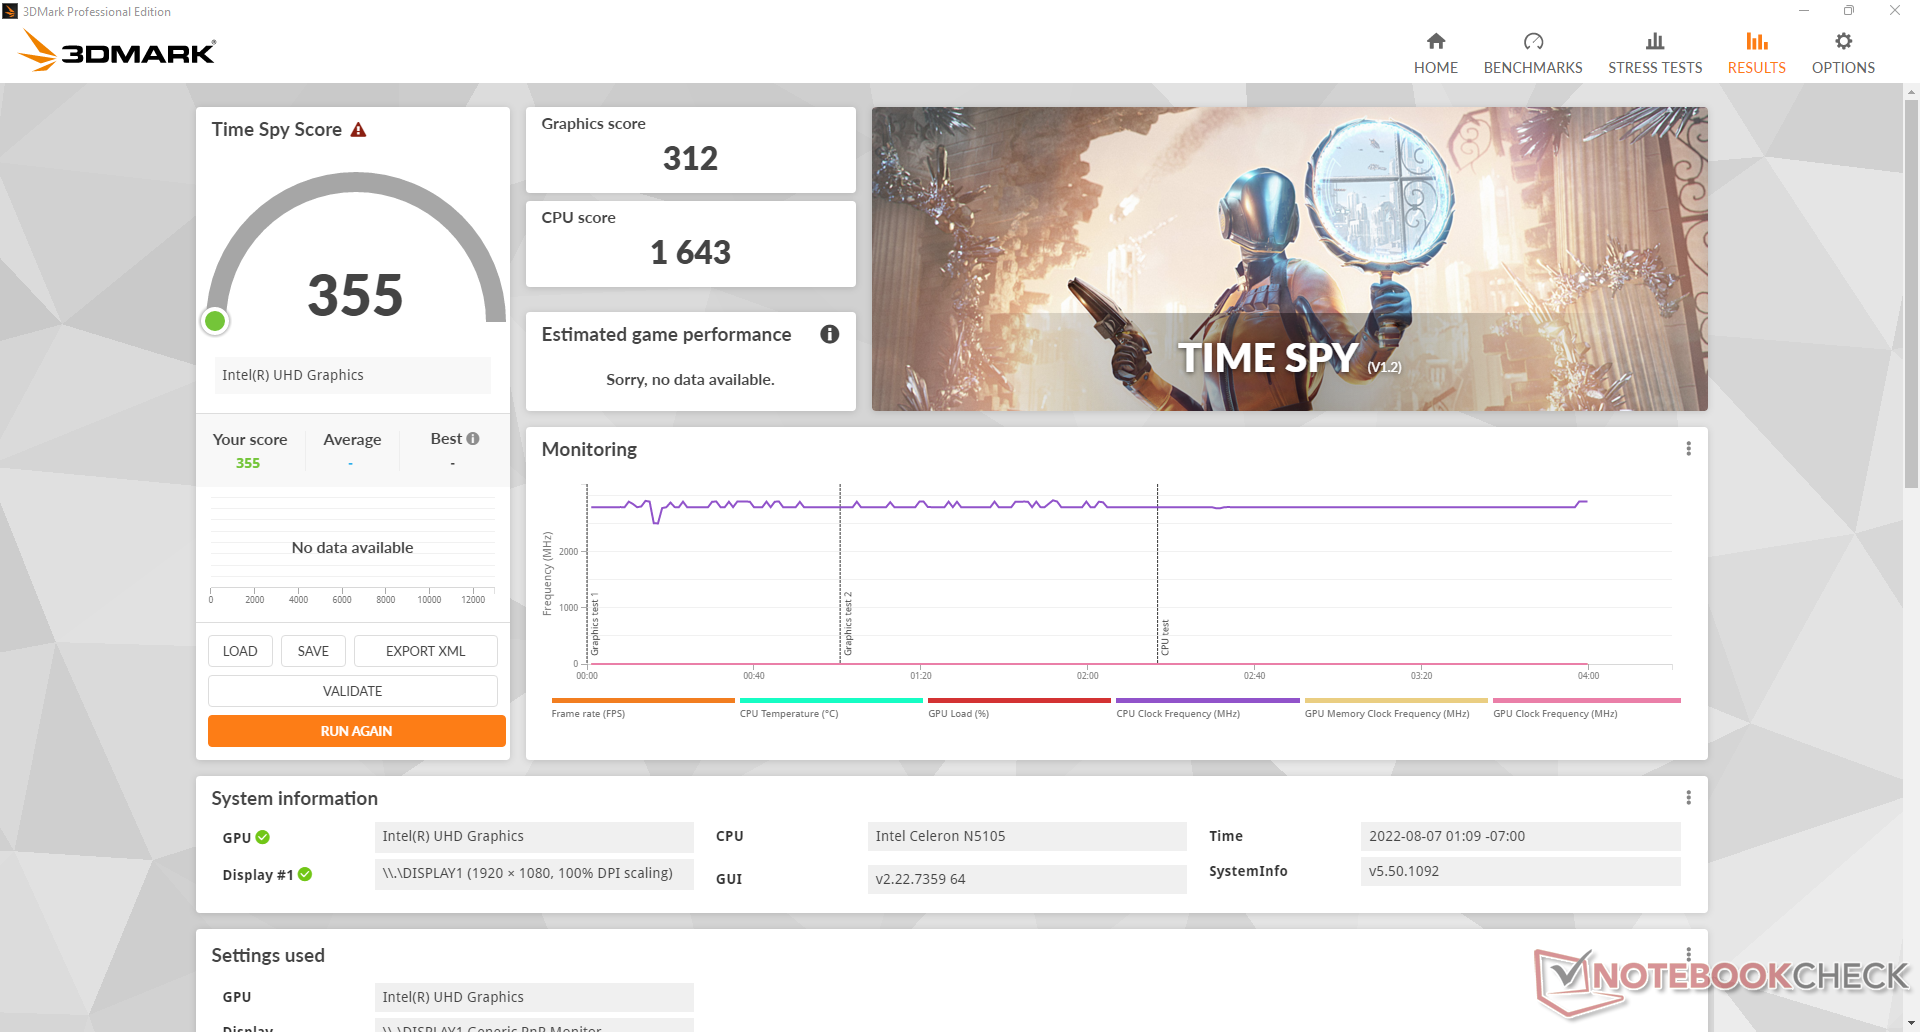
Le GPU intégré est mis à niveau par rapport au Jasper Lake 16 UE sur le Celeron N5095 de l'année dernière, à celui de Jasper Lake 24 EUs sur le U59 N5105 de cette année. les résultats 3DMark sont 80 % plus rapides sur le nouveau GPU par rapport au U59 de l'année dernière, ce qui représente une augmentation significative d'une année sur l'autre. Cependant, il est important de noter que notre U59 N5095 était livré avec 8 Go de RAM monocanal, contre 16 Go de RAM bicanal dans notre U59 N5105. La RAM double canal représente à elle seule 30 à 50 % de cette différence de performances. Néanmoins, il s'agit toujours de l'une des solutions de GPU intégré les plus lentes du marché et elle est donc inadaptée à la plupart des jeux, nouveaux ou anciens.
| 3DMark | |
| 1920x1080 Fire Strike Graphics | |
| Beelink SER4 | |
| Intel NUC11TNKi5 | |
| Lenovo IdeaPad 3 15ITL05 81X80074GE | |
| Beelink SER3 | |
| Beelink SEi8 | |
| Teclast TBOLT F15 Pro | |
| Beelink U59 N5105 | |
| Moyenne Intel UHD Graphics (Jasper Lake 24 EU) (n=1) | |
| HP 17-by2437ng | |
| Beelink U59 Mini-S | |
| Zotac ZBOX PI336 pico | |
| 2560x1440 Time Spy Graphics | |
| Beelink SER4 | |
| Intel NUC11TNKi5 | |
| Lenovo IdeaPad 3 15ITL05 81X80074GE | |
| Beelink SER3 | |
| Beelink SEi8 | |
| Teclast TBOLT F15 Pro | |
| HP 17-by2437ng | |
| Beelink U59 N5105 | |
| Moyenne Intel UHD Graphics (Jasper Lake 24 EU) (n=1) | |
| Beelink U59 Mini-S | |
| 2560x1440 Time Spy Score | |
| Beelink SER4 | |
| Intel NUC11TNKi5 | |
| Lenovo IdeaPad 3 15ITL05 81X80074GE | |
| Beelink SER3 | |
| Beelink SEi8 | |
| Teclast TBOLT F15 Pro | |
| HP 17-by2437ng | |
| Beelink U59 N5105 | |
| Moyenne Intel UHD Graphics (Jasper Lake 24 EU) (n=1) | |
| Beelink U59 Mini-S | |
| 3DMark 11 - 1280x720 Performance GPU | |
| Beelink SER4 | |
| Intel NUC11TNKi5 | |
| Lenovo IdeaPad 3 15ITL05 81X80074GE | |
| Beelink SER3 | |
| Beelink SEi8 | |
| Teclast TBOLT F15 Pro | |
| HP 17-by2437ng | |
| Beelink U59 N5105 | |
| Moyenne Intel UHD Graphics (Jasper Lake 24 EU) (n=1) | |
| Beelink U59 Mini-S | |
| Zotac ZBOX PI336 pico | |
| 3DMark 11 Performance | 1654 points | |
| 3DMark Cloud Gate Standard Score | 6659 points | |
| 3DMark Fire Strike Score | 1043 points | |
| 3DMark Time Spy Score | 355 points | |
Aide | ||
| The Witcher 3 | |
| 1024x768 Low Graphics & Postprocessing | |
| Beelink SER4 | |
| Intel NUC11TNKi5 | |
| Lenovo IdeaPad 3 15ITL05 81X80074GE | |
| Beelink SER3 | |
| Teclast TBOLT F15 Pro | |
| Beelink U59 N5105 | |
| Moyenne Intel UHD Graphics (Jasper Lake 24 EU) (n=1) | |
| 1366x768 Medium Graphics & Postprocessing | |
| Beelink SER4 | |
| Lenovo IdeaPad 3 15ITL05 81X80074GE | |
| Beelink SER3 | |
| Teclast TBOLT F15 Pro | |
| Beelink U59 N5105 | |
| Moyenne Intel UHD Graphics (Jasper Lake 24 EU) (n=1) | |
| 1920x1080 High Graphics & Postprocessing (Nvidia HairWorks Off) | |
| Beelink SER4 | |
| Lenovo IdeaPad 3 15ITL05 81X80074GE | |
| Beelink SER3 | |
| Teclast TBOLT F15 Pro | |
| Beelink U59 N5105 | |
| Moyenne Intel UHD Graphics (Jasper Lake 24 EU) (n=1) | |
| 1920x1080 Ultra Graphics & Postprocessing (HBAO+) | |
| Beelink SER4 | |
| Lenovo IdeaPad 3 15ITL05 81X80074GE | |
| Beelink SER3 | |
| Beelink U59 N5105 | |
| Moyenne Intel UHD Graphics (Jasper Lake 24 EU) (n=1) | |
| X-Plane 11.11 | |
| 1280x720 low (fps_test=1) | |
| Beelink SER4 | |
| Lenovo IdeaPad 3 15ITL05 81X80074GE | |
| Intel NUC11TNKi5 | |
| Teclast TBOLT F15 Pro | |
| Beelink SER3 | |
| Beelink SEi8 | |
| Beelink U59 N5105 | |
| Moyenne Intel UHD Graphics (Jasper Lake 24 EU) (n=1) | |
| Beelink U59 Mini-S | |
| Zotac ZBOX PI336 pico | |
| 1920x1080 med (fps_test=2) | |
| Beelink SER4 | |
| Intel NUC11TNKi5 | |
| Lenovo IdeaPad 3 15ITL05 81X80074GE | |
| Beelink SER3 | |
| Beelink SEi8 | |
| Teclast TBOLT F15 Pro | |
| Beelink U59 N5105 | |
| Moyenne Intel UHD Graphics (Jasper Lake 24 EU) (n=1) | |
| Beelink U59 Mini-S | |
| Zotac ZBOX PI336 pico | |
| 1920x1080 high (fps_test=3) | |
| Beelink SER4 | |
| Intel NUC11TNKi5 | |
| Lenovo IdeaPad 3 15ITL05 81X80074GE | |
| Beelink SER3 | |
| Teclast TBOLT F15 Pro | |
| Beelink SEi8 | |
| Beelink U59 N5105 | |
| Moyenne Intel UHD Graphics (Jasper Lake 24 EU) (n=1) | |
| Beelink U59 Mini-S | |
| Zotac ZBOX PI336 pico | |
| Final Fantasy XV Benchmark - 1280x720 Lite Quality | |
| Beelink SER4 | |
| Intel NUC11TNKi5 | |
| Lenovo IdeaPad 3 15ITL05 81X80074GE | |
| Beelink SER3 | |
| Beelink SEi8 | |
| Teclast TBOLT F15 Pro | |
| Beelink U59 N5105 | |
| Moyenne Intel UHD Graphics (Jasper Lake 24 EU) (n=1) | |
| Beelink U59 Mini-S | |
| Zotac ZBOX PI336 pico | |
| Dota 2 Reborn | |
| 1280x720 min (0/3) fastest | |
| Beelink SER4 | |
| Beelink SEi8 | |
| Lenovo IdeaPad 3 15ITL05 81X80074GE | |
| Teclast TBOLT F15 Pro | |
| Intel NUC11TNKi5 | |
| Beelink U59 N5105 | |
| Moyenne Intel UHD Graphics (Jasper Lake 24 EU) (n=1) | |
| Beelink SER3 | |
| Beelink U59 Mini-S | |
| Zotac ZBOX PI336 pico | |
| 1366x768 med (1/3) | |
| Beelink SER4 | |
| Intel NUC11TNKi5 | |
| Beelink SER3 | |
| Lenovo IdeaPad 3 15ITL05 81X80074GE | |
| Beelink SEi8 | |
| Teclast TBOLT F15 Pro | |
| Beelink U59 N5105 | |
| Moyenne Intel UHD Graphics (Jasper Lake 24 EU) (n=1) | |
| Beelink U59 Mini-S | |
| Zotac ZBOX PI336 pico | |
| 1920x1080 high (2/3) | |
| Beelink SER4 | |
| Intel NUC11TNKi5 | |
| Beelink SER3 | |
| Lenovo IdeaPad 3 15ITL05 81X80074GE | |
| Beelink SEi8 | |
| Teclast TBOLT F15 Pro | |
| Beelink U59 N5105 | |
| Moyenne Intel UHD Graphics (Jasper Lake 24 EU) (n=1) | |
| Beelink U59 Mini-S | |
| Zotac ZBOX PI336 pico | |
| 1920x1080 ultra (3/3) best looking | |
| Beelink SER4 | |
| Intel NUC11TNKi5 | |
| Beelink SER3 | |
| Lenovo IdeaPad 3 15ITL05 81X80074GE | |
| Beelink SEi8 | |
| Teclast TBOLT F15 Pro | |
| Beelink U59 N5105 | |
| Moyenne Intel UHD Graphics (Jasper Lake 24 EU) (n=1) | |
| Beelink U59 Mini-S | |
| Zotac ZBOX PI336 pico | |
| Bas | Moyen | Élevé | Ultra | |
|---|---|---|---|---|
| The Witcher 3 (2015) | 21.6 | 14.4 | 7.8 | 3.9 |
| Dota 2 Reborn (2015) | 73.8 | 24.1 | 16.8 | 15.5 |
| Final Fantasy XV Benchmark (2018) | 13.7 | |||
| X-Plane 11.11 (2018) | 20.8 | 13.3 | 12.3 |
Émissions
Bruit du système
Le bruit du ventilateur est silencieux, quelle que soit la charge, même lorsqu'il est réglé sur le mode Performance. Nous n'avons pu enregistrer qu'un maximum d'un peu moins de 27 dB(A) sur un fond silencieux de 21,5 dB(A), contre 34 dB(A) sur le U59 de l'année dernière. C'est l'un des mini PC les plus silencieux sans opter pour des modèles sans ventilateur comme le Zotac ZBOX PI336.
Notre unité de test présentait des bruits électroniques mineurs ou un ronflement de la bobine, ce qui contribue à expliquer notre bruit au ralenti de 22,1 dB(A).
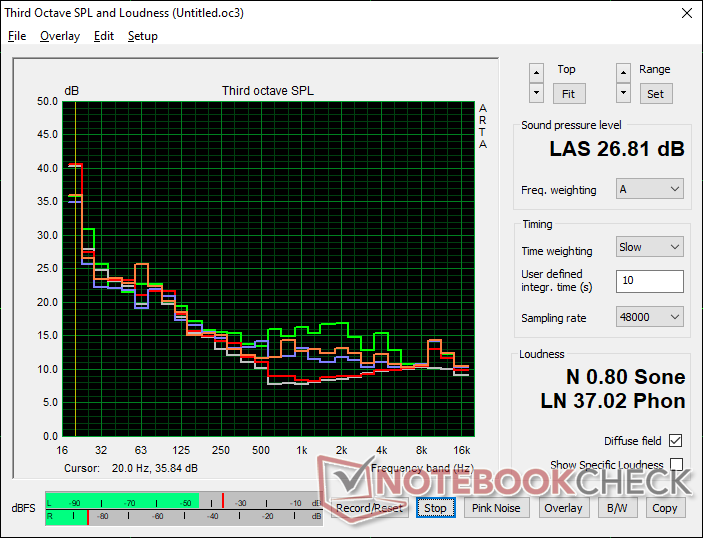
Degré de la nuisance sonore
| Au repos |
| 22.1 / 22.1 / 22.1 dB(A) |
| Fortement sollicité |
| 23.9 / 26.8 dB(A) |
 | ||
30 dB silencieux 40 dB(A) audible 50 dB(A) bruyant |
||
min: | ||
| Beelink U59 N5105 UHD Graphics (Jasper Lake 24 EU), Celeron N5105, Silicon Motion AZW 512G NV428 | Beelink U59 Mini-S UHD Graphics (Jasper Lake 16 EU), Celeron N5095, Silicon Motion AZW 256G M.228 220426 C SATA 3 | Beelink SER4 Vega 8, R7 4800U, Intel SSD 660p SSDPEKNW512G8 | Beelink SER3 Vega 10, R7 3750H, GSemi AZW GSDFN512TS3F1OGCX | Intel NUC11TNKi5 Iris Xe G7 80EUs, i5-1135G7, Transcend M.2 SSD 430S TS512GMTS430S | Zotac ZBOX PI336 pico UHD Graphics (Elkhart Lake 16 EU), Celeron N6211, SanDisk DF4128 | |
|---|---|---|---|---|---|---|
| Noise | -12% | -48% | -31% | -55% | ||
| arrêt / environnement * (dB) | 21.5 | 23.3 -8% | 23.4 -9% | 23.4 -9% | 24.8 -15% | |
| Idle Minimum * (dB) | 22.1 | 24.2 -10% | 33.2 -50% | 23.4 -6% | 35.6 -61% | |
| Idle Average * (dB) | 22.1 | 24.2 -10% | 33.2 -50% | 23.4 -6% | 35.6 -61% | |
| Idle Maximum * (dB) | 22.1 | 24.2 -10% | 33.2 -50% | 29.4 -33% | 35.6 -61% | |
| Load Average * (dB) | 23.9 | 25.1 -5% | 38.6 -62% | 35.2 -47% | 36.2 -51% | |
| Witcher 3 ultra * (dB) | 24.4 | 39.2 -61% | 37.2 -52% | 38 -56% | ||
| Load Maximum * (dB) | 26.8 | 33.9 -26% | 40.8 -52% | 43.3 -62% | 47.6 -78% |
* ... Moindre est la valeur, meilleures sont les performances
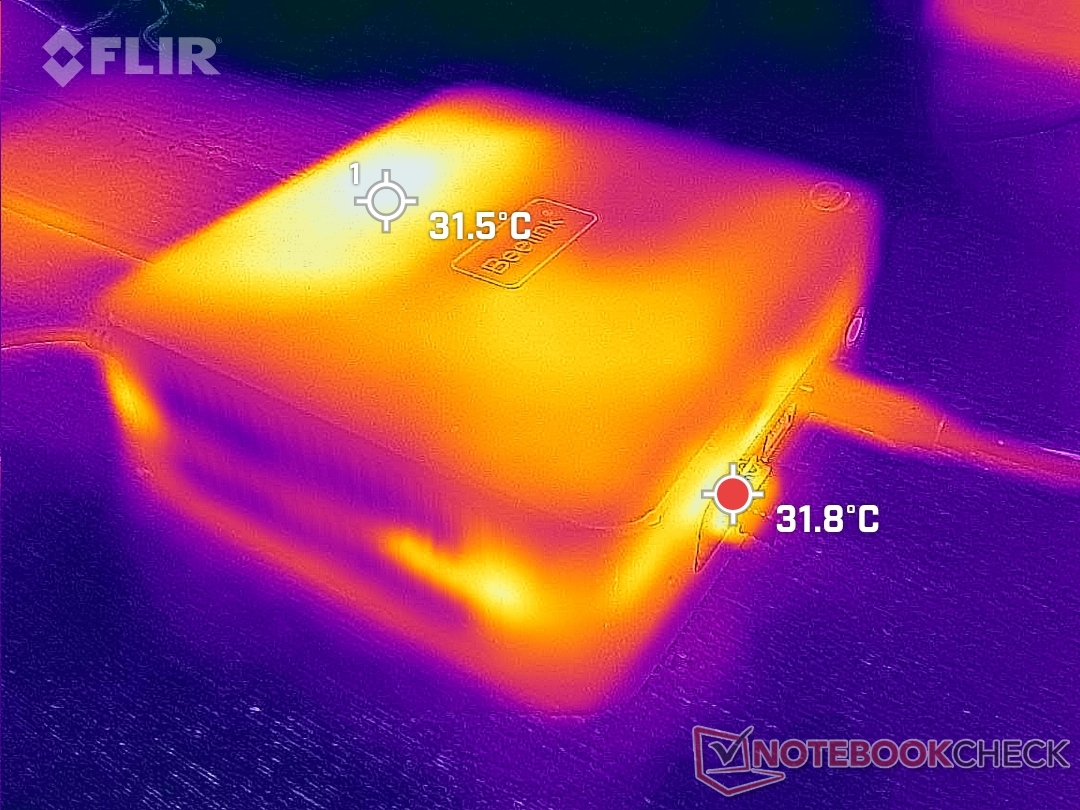
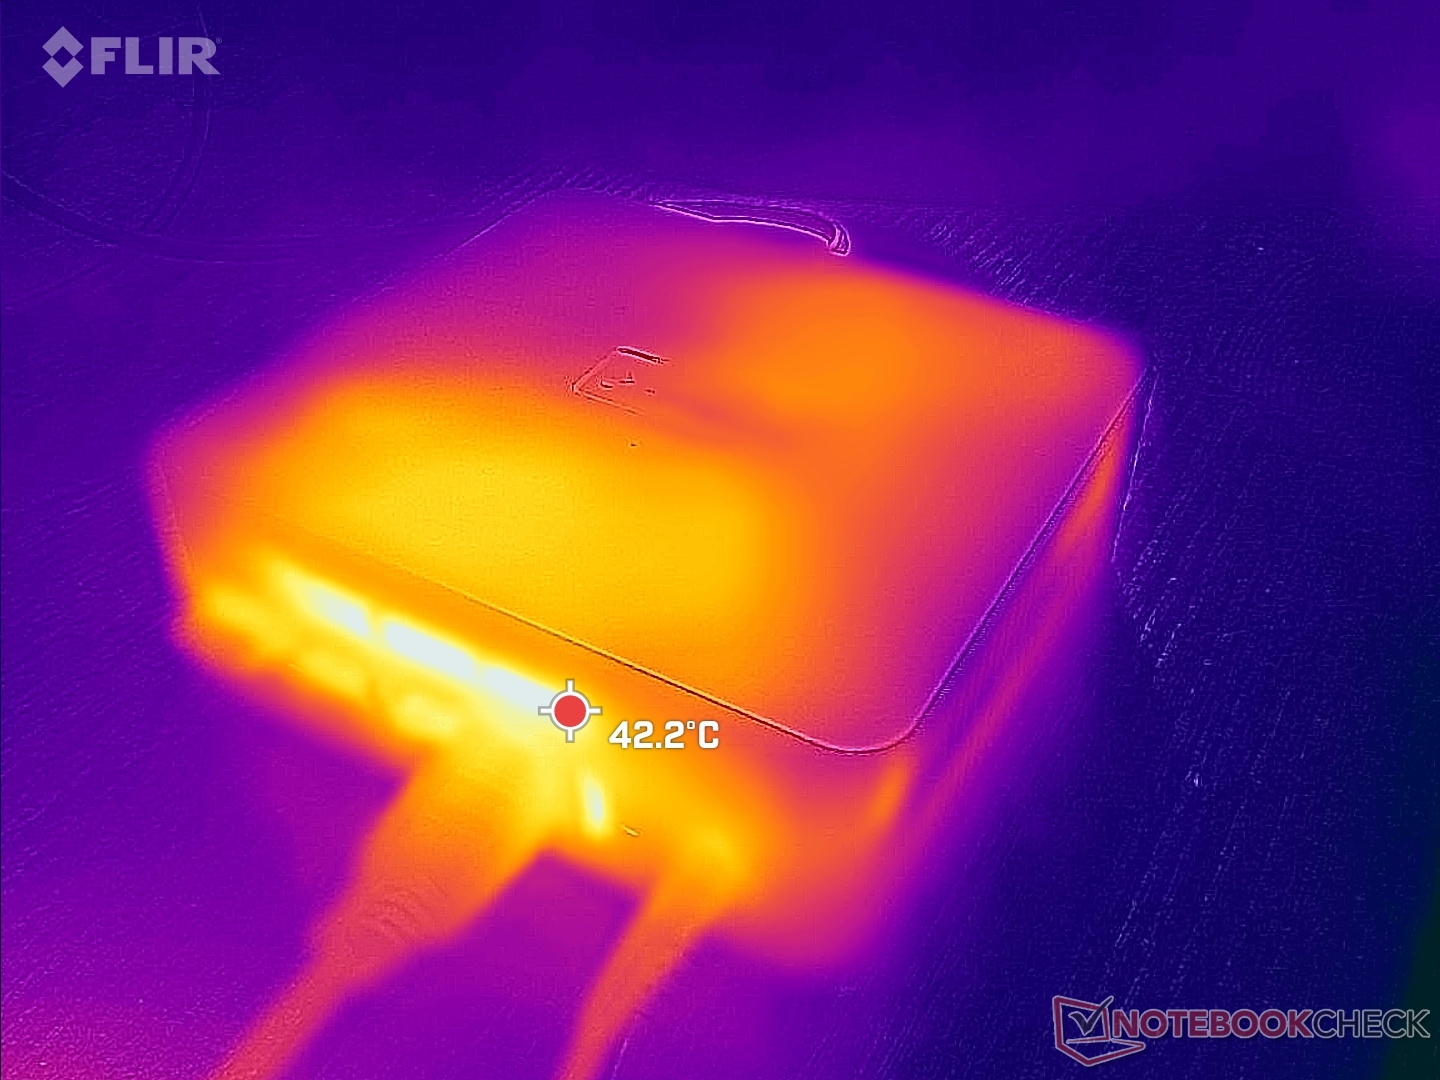
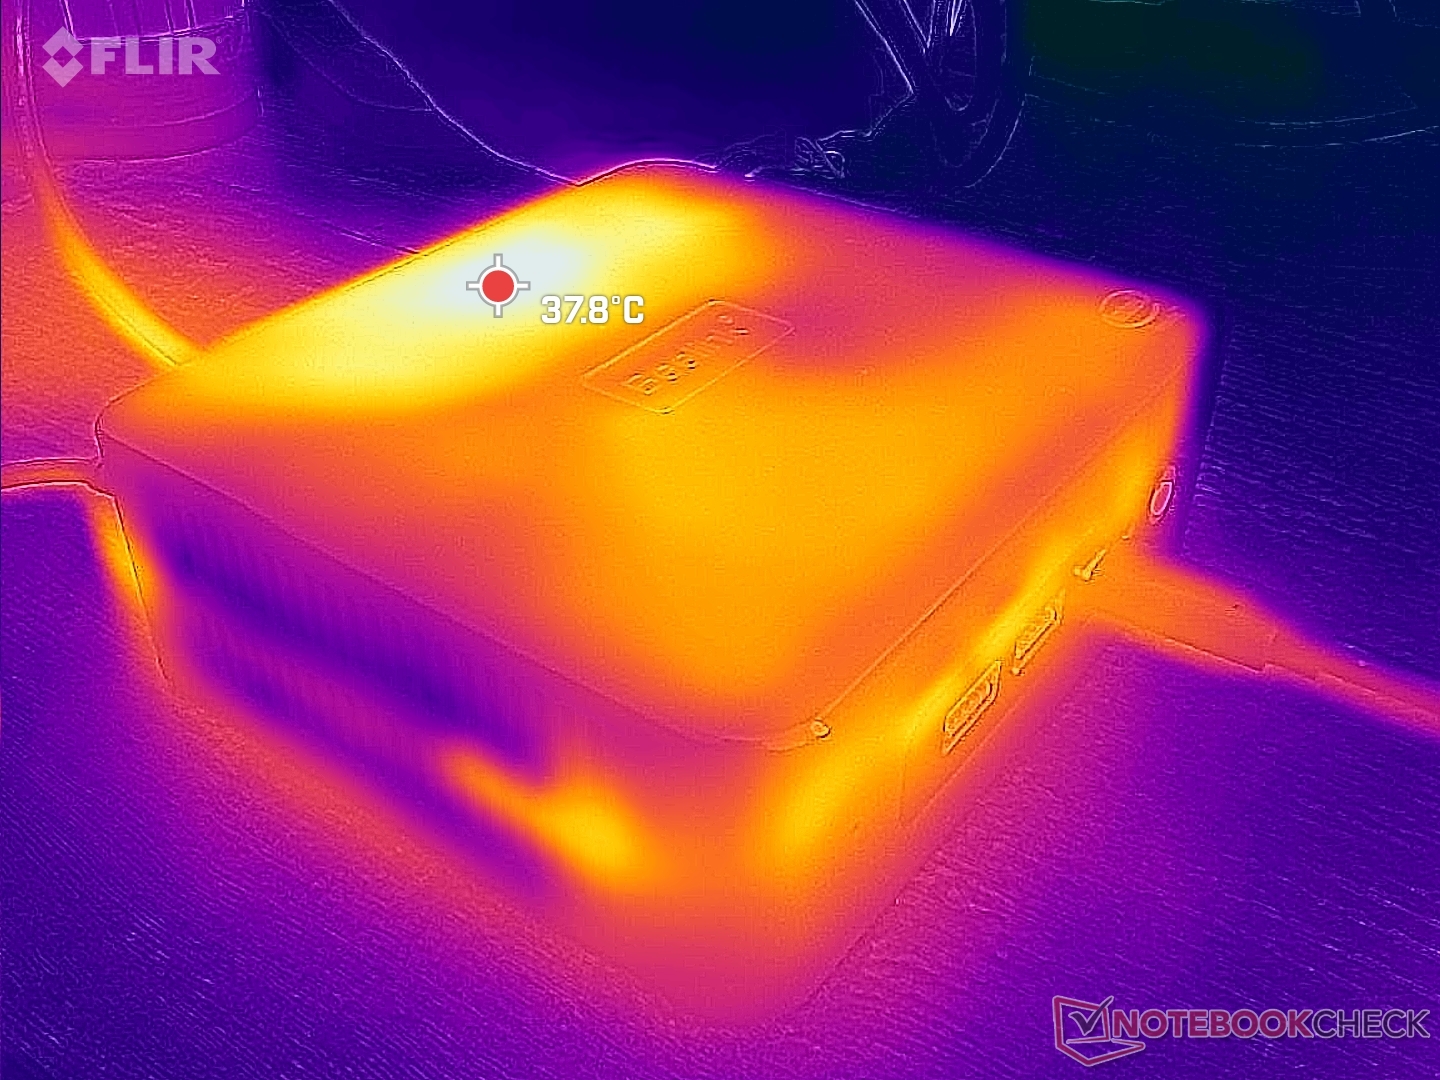
Température
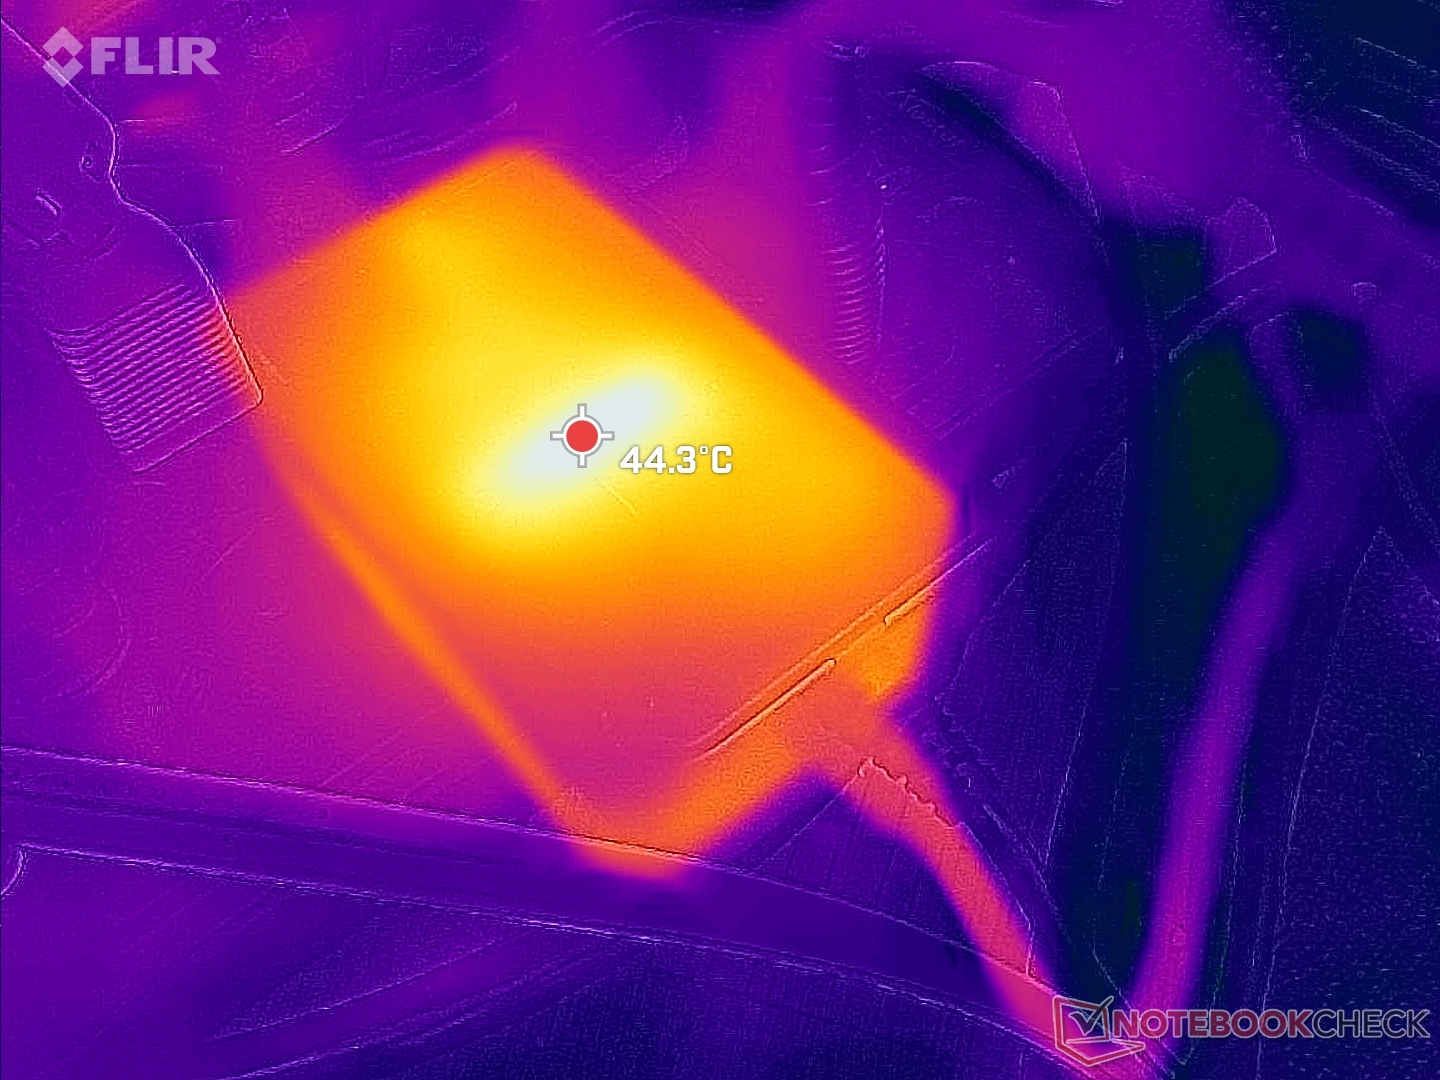
Les températures de surface sont chaudes même lorsque l'appareil est en veille sur le bureau, car le ventilateur est si léthargique. Le dessus de l'unité peut atteindre 32 C lorsqu'aucune application n'est en cours d'exécution ou jusqu'à 38 C lorsque des applications stressantes sont exécutées pendant de longues périodes. Les points chauds se trouvent à l'arrière du châssis, près des grilles de ventilation arrière.
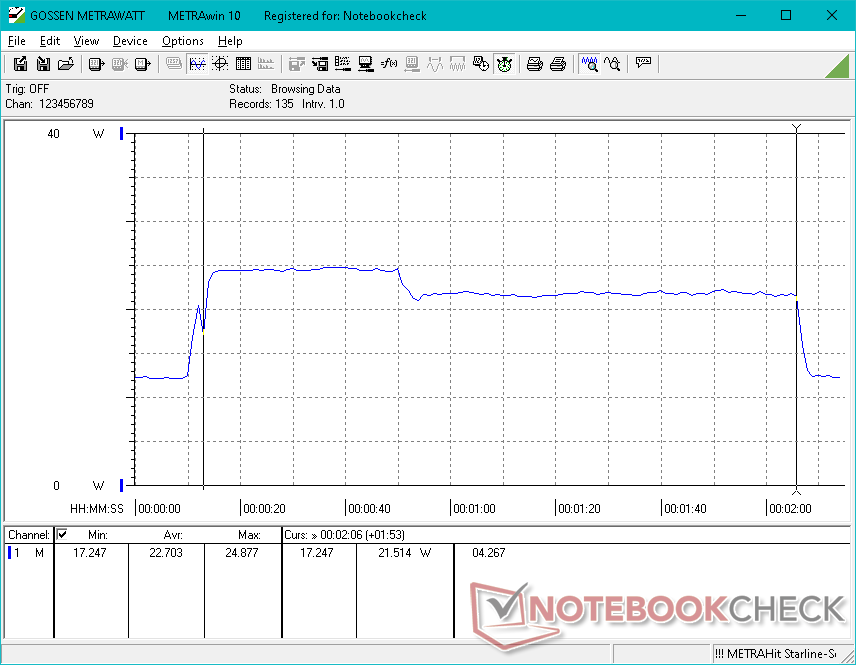
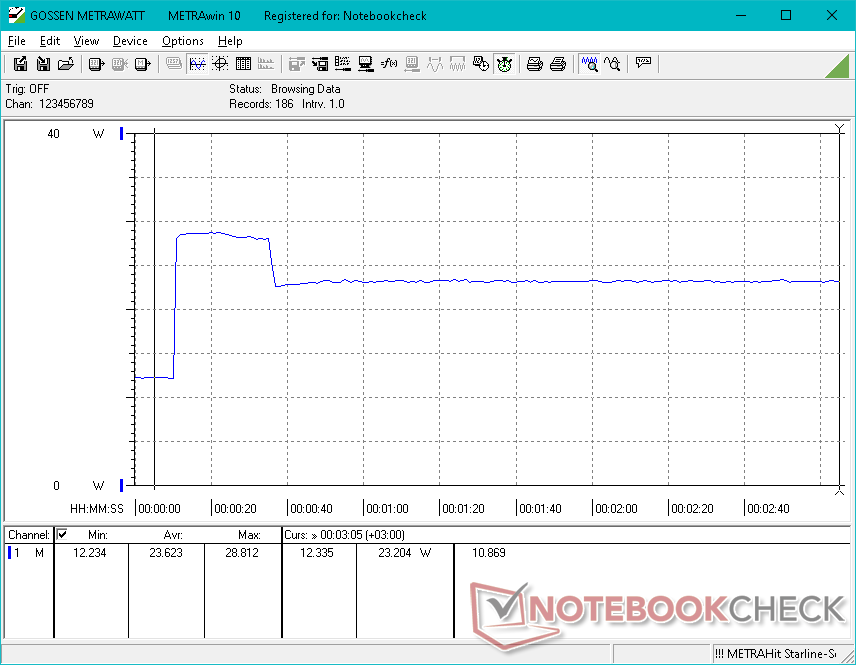
Test de stress
Les fréquences d'horloge du CPU, la température et la consommation d'énergie de la carte atteignaient respectivement 2,8 GHz, 86 C et 20 W lors du lancement du stress Prime95. Après environ 20 secondes, cependant, les fréquences d'horloge et la consommation d'énergie de la carte chutent à 2,4 GHz et 15 W, respectivement, afin de maintenir une température centrale plus froide de 76 C, comme le montre la capture d'écran ci-dessous. C'est en fait plus lent et plus froid de 200 MHz et 9 C, respectivement, que ce que nous avons enregistré sur le U59 de l'année dernière avec l'ancien N5095.
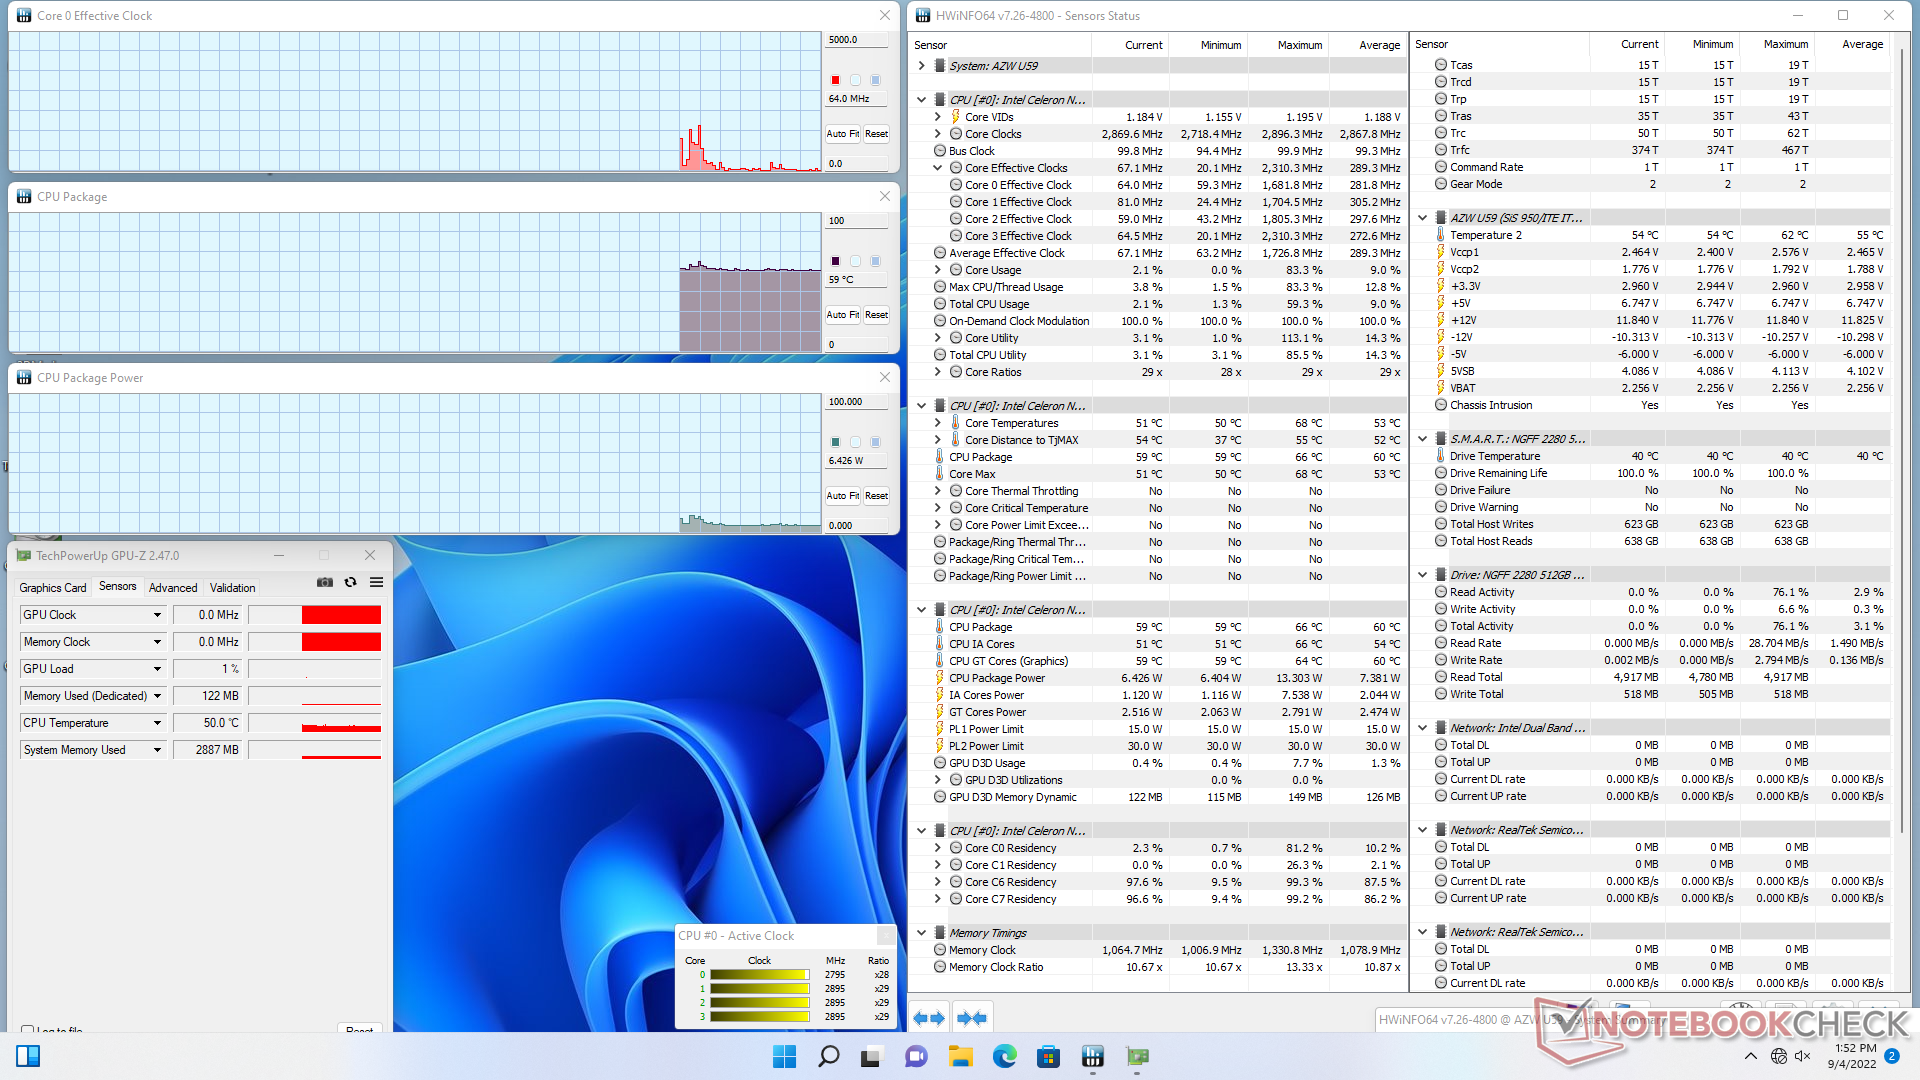
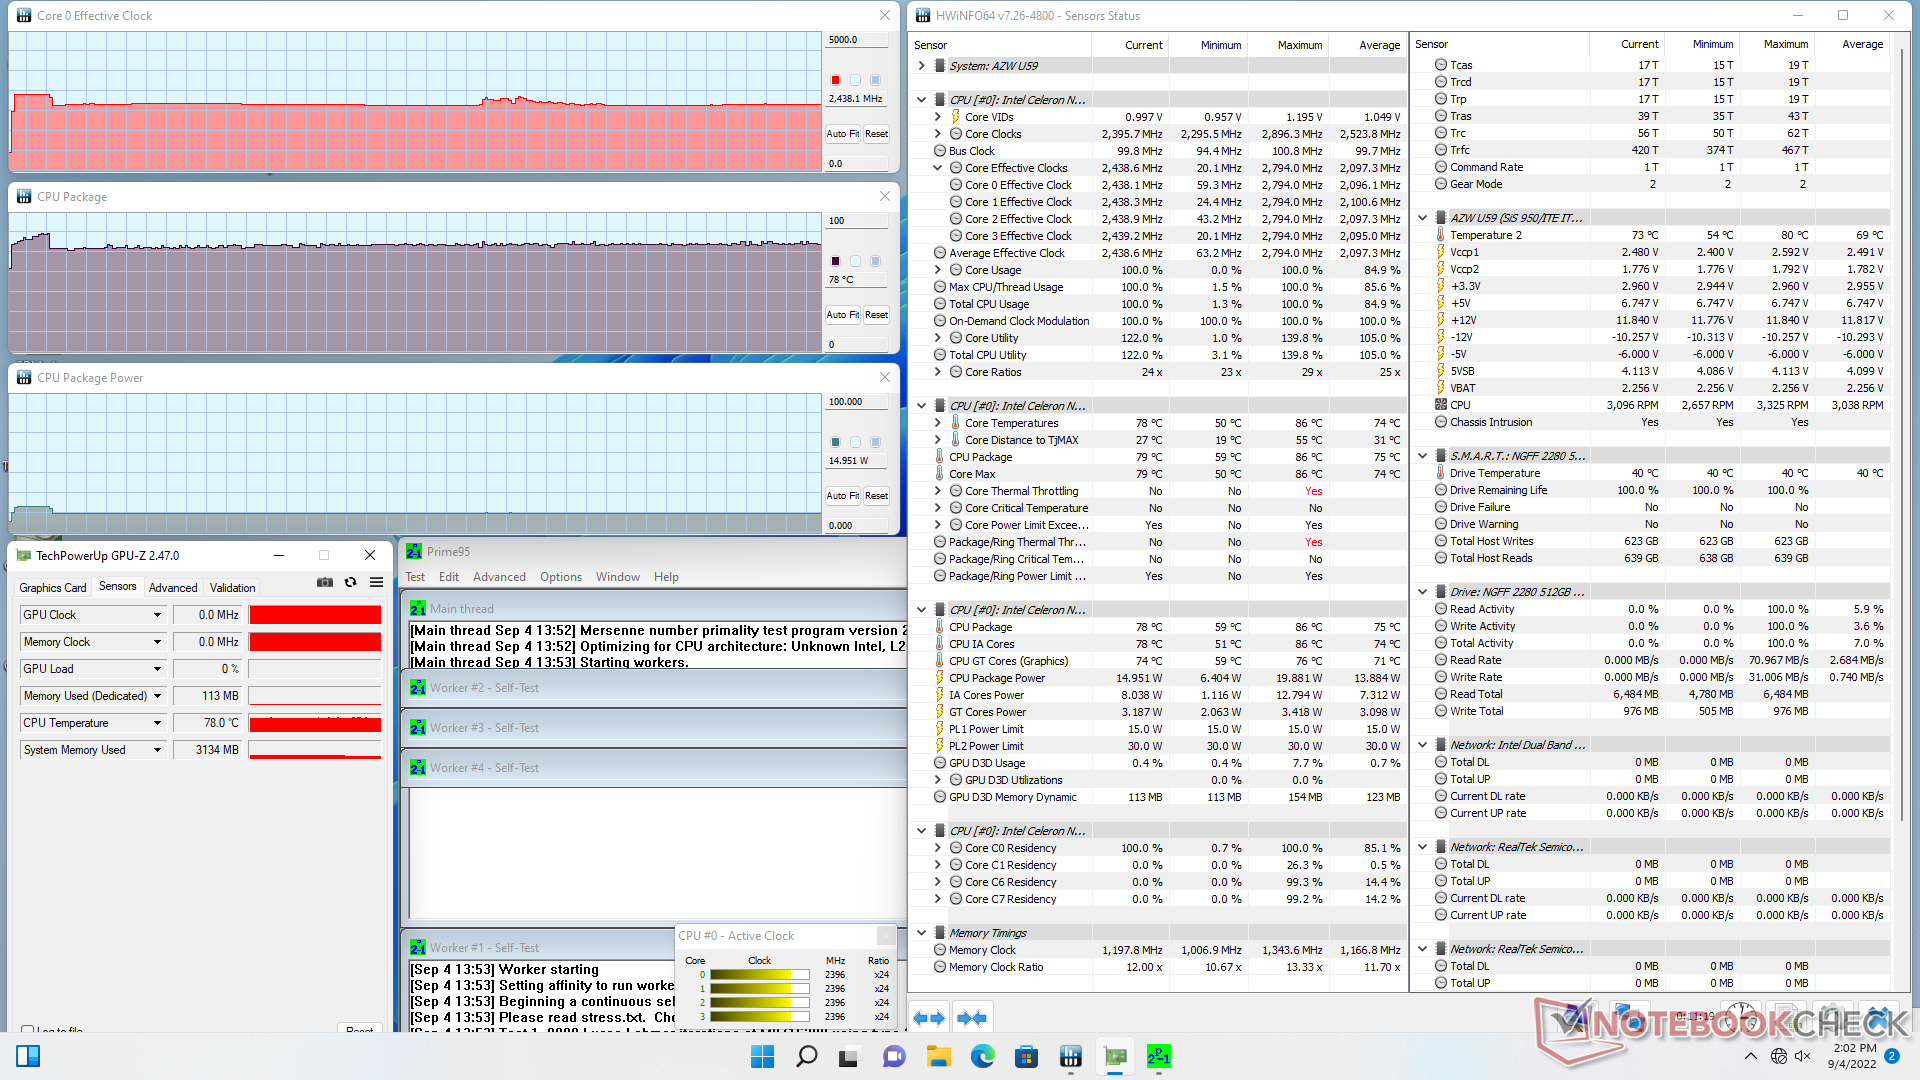
| Fréquence du CPU (GHz) | Fréquence du GPU (MHz) | Température moyenne du CPU (°C) | |
| Système au repos | -- | -- | 59 |
| Prime95 Stress | 2.4 | -- | 78 |
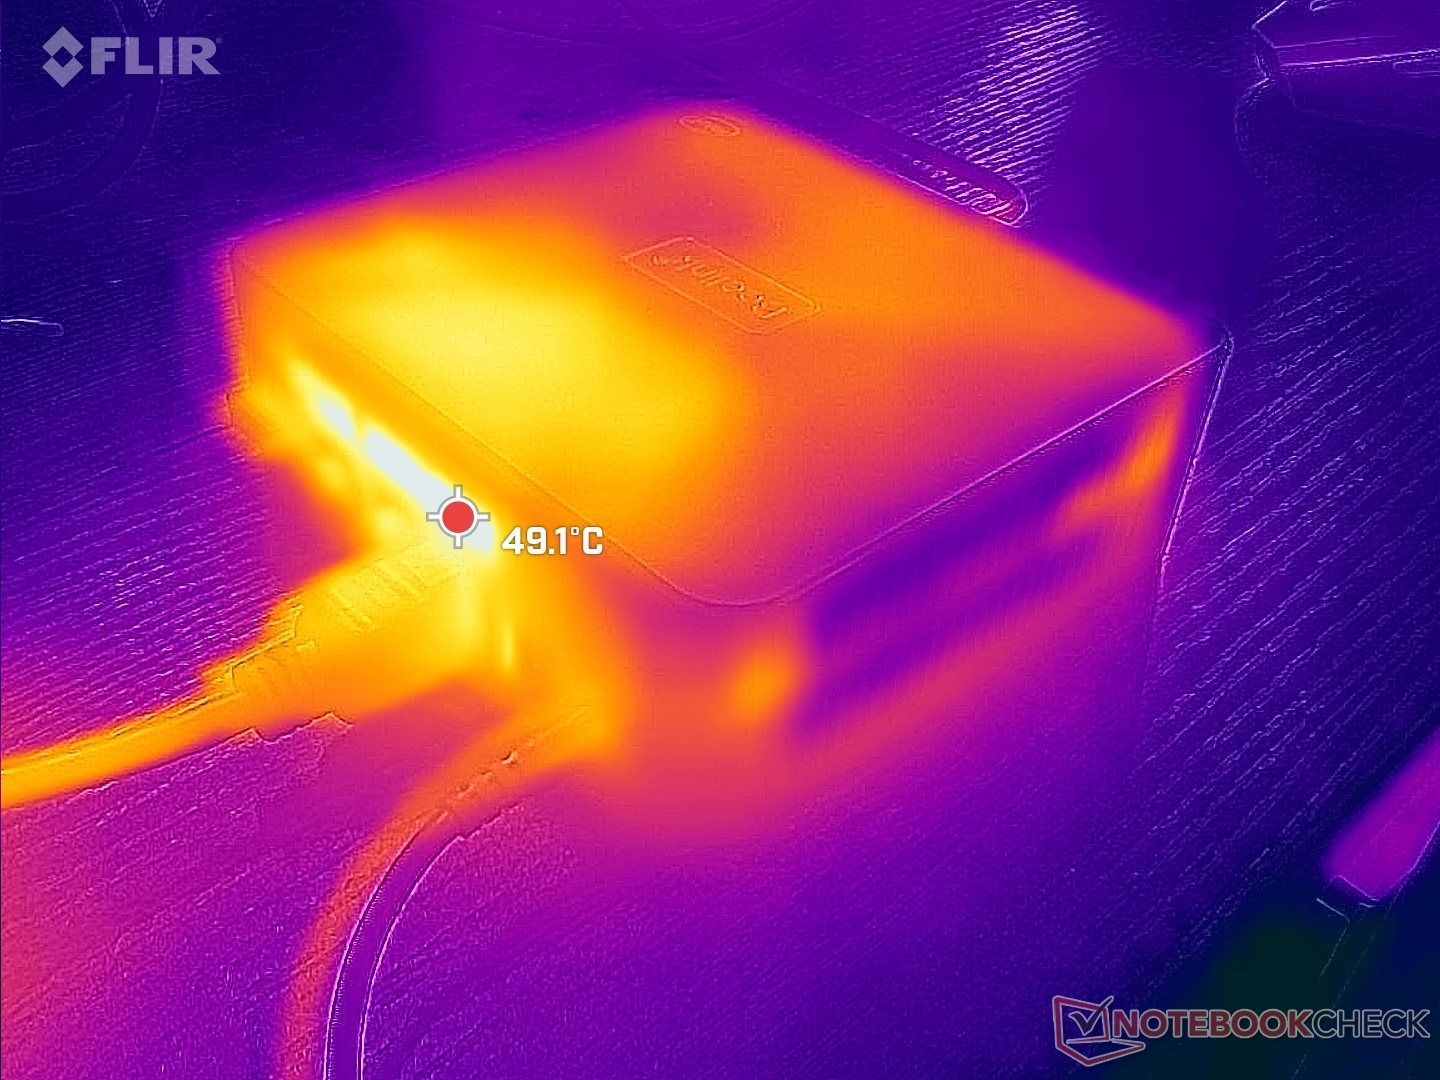
Gestion de l'énergie
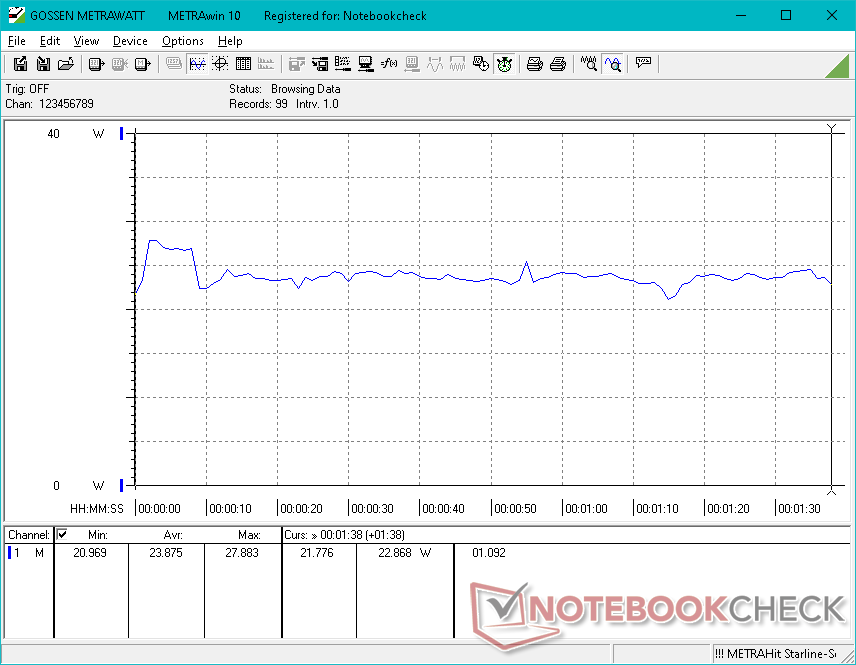
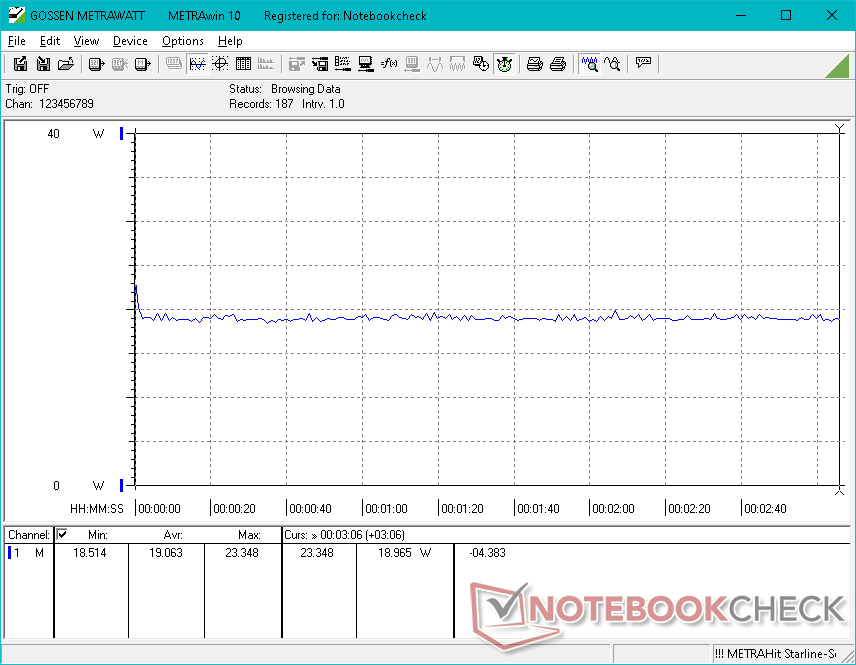
Consommation d'énergie
Le système est à peine plus exigeant que sur le U59 de l'année dernière avec l'ancien Celeron N5095. Les gains susmentionnés du GPU, cependant, valent bien les quelques watts supplémentaires. La consommation globale est toujours bien inférieure à celle des mini-PC équipés de CPU Core U ou Ryzen U comme le Intel NUC11 ou le Beelink SER4
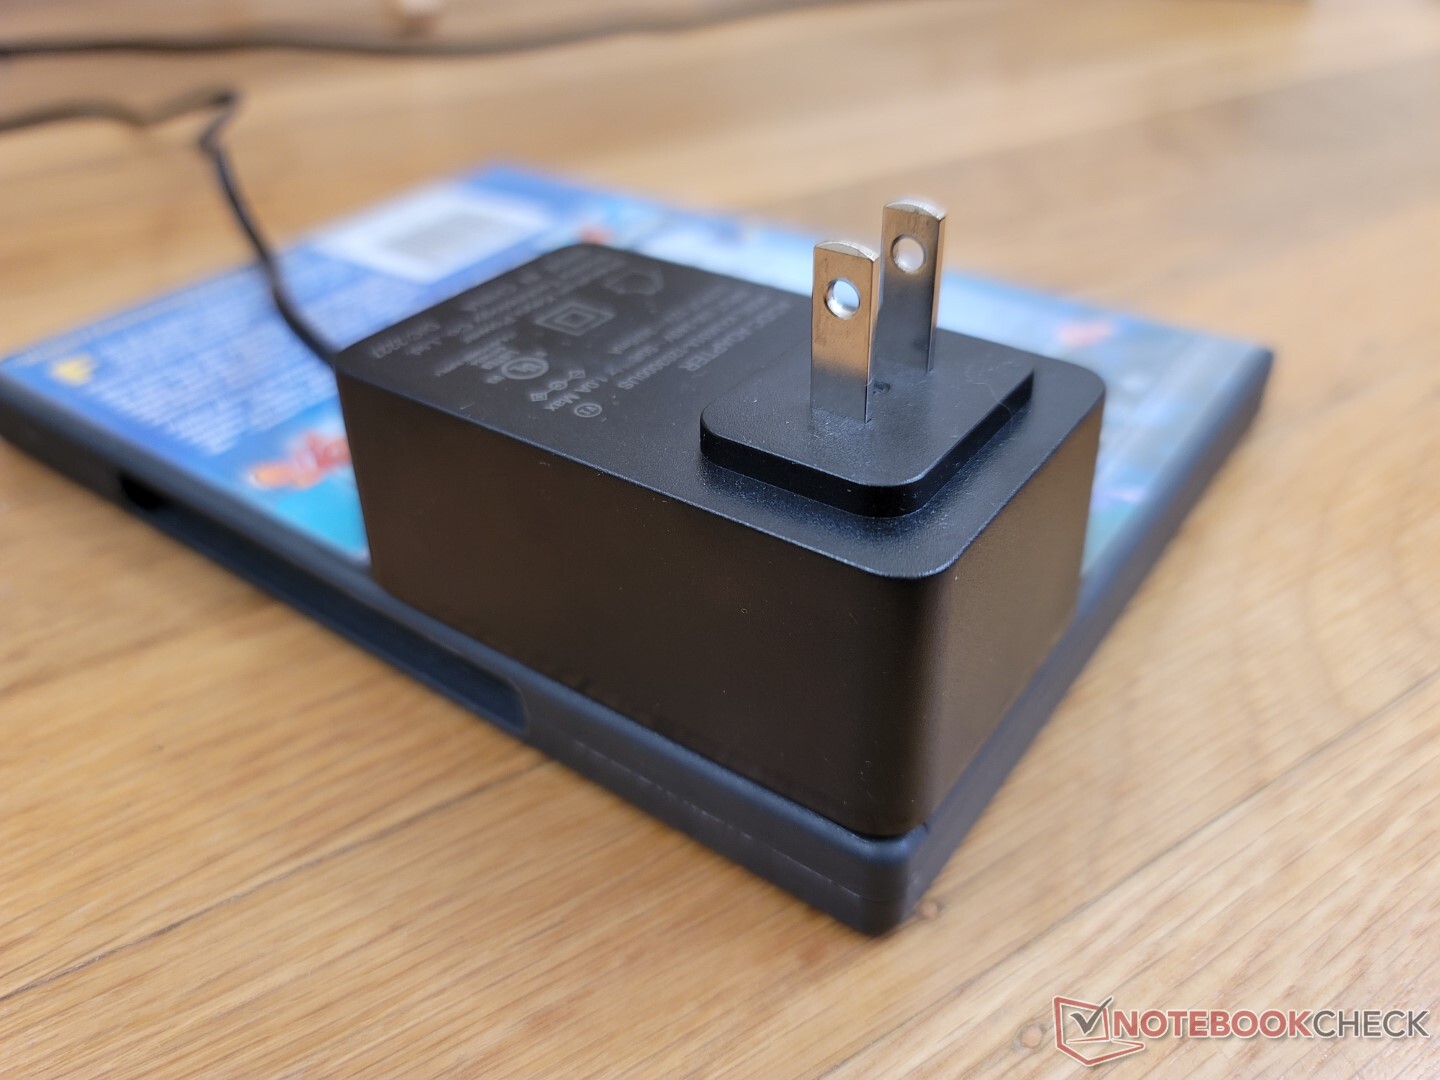
Nous avons pu enregistrer une consommation maximale temporaire de 29 W sur le petit adaptateur secteur de 36 W (~7,8 x 4,6 x 3,2 cm) lors de l'exécution de Prime95.
| Éteint/en veille | |
| Au repos | |
| Fortement sollicité |
|
Légende:
min: | |
| Beelink U59 N5105 Celeron N5105, UHD Graphics (Jasper Lake 24 EU), Silicon Motion AZW 512G NV428, , x, | Beelink U59 Mini-S Celeron N5095, UHD Graphics (Jasper Lake 16 EU), Silicon Motion AZW 256G M.228 220426 C SATA 3, , x, | Beelink SER4 R7 4800U, Vega 8, Intel SSD 660p SSDPEKNW512G8, , x, | Beelink SER3 R7 3750H, Vega 10, GSemi AZW GSDFN512TS3F1OGCX, , x, | Intel NUC11TNKi5 i5-1135G7, Iris Xe G7 80EUs, Transcend M.2 SSD 430S TS512GMTS430S, , x, | Zotac ZBOX PI336 pico Celeron N6211, UHD Graphics (Elkhart Lake 16 EU), SanDisk DF4128, , x, | |
|---|---|---|---|---|---|---|
| Power Consumption | 15% | -4% | -27% | -82% | 42% | |
| Idle Minimum * (Watt) | 6.7 | 7 -4% | 4.1 39% | 7 -4% | 11.5 -72% | 5.4 19% |
| Idle Average * (Watt) | 8.1 | 7 14% | 4.1 49% | 9.1 -12% | 12.4 -53% | 5.5 32% |
| Idle Maximum * (Watt) | 11.6 | 7.6 34% | 4.6 60% | 9.7 16% | 12.9 -11% | 6.2 47% |
| Load Average * (Watt) | 23.9 | 18.3 23% | 35.6 -49% | 29.5 -23% | 40.7 -70% | 11.3 53% |
| Witcher 3 ultra * (Watt) | 19.1 | 35.6 -86% | 32.5 -70% | 43.9 -130% | ||
| Load Maximum * (Watt) | 28.8 | 27.1 6% | 39.9 -39% | 48.7 -69% | 73.5 -155% | 11.8 59% |
* ... Moindre est la valeur, meilleures sont les performances
Power Consumption Witcher 3 / Stresstest
Power Consumption external Monitor
Points positifs
Points négatifs
Verdict - Même CPU, GPU plus rapide
Si vous recherchez la vitesse de traitement, il n'y a pratiquement aucune raison de choisir le Celeron N5105 plutôt que le N5095. Le N5105 est peut-être un peu plus froid, mais il n'offre pas de gains appréciables en termes de performances monofil ou multifil. Ses avantages résident plutôt dans le GPU intégré qui est plus rapide que le GPU intégré du N5095 par des marges beaucoup plus larges.
Malheureusement, le GPU du N5105 est toujours lent et l'interface utilisateur Windows est toujours aussi lente lorsqu'on exécute plus d'une ou deux applications simultanément. Dans ce cas, les capacités de streaming du U59 N5105 sont essentiellement les mêmes que sur le U59 N5095. Il est recommandé de trouver des SKUs avec de la RAM à double canal lorsque cela est possible afin de maximiser les performances du GPU intégré.
En ce qui concerne le mini-PC lui-même, le U59 dispose d'un grand nombre de fonctionnalités compte tenu de son prix très bas. Les configurations sont livrées préinstallées avec Windows 11 et un SSD très spacieux de 512 Go avec 16 Go de RAM pour seulement environ 200 USD alors qu'un Intel NUC pourrait facilement coûter plus de deux fois plus cher sans RAM ni stockage. Si tout ce que vous cherchez à faire est du streaming 1080p de base ou de la navigation, alors ce U59 fera le travail suffisamment. Pour des tâches multiples plus lourdes et des frais généraux plus élevés, cependant, vous voudrez investir dans un mini PC avec des processeurs Core ou Ryzen plus rapides, comme les séries SEI ou SER de Bellink.
Prix et disponibilité
Le Beelink U59 tel que configuré dans notre revue est actuellement disponible pour $200 USD s'il est acheté directement auprès du fabricant. Alternativement, Amazon a la configuration en stock pour 240 $ US et 200 $ pour les SKU de 16 Go et 8 Go, respectivement.
Price comparison

