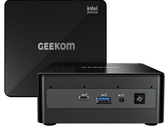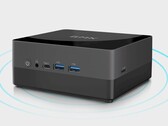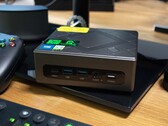
Intel Core i5-8259U
L'Intel Core i5-8259U est un SoC quadricœur pour portables basé sur l'architecture Coffee Lake, et annoncé en avril 2018. Par rapport à son prédécesseur, le Core i5-7267U, le processeur est maintenant équipé de quatre cœurs avec hyper-threading, pour exécuter jusqu'à 8 cœurs logiques simultanément. La fréquence de base est de 2,3 GHz, mais le Turbo monte à 3,8 GHz. Il est équipé d'une carte graphique Intel Iris Plus Graphics 655 avec 128 Mo de eDRAM, d'un contrôleur mémoire double canal (DDR4), ainsi que d'un décodeur et encodeur VP9 et H.265. La puce est toujours fabriquée grâce à un procédé 14 nm avec transistors FinFET.
Par rapport à des modèles Core i5 et Core i7 avec eDRAM et 28 W, le i5-8259U n'est équipé que de 6 Mo de smart cache, et de la version la plus lente de l'Iris Plus.
Intel utilise en gros la même micro architecture par rapport à Kaby Lake, si bien que les performances par MHz ne changent pas. Le fabriquant a simplement revu la technologie "Speed Shift", pour un ajustement dynamique des voltages et de la fréquence plus rapide, et le procédé 14 nm amélioré permet des fréquences bien plus élevées avec une meilleure efficience qu'auparavant.
Vu les fréquences du Core i5-8259U, ses performances devraient être comprises entre les modèles 15 W Core i5-8350U et Core i7-8550U. Le i5-8259U devrait être plus rapide que le i7-8550U en pratique, grâce à son enveloppe thermique supérieure, surtout en cas de sollicitations soutenues.
L'Intel Iris Plus 655 Graphics intégrée est le modèle GT3e des GPU Kaby Lake (Intel Gen. 9.5). Elle possède 48 unités de calcul cadencés entre 300 et 1 050 MHz (fréquence la plus faible pour la 655, la plus rapide étant de 1 200 MHz avec l'i7-8559U), et les performances sont comparables à celles d'une GeForce 930M ou d'une 940MX grâce au cache eDRAM rapide. Cependant, il n'y a pas eu beaucoup d'améliorations par rapport à l'ancienne Iris Plus 650, si bien que les jeux modernes ne peuvent pas être joués fluidement, ou uniquement à des niveaux de réglage les plus bas ou moyens.
A la différence de Skylake, Kaby Lake supporte également le H.265 / HEVC Main 10 avec une profondeur de couleurs de 10 bits, ainsi que le codec VP9 de Google. Les processeur Kaby Lake double cœurs annoncés en janvier devraient également supporter le HDCP 2.2.
La puce est fabriquée grâce à un procédé 14 nm amélioré, avec des transistors FinFET, qui améliore encre un peu plus l'efficience. Intel indique une enveloppe thermique de 28 W, qui peut être abaissée à 23 W (cTDP down), en fonction du scénario d'utilisation. L'enveloppe thermique est plutôt élevée, quand on la compare aux 15 W habituels des processeurs quatre cœurs, mais permet une meilleure utilisation des Turbos du CPU et du GPU.
Gamme Intel Coffee Lake Nom de code Coffee Lake-U Gamme: Coffee Lake Coffee Lake-U Fréquence 2300 - 3800 MHz Cache de Niveau 1 (L1) 256 KB Cache de Niveau 2 (L2) 1 MB Cache de Niveau 3 (L3) 6 MB Nombres de cœurs/threads simultanés supportés 4 / 8 Consommation énergétique maximale (TDP) 28 Watt(s) Lithographie (procédé de fabrication) 14 nm Température maximale 100 °C Socket FCBGA1528 Fonctionnalités Dual-Channel DDR4 Memory Controller, HyperThreading, AVX, AVX2, Quick Sync, Virtualization, AES-NI, Intel SSE4.1, Intel SSE 4.2 Carte graphique Intel Iris Plus Graphics 655 (300 - 1050 MHz)64 Bit Prend en charge les instructions 64 Bit Architecture x86 Date de présentation 04/03/2018 Lien redirigeant vers une page externe du produit ark.intel.com
Benchmarks Performance Rating - CB R15 + R20 + 7-Zip + X265 + Blender + 3DM11 CPU
27.6 pt (38%)
...
Intel Core i5-8265U
Intel Core i7-7700HQ
Intel Core i5-8260U
Intel Core i5-1035G4
Intel Core i5-1035G1
...
max:
AMD Ryzen Threadripper PRO 7995WX
Cinebench R23 - Cinebench R23 Multi Core
min: 3592 moyenne: 3792 médian: 3728 (3%) maximum: 4025 Points
CPU TDP ? TDP 28 W 100% 93%
...
AMD Ryzen Embedded V1605B
Intel Core i5-8265U
Intel Core i7-1065G7
Intel Core i5-1035G4
Intel Core i5-1035G1
...
max:
AMD Ryzen Threadripper PRO 7995WX
Cinebench R23 - Cinebench R23 Single Core
min: 959 moyenne: 976 médian: 976.5 (42%) maximum: 991 Points
CPU TDP ? TDP 28 W 98% 100%
...
AMD Ryzen Embedded R1606G
Intel Core i5-8265U
Intel Core i5-1035G1
...
Apple M3 Pro 12-Core
max:
Intel Core i9-14900K
Cinebench R20 - Cinebench R20 CPU (Single Core)
min: 369 moyenne: 378 médian: 381 (42%) maximum: 386 Points
CPU TDP ? TDP 28 W 98% 100%
...
Intel Core i7-7700HQ
Apple M2
Intel Core i5-8265U
Intel Core i5-8260U
...
max:
Intel Core i9-14900K
Cinebench R20 - Cinebench R20 CPU (Multi Core)
min: 1385 moyenne: 1473 médian: 1471 (4%) maximum: 1567 Points
CPU TDP ? TDP 28 W 100% 93%
...
Intel Core i5-1035G1
Intel Core i5-8260U
Intel Core i7-1065G7
...
max:
AMD Ryzen Threadripper PRO 7995WX
Cinebench R15 - Cinebench R15 CPU Multi 64 Bit
min: 575 moyenne: 622 médian: 615 (4%) maximum: 687 Points
CPU TDP ? TDP 28 W 100% 94%
...
Intel Core i5-1035G1
Intel Core i5-8260U
...
max:
AMD Ryzen Threadripper PRO 7995WX
0 35 70 105 140 175 210 245 280 315 350 385 420 455 490 525 560 595 630 665 Tooltip Chuwi CoreBook X: Ø571 (559.33-575.29)
Geekom Mini IT8-GM08i5T: Ø594 (591.39-600.38)
Apple MacBook Pro 13 2018 Touchbar i5 macOS Software Update: Ø579 (560-607)
Apple MacBook Pro 13 2018 Touchbar i5 macOS Software Update: Ø688 (666.16-693.55)
GMK NucBox 2: Ø612 (608.07-614.94)
ACEMagician ACE-CK10-8259U: Ø621 (611.68-659.87)
Chuwi CoreBook X Pro: Ø629 (624.68-636.38)
Cinebench R15 - Cinebench R15 CPU Single 64 Bit
min: 132 moyenne: 147.1 médian: 148.7 (45%) maximum: 154 Points
CPU TDP ? TDP 28 W 100% 97%
...
Intel Core i3-8145U
...
max:
Intel Core i9-14900K
Cinebench R11.5 - Cinebench R11.5 CPU Multi 64 Bit
7.1 Points (9%)
...
Intel Core i5-1035G4
Intel Core i7-1065G7
...
max:
AMD Ryzen Threadripper PRO 7995WX
Cinebench R11.5 - Cinebench R11.5 CPU Single 64 Bit
1.7 Points (42%)
...
...
max:
Intel Core i9-14900K
Cinebench R10 - Cinebench R10 Rend. Single (32bit)
5706 points (34%)
...
...
max:
Cinebench R10 - Cinebench R10 Rend. Multi (32bit)
21869 points (16%)
...
Intel Core i5-1035G1
Intel Core i7-1065G7
Intel Core i5-1035G4
Intel Core i7-7700HQ
...
max:
Cinebench R10 - Cinebench R10 Rend. Multi (64bit)
27377 Points (19%)
...
Intel Core i7-7700HQ
Intel Core i5-1230U
...
max:
Intel Core i9-14900K
Cinebench R10 - Cinebench R10 Rend. Single (64bit)
7397 Points (40%)
...
Intel Core i7-7700HQ
Intel Core i5-8265U
...
max:
Intel Core i9-14900K
wPrime 2.10 - wPrime 2.0 1024m *
248.6 s (3%)
...
Intel Core i7-7700HQ
...
VIA C3-M C3-M-1200
wPrime 2.10 - wPrime 2.0 32m *
7.5 s (2%)
...
Intel Core i5-1035G4
Intel Core i5-1035G7
Intel Core i7-2860QM
...
5348 points (8%)
...
...
max:
AMD Ryzen Threadripper PRO 7995WX
7-Zip 18.03 - 7-Zip 18.03 Multli Thread 4 runs
min: 17799 moyenne: 20778 médian: 19104.5 (11%) maximum: 28824 MIPS
CPU TDP ? TDP 28 W 94% 100%
...
Intel Core i5-8260U
Intel Core i5-1038NG7
Intel Core i7-7700HQ
...
max:
AMD Ryzen Threadripper PRO 7995WX
7-Zip 18.03 - 7-Zip 18.03 Single Thread 4 runs
min: 3753 moyenne: 3949 médian: 3975.5 (48%) maximum: 4022 MIPS
CPU TDP ? TDP 28 W 97% 100%
...
Intel Core i7-2860QM
Intel Core i5-8265U
Intel Core i5-8260U
Intel Core i5-1035G1
...
max:
X264 HD Benchmark 4.0 - x264 Pass 2
min: 38.5 moyenne: 39.5 médian: 39.5 (14%) maximum: 40.5 fps
...
Intel Core i5-1035G7
...
max:
AMD Ryzen Threadripper PRO 7995WX
X264 HD Benchmark 4.0 - x264 Pass 1
min: 162.3 moyenne: 165.1 médian: 165.1 (38%) maximum: 167.95 fps
...
Intel Core i5-8265U
Intel Core i5-1035G7
Intel Core i7-7700HQ
...
max:
HWBOT x265 Benchmark v2.2 - HWBOT x265 4k Preset
min: 4.72 moyenne: 5.2 médian: 5.4 (9%) maximum: 5.49 fps
CPU TDP ? TDP 28 W 97% 100%
...
Intel Core i7-1065G7
Intel Core i5-1035G7
Intel Core i3-1215U
Intel Core i5-1230U
Intel Core i5-1038NG7
...
max:
AMD Ryzen Threadripper PRO 7995WX
0 1 2 3 4 5 6 7 8 9 10 11 12 Tooltip Apple MacBook Pro 13 2018 Touchbar i5: Ø5.24 (0.69-12.2)
Chuwi CoreBook X: Ø5.29 (0.68-11.2)
Geekom Mini IT8-GM08i5T: Ø5.96 (0.81-11.8)
GMK NucBox 2: Ø5.69 (0.65-10.1)
Chuwi CoreBook X Pro: Ø5.85 (0.69-11.2)
ACEMagician ACE-CK10-8259U: Ø5.98 (0.76-11.7)
TrueCrypt - TrueCrypt Serpent
0.5 GB/s (14%)
...
Intel Core i5-1035G4
Intel Core i5-8265U
Intel Core i7-1065G7
...
max:
AMD Ryzen Threadripper PRO 7995WX
TrueCrypt - TrueCrypt Twofish
0.8 GB/s (13%)
...
Intel Core i5-1035G7
Intel Core i5-1035G4
Intel Core i5-8265U
Intel Core i7-1065G7
...
max:
Intel Core i9-14900K
TrueCrypt - TrueCrypt AES
4.1 GB/s (11%)
...
Intel Core i7-7700HQ
Intel Core i5-1035G1
...
max:
AMD Ryzen Threadripper PRO 7995WX
Blender - Blender 3.3 Classroom CPU *
1331 Seconds (17%)
...
Intel Core i3-1215U
Intel Core i5-8260U
Intel Core i5-1230U
Intel Core i5-8265U
...
Blender - Blender 2.79 BMW27 CPU *
min: 688 moyenne: 730 médian: 729.5 (5%) maximum: 769 Seconds
CPU TDP ? TDP 28 W 100% 100%
...
Intel Core i5-8260U
Intel Core i5-1230U
AMD Ryzen Embedded V1605B
...
R Benchmark 2.5 - R Benchmark 2.5 *
min: 0.738 moyenne: 0.8 médian: 0.8 (17%) maximum: 0.818 sec
CPU TDP ? TDP 28 W 100% 101%
...
Intel Core i5-1035G4
AMD Ryzen Embedded V1605B
AMD Ryzen Embedded R1606G
Intel Core i5-1035G7
...
3DMark 06 - CPU - 3DMark 06 - CPU
7916 Points (17%)
...
Intel Core i5-1038NG7
...
max:
AMD Ryzen Threadripper PRO 7995WX
Super Pi mod 1.5 XS 1M - Super Pi mod 1.5 XS 1M *
11.1 s (2%)
...
Intel Core i7-2640M
...
VIA C3-M C3-M-1200
Super Pi mod 1.5 XS 2M - Super Pi mod 1.5 XS 2M *
24.3 s (1%)
...
Intel Core i3-8145U
...
Super Pi Mod 1.5 XS 32M - Super Pi mod 1.5 XS 32M *
589 s (3%)
...
Intel Core i7-2860QM
...
VIA C3-M C3-M-1200
3DMark Vantage - 3DM Vant. Perf. CPU no Physx
25093 Points (23%)
...
Intel Core i5-1035G7
Intel Core i7-7700HQ
Intel Core i5-1035G4
...
max:
3DMark 11 - 3DM11 Performance Physics
min: 7105 moyenne: 8348 médian: 8528.5 (23%) maximum: 9276 Points
CPU TDP ? TDP 28 W 100% 91%
...
Intel Core i7-1065G7
Intel Core i7-7700HQ
...
max:
3DMark - 3DMark Ice Storm Physics
min: 47878 moyenne: 49579 médian: 49578.5 (40%) maximum: 51279 Points
CPU TDP ? TDP 28 W 100% 93%
...
Intel Core i5-1035G1
Intel Core i7-1065G7
Intel Core i5-1035G4
...
max:
Intel Core i5-14600K
3DMark - 3DMark Ice Storm Extreme Physics
min: 47855 moyenne: 49509 médian: 49509 (40%) maximum: 51163 Points
CPU TDP ? TDP 28 W 100% 94%
...
Intel Core i5-1035G4
Intel Core i5-1035G1
...
max:
Intel Core i5-14600K
3DMark - 3DMark Ice Storm Unlimited Physics
min: 17718 moyenne: 40451 médian: 49722 (42%) maximum: 53914 Points
CPU TDP ? TDP 28 W 72% 100%
...
AMD Ryzen Embedded R1505G
Intel Core i5-7200U
...
max:
Intel Core i5-14600K
3DMark - 3DMark Cloud Gate Physics
min: 5946 moyenne: 6904 médian: 6670.5 (17%) maximum: 7927 Points
CPU TDP ? TDP 28 W 100% 93%
...
AMD Ryzen Embedded V1605B
Intel Core i5-1035G7
Intel Core i5-1035G1
Intel Core i7-1065G7
...
max:
Intel Core i9-14900K
3DMark - 3DMark Fire Strike Standard Physics
min: 8348 moyenne: 9726 médian: 9743 (17%) maximum: 11006 Points
CPU TDP ? TDP 28 W 98% 100%
...
Intel Core i7-1065G7
Intel Core i5-1035G1
...
max:
Intel Core i9-14900K
3DMark - 3DMark Time Spy CPU
min: 2752 moyenne: 3096 médian: 3132 (13%) maximum: 3346 Points
CPU TDP ? TDP 28 W 100% 98%
...
Intel Core i5-1230U
Intel Core i5-1035G4
AMD Ryzen Embedded V1605B
Intel Core i5-8260U
Intel Core i5-1035G1
...
max:
Intel Core i9-14900K
Geekbench 5.5 - Geekbench 5.1 - 5.4 64 Bit Single-Core
min: 948 moyenne: 961 médian: 951 (40%) maximum: 984 points
CPU TDP ? TDP 28 W 98% 100%
...
Intel Core i7-7700HQ
...
Geekbench 5.5 - Geekbench 5.1 - 5.4 64 Bit Multi-Core
min: 3359 moyenne: 3602 médian: 3607 (6%) maximum: 3839 points
CPU TDP ? TDP 28 W 100% 91%
...
AMD Ryzen Embedded V1605B
Intel Core i5-8265U
Intel Core i7-7700HQ
Intel Core i5-1035G4
...
Apple M3 Max 16-Core
max:
AMD Ryzen Threadripper PRO 7995WX
Geekbench 5.0 - Geekbench 5.0 64 Bit Single-Core
min: 944 moyenne: 957 médian: 948 (4%) maximum: 979 points
CPU TDP ? TDP 28 W 98% 100%
...
Intel Core i3-8145U
Intel Core i5-8265U
Intel Core i7-7700HQ
...
max:
Intel Core i9-14900K
Geekbench 5.0 - Geekbench 5.0 64 Bit Multi-Core
min: 3335 moyenne: 3571 médian: 3567 (11%) maximum: 3811 points
CPU TDP ? TDP 28 W 100% 91%
...
Intel Core i5-8265U
Intel Core i5-1035G7
Intel Core i5-1035G1
Intel Core i7-7700HQ
...
max:
Geekbench 4.4 - Geekbench 4.1 - 4.4 64 Bit Single-Core
min: 4200 moyenne: 4265 médian: 4211 (43%) maximum: 4383 points
CPU TDP ? TDP 28 W 98% 100%
...
Intel Core i3-8145U
Intel Core i5-8265U
...
max:
Intel Core i9-14900K
Geekbench 4.4 - Geekbench 4.1 - 4.4 64 Bit Multi-Core
min: 13421 moyenne: 14122 médian: 13961 (16%) maximum: 14984 points
CPU TDP ? TDP 28 W 100% 91%
...
Intel Core i5-8265U
Intel Core i7-7700HQ
Intel Core i5-1035G1
...
max:
Intel Core i9-14900K
Mozilla Kraken 1.1 - Kraken 1.1 Total Score *
min: 1010 moyenne: 1054 médian: 1068 (1%) maximum: 1095 ms
CPU TDP ? TDP 28 W 100% 100%
...
Intel Core i7-9750H
...
max:
WebXPRT 4 - WebXPRT 4 Score
140.3 Points (42%)
...
Intel Core i5-8265U
...
max:
Intel Core i9-14900K
WebXPRT 3 - WebXPRT 3 Score
min: 173.3 moyenne: 176.9 médian: 176 (37%) maximum: 182.4 Points
CPU TDP ? TDP 28 W 100% 96%
...
Intel Core i5-1035G4
Intel Core i5-1038NG7
Intel Core i5-1035G1
...
CrossMark - CrossMark Overall
954 Points (37%)
...
Intel Core i5-8265U
Intel Core i7-1065G7
...
max:
Intel Core i9-14900K
Power Consumption - Prime95 Power Consumption - external Monitor *
min: 36.1 moyenne: 42 médian: 39.5 (7%) maximum: 50.3 Watt
CPU TDP ? TDP 28 W 101% 100%
...
Intel Core i7-1265U
...
max:
0 5 10 15 20 25 30 35 40 45 50 55 60 Tooltip Chuwi CoreBook X: Ø36.1 (17.5-61.3)
ACEMagician ACE-CK10-8259U: Ø39.5 (37.2-54.3)
Chuwi CoreBook X Pro: Ø50.3 (48-56.5)
Power Consumption - Cinebench R15 Multi Power Consumption - external Monitor *
min: 37.6 moyenne: 44.2 médian: 43.7 (8%) maximum: 51.3 Watt
CPU TDP ? TDP 28 W 100% 100%
...
Intel Core i5-8260U
Intel Core i5-1240U
Intel Core i3-1215U
Apple M3 Pro 12-Core
...
max:
Intel Core i9-14900K
0 5 10 15 20 25 30 35 40 45 50 55 60 Tooltip Chuwi CoreBook X: Ø37.6 (30.2-61.8)
ACEMagician ACE-CK10-8259U: Ø43.7 (36.9-52.4)
Chuwi CoreBook X Pro: Ø51.3 (47-56.3)
Power Consumption - Idle Power Consumption - external Monitor *
13.9 Watt (11%)
...
Intel Core i5-1245U
...
max:
0 1 2 3 4 5 6 7 8 9 10 11 12 13 14 15 Tooltip ACEMagician ACE-CK10-8259U: Ø13.9 (13.7-15)
Power Consumption - Cinebench R15 Multi Power Efficiency - external Monitor
min: 12.4 moyenne: 13.9 médian: 13.9 (10%) maximum: 15.3 Points per Watt
...
Intel Atom x7-Z8750
Intel Core i5-8260U
...
- Amplitude des valeurs obtenues dans le benchmark avec cette carte graphique
- Valeur moyenne obtenue dans le benchmark avec cette carte graphique
* Plus les chiffres sont petits, plus les performances sont élevées
v1.26
log 03. 06:50:53
#0 no ids found in url (should be separated by "_") +0s ... 0s
#1 not redirecting to Ajax server +0s ... 0s
#2 did not recreate cache, as it is less than 5 days old! Created at Sat, 02 Dec 2023 15:30:08 +0100 +0.001s ... 0.001s
#3 no comparison url found in template nbc.compare_page_2 needed +0.004s ... 0.005s
#4 no comparison url found in template nbc.compare_page_2 needed +0s ... 0.005s
#5 no comparison url found in template nbc.compare_page_2 needed +0s ... 0.005s
#6 no comparison url found in template nbc.compare_page_2 needed +0s ... 0.006s
#7 no comparison url found in template nbc.compare_page_2 needed +0s ... 0.006s
#8 no comparison url found in template nbc.compare_page_2 needed +0s ... 0.006s
#9 composed specs +0s ... 0.006s
#10 did output specs +0s ... 0.007s
#11 getting avg benchmarks for device 10068 +0.015s ... 0.021s
#12 got single benchmarks 10068 +0.016s ... 0.037s
#13 got avg benchmarks for devices +0s ... 0.037s
#14 min, max, avg, median took s +1.008s ... 1.045s
#15 no comparison url found in template nbc.compare_page_2 needed +0s ... 1.045s
#16 return log +0s ... 1.045s
Critiques du Intel Core i5-8259U processeur
Test de l'ACEMagician ACE-CK10-8259U : mini PC de bureau silencieux avec jusqu'à trois SSD L'ACEMagician ACE-CK10-8259U est un petit PC de bureau basé sur un processeur natif à 4 cœurs. Cependant, son processeur fait encore partie de la génération Cof...
Intel Core i5-8259U | Intel Iris Plus Graphics 655 | | 449 g
Test du Geekom SFF Mini IT8 : un PC de bureau compact Le Geekom Mini IT8 est un ordinateur de bureau compact. Malgré sa petite taille, il est assez puissant grâce à son processeur à quatre cœurs et à son iGPU Intel...
Intel Core i5-8259U | Intel Iris Plus Graphics 655 | | 586 g
Test du Chuwi CoreBook X Pro : écran 120 Hz et petit prix Le CoreBook X Pro est l'ordinateur portable de 15,6 pouces le moins cher que vous puissiez trouver avec une dalle 120 Hz. Le hic, cependant, c'est que vous devr...
Intel Core i5-8259U | Intel Iris Plus Graphics 655 | 15.60" | 1.8 kg
Test du Chuwi CoreBook X : comme un MateBook d'Huawei, mais moins cher Le CoreBook X est une bonne solution pour ceux qui veulent maximiser la qualité d'affichage et les couleurs pour un prix budgétaire. Néanmoins, il y a un tas de...
Intel Core i5-8259U | Intel Iris Plus Graphics 655 | 14.00" | 1.5 kg
Test du GMK NucBox 2 : mini-PC au prix raisonnable et avec une bonne évolutivité Le GMK utilise le même processeur Intel de 8e génération que le MacBook Pro 13 de 2018 pour moins de 500 dollars US au détail. La qualité de construction et les...
Intel Core i5-8259U | Intel Iris Plus Graphics 655 | | 430 g
Apple MacBook Pro 13 2018 Touchbar i5 : Intel Iris Plus Graphics 655, 13.30", 1.4 kg
Critique » Critique complète du portable Apple MacBook Pro 13 2018 (Touch Bar, i5)
Chuwi CoreBook X Pro : Intel Iris Plus Graphics 655, 15.60", 1.8 kg
Autres tests » Chuwi CoreBook X Pro
Chuwi CoreBook X : Intel Iris Plus Graphics 655, 14.00", 1.5 kg
Autres tests » Chuwi CoreBook X
Apple MacBook Pro 13 2018 Touchbar i5 : Intel Iris Plus Graphics 655, 13.30", 1.4 kg
Autres tests » Apple MacBook Pro 13 2018 Touchbar i5
Please share our article, every link counts!
Les autres processeurs de la gamme Coffee Lake