Test du Beelink SER5 Pro 5600H : mini PC avec les vitesses du NUC 11 avec AMD Ryzen
")
À l'instar de Zotac et de sa célèbre sélection de mini-PC ZBox, Beelink cherche à faire de même en lançant tous les quelques mois de nouveaux modèles équipés de processeurs de plus en plus rapides. Le Beelink SER4 a été lancé plus tôt cette année avec le processeur Zen 2 Ryzen 7 4800U, mais maintenant le SER5 est arrivé sur le marché avec un processeur encore plus rapide Zen 3 Ryzen 5 5600H tout en maintenant des prix bien inférieurs à 500 dollars américains
Les concurrents dans cet espace comprennent d'autres mini PC ou HTPC sans graphiques discrets comme le Ace Magician TK11, Geekom MiniAir 11, Zotac ZBox PI336et la plupart des Modèles Intel NUC
Plus de commentaires sur Beelink :
Comparaison avec les concurrents potentiels
Note | Date | Modèle | Poids | Épaisseur | Taille | Résolution | Prix |
|---|---|---|---|---|---|---|---|
v (old) | 10/22 | Beelink SER Pro Ryzen 5 5600H R5 5600H, Vega 7 | 498 g | 42 mm | x | ||
v (old) | 09/22 | Beelink SEi11 Pro i5-11320H, Iris Xe G7 96EUs | 440 g | 40 mm | x | ||
v (old) | 01/22 | Beelink GTR5 R9 5900HX, Vega 8 | 686 g | 39 mm | x | ||
v (old) | 04/21 | Intel NUC11TNKi5 i5-1135G7, Iris Xe G7 80EUs | 504 g | 37 mm | x | ||
v (old) | 02/20 | Intel NUC10i7FNH i7-10710U, UHD Graphics 620 | 697 g | 51 mm | 0.00" | 0x0 | |
v (old) | 07/22 | Zotac ZBOX PI336 pico Celeron N6211, UHD Graphics (Elkhart Lake 16 EU) | 293 g | 20.7 mm | x |
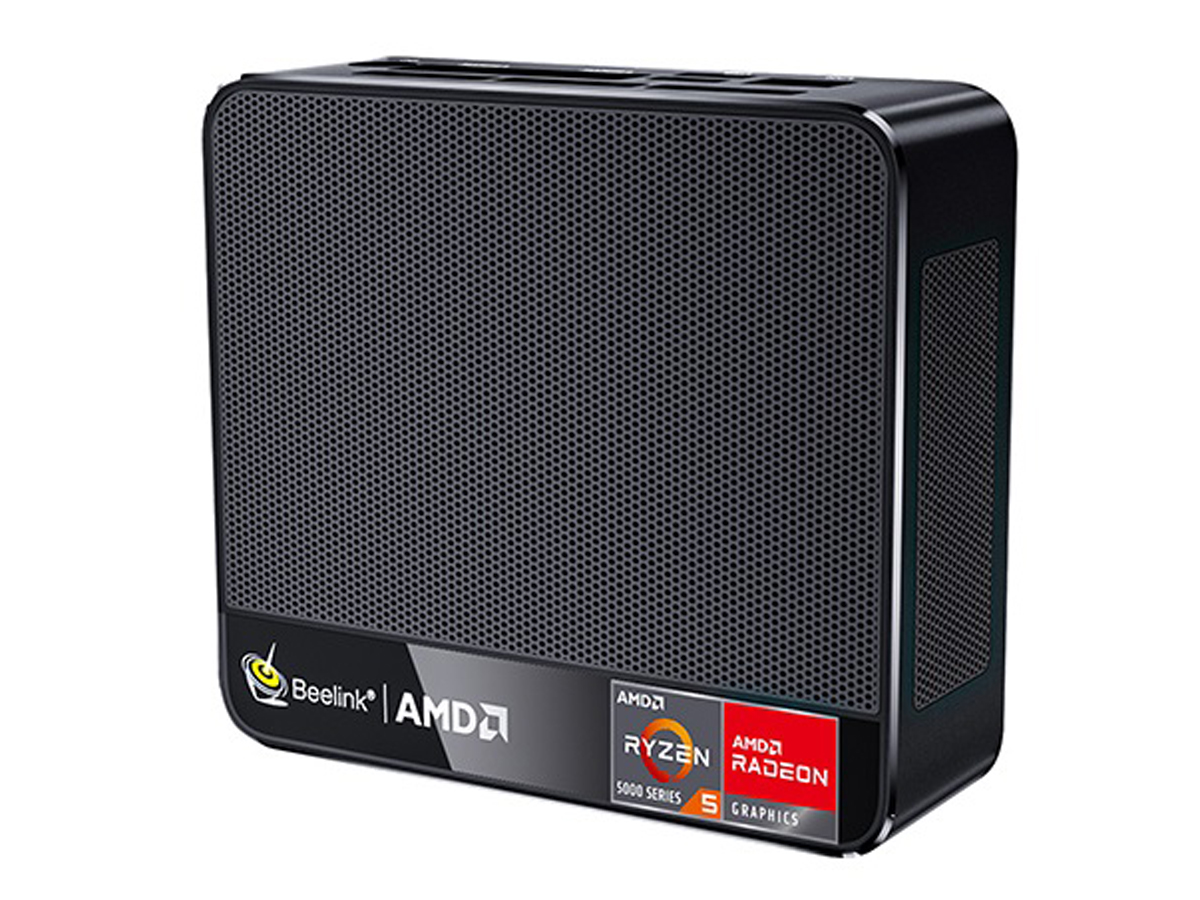
Cas
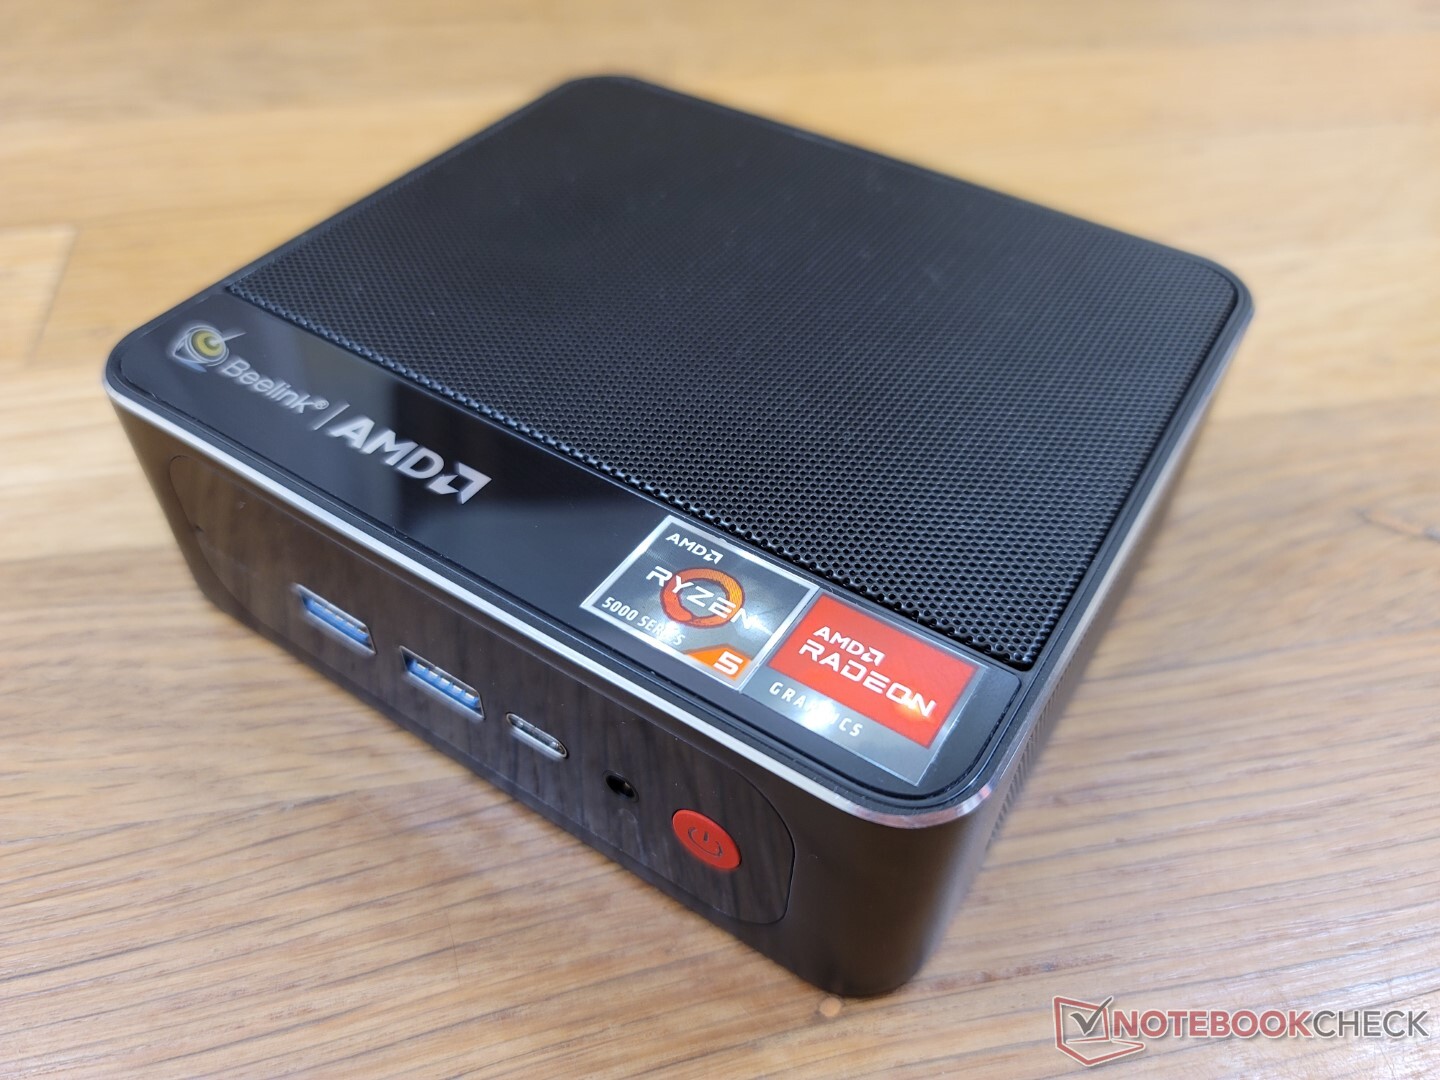
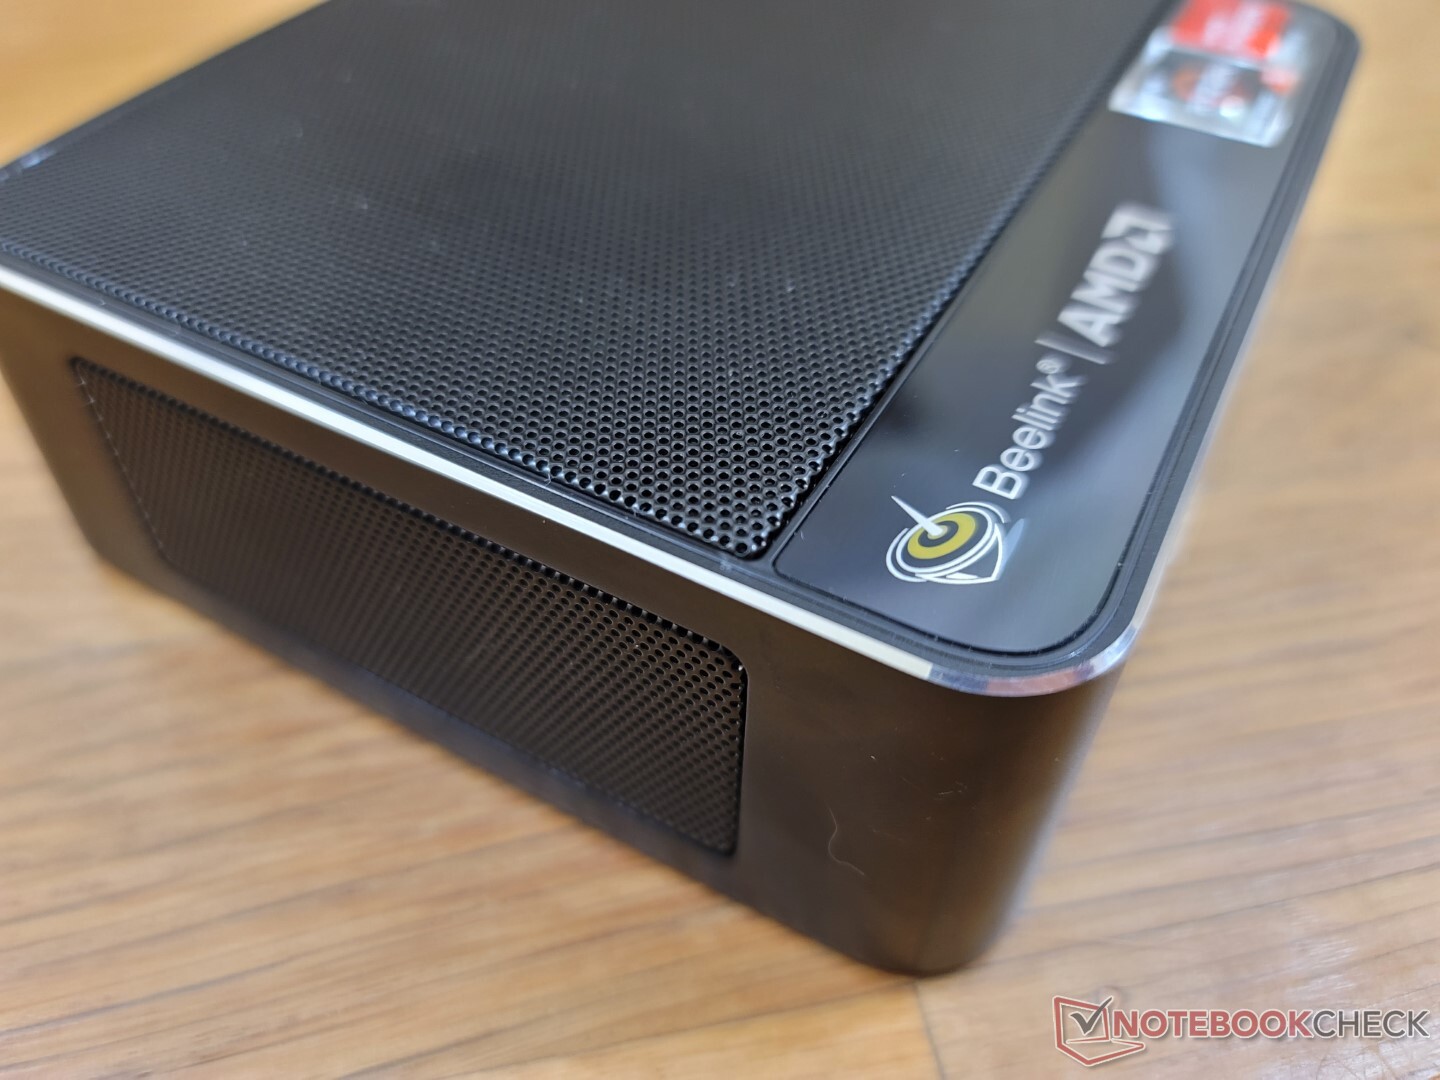
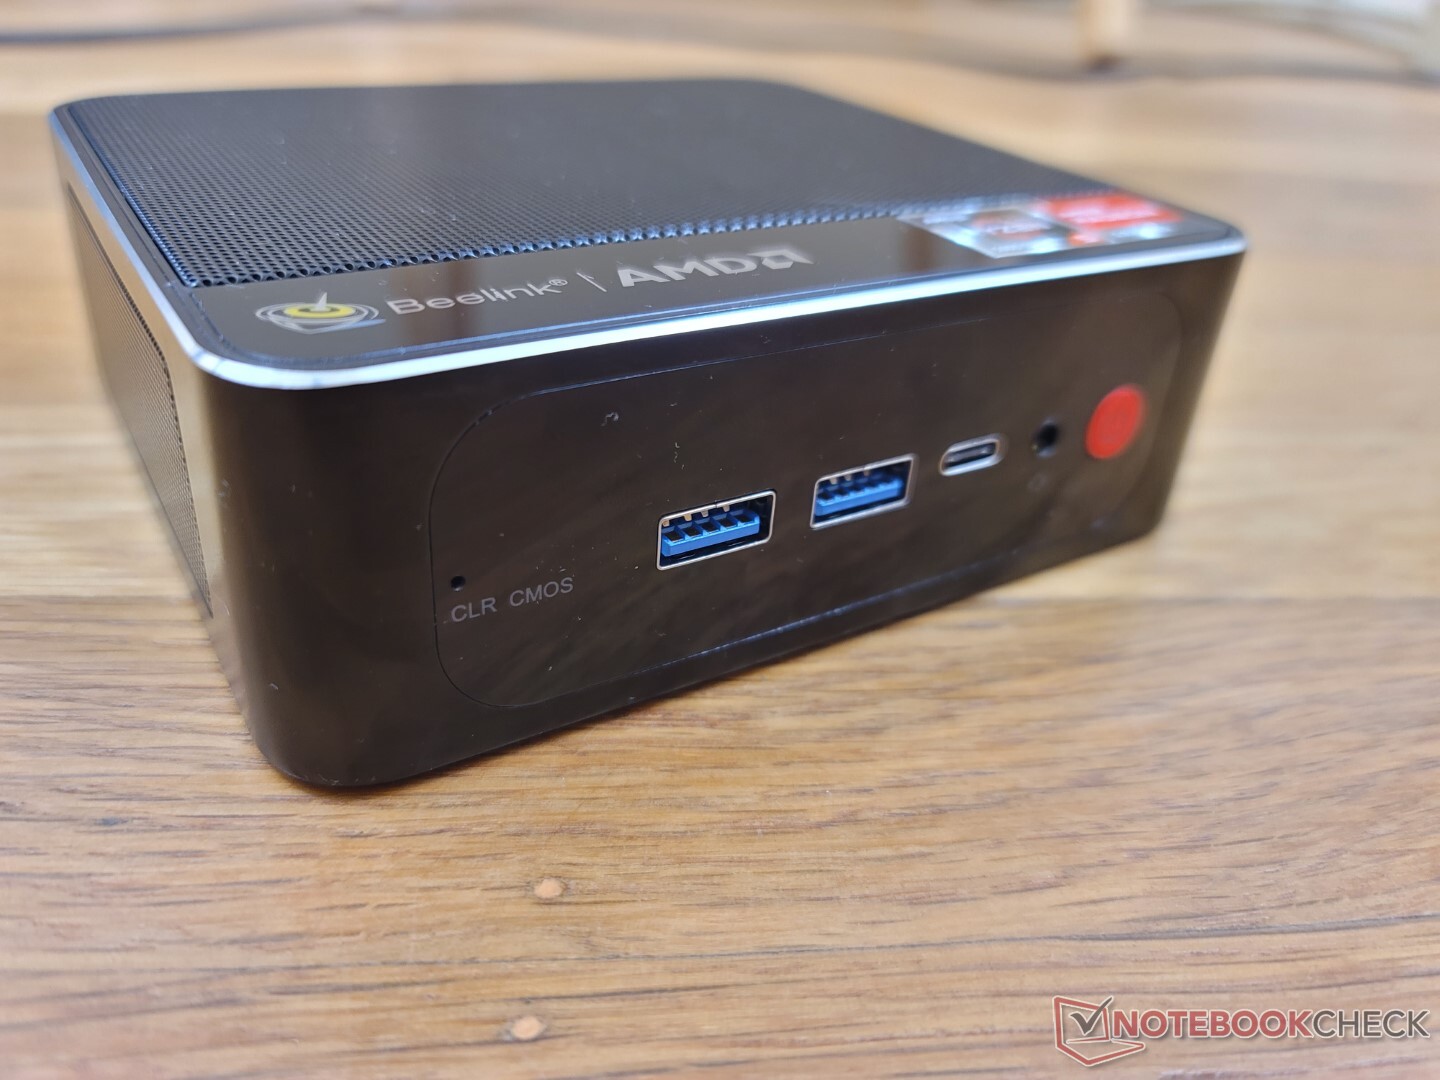
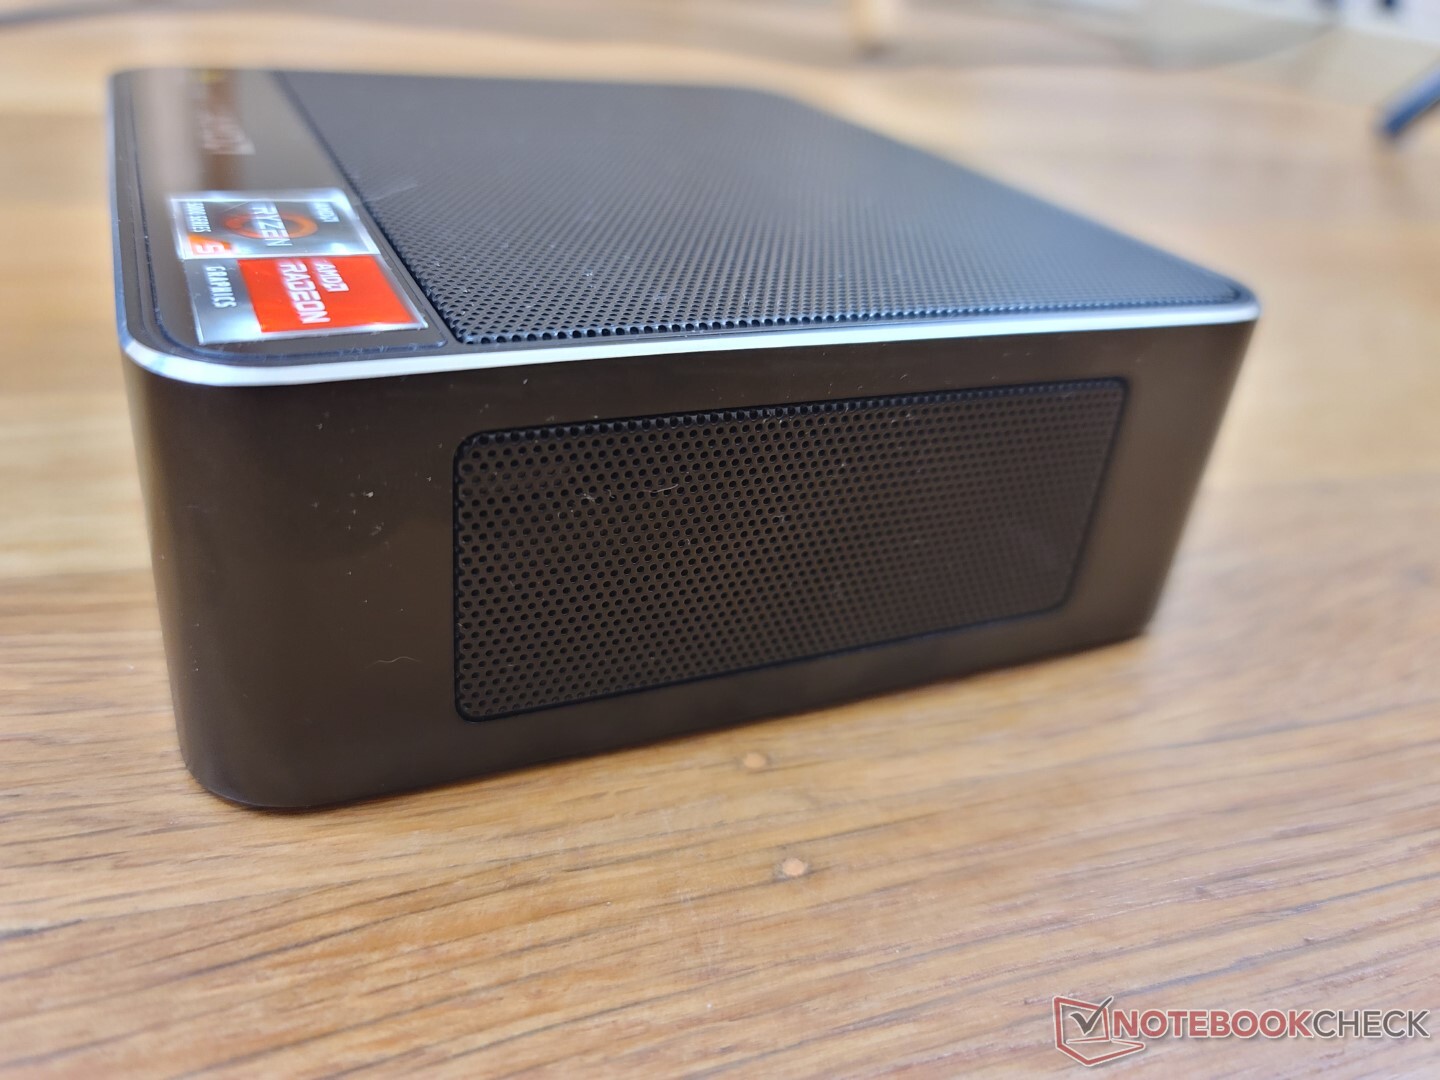
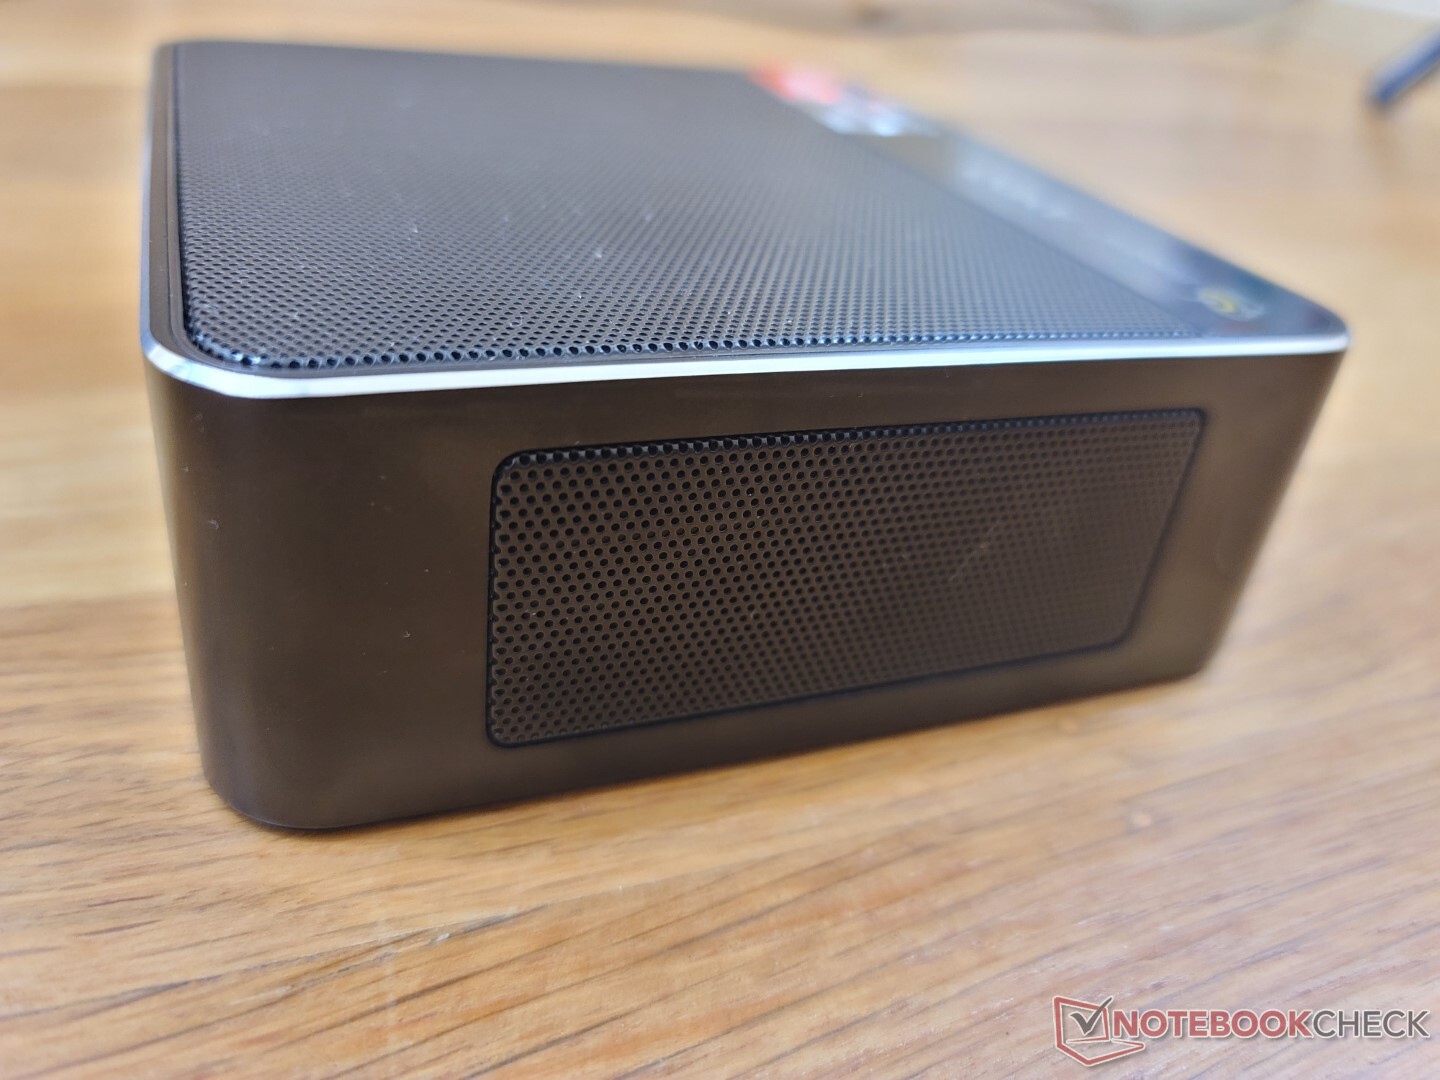
Les SER4 et SER5 utilisent tous deux le même squelette de châssis, mais avec des marques et des couleurs superficielles légèrement différentes. Sur le SER5, les grilles de ventilation sur le côté sont noires au lieu d'être rouges
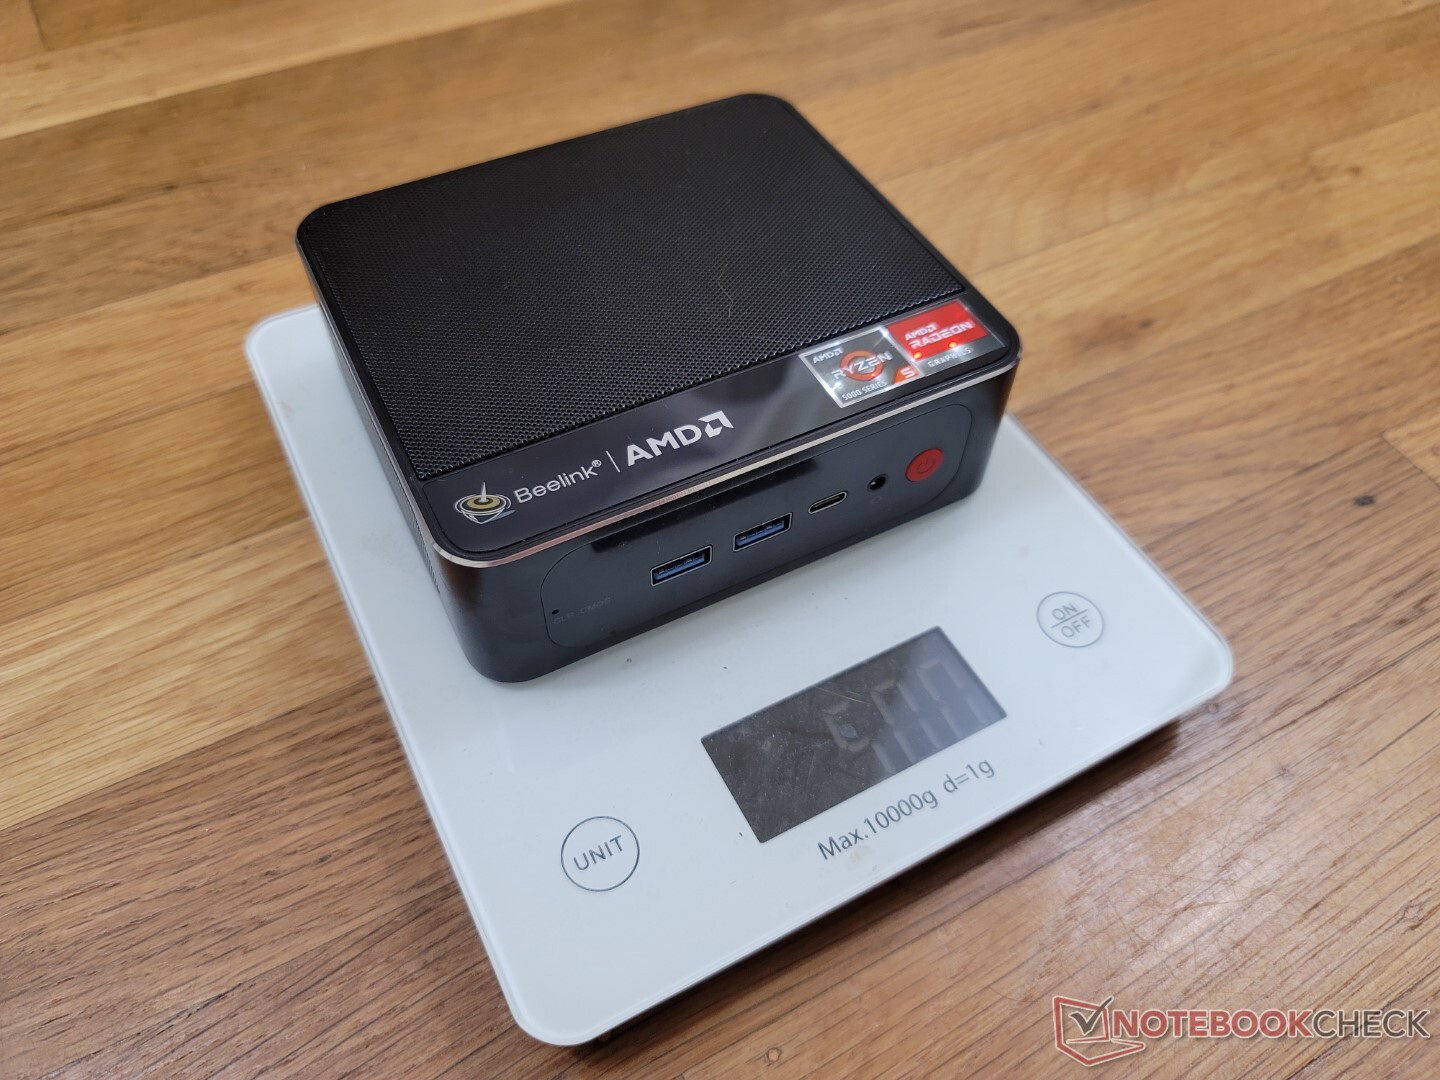
En termes de taille, le SER5 est juste un peu plus épais que le Intel NUC 11TNK. Il est cependant tout aussi lourd, avec environ un demi-kilogramme.
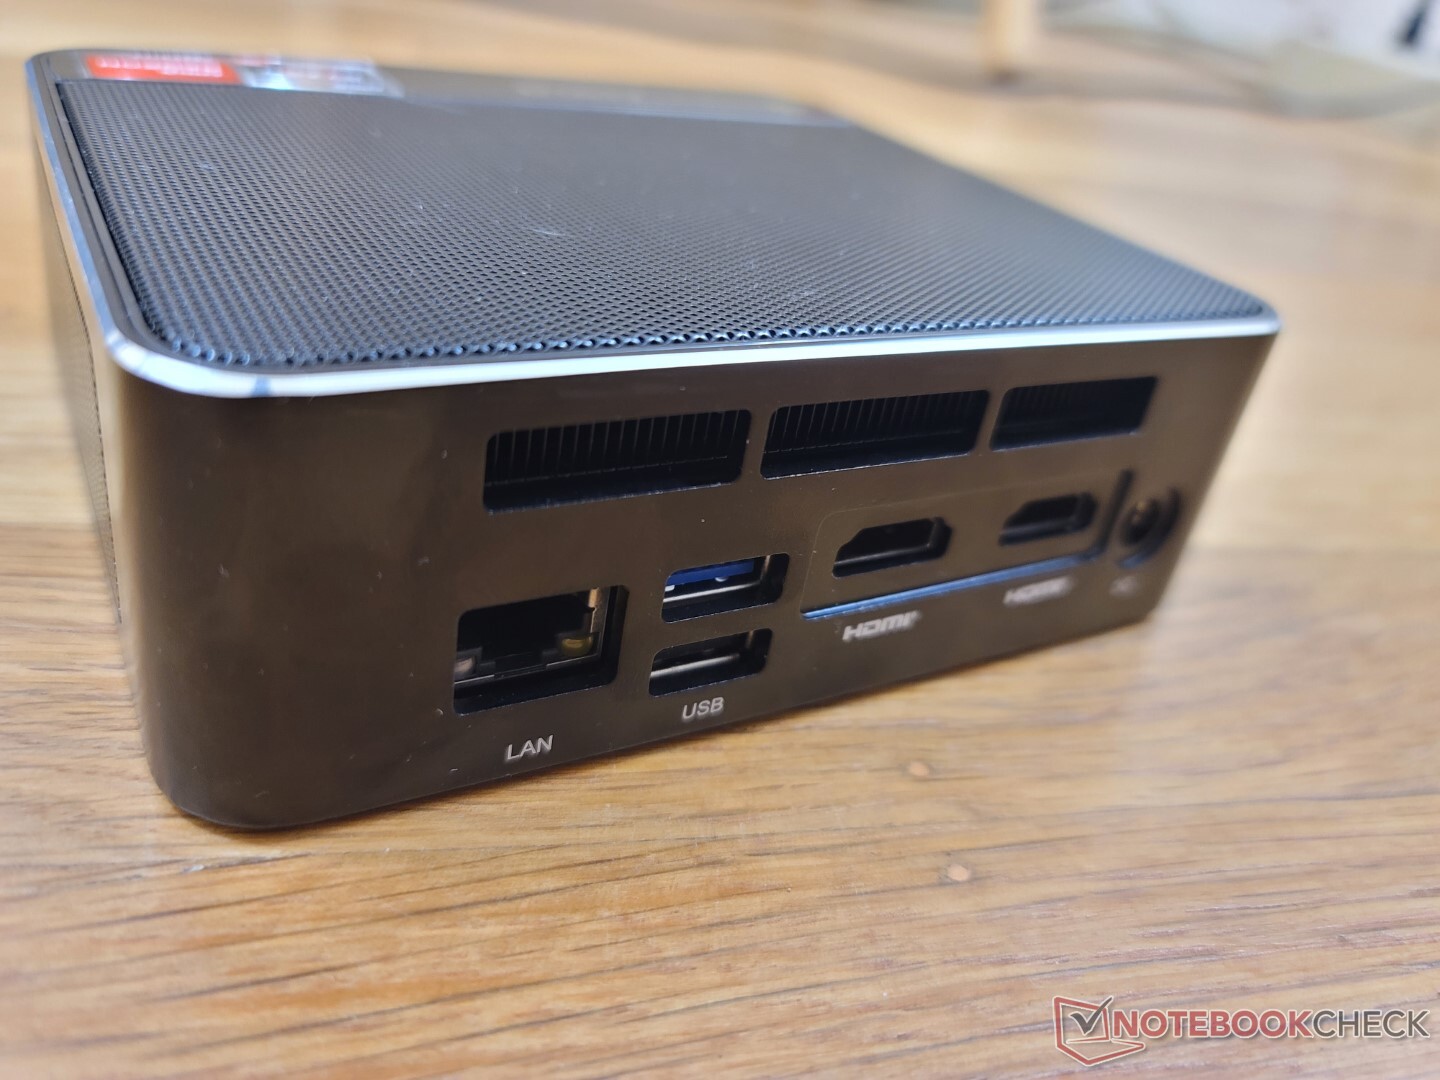
Connectivité
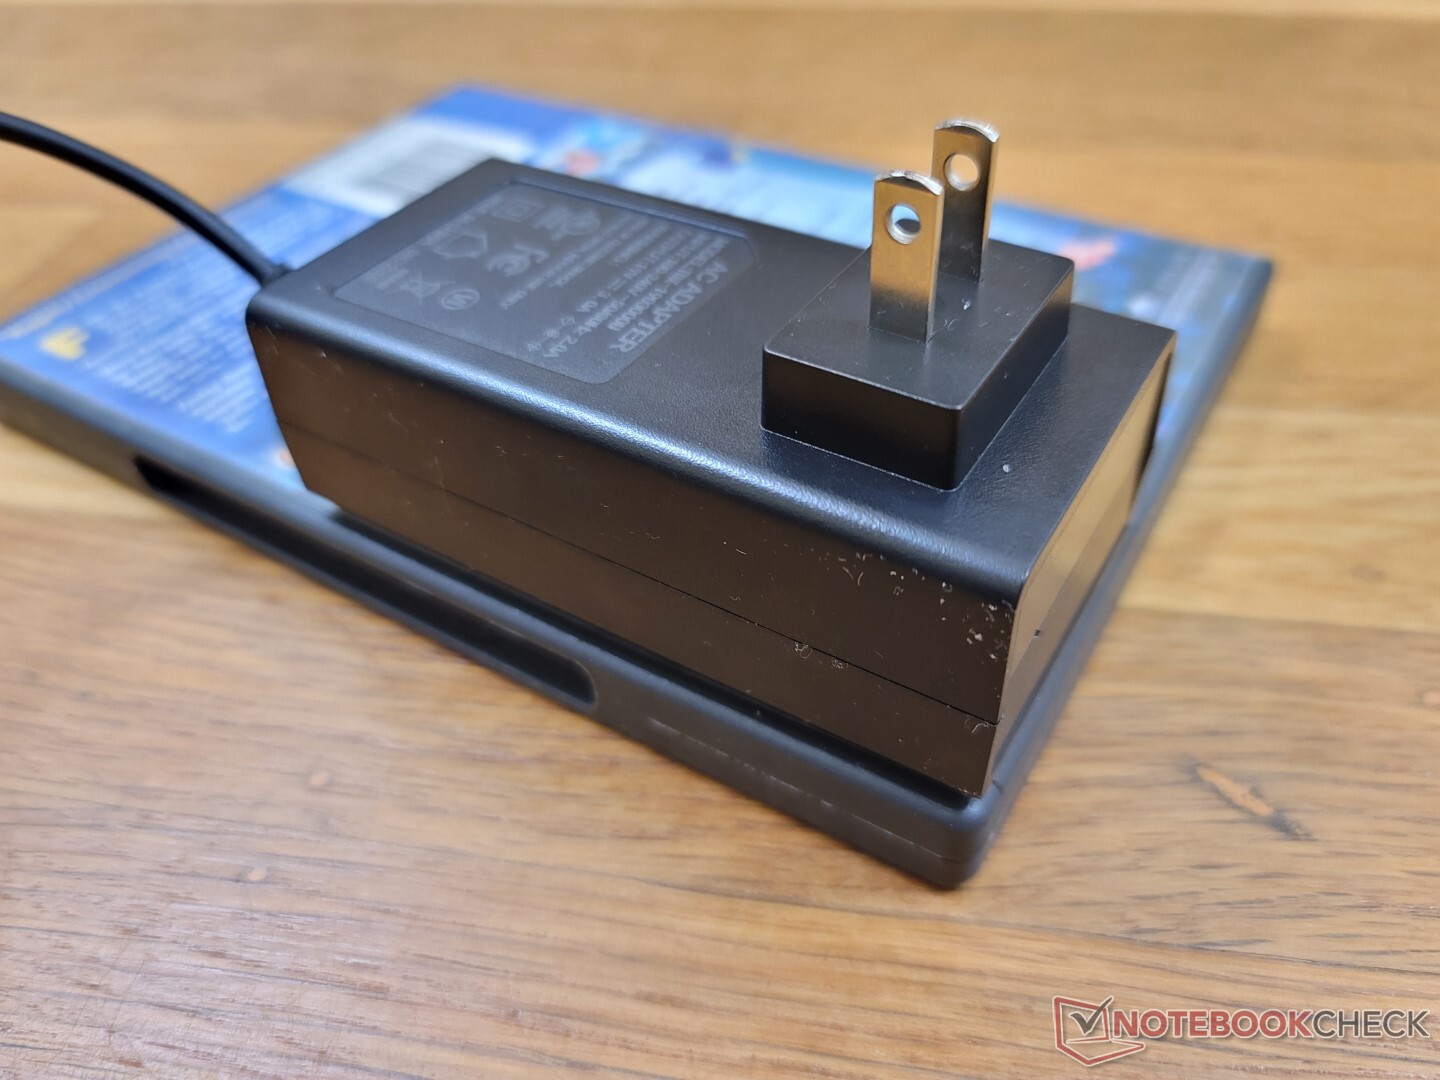
Les options de port sont les mêmes que sur le SER4. Il est décevant que Beelink ne soit toujours pas passé aux adaptateurs secteur USB-C, car le SER5 utilise un adaptateur secteur propriétaire à la place. L'unique port USB-C en façade prend en charge DisplayPort 1.4 mais pas PD-in.
Communication
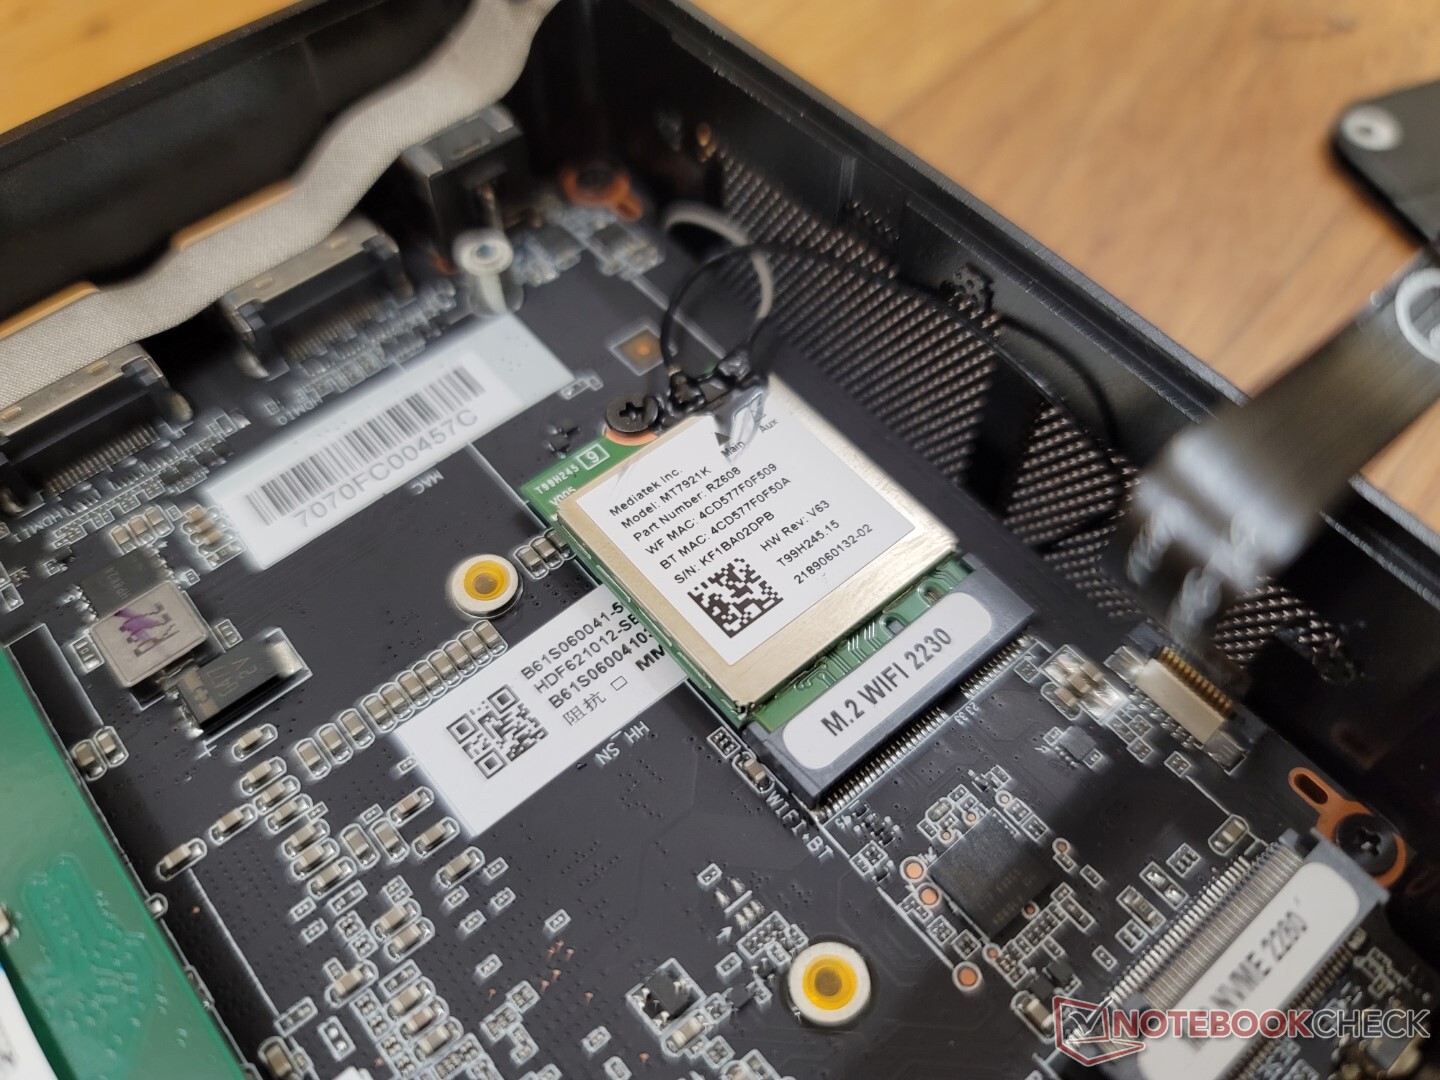
Un MediaTek RZ608 est fourni en standard pour la prise en charge du Wi-Fi 6E, tout comme sur le Beelink SEi11 Pro. Cependant, les performances sont encore insuffisantes par rapport à la série commune Intel AX200/210 comme le montrent les graphiques ci-dessous.
| Networking | |
| iperf3 transmit AX12 | |
| Intel NUC11TNKi5 | |
| Beelink GTR5 | |
| iperf3 receive AX12 | |
| Intel NUC11TNKi5 | |
| Beelink GTR5 | |
| iperf3 receive AXE11000 6GHz | |
| Zotac ZBOX PI336 pico | |
| Beelink SER Pro Ryzen 5 5600H | |
| Beelink SEi11 Pro | |
| iperf3 transmit AXE11000 6GHz | |
| Zotac ZBOX PI336 pico | |
| Beelink SER Pro Ryzen 5 5600H | |
| Beelink SEi11 Pro | |
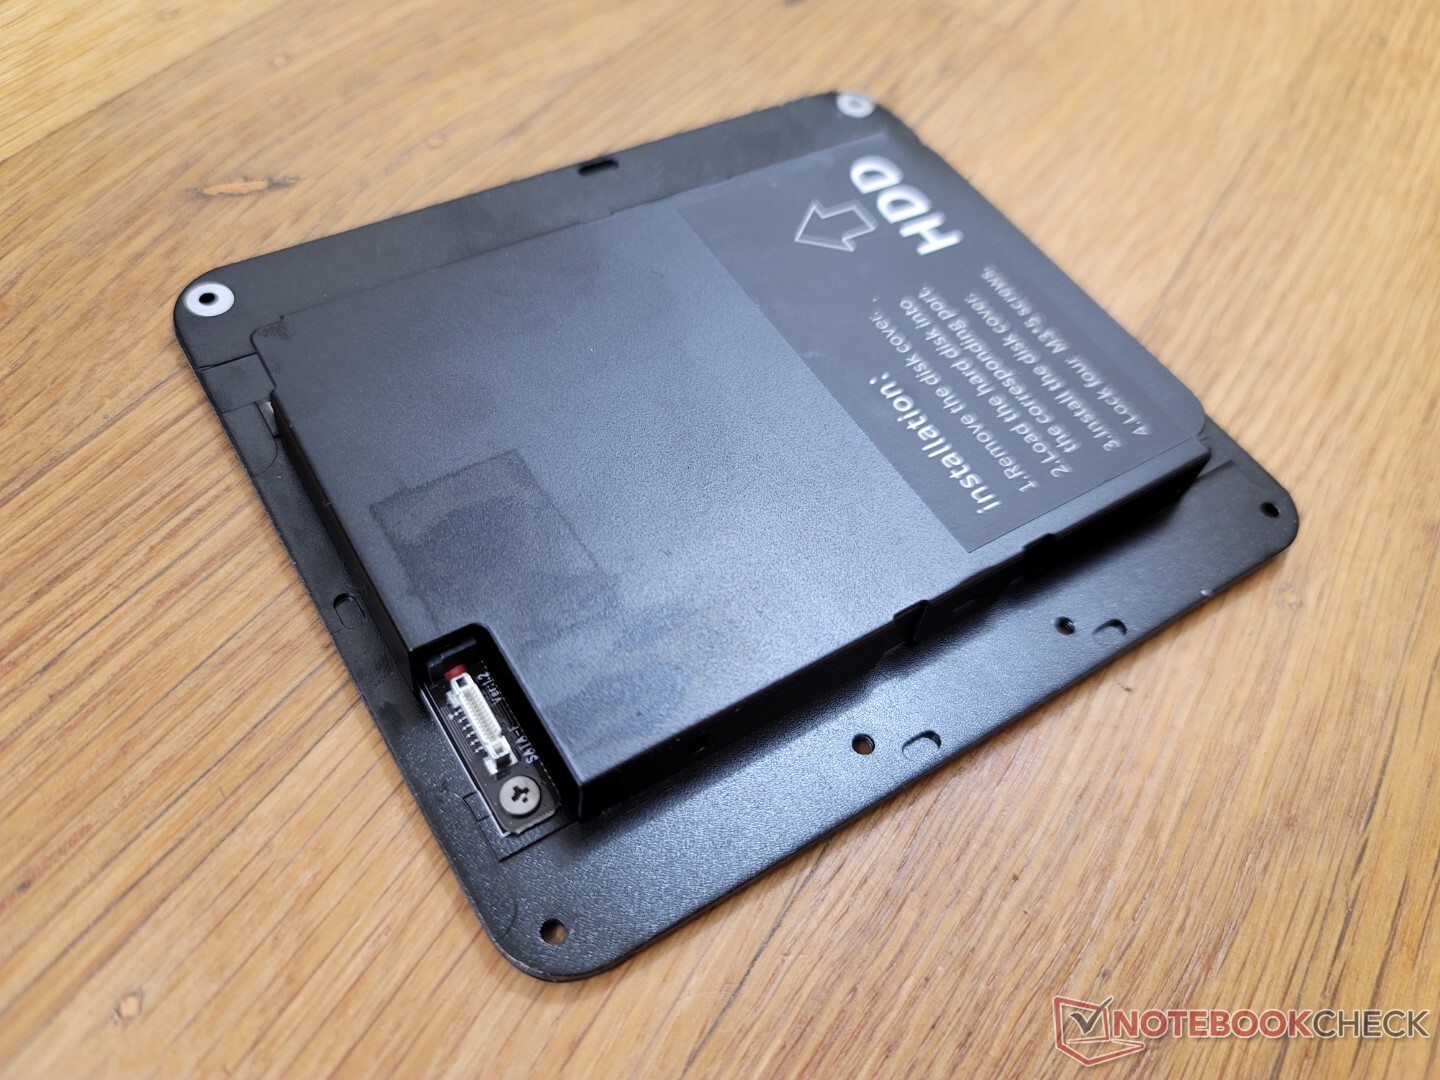
Maintenance
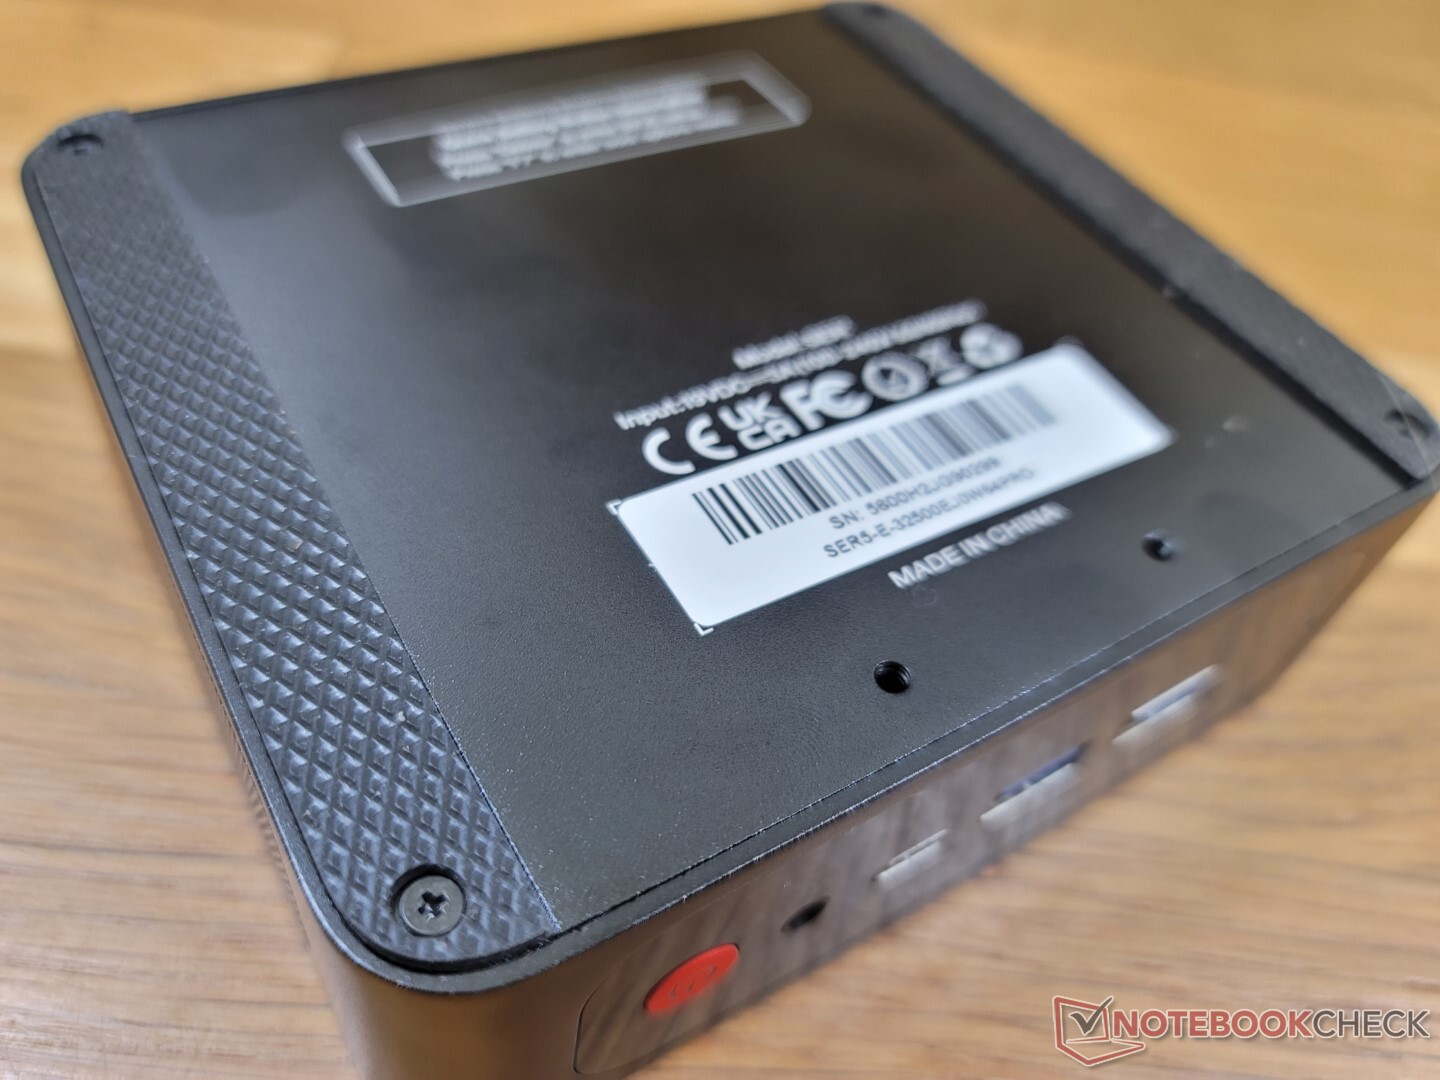
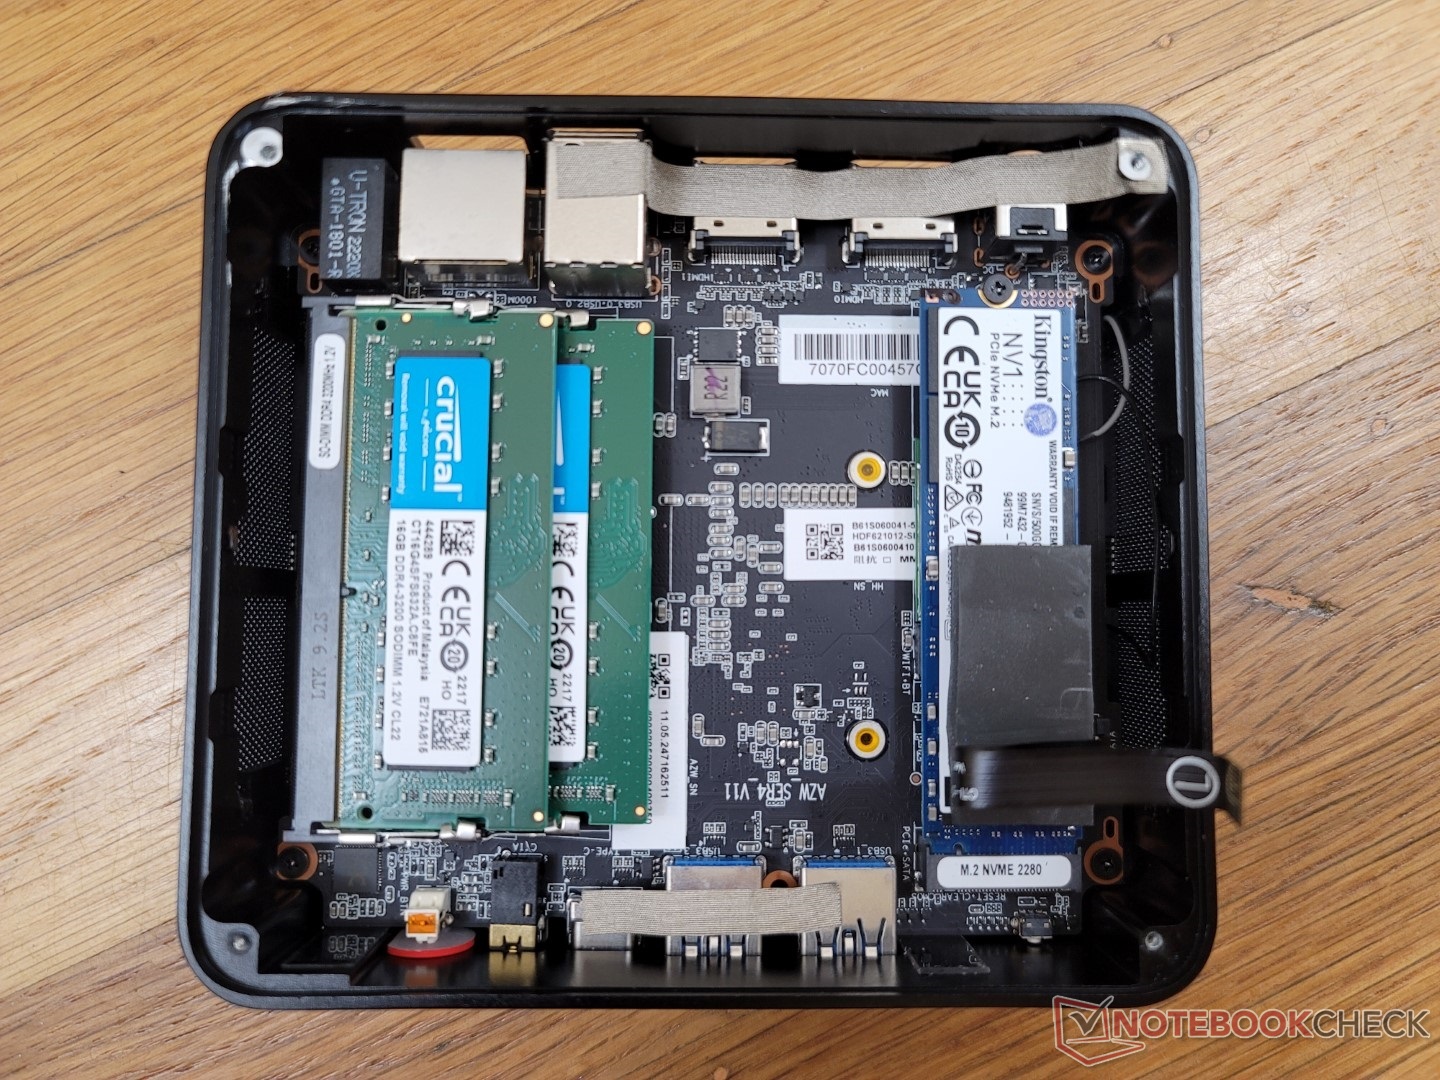
Le panneau inférieur est fixé par quatre vis Philips. Ces vis sont beaucoup plus petites que les vis à torsion manuelle sur un Intel NUC et nécessiteront un tournevis pour les retirer. Gardez à l'esprit que ces vis sont assez molles et qu'elles peuvent être facilement arrachées si vous ne faites pas attention.
Accessoires et garantie
La boîte de détail comprend un support de montage VESA amovible, des vis supplémentaires, un manuel d'utilisation, deux câbles HDMI et l'adaptateur secteur.
La garantie standard limitée d'un an du fabricant s'applique si l'appareil est acheté aux États-Unis.
Performance
Conditions d'essai
Nous avons réglé notre appareil en mode Performance via Windows avant d'exécuter les benchmarks ci-dessous.
Processeur
La performance multithread est environ 15 % plus lente que celle du PC moyen de notre base de données équipé du même Ryzen 5 5600H DE NOTRE BASE DE DONNÉES. Malgré cela, les performances globales sont toujours beaucoup plus rapides que le commun Core i7-1165G7 que l'on trouve sur de nombreux Ultrabooks et Intel NUCs.
Cinebench R15 Multi Loop
Cinebench R23: Multi Core | Single Core
Cinebench R15: CPU Multi 64Bit | CPU Single 64Bit
Blender: v2.79 BMW27 CPU
7-Zip 18.03: 7z b 4 | 7z b 4 -mmt1
Geekbench 5.5: Multi-Core | Single-Core
HWBOT x265 Benchmark v2.2: 4k Preset
LibreOffice : 20 Documents To PDF
R Benchmark 2.5: Overall mean
| Cinebench R20 / CPU (Multi Core) | |
| HP Envy 16 h0112nr | |
| Schenker XMG Apex 15 NH57E PS | |
| Honor MagicBook 14 2022 | |
| Beelink GTR5 | |
| Moyenne AMD Ryzen 5 5600H (3074 - 4059, n=16) | |
| Beelink SER4 | |
| Beelink SER Pro Ryzen 5 5600H | |
| Intel NUC10i7FNH | |
| Beelink SEi11 Pro | |
| Framework Laptop 13.5 | |
| Intel NUC11TNKi5 | |
| Zotac ZBOX PI336 pico | |
| Cinebench R20 / CPU (Single Core) | |
| HP Envy 16 h0112nr | |
| Honor MagicBook 14 2022 | |
| Framework Laptop 13.5 | |
| Beelink GTR5 | |
| Beelink SEi11 Pro | |
| Schenker XMG Apex 15 NH57E PS | |
| Moyenne AMD Ryzen 5 5600H (527 - 538, n=15) | |
| Beelink SER Pro Ryzen 5 5600H | |
| Intel NUC11TNKi5 | |
| Beelink SER4 | |
| Intel NUC10i7FNH | |
| Zotac ZBOX PI336 pico | |
| Cinebench R23 / Multi Core | |
| HP Envy 16 h0112nr | |
| Schenker XMG Apex 15 NH57E PS | |
| Honor MagicBook 14 2022 | |
| Beelink GTR5 | |
| Moyenne AMD Ryzen 5 5600H (7945 - 10416, n=13) | |
| Beelink SER4 | |
| Beelink SER Pro Ryzen 5 5600H | |
| Beelink SEi11 Pro | |
| Framework Laptop 13.5 | |
| Intel NUC11TNKi5 | |
| Zotac ZBOX PI336 pico | |
| Cinebench R23 / Single Core | |
| HP Envy 16 h0112nr | |
| Honor MagicBook 14 2022 | |
| Framework Laptop 13.5 | |
| Beelink GTR5 | |
| Beelink SEi11 Pro | |
| Schenker XMG Apex 15 NH57E PS | |
| Intel NUC11TNKi5 | |
| Beelink SER Pro Ryzen 5 5600H | |
| Moyenne AMD Ryzen 5 5600H (1316 - 1381, n=13) | |
| Beelink SER4 | |
| Zotac ZBOX PI336 pico | |
| Cinebench R15 / CPU Single 64Bit | |
| HP Envy 16 h0112nr | |
| Beelink GTR5 | |
| Honor MagicBook 14 2022 | |
| Schenker XMG Apex 15 NH57E PS | |
| Framework Laptop 13.5 | |
| Moyenne AMD Ryzen 5 5600H (218 - 225, n=14) | |
| Beelink SER Pro Ryzen 5 5600H | |
| Beelink SEi11 Pro | |
| Intel NUC11TNKi5 | |
| Intel NUC10i7FNH | |
| Beelink SER4 | |
| Zotac ZBOX PI336 pico | |
| Geekbench 5.5 / Multi-Core | |
| HP Envy 16 h0112nr | |
| Honor MagicBook 14 2022 | |
| Schenker XMG Apex 15 NH57E PS | |
| Beelink GTR5 | |
| Moyenne AMD Ryzen 5 5600H (4990 - 7253, n=14) | |
| Beelink SER4 | |
| Beelink SER Pro Ryzen 5 5600H | |
| Intel NUC10i7FNH | |
| Beelink SEi11 Pro | |
| Intel NUC11TNKi5 | |
| Zotac ZBOX PI336 pico | |
| Geekbench 5.5 / Single-Core | |
| HP Envy 16 h0112nr | |
| Honor MagicBook 14 2022 | |
| Beelink GTR5 | |
| Beelink SEi11 Pro | |
| Schenker XMG Apex 15 NH57E PS | |
| Beelink SER Pro Ryzen 5 5600H | |
| Moyenne AMD Ryzen 5 5600H (1365 - 1445, n=14) | |
| Intel NUC11TNKi5 | |
| Intel NUC10i7FNH | |
| Beelink SER4 | |
| Zotac ZBOX PI336 pico | |
| HWBOT x265 Benchmark v2.2 / 4k Preset | |
| Schenker XMG Apex 15 NH57E PS | |
| HP Envy 16 h0112nr | |
| Beelink GTR5 | |
| Honor MagicBook 14 2022 | |
| Moyenne AMD Ryzen 5 5600H (9.92 - 13.3, n=14) | |
| Beelink SER Pro Ryzen 5 5600H | |
| Beelink SER4 | |
| Intel NUC10i7FNH | |
| Beelink SEi11 Pro | |
| Framework Laptop 13.5 | |
| Intel NUC11TNKi5 | |
| Zotac ZBOX PI336 pico | |
| LibreOffice / 20 Documents To PDF | |
| Zotac ZBOX PI336 pico | |
| Beelink SER4 | |
| Moyenne AMD Ryzen 5 5600H (52.2 - 81.5, n=14) | |
| Schenker XMG Apex 15 NH57E PS | |
| Beelink SER Pro Ryzen 5 5600H | |
| Intel NUC11TNKi5 | |
| Beelink GTR5 | |
| Beelink SEi11 Pro | |
| HP Envy 16 h0112nr | |
| Framework Laptop 13.5 | |
| Honor MagicBook 14 2022 | |
| R Benchmark 2.5 / Overall mean | |
| Zotac ZBOX PI336 pico | |
| Intel NUC10i7FNH | |
| Intel NUC11TNKi5 | |
| Beelink SEi11 Pro | |
| Beelink SER4 | |
| Framework Laptop 13.5 | |
| Moyenne AMD Ryzen 5 5600H (0.526 - 0.596, n=14) | |
| Beelink SER Pro Ryzen 5 5600H | |
| Schenker XMG Apex 15 NH57E PS | |
| Honor MagicBook 14 2022 | |
| Beelink GTR5 | |
| HP Envy 16 h0112nr | |
* ... Moindre est la valeur, meilleures sont les performances
AIDA64: FP32 Ray-Trace | FPU Julia | CPU SHA3 | CPU Queen | FPU SinJulia | FPU Mandel | CPU AES | CPU ZLib | FP64 Ray-Trace | CPU PhotoWorxx
| Performance rating | |
| Beelink GTR5 | |
| Beelink SER Pro Ryzen 5 5600H | |
| Beelink SEi11 Pro | |
| Intel NUC11TNKi5 | |
| Zotac ZBOX PI336 pico | |
| AIDA64 / FP32 Ray-Trace | |
| Beelink GTR5 | |
| Beelink SER Pro Ryzen 5 5600H | |
| Beelink SEi11 Pro | |
| Intel NUC11TNKi5 | |
| Zotac ZBOX PI336 pico | |
| AIDA64 / FPU Julia | |
| Beelink GTR5 | |
| Beelink SER Pro Ryzen 5 5600H | |
| Beelink SEi11 Pro | |
| Intel NUC11TNKi5 | |
| Zotac ZBOX PI336 pico | |
| AIDA64 / CPU SHA3 | |
| Beelink GTR5 | |
| Beelink SER Pro Ryzen 5 5600H | |
| Beelink SEi11 Pro | |
| Intel NUC11TNKi5 | |
| Zotac ZBOX PI336 pico | |
| AIDA64 / CPU Queen | |
| Beelink GTR5 | |
| Beelink SER Pro Ryzen 5 5600H | |
| Beelink SEi11 Pro | |
| Intel NUC11TNKi5 | |
| Zotac ZBOX PI336 pico | |
| AIDA64 / FPU SinJulia | |
| Beelink GTR5 | |
| Beelink SER Pro Ryzen 5 5600H | |
| Beelink SEi11 Pro | |
| Intel NUC11TNKi5 | |
| Zotac ZBOX PI336 pico | |
| AIDA64 / FPU Mandel | |
| Beelink GTR5 | |
| Beelink SER Pro Ryzen 5 5600H | |
| Beelink SEi11 Pro | |
| Intel NUC11TNKi5 | |
| Zotac ZBOX PI336 pico | |
| AIDA64 / CPU AES | |
| Beelink GTR5 | |
| Beelink SER Pro Ryzen 5 5600H | |
| Beelink SEi11 Pro | |
| Intel NUC11TNKi5 | |
| Zotac ZBOX PI336 pico | |
| AIDA64 / CPU ZLib | |
| Beelink GTR5 | |
| Beelink SER Pro Ryzen 5 5600H | |
| Intel NUC11TNKi5 | |
| Beelink SEi11 Pro | |
| Zotac ZBOX PI336 pico | |
| AIDA64 / FP64 Ray-Trace | |
| Beelink GTR5 | |
| Beelink SER Pro Ryzen 5 5600H | |
| Beelink SEi11 Pro | |
| Intel NUC11TNKi5 | |
| Zotac ZBOX PI336 pico | |
| AIDA64 / CPU PhotoWorxx | |
| Beelink SEi11 Pro | |
| Beelink GTR5 | |
| Beelink SER Pro Ryzen 5 5600H | |
| Intel NUC11TNKi5 | |
| Zotac ZBOX PI336 pico | |
Performance du système
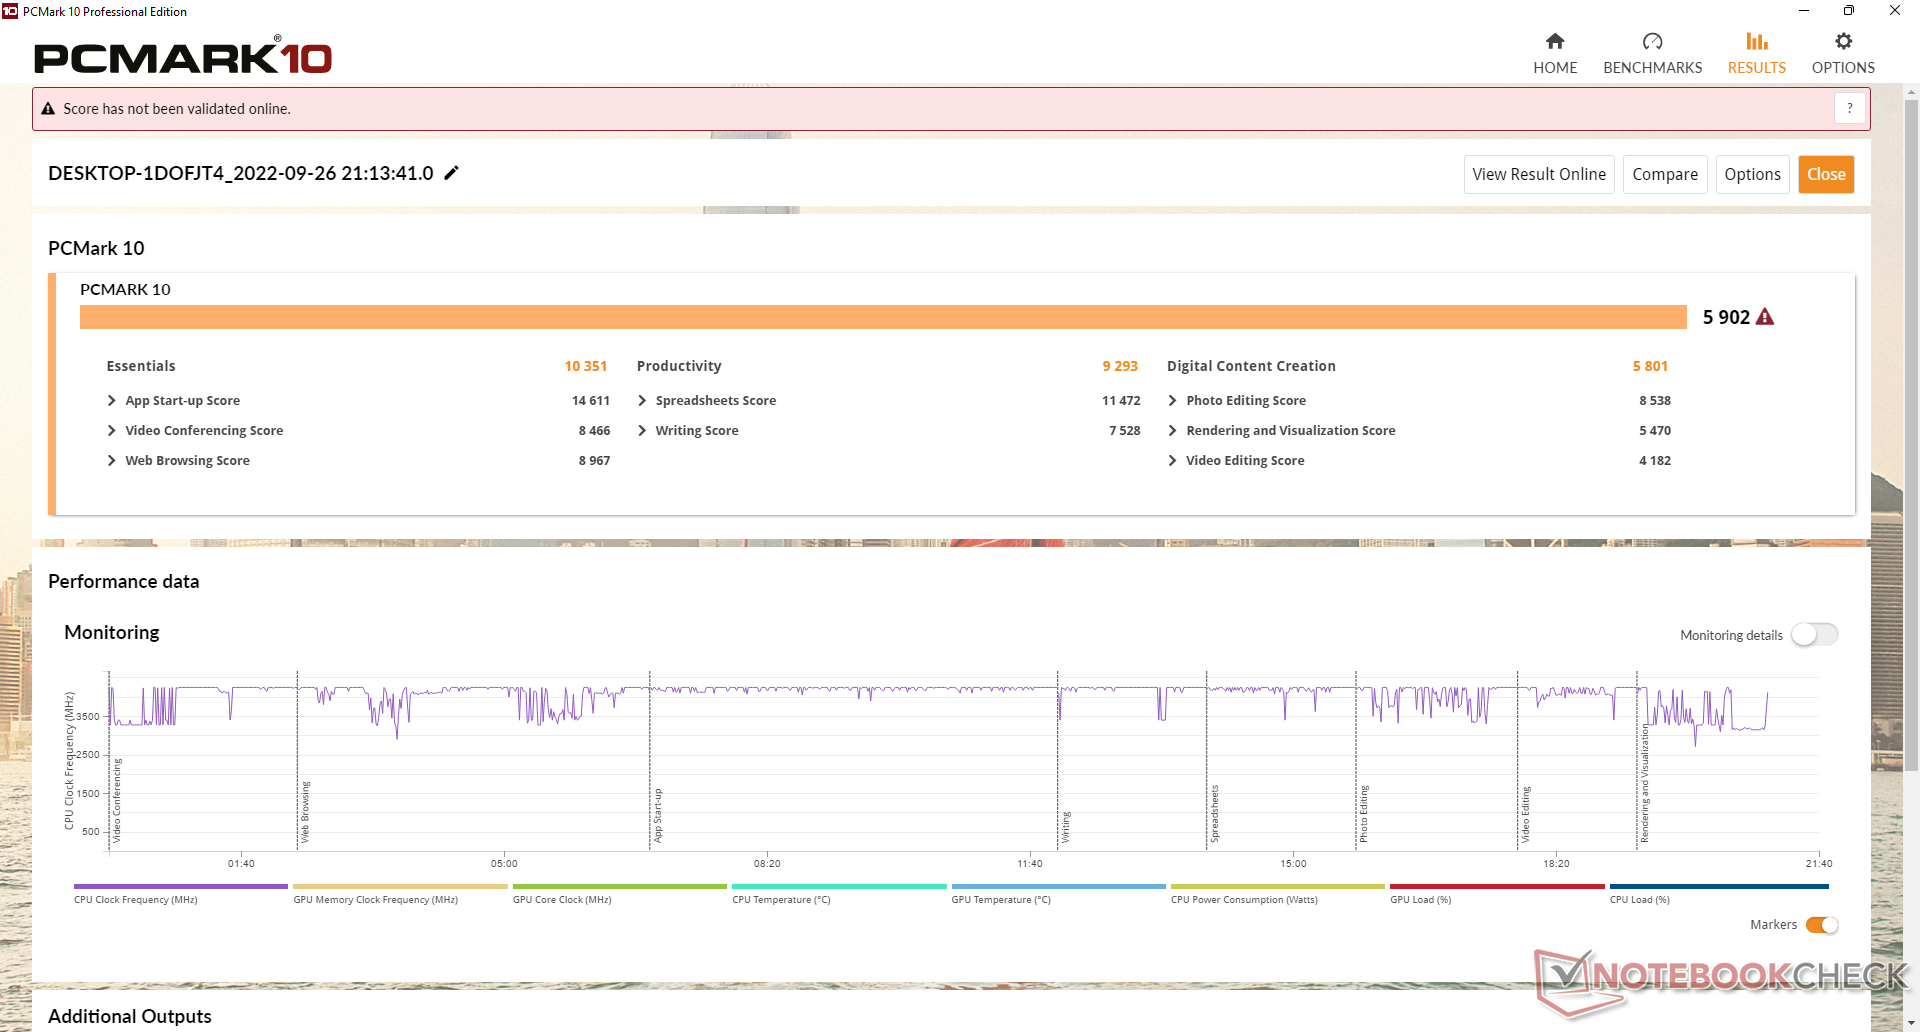
Les résultats de PCMark 10 sont conformes à ce que l'on attend d'eux lorsqu'ils sont comparés à d'autres ordinateurs portables ou mini PC Ryzen 5 5600H, sauf dans le subtest de création de contenu numérique où les performances du GPU sont les plus importantes. Cela s'explique par le fait que de nombreux ordinateurs portables équipés de ce même processeur sont généralement livrés avec des cartes graphiques discrètes plus rapides.
CrossMark: Overall | Productivity | Creativity | Responsiveness
| PCMark 10 / Score | |
| Beelink GTR5 | |
| Moyenne AMD Ryzen 5 5600H (5309 - 7091, n=14) | |
| Beelink SER Pro Ryzen 5 5600H | |
| Beelink SEi11 Pro | |
| Intel NUC11TNKi5 | |
| Intel NUC10i7FNH | |
| PCMark 10 / Essentials | |
| Beelink GTR5 | |
| Beelink SER Pro Ryzen 5 5600H | |
| Beelink SEi11 Pro | |
| Moyenne AMD Ryzen 5 5600H (9326 - 10506, n=14) | |
| Intel NUC10i7FNH | |
| Intel NUC11TNKi5 | |
| PCMark 10 / Productivity | |
| Beelink GTR5 | |
| Beelink SER Pro Ryzen 5 5600H | |
| Moyenne AMD Ryzen 5 5600H (7975 - 9642, n=14) | |
| Beelink SEi11 Pro | |
| Intel NUC10i7FNH | |
| Intel NUC11TNKi5 | |
| PCMark 10 / Digital Content Creation | |
| Moyenne AMD Ryzen 5 5600H (4921 - 9907, n=14) | |
| Beelink GTR5 | |
| Beelink SER Pro Ryzen 5 5600H | |
| Beelink SEi11 Pro | |
| Intel NUC11TNKi5 | |
| Intel NUC10i7FNH | |
| CrossMark / Overall | |
| Beelink GTR5 | |
| Beelink SEi11 Pro | |
| Beelink SER Pro Ryzen 5 5600H | |
| Moyenne AMD Ryzen 5 5600H (1157 - 1353, n=7) | |
| CrossMark / Productivity | |
| Beelink GTR5 | |
| Beelink SEi11 Pro | |
| Beelink SER Pro Ryzen 5 5600H | |
| Moyenne AMD Ryzen 5 5600H (1217 - 1384, n=7) | |
| CrossMark / Creativity | |
| Beelink GTR5 | |
| Moyenne AMD Ryzen 5 5600H (1184 - 1377, n=7) | |
| Beelink SER Pro Ryzen 5 5600H | |
| Beelink SEi11 Pro | |
| CrossMark / Responsiveness | |
| Beelink SEi11 Pro | |
| Beelink GTR5 | |
| Beelink SER Pro Ryzen 5 5600H | |
| Moyenne AMD Ryzen 5 5600H (926 - 1225, n=7) | |
| PCMark 10 Score | 5902 points | |
Aide | ||
| AIDA64 / Memory Copy | |
| Beelink GTR5 | |
| Beelink SER Pro Ryzen 5 5600H | |
| Beelink SEi11 Pro | |
| Moyenne AMD Ryzen 5 5600H (20549 - 42141, n=14) | |
| Intel NUC11TNKi5 | |
| Zotac ZBOX PI336 pico | |
| AIDA64 / Memory Read | |
| Beelink SER Pro Ryzen 5 5600H | |
| Beelink GTR5 | |
| Beelink SEi11 Pro | |
| Moyenne AMD Ryzen 5 5600H (22917 - 47595, n=14) | |
| Intel NUC11TNKi5 | |
| Zotac ZBOX PI336 pico | |
| AIDA64 / Memory Write | |
| Beelink SEi11 Pro | |
| Beelink SER Pro Ryzen 5 5600H | |
| Beelink GTR5 | |
| Moyenne AMD Ryzen 5 5600H (20226 - 44872, n=14) | |
| Intel NUC11TNKi5 | |
| Zotac ZBOX PI336 pico | |
| AIDA64 / Memory Latency | |
| Intel NUC11TNKi5 | |
| Beelink SEi11 Pro | |
| Beelink SER Pro Ryzen 5 5600H | |
| Beelink GTR5 | |
| Moyenne AMD Ryzen 5 5600H (75 - 89.1, n=14) | |
| Zotac ZBOX PI336 pico | |
* ... Moindre est la valeur, meilleures sont les performances
Latence DPC
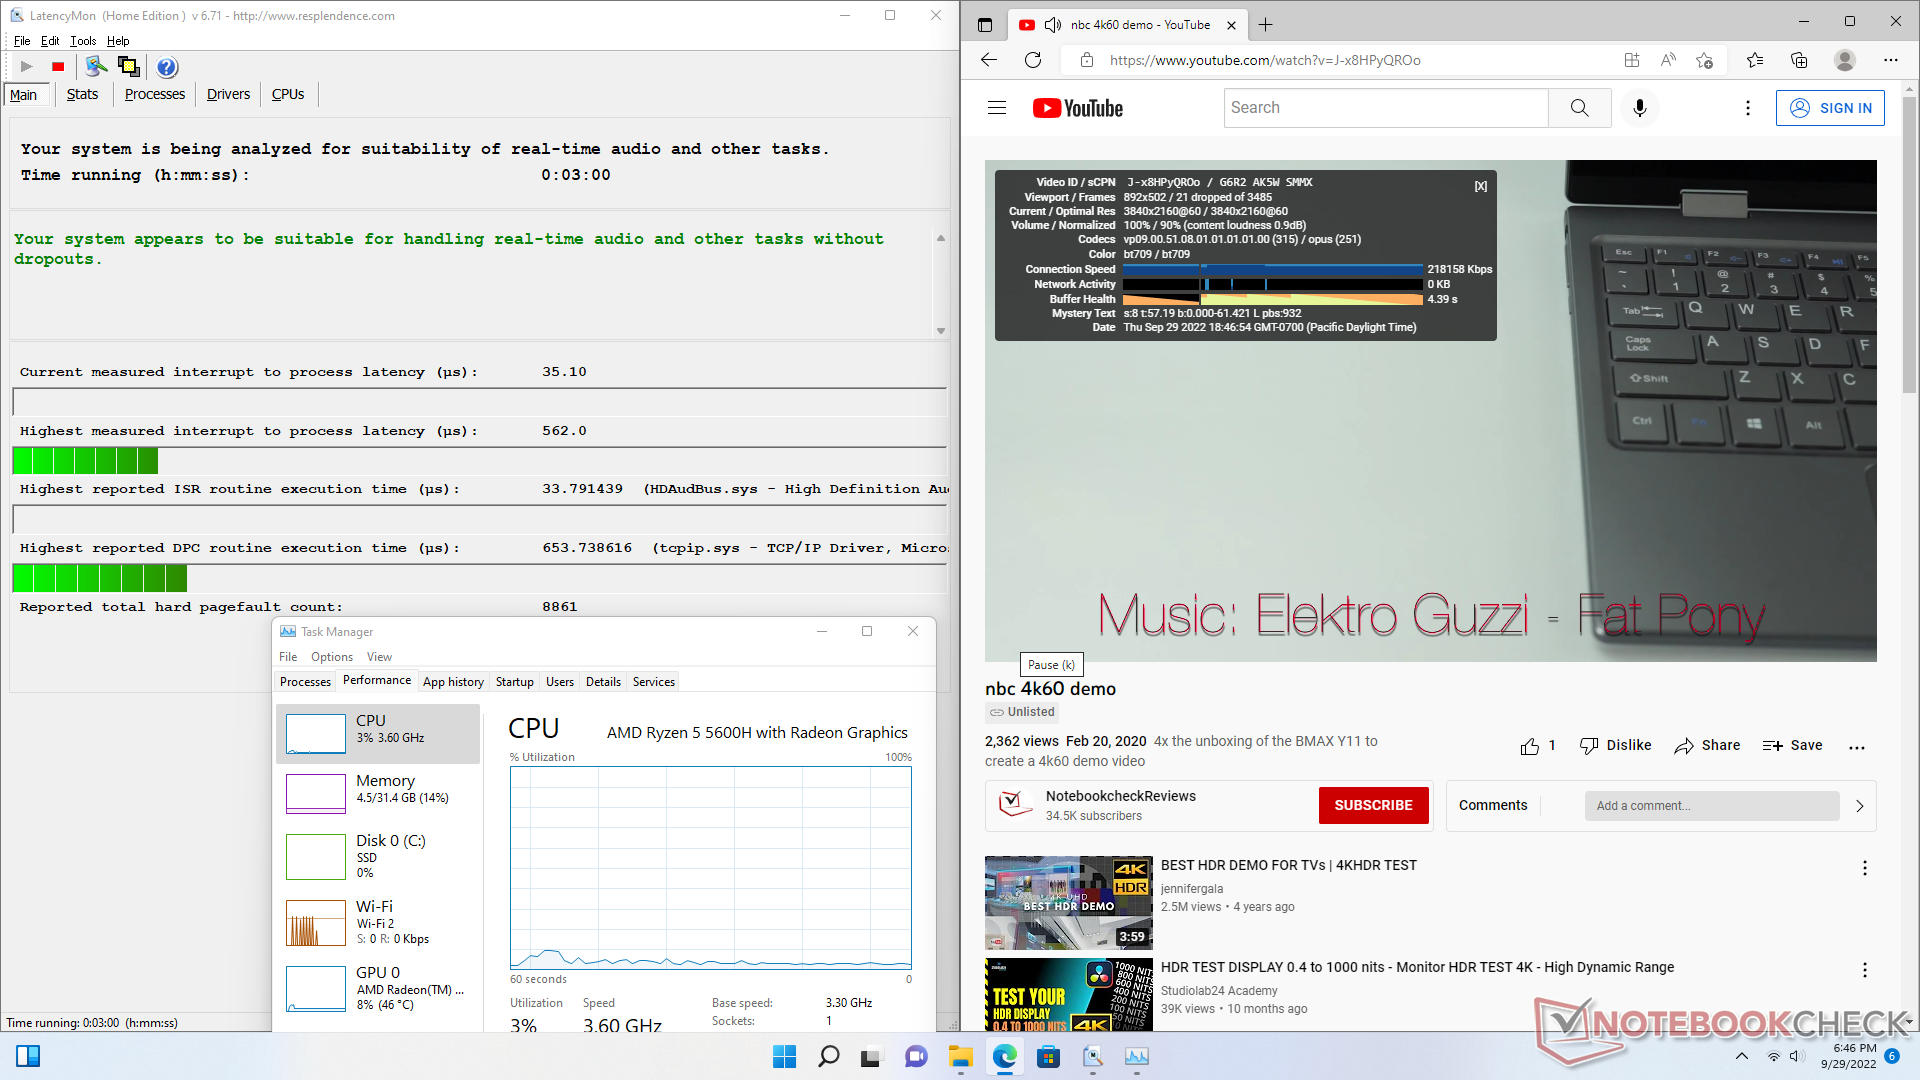
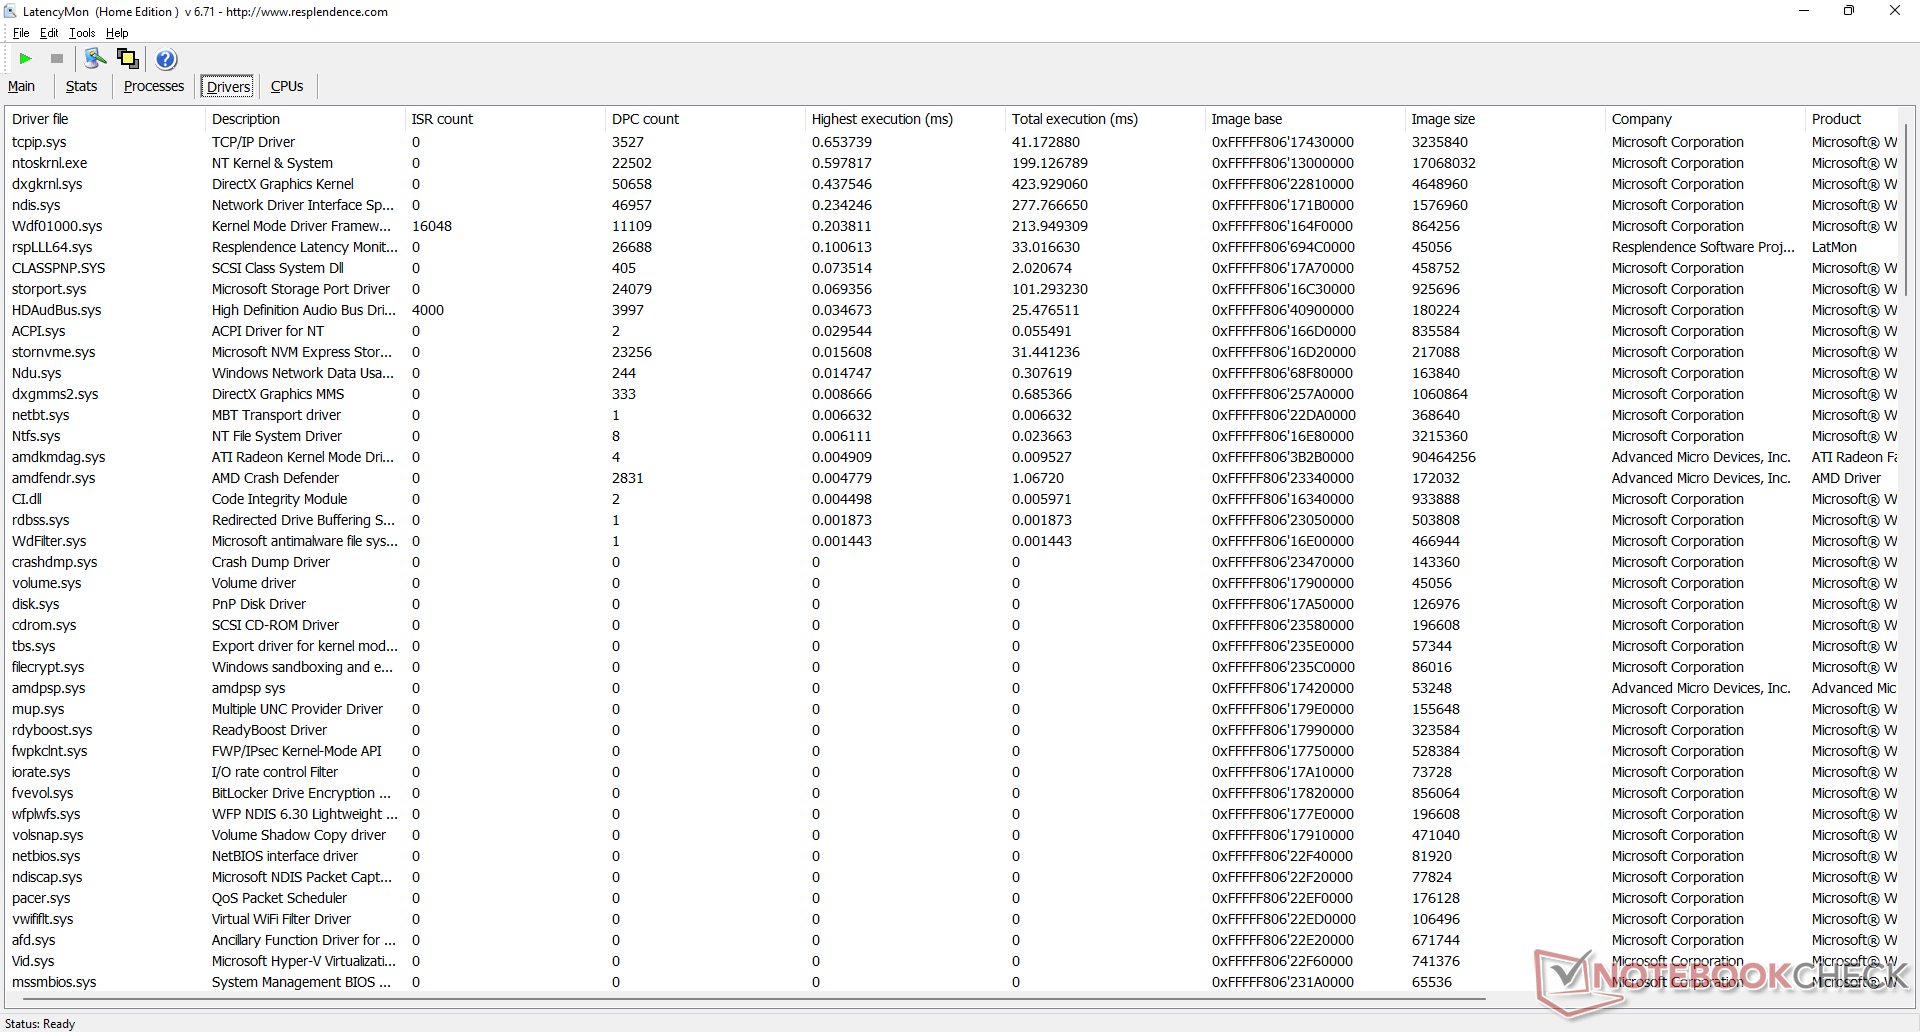
LatencyMon ne montre aucun problème majeur de CPD lors de l'ouverture de plusieurs onglets de navigateur sur notre page d'accueil. Malheureusement, la lecture de vidéos 4K à 60 FPS est imparfaite avec 21 images perdues pendant notre vidéo d'une minute.
| DPC Latencies / LatencyMon - interrupt to process latency (max), Web, Youtube, Prime95 | |
| Zotac ZBOX PI336 pico | |
| Beelink SER Pro Ryzen 5 5600H | |
| Intel NUC11TNKi5 | |
| Beelink SEi11 Pro | |
| Beelink GTR5 | |
* ... Moindre est la valeur, meilleures sont les performances
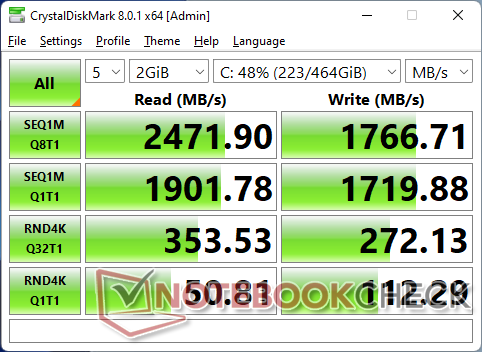
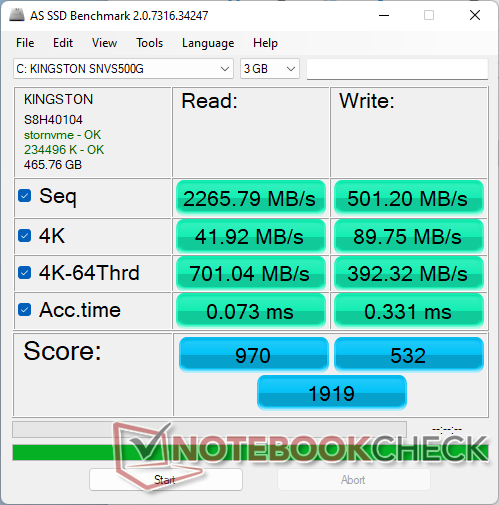
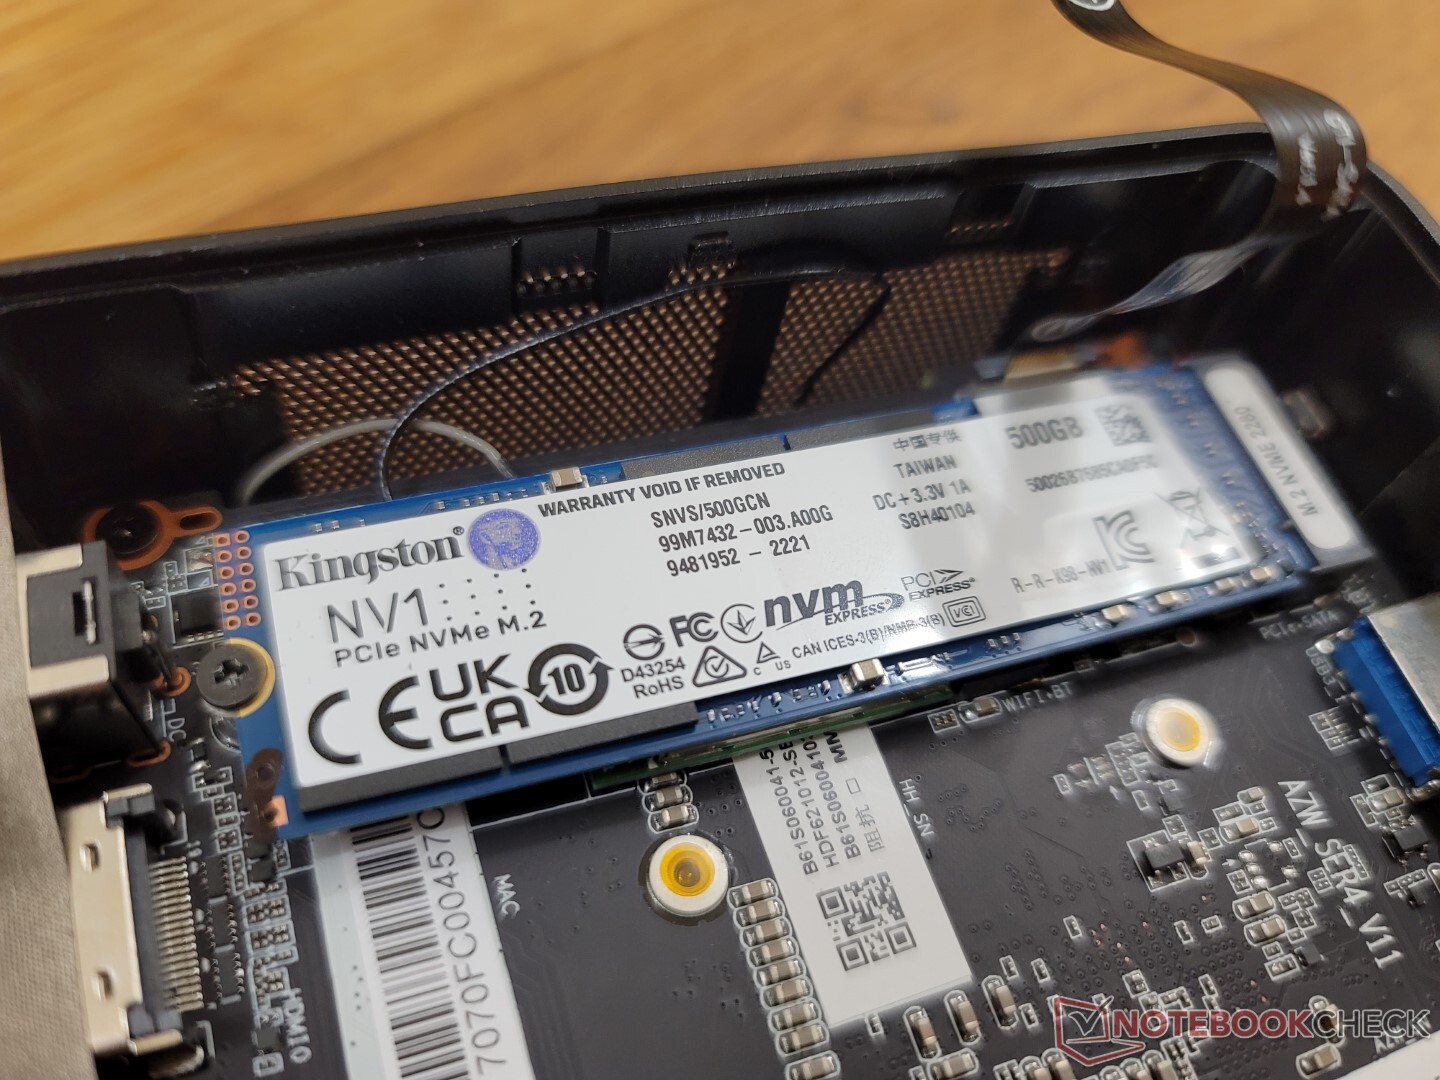
Périphériques de stockage
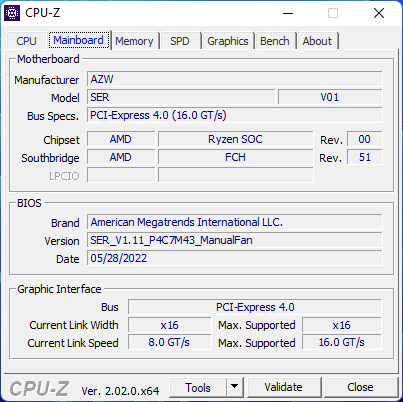
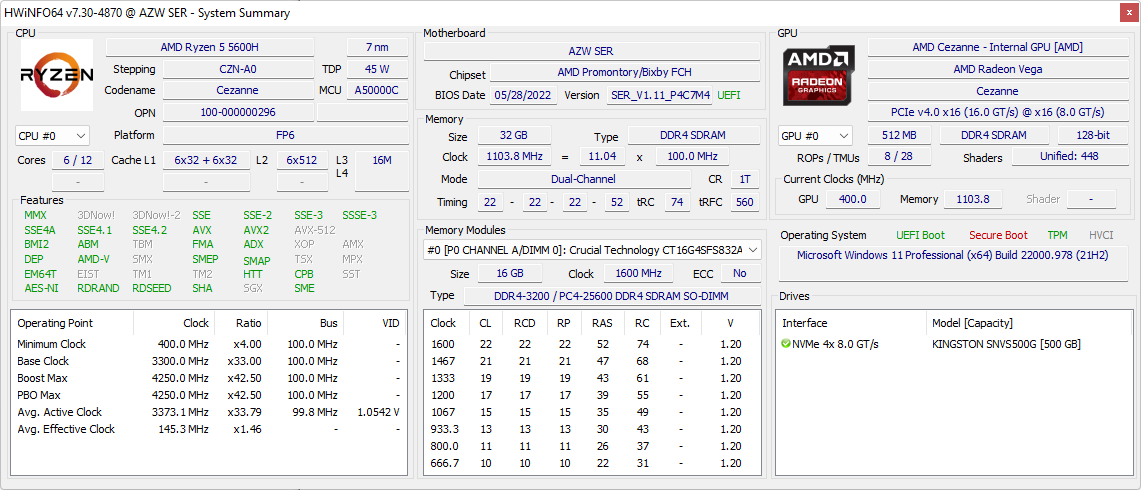
Les vitesses NVMe sont limitées à PCIe3 x4, alors que la plupart des nouveaux modèles Intel NUC supportent pleinement PCIe4 x4. PCIe3 est plus que suffisant pour la plupart des utilisateurs, cependant, et donc la coupure ici n'est pas significative. Notre SSD de milieu de gamme 500 Go Kingston NV1 SSD de milieu de gamme est capable de soutenir ses taux de lecture maximum de ~2500 MB/s sans aucun problème thermique.

| Drive Performance rating - Percent | |
| Beelink SER Pro Ryzen 5 5600H -11! | |
| Beelink GTR5 | |
| Beelink SEi11 Pro | |
| Intel NUC10i7FNH | |
| Intel NUC11TNKi5 | |
| Zotac ZBOX PI336 pico | |
* ... Moindre est la valeur, meilleures sont les performances
Disk Throttling: DiskSpd Read Loop, Queue Depth 8
Performances du GPU
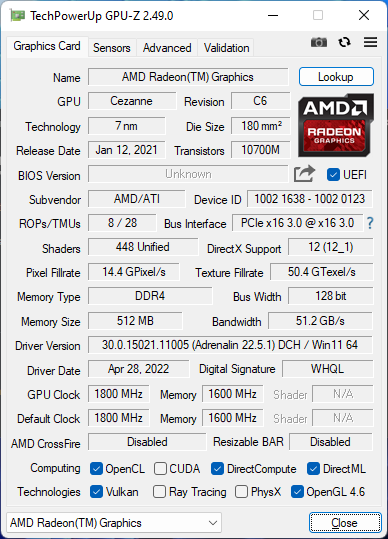
Les performances graphiques sont beaucoup plus rapides que celles de la plupart des autres ordinateurs portables ou mini-PC dotés du même système intégré Radeon RX Vega 7 De 30 à 35 %, car ces produits associent généralement le GPU à des CPU Ryzen de série U plus lents ou à une RAM à canal unique. Le Ryzen 5 5600H est moins un goulot d'étranglement pour le GPU et les taux de trame en bénéficient. Ce n'est pas encore une machine de jeu, cependant.
Le site Iris Xe 96 EU que l'on trouve généralement sur la plupart des ordinateurs portables ou mini PC Intel Core i7 de 11e génération, est toujours 10 à 15 % plus rapide.
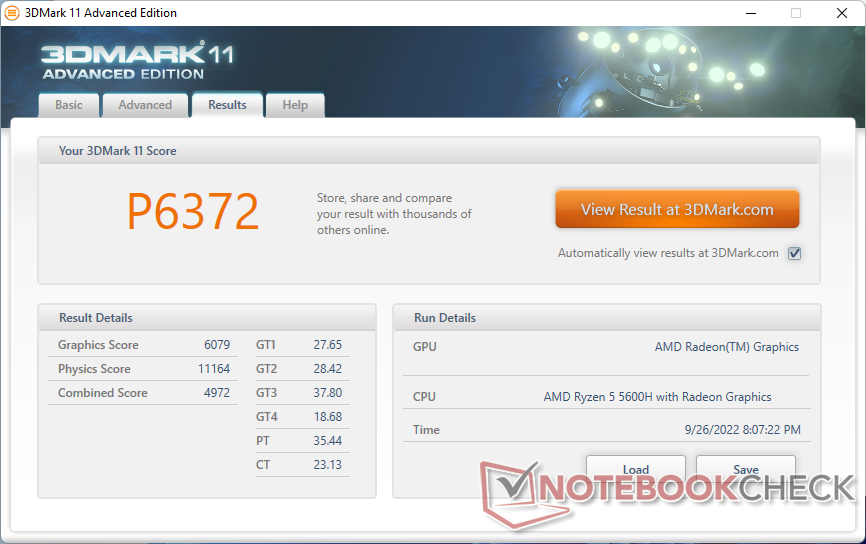
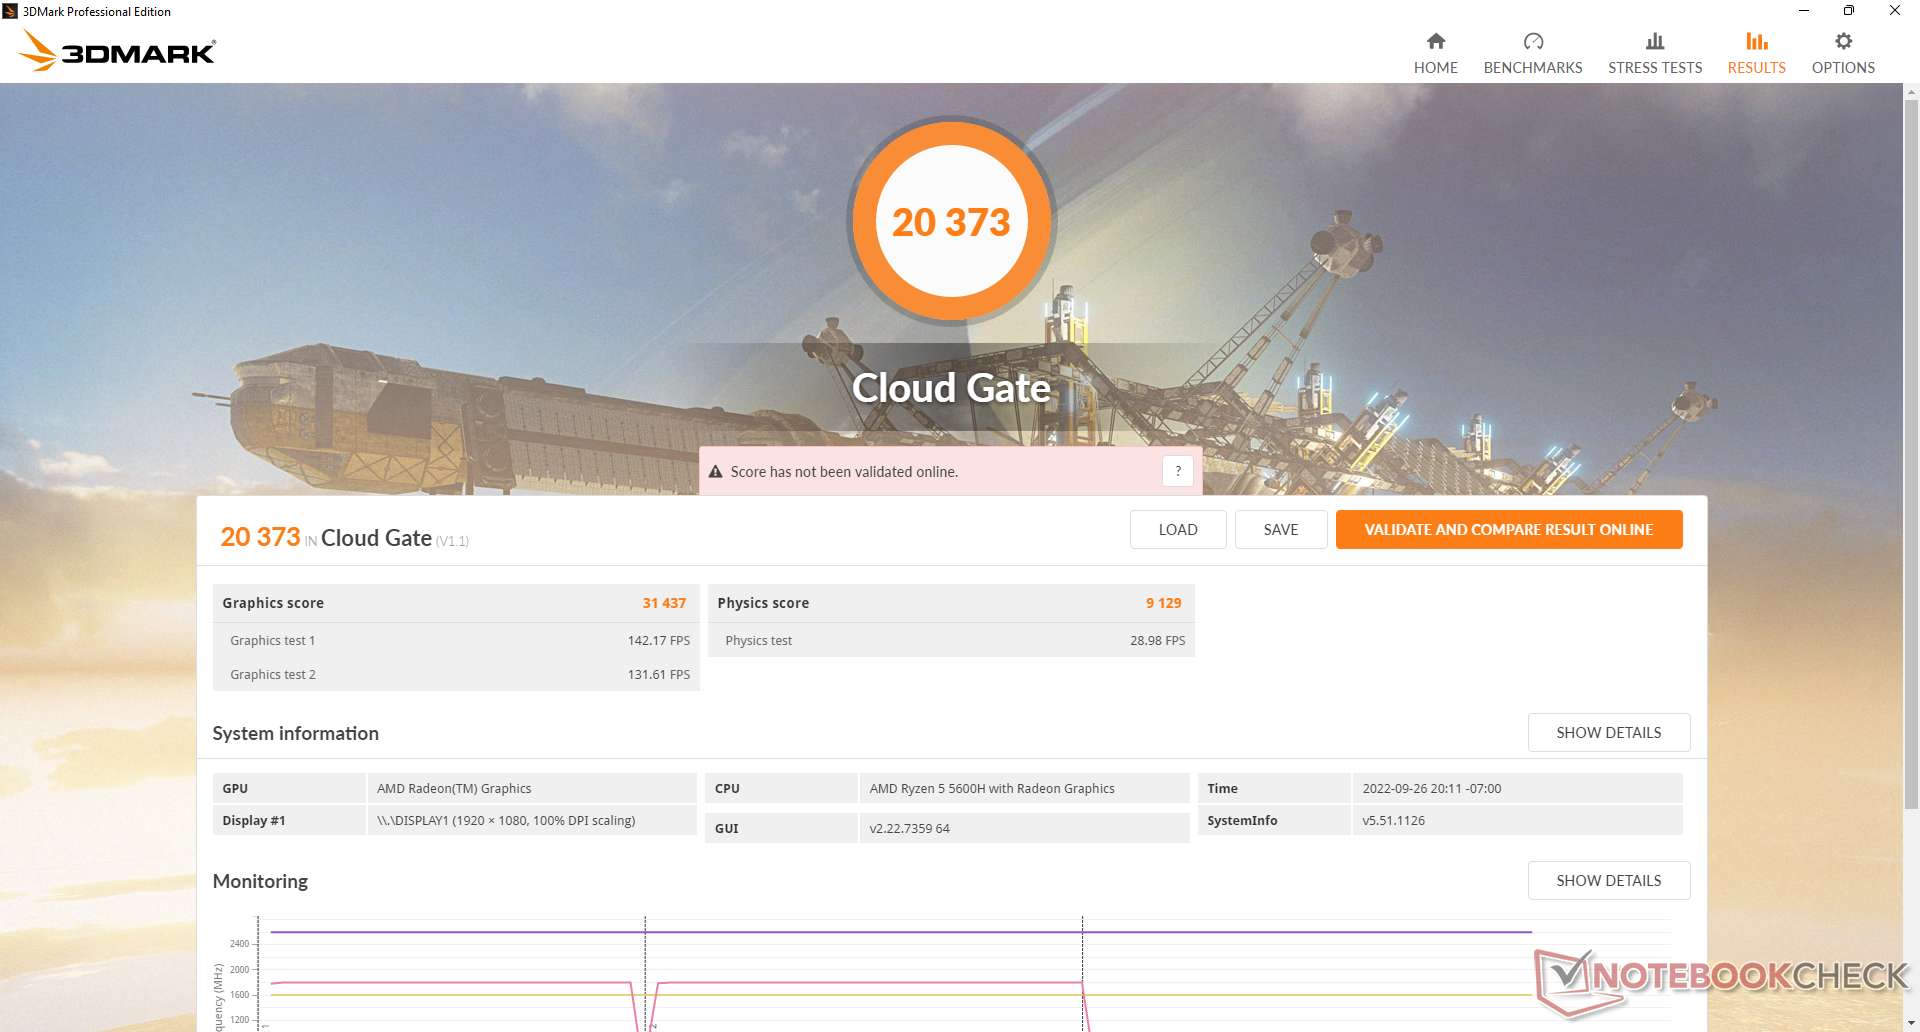
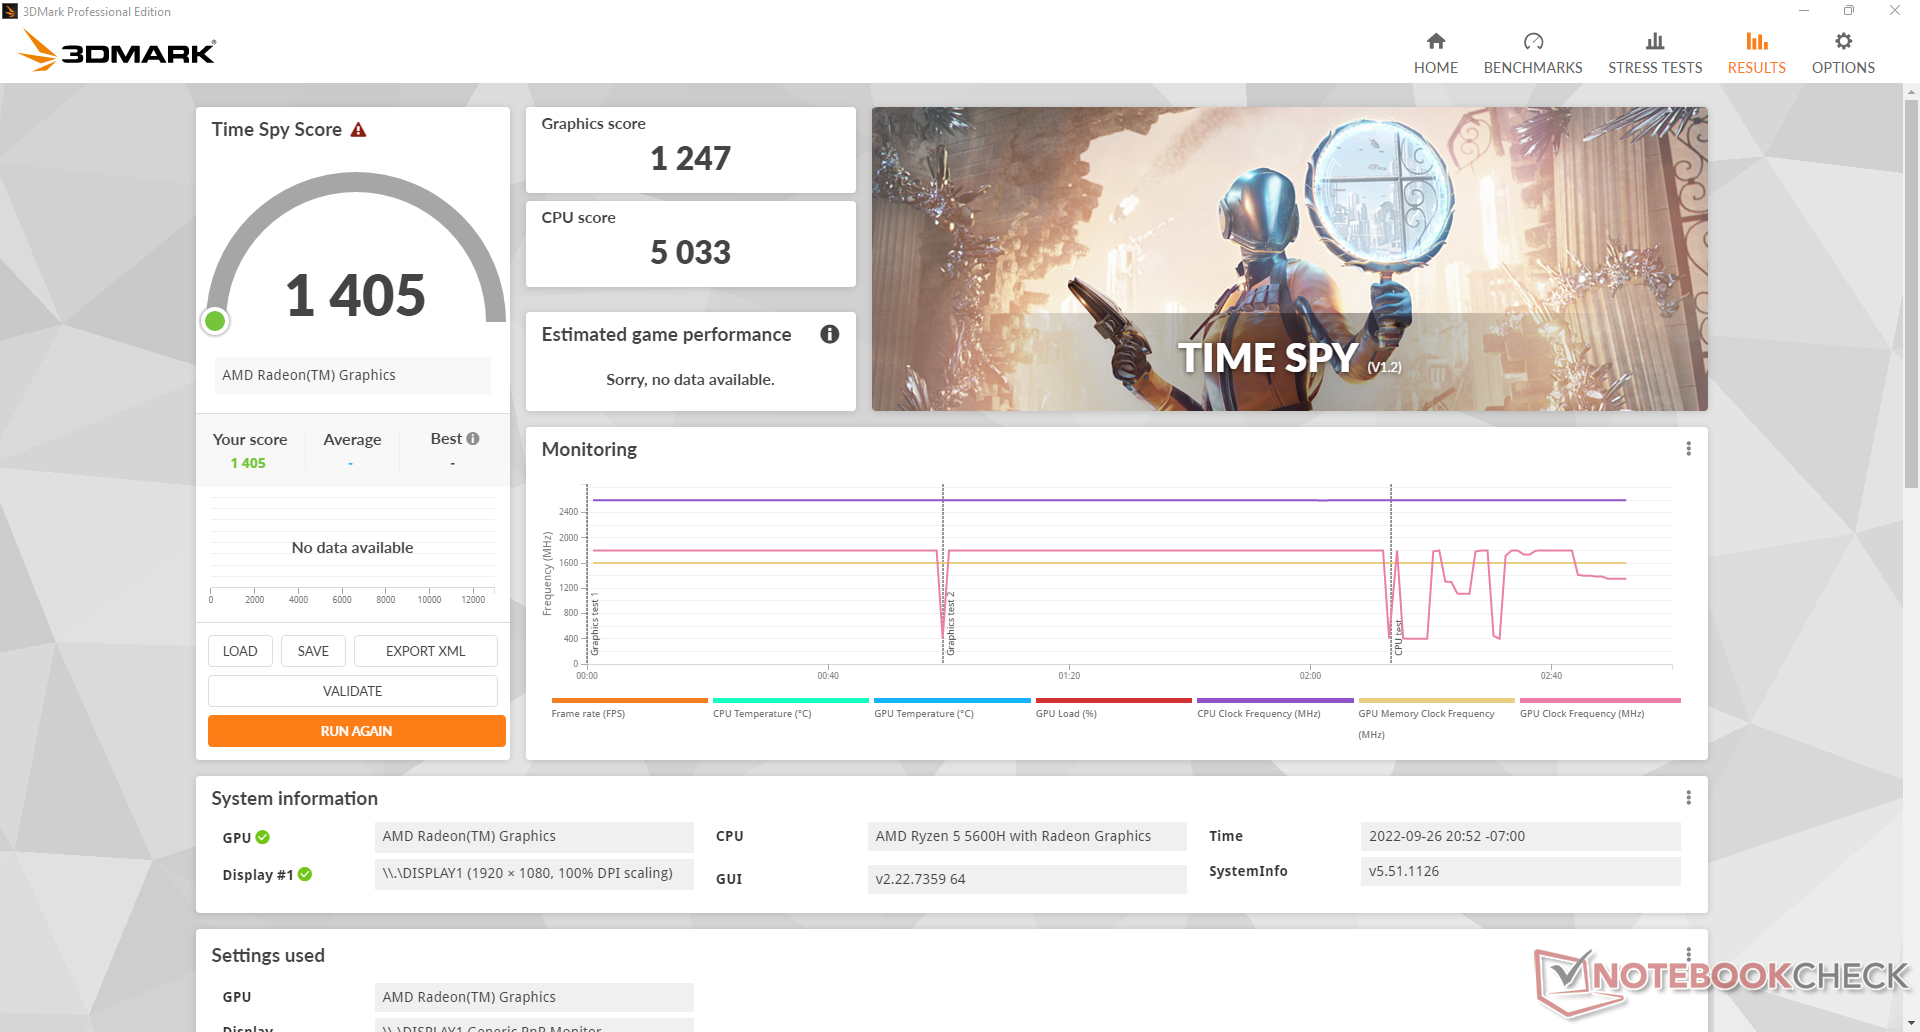
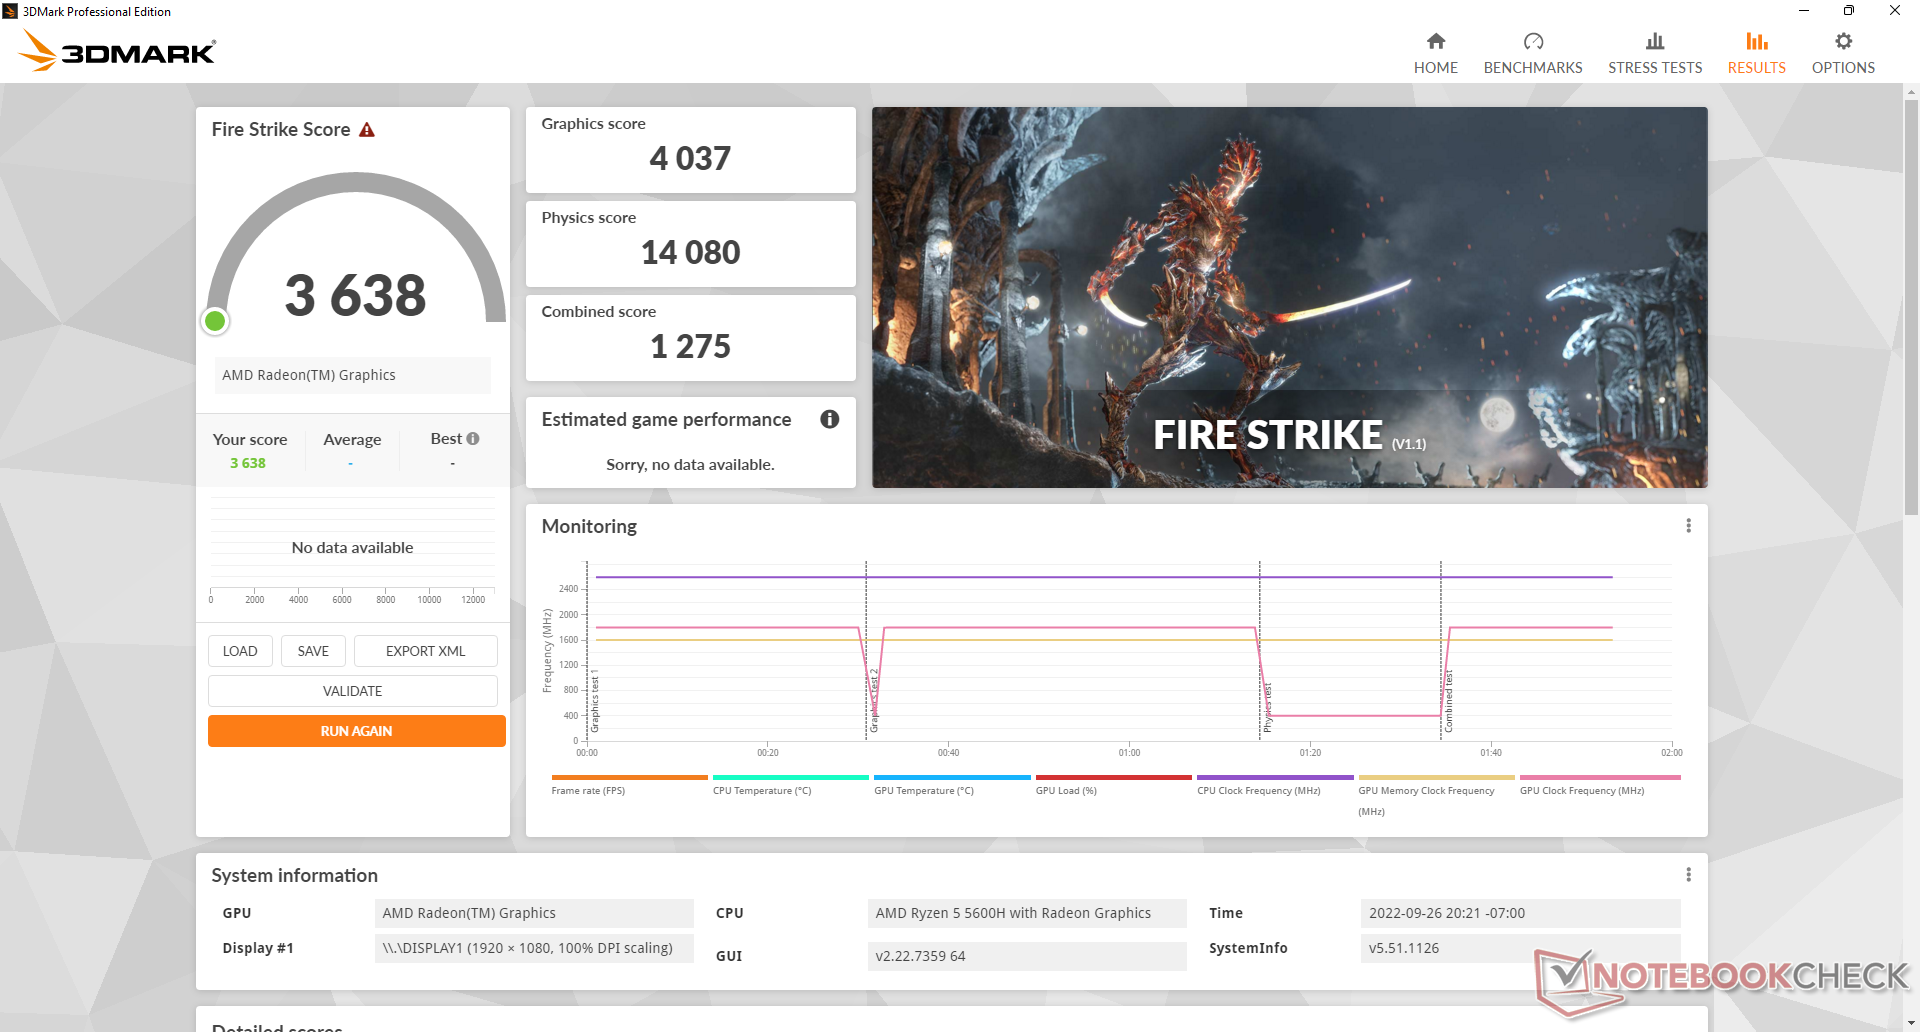
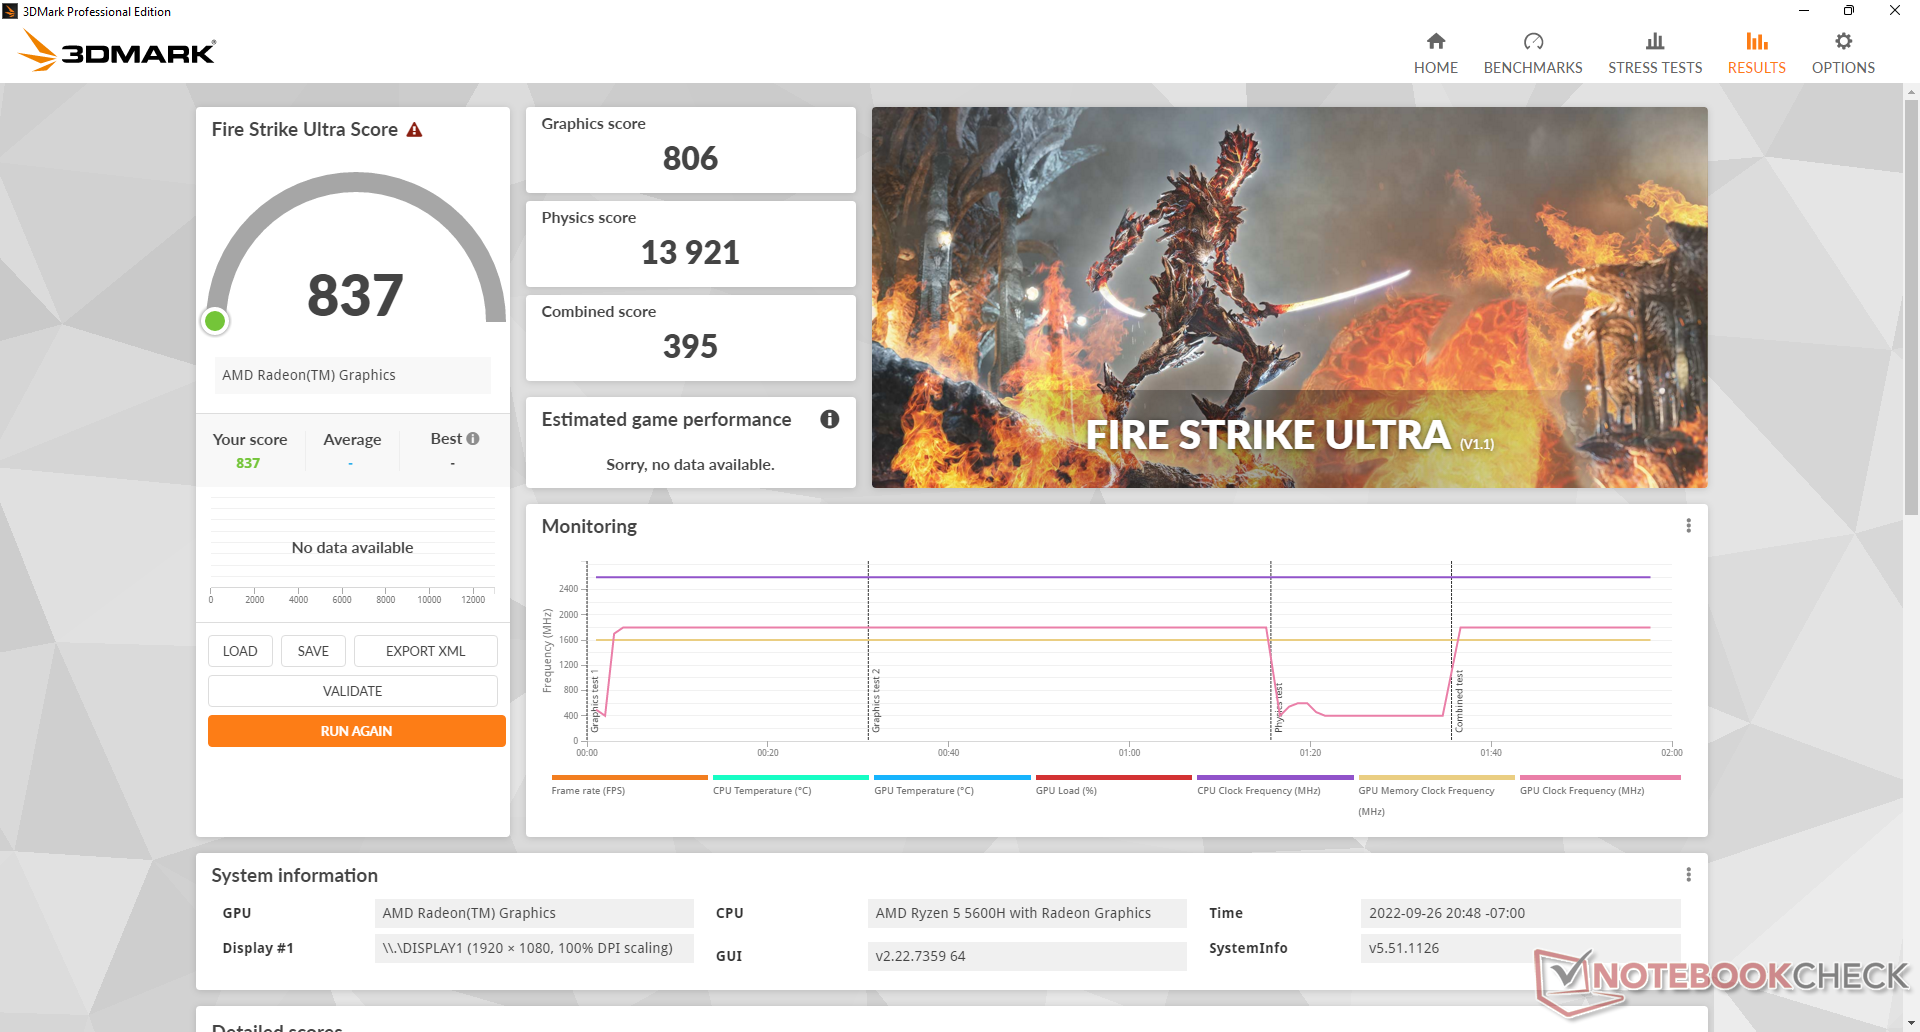
| 3DMark 11 Performance | 6372 points | |
| 3DMark Cloud Gate Standard Score | 20373 points | |
| 3DMark Fire Strike Score | 3638 points | |
| 3DMark Time Spy Score | 1405 points | |
Aide | ||
| Blender - v3.3 Classroom CPU | |
| Beelink SER Pro Ryzen 5 5600H | |
| Moyenne de la classe Mini PC (132 - 4571, n=83, 2 dernières années) | |
* ... Moindre est la valeur, meilleures sont les performances
| The Witcher 3 | |
| 1024x768 Low Graphics & Postprocessing | |
| Intel NUC11PHKi7C | |
| Honor MagicBook 14 2022 | |
| Lenovo Yoga 7-14ARB G7 | |
| Beelink SEi11 Pro | |
| Beelink GTR5 | |
| Beelink SER Pro Ryzen 5 5600H | |
| Beelink SER4 | |
| Intel NUC11TNKi5 | |
| Moyenne AMD Radeon RX Vega 7 (25.5 - 105.8, n=53) | |
| 1366x768 Medium Graphics & Postprocessing | |
| Intel NUC11PHKi7C | |
| Honor MagicBook 14 2022 | |
| Lenovo Yoga 7-14ARB G7 | |
| Beelink GTR5 | |
| Beelink SEi11 Pro | |
| Beelink SER Pro Ryzen 5 5600H | |
| Beelink SER4 | |
| Moyenne AMD Radeon RX Vega 7 (9.74 - 81.3, n=39) | |
| 1920x1080 High Graphics & Postprocessing (Nvidia HairWorks Off) | |
| Intel NUC11PHKi7C | |
| Honor MagicBook 14 2022 | |
| Lenovo Yoga 7-14ARB G7 | |
| Beelink SEi11 Pro | |
| Beelink GTR5 | |
| Beelink SER Pro Ryzen 5 5600H | |
| Beelink SER4 | |
| Moyenne AMD Radeon RX Vega 7 (8.96 - 26.2, n=52) | |
| 1920x1080 Ultra Graphics & Postprocessing (HBAO+) | |
| Intel NUC11PHKi7C | |
| Honor MagicBook 14 2022 | |
| Lenovo Yoga 7-14ARB G7 | |
| Beelink GTR5 | |
| Beelink SER Pro Ryzen 5 5600H | |
| Beelink SER4 | |
| Beelink SEi11 Pro | |
| Moyenne AMD Radeon RX Vega 7 (6.5 - 15.8, n=44) | |
Les fréquences d'images ne sont malheureusement pas aussi régulières que nous l'avions espéré. Lorsque le jeu tourne au ralenti sur Witcher 3 avec des paramètres 720p bas, les taux de trame tombent parfois à 60 FPS ou même 19 FPS sans raison apparente, comme le montre le graphique ci-dessous. Une mauvaise gestion de l'activité de fond est probablement responsable de l'interruption des taux d'images.
Witcher 3 FPS Chart
| Bas | Moyen | Élevé | Ultra | |
|---|---|---|---|---|
| GTA V (2015) | 132.9 | 117.6 | 32.2 | 14.5 |
| The Witcher 3 (2015) | 79.2 | 48.7 | 25.1 | 15.8 |
| Dota 2 Reborn (2015) | 137.5 | 103.1 | 59.3 | 56.3 |
| Final Fantasy XV Benchmark (2018) | 41.1 | 20.3 | 14.3 | |
| X-Plane 11.11 (2018) | 53.4 | 40.3 | 35.7 | |
| Strange Brigade (2018) | 95.3 | 36 | 30.1 | 25.5 |
| Cyberpunk 2077 1.6 (2022) | 20.9 | 16.2 | 11.4 |
Émissions
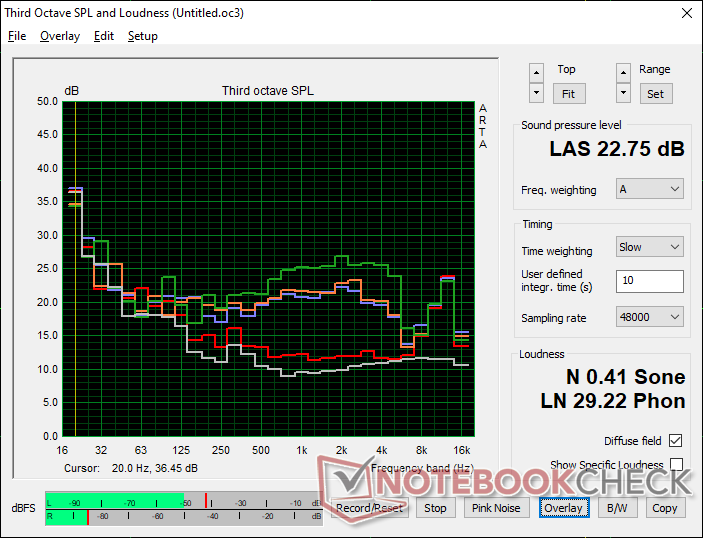
Bruit du système
Notre appareil de test ne souffre d'aucun bruit électronique ou de ronflement de bobine. Ainsi, nous sommes en mesure d'enregistrer un bruit de 26,1 dB(A) contre un arrière-plan silencieux de 22,8 dB(A), même lorsqu'il tourne au ralenti sur le bureau sans applications en cours d'exécution. Le bruit du ventilateur tourne autour de 28.7 dB(A) pendant des charges typiques comme la navigation web ou le streaming vidéo, ce qui est plus silencieux que le NUC11TNK.
Le bruit du ventilateur se situe entre 32 et 37 dB(A) lors de l'exécution de charges plus exigeantes comme les jeux, ce qui est encore plus silencieux que le NUC11TNK et le plus rapide Beelink GTR5. C'est un mini PC silencieux par rapport aux performances que vous obtenez.
Degré de la nuisance sonore
| Au repos |
| 26.1 / 26.1 / 28.7 dB(A) |
| Fortement sollicité |
| 32.3 / 36.4 dB(A) |
 | ||
30 dB silencieux 40 dB(A) audible 50 dB(A) bruyant |
||
min: | ||
| Beelink SER Pro Ryzen 5 5600H Vega 7, R5 5600H, Kingston NV1 SNVS/500GCN | Beelink SEi11 Pro Iris Xe G7 96EUs, i5-11320H, Kingston NV1 SNVS/500GCN | Beelink GTR5 Vega 8, R9 5900HX, Kingston NV1 SNVS/500GCN | Intel NUC11TNKi5 Iris Xe G7 80EUs, i5-1135G7, Transcend M.2 SSD 430S TS512GMTS430S | Beelink SEi8 Iris Plus Graphics 655, i3-8109U, Intel SSD 660p SSDPEKNW512G8 | Beelink SER4 Vega 8, R7 4800U, Intel SSD 660p SSDPEKNW512G8 | |
|---|---|---|---|---|---|---|
| Noise | 1% | -24% | -23% | -7% | -18% | |
| arrêt / environnement * (dB) | 22.8 | 22.8 -0% | 23.1 -1% | 24.8 -9% | 24.5 -7% | 23.4 -3% |
| Idle Minimum * (dB) | 26.1 | 24.7 5% | 34.2 -31% | 35.6 -36% | 26.5 -2% | 33.2 -27% |
| Idle Average * (dB) | 26.1 | 24.7 5% | 34.2 -31% | 35.6 -36% | 26.5 -2% | 33.2 -27% |
| Idle Maximum * (dB) | 28.7 | 25.3 12% | 34.2 -19% | 35.6 -24% | 31.1 -8% | 33.2 -16% |
| Load Average * (dB) | 32.3 | 33.2 -3% | 44.6 -38% | 36.2 -12% | 37.7 -17% | 38.6 -20% |
| Witcher 3 ultra * (dB) | 32.8 | 34.5 -5% | 41.4 -26% | 38 -16% | 39.2 -20% | |
| Load Maximum * (dB) | 36.4 | 37.8 -4% | 45.1 -24% | 47.6 -31% | 37.5 -3% | 40.8 -12% |
* ... Moindre est la valeur, meilleures sont les performances
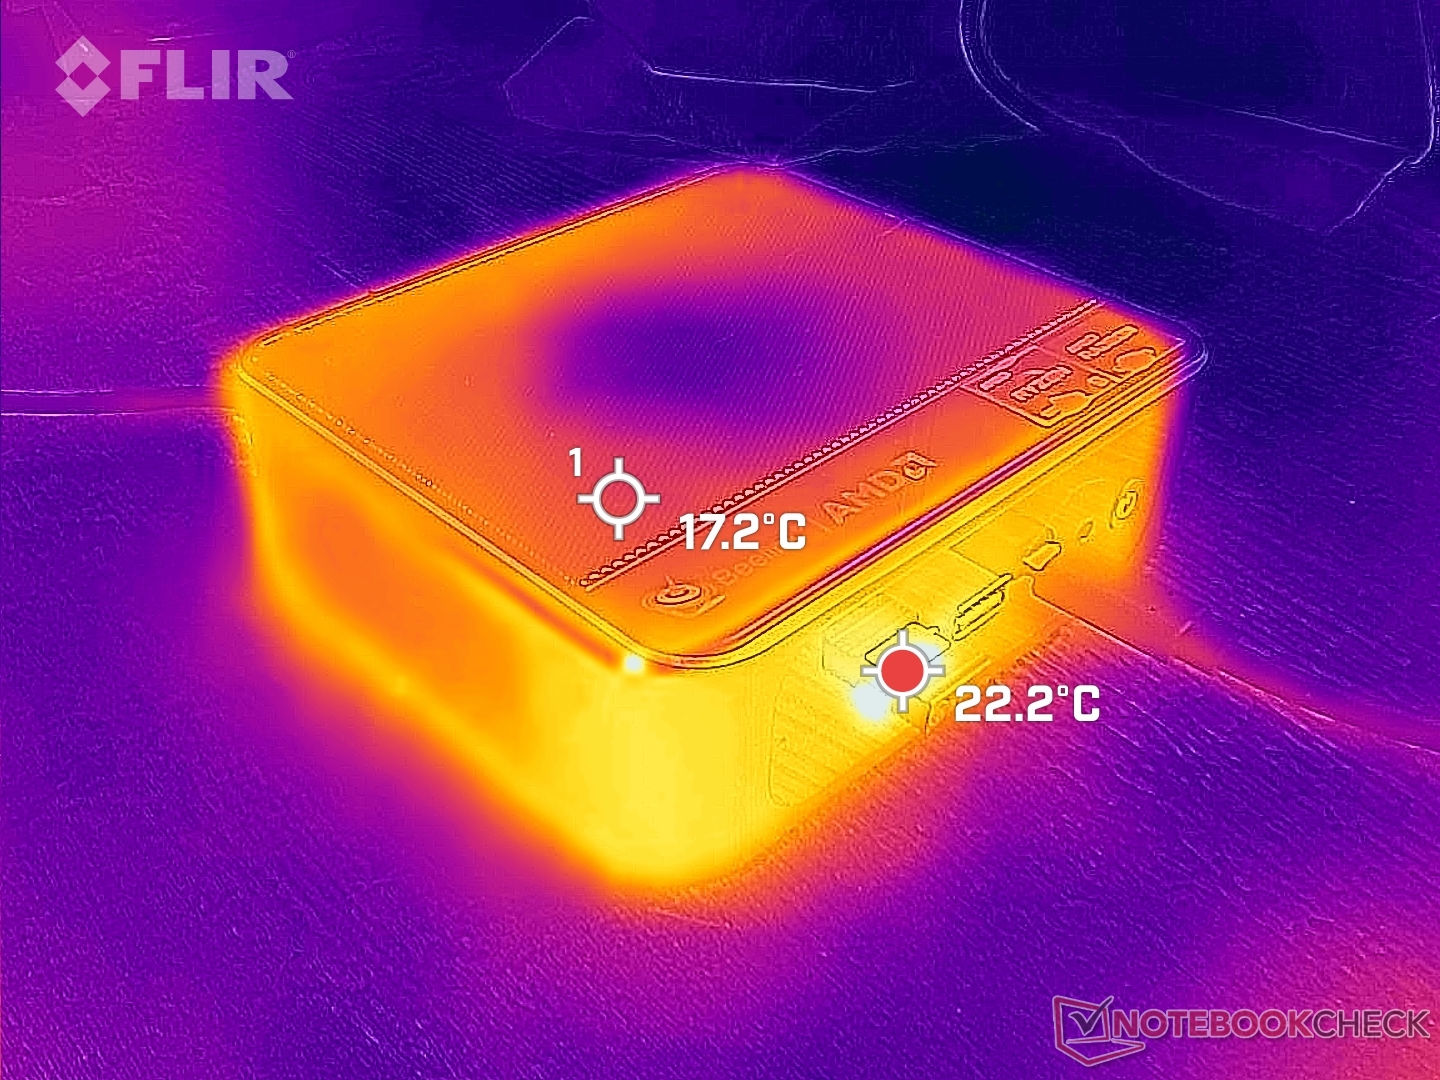
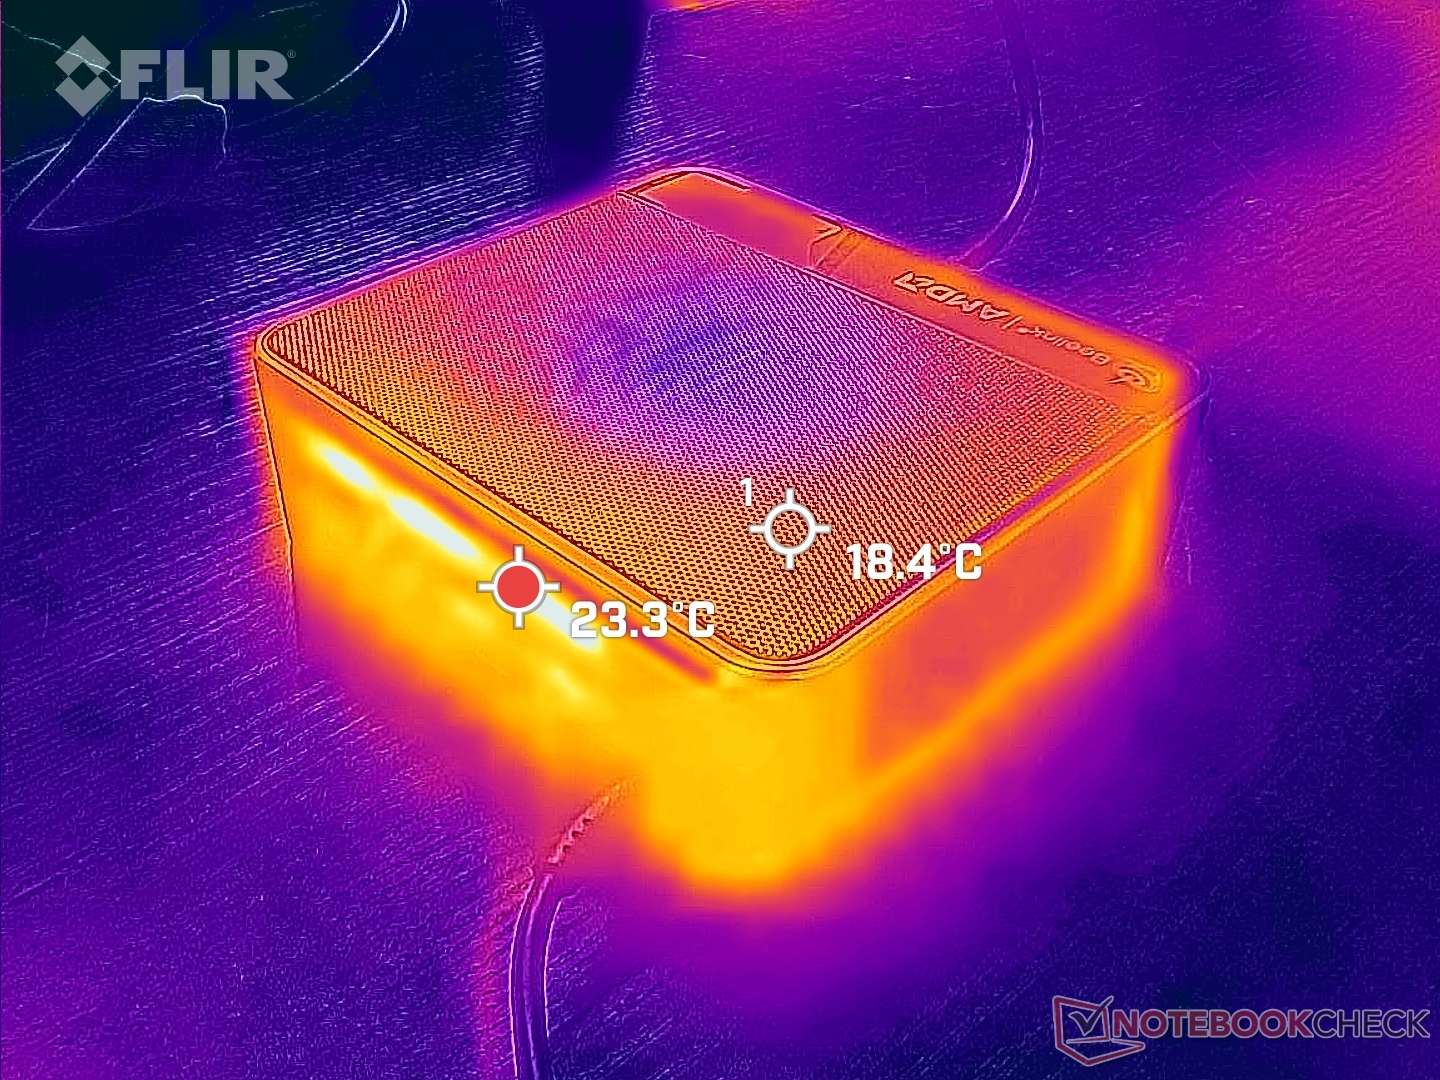
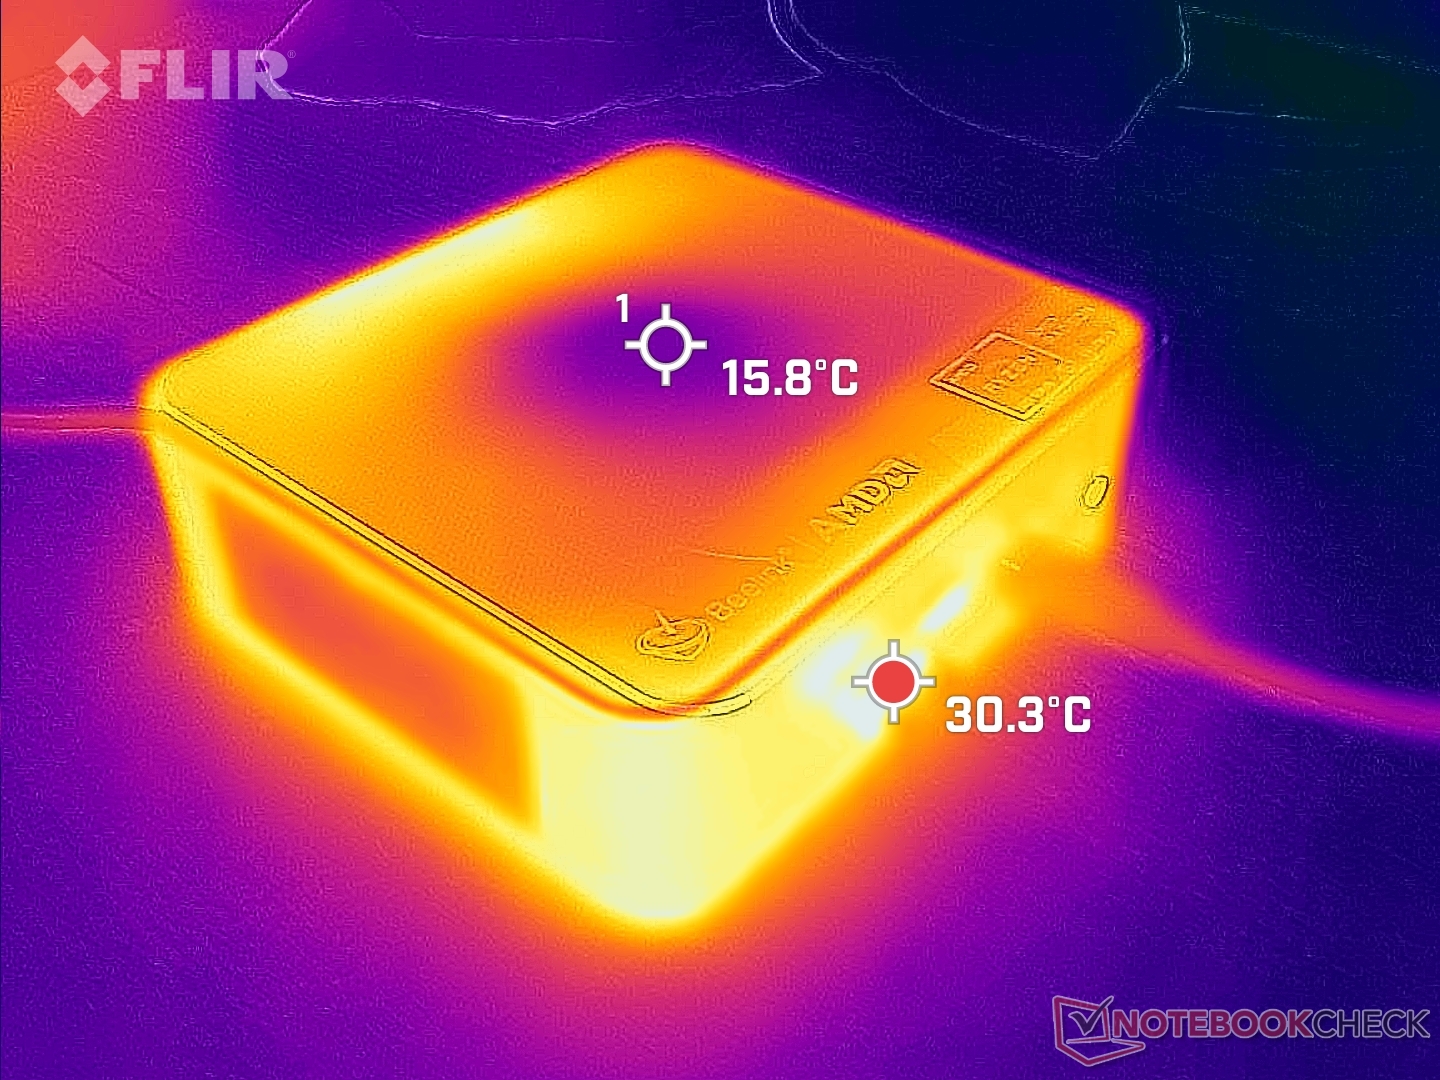
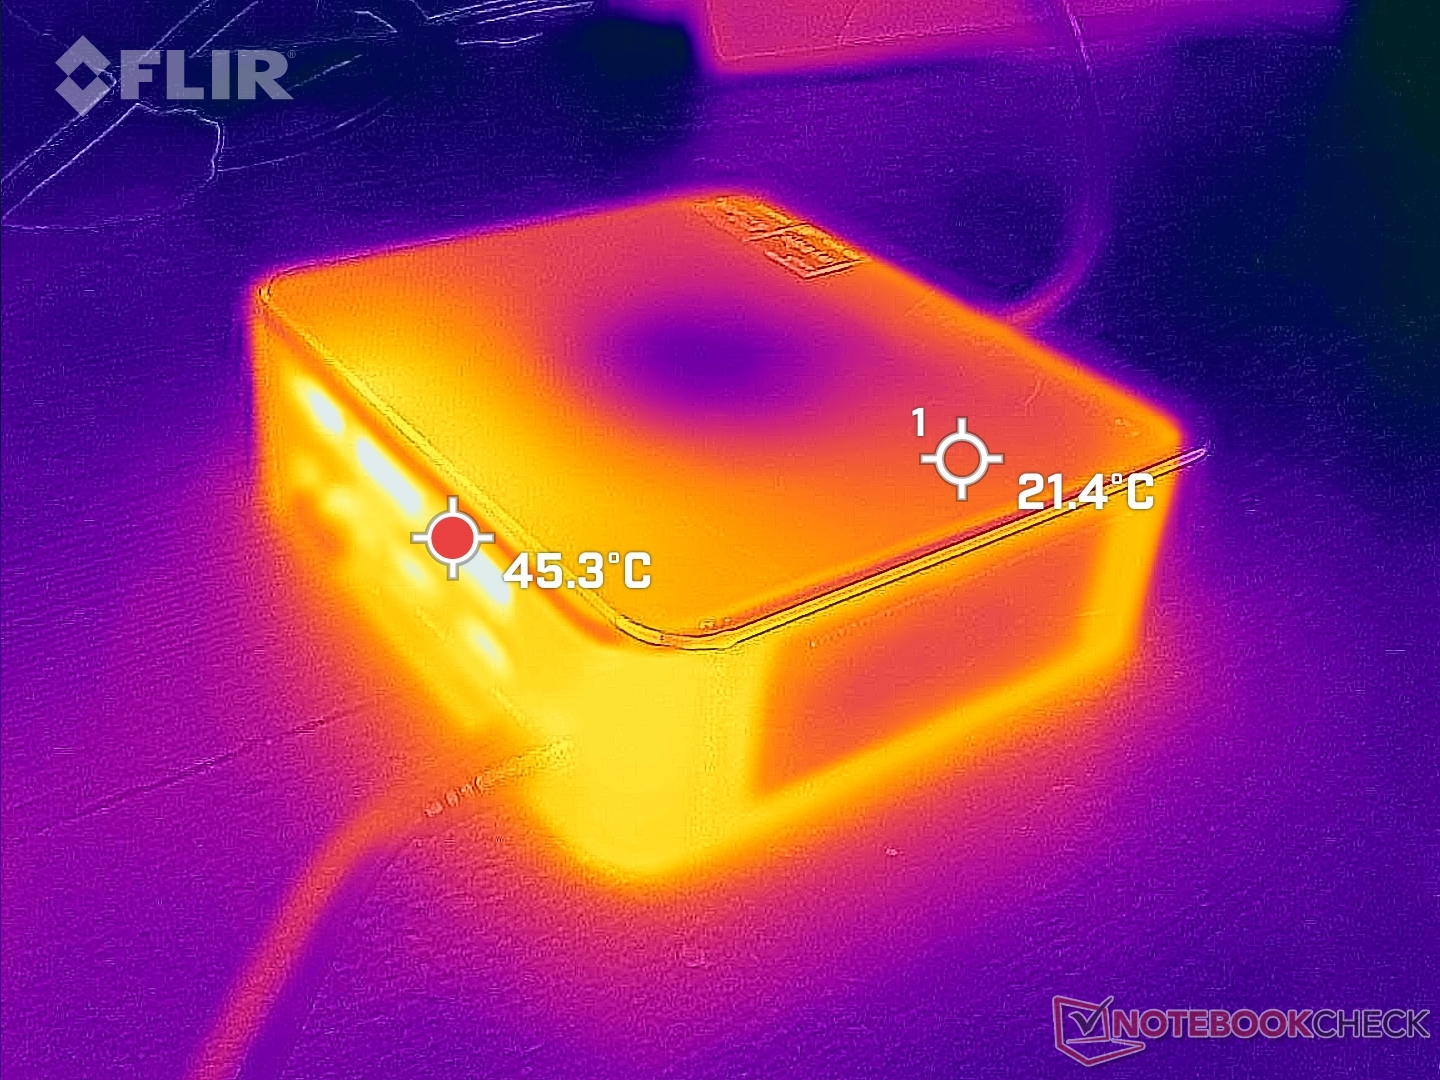
Température
L'air frais entre par le haut et la chaleur résiduelle sort par l'arrière. Pour un refroidissement optimal, il est préférable de ne pas laisser de livres, de papiers ou d'autres obstacles sur le dessus.
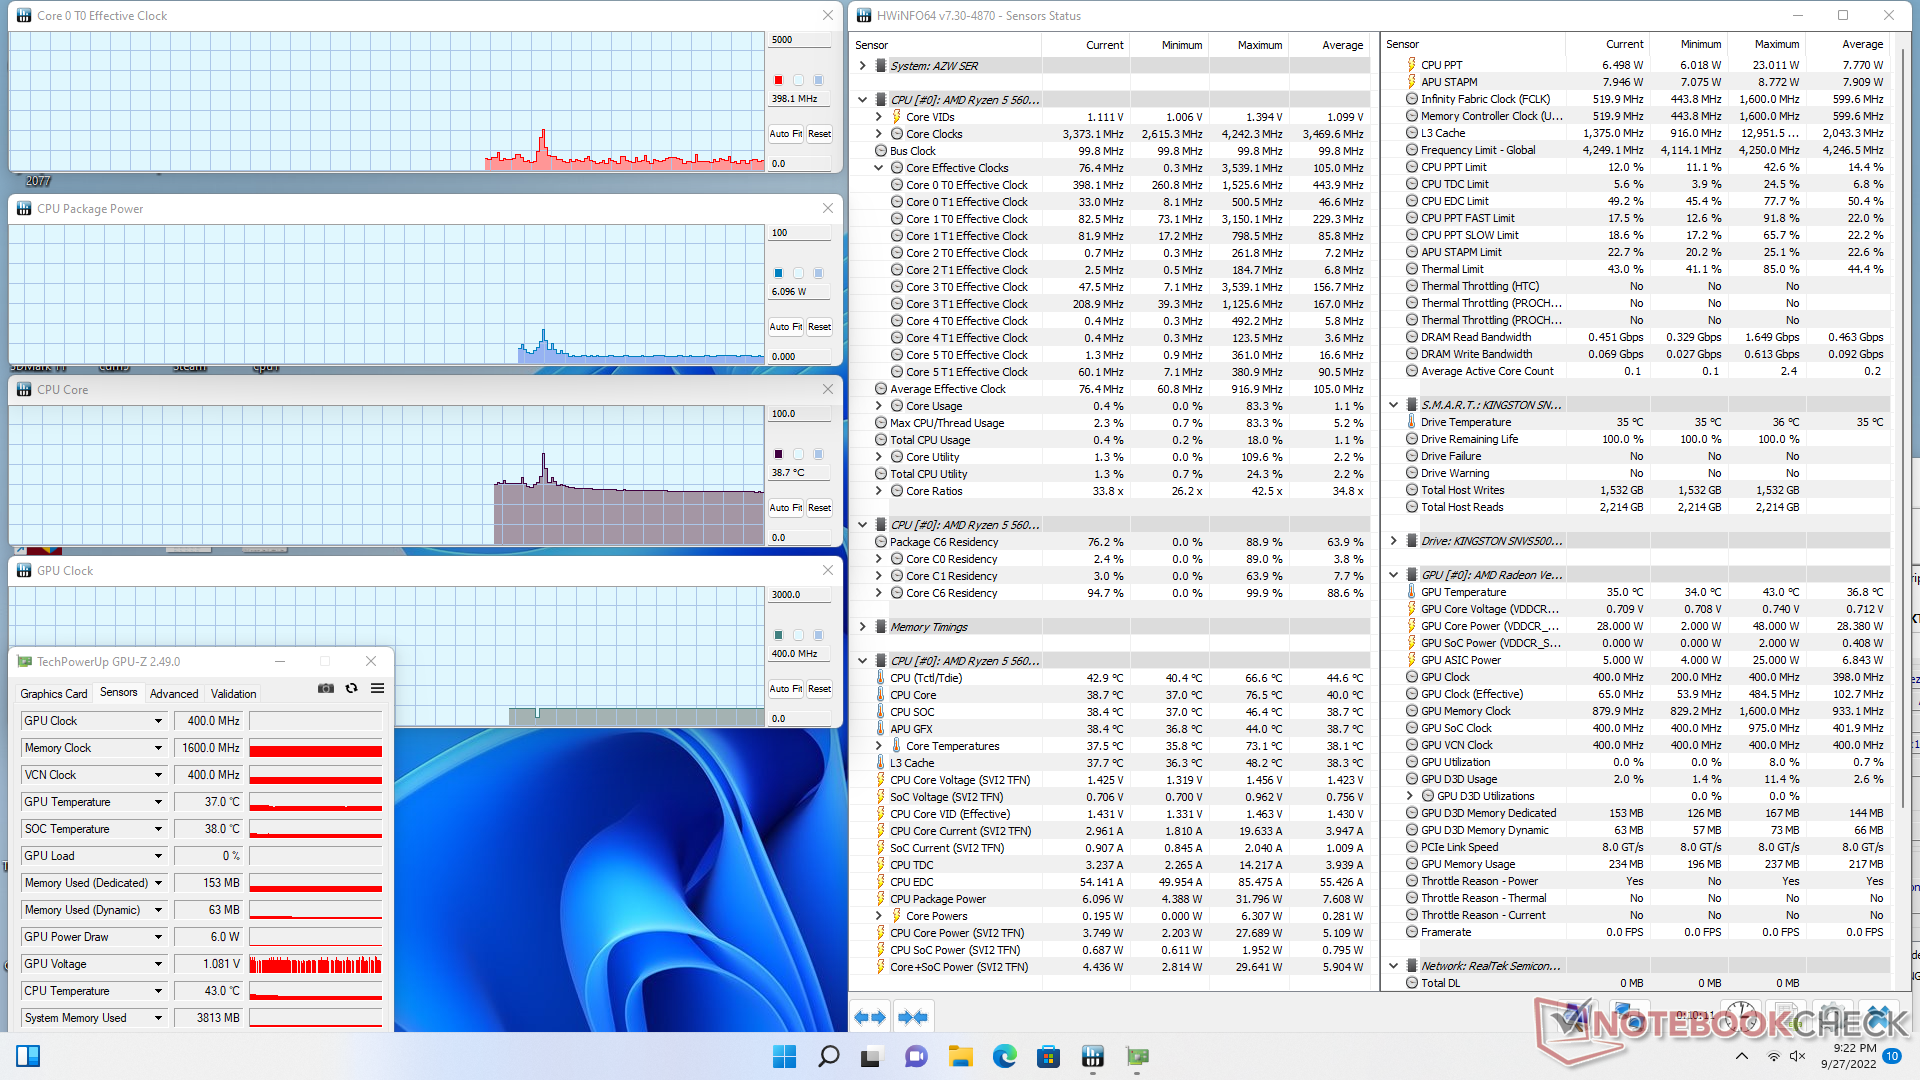
Test de stress
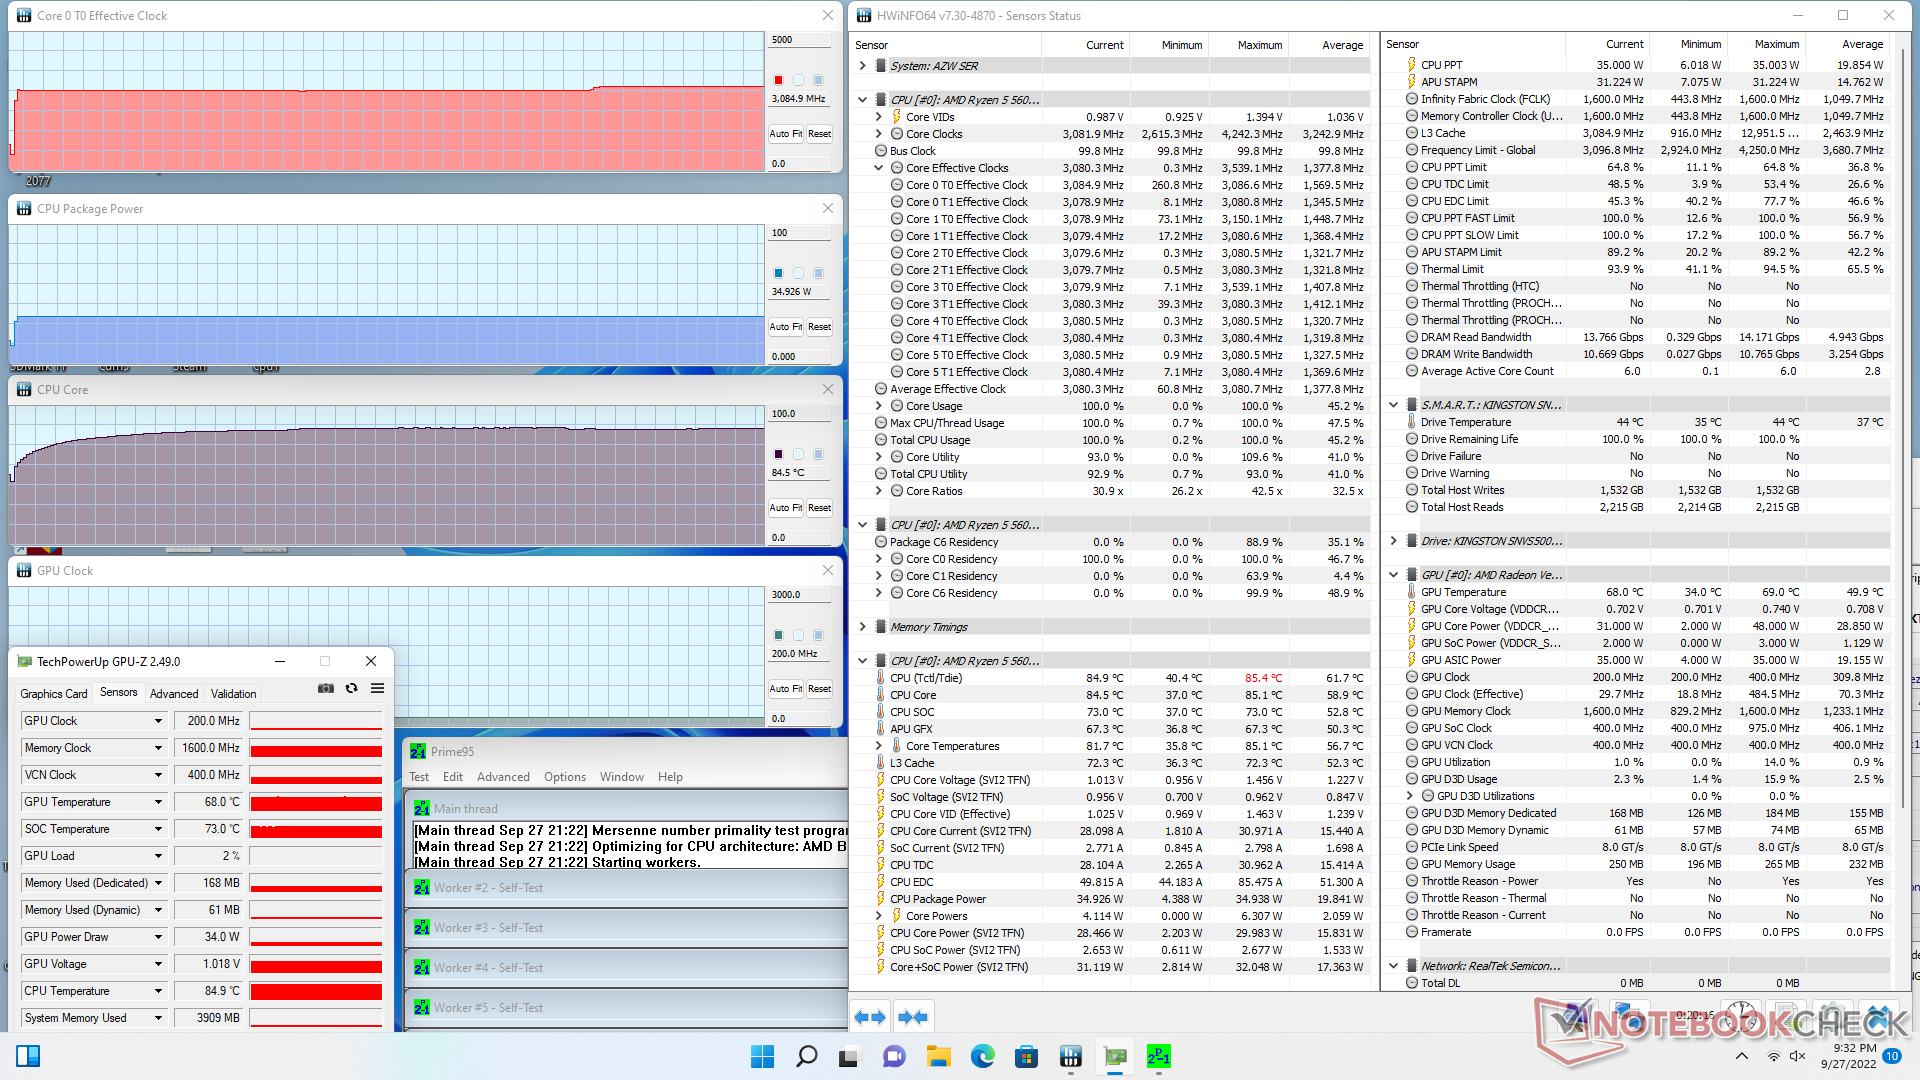
Les fréquences d'horloge du CPU et la consommation d'énergie de la carte se stabilisent à 3,0 GHz et 35 W, respectivement, lors du lancement de Prime95. 35 W est à l'extrémité inférieure du spectre pour le Ryzen 5 5600H et il est donc un peu décevant de ne pas voir des objectifs plus élevés TDP sur le SER5. La température du cœur est déjà assez élevée à 85 C, ce qui peut expliquer la faible note de 35 W.
L'exécution de Witcher 3 aurait pour résultat une température du noyau de 75 C comparé à 57 C sur le Intel NUC11PAQ. Le système Beelink fonctionne un peu plus chaud que l'Intel dans la plupart des conditions.
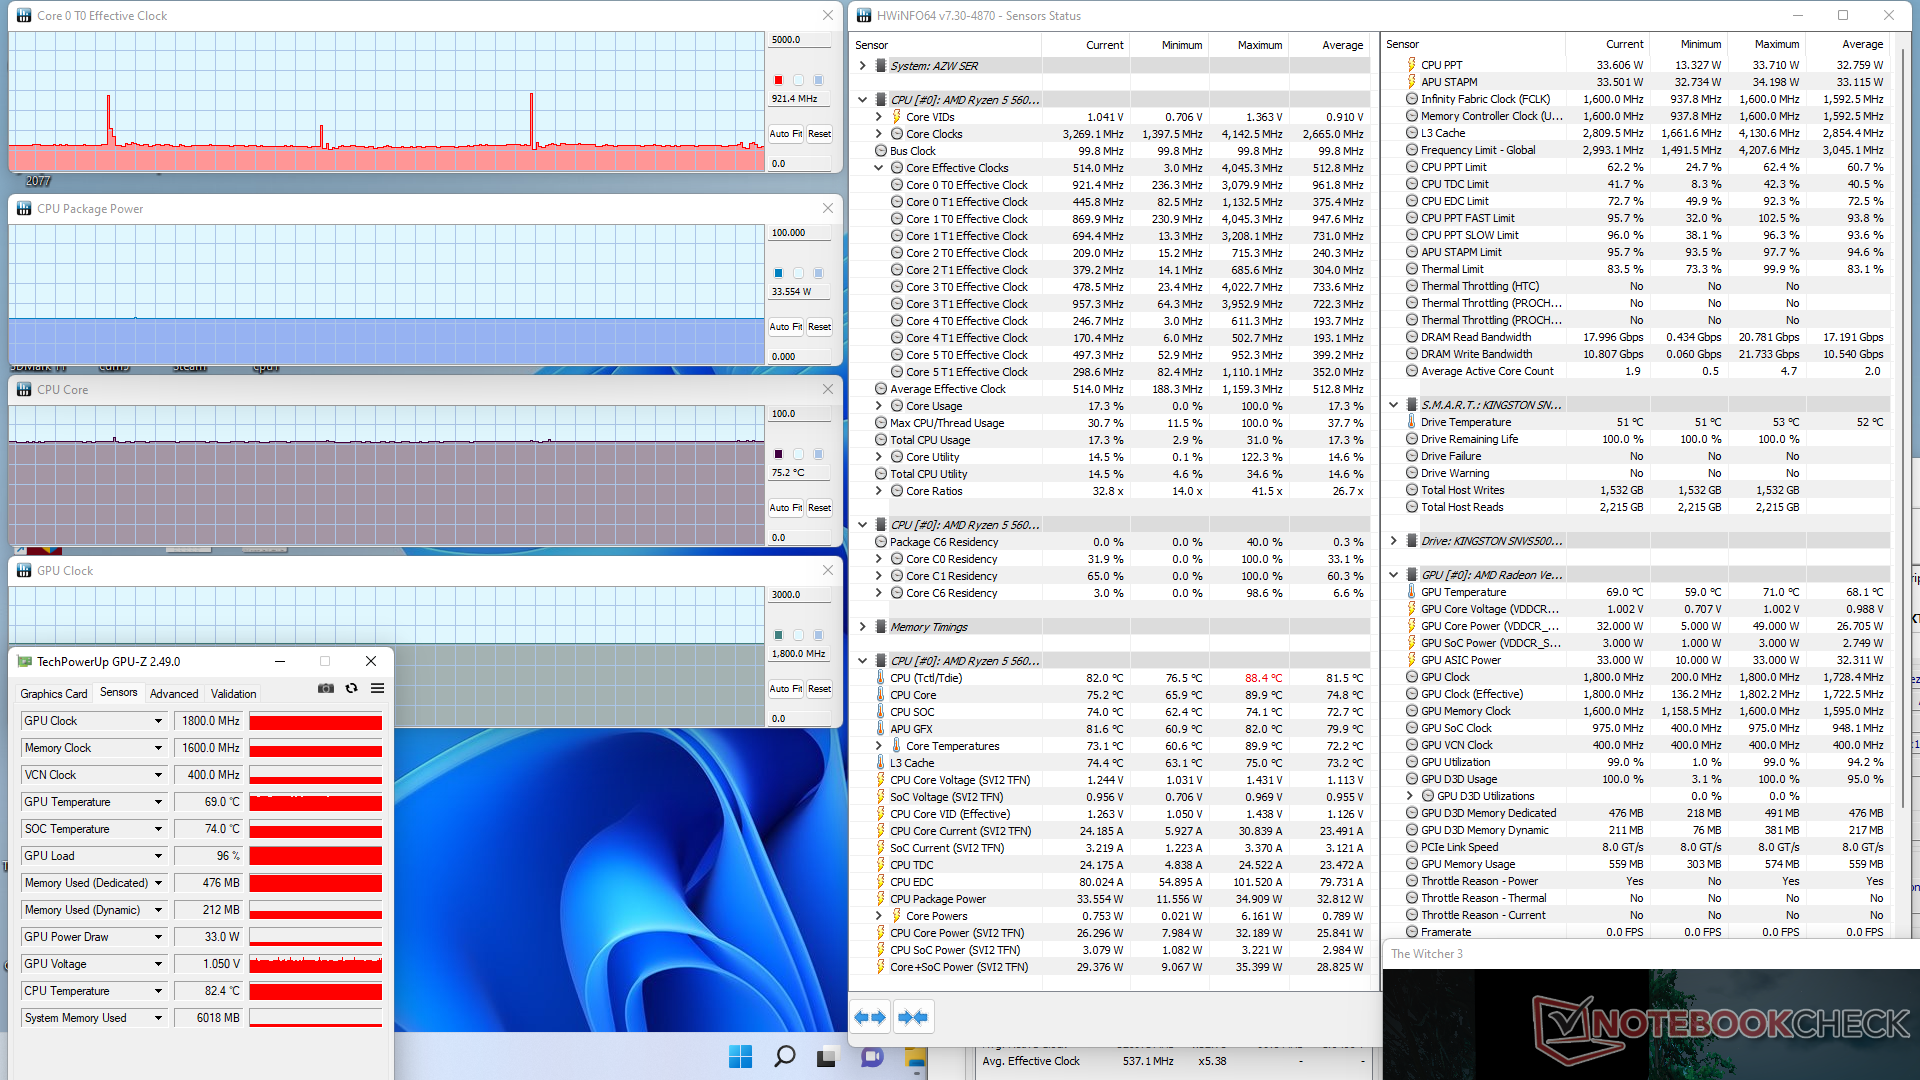
| Fréquence du CPU (GHz) | Fréquence du GPU (MHz) | Température moyenne du CPU (°C) | |
| Système au repos | -- | -- | 39 |
| Prime95 Stress | 3.0 | -- | 85 |
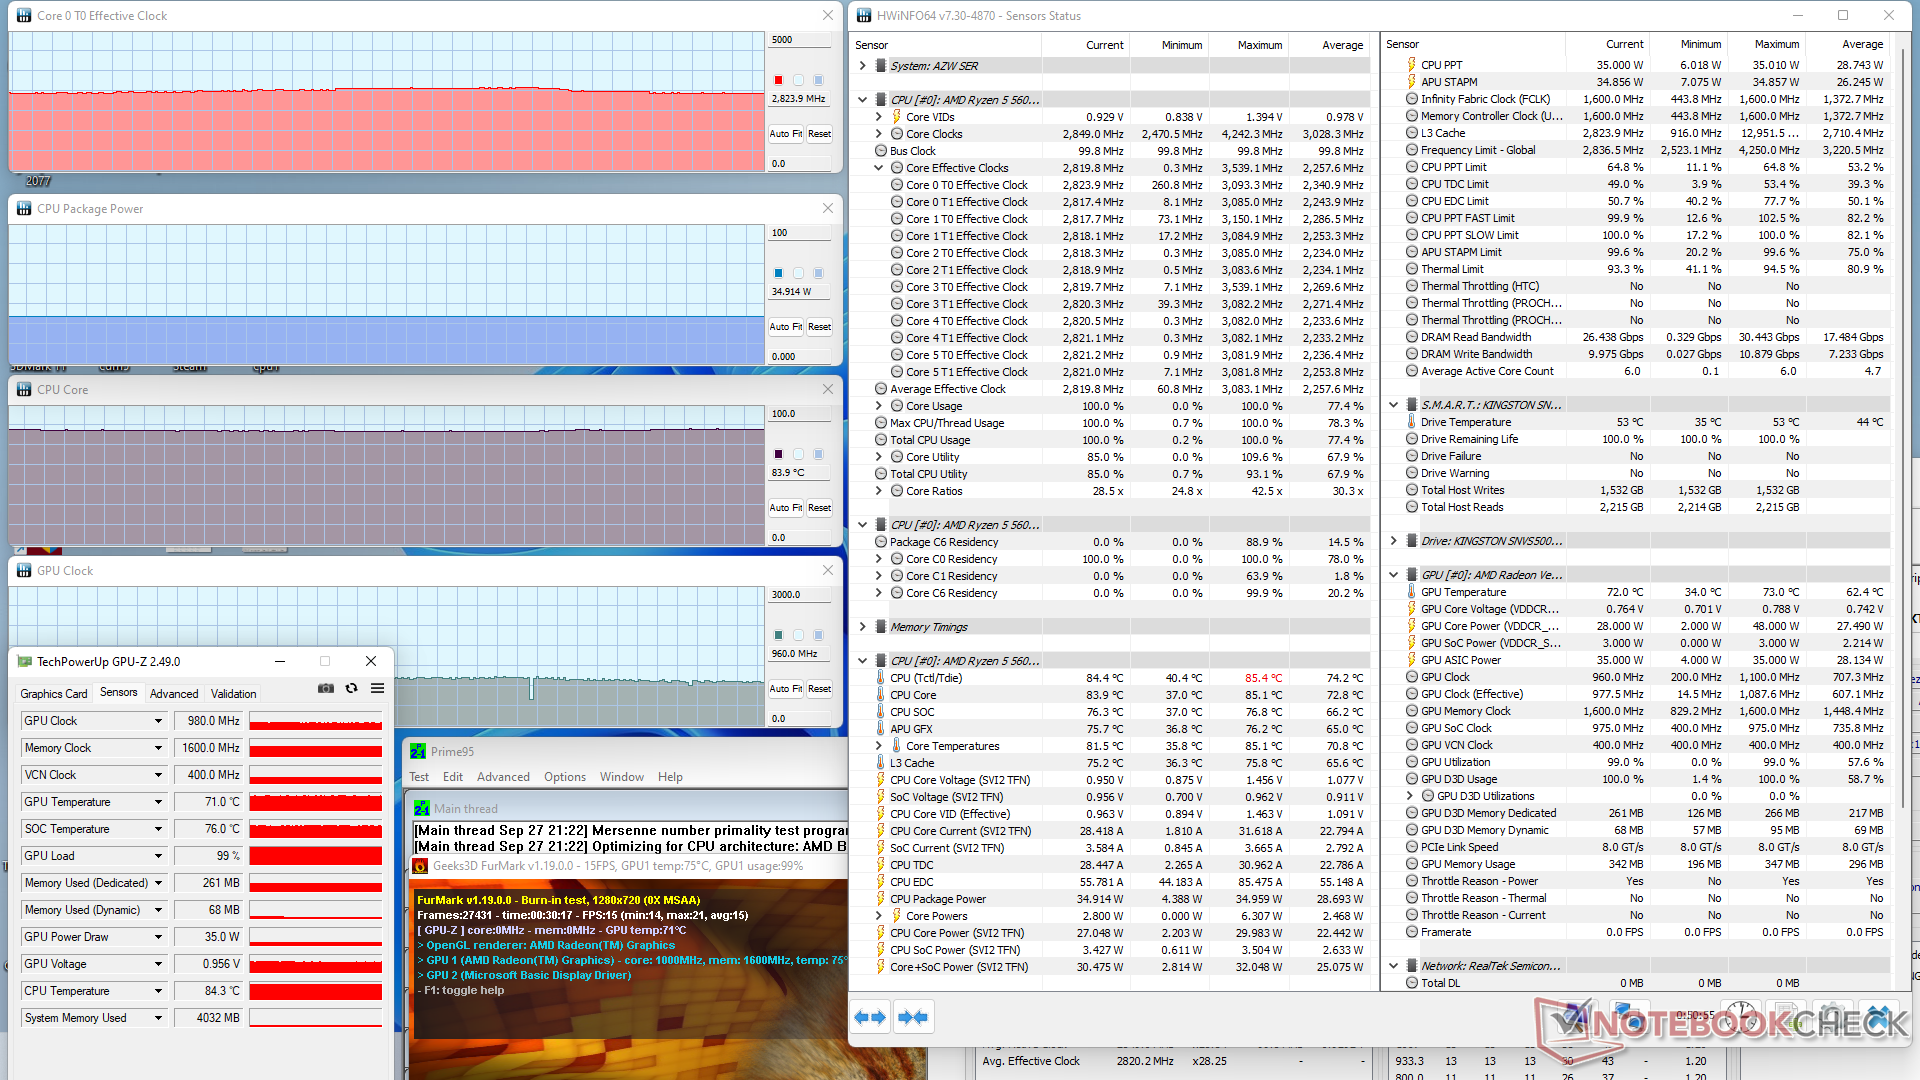
| Prime95 + FurMark Stress | 2.8 | 980 | 84 |
| Witcher 3 Stress | ~0.9 | 1800 | 75 |
Gestion de l'énergie
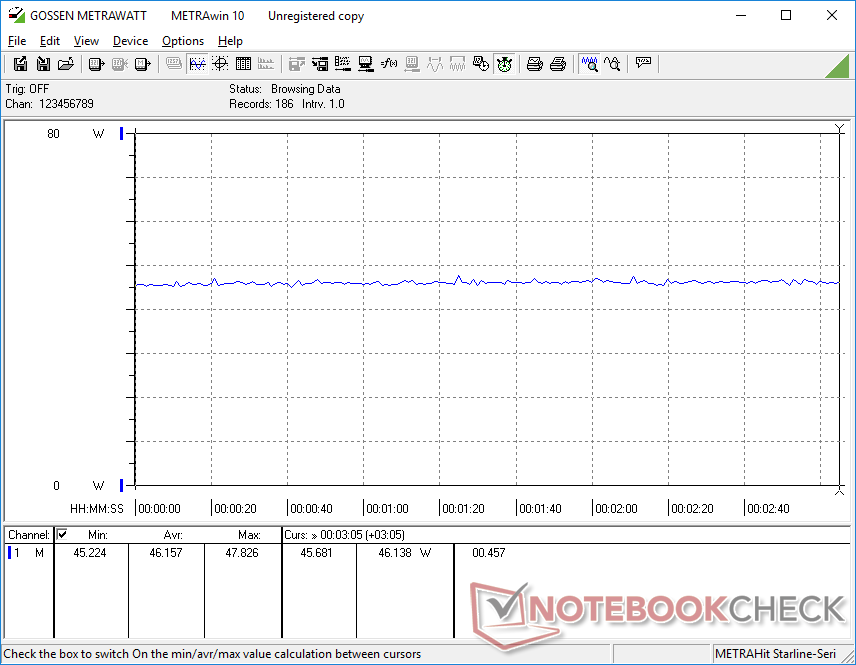
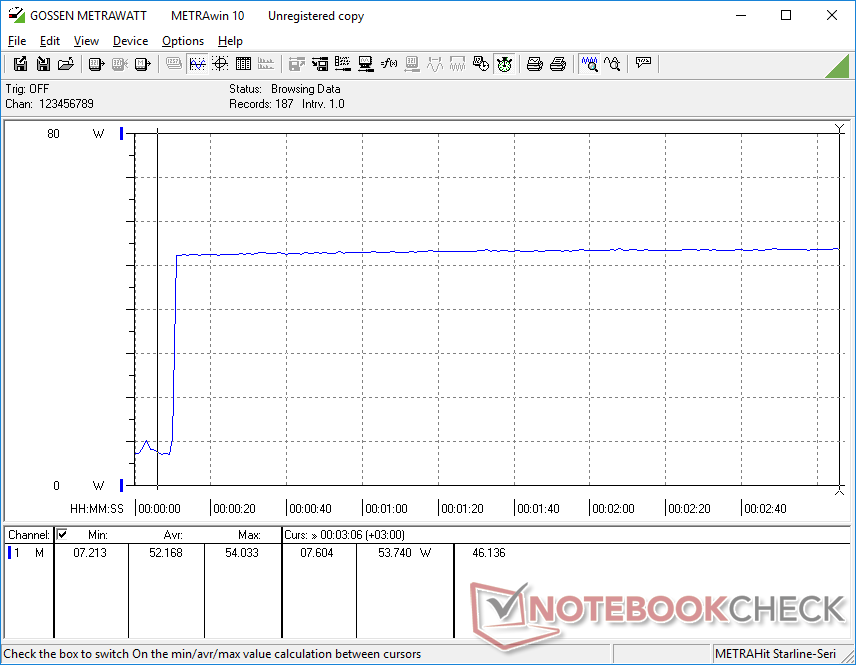
Consommation d'énergie
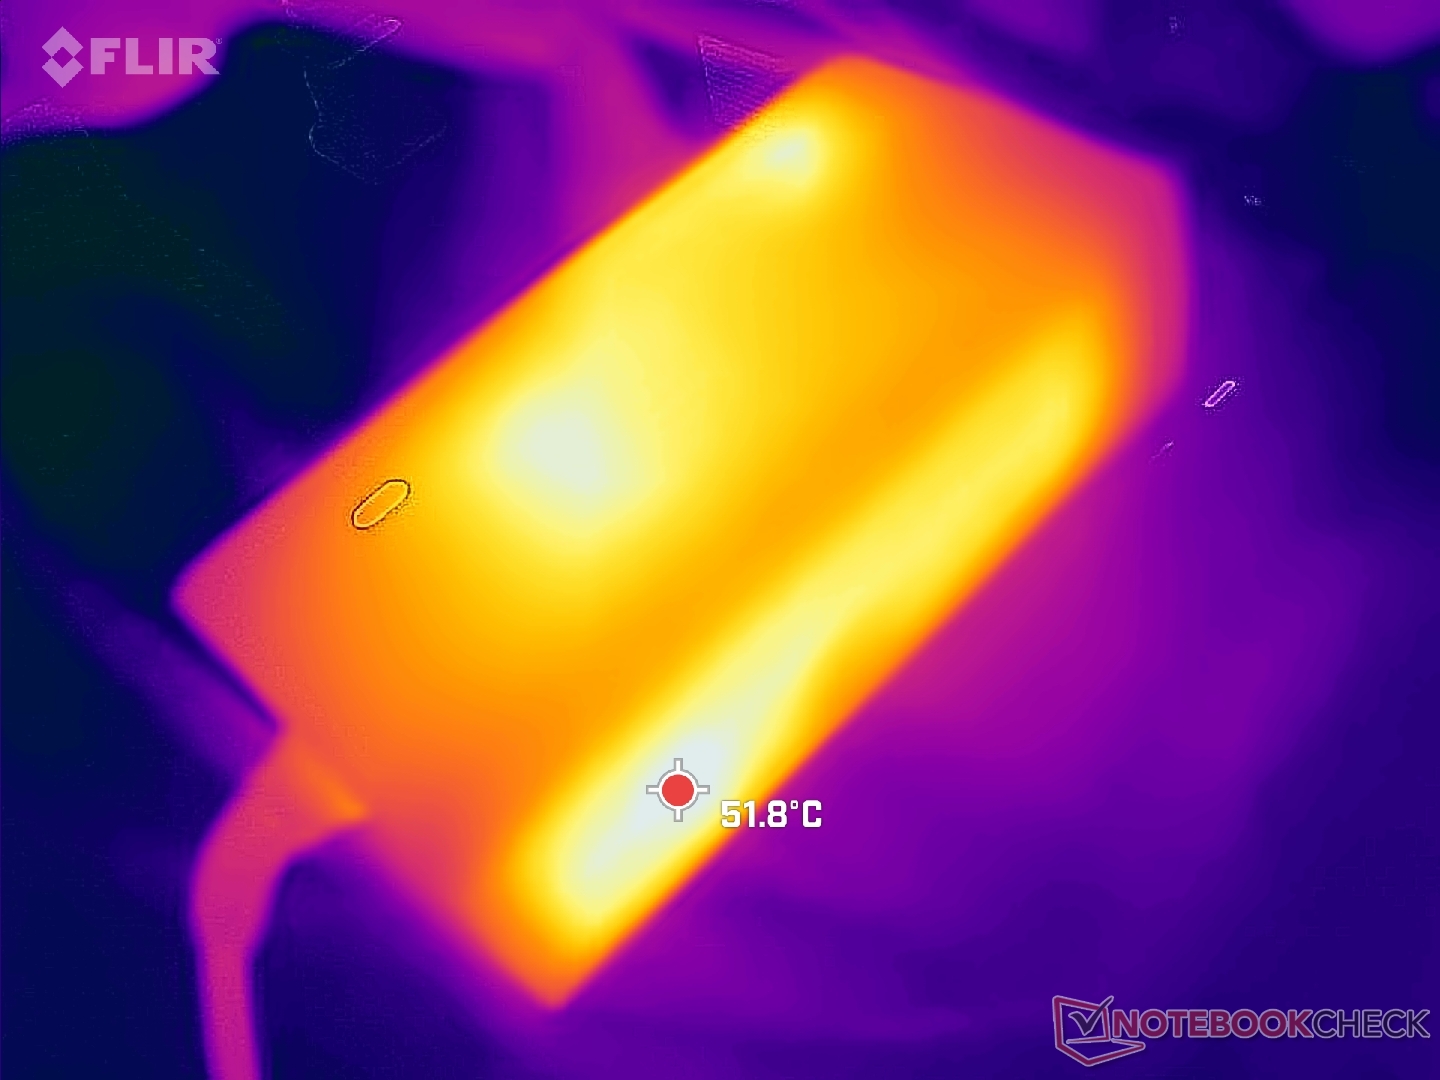
La consommation d'énergie est généralement plus élevée que celle des modèles fonctionnant avec des CPU Ryzen série U ou Core série U, car notre CPU Ryzen série H vise des niveaux de TDP comparativement plus élevés. Le NUC11 d'Intel avec le Core i5-1135G7par exemple, aurait besoin de 40 à 44 W pour jouer, contre 46 à 50 W pour notre Beelink. La performance par watt est tout de même meilleure avec le Ryzen 5 5600H, notamment en termes de performances du CPU multi-thread
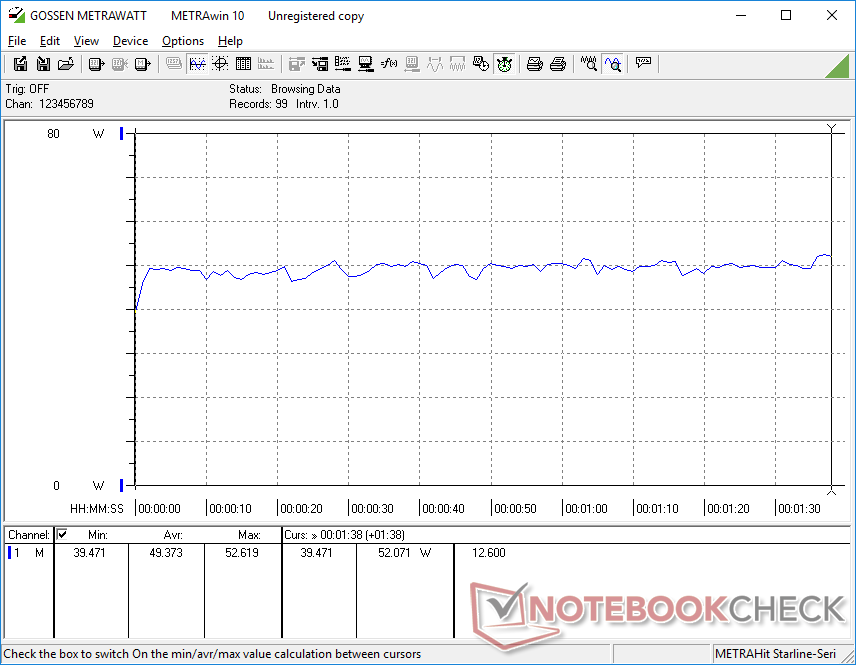
Nous sommes en mesure d'enregistrer une consommation maximale de 50,2 W de l'adaptateur CA petit-moyen (~10 x 4,9 x 3,3 cm) 57 W wall wart lorsque le CPU est utilisé à 100%. Nous pensons que ce chiffre peut être encore plus élevé si plusieurs périphériques USB ou moniteurs externes USB-C sont connectés.

| Éteint/en veille | |
| Au repos | |
| Fortement sollicité |
|
Légende:
min: | |
| Beelink SER Pro Ryzen 5 5600H R5 5600H, Vega 7, Kingston NV1 SNVS/500GCN, , x, | Beelink SEi11 Pro i5-11320H, Iris Xe G7 96EUs, Kingston NV1 SNVS/500GCN, , x, | Beelink GTR5 R9 5900HX, Vega 8, Kingston NV1 SNVS/500GCN, , x, | Intel NUC11TNKi5 i5-1135G7, Iris Xe G7 80EUs, Transcend M.2 SSD 430S TS512GMTS430S, , x, | Beelink SEi8 i3-8109U, Iris Plus Graphics 655, Intel SSD 660p SSDPEKNW512G8, , x, | Beelink SER4 R7 4800U, Vega 8, Intel SSD 660p SSDPEKNW512G8, , x, | |
|---|---|---|---|---|---|---|
| Power Consumption | -30% | -28% | -41% | -2% | 32% | |
| Idle Minimum * (Watt) | 5.4 | 9.8 -81% | 6.2 -15% | 11.5 -113% | 7.5 -39% | 4.1 24% |
| Idle Average * (Watt) | 8.2 | 10.3 -26% | 8.9 -9% | 12.4 -51% | 7.6 7% | 4.1 50% |
| Idle Maximum * (Watt) | 8.3 | 10.5 -27% | 9 -8% | 12.9 -55% | 9.2 -11% | 4.6 45% |
| Load Average * (Watt) | 49.3 | 54.2 -10% | 66.8 -35% | 40.7 17% | 41.1 17% | 35.6 28% |
| Witcher 3 ultra * (Watt) | 46.1 | 53.1 -15% | 62.6 -36% | 43.9 5% | 35.6 23% | |
| Load Maximum * (Watt) | 50.2 | 59 -18% | 81.6 -63% | 73.5 -46% | 41.4 18% | 39.9 21% |
* ... Moindre est la valeur, meilleures sont les performances
Power Consumption Witcher 3 / Stresstest
Power Consumption external Monitor
Points positifs
Points négatifs
Verdict - Une autre excellente alternative au NUC11 d'Intel
Pour environ 450 dollars américains, le Beelink SER5 Pro est livré tout équipé avec 16 Go de RAM, 500 Go de stockage et une copie sous licence de Windows 11 Pro. En revanche, un Intel NUC11PAHi7 équipé de la même capacité de stockage et de RAM se vend actuellement près de 900 $. Le SER5 est même capable d'offrir un processeur plus rapide que celui d'Intel et plusieurs des mêmes options de mise à niveau, y compris SODIMM et double stockage. Si vous cherchez à économiser quelques centaines de dollars, alors le Beelink devrait figurer en bonne place sur votre liste de considérations.
Le Beelink SER5 Pro est des centaines de dollars moins cher qu'un Intel NUC de performance similaire. Les entreprises peuvent toujours préférer la fiabilité du NUC, mais la plupart des utilisateurs privés voudront considérer le Beelink plus abordable.
Il y a un certain nombre d'économies, mais aucune n'a d'impact sur l'expérience de l'utilisateur. Par rapport au NUC d'Intel, le SER5 Pro manque de Thunderbolt, d'un verrou antivol, de la prise en charge des SSD PCIe4, d'une garantie fabricant de trois ans et d'un châssis plus solide. Le NUC peut toujours être le meilleur investissement si ces caractéristiques sont importantes pour vous, mais les économies de prix sont autrement substantielles.
Prix et disponibilité
Le Beelink SER5 est maintenant disponible sur Amazon pour un peu moins de 400 dollars américains.
Price comparison

