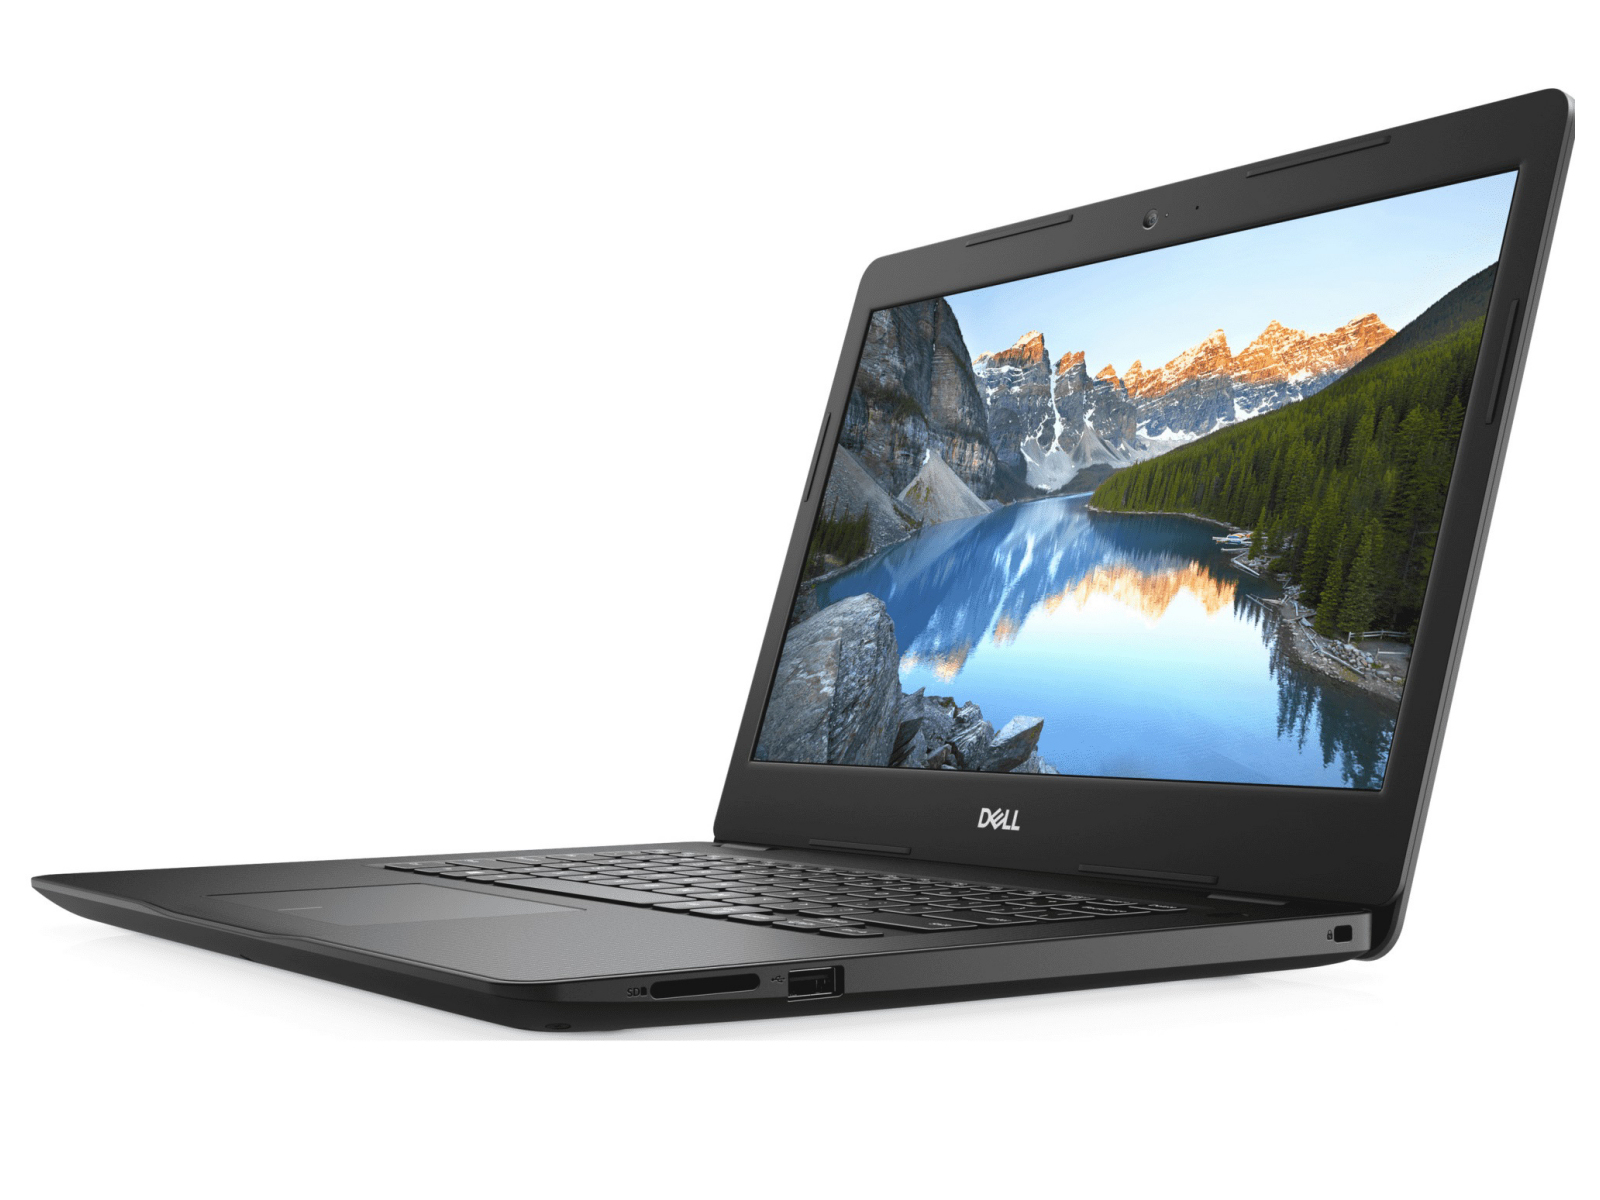
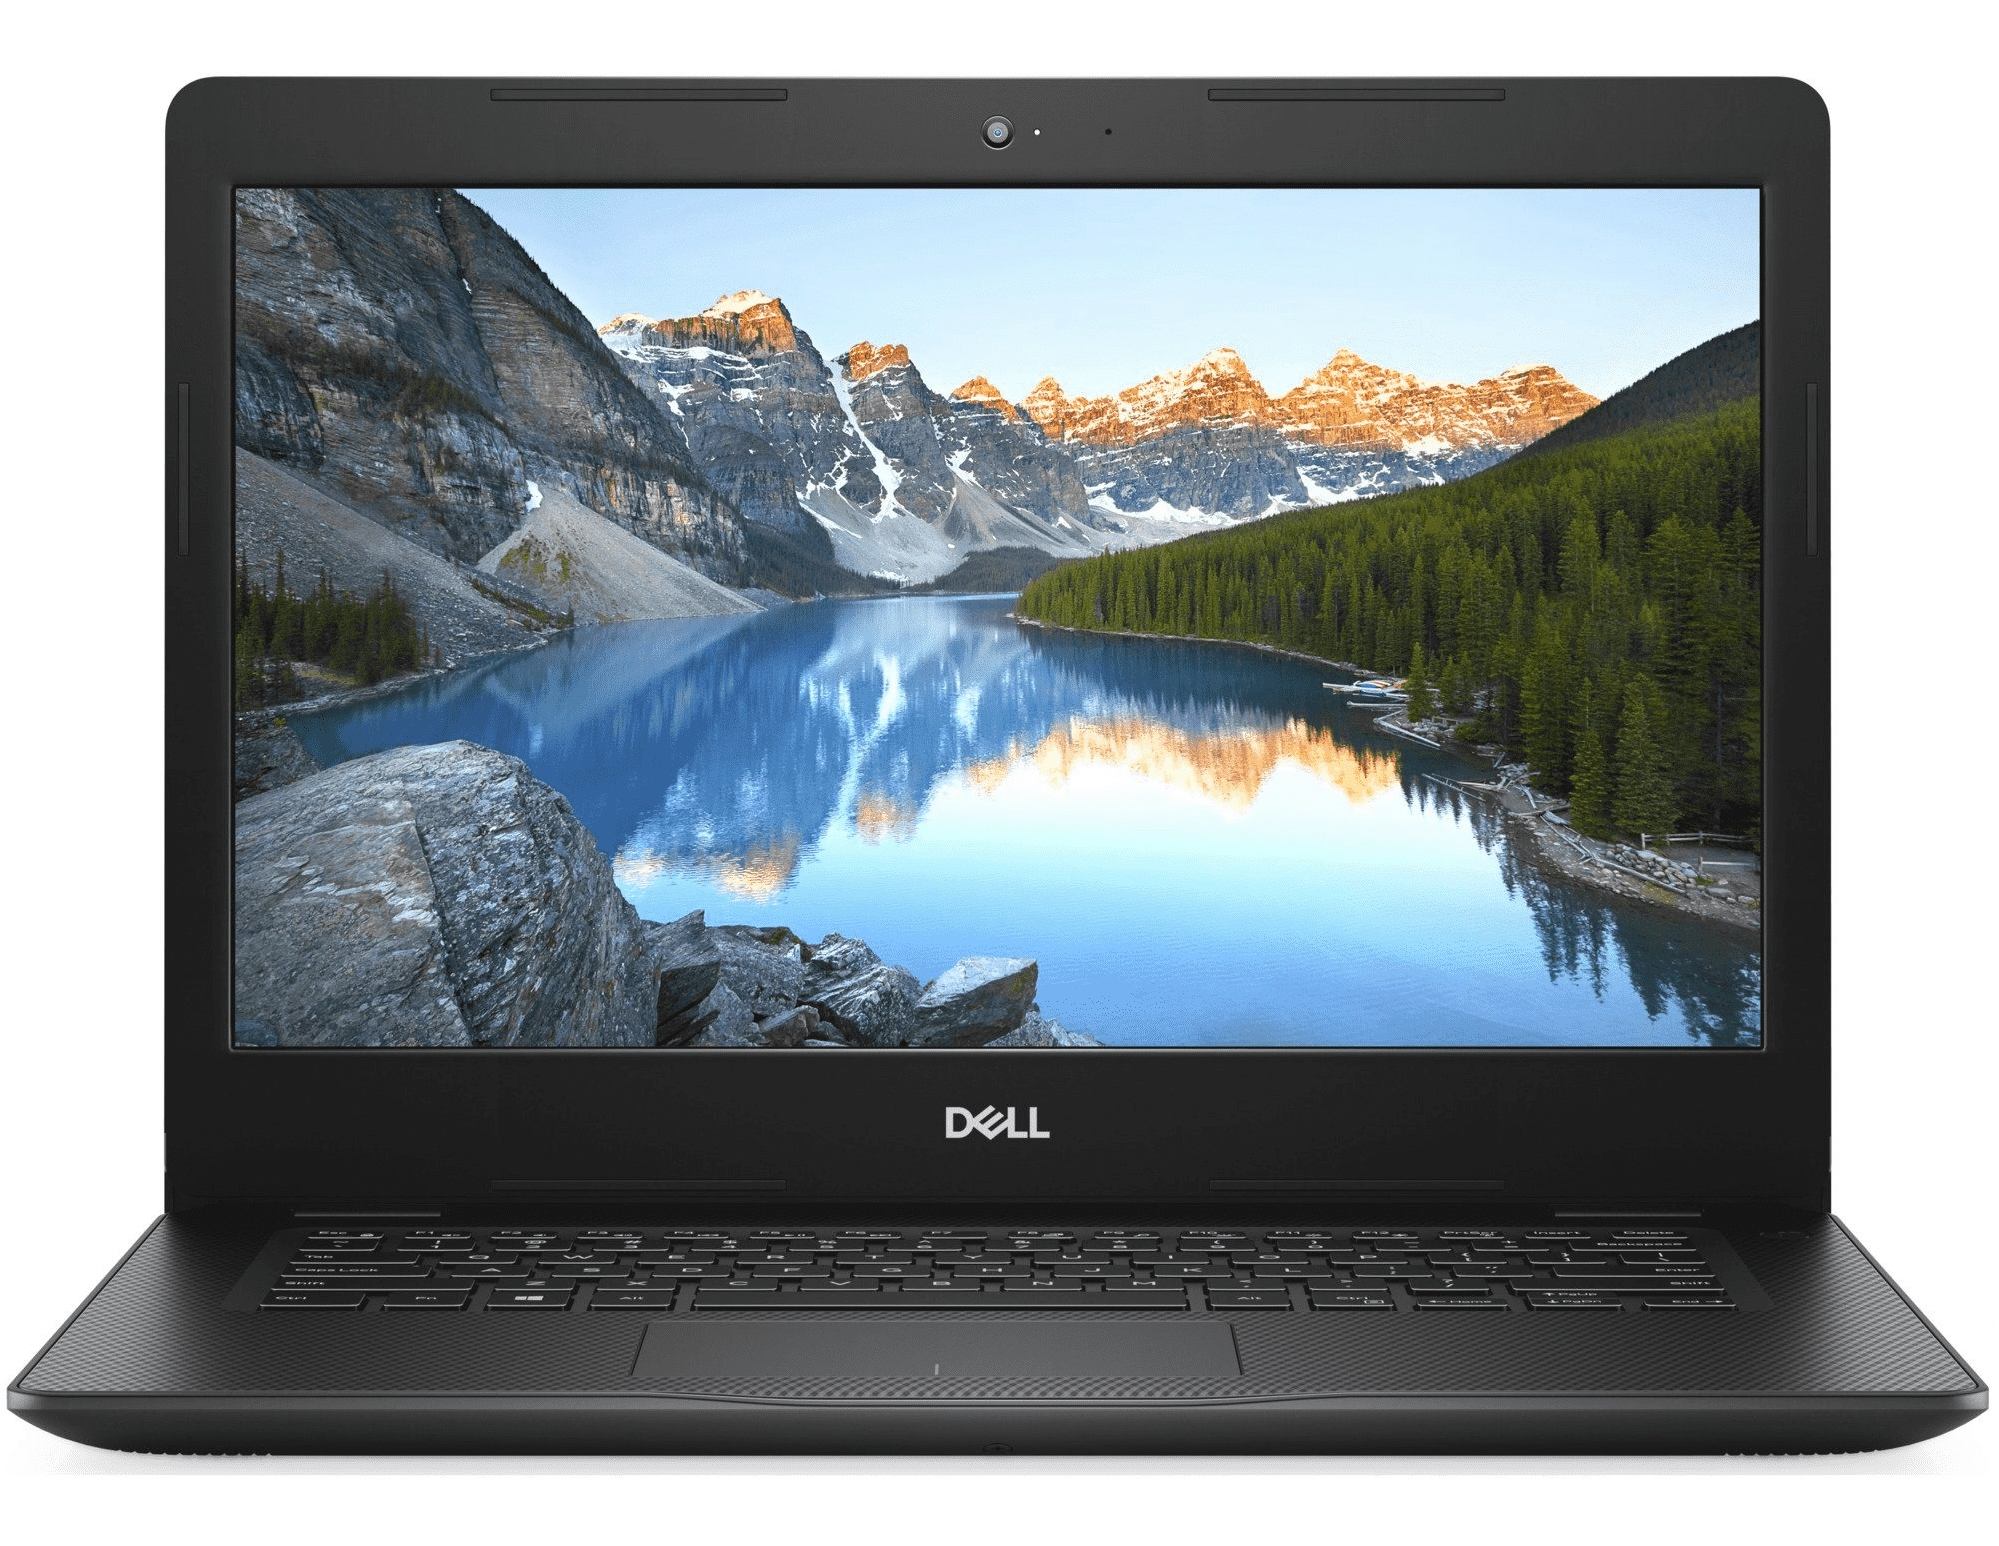
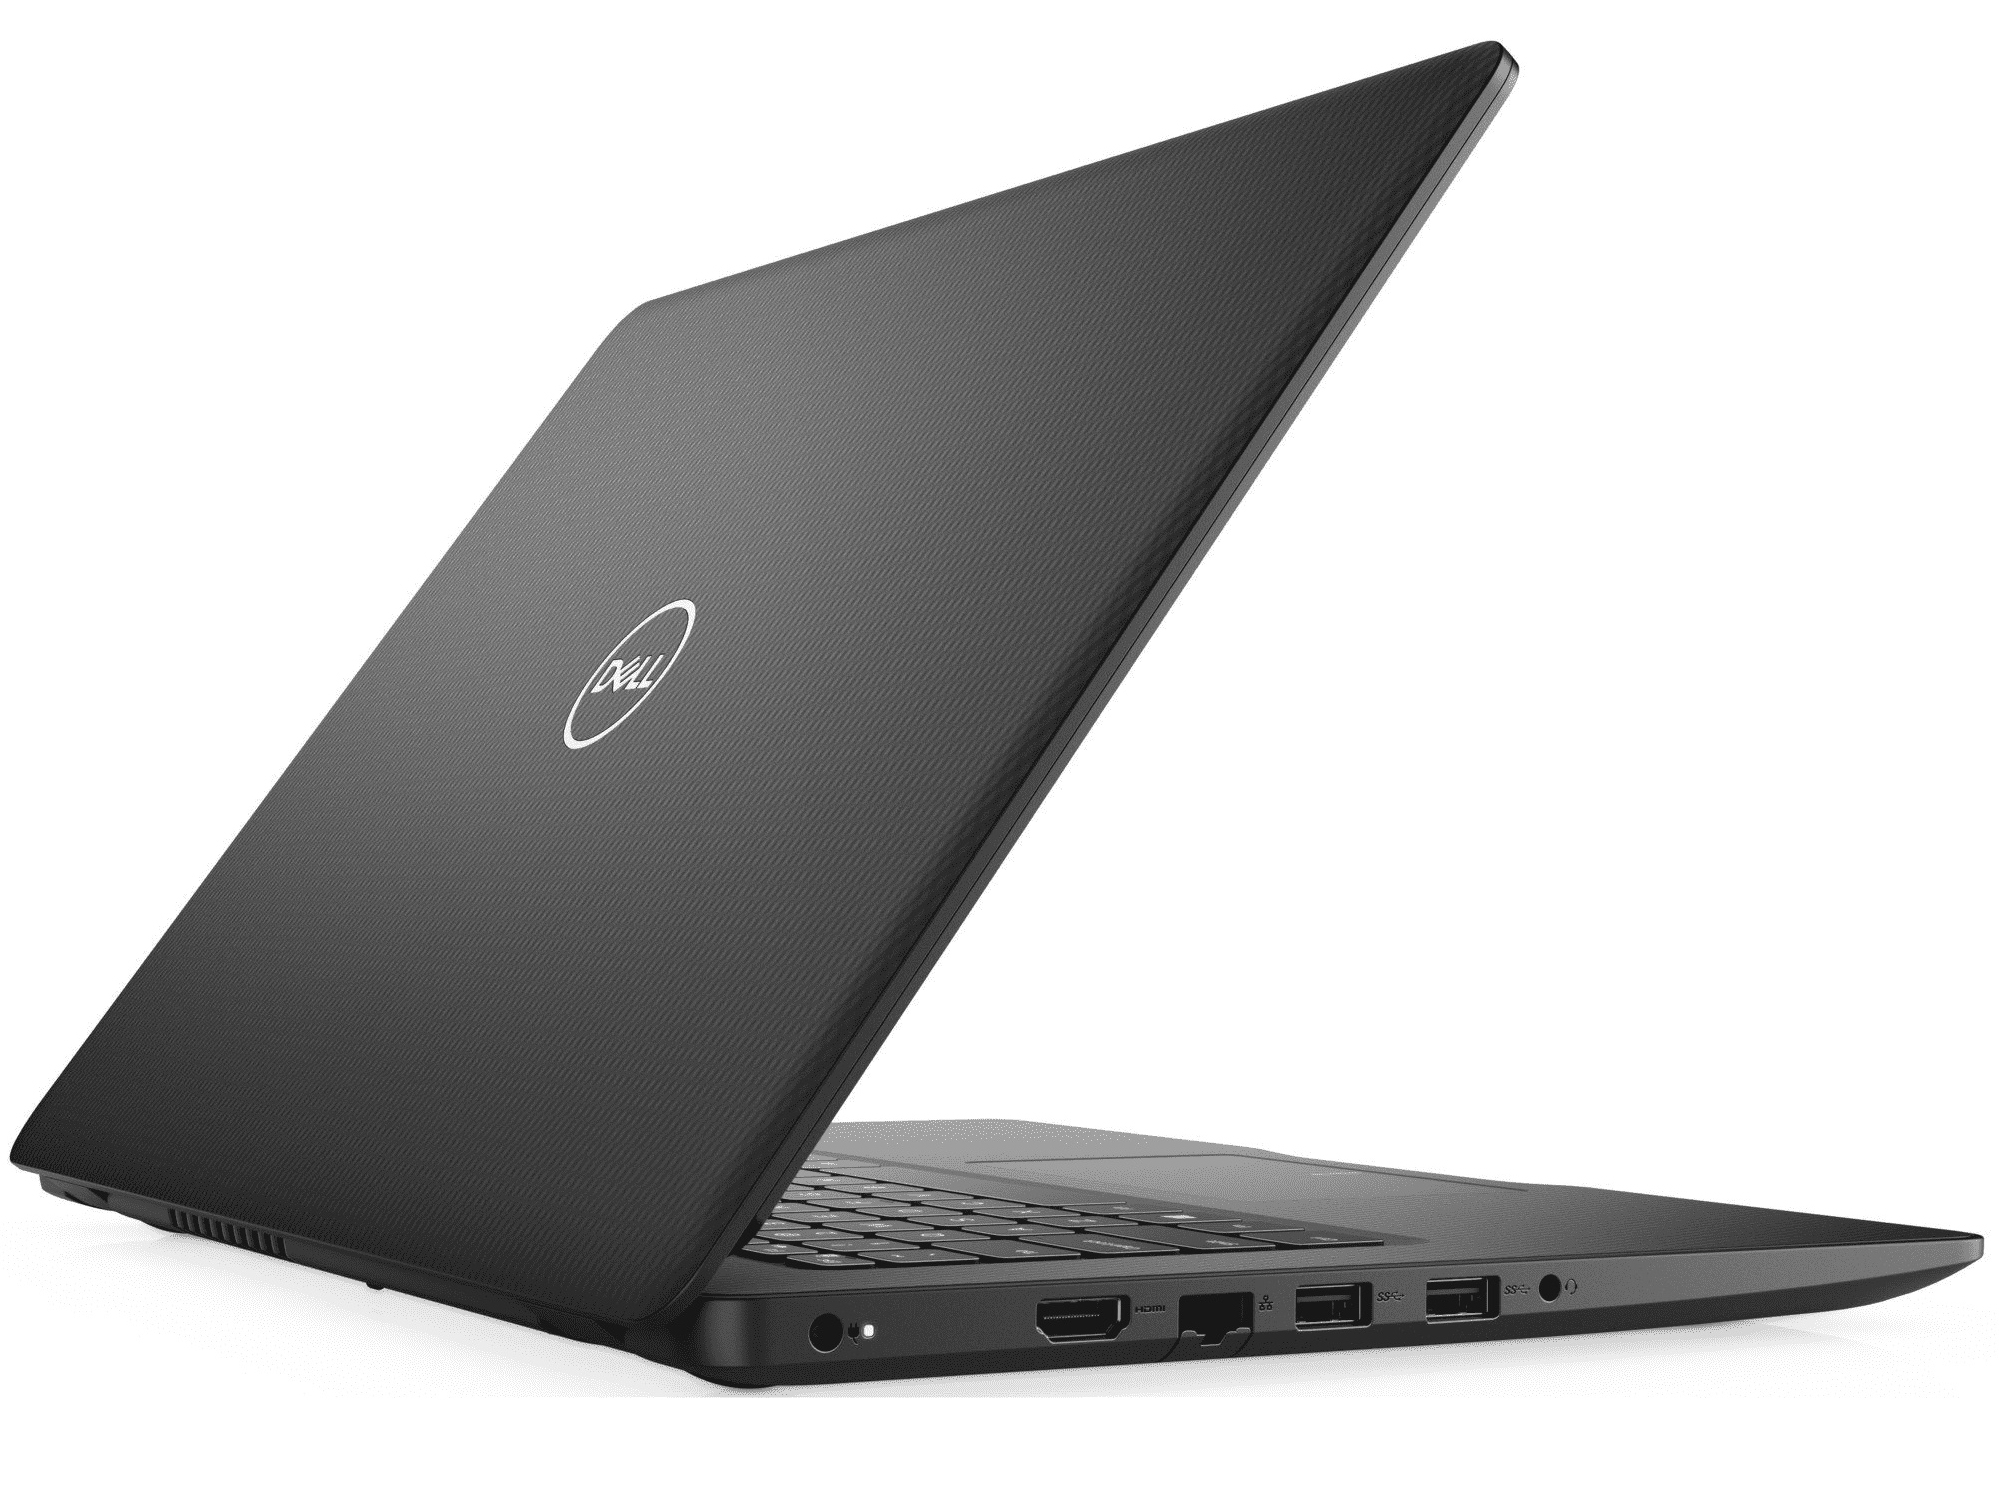
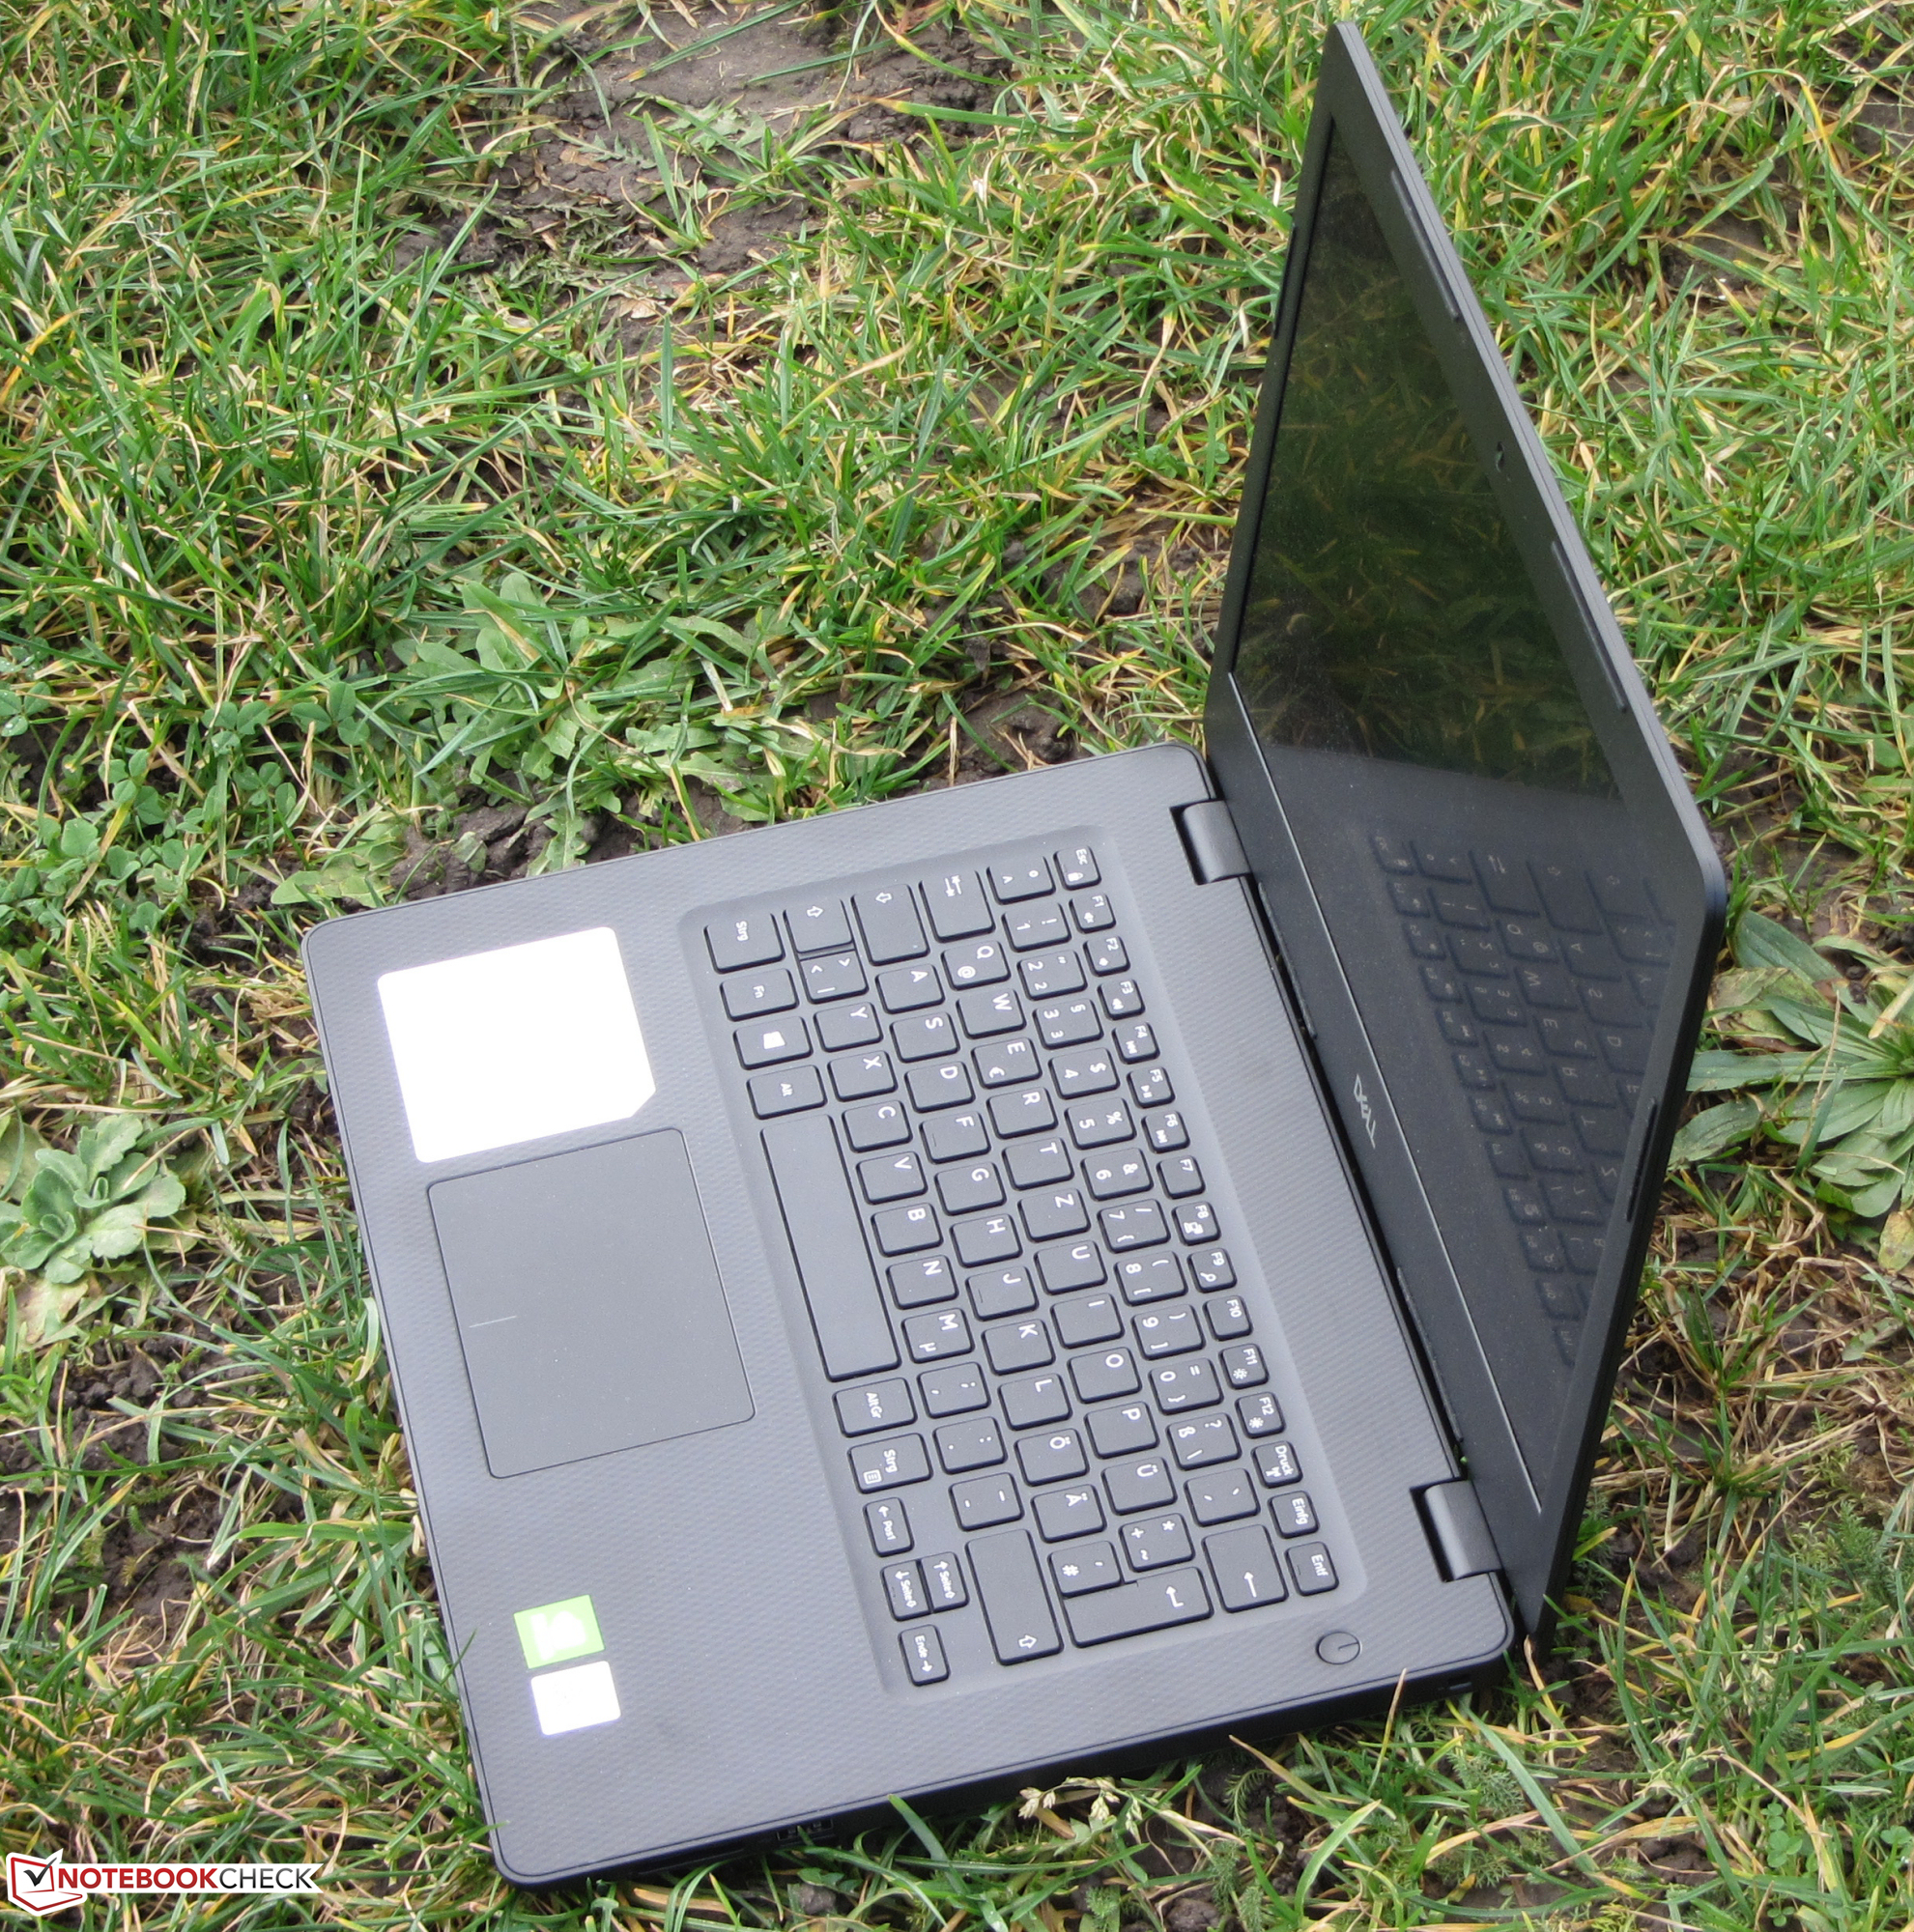
Test du Dell Inspiron 14 3493 (i7-1065G7, MX230, FHD) : le portable de 14 pouces de Dell néglige la carte graphique
Note | Date | Modèle | Poids | Épaisseur | Taille | Résolution | Prix |
|---|---|---|---|---|---|---|---|
| 74.5 % v7 (old) | 01/20 | Dell Inspiron 14 3493-4KWCF i7-1065G7, GeForce MX230 | 1.8 kg | 21 mm | 14.00" | 1920x1080 | |
| 83.8 % v6 (old) | 08/19 | Asus VivoBook 14 X412FJ-EB023T i5-8265U, GeForce MX230 | 1.5 kg | 19 mm | 14.00" | 1920x1080 | |
| 81.9 % v6 (old) | 06/19 | HP 14-dk0008ng R7 3700U, Vega 10 | 1.5 kg | 20 mm | 14.00" | 1920x1080 | |
| 82.7 % v7 (old) | 11/19 | Acer Swift 3 SF314-41-R8HZ R5 3500U, Vega 8 | 1.5 kg | 18 mm | 14.00" | 1920x1080 | |
| 84.8 % v6 (old) | 06/19 | Lenovo Ideapad S340-14IWL-81N70056GE i7-8565U, GeForce MX230 | 1.6 kg | 17.9 mm | 14.00" | 1920x1080 | |
| 84.6 % v7 (old) | 05/19 | Huawei MateBook D 14 W00D-53010GXL R5 2500U, Vega 8 | 1.5 kg | 16 mm | 14.00" | 1920x1080 |
| |||||||||||||||||||||||||
Homogénéité de la luminosité: 92 %
Valeur mesurée au centre, sur batterie: 195 cd/m²
Contraste: 1329:1 (Valeurs des noirs: 0.17 cd/m²)
ΔE ColorChecker Calman: 5.21 | ∀{0.5-29.43 Ø4.72}
calibrated: 4.43
ΔE Greyscale Calman: 3.27 | ∀{0.09-98 Ø4.97}
62% sRGB (Argyll 1.6.3 3D)
40% AdobeRGB 1998 (Argyll 1.6.3 3D)
43.33% AdobeRGB 1998 (Argyll 3D)
62.3% sRGB (Argyll 3D)
41.84% Display P3 (Argyll 3D)
Gamma: 2.36
CCT: 6538 K
| Dell Inspiron 14 3493-4KWCF IPS, 1920x1080, 14" | Asus VivoBook 14 X412FJ-EB023T IPS, 1920x1080, 14" | HP 14-dk0008ng IPS, 1920x1080, 14" | Acer Swift 3 SF314-41-R8HZ IPS, 1920x1080, 14" | Lenovo Ideapad S340-14IWL-81N70056GE IPS, 1920x1080, 14" | Huawei MateBook D 14 W00D-53010GXL IPS, 1920x1080, 14" | |
|---|---|---|---|---|---|---|
| Display | -5% | -6% | -1% | -8% | 5% | |
| Display P3 Coverage (%) | 41.84 | 39.65 -5% | 39.53 -6% | 41.43 -1% | 38.41 -8% | 44.26 6% |
| sRGB Coverage (%) | 62.3 | 59.5 -4% | 59.1 -5% | 61.8 -1% | 57.8 -7% | 65.1 4% |
| AdobeRGB 1998 Coverage (%) | 43.33 | 40.96 -5% | 40.84 -6% | 42.85 -1% | 39.68 -8% | 45.73 6% |
| Response Times | 4% | 10% | 10% | 13% | -5% | |
| Response Time Grey 50% / Grey 80% * (ms) | 41 ? | 40 ? 2% | 38 ? 7% | 38 ? 7% | 36 ? 12% | 42.4 ? -3% |
| Response Time Black / White * (ms) | 31 ? | 29 ? 6% | 27 ? 13% | 27 ? 13% | 27 ? 13% | 32.8 ? -6% |
| PWM Frequency (Hz) | 2500 ? | 250 ? | 198.4 ? | |||
| Screen | 7% | 13% | -4% | -11% | 0% | |
| Brightness middle (cd/m²) | 226 | 274 21% | 269 19% | 233 3% | 260 15% | 287 27% |
| Brightness (cd/m²) | 214 | 255 19% | 257 20% | 219 2% | 250 17% | 276 29% |
| Brightness Distribution (%) | 92 | 89 -3% | 89 -3% | 75 -18% | 87 -5% | 86 -7% |
| Black Level * (cd/m²) | 0.17 | 0.305 -79% | 0.2 -18% | 0.14 18% | 0.29 -71% | 0.25 -47% |
| Contrast (:1) | 1329 | 898 -32% | 1345 1% | 1664 25% | 897 -33% | 1148 -14% |
| Colorchecker dE 2000 * | 5.21 | 3.66 30% | 3.68 29% | 5.9 -13% | 6.29 -21% | 5.4 -4% |
| Colorchecker dE 2000 max. * | 22.15 | 7.54 66% | 7.36 67% | 22.8 -3% | 14.77 33% | 18.1 18% |
| Colorchecker dE 2000 calibrated * | 4.43 | 4.8 -8% | 4.51 -2% | 5 -13% | ||
| Greyscale dE 2000 * | 3.27 | 1.45 56% | 1.69 48% | 4.8 -47% | 4.65 -42% | 3.1 5% |
| Gamma | 2.36 93% | 2.49 88% | 2.49 88% | 2.06 107% | 2.73 81% | 1.99 111% |
| CCT | 6538 99% | 6597 99% | 6406 101% | 6589 99% | 7331 89% | 6769 96% |
| Color Space (Percent of AdobeRGB 1998) (%) | 40 | 38 -5% | 38 -5% | 39 -2% | 37 -7% | 41.8 5% |
| Color Space (Percent of sRGB) (%) | 62 | 59 -5% | 59 -5% | 62 0% | 58 -6% | 64.6 4% |
| Moyenne finale (programmes/paramètres) | 2% /
4% | 6% /
9% | 2% /
-1% | -2% /
-8% | 0% /
1% |
* ... Moindre est la valeur, meilleures sont les performances
Temps de réponse de l'écran
| ↔ Temps de réponse noir à blanc | ||
|---|---|---|
| 31 ms ... hausse ↗ et chute ↘ combinées | ↗ 18 ms hausse | 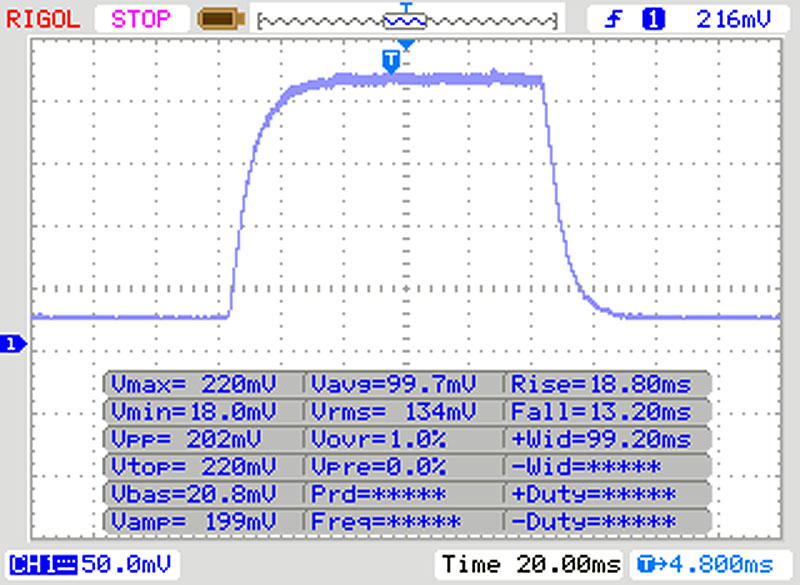 |
| ↘ 13 ms chute | ||
| L'écran souffre de latences très élevées, à éviter pour le jeu. En comparaison, tous les appareils testés affichent entre 0.1 (minimum) et 240 (maximum) ms. » 84 % des appareils testés affichent de meilleures performances. Cela signifie que les latences relevées sont moins bonnes que la moyenne (19.8 ms) de tous les appareils testés. | ||
| ↔ Temps de réponse gris 50% à gris 80% | ||
| 41 ms ... hausse ↗ et chute ↘ combinées | ↗ 23 ms hausse | 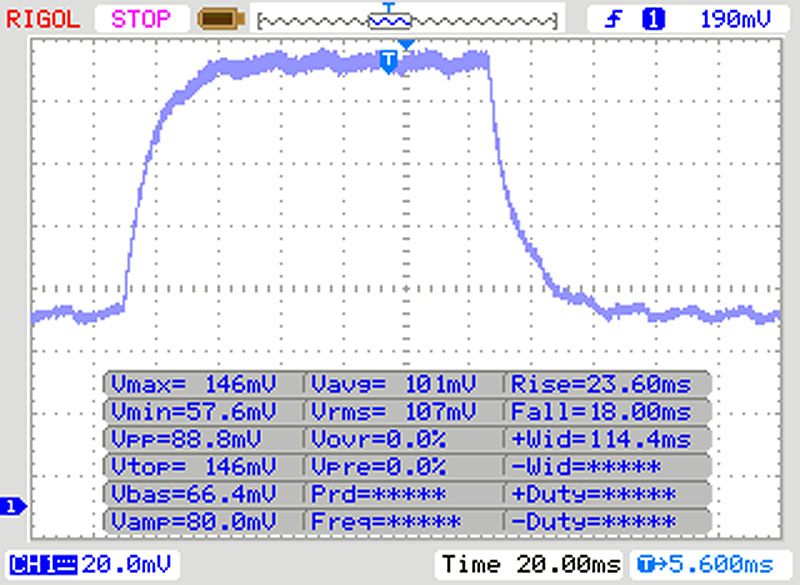 |
| ↘ 18 ms chute | ||
| L'écran souffre de latences très élevées, à éviter pour le jeu. En comparaison, tous les appareils testés affichent entre 0.165 (minimum) et 636 (maximum) ms. » 65 % des appareils testés affichent de meilleures performances. Cela signifie que les latences relevées sont moins bonnes que la moyenne (31 ms) de tous les appareils testés. | ||
Scintillement / MLI (Modulation de largeur d'impulsion)
| Scintillement / MLI (Modulation de largeur d'impulsion) décelé | 2500 Hz | ≤ 20 Niveau de luminosité | 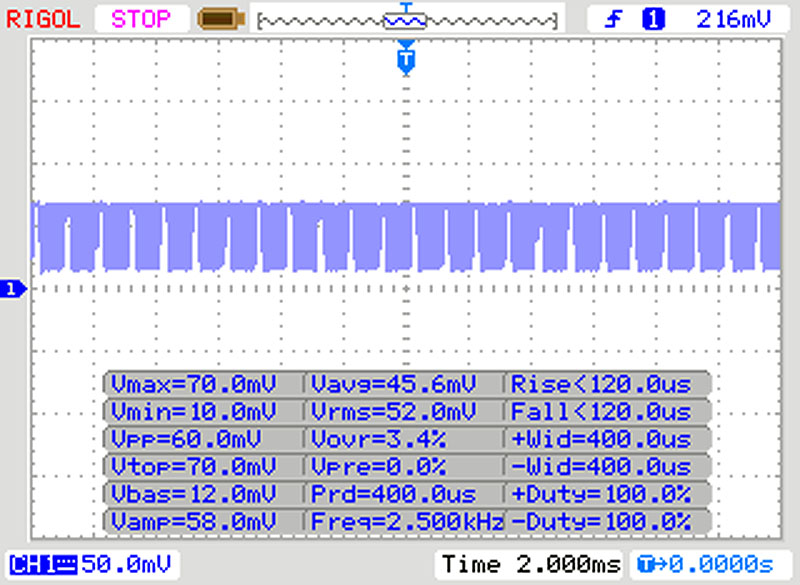 |
Le rétroéclairage de l'écran scintille à la fréquence de 2500 Hz (certainement du fait de l'utilisation d'une MDI - Modulation de largeur d'impulsion) à un niveau de luminosité inférieur ou égal à 20 % . Aucun scintillement ne devrait être perceptible au-dessus de cette valeur. La fréquence de rafraîchissement de 2500 Hz est élevée, la grande majorité des utilisateurs ne devrait pas percevoir de scintillements et être sujette à une fatigue oculaire accrue. En comparaison, 52 % des appareils testés n'emploient pas MDI pour assombrir leur écran. Nous avons relevé une moyenne à 7769 (minimum : 5 - maximum : 343500) Hz dans le cas où une MDI était active. | |||
| Geekbench 3 | |
| 32 Bit Multi-Core Score | |
| Dell Inspiron 14 3493-4KWCF | |
| Moyenne Intel Core i7-1065G7 (n=1) | |
| Asus VivoBook 14 X412FJ-EB023T | |
| Acer Swift 3 SF314-41-R8HZ | |
| HP 14-dk0008ng | |
| 32 Bit Single-Core Score | |
| Dell Inspiron 14 3493-4KWCF | |
| Moyenne Intel Core i7-1065G7 (n=1) | |
| Asus VivoBook 14 X412FJ-EB023T | |
| Acer Swift 3 SF314-41-R8HZ | |
| HP 14-dk0008ng | |
| Geekbench 5.0 | |
| 5.0 Multi-Core | |
| Moyenne Intel Core i7-1065G7 (3375 - 4839, n=6) | |
| Dell Inspiron 14 3493-4KWCF | |
| Acer Swift 3 SF314-41-R8HZ | |
| 5.0 Single-Core | |
| Moyenne Intel Core i7-1065G7 (1184 - 1334, n=6) | |
| Dell Inspiron 14 3493-4KWCF | |
| Acer Swift 3 SF314-41-R8HZ | |
| Mozilla Kraken 1.1 - Total | |
| Huawei MateBook D 14 W00D-53010GXL | |
| HP 14-dk0008ng (Edge 44) | |
| Acer Swift 3 SF314-41-R8HZ (Edge 44) | |
| Asus VivoBook 14 X412FJ-EB023T (Edge 44) | |
| Dell Inspiron 14 3493-4KWCF (Edge 44) | |
| Moyenne Intel Core i7-1065G7 (788 - 1249, n=30) | |
| Lenovo Ideapad S340-14IWL-81N70056GE | |
| Moyenne de la classe Multimedia (228 - 835, n=73, 2 dernières années) | |
| JetStream 1.1 - 1.1 Total | |
| Moyenne de la classe Multimedia (n=12 dernières années) | |
| Dell Inspiron 14 3493-4KWCF (Edge 44) | |
| Moyenne Intel Core i7-1065G7 (205 - 273, n=16) | |
| Lenovo Ideapad S340-14IWL-81N70056GE | |
| Asus VivoBook 14 X412FJ-EB023T (Edge 44) | |
| Acer Swift 3 SF314-41-R8HZ (Edge 44) | |
| HP 14-dk0008ng (Edge 44) | |
| Huawei MateBook D 14 W00D-53010GXL | |
* ... Moindre est la valeur, meilleures sont les performances
| PCMark 8 Home Score Accelerated v2 | 3355 points | |
| PCMark 8 Creative Score Accelerated v2 | 3948 points | |
| PCMark 8 Work Score Accelerated v2 | 4955 points | |
| PCMark 10 Score | 3862 points | |
Aide | ||

| Dell Inspiron 14 3493-4KWCF Toshiba KBG40ZNS512G NVMe | Asus VivoBook 14 X412FJ-EB023T Kingston RBUSNS8180DS3256GJ | HP 14-dk0008ng Samsung PM871b MZNLN128HAHQ | Acer Swift 3 SF314-41-R8HZ WDC PC SN520 SDAPNUW-512G | Lenovo Ideapad S340-14IWL-81N70056GE WDC PC SN520 SDAPNUW-512G | Huawei MateBook D 14 W00D-53010GXL SK Hynix SC313 HFS256G39TNF | Moyenne Toshiba KBG40ZNS512G NVMe | |
|---|---|---|---|---|---|---|---|
| CrystalDiskMark 5.2 / 6 | -60% | -58% | -15% | -2% | -59% | -9% | |
| Write 4K (MB/s) | 159.6 | 79.7 -50% | 90.6 -43% | 134.3 -16% | 160.8 1% | 72.3 -55% | 126.4 ? -21% |
| Read 4K (MB/s) | 53.5 | 28.14 -47% | 33.17 -38% | 43.56 -19% | 50.5 -6% | 30.77 -42% | 50 ? -7% |
| Write Seq (MB/s) | 1174 | 450.9 -62% | 483 -59% | 1434 22% | 1458 24% | 468.1 -60% | 1207 ? 3% |
| Read Seq (MB/s) | 1648 | 434.7 -74% | 511 -69% | 1448 -12% | 1447 -12% | 518 -69% | 1567 ? -5% |
| Write 4K Q32T1 (MB/s) | 420.8 | 228.5 -46% | 170.7 -59% | 239.1 -43% | 406.5 -3% | 214.2 -49% | 347 ? -18% |
| Read 4K Q32T1 (MB/s) | 564 | 244.1 -57% | 235 -58% | 327.6 -42% | 476.8 -15% | 241.1 -57% | 425 ? -25% |
| Write Seq Q32T1 (MB/s) | 1231 | 478.4 -61% | 496.5 -60% | 1456 18% | 1458 18% | 482 -61% | 1224 ? -1% |
| Read Seq Q32T1 (MB/s) | 2274 | 456.6 -80% | 534 -77% | 1734 -24% | 1743 -23% | 537 -76% | 2278 ? 0% |
| 3DMark 11 Performance | 3316 points | |
| 3DMark Ice Storm Standard Score | 47692 points | |
| 3DMark Cloud Gate Standard Score | 10313 points | |
| 3DMark Fire Strike Score | 2041 points | |
| 3DMark Time Spy Score | 786 points | |
Aide | ||
| BioShock Infinite - 1366x768 High Preset | |
| Lenovo Ideapad S340-14IWL-81N70056GE | |
| Asus VivoBook 14 X412FJ-EB023T | |
| Moyenne NVIDIA GeForce MX230 (61.8 - 79.8, n=5) | |
| Dell Inspiron 14 3493-4KWCF | |
| Microsoft Surface Laptop 3 15 i7-1065G7 | |
| Lenovo Yoga C940-14IIL | |
| Lenovo Yoga C940-14IIL 81Q9 | |
| Acer Swift 3 SF314-41-R8HZ | |
| HP 14-dk0008ng | |
| HP Spectre x360 13-aw0013dx | |
| Dell Inspiron 14 3493-4KWCF (Dual-Channel) | |
| Overwatch - 1366x768 Medium (Render Scale 100 %) AA:FX AF:2x | |
| Dell Inspiron 14 3493-4KWCF | |
| Moyenne NVIDIA GeForce MX230 (78.3 - 83, n=2) | |
| Dell Inspiron 14 3493-4KWCF (Dual-Channel) | |
| Microsoft Surface Laptop 3 15 i7-1065G7 | |
| Bas | Moyen | Élevé | Ultra | |
|---|---|---|---|---|
| Tomb Raider (2013) | 150.8 | 74.4 | 55.4 | 26.1 |
| BioShock Infinite (2013) | 148.5 | 71.3 | 61.8 | 26.2 |
| Overwatch (2016) | 101 | 83 | 39.1 | 23 |
| Total War: Three Kingdoms (2019) | 55.5 | 12.3 | 5.8 | 3.5 |
Degré de la nuisance sonore
| Au repos |
| 30.3 / 30.3 / 30.3 dB(A) |
| Fortement sollicité |
| 42.9 / 43.3 dB(A) |
 | ||
30 dB silencieux 40 dB(A) audible 50 dB(A) bruyant |
||
min: | ||
| Dell Inspiron 14 3493-4KWCF i7-1065G7, GeForce MX230 | Asus VivoBook 14 X412FJ-EB023T i5-8265U, GeForce MX230 | HP 14-dk0008ng R7 3700U, Vega 10 | Acer Swift 3 SF314-41-R8HZ R5 3500U, Vega 8 | Lenovo Ideapad S340-14IWL-81N70056GE i7-8565U, GeForce MX230 | Huawei MateBook D 14 W00D-53010GXL R5 2500U, Vega 8 | Moyenne NVIDIA GeForce MX230 | Moyenne de la classe Multimedia | |
|---|---|---|---|---|---|---|---|---|
| Noise | 3% | 6% | 4% | 3% | 10% | 4% | 13% | |
| arrêt / environnement * (dB) | 30.3 | 30 1% | 30.6 -1% | 30.4 -0% | 30.6 -1% | 29.5 3% | 30.2 ? -0% | 24.2 ? 20% |
| Idle Minimum * (dB) | 30.3 | 30.5 -1% | 31.4 -4% | 30.4 -0% | 30.6 -1% | 29.5 3% | 30.4 ? -0% | 24.3 ? 20% |
| Idle Average * (dB) | 30.3 | 30.5 -1% | 31.4 -4% | 30.9 -2% | 30.6 -1% | 29.5 3% | 30.4 ? -0% | 24.7 ? 18% |
| Idle Maximum * (dB) | 30.3 | 30.5 -1% | 31.4 -4% | 30.9 -2% | 31.2 -3% | 30.4 -0% | 30.5 ? -1% | 26.4 ? 13% |
| Load Average * (dB) | 42.9 | 38.2 11% | 32.5 24% | 36.3 15% | 36.5 15% | 31.5 27% | 37.5 ? 13% | 37.3 ? 13% |
| Load Maximum * (dB) | 43.3 | 40.2 7% | 32.5 25% | 36.6 15% | 39.7 8% | 33.5 23% | 39.6 ? 9% | 45.8 ? -6% |
* ... Moindre est la valeur, meilleures sont les performances
(±) La température maximale du côté supérieur est de 44.4 °C / 112 F, par rapport à la moyenne de 36.8 °C / 98 F, allant de 21 à 71 °C pour la classe Multimedia.
(-) Le fond chauffe jusqu'à un maximum de 52.2 °C / 126 F, contre une moyenne de 39.1 °C / 102 F
(+) En utilisation inactive, la température moyenne du côté supérieur est de 23.6 °C / 74 F, par rapport à la moyenne du dispositif de 31.3 °C / 88 F.
(+) Les repose-poignets et le pavé tactile sont plus froids que la température de la peau avec un maximum de 27.9 °C / 82.2 F et sont donc froids au toucher.
(±) La température moyenne de la zone de l'appui-paume de dispositifs similaires était de 28.7 °C / 83.7 F (+0.8 °C / #1.5 F).
| Dell Inspiron 14 3493-4KWCF i7-1065G7, GeForce MX230 | Asus VivoBook 14 X412FJ-EB023T i5-8265U, GeForce MX230 | HP 14-dk0008ng R7 3700U, Vega 10 | Acer Swift 3 SF314-41-R8HZ R5 3500U, Vega 8 | Lenovo Ideapad S340-14IWL-81N70056GE i7-8565U, GeForce MX230 | Huawei MateBook D 14 W00D-53010GXL R5 2500U, Vega 8 | Moyenne NVIDIA GeForce MX230 | Moyenne de la classe Multimedia | |
|---|---|---|---|---|---|---|---|---|
| Heat | -1% | 9% | 6% | -3% | 6% | 1% | 1% | |
| Maximum Upper Side * (°C) | 44.4 | 45.2 -2% | 39.6 11% | 37.1 16% | 45.2 -2% | 44.3 -0% | 44.1 ? 1% | 41.2 ? 7% |
| Maximum Bottom * (°C) | 52.2 | 42.7 18% | 37.1 29% | 39.6 24% | 43.8 16% | 45 14% | 44.1 ? 16% | 43.8 ? 16% |
| Idle Upper Side * (°C) | 25 | 27.6 -10% | 25.8 -3% | 26.8 -7% | 27.4 -10% | 23.9 4% | 26.5 ? -6% | 27 ? -8% |
| Idle Bottom * (°C) | 25.1 | 27.8 -11% | 25.3 -1% | 27.2 -8% | 28.7 -14% | 23.5 6% | 26.7 ? -6% | 28 ? -12% |
* ... Moindre est la valeur, meilleures sont les performances
Dell Inspiron 14 3493-4KWCF analyse audio
(-) | haut-parleurs pas très forts (40.97 dB)
Basses 100 - 315 Hz
(±) | basse réduite - en moyenne 5.6% inférieure à la médiane
(-) | les basses ne sont pas linéaires (16.1% delta à la fréquence précédente)
Médiums 400 - 2000 Hz
(+) | médiane équilibrée - seulement 4% de la médiane
(-) | les médiums ne sont pas linéaires (26.8% delta à la fréquence précédente)
Aiguës 2 - 16 kHz
(+) | des sommets équilibrés - à seulement 4.1% de la médiane
(-) | les aigus ne sont pas linéaires (30.2% delta à la fréquence précédente)
Globalement 100 - 16 000 Hz
(-) | le son global n'est pas linéaire (45.2% de différence à la médiane)
Par rapport à la même classe
» 100% de tous les appareils testés de cette catégorie étaient meilleurs, 0% similaires, 0% pires
» Le meilleur avait un delta de 5%, la moyenne était de 17%, le pire était de 45%.
Par rapport à tous les appareils testés
» 96% de tous les appareils testés étaient meilleurs, 0% similaires, 4% pires
» Le meilleur avait un delta de 4%, la moyenne était de 24%, le pire était de 134%.
Lenovo Ideapad S340-14IWL-81N70056GE analyse audio
(-) | haut-parleurs pas très forts (67.8 dB)
Basses 100 - 315 Hz
(-) | presque aucune basse - en moyenne 20.1% plus bas que la médiane
(±) | la linéarité des basses est moyenne (11.5% delta à la fréquence précédente)
Médiums 400 - 2000 Hz
(+) | médiane équilibrée - seulement 3.9% de la médiane
(±) | la linéarité des médiums est moyenne (7.1% delta à la fréquence précédente)
Aiguës 2 - 16 kHz
(+) | des sommets équilibrés - à seulement 2.6% de la médiane
(+) | les aigus sont linéaires (5.9% delta à la fréquence précédente)
Globalement 100 - 16 000 Hz
(±) | la linéarité du son global est moyenne (23.1% de différence avec la médiane)
Par rapport à la même classe
» 82% de tous les appareils testés de cette catégorie étaient meilleurs, 5% similaires, 14% pires
» Le meilleur avait un delta de 5%, la moyenne était de 17%, le pire était de 45%.
Par rapport à tous les appareils testés
» 69% de tous les appareils testés étaient meilleurs, 5% similaires, 26% pires
» Le meilleur avait un delta de 4%, la moyenne était de 24%, le pire était de 134%.
| Éteint/en veille | |
| Au repos | |
| Fortement sollicité |
|
Légende:
min: | |
| Dell Inspiron 14 3493-4KWCF i7-1065G7, GeForce MX230 | Asus VivoBook 14 X412FJ-EB023T i5-8265U, GeForce MX230 | HP 14-dk0008ng R7 3700U, Vega 10 | Acer Swift 3 SF314-41-R8HZ R5 3500U, Vega 8 | Lenovo Ideapad S340-14IWL-81N70056GE i7-8565U, GeForce MX230 | Huawei MateBook D 14 W00D-53010GXL R5 2500U, Vega 8 | Moyenne NVIDIA GeForce MX230 | Moyenne de la classe Multimedia | |
|---|---|---|---|---|---|---|---|---|
| Power Consumption | -6% | 6% | -6% | 17% | -4% | 3% | -56% | |
| Idle Minimum * (Watt) | 4.7 | 4.7 -0% | 4.8 -2% | 5.7 -21% | 2.5 47% | 5.3 -13% | 3.77 ? 20% | 5.64 ? -20% |
| Idle Average * (Watt) | 6.6 | 6.7 -2% | 7.1 -8% | 7.6 -15% | 5.1 23% | 7.8 -18% | 6.16 ? 7% | 10 ? -52% |
| Idle Maximum * (Watt) | 5.9 | 7.5 -27% | 7.3 -24% | 9 -53% | 5.6 5% | 8.46 -43% | 7.06 ? -20% | 12.2 ? -107% |
| Load Average * (Watt) | 56 | 54.4 3% | 34 39% | 40.1 28% | 47.5 15% | 36.9 34% | 49.6 ? 11% | 64.8 ? -16% |
| Load Maximum * (Watt) | 60.2 | 63 -5% | 45 25% | 42.4 30% | 64.5 -7% | 49.4 18% | 63.3 ? -5% | 111.7 ? -86% |
* ... Moindre est la valeur, meilleures sont les performances
| Dell Inspiron 14 3493-4KWCF i7-1065G7, GeForce MX230, 42 Wh | Asus VivoBook 14 X412FJ-EB023T i5-8265U, GeForce MX230, 37 Wh | HP 14-dk0008ng R7 3700U, Vega 10, 41.04 Wh | Acer Swift 3 SF314-41-R8HZ R5 3500U, Vega 8, 48 Wh | Lenovo Ideapad S340-14IWL-81N70056GE i7-8565U, GeForce MX230, 52.5 Wh | Huawei MateBook D 14 W00D-53010GXL R5 2500U, Vega 8, 57.4 Wh | Moyenne de la classe Multimedia | |
|---|---|---|---|---|---|---|---|
| Autonomie de la batterie | -8% | -18% | 28% | 16% | 27% | 66% | |
| Reader / Idle (h) | 13.8 | 11.8 -14% | 23.2 68% | 19 38% | 25.2 ? 83% | ||
| H.264 (h) | 8.6 | 6.9 -20% | 16.4 ? 91% | ||||
| WiFi v1.3 (h) | 6.5 | 6 -8% | 7.2 11% | 8.3 28% | 6 -8% | 9 38% | 12 ? 85% |
| Load (h) | 1.6 | 0.8 -50% | 1.4 -13% | 1.7 6% | 1.675 ? 5% |
Points positifs
Points négatifs
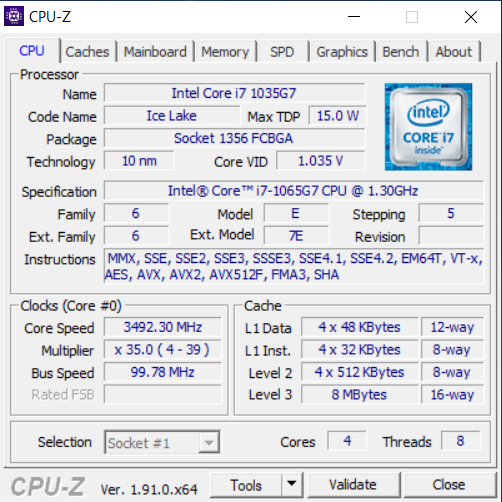
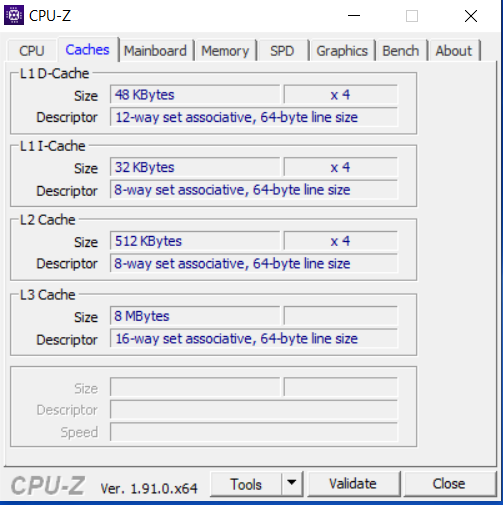
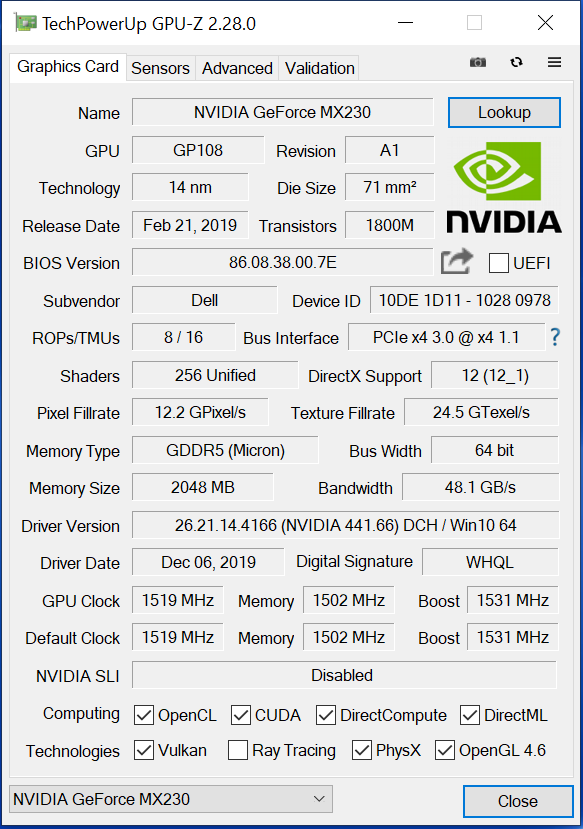
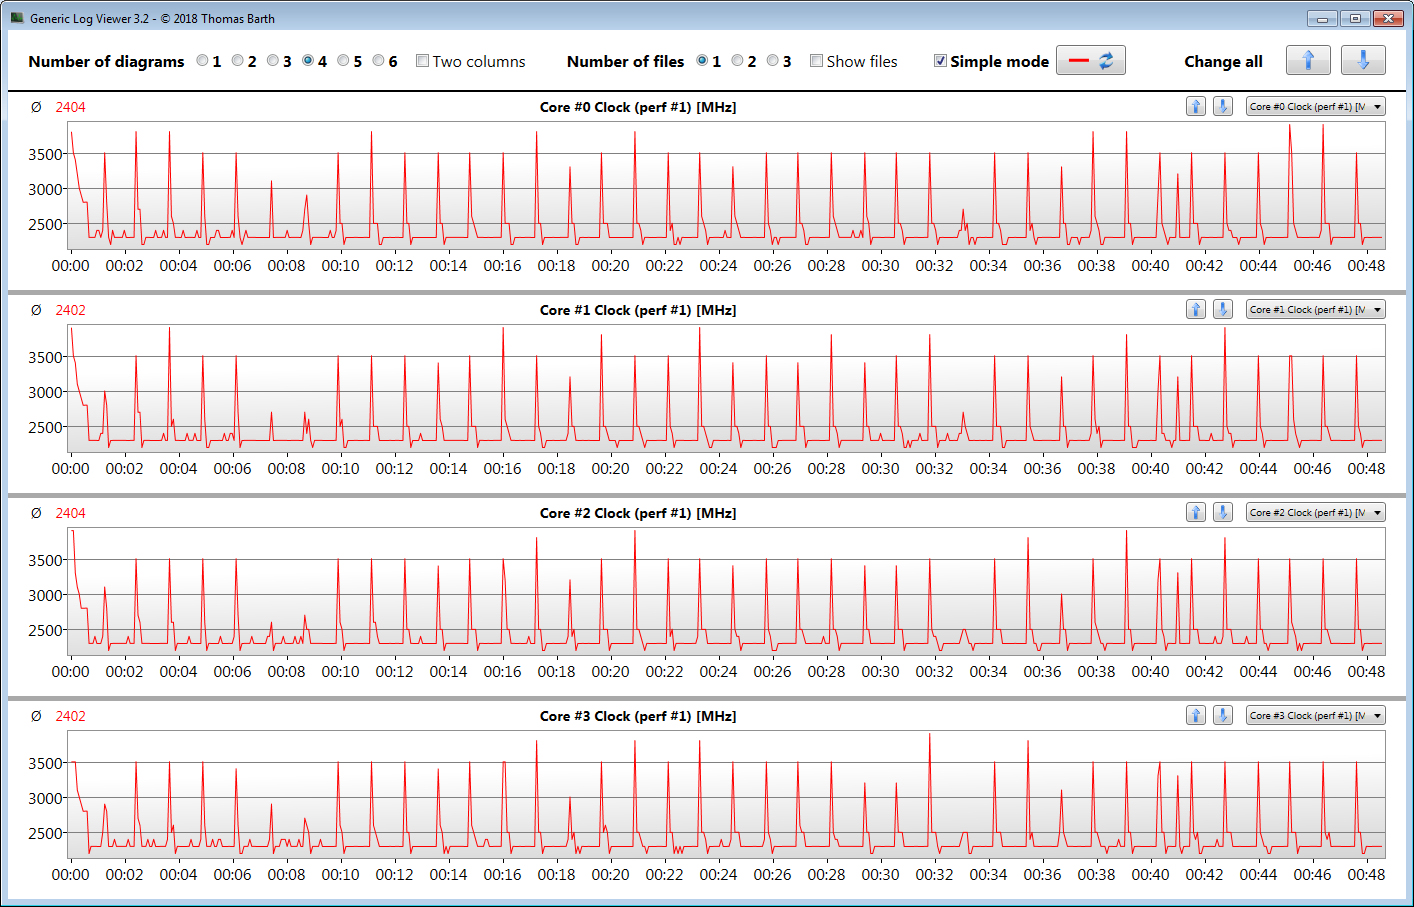
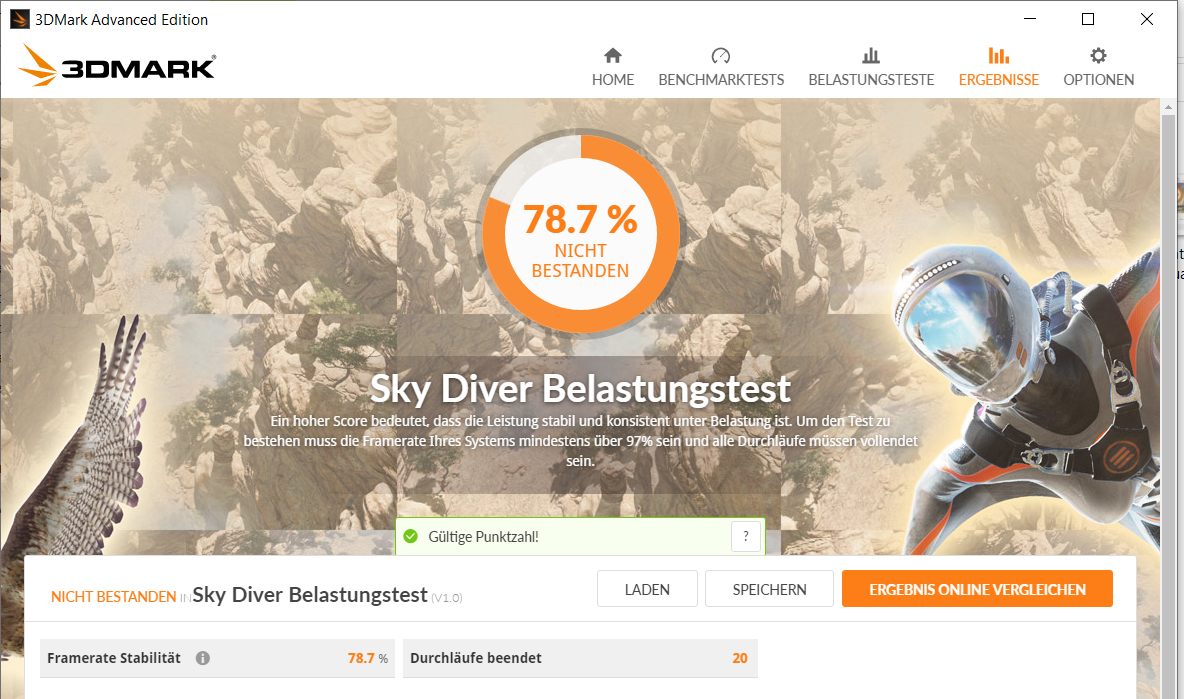
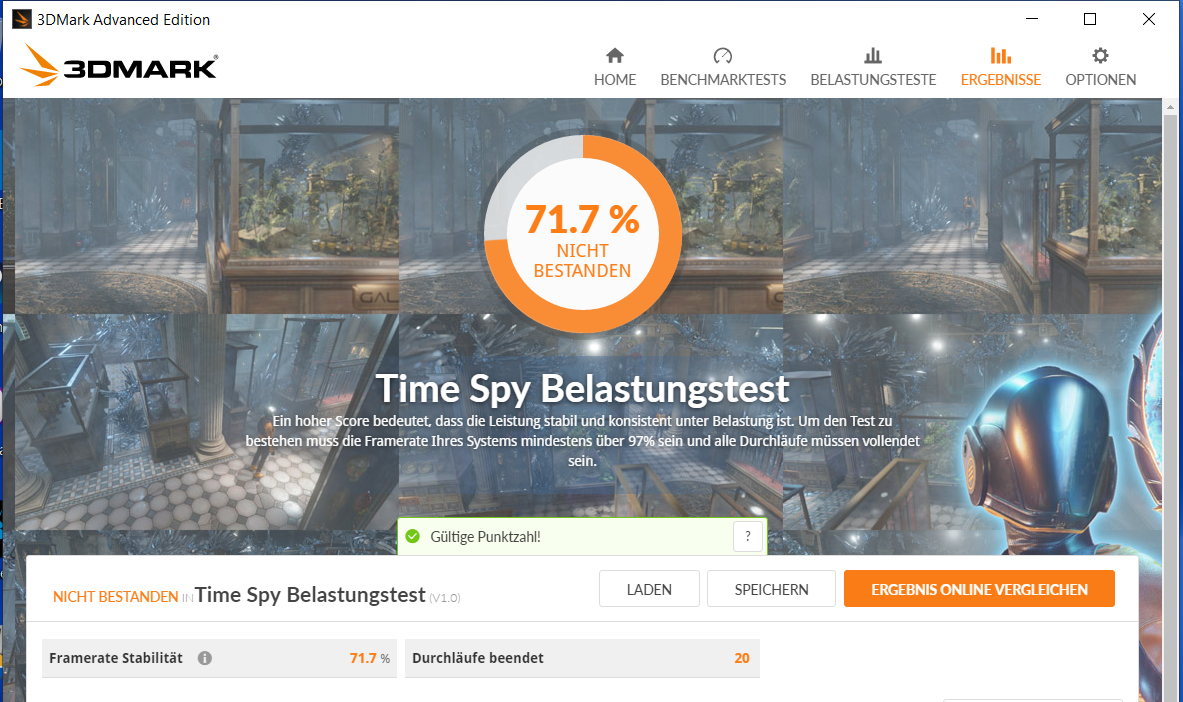
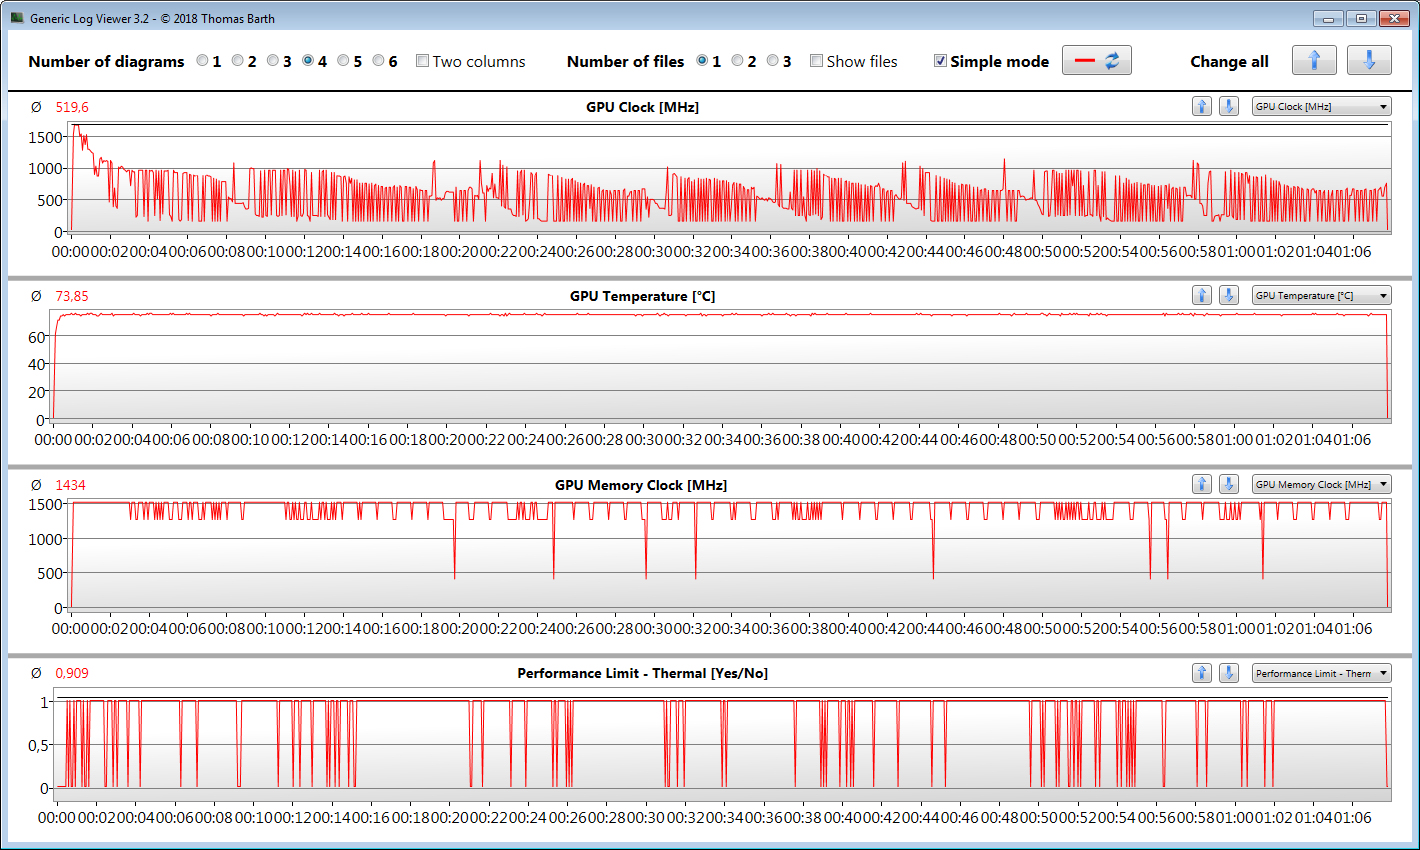
Ce portable de 14 pouces est équipé d’un processeur Core i7-1065G7 et d’une carte graphique GeForce MX230. Alors que le processeur est performant et s’avère assez performant pour la bureautique et la navigation web, la carte graphique GeForce déçoit, sa fréquence fluctuant au bout d’un court moment. Le jeu est donc impossible La seule utilisation où elle s’avère utile est pour les logiciels qui ne la sollicitent que brièvement.
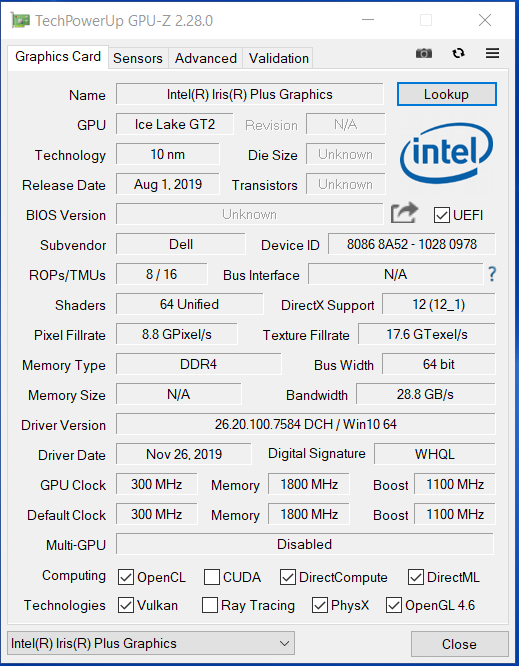
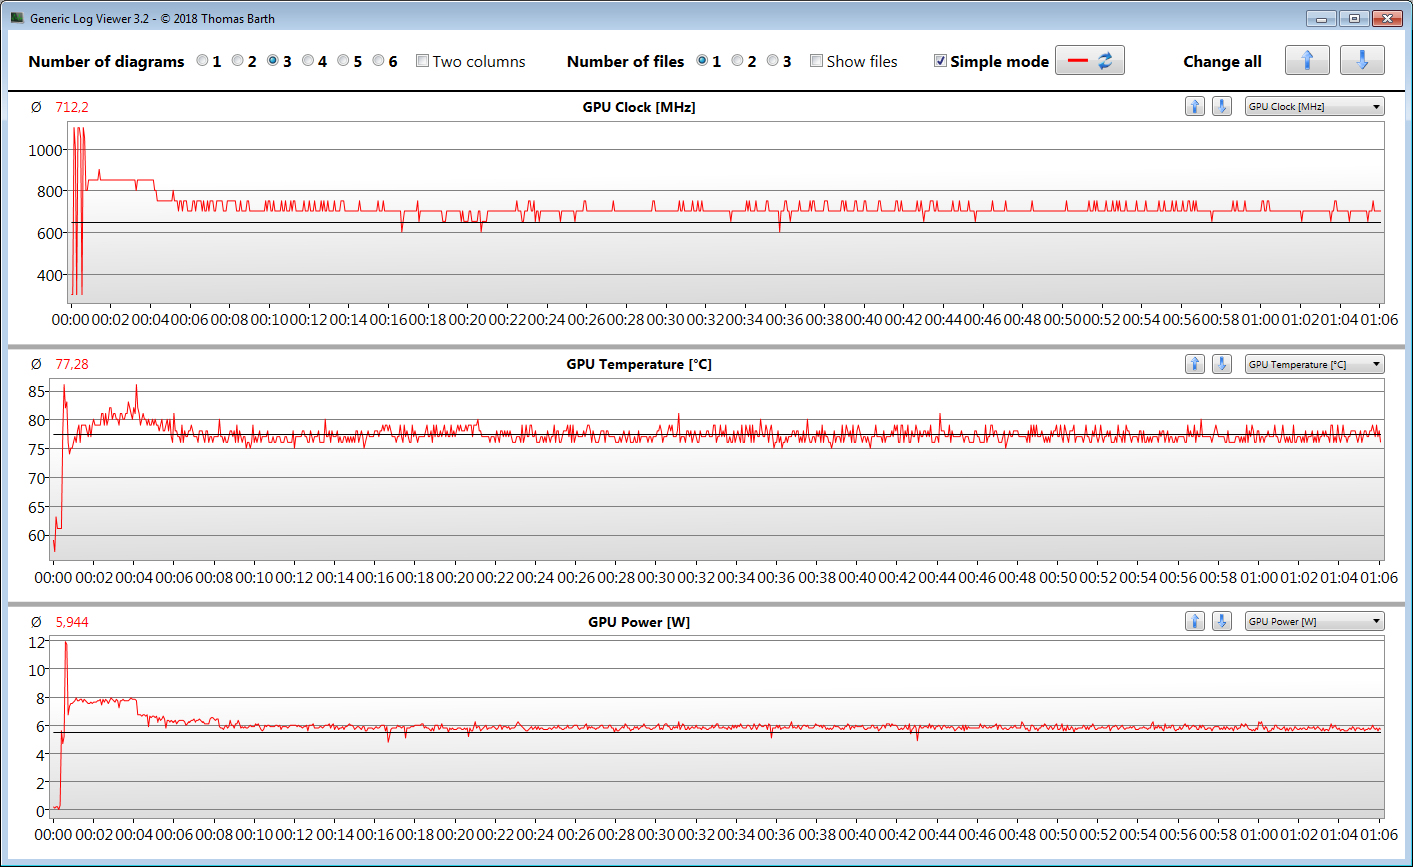
La carte graphique Iris Plus Graphics G7 intégrée ne peut pas non plus être utilisée à plein de ses capacités, et ne peut fonctionner à sa vitesse maximale. Cela dit, elle fournit un niveau de performances plus stable, ce qui au moins rend le jeu possible. Mais il faut un deuxième module de RAM pour profiter du mode double canal. Autrement, les taux d’image ne permettent pas d’avoir une expérience de jeu satisfaisante.
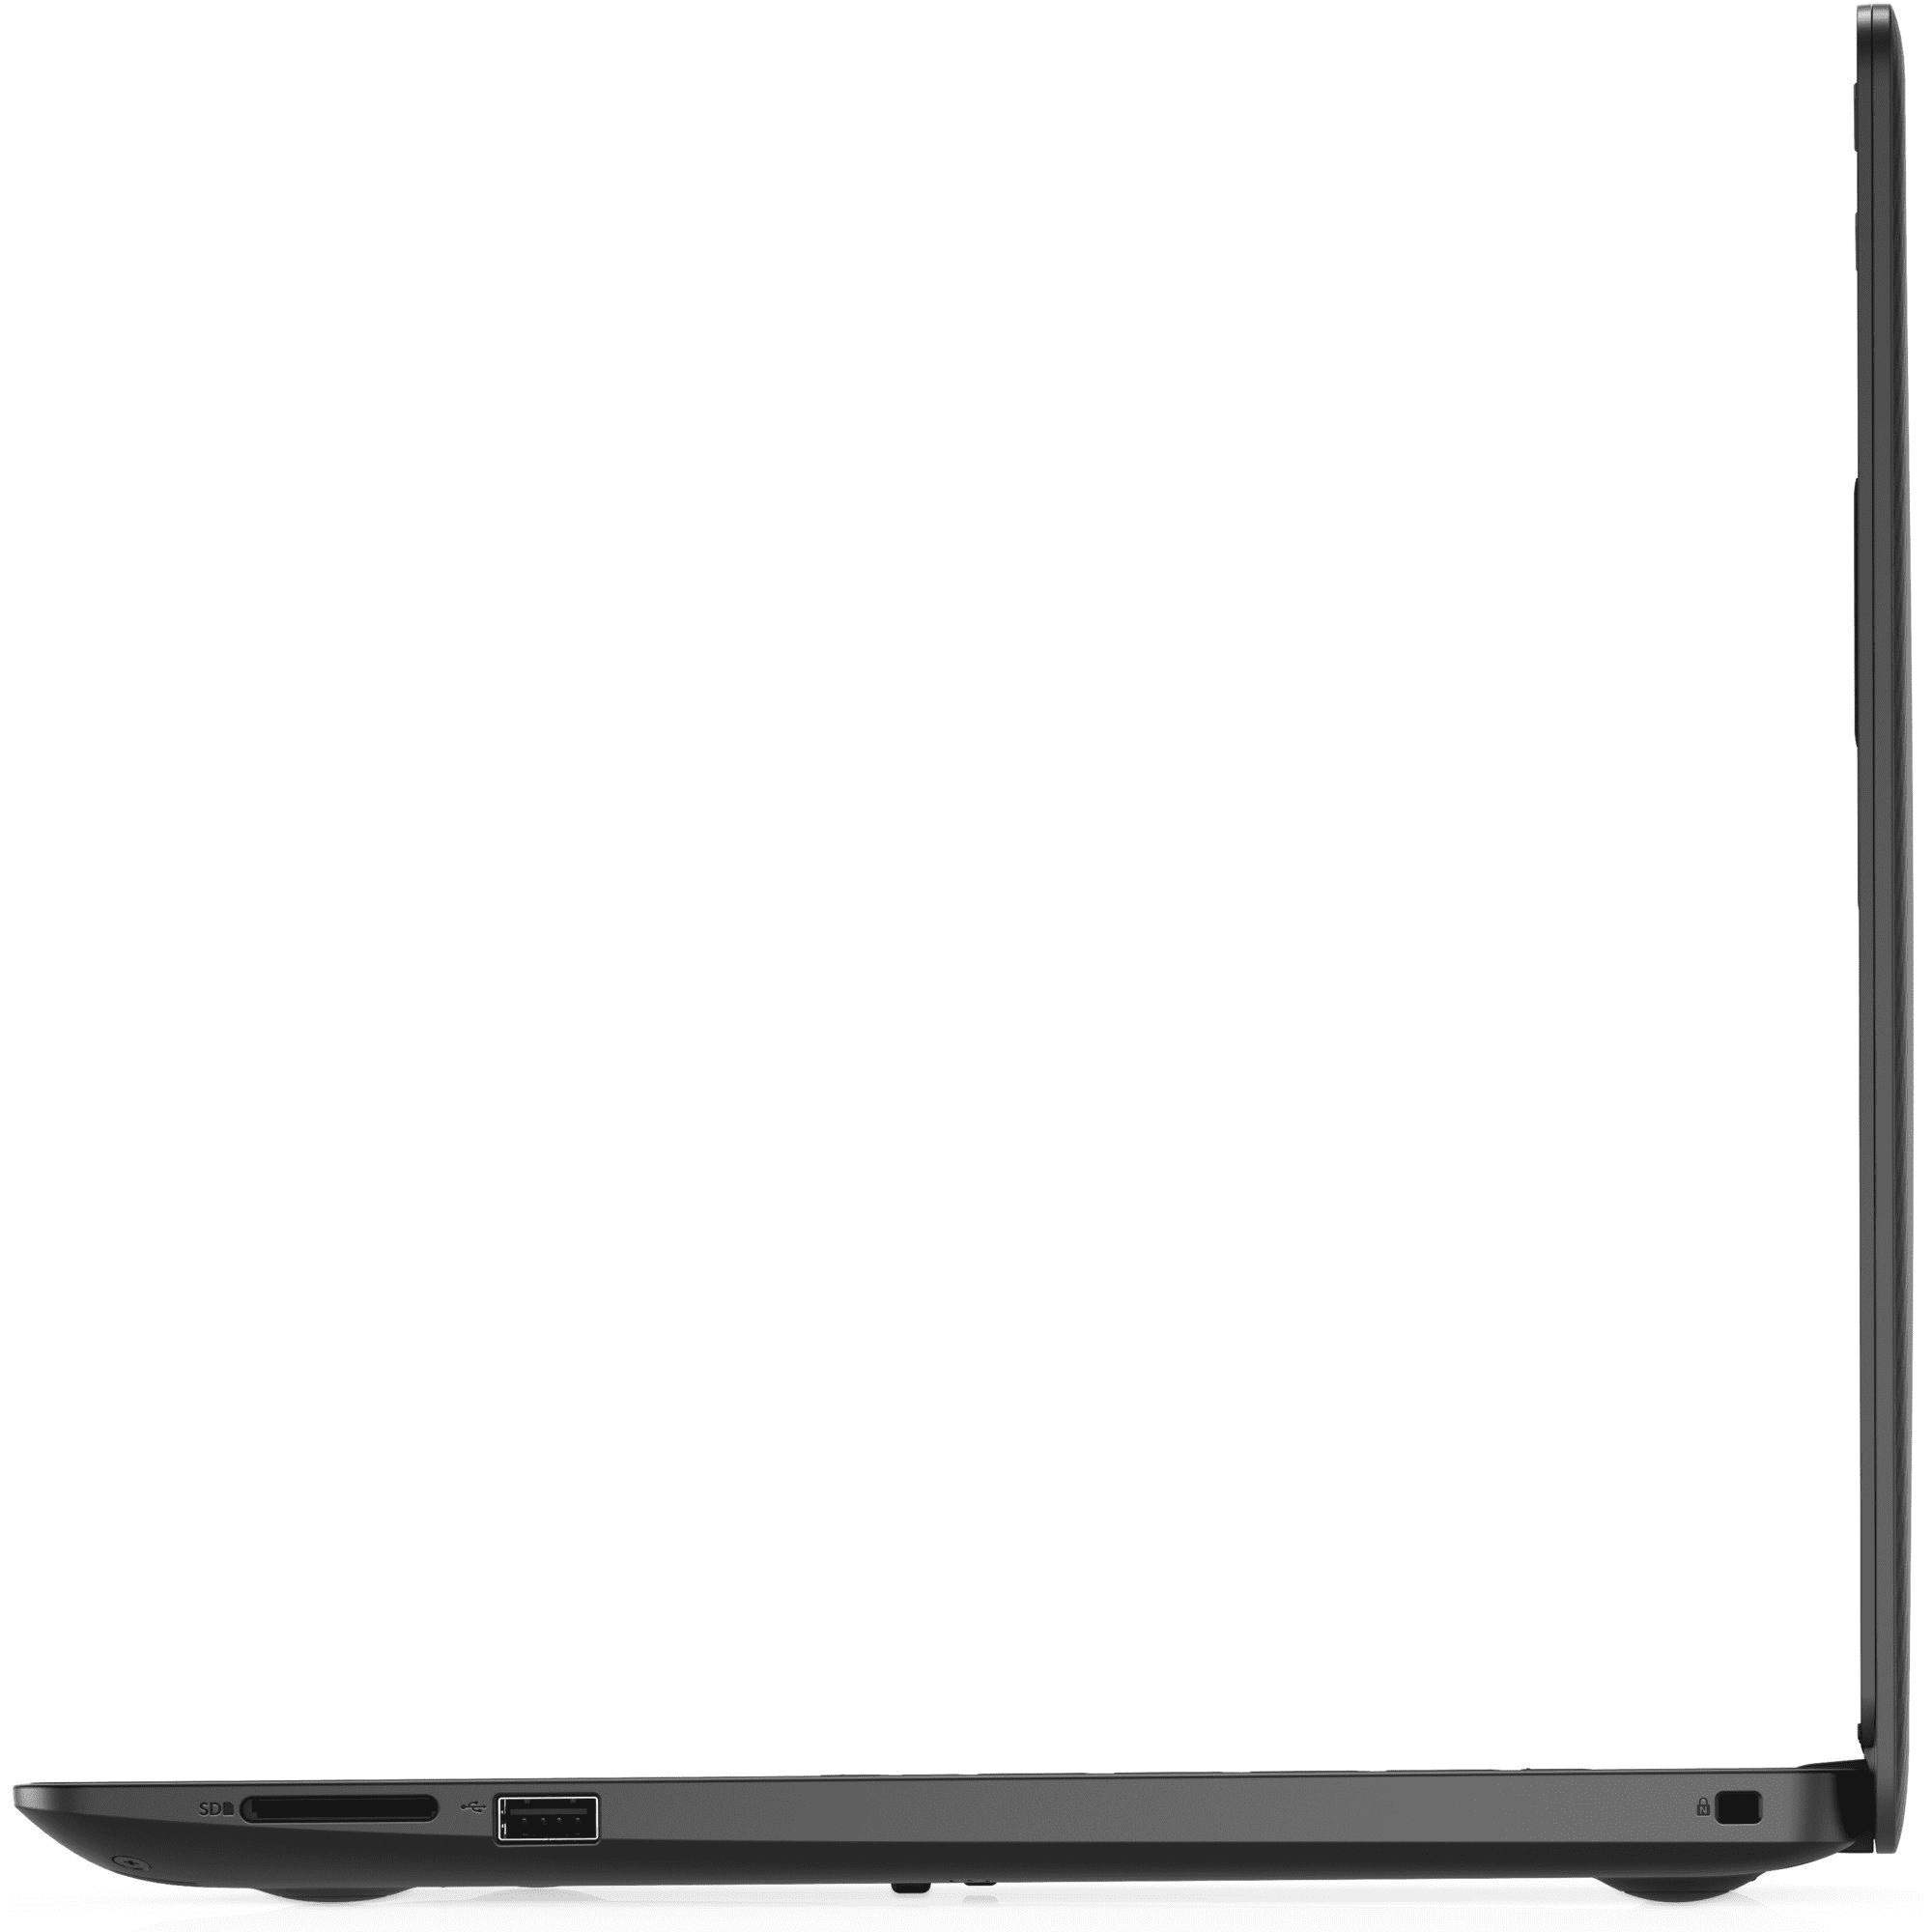
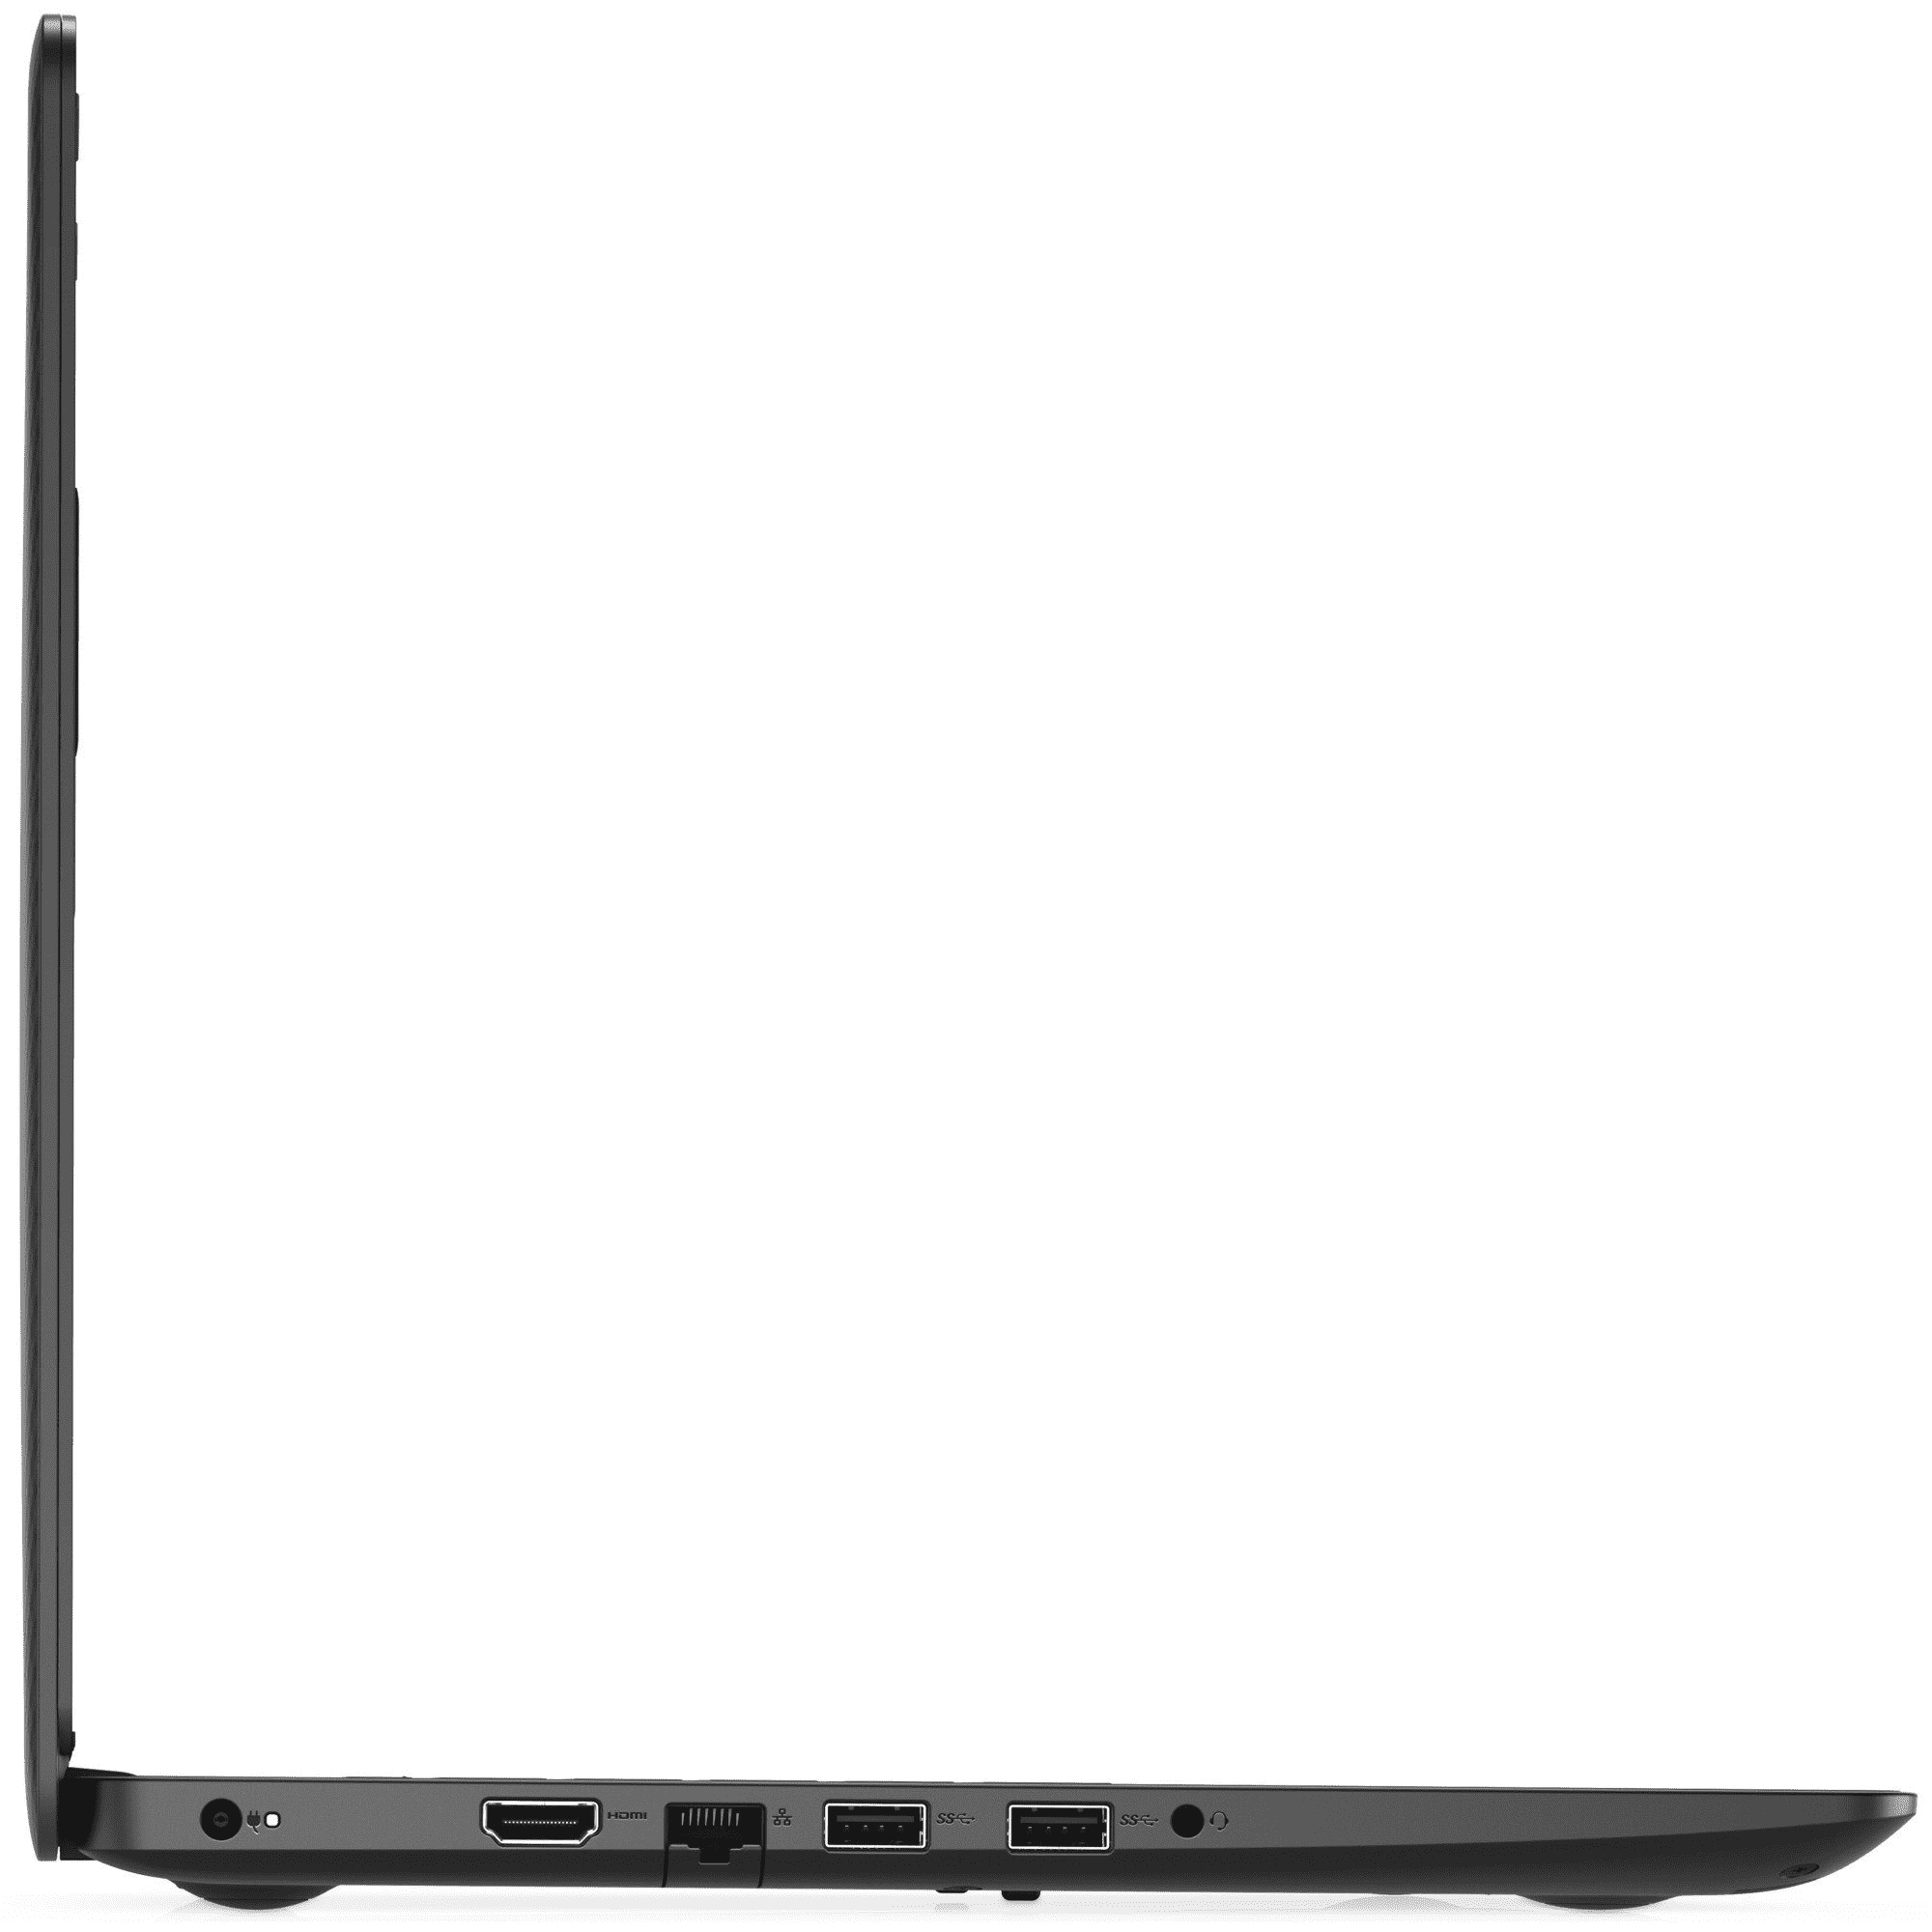
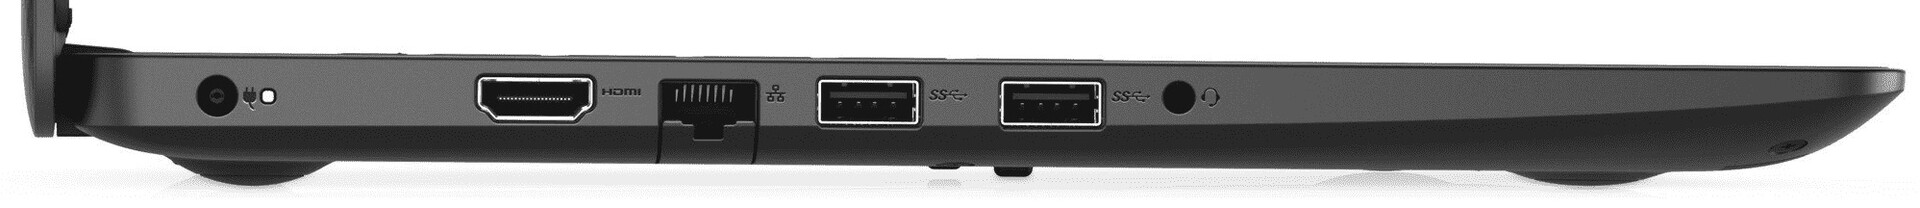
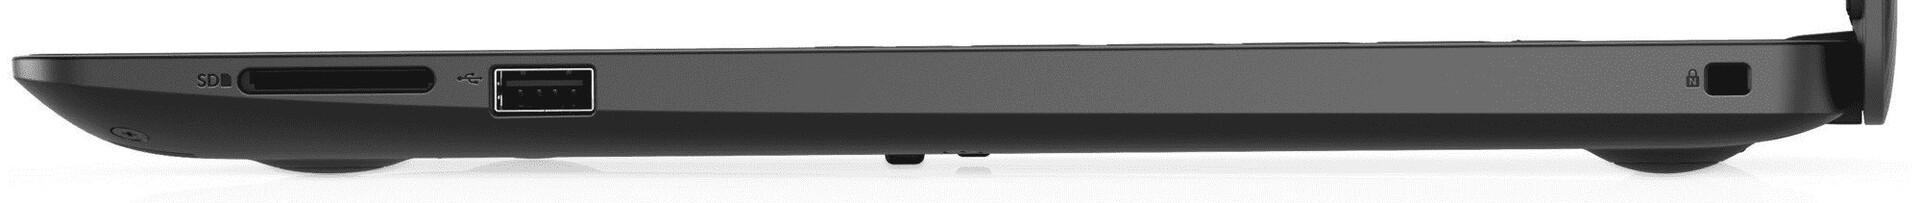
L’Inspiron 14 3494 ne donne pas beaucoup de bons arguments aux clients potentiels. Les problèmes de GPU mis de côté, la sélection de port aussi est moyenne, et partiellement dépassée.
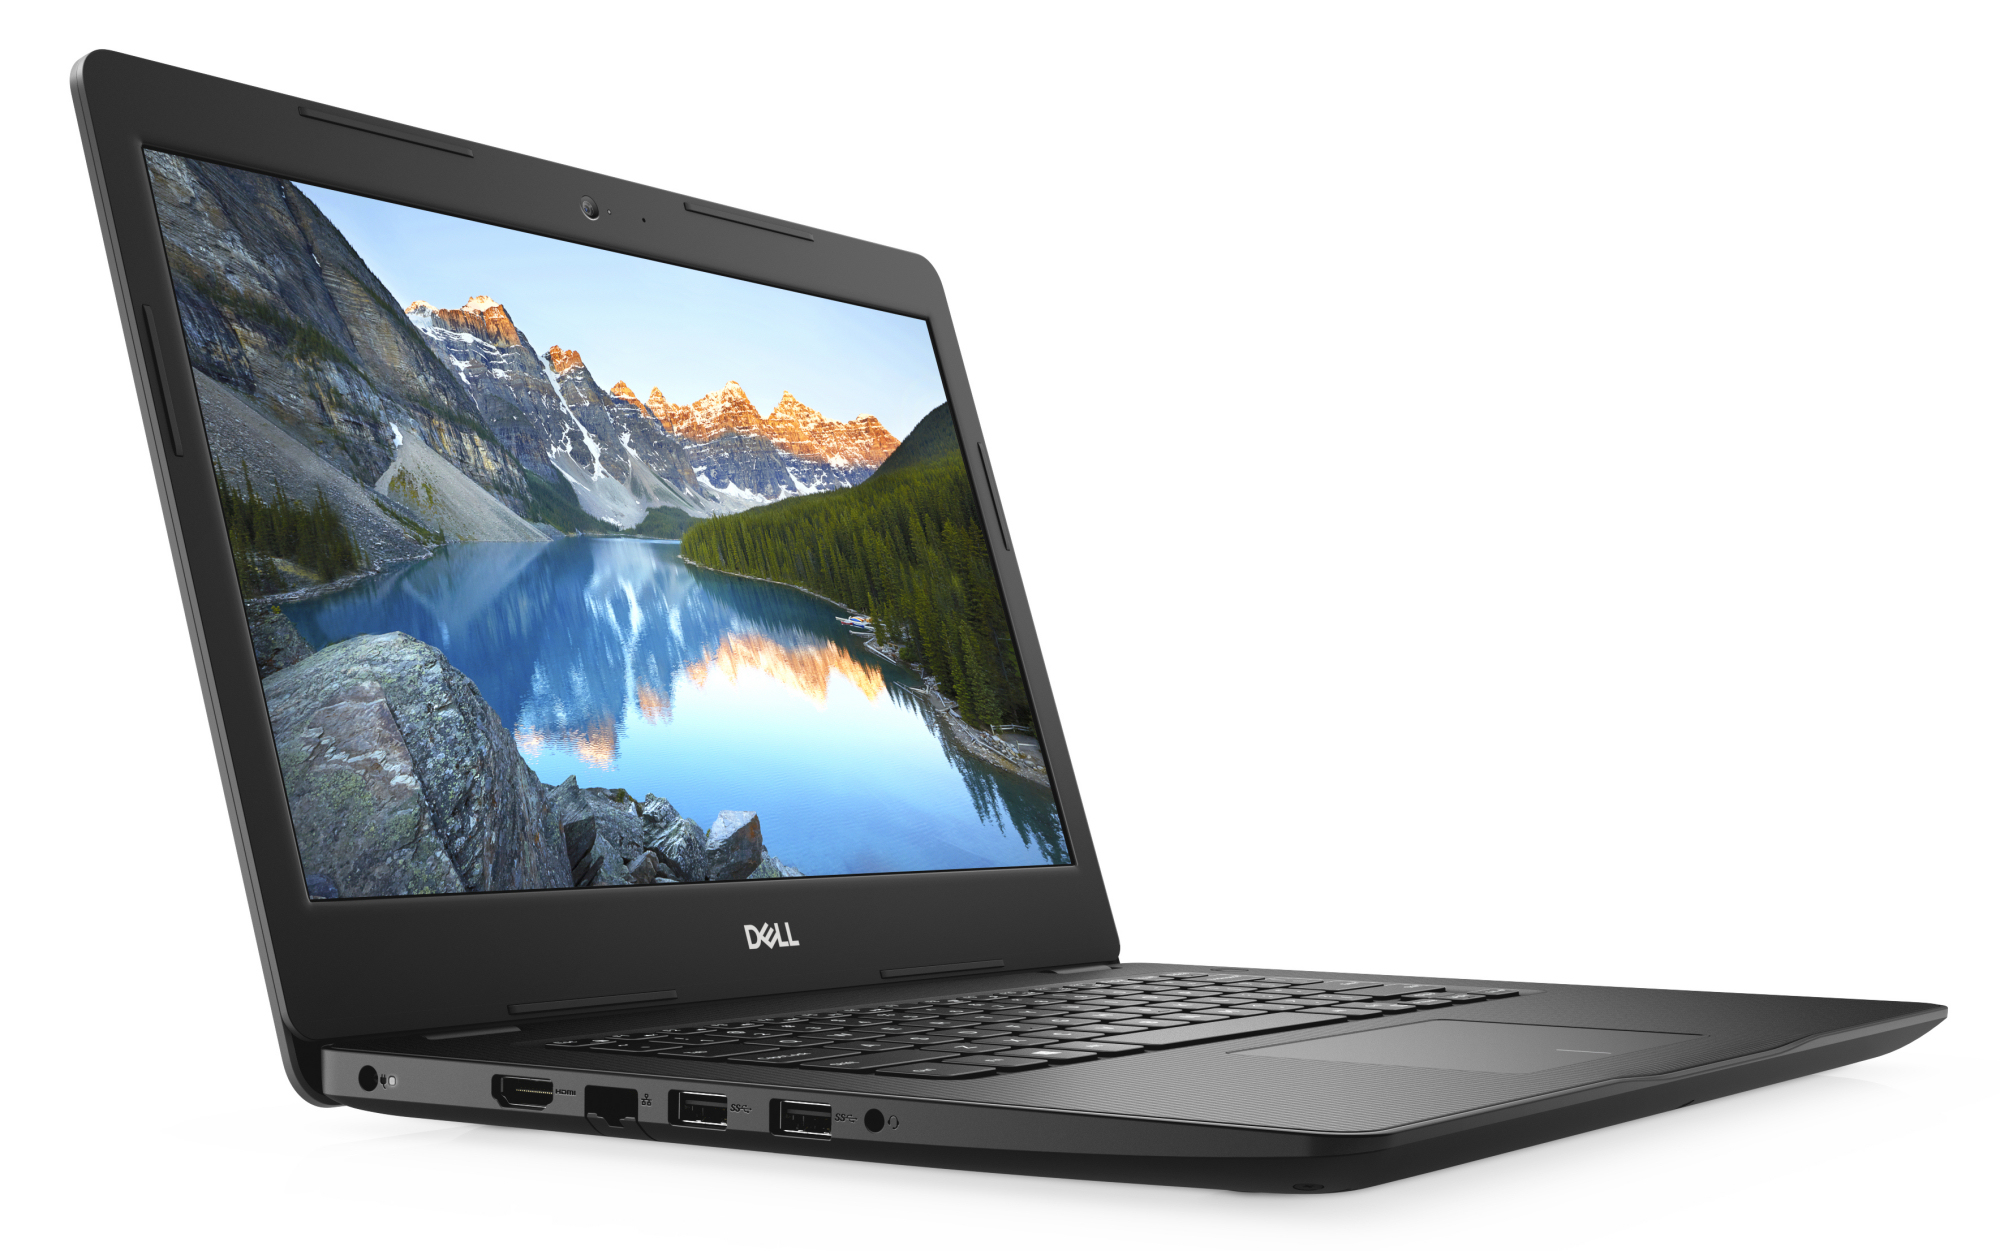
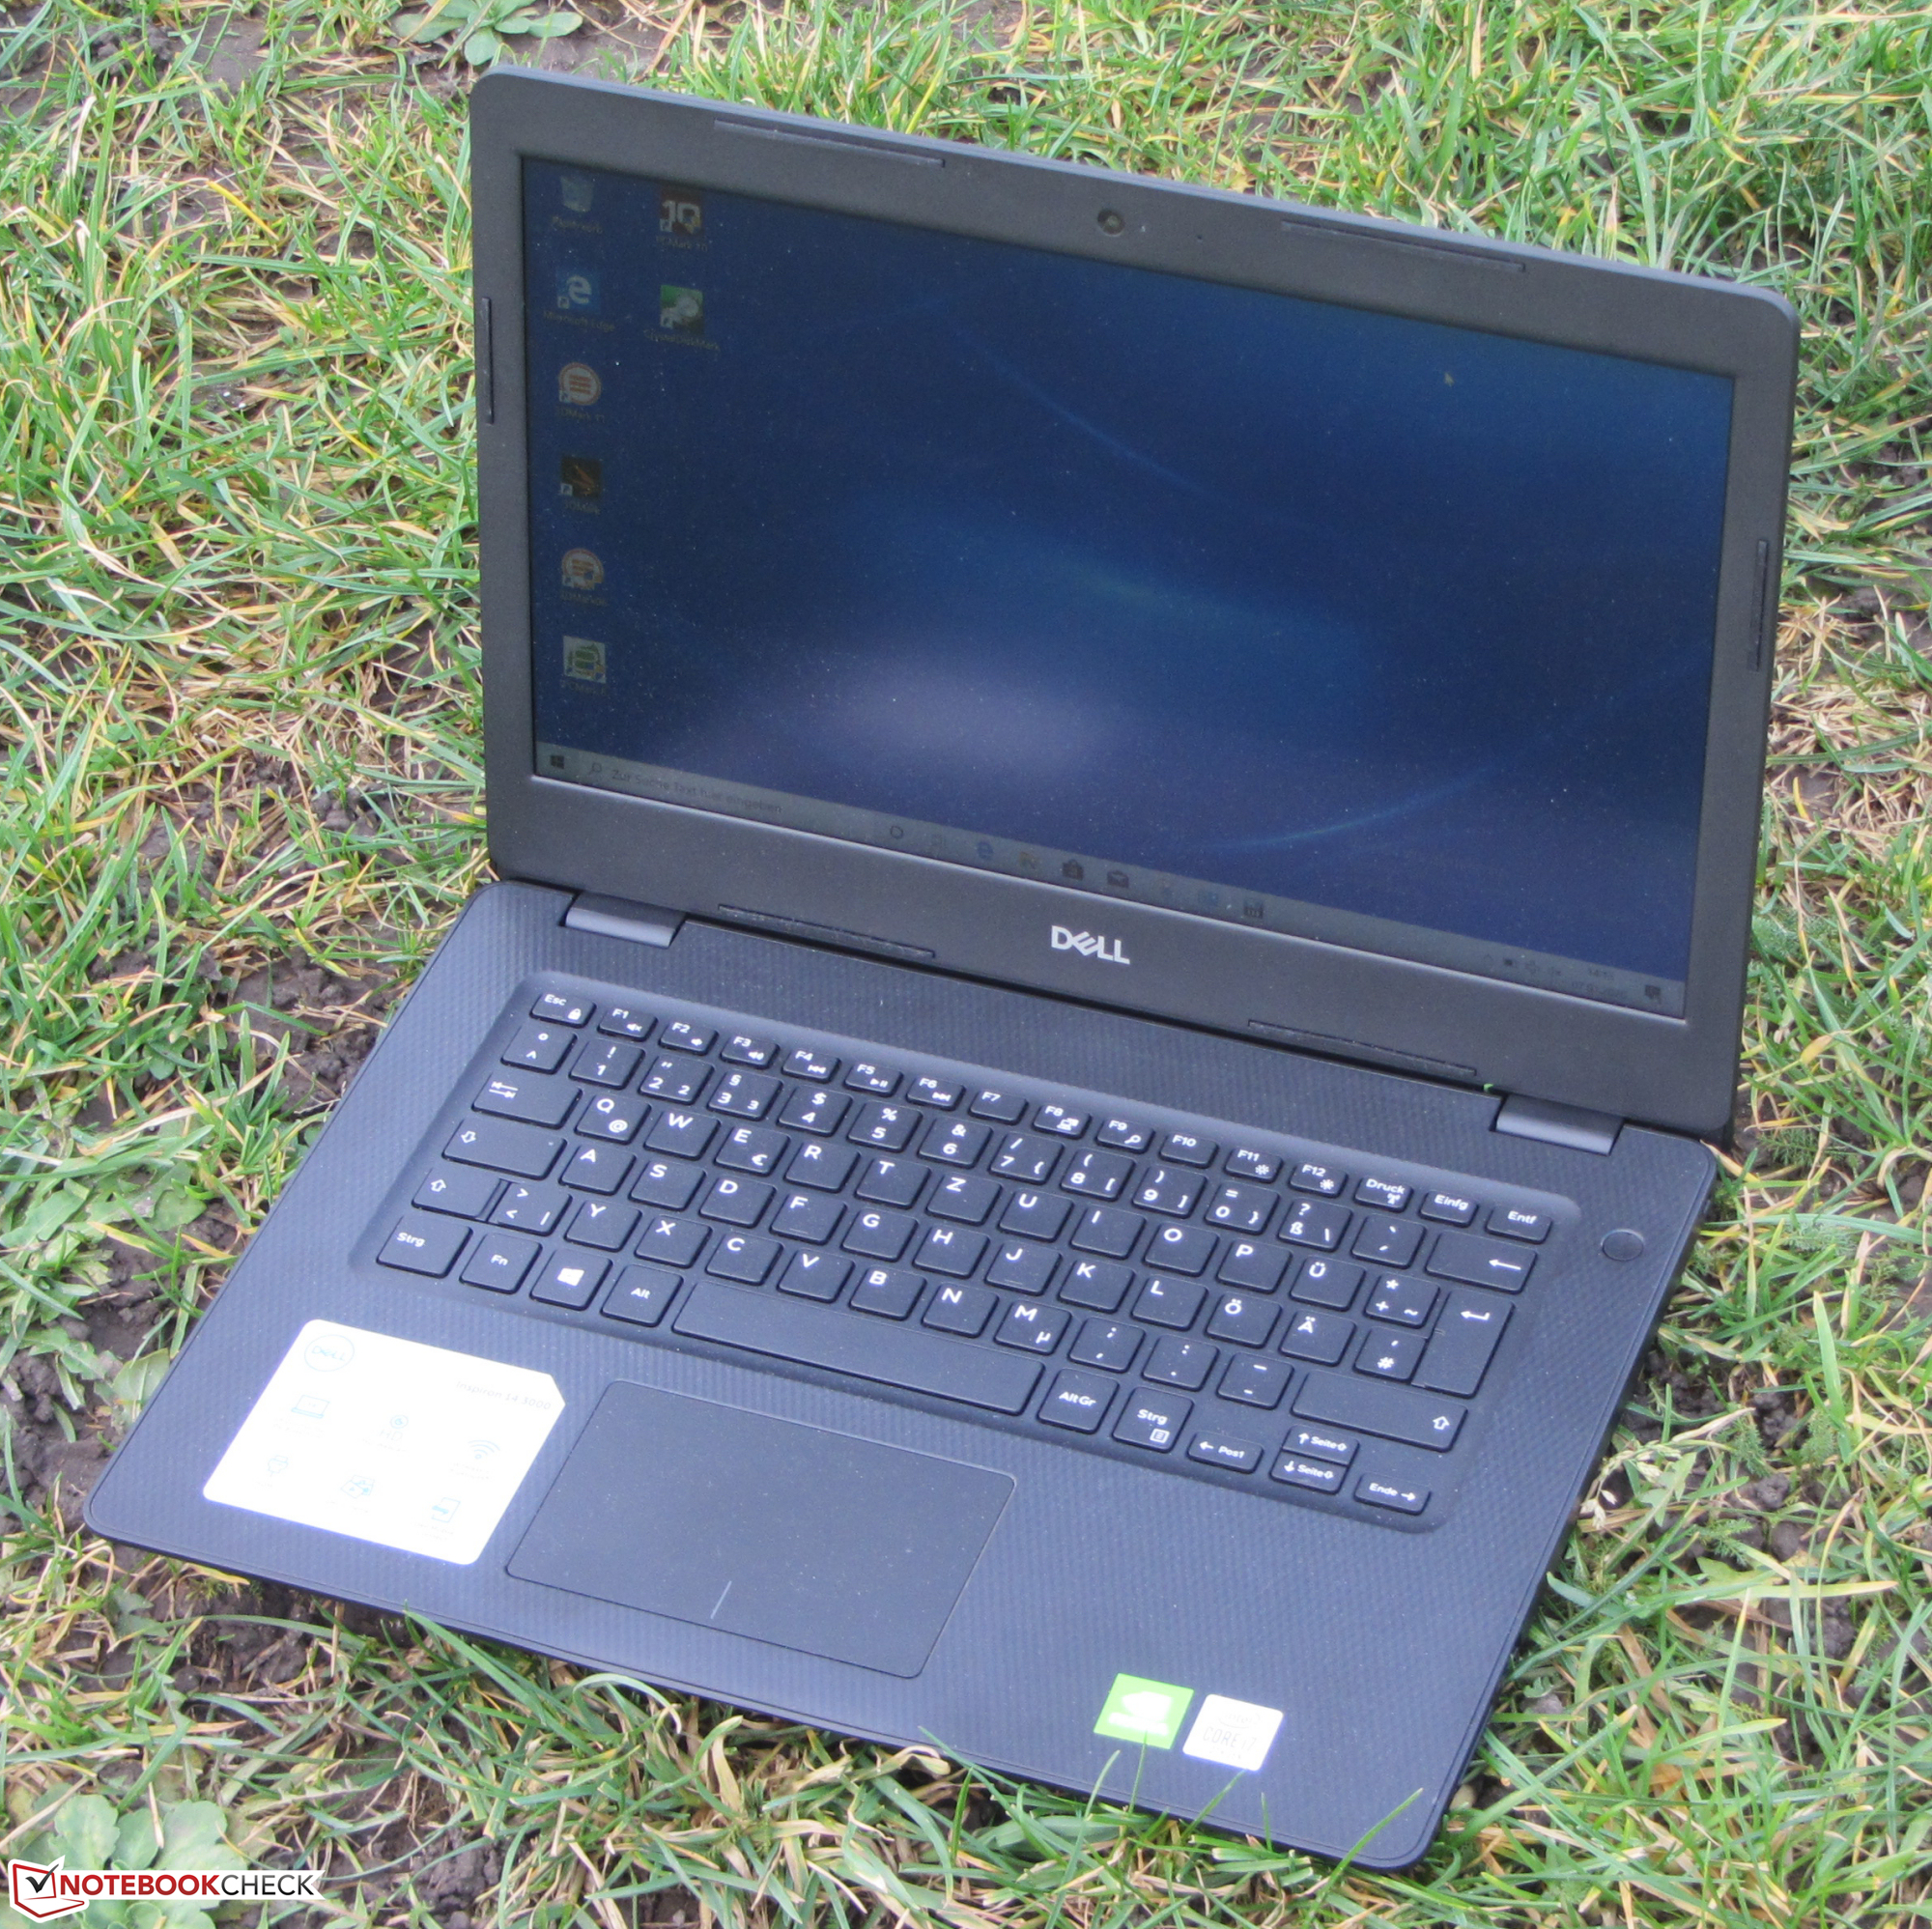
Grâce au SSD NVMe, le système est fluide et réactif. Le remplacement du SSD est possible. De plus, l’Inspiron peut être alimenté avec un disque de 2,5 pouces, et Le connecteur SATA nécessaire et le cadre sont disponibles. Dans tous les cas, il est nécessaire d’ouvrir la coque inférieure. L’écran Full HD peut mettre en avant sa surface matte, ses bons angles de vision, et son bon contraste. Mais sa luminosité maximale est trop réduite pour la catégorie. La couverture de l’espace colorimétrique n’a rien d’extraordinaire non plus. Le clavier non rétro-éclairé sera suffisant pour un usage régulier. Enfin l’autonomie est correcte, voire un peu mieux. Mais la sélection des ports est moyenne, le 3493 n’ayant en particulier pas de port USB C et ne prenant en charge que le Fast Ethernet.
L’intégralité de cette critique est disponible en anglais en suivant ce lien.
Dell Inspiron 14 3493-4KWCF
- 01/13/2020 v7 (old)
Sascha Mölck
Price comparison
