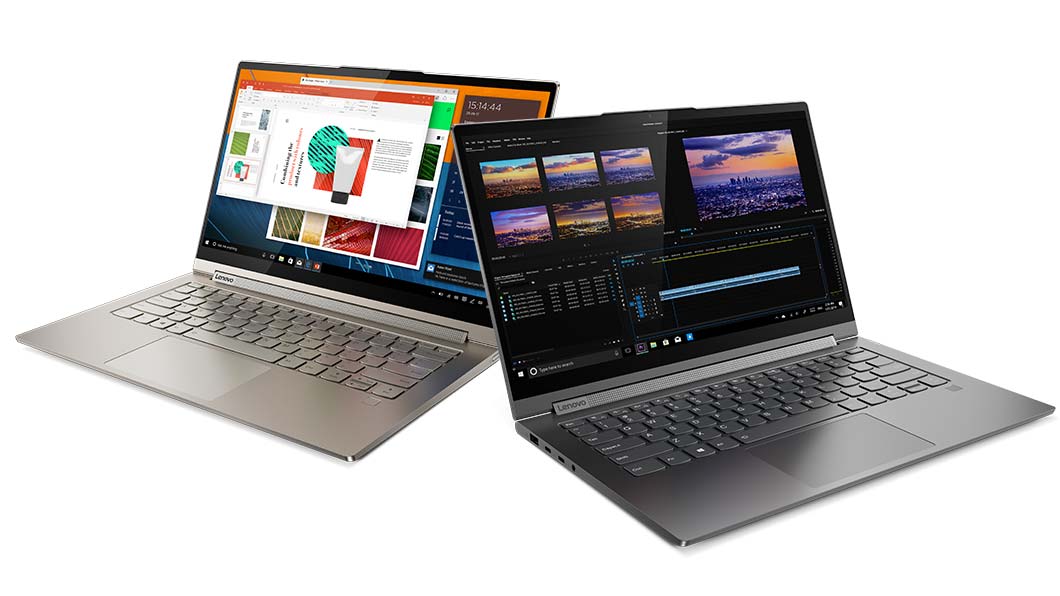
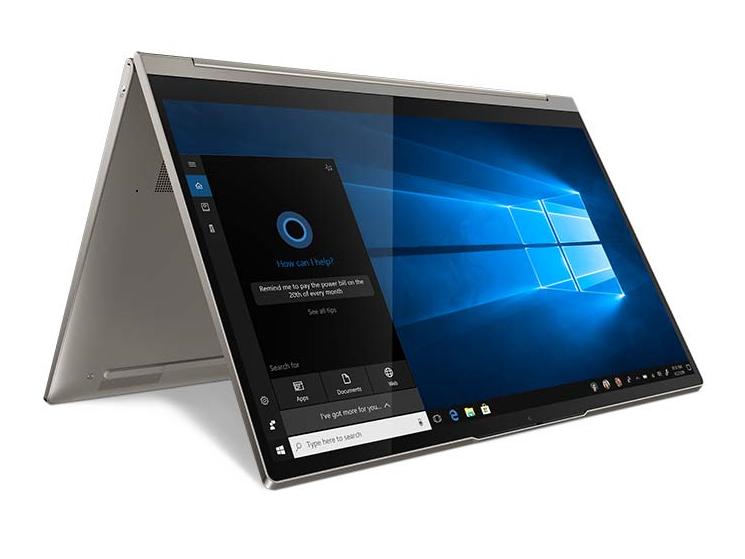
Test du Lenovo Yoga C940-14IIL (i7-1065G7, Iris G7, 4K UHD) : le convertible grand public de 14 pouces de référence
Note | Date | Modèle | Poids | Épaisseur | Taille | Résolution | Prix |
|---|---|---|---|---|---|---|---|
| 87 % v7 (old) | 12/19 | Lenovo Yoga C940-14IIL 81Q9 i7-1065G7, Iris Plus Graphics G7 (Ice Lake 64 EU) | 1.4 kg | 15.7 mm | 14.00" | 3840x2160 | |
| 86.3 % v7 (old) | 10/19 | Dell XPS 13 7390 2-in-1 Core i7 i7-1065G7, Iris Plus Graphics G7 (Ice Lake 64 EU) | 1.3 kg | 13 mm | 13.40" | 1920x1200 | |
| 87.6 % v6 (old) | 08/18 | Huawei Matebook X Pro i5 i5-8250U, GeForce MX150 | 1.3 kg | 14.6 mm | 13.90" | 3000x2000 | |
| 85.2 % v7 (old) | 11/19 | MSI Prestige 15 A10SC i7-10710U, GeForce GTX 1650 Max-Q | 1.7 kg | 16 mm | 15.60" | 3840x2160 | |
| 86.3 % v7 (old) | 10/19 | Razer Blade Stealth i7-1065G7 Iris Plus i7-1065G7, Iris Plus Graphics G7 (Ice Lake 64 EU) | 1.4 kg | 15.3 mm | 13.30" | 1920x1080 |
| Networking | |
| iperf3 transmit AX12 | |
| MSI Prestige 15 A10SC | |
| Lenovo Yoga C930-13IKB 81C4 | |
| Asus ZenBook S13 UX392FN | |
| iperf3 receive AX12 | |
| MSI Prestige 15 A10SC | |
| Asus ZenBook S13 UX392FN | |
| Lenovo Yoga C930-13IKB 81C4 | |
| |||||||||||||||||||||||||
Homogénéité de la luminosité: 82 %
Valeur mesurée au centre, sur batterie: 501.7 cd/m²
Contraste: 1568:1 (Valeurs des noirs: 0.32 cd/m²)
ΔE ColorChecker Calman: 5.48 | ∀{0.5-29.43 Ø4.72}
calibrated: 2.22
ΔE Greyscale Calman: 8.1 | ∀{0.09-98 Ø4.97}
100% sRGB (Argyll 1.6.3 3D)
74.1% AdobeRGB 1998 (Argyll 1.6.3 3D)
83.3% AdobeRGB 1998 (Argyll 3D)
99.9% sRGB (Argyll 3D)
83.8% Display P3 (Argyll 3D)
Gamma: 2.07
CCT: 6730 K
| Lenovo Yoga C940-14IIL 81Q9 BOE HF NV140QUM-N54, IPS, 14", 3840x2160 | Lenovo Yoga C930-13IKB 81C4 AUO B139HAN03_0, IPS, 13.9", 1920x1080 | Lenovo Yoga C940-14IIL LP140WF9-SPE2, IPS LED, 14", 1920x1080 | Dell XPS 13 7390 2-in-1 Core i7 Sharp LQ134N1, IPS, 13.4", 1920x1200 | Razer Blade Stealth i7-1065G7 Iris Plus Sharp LQ133M1JW41, IPS, 13.3", 1920x1080 | Asus ZenBook S13 UX392FN Tianma XM, IPS, 13.9", 1920x1080 | |
|---|---|---|---|---|---|---|
| Display | -18% | -14% | -11% | -14% | -13% | |
| Display P3 Coverage (%) | 83.8 | 62.7 -25% | 66 -21% | 69.9 -17% | 66.2 -21% | 67.5 -19% |
| sRGB Coverage (%) | 99.9 | 92.6 -7% | 97.9 -2% | 99.2 -1% | 97.2 -3% | 95.8 -4% |
| AdobeRGB 1998 Coverage (%) | 83.3 | 64.7 -22% | 67.3 -19% | 71.5 -14% | 67.1 -19% | 69 -17% |
| Response Times | 15% | -11% | -7% | -12% | 2% | |
| Response Time Grey 50% / Grey 80% * (ms) | 44.4 ? | 34.4 ? 23% | 49.6 ? -12% | 47.6 ? -7% | 45.2 ? -2% | 47.2 ? -6% |
| Response Time Black / White * (ms) | 27.2 ? | 25.6 ? 6% | 30 ? -10% | 29.2 ? -7% | 33.2 ? -22% | 24.8 ? 9% |
| PWM Frequency (Hz) | 2500 ? | 22730 ? | ||||
| Screen | -25% | 19% | 19% | 20% | 16% | |
| Brightness middle (cd/m²) | 501.7 | 312 -38% | 384 -23% | 549.8 10% | 422.6 -16% | 466 -7% |
| Brightness (cd/m²) | 501 | 295 -41% | 363 -28% | 520 4% | 404 -19% | 462 -8% |
| Brightness Distribution (%) | 82 | 87 6% | 90 10% | 86 5% | 87 6% | 90 10% |
| Black Level * (cd/m²) | 0.32 | 0.43 -34% | 0.17 47% | 0.39 -22% | 0.35 -9% | 0.33 -3% |
| Contrast (:1) | 1568 | 726 -54% | 2259 44% | 1410 -10% | 1207 -23% | 1412 -10% |
| Colorchecker dE 2000 * | 5.48 | 7.6 -39% | 3.5 36% | 2.12 61% | 1.02 81% | 1.93 65% |
| Colorchecker dE 2000 max. * | 10.03 | 15.06 -50% | 5.5 45% | 3.66 64% | 3.06 69% | 4.26 58% |
| Colorchecker dE 2000 calibrated * | 2.22 | 1.96 12% | 1 55% | 1.37 38% | 0.95 57% | 1.99 10% |
| Greyscale dE 2000 * | 8.1 | 8.8 -9% | 4.6 43% | 2.6 68% | 1 88% | 1.7 79% |
| Gamma | 2.07 106% | 2.01 109% | 2.32 95% | 2.3 96% | 2.21 100% | 2.15 102% |
| CCT | 6730 97% | 6874 95% | 6884 94% | 6884 94% | 6502 100% | 6382 102% |
| Color Space (Percent of AdobeRGB 1998) (%) | 74.1 | 59.1 -20% | 62 -16% | 65.4 -12% | 62.1 -16% | 62.2 -16% |
| Color Space (Percent of sRGB) (%) | 100 | 92.3 -8% | 97.7 -2% | 99.7 0% | 97.1 -3% | 95.7 -4% |
| Moyenne finale (programmes/paramètres) | -9% /
-19% | -2% /
9% | 0% /
10% | -2% /
9% | 2% /
9% |
* ... Moindre est la valeur, meilleures sont les performances
Temps de réponse de l'écran
| ↔ Temps de réponse noir à blanc | ||
|---|---|---|
| 27.2 ms ... hausse ↗ et chute ↘ combinées | ↗ 15.6 ms hausse | 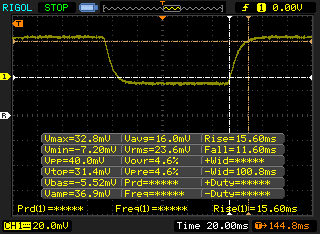 |
| ↘ 11.6 ms chute | ||
| L'écran souffre de latences relativement élevées, insuffisant pour le jeu. En comparaison, tous les appareils testés affichent entre 0.1 (minimum) et 240 (maximum) ms. » 69 % des appareils testés affichent de meilleures performances. Cela signifie que les latences relevées sont moins bonnes que la moyenne (19.8 ms) de tous les appareils testés. | ||
| ↔ Temps de réponse gris 50% à gris 80% | ||
| 44.4 ms ... hausse ↗ et chute ↘ combinées | ↗ 22.4 ms hausse | 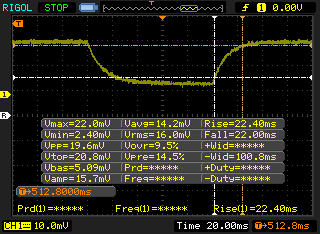 |
| ↘ 22 ms chute | ||
| L'écran souffre de latences très élevées, à éviter pour le jeu. En comparaison, tous les appareils testés affichent entre 0.165 (minimum) et 636 (maximum) ms. » 76 % des appareils testés affichent de meilleures performances. Cela signifie que les latences relevées sont moins bonnes que la moyenne (31 ms) de tous les appareils testés. | ||
Scintillement / MLI (Modulation de largeur d'impulsion)
| Scintillement / MLI (Modulation de largeur d'impulsion) non décelé | 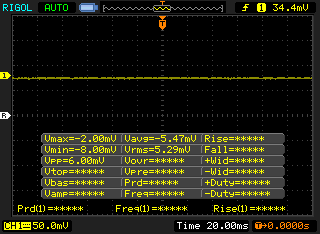 | ||
En comparaison, 52 % des appareils testés n'emploient pas MDI pour assombrir leur écran. Nous avons relevé une moyenne à 7772 (minimum : 5 - maximum : 343500) Hz dans le cas où une MDI était active. | |||
| Cinebench R10 | |
| Rendering Multiple CPUs 32Bit | |
| Dell G5 15 5590 | |
| Lenovo Legion Y540-17IRH | |
| Moyenne Intel Core i7-1065G7 (16551 - 26481, n=4) | |
| Dynabook Portege A30-E-174 | |
| Dell XPS 13 7390 2-in-1 Core i3 | |
| Rendering Single 32Bit | |
| Moyenne Intel Core i7-1065G7 (7083 - 7390, n=4) | |
| Dell XPS 13 7390 2-in-1 Core i3 | |
| Lenovo Legion Y540-17IRH | |
| Dell G5 15 5590 | |
| Dynabook Portege A30-E-174 | |
| wPrime 2.10 - 1024m | |
| Dell XPS 13 7390 2-in-1 Core i3 | |
| Moyenne Intel Core i7-1065G7 (233 - 354, n=3) | |
* ... Moindre est la valeur, meilleures sont les performances
| PCMark 8 Home Score Accelerated v2 | 3448 points | |
| PCMark 8 Work Score Accelerated v2 | 4382 points | |
| PCMark 10 Score | 4633 points | |
Aide | ||
| Lenovo Yoga C940-14IIL 81Q9 Samsung PM981a MZVLB1T0HBLR | Lenovo Yoga C930-13IKB 81C4 SK hynix PC401 HFS256GD9TNG | Lenovo Yoga C940-14IIL Samsung SSD PM981 MZVLB512HAJQ | Dell XPS 13 7390 2-in-1 Core i7 Toshiba BG4 KBG40ZPZ512G | Razer Blade Stealth i7-1065G7 Iris Plus Samsung SSD PM981 MZVLB256HAHQ | Asus ZenBook S13 UX392FN WDC PC SN520 SDAPNUW-512G | |
|---|---|---|---|---|---|---|
| AS SSD | -162% | 3% | -74% | -45% | -15% | |
| Seq Read (MB/s) | 2213 | 1228 -45% | 2525 14% | 1801 -19% | 1989 -10% | 1224 -45% |
| Seq Write (MB/s) | 1401 | 544 -61% | 1253 -11% | 1125 -20% | 827 -41% | 907 -35% |
| 4K Read (MB/s) | 55.2 | 39.16 -29% | 59.1 7% | 39.7 -28% | 40.12 -27% | 41.46 -25% |
| 4K Write (MB/s) | 130.3 | 106.5 -18% | 134.1 3% | 67 -49% | 135.1 4% | 126.2 -3% |
| 4K-64 Read (MB/s) | 878 | 466.4 -47% | 1010 15% | 1253 43% | 531 -40% | 1021 16% |
| 4K-64 Write (MB/s) | 1478 | 305.1 -79% | 1461 -1% | 209 -86% | 309.9 -79% | 1251 -15% |
| Access Time Read * (ms) | 0.036 | 0.46 -1178% | 0.052 -44% | 0.069 -92% | 0.085 -136% | 0.053 -47% |
| Access Time Write * (ms) | 0.086 | 0.51 -493% | 0.029 66% | 0.625 -627% | 0.09 -5% | 0.027 69% |
| Score Read (Points) | 1154 | 628 -46% | 1322 15% | 1472 28% | 770 -33% | 1185 3% |
| Score Write (Points) | 1748 | 466 -73% | 1721 -2% | 388 -78% | 528 -70% | 1468 -16% |
| Score Total (Points) | 3467 | 1394 -60% | 3670 6% | 2583 -25% | 1644 -53% | 3250 -6% |
| Copy ISO MB/s (MB/s) | 2161 | 628 -71% | 2016 -7% | 1293 -40% | 1418 -34% | 1404 -35% |
| Copy Program MB/s (MB/s) | 572 | 540 -6% | 542 -5% | 560 -2% | 382.7 -33% | 402.4 -30% |
| Copy Game MB/s (MB/s) | 1433 | 533 -63% | 1278 -11% | 927 -35% | 334.2 -77% | 902 -37% |
* ... Moindre est la valeur, meilleures sont les performances

| 3DMark 11 Performance | 4950 points | |
| 3DMark Ice Storm Standard Score | 58009 points | |
| 3DMark Cloud Gate Standard Score | 12842 points | |
| 3DMark Fire Strike Score | 2792 points | |
| 3DMark Time Spy Score | 934 points | |
Aide | ||
| Shadow of the Tomb Raider - 1280x720 Lowest Preset | |
| Acer Nitro 5 AN515-42-R6V0 | |
| Acer Aspire 5 A515-52G-723L | |
| Dell Inspiron 15 5000 5585 | |
| Moyenne Intel Iris Plus Graphics G7 (Ice Lake 64 EU) (15.6 - 33, n=13) | |
| Lenovo Yoga C940-14IIL 81Q9 | |
| Dell XPS 13 7390 Core i7-10710U | |
| Bas | Moyen | Élevé | Ultra | |
|---|---|---|---|---|
| BioShock Infinite (2013) | 104.2 | 68.3 | 59.9 | 22.1 |
| The Witcher 3 (2015) | 52.7 | 36.3 | 19.6 | 9.9 |
| Rocket League (2017) | 119 | 68.5 | 44.3 | |
| Shadow of the Tomb Raider (2018) | 26 |
| Lenovo Yoga C940-14IIL 81Q9 Iris Plus Graphics G7 (Ice Lake 64 EU), i7-1065G7, Samsung PM981a MZVLB1T0HBLR | MSI Prestige 15 A10SC GeForce GTX 1650 Max-Q, i7-10710U, Samsung SSD PM981 MZVLB1T0HALR | Asus ZenBook S13 UX392FN GeForce MX150, i7-8565U, WDC PC SN520 SDAPNUW-512G | Lenovo Yoga C930-13IKB 81C4 UHD Graphics 620, i5-8550U, SK hynix PC401 HFS256GD9TNG | Razer Blade Stealth i7-1065G7 Iris Plus Iris Plus Graphics G7 (Ice Lake 64 EU), i7-1065G7, Samsung SSD PM981 MZVLB256HAHQ | Dell XPS 13 7390 2-in-1 Core i7 Iris Plus Graphics G7 (Ice Lake 64 EU), i7-1065G7, Toshiba BG4 KBG40ZPZ512G | |
|---|---|---|---|---|---|---|
| Noise | -3% | -4% | 2% | -1% | -1% | |
| arrêt / environnement * (dB) | 28.5 | 29.3 -3% | 28.1 1% | 27.9 2% | 28.3 1% | 28.1 1% |
| Idle Minimum * (dB) | 28.5 | 30.1 -6% | 28.1 1% | 27.9 2% | 28.3 1% | 28.1 1% |
| Idle Average * (dB) | 28.5 | 30.2 -6% | 28.1 1% | 27.9 2% | 28.3 1% | 28.1 1% |
| Idle Maximum * (dB) | 29 | 30.2 -4% | 29 -0% | 29.3 -1% | 28.3 2% | 28.1 3% |
| Load Average * (dB) | 33 | 31.5 5% | 41.1 -25% | 32 3% | 33.5 -2% | 31.7 4% |
| Witcher 3 ultra * (dB) | 40.7 | 37 9% | 41.1 -1% | 34.5 15% | 43.4 -7% | |
| Load Maximum * (dB) | 39.5 | 47 -19% | 41.1 -4% | 39.3 1% | 49.4 -25% | 43.4 -10% |
* ... Moindre est la valeur, meilleures sont les performances
Degré de la nuisance sonore
| Au repos |
| 28.5 / 28.5 / 29 dB(A) |
| Fortement sollicité |
| 33 / 39.5 dB(A) |
 | ||
30 dB silencieux 40 dB(A) audible 50 dB(A) bruyant |
||
min: | ||
(±) La température maximale du côté supérieur est de 42.6 °C / 109 F, par rapport à la moyenne de 35.4 °C / 96 F, allant de 19.6 à 60 °C pour la classe Convertible.
(±) Le fond chauffe jusqu'à un maximum de 43.8 °C / 111 F, contre une moyenne de 36.9 °C / 98 F
(+) En utilisation inactive, la température moyenne du côté supérieur est de 23.7 °C / 75 F, par rapport à la moyenne du dispositif de 30.3 °C / 87 F.
(±) En jouant à The Witcher 3, la température moyenne du côté supérieur est de 34.2 °C / 94 F, alors que la moyenne de l'appareil est de 30.3 °C / 87 F.
(+) Les repose-poignets et le pavé tactile sont plus froids que la température de la peau avec un maximum de 29.6 °C / 85.3 F et sont donc froids au toucher.
(±) La température moyenne de la zone de l'appui-paume de dispositifs similaires était de 28 °C / 82.4 F (-1.6 °C / #-2.9 F).
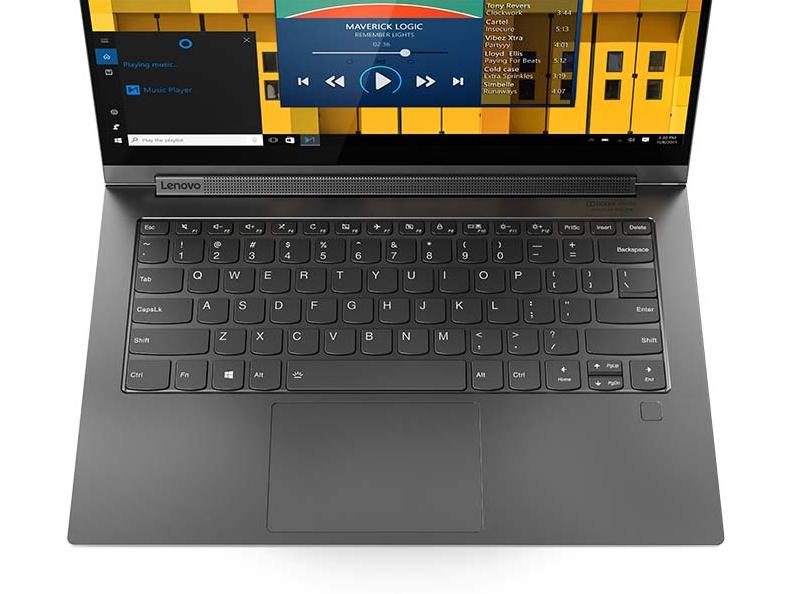
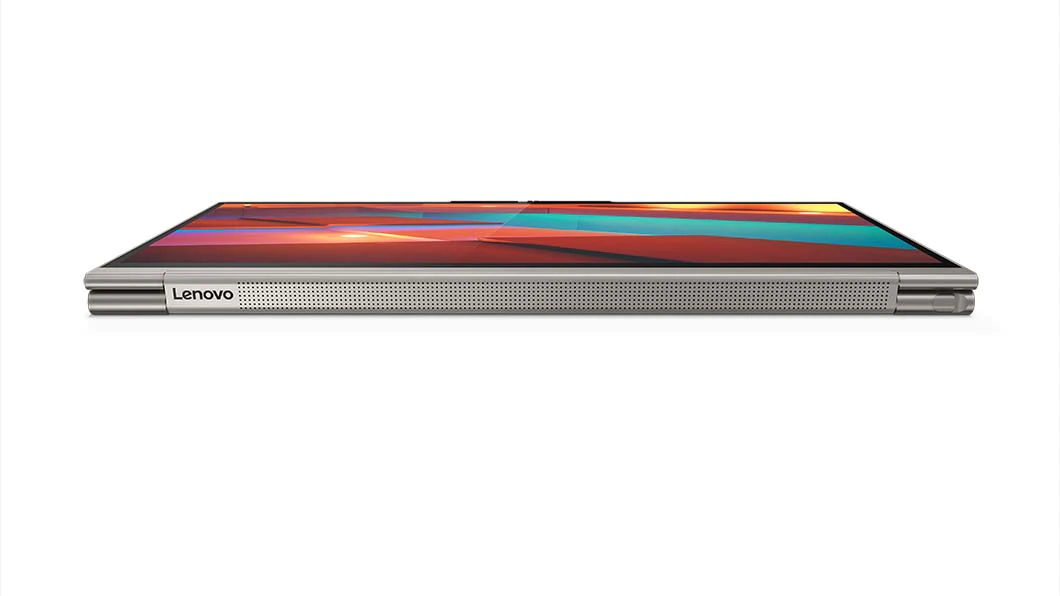
Lenovo Yoga C940-14IIL 81Q9 analyse audio
(+) | les haut-parleurs peuvent jouer relativement fort (90.3# dB)
Basses 100 - 315 Hz
(±) | basse réduite - en moyenne 11.2% inférieure à la médiane
(±) | la linéarité des basses est moyenne (10.9% delta à la fréquence précédente)
Médiums 400 - 2000 Hz
(+) | médiane équilibrée - seulement 2.2% de la médiane
(+) | les médiums sont linéaires (3.2% delta à la fréquence précédente)
Aiguës 2 - 16 kHz
(±) | sommets réduits - en moyenne 6% plus bas que la médiane
(±) | la linéarité des aigus est moyenne (8.9% delta à la fréquence précédente)
Globalement 100 - 16 000 Hz
(+) | le son global est linéaire (14.9% différence à la médiane)
Par rapport à la même classe
» 24% de tous les appareils testés de cette catégorie étaient meilleurs, 5% similaires, 72% pires
» Le meilleur avait un delta de 6%, la moyenne était de 20%, le pire était de 57%.
Par rapport à tous les appareils testés
» 20% de tous les appareils testés étaient meilleurs, 4% similaires, 76% pires
» Le meilleur avait un delta de 4%, la moyenne était de 24%, le pire était de 134%.
Apple MacBook 12 (Early 2016) 1.1 GHz analyse audio
(+) | les haut-parleurs peuvent jouer relativement fort (83.6# dB)
Basses 100 - 315 Hz
(±) | basse réduite - en moyenne 11.3% inférieure à la médiane
(±) | la linéarité des basses est moyenne (14.2% delta à la fréquence précédente)
Médiums 400 - 2000 Hz
(+) | médiane équilibrée - seulement 2.4% de la médiane
(+) | les médiums sont linéaires (5.5% delta à la fréquence précédente)
Aiguës 2 - 16 kHz
(+) | des sommets équilibrés - à seulement 2% de la médiane
(+) | les aigus sont linéaires (4.5% delta à la fréquence précédente)
Globalement 100 - 16 000 Hz
(+) | le son global est linéaire (10.2% différence à la médiane)
Par rapport à la même classe
» 7% de tous les appareils testés de cette catégorie étaient meilleurs, 2% similaires, 91% pires
» Le meilleur avait un delta de 5%, la moyenne était de 18%, le pire était de 53%.
Par rapport à tous les appareils testés
» 5% de tous les appareils testés étaient meilleurs, 1% similaires, 94% pires
» Le meilleur avait un delta de 4%, la moyenne était de 24%, le pire était de 134%.
| Éteint/en veille | |
| Au repos | |
| Fortement sollicité |
|
Légende:
min: | |
| Lenovo Yoga C940-14IIL 81Q9 i7-1065G7, Iris Plus Graphics G7 (Ice Lake 64 EU), Samsung PM981a MZVLB1T0HBLR, IPS, 3840x2160, 14" | Asus ZenBook S13 UX392FN i7-8565U, GeForce MX150, WDC PC SN520 SDAPNUW-512G, IPS, 1920x1080, 13.9" | Lenovo Yoga C930-13IKB 81C4 i5-8550U, UHD Graphics 620, SK hynix PC401 HFS256GD9TNG, IPS, 1920x1080, 13.9" | Lenovo Yoga C940-14IIL i7-1065G7, Iris Plus Graphics G7 (Ice Lake 64 EU), Samsung SSD PM981 MZVLB512HAJQ, IPS LED, 1920x1080, 14" | Razer Blade Stealth 13, Core i7-1065G7 i7-1065G7, GeForce GTX 1650 Max-Q, Lite-On CA3-8D512, IPS LED, 3840x2160, 13.3" | Dell XPS 13 7390 2-in-1 Core i7 i7-1065G7, Iris Plus Graphics G7 (Ice Lake 64 EU), Toshiba BG4 KBG40ZPZ512G, IPS, 1920x1200, 13.4" | Huawei MateBook 14 KLV-W29 i7-8565U, GeForce MX250, Samsung SSD PM981 MZVLB512HAJQ, IPS, 2160x1440, 14" | |
|---|---|---|---|---|---|---|---|
| Power Consumption | 19% | 17% | 23% | -35% | 33% | 1% | |
| Idle Minimum * (Watt) | 5.6 | 3.4 39% | 3.4 39% | 3.2 43% | 10.7 -91% | 2.6 54% | 3.7 34% |
| Idle Average * (Watt) | 10.5 | 6.3 40% | 7.5 29% | 7 33% | 13.6 -30% | 5.3 50% | 9.3 11% |
| Idle Maximum * (Watt) | 12 | 10.4 13% | 11.8 2% | 8.9 26% | 15.7 -31% | 7 42% | 12.8 -7% |
| Load Average * (Watt) | 53.3 | 51 4% | 47.7 11% | 47.6 11% | 60 -13% | 43.1 19% | 58.8 -10% |
| Witcher 3 ultra * (Watt) | 46.9 | 39 17% | 64 -36% | 43.1 8% | 55.8 -19% | ||
| Load Maximum * (Watt) | 64.6 | 62.7 3% | 63.2 2% | 63.1 2% | 71 -10% | 49 24% | 65 -1% |
* ... Moindre est la valeur, meilleures sont les performances
| Lenovo Yoga C940-14IIL 81Q9 i7-1065G7, Iris Plus Graphics G7 (Ice Lake 64 EU), 60 Wh | Asus ZenBook S13 UX392FN i7-8565U, GeForce MX150, 50 Wh | Lenovo Yoga C930-13IKB 81C4 i5-8550U, UHD Graphics 620, 60 Wh | Lenovo Yoga C940-14IIL i7-1065G7, Iris Plus Graphics G7 (Ice Lake 64 EU), 60 Wh | Razer Blade Stealth i7-1065G7 Iris Plus i7-1065G7, Iris Plus Graphics G7 (Ice Lake 64 EU), 53.1 Wh | Dell XPS 13 7390 2-in-1 Core i7 i7-1065G7, Iris Plus Graphics G7 (Ice Lake 64 EU), 51 Wh | |
|---|---|---|---|---|---|---|
| Autonomie de la batterie | 15% | 52% | 45% | 33% | 23% | |
| WiFi v1.3 (h) | 7.3 | 8.4 15% | 11.1 52% | 10.6 45% | 9.7 33% | 9 23% |
| Reader / Idle (h) | 28.5 | |||||
| Load (h) | 1.7 | 1.1 |
Points positifs
Points négatifs
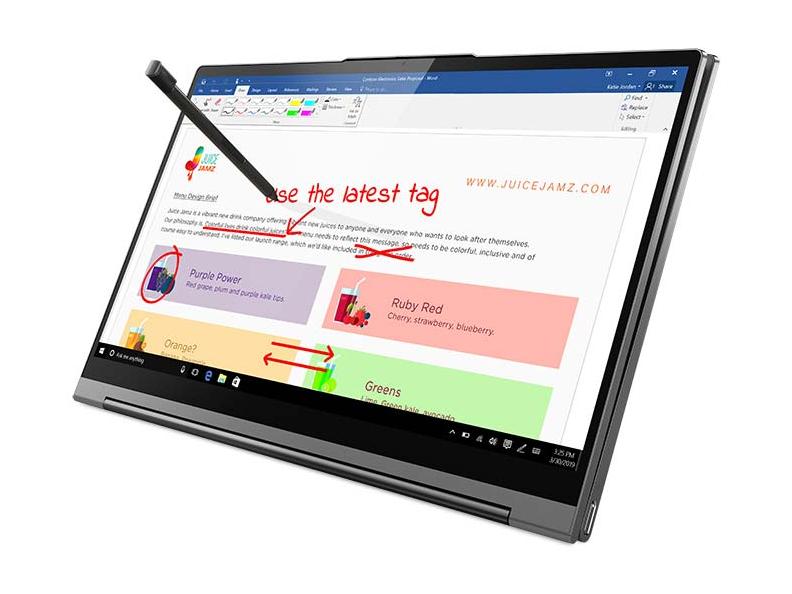
Choisir le Yoga C940 4K UHD plutôt que la version FHD moins chère apporte à la fois des avantages et des inconvénients. La bonne nouvelle est que la résolution supérieure permet une meilleure gestion du stylet, et que l’écran possède des couleurs plus profondes et une luminosité supérieure à l’écran FHD, sans que les temps de réponse et le contraste soient beaucoup impactés. Les couleurs et l’échelle de gris sont étrangement peu fidèles en sortie d’usine, mais un calibrage corrige cela.
Le principal défaut de la version 4K est son autonomie réduite, d’environ 3h d’après nos mesures, et la consommation légèrement supérieure. Même ainsi, les 7h d’utilisation WLAN réaliste devraient suffirent pour la plupart des utilisateurs. Toutes les versions du Yoga C940-14 ont les mêmes désavantages en ce qui concerne la maintenance, les ventilateurs en jeu, et les performances de jeu instables d’Ice Lake.
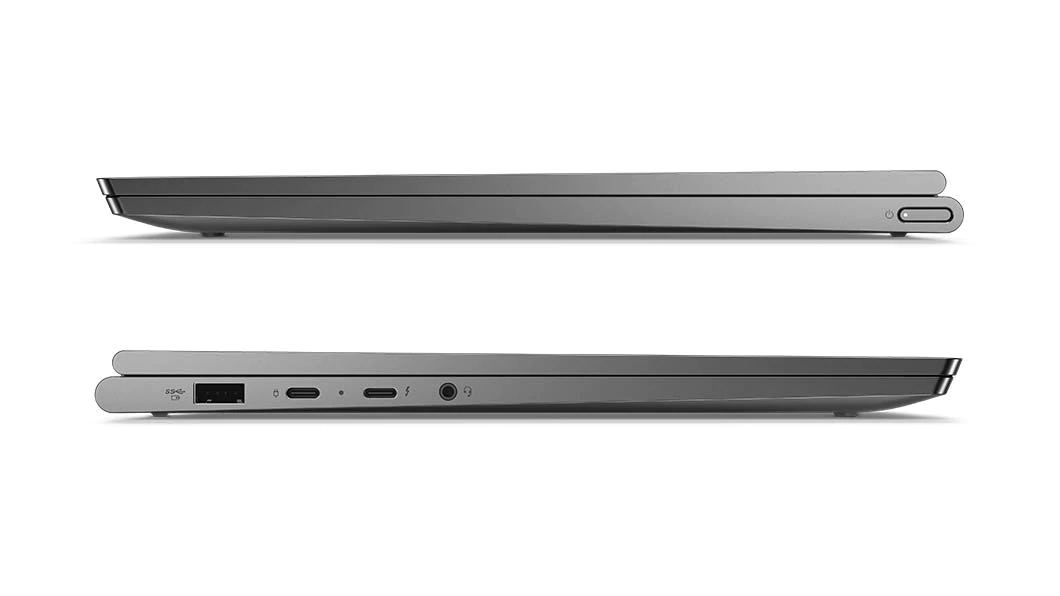
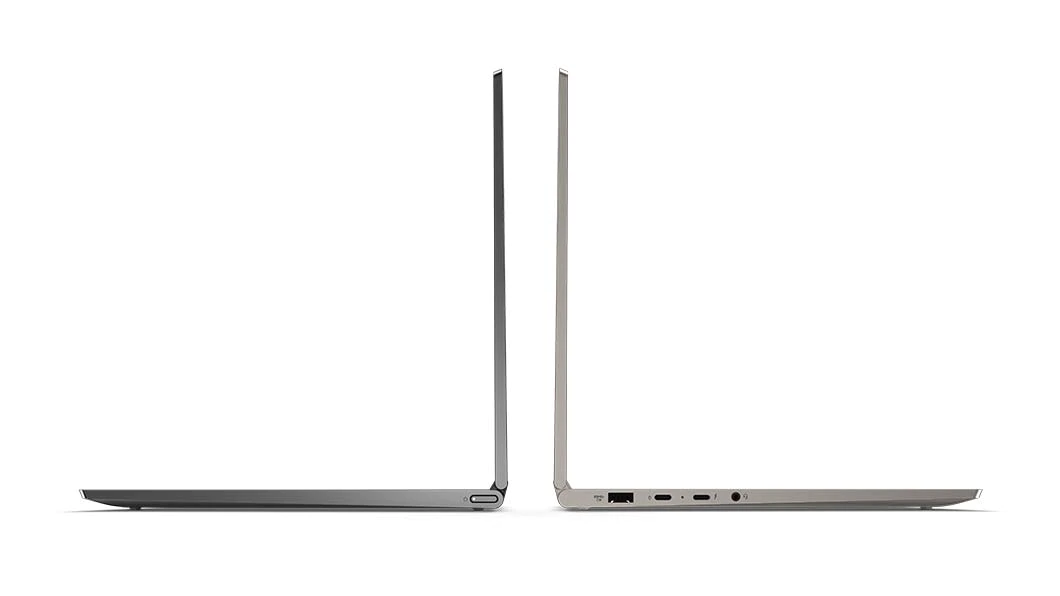
La série HP EliteBook x360 1040 orientée pro possède une connectivité plus complète, des écrans plus lumineux, et s’avère plus fin, mais à un prix supérieur que le Lenovo Yoga C940-14. Si vous voulez un convertible 14 pouces grand public plus équilibré, sans passer au Spectre x360 de 13,3 pouces ou au Dell XPS 2-en-1 de 13,4 pouces, alors le Yoga C940 devrait être en bonne position.
L’intégralité de cette critique est disponible en anglais en suivant ce lien.
Lenovo Yoga C940-14IIL 81Q9
- 12/19/2019 v7 (old)
Allen Ngo
Price comparison
