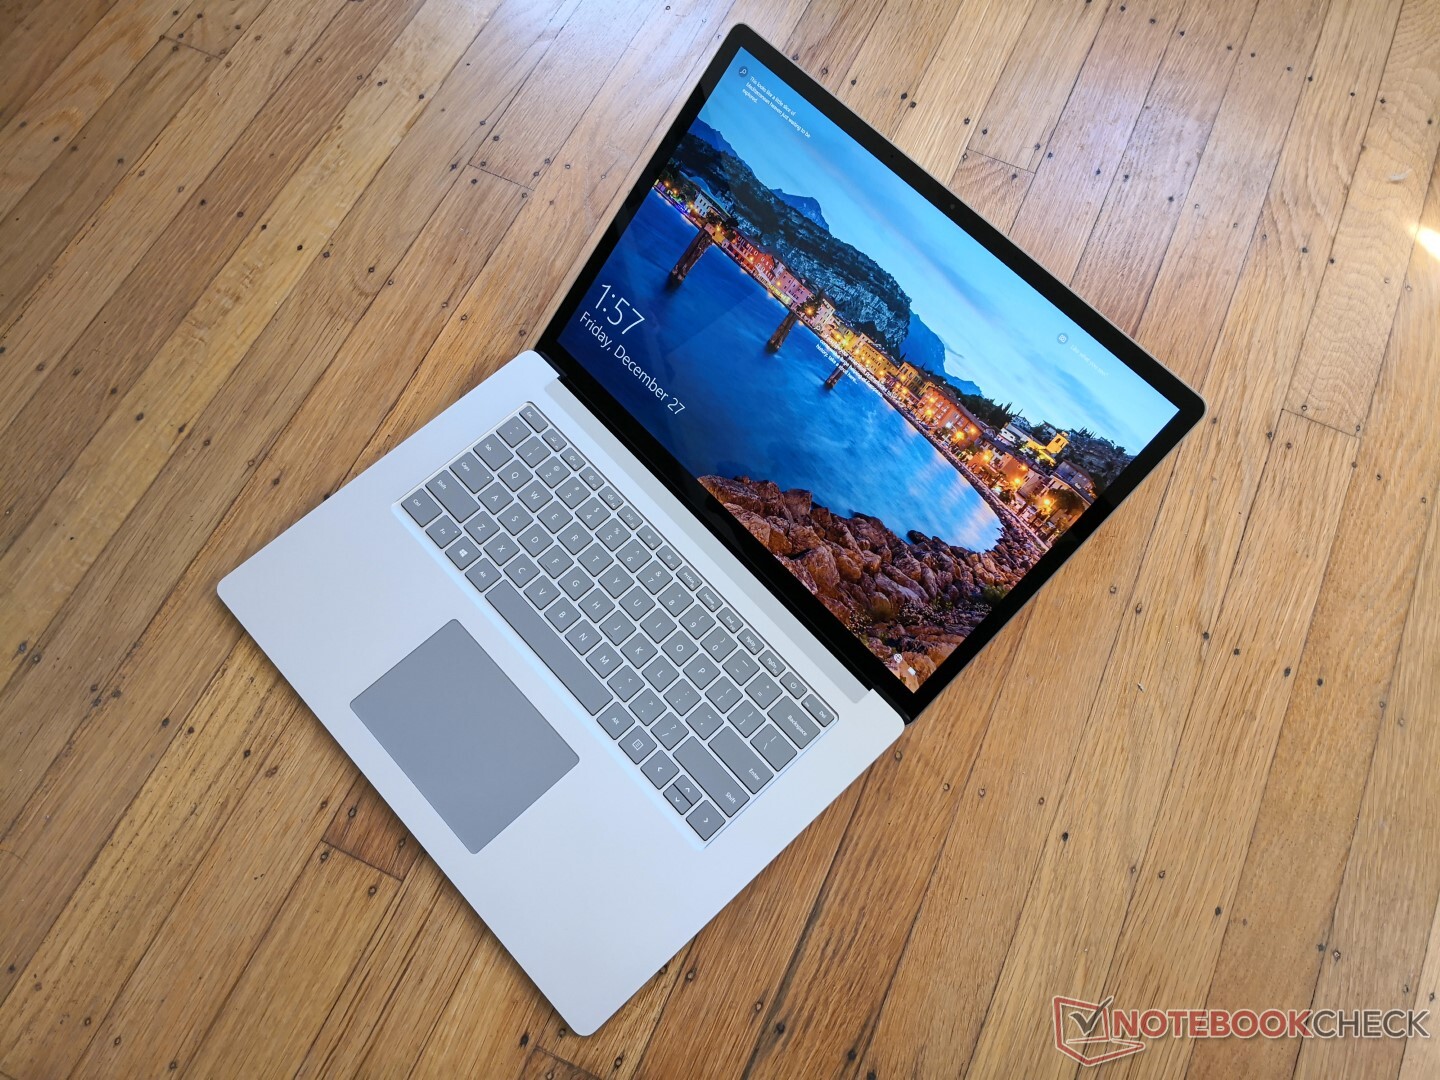
Test du Microsoft Surface Laptop 3 (15 pouces, i7-1065G7, Iris Plus G7, FHD+) : meilleur avec Ice Lake
Note | Date | Modèle | Poids | Épaisseur | Taille | Résolution | Prix |
|---|---|---|---|---|---|---|---|
| 83.9 % v7 (old) | 01/20 | Microsoft Surface Laptop 3 15 i7-1065G7 i7-1065G7, Iris Plus Graphics G7 (Ice Lake 64 EU) | 1.5 kg | 14.7 mm | 15.00" | 2496x1664 | |
| 86.3 % v7 (old) | 09/19 | Dell XPS 15 7590 i5 iGPU FHD i5-9300H, UHD Graphics 630 | 1.9 kg | 17 mm | 15.60" | 1920x1080 | |
| 86 % v7 (old) | 12/19 | Lenovo Yoga C940-15IRH i7-9750H, GeForce GTX 1650 Max-Q | 2 kg | 19.7 mm | 15.60" | 1920x1080 | |
| 83.9 % v7 (old) | 03/19 | HP Spectre x360 15-df0126ng i7-8750H, GeForce GTX 1050 Ti Max-Q | 2.2 kg | 19.3 mm | 15.60" | 3840x2160 | |
| 89.7 % v7 (old) | 04/20 | Apple MacBook Pro 16 2019 i9 5500M i9-9880H, Radeon Pro 5500M | 2 kg | 16.2 mm | 16.00" | 3072x1920 |
| |||||||||||||||||||||||||
Homogénéité de la luminosité: 78 %
Valeur mesurée au centre, sur batterie: 412.4 cd/m²
Contraste: 1178:1 (Valeurs des noirs: 0.35 cd/m²)
ΔE ColorChecker Calman: 1.04 | ∀{0.5-29.43 Ø4.71}
calibrated: 0.74
ΔE Greyscale Calman: 1.3 | ∀{0.09-98 Ø4.96}
98.4% sRGB (Argyll 1.6.3 3D)
62.4% AdobeRGB 1998 (Argyll 1.6.3 3D)
67.8% AdobeRGB 1998 (Argyll 3D)
98.4% sRGB (Argyll 3D)
65.6% Display P3 (Argyll 3D)
Gamma: 2.07
CCT: 6634 K
| Microsoft Surface Laptop 3 15 i7-1065G7 Sharp LQ150P1JX51, IPS, 15", 2496x1664 | Apple MacBook Pro 16 2019 i9 5500M APPA044, IPS, 16", 3072x1920 | Dell XPS 15 7590 i5 iGPU FHD LQ156M1, IPS, 15.6", 1920x1080 | Asus ZenBook 15 UX534FT-DB77 BOE NV156FHM-N63, IPS, 15.6", 1920x1080 | MSI Prestige 15 A10SC Sharp LQ156D1JW42, IPS, 15.6", 3840x2160 | Microsoft Surface Laptop 3 15 Ryzen 5 3580U Sharp LQ150P1JX51, IPS, 15", 2496x1664 | |
|---|---|---|---|---|---|---|
| Display | 1% | -5% | 22% | -1% | ||
| Display P3 Coverage (%) | 65.6 | 66.5 1% | 66.6 2% | 82 25% | 66.9 2% | |
| sRGB Coverage (%) | 98.4 | 98 0% | 87.7 -11% | 98.3 0% | 99.3 1% | |
| AdobeRGB 1998 Coverage (%) | 67.8 | 68.4 1% | 64.1 -5% | 96.2 42% | 63.7 -6% | |
| Response Times | 7% | 11% | 20% | -8% | 10% | |
| Response Time Grey 50% / Grey 80% * (ms) | 56 ? | 52.4 ? 6% | 52.8 ? 6% | 41.2 ? 26% | 60 ? -7% | 47.2 ? 16% |
| Response Time Black / White * (ms) | 38 ? | 34.9 ? 8% | 32 ? 16% | 33.2 ? 13% | 41.2 ? -8% | 36.8 ? 3% |
| PWM Frequency (Hz) | 21370 ? | 131700 | 1020 ? | 26040 ? | 21370 ? | |
| Screen | -14% | -34% | -132% | -65% | -31% | |
| Brightness middle (cd/m²) | 412.4 | 519 26% | 588 43% | 312.6 -24% | 464.5 13% | 416.9 1% |
| Brightness (cd/m²) | 374 | 477 28% | 555 48% | 290 -22% | 451 21% | 389 4% |
| Brightness Distribution (%) | 78 | 86 10% | 89 14% | 85 9% | 92 18% | 86 10% |
| Black Level * (cd/m²) | 0.35 | 0.39 -11% | 0.4 -14% | 0.31 11% | 0.5 -43% | 0.4 -14% |
| Contrast (:1) | 1178 | 1331 13% | 1470 25% | 1008 -14% | 929 -21% | 1042 -12% |
| Colorchecker dE 2000 * | 1.04 | 2.28 -119% | 2.5 -140% | 5.78 -456% | 3.36 -223% | 2.75 -164% |
| Colorchecker dE 2000 max. * | 2.83 | 6.54 -131% | 6.3 -123% | 8.86 -213% | 7.06 -149% | 6.64 -135% |
| Colorchecker dE 2000 calibrated * | 0.74 | 0.86 -16% | 0.6 19% | 3.78 -411% | 3.42 -362% | 0.71 4% |
| Greyscale dE 2000 * | 1.3 | 0.9 31% | 4.5 -246% | 5.4 -315% | 1.3 -0% | 1.8 -38% |
| Gamma | 2.07 106% | 2145 0% | 2.2 100% | 2.21 100% | 2.14 103% | 2.09 105% |
| CCT | 6634 98% | 6572 99% | 6836 95% | 7864 83% | 6596 99% | 6646 98% |
| Color Space (Percent of AdobeRGB 1998) (%) | 62.4 | 78 25% | 63.2 1% | 57.1 -8% | 84.8 36% | 63.4 2% |
| Color Space (Percent of sRGB) (%) | 98.4 | 98 0% | 87.4 -11% | 98.3 0% | 99.4 1% | |
| Moyenne finale (programmes/paramètres) | -4% /
-11% | -7% /
-22% | -39% /
-89% | -17% /
-41% | -7% /
-20% |
* ... Moindre est la valeur, meilleures sont les performances
Temps de réponse de l'écran
| ↔ Temps de réponse noir à blanc | ||
|---|---|---|
| 38 ms ... hausse ↗ et chute ↘ combinées | ↗ 21.2 ms hausse | 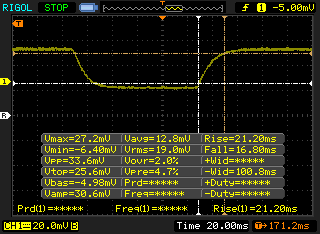 |
| ↘ 16.8 ms chute | ||
| L'écran souffre de latences très élevées, à éviter pour le jeu. En comparaison, tous les appareils testés affichent entre 0.1 (minimum) et 240 (maximum) ms. » 96 % des appareils testés affichent de meilleures performances. Cela signifie que les latences relevées sont moins bonnes que la moyenne (19.8 ms) de tous les appareils testés. | ||
| ↔ Temps de réponse gris 50% à gris 80% | ||
| 56 ms ... hausse ↗ et chute ↘ combinées | ↗ 27.6 ms hausse | 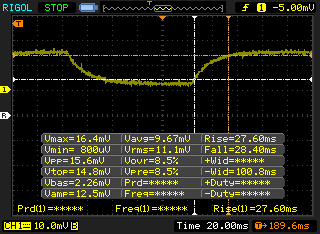 |
| ↘ 28.4 ms chute | ||
| L'écran souffre de latences très élevées, à éviter pour le jeu. En comparaison, tous les appareils testés affichent entre 0.165 (minimum) et 636 (maximum) ms. » 93 % des appareils testés affichent de meilleures performances. Cela signifie que les latences relevées sont moins bonnes que la moyenne (31 ms) de tous les appareils testés. | ||
Scintillement / MLI (Modulation de largeur d'impulsion)
| Scintillement / MLI (Modulation de largeur d'impulsion) décelé | 21370 Hz | ≤ 51 Niveau de luminosité | 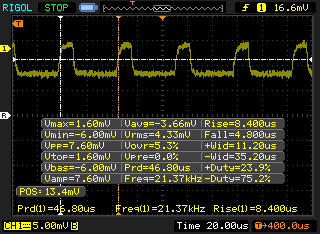 |
Le rétroéclairage de l'écran scintille à la fréquence de 21370 Hz (certainement du fait de l'utilisation d'une MDI - Modulation de largeur d'impulsion) à un niveau de luminosité inférieur ou égal à 51 % . Aucun scintillement ne devrait être perceptible au-dessus de cette valeur. La fréquence de rafraîchissement de 21370 Hz est élevée, la grande majorité des utilisateurs ne devrait pas percevoir de scintillements et être sujette à une fatigue oculaire accrue. En comparaison, 52 % des appareils testés n'emploient pas MDI pour assombrir leur écran. Nous avons relevé une moyenne à 7754 (minimum : 5 - maximum : 343500) Hz dans le cas où une MDI était active. | |||
| PCMark 8 Home Score Accelerated v2 | 3783 points | |
| PCMark 8 Work Score Accelerated v2 | 4799 points | |
| PCMark 10 Score | 4644 points | |
Aide | ||
| Microsoft Surface Laptop 3 15 i7-1065G7 Toshiba KBG40ZNS256G NVMe | Apple MacBook Pro 16 2019 i9 5500M Apple SSD AP1024 7171 | Asus ZenBook 15 UX534FT-DB77 Samsung SSD PM981 MZVLB1T0HALR | MSI Prestige 15 A10SC Samsung SSD PM981 MZVLB1T0HALR | Microsoft Surface Laptop 3 15 Ryzen 5 3580U SK hynix BC501 HFM256GDGTNG | Razer Blade Stealth 13, Core i7-1065G7 Lite-On CA3-8D512 | |
|---|---|---|---|---|---|---|
| AS SSD | 82% | 66% | 85% | -21% | 13% | |
| Seq Read (MB/s) | 1756 | 2531 44% | 1887 7% | 1274 -27% | 1122 -36% | 2666 52% |
| Seq Write (MB/s) | 818 | 2289 180% | 1432 75% | 1395 71% | 514 -37% | 1497 83% |
| 4K Read (MB/s) | 52.3 | 15.85 -70% | 52.3 0% | 50.3 -4% | 34.98 -33% | 53.7 3% |
| 4K Write (MB/s) | 112.2 | 39.88 -64% | 146 30% | 119.8 7% | 96.8 -14% | 133.7 19% |
| 4K-64 Read (MB/s) | 985 | 1267 29% | 969 -2% | 1599 62% | 492 -50% | 652 -34% |
| 4K-64 Write (MB/s) | 292.7 | 1749 498% | 1375 370% | 1455 397% | 339.9 16% | 272 -7% |
| Access Time Read * (ms) | 0.083 | 0.122 -47% | 0.034 59% | 0.044 47% | 0.056 33% | 0.075 10% |
| Access Time Write * (ms) | 0.619 | 0.095 85% | 0.075 88% | 0.092 85% | 0.11 82% | 0.032 95% |
| Score Read (Points) | 1213 | 1536 27% | 1210 0% | 1777 46% | 639 -47% | 972 -20% |
| Score Write (Points) | 487 | 2018 314% | 1664 242% | 1714 252% | 488 0% | 555 14% |
| Score Total (Points) | 2285 | 4317 89% | 3483 52% | 4411 93% | 1434 -37% | 1982 -13% |
| Copy ISO MB/s (MB/s) | 1192 | 1995 67% | 1375 15% | 2830 137% | 828 -31% | 1495 25% |
| Copy Program MB/s (MB/s) | 604 | 584 -3% | 468 -23% | 609 1% | 200.5 -67% | 458.4 -24% |
| Copy Game MB/s (MB/s) | 1136 | 1135 0% | 1287 13% | 1424 25% | 387.4 -66% | 964 -15% |
* ... Moindre est la valeur, meilleures sont les performances

| 3DMark 11 Performance | 4932 points | |
| 3DMark Ice Storm Standard Score | 67987 points | |
| 3DMark Cloud Gate Standard Score | 14347 points | |
| 3DMark Fire Strike Score | 2865 points | |
| 3DMark Time Spy Score | 960 points | |
Aide | ||
| F1 2019 | |
| 1280x720 Ultra Low Preset | |
| Microsoft Surface Laptop 3 15 i7-1065G7 | |
| Microsoft Surface Laptop 3 15 Ryzen 5 3580U | |
| Moyenne Intel Iris Plus Graphics G7 (Ice Lake 64 EU) (35 - 63, n=5) | |
| 1920x1080 Medium Preset AA:T AF:16x | |
| Microsoft Surface Laptop 3 15 i7-1065G7 | |
| Moyenne Intel Iris Plus Graphics G7 (Ice Lake 64 EU) (22 - 31, n=5) | |
| Microsoft Surface Laptop 3 15 Ryzen 5 3580U | |
| 1920x1080 High Preset AA:T AF:16x | |
| Microsoft Surface Laptop 3 15 i7-1065G7 | |
| Moyenne Intel Iris Plus Graphics G7 (Ice Lake 64 EU) (19 - 27, n=4) | |
| Microsoft Surface Laptop 3 15 Ryzen 5 3580U | |
| 1920x1080 Ultra High Preset AA:T AF:16x | |
| Microsoft Surface Laptop 3 15 i7-1065G7 | |
| Moyenne Intel Iris Plus Graphics G7 (Ice Lake 64 EU) (12 - 21, n=4) | |
| Microsoft Surface Laptop 3 15 Ryzen 5 3580U | |
| Borderlands 3 | |
| 1280x720 Very Low Overall Quality (DX11) | |
| Microsoft Surface Laptop 3 15 i7-1065G7 | |
| Moyenne Intel Iris Plus Graphics G7 (Ice Lake 64 EU) (26.7 - 37, n=4) | |
| Microsoft Surface Laptop 3 15 Ryzen 5 3580U | |
| 1920x1080 Medium Overall Quality (DX11) | |
| Microsoft Surface Laptop 3 15 i7-1065G7 | |
| Moyenne Intel Iris Plus Graphics G7 (Ice Lake 64 EU) (11.7 - 16, n=3) | |
| Microsoft Surface Laptop 3 15 Ryzen 5 3580U | |
| 1920x1080 High Overall Quality (DX11) | |
| Microsoft Surface Laptop 3 15 i7-1065G7 | |
| Moyenne Intel Iris Plus Graphics G7 (Ice Lake 64 EU) (7.73 - 10, n=3) | |
| Microsoft Surface Laptop 3 15 Ryzen 5 3580U | |
| Bas | Moyen | Élevé | Ultra | |
|---|---|---|---|---|
| StarCraft II: Heart of the Swarm (2013) | 358.2 | 100.9 | 64.8 | |
| BioShock Infinite (2013) | 109.6 | 73 | 61.5 | 22.6 |
| The Witcher 3 (2015) | 56.4 | 36.8 | 20.1 | 10 |
| Overwatch (2016) | 90 | 64 | 32.9 | 19.7 |
| Rocket League (2017) | 96.1 | 61 | 42.8 | |
| Shadow of the Tomb Raider (2018) | 31 | |||
| F1 2019 (2019) | 63 | 31 | 27 | 17 |
| Borderlands 3 (2019) | 37 | 16 | 10 |
| Microsoft Surface Laptop 3 15 i7-1065G7 Iris Plus Graphics G7 (Ice Lake 64 EU), i7-1065G7, Toshiba KBG40ZNS256G NVMe | Apple MacBook Pro 16 2019 i9 5500M Radeon Pro 5500M, i9-9880H, Apple SSD AP1024 7171 | Dell XPS 15 7590 i5 iGPU FHD UHD Graphics 630, i5-9300H, Toshiba XG6 KXG60ZNV512G | Asus ZenBook 15 UX534FT-DB77 GeForce GTX 1650 Max-Q, i7-8565U, Samsung SSD PM981 MZVLB1T0HALR | Razer Blade Stealth i7-8565U GeForce MX150, i7-8565U, Lite-On CA3-8D256-Q11 | Microsoft Surface Laptop 3 15 Ryzen 5 3580U Vega 9, R5 3580U, SK hynix BC501 HFM256GDGTNG | |
|---|---|---|---|---|---|---|
| Noise | -13% | -2% | -2% | -8% | 2% | |
| arrêt / environnement * (dB) | 28.5 | 29.8 -5% | 29.3 -3% | 28.4 -0% | 28.4 -0% | 28 2% |
| Idle Minimum * (dB) | 28.5 | 29.9 -5% | 29.3 -3% | 28.4 -0% | 28.5 -0% | 28 2% |
| Idle Average * (dB) | 28.5 | 29.9 -5% | 29.3 -3% | 28.4 -0% | 29 -2% | 28 2% |
| Idle Maximum * (dB) | 28.7 | 29.9 -4% | 29.8 -4% | 28.4 1% | 29.1 -1% | 28 2% |
| Load Average * (dB) | 30 | 43 -43% | 32.4 -8% | 33.9 -13% | 42.8 -43% | 29.2 3% |
| Witcher 3 ultra * (dB) | 39.2 | 45.4 -16% | 39.8 -2% | 41.4 -6% | 39 1% | |
| Load Maximum * (dB) | 41.2 | 46.1 -12% | 37.2 10% | 40.2 2% | 41.6 -1% | 41.4 -0% |
* ... Moindre est la valeur, meilleures sont les performances
Degré de la nuisance sonore
| Au repos |
| 28.5 / 28.5 / 28.7 dB(A) |
| Fortement sollicité |
| 30 / 41.2 dB(A) |
 | ||
30 dB silencieux 40 dB(A) audible 50 dB(A) bruyant |
||
min: | ||
(±) La température maximale du côté supérieur est de 41.8 °C / 107 F, par rapport à la moyenne de 34.3 °C / 94 F, allant de 21.2 à 62.5 °C pour la classe Office.
(-) Le fond chauffe jusqu'à un maximum de 45.6 °C / 114 F, contre une moyenne de 36.8 °C / 98 F
(+) En utilisation inactive, la température moyenne du côté supérieur est de 21.6 °C / 71 F, par rapport à la moyenne du dispositif de 29.5 °C / 85 F.
(±) En jouant à The Witcher 3, la température moyenne du côté supérieur est de 32.2 °C / 90 F, alors que la moyenne de l'appareil est de 29.5 °C / 85 F.
(+) Les repose-poignets et le pavé tactile sont plus froids que la température de la peau avec un maximum de 29 °C / 84.2 F et sont donc froids au toucher.
(±) La température moyenne de la zone de l'appui-paume de dispositifs similaires était de 27.5 °C / 81.5 F (-1.5 °C / #-2.7 F).
Microsoft Surface Laptop 3 15 i7-1065G7 analyse audio
(±) | le niveau sonore du haut-parleur est moyen mais bon (80.5# dB)
Basses 100 - 315 Hz
(±) | basse réduite - en moyenne 5.3% inférieure à la médiane
(±) | la linéarité des basses est moyenne (10.3% delta à la fréquence précédente)
Médiums 400 - 2000 Hz
(+) | médiane équilibrée - seulement 2.7% de la médiane
(+) | les médiums sont linéaires (6.7% delta à la fréquence précédente)
Aiguës 2 - 16 kHz
(+) | des sommets équilibrés - à seulement 2.7% de la médiane
(±) | la linéarité des aigus est moyenne (8.5% delta à la fréquence précédente)
Globalement 100 - 16 000 Hz
(+) | le son global est linéaire (11.7% différence à la médiane)
Par rapport à la même classe
» 4% de tous les appareils testés de cette catégorie étaient meilleurs, 2% similaires, 95% pires
» Le meilleur avait un delta de 7%, la moyenne était de 21%, le pire était de 53%.
Par rapport à tous les appareils testés
» 8% de tous les appareils testés étaient meilleurs, 3% similaires, 89% pires
» Le meilleur avait un delta de 4%, la moyenne était de 23%, le pire était de 134%.
Apple MacBook 12 (Early 2016) 1.1 GHz analyse audio
(+) | les haut-parleurs peuvent jouer relativement fort (83.6# dB)
Basses 100 - 315 Hz
(±) | basse réduite - en moyenne 11.3% inférieure à la médiane
(±) | la linéarité des basses est moyenne (14.2% delta à la fréquence précédente)
Médiums 400 - 2000 Hz
(+) | médiane équilibrée - seulement 2.4% de la médiane
(+) | les médiums sont linéaires (5.5% delta à la fréquence précédente)
Aiguës 2 - 16 kHz
(+) | des sommets équilibrés - à seulement 2% de la médiane
(+) | les aigus sont linéaires (4.5% delta à la fréquence précédente)
Globalement 100 - 16 000 Hz
(+) | le son global est linéaire (10.2% différence à la médiane)
Par rapport à la même classe
» 7% de tous les appareils testés de cette catégorie étaient meilleurs, 2% similaires, 90% pires
» Le meilleur avait un delta de 5%, la moyenne était de 18%, le pire était de 53%.
Par rapport à tous les appareils testés
» 5% de tous les appareils testés étaient meilleurs, 1% similaires, 94% pires
» Le meilleur avait un delta de 4%, la moyenne était de 23%, le pire était de 134%.
| Éteint/en veille | |
| Au repos | |
| Fortement sollicité |
|
Légende:
min: | |
| Microsoft Surface Laptop 3 15 i7-1065G7 i7-1065G7, Iris Plus Graphics G7 (Ice Lake 64 EU), Toshiba KBG40ZNS256G NVMe, IPS, 2496x1664, 15" | Dell XPS 15 7590 i5 iGPU FHD i5-9300H, UHD Graphics 630, Toshiba XG6 KXG60ZNV512G, IPS, 1920x1080, 15.6" | Asus ZenBook 15 UX534FT-DB77 i7-8565U, GeForce GTX 1650 Max-Q, Samsung SSD PM981 MZVLB1T0HALR, IPS, 1920x1080, 15.6" | MSI Prestige 15 A10SC i7-10710U, GeForce GTX 1650 Max-Q, Samsung SSD PM981 MZVLB1T0HALR, IPS, 3840x2160, 15.6" | Razer Blade Stealth i7-8565U i7-8565U, GeForce MX150, Lite-On CA3-8D256-Q11, IPS, 1920x1080, 13.3" | Microsoft Surface Laptop 3 15 Ryzen 5 3580U R5 3580U, Vega 9, SK hynix BC501 HFM256GDGTNG, IPS, 2496x1664, 15" | |
|---|---|---|---|---|---|---|
| Power Consumption | -17% | -74% | -68% | -28% | 10% | |
| Idle Minimum * (Watt) | 4.4 | 3.79 14% | 5 -14% | 6.1 -39% | 6.7 -52% | 3.3 25% |
| Idle Average * (Watt) | 8.3 | 6.9 17% | 13.2 -59% | 13.2 -59% | 8.6 -4% | 7.1 14% |
| Idle Maximum * (Watt) | 8.6 | 9.2 -7% | 24 -179% | 19.2 -123% | 9.4 -9% | 7.2 16% |
| Load Average * (Watt) | 43.6 | 62 -42% | 70 -61% | 75 -72% | 64.1 -47% | 44.8 -3% |
| Witcher 3 ultra * (Watt) | 41.5 | 63.3 -53% | 74 -78% | 63.7 -53% | 45.1 -9% | |
| Load Maximum * (Watt) | 64.4 | 108 -68% | 114 -77% | 89.7 -39% | 64.1 -0% | 53 18% |
* ... Moindre est la valeur, meilleures sont les performances
| Microsoft Surface Laptop 3 15 i7-1065G7 i7-1065G7, Iris Plus Graphics G7 (Ice Lake 64 EU), 45 Wh | Apple MacBook Pro 16 2019 i9 5500M i9-9880H, Radeon Pro 5500M, 99.8 Wh | Dell XPS 15 7590 i5 iGPU FHD i5-9300H, UHD Graphics 630, 97 Wh | Lenovo Yoga C940-15IRH i7-9750H, GeForce GTX 1650 Max-Q, 69 Wh | HP Spectre x360 15-df0126ng i7-8750H, GeForce GTX 1050 Ti Max-Q, 84 Wh | Asus ZenBook 15 UX534FT-DB77 i7-8565U, GeForce GTX 1650 Max-Q, 71 Wh | MSI Prestige 15 A10SC i7-10710U, GeForce GTX 1650 Max-Q, 82 Wh | Microsoft Surface Laptop 3 15 Ryzen 5 3580U R5 3580U, Vega 9, 45 Wh | |
|---|---|---|---|---|---|---|---|---|
| Autonomie de la batterie | -1% | 31% | -26% | -6% | 5% | -14% | -16% | |
| Reader / Idle (h) | 35 | 18.2 -48% | 18.8 -46% | 21.5 -39% | 19.1 -45% | 18.7 -47% | ||
| WiFi v1.3 (h) | 8.2 | 12 46% | 14.1 72% | 9.7 18% | 8.8 7% | 8.4 2% | 7.6 -7% | 9.1 11% |
| Load (h) | 1.9 | 1 -47% | 1.7 -11% | 1 -47% | 2.3 21% | 2.9 53% | 2.1 11% | 1.7 -11% |
| Witcher 3 ultra (h) | 0.9 |
Points positifs
Points négatifs
Le principal avantage de la version Core i7 sur la version Ryzen 5 est la compatibilité Wifi 6 intégrée, les performances en hausse du stockage et du processeur, l’accélération IA intégrée, les meilleures performances de jeu, et les performances par watt supérieures. Les autres éléments comme l’écran, l’autonomie Wifi, les températures externes et le niveau sonore sont à peu près les mêmes, voire sont identiques.
Alors que c’est peu surprenant que notre version Core i7 soit capable de surpasser notre version Ryzen 5 moins chère, c’est la différence entre les deux machines qui nous intéresse plus. Les performances brutes, par exemple, ne sont pas si différentes que cela, si bien qu’il ne faudra pas choisir la version Intel en se basant uniquement sur la puissance du processeur. Les performances de jeu sont également peu probantes, certains jeux étant meilleurs sur Intel, mais d’autres étant au coude à coude entre les deux versions. Et l’accélération IA continue à être une nouveauté pour la plupart des utilisateurs professionnels, qui n’a pas de réelle influence sur les tâches au quotidien - Intel peut faire la différence avec AMD dans le domaine de l’intelligence artificielle, mais cela ne signifie pas grand-chose pour l’utilisateur tant que les logiciels ne sont pas optimisés pour exploiter l’accélération IA…
En bref, les différences au quotidien entre le Surface Laptop 3 Core i7 et le Ryzen 5 sont plus réduites qu’attendu, surtout vu le prix demandé par Microsoft pour les versions Intel. Ceux qui recherchent le meilleur de ce que les Surface Laptop peuvent proposer choisiront la version Intel. Autrement, il sera difficile de faire la différence en cas d’un usage fait de traitement de texte, de navigation web ou de streaming vidéo.
L’intégralité de cette critique est disponible en anglais en suivant ce lien.
Microsoft Surface Laptop 3 15 i7-1065G7
- 02/23/2020 v7 (old)
Allen Ngo
Price comparison
