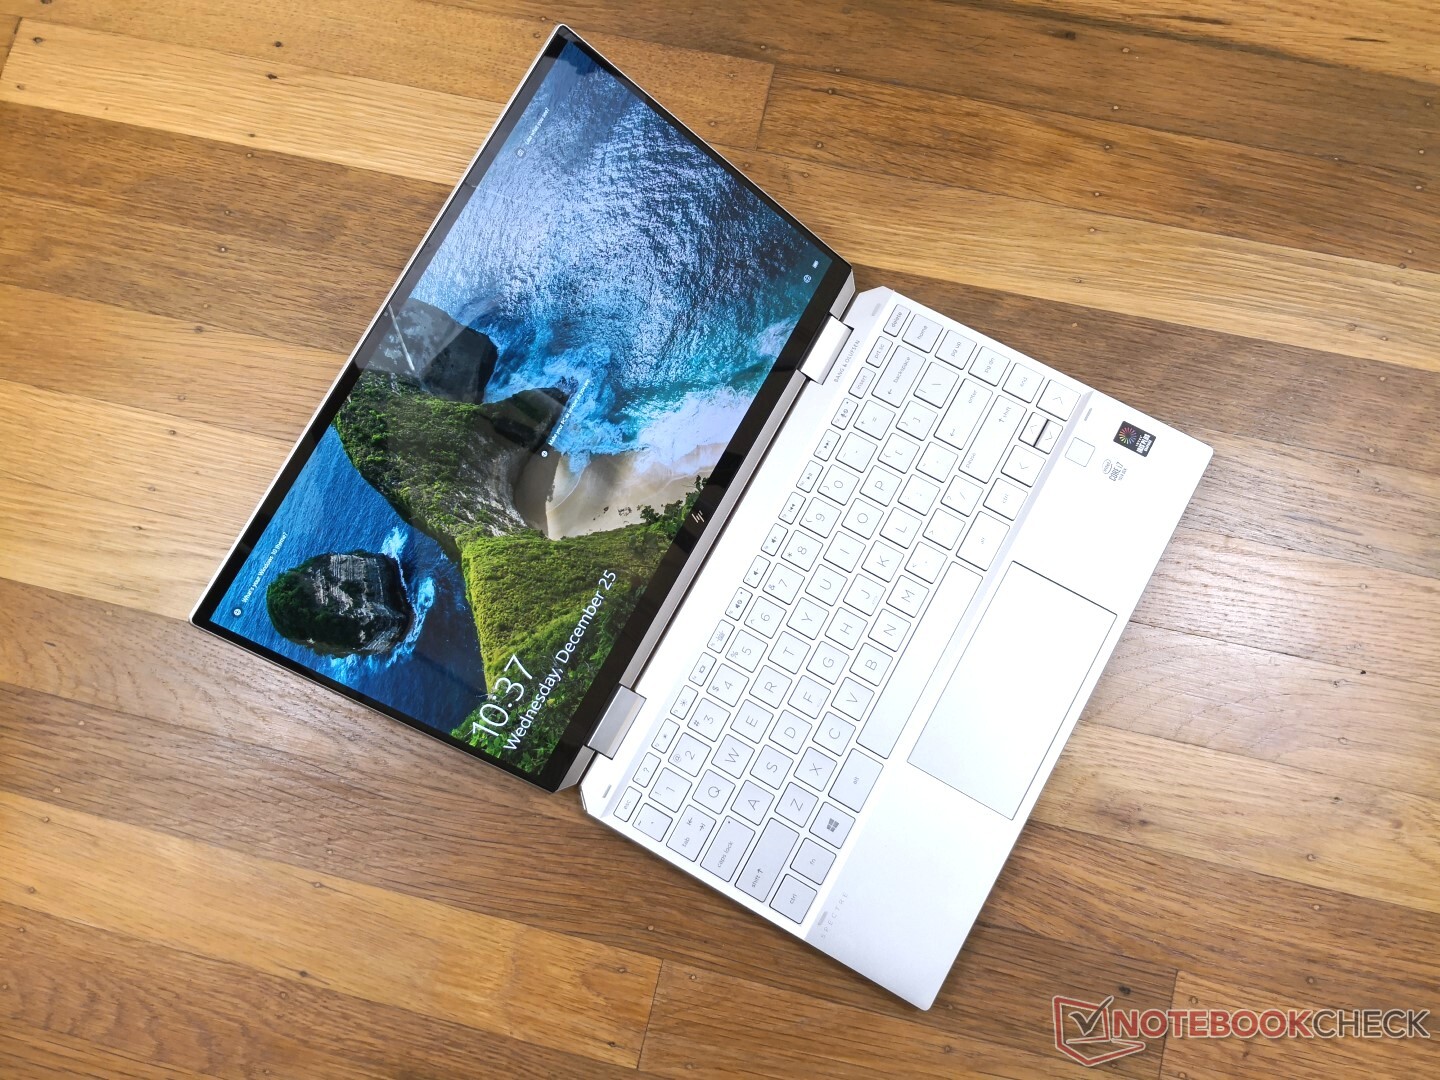
Test du HP Spectre x360 13-aw0013dx (i7-1065G7, Iris Plus G7, FHD) : convertible Intel Ice Lake
Note | Date | Modèle | Poids | Épaisseur | Taille | Résolution | Prix |
|---|---|---|---|---|---|---|---|
| 88.4 % v7 (old) | 01/20 | HP Spectre x360 13-aw0013dx i7-1065G7, Iris Plus Graphics G7 (Ice Lake 64 EU) | 1.2 kg | 16.9 mm | 13.30" | 1920x1080 | |
| 86.3 % v7 (old) | 10/19 | Dell XPS 13 7390 2-in-1 Core i7 i7-1065G7, Iris Plus Graphics G7 (Ice Lake 64 EU) | 1.3 kg | 13 mm | 13.40" | 1920x1200 | |
| 81.2 % v7 (old) | 09/19 | Asus ZenBook Flip 14 UM462DA-AI023T R7 3700U, Vega 10 | 1.6 kg | 18.9 mm | 14.00" | 1920x1080 | |
| 86.3 % v7 (old) | 10/19 | Razer Blade Stealth i7-1065G7 Iris Plus i7-1065G7, Iris Plus Graphics G7 (Ice Lake 64 EU) | 1.4 kg | 15.3 mm | 13.30" | 1920x1080 | |
| 87 % v7 (old) | 12/19 | Lenovo Yoga C940-14IIL 81Q9 i7-1065G7, Iris Plus Graphics G7 (Ice Lake 64 EU) | 1.4 kg | 15.7 mm | 14.00" | 3840x2160 |
| SD Card Reader | |
| average JPG Copy Test (av. of 3 runs) | |
| HP Spectre x360 13-ap0312ng (Toshiba Exceria Pro M501 64 GB UHS-II) | |
| HP Spectre x360 13-aw0013dx (Toshiba Exceria Pro M501 microSDXC 64GB) | |
| Dell XPS 13 7390 2-in-1 Core i7 (Toshiba Exceria Pro M501 64 GB UHS-II) | |
| Asus ZenBook Flip 14 UM462DA-AI023T (Toshiba Exceria Pro M501 microSDXC 64GB) | |
| maximum AS SSD Seq Read Test (1GB) | |
| HP Spectre x360 13-ap0312ng (Toshiba Exceria Pro M501 64 GB UHS-II) | |
| Dell XPS 13 7390 2-in-1 Core i7 (Toshiba Exceria Pro M501 64 GB UHS-II) | |
| HP Spectre x360 13-aw0013dx (Toshiba Exceria Pro M501 microSDXC 64GB) | |
| Asus ZenBook Flip 14 UM462DA-AI023T (Toshiba Exceria Pro M501 microSDXC 64GB) | |
| Networking | |
| iperf3 transmit AX12 | |
| MSI Prestige 15 A10SC | |
| HP Spectre x360 13-ap0312ng | |
| Asus ZenBook Flip 14 UM462DA-AI023T | |
| iperf3 receive AX12 | |
| MSI Prestige 15 A10SC | |
| HP Spectre x360 13-ap0312ng | |
| Asus ZenBook Flip 14 UM462DA-AI023T | |
| |||||||||||||||||||||||||
Homogénéité de la luminosité: 85 %
Valeur mesurée au centre, sur batterie: 447.4 cd/m²
Contraste: 1443:1 (Valeurs des noirs: 0.31 cd/m²)
ΔE ColorChecker Calman: 4.23 | ∀{0.5-29.43 Ø4.72}
calibrated: 1.32
ΔE Greyscale Calman: 6.1 | ∀{0.09-98 Ø4.97}
98.9% sRGB (Argyll 1.6.3 3D)
64.8% AdobeRGB 1998 (Argyll 1.6.3 3D)
71.5% AdobeRGB 1998 (Argyll 3D)
98.9% sRGB (Argyll 3D)
69.6% Display P3 (Argyll 3D)
Gamma: 2.11
CCT: 6136 K
| HP Spectre x360 13-aw0013dx AU Optronics AUO5E2D, IPS, 13.3", 1920x1080 | HP Spectre x360 13-ap0312ng M133NVF3, IPS, 13.3", 1920x1080 | Dell XPS 13 7390 2-in-1 Core i7 Sharp LQ134N1, IPS, 13.4", 1920x1200 | Razer Blade Stealth i7-1065G7 Iris Plus Sharp LQ133M1JW41, IPS, 13.3", 1920x1080 | Lenovo Yoga C940-14IIL 81Q9 BOE HF NV140QUM-N54, IPS, 14", 3840x2160 | Asus ZenBook Flip 14 UM462DA-AI023T IPS, 14", 1920x1080 | |
|---|---|---|---|---|---|---|
| Display | -9% | 0% | -4% | 13% | -11% | |
| Display P3 Coverage (%) | 69.6 | 63 -9% | 69.9 0% | 66.2 -5% | 83.8 20% | 65.5 -6% |
| sRGB Coverage (%) | 98.9 | 89.8 -9% | 99.2 0% | 97.2 -2% | 99.9 1% | 85.2 -14% |
| AdobeRGB 1998 Coverage (%) | 71.5 | 64.1 -10% | 71.5 0% | 67.1 -6% | 83.3 17% | 62.2 -13% |
| Response Times | 49% | 22% | 18% | 27% | 20% | |
| Response Time Grey 50% / Grey 80% * (ms) | 60.8 ? | 29.2 ? 52% | 47.6 ? 22% | 45.2 ? 26% | 44.4 ? 27% | 42 ? 31% |
| Response Time Black / White * (ms) | 36.8 ? | 20 ? 46% | 29.2 ? 21% | 33.2 ? 10% | 27.2 ? 26% | 34 ? 8% |
| PWM Frequency (Hz) | 1000 ? | 2500 ? | 22730 ? | |||
| Screen | -20% | 17% | 19% | -8% | -29% | |
| Brightness middle (cd/m²) | 447.4 | 272 -39% | 549.8 23% | 422.6 -6% | 501.7 12% | 306 -32% |
| Brightness (cd/m²) | 420 | 298 -29% | 520 24% | 404 -4% | 501 19% | 294 -30% |
| Brightness Distribution (%) | 85 | 84 -1% | 86 1% | 87 2% | 82 -4% | 81 -5% |
| Black Level * (cd/m²) | 0.31 | 0.39 -26% | 0.39 -26% | 0.35 -13% | 0.32 -3% | 0.39 -26% |
| Contrast (:1) | 1443 | 697 -52% | 1410 -2% | 1207 -16% | 1568 9% | 785 -46% |
| Colorchecker dE 2000 * | 4.23 | 4.3 -2% | 2.12 50% | 1.02 76% | 5.48 -30% | 5.16 -22% |
| Colorchecker dE 2000 max. * | 9.34 | 9 4% | 3.66 61% | 3.06 67% | 10.03 -7% | 9.9 -6% |
| Colorchecker dE 2000 calibrated * | 1.32 | 2.4 -82% | 1.37 -4% | 0.95 28% | 2.22 -68% | 3.07 -133% |
| Greyscale dE 2000 * | 6.1 | 4.4 28% | 2.6 57% | 1 84% | 8.1 -33% | 5.86 4% |
| Gamma | 2.11 104% | 1.97 112% | 2.3 96% | 2.21 100% | 2.07 106% | 2.31 95% |
| CCT | 6136 106% | 5825 112% | 6884 94% | 6502 100% | 6730 97% | 6349 102% |
| Color Space (Percent of AdobeRGB 1998) (%) | 64.8 | 58.9 -9% | 65.4 1% | 62.1 -4% | 74.1 14% | 56 -14% |
| Color Space (Percent of sRGB) (%) | 98.9 | 89.8 -9% | 99.7 1% | 97.1 -2% | 100 1% | 85 -14% |
| Moyenne finale (programmes/paramètres) | 7% /
-9% | 13% /
14% | 11% /
15% | 11% /
0% | -7% /
-20% |
* ... Moindre est la valeur, meilleures sont les performances
Temps de réponse de l'écran
| ↔ Temps de réponse noir à blanc | ||
|---|---|---|
| 36.8 ms ... hausse ↗ et chute ↘ combinées | ↗ 15.6 ms hausse | 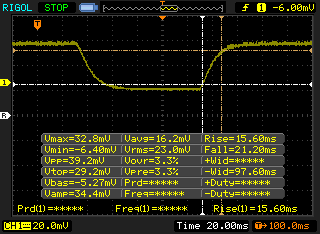 |
| ↘ 21.2 ms chute | ||
| L'écran souffre de latences très élevées, à éviter pour le jeu. En comparaison, tous les appareils testés affichent entre 0.1 (minimum) et 240 (maximum) ms. » 95 % des appareils testés affichent de meilleures performances. Cela signifie que les latences relevées sont moins bonnes que la moyenne (19.8 ms) de tous les appareils testés. | ||
| ↔ Temps de réponse gris 50% à gris 80% | ||
| 60.8 ms ... hausse ↗ et chute ↘ combinées | ↗ 26 ms hausse | 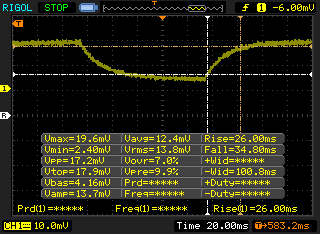 |
| ↘ 34.8 ms chute | ||
| L'écran souffre de latences très élevées, à éviter pour le jeu. En comparaison, tous les appareils testés affichent entre 0.165 (minimum) et 636 (maximum) ms. » 96 % des appareils testés affichent de meilleures performances. Cela signifie que les latences relevées sont moins bonnes que la moyenne (31 ms) de tous les appareils testés. | ||
Scintillement / MLI (Modulation de largeur d'impulsion)
| Scintillement / MLI (Modulation de largeur d'impulsion) non décelé | 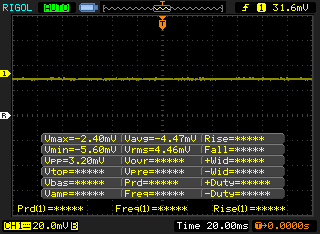 | ||
En comparaison, 52 % des appareils testés n'emploient pas MDI pour assombrir leur écran. Nous avons relevé une moyenne à 7769 (minimum : 5 - maximum : 343500) Hz dans le cas où une MDI était active. | |||
| PCMark 8 Home Score Accelerated v2 | 3911 points | |
| PCMark 8 Work Score Accelerated v2 | 5227 points | |
| PCMark 10 Score | 4522 points | |
Aide | ||
| HP Spectre x360 13-aw0013dx Intel Optane Memory H10 with Solid State Storage 32GB + 512GB HBRPEKNX0202A(L/H) | HP Spectre x360 13-ap0312ng Toshiba XG5 KXG50ZNV512G | Dell XPS 13 7390 2-in-1 Core i7 Toshiba BG4 KBG40ZPZ512G | Asus ZenBook Flip 14 UM462DA-AI023T | Razer Blade Stealth i7-1065G7 Iris Plus Samsung SSD PM981 MZVLB256HAHQ | Lenovo Yoga C940-14IIL 81Q9 Samsung PM981a MZVLB1T0HBLR | |
|---|---|---|---|---|---|---|
| AS SSD | 27% | 28% | -25% | 21% | 115% | |
| Seq Read (MB/s) | 1039 | 2197 111% | 1801 73% | 424.5 -59% | 1989 91% | 2213 113% |
| Seq Write (MB/s) | 310.1 | 493 59% | 1125 263% | 374.5 21% | 827 167% | 1401 352% |
| 4K Read (MB/s) | 76 | 31.4 -59% | 39.7 -48% | 19.38 -74% | 40.12 -47% | 55.2 -27% |
| 4K Write (MB/s) | 118 | 123.9 5% | 67 -43% | 34.69 -71% | 135.1 14% | 130.3 10% |
| 4K-64 Read (MB/s) | 371.8 | 674 81% | 1253 237% | 430.2 16% | 531 43% | 878 136% |
| 4K-64 Write (MB/s) | 469.5 | 479.3 2% | 209 -55% | 377.2 -20% | 309.9 -34% | 1478 215% |
| Access Time Read * (ms) | 0.067 | 0.117 -75% | 0.069 -3% | 0.13 -94% | 0.085 -27% | 0.036 46% |
| Access Time Write * (ms) | 0.138 | 0.049 64% | 0.625 -353% | 0.084 39% | 0.09 35% | 0.086 38% |
| Score Read (Points) | 552 | 925 68% | 1472 167% | 492 -11% | 770 39% | 1154 109% |
| Score Write (Points) | 618 | 653 6% | 388 -37% | 449 -27% | 528 -15% | 1748 183% |
| Score Total (Points) | 1448 | 1971 36% | 2583 78% | 1194 -18% | 1644 14% | 3467 139% |
| Copy ISO MB/s (MB/s) | 764 | 1293 69% | 1024 34% | 1418 86% | 2161 183% | |
| Copy Program MB/s (MB/s) | 465.8 | 560 20% | 203.6 -56% | 382.7 -18% | 572 23% | |
| Copy Game MB/s (MB/s) | 764 | 927 21% | 552 -28% | 334.2 -56% | 1433 88% | |
| CrystalDiskMark 5.2 / 6 | -1% | 24% | -12% | 43% | 75% | |
| Write 4K (MB/s) | 112.6 | 105.1 -7% | 106.7 -5% | 142.1 26% | 176.8 57% | 128.6 14% |
| Read 4K (MB/s) | 131 | 42.3 -68% | 49.94 -62% | 44.75 -66% | 48.38 -63% | 45.25 -65% |
| Write Seq (MB/s) | 458.9 | 677 48% | 1223 167% | 1332 190% | 1949 325% | |
| Read Seq (MB/s) | 1355 | 2092 54% | 1801 33% | 1644 21% | 2359 74% | |
| Write 4K Q32T1 (MB/s) | 341.3 | 378.8 11% | 325.3 -5% | 252.4 -26% | 440.6 29% | 445 30% |
| Read 4K Q32T1 (MB/s) | 320.6 | 271.3 -15% | 551 72% | 340.9 6% | 559 74% | 404.5 26% |
| Write Seq Q32T1 (MB/s) | 1219 | 527 -57% | 1224 0% | 1457 20% | 1104 -9% | 3019 148% |
| Read Seq Q32T1 (MB/s) | 2462 | 3175 29% | 2350 -5% | 1723 -30% | 3481 41% | 3564 45% |
| Write 4K Q8T8 (MB/s) | 1164 | |||||
| Read 4K Q8T8 (MB/s) | 1103 | |||||
| Moyenne finale (programmes/paramètres) | 13% /
15% | 26% /
27% | -19% /
-21% | 32% /
29% | 95% /
100% |
* ... Moindre est la valeur, meilleures sont les performances

| 3DMark 11 Performance | 4777 points | |
| 3DMark Ice Storm Standard Score | 70068 points | |
| 3DMark Cloud Gate Standard Score | 13766 points | |
| 3DMark Fire Strike Score | 2673 points | |
| 3DMark Time Spy Score | 771 points | |
Aide | ||
| Shadow of the Tomb Raider - 1280x720 Lowest Preset | |
| Asus GL753VD | |
| MSI PE60 2QD | |
| Acer Aspire 5 A515-52G-723L | |
| Acer Aspire 5 A515-52G-53PU | |
| Dell Inspiron 15 5000 5585 | |
| Moyenne Intel Iris Plus Graphics G7 (Ice Lake 64 EU) (15.6 - 33, n=13) | |
| Acer Nitro 5 | |
| HP Spectre x360 13-aw0013dx | |
| Dell XPS 13 7390 Core i7-10710U | |
| Dell Inspiron 14 5000 5482 2-in-1 | |
| Bas | Moyen | Élevé | Ultra | |
|---|---|---|---|---|
| BioShock Infinite (2013) | 89.4 | 47.9 | 47.3 | 17.3 |
| The Witcher 3 (2015) | 43.9 | 28.9 | 13.8 | 7.2 |
| Rocket League (2017) | 87.9 | 44 | 29.7 | |
| Shadow of the Tomb Raider (2018) | 21 |
| HP Spectre x360 13-aw0013dx Iris Plus Graphics G7 (Ice Lake 64 EU), i7-1065G7, Intel Optane Memory H10 with Solid State Storage 32GB + 512GB HBRPEKNX0202A(L/H) | HP Spectre x360 13-ap0312ng UHD Graphics 620, i7-8565U, Toshiba XG5 KXG50ZNV512G | Dell XPS 13 7390 2-in-1 Core i7 Iris Plus Graphics G7 (Ice Lake 64 EU), i7-1065G7, Toshiba BG4 KBG40ZPZ512G | Asus ZenBook Flip 14 UM462DA-AI023T Vega 10, R7 3700U | Razer Blade Stealth i7-1065G7 Iris Plus Iris Plus Graphics G7 (Ice Lake 64 EU), i7-1065G7, Samsung SSD PM981 MZVLB256HAHQ | Lenovo Yoga C940-14IIL 81Q9 Iris Plus Graphics G7 (Ice Lake 64 EU), i7-1065G7, Samsung PM981a MZVLB1T0HBLR | |
|---|---|---|---|---|---|---|
| Noise | -2% | -8% | -8% | -7% | -6% | |
| arrêt / environnement * (dB) | 28.5 | 29.2 -2% | 28.1 1% | 30 -5% | 28.3 1% | 28.5 -0% |
| Idle Minimum * (dB) | 28.5 | 29.2 -2% | 28.1 1% | 30 -5% | 28.3 1% | 28.5 -0% |
| Idle Average * (dB) | 28.5 | 29.2 -2% | 28.1 1% | 30 -5% | 28.3 1% | 28.5 -0% |
| Idle Maximum * (dB) | 28.5 | 30.4 -7% | 28.1 1% | 30 -5% | 28.3 1% | 29 -2% |
| Load Average * (dB) | 28.5 | 31 -9% | 31.7 -11% | 34.2 -20% | 33.5 -18% | 33 -16% |
| Witcher 3 ultra * (dB) | 35.3 | 43.4 -23% | 34.5 2% | 40.7 -15% | ||
| Load Maximum * (dB) | 35.3 | 32.1 9% | 43.4 -23% | 37.5 -6% | 49.4 -40% | 39.5 -12% |
* ... Moindre est la valeur, meilleures sont les performances
Degré de la nuisance sonore
| Au repos |
| 28.5 / 28.5 / 28.5 dB(A) |
| Disque dur |
| 28.5 dB(A) |
| Fortement sollicité |
| 28.5 / 35.3 dB(A) |
 | ||
30 dB silencieux 40 dB(A) audible 50 dB(A) bruyant |
||
min: | ||
(+) La température maximale du côté supérieur est de 37.2 °C / 99 F, par rapport à la moyenne de 35.4 °C / 96 F, allant de 19.6 à 60 °C pour la classe Convertible.
(±) Le fond chauffe jusqu'à un maximum de 42.2 °C / 108 F, contre une moyenne de 36.9 °C / 98 F
(+) En utilisation inactive, la température moyenne du côté supérieur est de 23.5 °C / 74 F, par rapport à la moyenne du dispositif de 30.3 °C / 87 F.
(+) Les repose-poignets et le pavé tactile sont plus froids que la température de la peau avec un maximum de 24.6 °C / 76.3 F et sont donc froids au toucher.
(+) La température moyenne de la zone de l'appui-paume de dispositifs similaires était de 28 °C / 82.4 F (+3.4 °C / #6.1 F).
HP Spectre x360 13-aw0013dx analyse audio
(±) | le niveau sonore du haut-parleur est moyen mais bon (81.6# dB)
Basses 100 - 315 Hz
(±) | basse réduite - en moyenne 13.2% inférieure à la médiane
(±) | la linéarité des basses est moyenne (12.8% delta à la fréquence précédente)
Médiums 400 - 2000 Hz
(+) | médiane équilibrée - seulement 2.3% de la médiane
(+) | les médiums sont linéaires (3.6% delta à la fréquence précédente)
Aiguës 2 - 16 kHz
(+) | des sommets équilibrés - à seulement 2.7% de la médiane
(+) | les aigus sont linéaires (6.9% delta à la fréquence précédente)
Globalement 100 - 16 000 Hz
(±) | la linéarité du son global est moyenne (16.7% de différence avec la médiane)
Par rapport à la même classe
» 31% de tous les appareils testés de cette catégorie étaient meilleurs, 5% similaires, 64% pires
» Le meilleur avait un delta de 6%, la moyenne était de 20%, le pire était de 57%.
Par rapport à tous les appareils testés
» 29% de tous les appareils testés étaient meilleurs, 7% similaires, 64% pires
» Le meilleur avait un delta de 4%, la moyenne était de 24%, le pire était de 134%.
Apple MacBook 12 (Early 2016) 1.1 GHz analyse audio
(+) | les haut-parleurs peuvent jouer relativement fort (83.6# dB)
Basses 100 - 315 Hz
(±) | basse réduite - en moyenne 11.3% inférieure à la médiane
(±) | la linéarité des basses est moyenne (14.2% delta à la fréquence précédente)
Médiums 400 - 2000 Hz
(+) | médiane équilibrée - seulement 2.4% de la médiane
(+) | les médiums sont linéaires (5.5% delta à la fréquence précédente)
Aiguës 2 - 16 kHz
(+) | des sommets équilibrés - à seulement 2% de la médiane
(+) | les aigus sont linéaires (4.5% delta à la fréquence précédente)
Globalement 100 - 16 000 Hz
(+) | le son global est linéaire (10.2% différence à la médiane)
Par rapport à la même classe
» 7% de tous les appareils testés de cette catégorie étaient meilleurs, 2% similaires, 91% pires
» Le meilleur avait un delta de 5%, la moyenne était de 18%, le pire était de 53%.
Par rapport à tous les appareils testés
» 5% de tous les appareils testés étaient meilleurs, 1% similaires, 94% pires
» Le meilleur avait un delta de 4%, la moyenne était de 24%, le pire était de 134%.
| Éteint/en veille | |
| Au repos | |
| Fortement sollicité |
|
Légende:
min: | |
| HP Spectre x360 13-aw0013dx i7-1065G7, Iris Plus Graphics G7 (Ice Lake 64 EU), Intel Optane Memory H10 with Solid State Storage 32GB + 512GB HBRPEKNX0202A(L/H), IPS, 1920x1080, 13.3" | HP Spectre x360 13-ap0312ng i7-8565U, UHD Graphics 620, Toshiba XG5 KXG50ZNV512G, IPS, 1920x1080, 13.3" | Dell XPS 13 7390 2-in-1 Core i7 i7-1065G7, Iris Plus Graphics G7 (Ice Lake 64 EU), Toshiba BG4 KBG40ZPZ512G, IPS, 1920x1200, 13.4" | Asus ZenBook Flip 14 UM462DA-AI023T R7 3700U, Vega 10, , IPS, 1920x1080, 14" | Razer Blade Stealth i7-1065G7 Iris Plus i7-1065G7, Iris Plus Graphics G7 (Ice Lake 64 EU), Samsung SSD PM981 MZVLB256HAHQ, IPS, 1920x1080, 13.3" | Lenovo Yoga C940-14IIL 81Q9 i7-1065G7, Iris Plus Graphics G7 (Ice Lake 64 EU), Samsung PM981a MZVLB1T0HBLR, IPS, 3840x2160, 14" | |
|---|---|---|---|---|---|---|
| Power Consumption | -7% | -6% | -4% | -38% | -57% | |
| Idle Minimum * (Watt) | 3.9 | 4.32 -11% | 2.6 33% | 3.7 5% | 5.9 -51% | 5.6 -44% |
| Idle Average * (Watt) | 6.3 | 6.84 -9% | 5.3 16% | 6.9 -10% | 8.1 -29% | 10.5 -67% |
| Idle Maximum * (Watt) | 6.8 | 8.64 -27% | 7 -3% | 9.4 -38% | 11.2 -65% | 12 -76% |
| Load Average * (Watt) | 32.6 | 31.8 2% | 43.1 -32% | 34 -4% | 44.3 -36% | 53.3 -63% |
| Witcher 3 ultra * (Watt) | 25.6 | 43.1 -68% | 41.9 -64% | 46.9 -83% | ||
| Load Maximum * (Watt) | 59 | 53 10% | 49 17% | 44 25% | 50.2 15% | 64.6 -9% |
* ... Moindre est la valeur, meilleures sont les performances
| HP Spectre x360 13-aw0013dx i7-1065G7, Iris Plus Graphics G7 (Ice Lake 64 EU), 60 Wh | HP Spectre x360 13-ap0312ng i7-8565U, UHD Graphics 620, 61 Wh | Dell XPS 13 7390 2-in-1 Core i7 i7-1065G7, Iris Plus Graphics G7 (Ice Lake 64 EU), 51 Wh | Asus ZenBook Flip 14 UM462DA-AI023T R7 3700U, Vega 10, 42 Wh | Razer Blade Stealth i7-1065G7 Iris Plus i7-1065G7, Iris Plus Graphics G7 (Ice Lake 64 EU), 53.1 Wh | Lenovo Yoga C940-14IIL 81Q9 i7-1065G7, Iris Plus Graphics G7 (Ice Lake 64 EU), 60 Wh | |
|---|---|---|---|---|---|---|
| Autonomie de la batterie | -13% | -9% | -24% | -2% | -26% | |
| Reader / Idle (h) | 37.1 | |||||
| WiFi v1.3 (h) | 9.9 | 8.9 -10% | 9 -9% | 7.5 -24% | 9.7 -2% | 7.3 -26% |
| Load (h) | 2.7 | 2.3 -15% |
Points positifs
Points négatifs
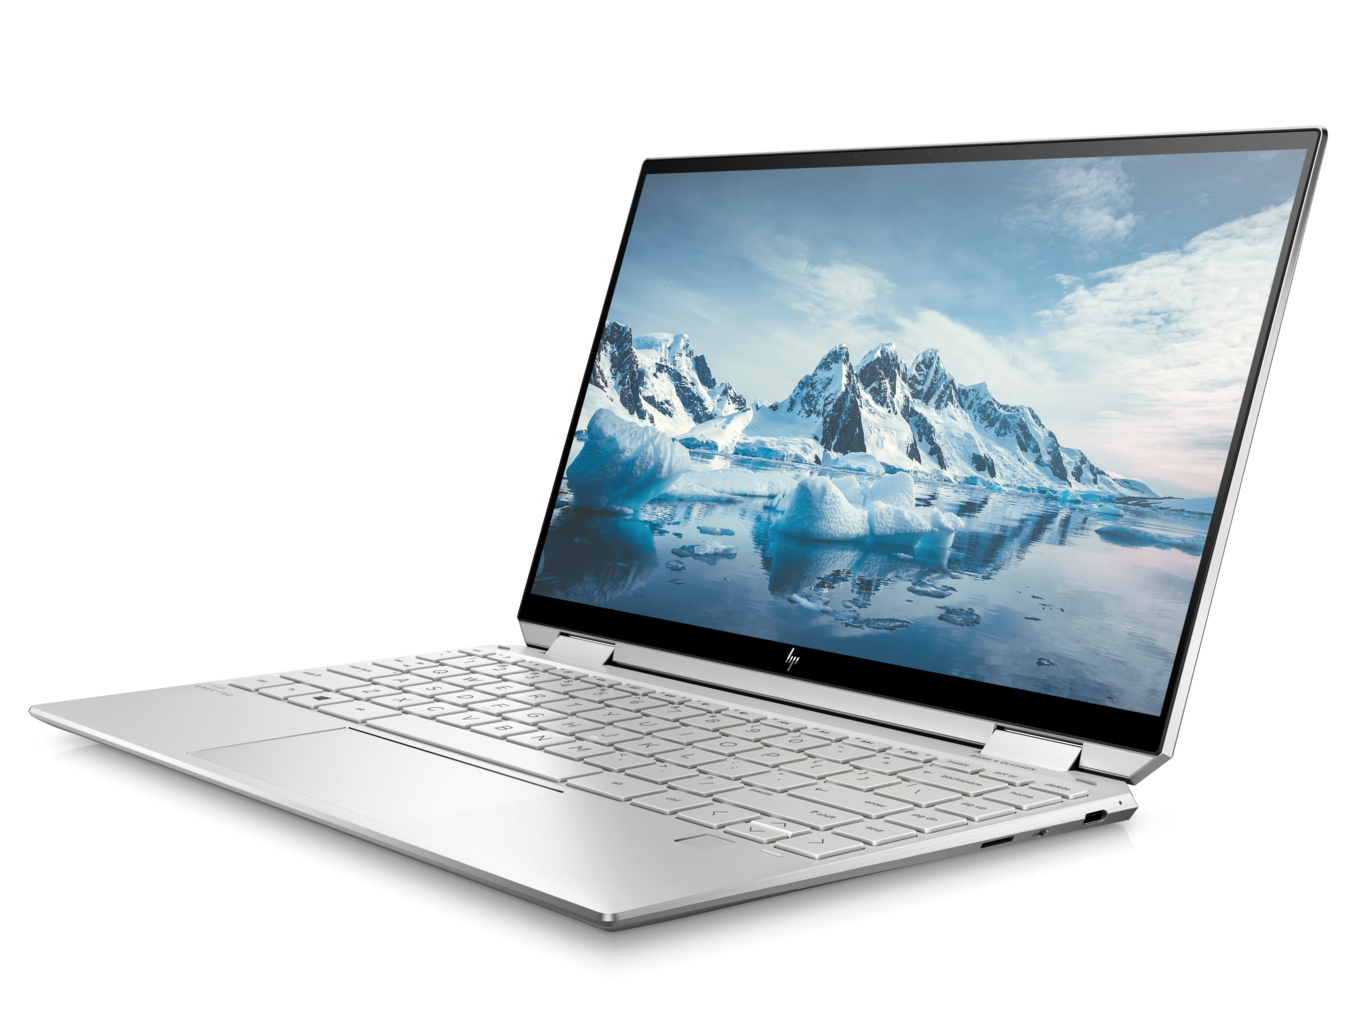
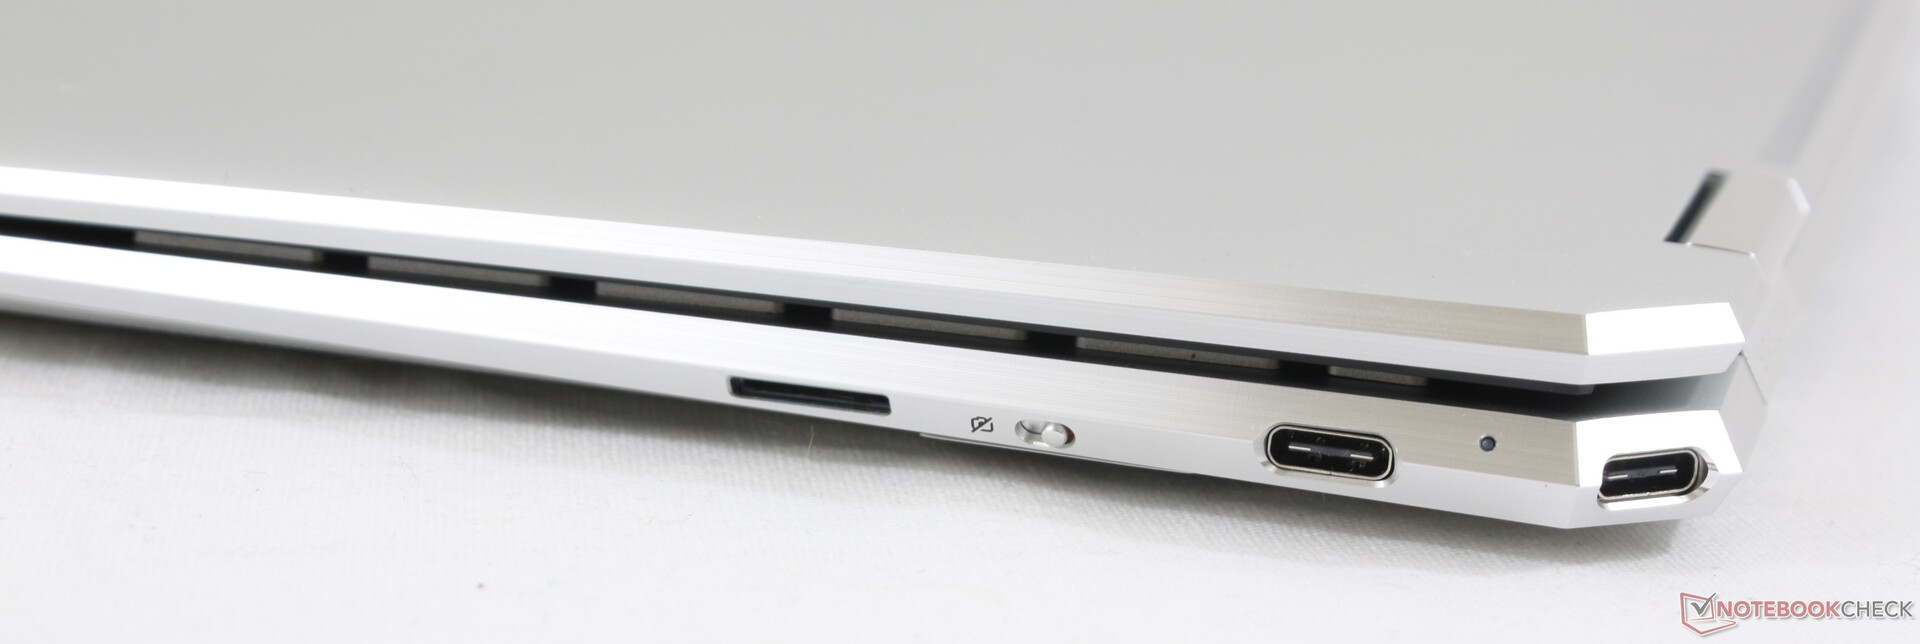
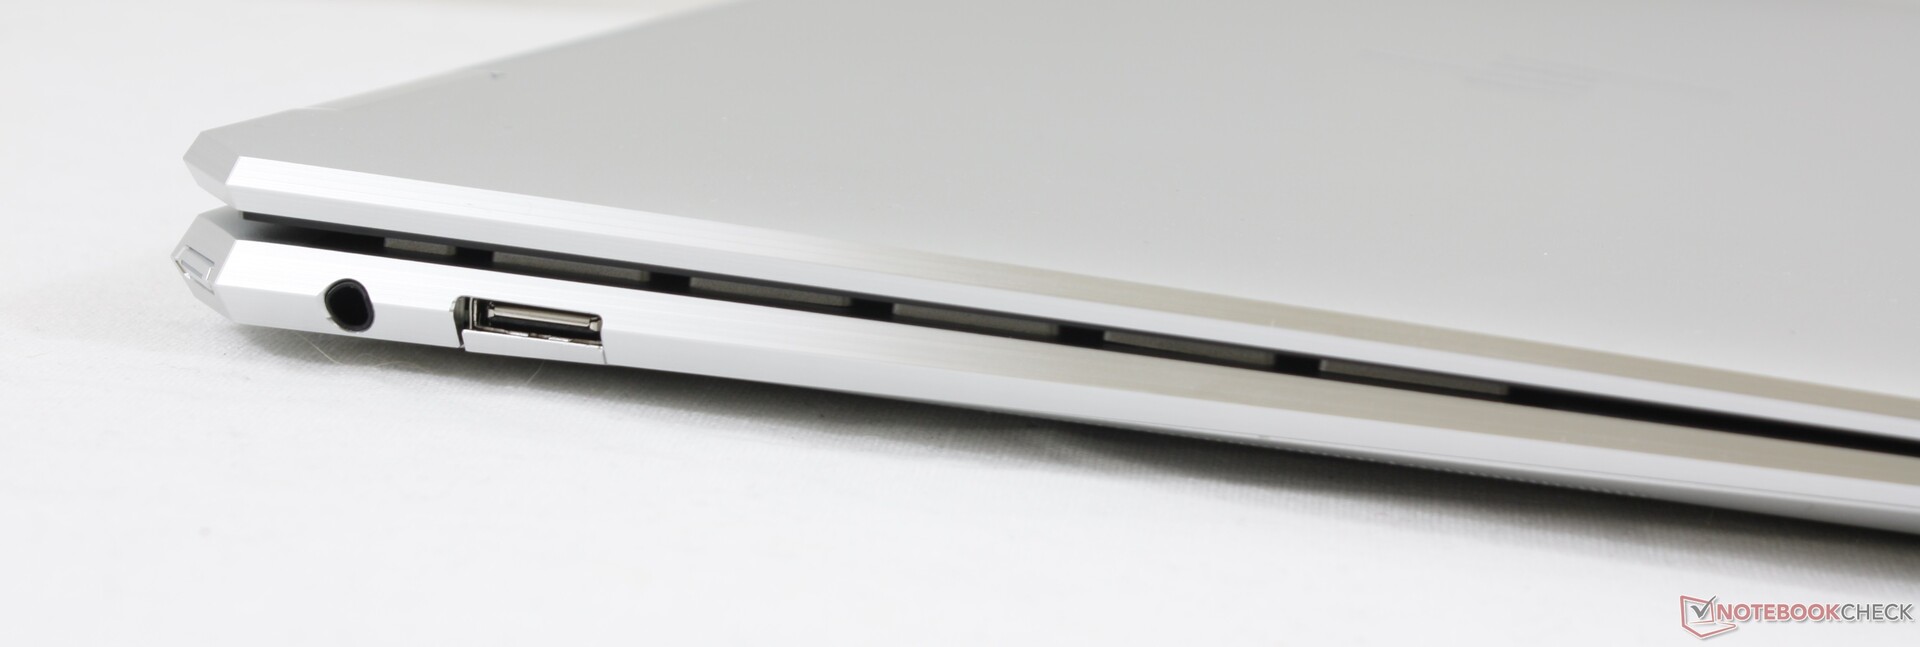
Si vous recherchez un convertible de 13 pouces haut de gamme avec les processeurs Intel de 10e génération dernier cri, vous avez le choix entre deux produits : le HP Spectre x360 13 ou le Dell XPS 13 7390 2-en-1. Le HP paraît plus complet avec un stockage M.2 amovible, une plus grosse batterie, le WWAN en option, et un port USB A grand format - autant d’éléments absents du Dell. Si ceux-ci vous paraissent importants, alors vous préférerez le Spectre x360 13.
Mais le portable HP reste en retrait quand il s’agit d’exploiter au mieux son processeur Ice Lake. La fréquence variable du processeur, la fréquence de la carte graphique, le niveau sonore du ventilateur, la consommation, et les taux d’image en jeu sont autant de déceptions au regard du potentiel d’Intel Ice Lake. Nous savons que le Core i7-1065G7 peut faire mieux, comme le montrent le XPS 13 7390 2-en-1 ou le Yoga C940 et leurs résultats plus stables. Cela reste néanmoins un progrès par rapport au Spectre x360 13 Whiskey Lake U, surtout en ce qui concerne la portabilité et la luminosité d’écran, mais la différence entre les deux est inférieure à ce à quoi nous nous attendions.
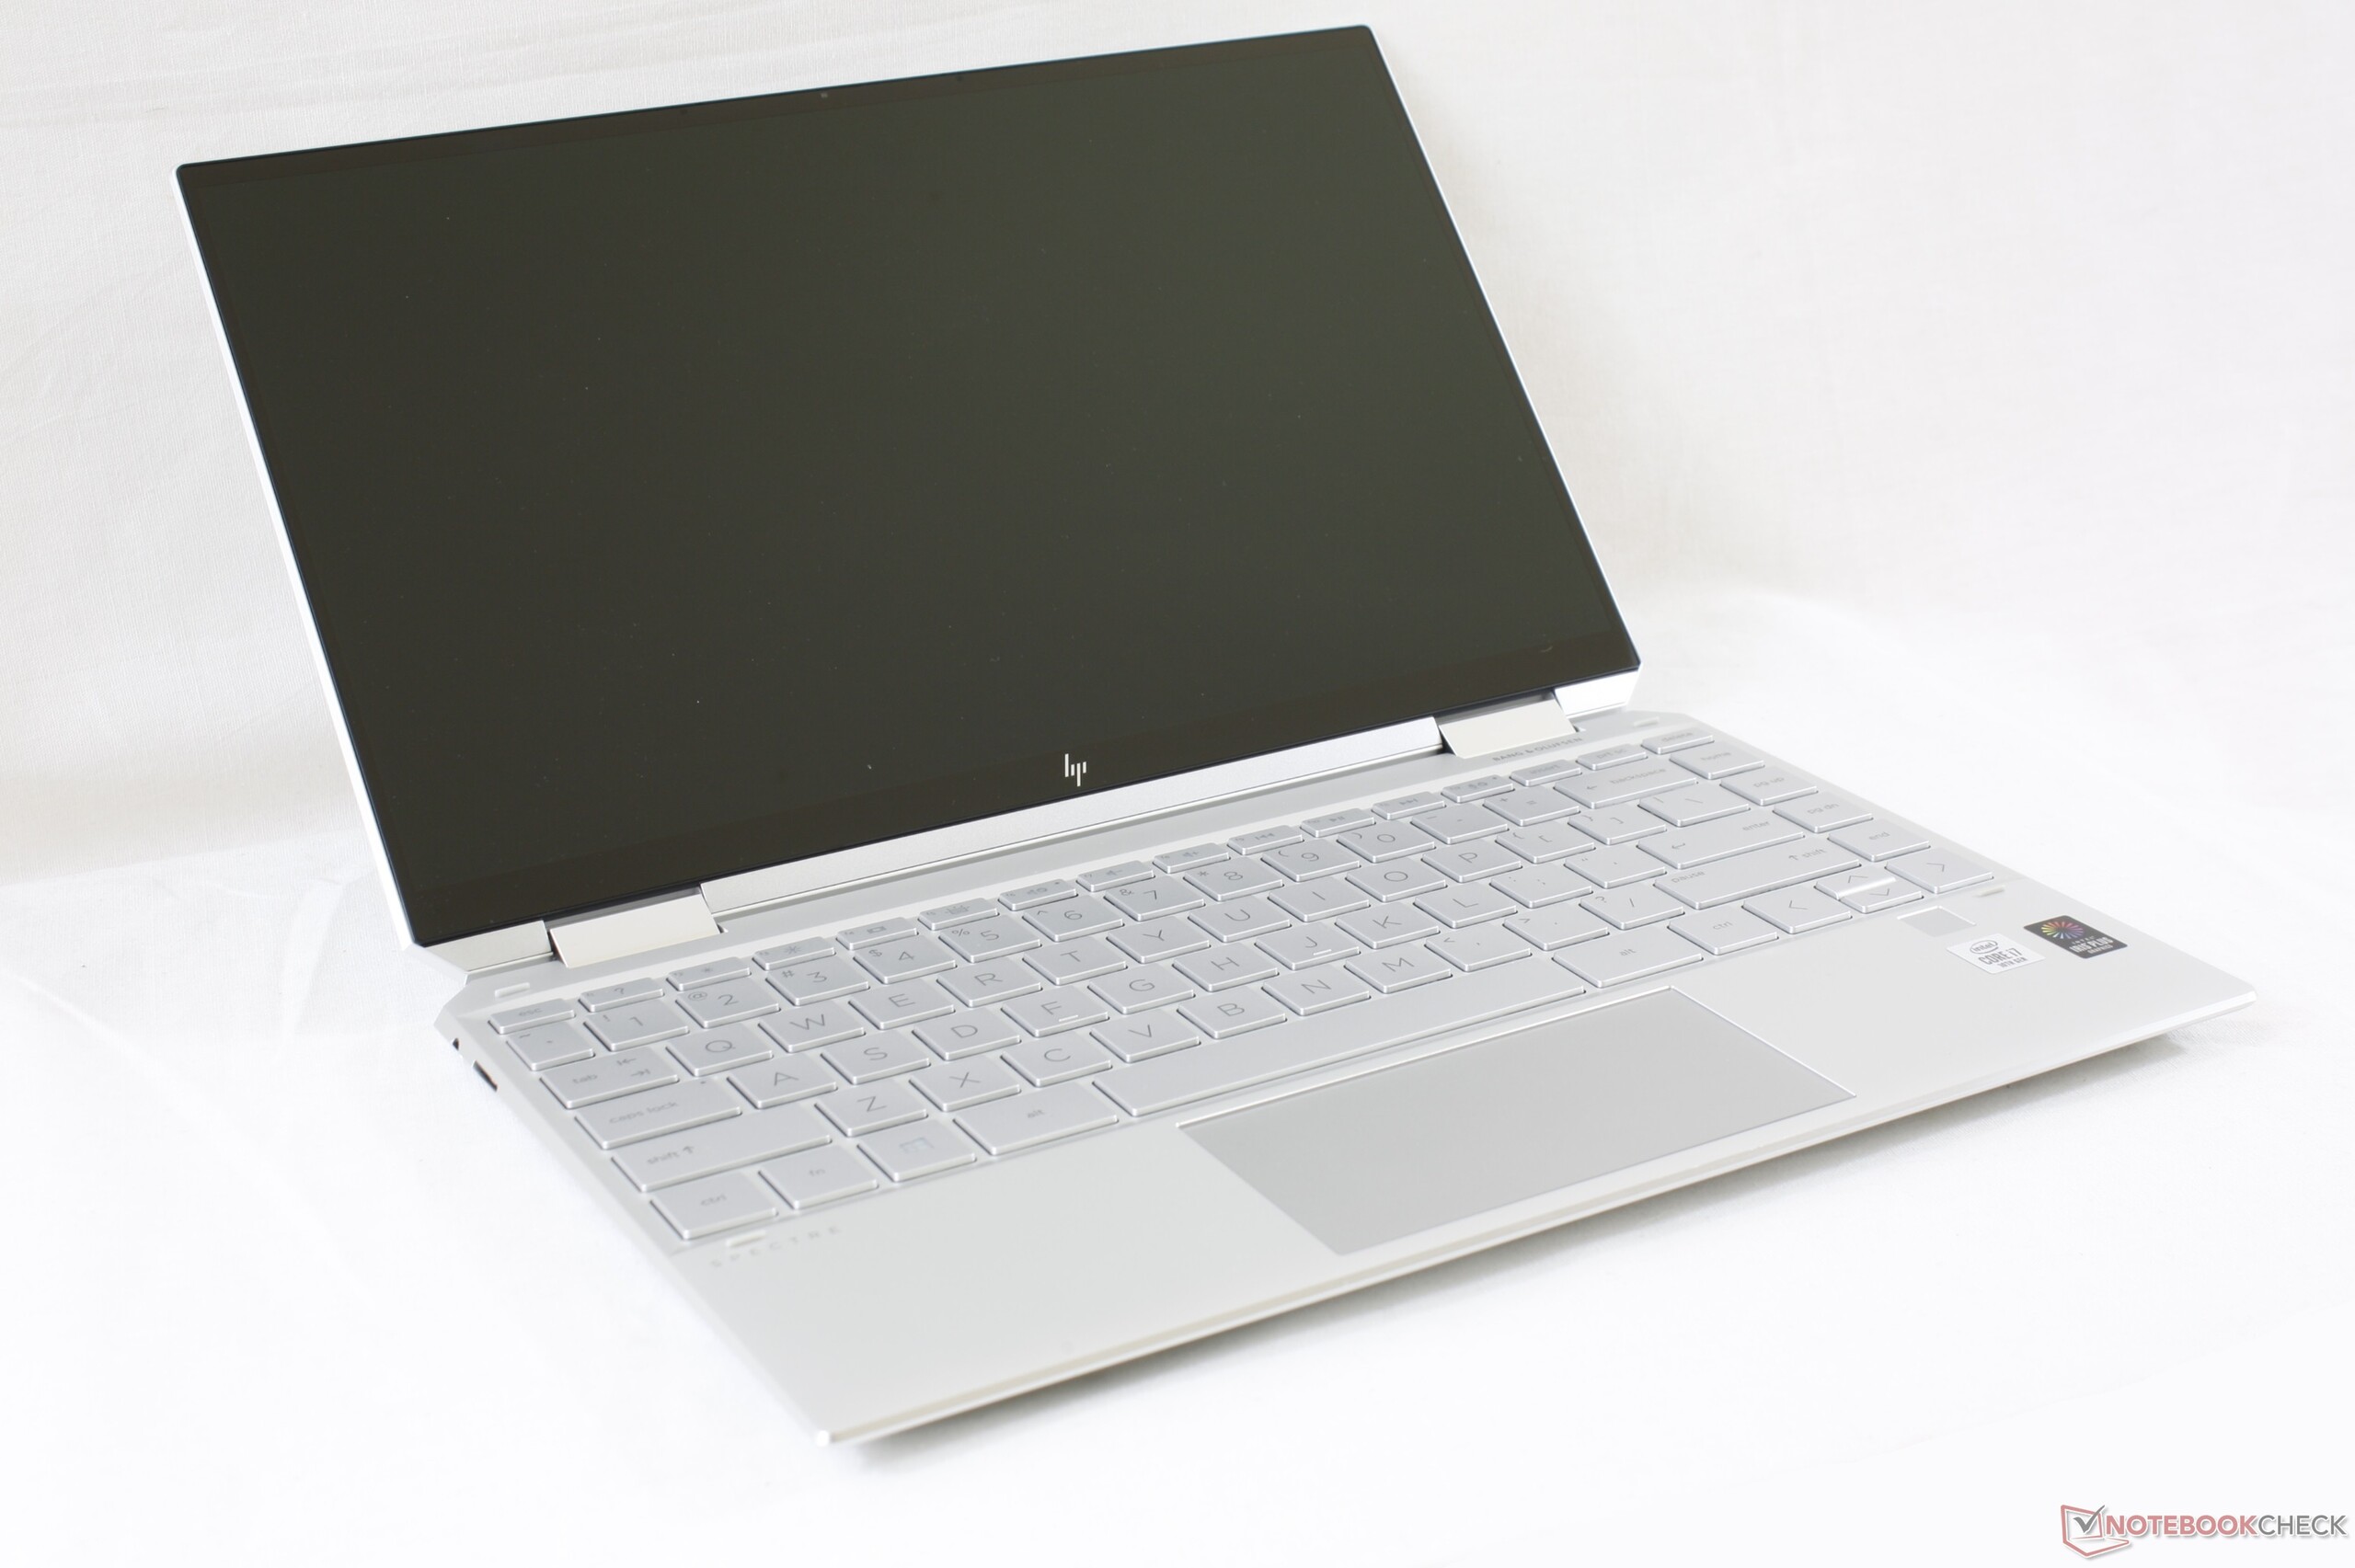
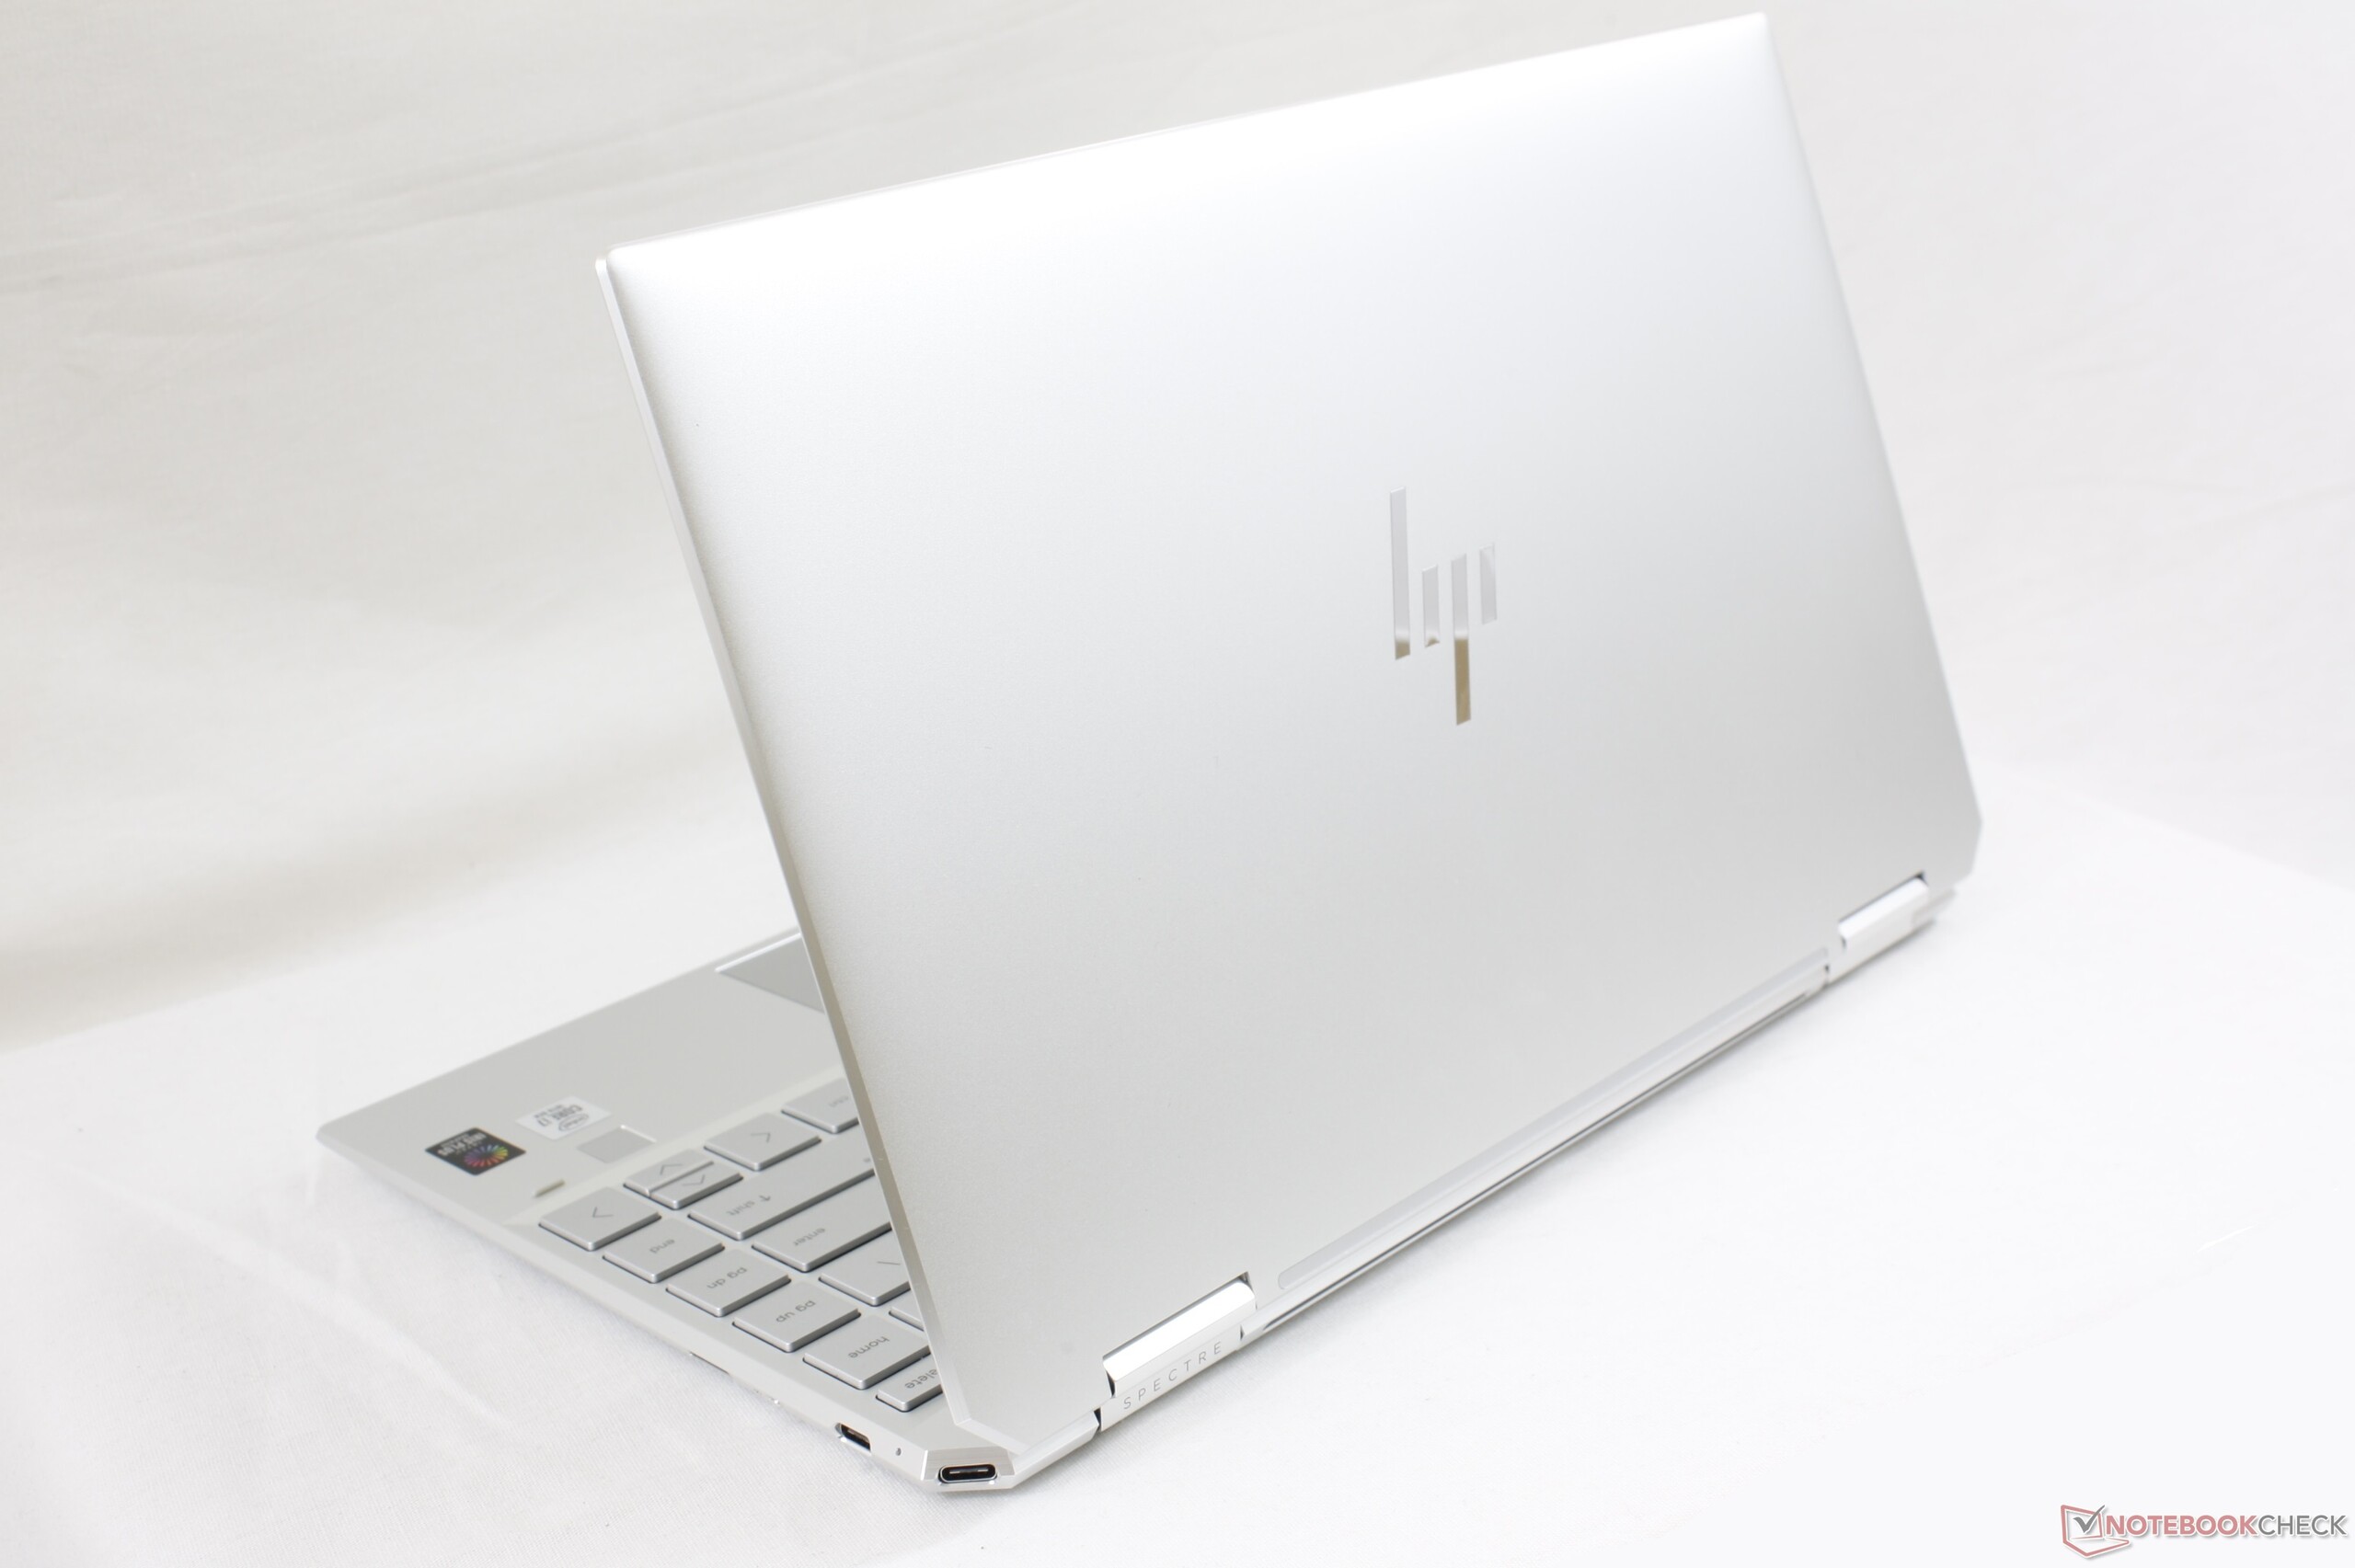
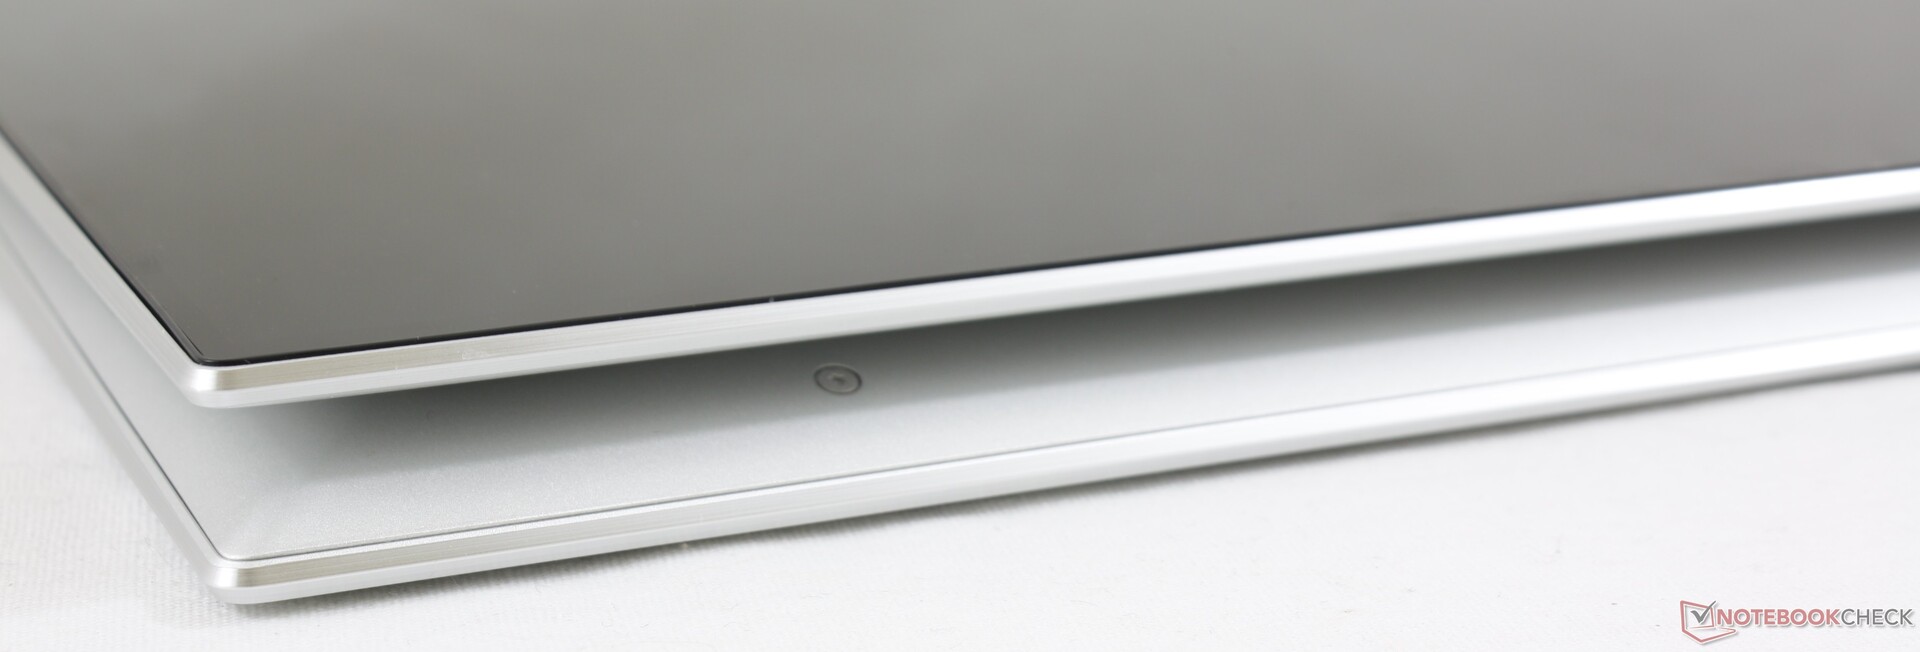
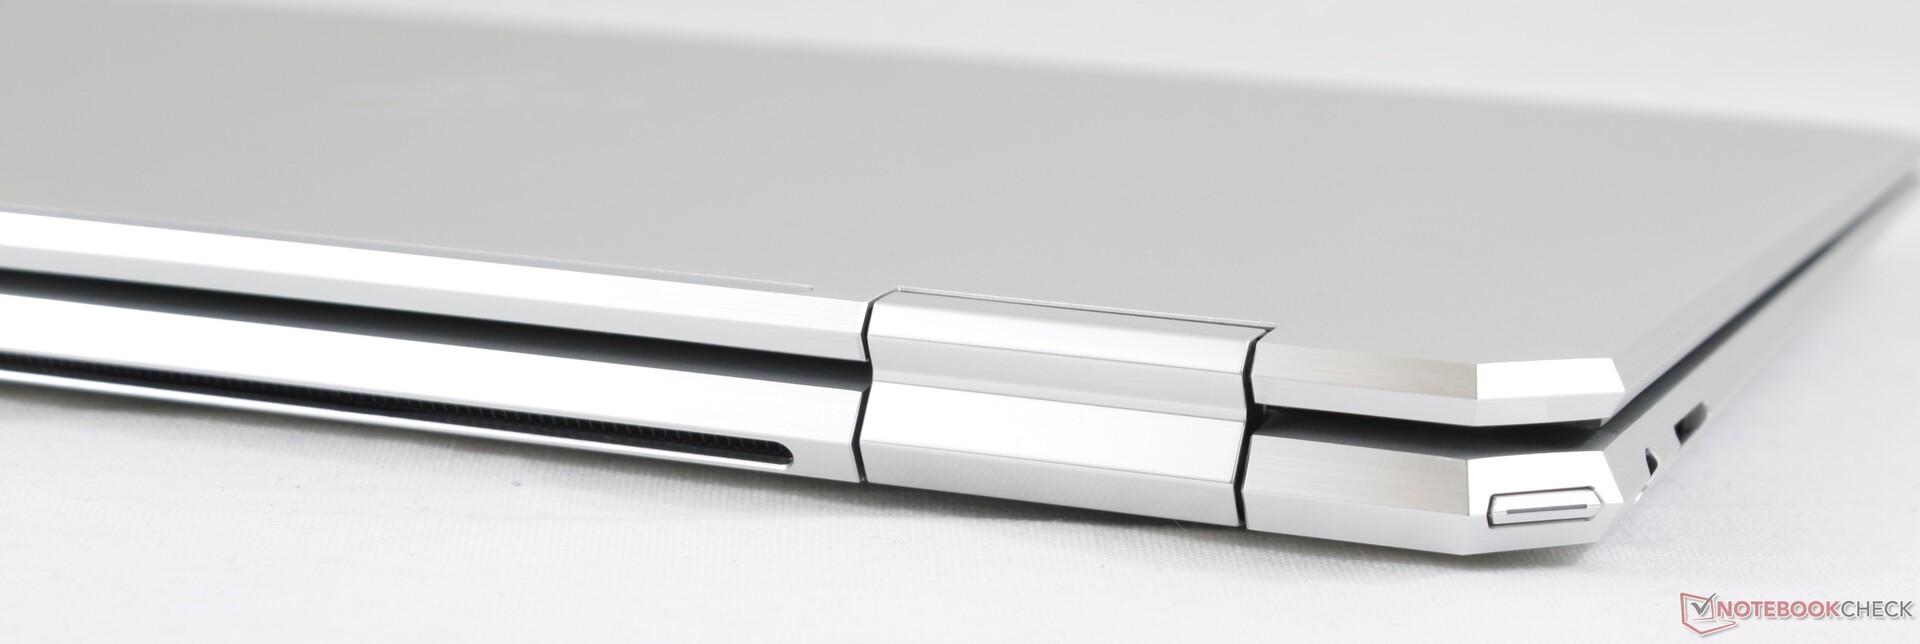
Un châssis excellent encore plus compact qu’avant, et plus de fonctionnalités que la plupart des autres convertibles grand public, voilà ce que propose le nouveau Spectre x360 13. L’intégration par HP d’Ice Lake reste moins bonne que sur les autres convertibles, si bien que les joueurs occasionnels doivent éviter ce Spectre.
L’intégralité de cette critique est disponible en anglais en suivant ce lien.
HP Spectre x360 13-aw0013dx
- 12/27/2019 v7 (old)
Allen Ngo
Price comparison
