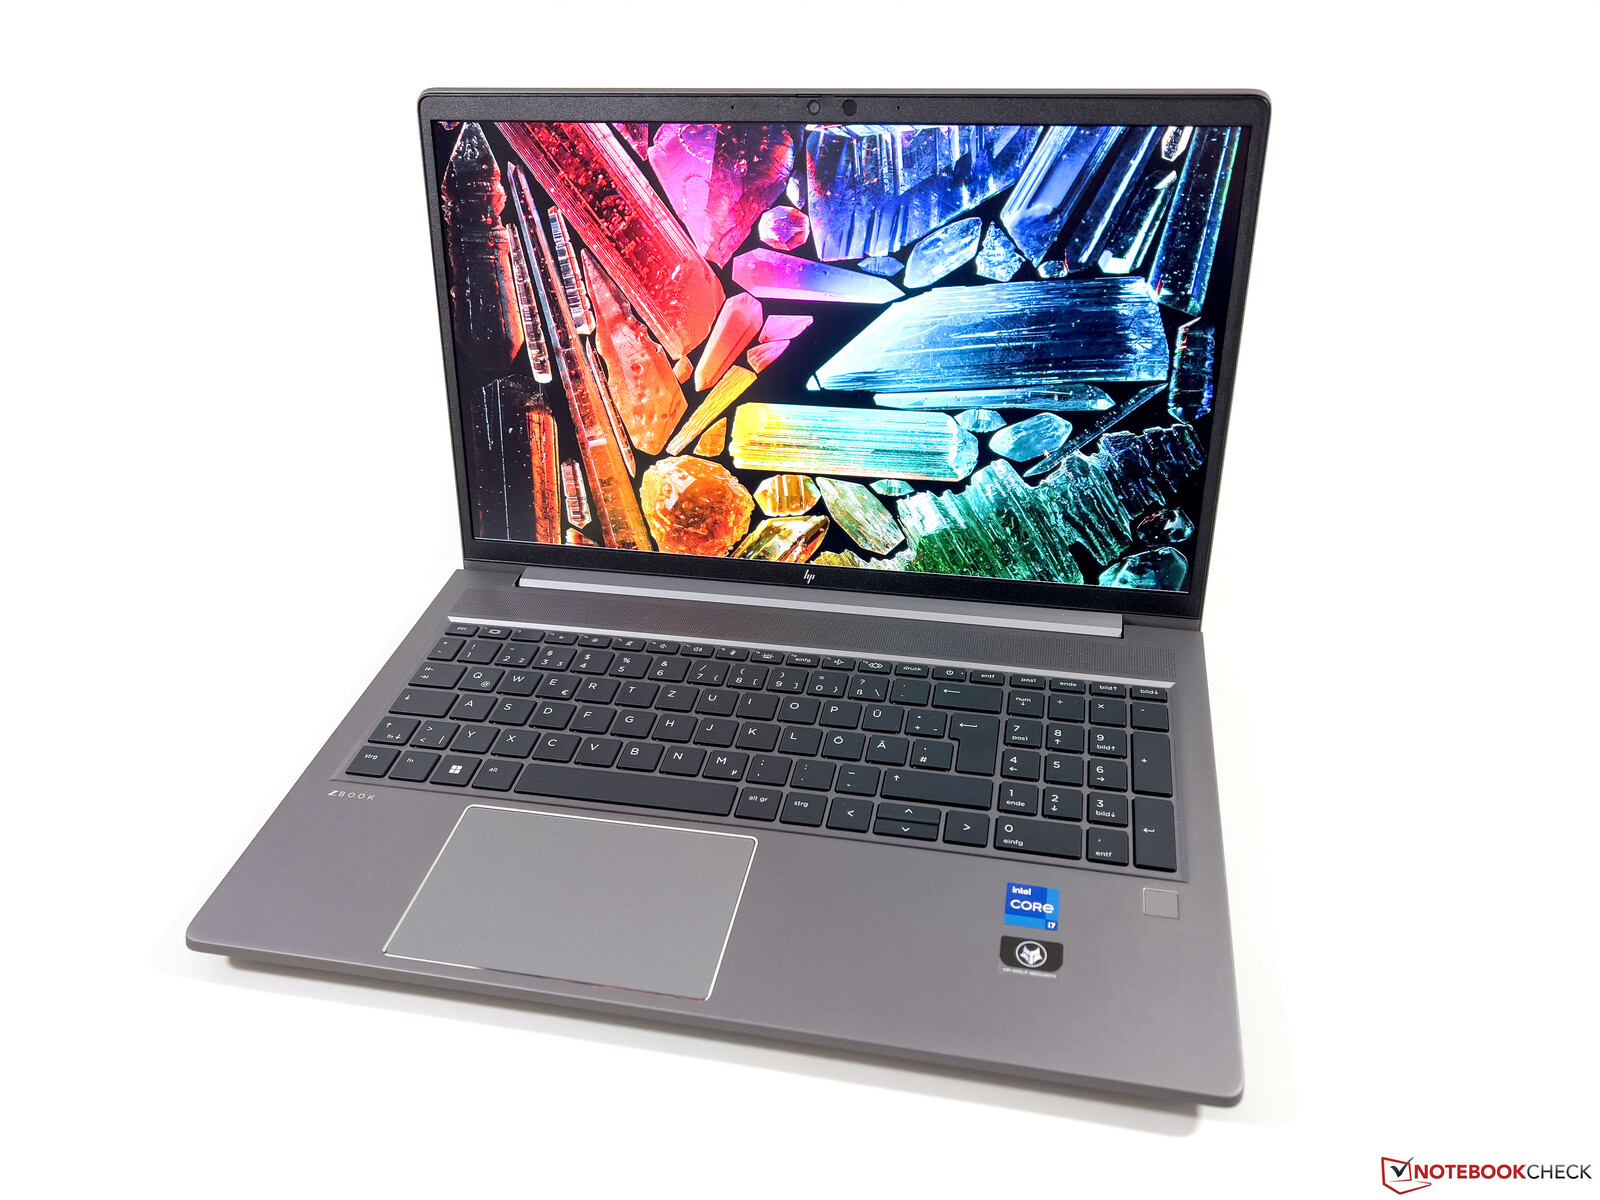
Test du HP ZBook Power 15 G9 : station de travail mobile avec un écran 4K mat
HP propose plusieurs séries de modèles de stations de travail mobiles, à commencer par le mince ZBook Fireflyappareils d'entrée de gamme, suivis par leZBook Studiole ZBook Furyles modèles haut de gamme, et le ZBook Power, qui est censé représenter une bonne combinaison de prix et de performances. Si le boîtier n'est pas particulièrement fin, cela s'accompagne également d'un nombre suffisant de ports. Nous testons la version ZBook Power 15 G9 6B8C4EA pour environ 2.800 Euros (~2981$), qui est très bien équipée avec un Core i7-12700HlaRTX A200032 Go de RAM, un SSD de 1 To et un écran 4K mat. Par rapport au prédécesseur du ZBook Power 15 G8 (ici dans notre test), il n'y a pas de changements dans le boîtier et les périphériques d'entrée, donc nous allons garder ces sections courtes ici, en se concentrant plutôt sur les sections de performance.
Comparaison avec les concurrents potentiels
Note | Date | Modèle | Poids | Épaisseur | Taille | Résolution | Prix |
|---|---|---|---|---|---|---|---|
| 87.4 % v7 (old) | 01/23 | HP ZBook Power 15 G9 6B8C4EA i7-12700H, RTX A2000 Laptop GPU | 2 kg | 22.8 mm | 15.60" | 3840x2160 | |
| 90.1 % v7 (old) | 11/22 | HP ZBook Studio 16 G9 62U04EA i7-12800H, RTX A2000 Laptop GPU | 1.8 kg | 19 mm | 16.00" | 3840x2400 | |
| 88.3 % v7 (old) | 10/21 | Dell Precision 5000 5560 i7-11850H, RTX A2000 Laptop GPU | 2 kg | 18 mm | 15.60" | 3840x2400 | |
| 86.2 % v7 (old) | 06/22 | Lenovo ThinkPad P15v G2 21A9000XGE i7-11800H, T1200 Laptop GPU | 2.3 kg | 22.7 mm | 15.60" | 1920x1080 | |
| 87.7 % v7 (old) | 07/22 | HP ZBook Power 15 G8 313S5EA i7-11800H, T600 Laptop GPU | 2 kg | 22.8 mm | 15.60" | 1920x1080 |
Cas et équipement
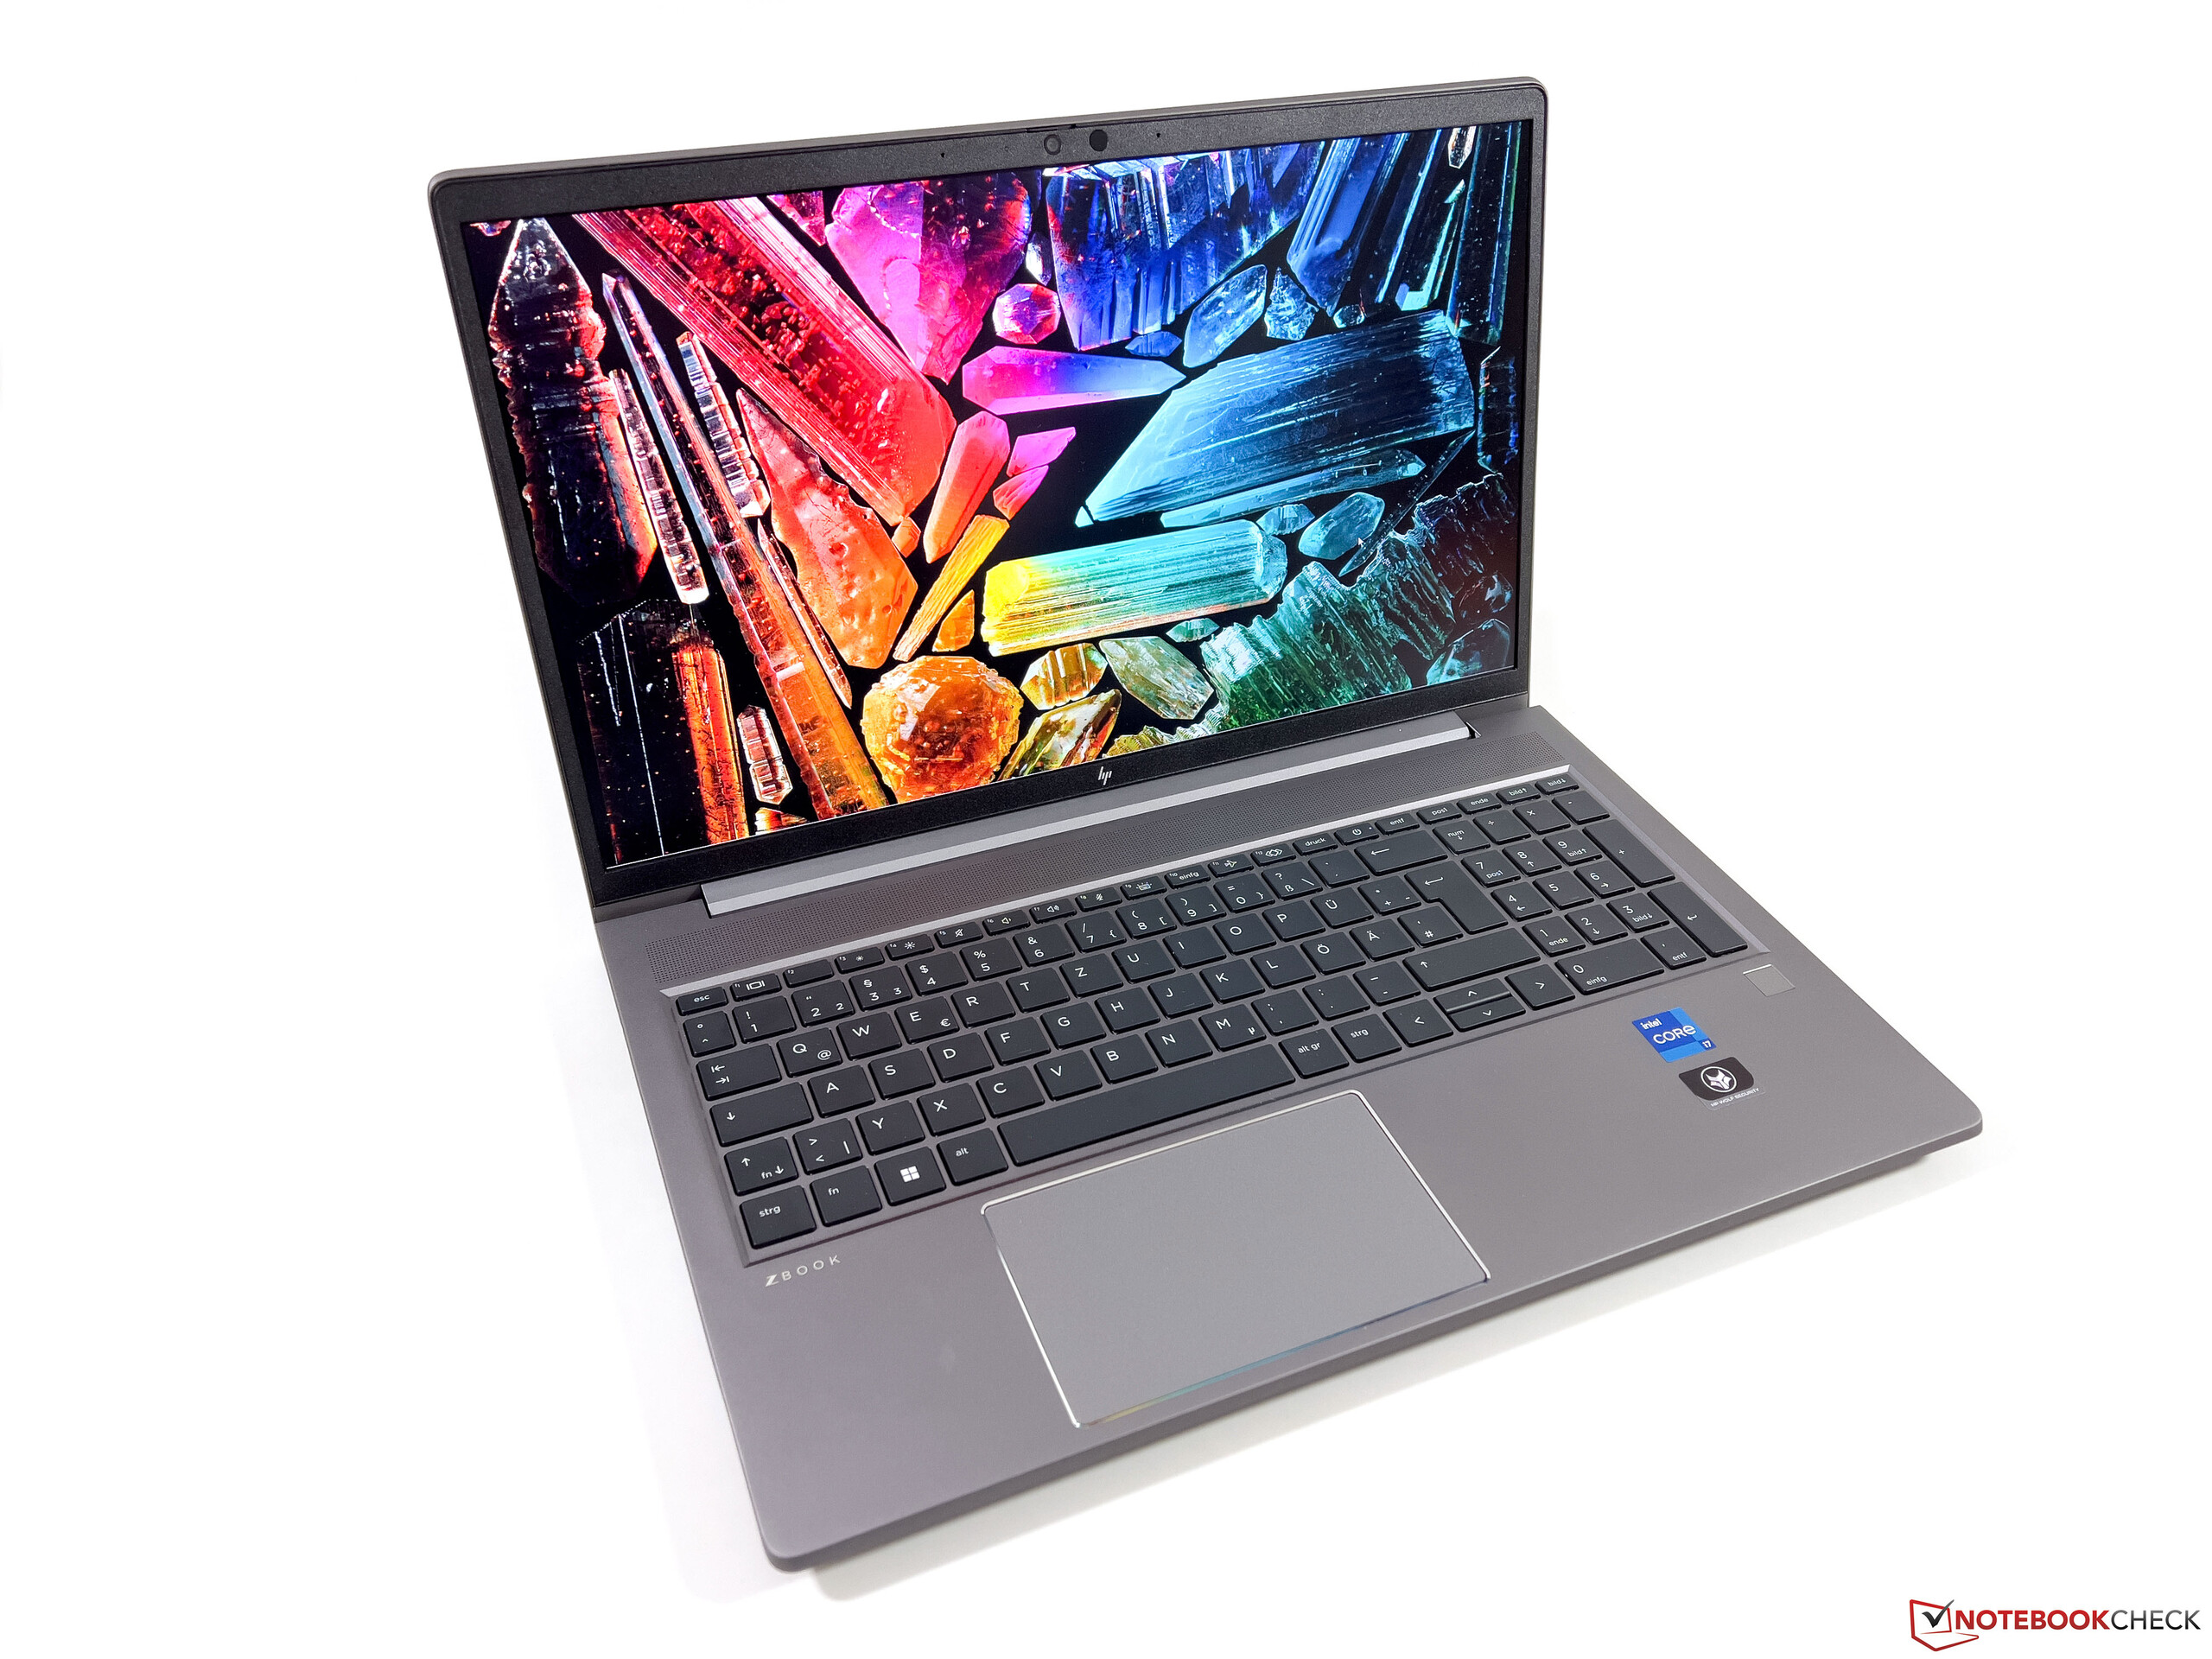
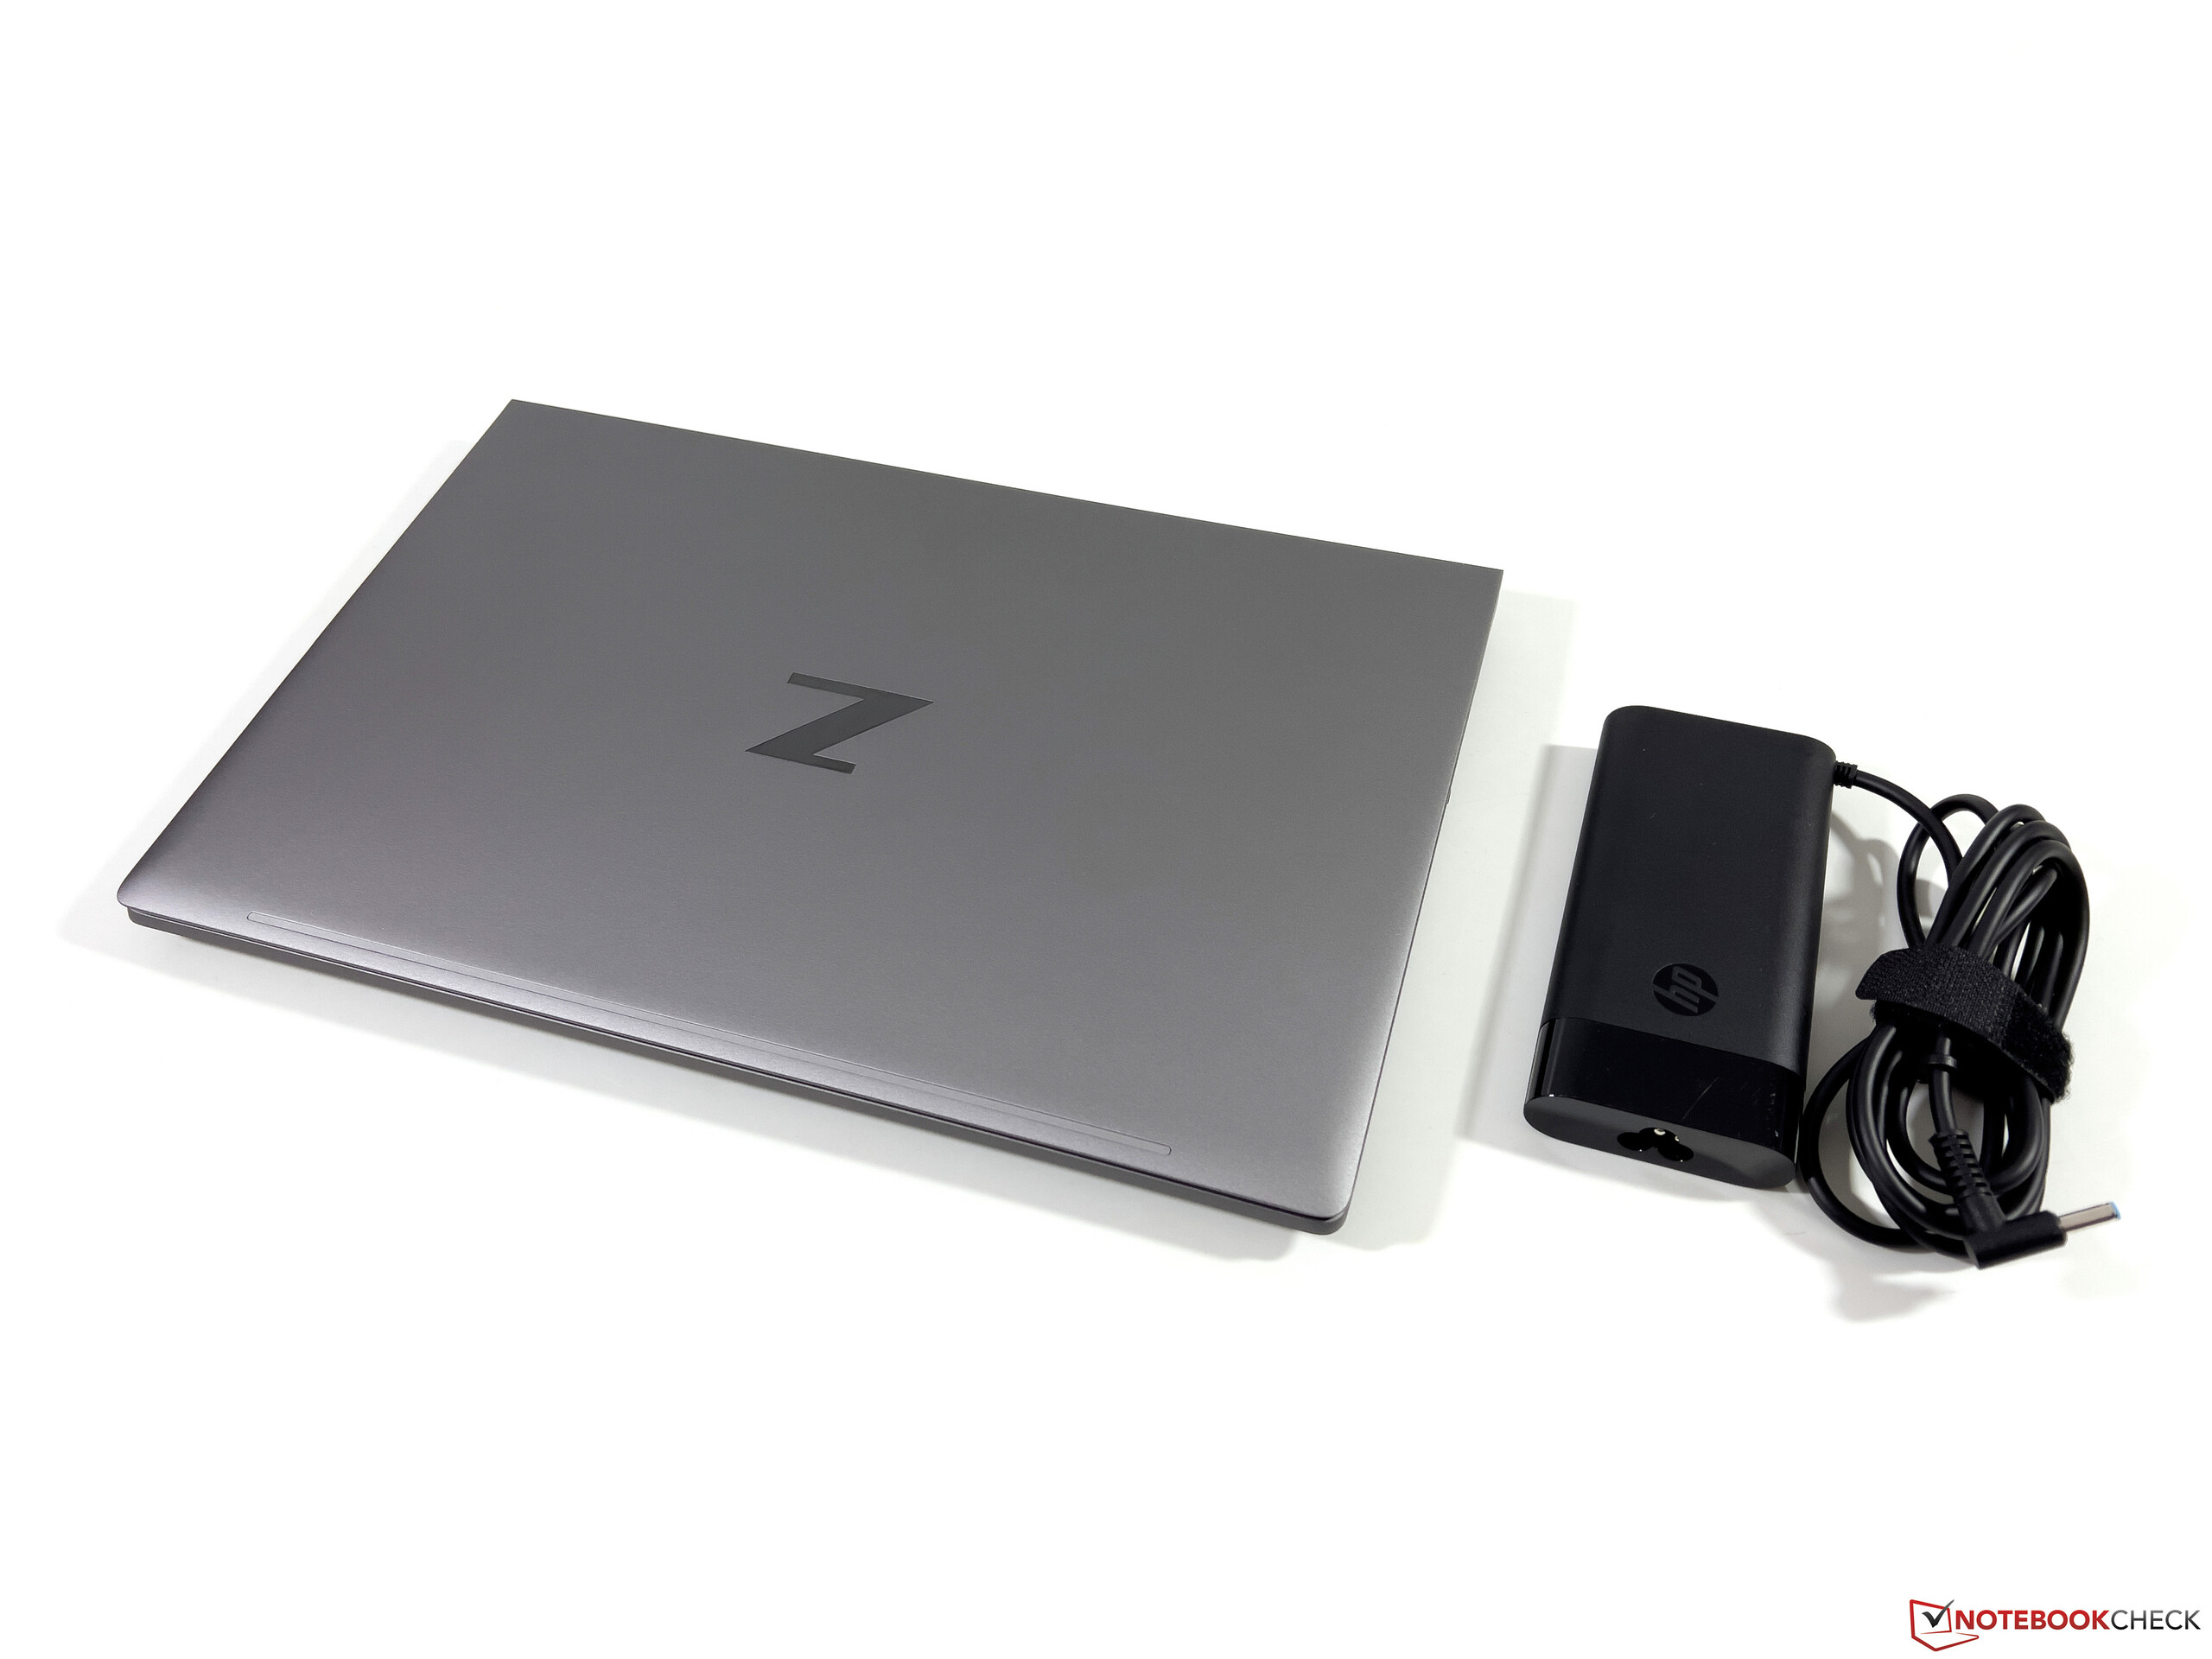
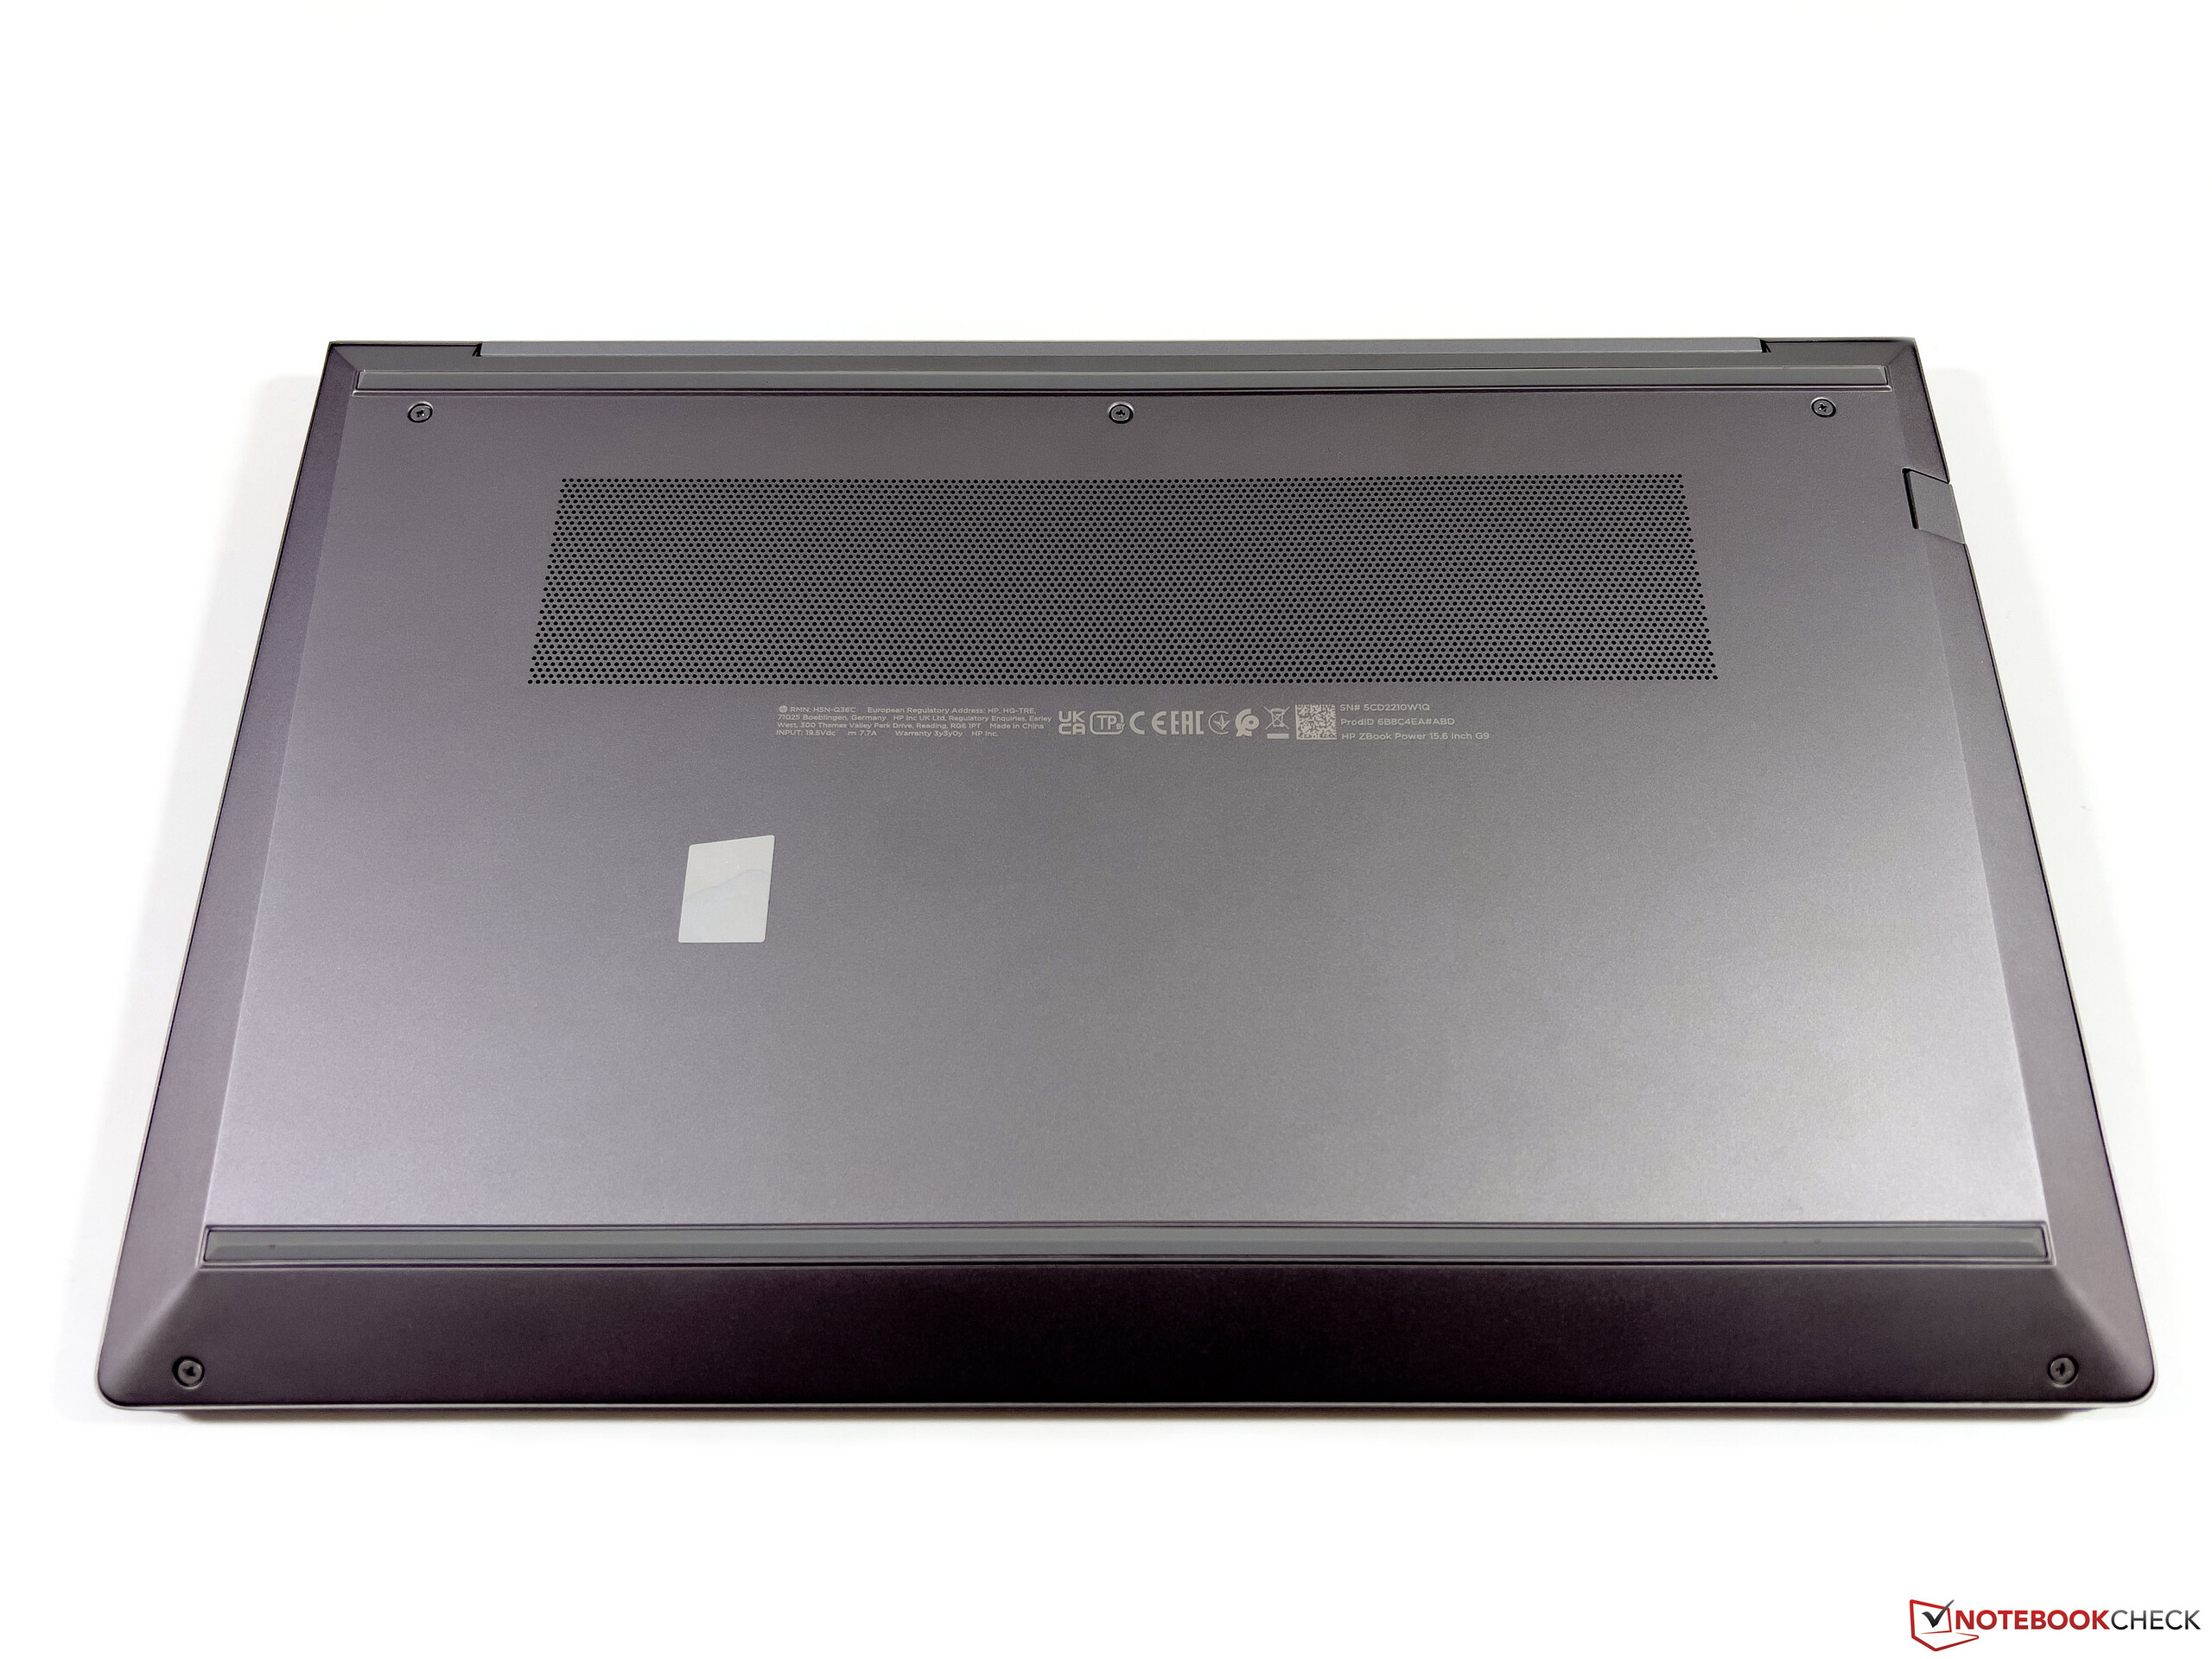
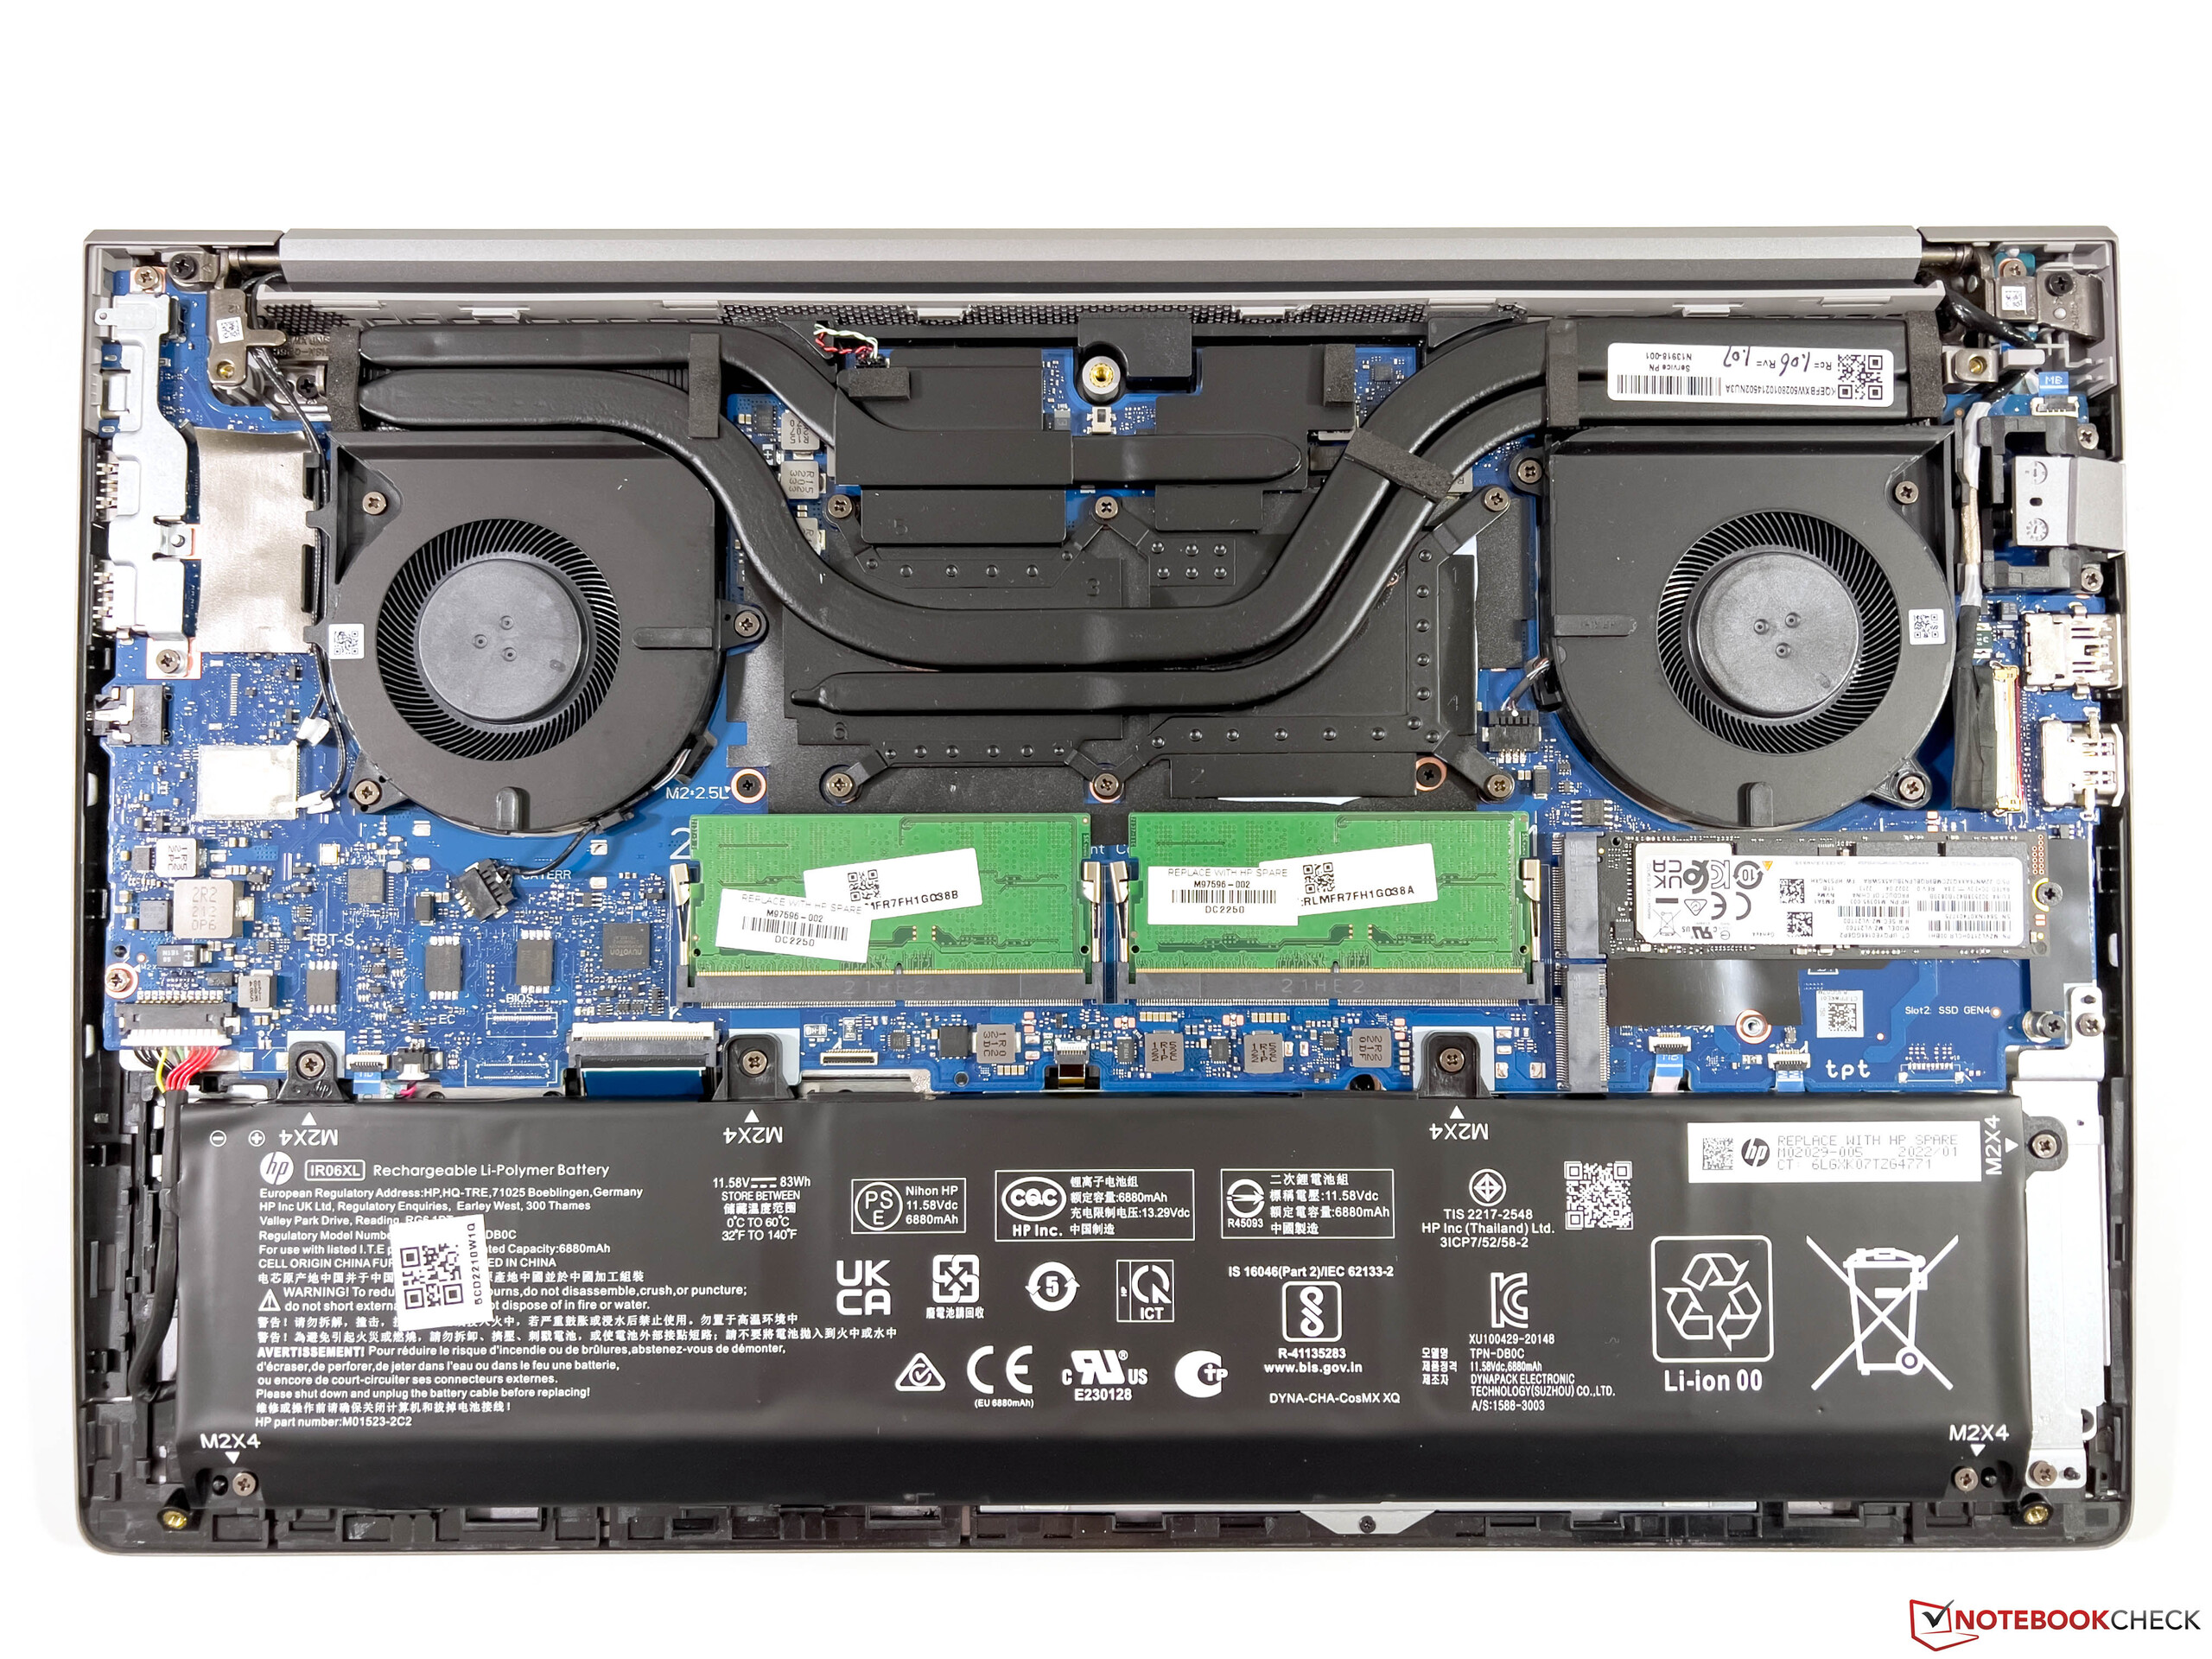
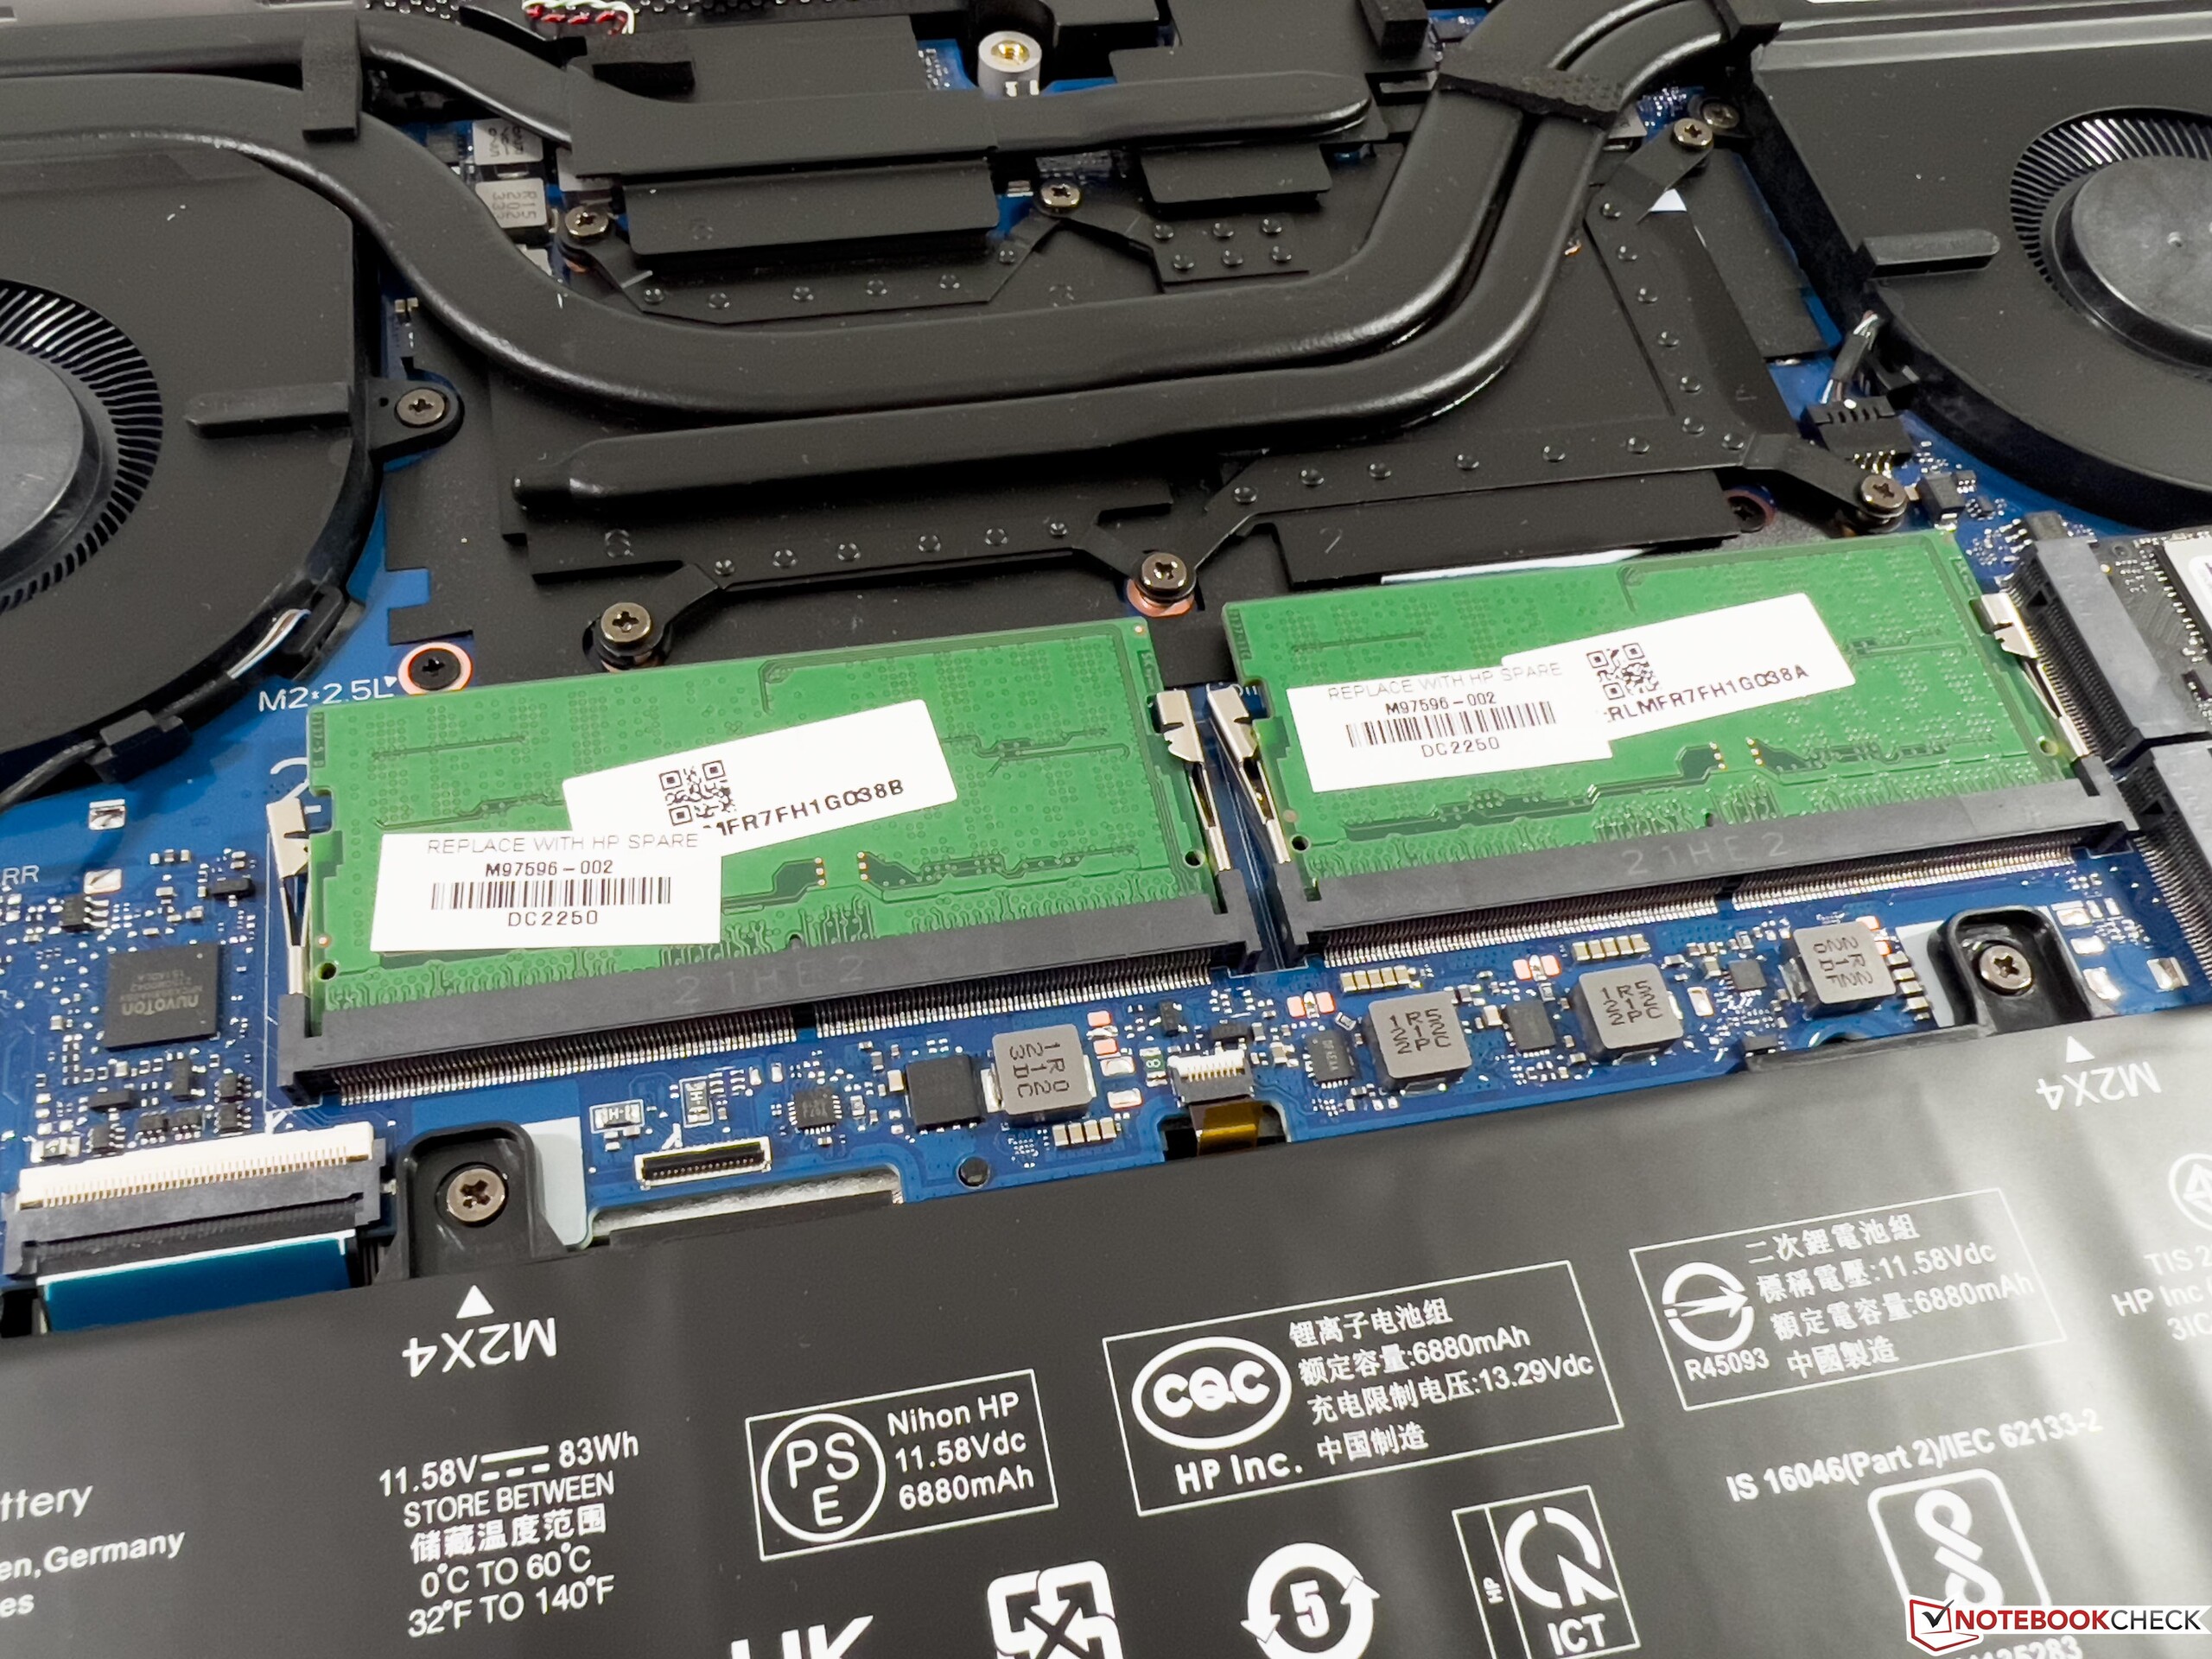
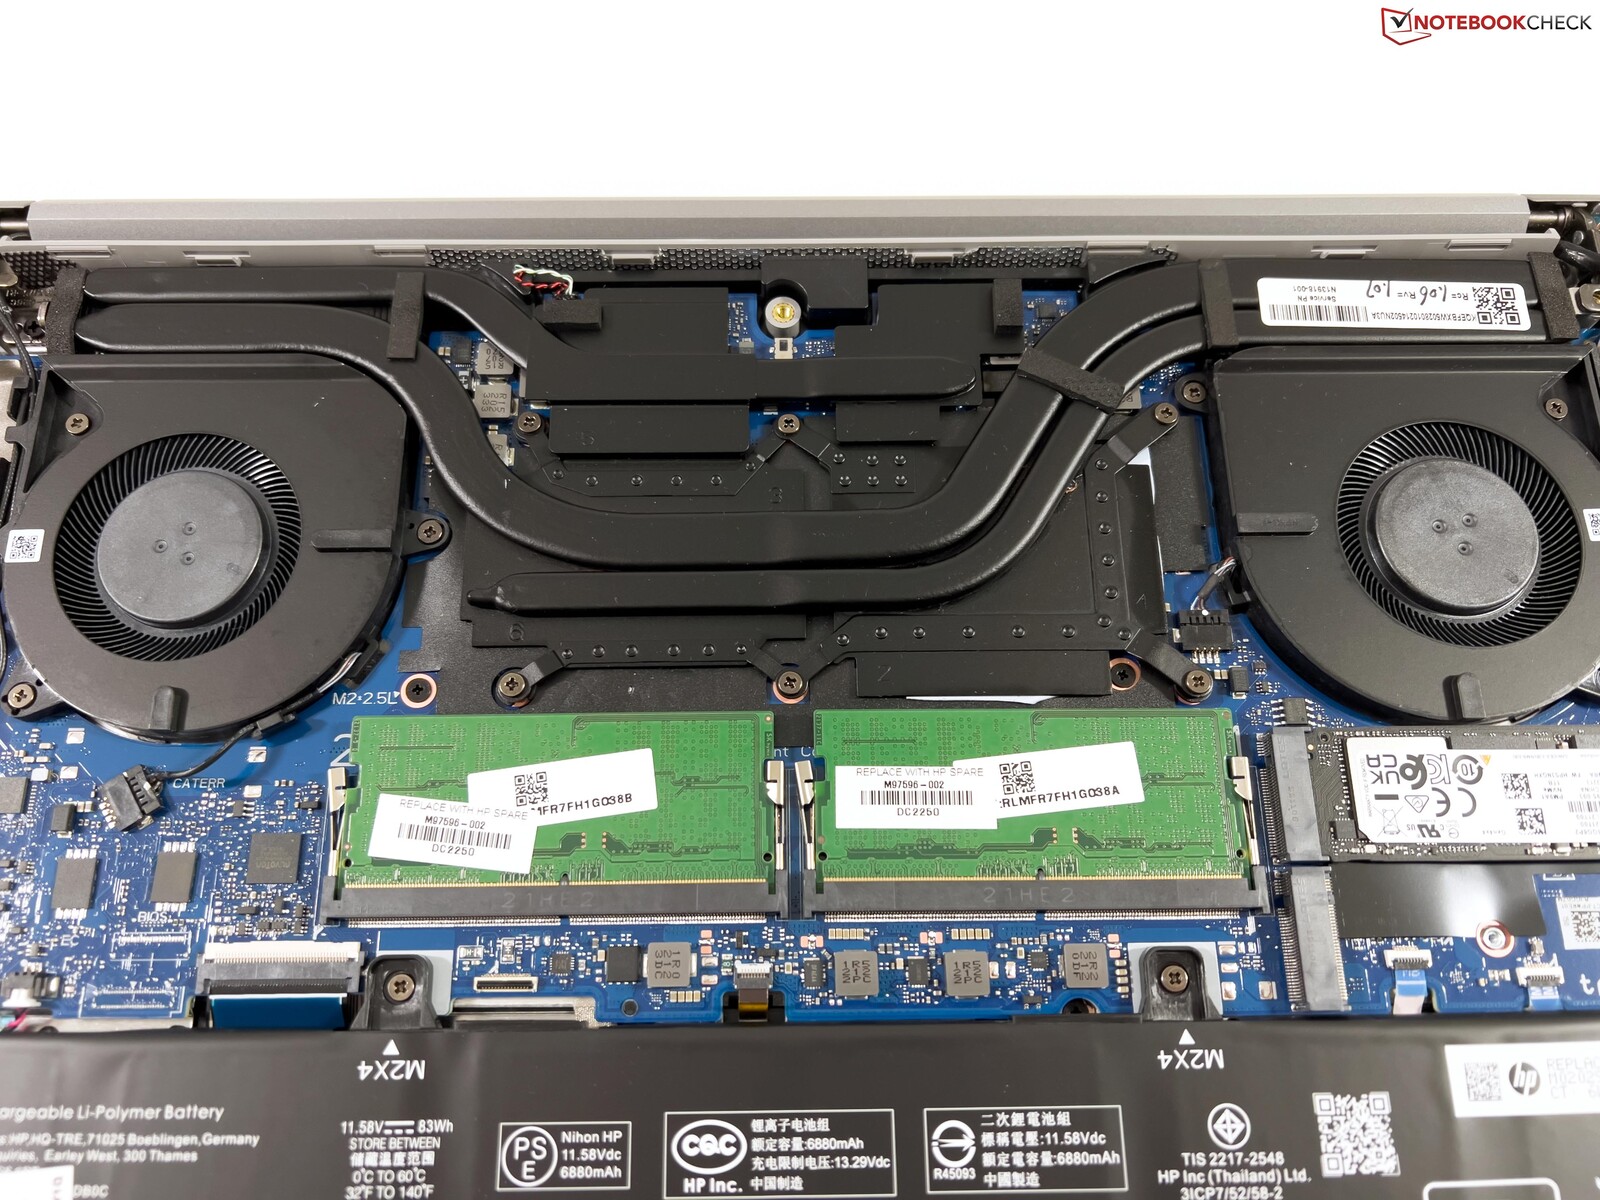
Le boîtier en aluminium reste inchangé par rapport au précédent modèle G8. Si la qualité est bonne dans l'ensemble, la stabilité n'atteint pas tout à fait celle des modèles de stations de travail plus coûteux comme le ZBook Studio ou le ZBook Fury. En outre, l'écran oscille légèrement après avoir modifié l'angle d'ouverture. Visuellement, le ZBook Power 15 G9 a l'air modeste et sans particularité avec sa couleur gris foncé. Le fond du boîtier est seulement vissé et peut être retiré facilement. Outre la mémoire de travail, vous pouvez également accéder aux deux emplacements SSD M.2, mais le module WLAN est soudé.
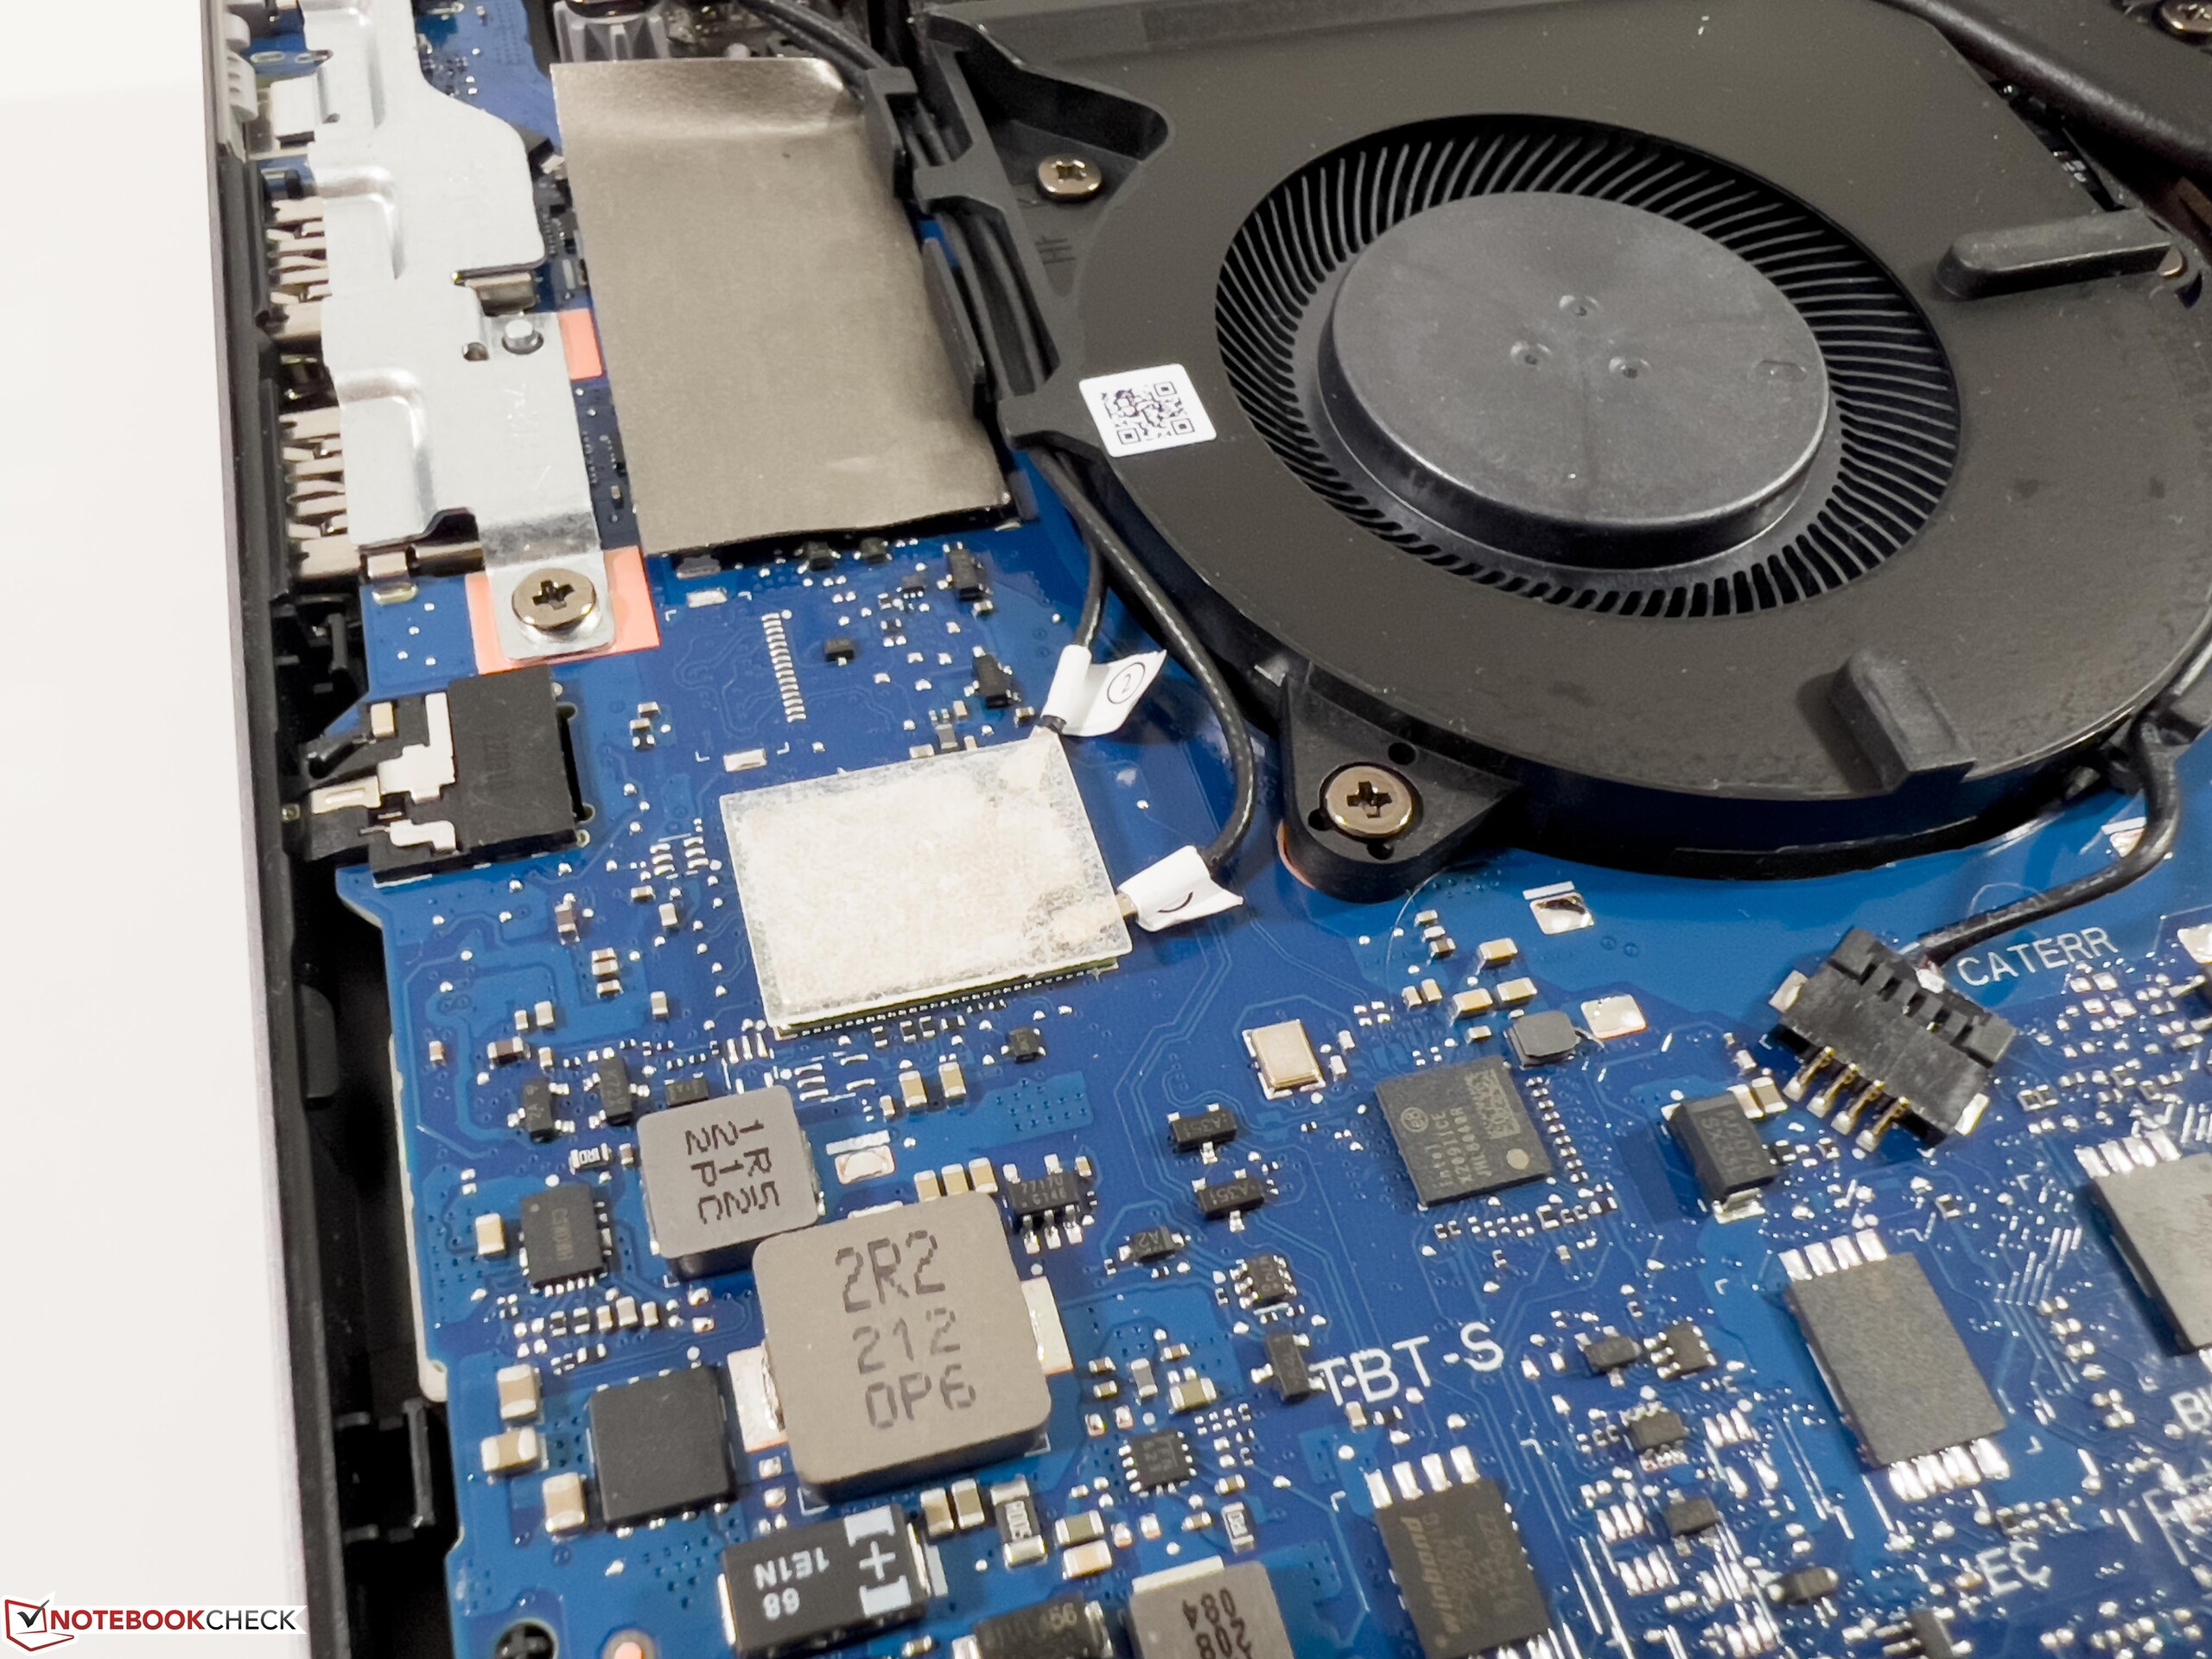
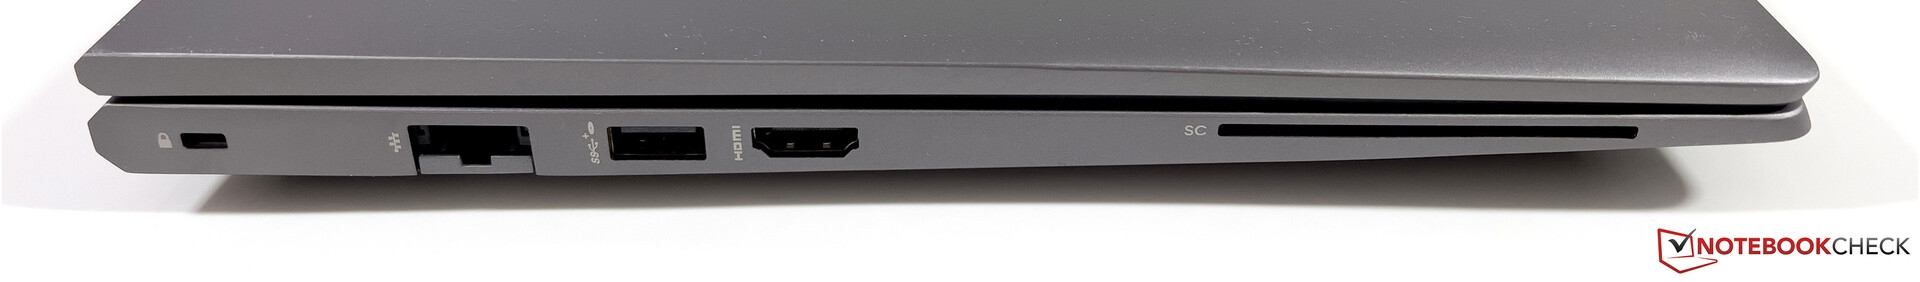
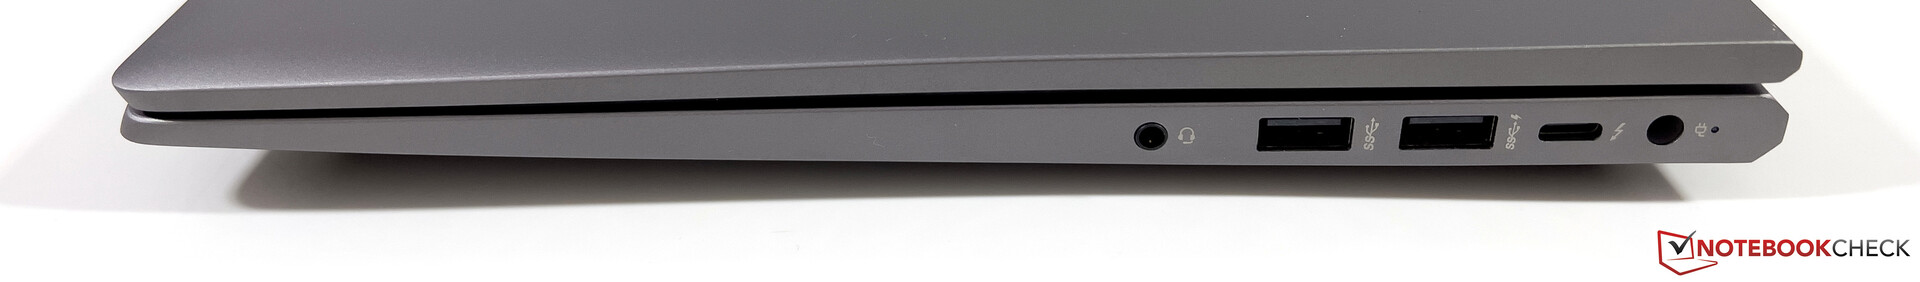
En ce qui concerne le matériel de connexion, on trouve toujours un certain nombre de ports USB-A ainsi que des ports USB-C avec Thunderbolt 4, Ethernet et un port HDMI. En revanche, il manque un lecteur de cartes. Le module WLAN a été mis à niveau, et la carte AX211 d'Intel prend désormais également en charge la norme Wi-Fi 6E. Nous sommes en mesure de nous connecter au réseau 6-GHz depuis notre routeur de référence Asus sans aucun problème. Les taux de transfert que nous mesurons sont très élevés et également stables. Un module LTE/5G n'est pas disponible pour le ZBook Power.
En ce qui concerne la webcam, il y a toujours un capteur 720p incluant une caméra IR pour la reconnaissance des visages. La webcam fait son travail, mais la qualité de l'image n'est pas très bonne, même dans de bonnes conditions de luminosité.
| Networking | |
| HP ZBook Power 15 G9 6B8C4EA | |
| iperf3 receive AXE11000 6GHz | |
| iperf3 transmit AXE11000 6GHz | |
| HP ZBook Studio 16 G9 62U04EA | |
| iperf3 receive AXE11000 6GHz | |
| iperf3 transmit AXE11000 6GHz | |
| Dell Precision 5000 5560 | |
| iperf3 transmit AX12 | |
| iperf3 receive AX12 | |
| Lenovo ThinkPad P15v G2 21A9000XGE | |
| iperf3 transmit AX12 | |
| iperf3 receive AX12 | |
| HP ZBook Power 15 G8 313S5EA | |
| iperf3 transmit AX12 | |
| iperf3 receive AX12 | |


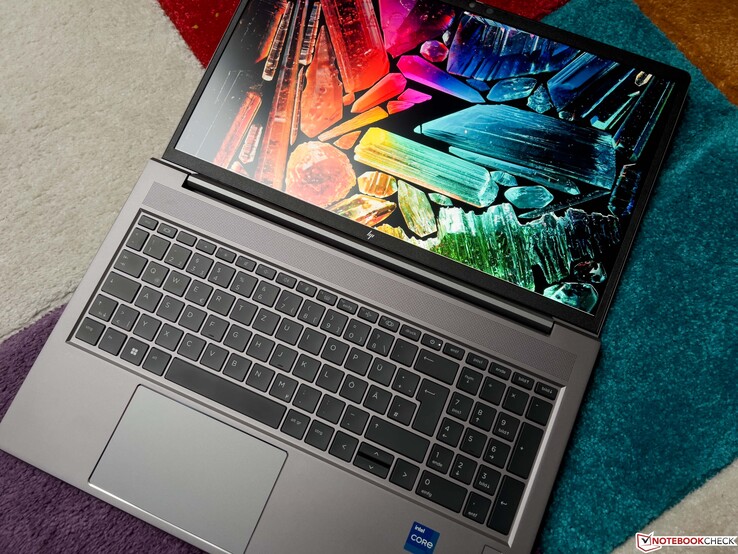
Périphériques d'entrée - ZBook Power avec un bon clavier
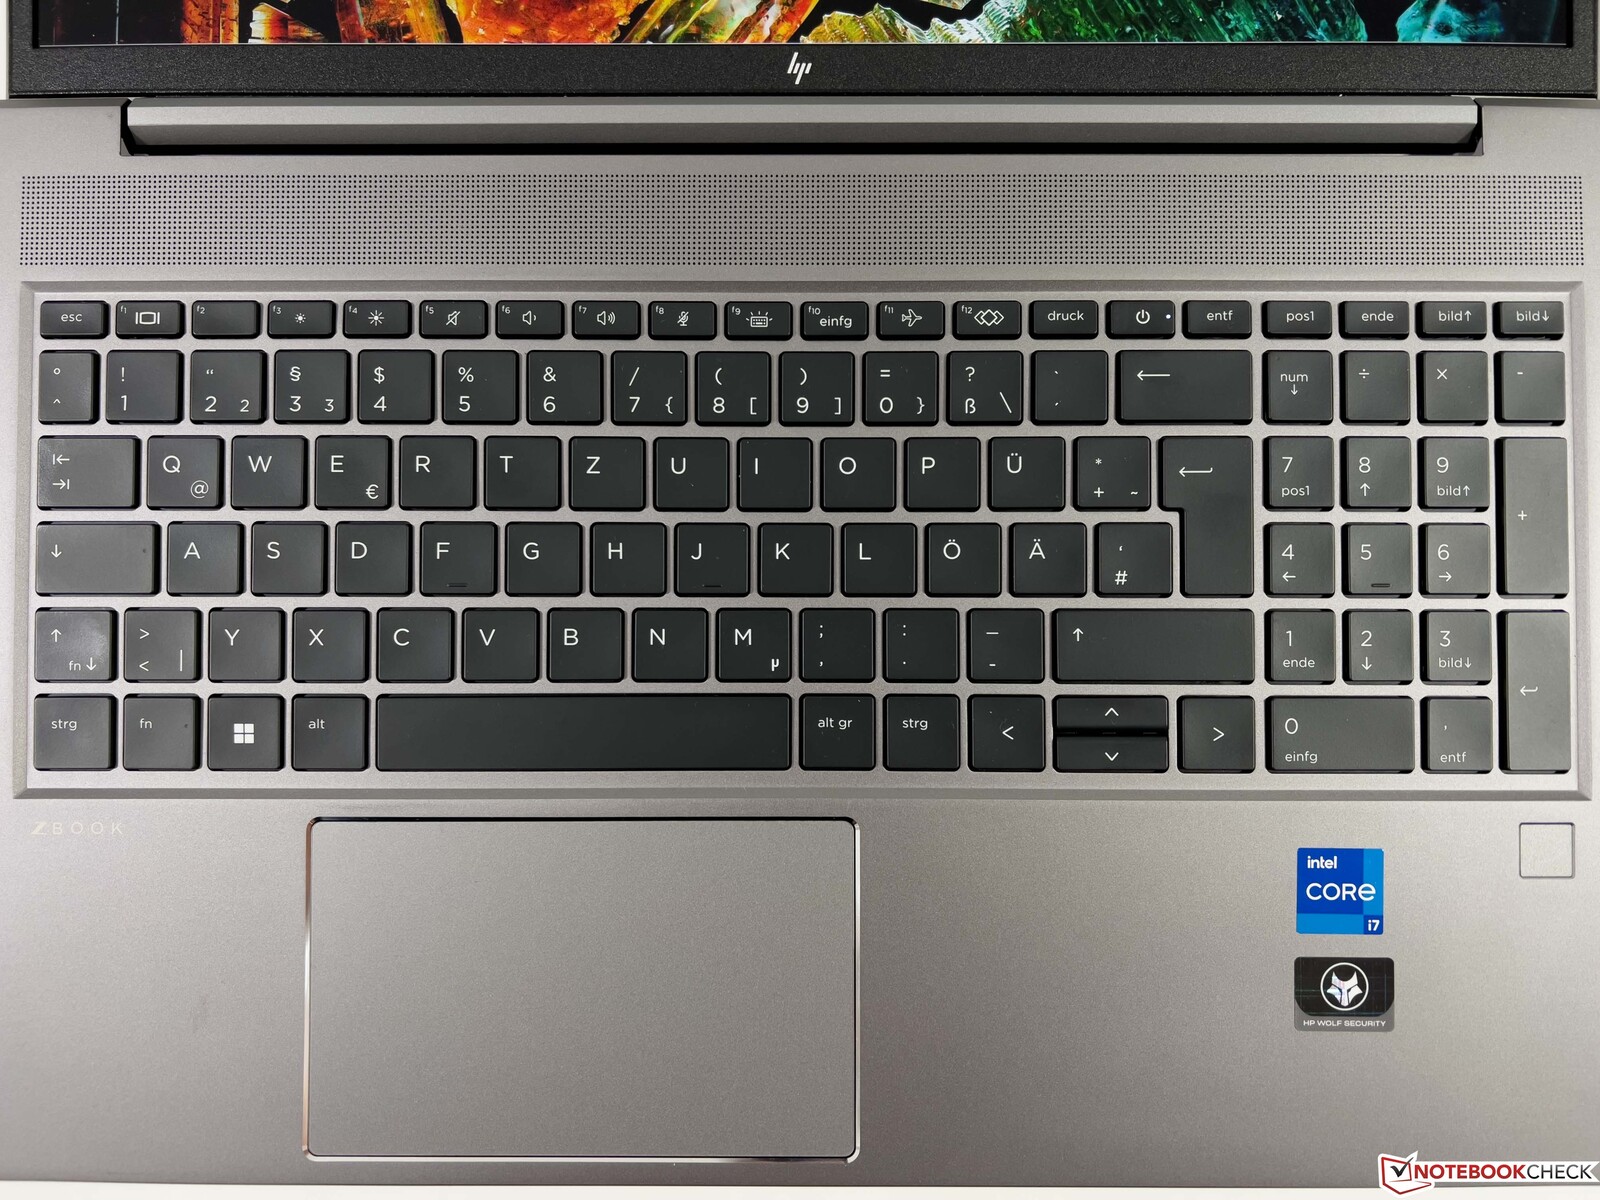
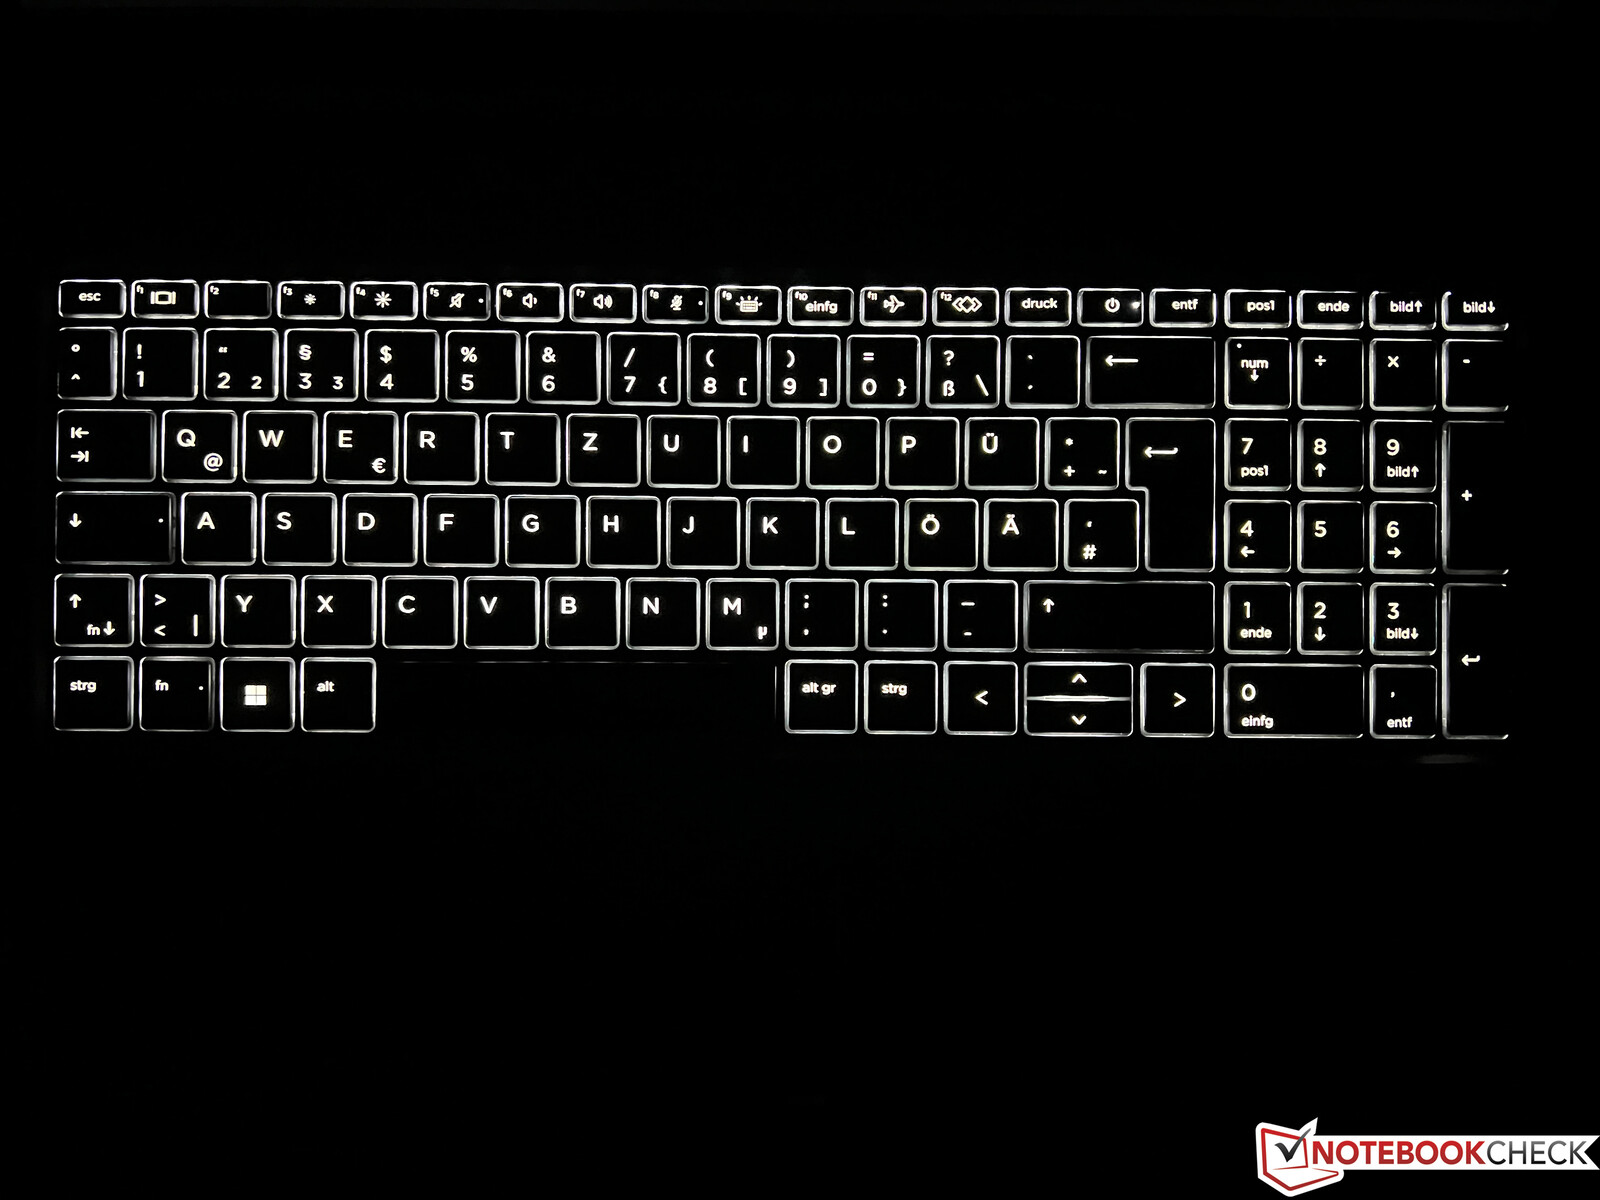
Par rapport au ZBook Power 15 G8il n'y a pas non plus de changement dans les périphériques d'entrée. Le clavier avec éclairage de fond offre une très bonne expérience de frappe, et il y a un bloc numérique dédié sur le côté droit. En termes de disposition, il faut s'habituer aux touches fléchées légèrement plus petites et au bouton Power dans la rangée de touches supérieure. Le scanner d'empreintes digitales est placé sur la droite, sous le clavier. Dans notre test, le ClickPad fonctionne de manière fiable, mais le son du clic est un peu fort.
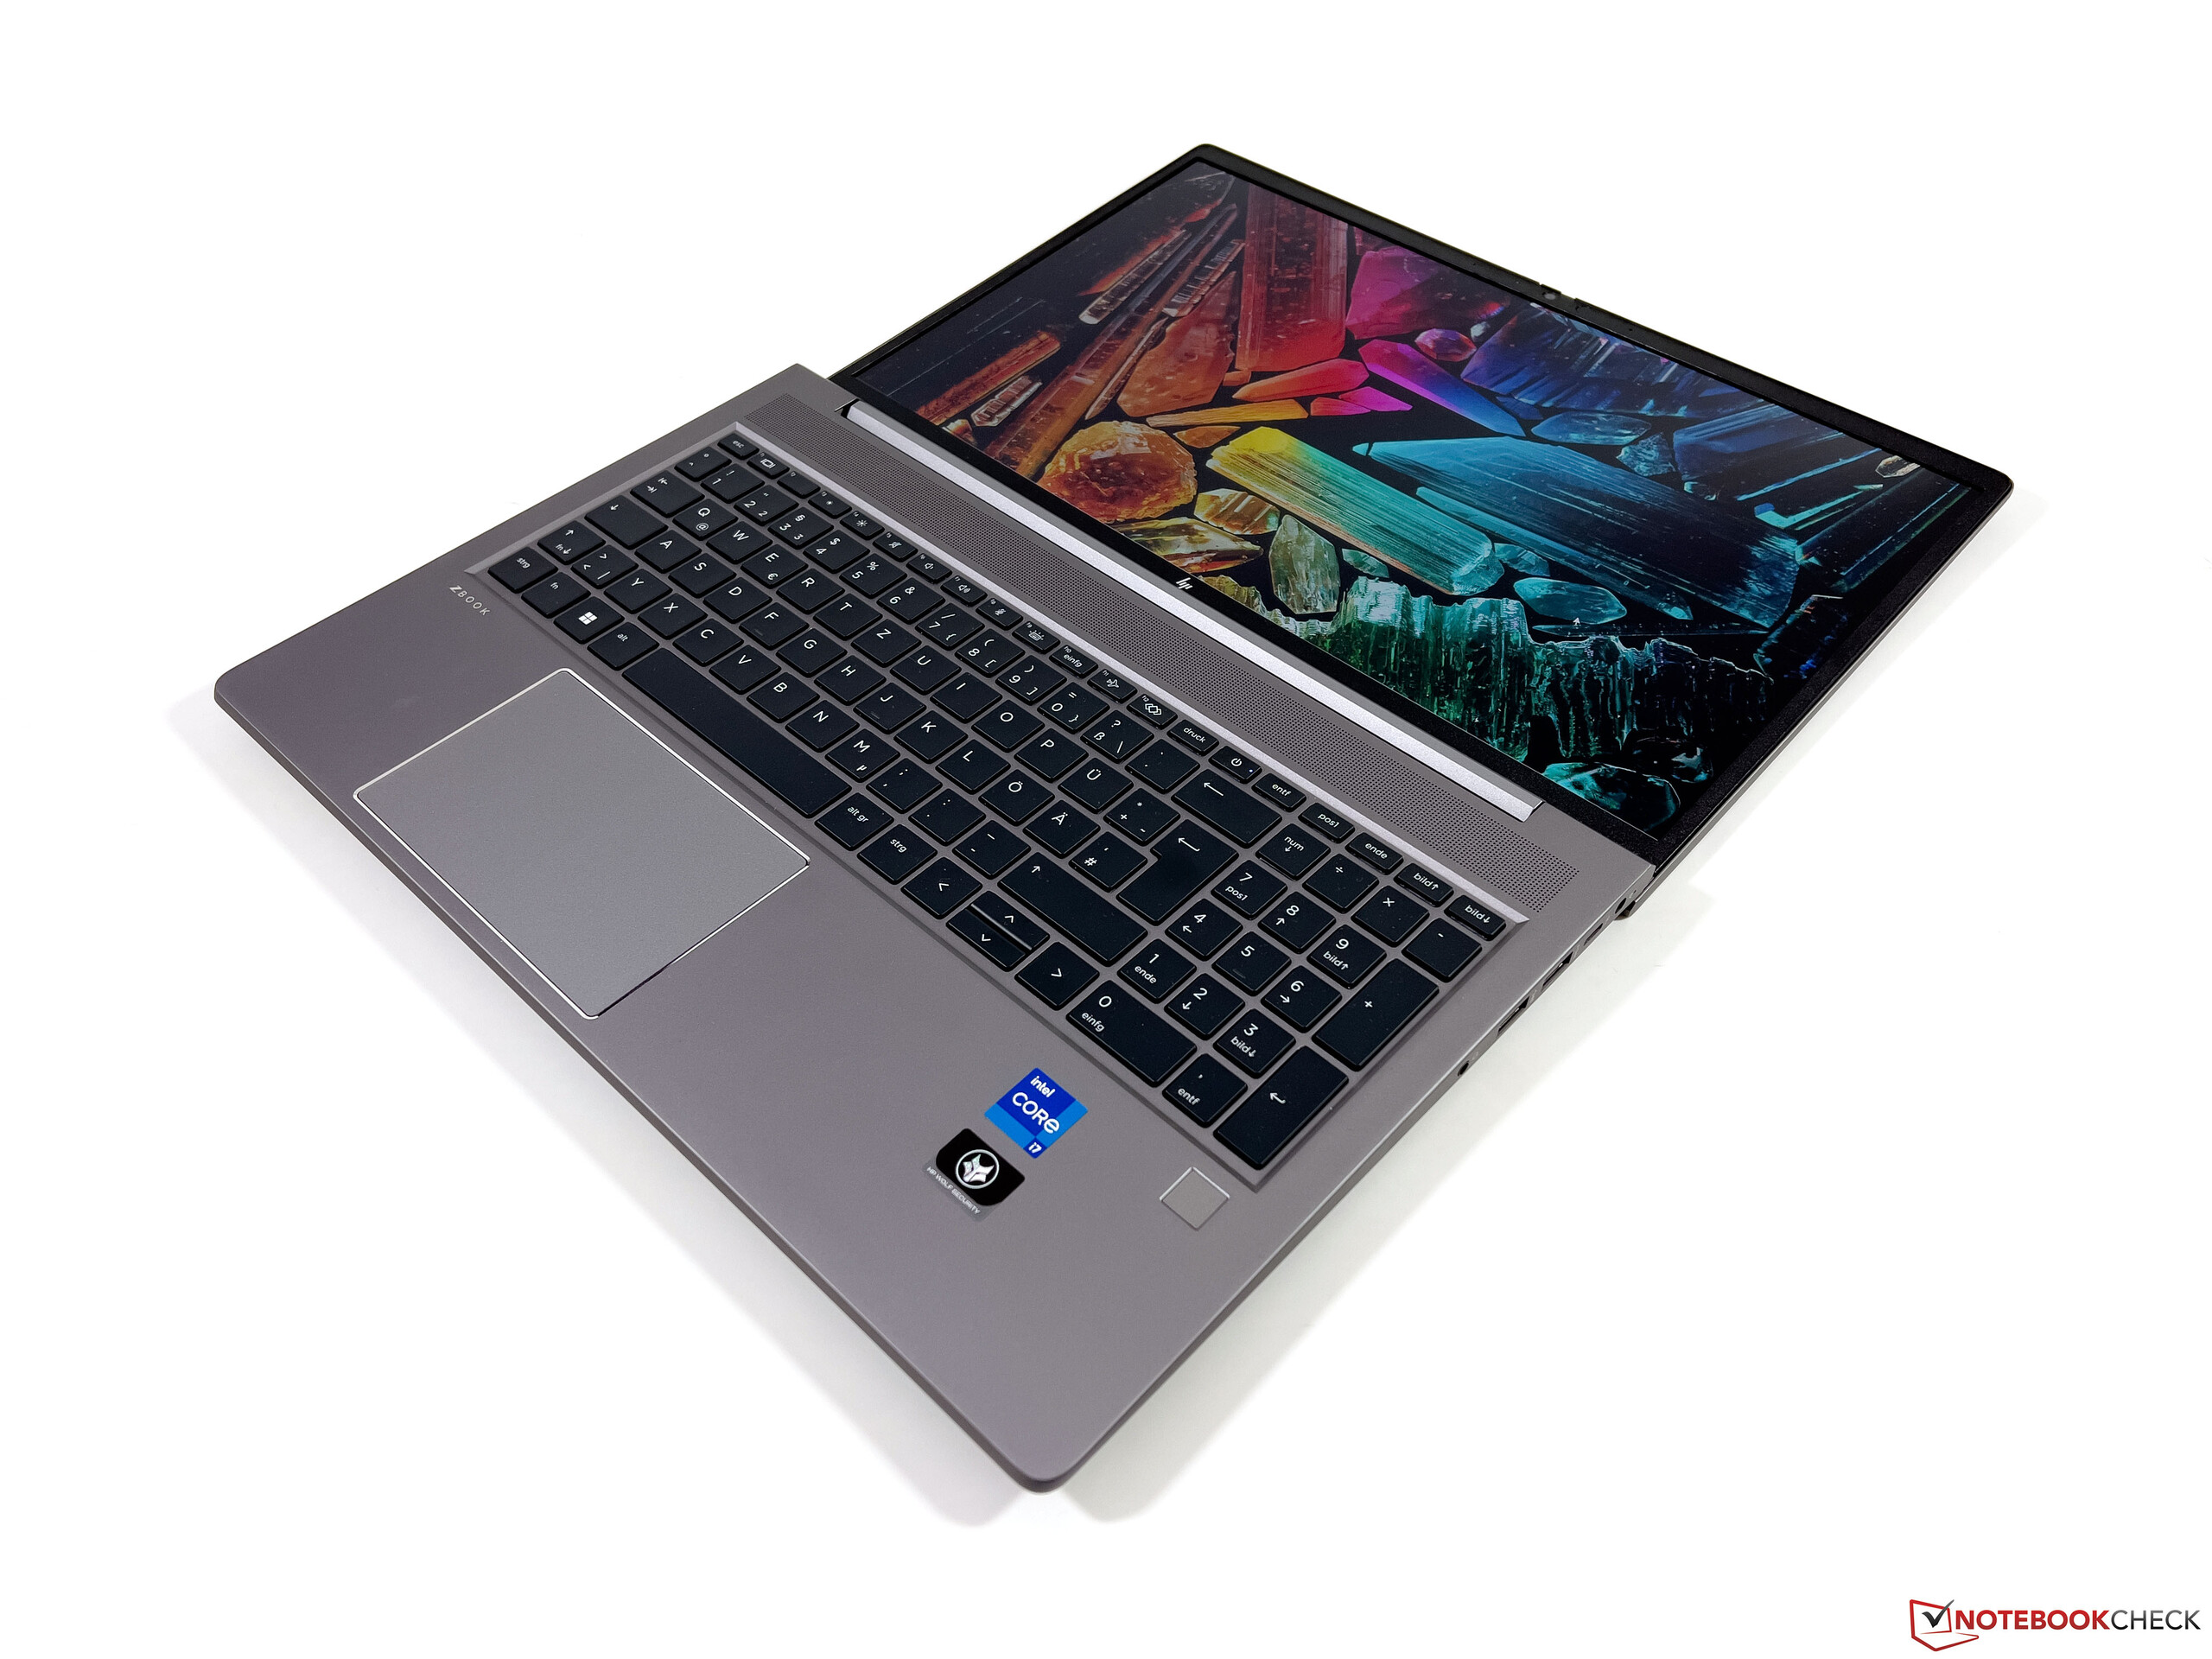
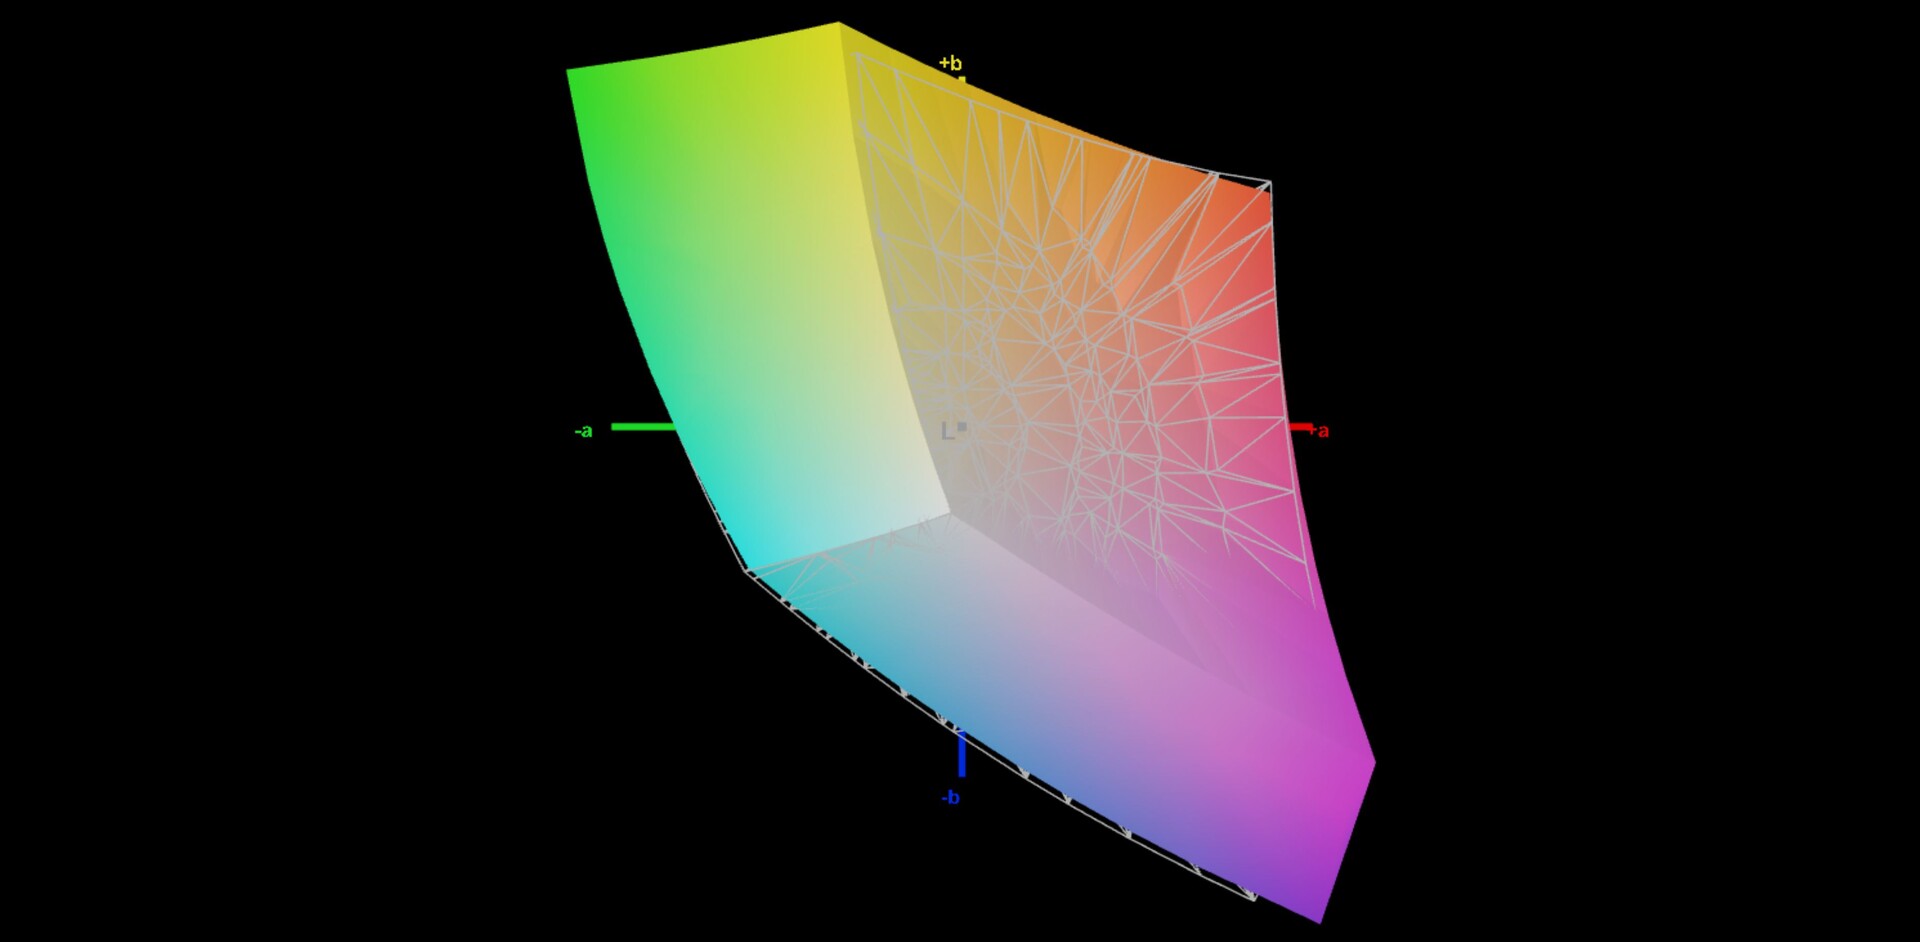
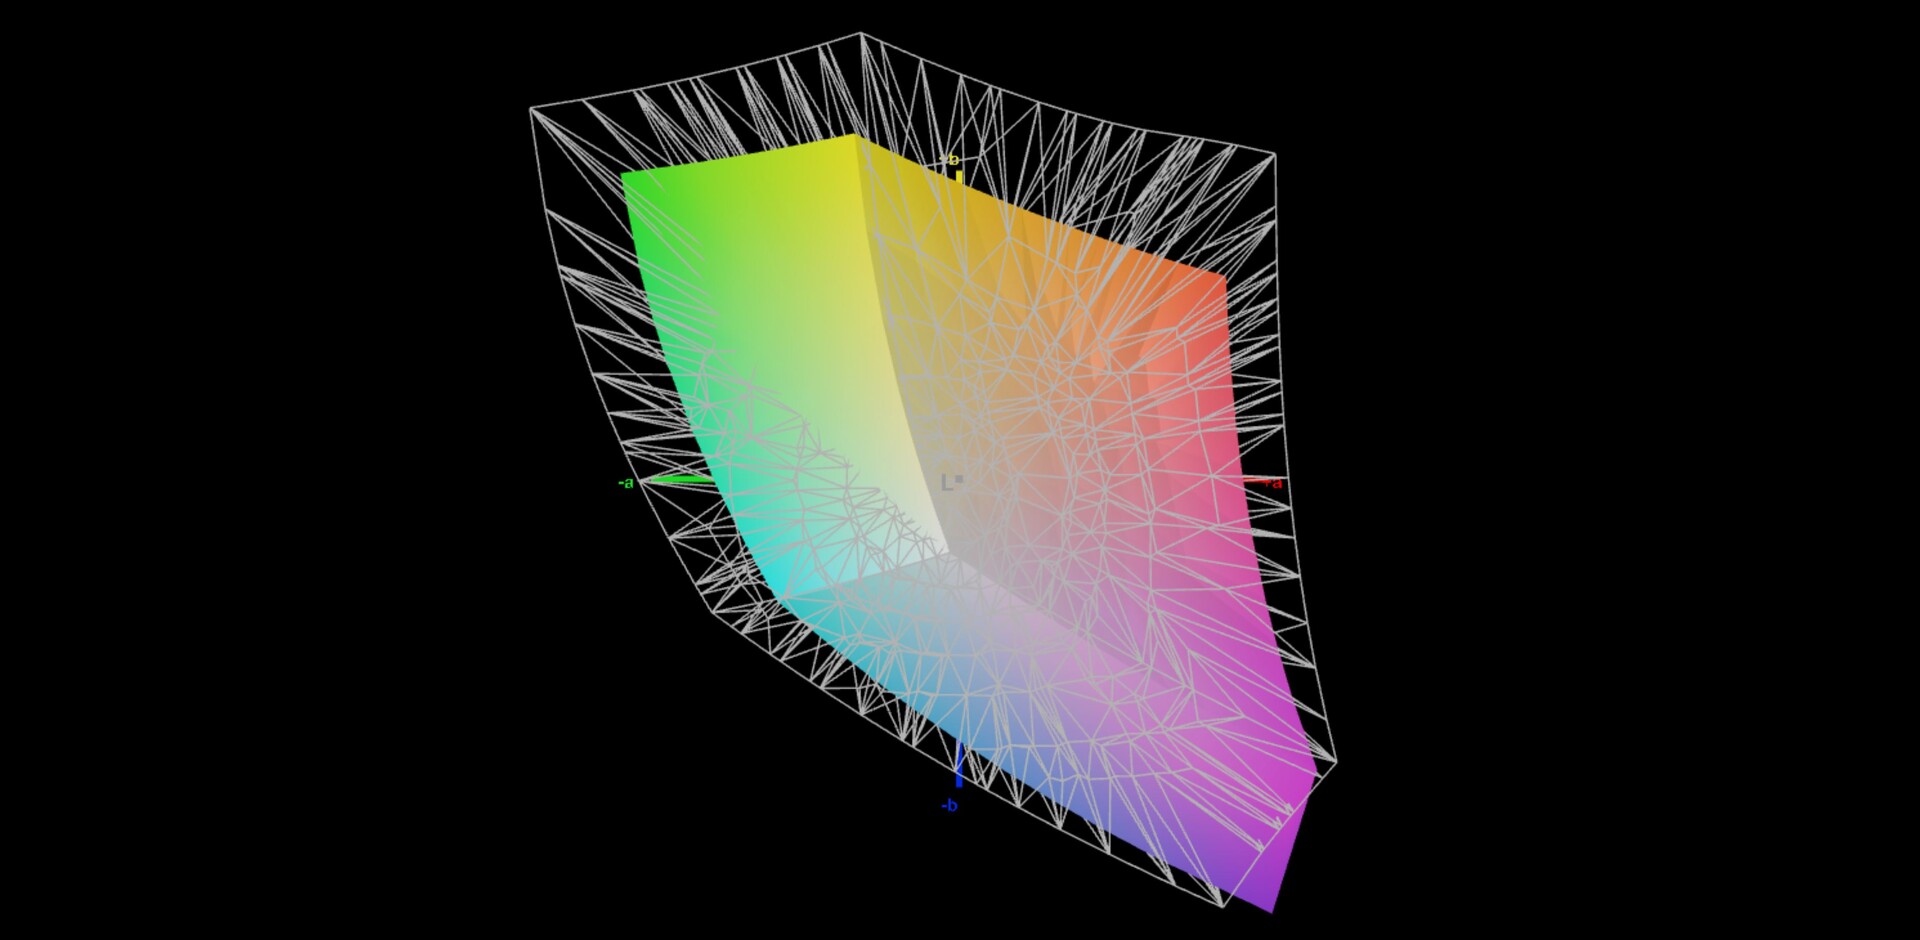
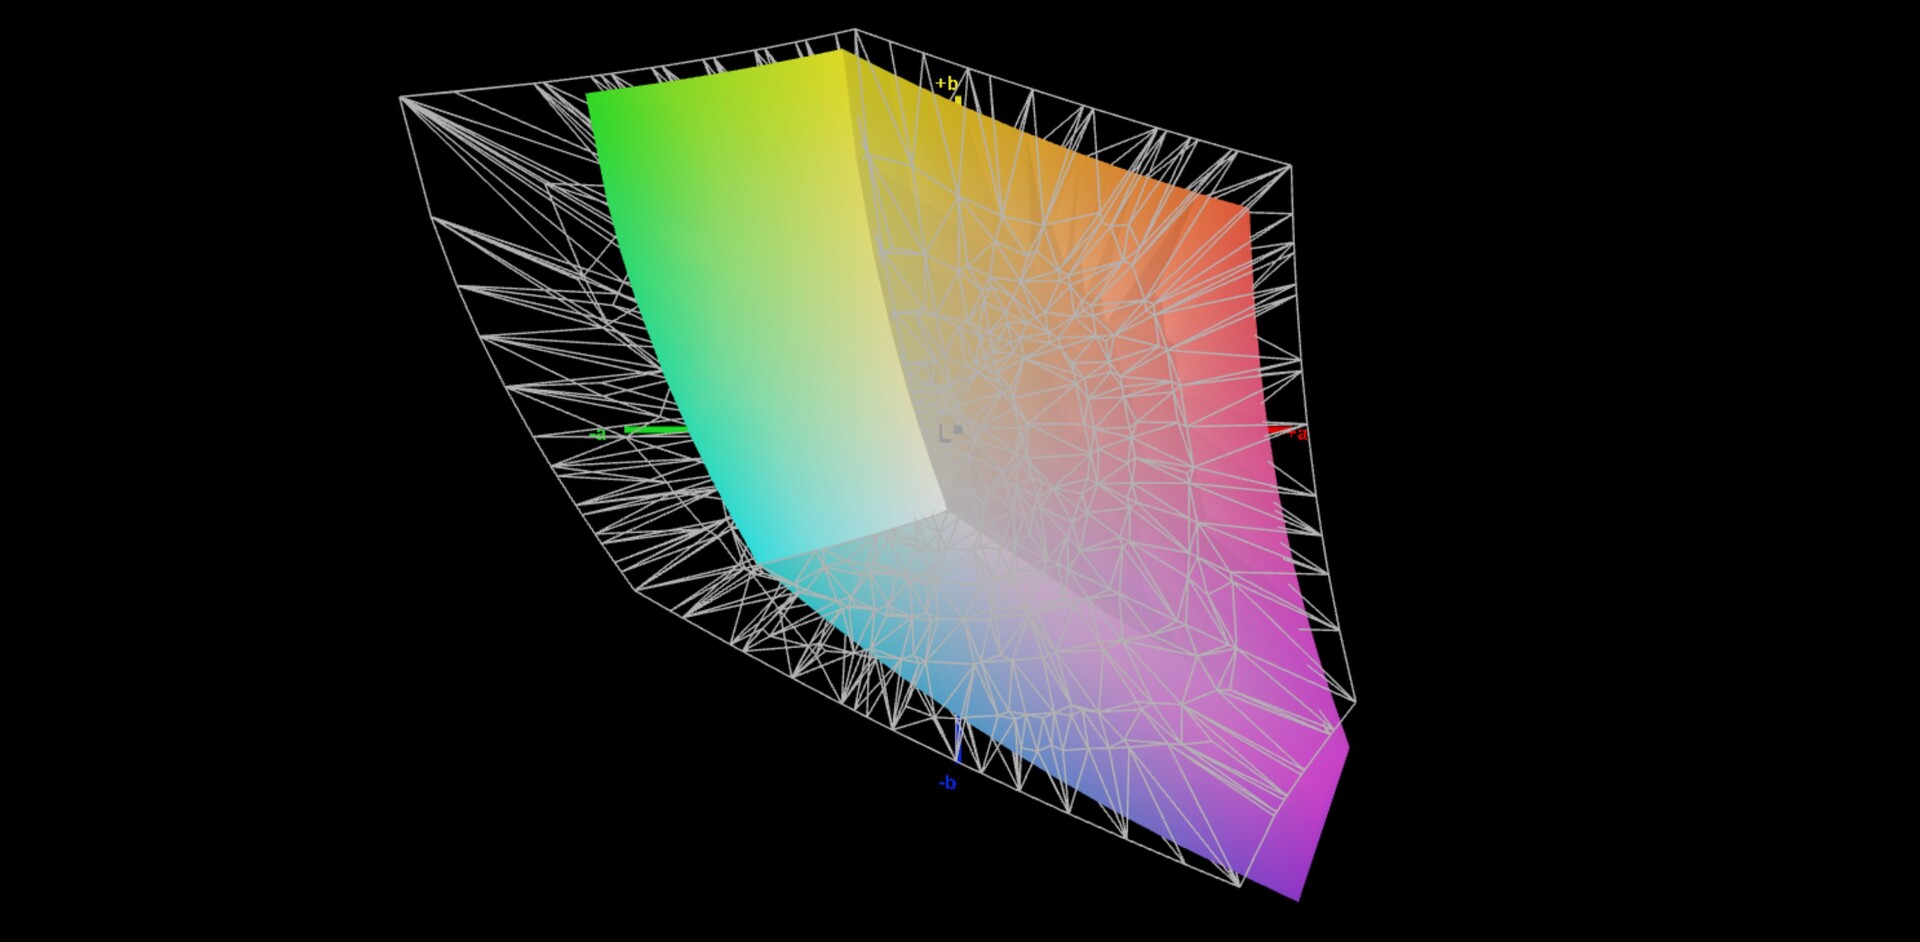
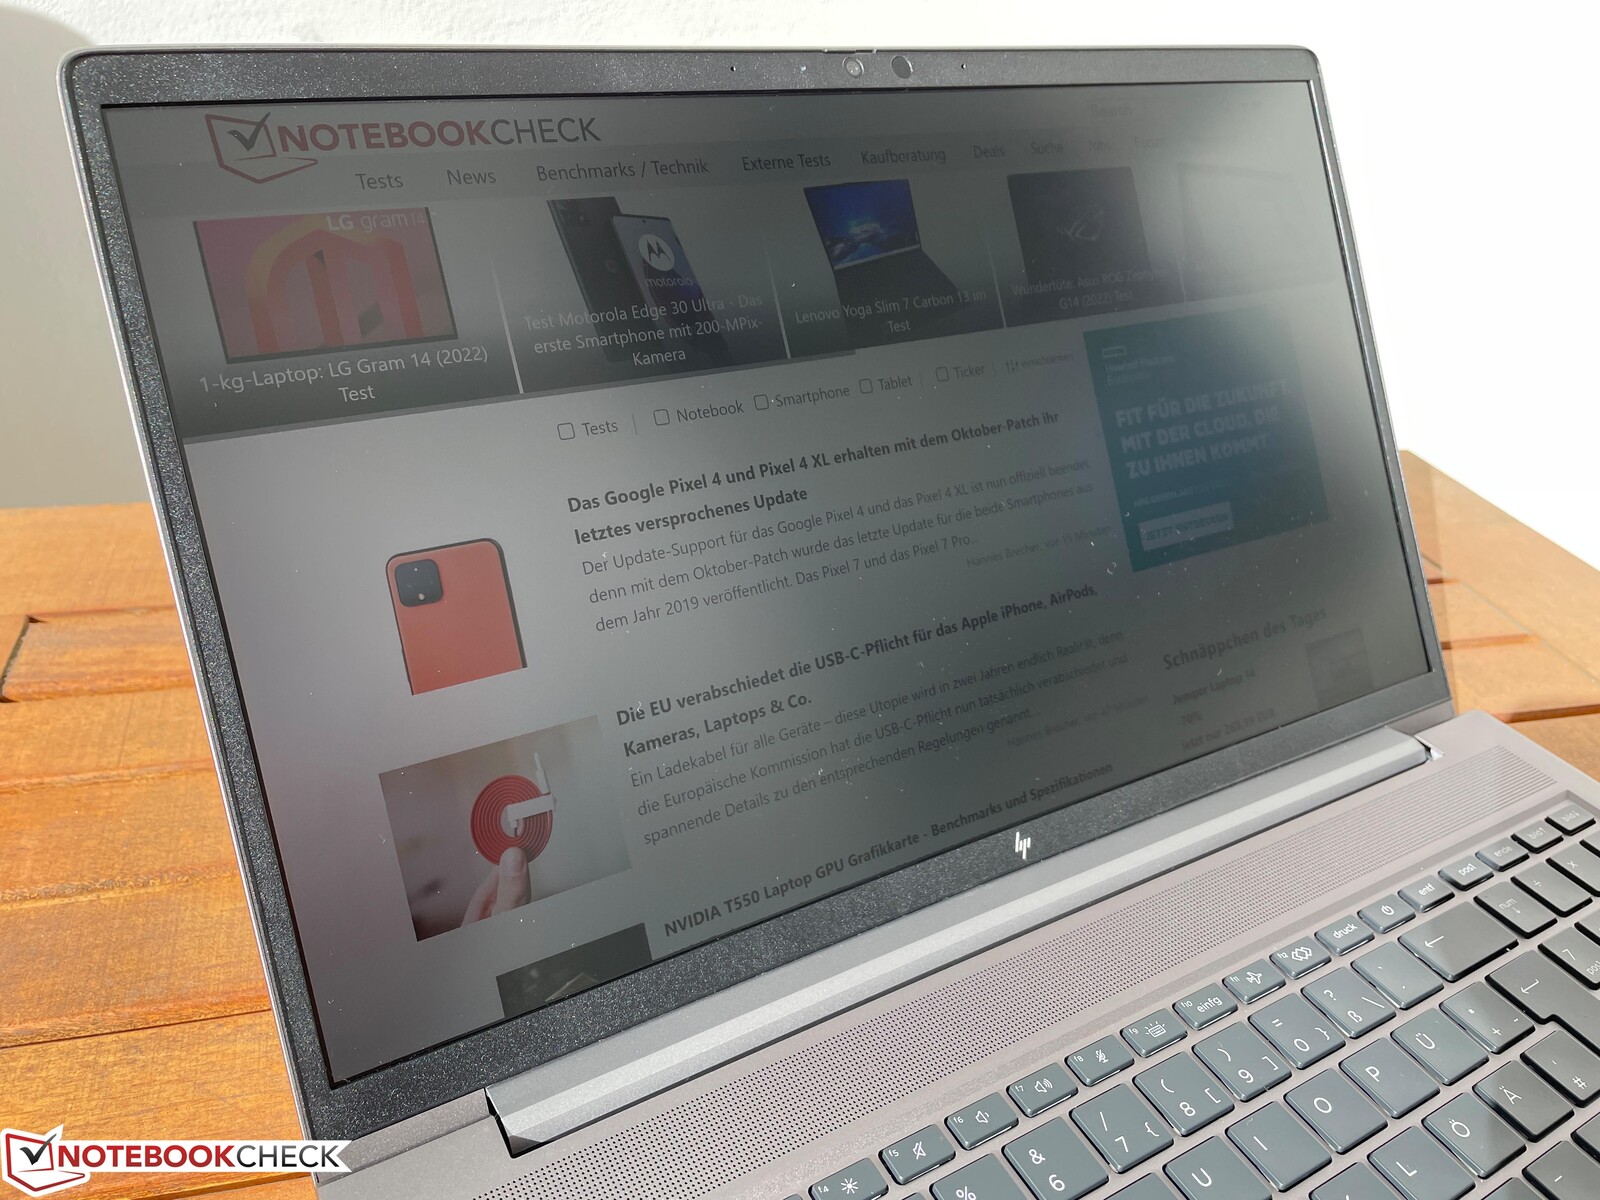
Affichage - IPS 4K avec couverture sRGB à 100%
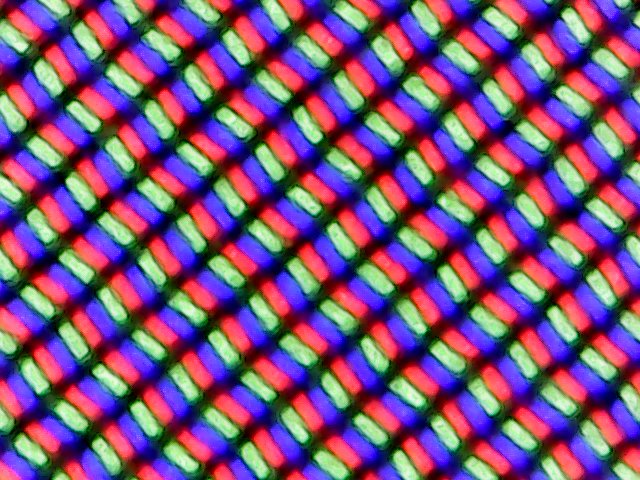
Nous avons déjà testé le panneau Full HD ordinaire avec le prédécesseurnotre configuration de test actuelle du ZBook Power G9 est équipée de l'écran IPS 4K à faible consommation en option. Comme dans le prédécesseur, celui-ci a toujours le format 16:9 (3.840 x 2.160 pixels). Subjectivement, la dalle LG-Philips produit une bonne qualité d'image, mais les contenus lumineux apparaissent légèrement granuleux sur la surface d'affichage mate. En outre, les temps de réponse ne sont pas particulièrement rapides, et nous constatons également dans la pratique quelques effets fantômes évidents, par exemple au niveau du pointeur de la souris.
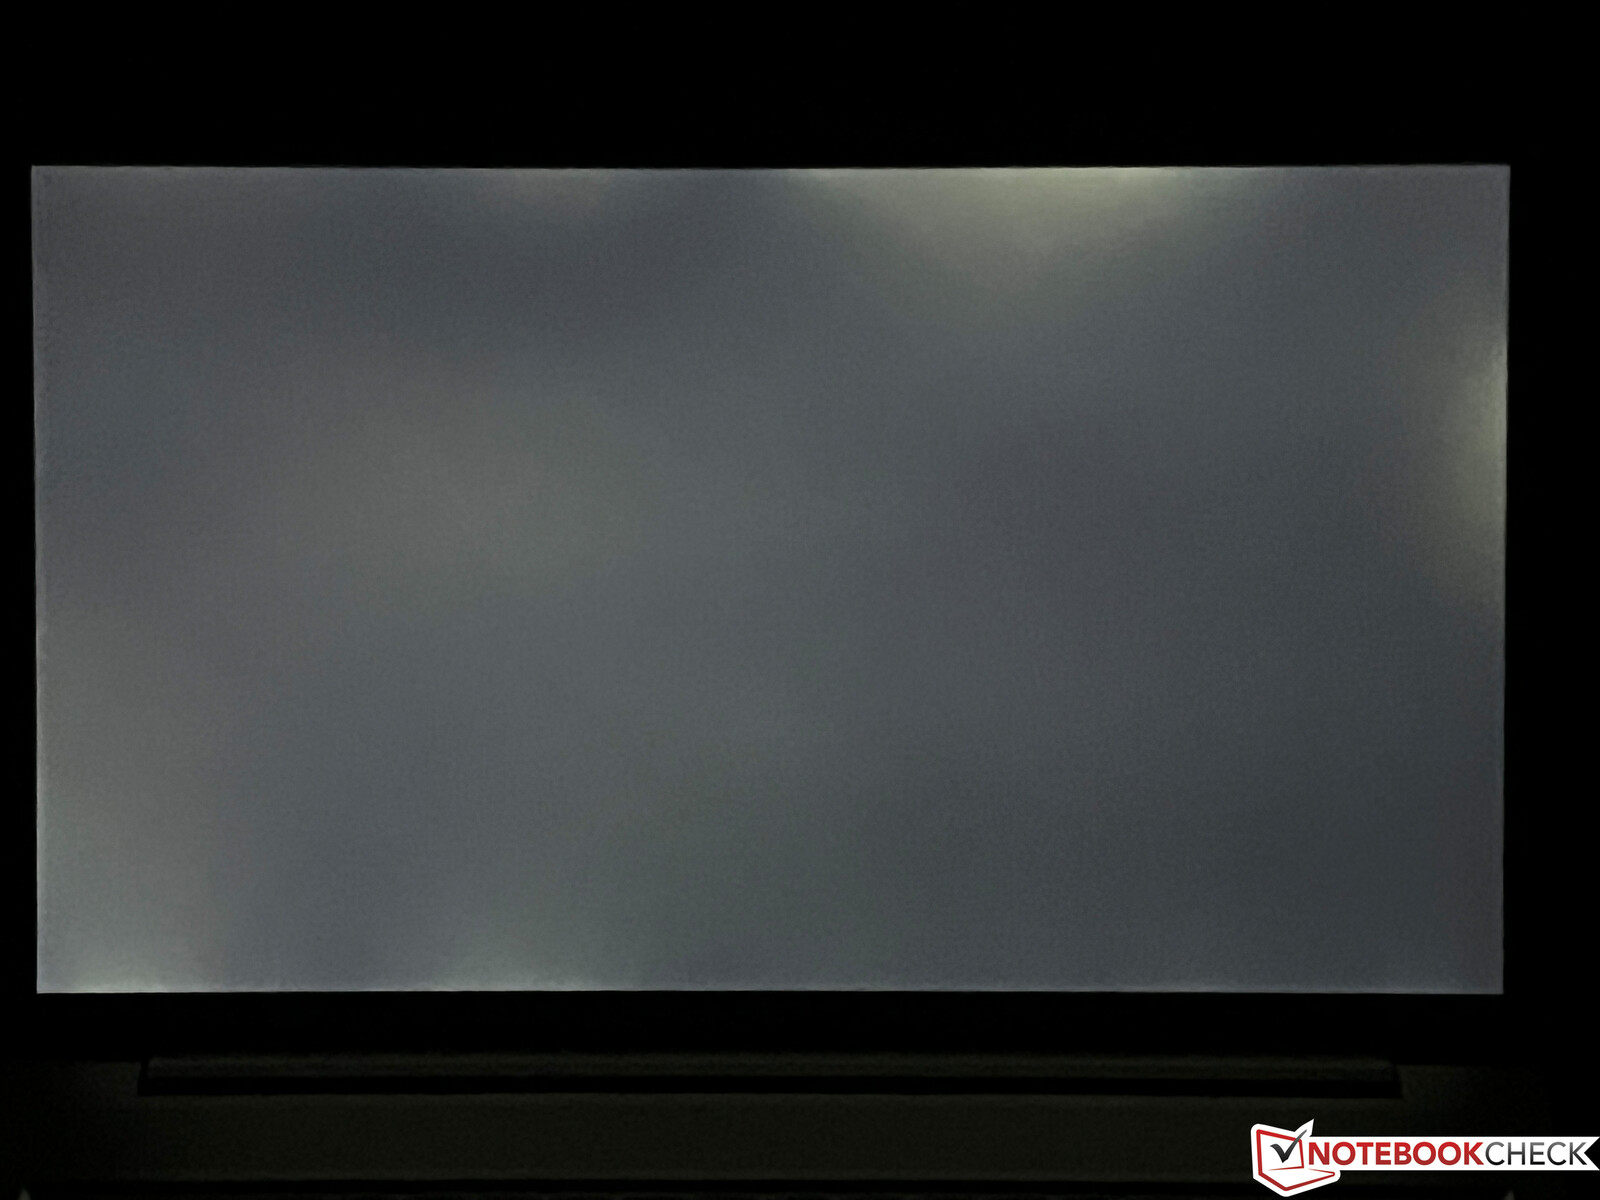
HP annonce une luminosité de 400 cd/m², et notre unité de test l'atteint également dans la fourchette haute. Dans le même temps, la valeur du noir est très faible à 0,15, ce qui conduit à un très bon rapport de contraste de plus de 2 500:1. En pleine luminosité et avec un arrière-plan sombre, il y a quelques halos lumineux perceptibles. Le PWM n'est pas utilisé.
| |||||||||||||||||||||||||
Homogénéité de la luminosité: 88 %
Valeur mesurée au centre, sur batterie: 391 cd/m²
Contraste: 2613:1 (Valeurs des noirs: 0.15 cd/m²)
ΔE ColorChecker Calman: 3.2 | ∀{0.5-29.43 Ø4.71}
calibrated: 1.2
ΔE Greyscale Calman: 4.9 | ∀{0.09-98 Ø4.96}
69.6% AdobeRGB 1998 (Argyll 3D)
97.7% sRGB (Argyll 3D)
69.1% Display P3 (Argyll 3D)
Gamma: 2.13
CCT: 5982 K
| HP ZBook Power 15 G9 6B8C4EA LGD073F, IPS, 3840x2160, 15.6" | HP ZBook Studio 16 G9 62U04EA BOE0A52, IPS, 3840x2400, 16" | Dell Precision 5000 5560 Sharp LQ156R1, IPS, 3840x2400, 15.6" | Lenovo ThinkPad P15v G2 21A9000XGE N156HCA-EAC, IPS LED, 1920x1080, 15.6" | HP ZBook Power 15 G8 313S5EA AUOA08B, IPS LED, 1920x1080, 15.6" | |
|---|---|---|---|---|---|
| Display | 22% | 28% | -35% | 2% | |
| Display P3 Coverage (%) | 69.1 | 97.5 41% | 94.9 37% | 43.7 -37% | 70.5 2% |
| sRGB Coverage (%) | 97.7 | 99.9 2% | 100 2% | 65.1 -33% | 99 1% |
| AdobeRGB 1998 Coverage (%) | 69.6 | 86.3 24% | 100 44% | 45.3 -35% | 71.3 2% |
| Response Times | 73% | -5% | -2% | -33% | |
| Response Time Grey 50% / Grey 80% * (ms) | 45.8 ? | 15.3 ? 67% | 47.2 ? -3% | 48 ? -5% | 61 -33% |
| Response Time Black / White * (ms) | 28.6 ? | 6.1 ? 79% | 30.4 ? -6% | 28 ? 2% | 38 ? -33% |
| PWM Frequency (Hz) | |||||
| Screen | 6% | -21% | -87% | 3% | |
| Brightness middle (cd/m²) | 392 | 554 41% | 501.5 28% | 305 -22% | 393 0% |
| Brightness (cd/m²) | 388 | 516 33% | 467 20% | 281 -28% | 385 -1% |
| Brightness Distribution (%) | 88 | 84 -5% | 83 -6% | 88 0% | 78 -11% |
| Black Level * (cd/m²) | 0.15 | 0.47 -213% | 0.44 -193% | 0.32 -113% | 0.25 -67% |
| Contrast (:1) | 2613 | 1179 -55% | 1140 -56% | 953 -64% | 1572 -40% |
| Colorchecker dE 2000 * | 3.2 | 1 69% | 4.73 -48% | 5.9 -84% | 1.5 53% |
| Colorchecker dE 2000 max. * | 7 | 2.4 66% | 8.45 -21% | 20.1 -187% | 4.3 39% |
| Colorchecker dE 2000 calibrated * | 1.2 | 0.6 50% | 0.51 57% | 4.5 -275% | 1.4 -17% |
| Greyscale dE 2000 * | 4.9 | 1.6 67% | 3.6 27% | 5.3 -8% | 1.3 73% |
| Gamma | 2.13 103% | 2.29 96% | 2.08 106% | 2.1 105% | 2.26 97% |
| CCT | 5982 109% | 6458 101% | 6447 101% | 6307 103% | 6435 101% |
| Moyenne finale (programmes/paramètres) | 34% /
19% | 1% /
-8% | -41% /
-64% | -9% /
-2% |
* ... Moindre est la valeur, meilleures sont les performances
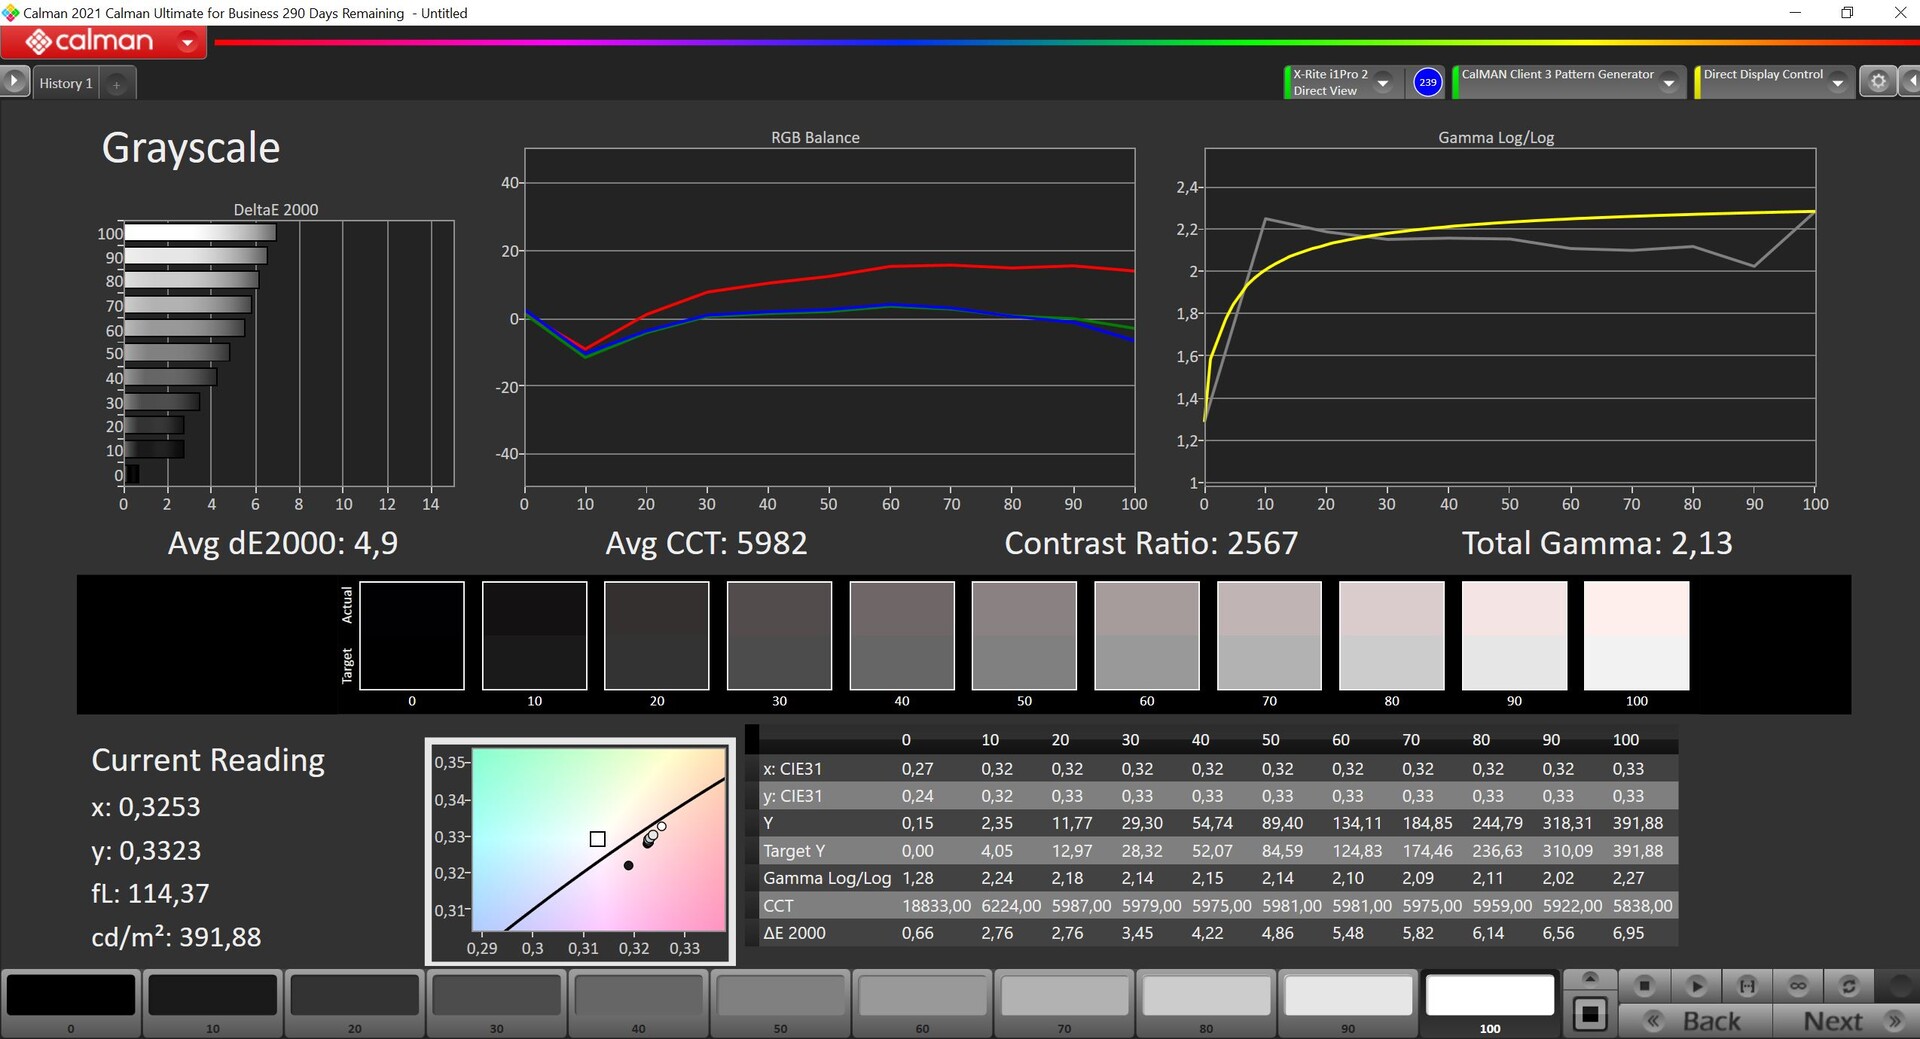
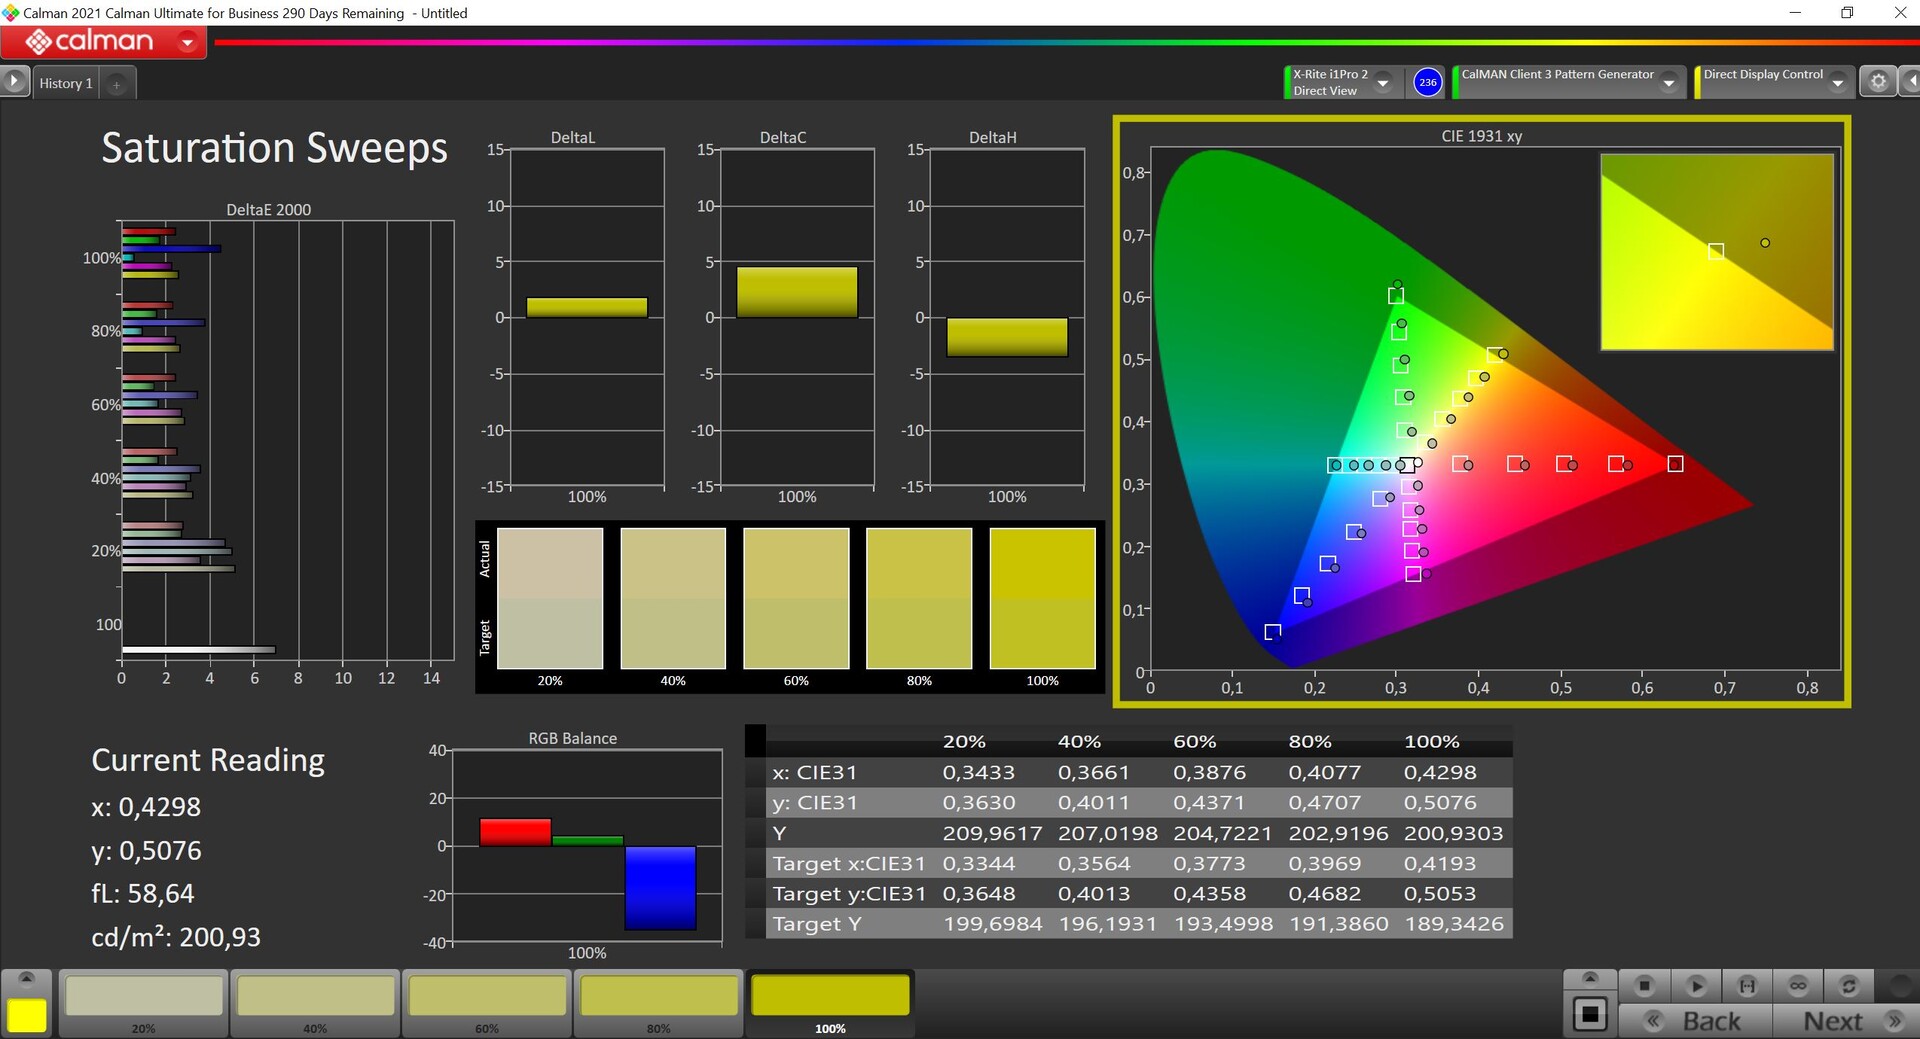
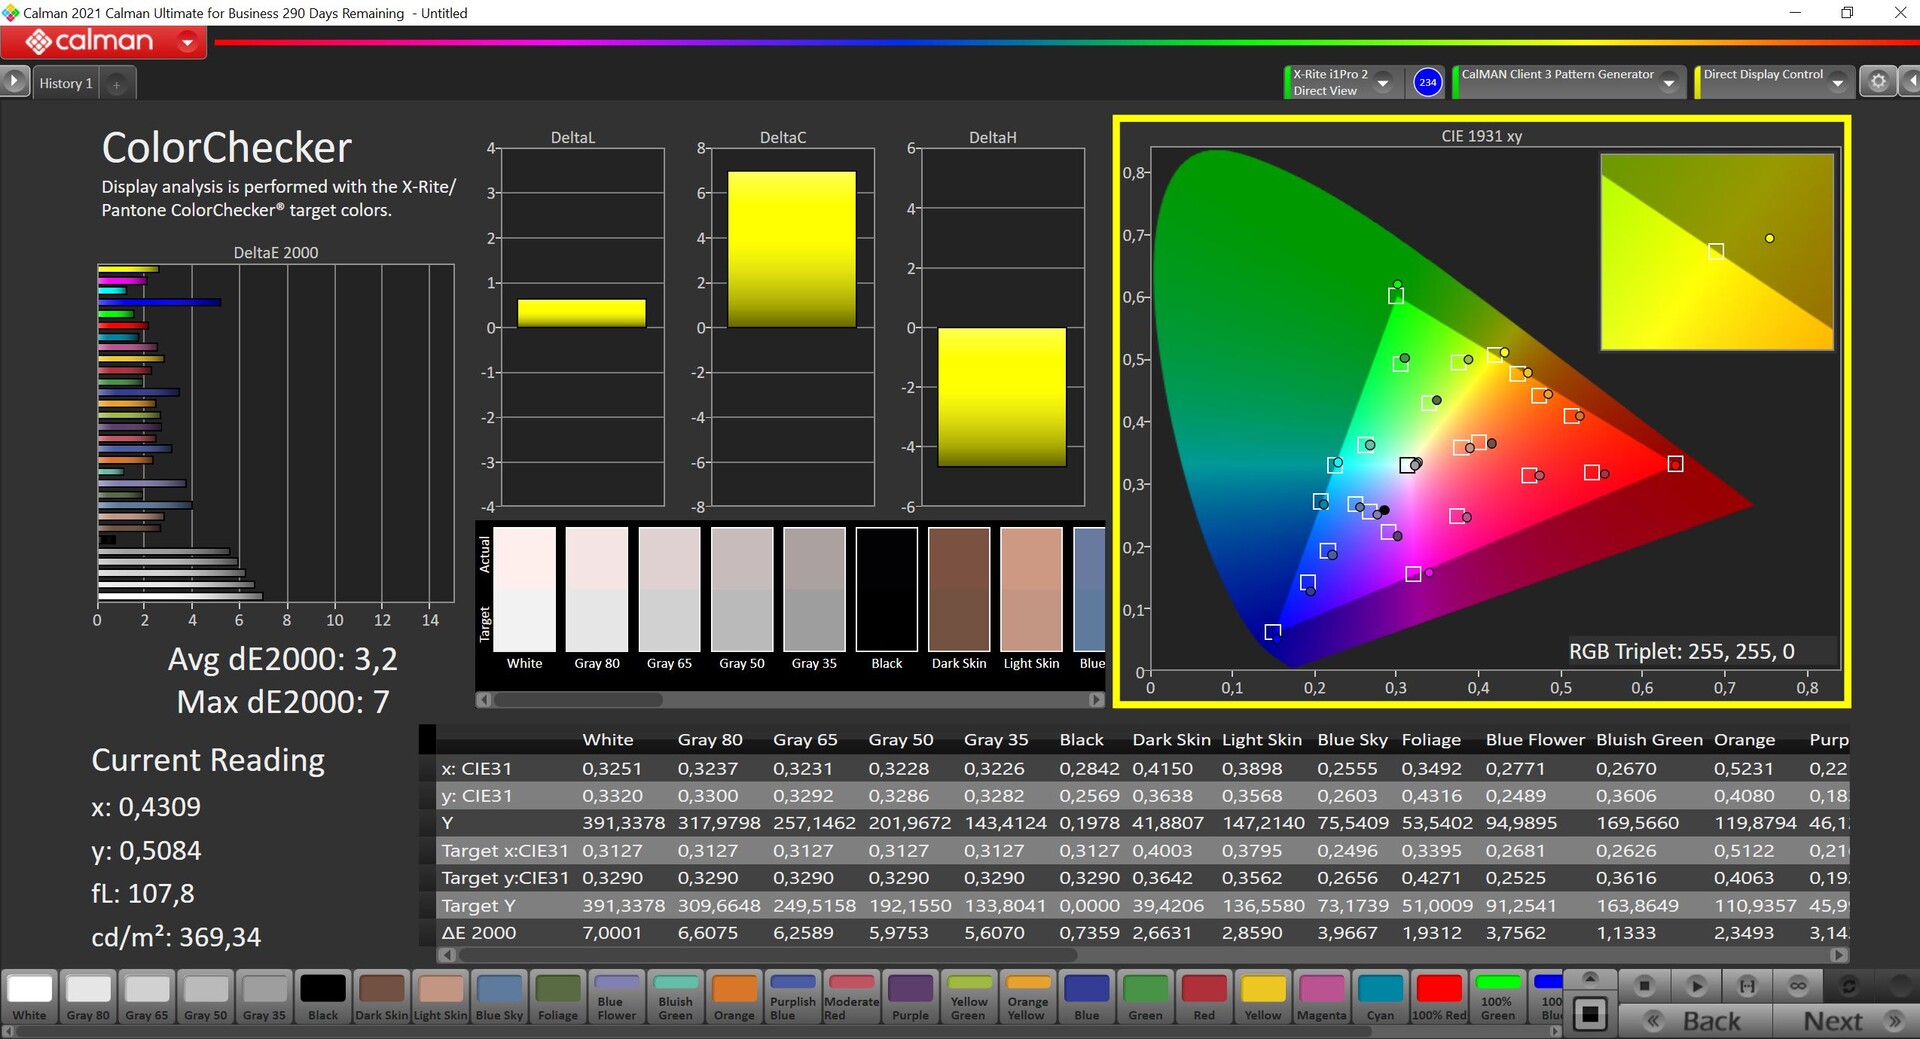
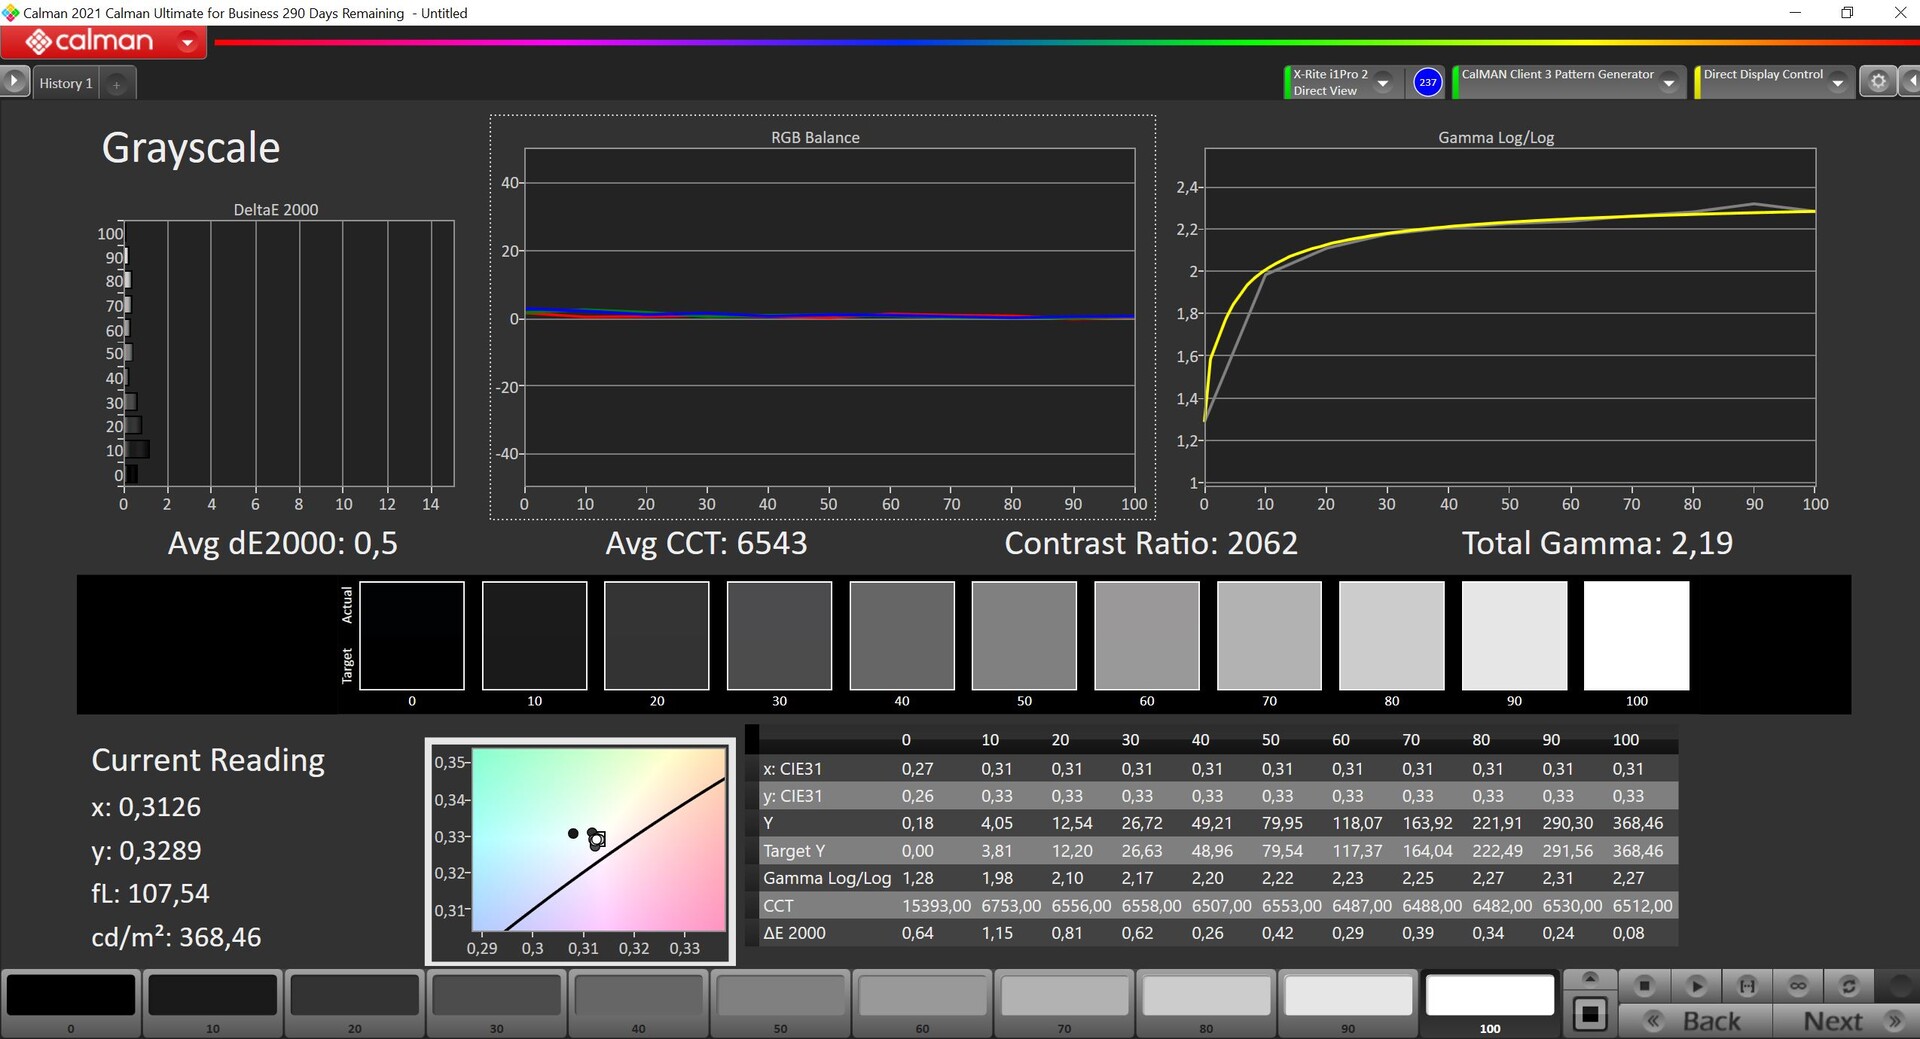
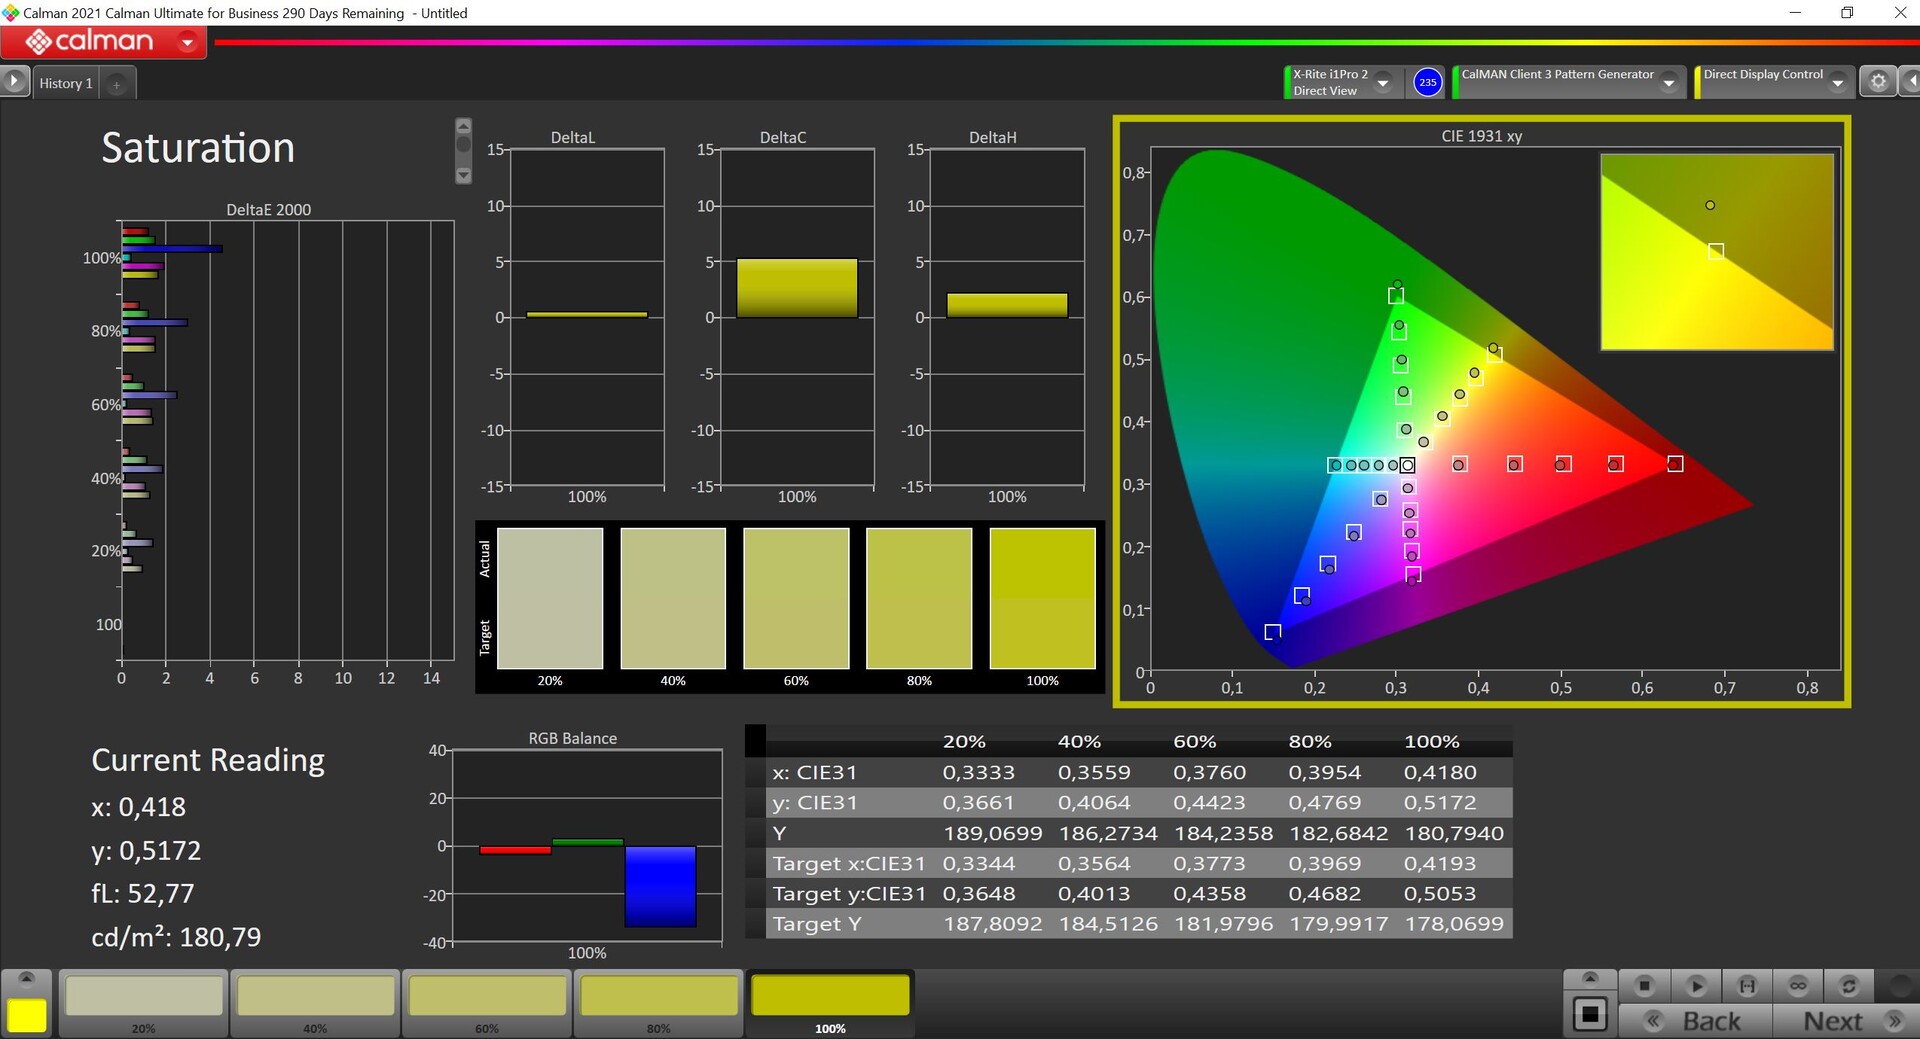
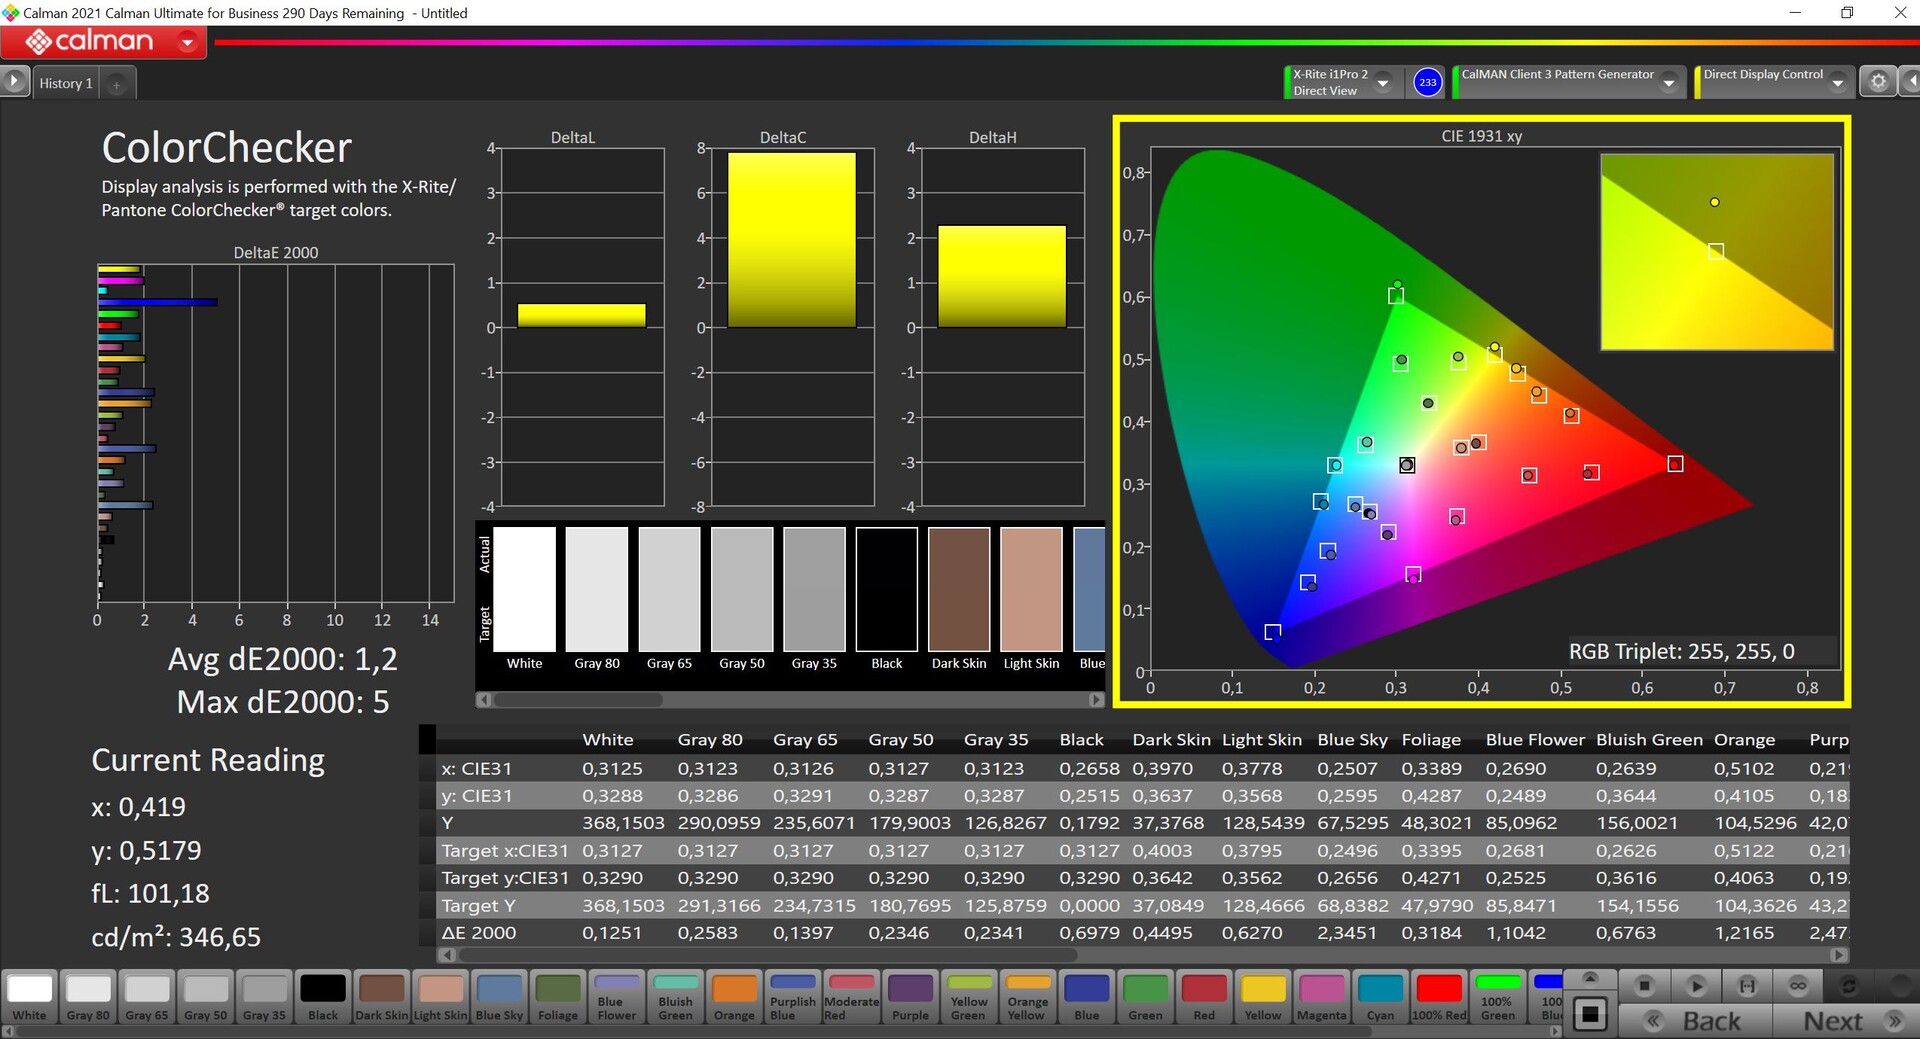
Nous mesurons le panneau avec le logiciel professionnel CalMAN. Dans l'état de livraison, il y a une teinte rouge clairement visible, et la température de couleur est également trop chaude. C'est regrettable, car nous sommes en mesure d'améliorer considérablement l'affichage avec notre propre calibration (profil de couleur disponible pour un téléchargement gratuit à partir du lien ci-dessus), qui conduit à d'excellents résultats en particulier dans l'échelle de gris et se débarrasse complètement de la teinte de couleur. Les écarts de couleur par rapport à l'espace colorimétrique de référence sRGB (qui est entièrement couvert) sont également légèrement inférieurs, ne laissant que le bleu à 100% comme aberration. Cependant, le panneau calibré est toujours adapté au traitement des images.
Temps de réponse de l'écran
| ↔ Temps de réponse noir à blanc | ||
|---|---|---|
| 28.6 ms ... hausse ↗ et chute ↘ combinées | ↗ 14.5 ms hausse | 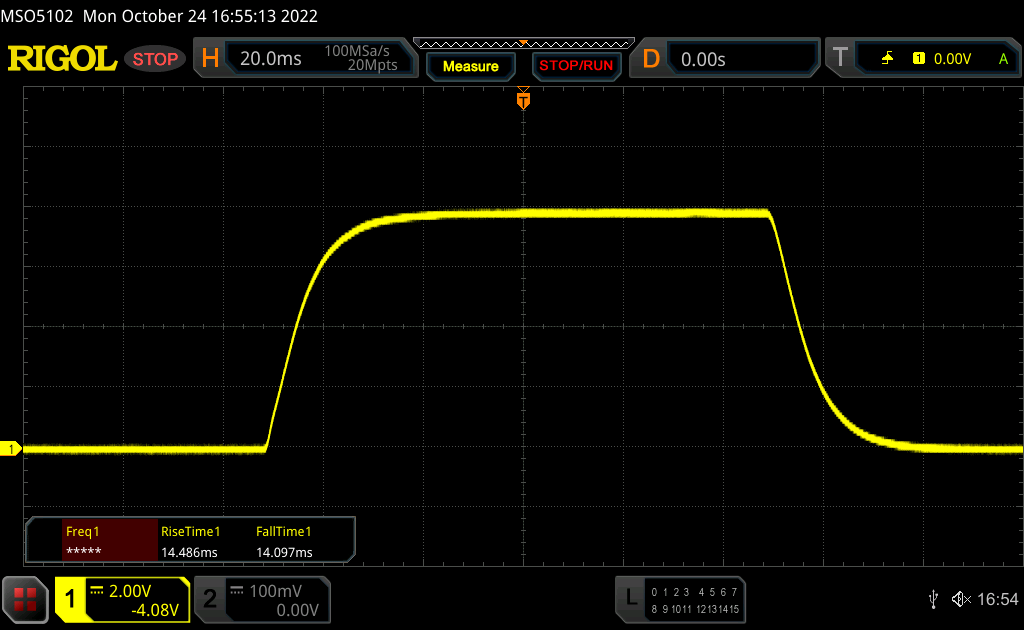 |
| ↘ 14.1 ms chute | ||
| L'écran souffre de latences relativement élevées, insuffisant pour le jeu. En comparaison, tous les appareils testés affichent entre 0.1 (minimum) et 240 (maximum) ms. » 76 % des appareils testés affichent de meilleures performances. Cela signifie que les latences relevées sont moins bonnes que la moyenne (19.8 ms) de tous les appareils testés. | ||
| ↔ Temps de réponse gris 50% à gris 80% | ||
| 45.8 ms ... hausse ↗ et chute ↘ combinées | ↗ 21.2 ms hausse | 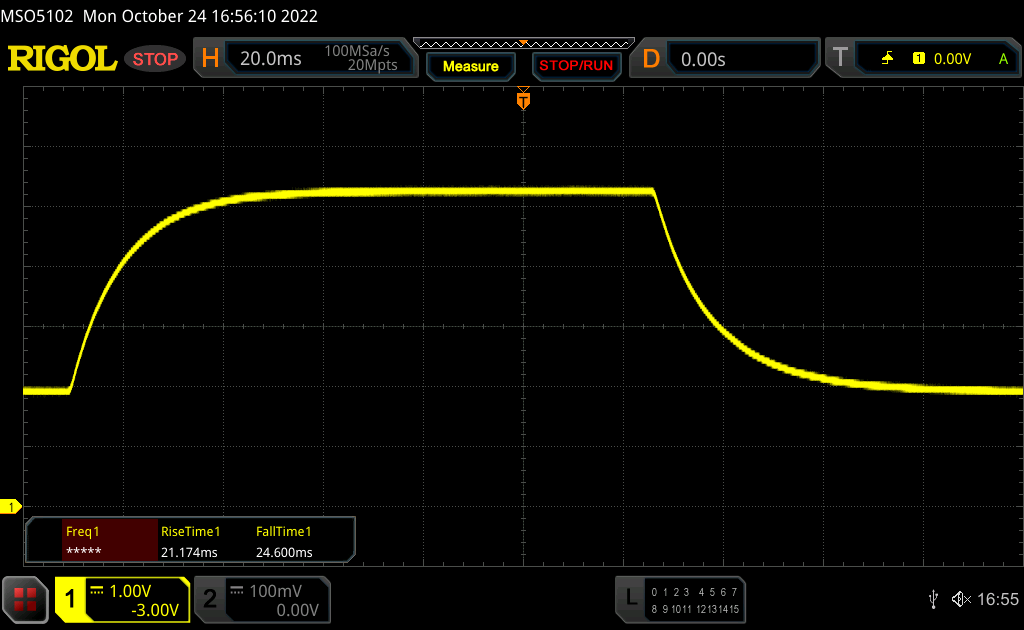 |
| ↘ 24.6 ms chute | ||
| L'écran souffre de latences très élevées, à éviter pour le jeu. En comparaison, tous les appareils testés affichent entre 0.165 (minimum) et 636 (maximum) ms. » 79 % des appareils testés affichent de meilleures performances. Cela signifie que les latences relevées sont moins bonnes que la moyenne (31 ms) de tous les appareils testés. | ||
Scintillement / MLI (Modulation de largeur d'impulsion)
| Scintillement / MLI (Modulation de largeur d'impulsion) non décelé |  | ||
En comparaison, 52 % des appareils testés n'emploient pas MDI pour assombrir leur écran. Nous avons relevé une moyenne à 7757 (minimum : 5 - maximum : 343500) Hz dans le cas où une MDI était active. | |||
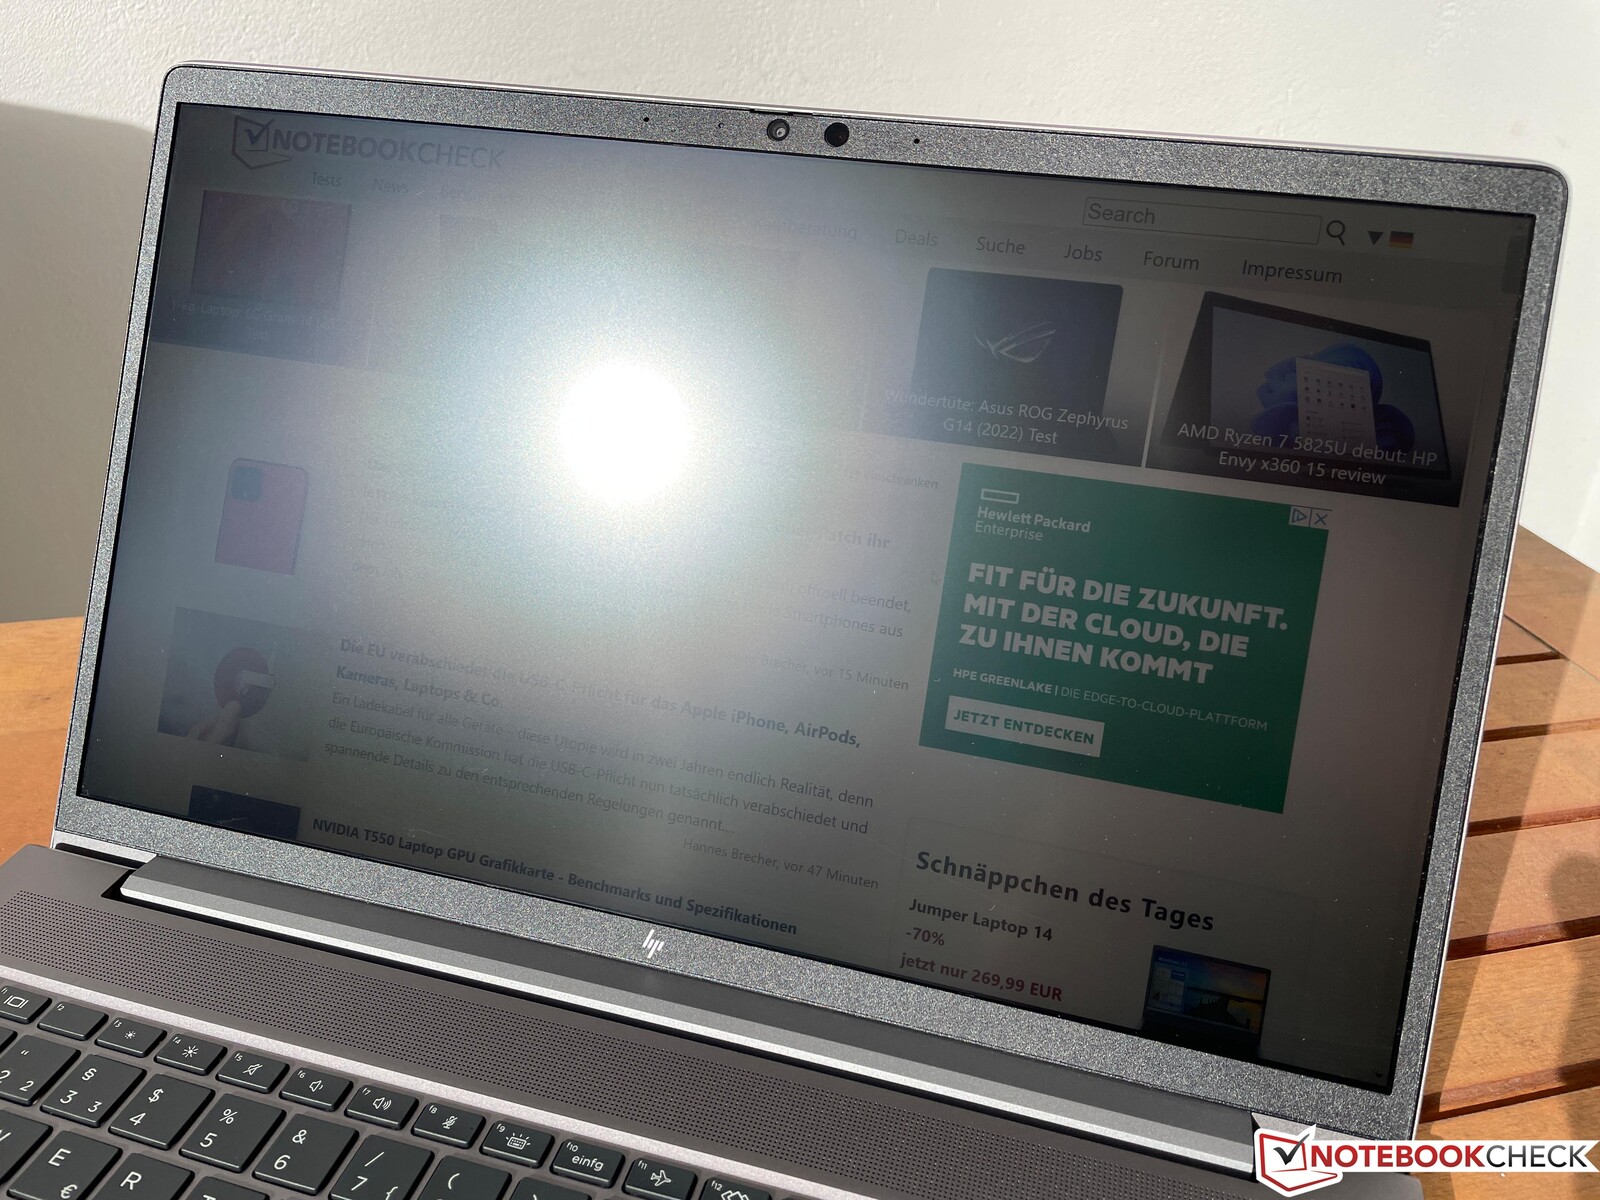
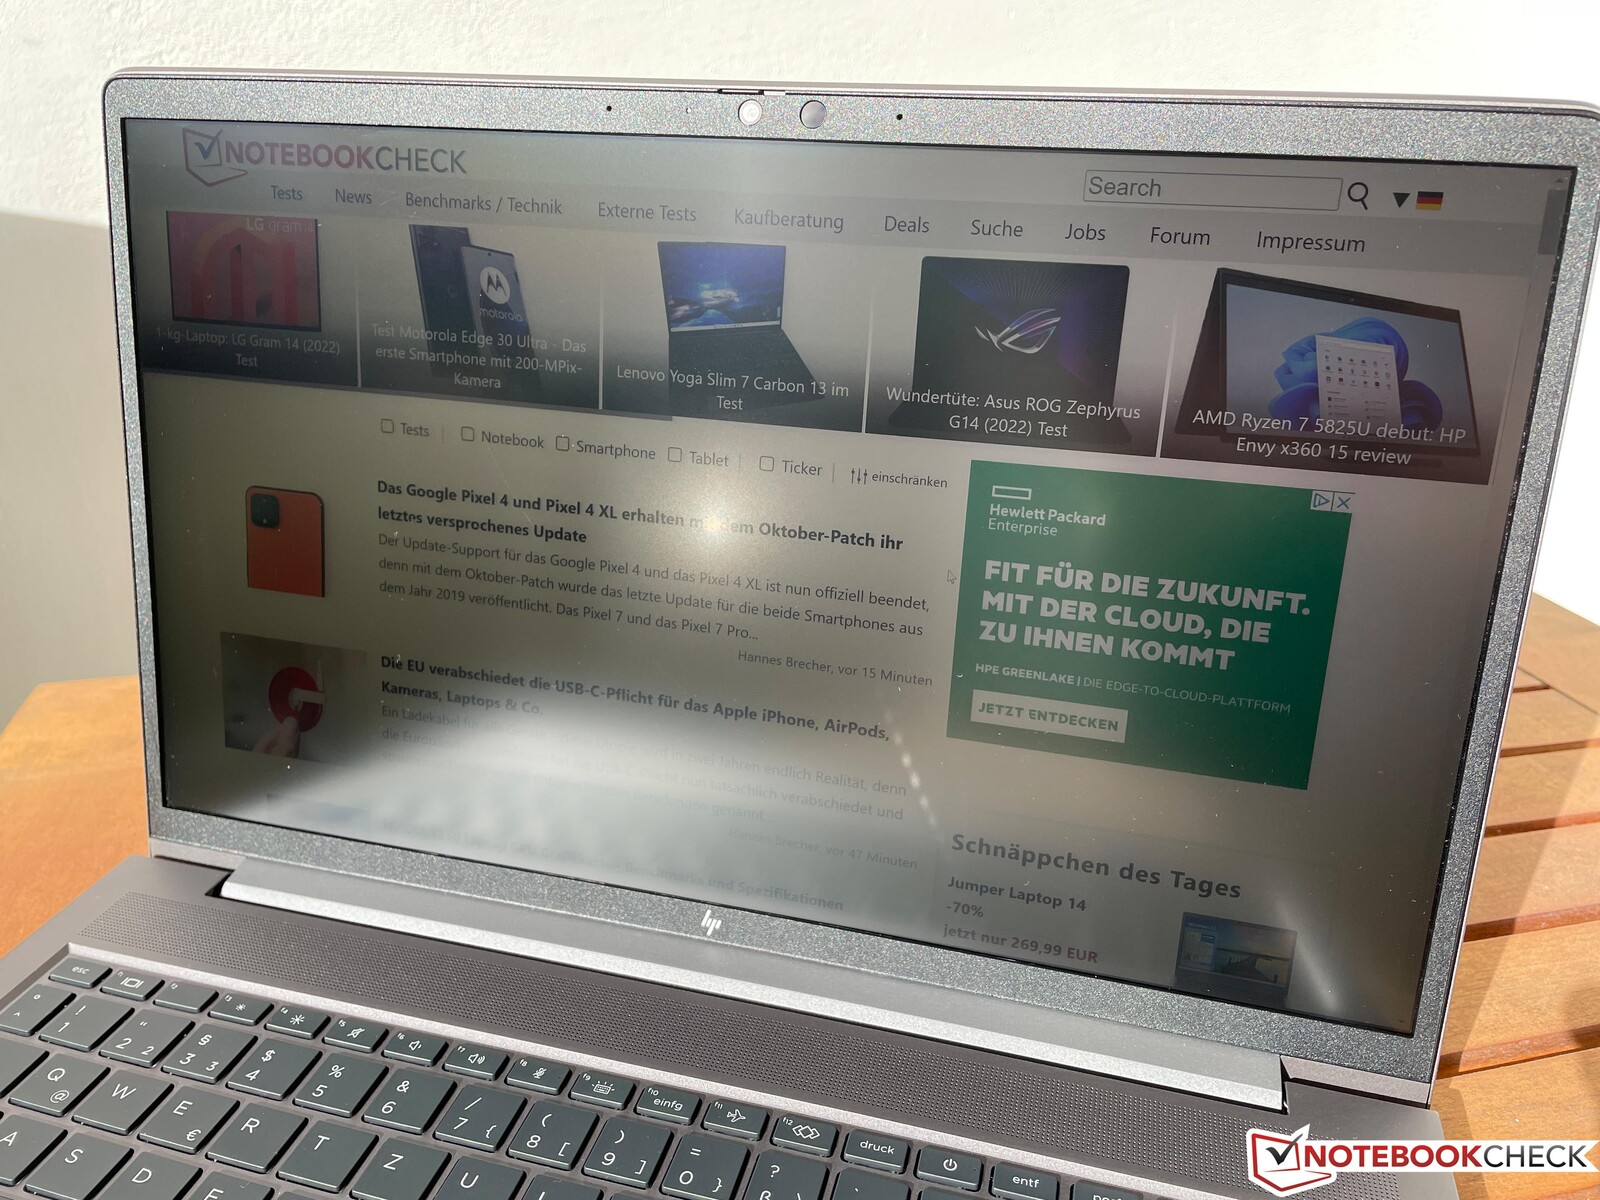
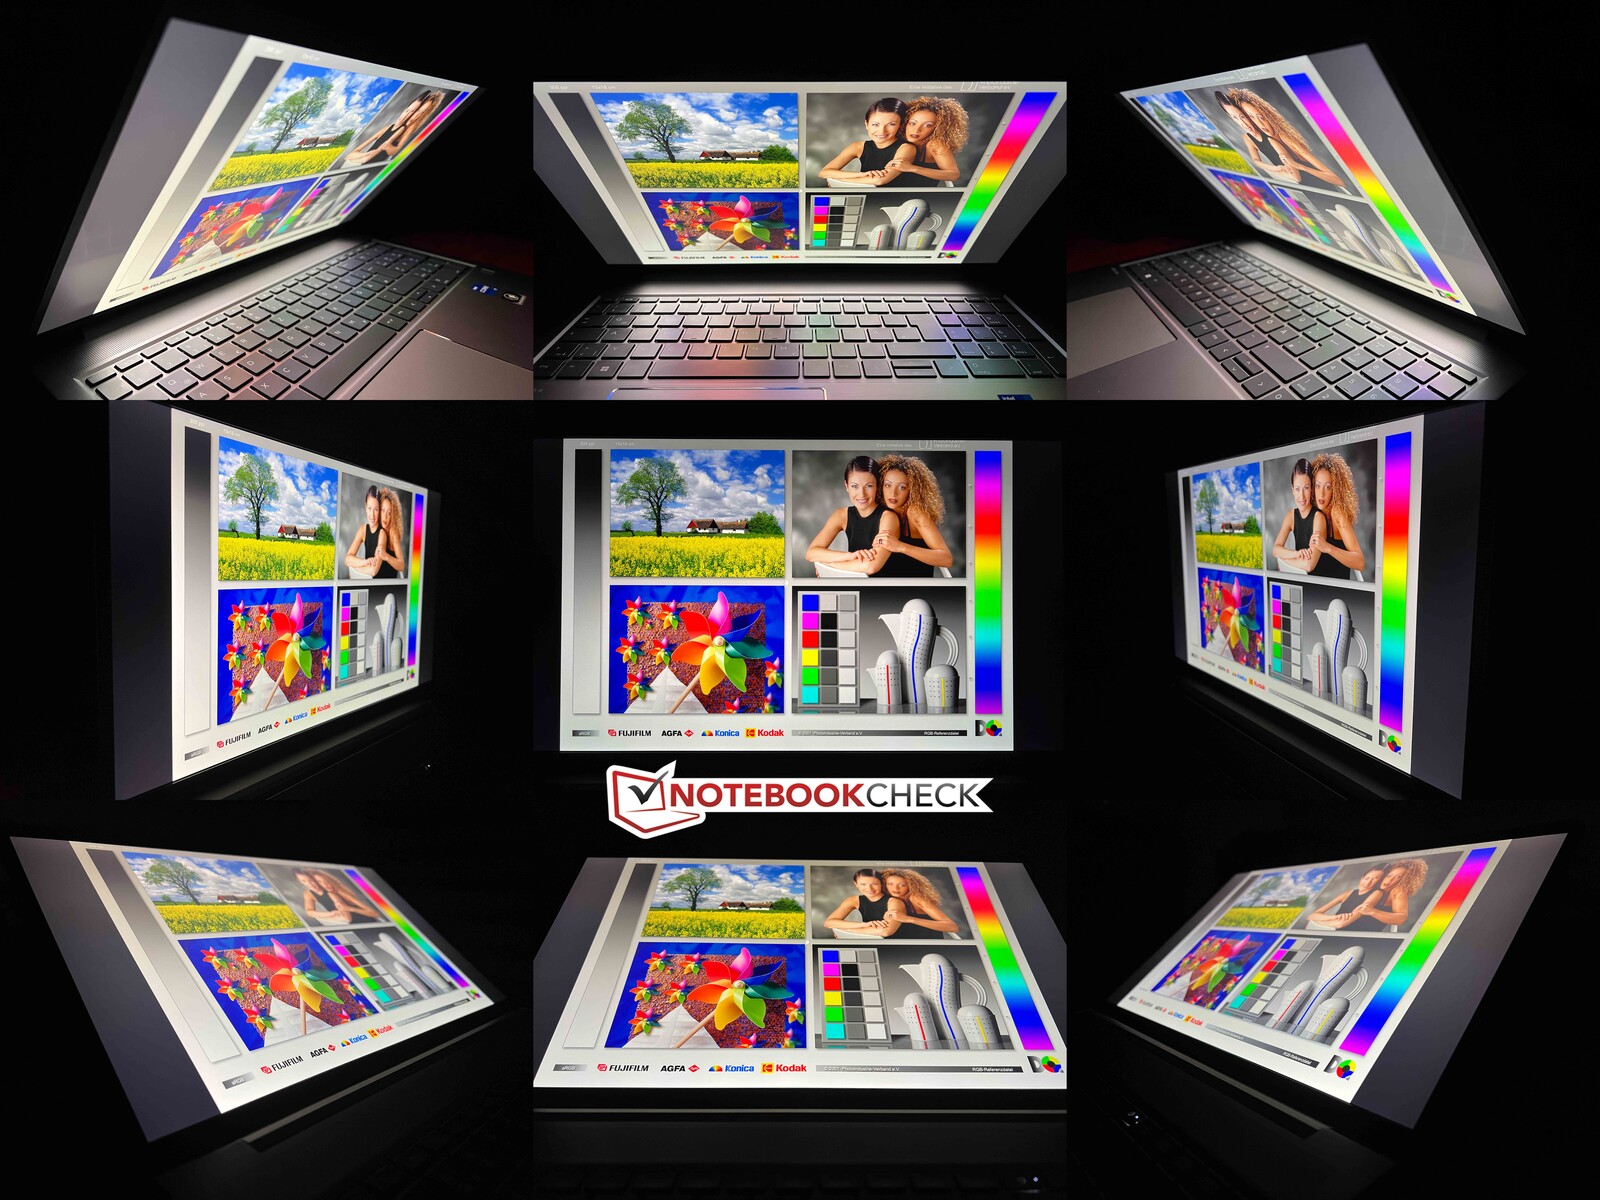
En extérieur, l'écran bénéficie de la surface mate, et tant que vous évitez les réflexions directes des sources lumineuses, vous pouvez toujours reconnaître facilement le contenu de l'écran même par temps clair. La stabilité de l'angle de vision de l'écran IPS est très bonne.
Performances - ZBook avec Intel Alder Lake
Conditions d'essai
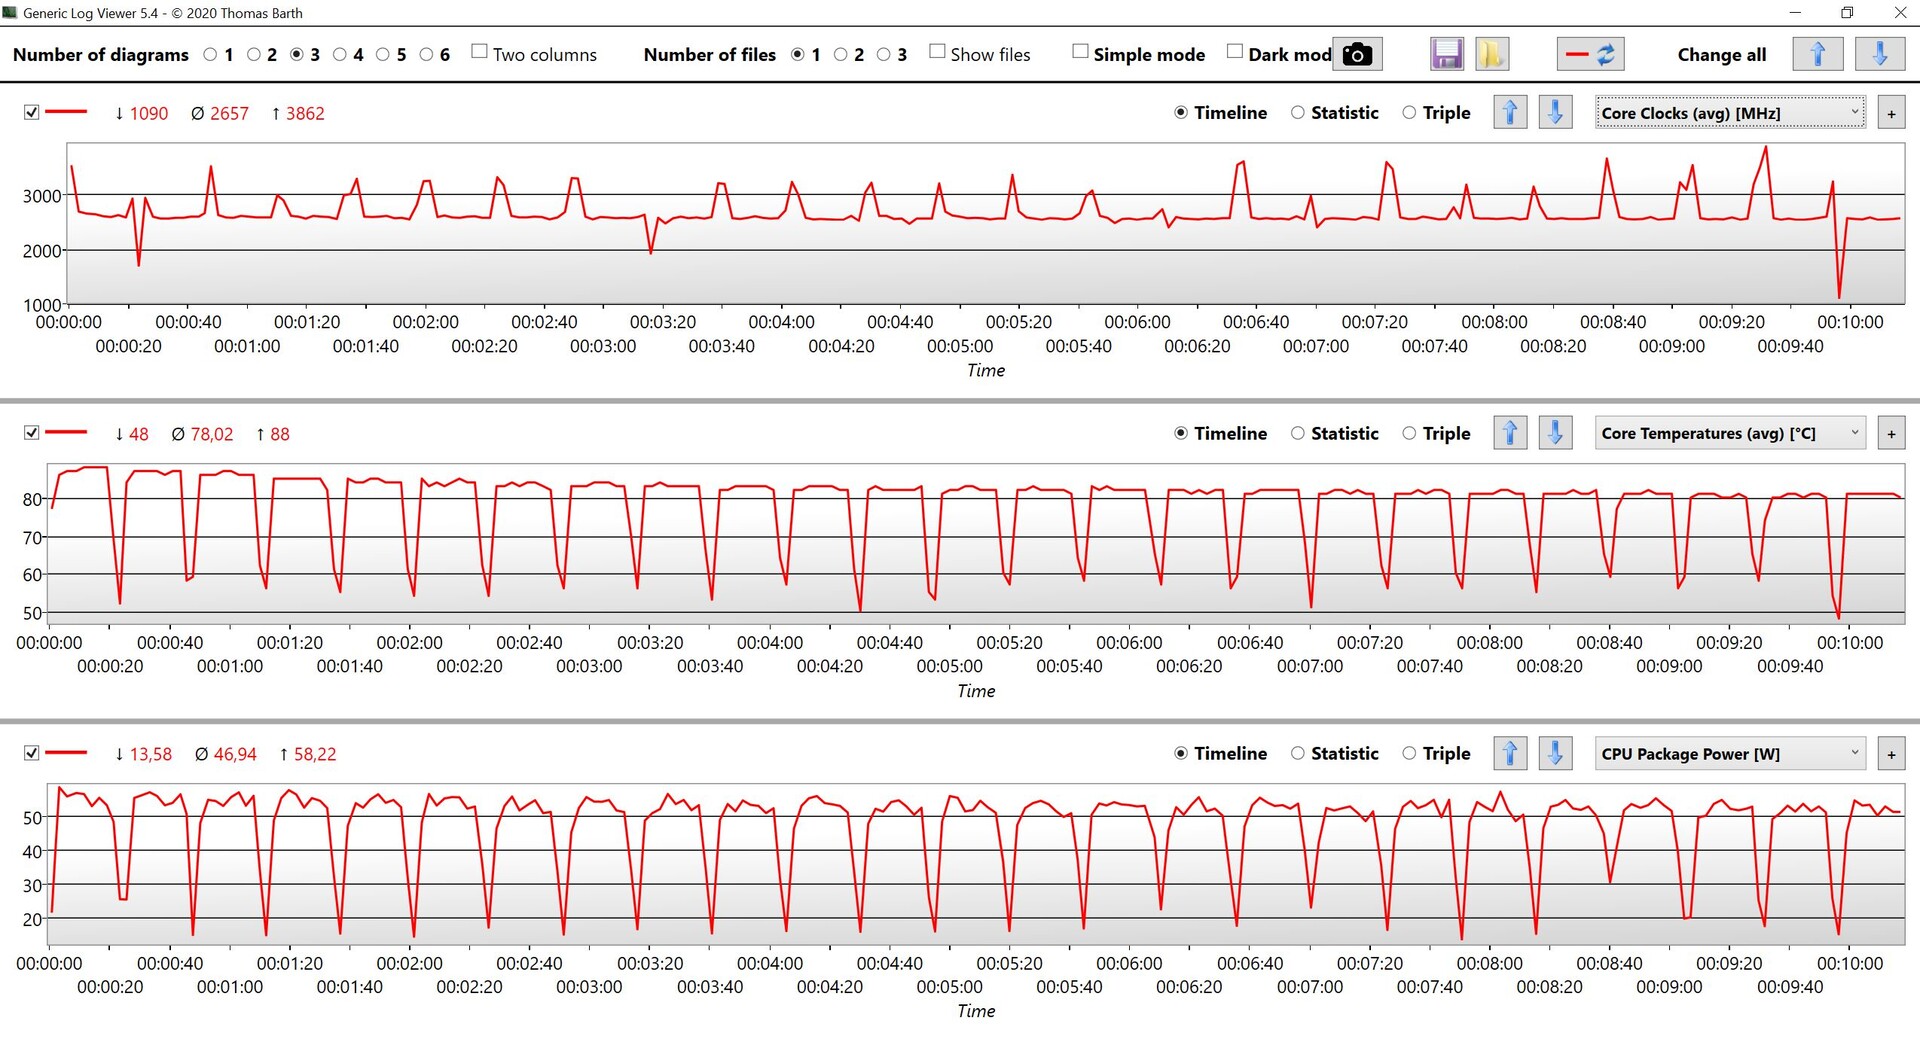
HP ne propose pas d'autres options de configuration de l'alimentation. Pendant le test, nous avons pu observer des valeurs de performance très variables. Bien que la situation se soit légèrement améliorée avec certaines mises à jour du BIOS, elle n'est toujours pas complètement stable. Avec 105/75 watts, les valeurs TDP sont en principe configurées à un niveau élevé, mais le processeur n'est capable d'utiliser jusqu'à 90 watts au maximum pendant une seconde de temps en temps, avant de se stabiliser rapidement à environ 55 watts. Parfois, le processeur démarre même avec cette valeur (avec les versions précédentes du BIOS, elle était même inférieure à 40 watts).
Processeur
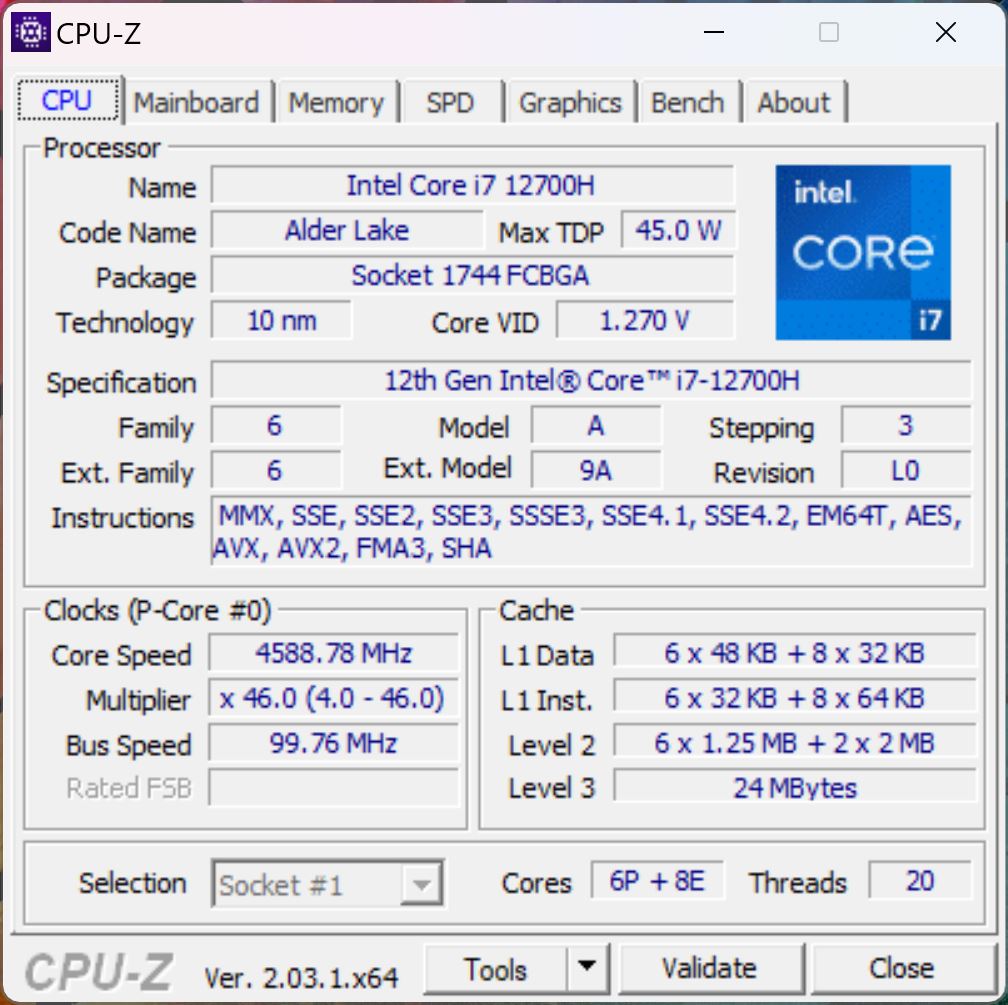
Le siteCore i7-12700Hest issu de l'actuelle génération Alder Lake d'Intel, combinant 6 cœurs rapides de performance et 8 cœurs d'efficacité. Les performances monocœurs sont très bonnes et environ 15 à 20 % plus rapides que celles de son prédécesseur avec le Core i7-11800H. Cependant, dans les benchmarks multicœurs, les performances sont légèrement décevantes compte tenu du grand boîtier, avec beaucoup de potentiel inutilisé. Par exemple, leZBook Studio 16 G9avec le même processeur est environ 20% plus rapide dans les tests multicore. Nous essayons également d'augmenter les valeurs TDP manuellement, mais le refroidissement est incapable de gérer plus de 60-65 watts, car les températures du CPU augmenteront alors à plus de 95 °C (203 °F).
En mode batterie, la consommation d'énergie du CPU est limitée à 30 watts. Cela n'a aucune influence sur les performances des processeurs monocœurs, mais entraîne un déficit de performances d'environ 30 % dans les tests multicœurs (9 926 points CB R23 Multi). Vous pouvez trouver d'autres benchmarks CPU dans notre section technique.
Cinebench R15 Multi Constant Load Test
Cinebench R23: Multi Core | Single Core
Cinebench R20: CPU (Multi Core) | CPU (Single Core)
Cinebench R15: CPU Multi 64Bit | CPU Single 64Bit
Blender: v2.79 BMW27 CPU
7-Zip 18.03: 7z b 4 | 7z b 4 -mmt1
Geekbench 5.5: Multi-Core | Single-Core
HWBOT x265 Benchmark v2.2: 4k Preset
LibreOffice : 20 Documents To PDF
R Benchmark 2.5: Overall mean
| CPU Performance rating | |
| Moyenne de la classe Workstation | |
| HP ZBook Studio 16 G9 62U04EA | |
| Moyenne Intel Core i7-12700H | |
| HP ZBook Power 15 G9 6B8C4EA | |
| HP ZBook Power 15 G8 313S5EA | |
| Dell Precision 5000 5560 -2! | |
| Lenovo ThinkPad P15v G2 21A9000XGE -1! | |
| Cinebench R23 / Multi Core | |
| Moyenne de la classe Workstation (14621 - 38520, n=23, 2 dernières années) | |
| HP ZBook Studio 16 G9 62U04EA | |
| Moyenne Intel Core i7-12700H (4032 - 19330, n=64) | |
| HP ZBook Power 15 G9 6B8C4EA | |
| HP ZBook Power 15 G8 313S5EA | |
| Lenovo ThinkPad P15v G2 21A9000XGE | |
| Dell Precision 5000 5560 | |
| Cinebench R23 / Single Core | |
| Moyenne de la classe Workstation (1712 - 2228, n=23, 2 dernières années) | |
| HP ZBook Studio 16 G9 62U04EA | |
| HP ZBook Power 15 G9 6B8C4EA | |
| Moyenne Intel Core i7-12700H (778 - 1826, n=63) | |
| HP ZBook Power 15 G8 313S5EA | |
| Dell Precision 5000 5560 | |
| Cinebench R20 / CPU (Multi Core) | |
| Moyenne de la classe Workstation (5760 - 15043, n=23, 2 dernières années) | |
| HP ZBook Studio 16 G9 62U04EA | |
| Moyenne Intel Core i7-12700H (1576 - 7407, n=64) | |
| HP ZBook Power 15 G9 6B8C4EA | |
| HP ZBook Power 15 G8 313S5EA | |
| Dell Precision 5000 5560 | |
| Lenovo ThinkPad P15v G2 21A9000XGE | |
| Cinebench R20 / CPU (Single Core) | |
| Moyenne de la classe Workstation (671 - 857, n=23, 2 dernières années) | |
| HP ZBook Studio 16 G9 62U04EA | |
| HP ZBook Power 15 G9 6B8C4EA | |
| Moyenne Intel Core i7-12700H (300 - 704, n=64) | |
| HP ZBook Power 15 G8 313S5EA | |
| Dell Precision 5000 5560 | |
| Lenovo ThinkPad P15v G2 21A9000XGE | |
| Cinebench R15 / CPU Multi 64Bit | |
| Moyenne de la classe Workstation (2489 - 5810, n=23, 2 dernières années) | |
| HP ZBook Studio 16 G9 62U04EA | |
| Moyenne Intel Core i7-12700H (1379 - 2916, n=70) | |
| HP ZBook Power 15 G8 313S5EA | |
| HP ZBook Power 15 G8 313S5EA | |
| HP ZBook Power 15 G9 6B8C4EA | |
| Lenovo ThinkPad P15v G2 21A9000XGE | |
| Dell Precision 5000 5560 | |
| Cinebench R15 / CPU Single 64Bit | |
| Moyenne de la classe Workstation (191.4 - 328, n=23, 2 dernières années) | |
| HP ZBook Studio 16 G9 62U04EA | |
| Moyenne Intel Core i7-12700H (113 - 263, n=65) | |
| HP ZBook Power 15 G9 6B8C4EA | |
| Dell Precision 5000 5560 | |
| HP ZBook Power 15 G8 313S5EA | |
| Lenovo ThinkPad P15v G2 21A9000XGE | |
| Blender / v2.79 BMW27 CPU | |
| Lenovo ThinkPad P15v G2 21A9000XGE | |
| Dell Precision 5000 5560 | |
| HP ZBook Power 15 G8 313S5EA | |
| HP ZBook Power 15 G9 6B8C4EA | |
| Moyenne Intel Core i7-12700H (168 - 732, n=63) | |
| HP ZBook Studio 16 G9 62U04EA | |
| Moyenne de la classe Workstation (91 - 222, n=23, 2 dernières années) | |
| 7-Zip 18.03 / 7z b 4 | |
| Moyenne de la classe Workstation (60489 - 116969, n=23, 2 dernières années) | |
| HP ZBook Studio 16 G9 62U04EA | |
| Moyenne Intel Core i7-12700H (22844 - 73067, n=63) | |
| HP ZBook Power 15 G9 6B8C4EA | |
| HP ZBook Power 15 G8 313S5EA | |
| Dell Precision 5000 5560 | |
| Lenovo ThinkPad P15v G2 21A9000XGE | |
| 7-Zip 18.03 / 7z b 4 -mmt1 | |
| Moyenne de la classe Workstation (5126 - 6960, n=23, 2 dernières années) | |
| HP ZBook Studio 16 G9 62U04EA | |
| HP ZBook Power 15 G9 6B8C4EA | |
| Dell Precision 5000 5560 | |
| HP ZBook Power 15 G8 313S5EA | |
| Moyenne Intel Core i7-12700H (2743 - 5972, n=63) | |
| Lenovo ThinkPad P15v G2 21A9000XGE | |
| Geekbench 5.5 / Multi-Core | |
| Moyenne de la classe Workstation (11542 - 25554, n=23, 2 dernières années) | |
| HP ZBook Studio 16 G9 62U04EA | |
| HP ZBook Power 15 G9 6B8C4EA | |
| Moyenne Intel Core i7-12700H (5144 - 13745, n=64) | |
| HP ZBook Power 15 G8 313S5EA | |
| Lenovo ThinkPad P15v G2 21A9000XGE | |
| Geekbench 5.5 / Single-Core | |
| Moyenne de la classe Workstation (1783 - 2183, n=23, 2 dernières années) | |
| HP ZBook Studio 16 G9 62U04EA | |
| Moyenne Intel Core i7-12700H (803 - 1851, n=64) | |
| HP ZBook Power 15 G9 6B8C4EA | |
| HP ZBook Power 15 G8 313S5EA | |
| Lenovo ThinkPad P15v G2 21A9000XGE | |
| HWBOT x265 Benchmark v2.2 / 4k Preset | |
| Moyenne de la classe Workstation (17.8 - 40.5, n=23, 2 dernières années) | |
| HP ZBook Studio 16 G9 62U04EA | |
| Moyenne Intel Core i7-12700H (4.67 - 21.8, n=64) | |
| HP ZBook Power 15 G9 6B8C4EA | |
| HP ZBook Power 15 G8 313S5EA | |
| Dell Precision 5000 5560 | |
| Lenovo ThinkPad P15v G2 21A9000XGE | |
| LibreOffice / 20 Documents To PDF | |
| Lenovo ThinkPad P15v G2 21A9000XGE | |
| Dell Precision 5000 5560 | |
| Moyenne de la classe Workstation (37.1 - 74.7, n=23, 2 dernières années) | |
| Moyenne Intel Core i7-12700H (34.2 - 95.3, n=63) | |
| HP ZBook Power 15 G9 6B8C4EA | |
| HP ZBook Studio 16 G9 62U04EA | |
| HP ZBook Power 15 G8 313S5EA | |
| R Benchmark 2.5 / Overall mean | |
| HP ZBook Power 15 G8 313S5EA | |
| Lenovo ThinkPad P15v G2 21A9000XGE | |
| Dell Precision 5000 5560 | |
| HP ZBook Power 15 G9 6B8C4EA | |
| Moyenne Intel Core i7-12700H (0.4441 - 1.052, n=63) | |
| HP ZBook Studio 16 G9 62U04EA | |
| Moyenne de la classe Workstation (0.3825 - 0.603, n=23, 2 dernières années) | |
* ... Moindre est la valeur, meilleures sont les performances
AIDA64: FP32 Ray-Trace | FPU Julia | CPU SHA3 | CPU Queen | FPU SinJulia | FPU Mandel | CPU AES | CPU ZLib | FP64 Ray-Trace | CPU PhotoWorxx
| Performance rating | |
| Moyenne de la classe Workstation | |
| HP ZBook Studio 16 G9 62U04EA | |
| HP ZBook Power 15 G9 6B8C4EA | |
| HP ZBook Power 15 G8 313S5EA | |
| Moyenne Intel Core i7-12700H | |
| Lenovo ThinkPad P15v G2 21A9000XGE | |
| Dell Precision 5000 5560 -9! | |
| AIDA64 / FP32 Ray-Trace | |
| Moyenne de la classe Workstation (16730 - 61611, n=23, 2 dernières années) | |
| HP ZBook Studio 16 G9 62U04EA | |
| HP ZBook Power 15 G8 313S5EA | |
| HP ZBook Power 15 G9 6B8C4EA | |
| Lenovo ThinkPad P15v G2 21A9000XGE | |
| Moyenne Intel Core i7-12700H (2585 - 17957, n=64) | |
| AIDA64 / FPU Julia | |
| Moyenne de la classe Workstation (89597 - 186971, n=23, 2 dernières années) | |
| HP ZBook Studio 16 G9 62U04EA | |
| HP ZBook Power 15 G9 6B8C4EA | |
| HP ZBook Power 15 G8 313S5EA | |
| Moyenne Intel Core i7-12700H (12439 - 90760, n=64) | |
| Lenovo ThinkPad P15v G2 21A9000XGE | |
| AIDA64 / CPU SHA3 | |
| Moyenne de la classe Workstation (4178 - 8975, n=23, 2 dernières années) | |
| HP ZBook Power 15 G8 313S5EA | |
| HP ZBook Studio 16 G9 62U04EA | |
| Lenovo ThinkPad P15v G2 21A9000XGE | |
| HP ZBook Power 15 G9 6B8C4EA | |
| Moyenne Intel Core i7-12700H (833 - 4242, n=64) | |
| AIDA64 / CPU Queen | |
| Moyenne de la classe Workstation (60778 - 144411, n=23, 2 dernières années) | |
| HP ZBook Studio 16 G9 62U04EA | |
| HP ZBook Power 15 G9 6B8C4EA | |
| Moyenne Intel Core i7-12700H (57923 - 103202, n=63) | |
| HP ZBook Power 15 G8 313S5EA | |
| Lenovo ThinkPad P15v G2 21A9000XGE | |
| AIDA64 / FPU SinJulia | |
| Moyenne de la classe Workstation (8165 - 29343, n=23, 2 dernières années) | |
| HP ZBook Power 15 G8 313S5EA | |
| HP ZBook Studio 16 G9 62U04EA | |
| Moyenne Intel Core i7-12700H (3249 - 9939, n=64) | |
| Lenovo ThinkPad P15v G2 21A9000XGE | |
| HP ZBook Power 15 G9 6B8C4EA | |
| AIDA64 / FPU Mandel | |
| Moyenne de la classe Workstation (44497 - 98153, n=23, 2 dernières années) | |
| HP ZBook Studio 16 G9 62U04EA | |
| HP ZBook Power 15 G8 313S5EA | |
| HP ZBook Power 15 G9 6B8C4EA | |
| Lenovo ThinkPad P15v G2 21A9000XGE | |
| Moyenne Intel Core i7-12700H (7135 - 44760, n=64) | |
| AIDA64 / CPU AES | |
| Moyenne de la classe Workstation (73133 - 187841, n=23, 2 dernières années) | |
| Moyenne Intel Core i7-12700H (31839 - 144360, n=64) | |
| HP ZBook Power 15 G8 313S5EA | |
| Lenovo ThinkPad P15v G2 21A9000XGE | |
| HP ZBook Studio 16 G9 62U04EA | |
| HP ZBook Power 15 G9 6B8C4EA | |
| AIDA64 / CPU ZLib | |
| Moyenne de la classe Workstation (929 - 2148, n=23, 2 dernières années) | |
| HP ZBook Studio 16 G9 62U04EA | |
| Moyenne Intel Core i7-12700H (305 - 1171, n=64) | |
| HP ZBook Power 15 G9 6B8C4EA | |
| HP ZBook Power 15 G8 313S5EA | |
| Lenovo ThinkPad P15v G2 21A9000XGE | |
| Dell Precision 5000 5560 | |
| AIDA64 / FP64 Ray-Trace | |
| Moyenne de la classe Workstation (8545 - 32891, n=23, 2 dernières années) | |
| HP ZBook Studio 16 G9 62U04EA | |
| HP ZBook Power 15 G8 313S5EA | |
| HP ZBook Power 15 G9 6B8C4EA | |
| Lenovo ThinkPad P15v G2 21A9000XGE | |
| Moyenne Intel Core i7-12700H (1437 - 9692, n=64) | |
| AIDA64 / CPU PhotoWorxx | |
| Moyenne de la classe Workstation (37151 - 93684, n=23, 2 dernières années) | |
| HP ZBook Power 15 G9 6B8C4EA | |
| HP ZBook Studio 16 G9 62U04EA | |
| Moyenne Intel Core i7-12700H (12863 - 52207, n=64) | |
| HP ZBook Power 15 G8 313S5EA | |
| Lenovo ThinkPad P15v G2 21A9000XGE | |
Performance du système
Le ZBook Power 15 G9 est un appareil très réactif, et nous n'avons rencontré aucun problème pendant nos tests. Les résultats du benchmark synthétique sont également très bons et confirment notre impression subjective des performances.
CrossMark: Overall | Productivity | Creativity | Responsiveness
| PCMark 10 / Score | |
| Moyenne de la classe Workstation (6563 - 10409, n=19, 2 dernières années) | |
| Dell Precision 5000 5560 | |
| HP ZBook Studio 16 G9 62U04EA | |
| HP ZBook Power 15 G9 6B8C4EA | |
| Moyenne Intel Core i7-12700H, NVIDIA RTX A2000 Laptop GPU (n=1) | |
| Lenovo ThinkPad P15v G2 21A9000XGE | |
| HP ZBook Power 15 G8 313S5EA | |
| PCMark 10 / Essentials | |
| Dell Precision 5000 5560 | |
| Moyenne de la classe Workstation (9622 - 11157, n=19, 2 dernières années) | |
| HP ZBook Power 15 G9 6B8C4EA | |
| Moyenne Intel Core i7-12700H, NVIDIA RTX A2000 Laptop GPU (n=1) | |
| Lenovo ThinkPad P15v G2 21A9000XGE | |
| HP ZBook Studio 16 G9 62U04EA | |
| HP ZBook Power 15 G8 313S5EA | |
| PCMark 10 / Productivity | |
| Moyenne de la classe Workstation (8789 - 20616, n=19, 2 dernières années) | |
| Dell Precision 5000 5560 | |
| Lenovo ThinkPad P15v G2 21A9000XGE | |
| HP ZBook Studio 16 G9 62U04EA | |
| HP ZBook Power 15 G9 6B8C4EA | |
| Moyenne Intel Core i7-12700H, NVIDIA RTX A2000 Laptop GPU (n=1) | |
| HP ZBook Power 15 G8 313S5EA | |
| PCMark 10 / Digital Content Creation | |
| Moyenne de la classe Workstation (8108 - 15631, n=19, 2 dernières années) | |
| HP ZBook Studio 16 G9 62U04EA | |
| HP ZBook Power 15 G9 6B8C4EA | |
| Moyenne Intel Core i7-12700H, NVIDIA RTX A2000 Laptop GPU (n=1) | |
| Dell Precision 5000 5560 | |
| Lenovo ThinkPad P15v G2 21A9000XGE | |
| HP ZBook Power 15 G8 313S5EA | |
| CrossMark / Overall | |
| Moyenne de la classe Workstation (1307 - 2267, n=22, 2 dernières années) | |
| HP ZBook Studio 16 G9 62U04EA | |
| HP ZBook Power 15 G9 6B8C4EA | |
| Moyenne Intel Core i7-12700H, NVIDIA RTX A2000 Laptop GPU (n=1) | |
| HP ZBook Power 15 G8 313S5EA | |
| Lenovo ThinkPad P15v G2 21A9000XGE | |
| CrossMark / Productivity | |
| Moyenne de la classe Workstation (1130 - 2122, n=22, 2 dernières années) | |
| HP ZBook Studio 16 G9 62U04EA | |
| HP ZBook Power 15 G9 6B8C4EA | |
| Moyenne Intel Core i7-12700H, NVIDIA RTX A2000 Laptop GPU (n=1) | |
| HP ZBook Power 15 G8 313S5EA | |
| Lenovo ThinkPad P15v G2 21A9000XGE | |
| CrossMark / Creativity | |
| Moyenne de la classe Workstation (1657 - 2725, n=22, 2 dernières années) | |
| HP ZBook Studio 16 G9 62U04EA | |
| HP ZBook Power 15 G9 6B8C4EA | |
| Moyenne Intel Core i7-12700H, NVIDIA RTX A2000 Laptop GPU (n=1) | |
| HP ZBook Power 15 G8 313S5EA | |
| Lenovo ThinkPad P15v G2 21A9000XGE | |
| CrossMark / Responsiveness | |
| Moyenne de la classe Workstation (993 - 2096, n=22, 2 dernières années) | |
| HP ZBook Studio 16 G9 62U04EA | |
| HP ZBook Power 15 G9 6B8C4EA | |
| Moyenne Intel Core i7-12700H, NVIDIA RTX A2000 Laptop GPU (n=1) | |
| HP ZBook Power 15 G8 313S5EA | |
| Lenovo ThinkPad P15v G2 21A9000XGE | |
| PCMark 10 Score | 6232 points | |
Aide | ||
| AIDA64 / Memory Copy | |
| Moyenne de la classe Workstation (56003 - 164795, n=23, 2 dernières années) | |
| HP ZBook Power 15 G9 6B8C4EA | |
| HP ZBook Studio 16 G9 62U04EA | |
| Moyenne Intel Core i7-12700H (25615 - 80511, n=64) | |
| HP ZBook Power 15 G8 313S5EA | |
| Lenovo ThinkPad P15v G2 21A9000XGE | |
| AIDA64 / Memory Read | |
| Moyenne de la classe Workstation (55795 - 121563, n=23, 2 dernières années) | |
| HP ZBook Power 15 G9 6B8C4EA | |
| HP ZBook Studio 16 G9 62U04EA | |
| Moyenne Intel Core i7-12700H (25586 - 79442, n=64) | |
| HP ZBook Power 15 G8 313S5EA | |
| Lenovo ThinkPad P15v G2 21A9000XGE | |
| AIDA64 / Memory Write | |
| Moyenne de la classe Workstation (55663 - 214520, n=23, 2 dernières années) | |
| HP ZBook Power 15 G9 6B8C4EA | |
| HP ZBook Studio 16 G9 62U04EA | |
| Moyenne Intel Core i7-12700H (23679 - 88660, n=64) | |
| HP ZBook Power 15 G8 313S5EA | |
| Lenovo ThinkPad P15v G2 21A9000XGE | |
| AIDA64 / Memory Latency | |
| Moyenne de la classe Workstation (84.5 - 165.2, n=23, 2 dernières années) | |
| Lenovo ThinkPad P15v G2 21A9000XGE | |
| HP ZBook Power 15 G9 6B8C4EA | |
| HP ZBook Studio 16 G9 62U04EA | |
| Moyenne Intel Core i7-12700H (76.2 - 133.9, n=62) | |
| HP ZBook Power 15 G8 313S5EA | |
* ... Moindre est la valeur, meilleures sont les performances
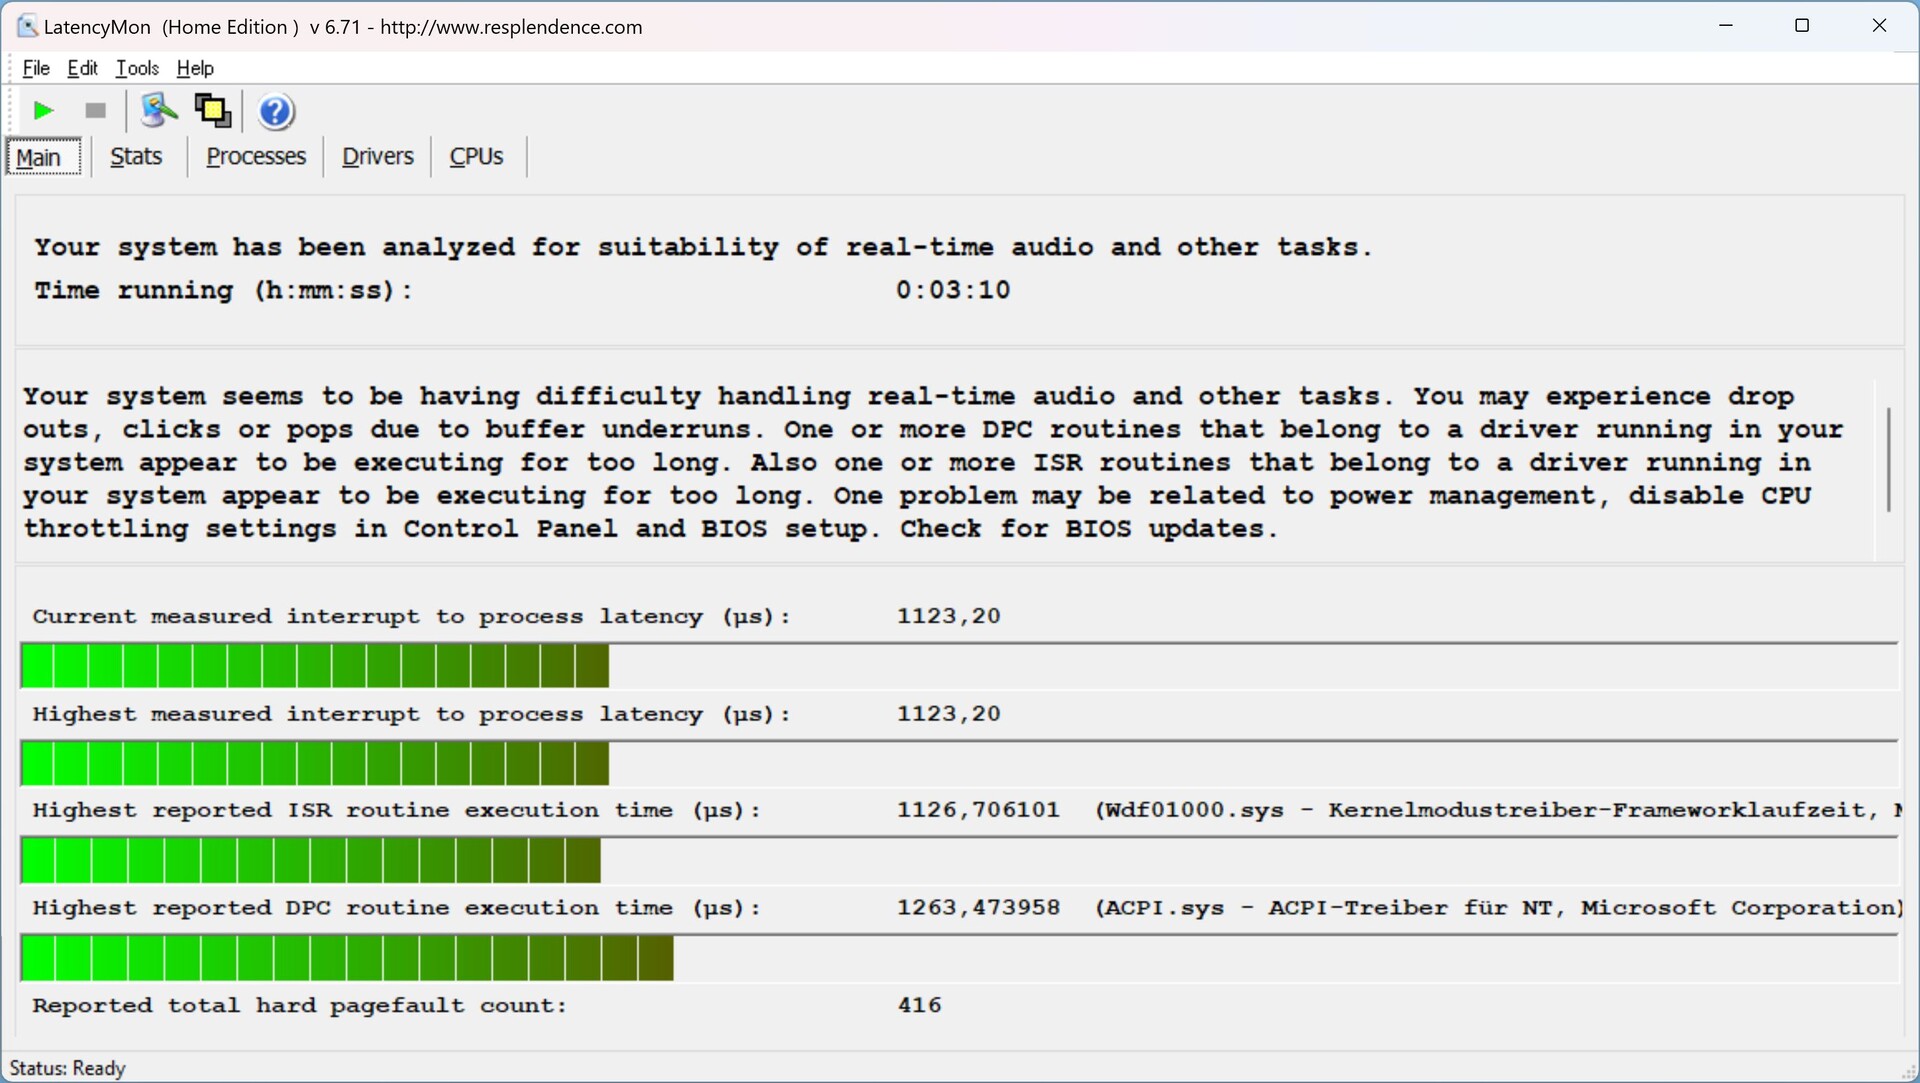
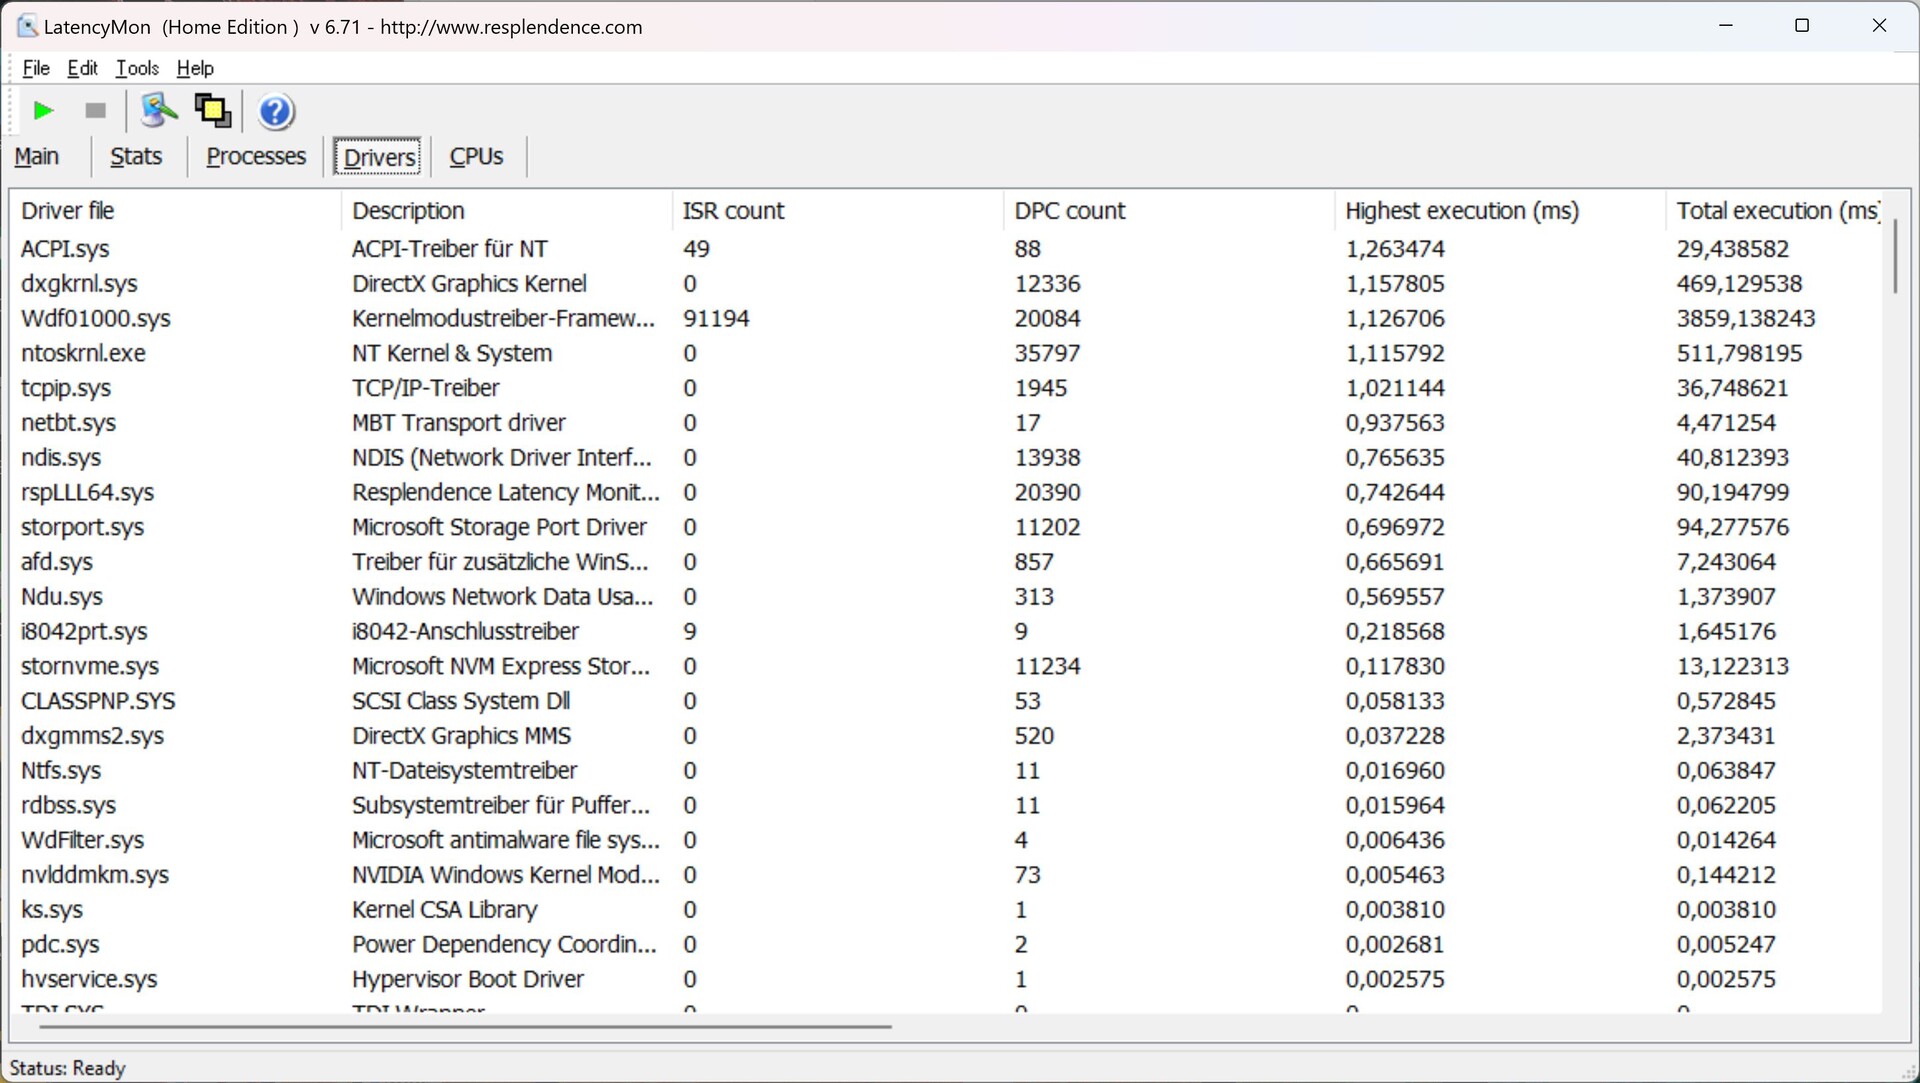
Latences DPC
Dans notre test de latence standardisé (navigation sur Internet, reproduction de vidéos YouTube 4K, charge du processeur), on constate de légères limitations. Par conséquent, l'appareil avec la version actuelle du BIOS n'est pas adapté de manière optimale à l'utilisation d'applications audio en temps réel.
| DPC Latencies / LatencyMon - interrupt to process latency (max), Web, Youtube, Prime95 | |
| Lenovo ThinkPad P15v G2 21A9000XGE | |
| HP ZBook Studio 16 G9 62U04EA | |
| HP ZBook Power 15 G9 6B8C4EA | |
| Dell Precision 5000 5560 | |
| HP ZBook Power 15 G8 313S5EA | |
* ... Moindre est la valeur, meilleures sont les performances
Solution de stockage
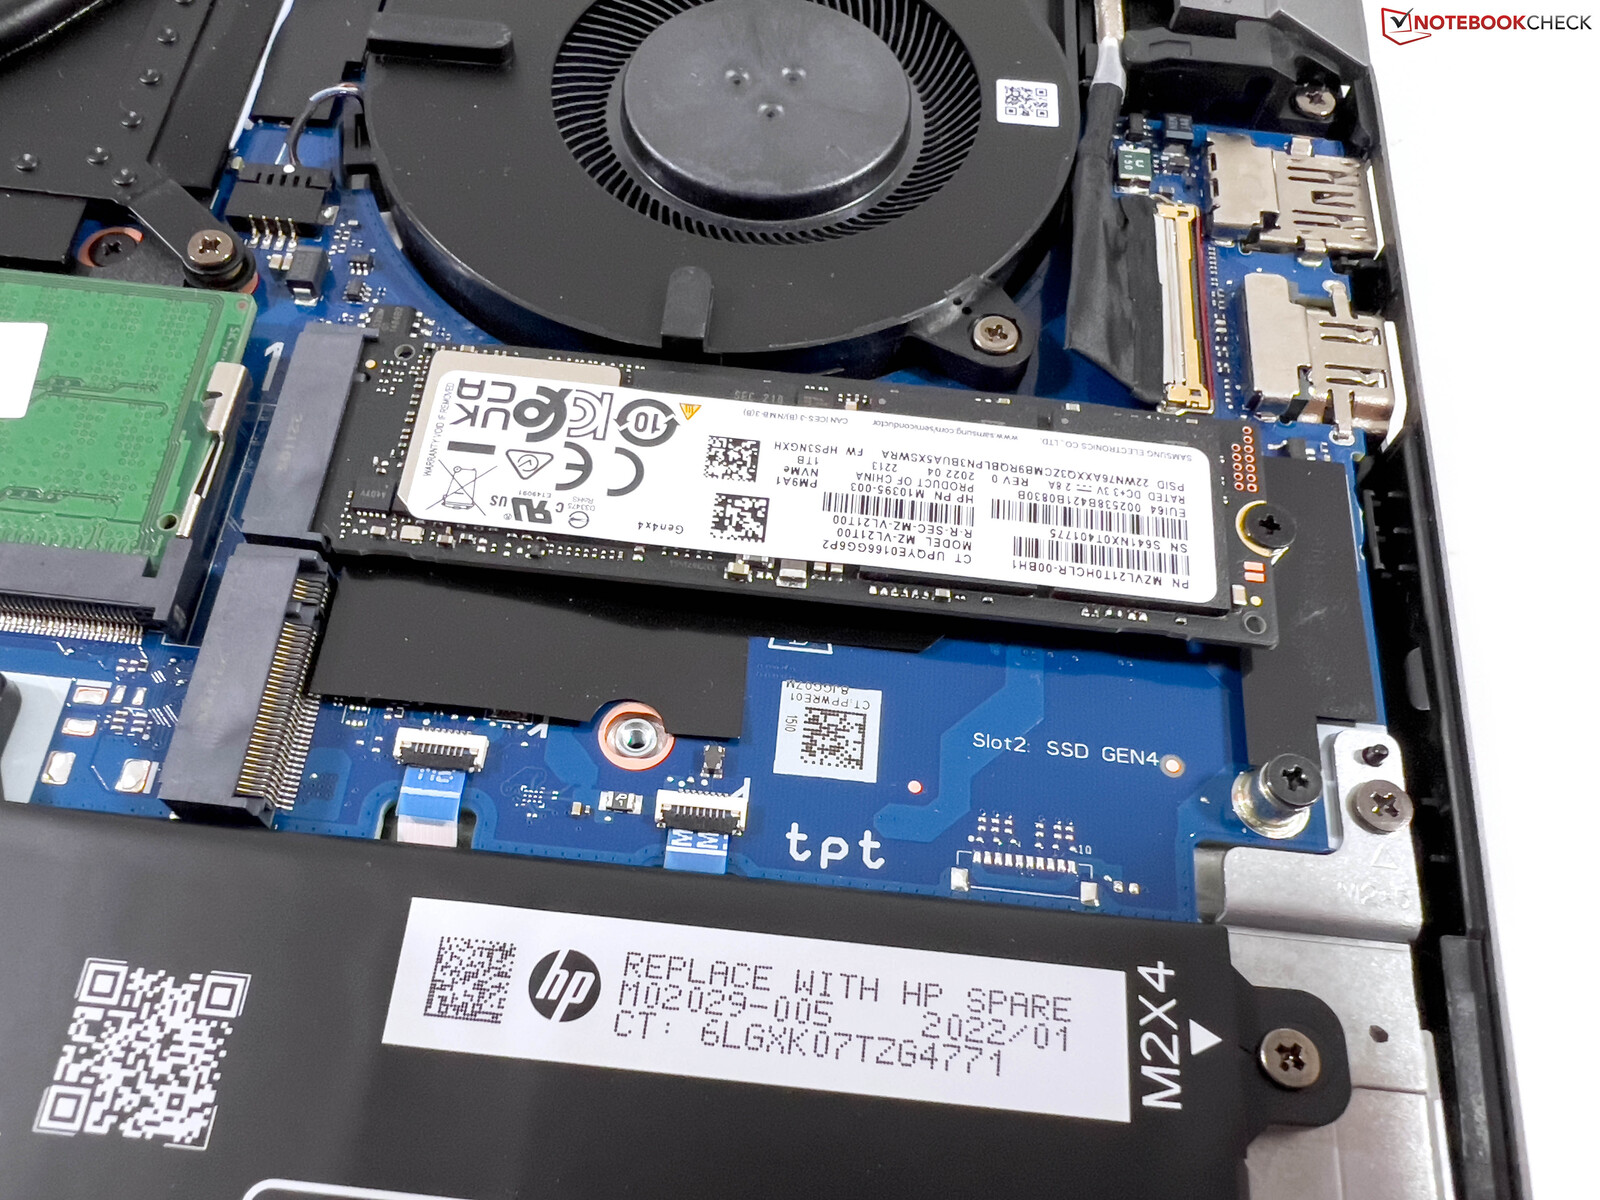
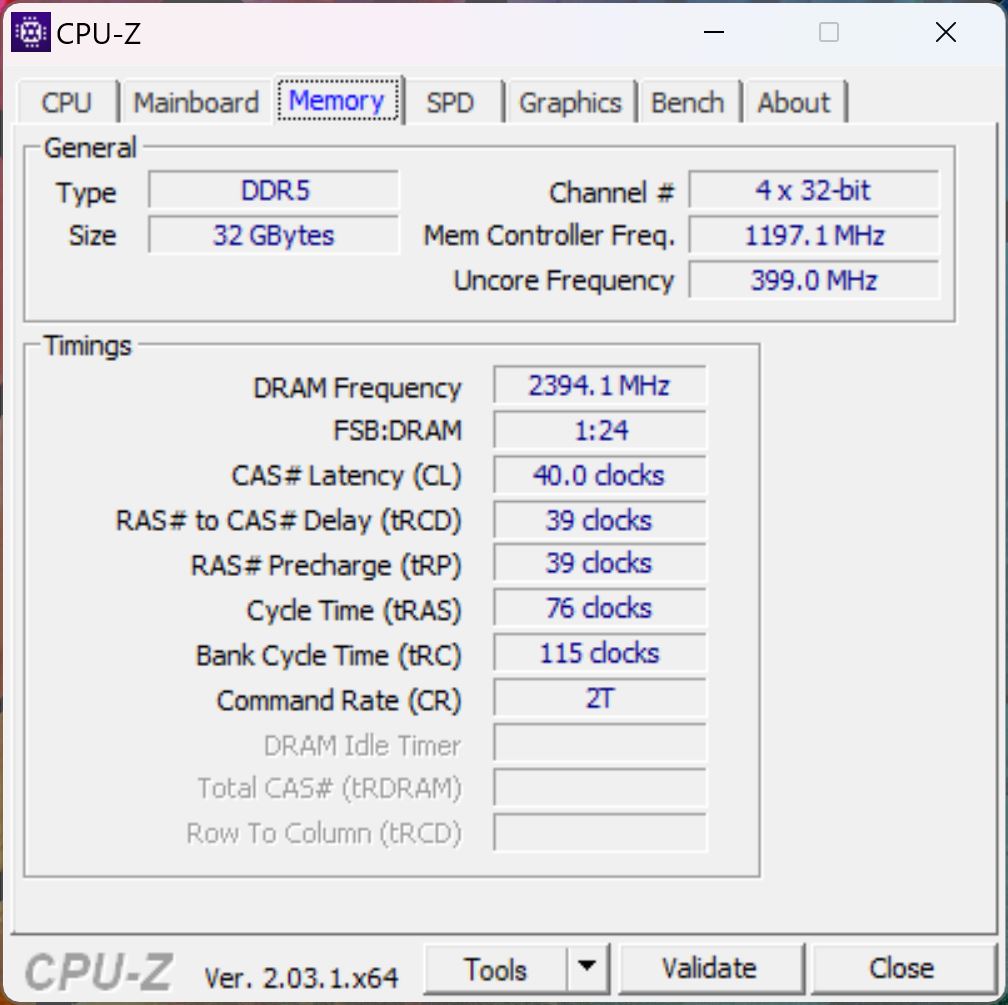
Le ZBook Power 15 G9 offre deux emplacements PCIe 4.0 rapides pour des SSD M.2. Notre unité de test utilise un gros PM9A1 de 1 To de Samsung (version OEM du 980 Pro). Après l'avoir allumé pour la première fois, 890 Go sont à la disposition de l'utilisateur. Les taux de transfert du SSD sont excellents, et les performances restent également presque totalement stables même après une charge plus longue. Vous pouvez trouver d'autres benchmarks SSD ici.

* ... Moindre est la valeur, meilleures sont les performances
Disk Throttling: DiskSpd Read Loop, Queue Depth 8
Carte graphique
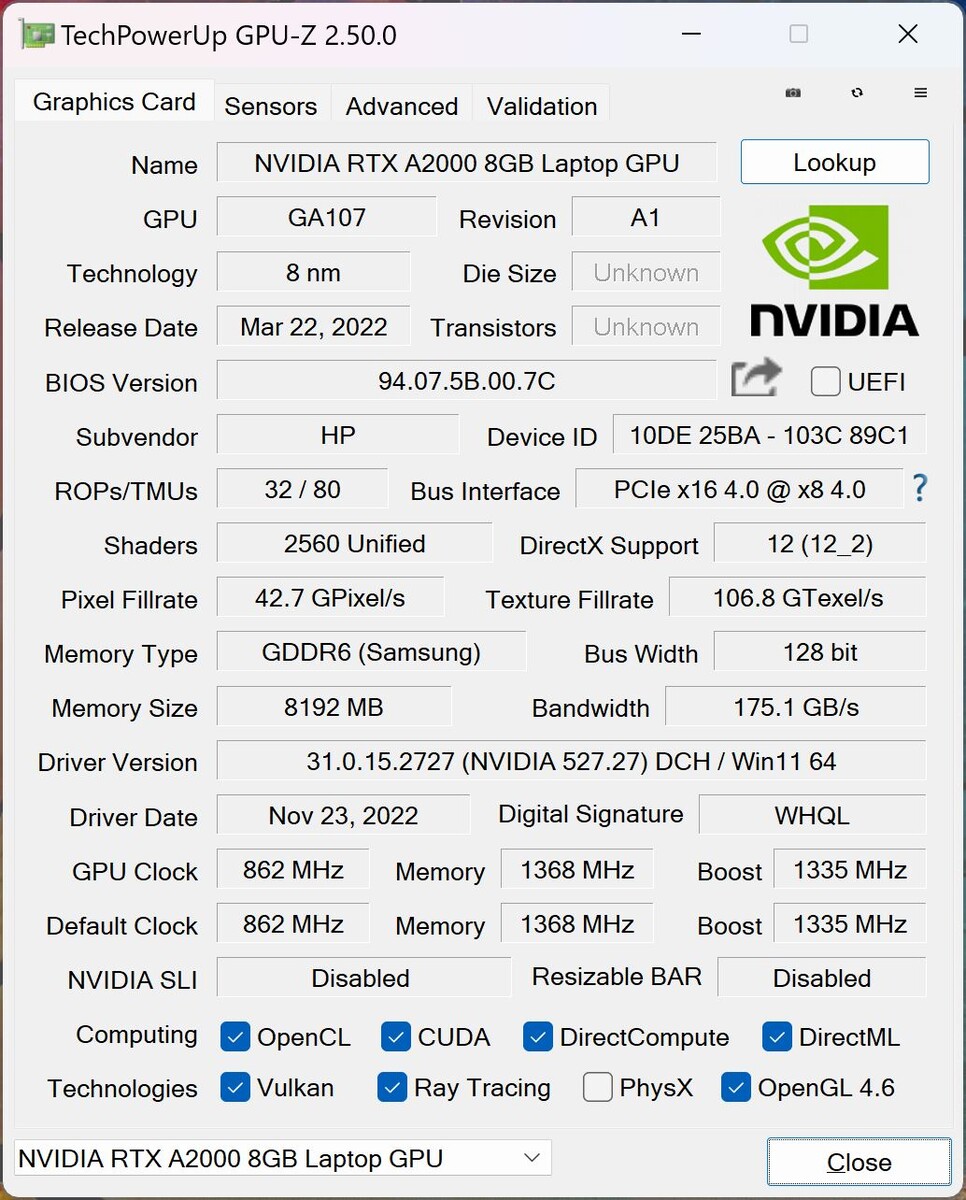
Le siteNvidia RTX A2000 est le GPU le plus rapide que HP propose pour le ZBook Power 15 G9. Il s'agit de la version mise à jour avec 8 Go de GDDR6-VRAM. Cependant, le GPU n'est autorisé à consommer qu'un maximum de 45 watts (dont 5 watts de Dynamic Boost), ce qui en fait l'une des versions les plus lentes. Dans nos benchmarks, le GPU se situe donc également en dessous de la moyenne des résultats que nous avons mesurés pour la RTX A2000 jusqu'à présent. Les performances de jeu sont comparables à celles de la GeForce RTX 3050 Ti consumer GPUmais grâce aux pilotes certifiés, les performances dans les applications professionnelles peuvent également être nettement meilleures.
Sous une charge constante, les performances du GPU restent totalement stables. Comme pour le processeur, la consommation d'énergie de la carte graphique en mode batterie est également limitée à 30 watts, ce qui entraîne une réduction des performances de près de 25 % (3 589 points Time Spy Graphics). Vous trouverez d'autres benchmarks GPU ici.
| 3DMark 11 Performance | 16503 points | |
| 3DMark Fire Strike Score | 11074 points | |
| 3DMark Time Spy Score | 5106 points | |
Aide | ||
| Blender / v3.3 Classroom OPTIX/RTX | |
| HP ZBook Studio 16 G9 62U04EA | |
| HP ZBook Power 15 G9 6B8C4EA | |
| Moyenne NVIDIA RTX A2000 Laptop GPU (42 - 54, n=7) | |
| Moyenne de la classe Workstation (10 - 43, n=17, 2 dernières années) | |
| Blender / v3.3 Classroom CUDA | |
| HP ZBook Studio 16 G9 62U04EA | |
| HP ZBook Power 15 G9 6B8C4EA | |
| Moyenne NVIDIA RTX A2000 Laptop GPU (78 - 98, n=7) | |
| Moyenne de la classe Workstation (16 - 74, n=17, 2 dernières années) | |
| Blender / v3.3 Classroom CPU | |
| HP ZBook Power 15 G9 6B8C4EA | |
| Moyenne NVIDIA RTX A2000 Laptop GPU (312 - 414, n=7) | |
| HP ZBook Studio 16 G9 62U04EA | |
| Moyenne de la classe Workstation (148 - 364, n=23, 2 dernières années) | |
* ... Moindre est la valeur, meilleures sont les performances
| The Witcher 3 - 1920x1080 Ultra Graphics & Postprocessing (HBAO+) | |
| Moyenne de la classe Workstation (n=12 dernières années) | |
| Dell Precision 5000 5560 | |
| HP ZBook Studio 16 G9 62U04EA | |
| HP ZBook Power 15 G9 6B8C4EA | |
| Lenovo ThinkPad P15v G2 21A9000XGE | |
| HP ZBook Power 15 G8 313S5EA | |
| Final Fantasy XV Benchmark - 1920x1080 High Quality | |
| Moyenne de la classe Workstation (26.4 - 197.6, n=23, 2 dernières années) | |
| HP ZBook Studio 16 G9 62U04EA | |
| HP ZBook Power 15 G9 6B8C4EA | |
| Dell Precision 5000 5560 | |
| Lenovo ThinkPad P15v G2 21A9000XGE | |
| HP ZBook Power 15 G8 313S5EA | |
| Strange Brigade - 1920x1080 ultra AA:ultra AF:16 | |
| Moyenne de la classe Workstation (93.2 - 418, n=17, 2 dernières années) | |
| HP ZBook Studio 16 G9 62U04EA | |
| HP ZBook Power 15 G9 6B8C4EA | |
| Lenovo ThinkPad P15v G2 21A9000XGE | |
| HP ZBook Power 15 G8 313S5EA | |
| Dota 2 Reborn - 1920x1080 ultra (3/3) best looking | |
| HP ZBook Studio 16 G9 62U04EA | |
| Moyenne de la classe Workstation (50.7 - 178.4, n=23, 2 dernières années) | |
| Dell Precision 5000 5560 | |
| HP ZBook Power 15 G9 6B8C4EA | |
| HP ZBook Power 15 G8 313S5EA | |
| Lenovo ThinkPad P15v G2 21A9000XGE | |
The Witcher 3 FPS Chart
| Bas | Moyen | Élevé | Ultra | QHD | 4K | |
|---|---|---|---|---|---|---|
| GTA V (2015) | 182.9 | 177.1 | 134.7 | 65.4 | 47.3 | 45 |
| The Witcher 3 (2015) | 264 | 171 | 45 | 44.5 | ||
| Dota 2 Reborn (2015) | 179.3 | 133.5 | 126.1 | 118.6 | 68.9 | |
| Final Fantasy XV Benchmark (2018) | 121.9 | 68.2 | 48.6 | 34.9 | 20.6 | |
| X-Plane 11.11 (2018) | 122.6 | 103.6 | 87.6 | 73.1 | ||
| Strange Brigade (2018) | 266 | 126 | 100 | 86 | 36 | |
| F1 2021 (2021) | 287 | 153.1 | 124.4 | 62.7 | 44.4 | 23.9 |
| F1 22 (2022) | 147.1 | 137.9 | 100.6 | 30.8 | 19.1 | 9.05 |
Émissions et gestion de l'énergie
Niveau de bruit
Habituellement, les deux ventilateurs du ZBook Power 15 G9 restent souvent désactivés pendant les tâches simples. Ce n'est que lorsque vous mettez le processeur ou la carte graphique dédiée sous charge que les ventilateurs s'allument rapidement, produisant généralement un niveau sonore entre 42 et 45 dB(A), la vitesse des ventilateurs ne restant pas toujours stable mais fluctuant parfois. Lors du test de stress avec charge maximale pour les deux composants, nous mesurons un maximum de 47,9 dB(A). La génération actuelle du G9 reste donc légèrement plus silencieuse que son prédécesseur. Il n'y a pas d'autres bruits électroniques.
Degré de la nuisance sonore
| Au repos |
| 23.8 / 23.8 / 23.8 dB(A) |
| Fortement sollicité |
| 42.9 / 47.9 dB(A) |
 | ||
30 dB silencieux 40 dB(A) audible 50 dB(A) bruyant |
||
min: | ||
| HP ZBook Power 15 G9 6B8C4EA RTX A2000 Laptop GPU, i7-12700H, Samsung PM9A1 MZVL21T0HCLR | HP ZBook Studio 16 G9 62U04EA RTX A2000 Laptop GPU, i7-12800H, Micron 3400 1TB MTFDKBA1T0TFH | Dell Precision 5000 5560 RTX A2000 Laptop GPU, i7-11850H, Samsung PM9A1 MZVL22T0HBLB | Lenovo ThinkPad P15v G2 21A9000XGE T1200 Laptop GPU, i7-11800H, Toshiba XG6 KXG6AZNV512G | HP ZBook Power 15 G8 313S5EA T600 Laptop GPU, i7-11800H, Samsung PM9A1 MZVL2512HCJQ | |
|---|---|---|---|---|---|
| Noise | -4% | 10% | 2% | -8% | |
| arrêt / environnement * (dB) | 23.8 | 24 -1% | 23.4 2% | 25.21 -6% | 25.54 -7% |
| Idle Minimum * (dB) | 23.8 | 24 -1% | 23.6 1% | 25.21 -6% | 25.54 -7% |
| Idle Average * (dB) | 23.8 | 27.7 -16% | 23.6 1% | 25.21 -6% | 25.54 -7% |
| Idle Maximum * (dB) | 23.8 | 27.7 -16% | 23.6 1% | 25.21 -6% | 25.54 -7% |
| Load Average * (dB) | 42.9 | 39.8 7% | 25.8 40% | 39.09 9% | 48.85 -14% |
| Witcher 3 ultra * (dB) | 44.5 | 44.3 -0% | 40.1 10% | 36.6 18% | 46.58 -5% |
| Load Maximum * (dB) | 47.9 | 47.7 -0% | 41.4 14% | 43.53 9% | 50.98 -6% |
* ... Moindre est la valeur, meilleures sont les performances
Températures
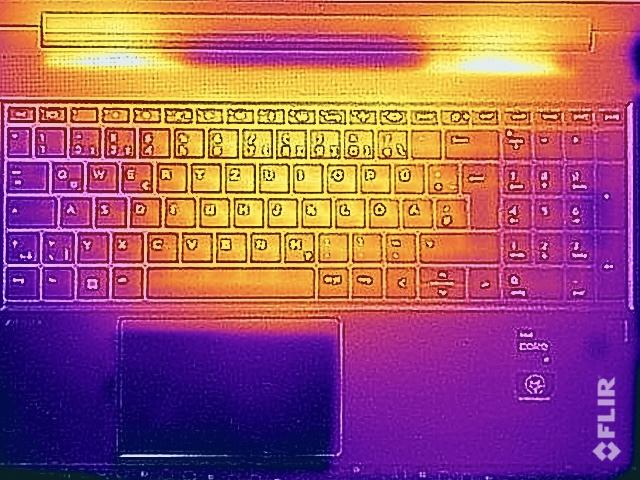
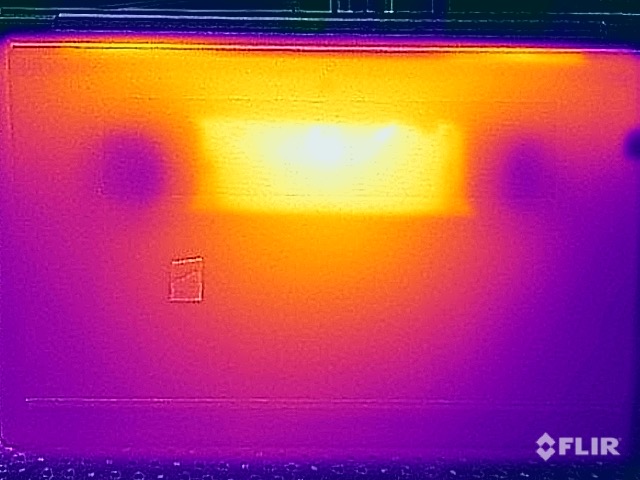
Les températures de surface de la station de travail mobile restent généralement très basses dans le cadre d'une utilisation quotidienne, ne donnant aucune raison de s'inquiéter, même en charge. À 48 °C, le seul point chaud se situe en bas, dans la zone centrale vers l'arrière, mais grâce à sa position, vous pouvez toujours poser l'appareil sur vos genoux. En revanche, la partie supérieure de l'unité de base, y compris le clavier, reste nettement plus froide, avec un maximum de 40 °C (104 °F).
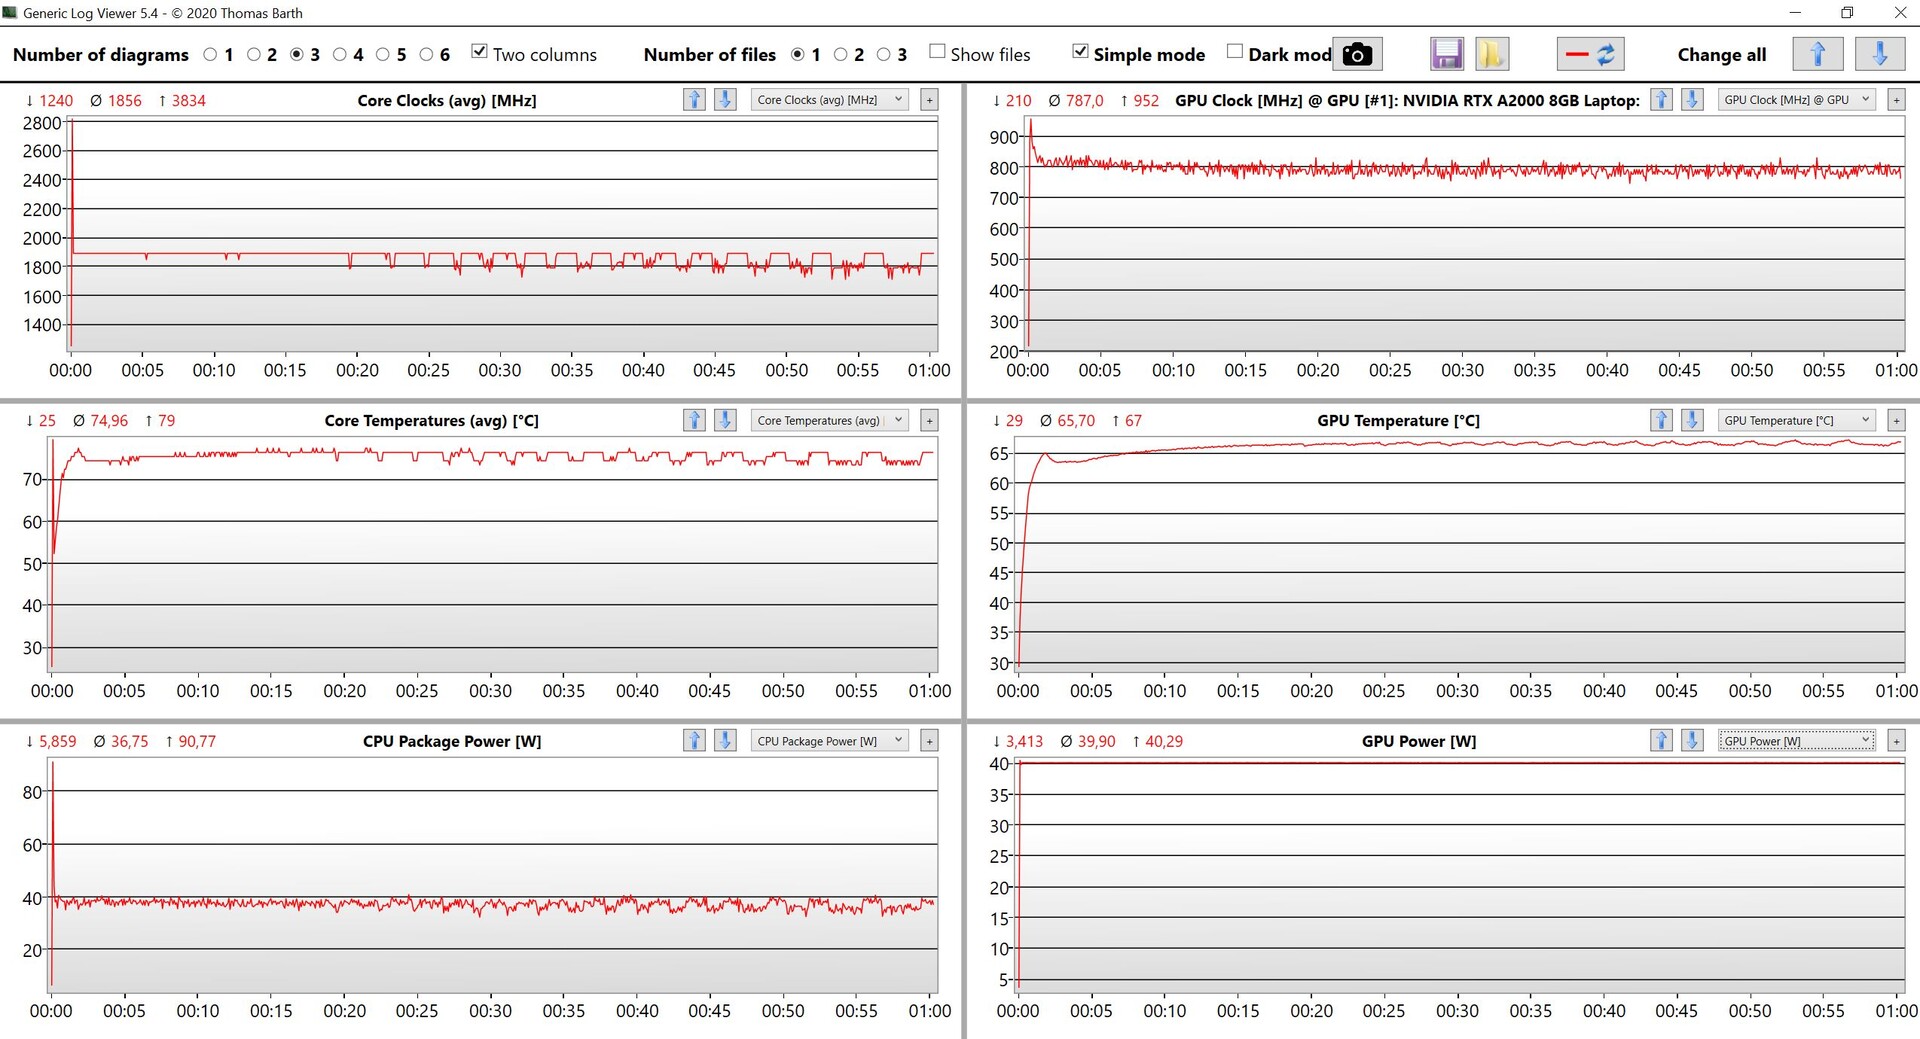
Pendant le test de stress, le processeur se stabilise à 35-39 watts après un bref pic de 90 watts, tandis que la carte graphique reste stable à 40 watts. Après le test de stress, les performances ne sont pas réduites. En mode batterie, les valeurs baissent légèrement, le processeur pouvant encore consommer 25 watts et la carte graphique, 30 watts en charge combinée.
(±) La température maximale du côté supérieur est de 40.3 °C / 105 F, par rapport à la moyenne de 38.2 °C / 101 F, allant de 22.2 à 69.8 °C pour la classe Workstation.
(-) Le fond chauffe jusqu'à un maximum de 48.3 °C / 119 F, contre une moyenne de 41.1 °C / 106 F
(+) En utilisation inactive, la température moyenne du côté supérieur est de 23.1 °C / 74 F, par rapport à la moyenne du dispositif de 32 °C / 90 F.
(±) En jouant à The Witcher 3, la température moyenne du côté supérieur est de 33.5 °C / 92 F, alors que la moyenne de l'appareil est de 32 °C / 90 F.
(+) Les repose-poignets et le pavé tactile sont plus froids que la température de la peau avec un maximum de 28.6 °C / 83.5 F et sont donc froids au toucher.
(±) La température moyenne de la zone de l'appui-paume de dispositifs similaires était de 27.8 °C / 82 F (-0.8 °C / #-1.5 F).
| HP ZBook Power 15 G9 6B8C4EA Intel Core i7-12700H, NVIDIA RTX A2000 Laptop GPU | HP ZBook Studio 16 G9 62U04EA Intel Core i7-12800H, NVIDIA RTX A2000 Laptop GPU | Dell Precision 5000 5560 Intel Core i7-11850H, NVIDIA RTX A2000 Laptop GPU | Lenovo ThinkPad P15v G2 21A9000XGE Intel Core i7-11800H, NVIDIA T1200 Laptop GPU | HP ZBook Power 15 G8 313S5EA Intel Core i7-11800H, NVIDIA T600 Laptop GPU | |
|---|---|---|---|---|---|
| Heat | -14% | -26% | -18% | 2% | |
| Maximum Upper Side * (°C) | 40.3 | 38.7 4% | 48.2 -20% | 53.8 -33% | 41.4 -3% |
| Maximum Bottom * (°C) | 48.3 | 53.4 -11% | 42.6 12% | 52.1 -8% | 41.5 14% |
| Idle Upper Side * (°C) | 23.7 | 27.3 -15% | 34.8 -47% | 27.6 -16% | 23.8 -0% |
| Idle Bottom * (°C) | 23.8 | 31.6 -33% | 35.2 -48% | 27.7 -16% | 25 -5% |
* ... Moindre est la valeur, meilleures sont les performances
Haut-parleurs
Les deux haut-parleurs stéréo représentent l'une des faiblesses de la station de travail mobile, car leur son est très fin et peu convaincant. Bien qu'ils fassent leur travail pendant les vidéoconférences ou les appels vocaux, nous recommandons vivement l'utilisation d'un casque ou de haut-parleurs externes pour la reproduction de musique ou de films.
HP ZBook Power 15 G9 6B8C4EA analyse audio
(±) | le niveau sonore du haut-parleur est moyen mais bon (77.9# dB)
Basses 100 - 315 Hz
(-) | presque aucune basse - en moyenne 28.5% plus bas que la médiane
(±) | la linéarité des basses est moyenne (9.4% delta à la fréquence précédente)
Médiums 400 - 2000 Hz
(+) | médiane équilibrée - seulement 3.9% de la médiane
(+) | les médiums sont linéaires (5.1% delta à la fréquence précédente)
Aiguës 2 - 16 kHz
(±) | sommets plus élevés - en moyenne 5.1% plus élevés que la médiane
(+) | les aigus sont linéaires (4.1% delta à la fréquence précédente)
Globalement 100 - 16 000 Hz
(±) | la linéarité du son global est moyenne (22.9% de différence avec la médiane)
Par rapport à la même classe
» 82% de tous les appareils testés de cette catégorie étaient meilleurs, 3% similaires, 15% pires
» Le meilleur avait un delta de 7%, la moyenne était de 17%, le pire était de 35%.
Par rapport à tous les appareils testés
» 68% de tous les appareils testés étaient meilleurs, 6% similaires, 26% pires
» Le meilleur avait un delta de 4%, la moyenne était de 23%, le pire était de 134%.
Dell Precision 5000 5560 analyse audio
(±) | le niveau sonore du haut-parleur est moyen mais bon (75.2# dB)
Basses 100 - 315 Hz
(±) | basse réduite - en moyenne 9.8% inférieure à la médiane
(±) | la linéarité des basses est moyenne (8.8% delta à la fréquence précédente)
Médiums 400 - 2000 Hz
(±) | médiane supérieure - en moyenne 5.7% supérieure à la médiane
(+) | les médiums sont linéaires (3.7% delta à la fréquence précédente)
Aiguës 2 - 16 kHz
(+) | des sommets équilibrés - à seulement 2.7% de la médiane
(+) | les aigus sont linéaires (6.4% delta à la fréquence précédente)
Globalement 100 - 16 000 Hz
(+) | le son global est linéaire (14.8% différence à la médiane)
Par rapport à la même classe
» 33% de tous les appareils testés de cette catégorie étaient meilleurs, 6% similaires, 61% pires
» Le meilleur avait un delta de 7%, la moyenne était de 17%, le pire était de 35%.
Par rapport à tous les appareils testés
» 20% de tous les appareils testés étaient meilleurs, 4% similaires, 76% pires
» Le meilleur avait un delta de 4%, la moyenne était de 23%, le pire était de 134%.
Consommation d'énergie
Malgré l'écran 4K, le ZBook Power 15 G9 est un appareil très efficace avec un maximum de 8,5 watts en mode veille. En charge, vous pouvez vous attendre à environ 85-100 watts, et après un court pic de consommation de 139 watts, il se stabilise également dans cette fourchette après plusieurs minutes lors du test de stress. L'alimentation de 150 watts fournie est donc tout à fait suffisante.
| Éteint/en veille | |
| Au repos | |
| Fortement sollicité |
|
Légende:
min: | |
Power Consumption The Witcher 3 / Stress Test
Power Consumption With External Monitor
Autonomie de la batterie
La grande batterie de 83 Wh reste inchangée, permettant une bonne autonomie, même si le prédécesseur avec une dalle Full HD durait encore plus longtemps. Si l'on considère le panneau 4K, avec environ 10 heures dans notre test WLAN à 150 cd/m² (correspondant à 65% de la luminosité maximale dans notre unité de test) et encore 9 heures à la luminosité maximale, les résultats sont très bons. L'affichage à faible consommation devient définitivement perceptible ici.
Il faut environ 2,5 heures pour recharger complètement l'appareil lorsqu'il est allumé, 50% étant déjà disponibles après 34 minutes, et 80% après 70 minutes.
Points positifs
Points négatifs
Verdict - Le HP ZBook Power 15 G9 bénéficierait d'un refroidissement plus puissant
Le ZBook Power 15 G9 est une station de travail d'entrée de gamme, ciblant les utilisateurs qui ont besoin d'une performance fiable et de cartes graphiques professionnelles. Hormis le processeur, notre configuration de test correspond déjà à la configuration maximale avec l'écran 4K, la Nvidia RTX A2000 et un stockage abondant, ce qui fait bien sûr aussi grimper le prix. Comme son prédécesseurTest du HP ZBook Power 15 G8 : du haut de gamme dans une station de travail abordable , le ZBook Power G9 offre également des performances solides dans de nombreux domaines. Mais en particulier dans les performances du CPU, les résultats ne sont pas toujours constants. La situation s'est légèrement stabilisée avec quelques mises à jour du BIOS, mais la station de travail n'est toujours pas en mesure d'utiliser pleinement le potentiel réel du Core i7-12700H.
En particulier en ce qui concerne l'évolution des performances, le ZBook Power 15 G9 ne parvient pas à atteindre les valeurs maximales, mais grâce à certaines mises à jour du BIOS, les performances du CPU se sont largement stabilisées. Après un calibrage, l'écran 4K à faible consommation offre une bonne qualité d'image et permet une longue autonomie.
Cependant, pour être juste, nous devons également mentionner que les stations de travail d'entrée de gamme des concurrents, comme le Lenovo ThinkPad P15v ou Dell Precision 5560ne sont pas beaucoup plus performantes non plus, les trois modèles étant globalement au même niveau. La dalle 4K est fondamentalement un très bon choix, car elle fonctionne très efficacement sans faire grimper la consommation d'énergie, mais vous devriez la calibrer si possible.
Prix et disponibilité
Le ZBook Power 15 G9 est actuellement disponible directement auprès de HP à partir de 1455 $ environ, et certaines configurations sont également disponibles chez Amazon, par exemple.
HP ZBook Power 15 G9 6B8C4EA
- 01/05/2023 v7 (old)
Andreas Osthoff
Price comparison

