Test du HP ZBook Power 15 G8 : du haut de gamme dans une station de travail abordable
En tant que station de travail abordable, le HP ZBook Power 15 G8 apporte des mises à jour pour le CPU et le GPU dans la génération actuelle, avec la configuration maximale offrant un Intel Tiger Lake Core i9-11950Het Nvidia RTX A2000. Alors qu'en plus d'un écran 4K, les CPU vPRO sont également disponibles, malheureusement les processeurs Xeon et avec cela aussi la RAM ECC ne seront pas disponibles cette année. Mais l'appareil offre tout de même de nombreuses caractéristiques d'une station de travail haut de gamme.
Pour environ 1600 Euros (~1630$), notre configuration est équipée du Intel's Core i7-11800H, Du T600 de Nvidia de Nvidia comme GPU professionnel, et d'un écran FHD. Comme concurrents directs dans le segment des stations de travail d'entrée de gamme, nous avons le Lenovo ThinkPad P15v G2et Dell Precision 3551. Notre test montrera si le ZBook Power 15 G8 avec ses composants assez puissants apporte également un bon rapport qualité-prix.
Comparaison avec les concurrents potentiels
Note | Date | Modèle | Poids | Épaisseur | Taille | Résolution | Prix |
|---|---|---|---|---|---|---|---|
| 87.7 % v7 (old) | 07/22 | HP ZBook Power 15 G8 313S5EA i7-11800H, T600 Laptop GPU | 2 kg | 22.8 mm | 15.60" | 1920x1080 | |
| 90.3 % v7 (old) | 10/21 | HP ZBook Fury 15 G8 i9-11950H, RTX A5000 Laptop GPU | 2.5 kg | 25.9 mm | 15.60" | 3840x2160 | |
| 87.8 % v7 (old) | 08/21 | HP ZBook Studio 15 G8 i9-11950H, GeForce RTX 3070 Laptop GPU | 1.9 kg | 18 mm | 15.60" | 3840x2160 | |
| 83.8 % v7 (old) | 04/21 | HP ZBook Firefly 15 G8 2C9R7EA i7-1165G7, T500 Laptop GPU | 1.8 kg | 19.2 mm | 15.60" | 1920x1080 | |
| 86.2 % v7 (old) | 06/22 | Lenovo ThinkPad P15v G2 21A9000XGE i7-11800H, T1200 Laptop GPU | 2.3 kg | 22.7 mm | 15.60" | 1920x1080 | |
| 81.2 % v7 (old) | 10/20 | Dell Precision 3000 3551 i9-10885H, Quadro P620 | 2.2 kg | 24.92 mm | 15.60" | 1920x1080 |
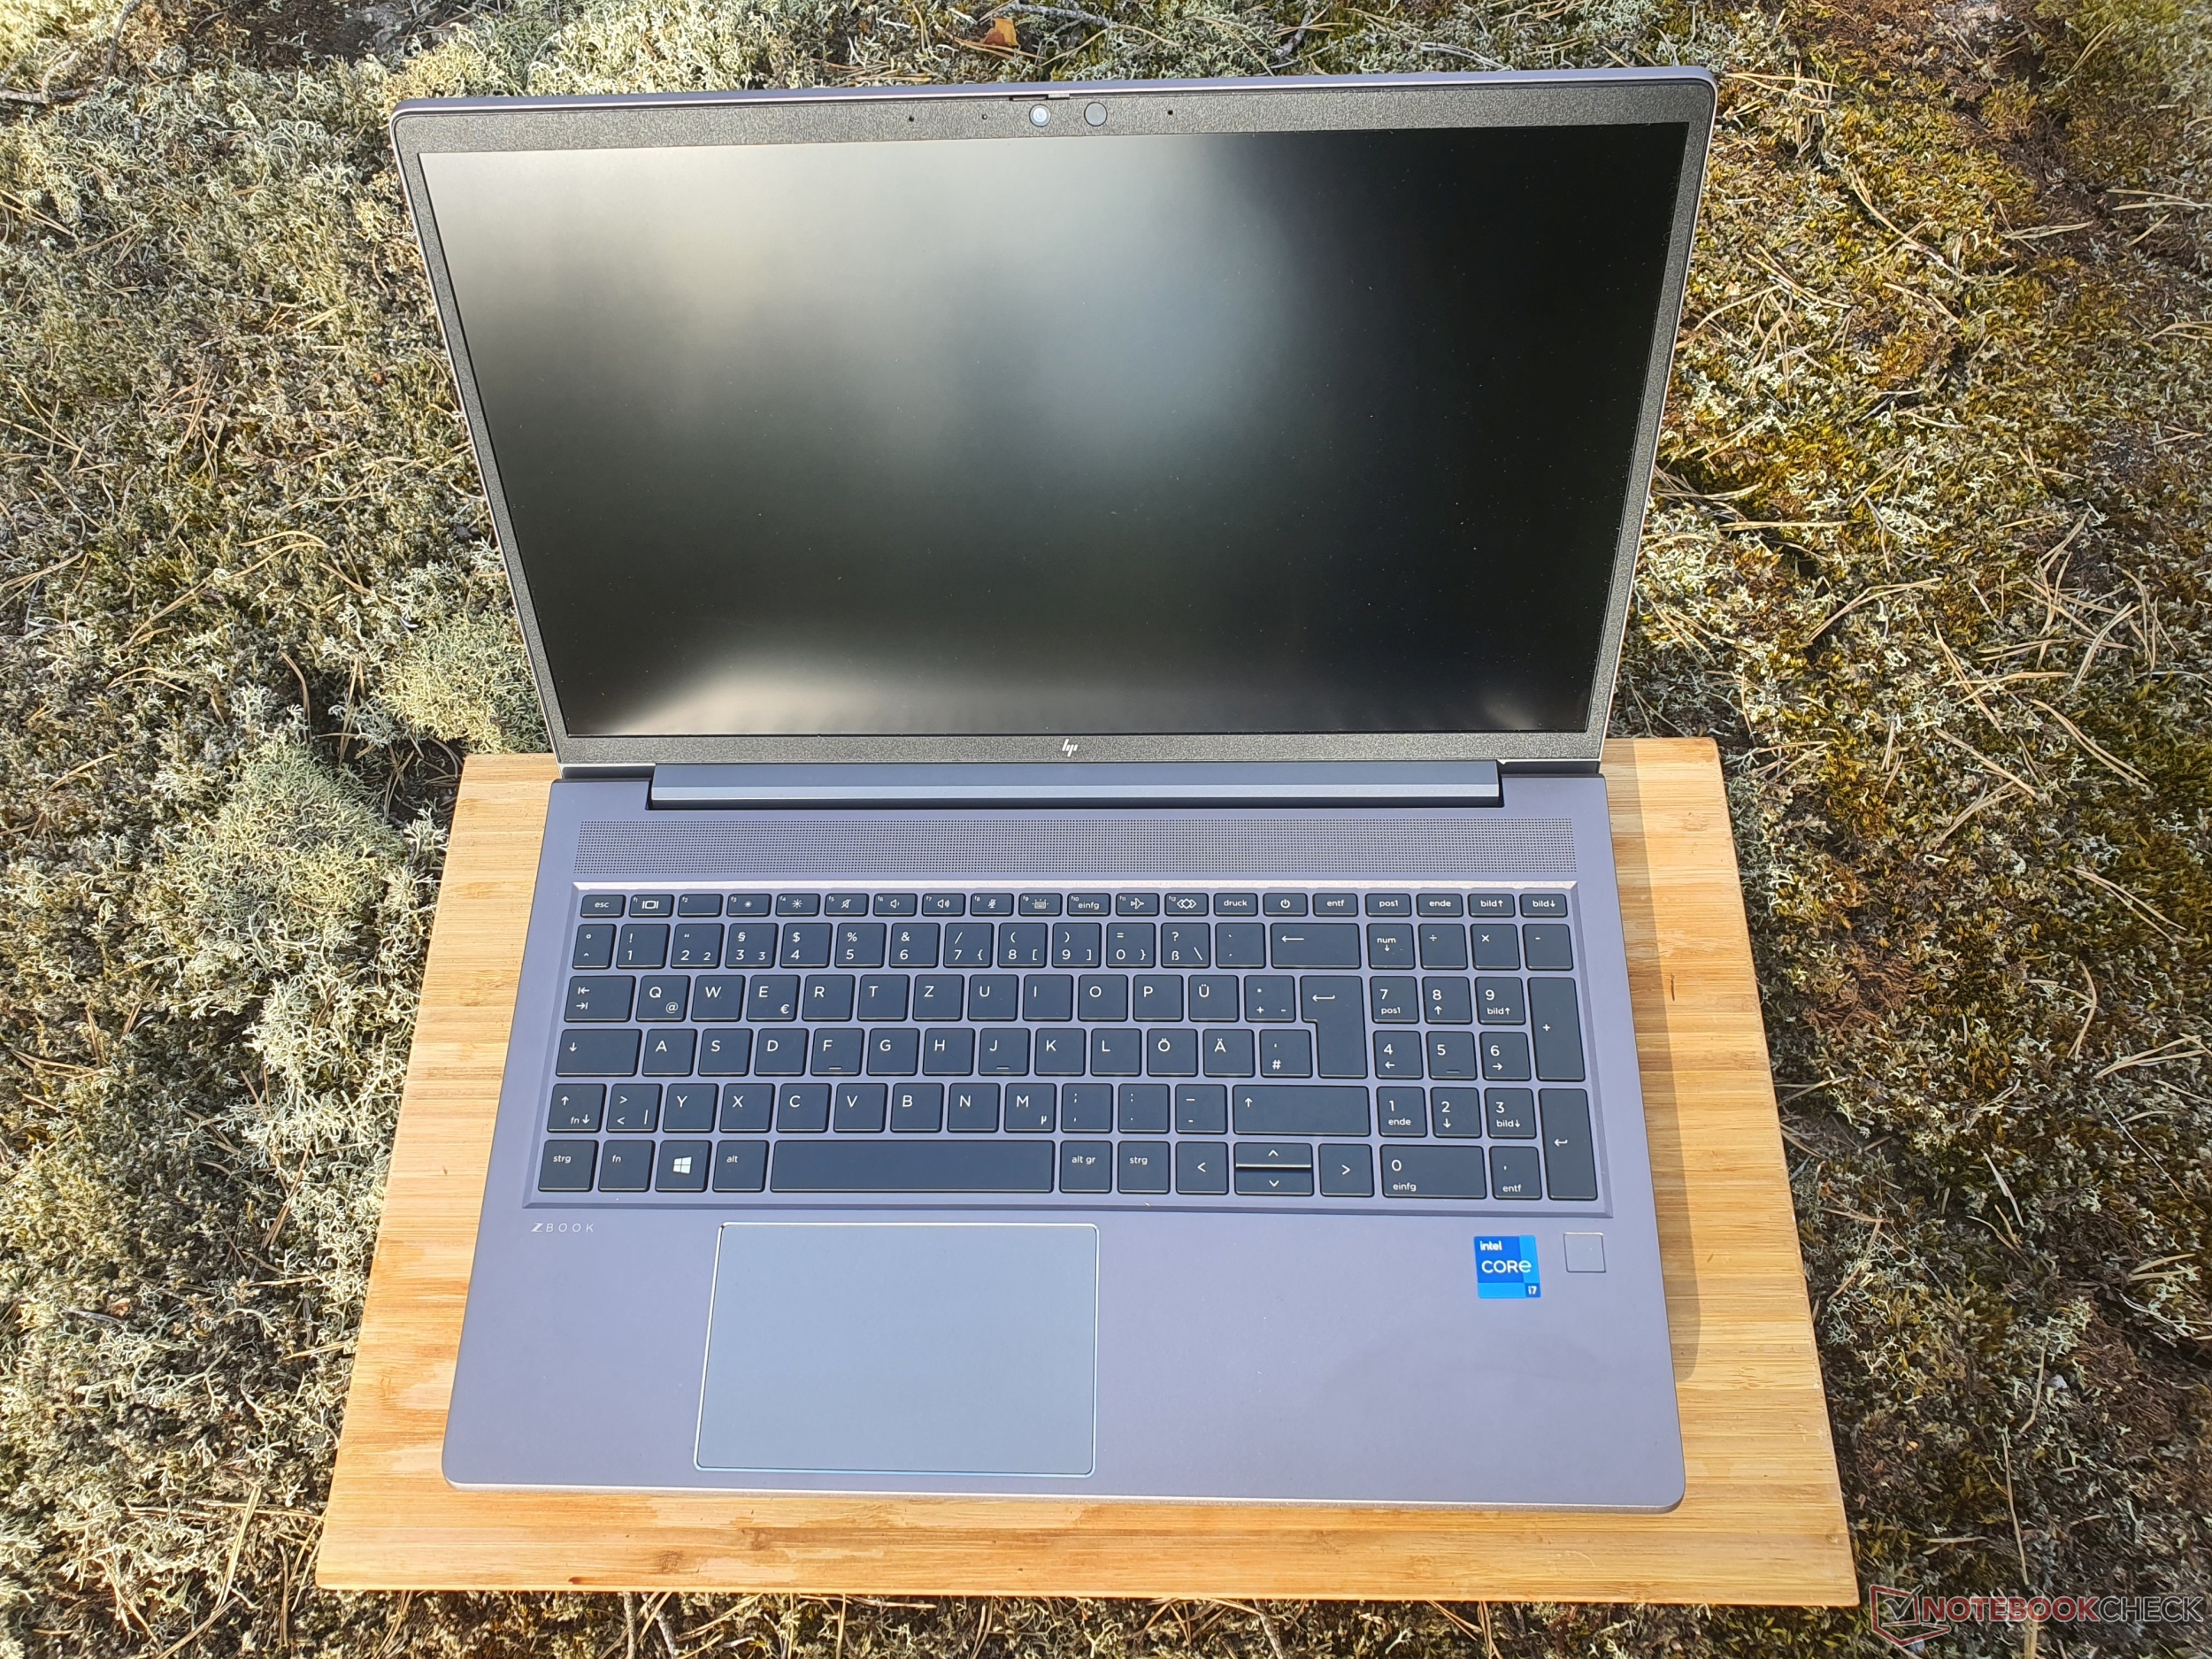
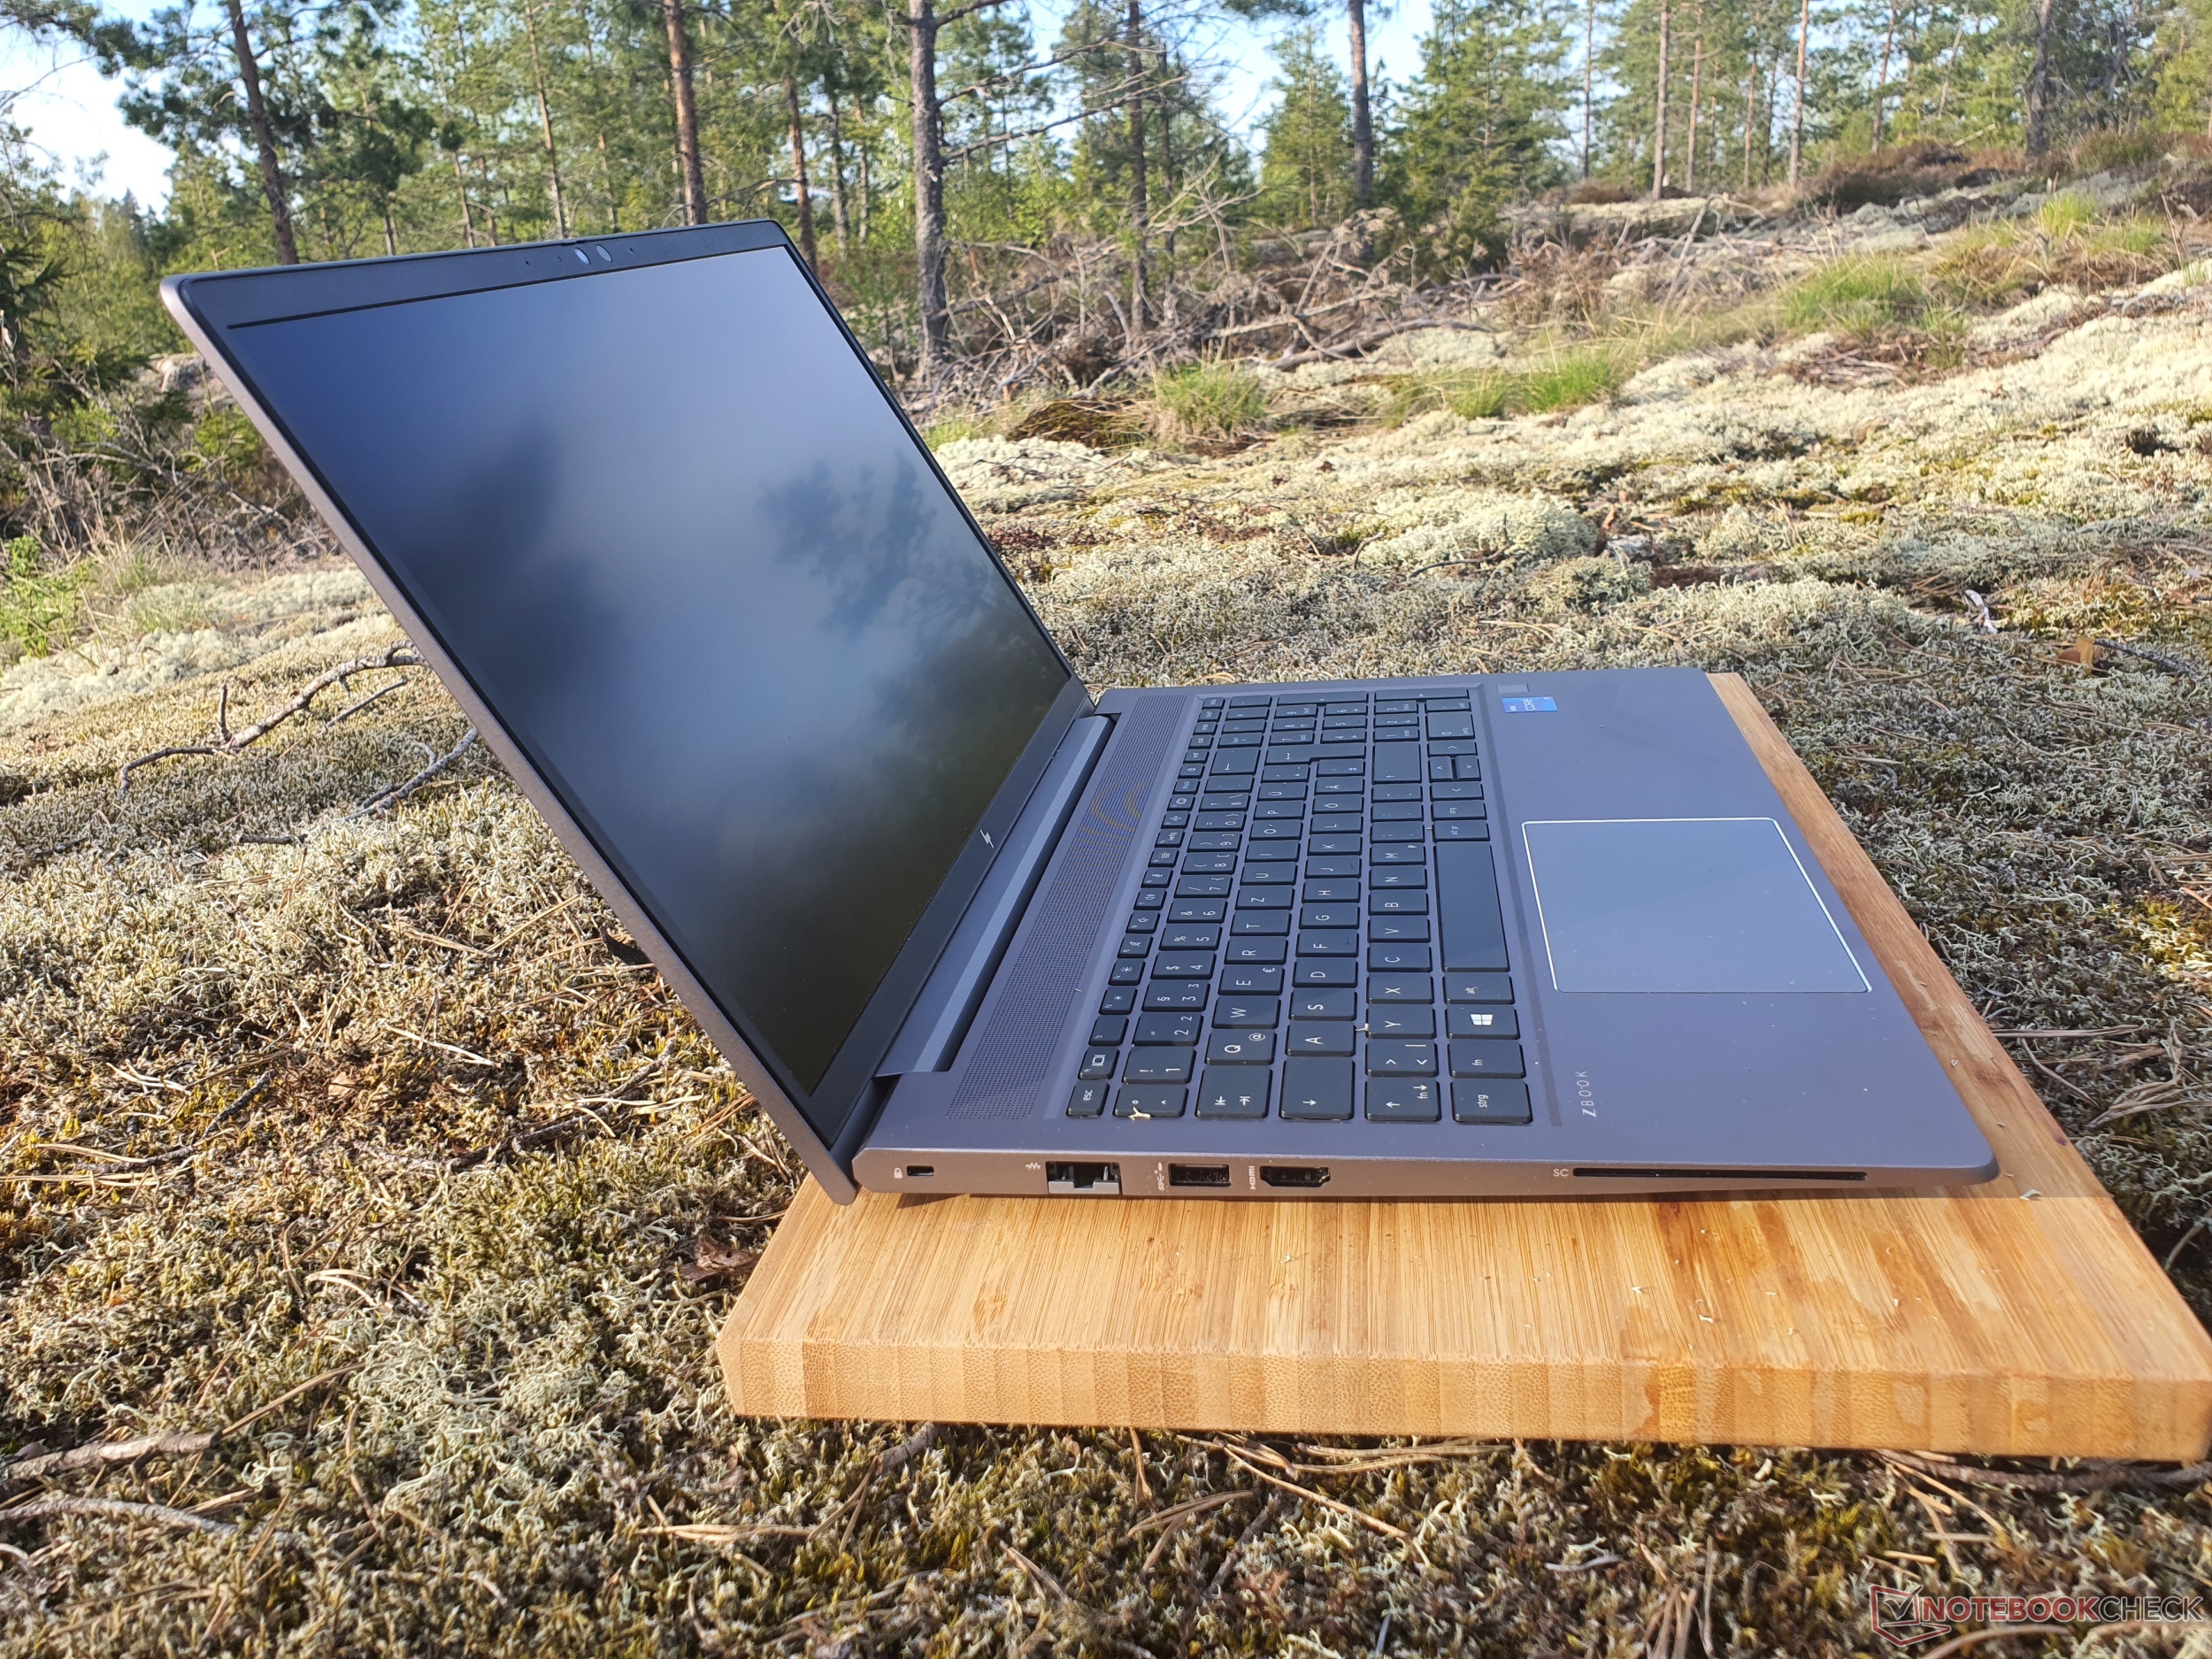
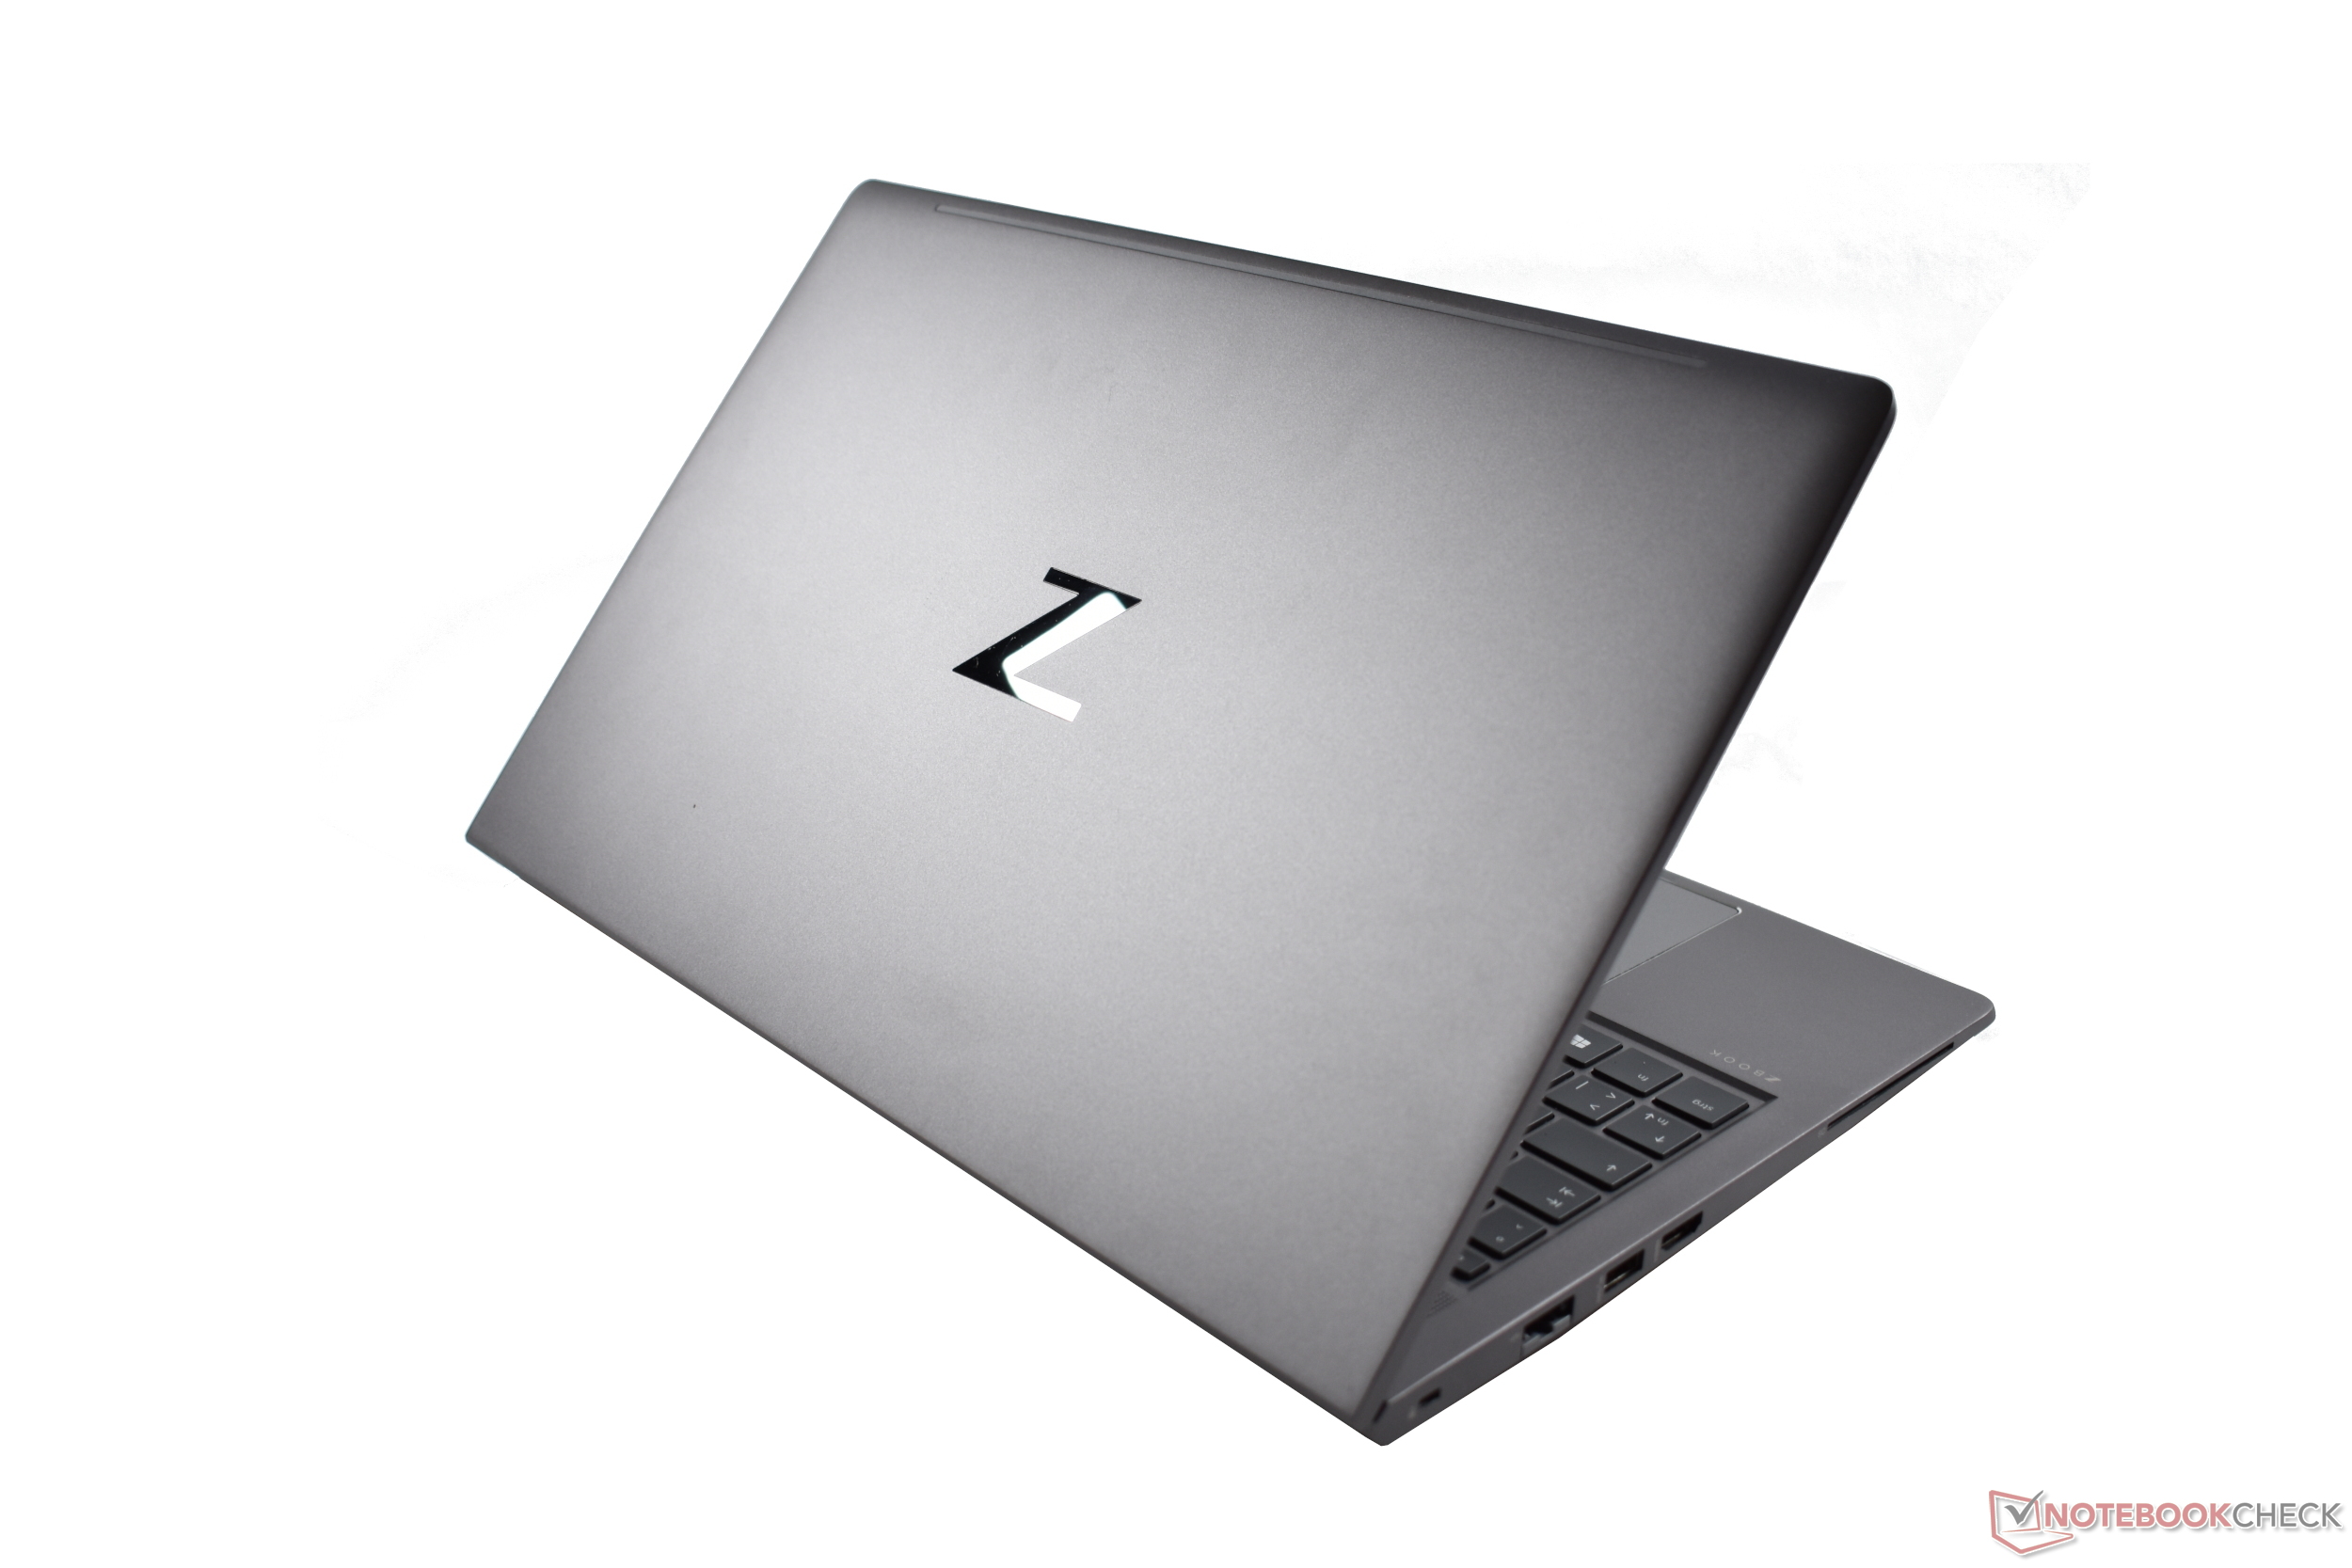
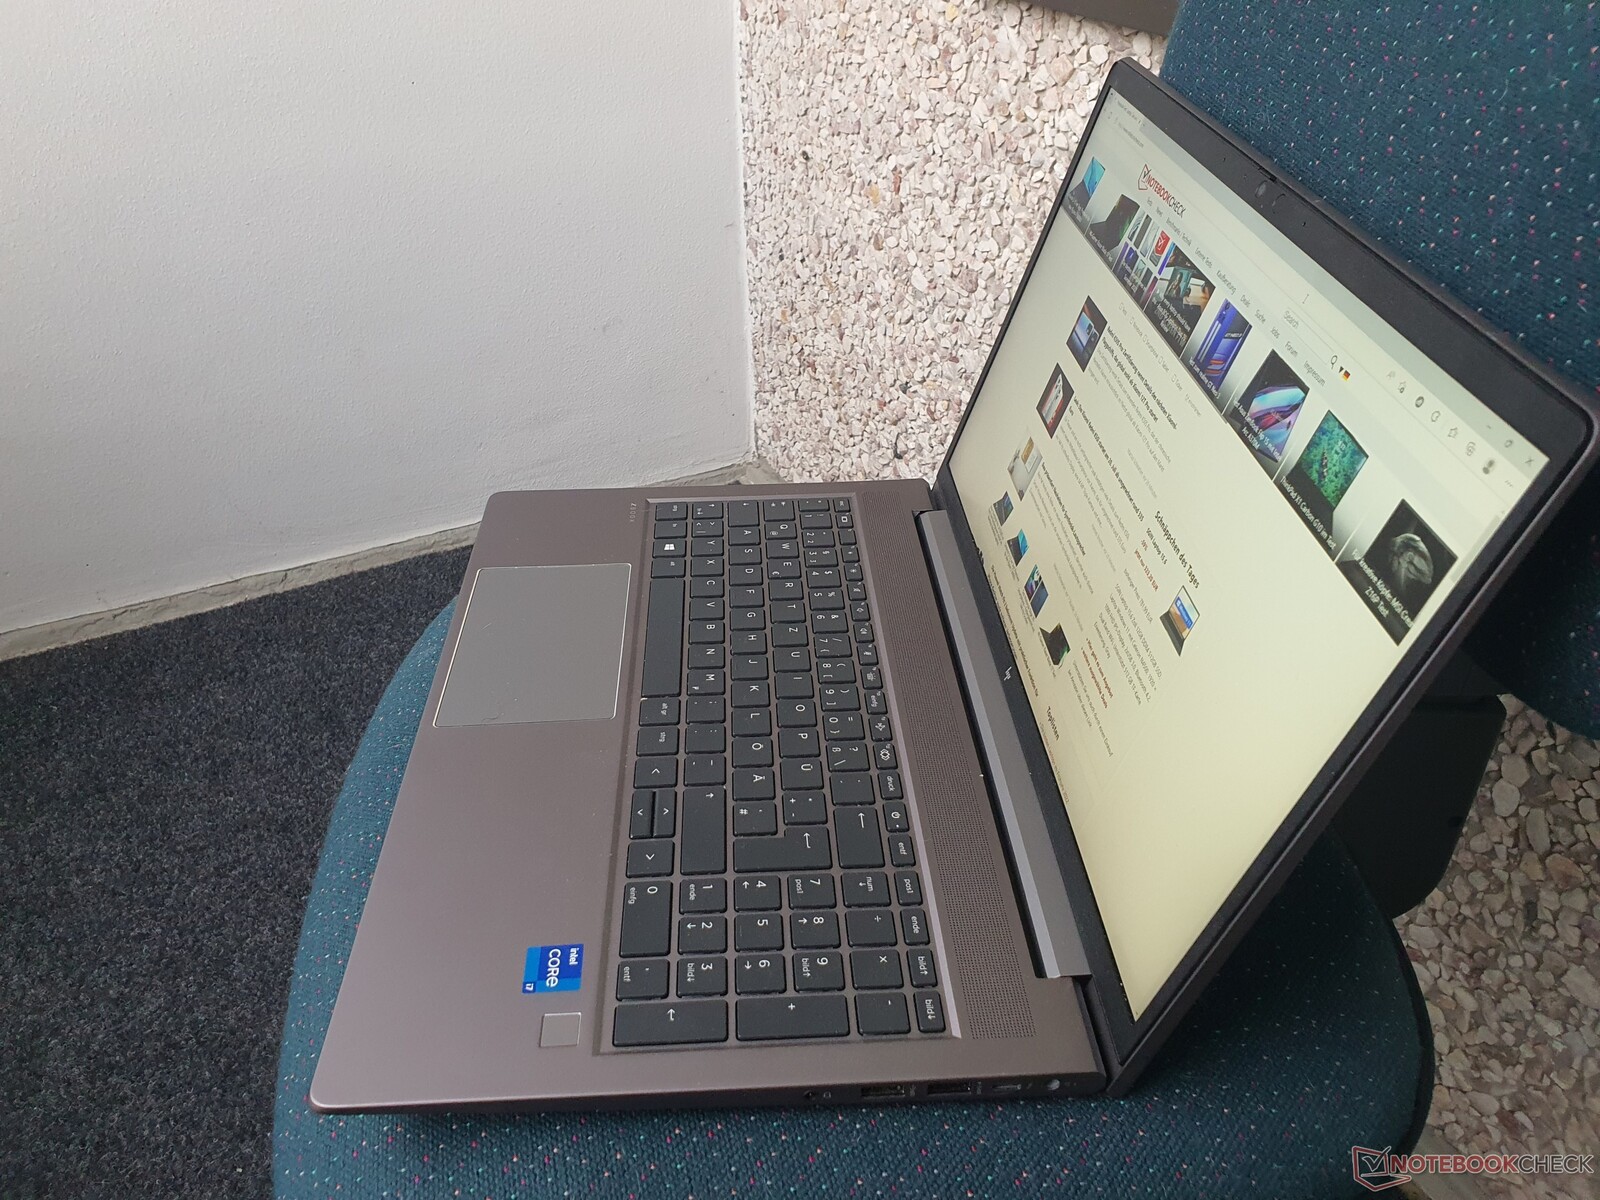
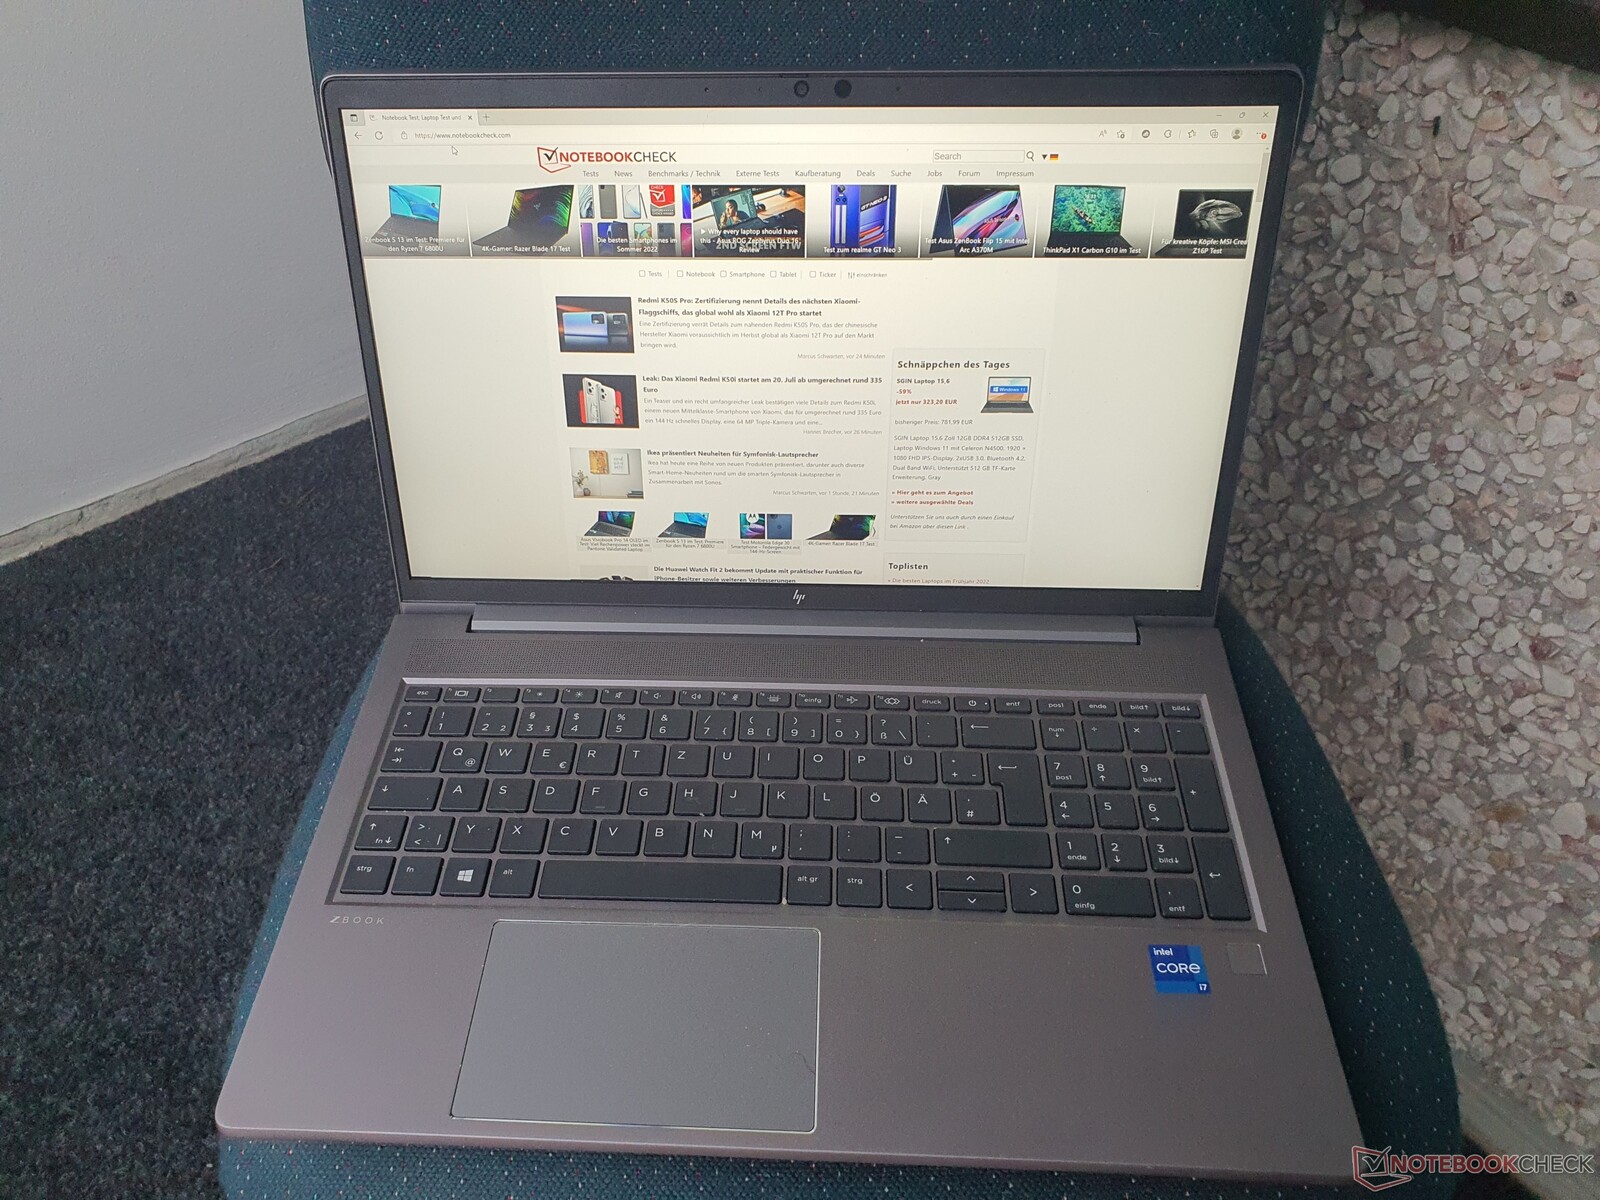
Boîtier : ZBook Power en aluminium robuste
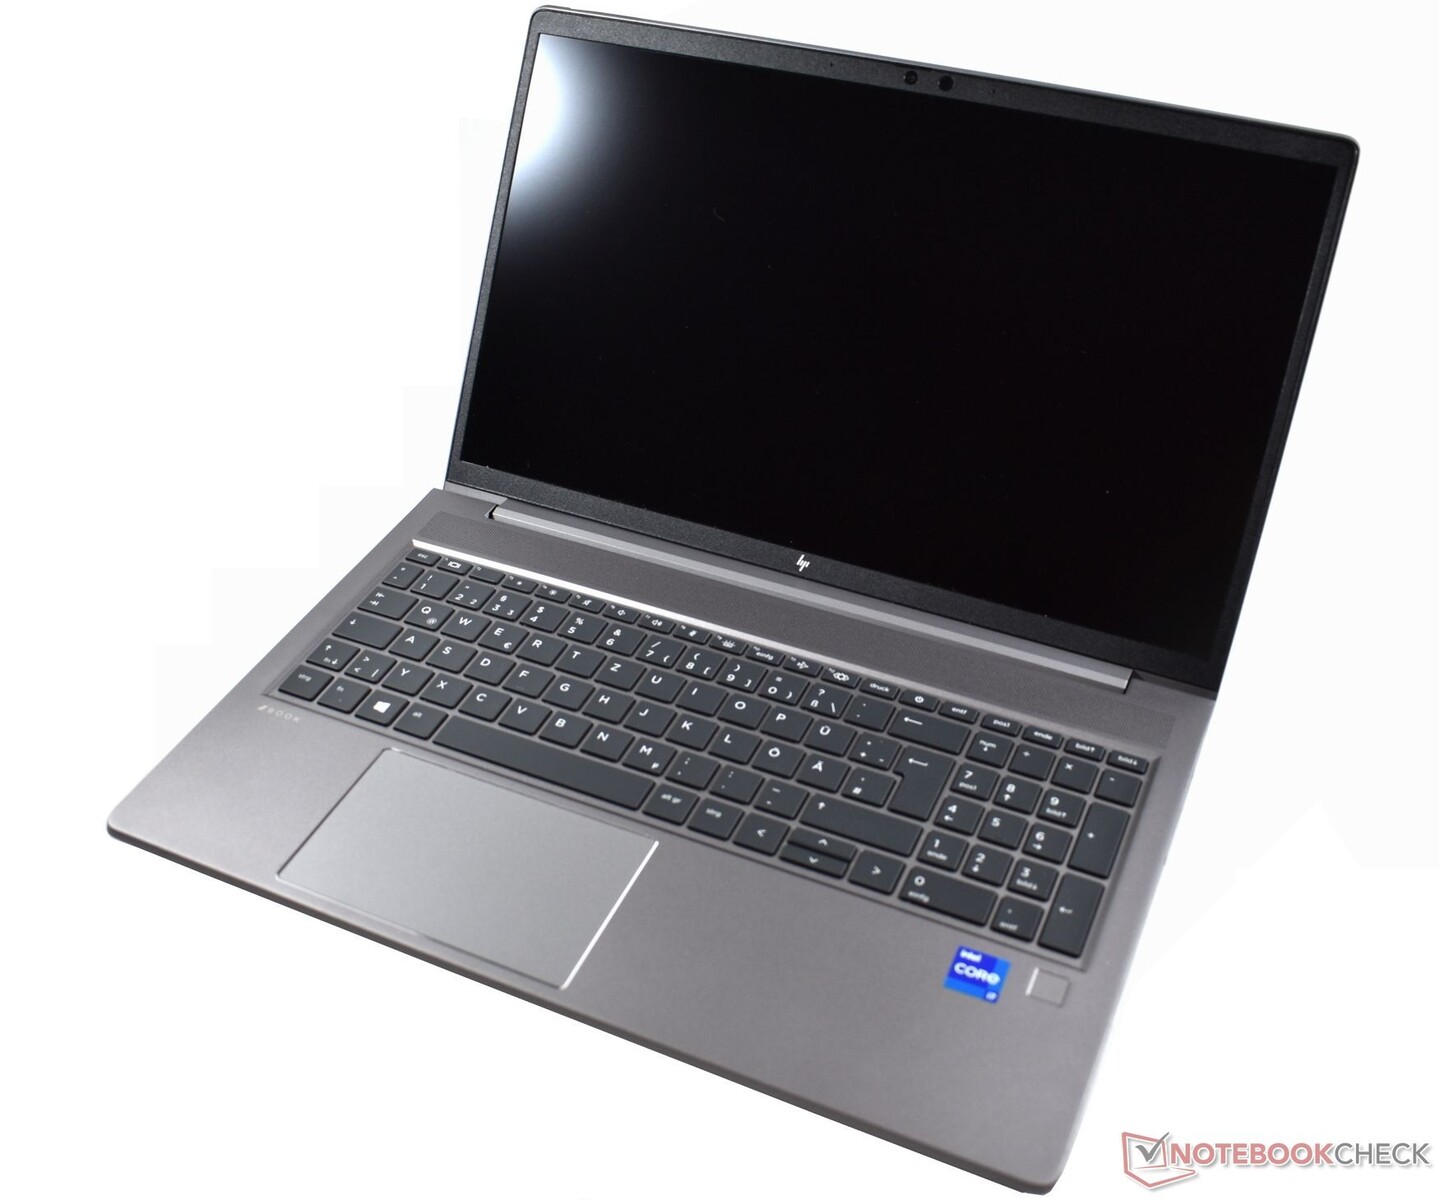
Le boîtier en aluminium gris foncé donne au ZBook Power 15 une allure élégante et une robustesse tout à fait remarquable, ce qui est également confirmé par sa certification MIL STD-810H. L'haptique, y compris les surfaces mates, ne laisse rien à désirer non plus.
L'appareil présente une finition propre, et les empreintes digitales ne sont pas un problème. Le couvercle peut être ouvert d'une seule main, et la grande charnière qui le traverse de part en part est extrêmement solide.
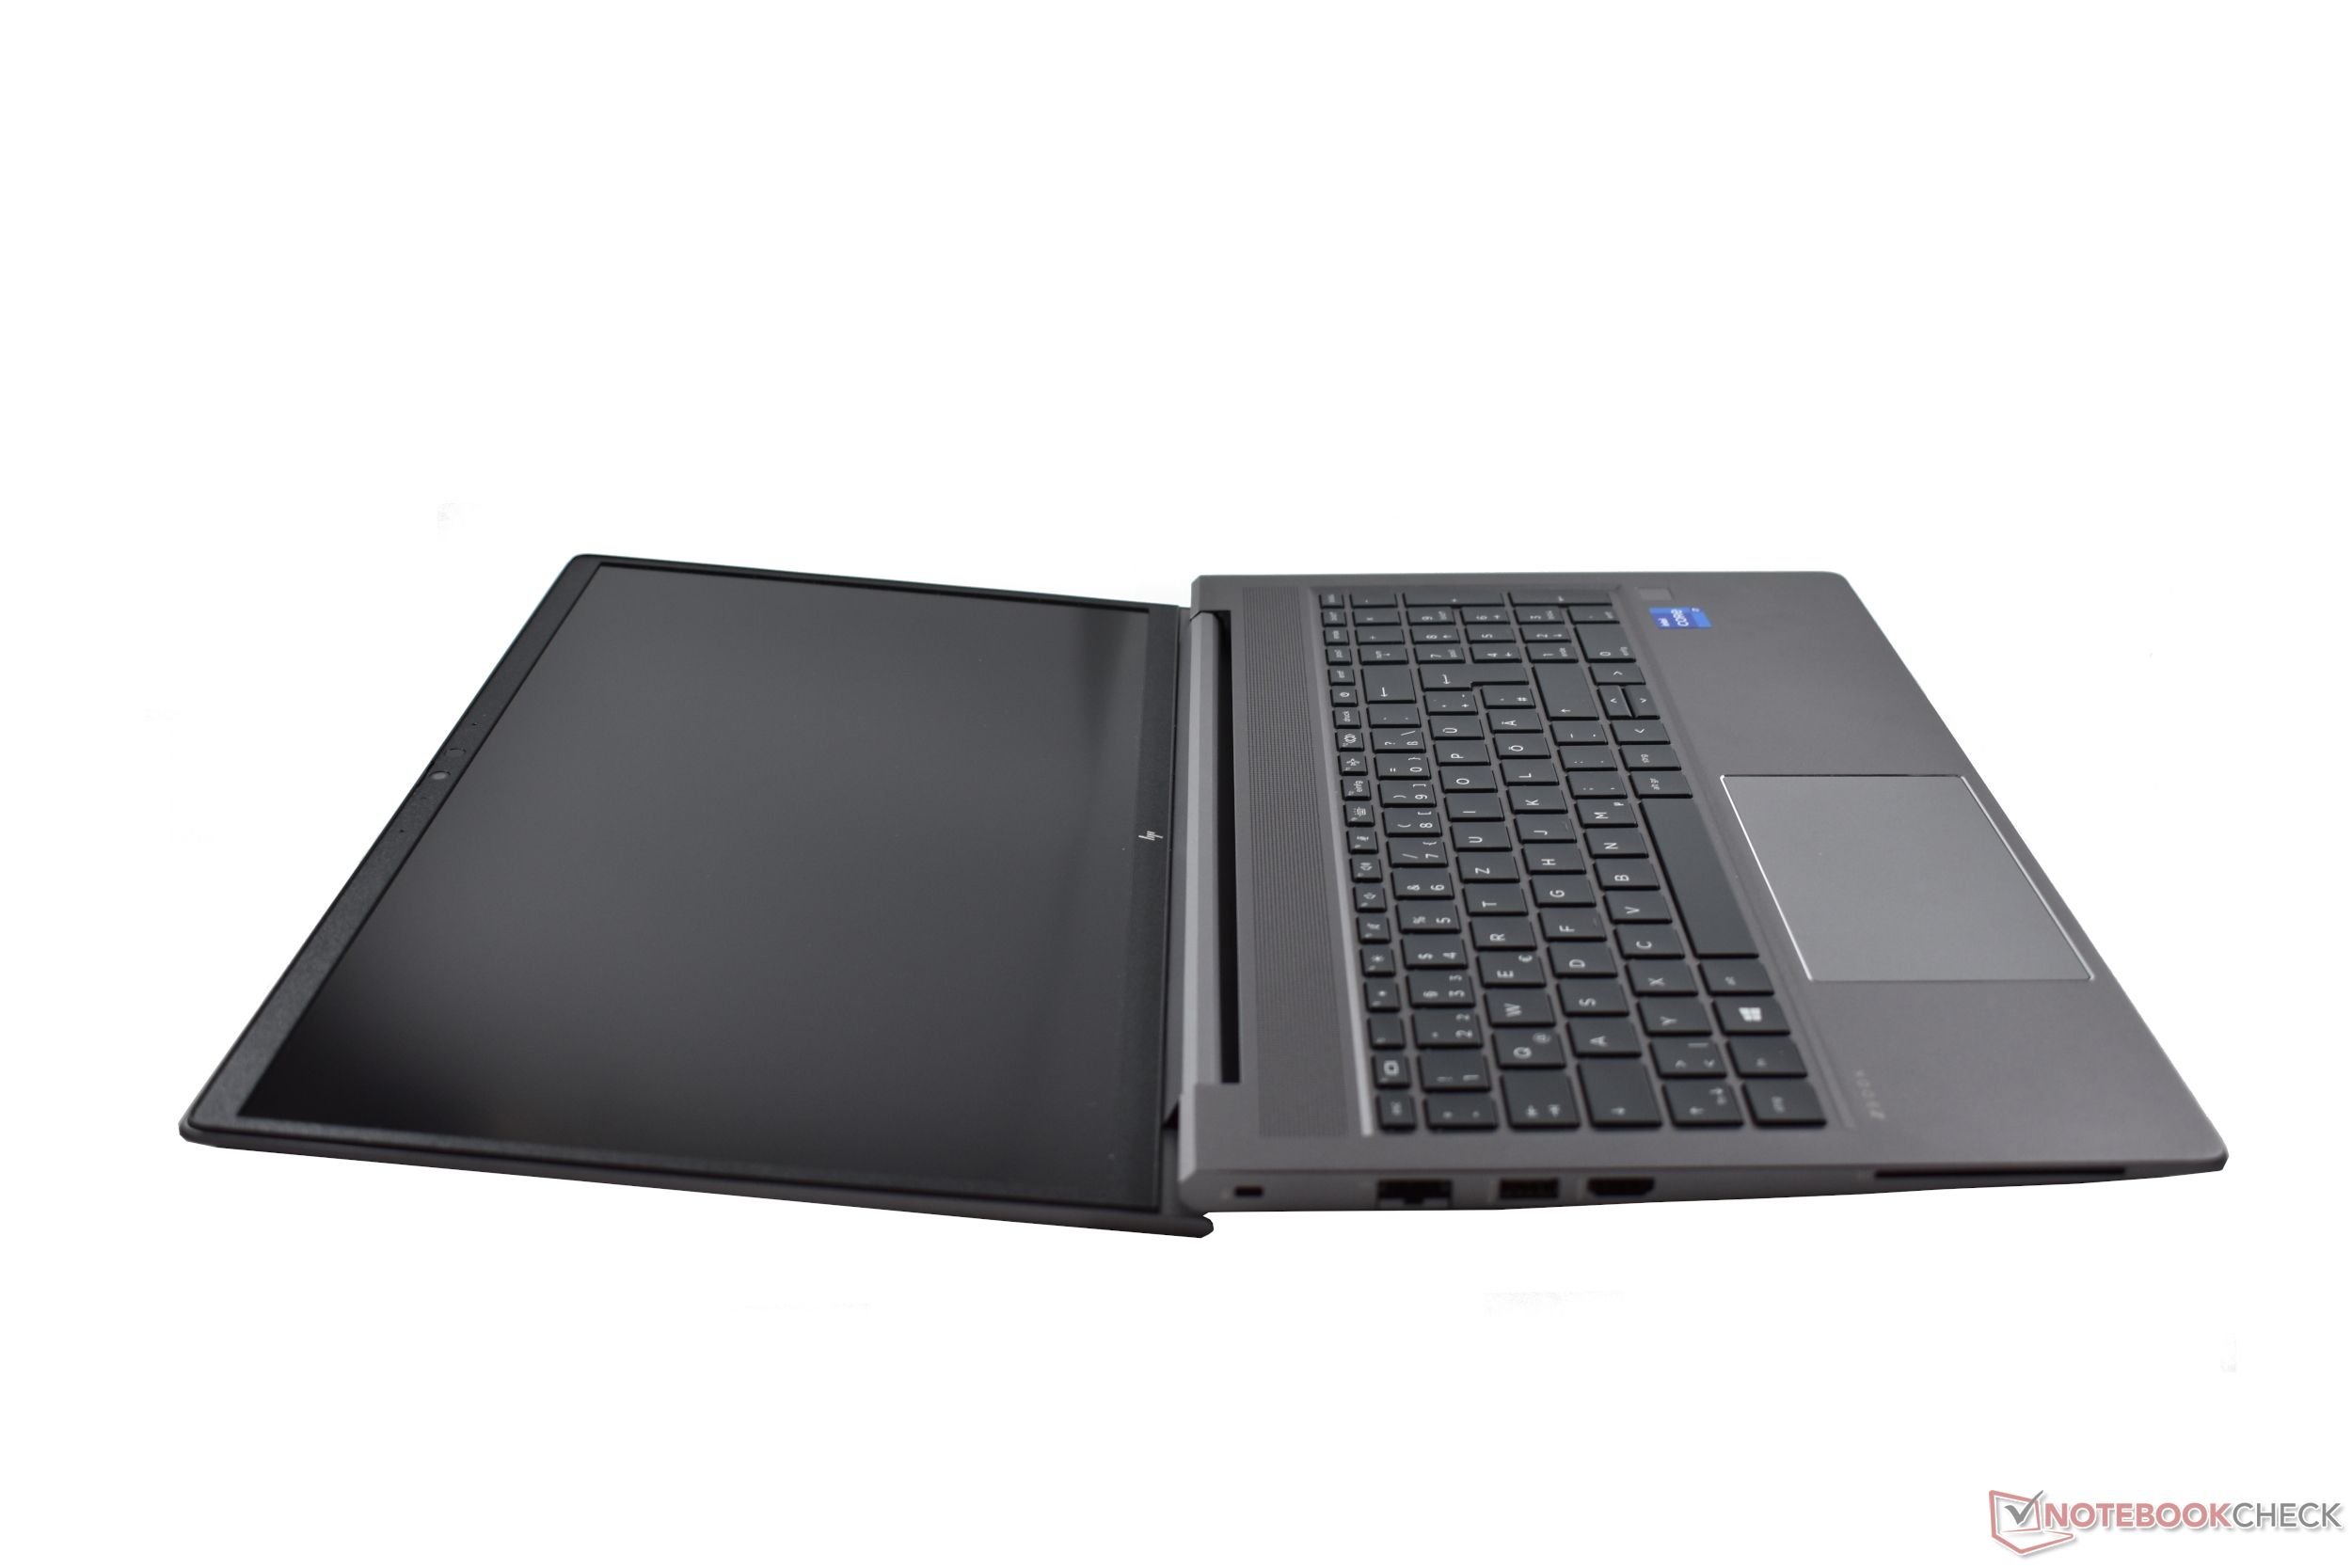
D'autre part, l'arrière du couvercle peut être facilement enfoncé avec une pression d'un seul point, bien que cela n'entraîne aucune distorsion de l'image. Les points positifs sont le fait que le couvercle, avec ses bords fins, ne peut être tourné que de façon minimale et que l'angle d'ouverture maximum est d'environ 180 degrés.
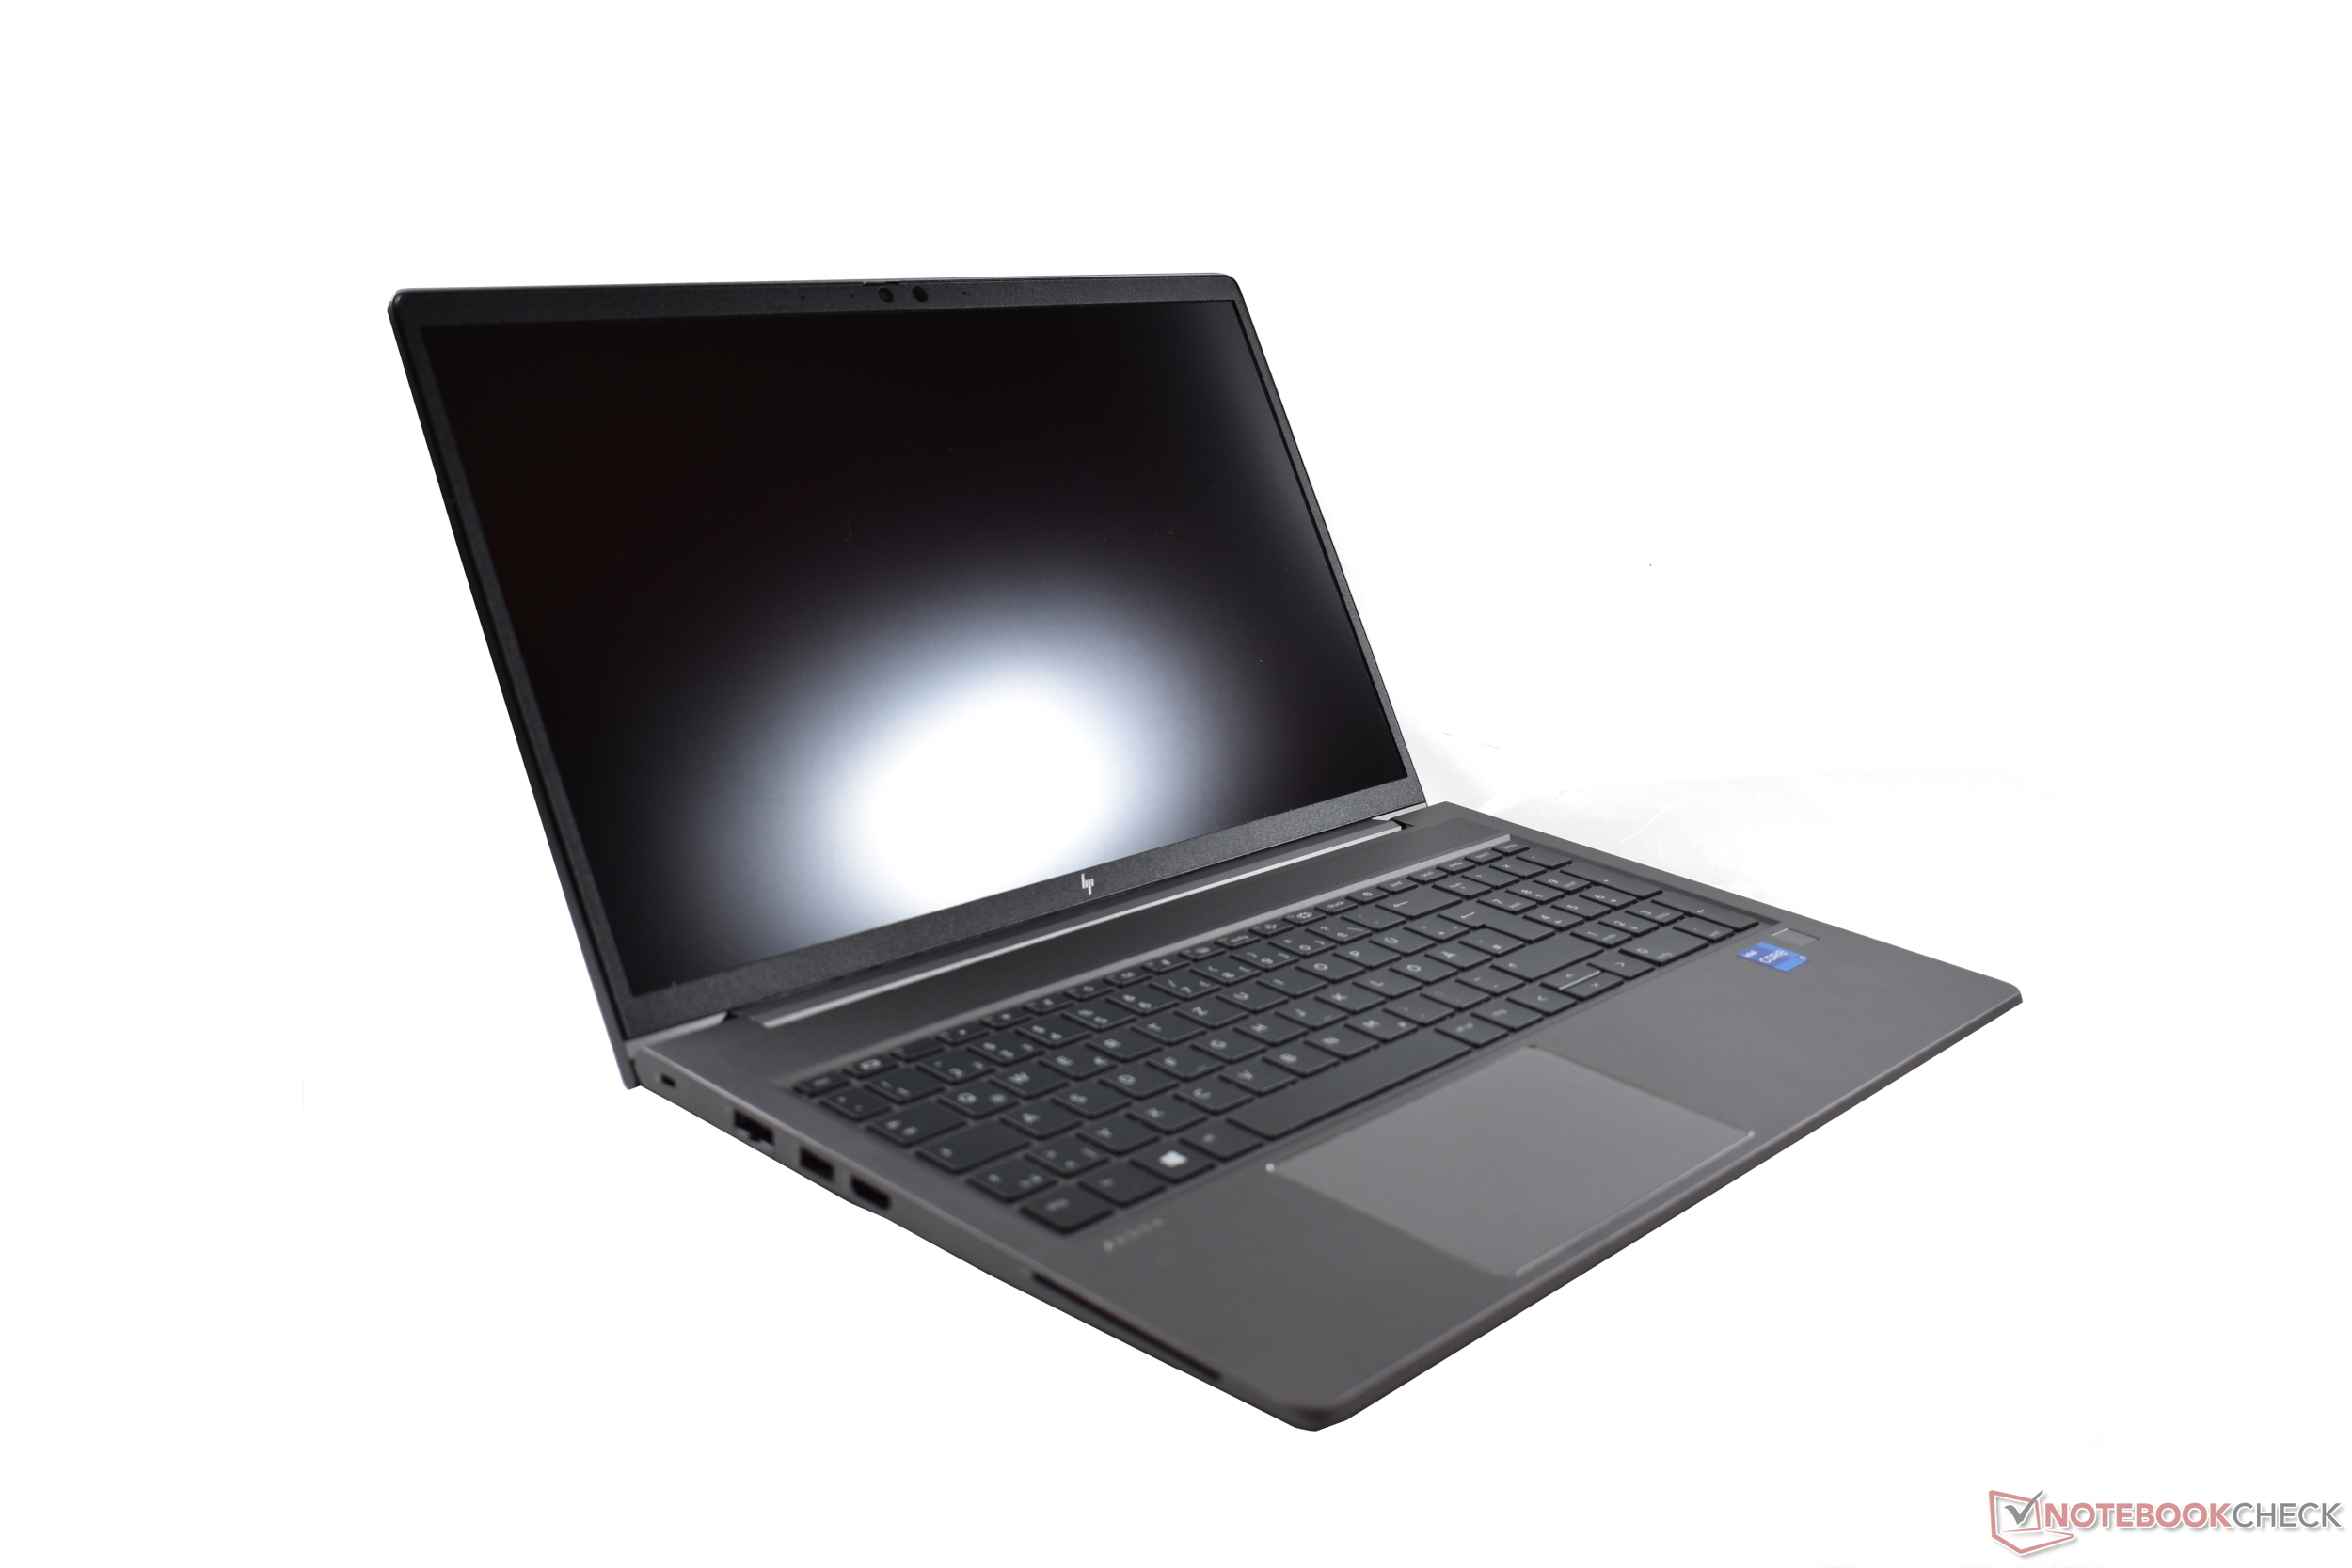
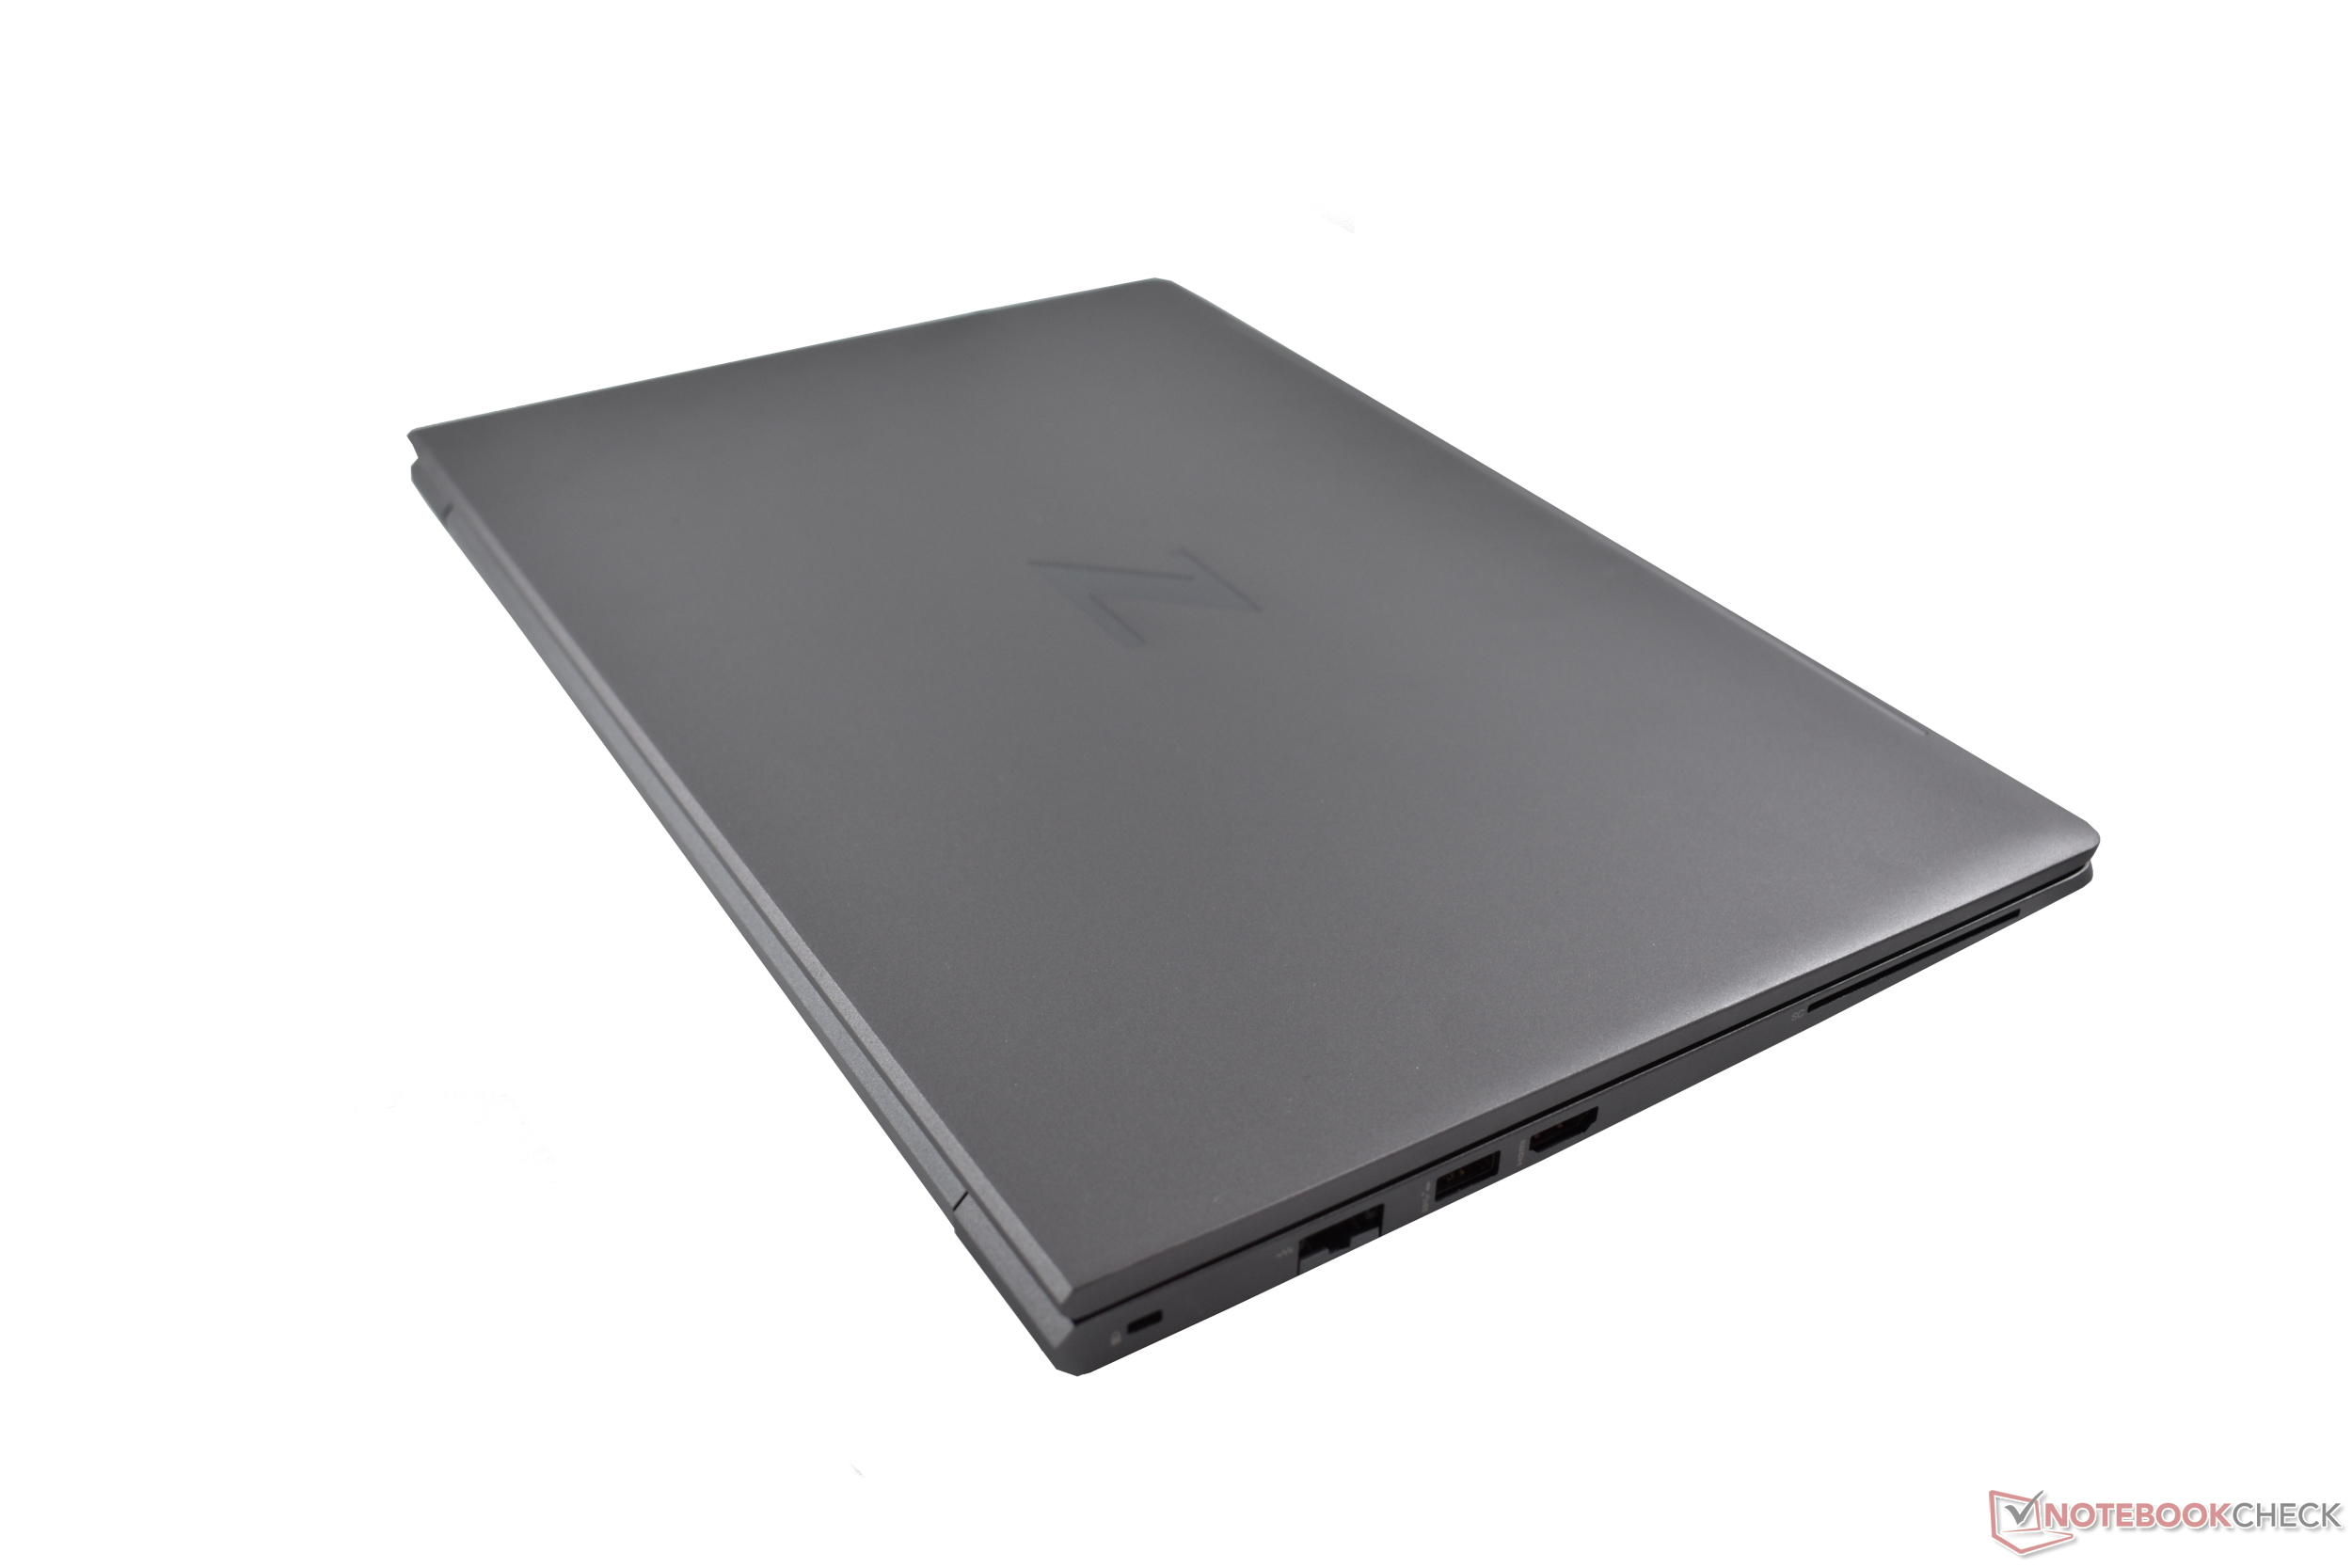
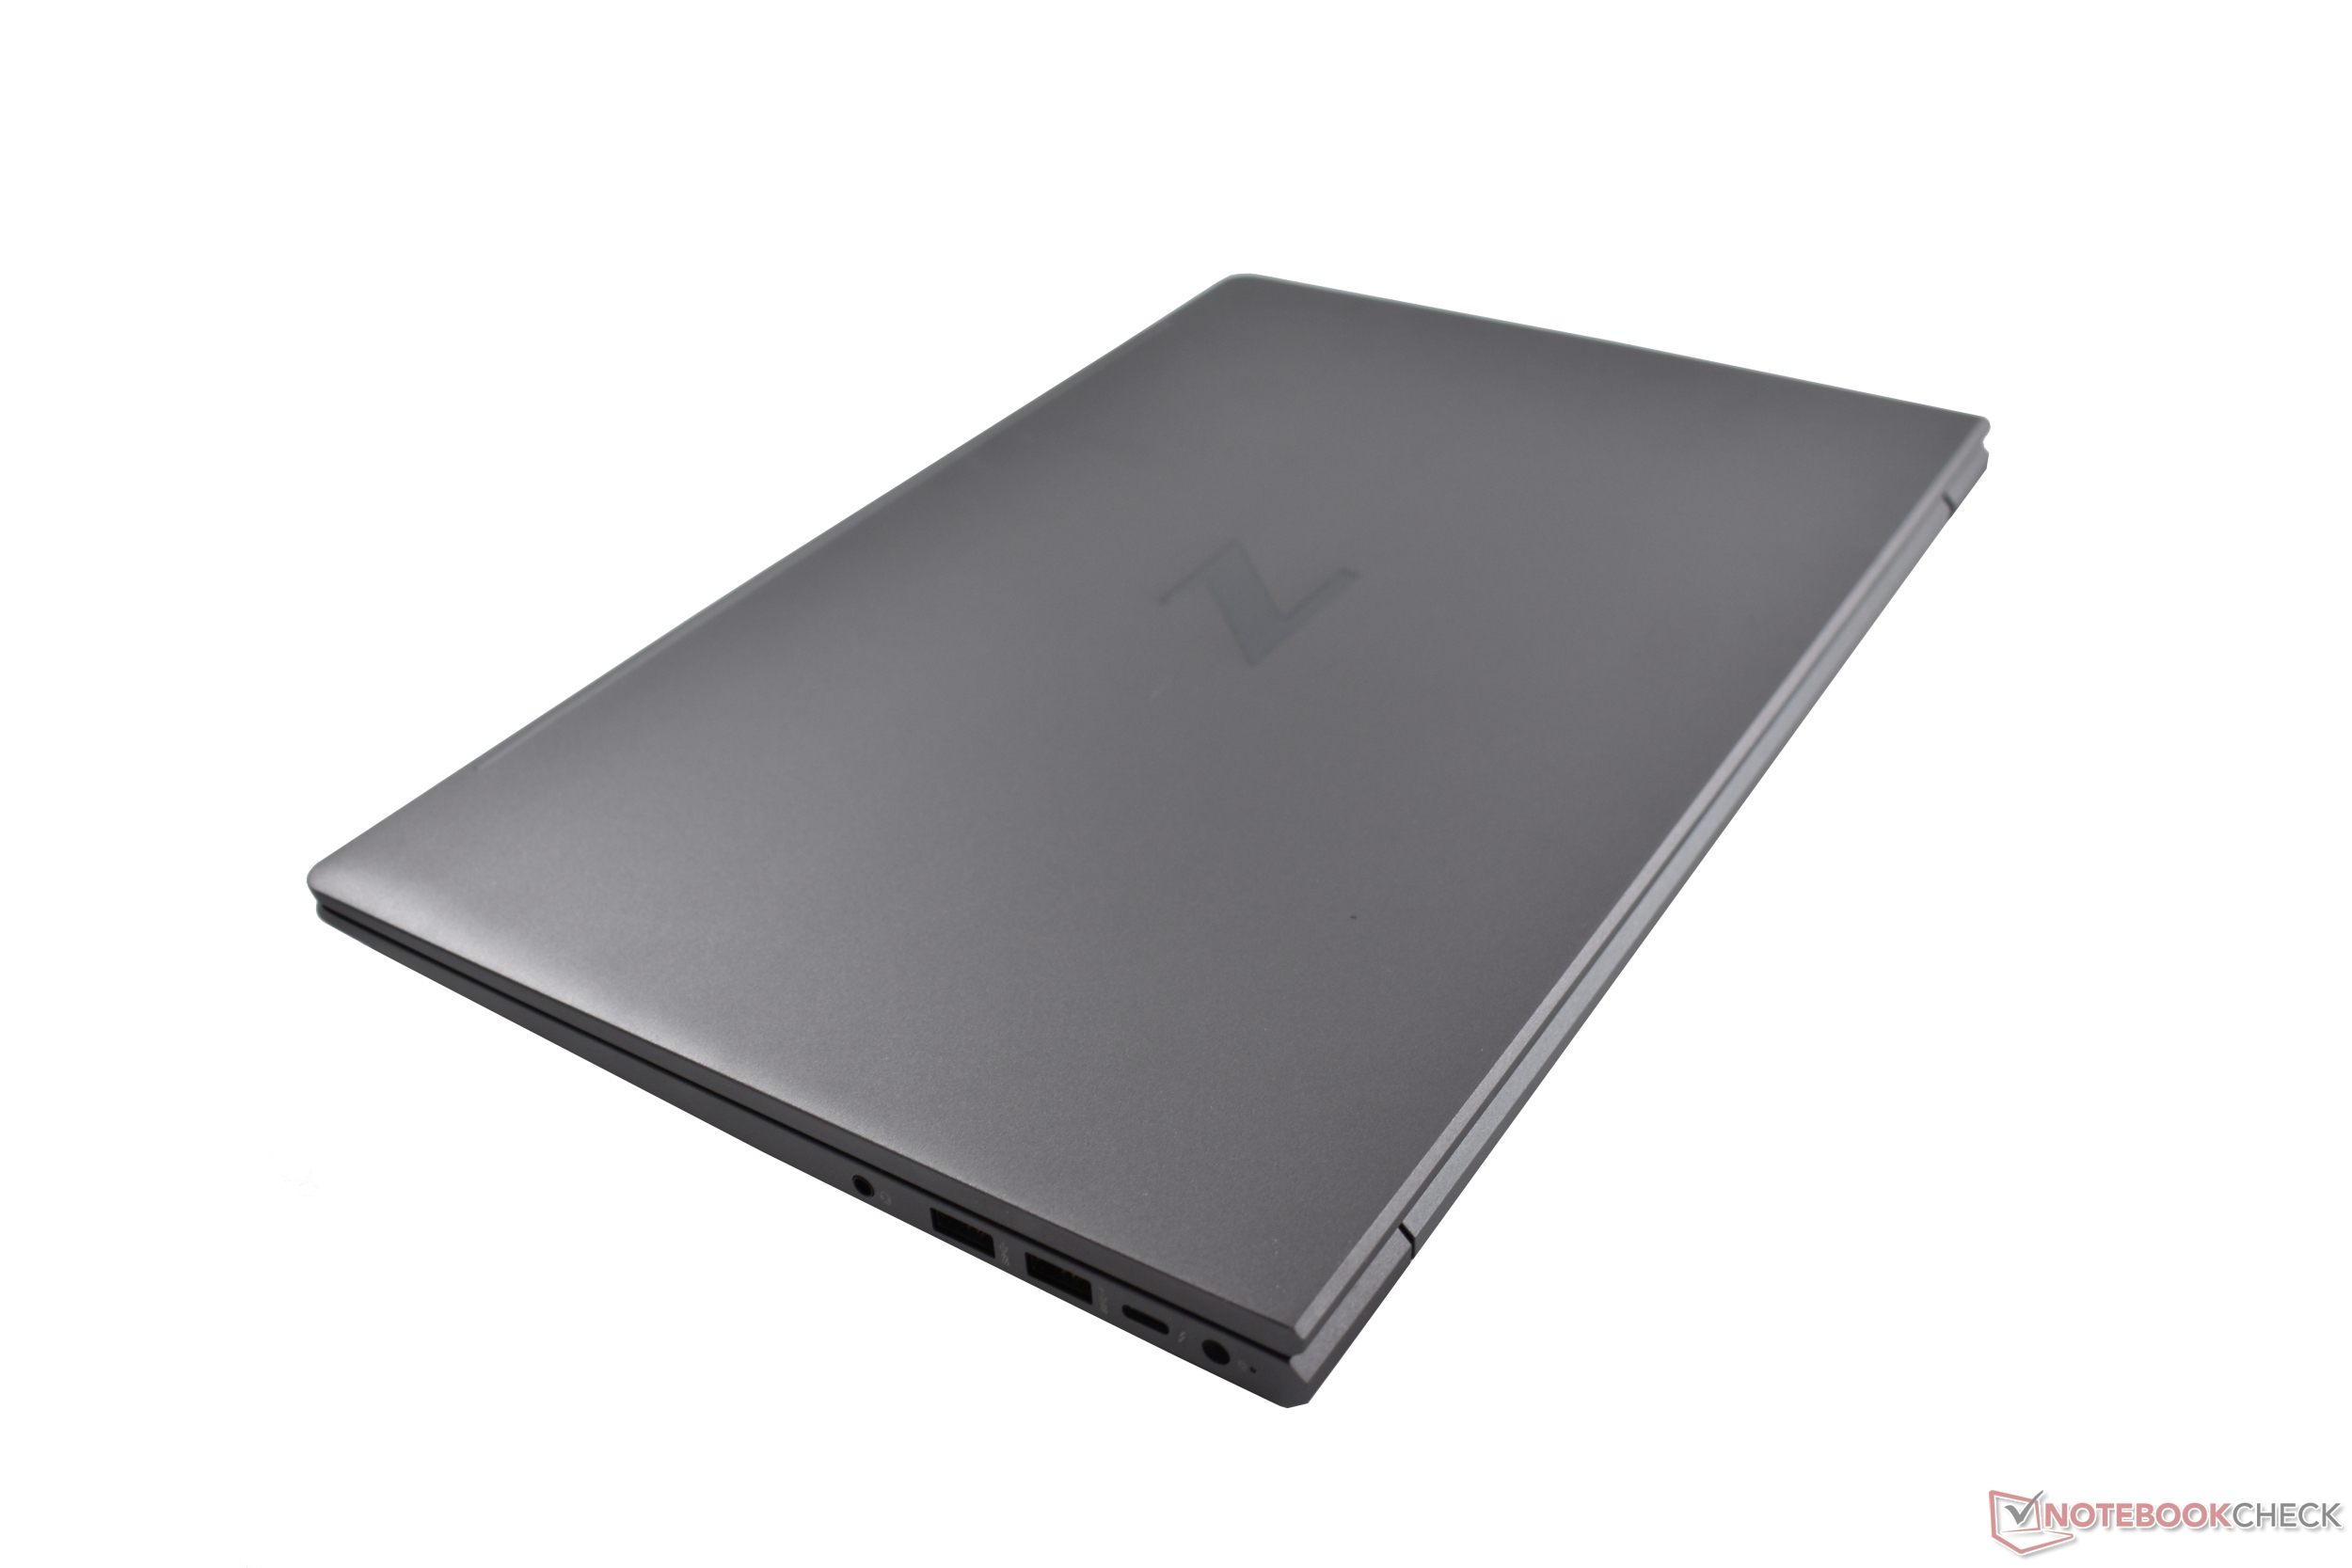
Globalement, la station de travail est plus légère (1,97 kg) et plus compacte que ses concurrents. Cependant, en tant que station de travail haut de gamme, la station HP ZBook Studio 15 de HP est encore plus mince avec 18 mm (~0,7 in), tout comme la station de travail compacte légère de HP, laFirefly 15qui ne pèse également que 1,75 kg (~3,96 lb).
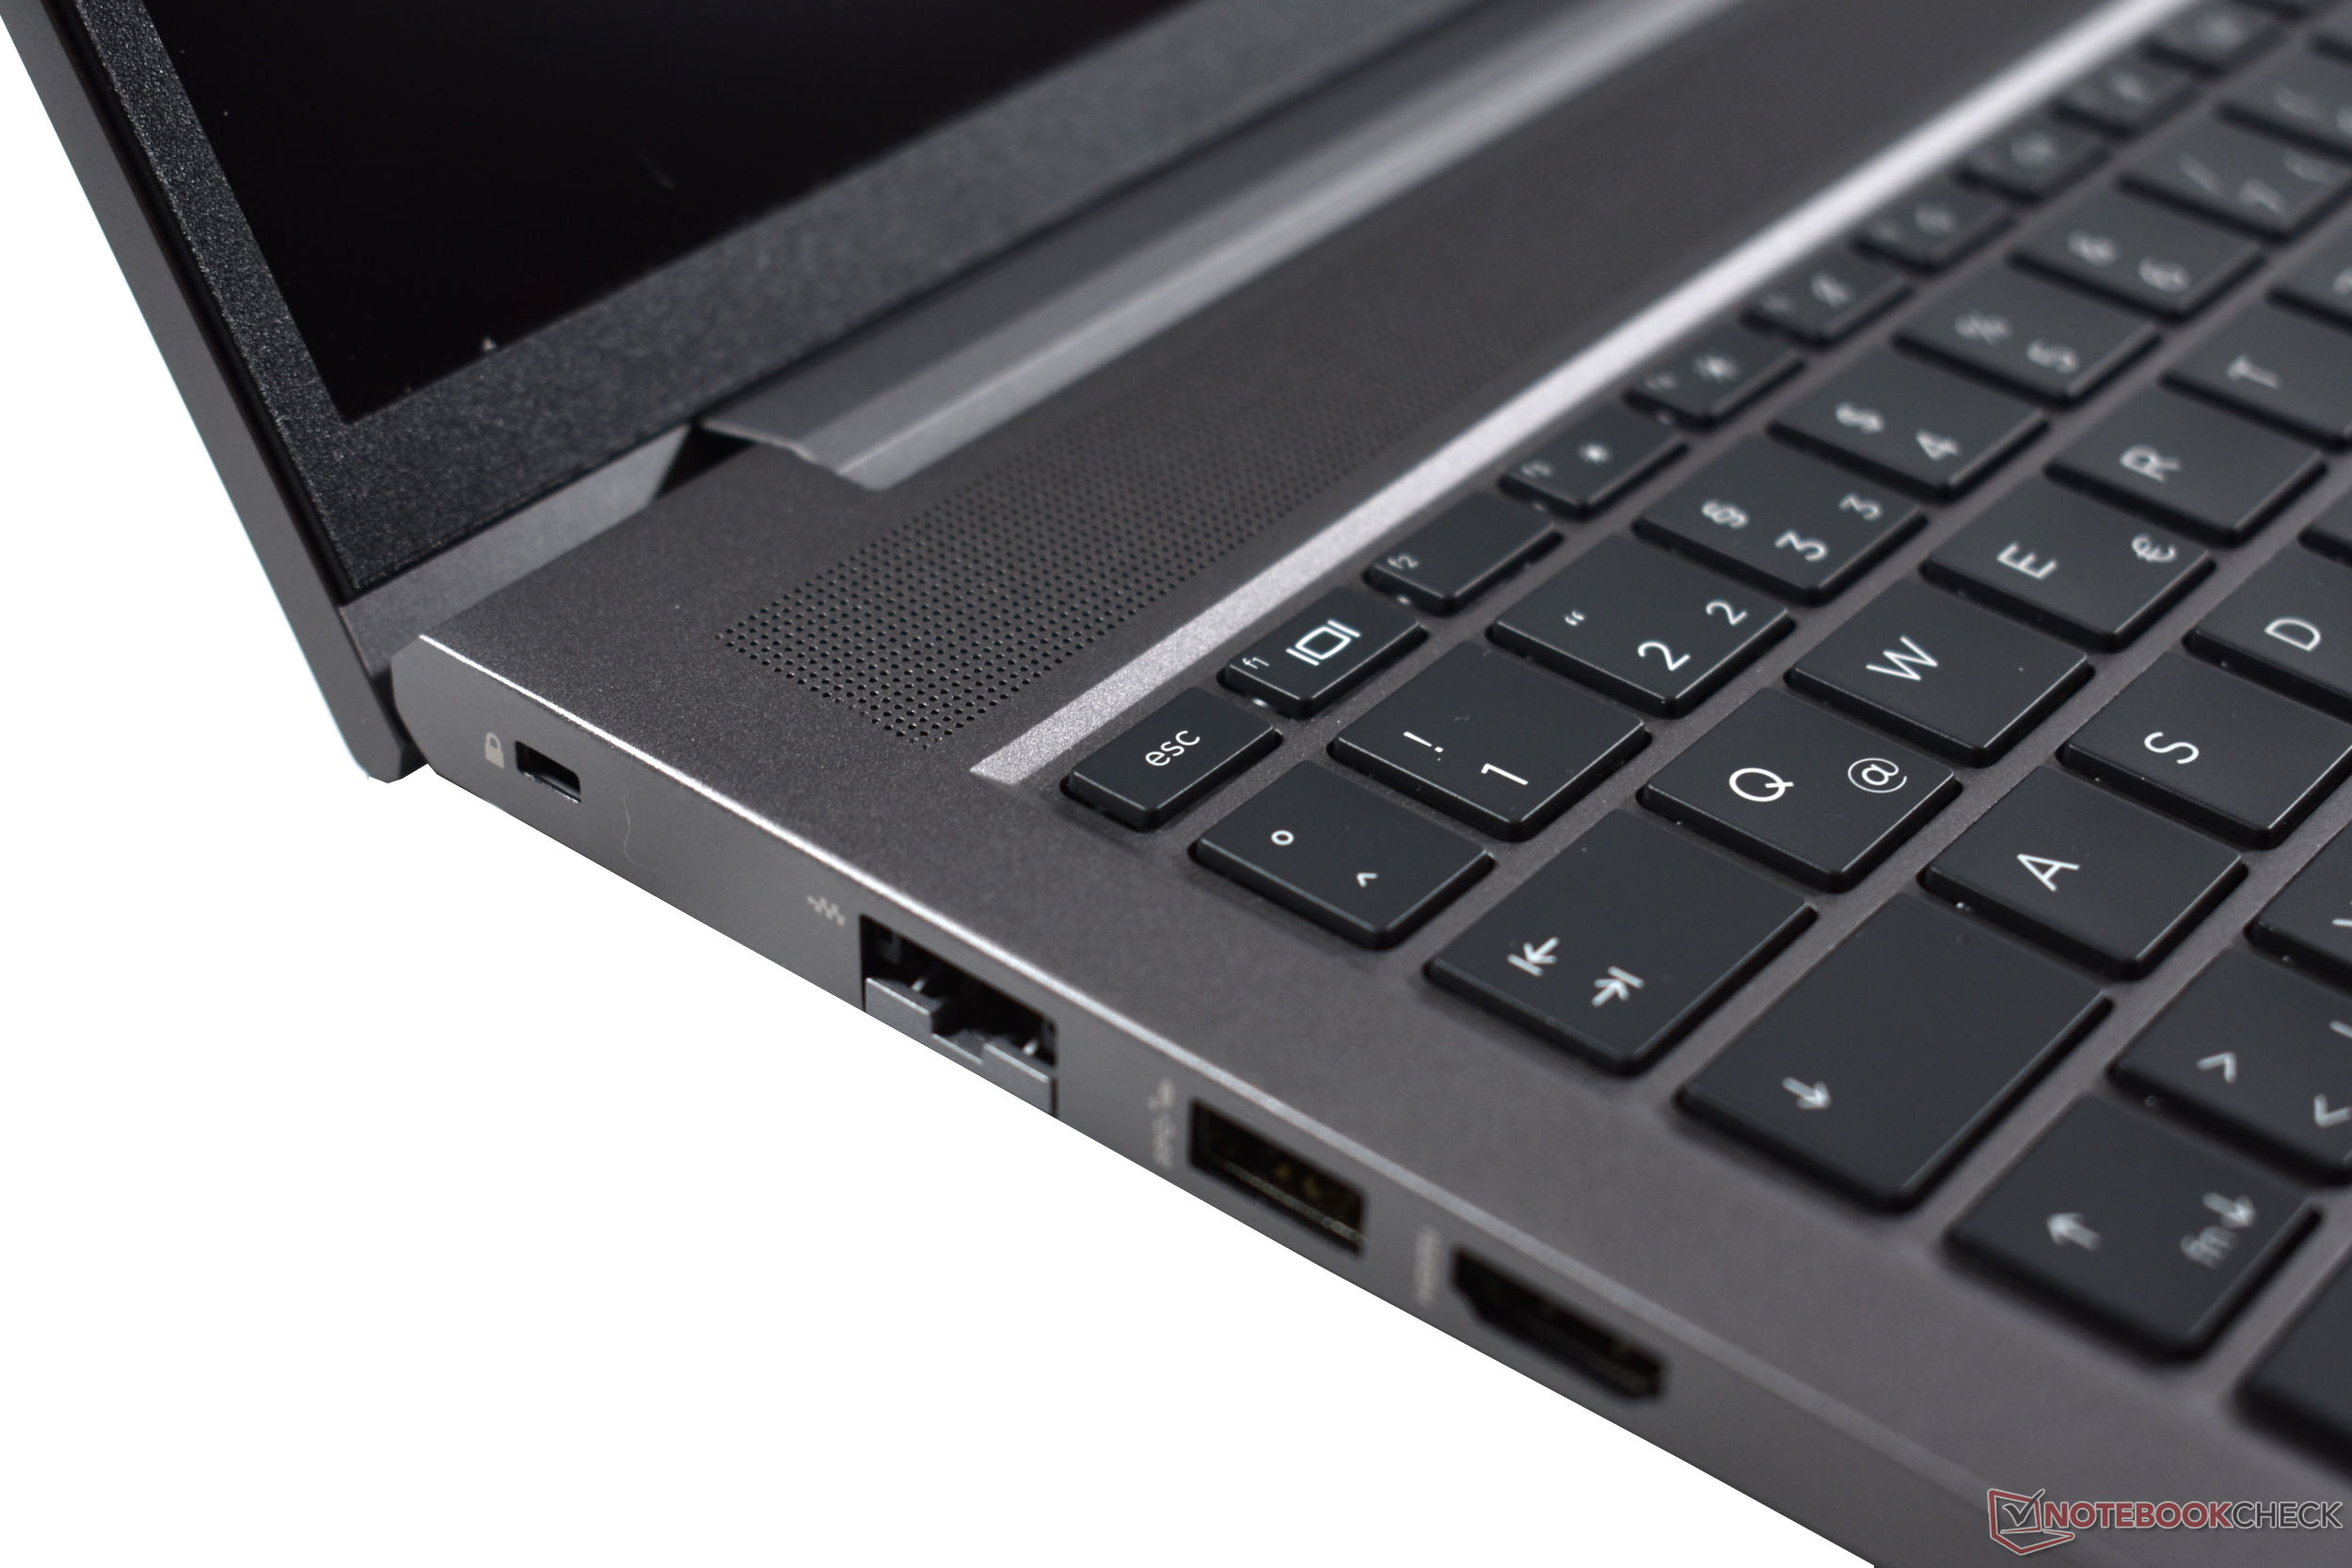
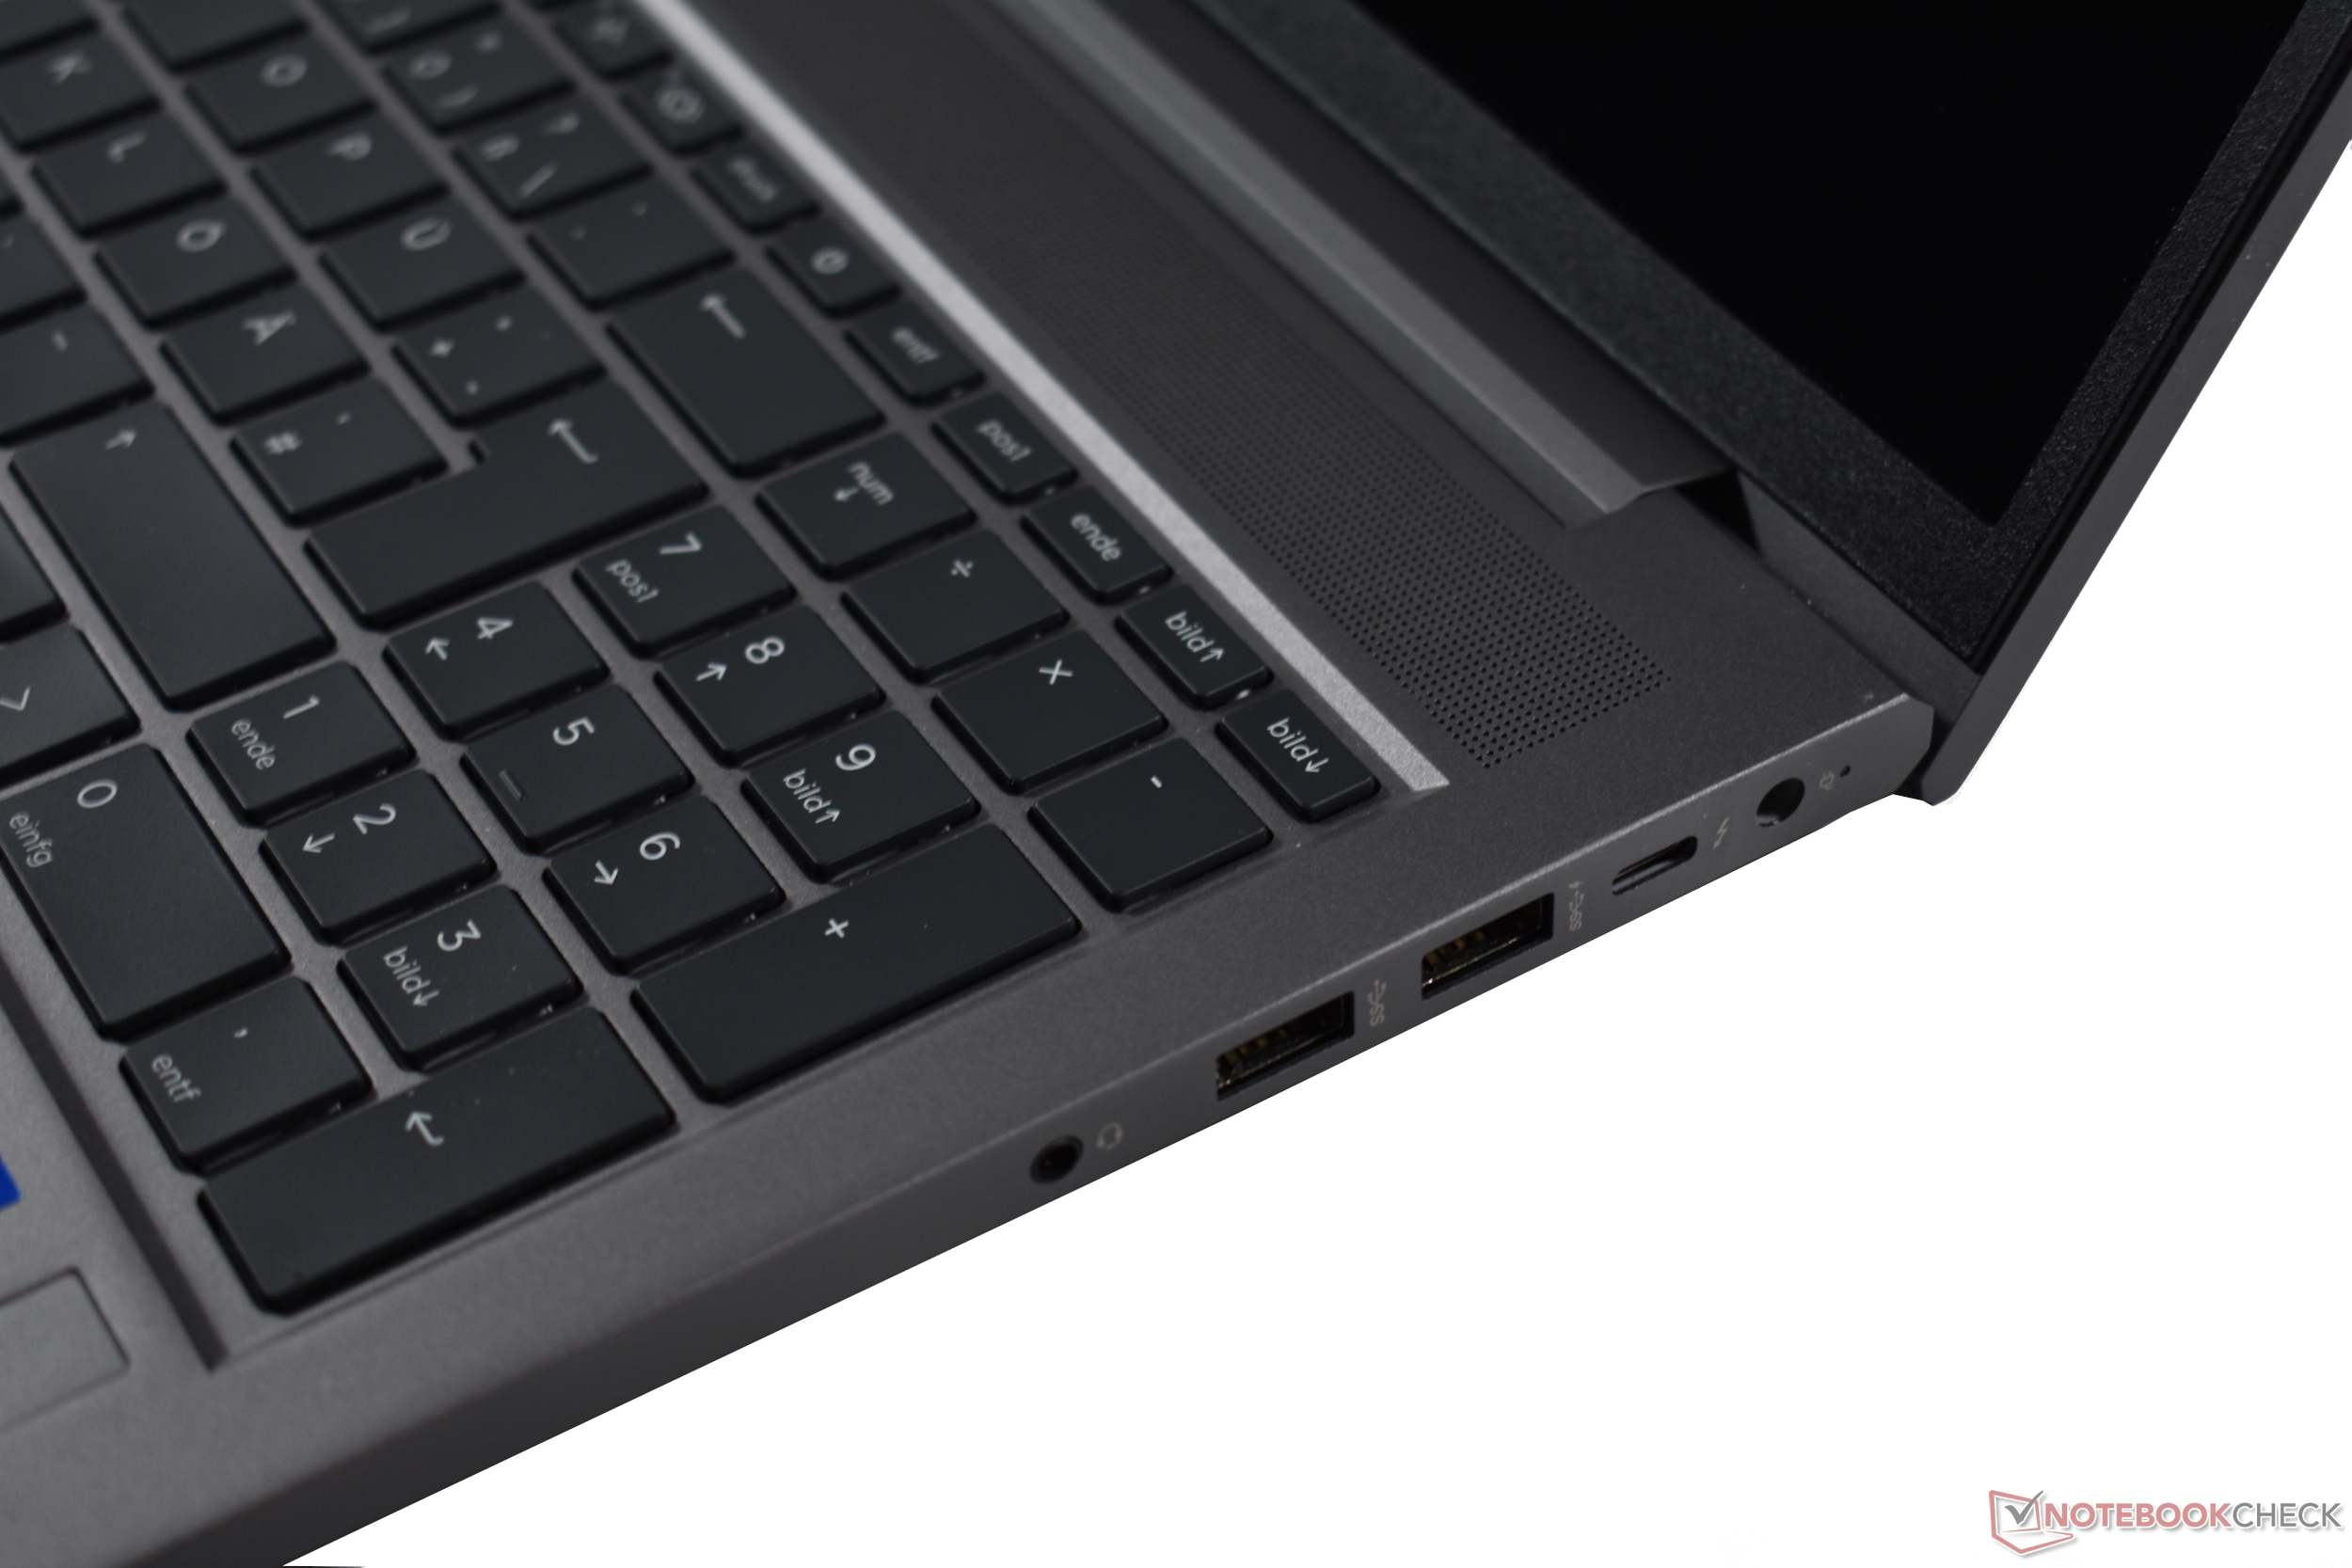
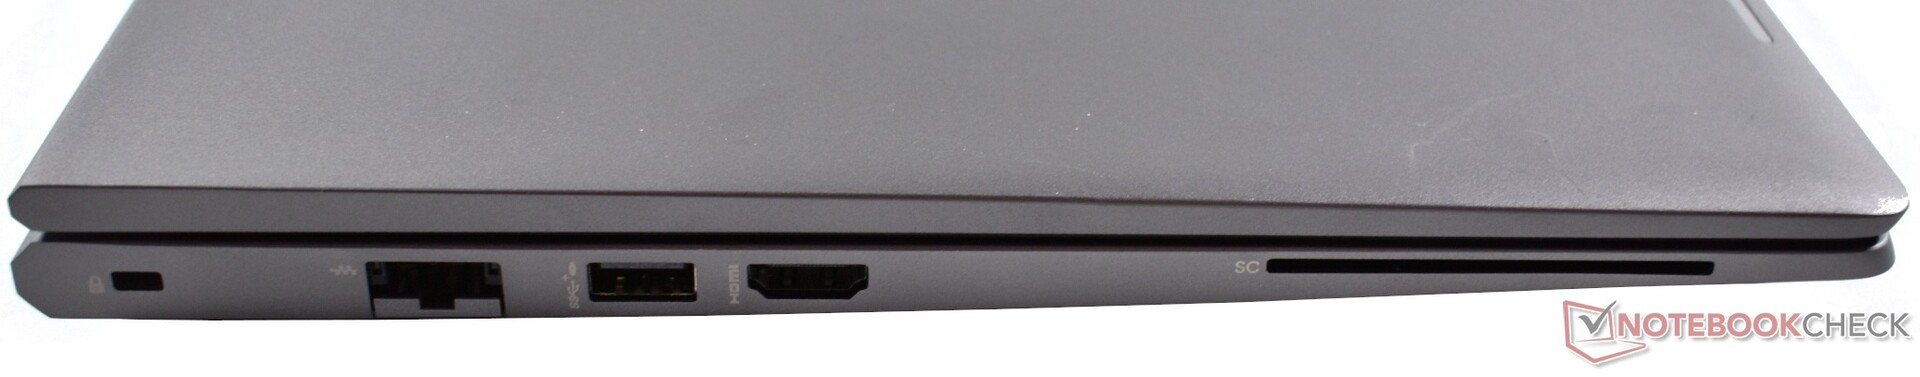
Équipement : HP ZBook avec PD USB-C et WiFi 6 rapide
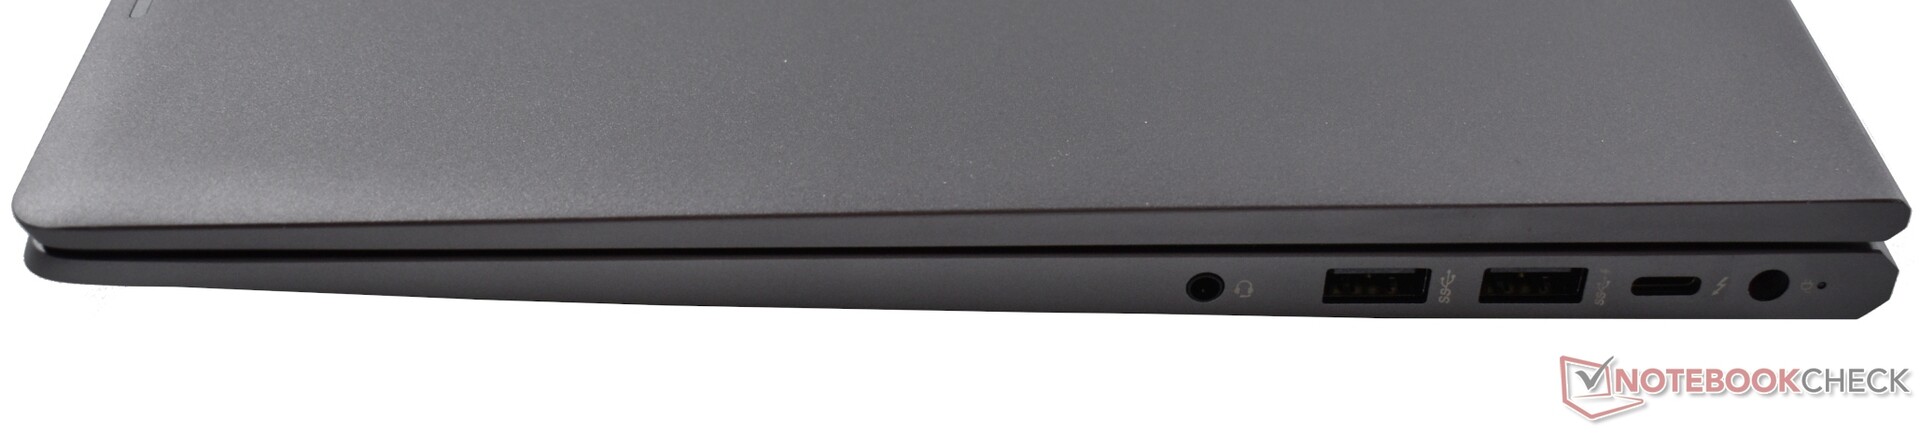
Même en tant que station de travail d'entrée de gamme, le ZBook 15 G8 offre de nombreuses connexions importantes : Il y a un LAN Gbit (même si ce n'est pas 2,5 Gbps), il y a un total de trois ports USB-A 3.1 Gen1 (5 Gbps), alors qu'il n'y a qu'une seule connexion Thunderbolt 4, et il offre également DisplayPort 1.4 et Power Delivery en général. Nous apprécions également de voir le HDMI en version 2.0.
Un lecteur de carte à puce est en option, mais il y a toujours un verrou Kensington (nano). Avec le port de charge propriétaire, l'ensemble est complété par un port audio combo. Cependant, il nous manque un emplacement pour carte SD.
Communication
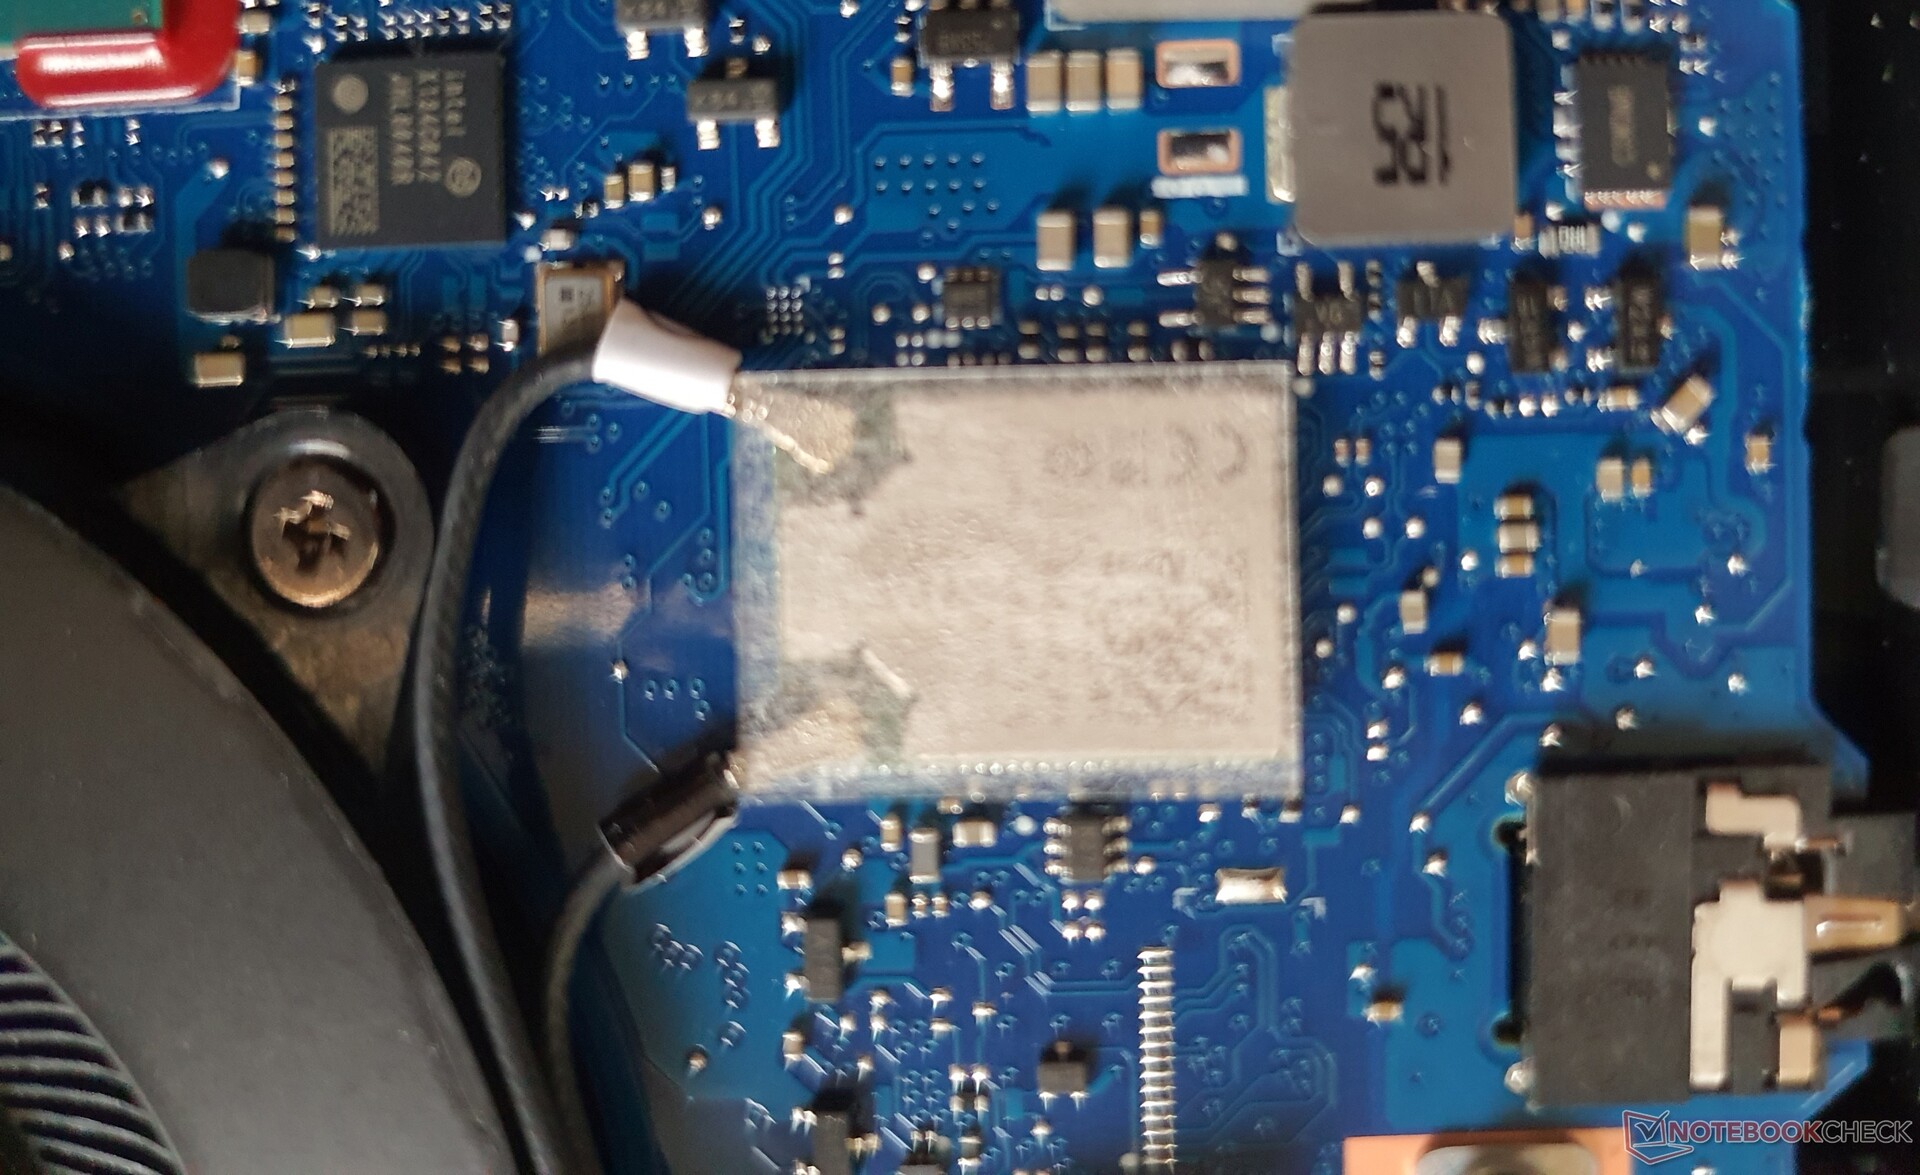
En plus du LAN Gbit, le Wi-Fi 6 AX201 + Bluetooth 5.2 d'Intel est également disponible sous forme soudée. ~1,5 Gbps en émission et 1,33 Gbps en réception correspond à la vitesse élevée du Wi-Fi des concurrents. Bien qu'il n'y ait pas de slot WWAN, le NFC est disponible en option.
Webcam

La webcam 720p offre un SureShutter (cache), des micros à double réseau et un infrarouge en option pour Windows Hello. Cependant, la qualité de l'image est bruyante.


Sécurité
HP ne fait pas dans la demi-mesure en matière de sécurité. Du côté des options matérielles, on trouve un lecteur de carte à puce et une caméra IR pour Windows Hello. En outre, il y a un mécanisme pour un verrou de sécurité, un lecteur d'empreintes digitales, un TPM 2.0 et un obturateur d'appareil photo.
Du côté des logiciels, une sécurité accrue est assurée par le HP System Safeguard contre les attaques de firmware ou les erreurs soudaines de firmware, le HP Client Security Manager, HP Sure Click & Sure Sense contre le phishing et les logiciels malveillants, et un BIOS "auto-guérissant".
Accessoires
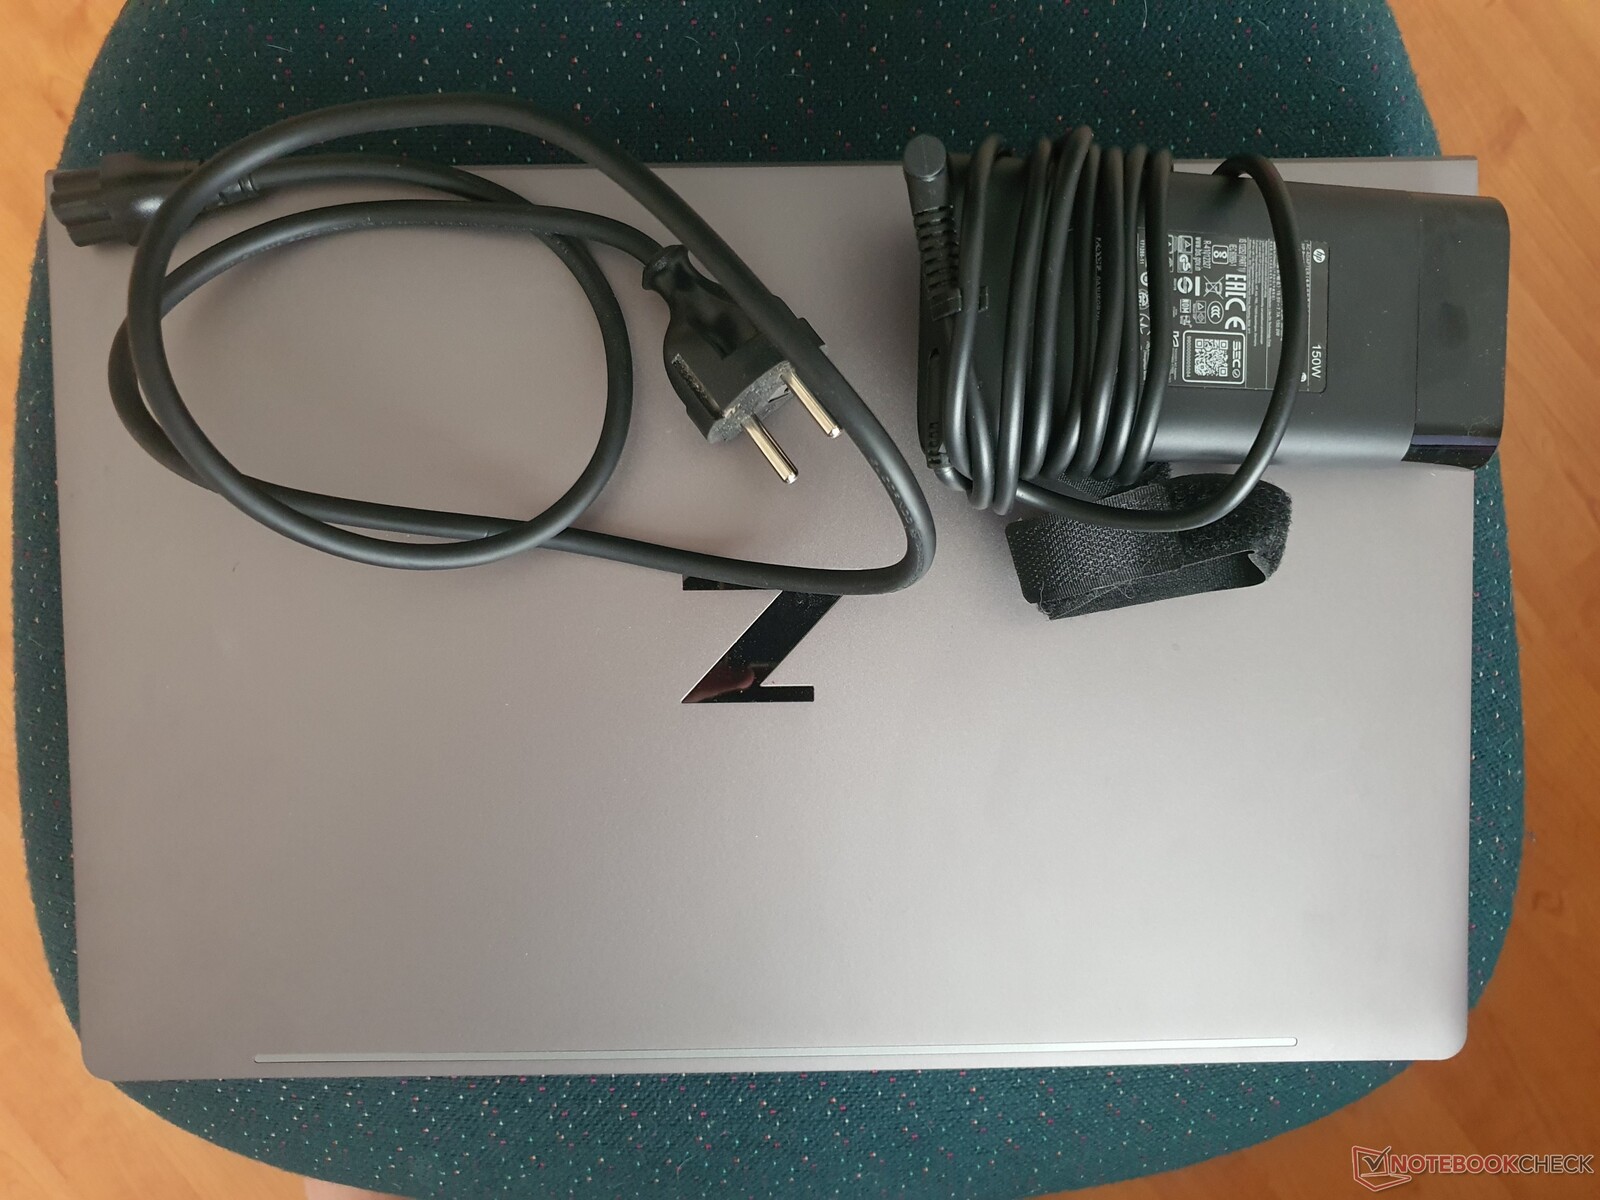
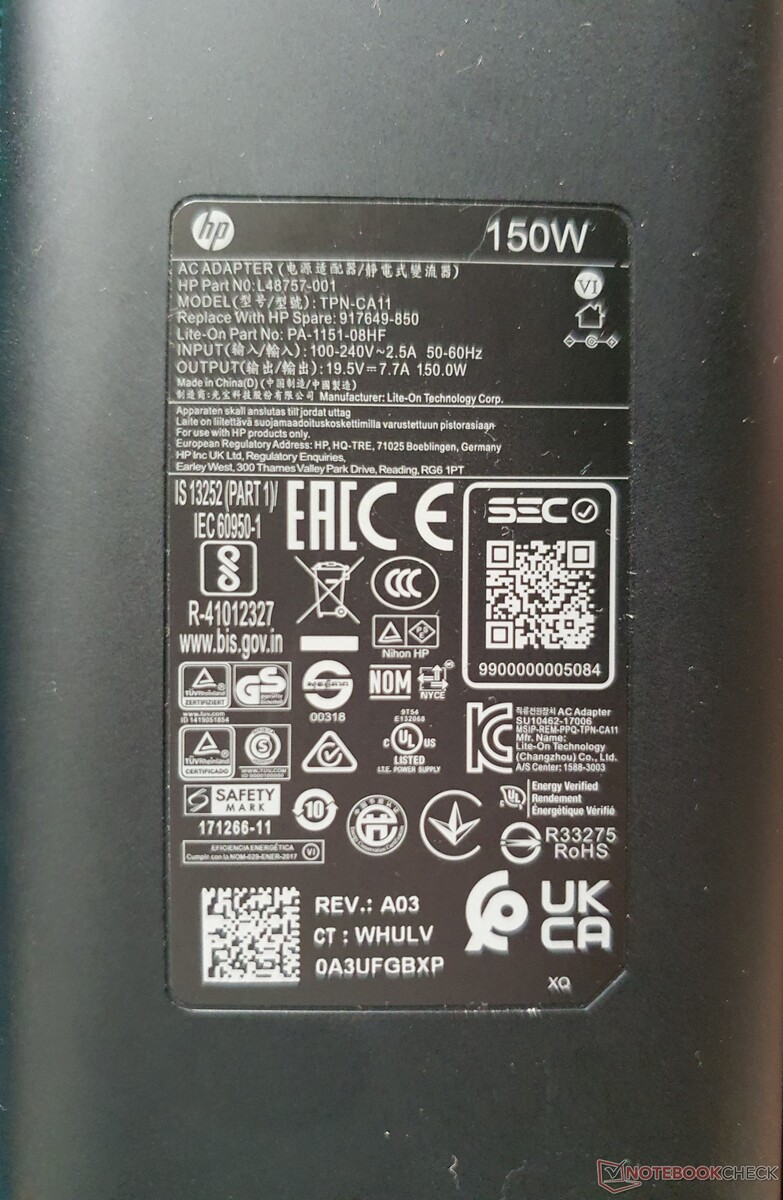
Un bloc d'alimentation de 150 watts (120 watts dans les configurations sans dGPU) est inclus. L'emballage est sans plastique (soit 10 % seulement), la majeure partie est en carton (45 % de recyclé) et en papier cellulose. En option, HP propose diverses stations d'accueil USB-C/Thunderbolt, mais seule la HP TB Dock G2 avec câble combo https://www.hp.com/us-en/shop/pdp/hp-thunderbolt-dock-g2-with-combo-cable (environ 200 euros, ~$204) inclut Power Delivery.
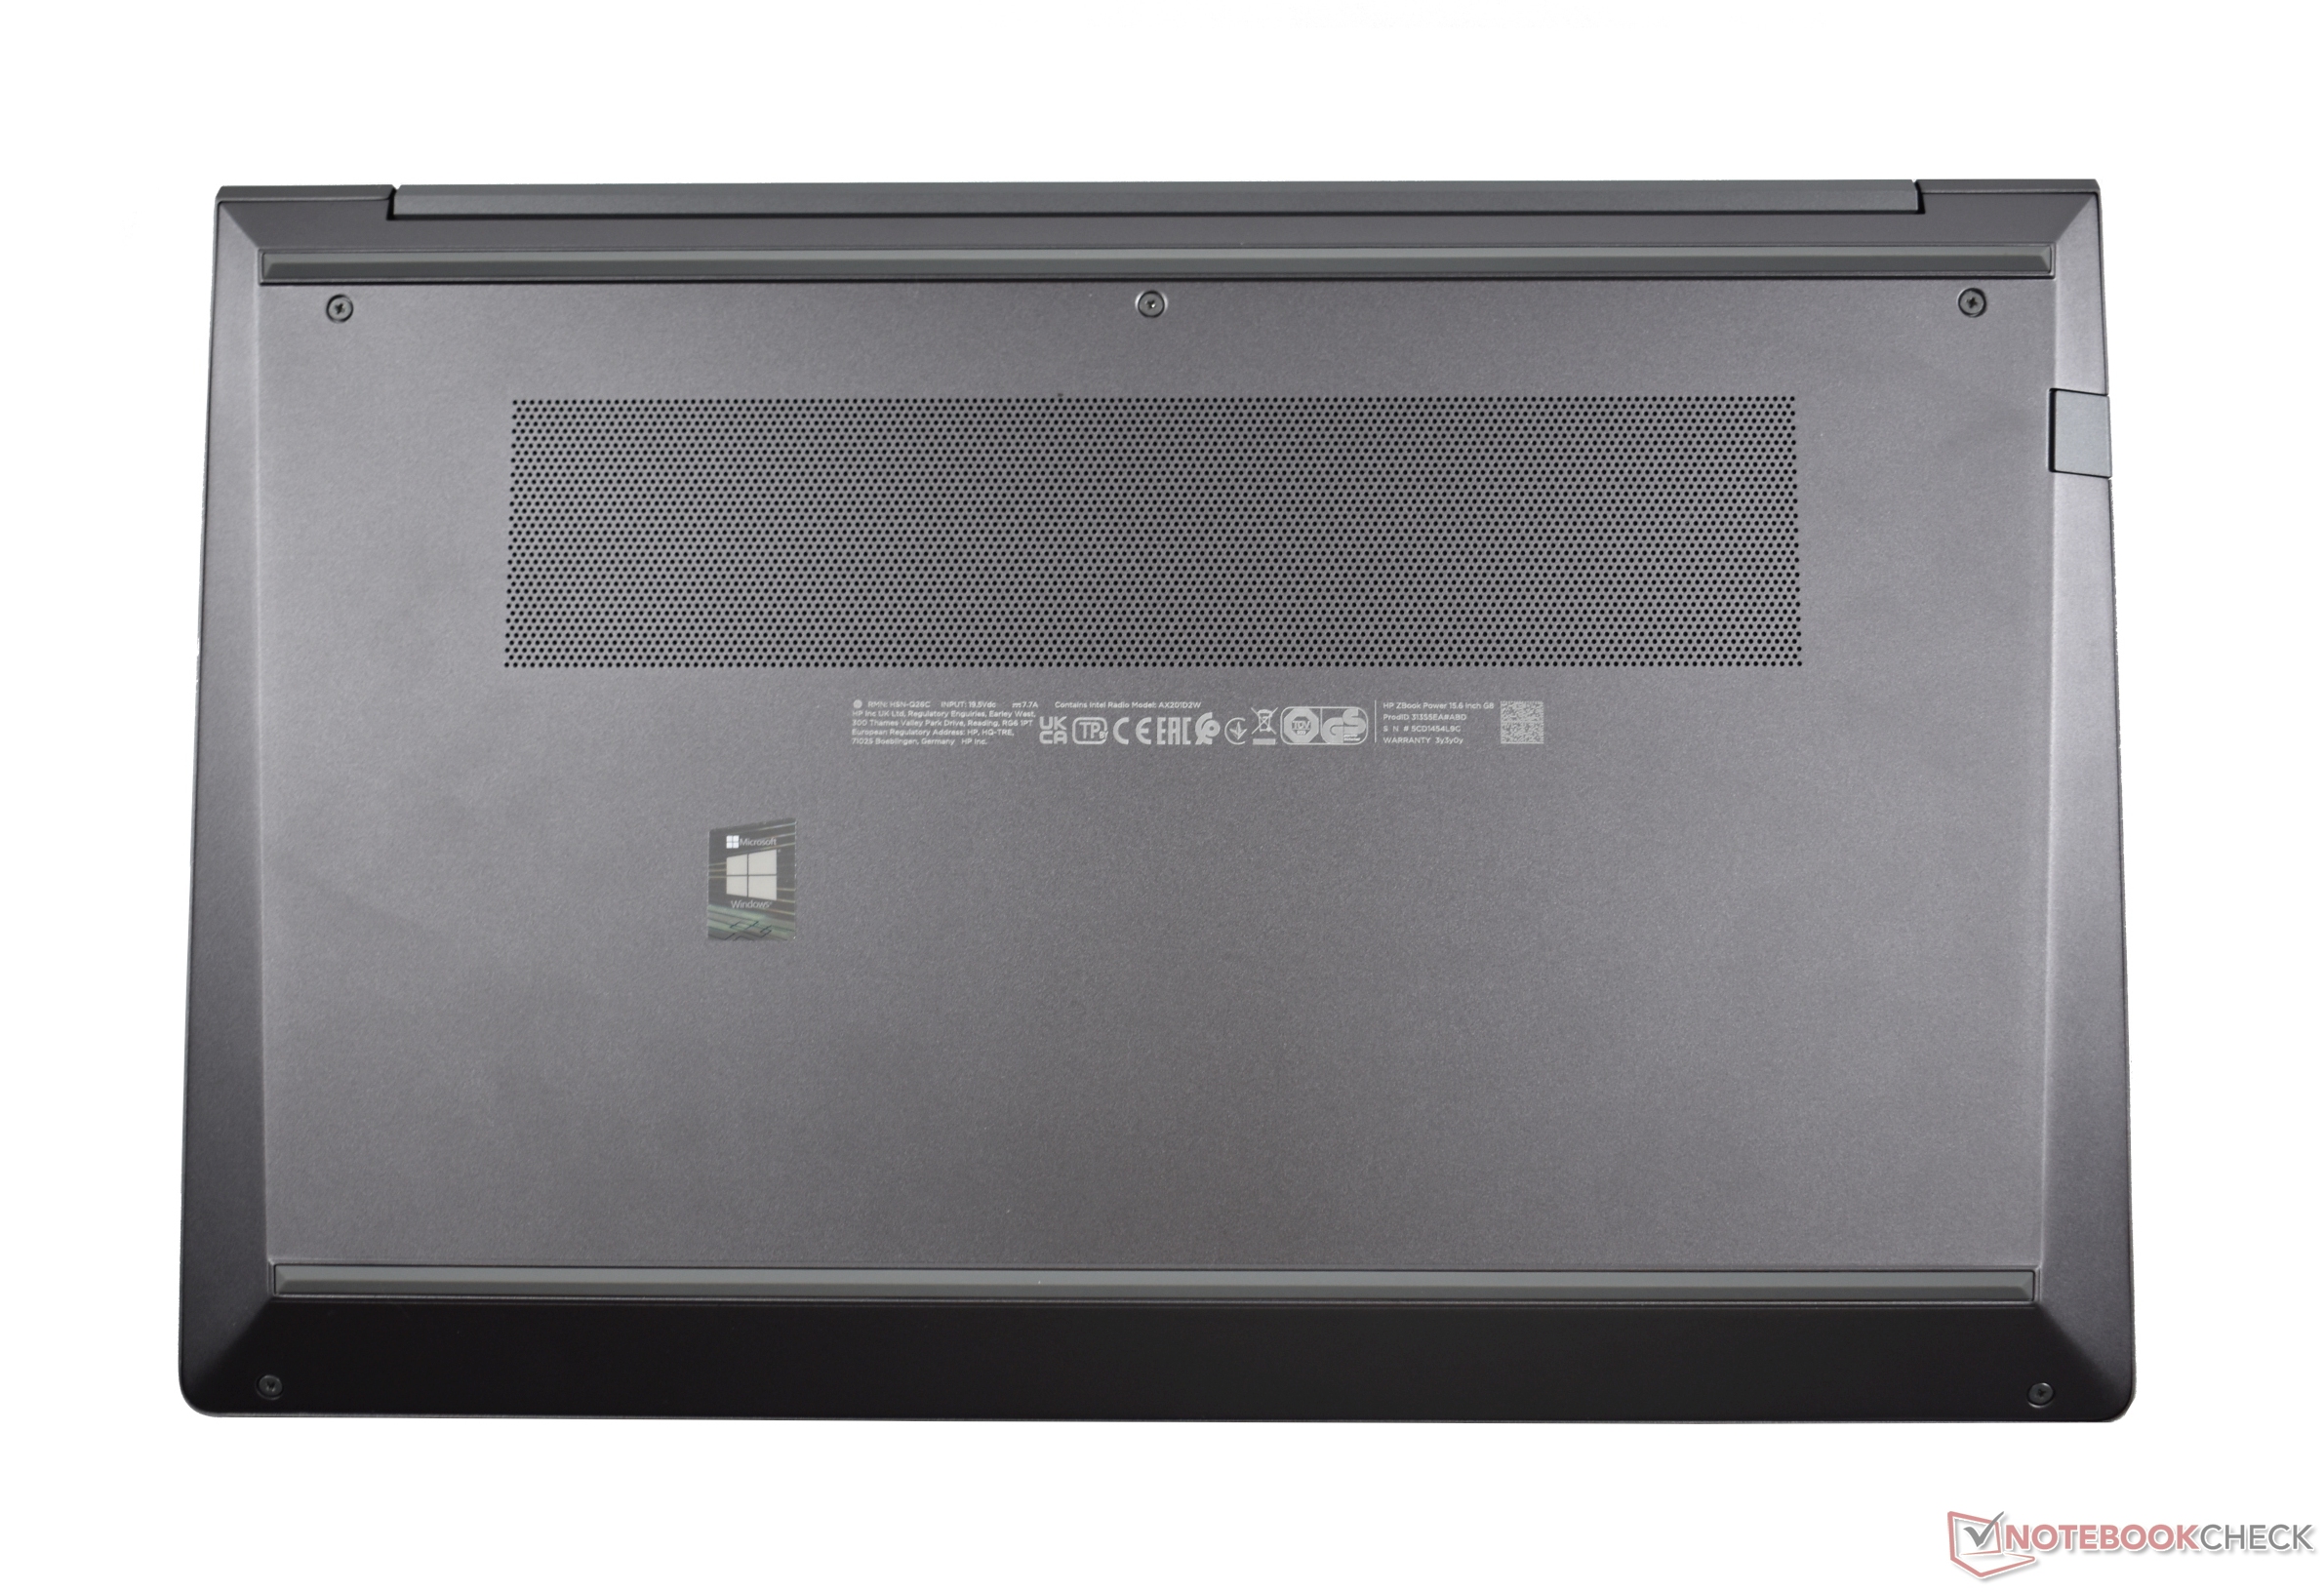
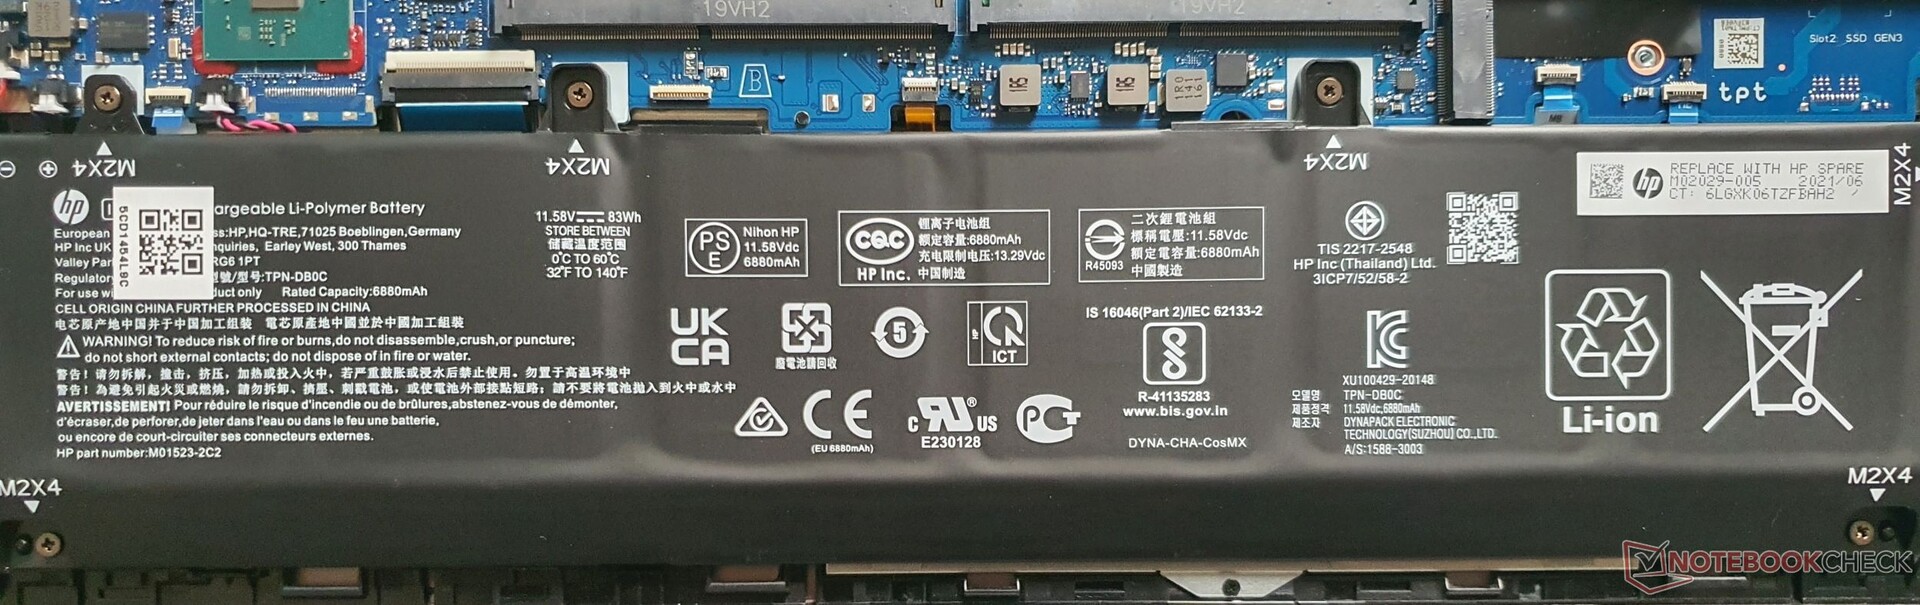
Maintenance
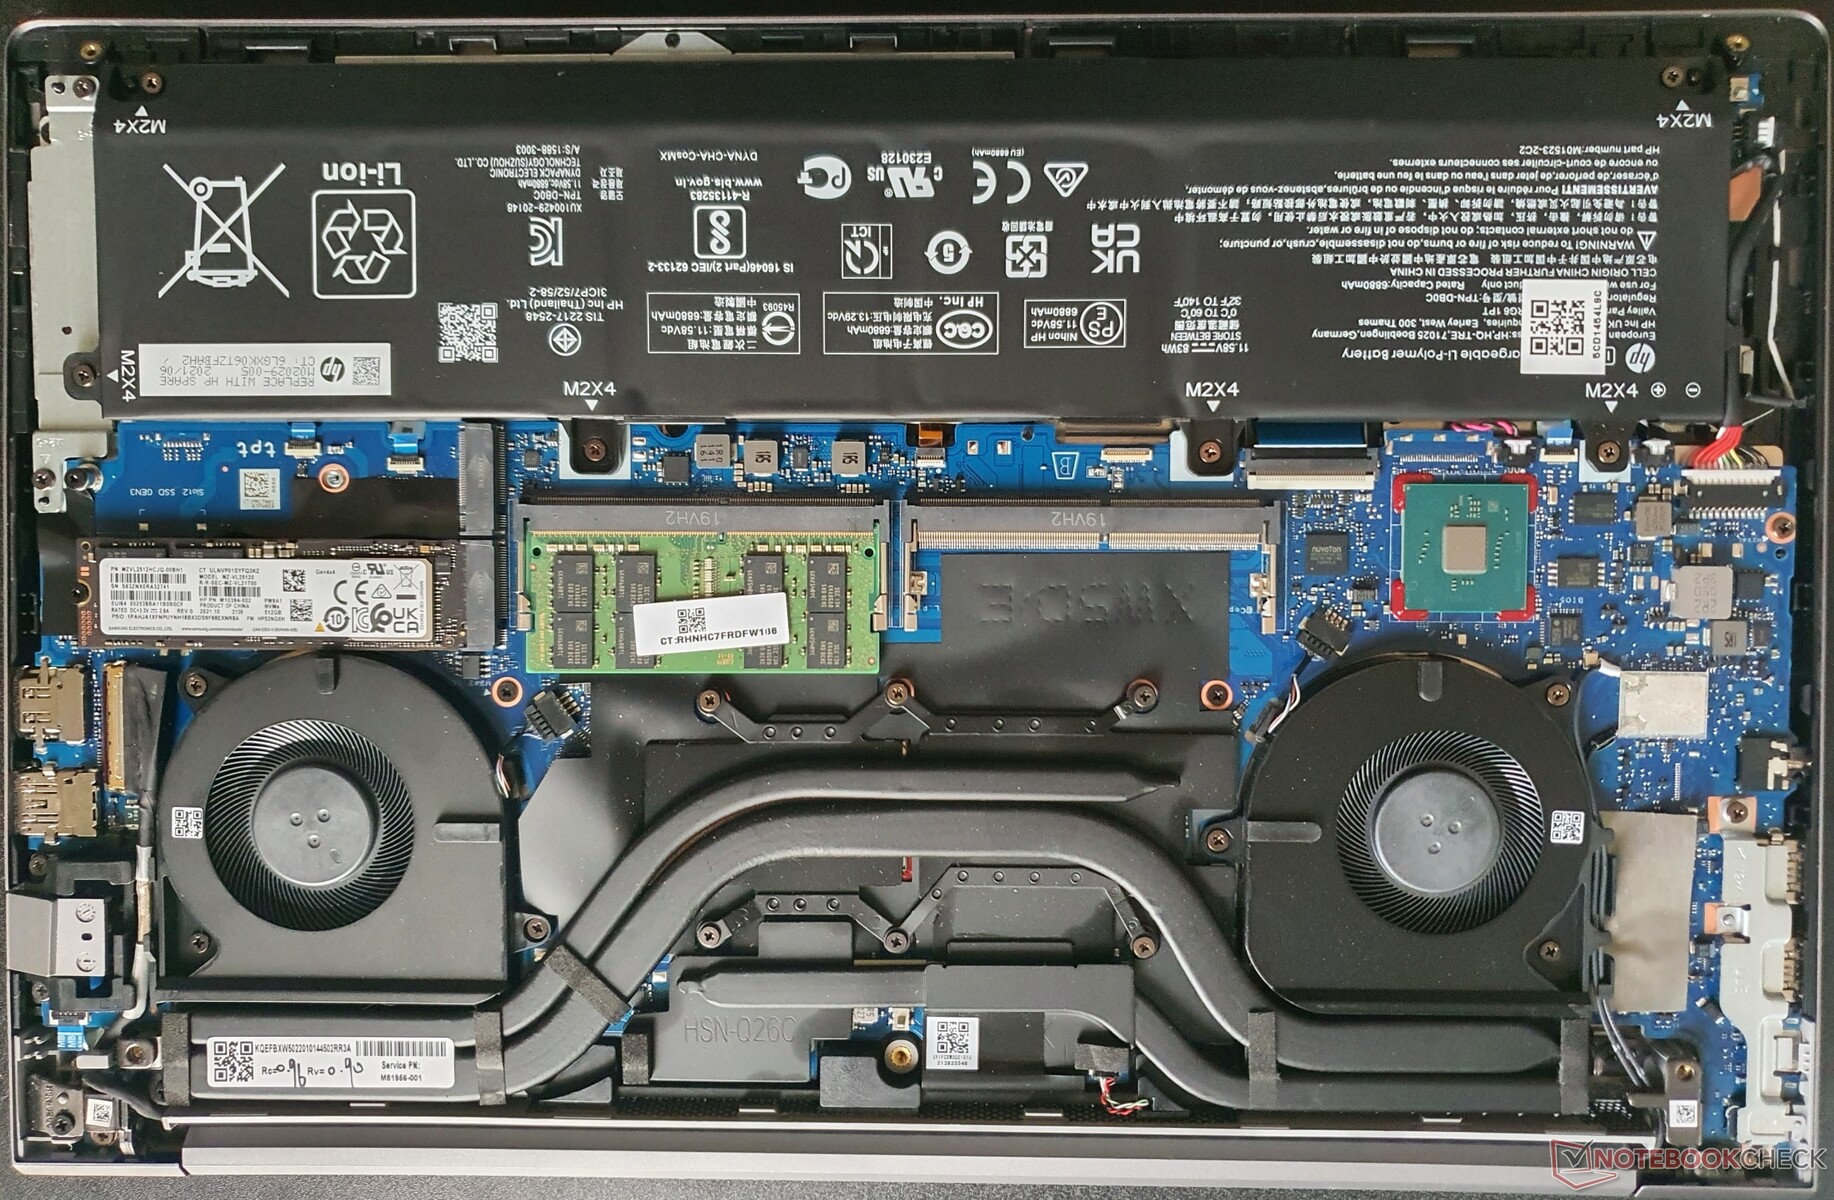
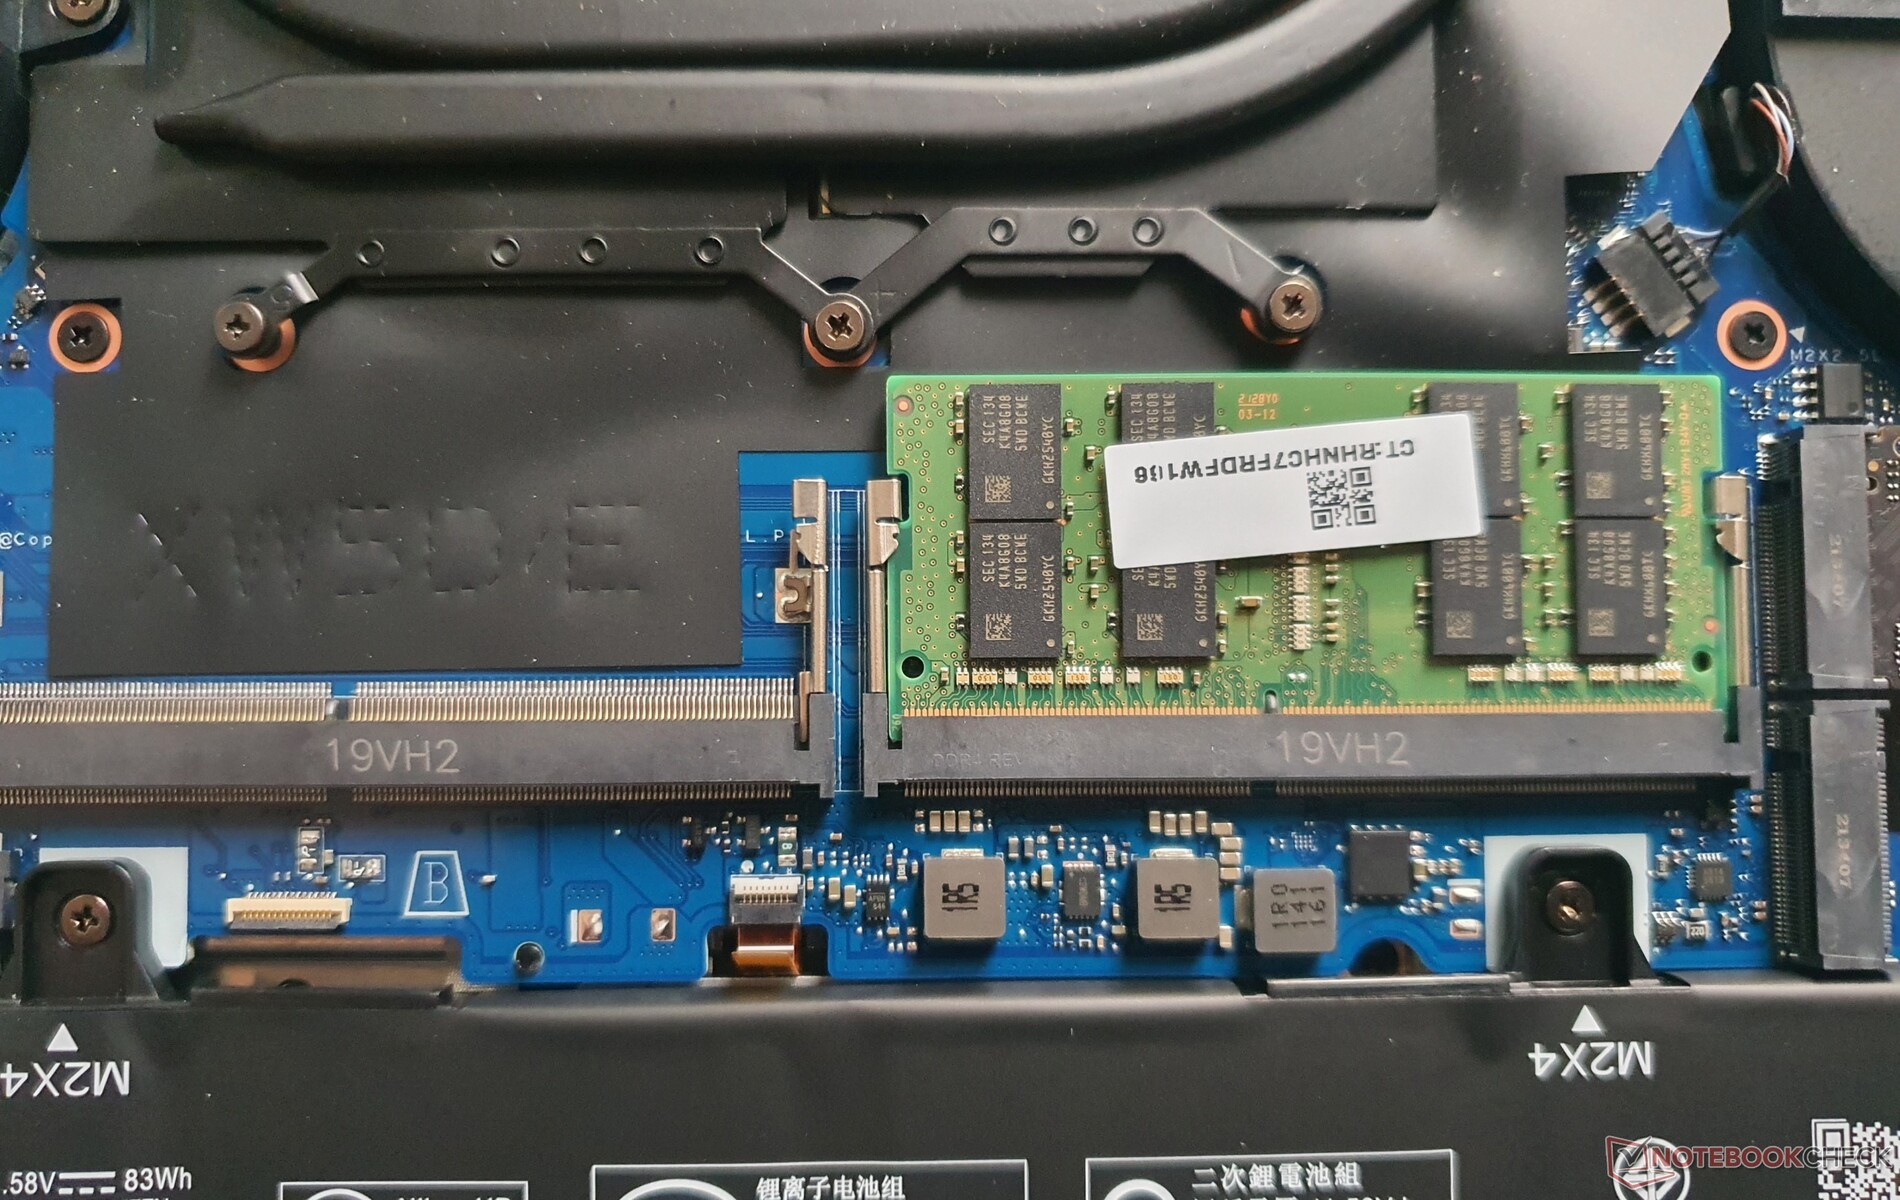
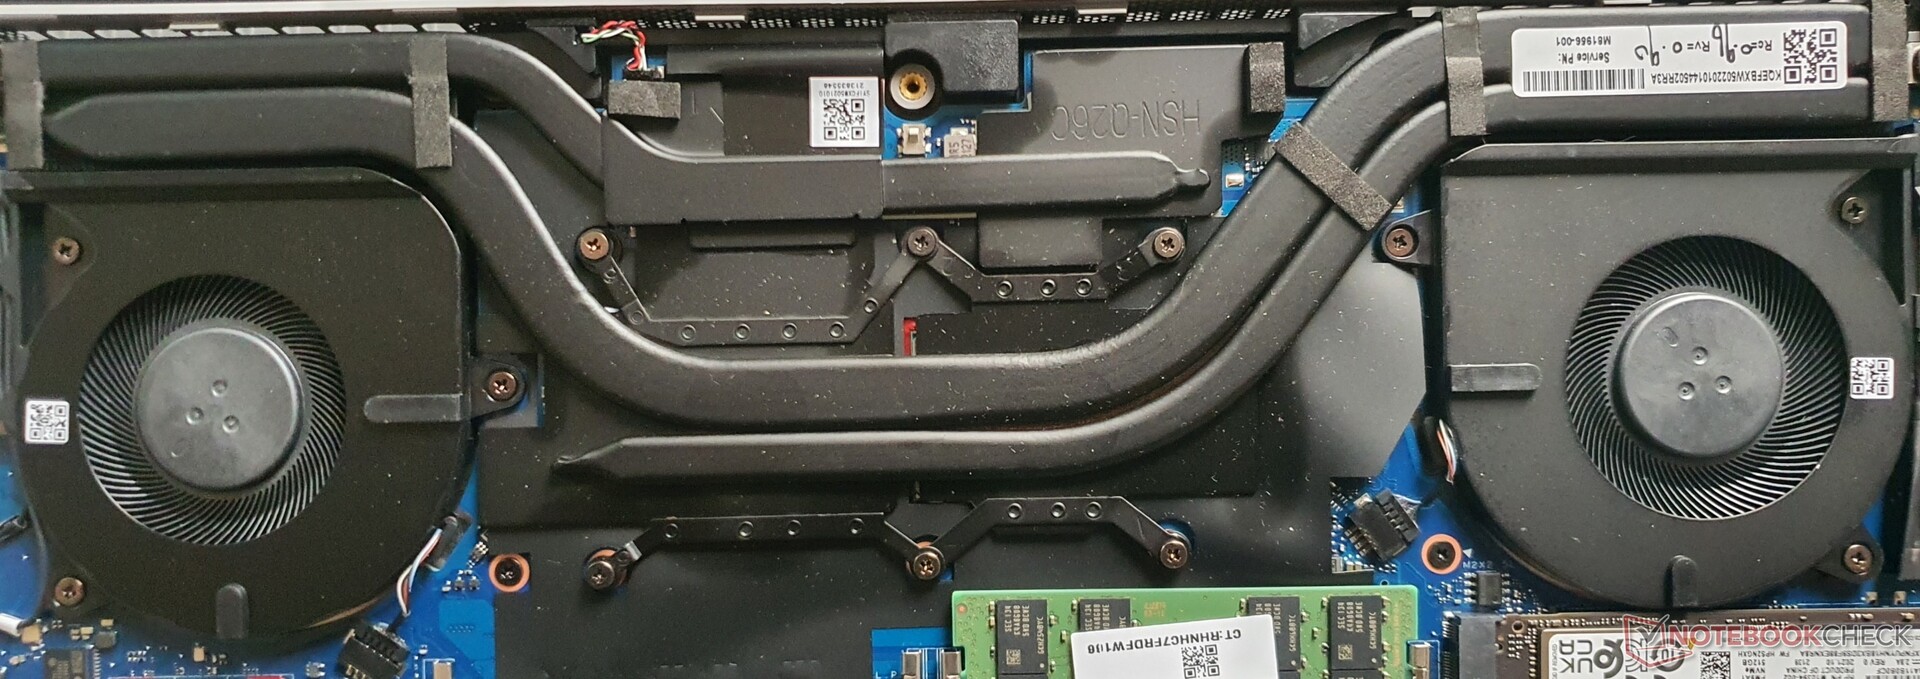
Après avoir retiré seulement cinq vis Philips, le fond du boîtier peut être facilement retiré à l'aide d'un outil en plastique. De cette façon, vous avez accès à 2 DIMM SO et à 2 emplacements M.2-2280, tandis que la batterie est également remplaçable et que le système de refroidissement vissé peut être maintenu. Le module WLAN est soudé, et le clavier est également fixé. Il n'y a pas de WWAN.
Garantie
Dans la zone germanophone, HP offre une garantie standard de 3 ans, qui peut être étendue jusqu'à 5 ans. Elle comprend un service d'enlèvement et de retour, et le service sur site coûte plus cher. Cela correspond aux politiques de HP pour les ordinateurs portables professionnels haut de gamme.
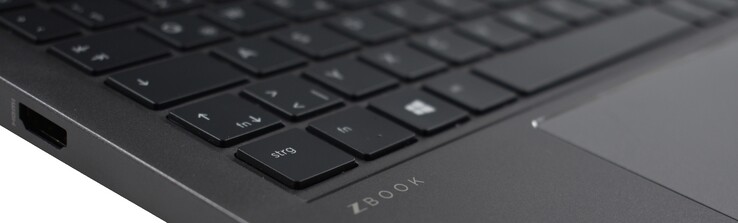
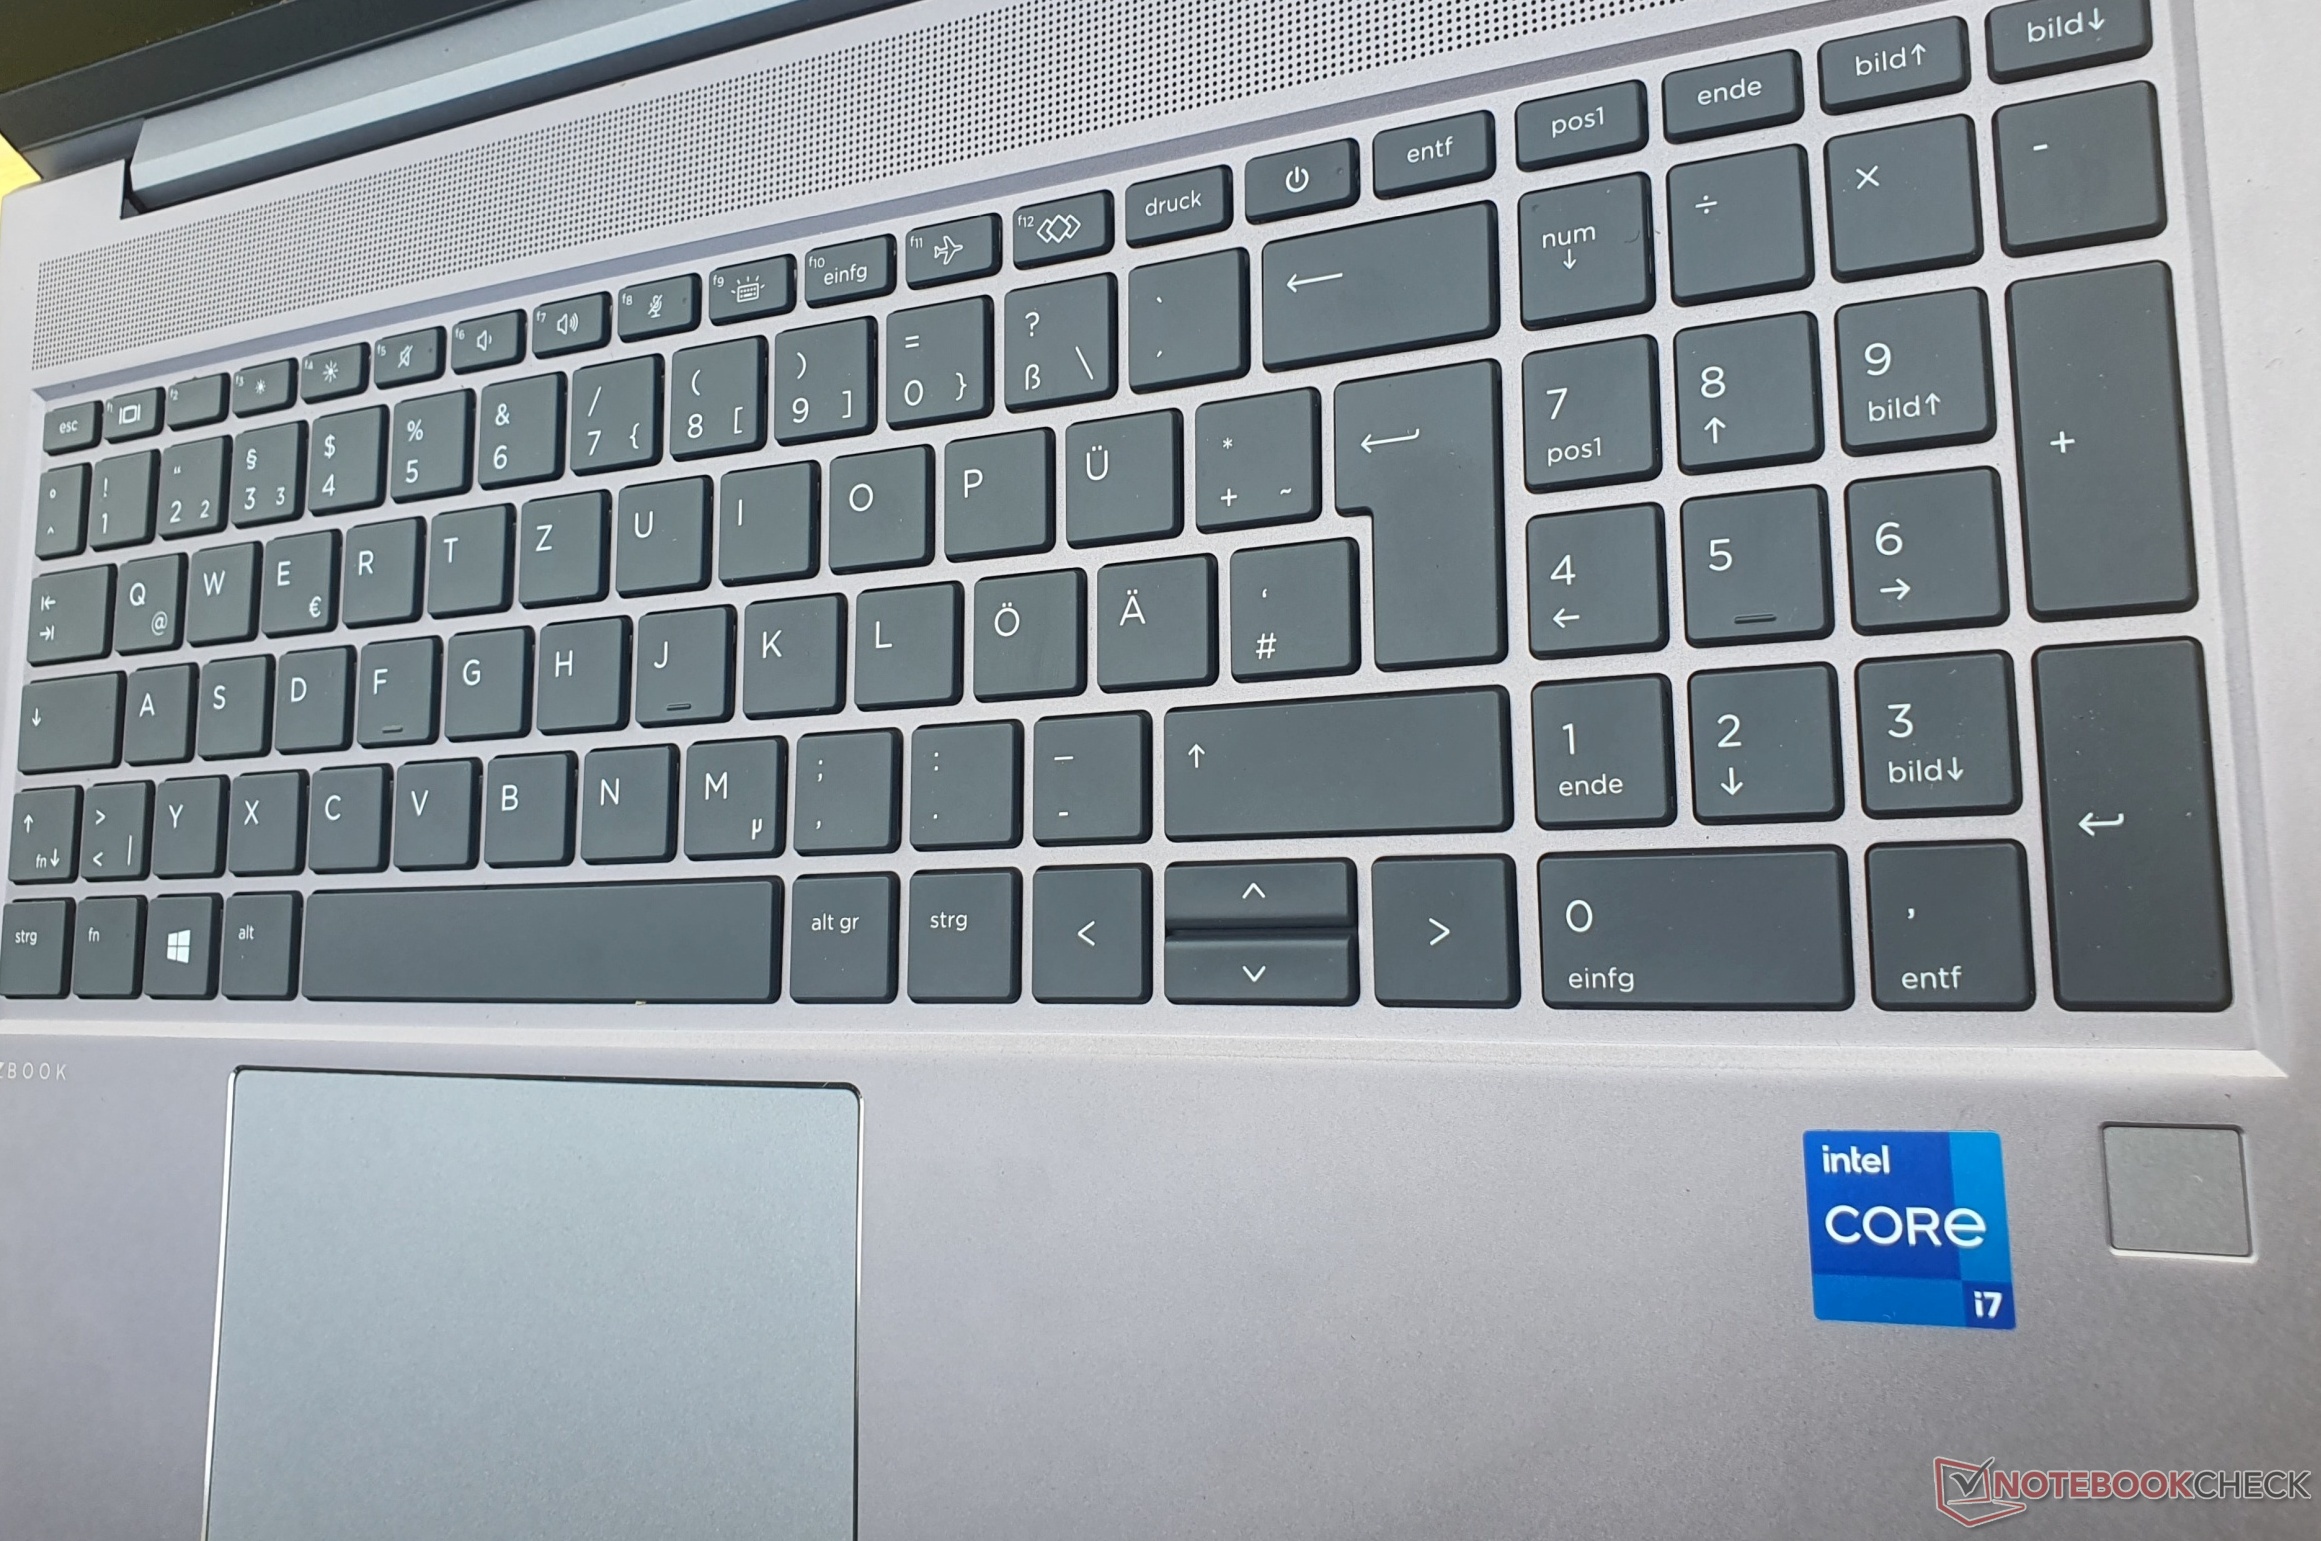
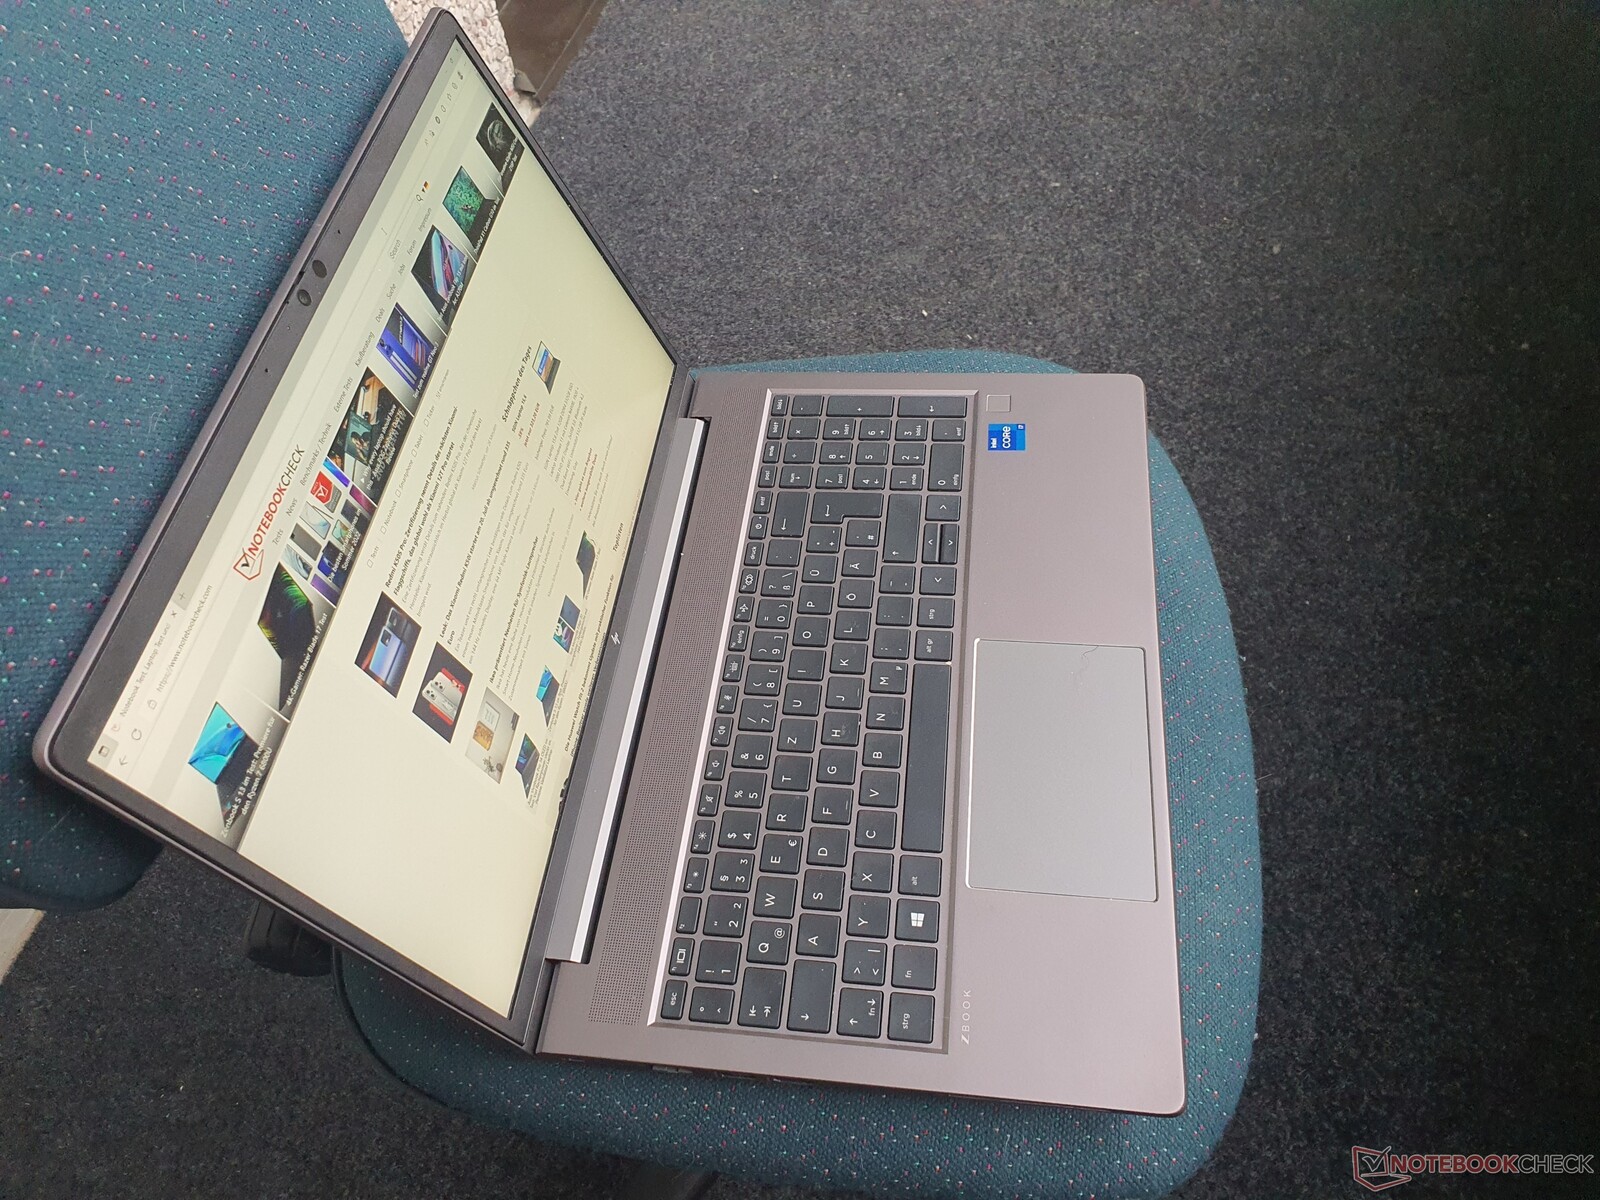
Périphériques d'entrée : Le ZBook Power impressionne avec un clavier impeccable
Clavier
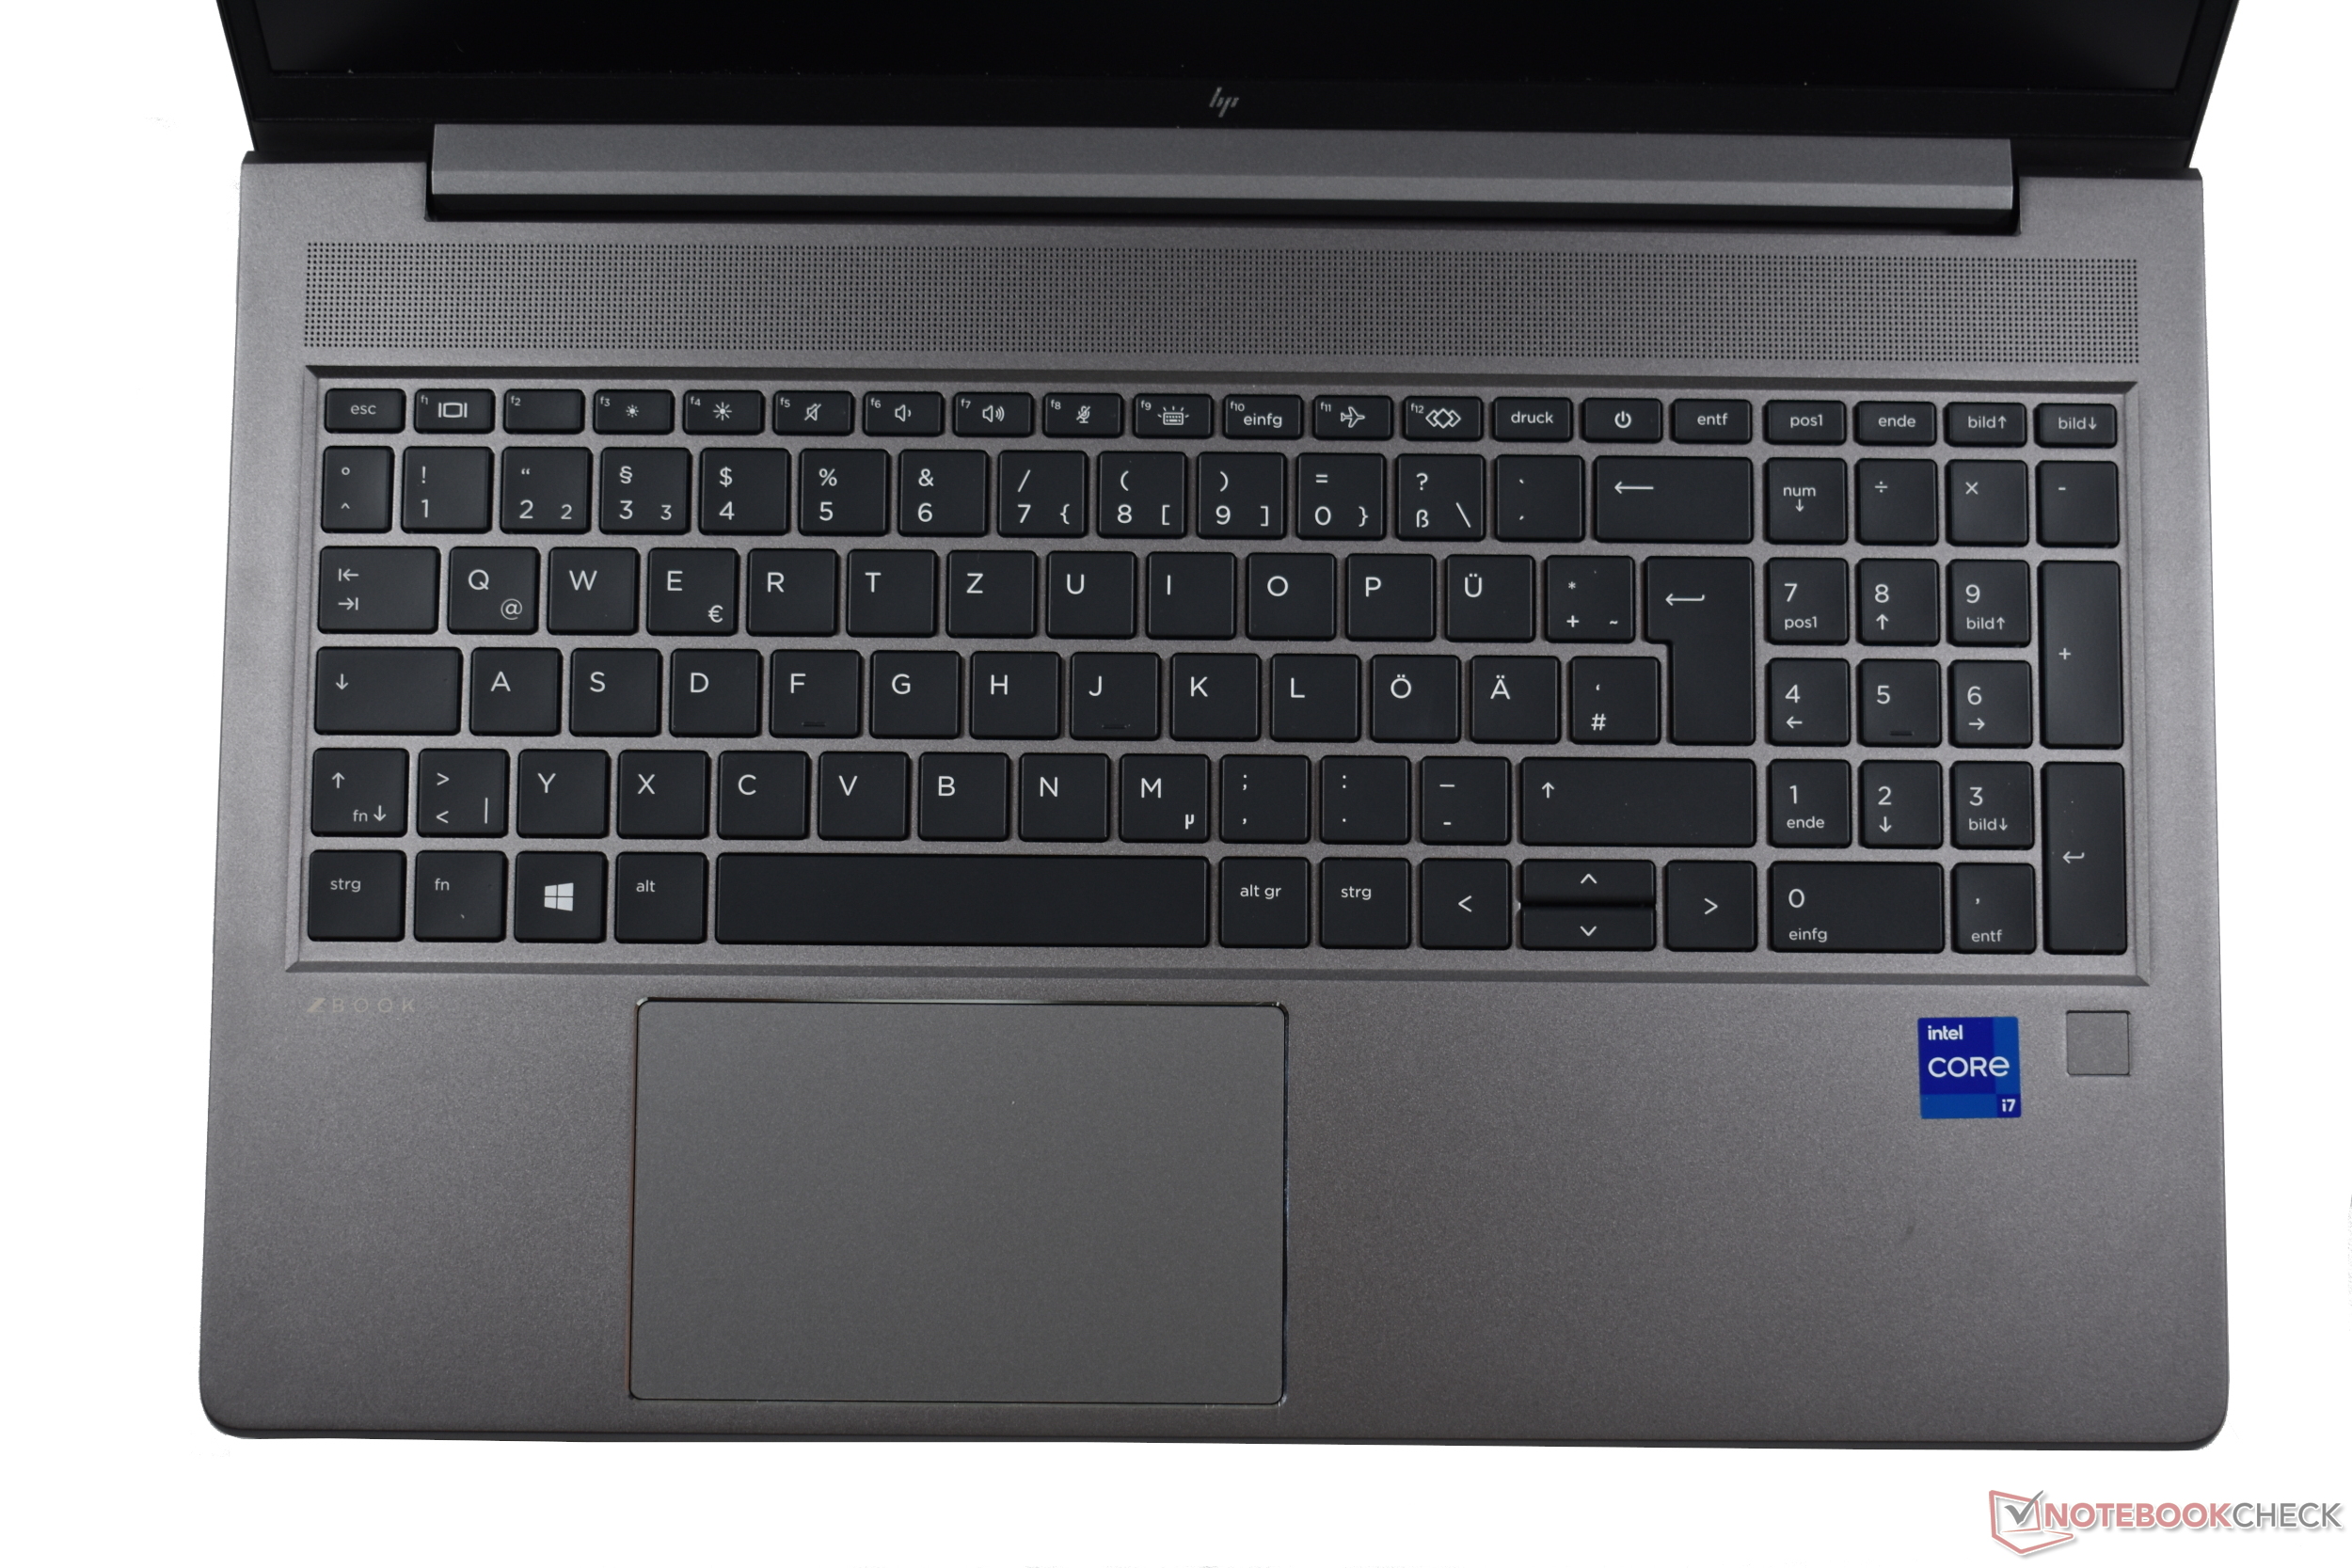
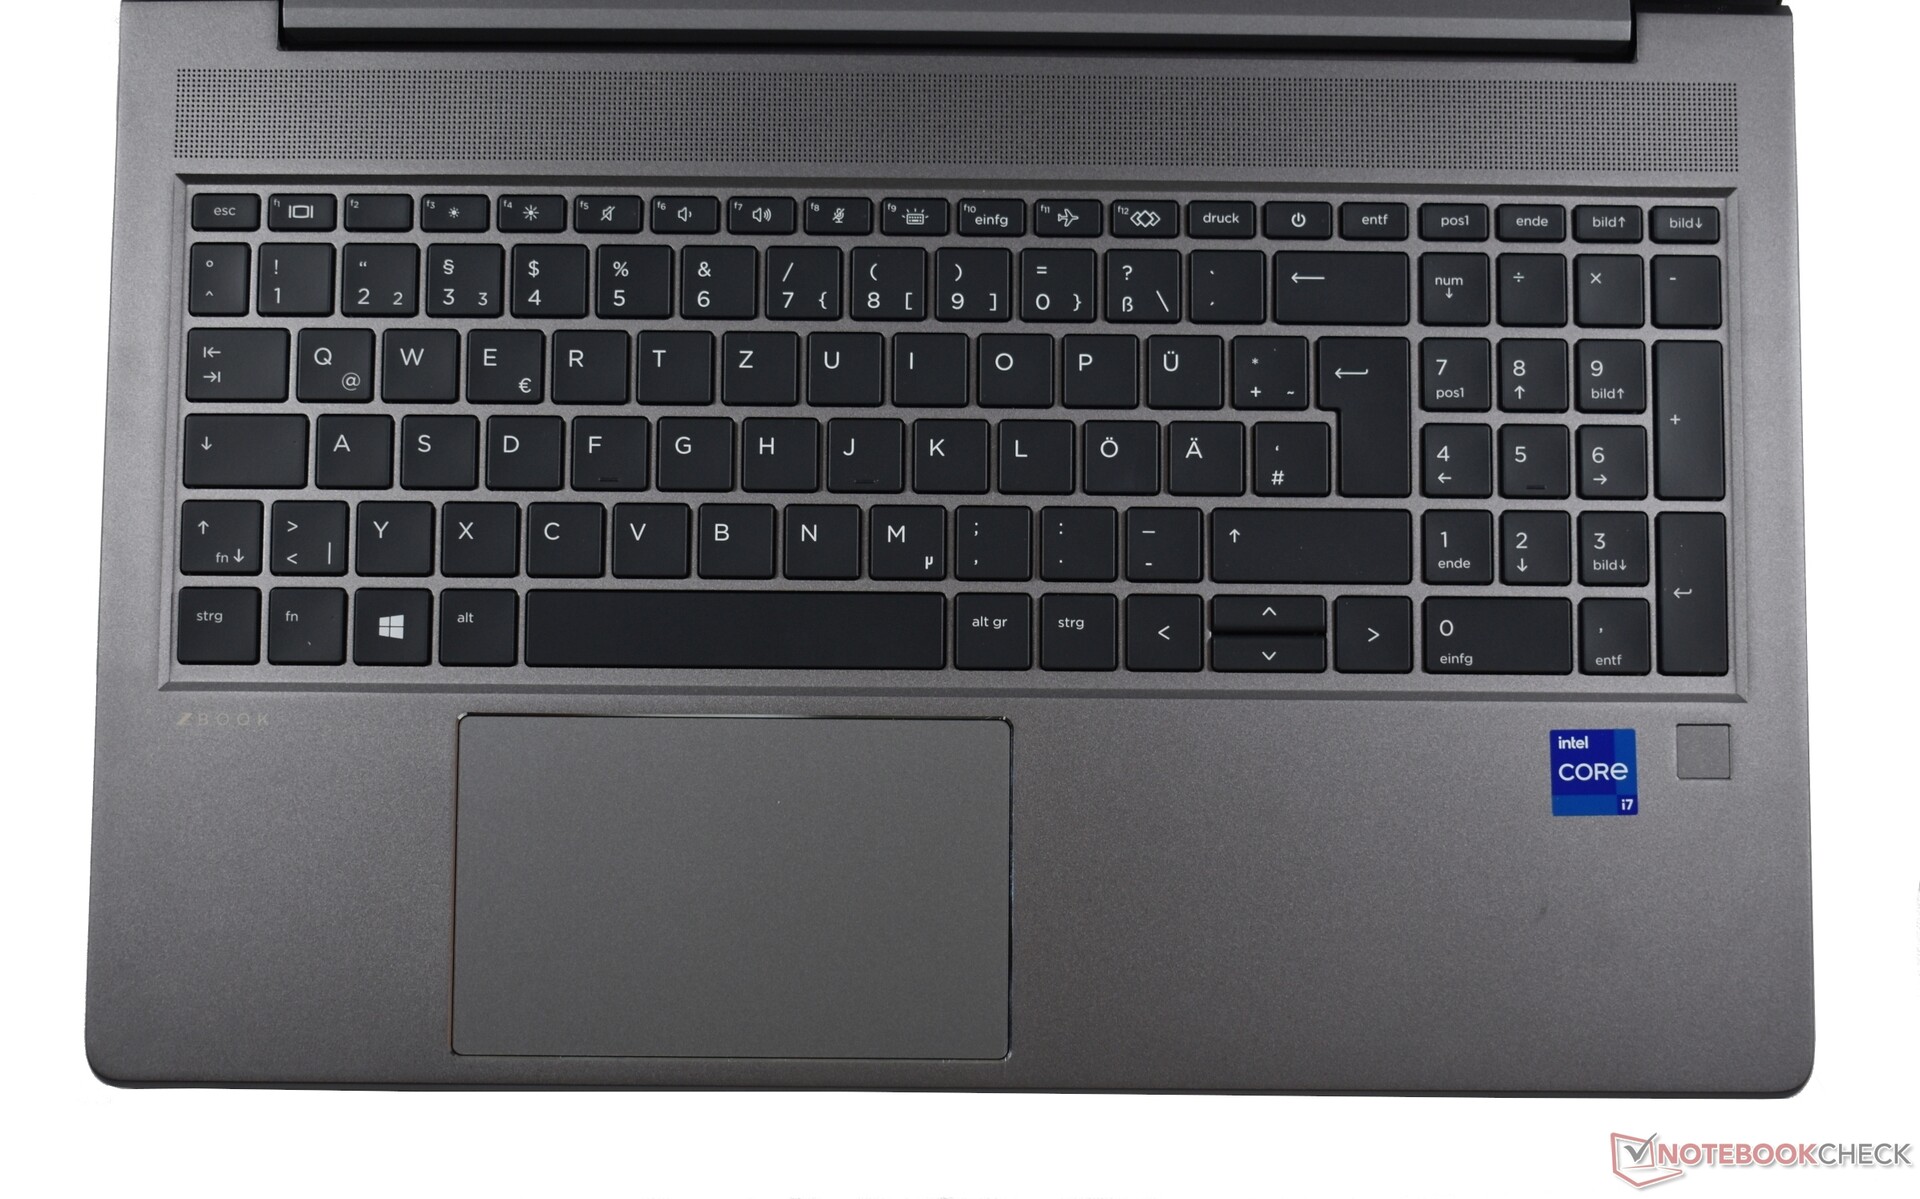
Si le clavier présente des touches (15 × 15 mm, ~0,6 x 0,6 in) et des distances légèrement plus petites, le lettrage est plus grand. Il ressemble beaucoup à celui du ZBook Firefly etZBook Furyl'expérience de frappe est donc tout aussi nette et le point de pression est clairement perceptible. La course de ~1,5 mm (~0,06 in) ajoute à l'impression générale attrayante
Le clavier est étanche aux éclaboussures et son fonctionnement reste agréablement silencieux. Il n'est possible de l'enfoncer que très légèrement en exerçant une pression à un seul endroit. Ce n'est pas nécessairement pire que celui du ThinkPad P15v.
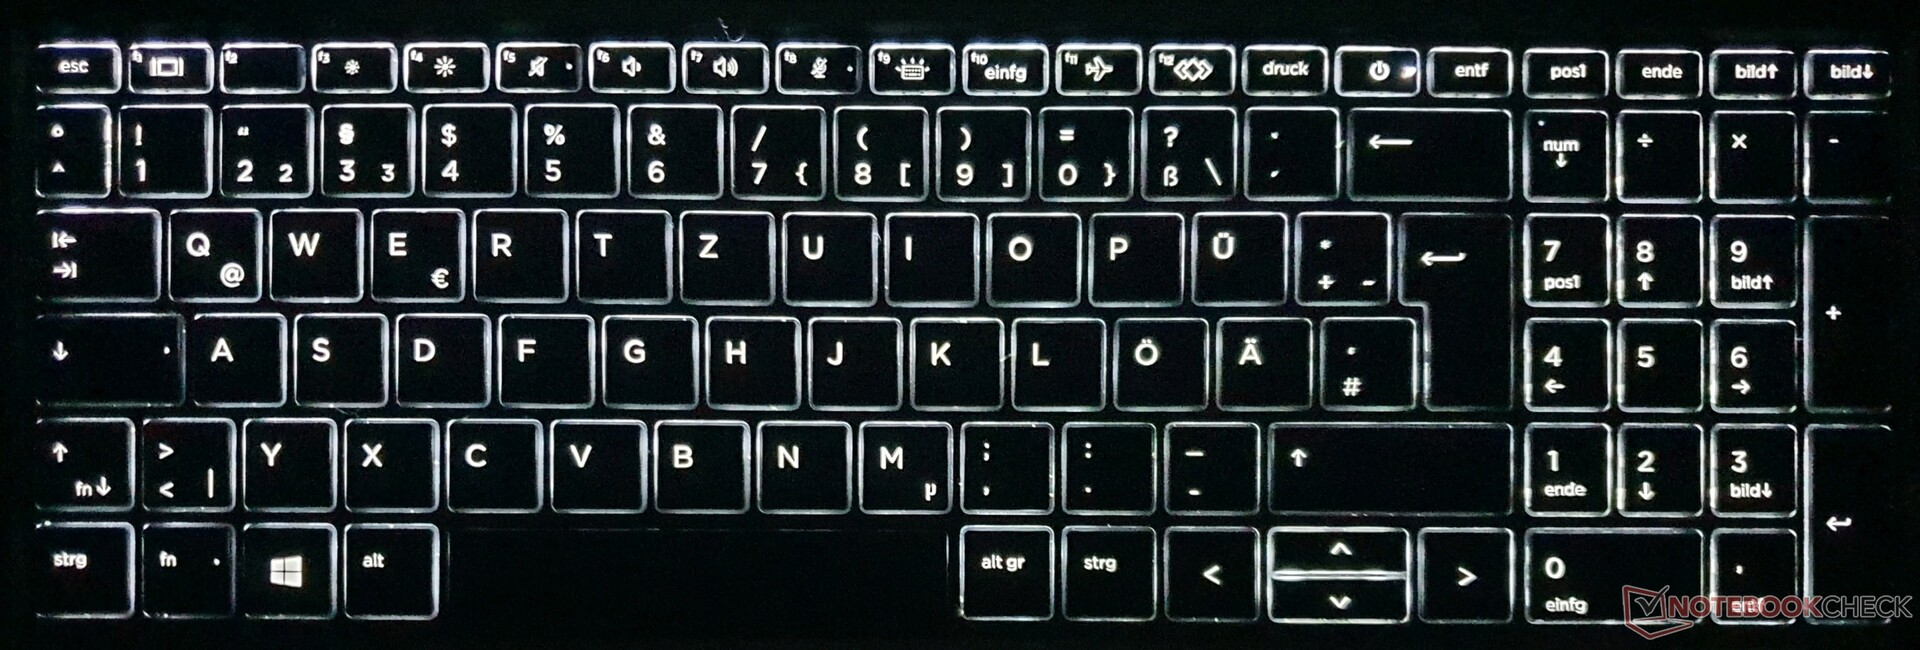
La disposition est très réussie, mais les touches qui sont plus petites sont notamment les touches Entrée, Maj gauche, les flèches verticales, le bloc numérique et la rangée supérieure. Le bouton d'alimentation est également intégré à la rangée supérieure, mais une pression accidentelle sur celui-ci ne mettra pas l'ordinateur portable en veille. Il y a un éclairage en deux étapes, et sa durée peut être configurée dans le BIOS.
Pavé tactile
L'écran de 11,5 × 7 cm (~4,5 x 2,75 in) est extrêmement réactif et précis. La surface en verre lisse offre de très bonnes caractéristiques de glissement, et tous les gestes sont mis en œuvre de manière irréprochable. Les touches intégrées ont une course moyenne et produisent un retour puissant et fort.
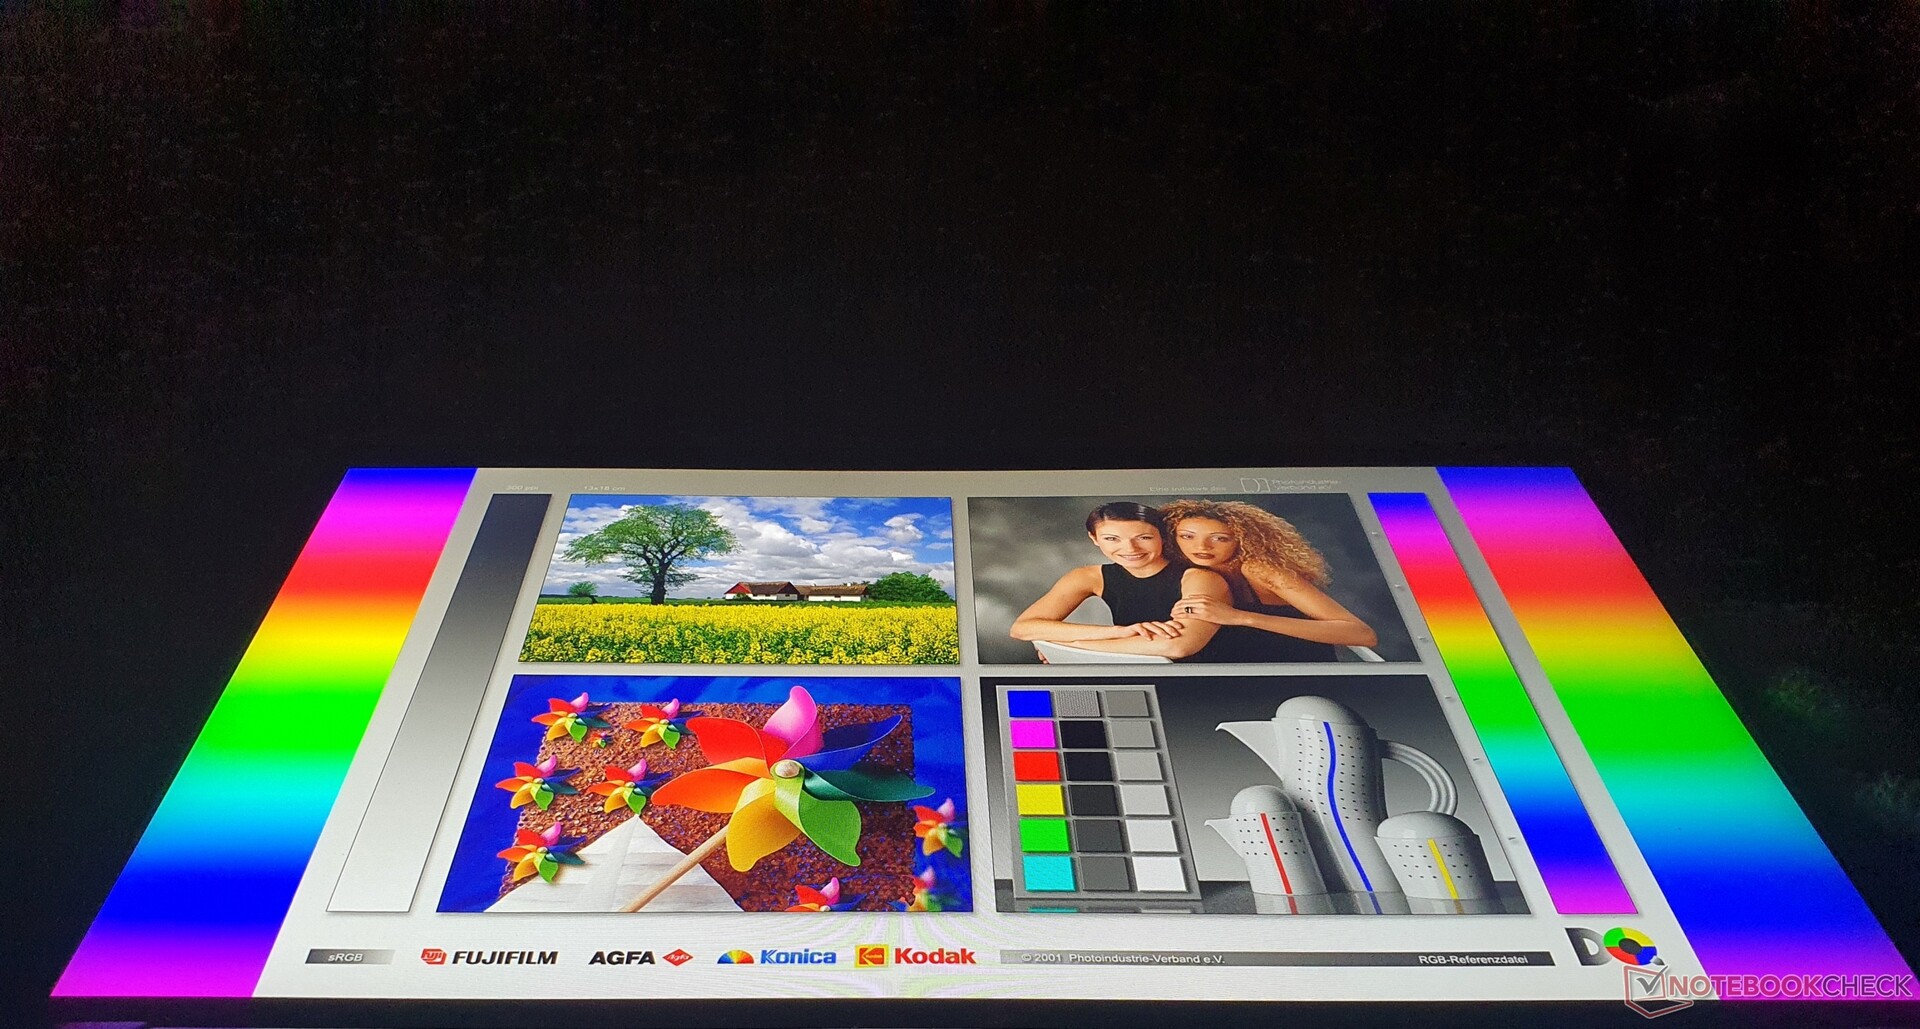
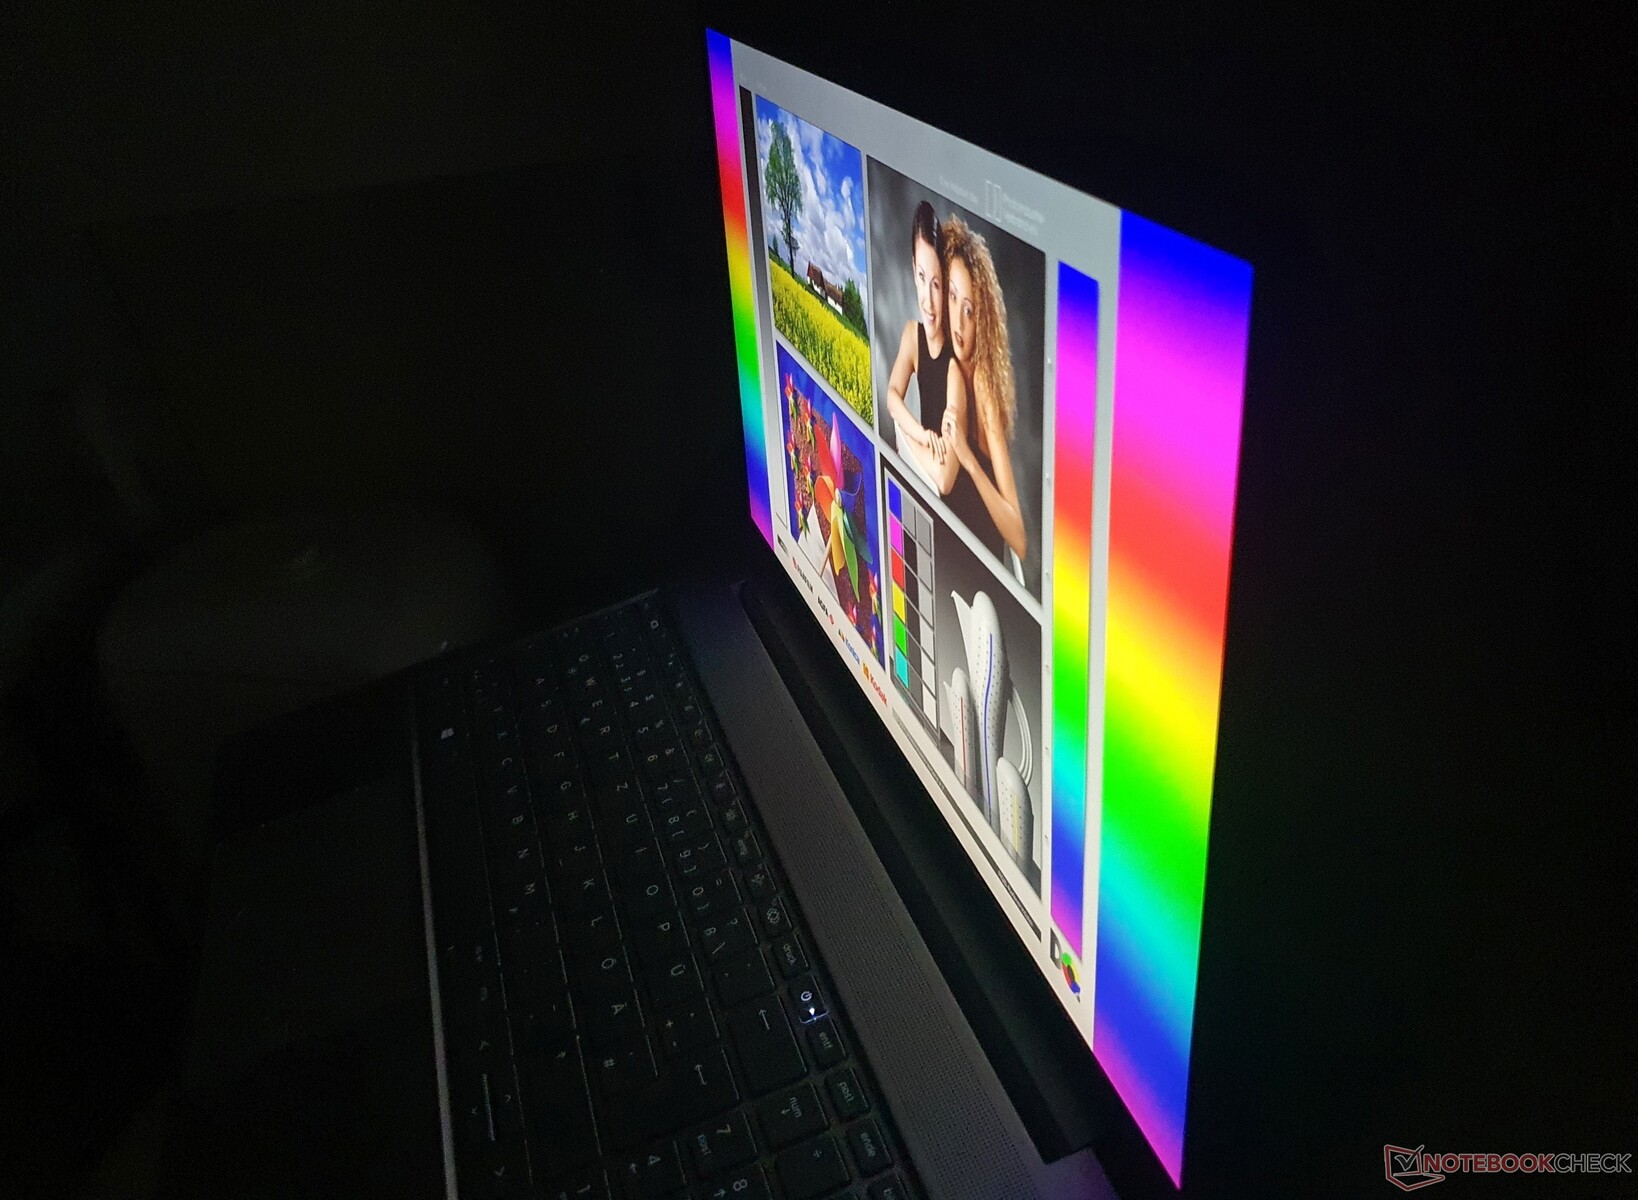
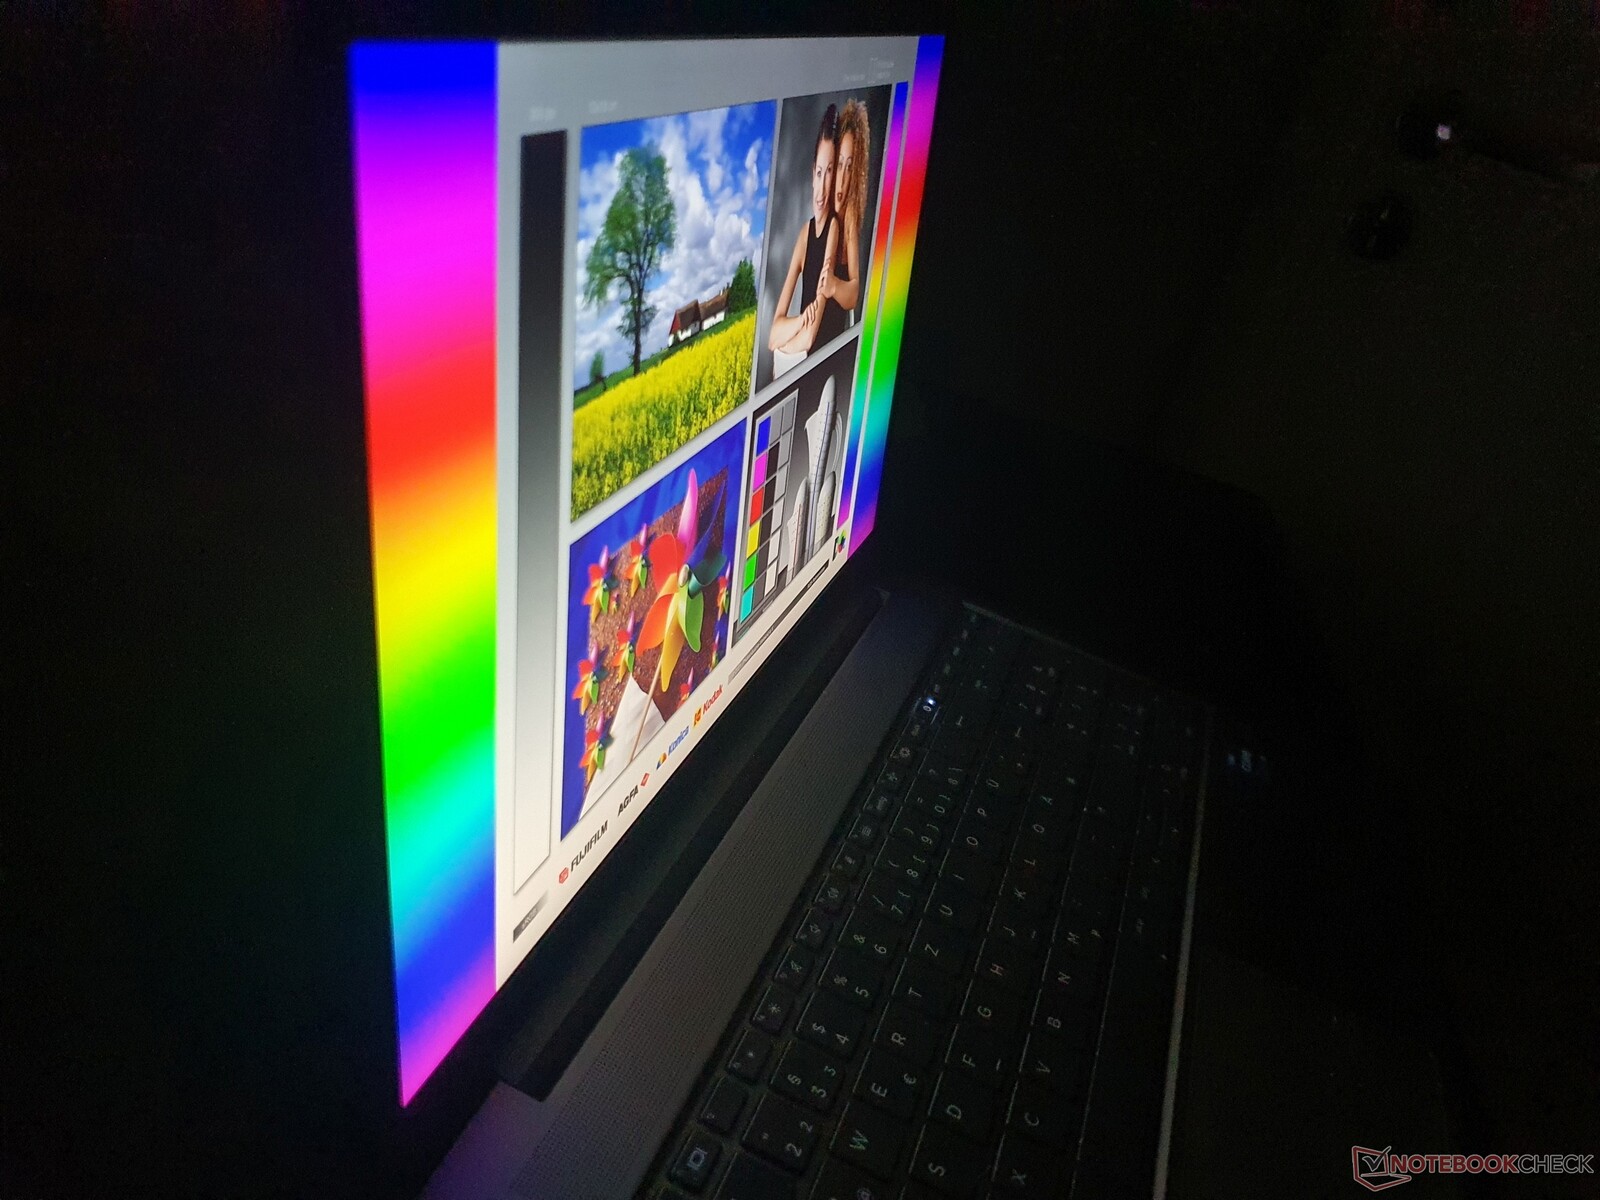
Écran FHD brillant et à fort contraste dans le ZBook Power
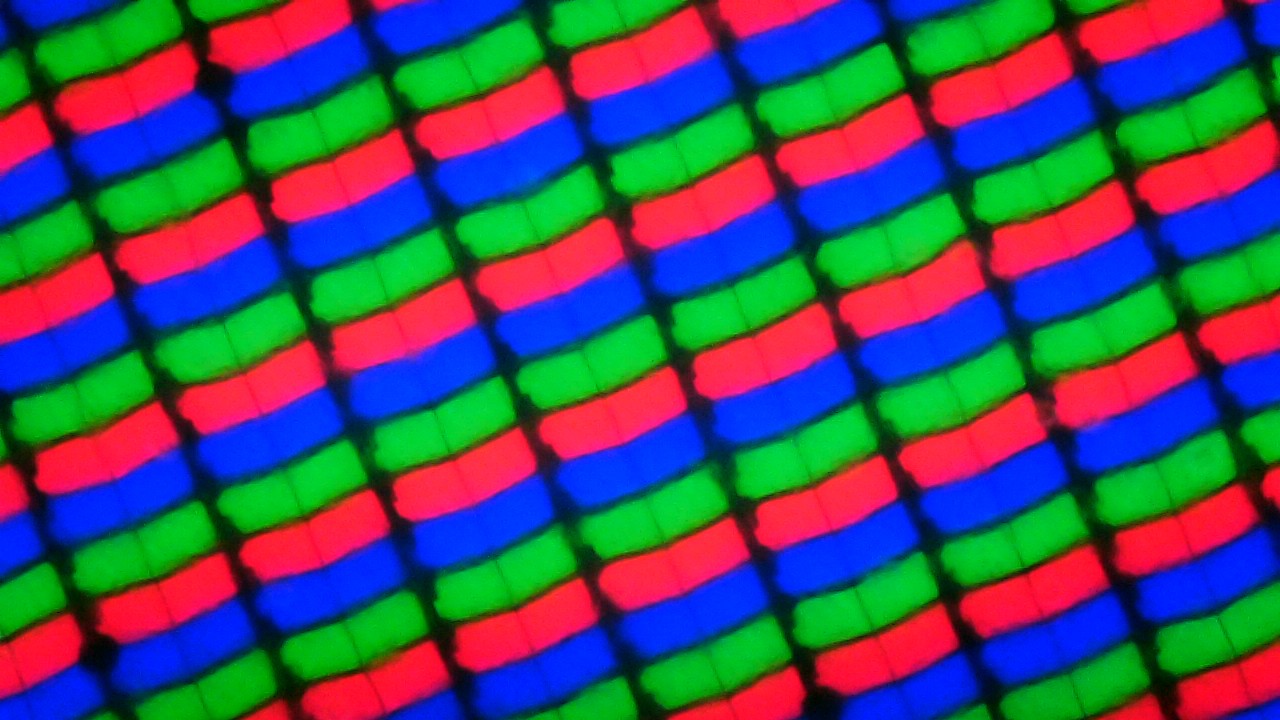

Notre configuration comprend la même dalle IPS FHD mate de 15,6 pouces, lumineuse (400 nits) et à faible consommation (AUOA08B) au format 16:9 que son prédécesseur. Il est également utilisé dans plusieurs HP Elite et ProBooks, ainsi que dans le HP Envy x360 15.
L'option 4K (3840 x 2160 pixels) devrait réduire sensiblement l'autonomie de la batterie et, selon la fiche technique, n'offre qu'une couverture complète de l'espace colorimétrique sRGB, comme le panneau 4K du ZBook Firefly G7 - vous chercherez donc en vain du Dreamcolor. Le panneau d'entrée de gamme utilise un IPS FHD avec seulement 250 nits de luminosité et avec le tactile en option.
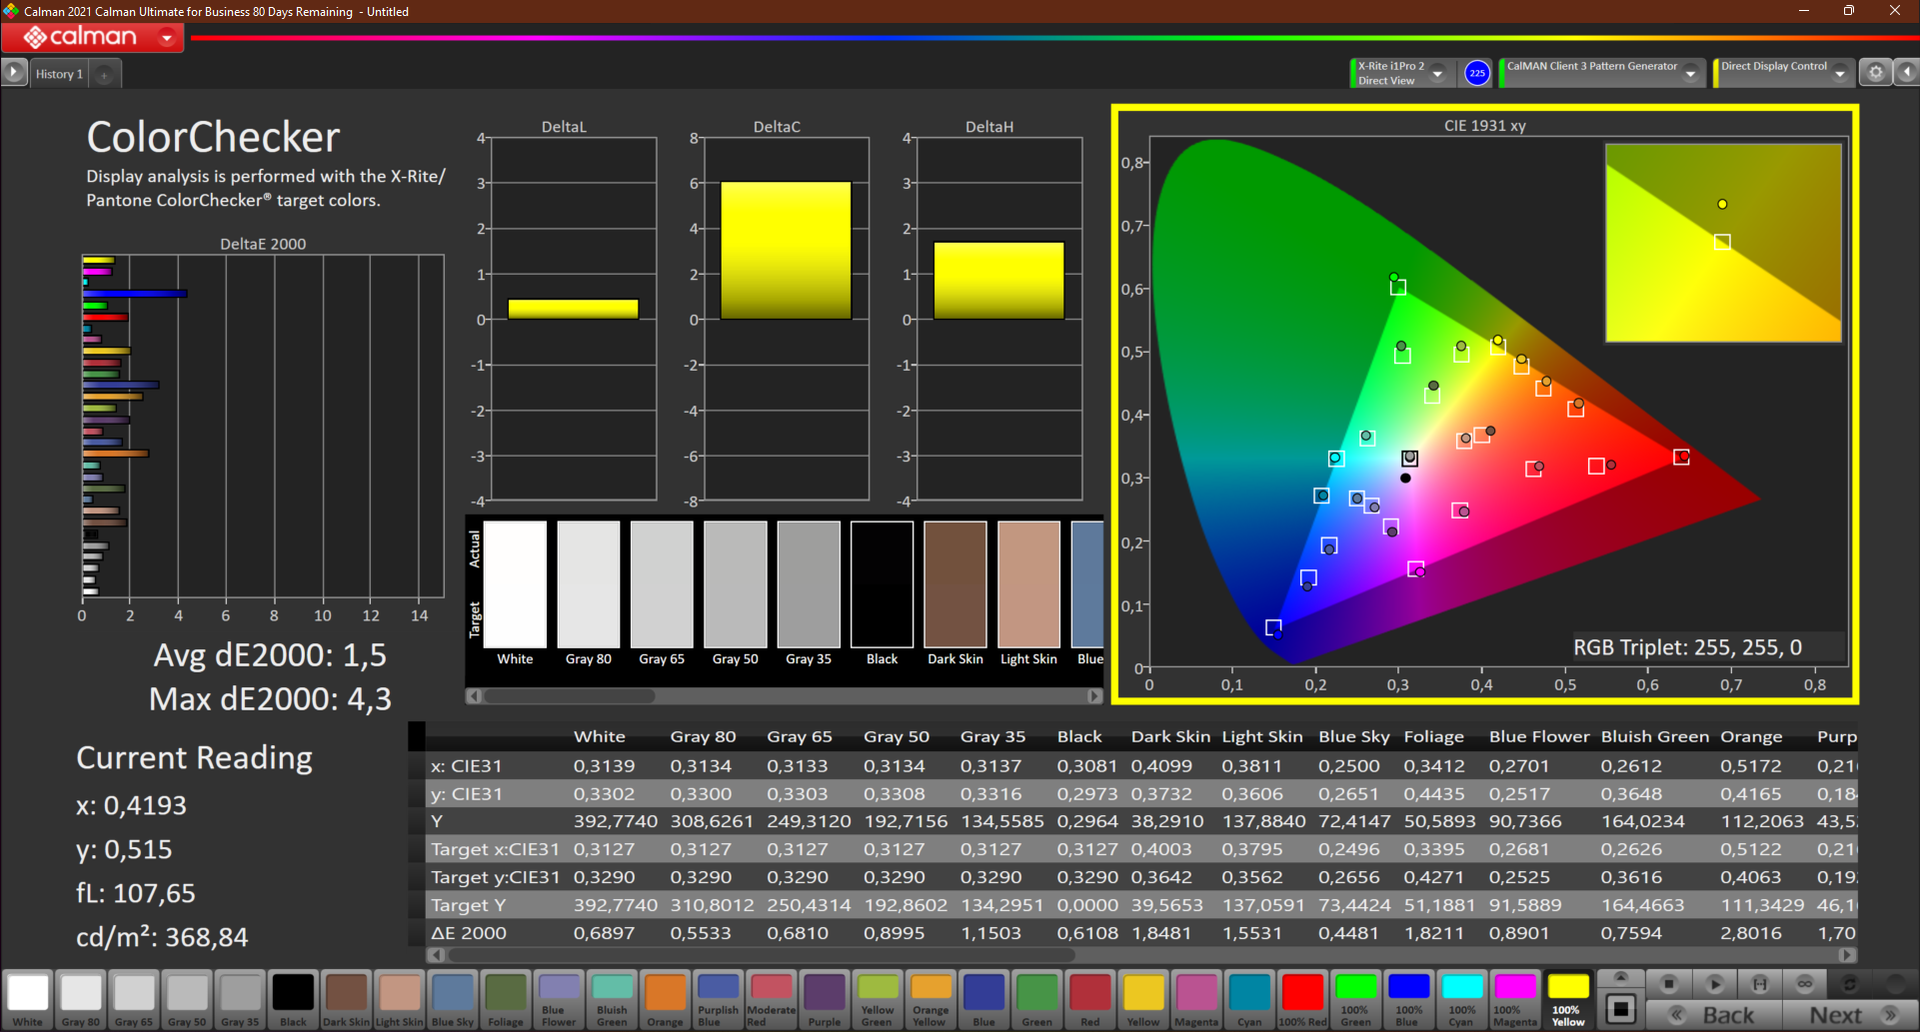
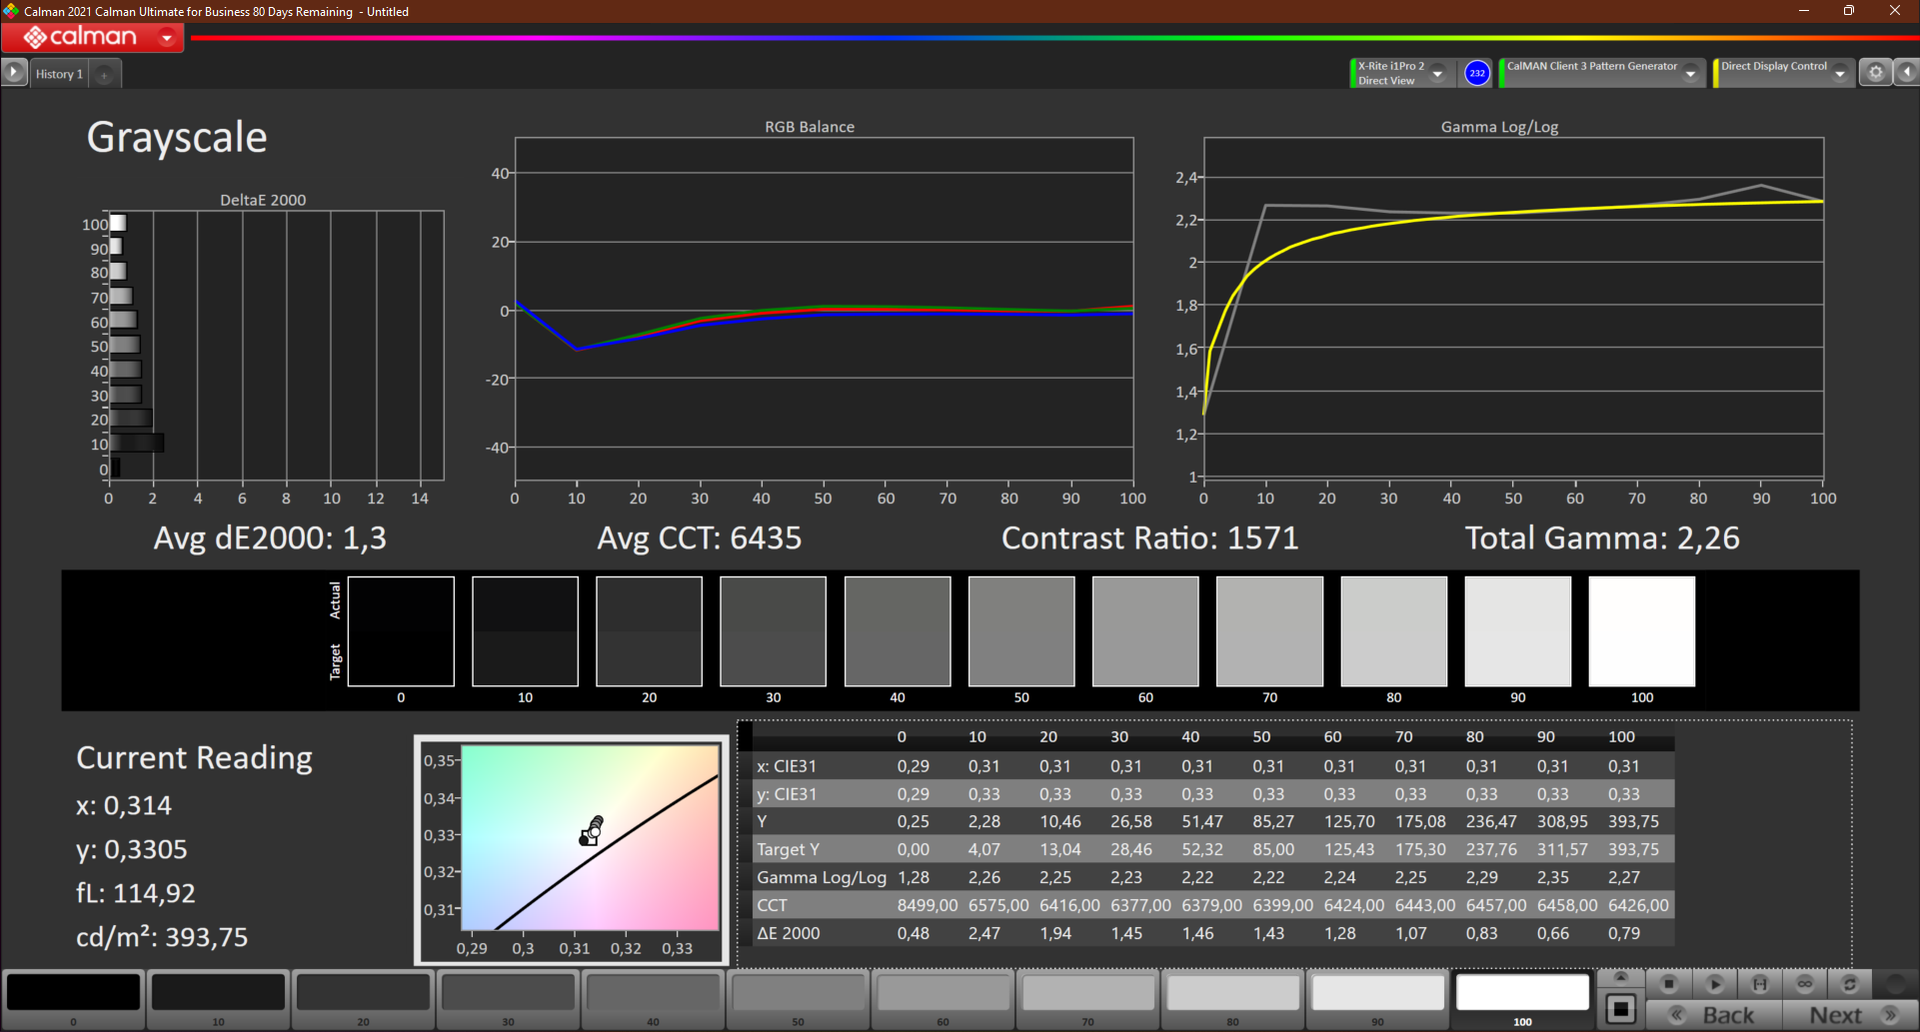
Avec une moyenne de 385 nits, la dalle est nettement plus lumineuse que celle du ThinkPad P15vet Precision 3551. Les valeurs DeltaE (< 2) sont également beaucoup plus précises. Le contraste est un bon 1574:1 et, avec la valeur du noir de 0,25 nits, il produit un noir saturé. La lenteur des temps de réponse est un inconvénient. Il n'y a pas de scintillement PWM
| |||||||||||||||||||||||||
Homogénéité de la luminosité: 78 %
Valeur mesurée au centre, sur batterie: 393 cd/m²
Contraste: 1572:1 (Valeurs des noirs: 0.25 cd/m²)
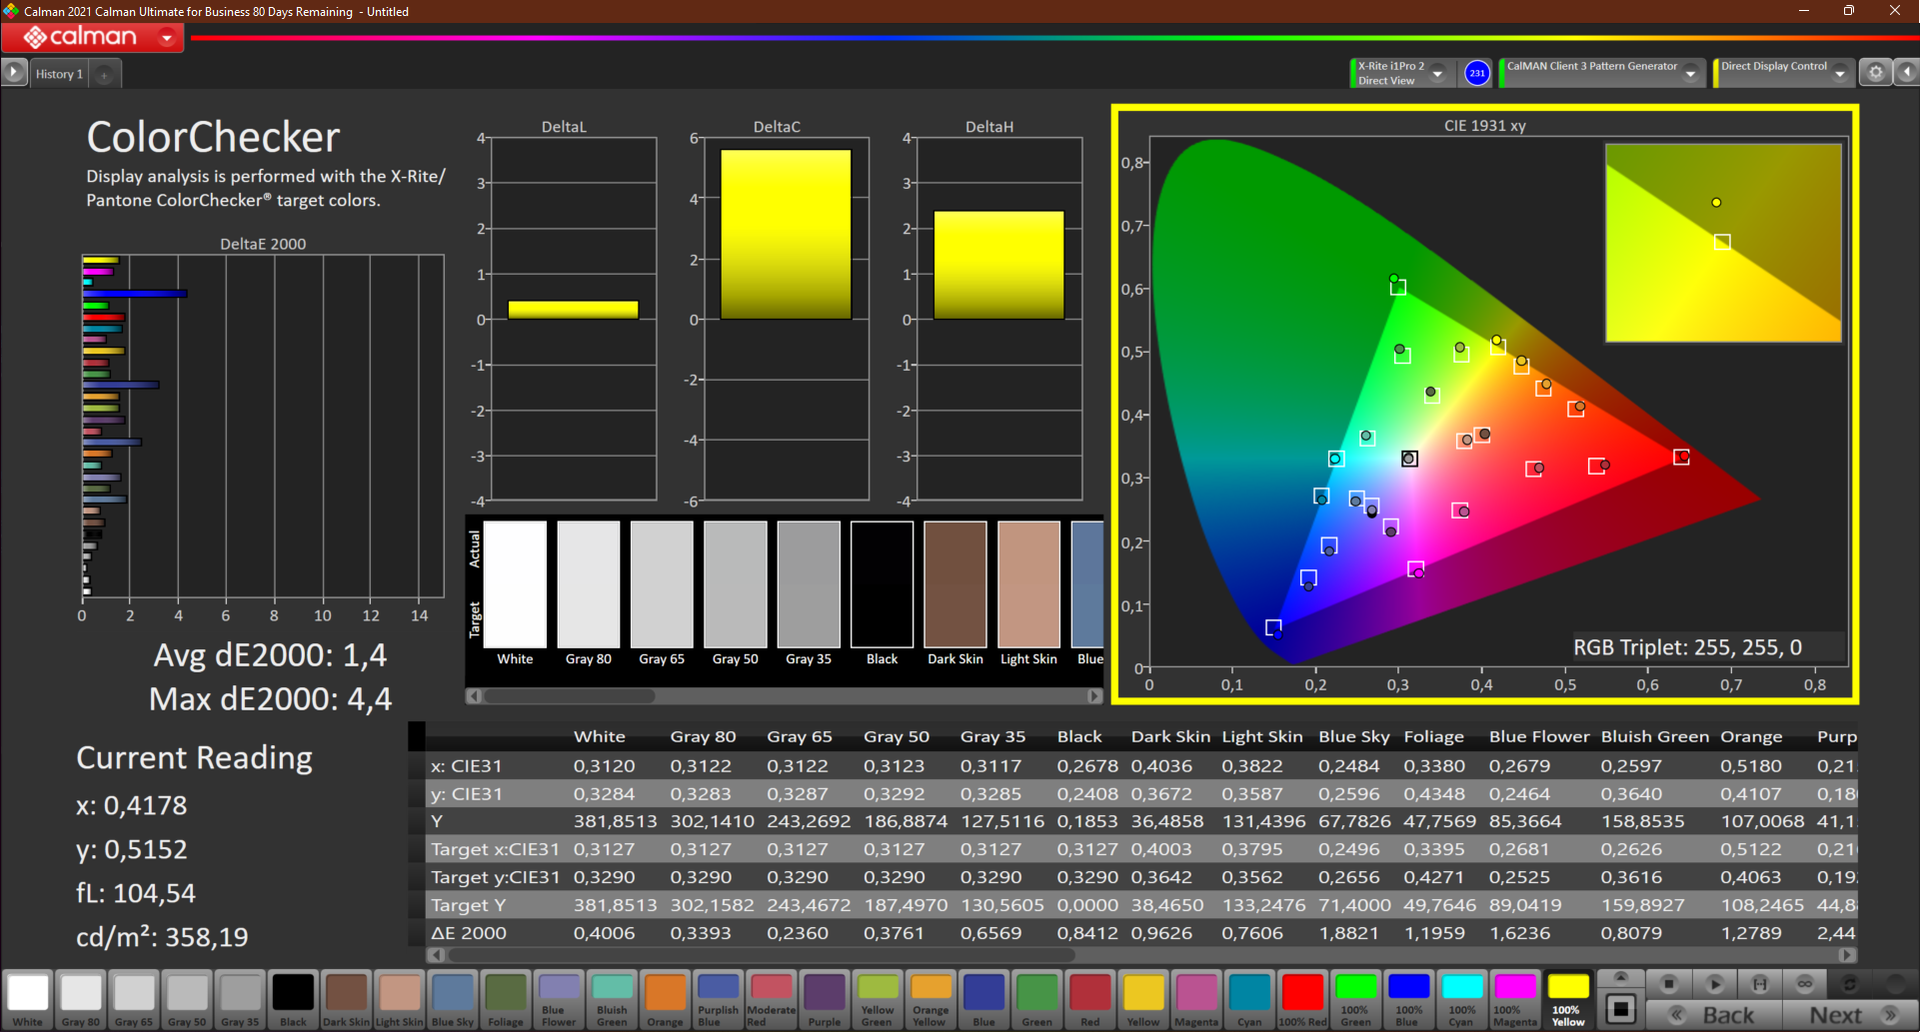
ΔE ColorChecker Calman: 1.5 | ∀{0.5-29.43 Ø4.71}
calibrated: 1.4
ΔE Greyscale Calman: 1.3 | ∀{0.09-98 Ø4.96}
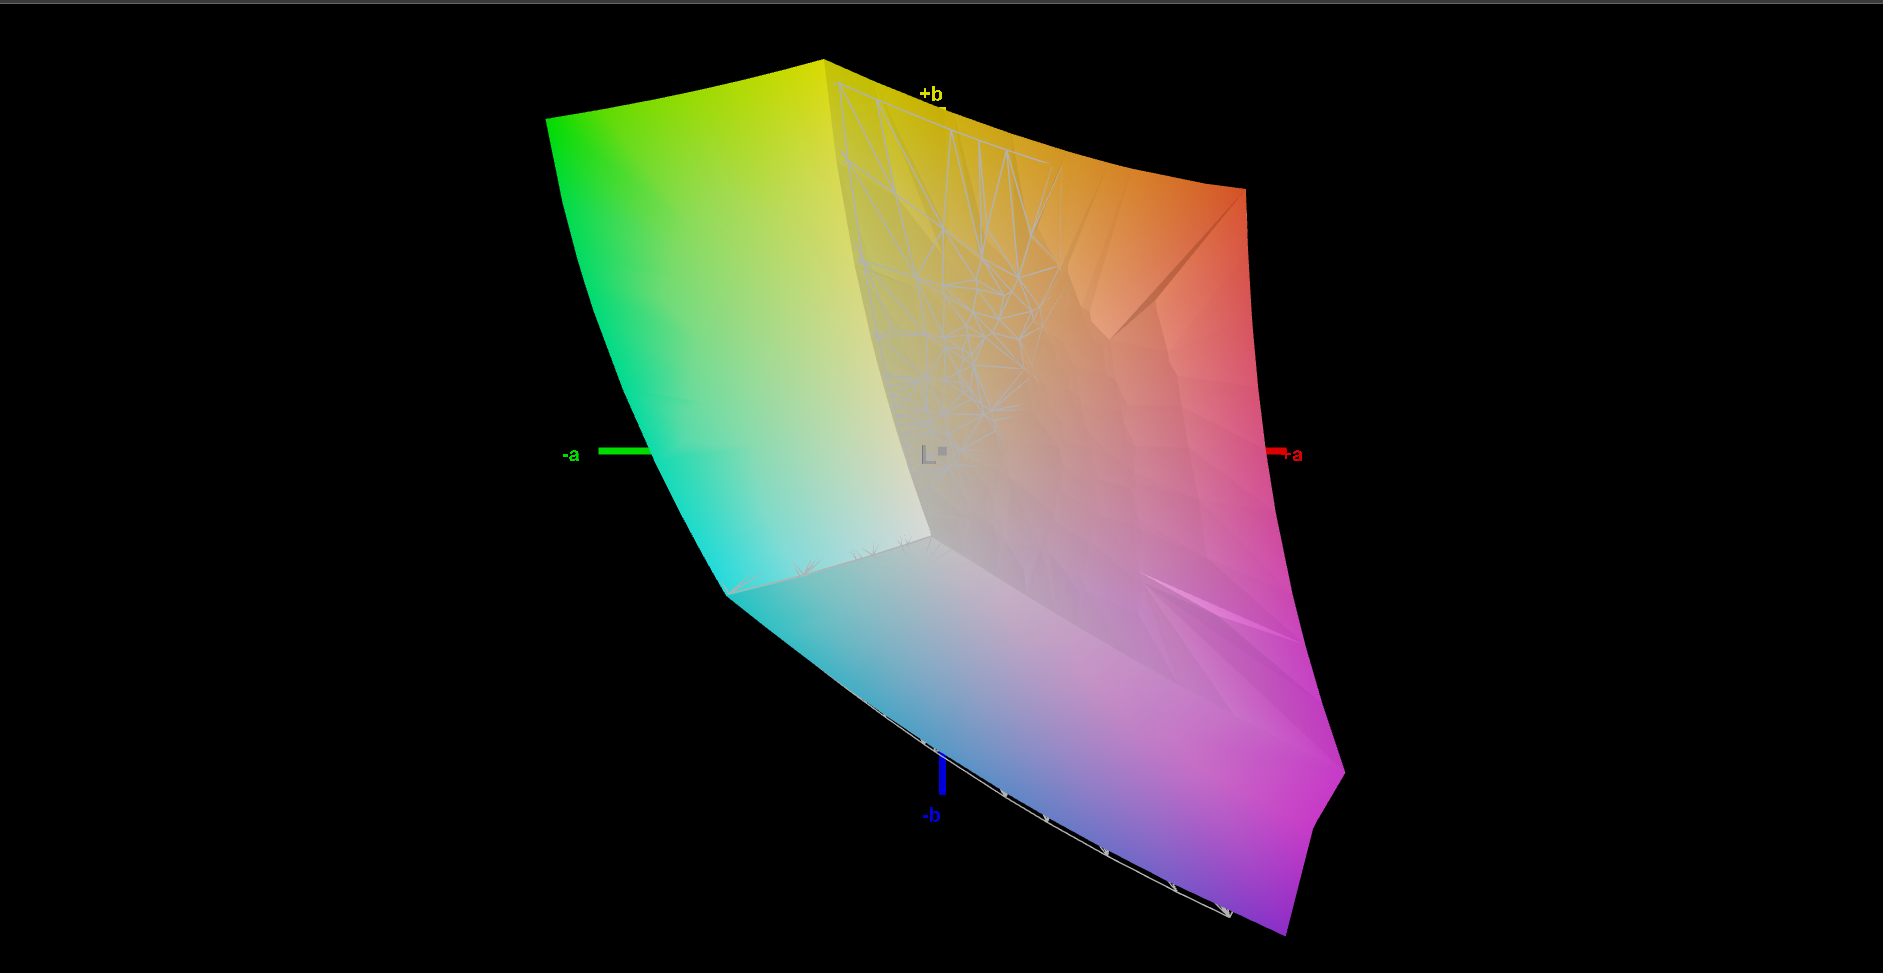
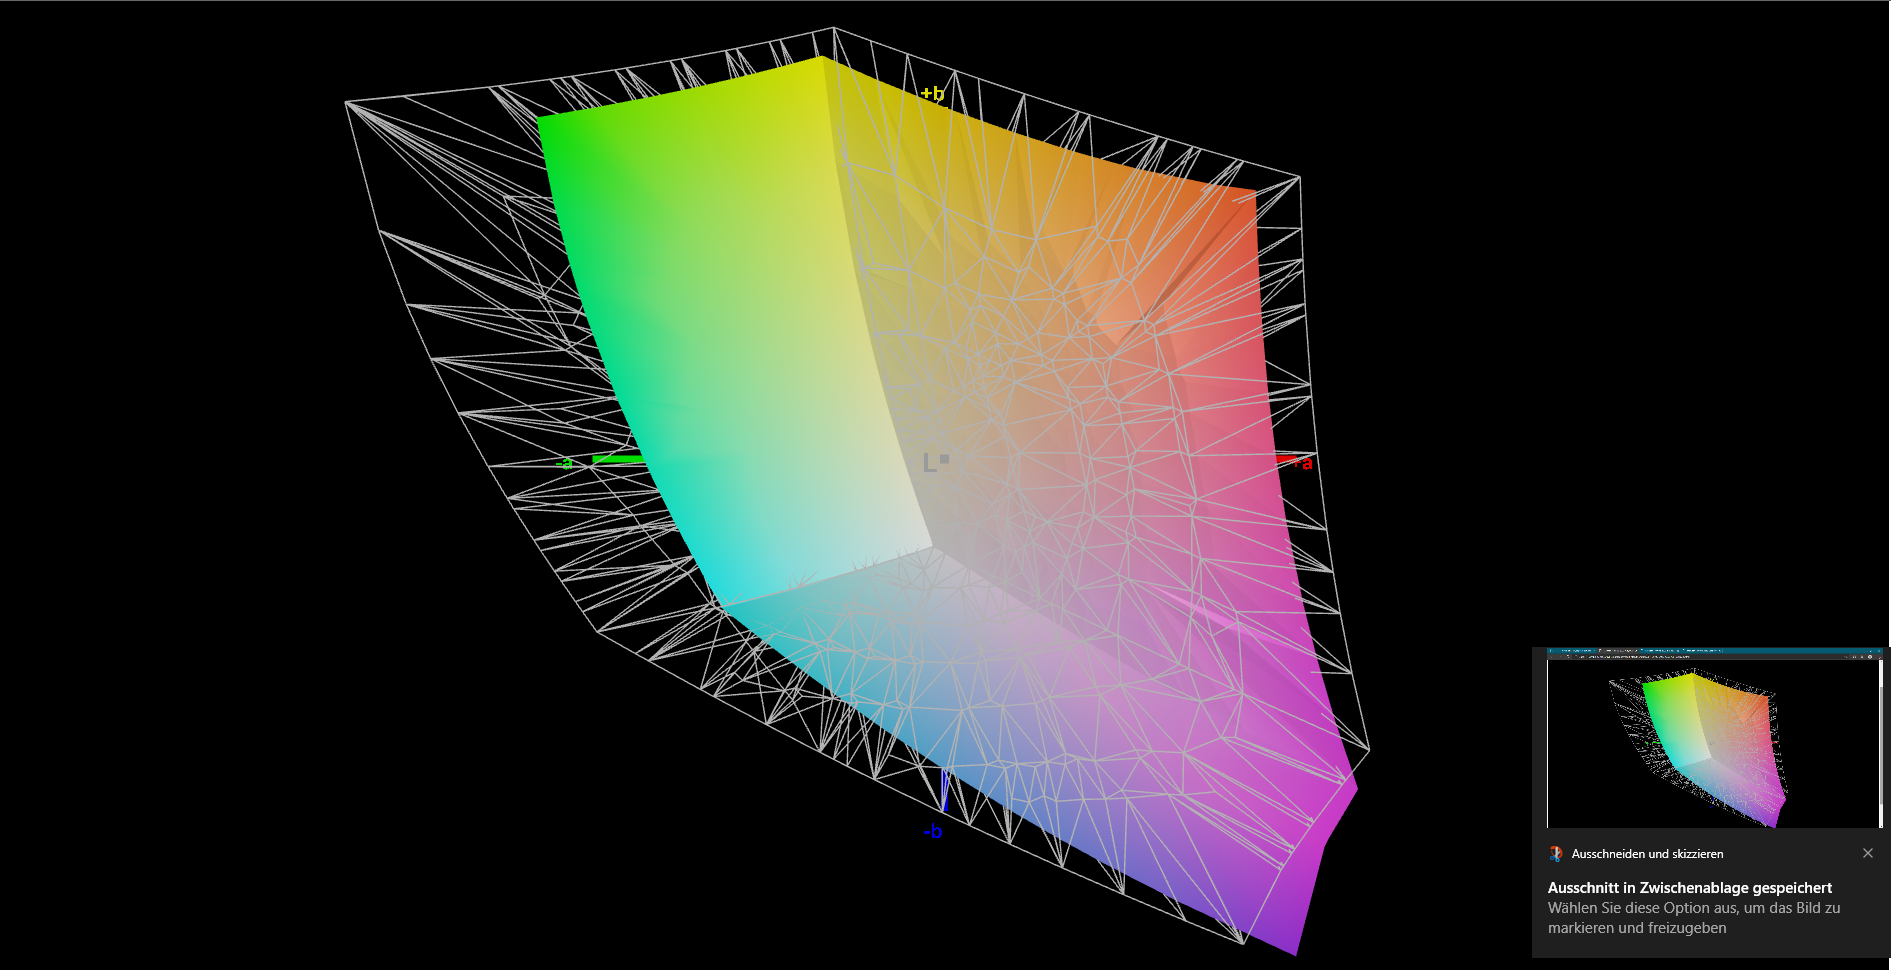
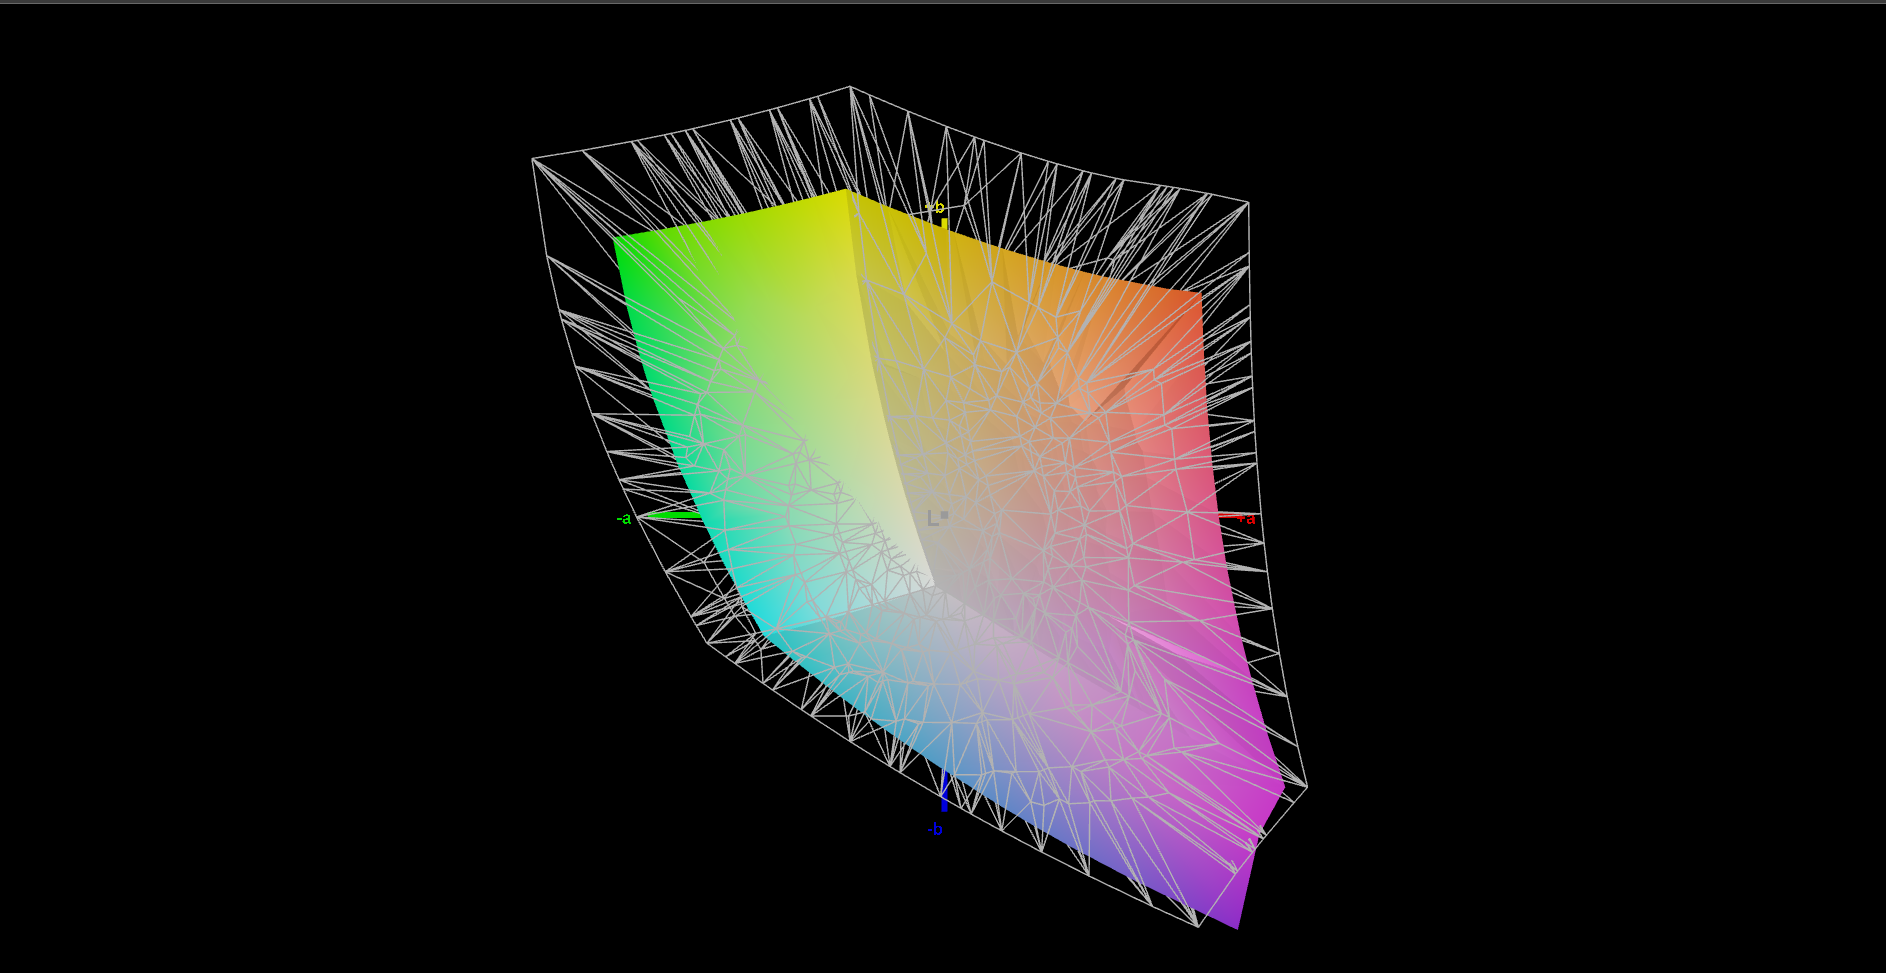
71.3% AdobeRGB 1998 (Argyll 3D)
99% sRGB (Argyll 3D)
70.5% Display P3 (Argyll 3D)
Gamma: 2.26
CCT: 6435 K
| HP ZBook Power 15 G8 313S5EA AUOA08B, IPS LED, 1920x1080, 15.6" | HP ZBook Fury 15 G8 BOE0969, IPS, 3840x2160, 15.6" | HP ZBook Studio 15 G8 SDC4145, OLED, 3840x2160, 15.6" | HP ZBook Firefly 15 G8 2C9R7EA LGD069B, IPS, 1920x1080, 15.6" | Lenovo ThinkPad P15v G2 21A9000XGE N156HCA-EAC, IPS LED, 1920x1080, 15.6" | Dell Precision 3000 3551 LG Philips 156WFD, IPS, 1920x1080, 15.6" | |
|---|---|---|---|---|---|---|
| Display | 20% | 26% | -2% | -36% | -45% | |
| Display P3 Coverage (%) | 70.5 | 95.9 36% | 99.9 42% | 68.6 -3% | 43.7 -38% | 37.5 -47% |
| sRGB Coverage (%) | 99 | 100 1% | 100 1% | 98.5 -1% | 65.1 -34% | 56.5 -43% |
| AdobeRGB 1998 Coverage (%) | 71.3 | 87.3 22% | 95.3 34% | 70 -2% | 45.3 -36% | 38.74 -46% |
| Response Times | 74% | 95% | 12% | 24% | 41% | |
| Response Time Grey 50% / Grey 80% * (ms) | 61 | 14.8 ? 76% | 2.4 ? 96% | 56 ? 8% | 48 ? 21% | 29.6 ? 51% |
| Response Time Black / White * (ms) | 38 ? | 11 ? 71% | 2.4 ? 94% | 32 ? 16% | 28 ? 26% | 26.4 ? 31% |
| PWM Frequency (Hz) | 240.4 ? | |||||
| Screen | -81% | -75% | -90% | -144% | -111% | |
| Brightness middle (cd/m²) | 393 | 626 59% | 379.6 -3% | 397 1% | 305 -22% | 235.5 -40% |
| Brightness (cd/m²) | 385 | 589 53% | 380 -1% | 402 4% | 281 -27% | 228 -41% |
| Brightness Distribution (%) | 78 | 87 12% | 95 22% | 84 8% | 88 13% | 89 14% |
| Black Level * (cd/m²) | 0.25 | 0.58 -132% | 0.13 48% | 0.32 -28% | 0.25 -0% | |
| Contrast (:1) | 1572 | 1079 -31% | 3054 94% | 953 -39% | 942 -40% | |
| Colorchecker dE 2000 * | 1.5 | 5.41 -261% | 5.15 -243% | 5.9 -293% | 5.9 -293% | 5.44 -263% |
| Colorchecker dE 2000 max. * | 4.3 | 9.05 -110% | 7.79 -81% | 9.4 -119% | 20.1 -367% | 13.58 -216% |
| Colorchecker dE 2000 calibrated * | 1.4 | 0.6 57% | 3.1 -121% | 1.1 21% | 4.5 -221% | 5.2 -271% |
| Greyscale dE 2000 * | 1.3 | 6.2 -377% | 2.6 -100% | 8.8 -577% | 5.3 -308% | 3.1 -138% |
| Gamma | 2.26 97% | 2.66 83% | 1.99 111% | 2.47 89% | 2.1 105% | 2.42 91% |
| CCT | 6435 101% | 6101 107% | 6166 105% | 6416 101% | 6307 103% | 7070 92% |
| Color Space (Percent of AdobeRGB 1998) (%) | 63.7 | 35.5 | ||||
| Color Space (Percent of sRGB) (%) | 98.5 | 56.1 | ||||
| Moyenne finale (programmes/paramètres) | 4% /
-37% | 15% /
-22% | -27% /
-57% | -52% /
-97% | -38% /
-75% |
* ... Moindre est la valeur, meilleures sont les performances
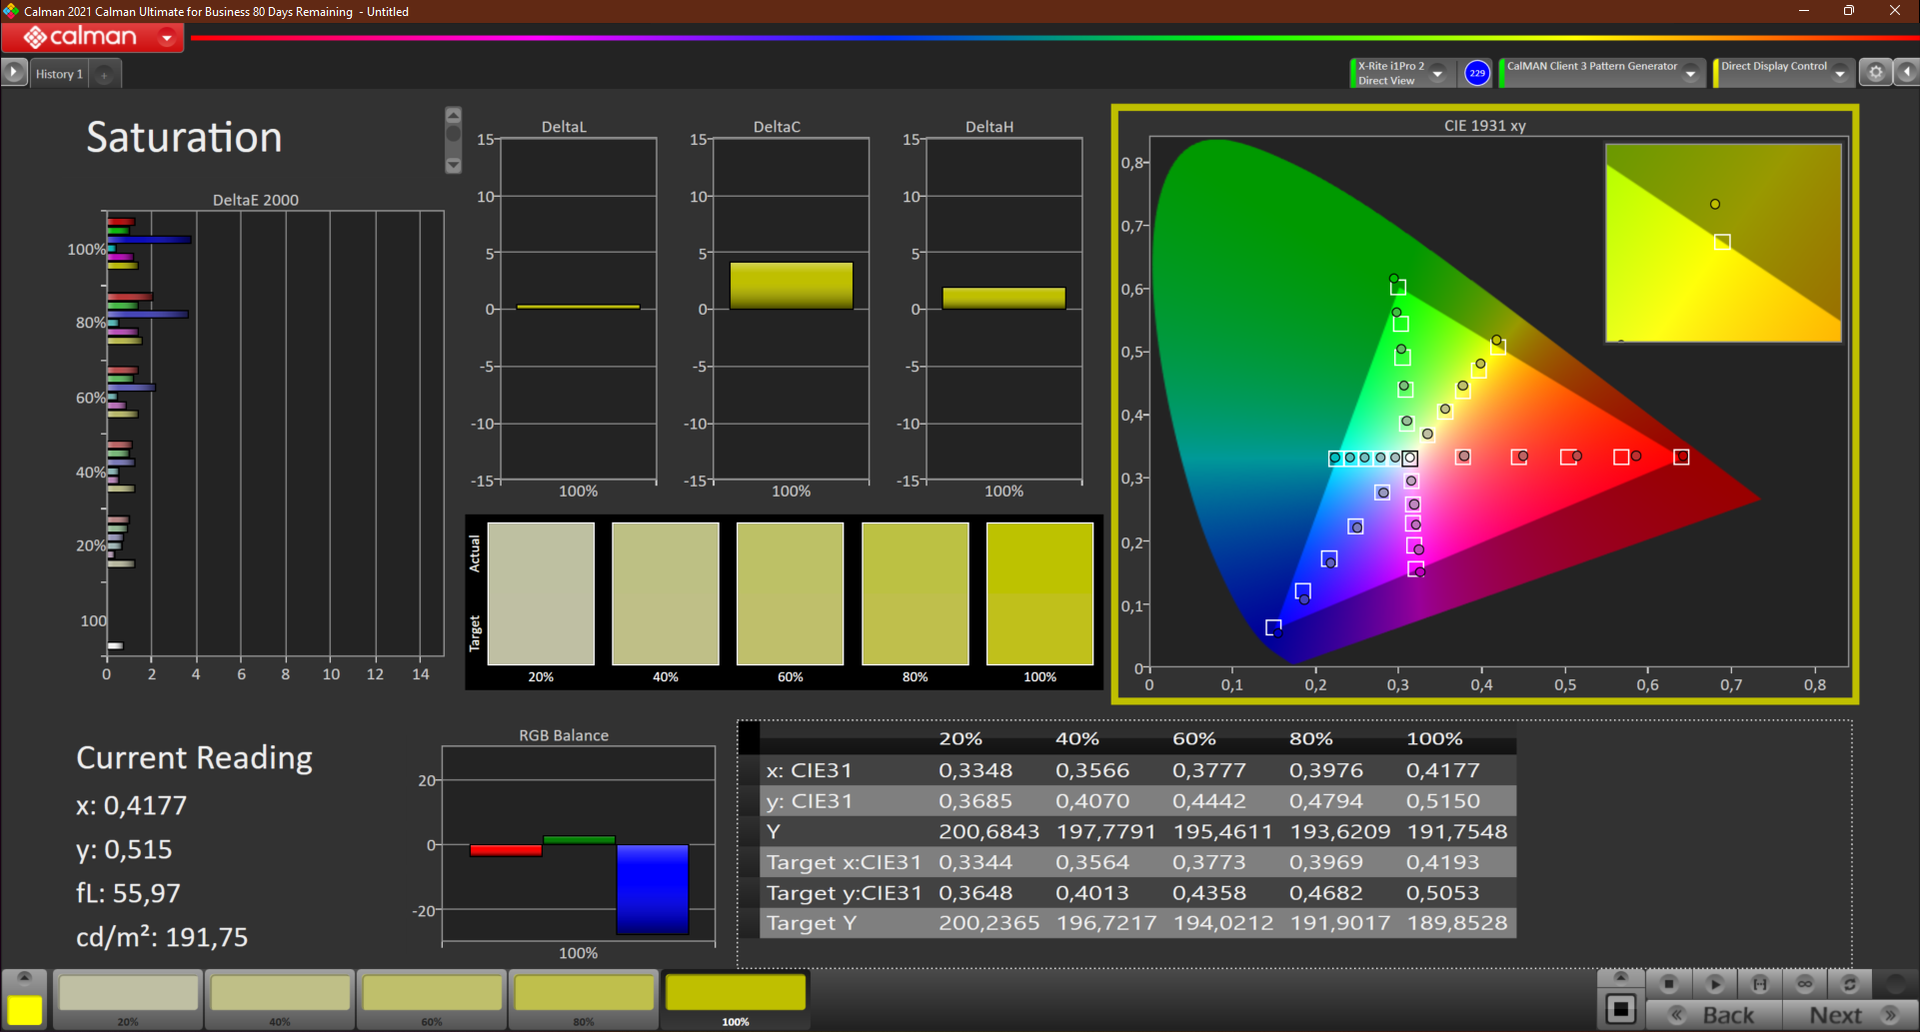
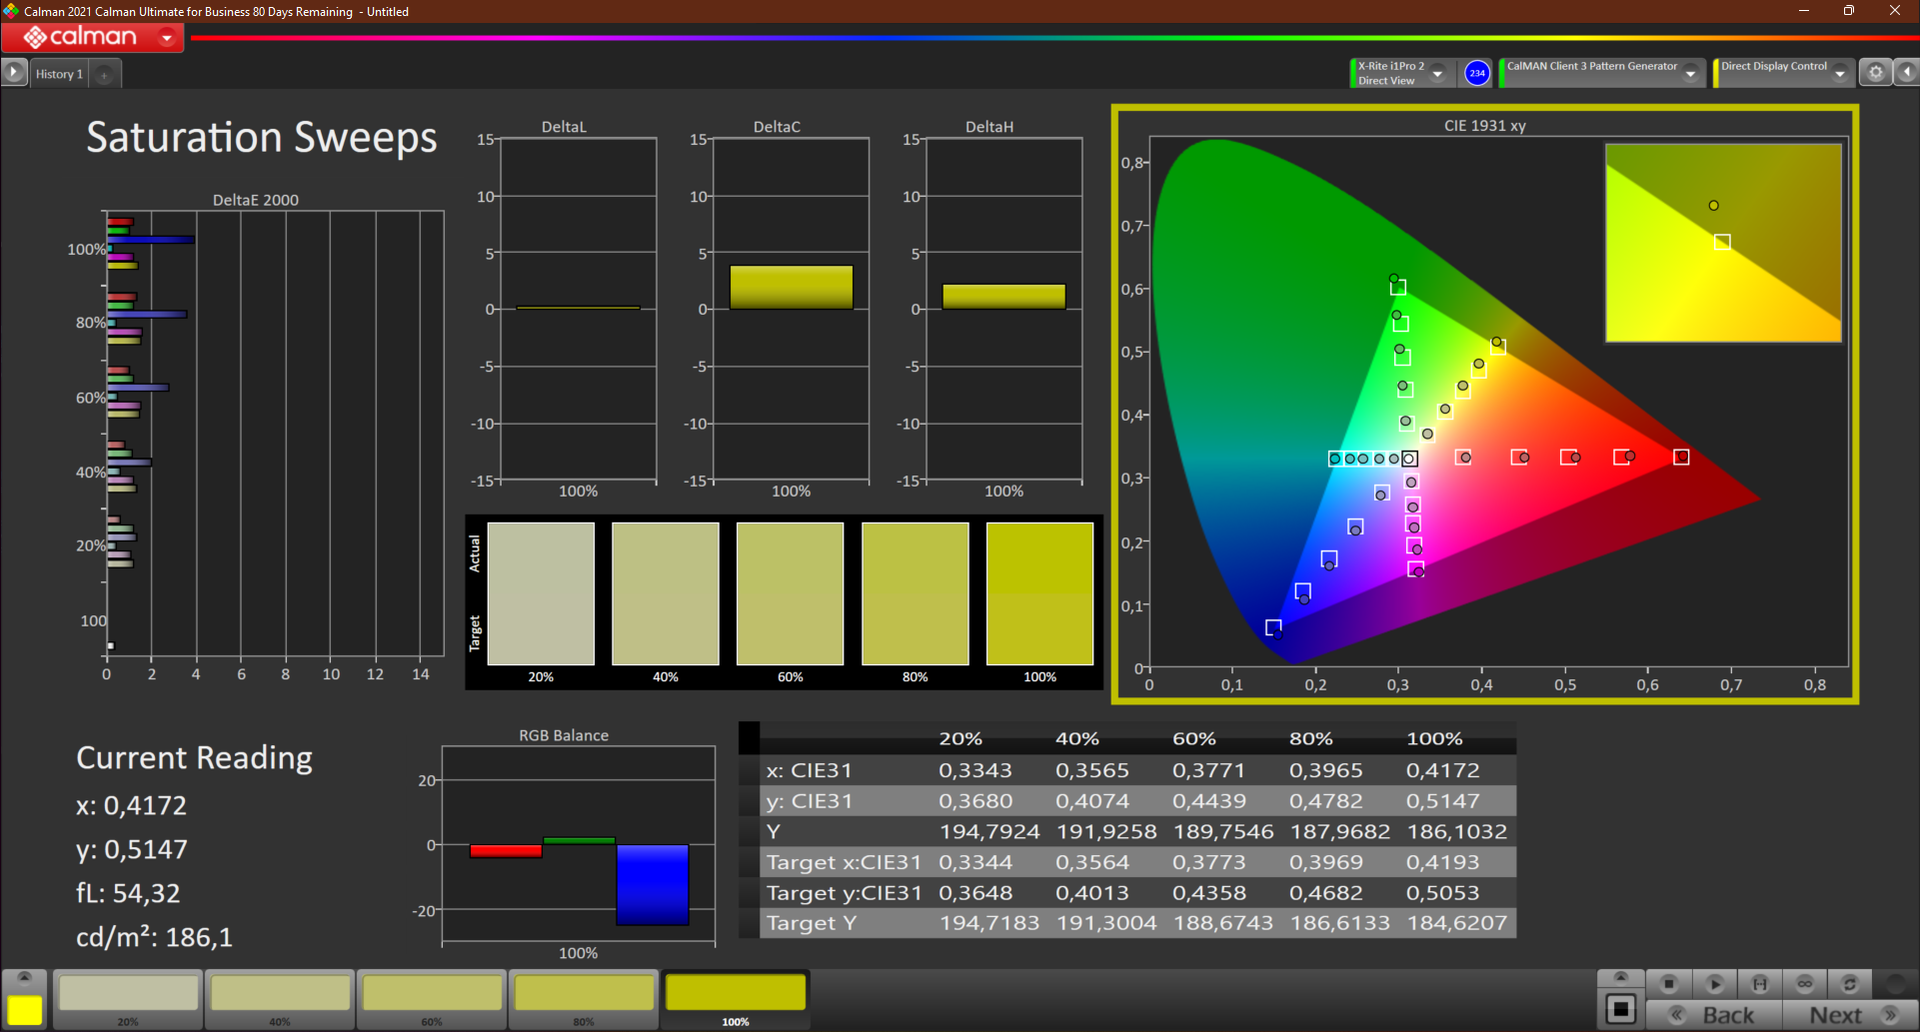
L'espace couleur sRGB est couvert à 99 %, mais seulement ~71 % de DCI-P3 et AdobeRGB sont reproduits. Avec cela, vous pouvez utiliser l'ordinateur portable pour le traitement d'images et de vidéos à un niveau semi-professionnel. Le ThinkPad P15v G2 fait nettement moins bien (sRGB < 57%) ici aussi.
Avec un DeltaE de 4,3, l'écart le plus important concerne la couleur bleue, même après l'étalonnage. Cependant, l'équilibre RVB est bon dans l'ensemble. Après le calibrage, le contraste augmente même à 2151:1, tandis que la luminosité est réduite de seulement 10 nits. Comme toujours, notre profil de couleur ICC peut être téléchargé gratuitement à côté du graphique de distribution de la luminosité ci-dessus.

Temps de réponse de l'écran
| ↔ Temps de réponse noir à blanc | ||
|---|---|---|
| 38 ms ... hausse ↗ et chute ↘ combinées | ↗ 19 ms hausse | 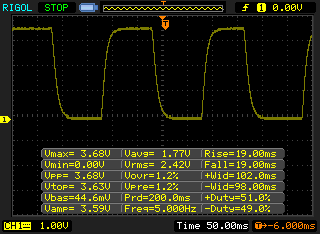 |
| ↘ 19 ms chute | ||
| L'écran souffre de latences très élevées, à éviter pour le jeu. En comparaison, tous les appareils testés affichent entre 0.1 (minimum) et 240 (maximum) ms. » 96 % des appareils testés affichent de meilleures performances. Cela signifie que les latences relevées sont moins bonnes que la moyenne (19.8 ms) de tous les appareils testés. | ||
| ↔ Temps de réponse gris 50% à gris 80% | ||
| 61 ms ... hausse ↗ et chute ↘ combinées | ↗ ms hausse | 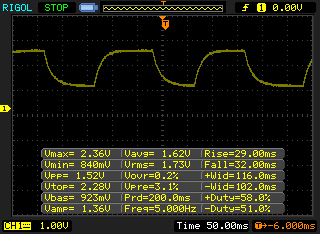 |
| ↘ ms chute | ||
| L'écran souffre de latences très élevées, à éviter pour le jeu. En comparaison, tous les appareils testés affichent entre 0.165 (minimum) et 636 (maximum) ms. » 96 % des appareils testés affichent de meilleures performances. Cela signifie que les latences relevées sont moins bonnes que la moyenne (31 ms) de tous les appareils testés. | ||
Scintillement / MLI (Modulation de largeur d'impulsion)
| Scintillement / MLI (Modulation de largeur d'impulsion) non décelé | 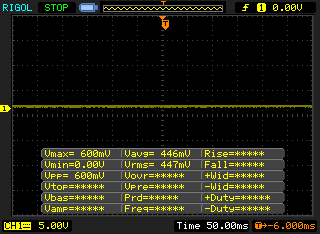 | ||
En comparaison, 52 % des appareils testés n'emploient pas MDI pour assombrir leur écran. Nous avons relevé une moyenne à 7757 (minimum : 5 - maximum : 343500) Hz dans le cas où une MDI était active. | |||
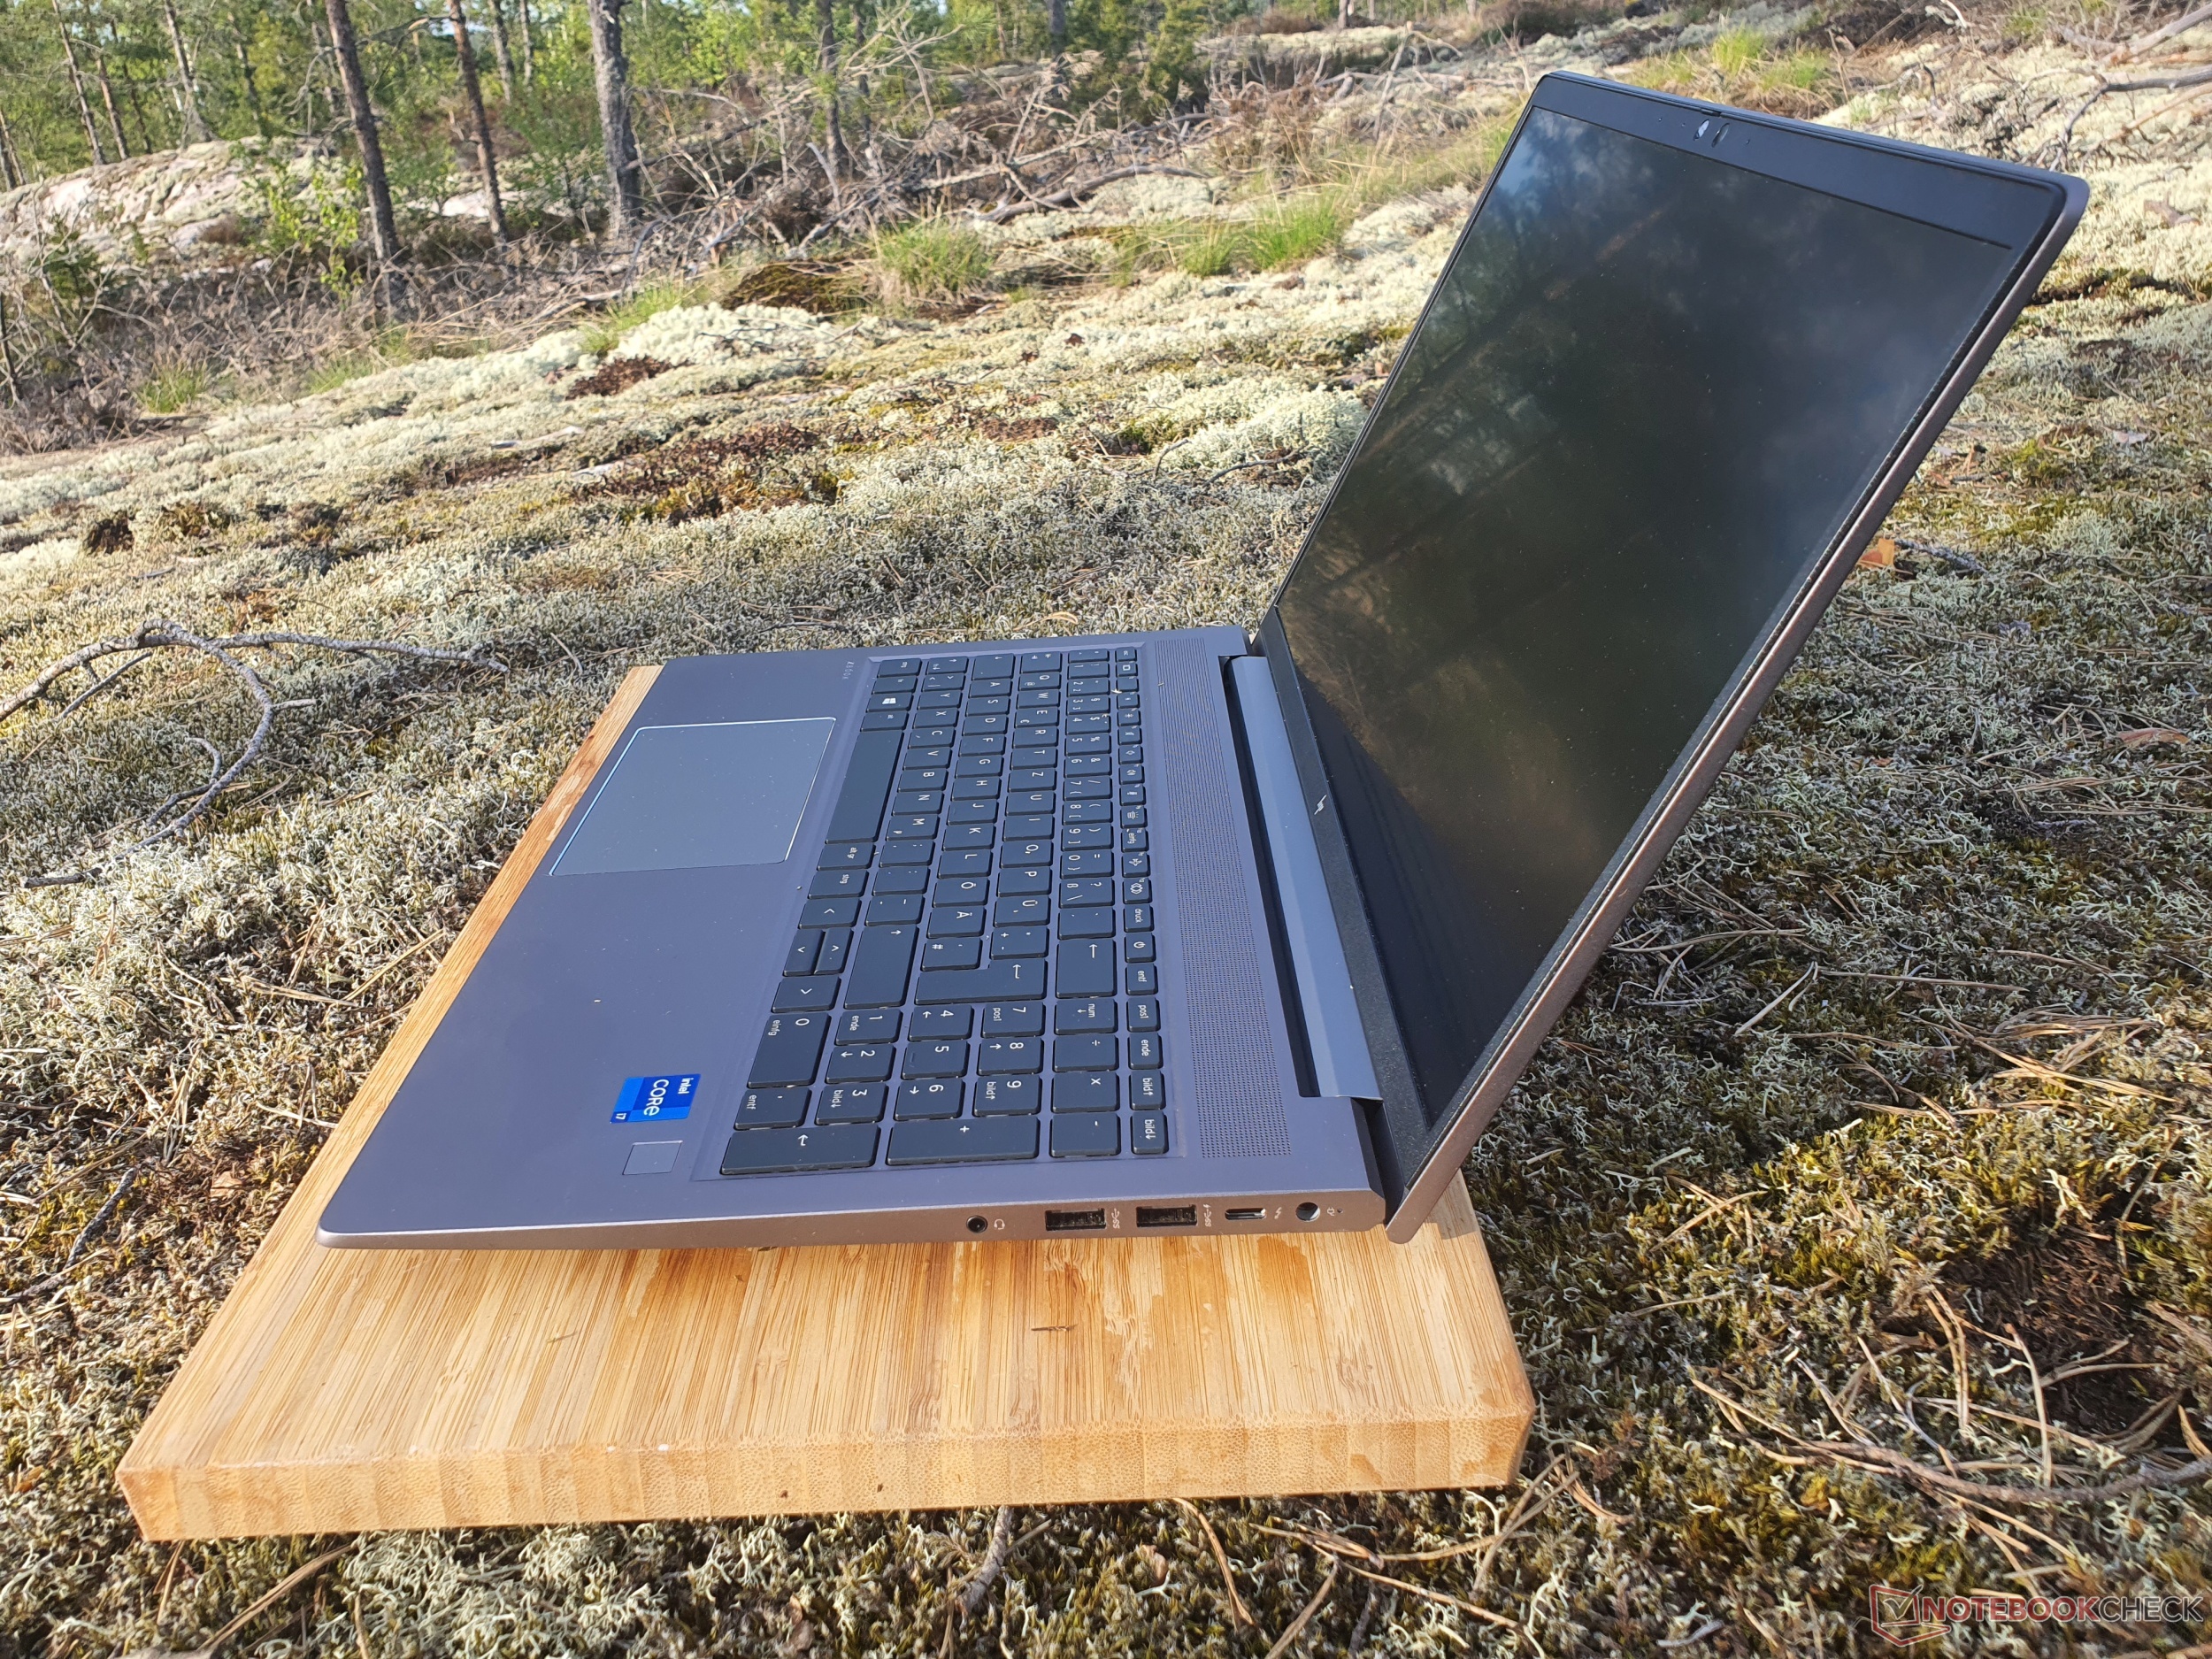
La surface d'affichage mate et la luminosité élevée de 385 nits permettent au ZBook Power 15 de fonctionner en extérieur. Cependant, vous devez tout de même éviter la lumière directe du soleil.
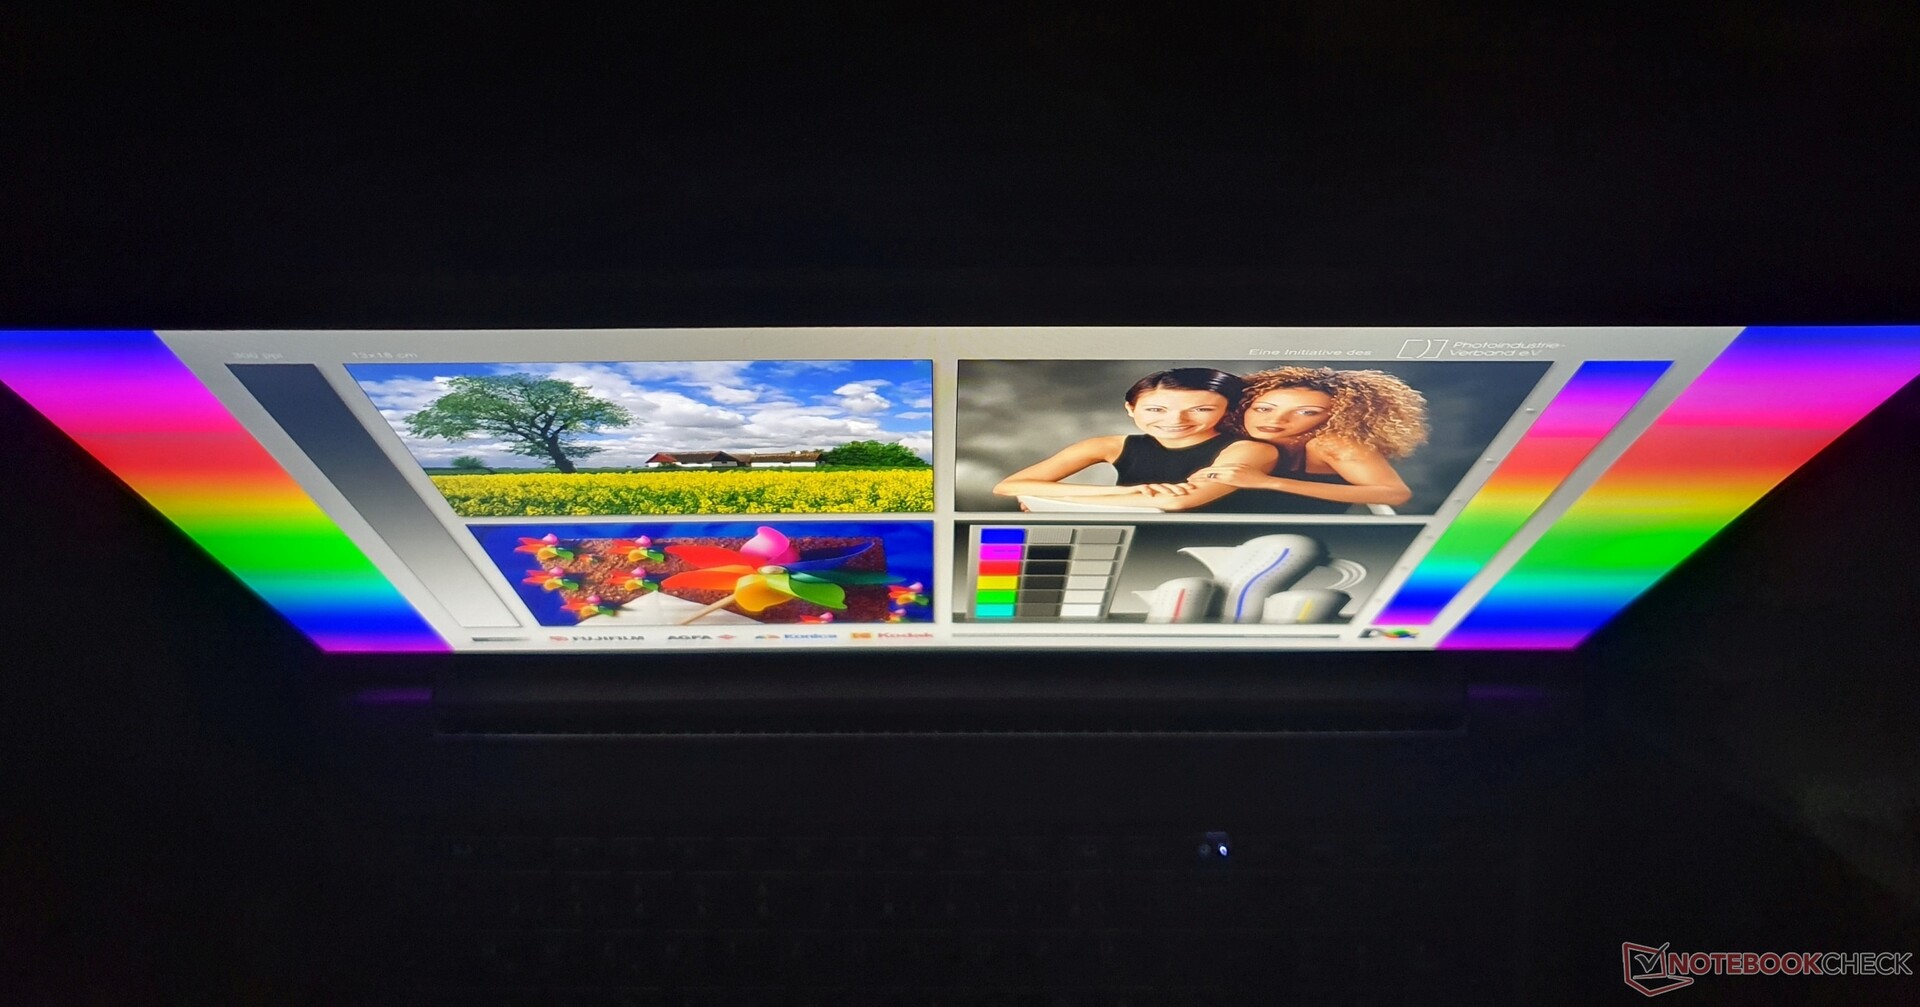
Comme c'est le cas pour les écrans IPS, la stabilité de l'angle de vision est très élevée et ne pose jamais de problème, par exemple si vous voulez regarder des vidéos à plusieurs.
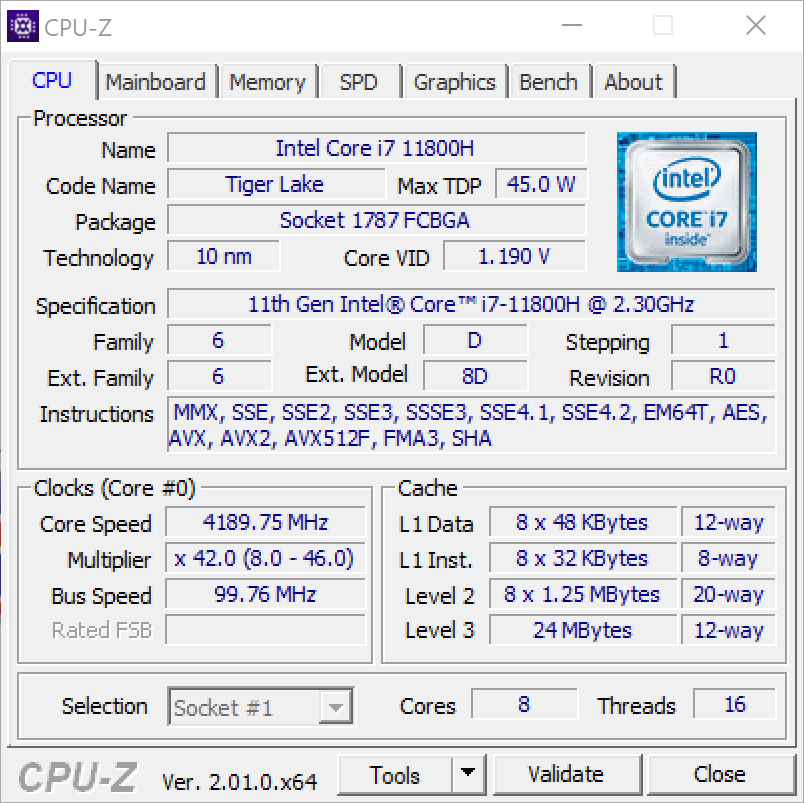
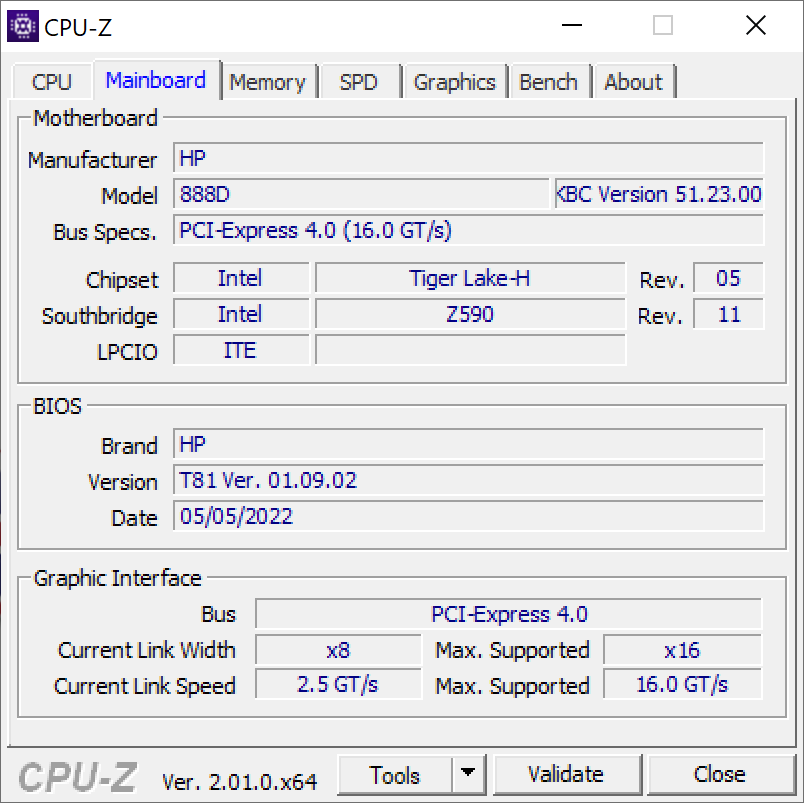
Des performances élevées limitées par la propre IA de HP ?
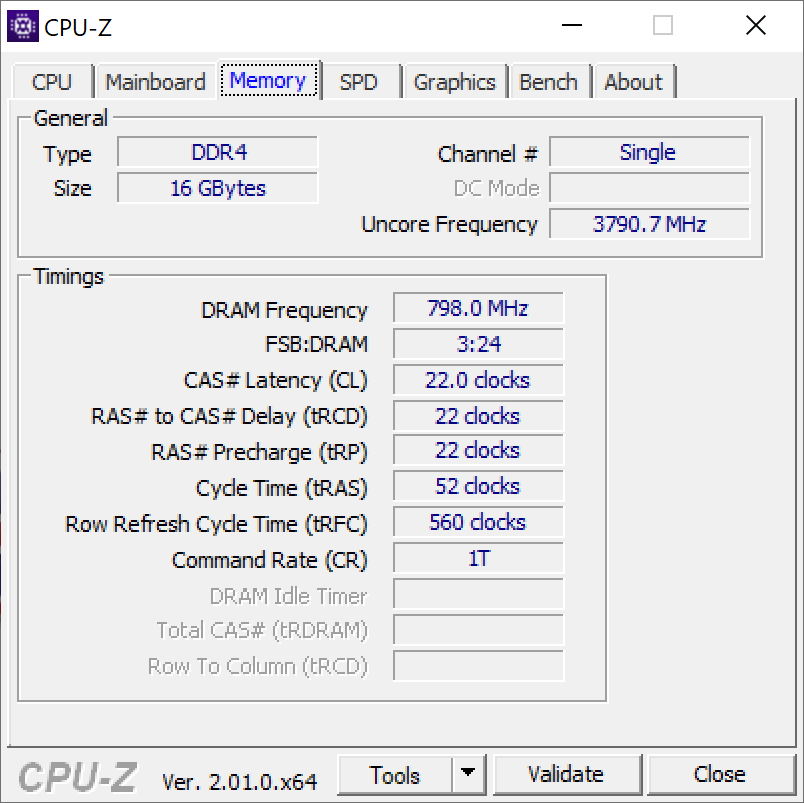
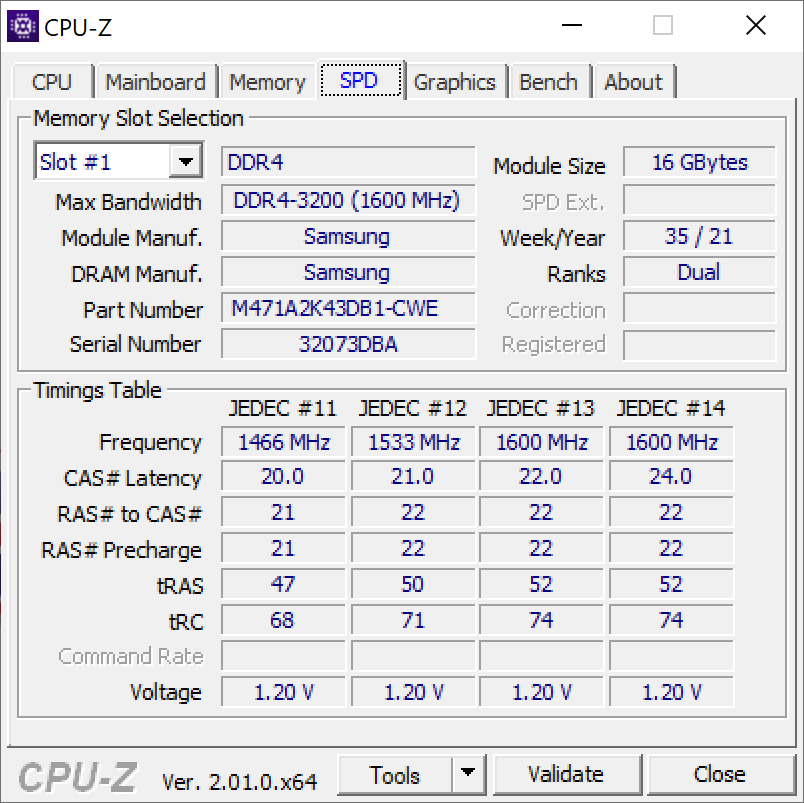
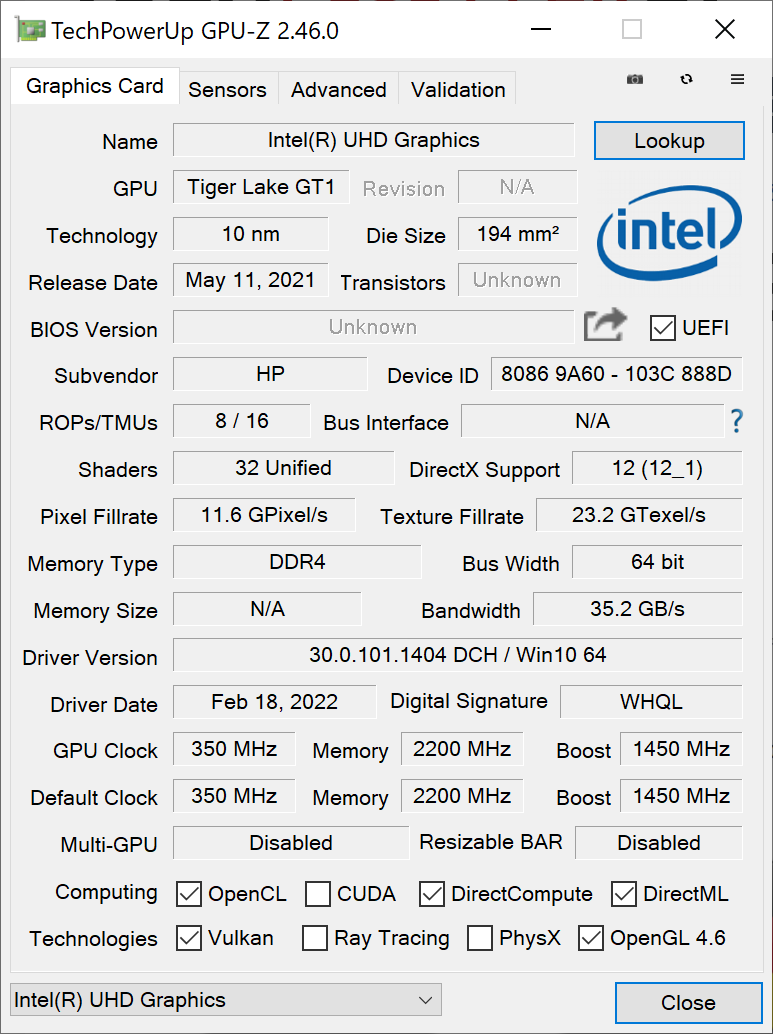
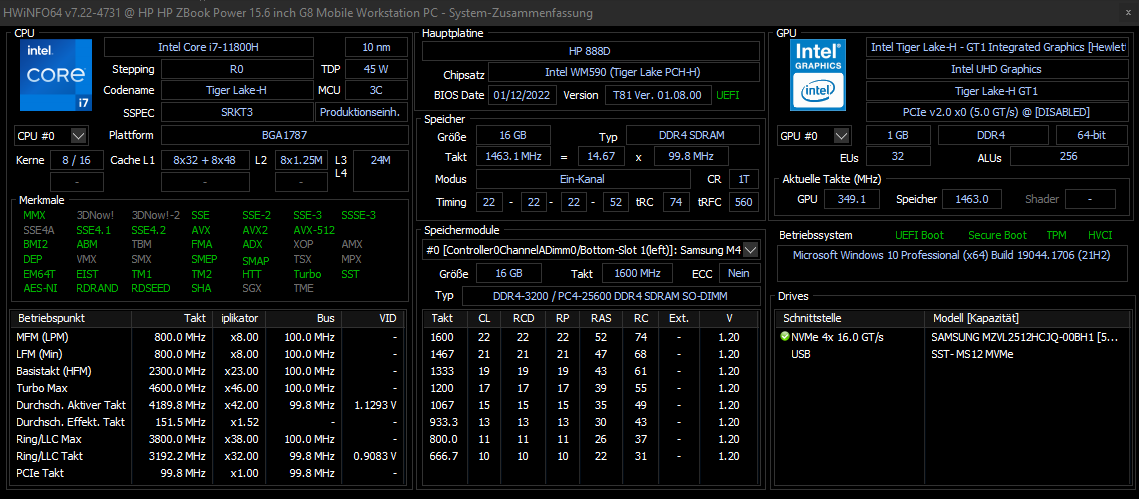
Notre unité de test offre un Intel Core i7-11800H (Tiger Lake, sans vPRO) et le processeurNvidia T600 dGPU, ainsi que le processeur intégré Intel UHD Xe (32 UEs). Le tout est complété par un module de RAM de 16 Go (DDR4-3200 @DDR4-2933) et un SSD PCIe4x4 de 512 Go. Les processeurs Xeon et la RAM ECC ne sont pas disponibles cette année.
La configuration maximale comprend leCore i9-11950H d'Intel (vPRO), le processeur Nvidia RTX A2000 DE NVIDIAde Nvidia, deux modules de RAM de 32 Go et deux SSD M.2-2280 de 2 To. Des modèles plus abordables avec un Intel Core i5 (hexa-core) et avec ou sans GPU Nvidia sont également disponibles

Conditions d'essai
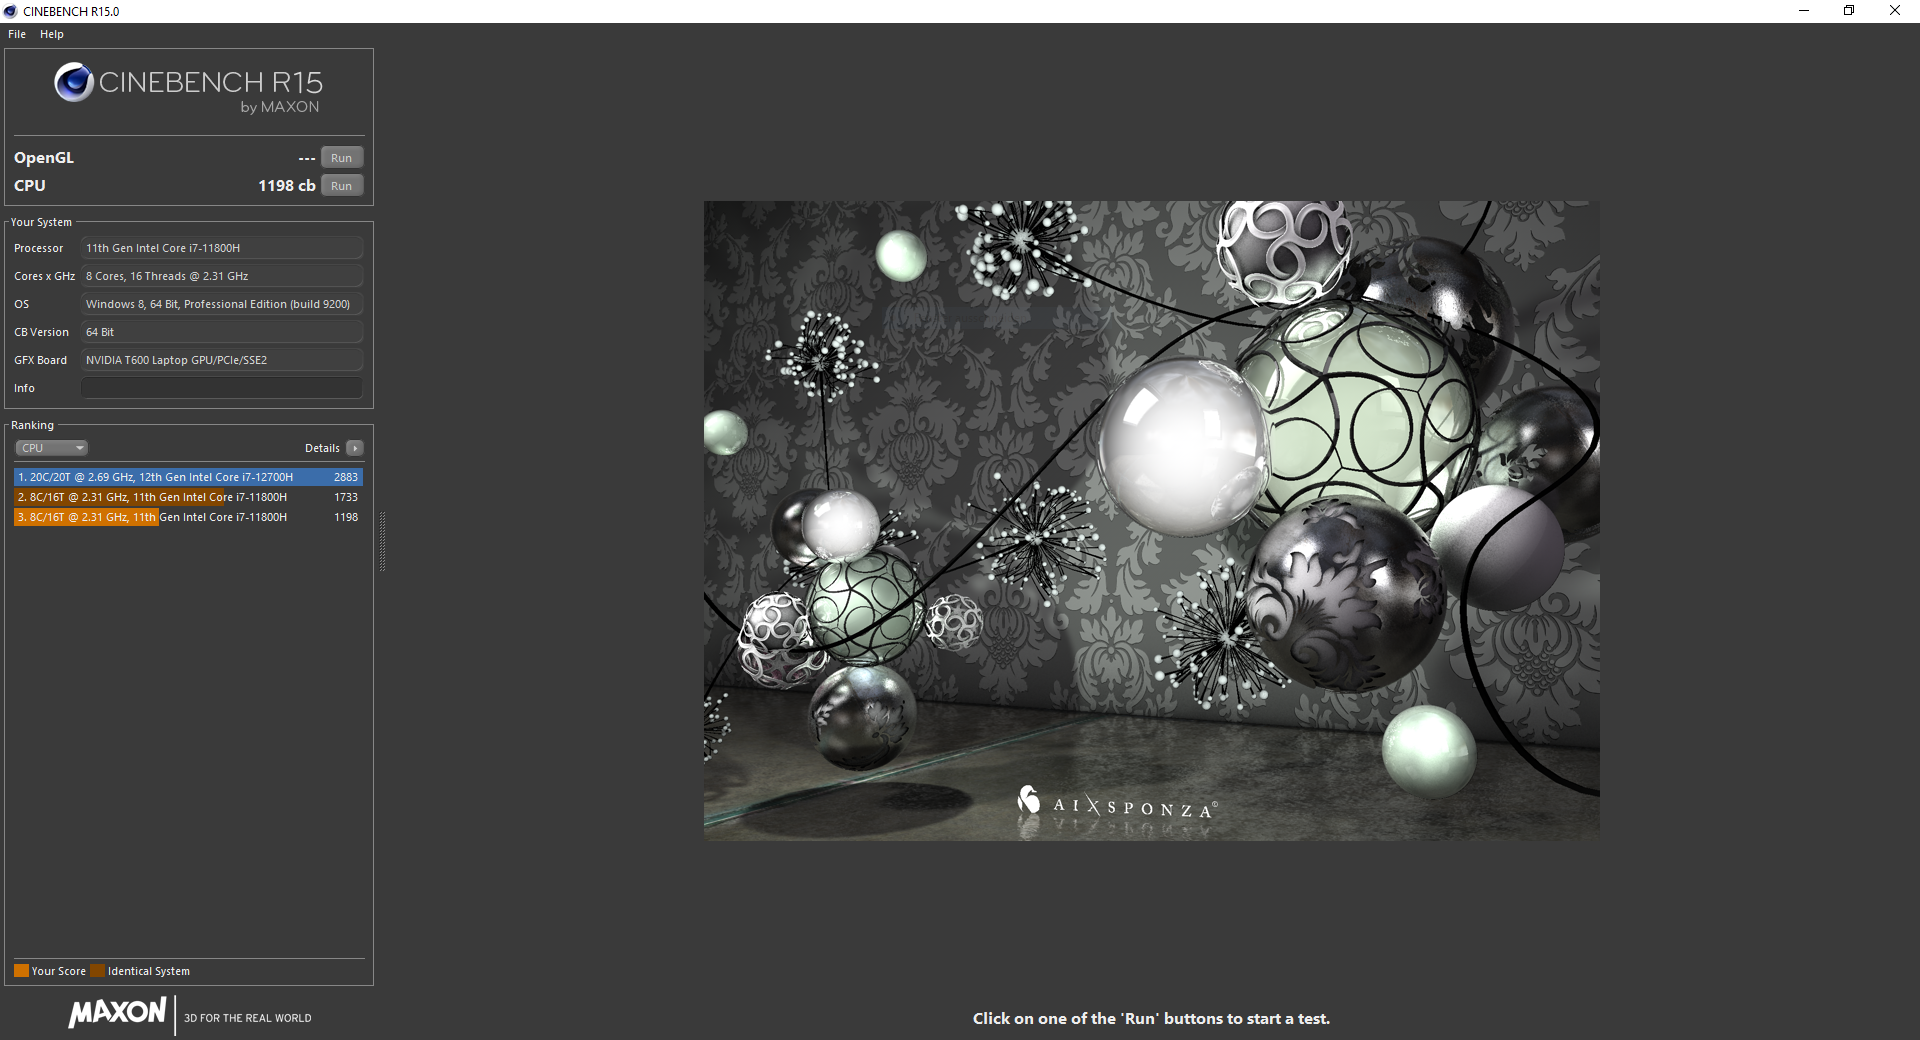
HP contrôle les performances et le comportement du ventilateur dans le ZBook 15 G8 en utilisant une IA appelée "Z Algorithms", qui fonctionne en utilisant le Dynamic Tuning d'Intel. Cependant, cela ne semble pas encore tout à fait mature, car les performances ne sont pas constantes. Une fois, notre boucle de test Cinebench R15 atteint une constante de 1 550 points en 25 exécutions, tandis qu'une autre boucle ne donne que ~1 100 points et une troisième ~1 300 points
Une mise à jour du BIOS de la v1.01 à la v1.09 n'a pas amélioré les choses mais a eu le résultat contraire : Les 2 075 points initialement atteints (constante : 1 826) en CBR15 ne sont plus reproductibles à aucun moment, mais les ventilateurs sont désormais nettement moins agressifs. Selon le résultat, la consommation constante était de 40 watts une fois et de 47 watts une autre fois, soit un maximum de 55 watts en permanence.
Processeur
Avec le comportement IA décrit, les performances réelles de l'Intel Core i7-11800Hen combinaison avec la capacité de refroidissement est difficile à cerner.
Alors que tous les tests CPU ont été effectués avec l'ancien BIOS v1.01 lorsque l'IA était encore plus bienveillante, le ZBook Power 15 a mené le champ de test la plupart du temps. Après la mise à jour du BIOS, les performances tombent à peine au-dessus de celles du ThinkPad P15v G2en moyenne.
Il ne semble plus y avoir de Turbo à court terme (PL2) non plus. En outre, les ventilateurs commencent à tourner très tard (juste avant la fin de la première course) et sont plus silencieux qu'à l'origine, que ce soit à cause du nouveau BIOS ou d'une alimentation qui ne fonctionne pas correctement. En fonctionnement sur batterie, les performances sont à nouveau réduites d'environ 25 %.
Cinebench R15 Multi Constant Load Test
Cinebench R23: Multi Core | Single Core
Cinebench R20: CPU (Multi Core) | CPU (Single Core)
Cinebench R15: CPU Multi 64Bit | CPU Single 64Bit
Blender: v2.79 BMW27 CPU
7-Zip 18.03: 7z b 4 | 7z b 4 -mmt1
Geekbench 5.5: Multi-Core | Single-Core
HWBOT x265 Benchmark v2.2: 4k Preset
LibreOffice : 20 Documents To PDF
R Benchmark 2.5: Overall mean
Octane V2: Total Score
Jetstream 2: 2.0 Total
| CPU Performance rating | |
| Moyenne de la classe Workstation | |
| HP ZBook Studio 15 G8 -1! | |
| HP ZBook Power 15 G8 313S5EA | |
| HP ZBook Fury 15 G8 -3! | |
| Moyenne Intel Core i7-11800H | |
| Lenovo ThinkPad P15v G2 21A9000XGE -3! | |
| Dell Precision 3000 3551 -4! | |
| HP ZBook Firefly 15 G8 2C9R7EA -4! | |
| Cinebench R23 / Multi Core | |
| Moyenne de la classe Workstation (14621 - 38520, n=23, 2 dernières années) | |
| HP ZBook Power 15 G8 313S5EA | |
| HP ZBook Fury 15 G8 | |
| HP ZBook Studio 15 G8 | |
| Moyenne Intel Core i7-11800H (6508 - 14088, n=48) | |
| Lenovo ThinkPad P15v G2 21A9000XGE | |
| Cinebench R23 / Single Core | |
| Moyenne de la classe Workstation (1712 - 2228, n=23, 2 dernières années) | |
| HP ZBook Fury 15 G8 | |
| HP ZBook Studio 15 G8 | |
| HP ZBook Power 15 G8 313S5EA | |
| Moyenne Intel Core i7-11800H (1386 - 1522, n=45) | |
| Cinebench R20 / CPU (Multi Core) | |
| Moyenne de la classe Workstation (5760 - 15043, n=23, 2 dernières années) | |
| HP ZBook Fury 15 G8 | |
| HP ZBook Studio 15 G8 | |
| Moyenne Intel Core i7-11800H (2498 - 5408, n=50) | |
| HP ZBook Power 15 G8 313S5EA | |
| Lenovo ThinkPad P15v G2 21A9000XGE | |
| Dell Precision 3000 3551 | |
| HP ZBook Firefly 15 G8 2C9R7EA | |
| Cinebench R20 / CPU (Single Core) | |
| Moyenne de la classe Workstation (671 - 857, n=23, 2 dernières années) | |
| HP ZBook Fury 15 G8 | |
| HP ZBook Studio 15 G8 | |
| HP ZBook Firefly 15 G8 2C9R7EA | |
| HP ZBook Power 15 G8 313S5EA | |
| Moyenne Intel Core i7-11800H (520 - 586, n=47) | |
| Lenovo ThinkPad P15v G2 21A9000XGE | |
| Dell Precision 3000 3551 | |
| Cinebench R15 / CPU Multi 64Bit | |
| Moyenne de la classe Workstation (2489 - 5810, n=23, 2 dernières années) | |
| HP ZBook Power 15 G8 313S5EA | |
| HP ZBook Power 15 G8 313S5EA | |
| Moyenne Intel Core i7-11800H (1342 - 2173, n=50) | |
| HP ZBook Studio 15 G8 | |
| HP ZBook Fury 15 G8 | |
| Lenovo ThinkPad P15v G2 21A9000XGE | |
| Dell Precision 3000 3551 | |
| HP ZBook Firefly 15 G8 2C9R7EA | |
| Cinebench R15 / CPU Single 64Bit | |
| Moyenne de la classe Workstation (191.4 - 328, n=23, 2 dernières années) | |
| HP ZBook Fury 15 G8 | |
| HP ZBook Studio 15 G8 | |
| HP ZBook Power 15 G8 313S5EA | |
| HP ZBook Firefly 15 G8 2C9R7EA | |
| Moyenne Intel Core i7-11800H (201 - 231, n=46) | |
| Lenovo ThinkPad P15v G2 21A9000XGE | |
| Dell Precision 3000 3551 | |
| Blender / v2.79 BMW27 CPU | |
| HP ZBook Firefly 15 G8 2C9R7EA | |
| Dell Precision 3000 3551 | |
| Lenovo ThinkPad P15v G2 21A9000XGE | |
| Moyenne Intel Core i7-11800H (217 - 454, n=46) | |
| HP ZBook Fury 15 G8 | |
| HP ZBook Power 15 G8 313S5EA | |
| HP ZBook Studio 15 G8 | |
| Moyenne de la classe Workstation (91 - 222, n=23, 2 dernières années) | |
| 7-Zip 18.03 / 7z b 4 | |
| Moyenne de la classe Workstation (60489 - 116969, n=23, 2 dernières années) | |
| HP ZBook Fury 15 G8 | |
| HP ZBook Studio 15 G8 | |
| HP ZBook Power 15 G8 313S5EA | |
| Moyenne Intel Core i7-11800H (33718 - 56758, n=46) | |
| Lenovo ThinkPad P15v G2 21A9000XGE | |
| Dell Precision 3000 3551 | |
| HP ZBook Firefly 15 G8 2C9R7EA | |
| 7-Zip 18.03 / 7z b 4 -mmt1 | |
| Moyenne de la classe Workstation (5126 - 6960, n=23, 2 dernières années) | |
| HP ZBook Studio 15 G8 | |
| HP ZBook Fury 15 G8 | |
| HP ZBook Power 15 G8 313S5EA | |
| Moyenne Intel Core i7-11800H (5138 - 5732, n=46) | |
| HP ZBook Firefly 15 G8 2C9R7EA | |
| Dell Precision 3000 3551 | |
| Lenovo ThinkPad P15v G2 21A9000XGE | |
| Geekbench 5.5 / Multi-Core | |
| Moyenne de la classe Workstation (11542 - 25554, n=23, 2 dernières années) | |
| Moyenne Intel Core i7-11800H (4655 - 9851, n=40) | |
| HP ZBook Power 15 G8 313S5EA | |
| HP ZBook Studio 15 G8 | |
| Dell Precision 3000 3551 | |
| Lenovo ThinkPad P15v G2 21A9000XGE | |
| HP ZBook Firefly 15 G8 2C9R7EA | |
| Geekbench 5.5 / Single-Core | |
| Moyenne de la classe Workstation (1783 - 2183, n=23, 2 dernières années) | |
| HP ZBook Studio 15 G8 | |
| Moyenne Intel Core i7-11800H (1429 - 1625, n=40) | |
| HP ZBook Firefly 15 G8 2C9R7EA | |
| HP ZBook Power 15 G8 313S5EA | |
| Lenovo ThinkPad P15v G2 21A9000XGE | |
| Dell Precision 3000 3551 | |
| HWBOT x265 Benchmark v2.2 / 4k Preset | |
| Moyenne de la classe Workstation (17.8 - 40.5, n=23, 2 dernières années) | |
| HP ZBook Studio 15 G8 | |
| HP ZBook Fury 15 G8 | |
| HP ZBook Power 15 G8 313S5EA | |
| Moyenne Intel Core i7-11800H (7.38 - 17.4, n=46) | |
| Lenovo ThinkPad P15v G2 21A9000XGE | |
| Dell Precision 3000 3551 | |
| HP ZBook Firefly 15 G8 2C9R7EA | |
| LibreOffice / 20 Documents To PDF | |
| Lenovo ThinkPad P15v G2 21A9000XGE | |
| HP ZBook Fury 15 G8 | |
| HP ZBook Studio 15 G8 | |
| Moyenne de la classe Workstation (37.1 - 74.7, n=23, 2 dernières années) | |
| Moyenne Intel Core i7-11800H (38.6 - 59.9, n=45) | |
| Dell Precision 3000 3551 | |
| HP ZBook Power 15 G8 313S5EA | |
| HP ZBook Firefly 15 G8 2C9R7EA | |
| R Benchmark 2.5 / Overall mean | |
| HP ZBook Power 15 G8 313S5EA | |
| Lenovo ThinkPad P15v G2 21A9000XGE | |
| Dell Precision 3000 3551 | |
| Moyenne Intel Core i7-11800H (0.548 - 0.615, n=46) | |
| HP ZBook Firefly 15 G8 2C9R7EA | |
| HP ZBook Studio 15 G8 | |
| HP ZBook Fury 15 G8 | |
| Moyenne de la classe Workstation (0.3825 - 0.603, n=23, 2 dernières années) | |
| Octane V2 / Total Score | |
| Moyenne de la classe Workstation (112382 - 129420, n=3, 2 dernières années) | |
| Moyenne Intel Core i7-11800H (63248 - 70549, n=10) | |
| HP ZBook Power 15 G8 313S5EA | |
| Jetstream 2 / 2.0 Total | |
| Moyenne de la classe Workstation (327 - 466, n=4, 2 dernières années) | |
| HP ZBook Power 15 G8 313S5EA | |
| HP ZBook Fury 15 G8 | |
| HP ZBook Studio 15 G8 | |
| Moyenne Intel Core i7-11800H (159.8 - 214, n=16) | |
* ... Moindre est la valeur, meilleures sont les performances
AIDA64: FP32 Ray-Trace | FPU Julia | CPU SHA3 | CPU Queen | FPU SinJulia | FPU Mandel | CPU AES | CPU ZLib | FP64 Ray-Trace | CPU PhotoWorxx
| Performance rating | |
| Moyenne de la classe Workstation | |
| HP ZBook Fury 15 G8 | |
| HP ZBook Studio 15 G8 | |
| HP ZBook Power 15 G8 313S5EA | |
| Moyenne Intel Core i7-11800H | |
| Lenovo ThinkPad P15v G2 21A9000XGE | |
| HP ZBook Firefly 15 G8 2C9R7EA | |
| AIDA64 / FP32 Ray-Trace | |
| Moyenne de la classe Workstation (16730 - 61611, n=23, 2 dernières années) | |
| HP ZBook Power 15 G8 313S5EA | |
| HP ZBook Fury 15 G8 | |
| HP ZBook Studio 15 G8 | |
| Moyenne Intel Core i7-11800H (8772 - 15961, n=20) | |
| Lenovo ThinkPad P15v G2 21A9000XGE | |
| HP ZBook Firefly 15 G8 2C9R7EA | |
| AIDA64 / FPU Julia | |
| Moyenne de la classe Workstation (89597 - 186971, n=23, 2 dernières années) | |
| HP ZBook Fury 15 G8 | |
| HP ZBook Studio 15 G8 | |
| HP ZBook Power 15 G8 313S5EA | |
| Moyenne Intel Core i7-11800H (39404 - 65636, n=20) | |
| Lenovo ThinkPad P15v G2 21A9000XGE | |
| HP ZBook Firefly 15 G8 2C9R7EA | |
| AIDA64 / CPU SHA3 | |
| Moyenne de la classe Workstation (4178 - 8975, n=23, 2 dernières années) | |
| HP ZBook Power 15 G8 313S5EA | |
| HP ZBook Fury 15 G8 | |
| HP ZBook Studio 15 G8 | |
| Moyenne Intel Core i7-11800H (2599 - 4439, n=20) | |
| Lenovo ThinkPad P15v G2 21A9000XGE | |
| HP ZBook Firefly 15 G8 2C9R7EA | |
| AIDA64 / CPU Queen | |
| Moyenne de la classe Workstation (60778 - 144411, n=23, 2 dernières années) | |
| HP ZBook Studio 15 G8 | |
| HP ZBook Fury 15 G8 | |
| HP ZBook Power 15 G8 313S5EA | |
| Moyenne Intel Core i7-11800H (85233 - 91941, n=20) | |
| Lenovo ThinkPad P15v G2 21A9000XGE | |
| HP ZBook Firefly 15 G8 2C9R7EA | |
| AIDA64 / FPU SinJulia | |
| Moyenne de la classe Workstation (8165 - 29343, n=23, 2 dernières années) | |
| HP ZBook Fury 15 G8 | |
| HP ZBook Studio 15 G8 | |
| HP ZBook Power 15 G8 313S5EA | |
| Moyenne Intel Core i7-11800H (6420 - 9792, n=20) | |
| Lenovo ThinkPad P15v G2 21A9000XGE | |
| HP ZBook Firefly 15 G8 2C9R7EA | |
| AIDA64 / FPU Mandel | |
| Moyenne de la classe Workstation (44497 - 98153, n=23, 2 dernières années) | |
| HP ZBook Fury 15 G8 | |
| HP ZBook Power 15 G8 313S5EA | |
| HP ZBook Studio 15 G8 | |
| Moyenne Intel Core i7-11800H (23365 - 39464, n=20) | |
| Lenovo ThinkPad P15v G2 21A9000XGE | |
| HP ZBook Firefly 15 G8 2C9R7EA | |
| AIDA64 / CPU AES | |
| Moyenne Intel Core i7-11800H (74617 - 149388, n=20) | |
| Moyenne de la classe Workstation (73133 - 187841, n=23, 2 dernières années) | |
| HP ZBook Power 15 G8 313S5EA | |
| HP ZBook Studio 15 G8 | |
| HP ZBook Fury 15 G8 | |
| Lenovo ThinkPad P15v G2 21A9000XGE | |
| HP ZBook Firefly 15 G8 2C9R7EA | |
| AIDA64 / CPU ZLib | |
| Moyenne de la classe Workstation (929 - 2148, n=23, 2 dernières années) | |
| HP ZBook Power 15 G8 313S5EA | |
| HP ZBook Studio 15 G8 | |
| HP ZBook Fury 15 G8 | |
| Lenovo ThinkPad P15v G2 21A9000XGE | |
| HP ZBook Firefly 15 G8 2C9R7EA | |
| Moyenne Intel Core i7-11800H (461 - 830, n=43) | |
| AIDA64 / FP64 Ray-Trace | |
| Moyenne de la classe Workstation (8545 - 32891, n=23, 2 dernières années) | |
| HP ZBook Power 15 G8 313S5EA | |
| HP ZBook Fury 15 G8 | |
| HP ZBook Studio 15 G8 | |
| Moyenne Intel Core i7-11800H (4545 - 8717, n=21) | |
| Lenovo ThinkPad P15v G2 21A9000XGE | |
| HP ZBook Firefly 15 G8 2C9R7EA | |
| AIDA64 / CPU PhotoWorxx | |
| Moyenne de la classe Workstation (37151 - 93684, n=23, 2 dernières années) | |
| HP ZBook Fury 15 G8 | |
| HP ZBook Studio 15 G8 | |
| Moyenne Intel Core i7-11800H (11898 - 26757, n=21) | |
| HP ZBook Firefly 15 G8 2C9R7EA | |
| HP ZBook Power 15 G8 313S5EA | |
| Lenovo ThinkPad P15v G2 21A9000XGE | |
Performances des postes de travail
Les performances dans les applications liées aux stations de travail ont été évaluées avec le nouveau BIOS (v1.09). Ici, il se place environ 10% derrière le ThinkPad P15v G2avec leNvidia T1200tandis que le HP Fireflyavec leNvidia T500est dépassé d'environ 45%. D'autre part, le ZBook Fury avecRTX A5000offre deux fois plus de performances la plupart du temps.
LeRTX A2000qui est le maximum que vous pouvez choisir pour le ZBook Power 15, devrait fonctionner environ 50% plus vite.
| V-Ray 5 Benchmark | |
| CPU | |
| HP ZBook Fury 15 G8 | |
| Lenovo ThinkPad P15v G2 21A9000XGE | |
| GPU CUDA | |
| Lenovo ThinkPad P15v G2 21A9000XGE | |
| HP ZBook Power 15 G8 313S5EA | |
| Geekbench 5.5 - OpenCL Score | |
| Lenovo ThinkPad P15v G2 21A9000XGE | |
| HP ZBook Power 15 G8 313S5EA | |
| HP ZBook Firefly 15 G8 2C9R7EA | |
| Dell Precision 3000 3551 | |
Performance du système
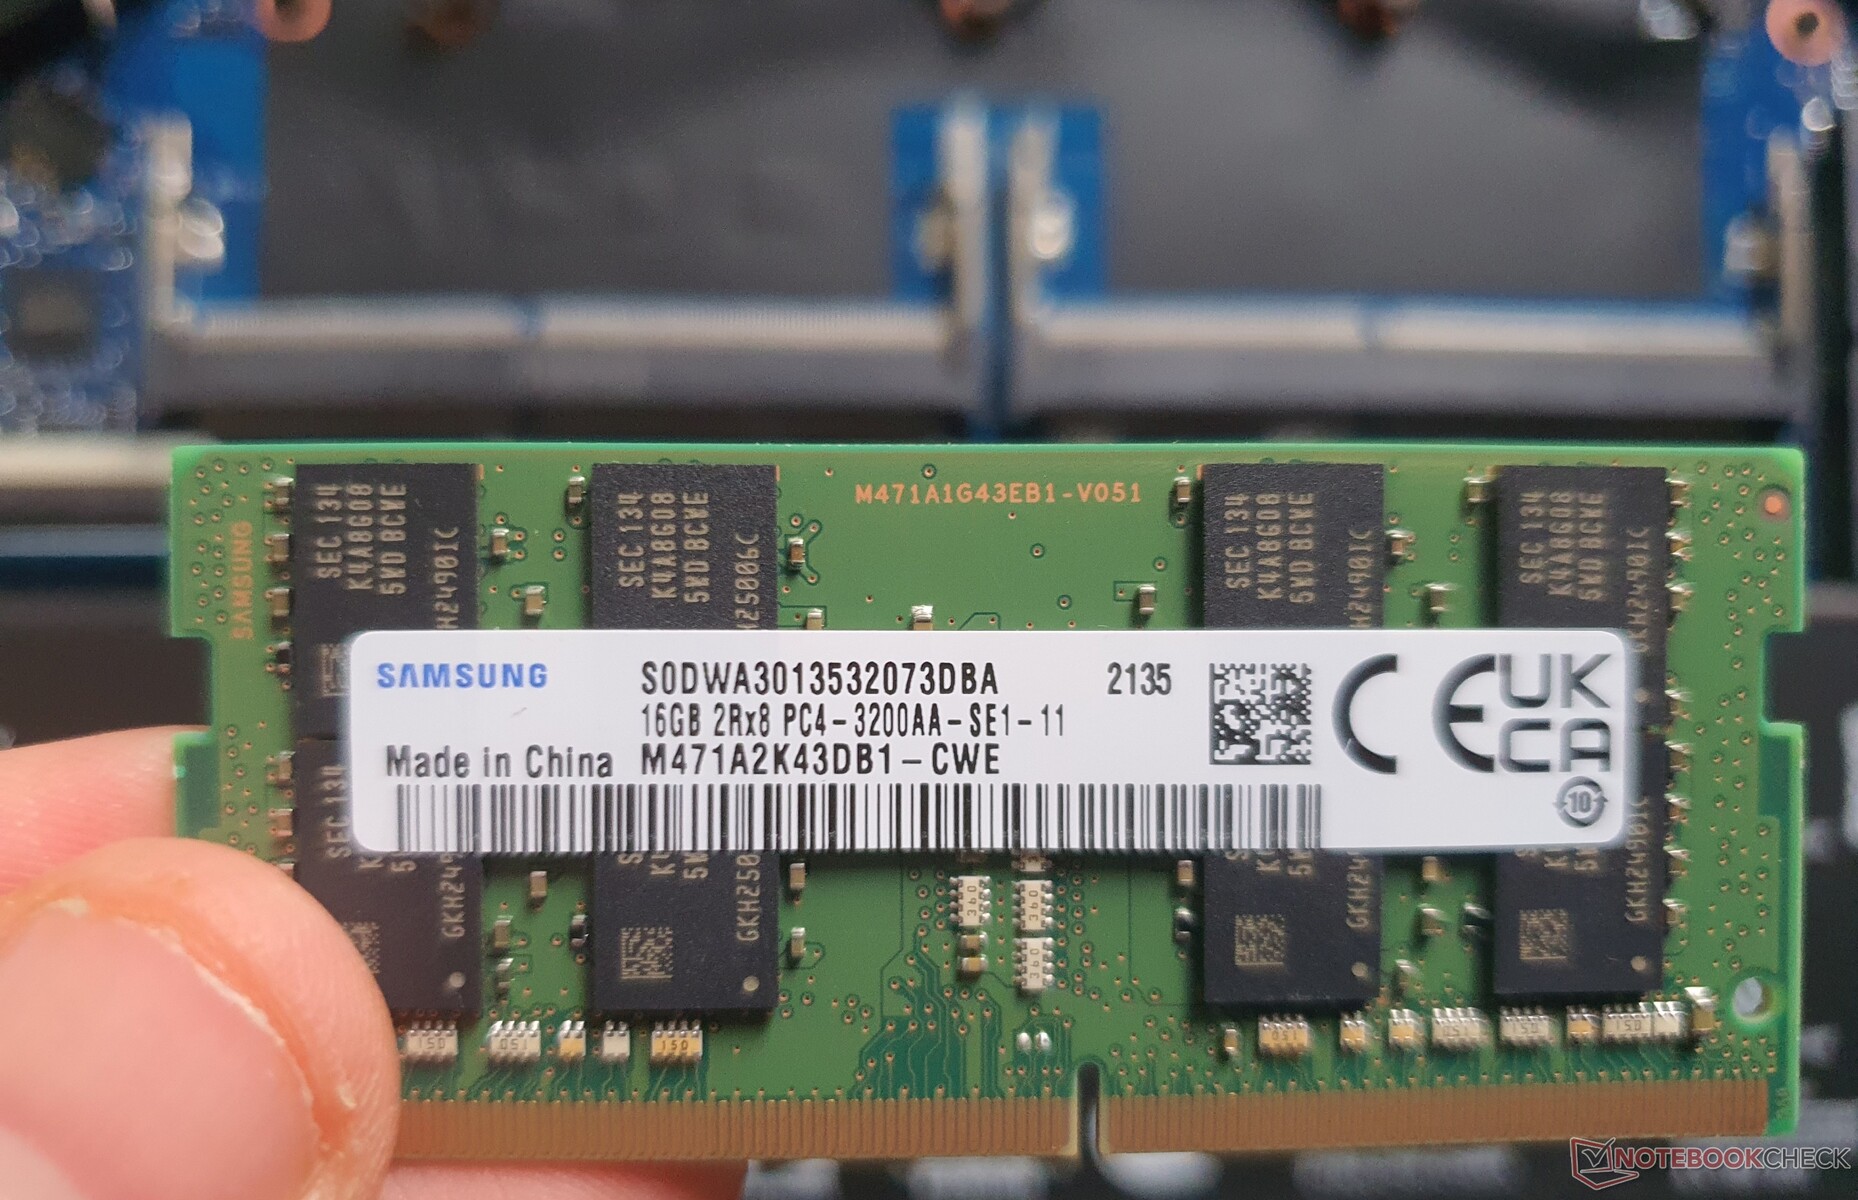
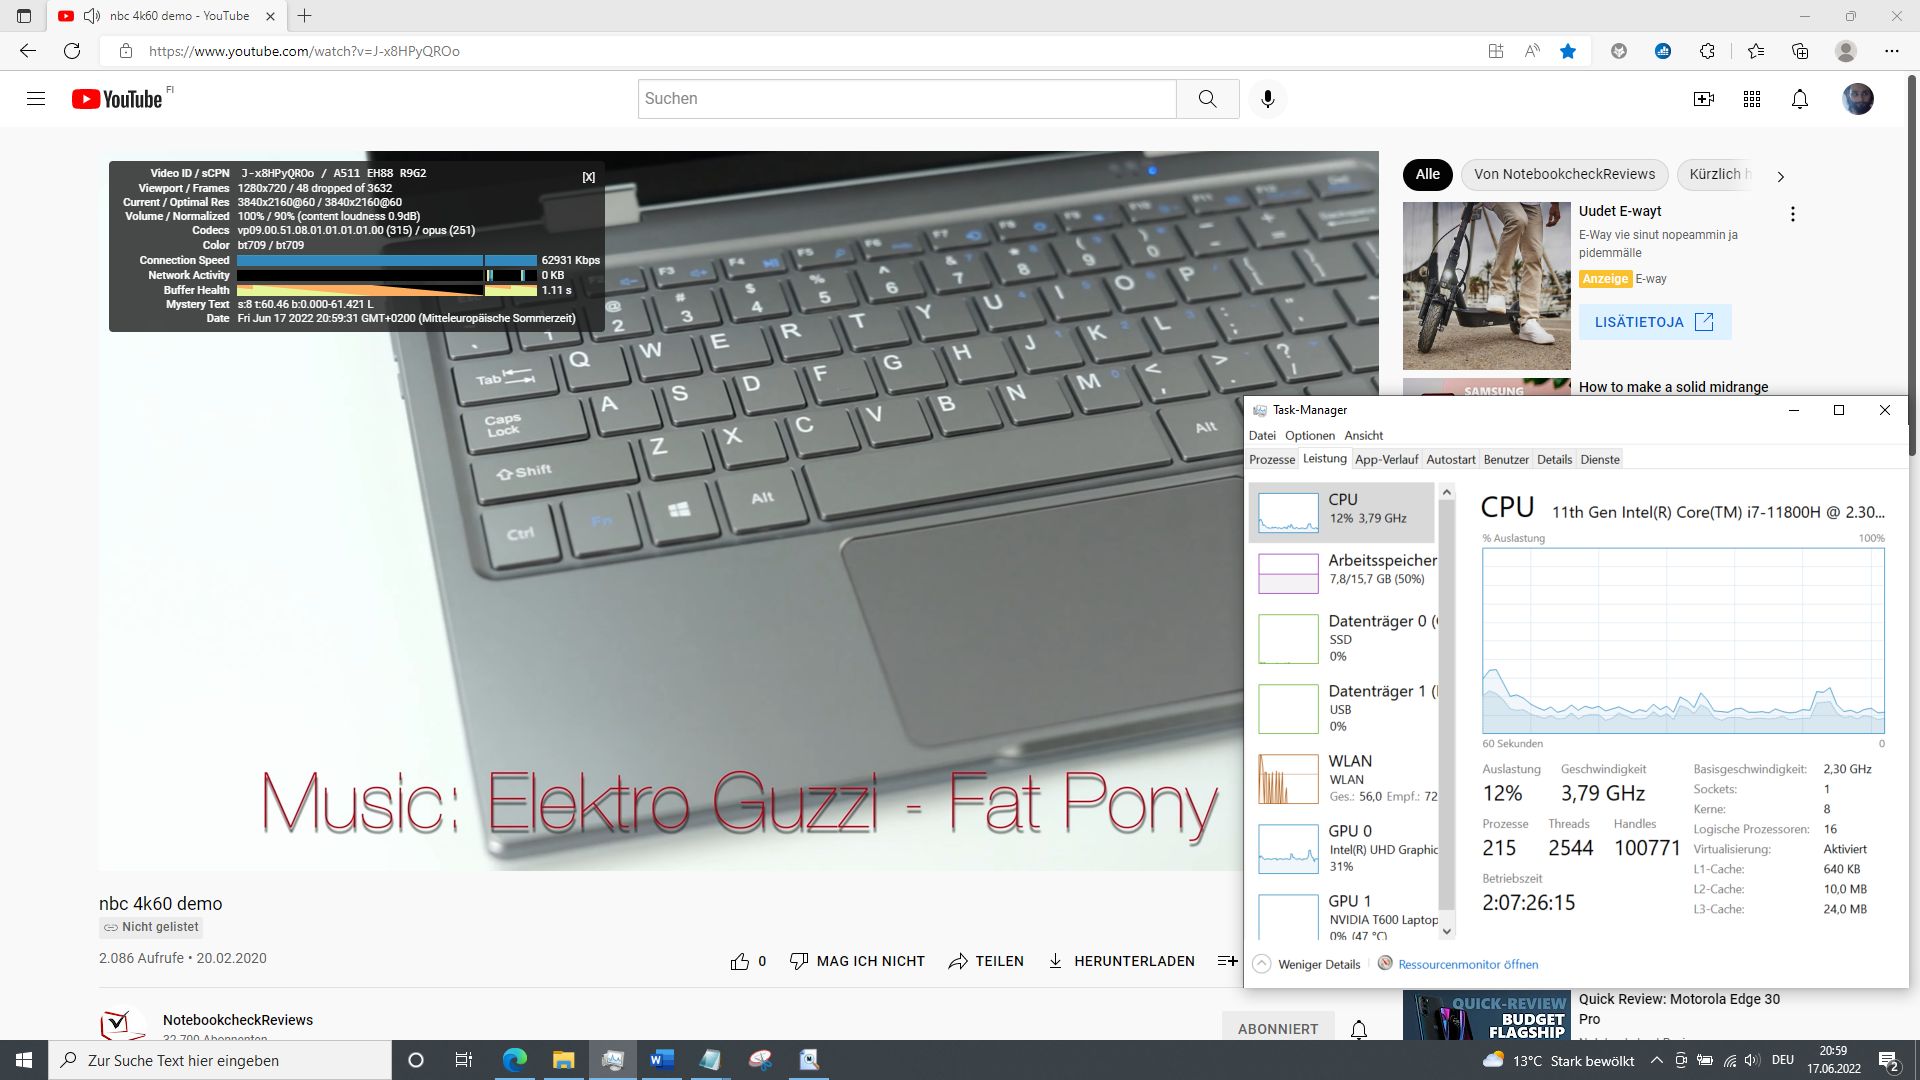
Malgré la RAM monocanal, le système fonctionne sans aucun retard, même en travaillant avec plusieurs onglets de navigateur pendant qu'une vidéo YouTube 4K tourne en arrière-plan.
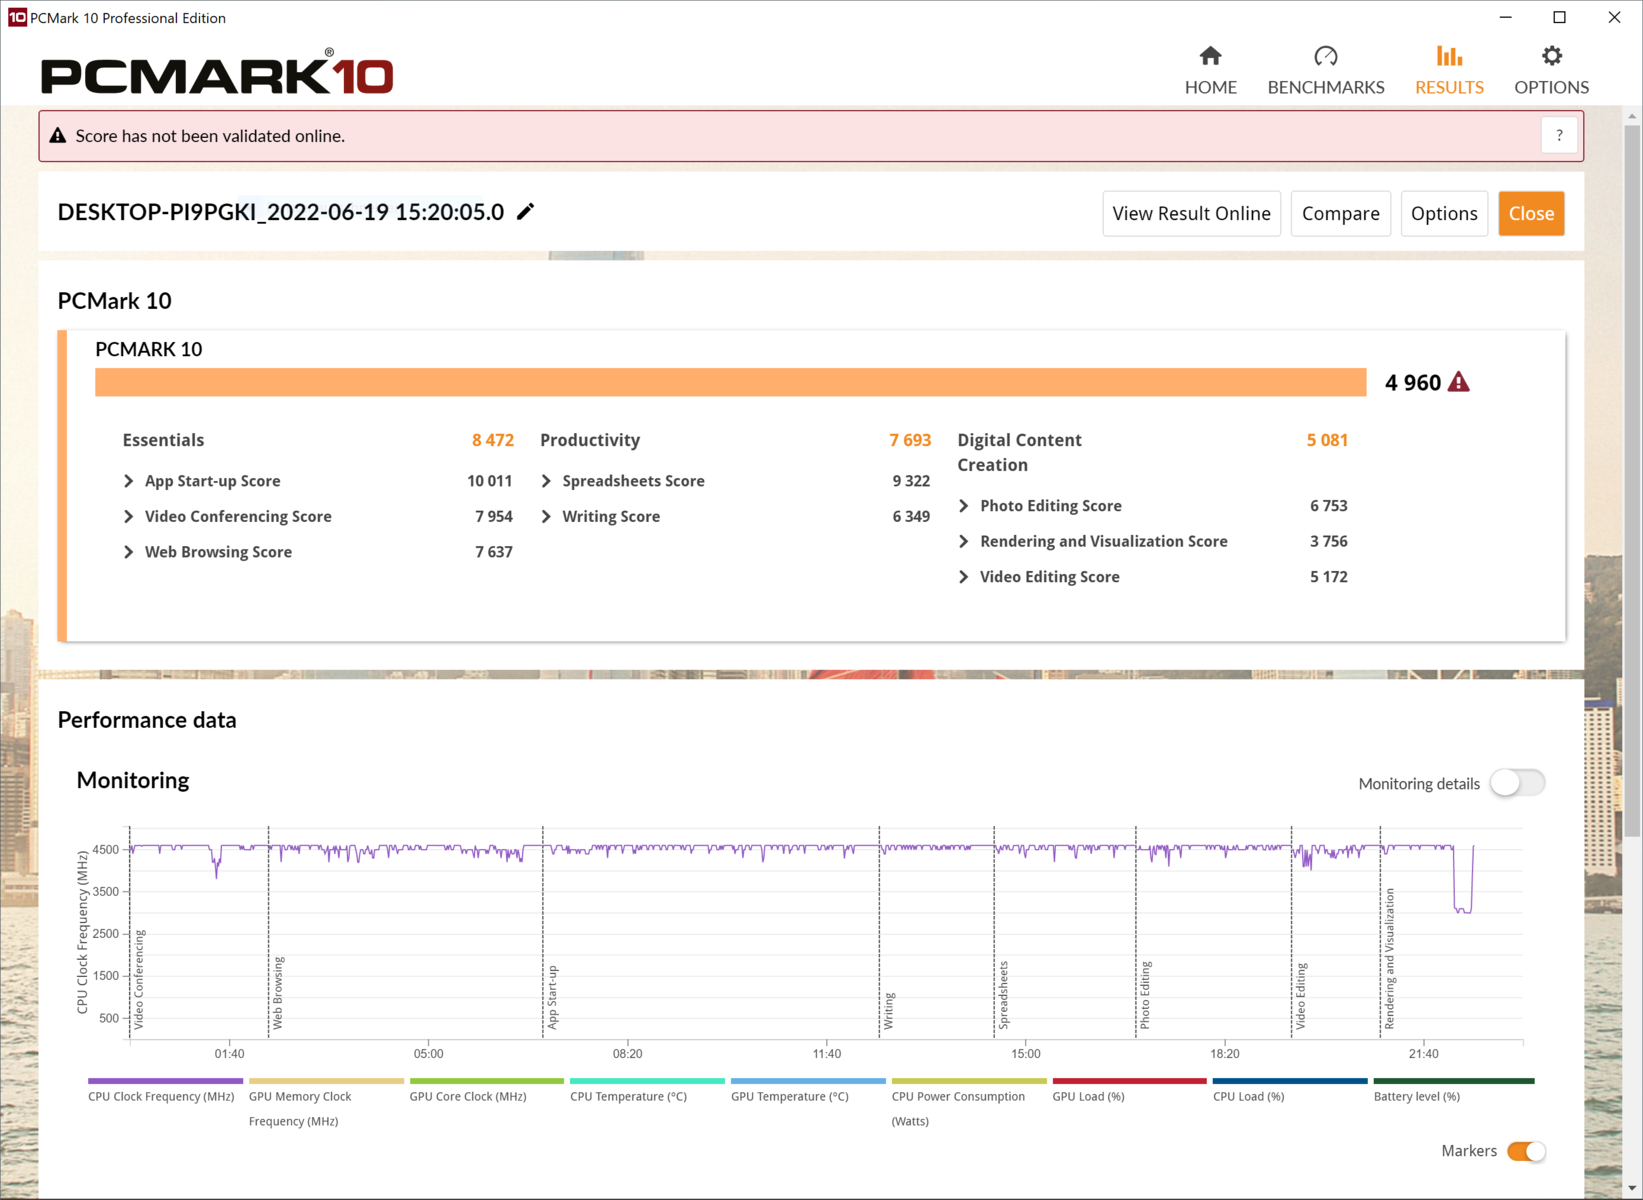
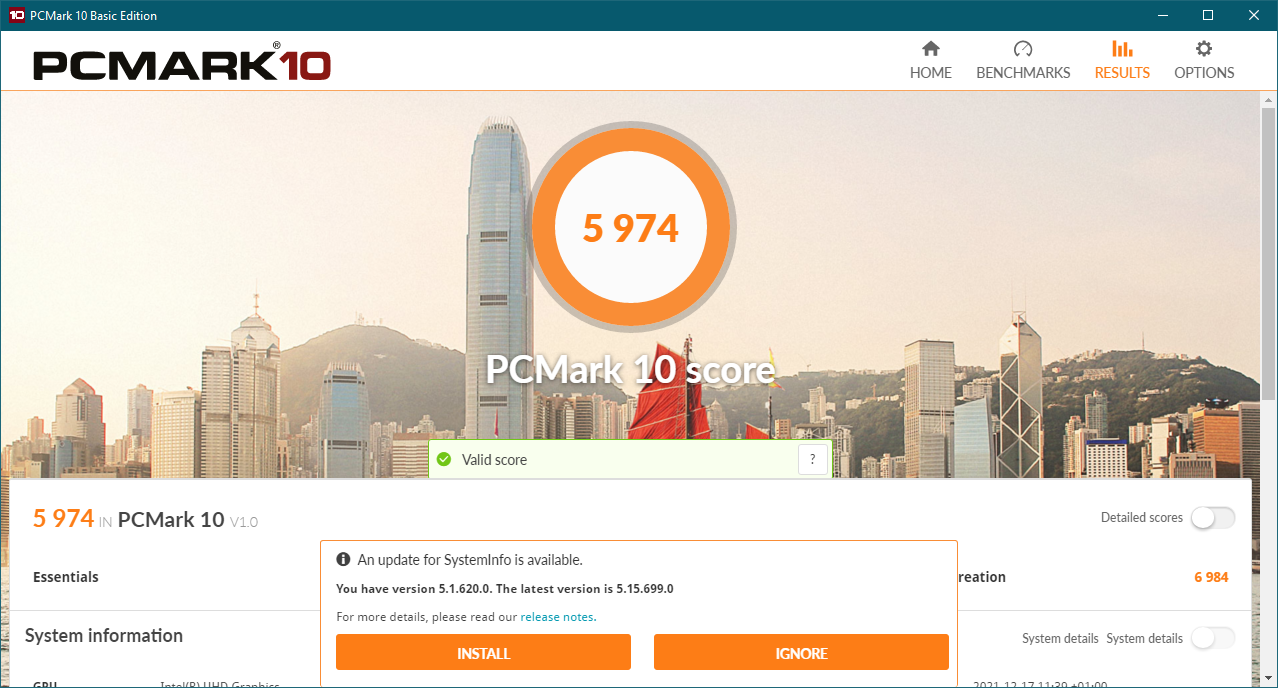
Avec le nouveau BIOS, environ 15% des performances sont perdues, de sorte que notre unité de test se retrouve dernière dans le benchmark PCMark 10. En particulier, le score de création de contenu a chuté d'environ 28%.
CrossMark: Overall | Productivity | Creativity | Responsiveness
| PCMark 10 / Score | |
| Moyenne de la classe Workstation (6563 - 10409, n=19, 2 dernières années) | |
| HP ZBook Fury 15 G8 | |
| HP ZBook Studio 15 G8 | |
| Lenovo ThinkPad P15v G2 21A9000XGE | |
| HP ZBook Firefly 15 G8 2C9R7EA | |
| Dell Precision 3000 3551 | |
| HP ZBook Power 15 G8 313S5EA | |
| Moyenne Intel Core i7-11800H, NVIDIA T600 Laptop GPU (n=1) | |
| PCMark 10 / Essentials | |
| Moyenne de la classe Workstation (9622 - 11157, n=19, 2 dernières années) | |
| Dell Precision 3000 3551 | |
| HP ZBook Fury 15 G8 | |
| HP ZBook Studio 15 G8 | |
| Lenovo ThinkPad P15v G2 21A9000XGE | |
| HP ZBook Firefly 15 G8 2C9R7EA | |
| HP ZBook Power 15 G8 313S5EA | |
| Moyenne Intel Core i7-11800H, NVIDIA T600 Laptop GPU (n=1) | |
| PCMark 10 / Productivity | |
| Moyenne de la classe Workstation (8789 - 20616, n=19, 2 dernières années) | |
| HP ZBook Firefly 15 G8 2C9R7EA | |
| HP ZBook Fury 15 G8 | |
| HP ZBook Studio 15 G8 | |
| Lenovo ThinkPad P15v G2 21A9000XGE | |
| Dell Precision 3000 3551 | |
| HP ZBook Power 15 G8 313S5EA | |
| Moyenne Intel Core i7-11800H, NVIDIA T600 Laptop GPU (n=1) | |
| PCMark 10 / Digital Content Creation | |
| Moyenne de la classe Workstation (8108 - 15631, n=19, 2 dernières années) | |
| HP ZBook Fury 15 G8 | |
| HP ZBook Studio 15 G8 | |
| Lenovo ThinkPad P15v G2 21A9000XGE | |
| HP ZBook Firefly 15 G8 2C9R7EA | |
| HP ZBook Power 15 G8 313S5EA | |
| Moyenne Intel Core i7-11800H, NVIDIA T600 Laptop GPU (n=1) | |
| Dell Precision 3000 3551 | |
| CrossMark / Overall | |
| Moyenne de la classe Workstation (1307 - 2267, n=22, 2 dernières années) | |
| HP ZBook Power 15 G8 313S5EA | |
| Moyenne Intel Core i7-11800H, NVIDIA T600 Laptop GPU (n=1) | |
| Lenovo ThinkPad P15v G2 21A9000XGE | |
| CrossMark / Productivity | |
| Moyenne de la classe Workstation (1130 - 2122, n=22, 2 dernières années) | |
| HP ZBook Power 15 G8 313S5EA | |
| Moyenne Intel Core i7-11800H, NVIDIA T600 Laptop GPU (n=1) | |
| Lenovo ThinkPad P15v G2 21A9000XGE | |
| CrossMark / Creativity | |
| Moyenne de la classe Workstation (1657 - 2725, n=22, 2 dernières années) | |
| HP ZBook Power 15 G8 313S5EA | |
| Moyenne Intel Core i7-11800H, NVIDIA T600 Laptop GPU (n=1) | |
| Lenovo ThinkPad P15v G2 21A9000XGE | |
| CrossMark / Responsiveness | |
| Moyenne de la classe Workstation (993 - 2096, n=22, 2 dernières années) | |
| HP ZBook Power 15 G8 313S5EA | |
| Moyenne Intel Core i7-11800H, NVIDIA T600 Laptop GPU (n=1) | |
| Lenovo ThinkPad P15v G2 21A9000XGE | |
| PCMark 10 Score | 4960 points | |
Aide | ||
| AIDA64 / Memory Copy | |
| Moyenne de la classe Workstation (56003 - 164795, n=23, 2 dernières années) | |
| HP ZBook Fury 15 G8 | |
| HP ZBook Studio 15 G8 | |
| Moyenne Intel Core i7-11800H (24508 - 48144, n=21) | |
| HP ZBook Power 15 G8 313S5EA | |
| HP ZBook Firefly 15 G8 2C9R7EA | |
| Lenovo ThinkPad P15v G2 21A9000XGE | |
| AIDA64 / Memory Read | |
| Moyenne de la classe Workstation (55795 - 121563, n=23, 2 dernières années) | |
| HP ZBook Studio 15 G8 | |
| HP ZBook Fury 15 G8 | |
| Moyenne Intel Core i7-11800H (25882 - 50365, n=20) | |
| HP ZBook Power 15 G8 313S5EA | |
| Lenovo ThinkPad P15v G2 21A9000XGE | |
| HP ZBook Firefly 15 G8 2C9R7EA | |
| AIDA64 / Memory Write | |
| Moyenne de la classe Workstation (55663 - 214520, n=23, 2 dernières années) | |
| HP ZBook Studio 15 G8 | |
| HP ZBook Fury 15 G8 | |
| Moyenne Intel Core i7-11800H (22240 - 46214, n=20) | |
| HP ZBook Firefly 15 G8 2C9R7EA | |
| HP ZBook Power 15 G8 313S5EA | |
| Lenovo ThinkPad P15v G2 21A9000XGE | |
| AIDA64 / Memory Latency | |
| Moyenne de la classe Workstation (84.5 - 165.2, n=23, 2 dernières années) | |
| Lenovo ThinkPad P15v G2 21A9000XGE | |
| HP ZBook Fury 15 G8 | |
| HP ZBook Studio 15 G8 | |
| HP ZBook Power 15 G8 313S5EA | |
| HP ZBook Firefly 15 G8 2C9R7EA | |
| Moyenne Intel Core i7-11800H (71.9 - 104.1, n=44) | |
* ... Moindre est la valeur, meilleures sont les performances
Latences DPC
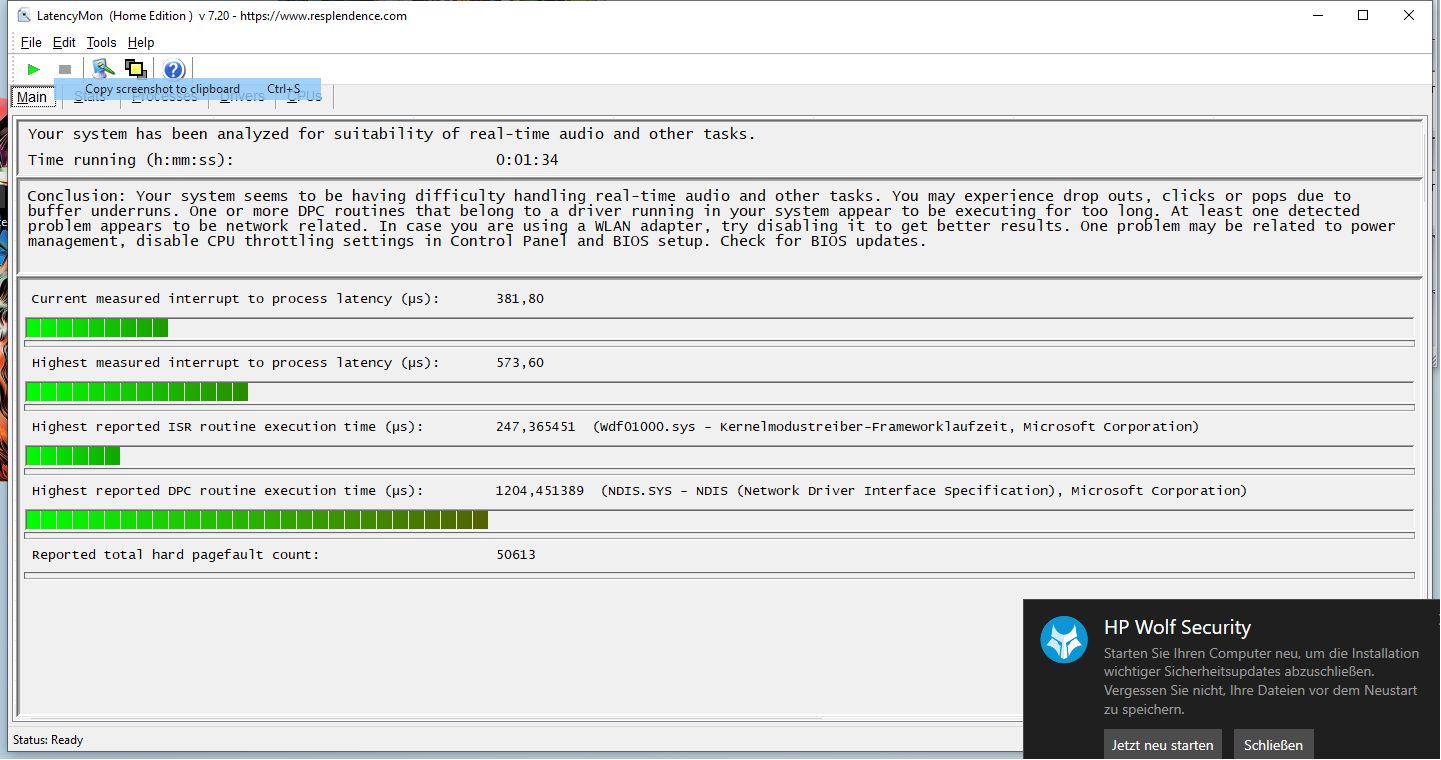
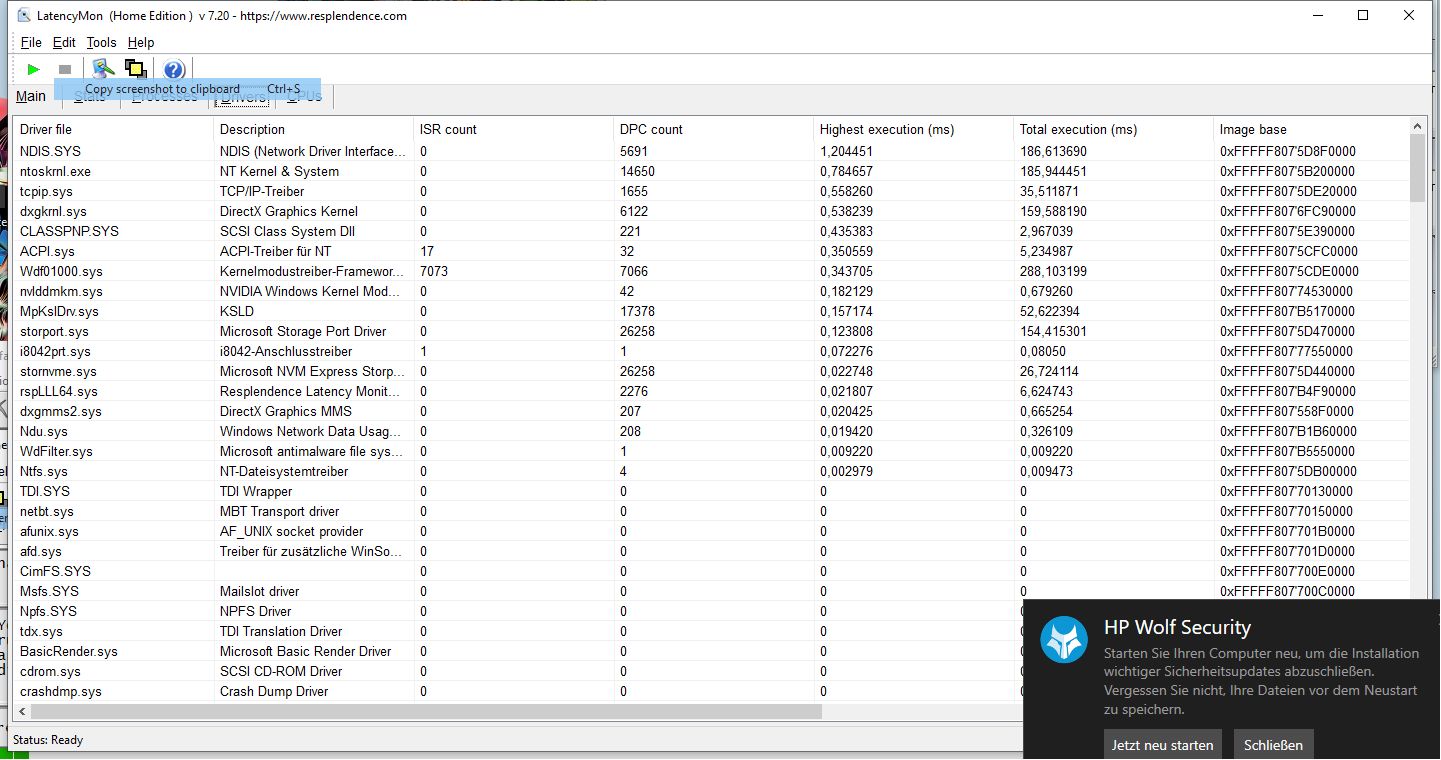
Avec seulement 537,6 µs, la latence DPC du ZBook Power 15 semble très bonne. Cependant, l'analyse montre encore que le pilote réseau provoque quelques retards, de sorte que le traitement vidéo et audio en temps réel ne fonctionnera que sans utiliser le Wi-Fi AX201 d'Intel
La reproduction d'une vidéo YouTube 4K entraîne une charge de 30 % sur l'iGPU et de 12 % sur le CPU, mais nous remarquons encore quelques images perdues.
| DPC Latencies / LatencyMon - interrupt to process latency (max), Web, Youtube, Prime95 (Classer selon les valeurs) | |
| HP ZBook Power 15 G8 313S5EA | |
| HP ZBook Fury 15 G8 | |
| HP ZBook Firefly 15 G8 2C9R7EA | |
| HP ZBook Studio 15 G8 | |
| Dell Precision 3000 3551 | |
| Lenovo ThinkPad P15v G2 21A9000XGE | |
* ... Moindre est la valeur, meilleures sont les performances
Solution de stockage
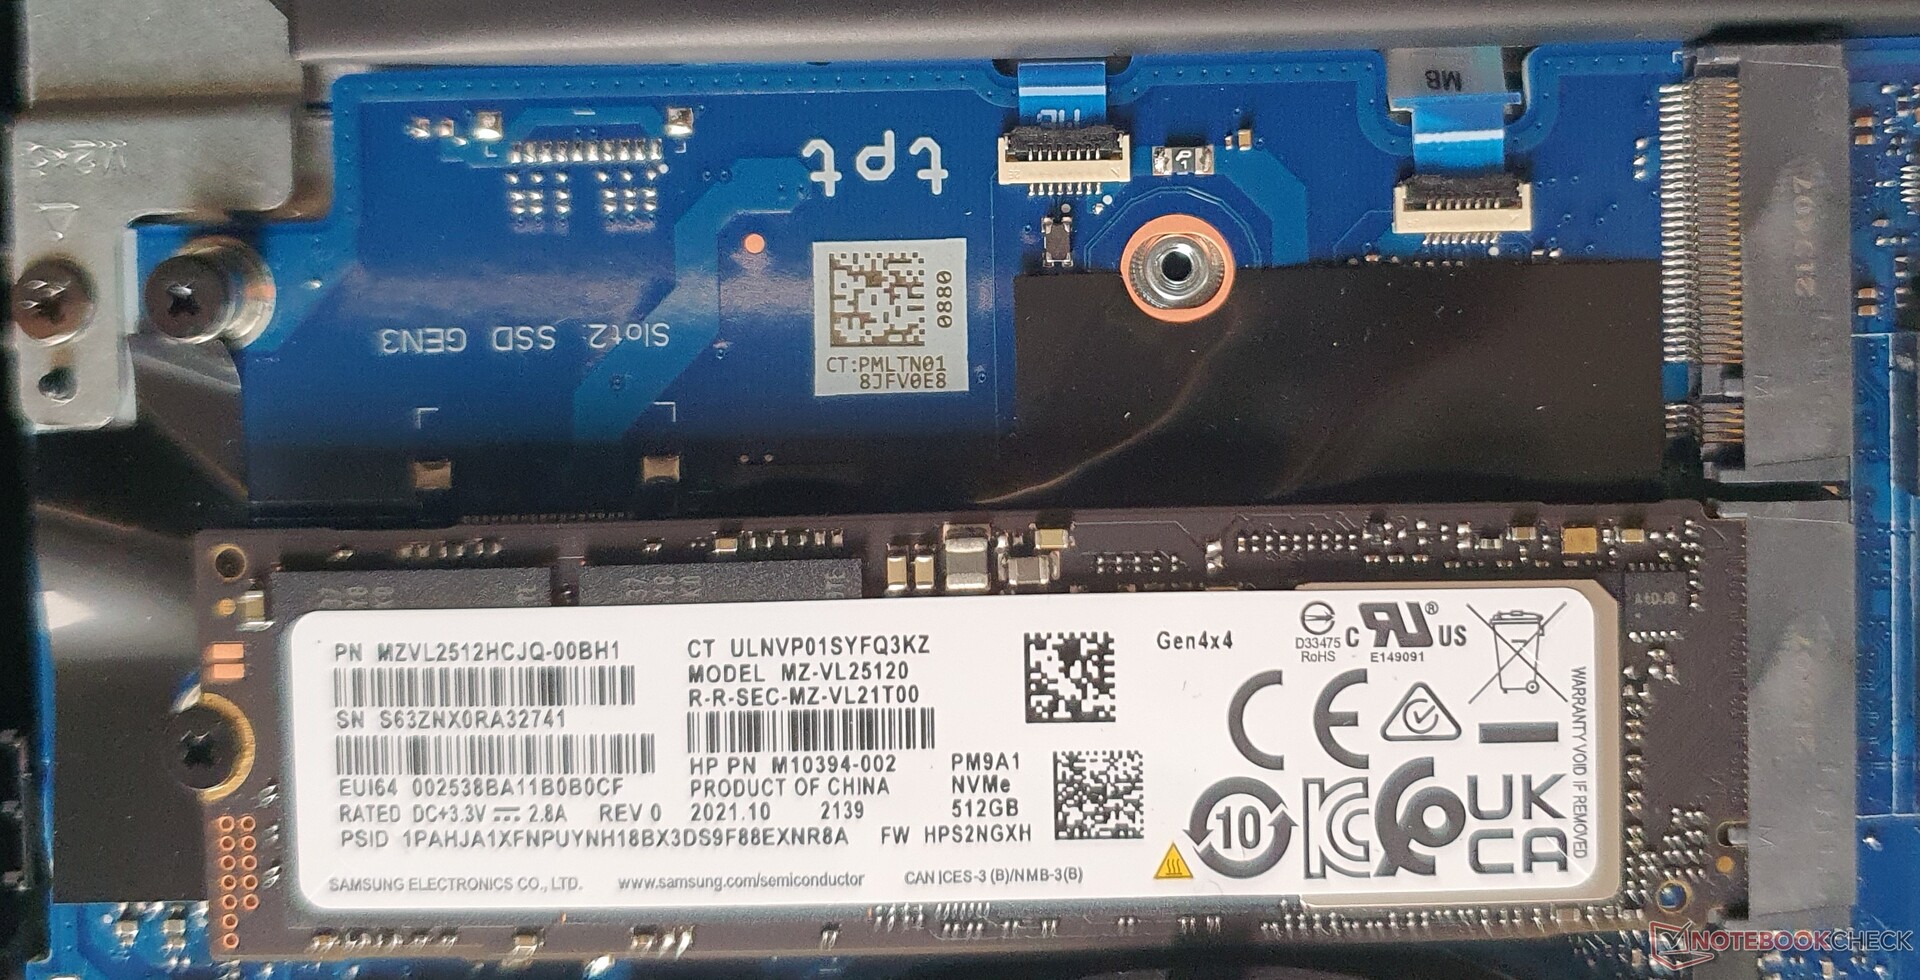
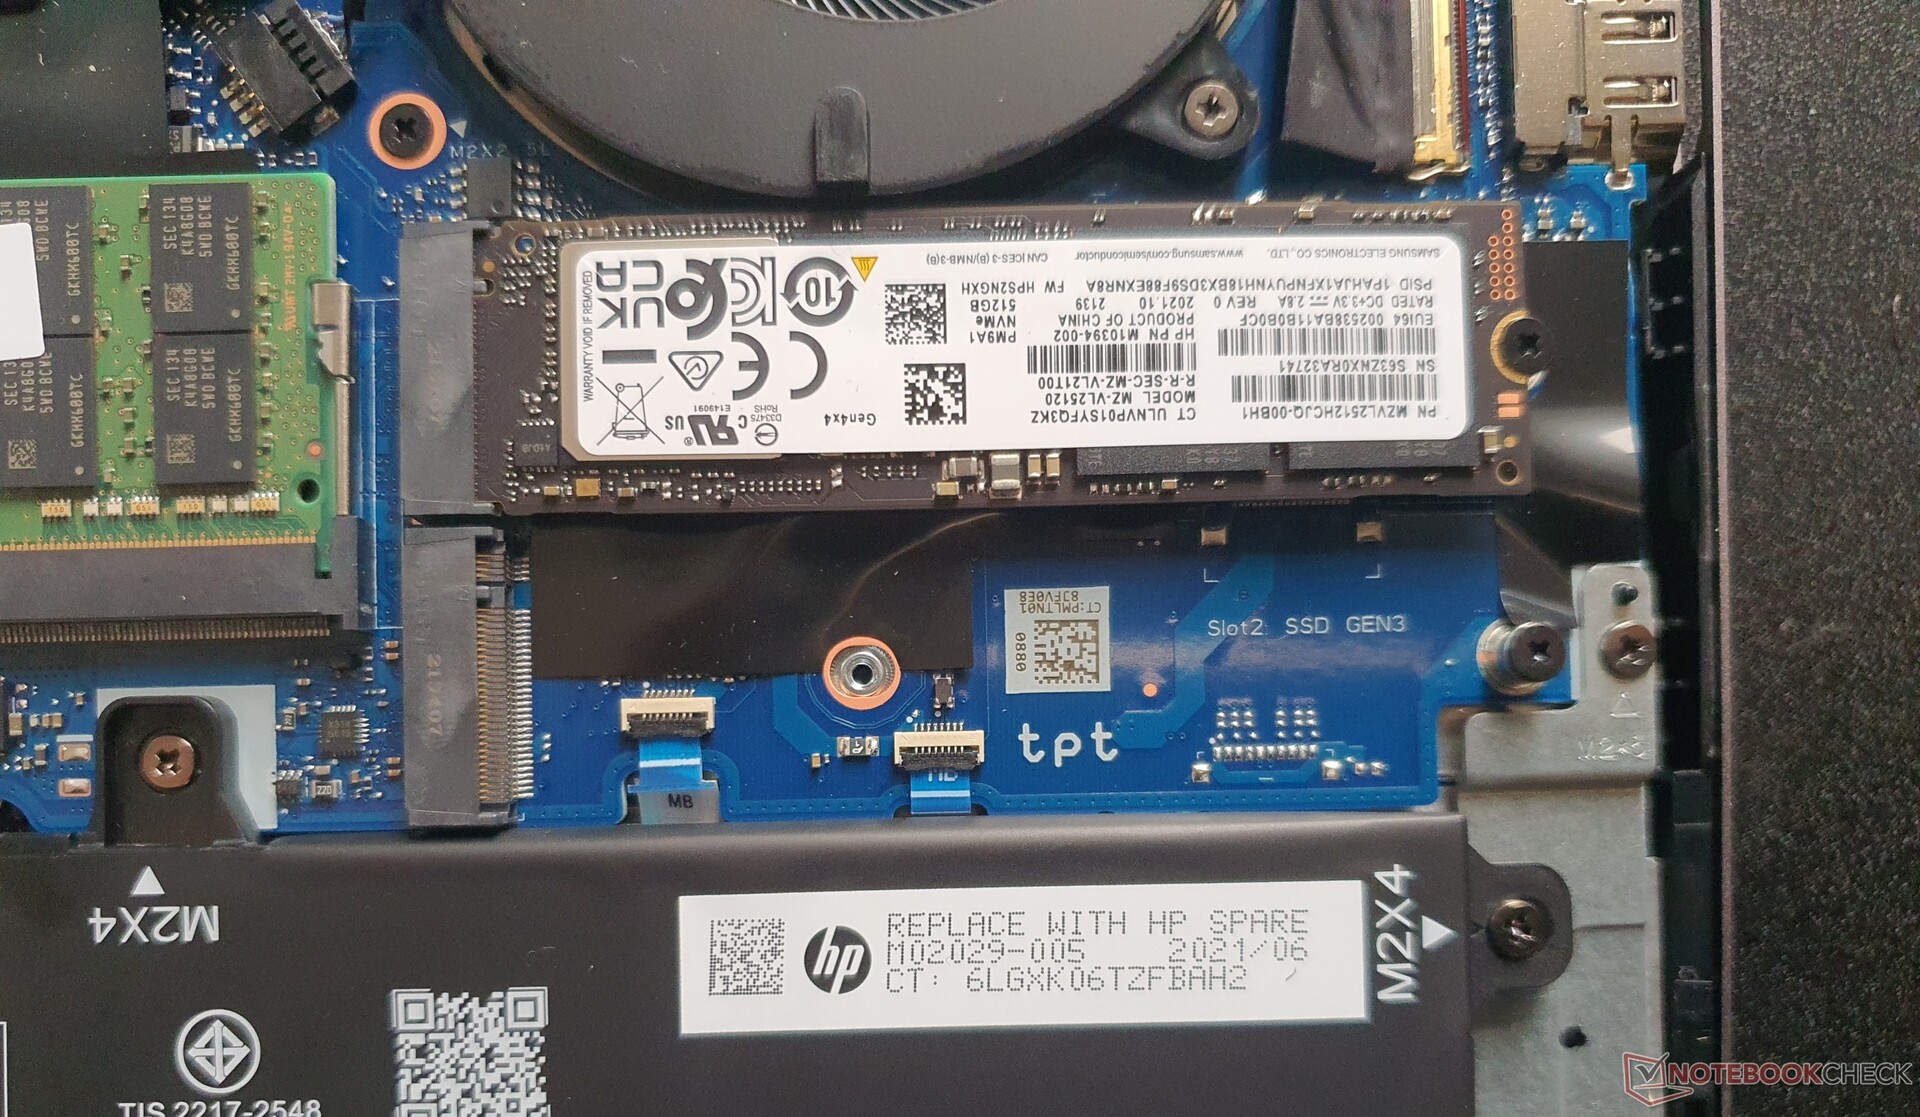
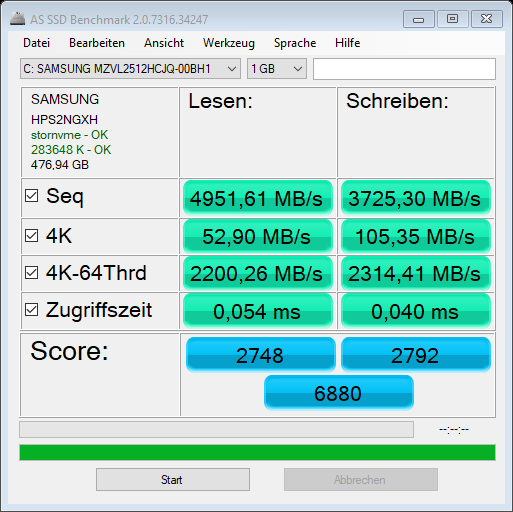
Le Samsung PM9A1 offre de l'espace pour 512 Go, dont environ 418 Go restent disponibles pour l'utilisateur en l'état de livraison. Grâce au PCIe Gen4x4, les vitesses, y compris les valeurs 4K et les temps d'accès, semblent très bonnes au départ. Un deuxième emplacement (PCIe Gen3x4) est également disponible, et les deux sont certifiés jusqu'à 2 To.
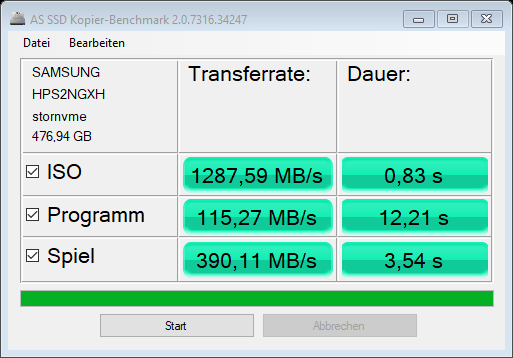
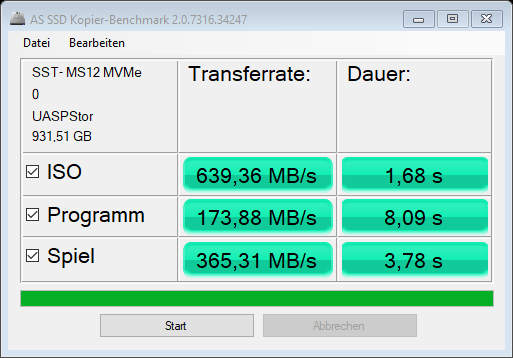
Cependant, lors de la copie d'un programme plus important, par exemple, le SSD montre des taux de transfert très faibles de 115 Mo/s au lieu des 1074 Mo/s duZBook Studio 15 G8. Même le modèle abordable Dell Precision 3511 parvient à des taux de copie nettement plus élevés. Notre SSD externe de 10 Gbps copie également les programmes plus rapidement.
| HP ZBook Power 15 G8 313S5EA T600 Laptop GPU, i7-11800H, Samsung PM9A1 MZVL2512HCJQ | HP ZBook Fury 15 G8 RTX A5000 Laptop GPU, i9-11950H, Samsung PM981a MZVLB1T0HBLR | HP ZBook Studio 15 G8 GeForce RTX 3070 Laptop GPU, i9-11950H, Samsung PM981a MZVLB2T0HALB | HP ZBook Firefly 15 G8 2C9R7EA T500 Laptop GPU, i7-1165G7, Toshiba XG6 KXG60ZNV1T02 | Lenovo ThinkPad P15v G2 21A9000XGE T1200 Laptop GPU, i7-11800H, Toshiba XG6 KXG6AZNV512G | Dell Precision 3000 3551 Quadro P620, i9-10885H, Toshiba Kioxia XG6 KXG60PNV512G | |
|---|---|---|---|---|---|---|
| AS SSD | -35% | 64% | -26% | -9% | 24% | |
| Seq Read (MB/s) | 4951 | 2937 -41% | 2953 -40% | 2599 -48% | 2684 -46% | 1833 -63% |
| Seq Write (MB/s) | 3725 | 1688 -55% | 1691 -55% | 1305 -65% | 1352 -64% | 1283 -66% |
| 4K Read (MB/s) | 52.9 | 44.27 -16% | 43.98 -17% | 49.65 -6% | 43.68 -17% | 44.56 -16% |
| 4K Write (MB/s) | 105.35 | 105.8 0% | 105.4 0% | 128.1 22% | 105.56 0% | 112.4 7% |
| 4K-64 Read (MB/s) | 2200.26 | 873 -60% | 1065 -52% | 1157 -47% | 976.92 -56% | 1106 -50% |
| 4K-64 Write (MB/s) | 2314.41 | 1996 -14% | 1957 -15% | 1475 -36% | 1452.09 -37% | 1262 -45% |
| Access Time Read * (ms) | 0.054 | 0.048 11% | 0.04 26% | 0.057 -6% | 0.124 -130% | 0.084 -56% |
| Access Time Write * (ms) | 0.04 | 0.107 -168% | 0.105 -163% | 0.03 25% | 0.038 5% | 0.105 -163% |
| Score Read (Points) | 2748 | 1211 -56% | 1404 -49% | 1467 -47% | 1289 -53% | 1334 -51% |
| Score Write (Points) | 2792 | 2271 -19% | 2232 -20% | 1734 -38% | 1693 -39% | 1503 -46% |
| Score Total (Points) | 6880 | 4046 -41% | 4297 -38% | 3894 -43% | 3582 -48% | 3498 -49% |
| Copy ISO MB/s (MB/s) | 1287.6 | 901 -30% | 2474 92% | 1760.5 37% | 2940 128% | |
| Copy Program MB/s (MB/s) | 115.3 | 118.7 3% | 1074 831% | 355 208% | 733 536% | |
| Copy Game MB/s (MB/s) | 390.1 | 372 -5% | 1929 394% | 849 118% | 1442 270% |
* ... Moindre est la valeur, meilleures sont les performances
* ... Moindre est la valeur, meilleures sont les performances
Constant Performance Reading: DiskSpd Read Loop, Queue Depth 8
Carte graphique
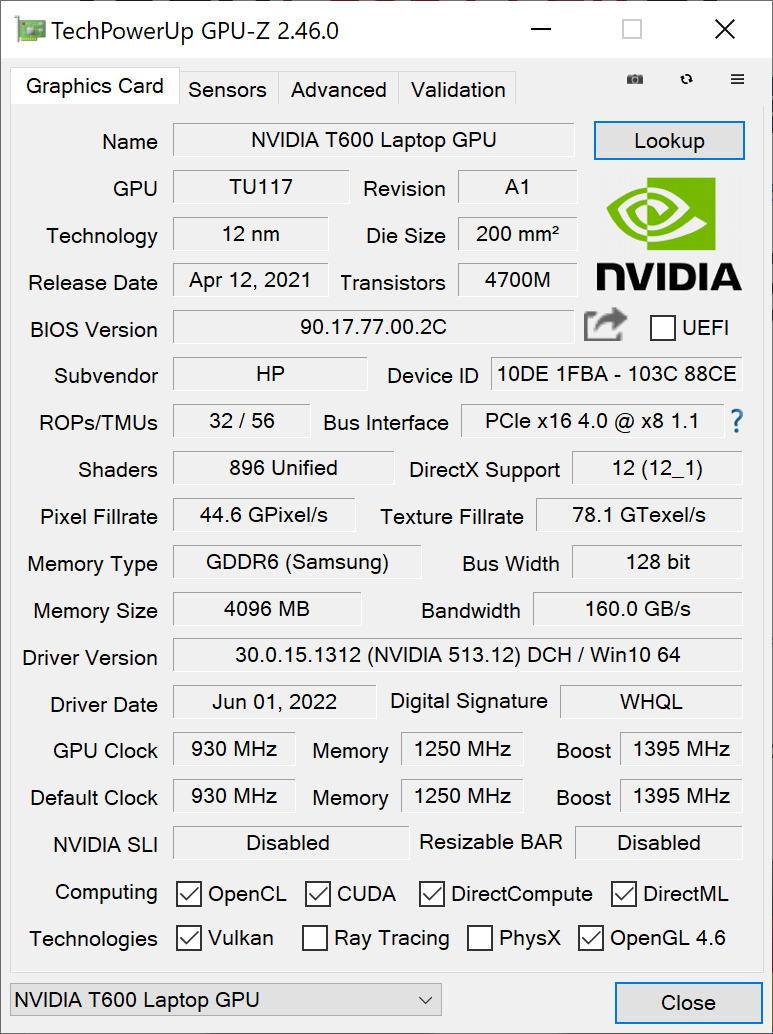
Le siteNvidia T600utilisé ici est la version professionnelle de la GeForce GTX 1650 (non-Ti) avec 4 Go de GDDR6 VRAM et un TGP de 25 watts et des boosts jusqu'à 1395 MHz
Dans de nombreux benchmarks, elle reste ~15% derrière la Nvidia T1200duThinkPad P15v G2et entre 30 et 50% d'avance sur le Nvidia T500 duZBook Firefly 15 G8
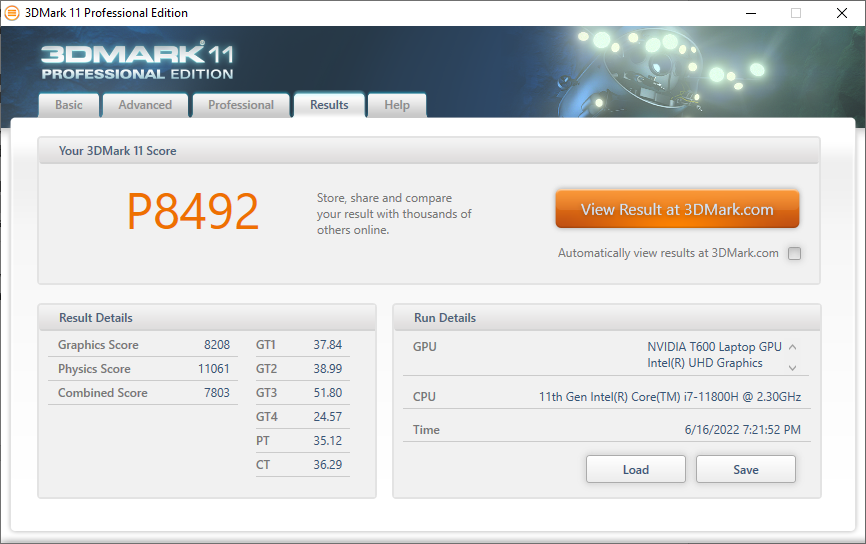
En mode batterie, vous perdrez environ 20 % de la puissance graphique, ce qui vous permettra tout de même de travailler sur des tâches GPU en mode mobile.

| 3DMark Performance rating - Percent | |
| Moyenne de la classe Workstation | |
| HP ZBook Fury 15 G8 -4! | |
| HP ZBook Studio 15 G8 -4! | |
| HP ZBook Power 15 G8 313S5EA | |
| Moyenne NVIDIA T600 Laptop GPU | |
| Lenovo ThinkPad P15v G2 21A9000XGE -3! | |
| Dell Precision 3000 3551 -3! | |
| HP ZBook Firefly 15 G8 2C9R7EA -4! | |
| 3DMark 06 - 1280x1024 Standard Score AA:0x AF:0x | |
| Moyenne de la classe Workstation (53112 - 63693, n=3, 2 dernières années) | |
| HP ZBook Power 15 G8 313S5EA | |
| Moyenne NVIDIA T600 Laptop GPU (n=1) | |
| Lenovo ThinkPad P15v G2 21A9000XGE | |
| Dell Precision 3000 3551 | |
| 3DMark Vantage | |
| 1280x1024 P Result | |
| Moyenne de la classe Workstation (71988 - 116321, n=3, 2 dernières années) | |
| HP ZBook Power 15 G8 313S5EA | |
| Moyenne NVIDIA T600 Laptop GPU (n=1) | |
| 1280x1024 P GPU no PhysX | |
| Moyenne de la classe Workstation (66766 - 117151, n=2, 2 dernières années) | |
| HP ZBook Power 15 G8 313S5EA | |
| Moyenne NVIDIA T600 Laptop GPU (n=1) | |
| 1280x1024 P CPU no PhysX | |
| Moyenne de la classe Workstation (94058 - 113900, n=2, 2 dernières années) | |
| HP ZBook Power 15 G8 313S5EA | |
| Moyenne NVIDIA T600 Laptop GPU (n=1) | |
| 3DMark 06 Standard Score | 43438 points | |
| 3DMark Vantage P Result | 39112 points | |
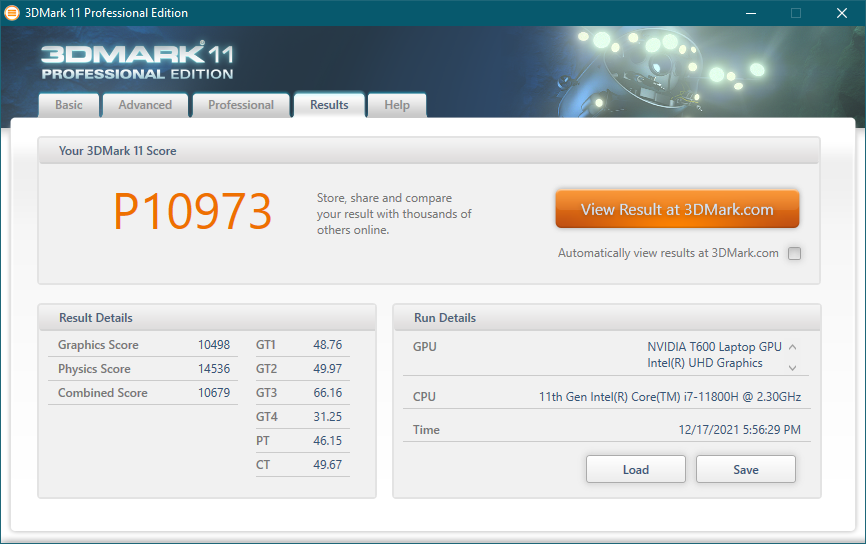
| 3DMark 11 Performance | 10973 points | |
| 3DMark Ice Storm Standard Score | 76482 points | |
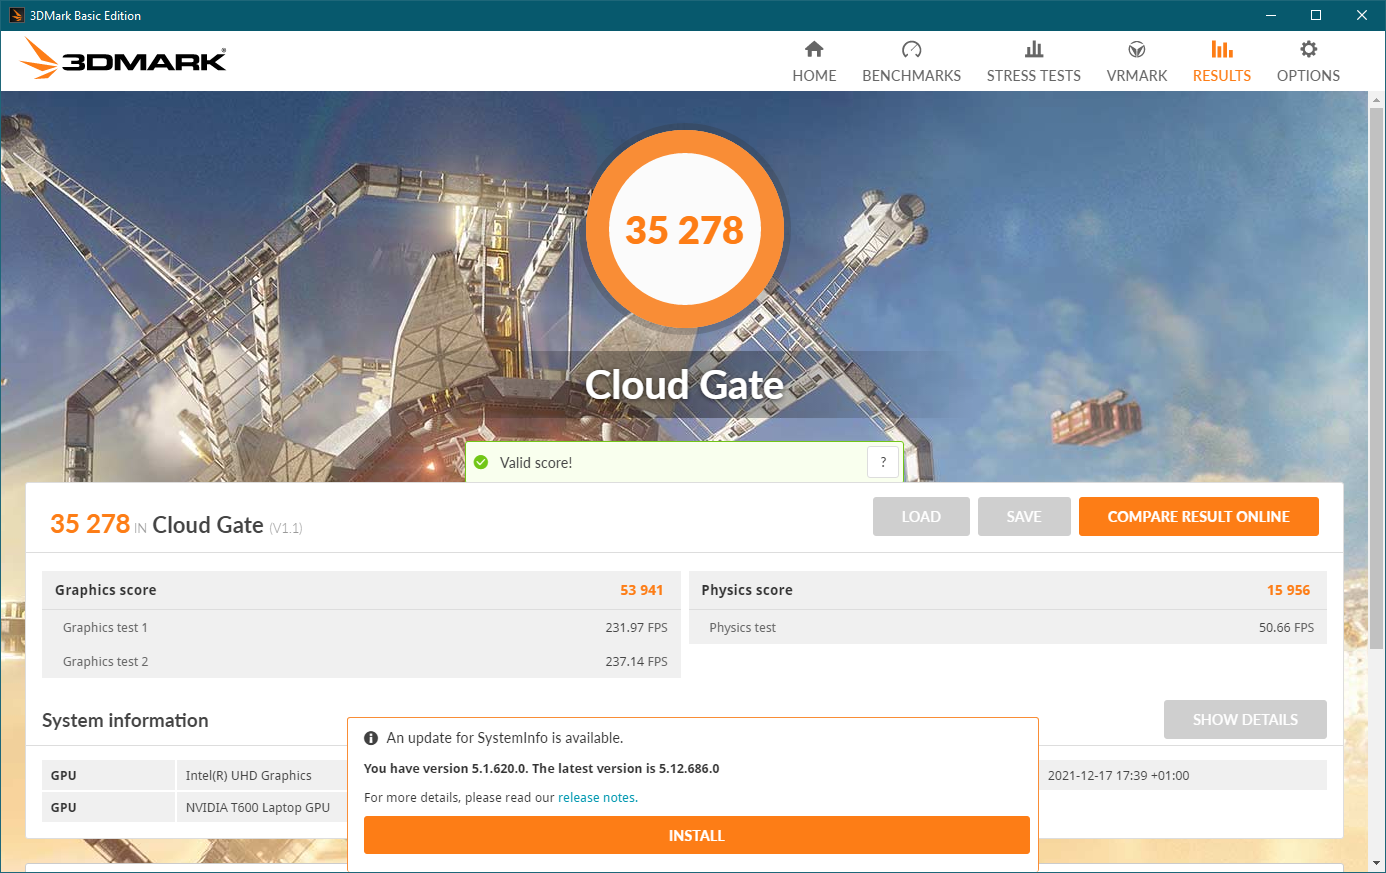
| 3DMark Cloud Gate Standard Score | 35278 points | |
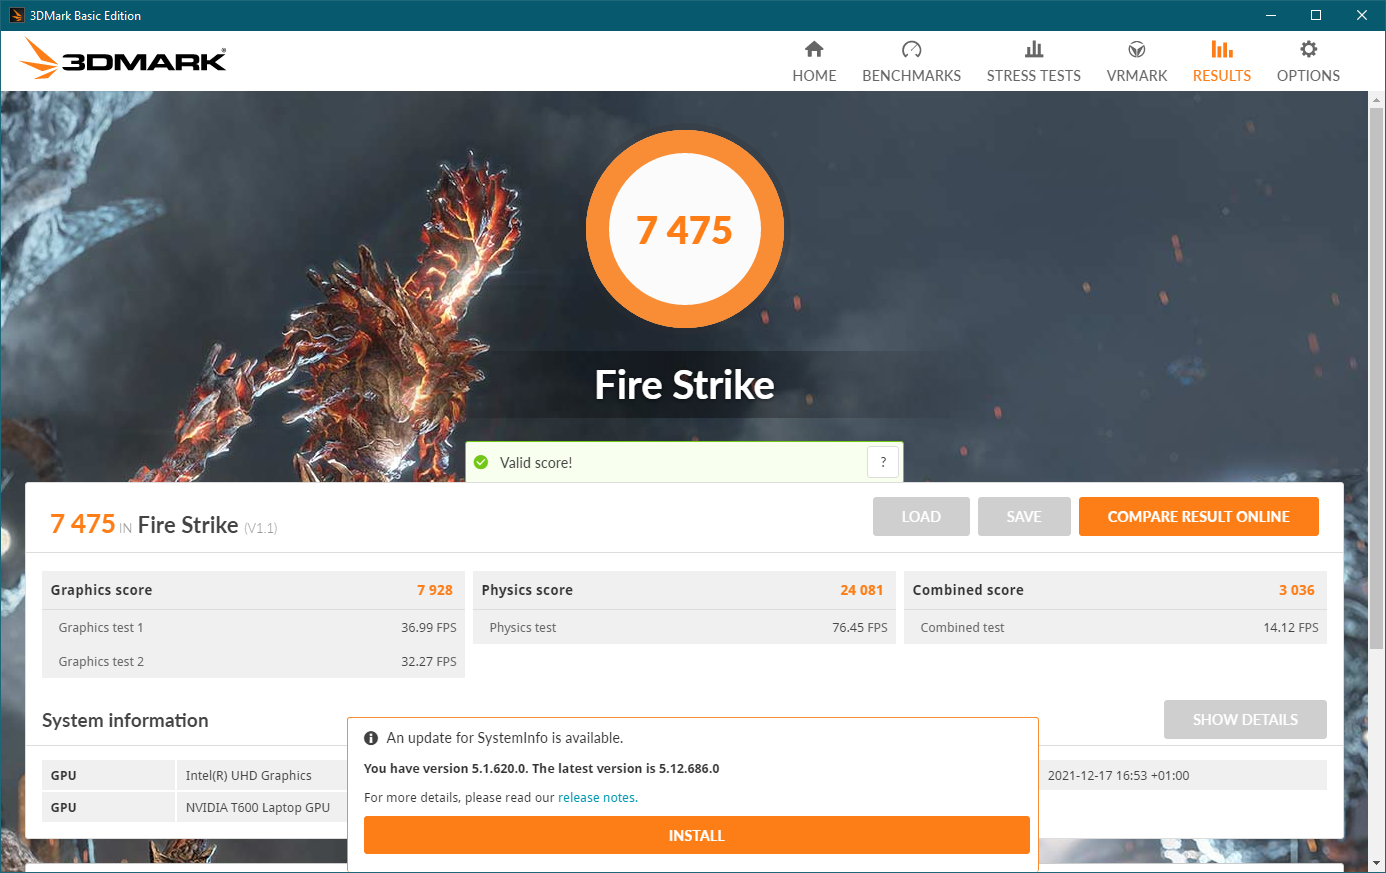
| 3DMark Fire Strike Score | 7475 points | |
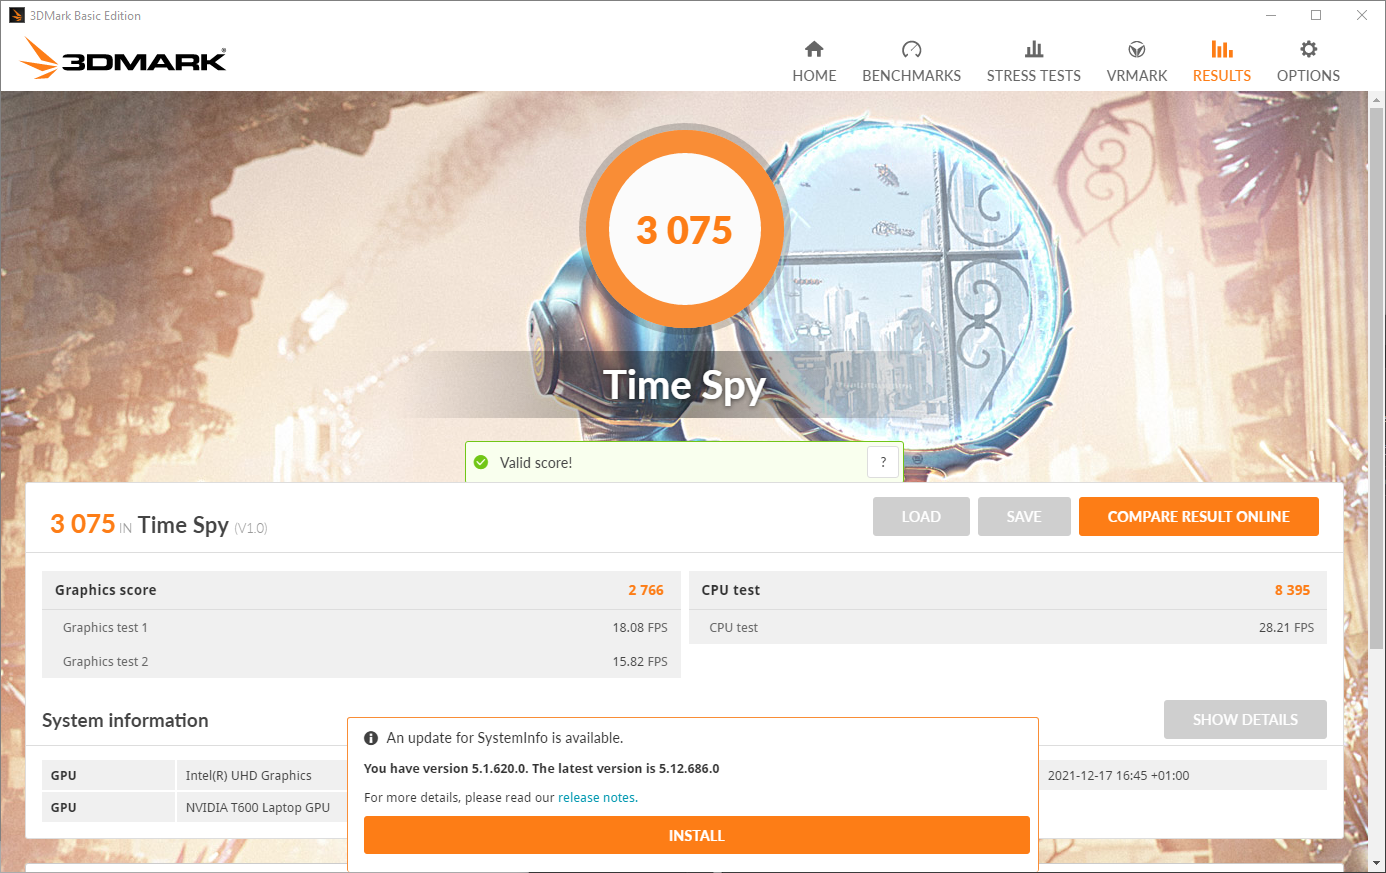
| 3DMark Time Spy Score | 3075 points | |
Aide | ||
Performances en matière de jeux
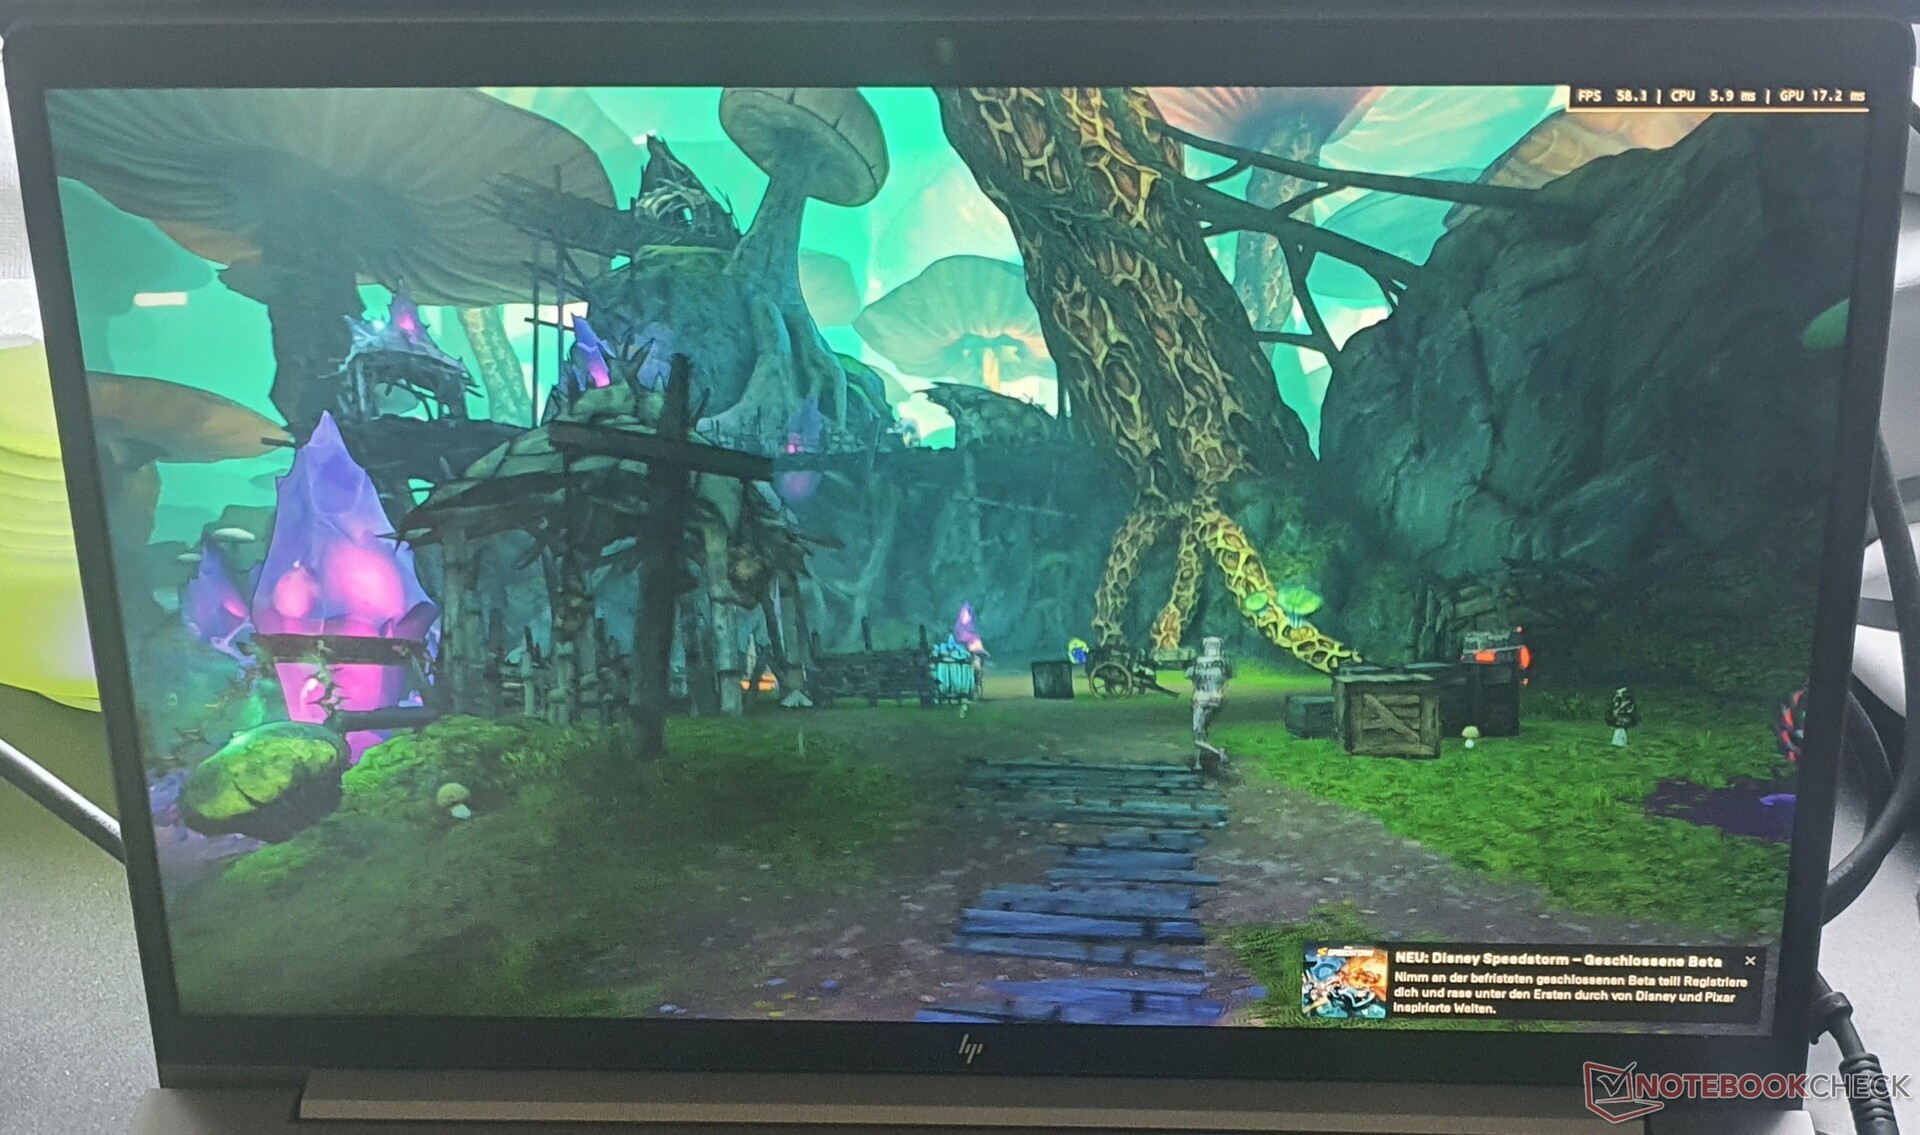
Pendant les jeux, la Nvidia T600 est capable de maintenir sa vitesse d'horloge maximale. À moins de 60 °C (140 °F), il ne chauffe pas particulièrement. Dans les jeux modernes, les performances sont suffisantes pour des détails moyens en résolution Full-HD. Cependant, le ZBook n'est pas conçu pour le jeu. Le système consomme ~60 watts dans ce scénario, dont 25 watts pour le GPU.
Bien que le ThinkPad P15vne fournit que 10 watts de plus pour son dGPU, il consomme un total de 100 watts pendant les jeux, tandis que la carte graphique Nvidia T1200ne fournit que ~15% d'images par seconde en plus. LeZBook Firefly 15 avec leNvidia T500 est 40% plus lent en moyenne, mais consomme toujours les mêmes 60 watts au total pendant le jeu. Dans le test d'une heure de The Witcher 3, nous ne remarquons aucune baisse de performance.
The Witcher 3 FPS Chart
| The Witcher 3 | |
| 1366x768 Medium Graphics & Postprocessing | |
| HP ZBook Studio 15 G8 | |
| HP ZBook Fury 15 G8 | |
| HP ZBook Power 15 G8 313S5EA | |
| Moyenne NVIDIA T600 Laptop GPU (n=1) | |
| Dell Precision 3000 3551 | |
| 1920x1080 High Graphics & Postprocessing (Nvidia HairWorks Off) | |
| Moyenne de la classe Workstation (n=12 dernières années) | |
| HP ZBook Studio 15 G8 | |
| HP ZBook Fury 15 G8 | |
| Lenovo ThinkPad P15v G2 21A9000XGE | |
| HP ZBook Power 15 G8 313S5EA | |
| Moyenne NVIDIA T600 Laptop GPU (n=1) | |
| Dell Precision 3000 3551 | |
| 1920x1080 Ultra Graphics & Postprocessing (HBAO+) | |
| Moyenne de la classe Workstation (n=12 dernières années) | |
| HP ZBook Fury 15 G8 | |
| HP ZBook Studio 15 G8 | |
| Lenovo ThinkPad P15v G2 21A9000XGE | |
| HP ZBook Power 15 G8 313S5EA | |
| Moyenne NVIDIA T600 Laptop GPU (n=1) | |
| HP ZBook Firefly 15 G8 2C9R7EA | |
| Dell Precision 3000 3551 | |
| GTA V | |
| 1366x768 Normal/Off AF:4x | |
| Moyenne de la classe Workstation (140.9 - 185.8, n=17, 2 dernières années) | |
| HP ZBook Fury 15 G8 | |
| Lenovo ThinkPad P15v G2 21A9000XGE | |
| HP ZBook Power 15 G8 313S5EA | |
| Moyenne NVIDIA T600 Laptop GPU (n=1) | |
| 1920x1080 High/On (Advanced Graphics Off) AA:2xMSAA + FX AF:8x | |
| Moyenne de la classe Workstation (44.4 - 179.4, n=21, 2 dernières années) | |
| HP ZBook Fury 15 G8 | |
| Lenovo ThinkPad P15v G2 21A9000XGE | |
| HP ZBook Power 15 G8 313S5EA | |
| Moyenne NVIDIA T600 Laptop GPU (n=1) | |
| 1920x1080 Highest AA:4xMSAA + FX AF:16x | |
| Moyenne de la classe Workstation (18.1 - 156.1, n=23, 2 dernières années) | |
| HP ZBook Fury 15 G8 | |
| Lenovo ThinkPad P15v G2 21A9000XGE | |
| HP ZBook Power 15 G8 313S5EA | |
| Moyenne NVIDIA T600 Laptop GPU (n=1) | |
| Shadow of the Tomb Raider | |
| 1280x720 Lowest Preset | |
| HP ZBook Fury 15 G8 | |
| HP ZBook Power 15 G8 313S5EA | |
| Moyenne NVIDIA T600 Laptop GPU (n=1) | |
| Lenovo ThinkPad P15v G2 21A9000XGE | |
| 1920x1080 Medium Preset | |
| HP ZBook Fury 15 G8 | |
| Lenovo ThinkPad P15v G2 21A9000XGE | |
| HP ZBook Power 15 G8 313S5EA | |
| Moyenne NVIDIA T600 Laptop GPU (n=1) | |
| 1920x1080 High Preset AA:SM | |
| HP ZBook Fury 15 G8 | |
| Lenovo ThinkPad P15v G2 21A9000XGE | |
| HP ZBook Power 15 G8 313S5EA | |
| Moyenne NVIDIA T600 Laptop GPU (n=1) | |
| Elden Ring | |
| 1920x1080 Medium Preset | |
| Lenovo ThinkPad P15v G2 21A9000XGE | |
| HP ZBook Power 15 G8 313S5EA | |
| Moyenne NVIDIA T600 Laptop GPU (n=1) | |
| 1920x1080 High Preset | |
| Lenovo ThinkPad P15v G2 21A9000XGE | |
| HP ZBook Power 15 G8 313S5EA | |
| Moyenne NVIDIA T600 Laptop GPU (n=1) | |
| 1920x1080 Maximum Preset | |
| Lenovo ThinkPad P15v G2 21A9000XGE | |
| HP ZBook Power 15 G8 313S5EA | |
| Moyenne NVIDIA T600 Laptop GPU (n=1) | |
| Resident Evil Village | |
| 1920x1080 Balanced Preset | |
| Lenovo ThinkPad P15v G2 21A9000XGE | |
| HP ZBook Power 15 G8 313S5EA | |
| Moyenne NVIDIA T600 Laptop GPU (n=1) | |
| 1920x1080 Prioritize Graphics Preset | |
| Lenovo ThinkPad P15v G2 21A9000XGE | |
| HP ZBook Power 15 G8 313S5EA | |
| Moyenne NVIDIA T600 Laptop GPU (n=1) | |
| 1920x1080 Max Preset | |
| Lenovo ThinkPad P15v G2 21A9000XGE | |
| HP ZBook Power 15 G8 313S5EA | |
| Moyenne NVIDIA T600 Laptop GPU (n=1) | |
| Vampire Bloodhunt | |
| 1920x1080 Medium Preset | |
| Lenovo ThinkPad P15v G2 21A9000XGE | |
| HP ZBook Power 15 G8 313S5EA | |
| Moyenne NVIDIA T600 Laptop GPU (n=1) | |
| 1920x1080 High Preset | |
| Lenovo ThinkPad P15v G2 21A9000XGE | |
| HP ZBook Power 15 G8 313S5EA | |
| Moyenne NVIDIA T600 Laptop GPU (n=1) | |
| 1920x1080 Ultra Preset | |
| Lenovo ThinkPad P15v G2 21A9000XGE | |
| HP ZBook Power 15 G8 313S5EA | |
| Moyenne NVIDIA T600 Laptop GPU (n=1) | |
| GRID Legends | |
| 1920x1080 Medium Preset | |
| Lenovo ThinkPad P15v G2 21A9000XGE | |
| HP ZBook Power 15 G8 313S5EA | |
| Moyenne NVIDIA T600 Laptop GPU (n=1) | |
| 1920x1080 High Preset | |
| Lenovo ThinkPad P15v G2 21A9000XGE | |
| HP ZBook Power 15 G8 313S5EA | |
| Moyenne NVIDIA T600 Laptop GPU (n=1) | |
| 1920x1080 Ultra Preset | |
| Lenovo ThinkPad P15v G2 21A9000XGE | |
| HP ZBook Power 15 G8 313S5EA | |
| Moyenne NVIDIA T600 Laptop GPU (n=1) | |
| Mafia Definitive Edition | |
| 1280x720 Low Preset | |
| Lenovo ThinkPad P15v G2 21A9000XGE | |
| HP ZBook Power 15 G8 313S5EA | |
| Moyenne NVIDIA T600 Laptop GPU (n=1) | |
| 1920x1080 Medium Preset | |
| Lenovo ThinkPad P15v G2 21A9000XGE | |
| HP ZBook Power 15 G8 313S5EA | |
| Moyenne NVIDIA T600 Laptop GPU (n=1) | |
| 1920x1080 High Preset | |
| Lenovo ThinkPad P15v G2 21A9000XGE | |
| HP ZBook Power 15 G8 313S5EA | |
| Moyenne NVIDIA T600 Laptop GPU (n=1) | |
| Elex 2 | |
| 1920x1080 Medium / On AA:FX AF:16x | |
| Lenovo ThinkPad P15v G2 21A9000XGE | |
| HP ZBook Power 15 G8 313S5EA | |
| Moyenne NVIDIA T600 Laptop GPU (n=1) | |
| 1920x1080 High / On AA:FX AF:16x | |
| Lenovo ThinkPad P15v G2 21A9000XGE | |
| HP ZBook Power 15 G8 313S5EA | |
| Moyenne NVIDIA T600 Laptop GPU (n=1) | |
| 1920x1080 Ultra / On AA:SM AF:16x | |
| Lenovo ThinkPad P15v G2 21A9000XGE | |
| HP ZBook Power 15 G8 313S5EA | |
| Moyenne NVIDIA T600 Laptop GPU (n=1) | |
| Farming Simulator 22 | |
| 1920x1080 Medium Preset | |
| Lenovo ThinkPad P15v G2 21A9000XGE | |
| HP ZBook Power 15 G8 313S5EA | |
| Moyenne NVIDIA T600 Laptop GPU (n=1) | |
| 1920x1080 High Preset | |
| Lenovo ThinkPad P15v G2 21A9000XGE | |
| HP ZBook Power 15 G8 313S5EA | |
| Moyenne NVIDIA T600 Laptop GPU (n=1) | |
| 1920x1080 Very High Preset | |
| Lenovo ThinkPad P15v G2 21A9000XGE | |
| HP ZBook Power 15 G8 313S5EA | |
| Moyenne NVIDIA T600 Laptop GPU (n=1) | |
| Ghostwire Tokyo | |
| 1920x1080 Medium Settings | |
| Lenovo ThinkPad P15v G2 21A9000XGE | |
| HP ZBook Power 15 G8 313S5EA | |
| Moyenne NVIDIA T600 Laptop GPU (n=1) | |
| 1920x1080 High Settings | |
| Lenovo ThinkPad P15v G2 21A9000XGE | |
| HP ZBook Power 15 G8 313S5EA | |
| Moyenne NVIDIA T600 Laptop GPU (n=1) | |
| 1920x1080 Highest Settings | |
| HP ZBook Power 15 G8 313S5EA | |
| Moyenne NVIDIA T600 Laptop GPU (n=1) | |
| Lenovo ThinkPad P15v G2 21A9000XGE | |
| Riders Republic | |
| 1920x1080 Medium Preset | |
| HP ZBook Power 15 G8 313S5EA | |
| Moyenne NVIDIA T600 Laptop GPU (n=1) | |
| Lenovo ThinkPad P15v G2 21A9000XGE | |
| 1920x1080 High Preset | |
| Lenovo ThinkPad P15v G2 21A9000XGE | |
| HP ZBook Power 15 G8 313S5EA | |
| Moyenne NVIDIA T600 Laptop GPU (n=1) | |
| 1920x1080 Ultra Preset | |
| Lenovo ThinkPad P15v G2 21A9000XGE | |
| HP ZBook Power 15 G8 313S5EA | |
| Moyenne NVIDIA T600 Laptop GPU (n=1) | |
| Dying Light 2 | |
| 1920x1080 Low Quality | |
| Lenovo ThinkPad P15v G2 21A9000XGE | |
| HP ZBook Power 15 G8 313S5EA | |
| Moyenne NVIDIA T600 Laptop GPU (n=1) | |
| 1920x1080 Medium Quality | |
| Lenovo ThinkPad P15v G2 21A9000XGE | |
| HP ZBook Power 15 G8 313S5EA | |
| Moyenne NVIDIA T600 Laptop GPU (n=1) | |
| 1920x1080 High Quality | |
| Lenovo ThinkPad P15v G2 21A9000XGE | |
| HP ZBook Power 15 G8 313S5EA | |
| Moyenne NVIDIA T600 Laptop GPU (n=1) | |
| Tiny Tina's Wonderlands | |
| 1920x1080 Medium Preset (DX12) | |
| Moyenne de la classe Workstation (115.1 - 233, n=5, 2 dernières années) | |
| HP ZBook Power 15 G8 313S5EA | |
| Moyenne NVIDIA T600 Laptop GPU (n=1) | |
| 1920x1080 High Preset (DX12) | |
| Moyenne de la classe Workstation (80 - 171.4, n=5, 2 dernières années) | |
| HP ZBook Power 15 G8 313S5EA | |
| Moyenne NVIDIA T600 Laptop GPU (n=1) | |
| 1920x1080 Badass Preset (DX12) | |
| Moyenne de la classe Workstation (64.4 - 137.1, n=5, 2 dernières années) | |
| HP ZBook Power 15 G8 313S5EA | |
| Moyenne NVIDIA T600 Laptop GPU (n=1) | |
| Deathloop | |
| 1920x1080 Medium Preset | |
| HP ZBook Power 15 G8 313S5EA | |
| Moyenne NVIDIA T600 Laptop GPU (n=1) | |
| 1920x1080 High Preset | |
| HP ZBook Power 15 G8 313S5EA | |
| Moyenne NVIDIA T600 Laptop GPU (n=1) | |
| 1920x1080 Ultra Preset | |
| HP ZBook Power 15 G8 313S5EA | |
| Moyenne NVIDIA T600 Laptop GPU (n=1) | |
| Immortals Fenyx Rising | |
| 1920x1080 Medium Preset | |
| HP ZBook Fury 15 G8 | |
| HP ZBook Power 15 G8 313S5EA | |
| Moyenne NVIDIA T600 Laptop GPU (n=1) | |
| 1920x1080 High Preset | |
| HP ZBook Fury 15 G8 | |
| HP ZBook Power 15 G8 313S5EA | |
| Moyenne NVIDIA T600 Laptop GPU (n=1) | |
| 1920x1080 Very High Preset | |
| HP ZBook Fury 15 G8 | |
| HP ZBook Power 15 G8 313S5EA | |
| Moyenne NVIDIA T600 Laptop GPU (n=1) | |
| Bas | Moyen | Élevé | Ultra | |
|---|---|---|---|---|
| GTA V (2015) | 142.6 | 137.6 | 82.3 | 44.1 |
| The Witcher 3 (2015) | 158.6 | 92.7 | 52.2 | 27.6 |
| Dota 2 Reborn (2015) | 149.4 | 127.6 | 115.8 | 107.1 |
| Final Fantasy XV Benchmark (2018) | 86 | 43.9 | 31 | |
| X-Plane 11.11 (2018) | 107.9 | 92.4 | 77 | |
| Far Cry 5 (2018) | 105 | 53 | 49 | 45 |
| Strange Brigade (2018) | 190.4 | 76.2 | 60.7 | 52.7 |
| Shadow of the Tomb Raider (2018) | 98 | 53 | 42 | 36 |
| Mafia Definitive Edition (2020) | 83.6 | 40.4 | 34.9 | |
| Immortals Fenyx Rising (2020) | 72 | 45 | 36 | 31 |
| Resident Evil Village (2021) | 113.6 | 58.6 | 52.1 | 44 |
| Deathloop (2021) | 68.9 | 34.4 | 28.4 | 25.2 |
| Riders Republic (2021) | 91 | 52 | 39 | 30 |
| Farming Simulator 22 (2021) | 175.4 | 87.5 | 63.5 | 53.9 |
| Dying Light 2 (2022) | 31.7 | 23 | 18.3 | |
| GRID Legends (2022) | 104.1 | 71 | 57.7 | 41.9 |
| Elden Ring (2022) | 52.4 | 45 | 39 | 29.9 |
| Elex 2 (2022) | 38.5 | 35.7 | 30.5 | 26.9 |
| Ghostwire Tokyo (2022) | 45.7 | 44.3 | 43.9 | 41.8 |
| Tiny Tina's Wonderlands (2022) | 57.5 | 32.8 | 48.3 | 27.2 |
| Vampire Bloodhunt (2022) | 119 | 64.5 | 61.8 | 60.1 |
Émissions : La station de travail ZBook fonctionne parfois silencieusement
Émissions sonores
Le testeur ne dispose que des mesures effectuées avec l'ancien BIOS, qui permettait encore une vitesse de ventilateur nettement supérieure et se traduisait par un niveau sonore allant jusqu'à 51db(A) dans le scénario de charge. Cependant, avec le BIOS v1.09, l'IA de HP ne permet qu'une vitesse maximale du ventilateur d'environ 4300 upm, ce qui pourrait être un avantage dans les environnements professionnels sensibles, cependant.
Avec ses deux ventilateurs et ses trois caloducs, le refroidissement devrait être capable de dissiper plus de chaleur que celui du ThinkPad P15v G2 dont les 75 watts sont refroidis avec succès par son seul ventilateur. Cependant, avec la limitation de l'IA, les ventilateurs du HP ZBook refroidissent un maximum de 65 à 80 watts en charge combinée (CPU + GPU). Les évents du ventilateur sont situés en bas, entre l'écran et le boîtier, aspirant l'air par le bas du boîtier, ce qui rend son utilisation sur vos genoux moins qu'optimale.
Pendant la navigation régulière sur Internet, les ventilateurs restent silencieux, mais si vous avez l'habitude de travailler plus rapidement sur le net, ils se mettent en marche constamment et assez bruyamment. Au moins, il n'y a pas de gémissement de la bobine. Avec des composants de puissance similaire, le ThinkPad P15v G2 de Lenovo est plus discret dans tous les scénarios, et le ZBook Fury de HP fonctionne également plus silencieusement. Precision En revanche, les ventilateurs du 3551 de Dell aiment beaucoup souffler.
Degré de la nuisance sonore
| Au repos |
| 25.54 / 25.54 / 25.54 dB(A) |
| Fortement sollicité |
| 48.85 / 50.98 dB(A) |
 | ||
30 dB silencieux 40 dB(A) audible 50 dB(A) bruyant |
||
min: | ||
| HP ZBook Power 15 G8 313S5EA T600 Laptop GPU, i7-11800H, Samsung PM9A1 MZVL2512HCJQ | HP ZBook Fury 15 G8 RTX A5000 Laptop GPU, i9-11950H, Samsung PM981a MZVLB1T0HBLR | HP ZBook Studio 15 G8 GeForce RTX 3070 Laptop GPU, i9-11950H, Samsung PM981a MZVLB2T0HALB | HP ZBook Firefly 15 G8 2C9R7EA T500 Laptop GPU, i7-1165G7, Toshiba XG6 KXG60ZNV1T02 | Lenovo ThinkPad P15v G2 21A9000XGE T1200 Laptop GPU, i7-11800H, Toshiba XG6 KXG6AZNV512G | Dell Precision 3000 3551 Quadro P620, i9-10885H, Toshiba Kioxia XG6 KXG60PNV512G | |
|---|---|---|---|---|---|---|
| Noise | 9% | 3% | 14% | 9% | -1% | |
| arrêt / environnement * (dB) | 25.54 | 24.1 6% | 23.5 8% | 24.1 6% | 25.21 1% | 25.8 -1% |
| Idle Minimum * (dB) | 25.54 | 24.1 6% | 25.3 1% | 24.1 6% | 25.21 1% | 26.2 -3% |
| Idle Average * (dB) | 25.54 | 24.1 6% | 25.3 1% | 24.1 6% | 25.21 1% | 26.2 -3% |
| Idle Maximum * (dB) | 25.54 | 24.8 3% | 25.3 1% | 27.1 -6% | 25.21 1% | 26.2 -3% |
| Load Average * (dB) | 48.85 | 37.8 23% | 41.2 16% | 32.8 33% | 39.09 20% | 51.2 -5% |
| Witcher 3 ultra * (dB) | 46.58 | 44.2 5% | 49.4 -6% | 36.1 22% | 36.6 21% | 42.7 8% |
| Load Maximum * (dB) | 50.98 | 44.2 13% | 49.4 3% | 36.1 29% | 43.53 15% | 50.7 1% |
* ... Moindre est la valeur, meilleures sont les performances
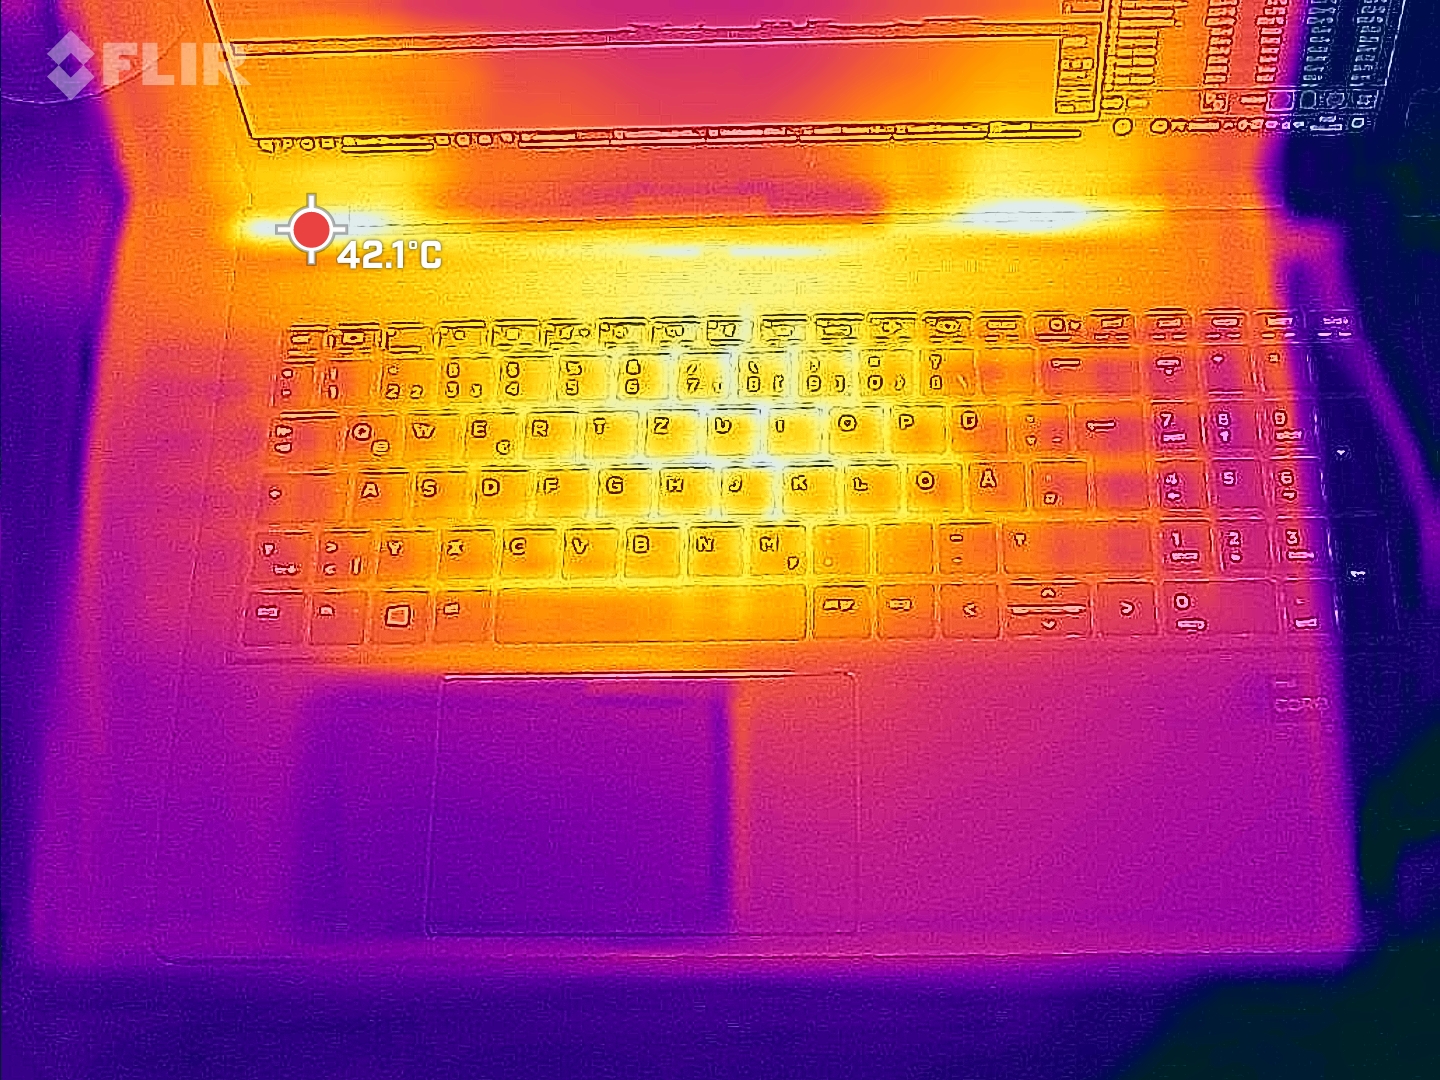
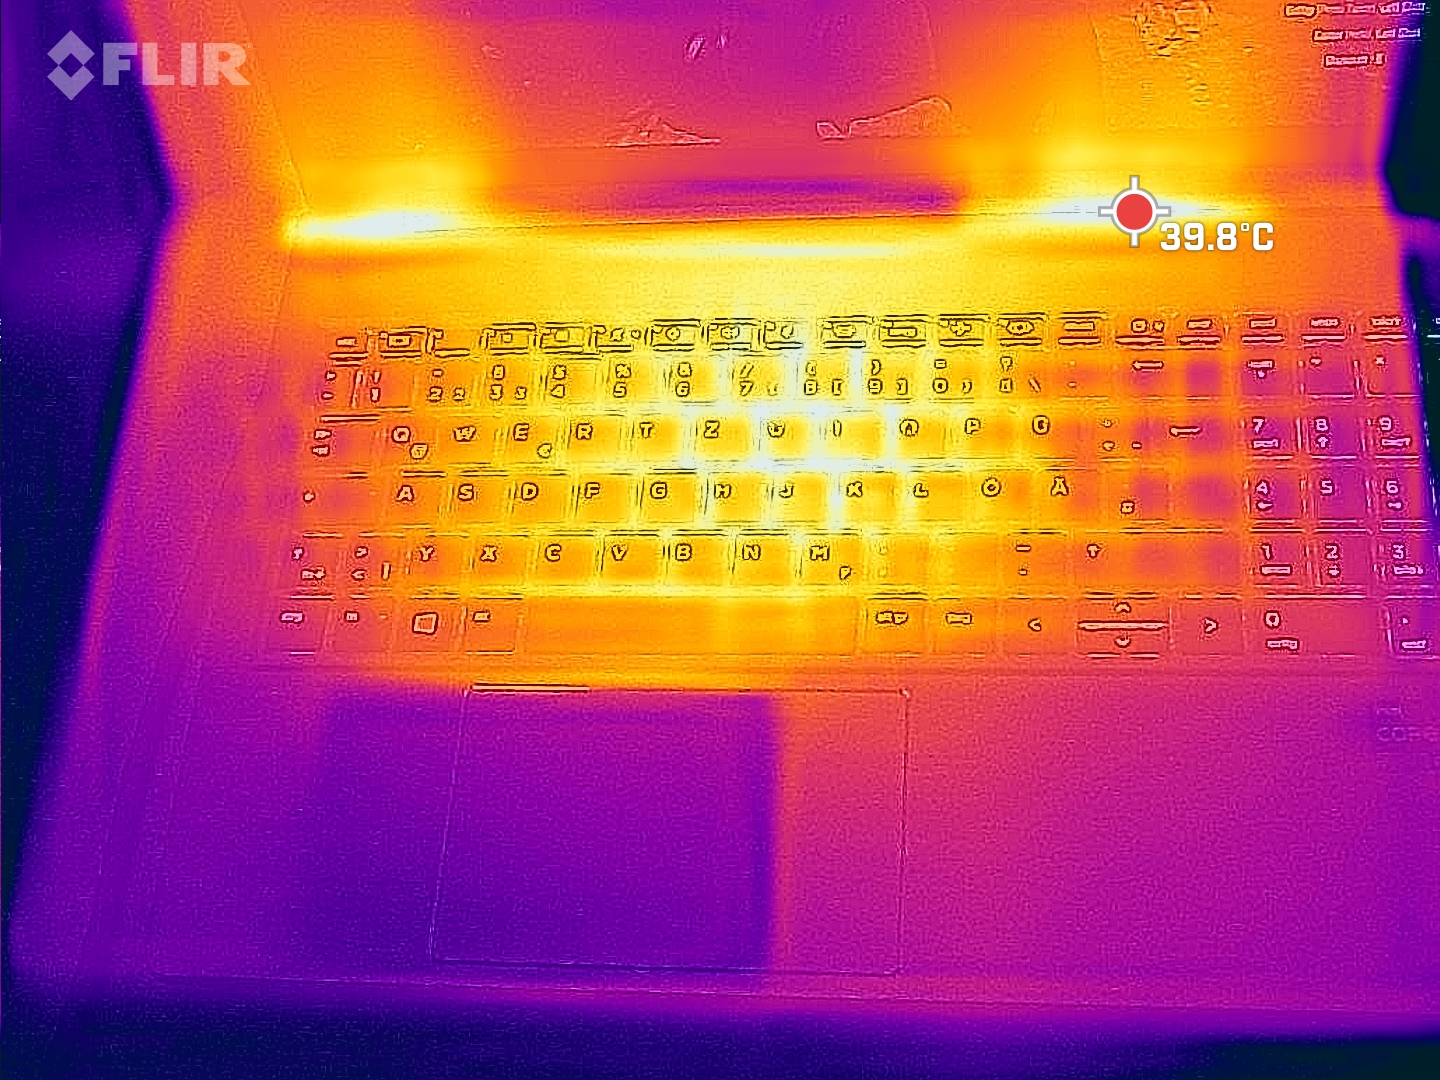
Températures
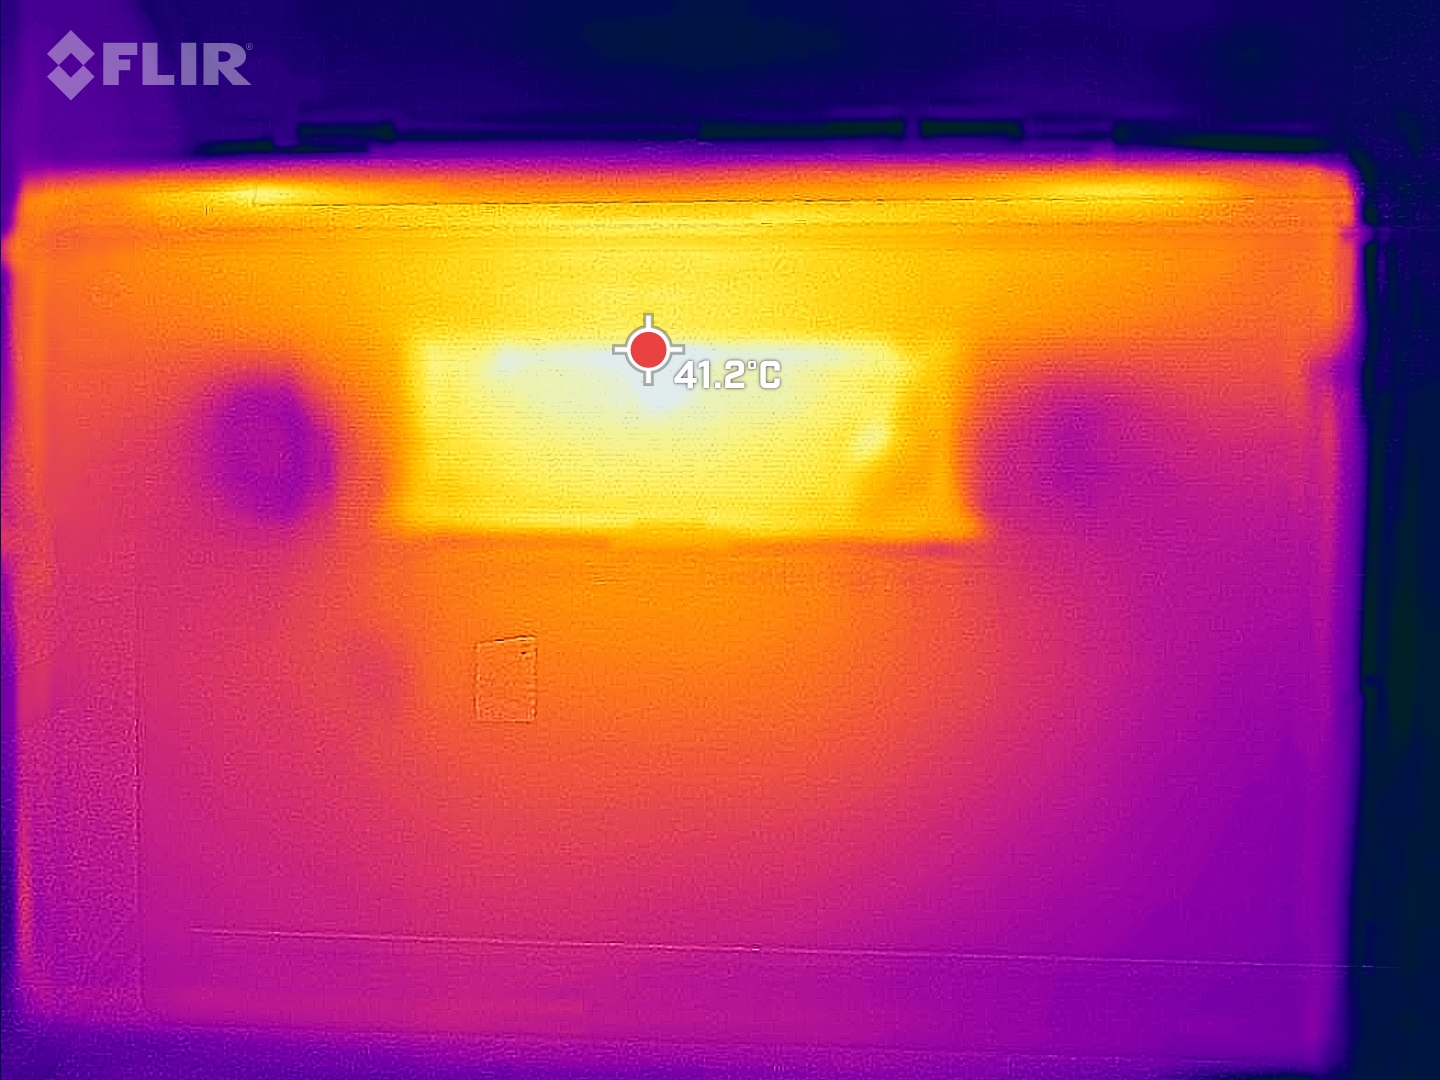
Les seuls endroits plus chauds se trouvent au centre, au-dessus du clavier, ainsi qu'à l'endroit correspondant au fond du boîtier, et ce uniquement pendant le test de stress. Cependant, comme les ventilateurs n'accélèrent pas autant, ces points chauds sont perceptibles même pendant le jeu ou le rendu, et même au centre du clavier. Mais ils ne deviennent jamais excessivement chauds.
(±) La température maximale du côté supérieur est de 41.4 °C / 107 F, par rapport à la moyenne de 38.2 °C / 101 F, allant de 22.2 à 69.8 °C pour la classe Workstation.
(±) Le fond chauffe jusqu'à un maximum de 41.5 °C / 107 F, contre une moyenne de 41.1 °C / 106 F
(+) En utilisation inactive, la température moyenne du côté supérieur est de 22.9 °C / 73 F, par rapport à la moyenne du dispositif de 32 °C / 90 F.
(+) En jouant à The Witcher 3, la température moyenne du côté supérieur est de 30.4 °C / 87 F, alors que la moyenne de l'appareil est de 32 °C / 90 F.
(+) Les repose-poignets et le pavé tactile sont plus froids que la température de la peau avec un maximum de 28.4 °C / 83.1 F et sont donc froids au toucher.
(±) La température moyenne de la zone de l'appui-paume de dispositifs similaires était de 27.8 °C / 82 F (-0.6 °C / #-1.1 F).

| HP ZBook Power 15 G8 313S5EA Intel Core i7-11800H, NVIDIA T600 Laptop GPU | HP ZBook Fury 15 G8 Intel Core i9-11950H, NVIDIA RTX A5000 Laptop GPU | HP ZBook Studio 15 G8 Intel Core i9-11950H, NVIDIA GeForce RTX 3070 Laptop GPU | HP ZBook Firefly 15 G8 2C9R7EA Intel Core i7-1165G7, NVIDIA T500 Laptop GPU | Lenovo ThinkPad P15v G2 21A9000XGE Intel Core i7-11800H, NVIDIA T1200 Laptop GPU | Dell Precision 3000 3551 Intel Core i9-10885H, NVIDIA Quadro P620 | |
|---|---|---|---|---|---|---|
| Heat | -18% | -20% | -3% | -21% | -20% | |
| Maximum Upper Side * (°C) | 41.4 | 45.6 -10% | 49 -18% | 41.2 -0% | 53.8 -30% | 47 -14% |
| Maximum Bottom * (°C) | 41.5 | 57.6 -39% | 54.2 -31% | 47.2 -14% | 52.1 -26% | 54.6 -32% |
| Idle Upper Side * (°C) | 23.8 | 26 -9% | 26.2 -10% | 23.7 -0% | 27.6 -16% | 27.8 -17% |
| Idle Bottom * (°C) | 25 | 28.8 -15% | 30.2 -21% | 23.9 4% | 27.7 -11% | 29.2 -17% |
* ... Moindre est la valeur, meilleures sont les performances
Test de stress
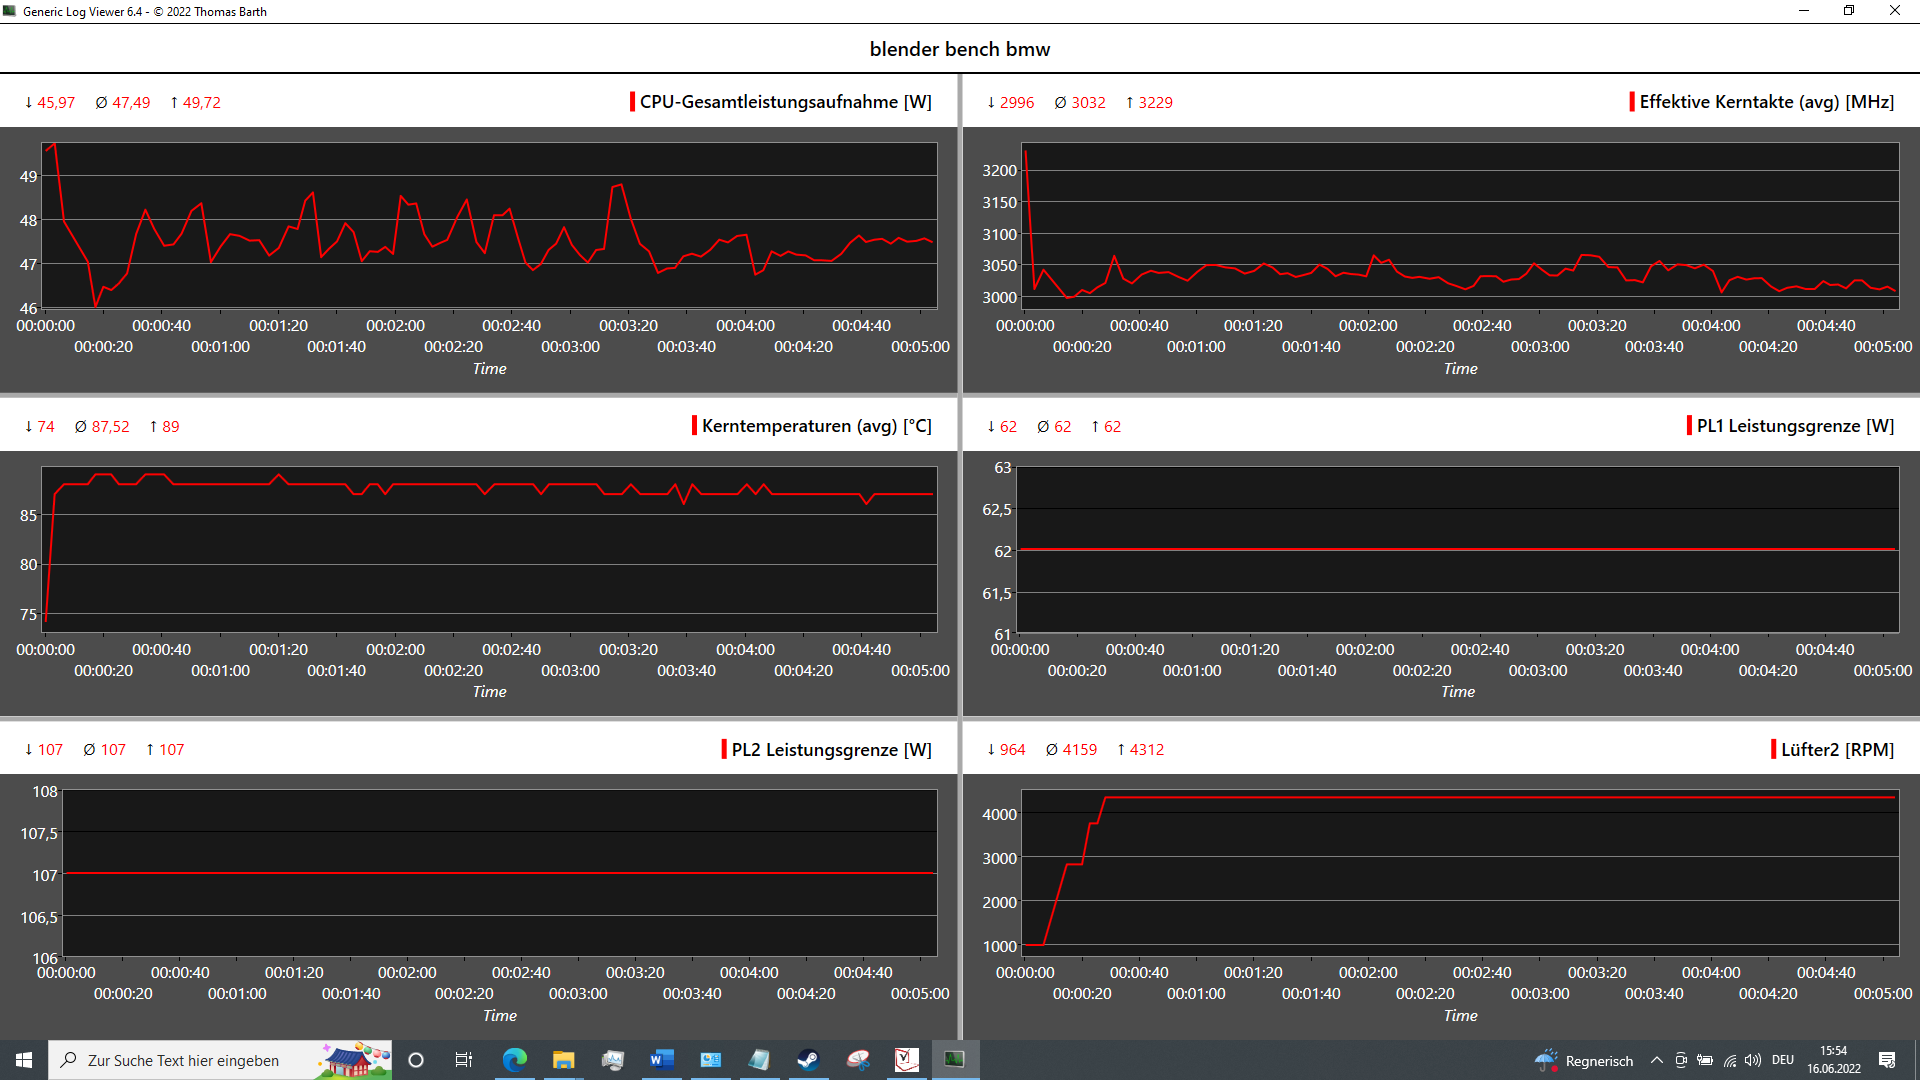
Le processeur ne peut bénéficier de la mise à jour du BIOS que pendant le test de stress. Dans le stress combiné (Prime95 + FurMark), le CPU tourne toujours à sa vitesse d'horloge de base (2,3 GHz), alors qu'il ne tournait qu'à 1,7 GHz auparavant. En revanche, à 1080 MHz, la vitesse d'horloge du GPU chute de 150 MHz. Dans le stress pur du CPU, 2,65 GHz sont maintenus à une consommation de 50 watts et à une température de 92 °C (198 °F)
En charge graphique pure, le GPU tourne à ~1100 MHz, ce qui est nettement inférieur à sa vitesse de boost de 1395 MHz. Cependant, la température reste à seulement 56 °C (133 °F), et nous soupçonnons une autre incohérence de l'IA.
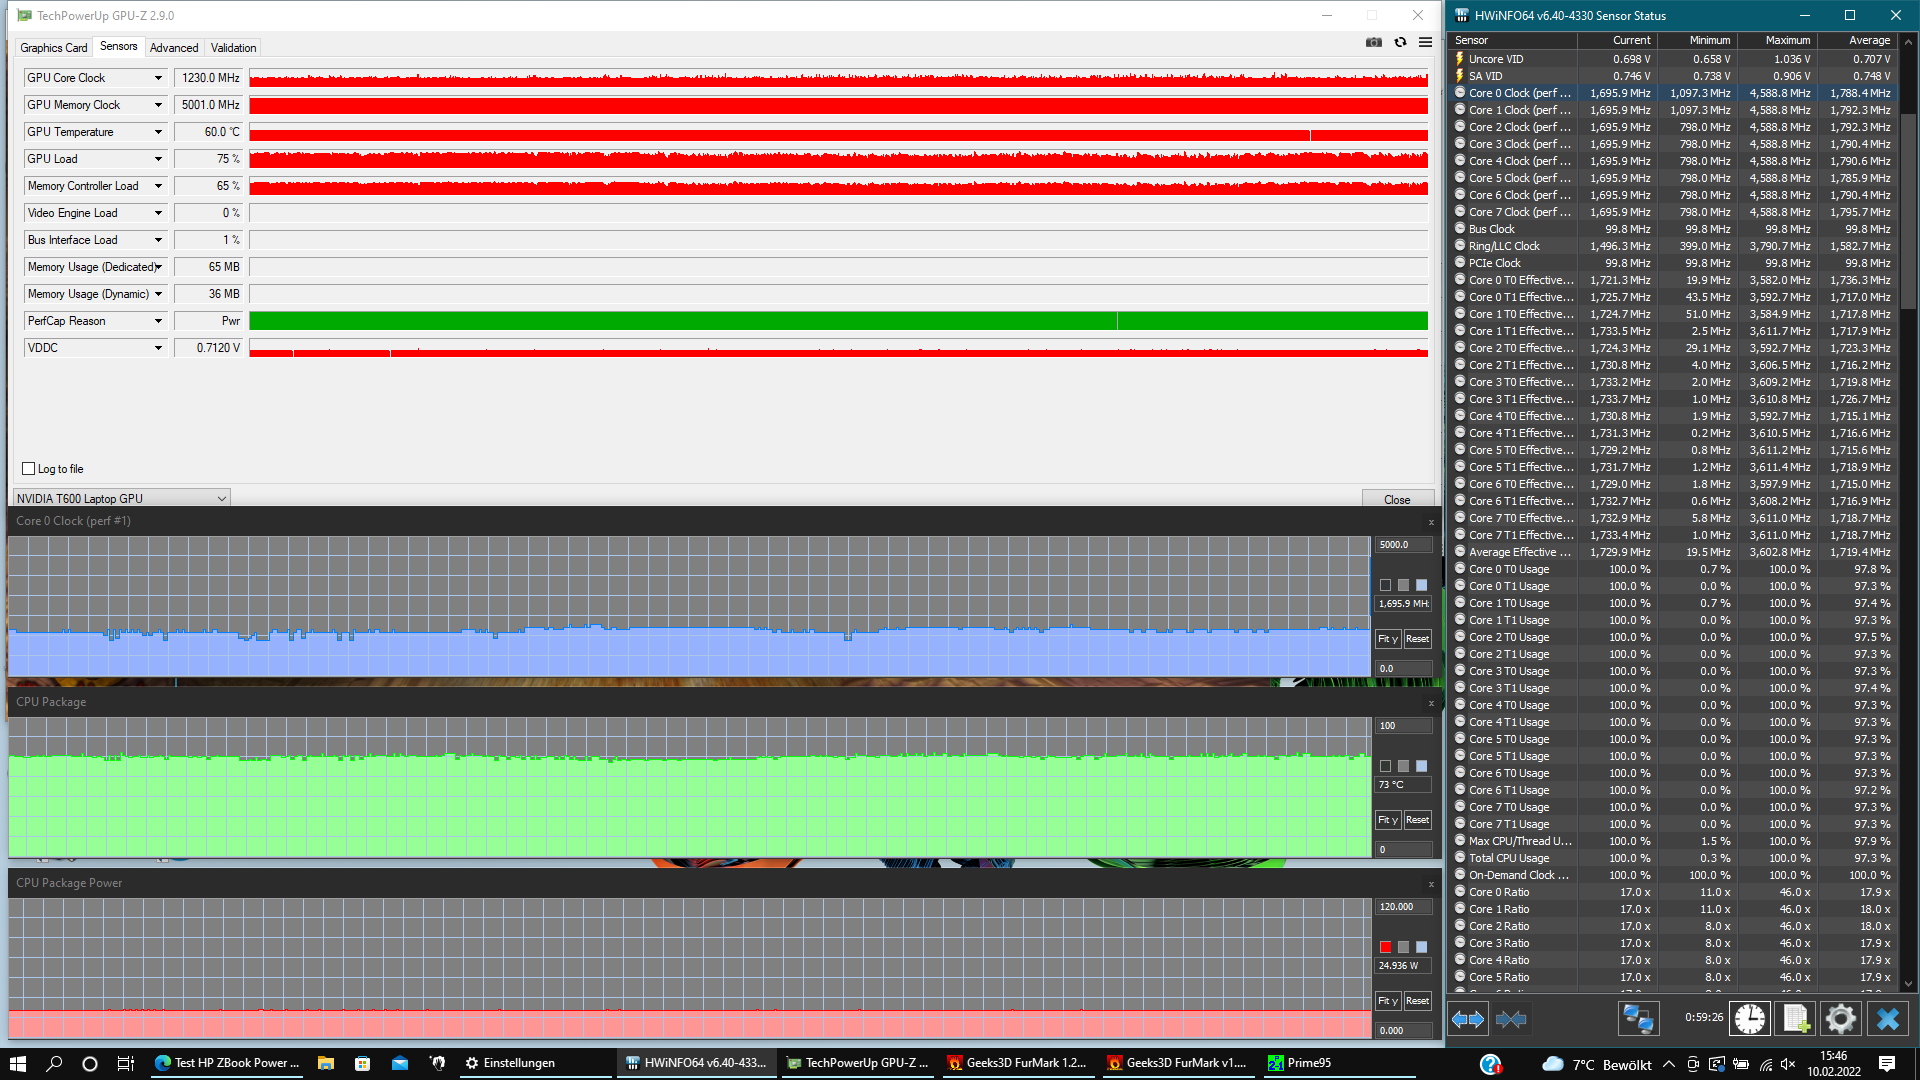
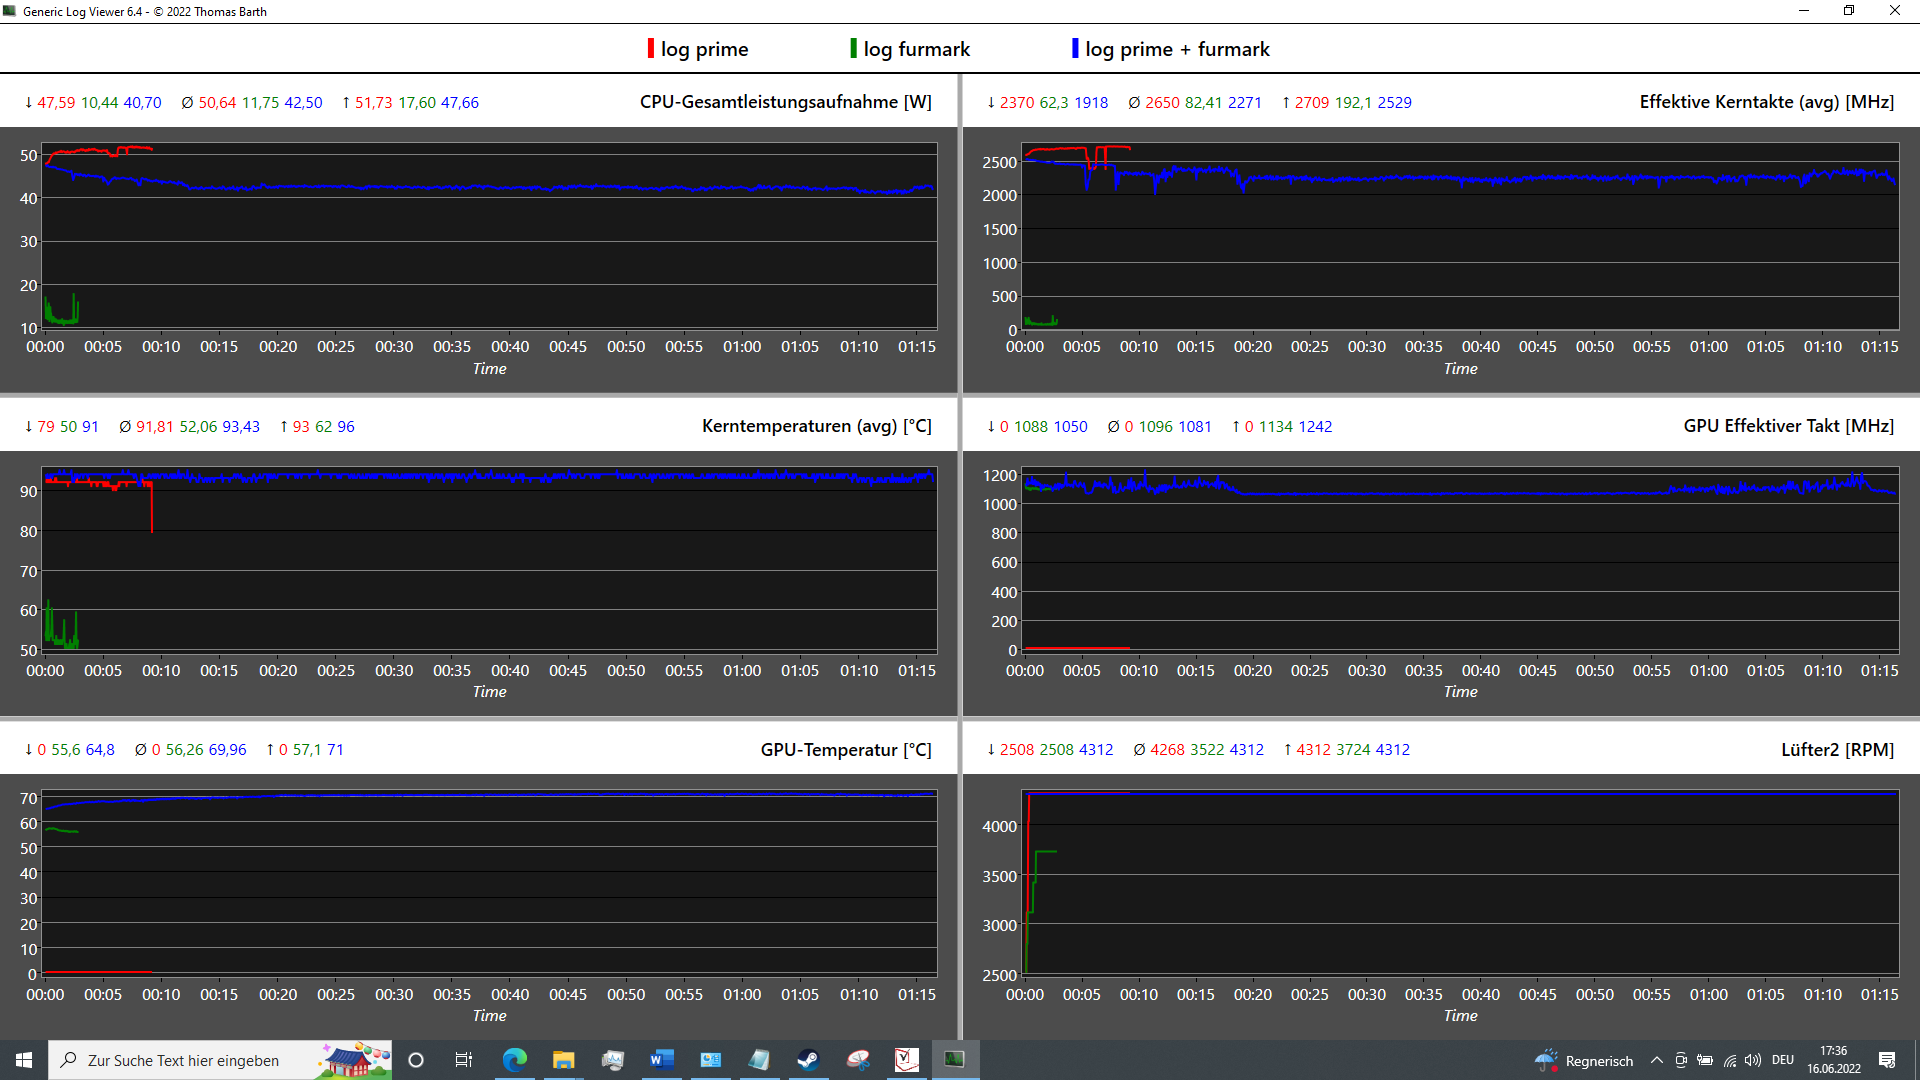
| Fréquence CPU (GHz) | Fréquence GPU (MHz) | Température CPU moyenne (°C) | Température GPU moyenne (°C) | |
| Système au repos | 1,3 | 350 | 35 | 35 |
| Prime95 Stress | 2.65 | 350 | 91.8 | -- |
| Prime95 + FurMark Stress | 2.27 | 1081 | 93.4 | 56 |
| FurMark Stress | 1.3 | 1100 | 52 | 70 |
Haut-parleurs
Le son des haut-parleurs stéréo de 2 watts orientés vers le haut est assez équilibré, mais ils manquent de basses et ne sont pas particulièrement forts non plus. Le HP Fury 15 dispose d'un système sonore nettement plus attrayant.
S'il peut être suffisant pour les tâches de bureau, pour profiter du multimédia, nous recommandons d'utiliser la connexion 3,5 mm ou Bluetooth pour les périphériques audio externes
HP ZBook Power 15 G8 313S5EA analyse audio
(±) | le niveau sonore du haut-parleur est moyen mais bon (72.3# dB)
Basses 100 - 315 Hz
(-) | presque aucune basse - en moyenne 23.3% plus bas que la médiane
(±) | la linéarité des basses est moyenne (11.8% delta à la fréquence précédente)
Médiums 400 - 2000 Hz
(+) | médiane équilibrée - seulement 2.5% de la médiane
(+) | les médiums sont linéaires (5.1% delta à la fréquence précédente)
Aiguës 2 - 16 kHz
(+) | des sommets équilibrés - à seulement 4.1% de la médiane
(+) | les aigus sont linéaires (3.1% delta à la fréquence précédente)
Globalement 100 - 16 000 Hz
(±) | la linéarité du son global est moyenne (21.4% de différence avec la médiane)
Par rapport à la même classe
» 77% de tous les appareils testés de cette catégorie étaient meilleurs, 6% similaires, 18% pires
» Le meilleur avait un delta de 7%, la moyenne était de 17%, le pire était de 35%.
Par rapport à tous les appareils testés
» 60% de tous les appareils testés étaient meilleurs, 7% similaires, 33% pires
» Le meilleur avait un delta de 4%, la moyenne était de 23%, le pire était de 134%.
Lenovo ThinkPad P15v G2 21A9000XGE analyse audio
(-) | haut-parleurs pas très forts (70.7 dB)
Basses 100 - 315 Hz
(±) | basse réduite - en moyenne 13.4% inférieure à la médiane
(±) | la linéarité des basses est moyenne (13.6% delta à la fréquence précédente)
Médiums 400 - 2000 Hz
(+) | médiane équilibrée - seulement 4.7% de la médiane
(+) | les médiums sont linéaires (6.2% delta à la fréquence précédente)
Aiguës 2 - 16 kHz
(+) | des sommets équilibrés - à seulement 3.2% de la médiane
(+) | les aigus sont linéaires (5.7% delta à la fréquence précédente)
Globalement 100 - 16 000 Hz
(±) | la linéarité du son global est moyenne (21.2% de différence avec la médiane)
Par rapport à la même classe
» 76% de tous les appareils testés de cette catégorie étaient meilleurs, 6% similaires, 18% pires
» Le meilleur avait un delta de 7%, la moyenne était de 17%, le pire était de 35%.
Par rapport à tous les appareils testés
» 59% de tous les appareils testés étaient meilleurs, 7% similaires, 34% pires
» Le meilleur avait un delta de 4%, la moyenne était de 23%, le pire était de 134%.
Gestion de l'énergie : Le ZBook Power est aussi efficace qu'un ultrabook
Consommation d'énergie
À une moyenne de 6,32 watts, les valeurs de ralenti du ZBook Power 15 sont aussi bonnes que celles des systèmes avec un CPU de 15 watts. LeZBook Furyet ZBook Powerconsomment presque trois fois plus. En veille, le ZBook Power ne consomme que 0,95 watts, de sorte que vous n'aurez pas à le recharger pendant près de quatre jours lorsqu'il est replié. Le bloc d'alimentation de 150 watts est également capable de gérer sans problème les pics de charge de 110 watts et de recharger le ZBook jusqu'à 80 % en 1,5 heure environ.
| Éteint/en veille | |
| Au repos | |
| Fortement sollicité |
|
Légende:
min: | |
| HP ZBook Power 15 G8 313S5EA i7-11800H, T600 Laptop GPU, Samsung PM9A1 MZVL2512HCJQ, IPS LED, 1920x1080, 15.6" | HP ZBook Fury 15 G8 i9-11950H, RTX A5000 Laptop GPU, Samsung PM981a MZVLB1T0HBLR, IPS, 3840x2160, 15.6" | HP ZBook Studio 15 G8 i9-11950H, GeForce RTX 3070 Laptop GPU, Samsung PM981a MZVLB2T0HALB, OLED, 3840x2160, 15.6" | HP ZBook Firefly 15 G8 2C9R7EA i7-1165G7, T500 Laptop GPU, Toshiba XG6 KXG60ZNV1T02, IPS, 1920x1080, 15.6" | Lenovo ThinkPad P15v G2 21A9000XGE i7-11800H, T1200 Laptop GPU, Toshiba XG6 KXG6AZNV512G, IPS LED, 1920x1080, 15.6" | Dell Precision 3000 3551 i9-10885H, Quadro P620, Toshiba Kioxia XG6 KXG60PNV512G, IPS, 1920x1080, 15.6" | Moyenne NVIDIA T600 Laptop GPU | Moyenne de la classe Workstation | |
|---|---|---|---|---|---|---|---|---|
| Power Consumption | -130% | -155% | 14% | -33% | -23% | 0% | -94% | |
| Idle Minimum * (Watt) | 4.17 | 8.3 -99% | 11 -164% | 3.3 21% | 5.96 -43% | 5.7 -37% | 4.17 ? -0% | 9.11 ? -118% |
| Idle Average * (Watt) | 6.32 | 19.9 -215% | 18.8 -197% | 5.6 11% | 8.37 -32% | 8.7 -38% | 6.32 ? -0% | 13.8 ? -118% |
| Idle Maximum * (Watt) | 7.1 | 21.8 -207% | 31.7 -346% | 8.7 -23% | 9.05 -27% | 9 -27% | 7.1 ? -0% | 17.9 ? -152% |
| Load Average * (Watt) | 80.41 | 110.9 -38% | 105.2 -31% | 64.4 20% | 91.82 -14% | 100.2 -25% | 80.4 ? -0% | 96 ? -19% |
| Witcher 3 ultra * (Watt) | 62.3 | 165 -165% | 148 -138% | 53 15% | 102 -64% | 56 10% | ||
| Load Maximum * (Watt) | 110.18 | 171.8 -56% | 171.8 -56% | 69 37% | 126.38 -15% | 133.2 -21% | 110.2 ? -0% | 180.3 ? -64% |
* ... Moindre est la valeur, meilleures sont les performances
Power Consumption The Witcher 3 / Stress Test
Power Consumption With External Monitor
Autonomie de la batterie
En surfant sur le web à 150 nits, le ZBook dure étonnamment 12:19 heures. Le ThinkPad P15v reste nettement à la traîne avec seulement ~7,5 heures Precision 3551 de Dellest capable de franchir la barre des 13 heures. Avec plus de 2 heures sous charge, le ZBook dure assez longtemps, ce qui est également dû en partie à son étranglement.
| HP ZBook Power 15 G8 313S5EA i7-11800H, T600 Laptop GPU, 83 Wh | HP ZBook Fury 15 G8 i9-11950H, RTX A5000 Laptop GPU, 94 Wh | HP ZBook Studio 15 G8 i9-11950H, GeForce RTX 3070 Laptop GPU, 83 Wh | HP ZBook Firefly 15 G8 2C9R7EA i7-1165G7, T500 Laptop GPU, 56 Wh | Lenovo ThinkPad P15v G2 21A9000XGE i7-11800H, T1200 Laptop GPU, 68 Wh | Dell Precision 3000 3551 i9-10885H, Quadro P620, 97 Wh | Moyenne de la classe Workstation | |
|---|---|---|---|---|---|---|---|
| Autonomie de la batterie | -50% | -26% | 15% | -26% | 11% | 4% | |
| Reader / Idle (h) | 14.9 | 12.9 -13% | 17.2 15% | 26.1 ? 75% | |||
| H.264 (h) | 10.1 | 15.3 51% | 8 -21% | 10.1 ? 0% | |||
| WiFi v1.3 (h) | 12.3 | 6.2 -50% | 6.2 -50% | 10.5 -15% | 7.5 -39% | 13.6 11% | 8.55 ? -30% |
| Load (h) | 2.1 | 1.8 -14% | 2.3 10% | 0.9 -57% | 1.441 ? -31% |
Points positifs
Points négatifs
Verdict : Un ZBook Power 15 abordable pour les créateurs professionnels
À un prix d'environ 1300 euros (~$1324), le ZBook Power 15 G8 (Core i7, Nvidia T600, 8 GB / 256 GB) offre quelques avantages clairs en termes de prix et de performances, tout en conservant de nombreuses caractéristiques d'une station de travail haut de gamme. Les points forts du ZBook sont les périphériques d'entrée, l'autonomie de la batterie, les fonctions de sécurité, la possibilité de mise à niveau, ainsi qu'une bonne performance de station de travail.
Si l'écran FHD que nous avons testé n'est pas totalement adapté à la conception de produits et à Adobe, il offre néanmoins de bonnes valeurs de luminosité et de contraste. Le groupe cible de cette configuration se compose principalement d'étudiants et de professionnels dans le domaine d'Autodesk SolidWorks, du développement de produits, de l'architecture, de la construction, de l'ingénierie, de la conception 2D et de la création de réalité virtuelle.
Parmi les inconvénients, citons l'évolution irrégulière des performances, mais nous ne sommes pas en mesure de confirmer si cela est dû à l'IA propre à HP. En outre, cette station de travail abordable doit se passer de processeurs Xeon et de mémoire vive ECC. Elle est également dépourvue de WWAN et de lecteur de carte SD et ne propose qu'un seul port Thunderbolt 4. Et enfin, la reproduction sonore et la webcam sont assez abyssales.
" Le HP ZBook Power 15 G8 est une station de travail solide pour les étudiants, les ingénieurs et les (semi-)professionnels sans exigences haut de gamme. Malheureusement, la dalle 4K en option n'élargit pas du tout le groupe cible aux tâches créatives, où une grande précision des couleurs est nécessaire. Sinon, tous les autres aspects essentiels sont à un niveau élevé."
Le siteThinkPad P15v G2offre des performances et des périphériques d'entrée similaires, également à un bon prix. Cependant, il fonctionne de manière nettement plus silencieuse et offre un lecteur de carte SD et peut-être l'option d'affichage 4K plus précise en termes de couleurs. En revanche, le ThinkPad ne prend pas en charge la recharge via USB-C et l'autonomie de la batterie est nettement inférieure. En outre, il est plus lourd et plus encombrant L'ordinateur Dell Precision 3551 est également un champion de l'endurance qui n'est pas beaucoup moins bon que le ZBook Power, sauf en termes de performances brutes, pour autant que vous l'équipiez du bon écran. Toutefois, son successeur devrait offrir des performances supérieures.
Prix et disponibilité
Une configuration de la station de travail mobile HP ZBook Power G8 avec un Core i7-11850H, 32 GB de RAM et 512 GB SSD est actuellement disponible pour ~$2400 sur Amazon. La boutique en ligne HP https://www.hp.com/us-en/workstations/zbook-power-g8.html propose également de nombreuses options configurables.
HP ZBook Power 15 G8 313S5EA
- 07/07/2022 v7 (old)
Marvin Gollor
Price comparison

