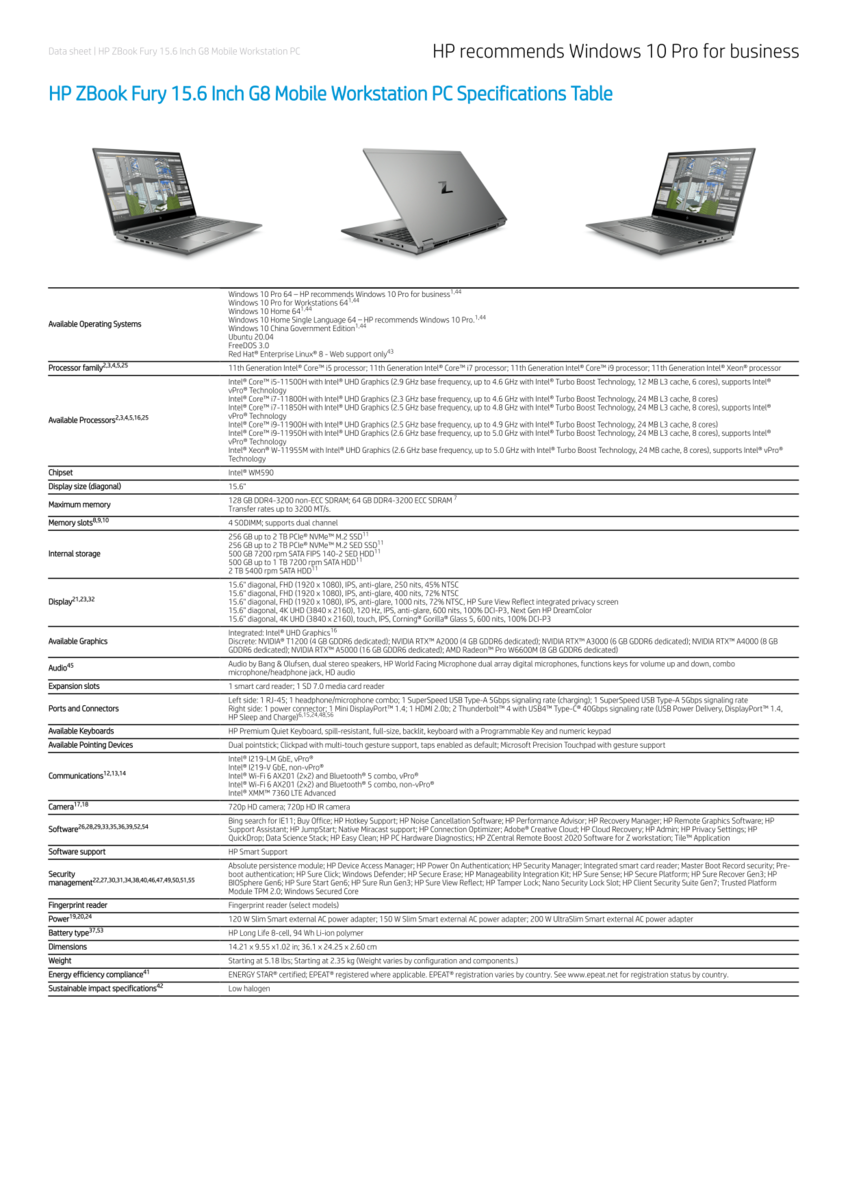
Test du HP ZBook Fury 15 G8 : la Quadro RTX A5000 est un monstre
Alors que le ZBook Fury 15 G7 représentait une refonte massive par rapport au ZBook Fury 15 G6, le dernier ZBook Fury 15 G8 est une mise à jour relativement mineure dans l'ensemble. Le nouveau modèle est équipé de processeurs Tiger Lake-H et de GPU Nvidia Ampere pour remplacer les options Comet Lake-H et Nvidia Turing de l'année dernière. Son écran est également passé de 4K 60 Hz à 4K 120 Hz, ce qui en fait l'un des rares ordinateurs portables de 15 pouces à disposer d'une telle option
Les UGS vont du CPU Core i5-11500H avec graphisme intégré et écran 1080p NTSC à 45 % pour environ 2 000 USD jusqu'au CPU Xeon W-11955M vPro avec graphisme Quadro RTX A5000 et écran tactile brillant 4K UHD 100 % DCI-P3 pour plus de 6 000 USD. Notre unité de test est une configuration haut de gamme avec le Core i9-11950H, le RTX A5000 et l'écran mat 4K120 pour environ 5000 $
Les concurrents dans cet espace comprennent d'autres stations de travail traditionnelles de 15,6 pouces comme le Dell Precision 7550,Lenovo ThinkPad P15 Gen 2et la Série Fujitsu Celsius. Nous vous recommandons de consulter notre revue existante sur le ZBook Fury 15 G7 pour plus d'informations sur le châssis et ses caractéristiques puisque le Fury 15 G8 utilise le même squelette.
Plus de commentaires sur HP
potential competitors in comparison
Note | Date | Modèle | Poids | Épaisseur | Taille | Résolution | Prix |
|---|---|---|---|---|---|---|---|
| 90.3 % v7 (old) | 10/21 | HP ZBook Fury 15 G8 i9-11950H, RTX A5000 Laptop GPU | 2.5 kg | 25.9 mm | 15.60" | 3840x2160 | |
| 90.2 % v7 (old) | 01/21 | HP ZBook Fury 15 G7 W-10885M, Quadro RTX 5000 Max-Q | 2.4 kg | 25.9 mm | 15.60" | 3840x2160 | |
| 88.3 % v7 (old) | 10/21 | Dell Precision 5000 5560 i7-11850H, RTX A2000 Laptop GPU | 2 kg | 18 mm | 15.60" | 3840x2400 | |
| 87.8 % v7 (old) | 08/21 | HP ZBook Studio 15 G8 i9-11950H, GeForce RTX 3070 Laptop GPU | 1.9 kg | 18 mm | 15.60" | 3840x2160 | |
| 85.3 % v7 (old) | 06/21 | Lenovo ThinkPad P15s Gen2-20W6000GGE i7-1165G7, T500 Laptop GPU | 1.9 kg | 19.1 mm | 15.60" | 3840x2160 | |
| 82.7 % v7 (old) | 11/20 | HP ZBook Firefly 15 G7 i7-10610U, Quadro P520 | 1.8 kg | 19.2 mm | 15.60" | 3840x2160 |
Boîtier - Identique au ZBook Fury 15 G7
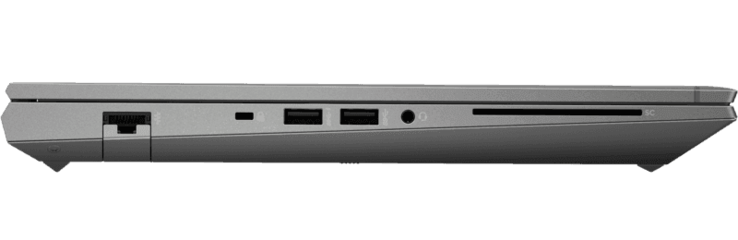
Connectivité
Thunderbolt 4 est pris en charge au lieu de " seulement " Thunderbolt 3 sur le Fury 15 G7. Sinon, les ports restent identiques d'une année sur l'autre.
Lecteur de carte SD
| SD Card Reader | |
| average JPG Copy Test (av. of 3 runs) | |
| Dell Precision 5000 5560 (AV Pro V60) | |
| HP ZBook Fury 15 G7 (Toshiba Exceria Pro SDXC 64 GB UHS-II) | |
| HP ZBook Fury 15 G8 (AV Pro V60) | |
| HP ZBook Studio 15 G8 (AV Pro V60) | |
| Lenovo ThinkPad P15s Gen2-20W6000GGE (AV Pro V60) | |
| maximum AS SSD Seq Read Test (1GB) | |
| HP ZBook Fury 15 G7 (Toshiba Exceria Pro SDXC 64 GB UHS-II) | |
| Dell Precision 5000 5560 (AV Pro V60) | |
| Lenovo ThinkPad P15s Gen2-20W6000GGE (AV Pro V60) | |
| HP ZBook Studio 15 G8 (AV Pro V60) | |
| HP ZBook Fury 15 G8 (AV Pro V60) | |
Communication
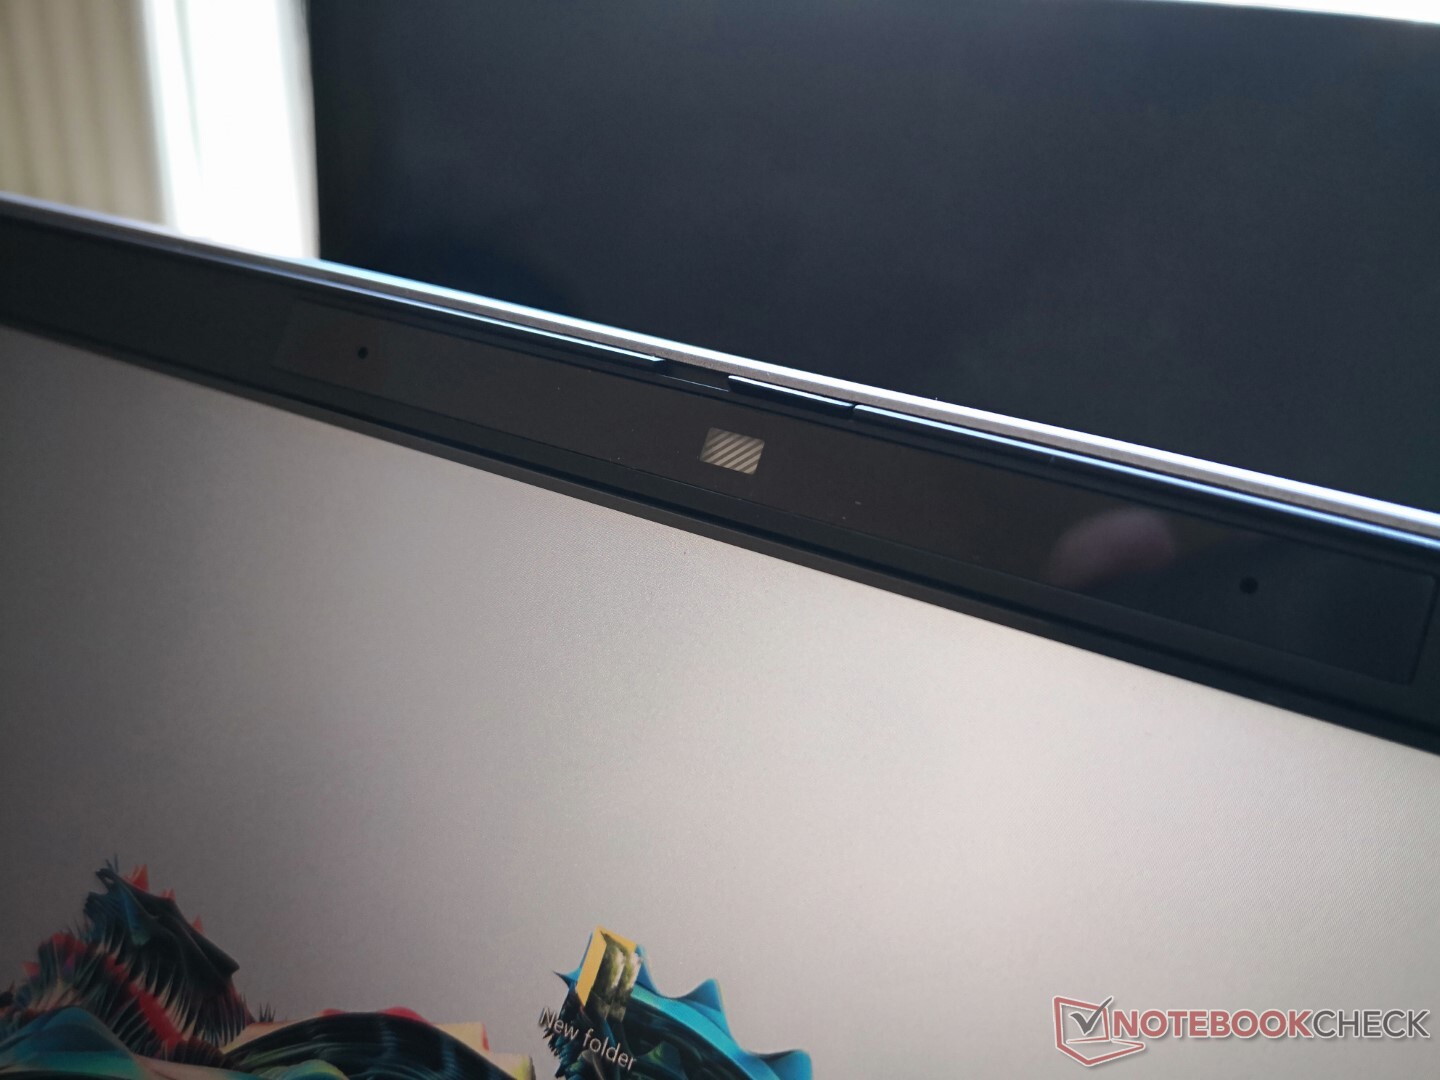
Webcam - Still 720p
La qualité de la caméra reste médiocre avec seulement 720p. Certains fabricants comme Razer ont depuis mis à niveau leurs webcams intégrées de 720p à 1080p.


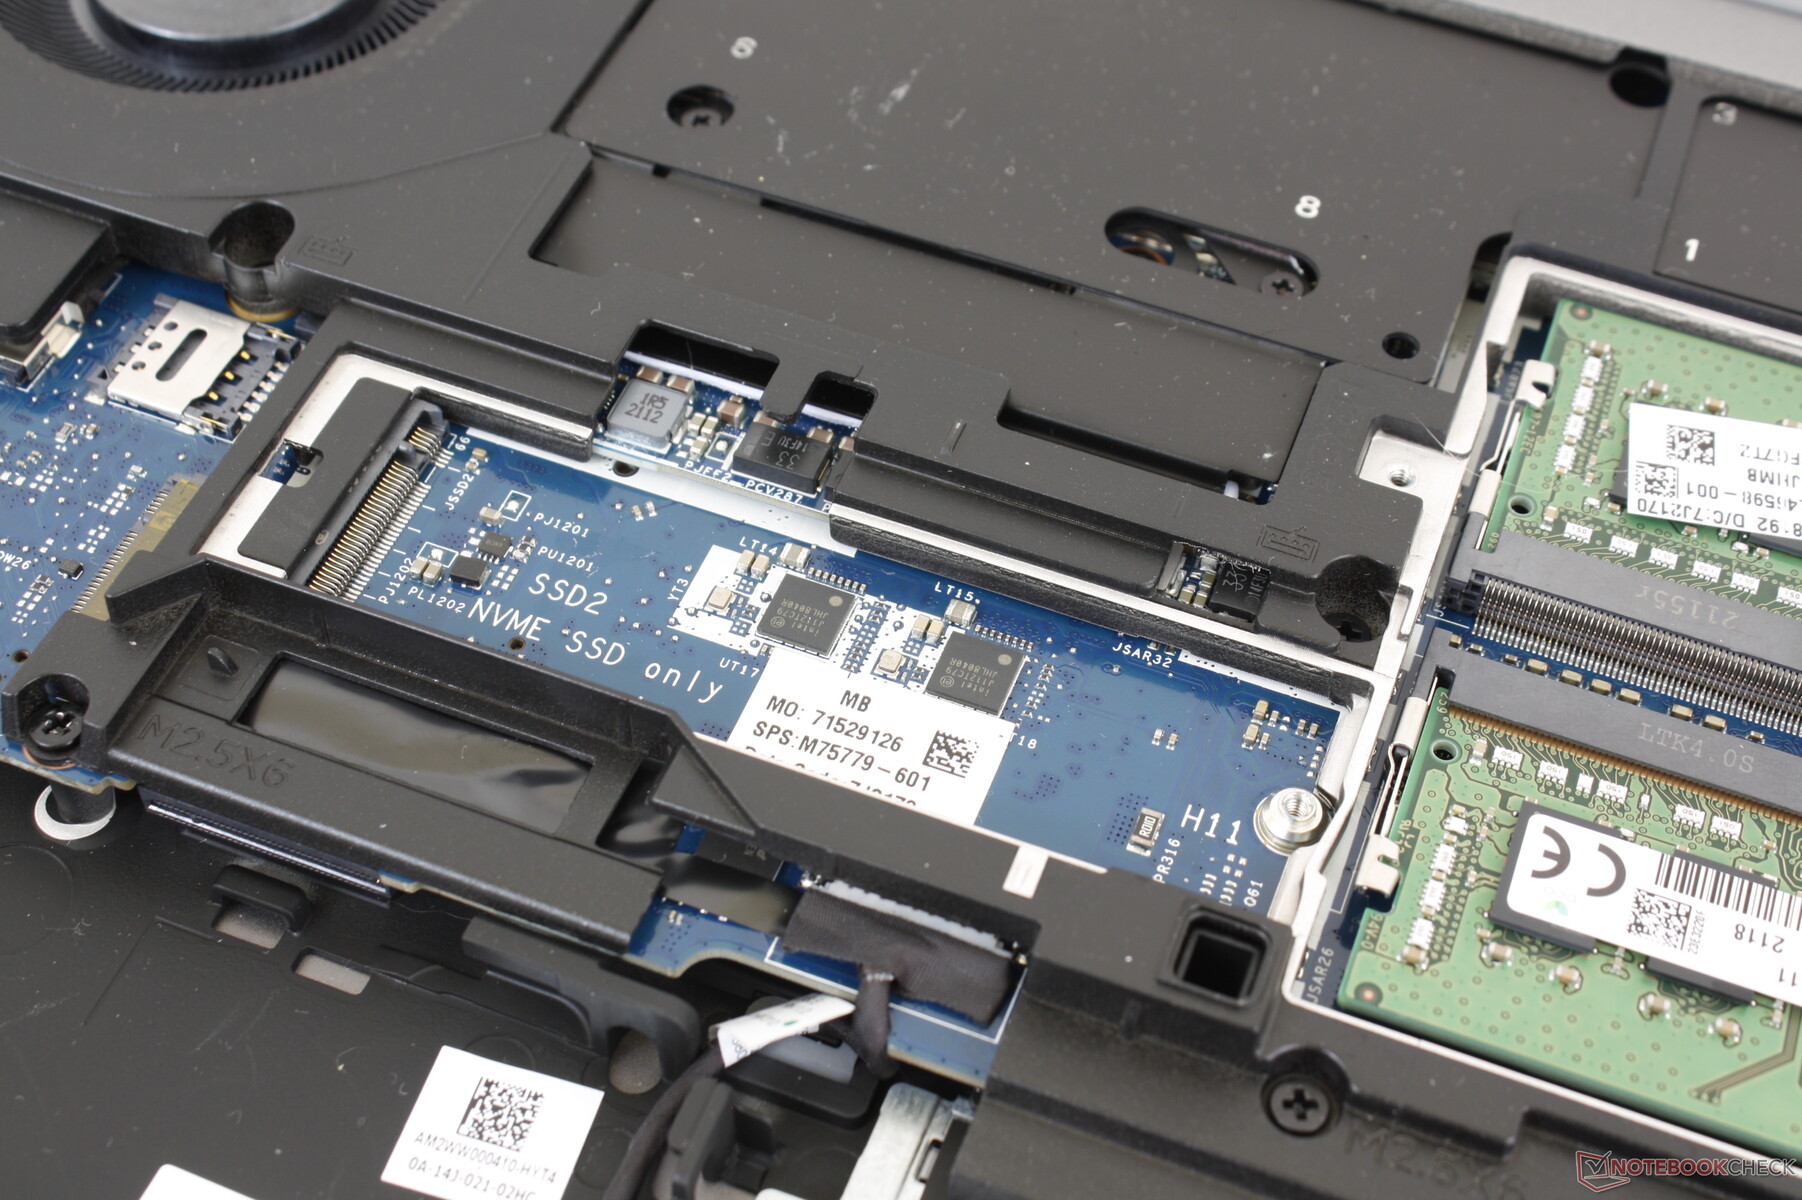
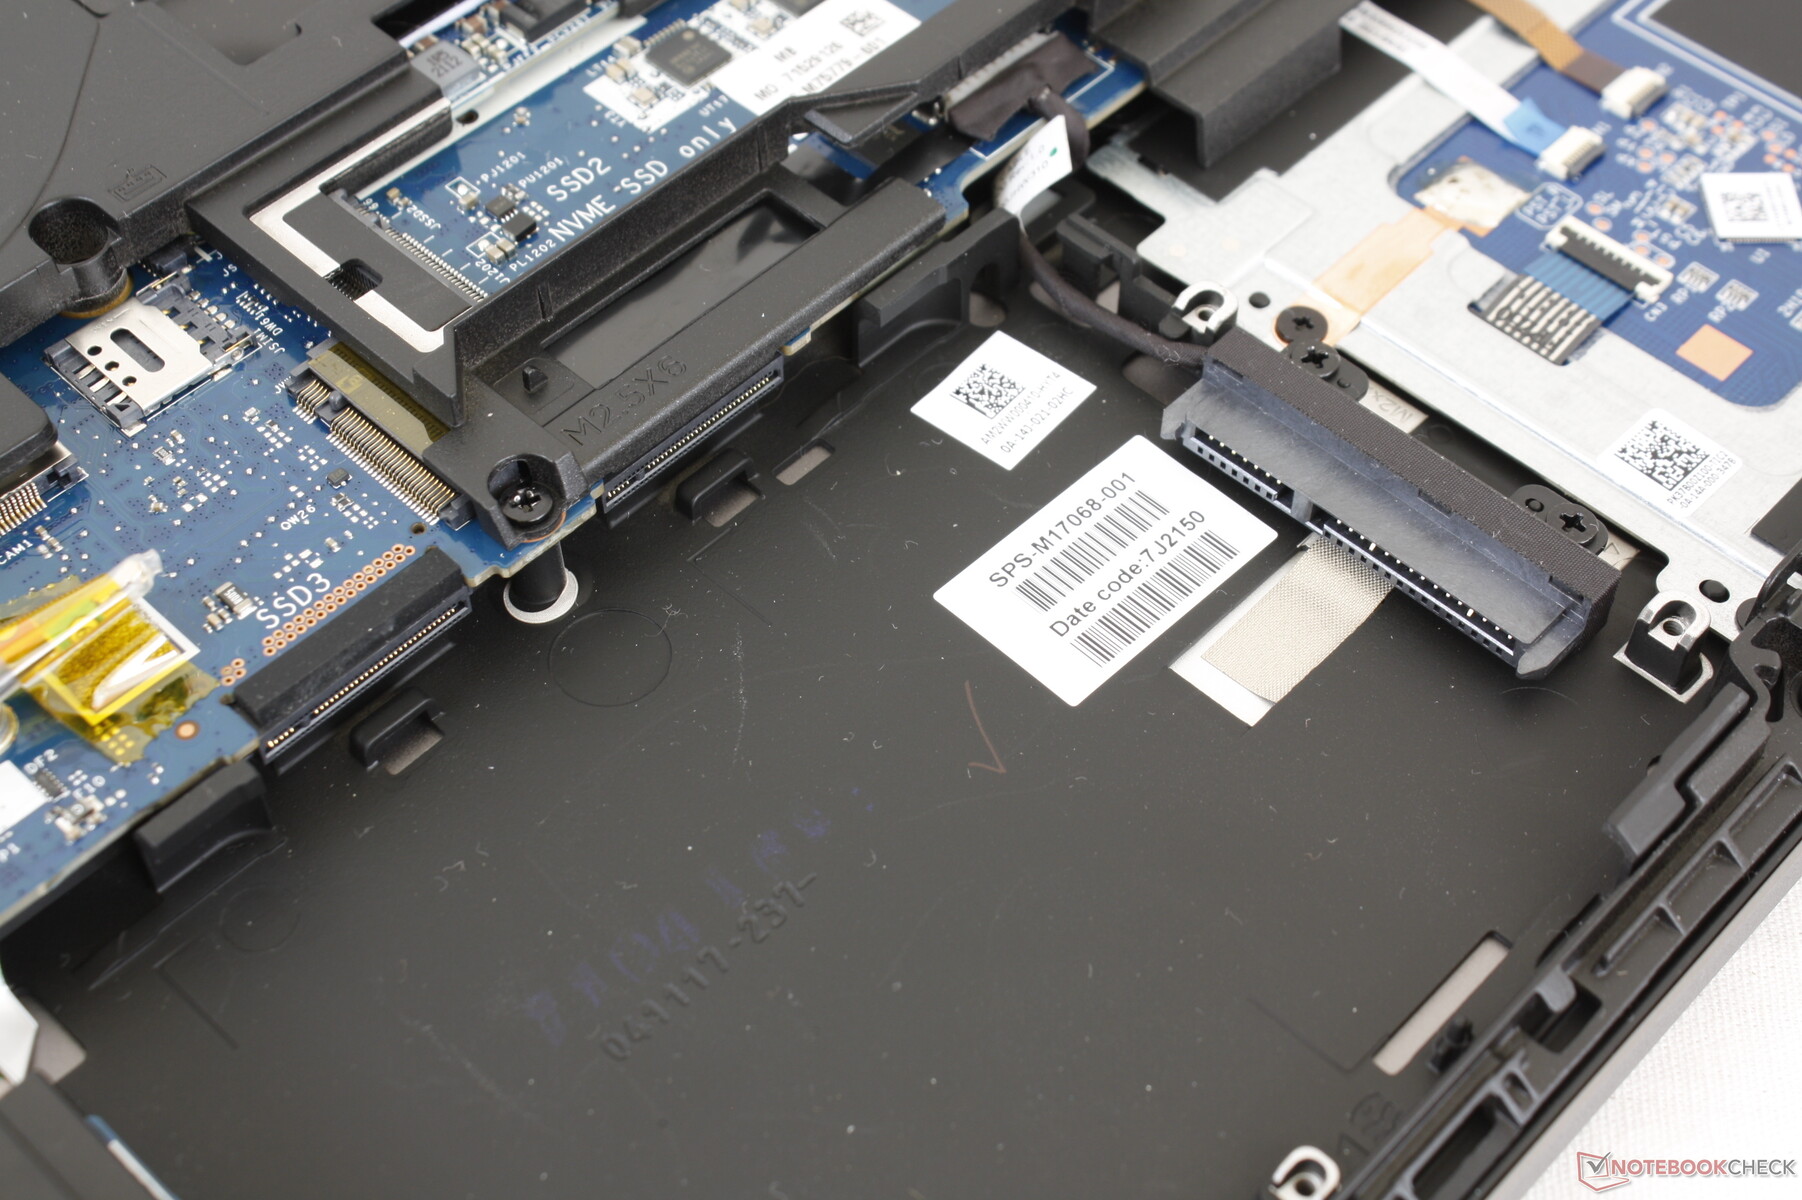
Entretien - Préparez un tournevis
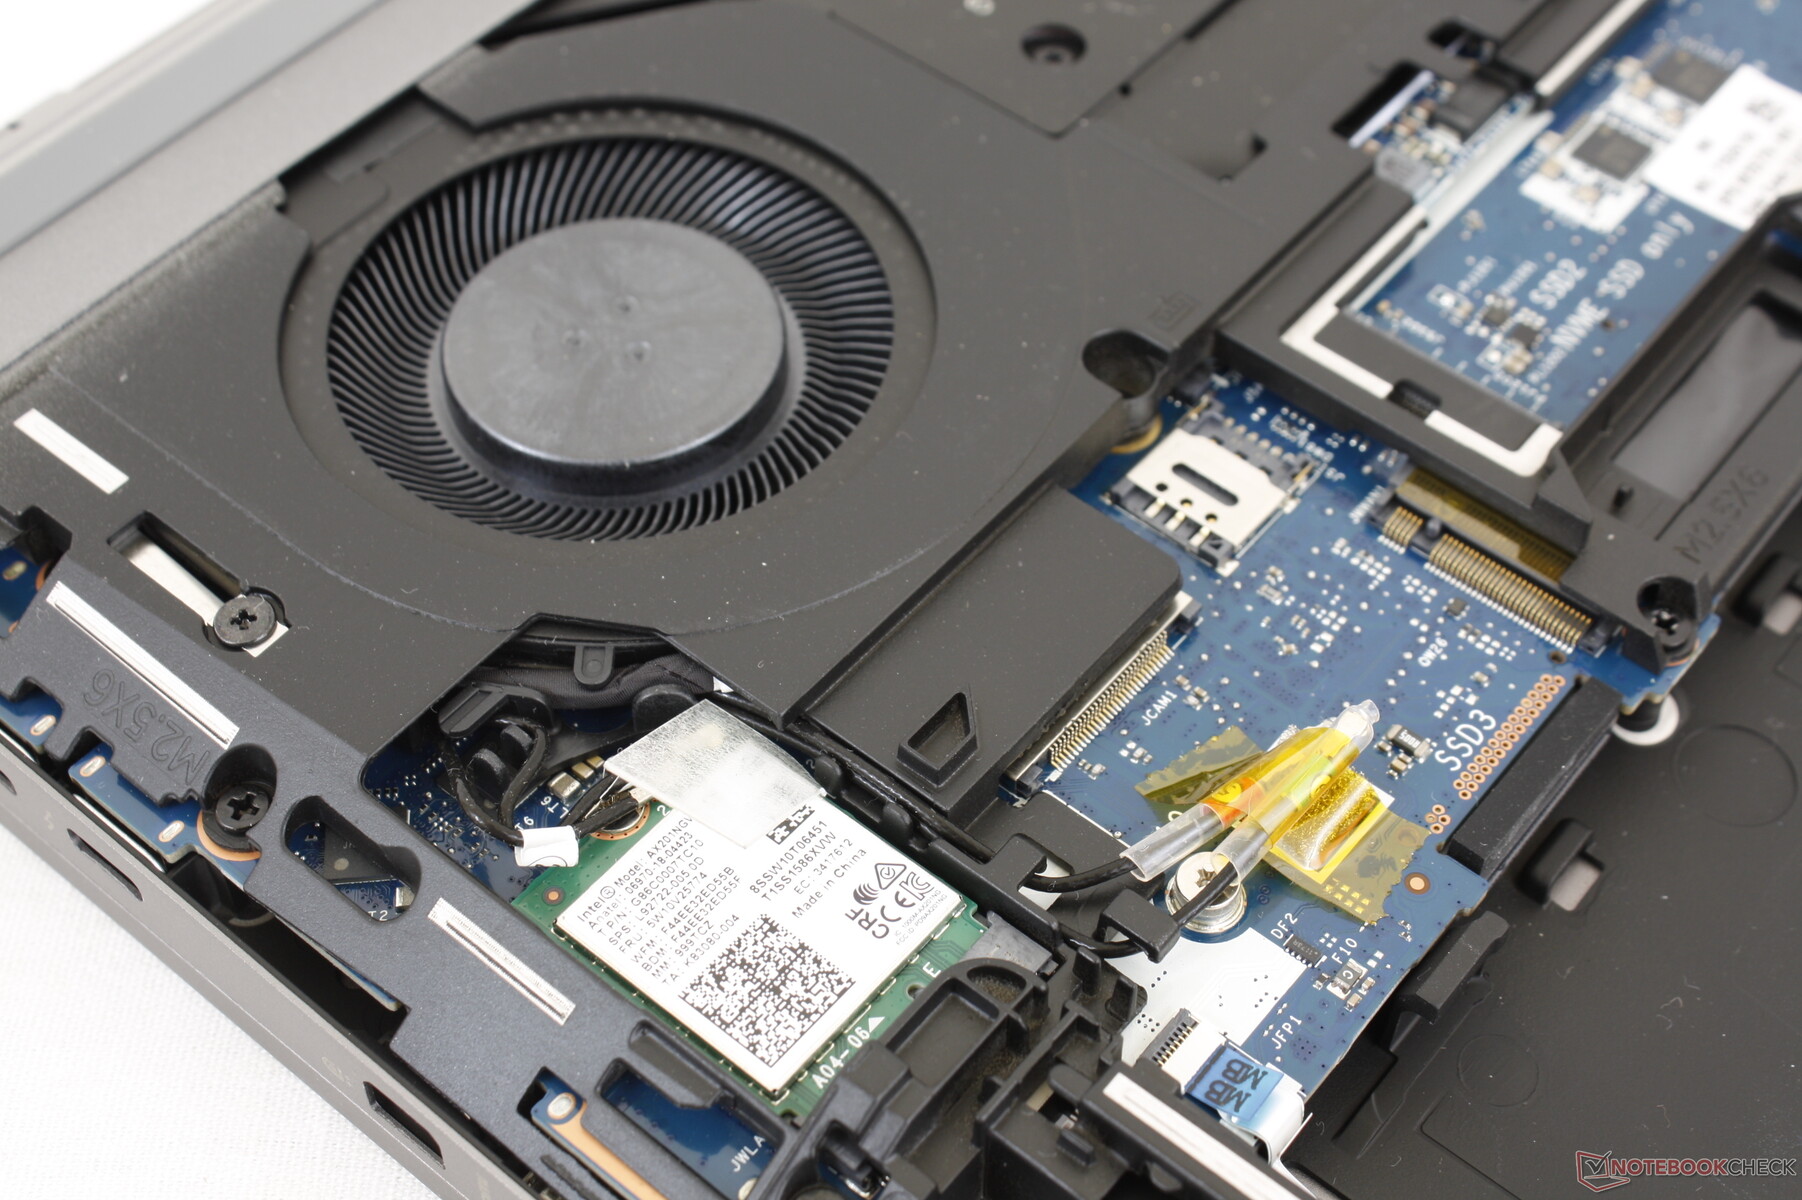
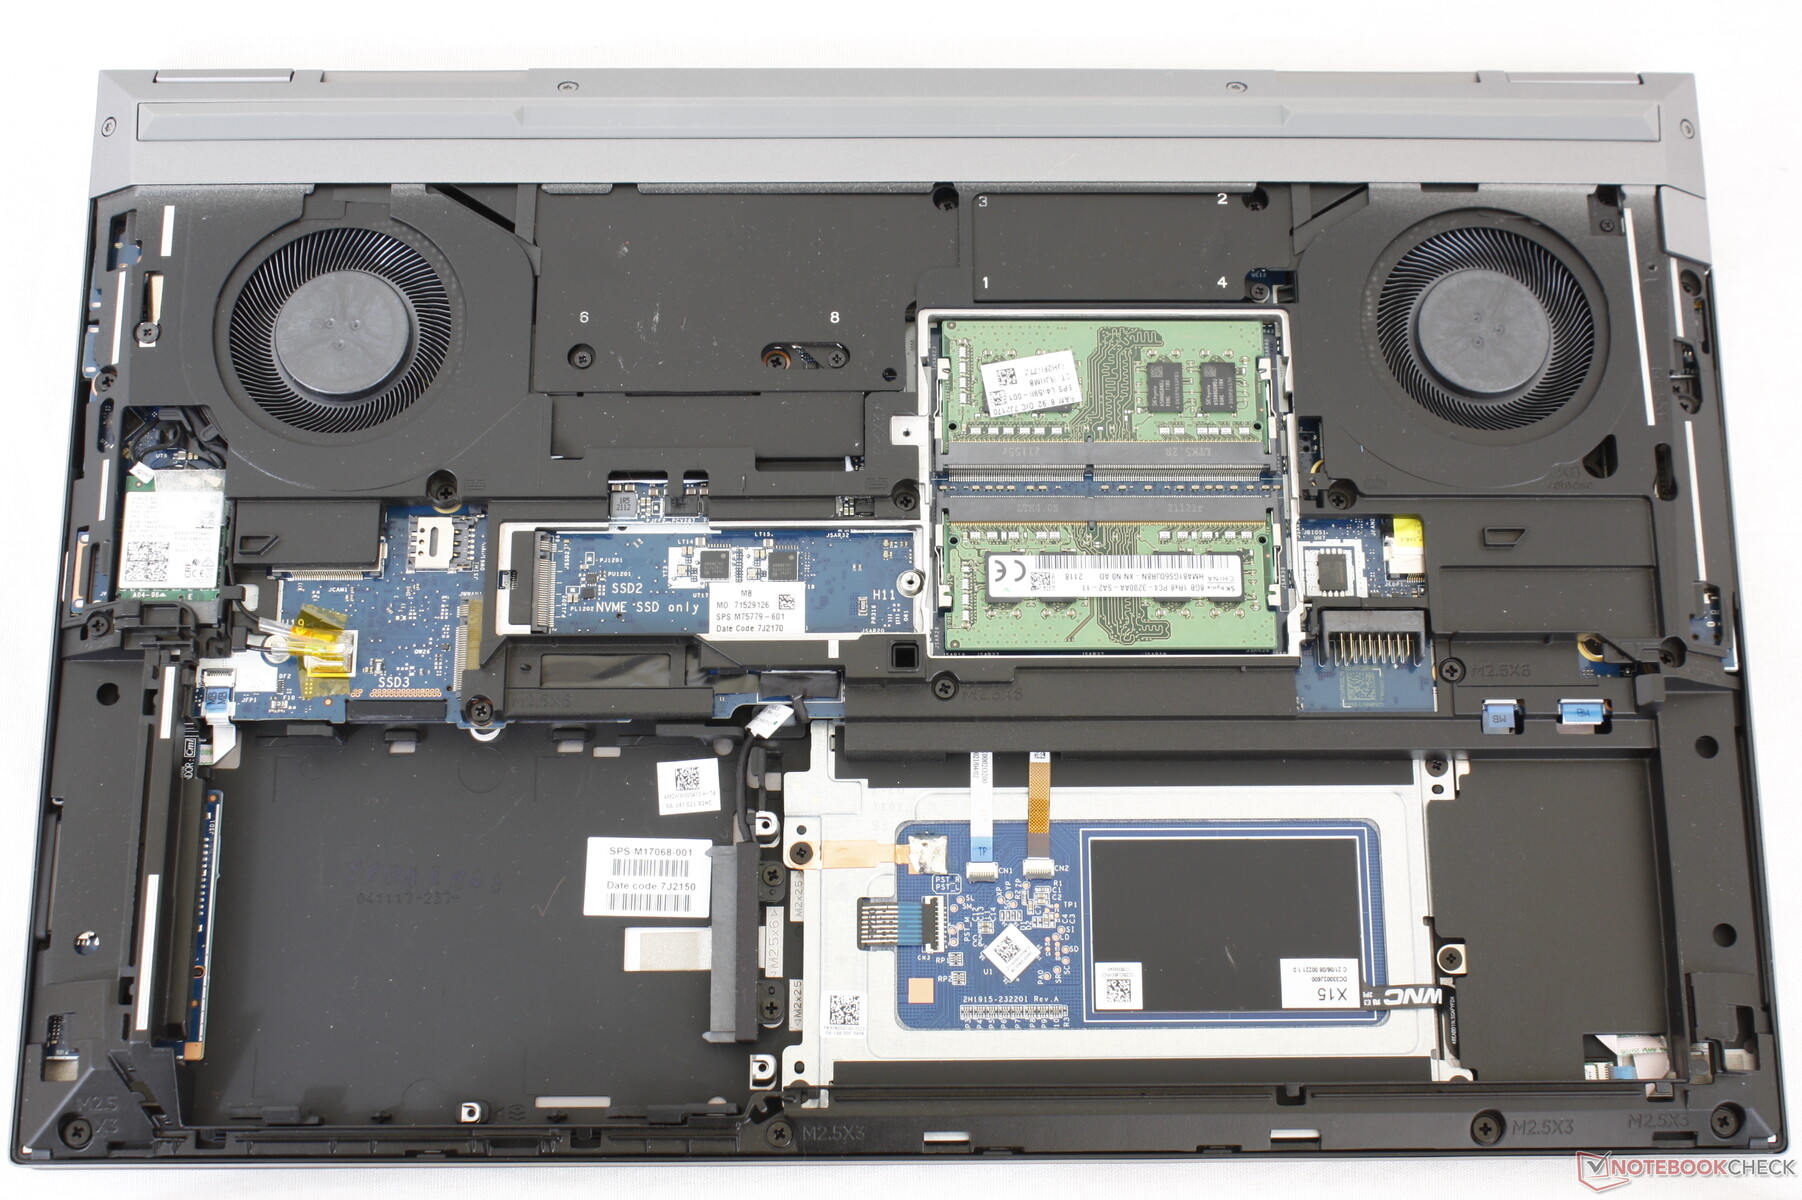
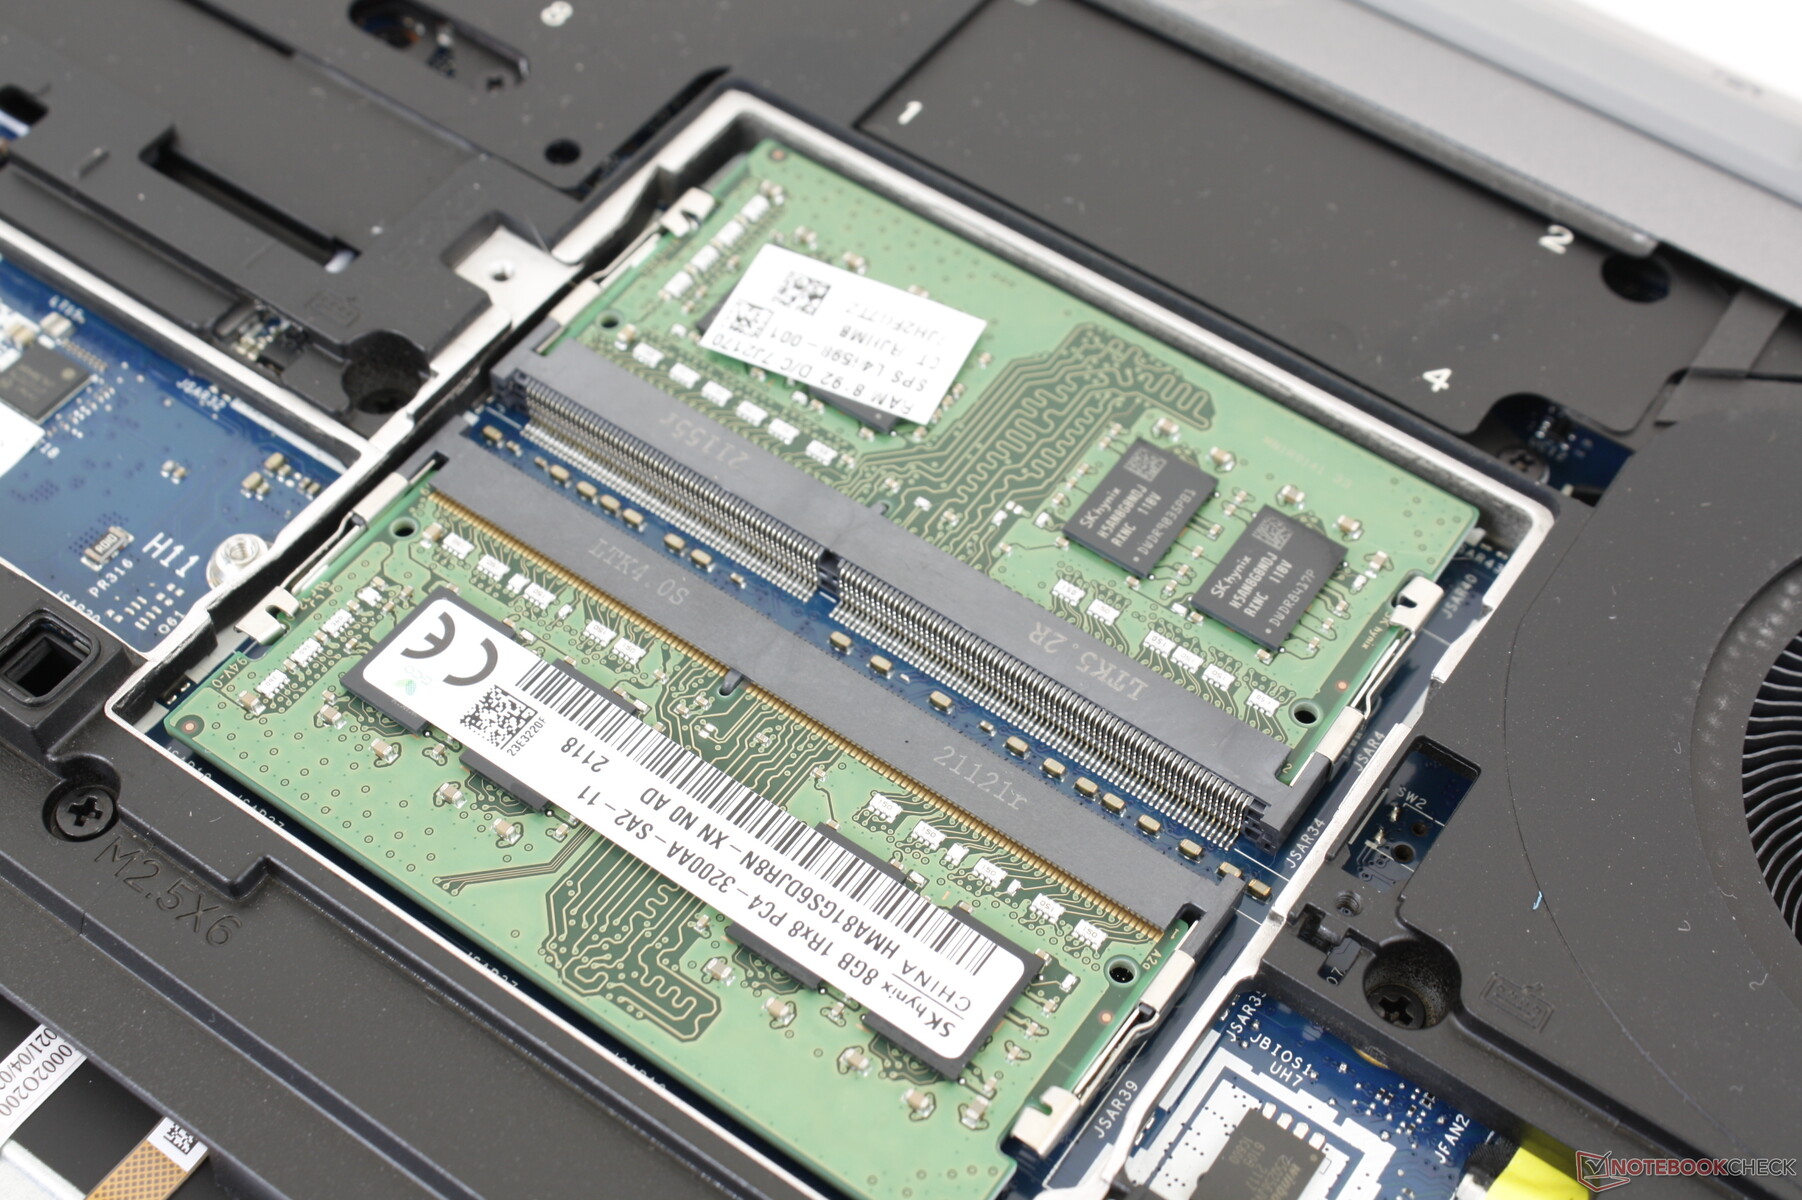
Le panneau inférieur se retire facilement, sans outil ni tournevis. Une fois à l'intérieur, cependant, la plupart des composants se trouvent sous des plaques métalliques qui nécessitent un tournevis Philips pour les retirer. La mémoire vive supplémentaire et les composants de stockage se trouvent de l'autre côté de la carte mère et ne sont donc pas aussi facilement accessibles.
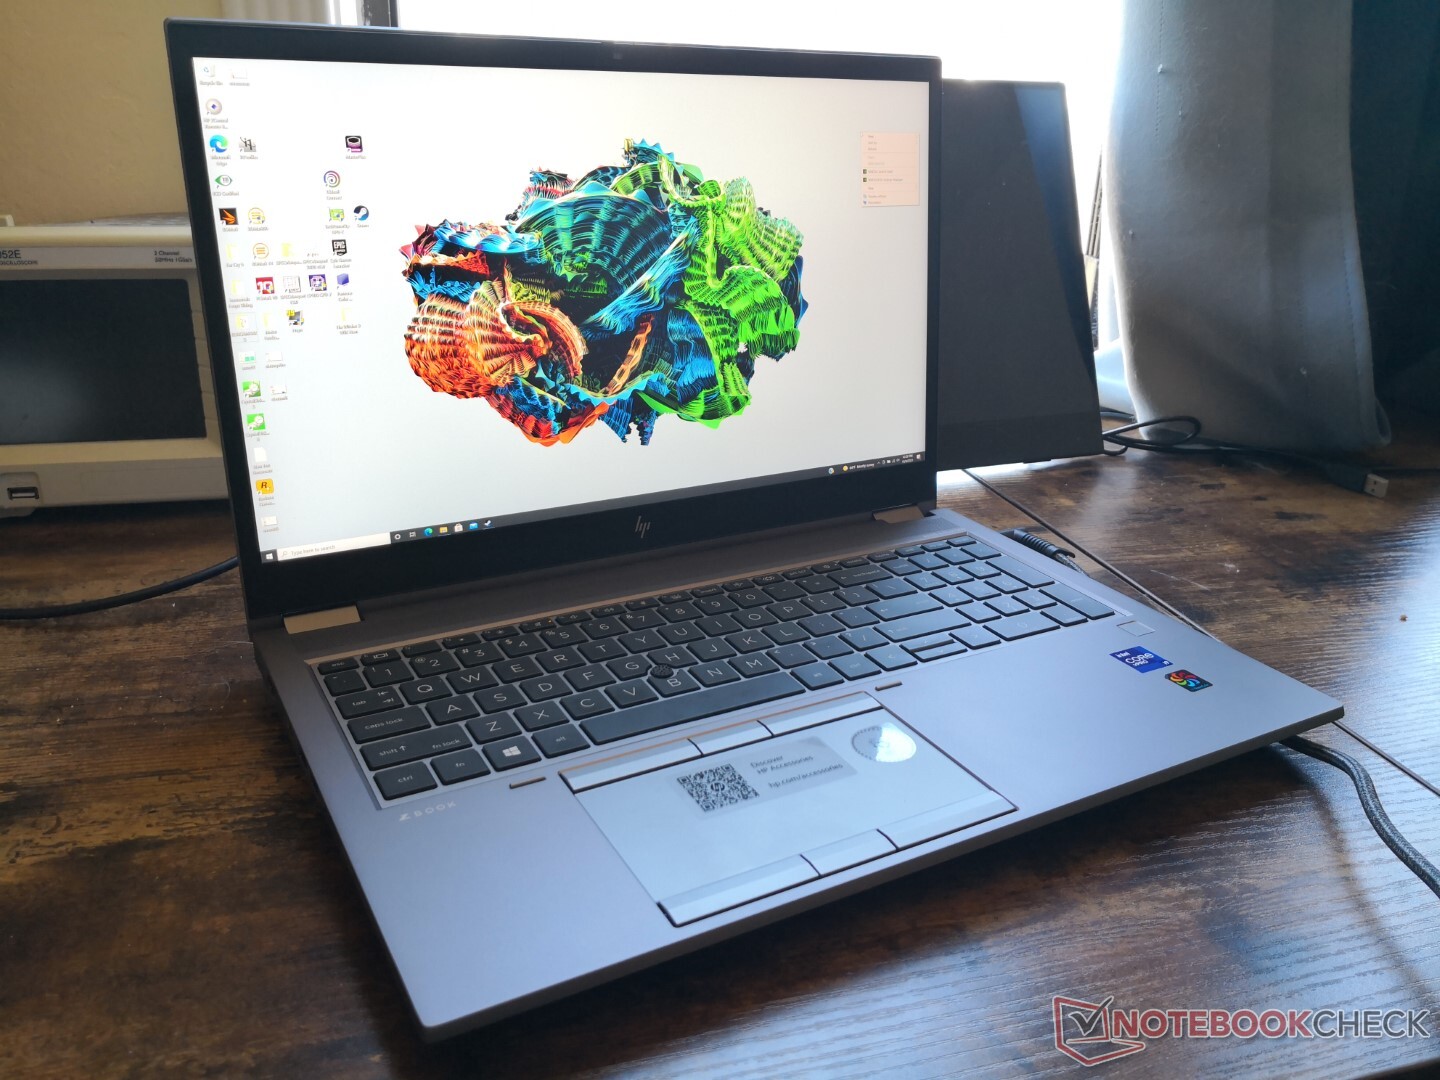
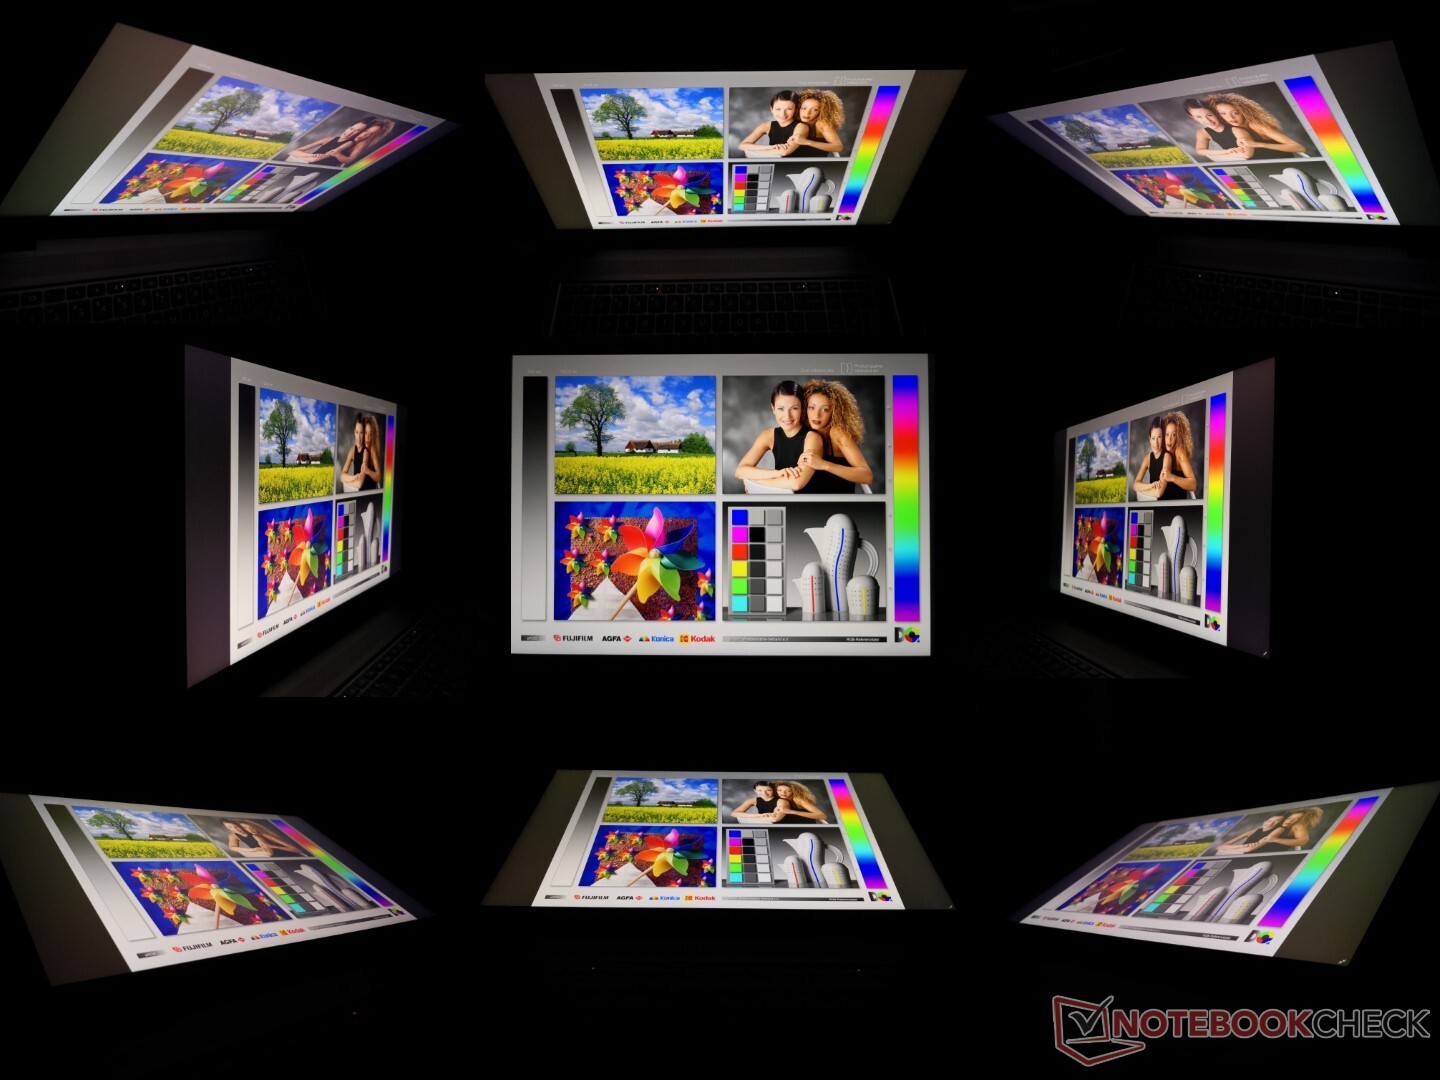
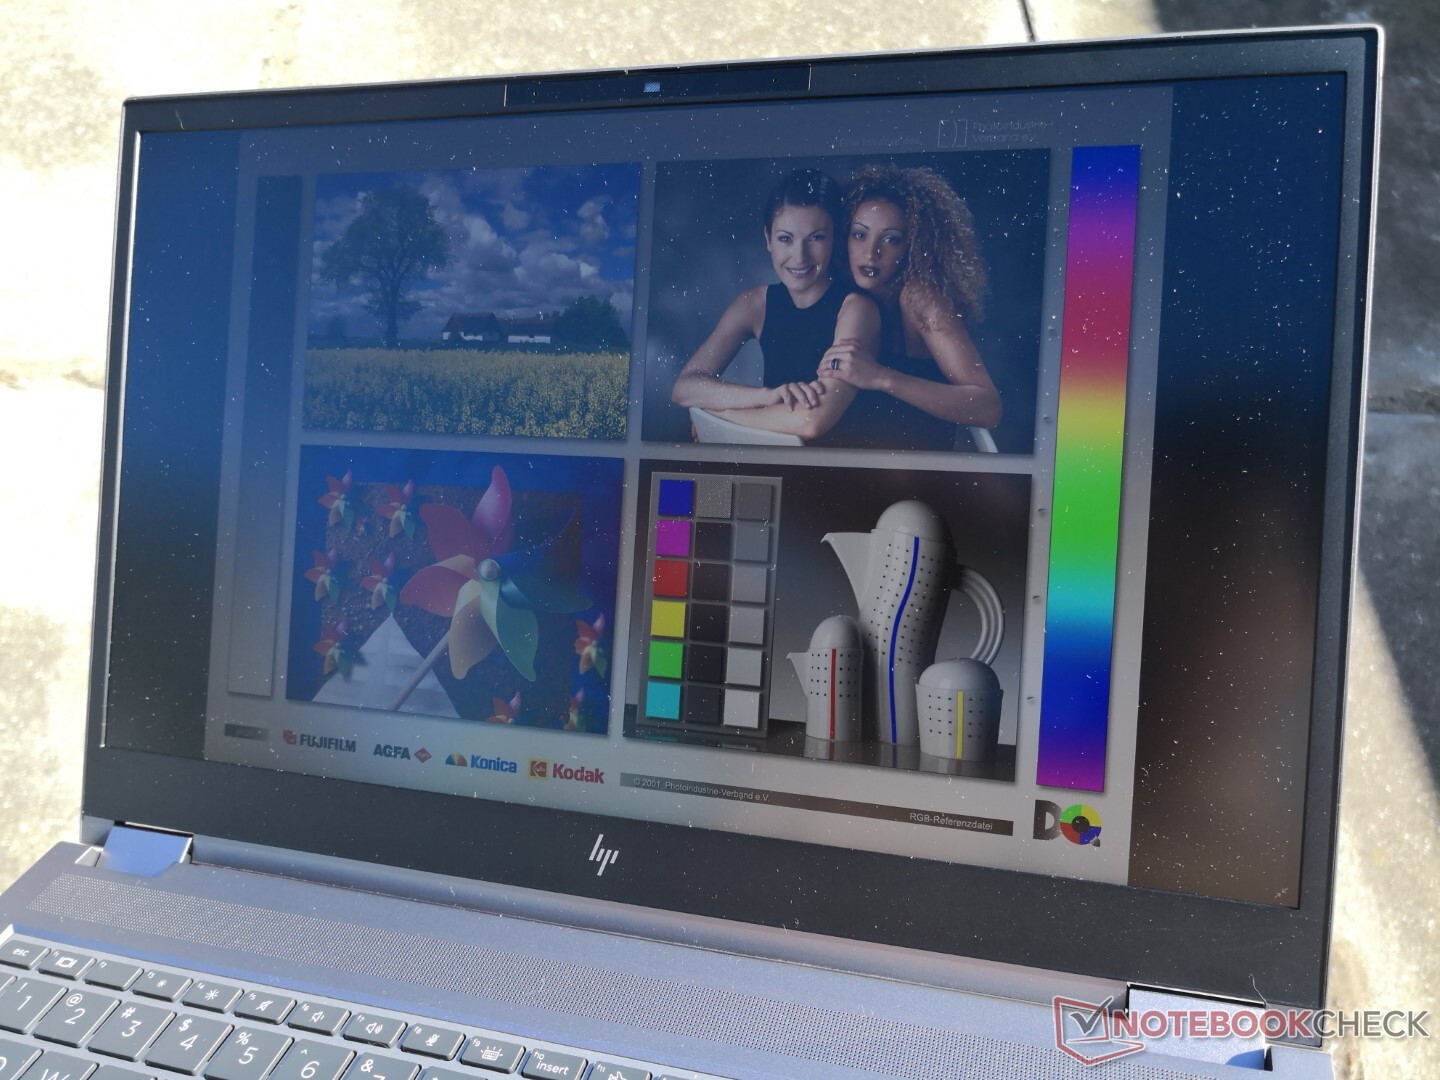
Affichage - 120 Hz fait toute la différence
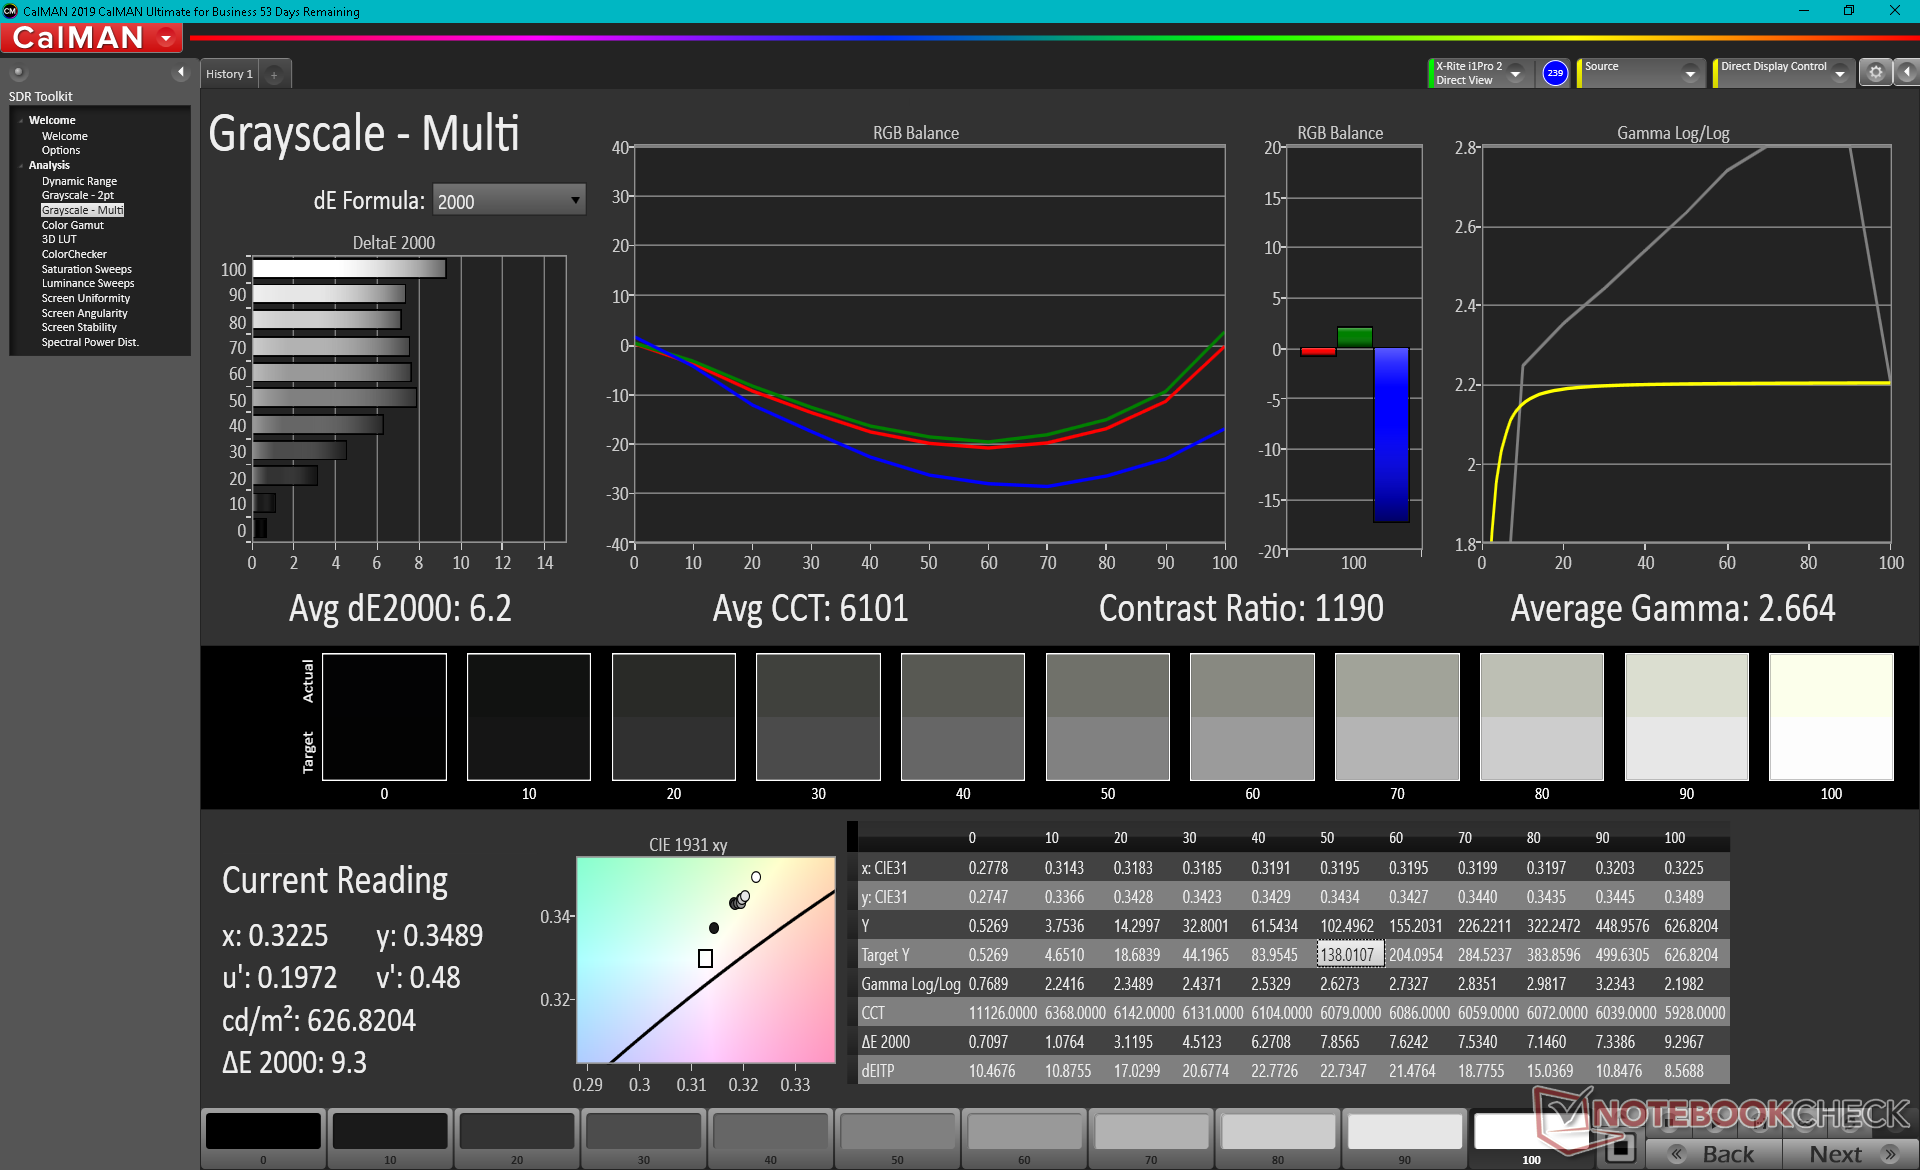
La nouvelle dalle 4K 120 Hz du Fury 15 G8 est une amélioration significative par rapport à la dalle 4K 60 Hz du Fury 15 G7, bien qu'elle ait la même résolution native élevée et la même couverture de couleurs étendue. Outre les avantages évidents du passage de 60 Hz à 120 Hz, la nouvelle dalle offre des temps de réponse noir-blanc et gris-gris beaucoup plus rapides de près de 4 fois, ce qui permet de réduire les images fantômes, en particulier dans le cas de graphiques en mouvement rapide. La luminosité et le contraste restent également élevés, respectivement à ~600:1 et >1000:1
Le plus gros inconvénient de l'écran 4K est peut-être qu'il souffre d'un léger grain dû à la couche mate, ce qui fait que les textes et les images ne sont pas aussi nets qu'ils auraient pu l'être malgré le PPI très élevé. HP propose des options brillantes pour remédier à cet inconvénient spécifique.
| |||||||||||||||||||||||||
Homogénéité de la luminosité: 87 %
Valeur mesurée au centre, sur batterie: 626 cd/m²
Contraste: 1079:1 (Valeurs des noirs: 0.58 cd/m²)
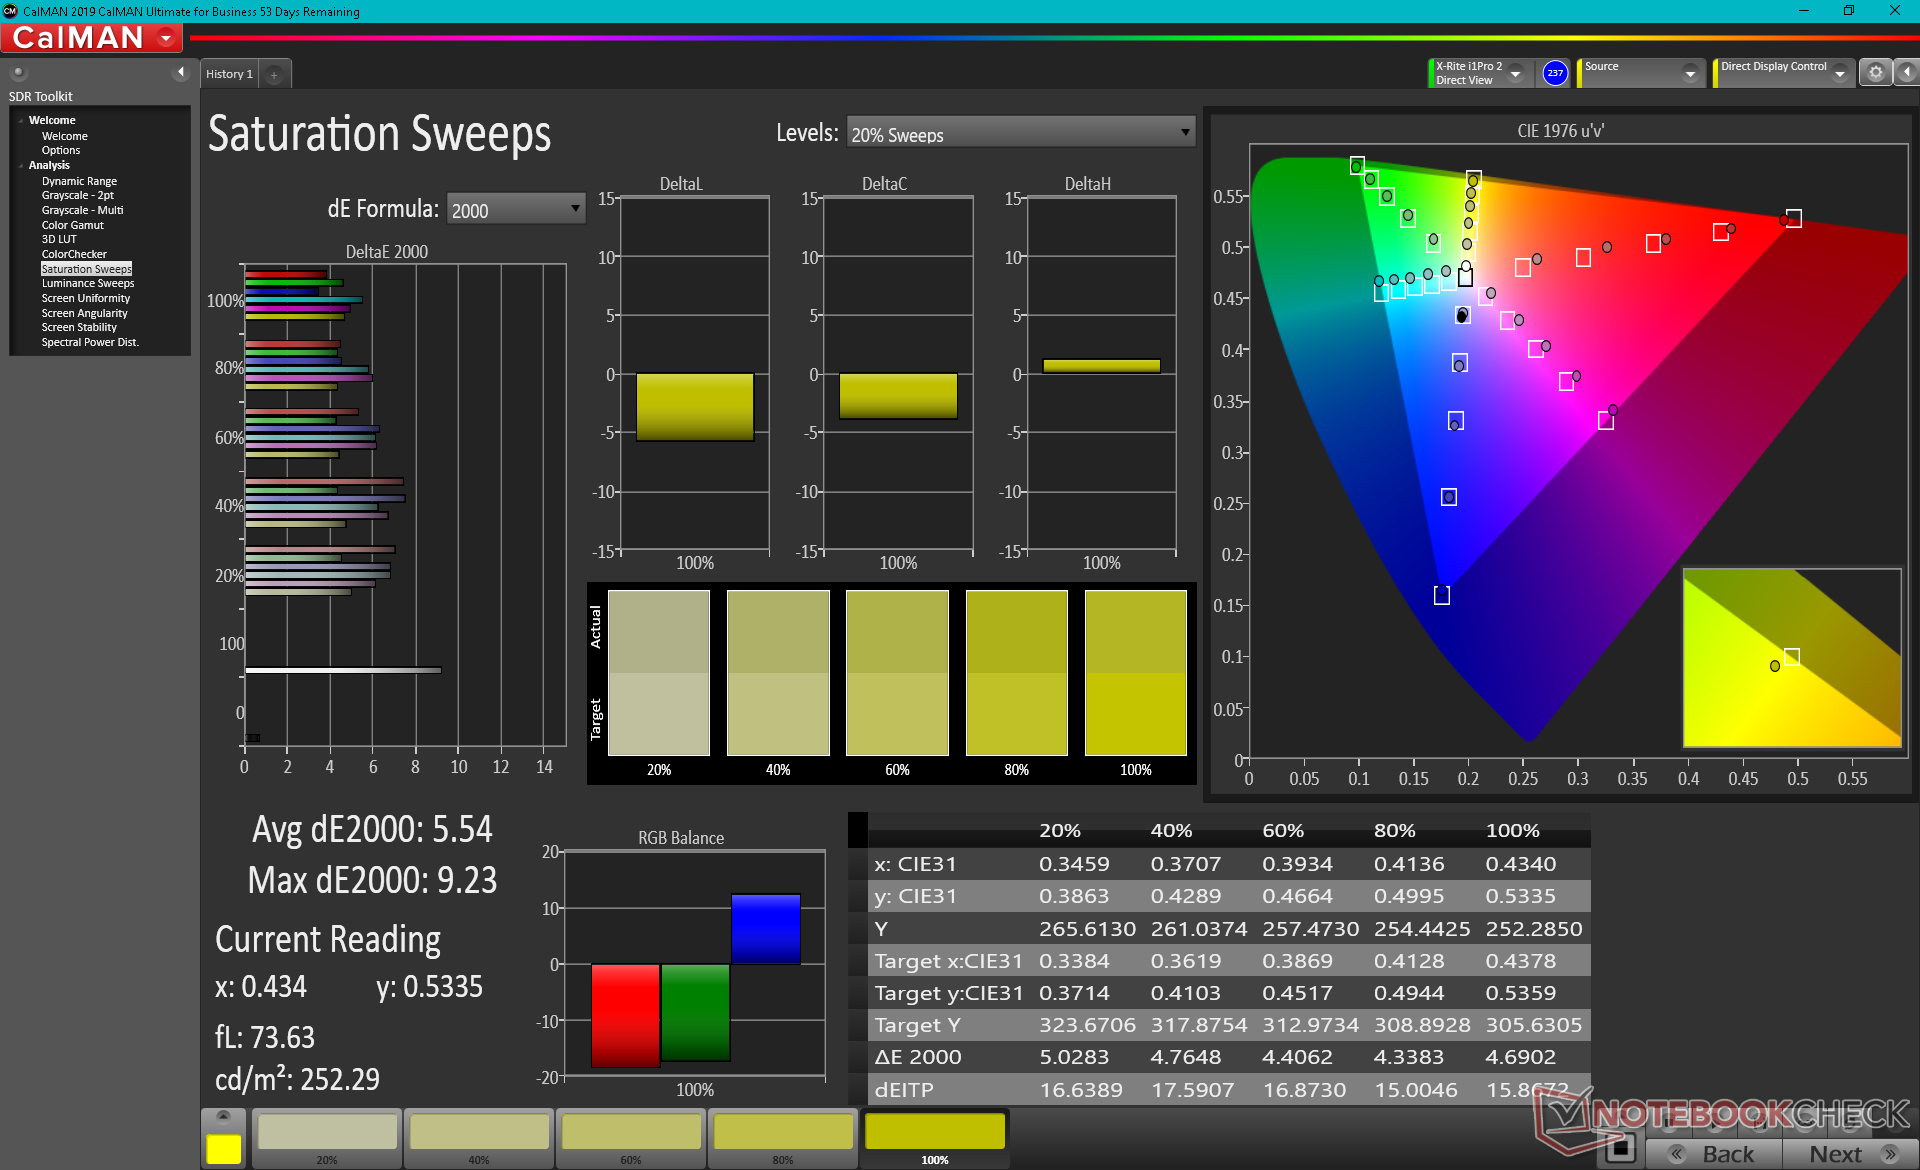
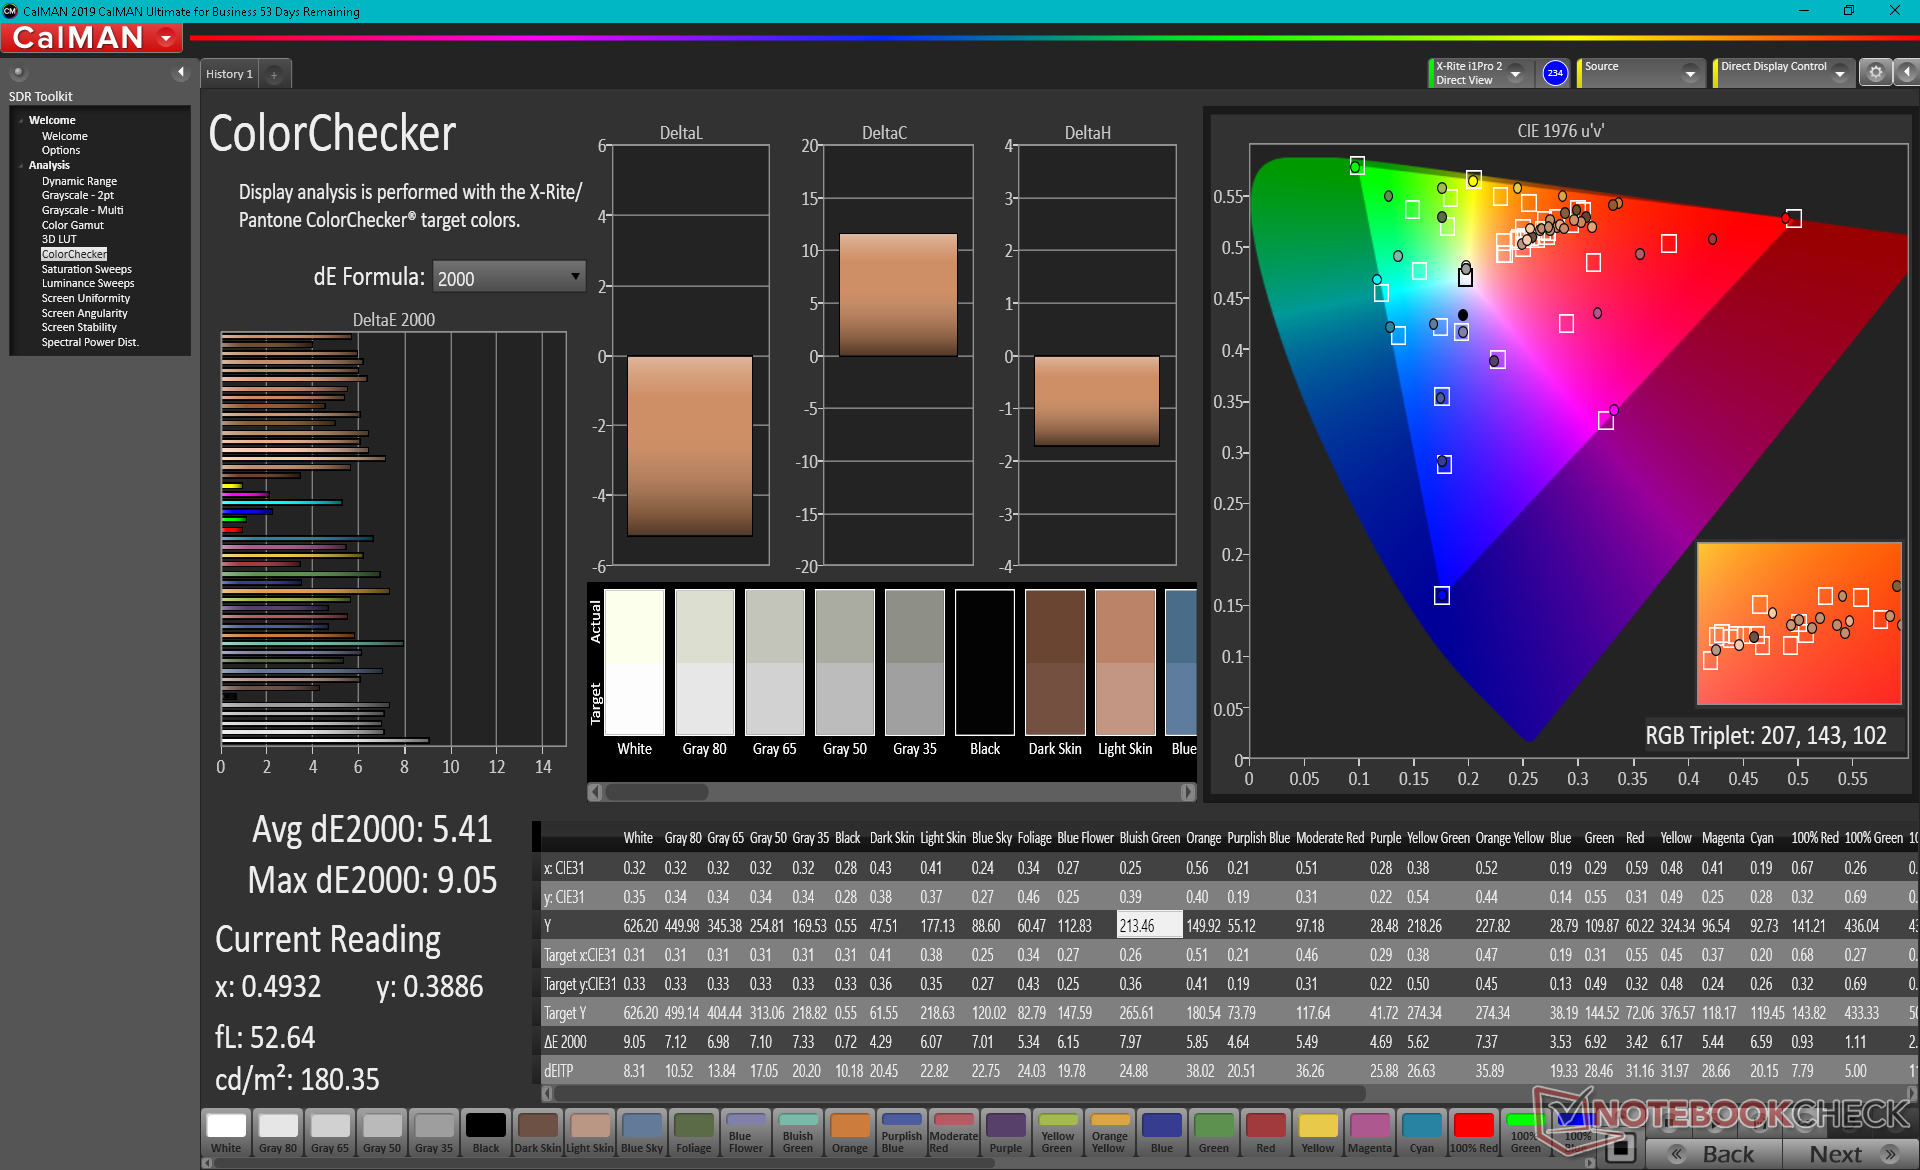
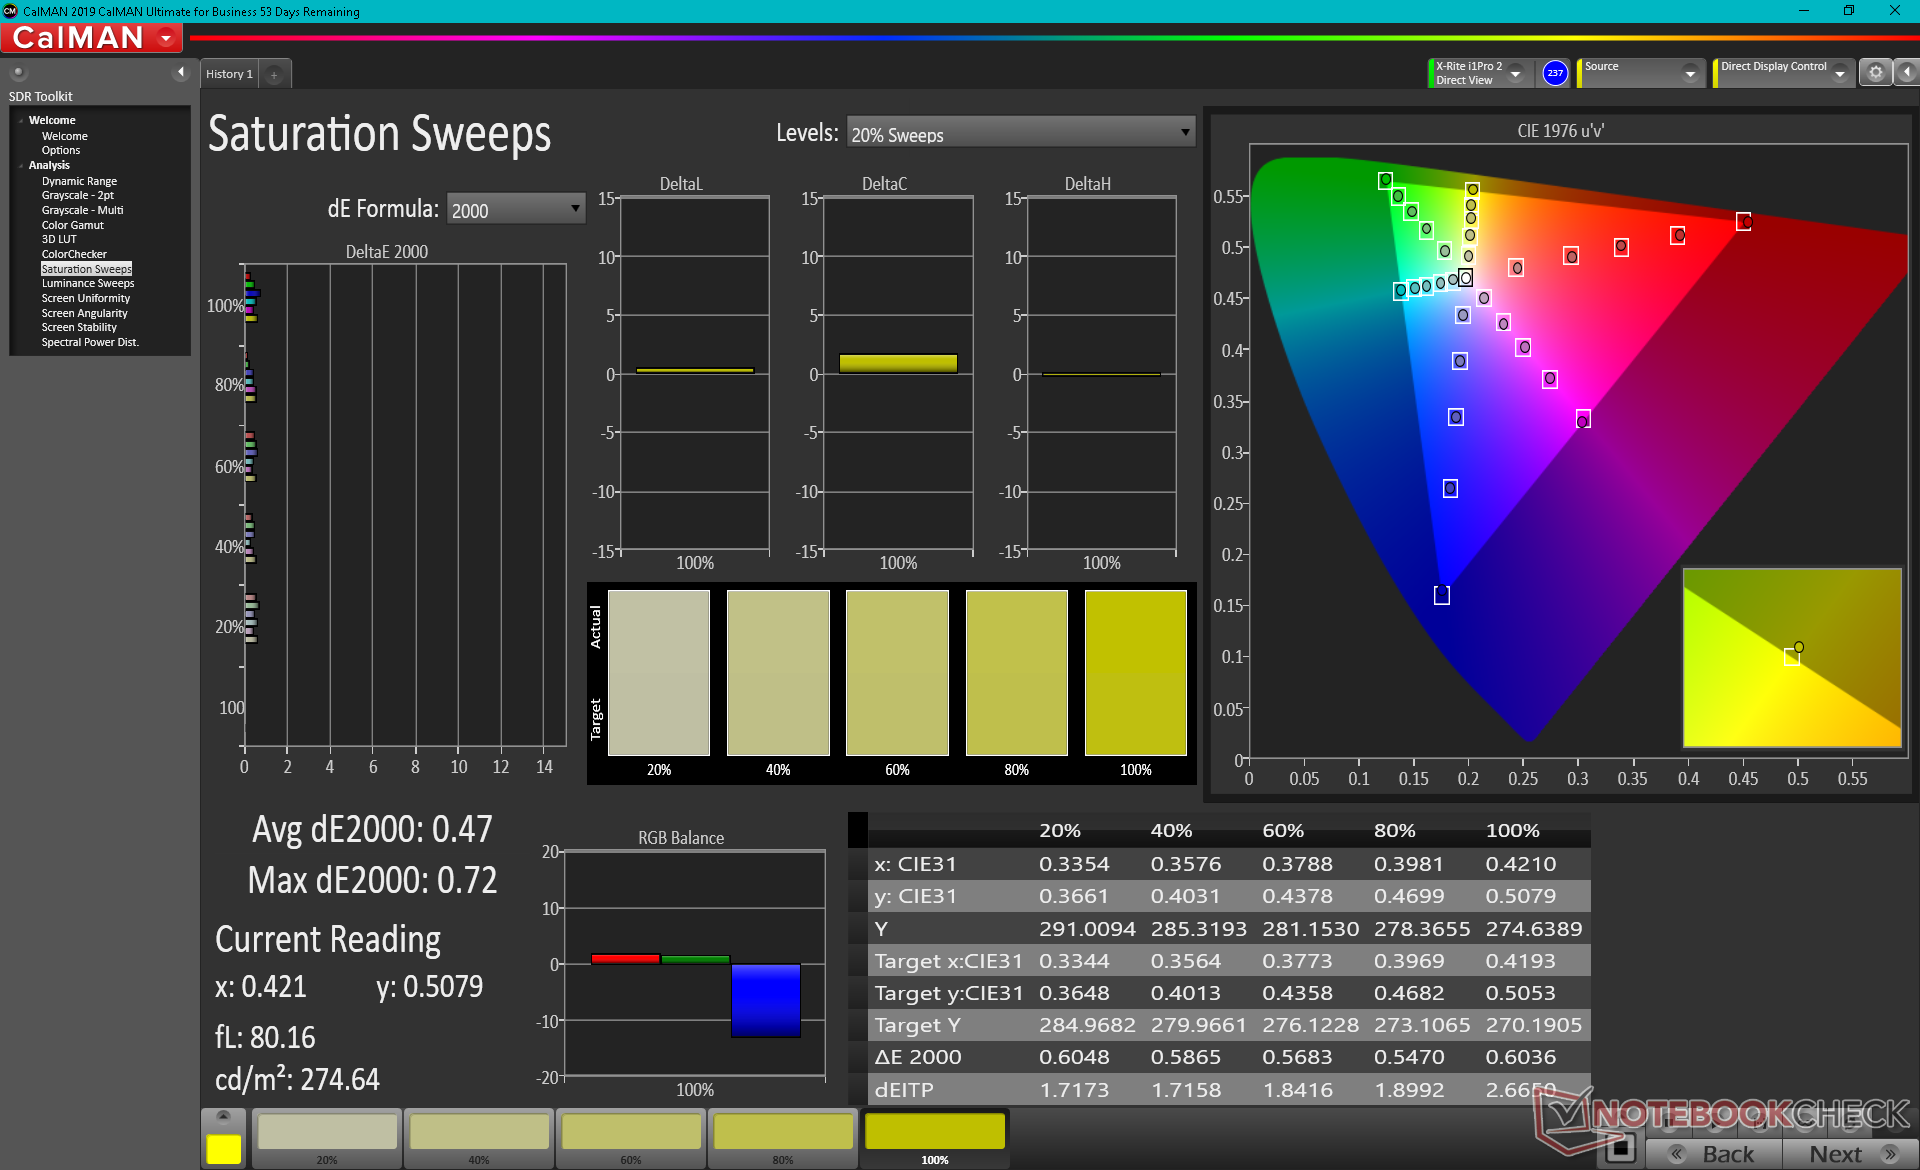
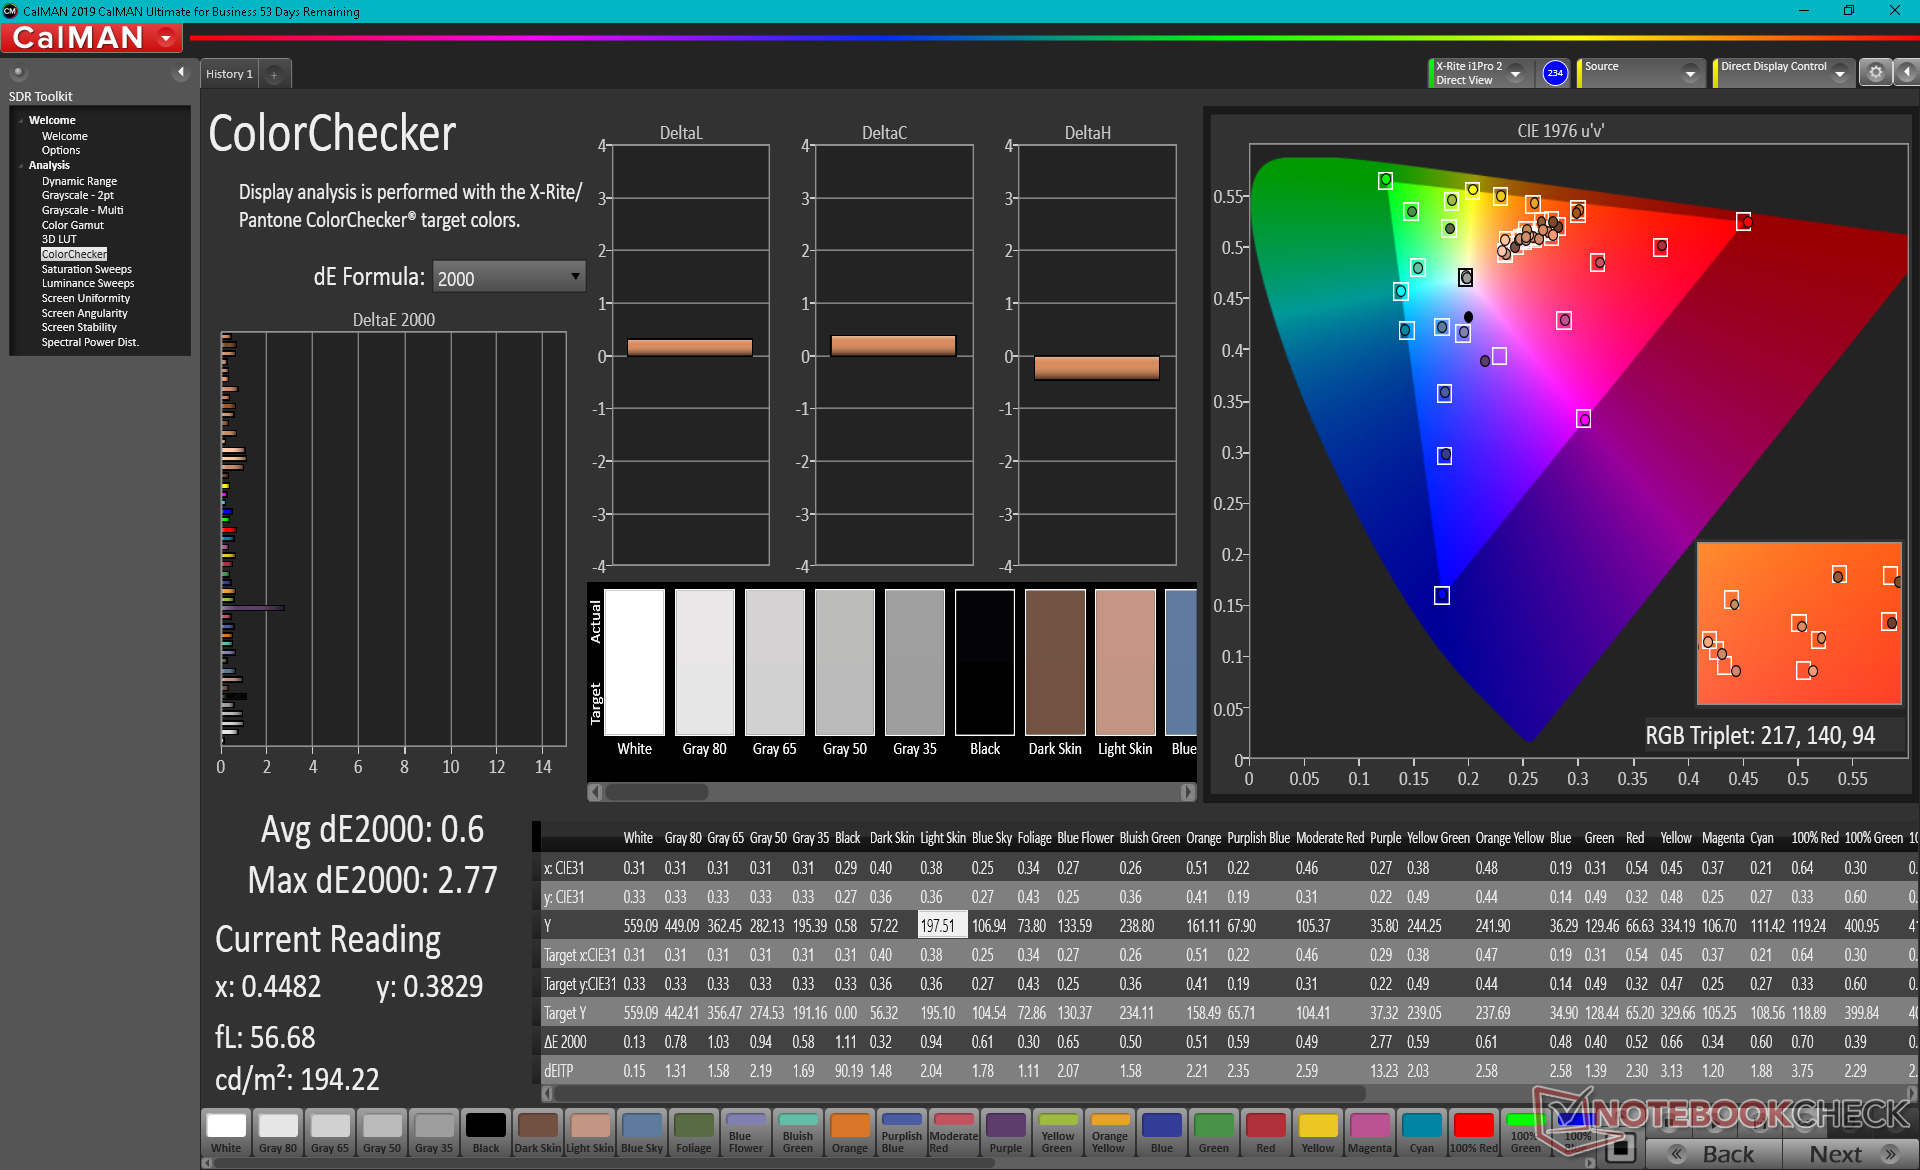
ΔE ColorChecker Calman: 5.41 | ∀{0.5-29.43 Ø4.72}
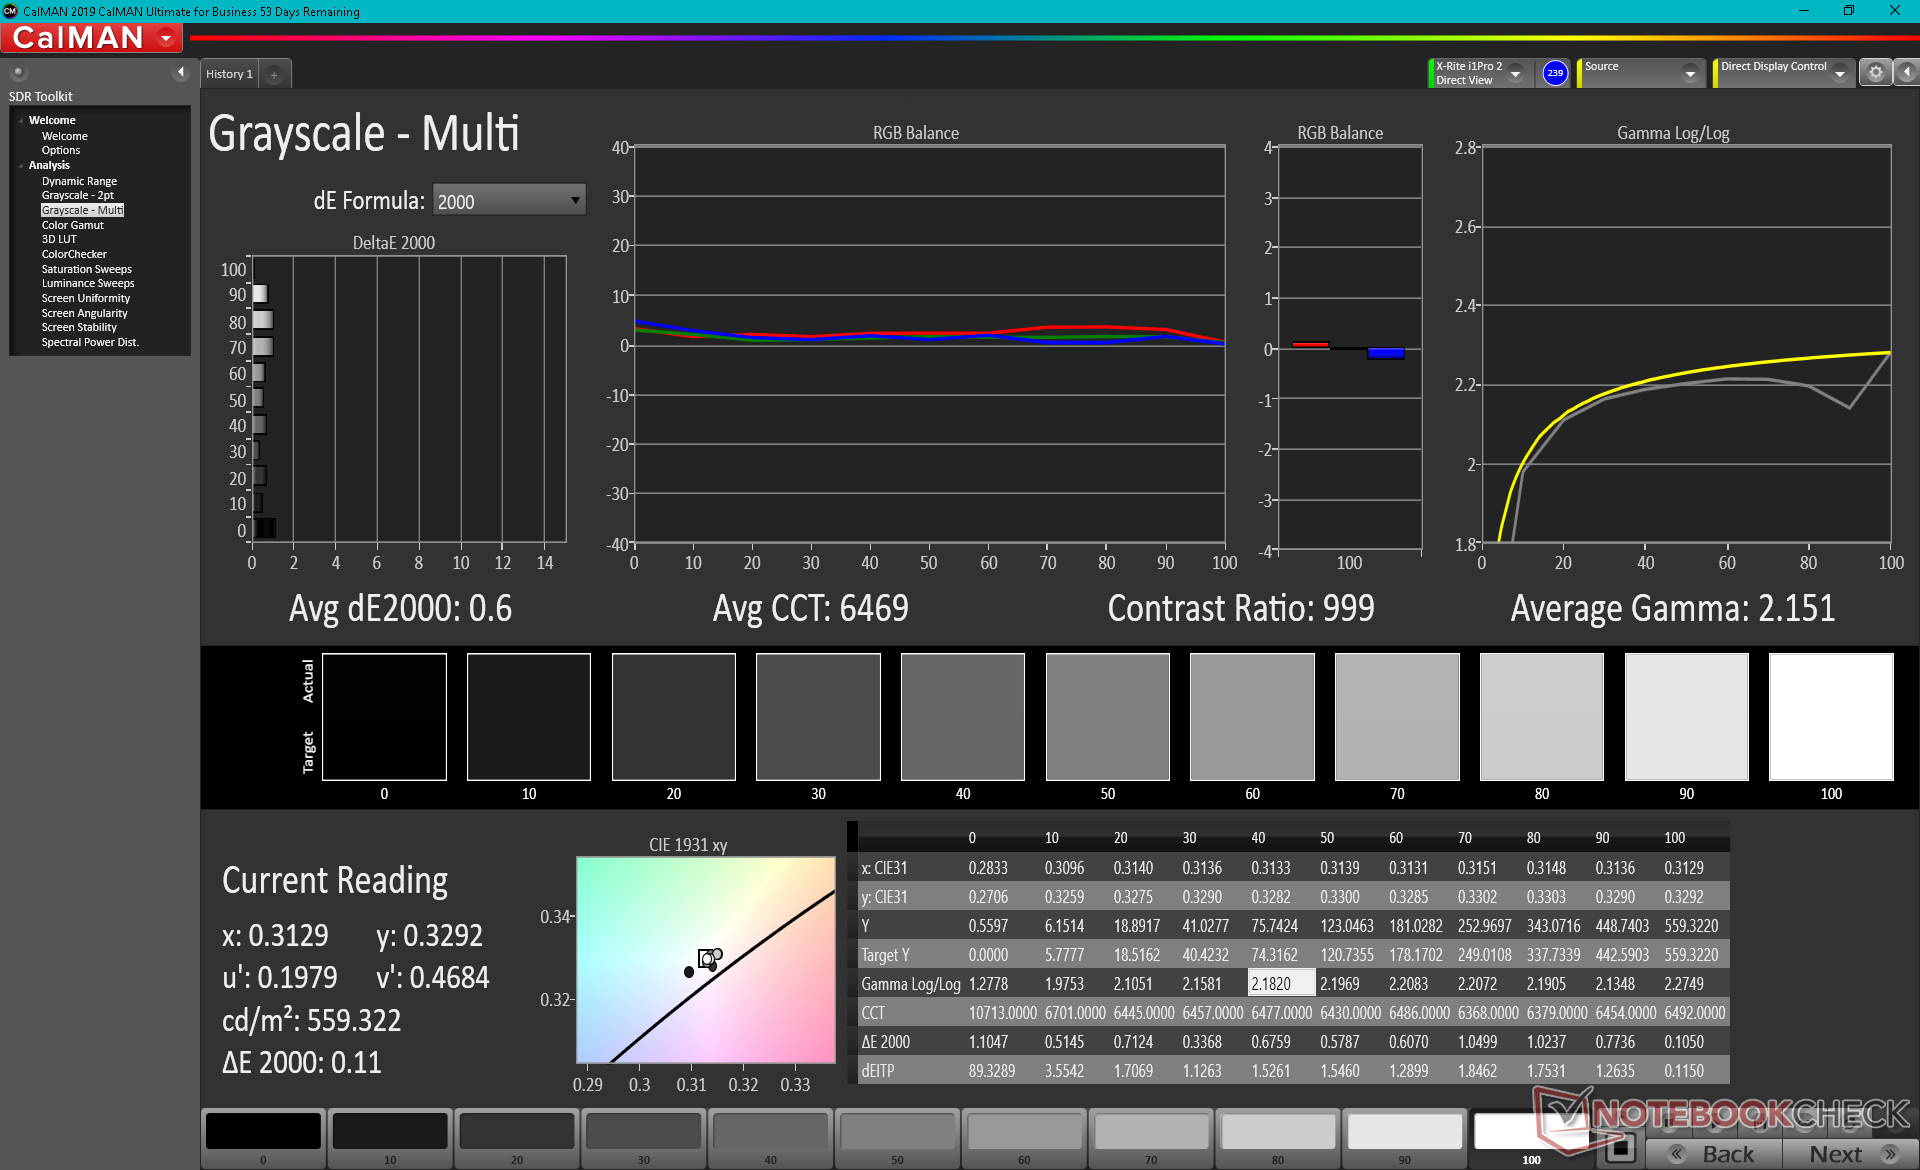
calibrated: 0.6
ΔE Greyscale Calman: 6.2 | ∀{0.09-98 Ø4.97}
87.3% AdobeRGB 1998 (Argyll 3D)
100% sRGB (Argyll 3D)
95.9% Display P3 (Argyll 3D)
Gamma: 2.66
CCT: 6101 K
| HP ZBook Fury 15 G8 BOE0969, IPS, 15.6", 3840x2160 | HP ZBook Fury 15 G7 LG Philips LGD0661, IPS, 15.6", 3840x2160 | Dell Precision 5000 5560 Sharp LQ156R1, IPS, 15.6", 3840x2400 | HP ZBook Studio 15 G8 SDC4145, OLED, 15.6", 3840x2160 | Lenovo ThinkPad P15s Gen2-20W6000GGE MNF601EA1-1, IPS LED, 15.6", 3840x2160 | HP ZBook Firefly 15 G7 LGD064F, IPS LED, 15.6", 3840x2160 | |
|---|---|---|---|---|---|---|
| Display | -1% | 5% | 4% | -0% | -17% | |
| Display P3 Coverage (%) | 95.9 | 95.6 0% | 94.9 -1% | 99.9 4% | 84.5 -12% | 68.8 -28% |
| sRGB Coverage (%) | 100 | 99.8 0% | 100 0% | 100 0% | 98.7 -1% | 97.7 -2% |
| AdobeRGB 1998 Coverage (%) | 87.3 | 84.5 -3% | 100 15% | 95.3 9% | 97.8 12% | 69.8 -20% |
| Response Times | -253% | -198% | 81% | -141% | -189% | |
| Response Time Grey 50% / Grey 80% * (ms) | 14.8 ? | 56 ? -278% | 47.2 ? -219% | 2.4 ? 84% | 40 ? -170% | 44 ? -197% |
| Response Time Black / White * (ms) | 11 ? | 36 ? -227% | 30.4 ? -176% | 2.4 ? 78% | 23.2 ? -111% | 30.8 ? -180% |
| PWM Frequency (Hz) | 240.4 ? | |||||
| Screen | -29% | 7% | -58% | 35% | 5% | |
| Brightness middle (cd/m²) | 626 | 672.8 7% | 501.5 -20% | 379.6 -39% | 604 -4% | 381 -39% |
| Brightness (cd/m²) | 589 | 674 14% | 467 -21% | 380 -35% | 609 3% | 382 -35% |
| Brightness Distribution (%) | 87 | 89 2% | 83 -5% | 95 9% | 91 5% | 92 6% |
| Black Level * (cd/m²) | 0.58 | 0.5 14% | 0.44 24% | 0.34 41% | 0.21 64% | |
| Contrast (:1) | 1079 | 1346 25% | 1140 6% | 1776 65% | 1814 68% | |
| Colorchecker dE 2000 * | 5.41 | 3.48 36% | 4.73 13% | 5.15 5% | 0.9 83% | 3 45% |
| Colorchecker dE 2000 max. * | 9.05 | 9.44 -4% | 8.45 7% | 7.79 14% | 2.6 71% | 5.2 43% |
| Colorchecker dE 2000 calibrated * | 0.6 | 3.03 -405% | 0.51 15% | 3.1 -417% | 0.8 -33% | 1.5 -150% |
| Greyscale dE 2000 * | 6.2 | 3.1 50% | 3.6 42% | 2.6 58% | 1.1 82% | 3.5 44% |
| Gamma | 2.66 83% | 2.04 108% | 2.08 106% | 1.99 111% | 2.15 102% | 2.26 97% |
| CCT | 6101 107% | 6380 102% | 6447 101% | 6166 105% | 6656 98% | 7254 90% |
| Color Space (Percent of AdobeRGB 1998) (%) | 75.2 | 84.5 | 64.3 | |||
| Color Space (Percent of sRGB) (%) | 100 | 98.6 | 97.5 | |||
| Moyenne finale (programmes/paramètres) | -94% /
-55% | -62% /
-23% | 9% /
-19% | -35% /
2% | -67% /
-27% |
* ... Moindre est la valeur, meilleures sont les performances
Notre colorimètre X-Rite indique une couverture DCI-P3 de 96 %, contre 100 % annoncés par HP. Combinez les couleurs étendues avec les temps de réponse très rapides et vous avez un panneau 4K qui fonctionne extrêmement bien pour les applications professionnelles d'édition graphique et de jeu.
L'écran aurait pu être mieux calibré par rapport à la norme DCI-P3. Les valeurs moyennes du deltaE des niveaux de gris et des couleurs sont respectivement de 6,2 et 5,41, avec une température de couleur trop chaude de 6100. Le fait de calibrer nous-mêmes le panneau avec un colorimètre X-Rite permet de remédier à ces défauts.
Temps de réponse de l'écran
| ↔ Temps de réponse noir à blanc | ||
|---|---|---|
| 11 ms ... hausse ↗ et chute ↘ combinées | ↗ 7.6 ms hausse | 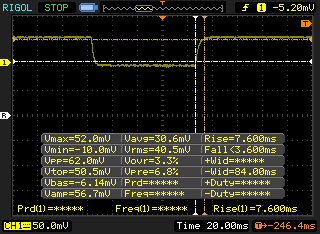 |
| ↘ 3.4 ms chute | ||
| L'écran montre de bons temps de réponse, mais insuffisant pour du jeu compétitif. En comparaison, tous les appareils testés affichent entre 0.1 (minimum) et 240 (maximum) ms. » 30 % des appareils testés affichent de meilleures performances. Cela signifie que les latences relevées sont meilleures que la moyenne (19.8 ms) de tous les appareils testés. | ||
| ↔ Temps de réponse gris 50% à gris 80% | ||
| 14.8 ms ... hausse ↗ et chute ↘ combinées | ↗ 7.6 ms hausse | 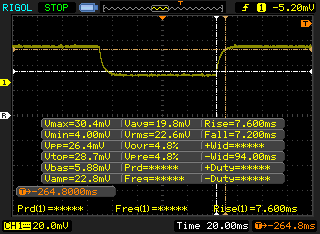 |
| ↘ 7.2 ms chute | ||
| L'écran montre de bons temps de réponse, mais insuffisant pour du jeu compétitif. En comparaison, tous les appareils testés affichent entre 0.165 (minimum) et 636 (maximum) ms. » 29 % des appareils testés affichent de meilleures performances. Cela signifie que les latences relevées sont meilleures que la moyenne (31 ms) de tous les appareils testés. | ||
Scintillement / MLI (Modulation de largeur d'impulsion)
| Scintillement / MLI (Modulation de largeur d'impulsion) non décelé | 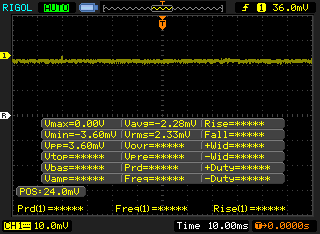 | ||
En comparaison, 52 % des appareils testés n'emploient pas MDI pour assombrir leur écran. Nous avons relevé une moyenne à 7765 (minimum : 5 - maximum : 343500) Hz dans le cas où une MDI était active. | |||
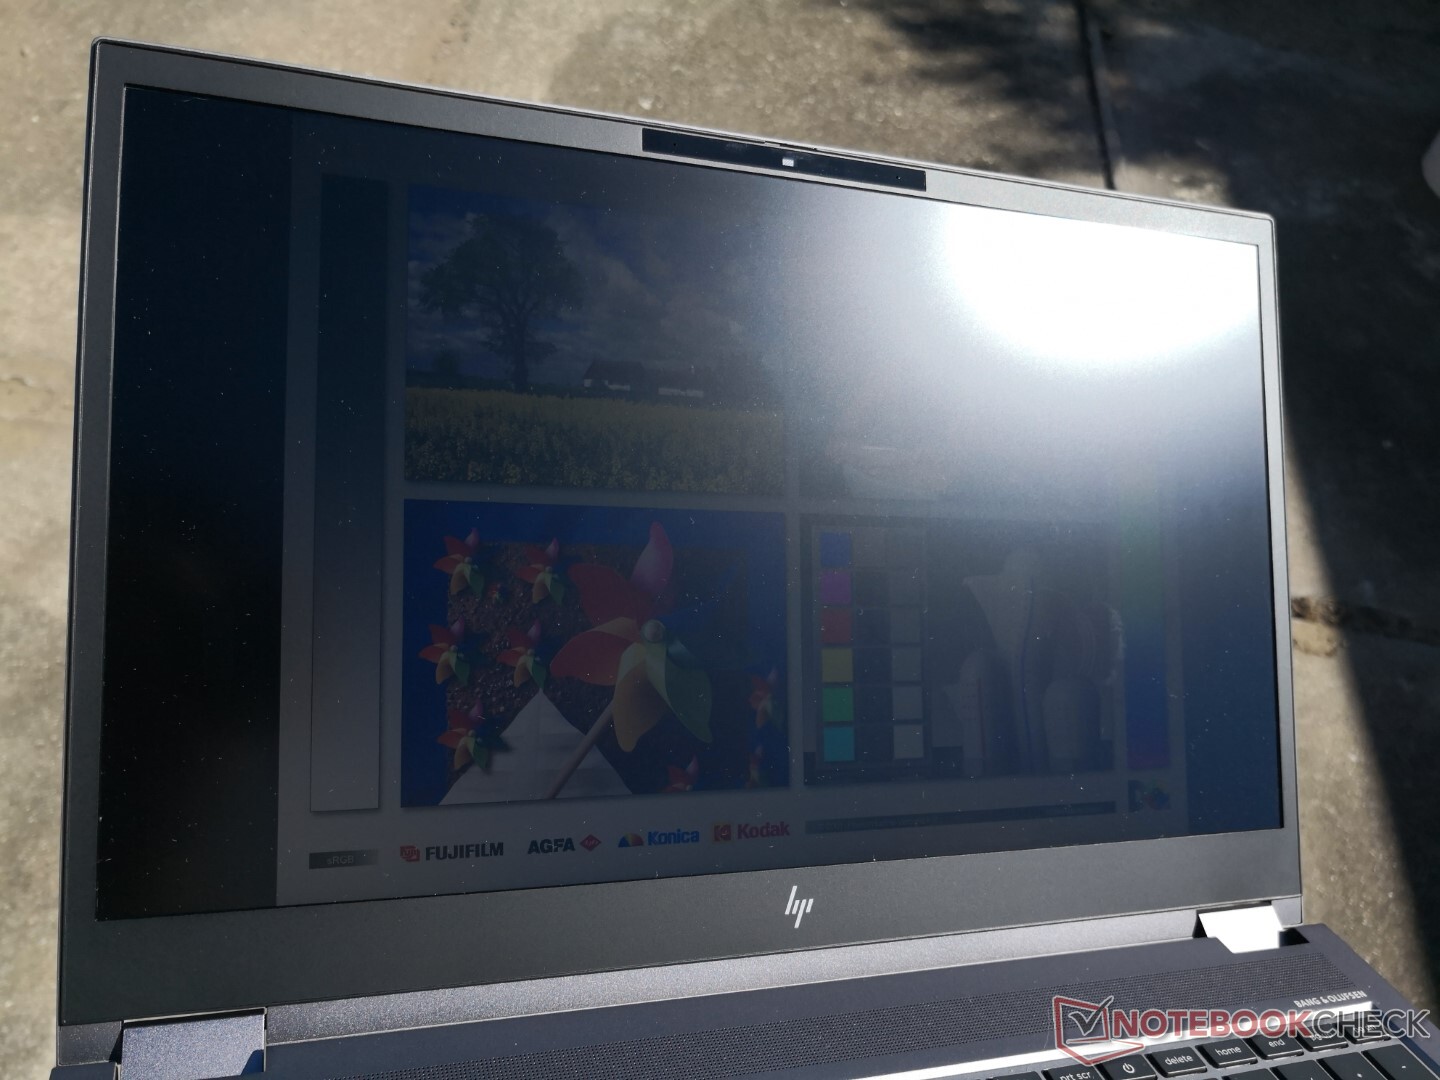
La visibilité en extérieur est meilleure que sur de nombreuses autres stations de travail grâce au rétroéclairage extra-lumineux de 600 nit. Même le propre HPZBook Studio 15 G8 ou Firefly 15 G7 n'approchent pas les 400 nits chacun à leurs paramètres de luminosité maximale respectifs. Néanmoins, vous voudrez toujours mettre la police à l'échelle de manière appropriée et travailler à l'ombre pour maximiser la visibilité.
Performances - Intel 11e génération
Les options de CPU comprennent les CPU Tiger Lake-H et les GPU Nvidia T1200 et RTX série A jusqu'au RTX A5000. Des options Xeon et même Radeon Pro W6600M sont également disponibles pour un très large éventail d'options configurables. Les options haut de gamme, en particulier, sont parmi les processeurs de classe station de travail mobile les plus rapides que vous pouvez trouver sur un ordinateur portable
Les fonctions Resizable Bar et Dynamic Boost 2.0 sont prises en charge, tandis que Advanced Optimus et WhisperMode 2.0 ne le sont pas. Malheureusement, il n'y a pas non plus de commutateur graphique manuel.
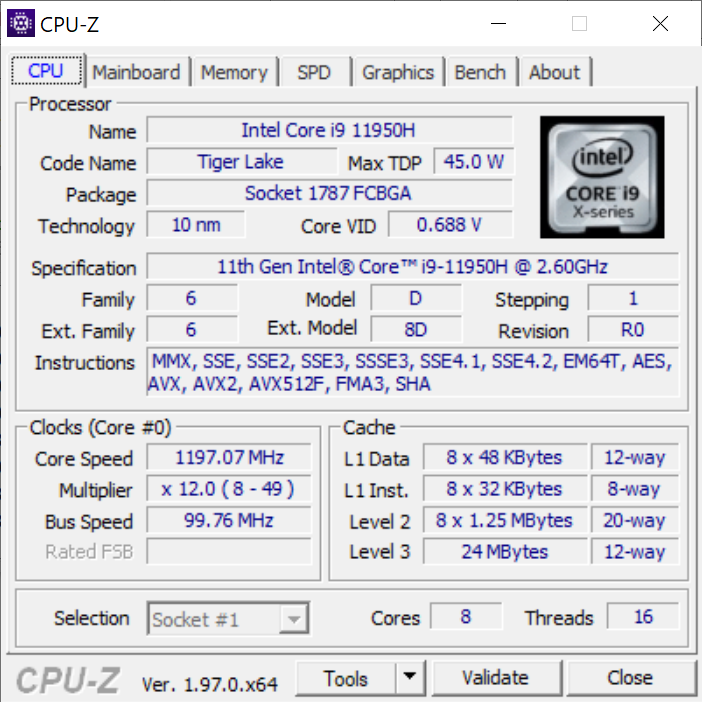
Processeur
Les performances du CPU multithread sont inférieures de quelques points de pourcentage à celles du Core i9-11900H que l'on trouve dans le concurrent MSI WS66 ce qui est normal compte tenu de l'intégration des fonctions vPro Le Core i9-11950H restent toutefois excellentes et comparables à celles de son homologue non vPro. Les performances globales en multithread sont supérieures d'environ 15 % à celles du Xeon W-10885M dans le ZBook Fury 15 G7 de l'année dernière, mais sans prise en charge de la RAM ECC, bien sûr.
Cinebench R15 Multi Loop
Cinebench R23: Multi Core | Single Core
Cinebench R15: CPU Multi 64Bit | CPU Single 64Bit
Blender: v2.79 BMW27 CPU
7-Zip 18.03: 7z b 4 -mmt1 | 7z b 4
Geekbench 5.5: Single-Core | Multi-Core
HWBOT x265 Benchmark v2.2: 4k Preset
LibreOffice : 20 Documents To PDF
R Benchmark 2.5: Overall mean
| Cinebench R23 / Multi Core | |
| Lenovo Legion 5 15ACH-82JU00C6GE-FL | |
| MSI GS76 Stealth 11UH | |
| Moyenne Intel Core i9-11950H (12048 - 13113, n=4) | |
| HP ZBook Fury 15 G8 | |
| Lenovo ThinkPad P15 G2-20YQ001JGE | |
| Dell Precision 5000 5560 | |
| Gigabyte Aero 15 OLED XC | |
| HP ZBook Fury 15 G7 | |
| Cinebench R23 / Single Core | |
| HP ZBook Fury 15 G8 | |
| Moyenne Intel Core i9-11950H (1569 - 1633, n=4) | |
| MSI GS76 Stealth 11UH | |
| Dell Precision 5000 5560 | |
| Lenovo ThinkPad P15 G2-20YQ001JGE | |
| Lenovo Legion 5 15ACH-82JU00C6GE-FL | |
| HP ZBook Fury 15 G7 | |
| Gigabyte Aero 15 OLED XC | |
| Geekbench 5.5 / Single-Core | |
| Moyenne Intel Core i9-11950H (1623 - 1702, n=3) | |
| MSI GS76 Stealth 11UH | |
| Lenovo ThinkPad P15 G2-20YQ001JGE | |
| Lenovo Legion 5 15ACH-82JU00C6GE-FL | |
| Acer Nitro 5 AN515-45-R05E | |
| HP ZBook Fury 15 G7 | |
| Dell Precision 5550 P91F | |
| Gigabyte Aero 15 OLED XC | |
| Geekbench 5.5 / Multi-Core | |
| MSI GS76 Stealth 11UH | |
| Lenovo ThinkPad P15 G2-20YQ001JGE | |
| Dell Precision 5550 P91F | |
| Moyenne Intel Core i9-11950H (7286 - 8152, n=3) | |
| Gigabyte Aero 15 OLED XC | |
| Lenovo Legion 5 15ACH-82JU00C6GE-FL | |
| HP ZBook Fury 15 G7 | |
| Acer Nitro 5 AN515-45-R05E | |
| HWBOT x265 Benchmark v2.2 / 4k Preset | |
| Lenovo Legion 5 15ACH-82JU00C6GE-FL | |
| MSI GS76 Stealth 11UH | |
| HP ZBook Fury 15 G8 | |
| Moyenne Intel Core i9-11950H (13.8 - 14.5, n=4) | |
| Lenovo ThinkPad P15 G2-20YQ001JGE | |
| Dell Precision 5000 5560 | |
| Gigabyte Aero 15 OLED XC | |
| Acer Nitro 5 AN515-45-R05E | |
| Dell Precision 5550 P91F | |
| HP ZBook Fury 15 G7 | |
| LibreOffice / 20 Documents To PDF | |
| Lenovo Legion 5 15ACH-82JU00C6GE-FL | |
| Gigabyte Aero 15 OLED XC | |
| HP ZBook Fury 15 G7 | |
| Acer Nitro 5 AN515-45-R05E | |
| HP ZBook Fury 15 G8 | |
| MSI GS76 Stealth 11UH | |
| Lenovo ThinkPad P15 G2-20YQ001JGE | |
| Moyenne Intel Core i9-11950H (38.6 - 53.2, n=4) | |
| Dell Precision 5000 5560 | |
| Dell Precision 5550 P91F | |
| R Benchmark 2.5 / Overall mean | |
| Dell Precision 5550 P91F | |
| Gigabyte Aero 15 OLED XC | |
| Lenovo ThinkPad P15 G2-20YQ001JGE | |
| HP ZBook Fury 15 G7 | |
| HP ZBook Fury 15 G8 | |
| Dell Precision 5000 5560 | |
| Acer Nitro 5 AN515-45-R05E | |
| Moyenne Intel Core i9-11950H (0.521 - 0.551, n=4) | |
| Lenovo Legion 5 15ACH-82JU00C6GE-FL | |
| MSI GS76 Stealth 11UH | |
* ... Moindre est la valeur, meilleures sont les performances
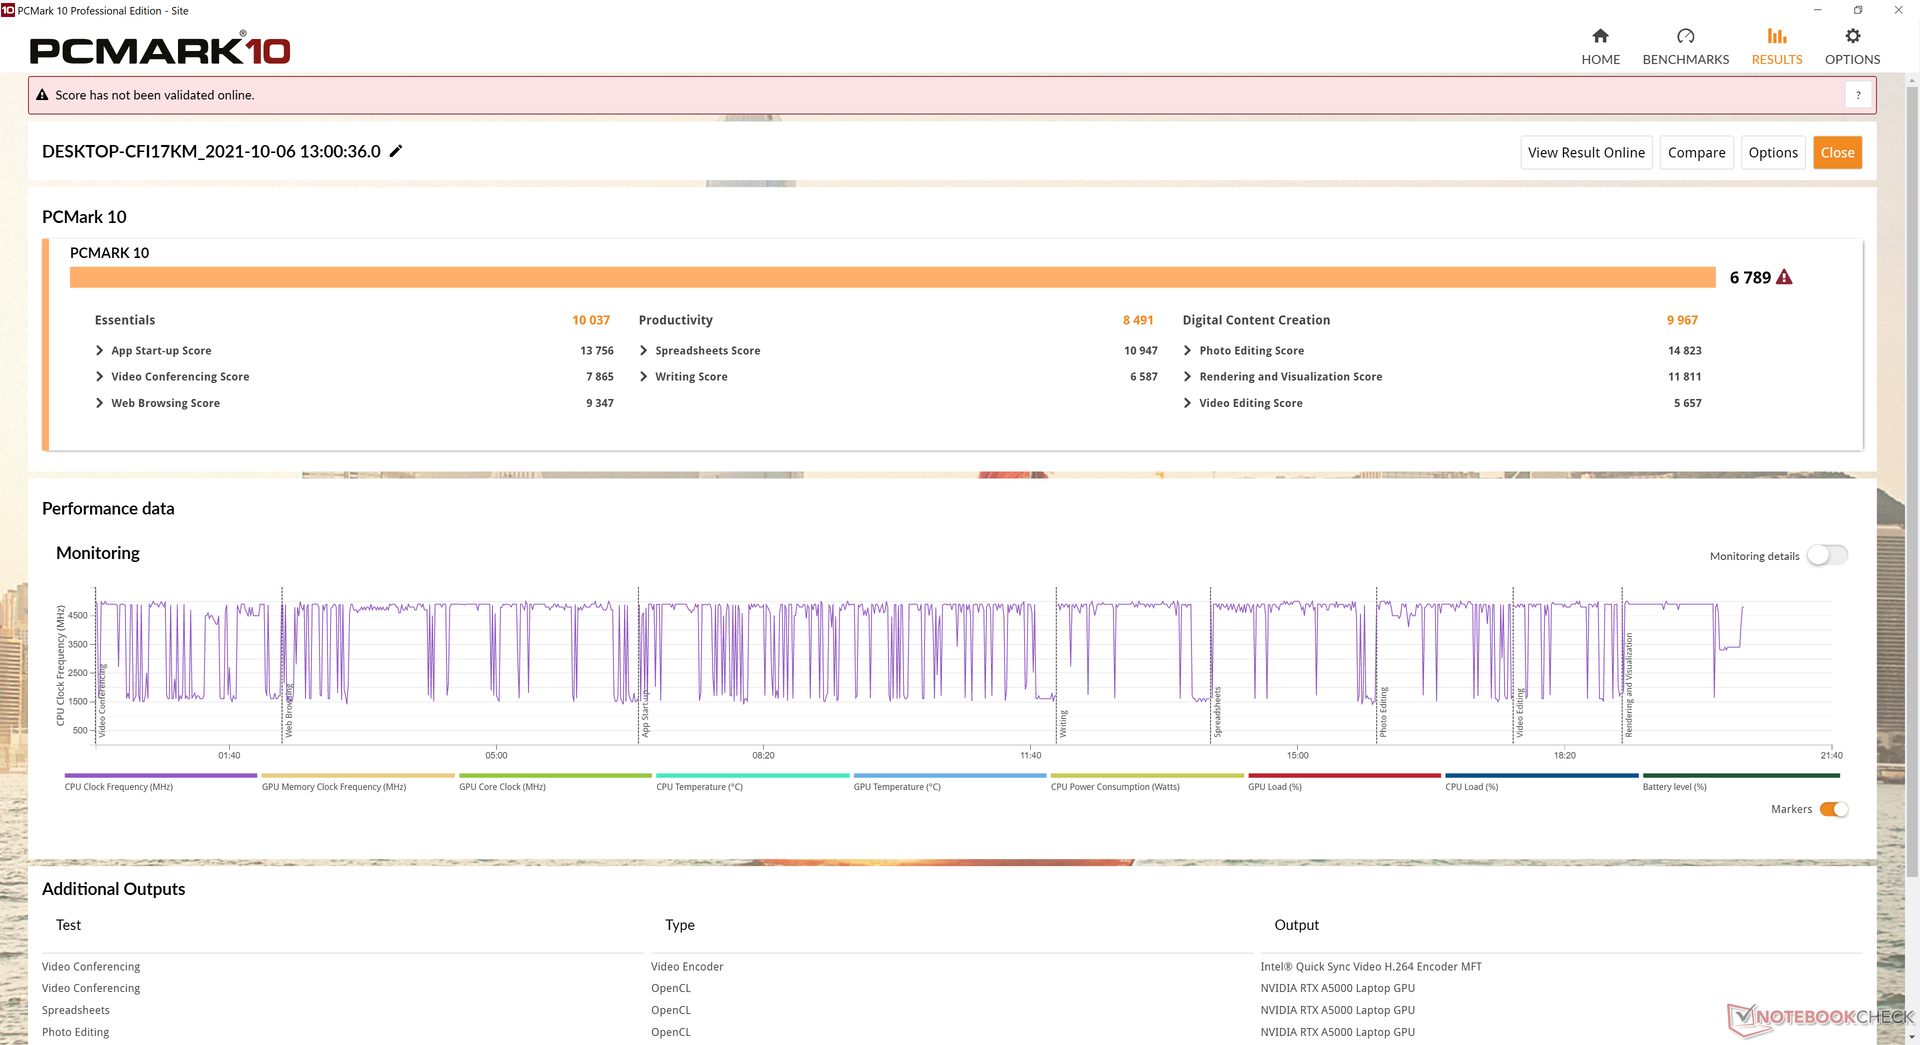
Performance du système
Les scores PCMark sont systématiquement plus élevés que ceux que nous avons enregistrés sur le Fury 15 G7 tout en étant presque identiques à ceux que nous avons enregistrés sur l'épais Studio 15 G8 avec des graphiques RTX 3070.
| PCMark 10 / Score | |
| HP ZBook Fury 15 G8 | |
| Moyenne Intel Core i9-11950H, NVIDIA RTX A5000 Laptop GPU (n=1) | |
| HP ZBook Studio 15 G8 | |
| Dell Precision 5000 5560 | |
| HP ZBook Fury 15 G7 | |
| Lenovo ThinkPad P15s Gen2-20W6000GGE | |
| HP ZBook Firefly 15 G7 | |
| PCMark 10 / Essentials | |
| Dell Precision 5000 5560 | |
| HP ZBook Fury 15 G8 | |
| Moyenne Intel Core i9-11950H, NVIDIA RTX A5000 Laptop GPU (n=1) | |
| HP ZBook Studio 15 G8 | |
| Lenovo ThinkPad P15s Gen2-20W6000GGE | |
| HP ZBook Fury 15 G7 | |
| HP ZBook Firefly 15 G7 | |
| PCMark 10 / Productivity | |
| Lenovo ThinkPad P15s Gen2-20W6000GGE | |
| Dell Precision 5000 5560 | |
| HP ZBook Fury 15 G8 | |
| Moyenne Intel Core i9-11950H, NVIDIA RTX A5000 Laptop GPU (n=1) | |
| HP ZBook Studio 15 G8 | |
| HP ZBook Fury 15 G7 | |
| HP ZBook Firefly 15 G7 | |
| PCMark 10 / Digital Content Creation | |
| HP ZBook Fury 15 G8 | |
| Moyenne Intel Core i9-11950H, NVIDIA RTX A5000 Laptop GPU (n=1) | |
| HP ZBook Studio 15 G8 | |
| Dell Precision 5000 5560 | |
| HP ZBook Fury 15 G7 | |
| Lenovo ThinkPad P15s Gen2-20W6000GGE | |
| HP ZBook Firefly 15 G7 | |
| PCMark 10 Score | 6789 points | |
Aide | ||
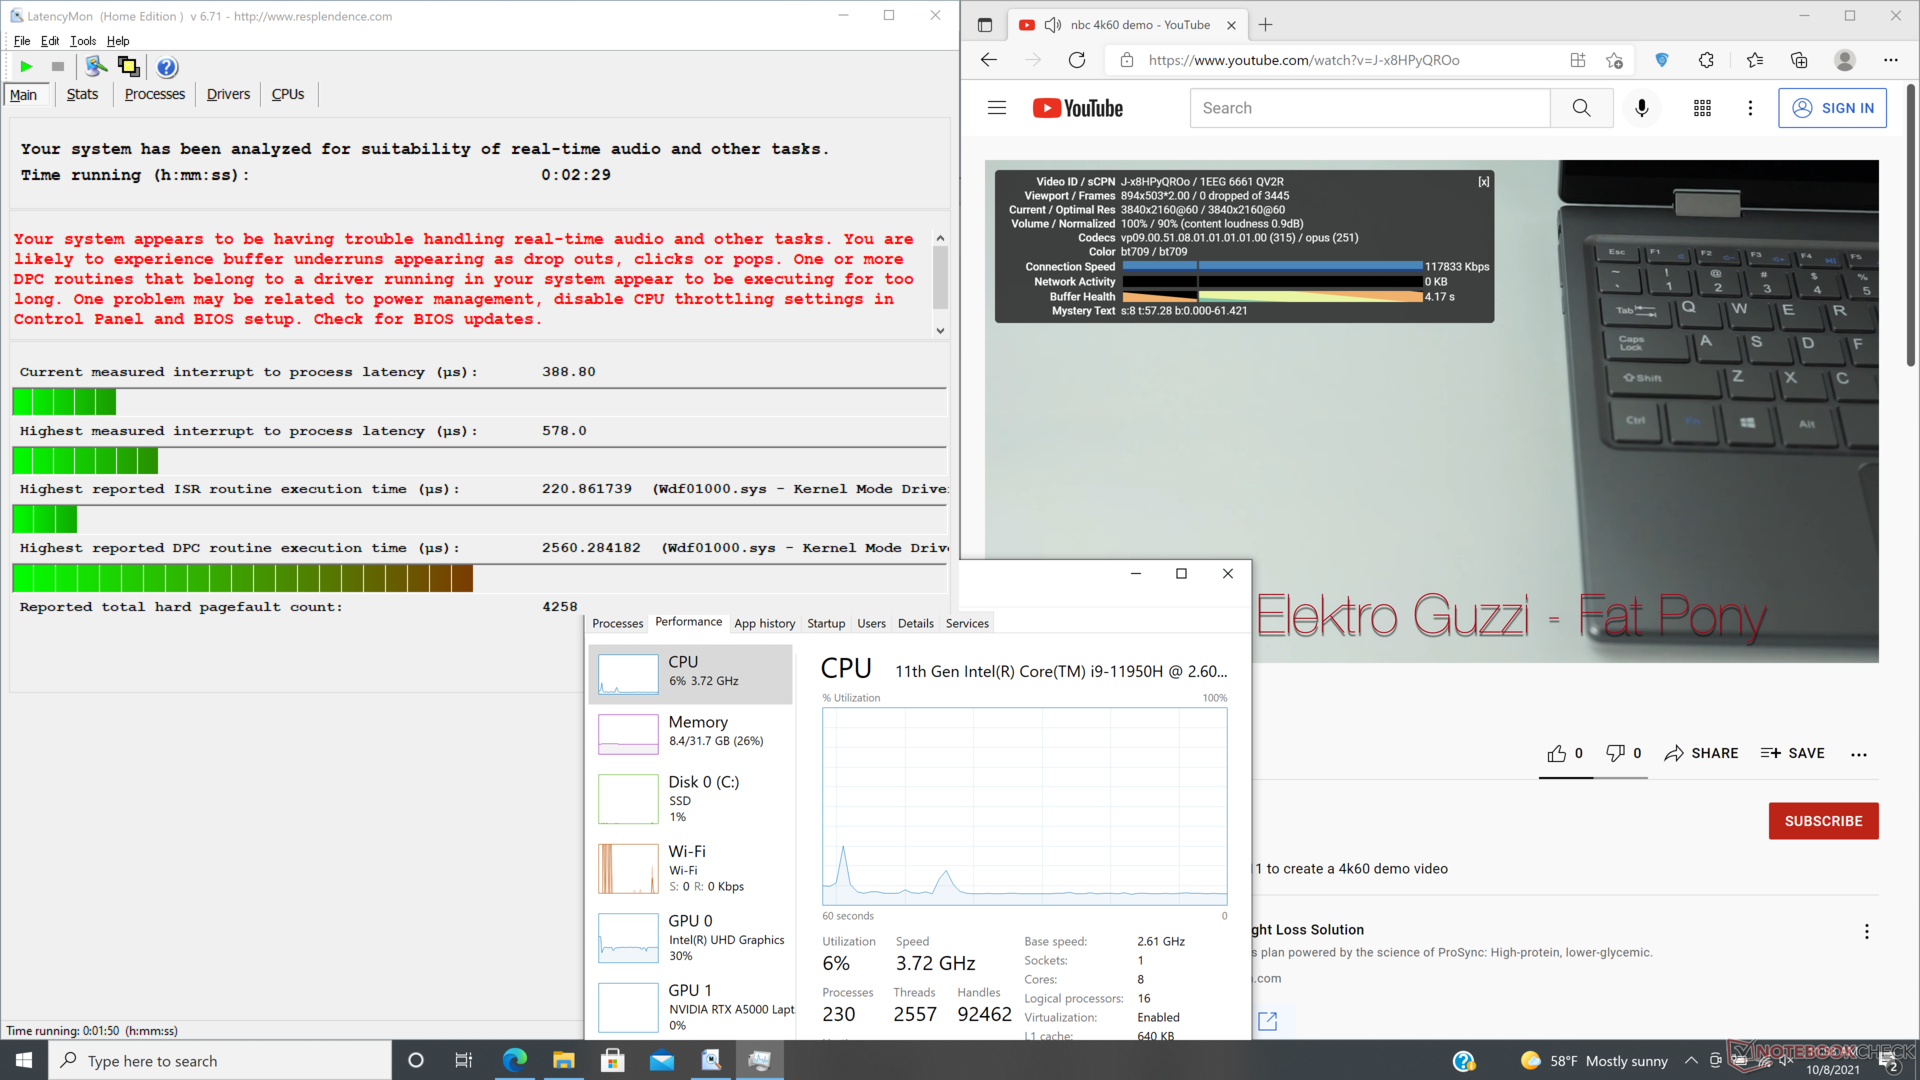
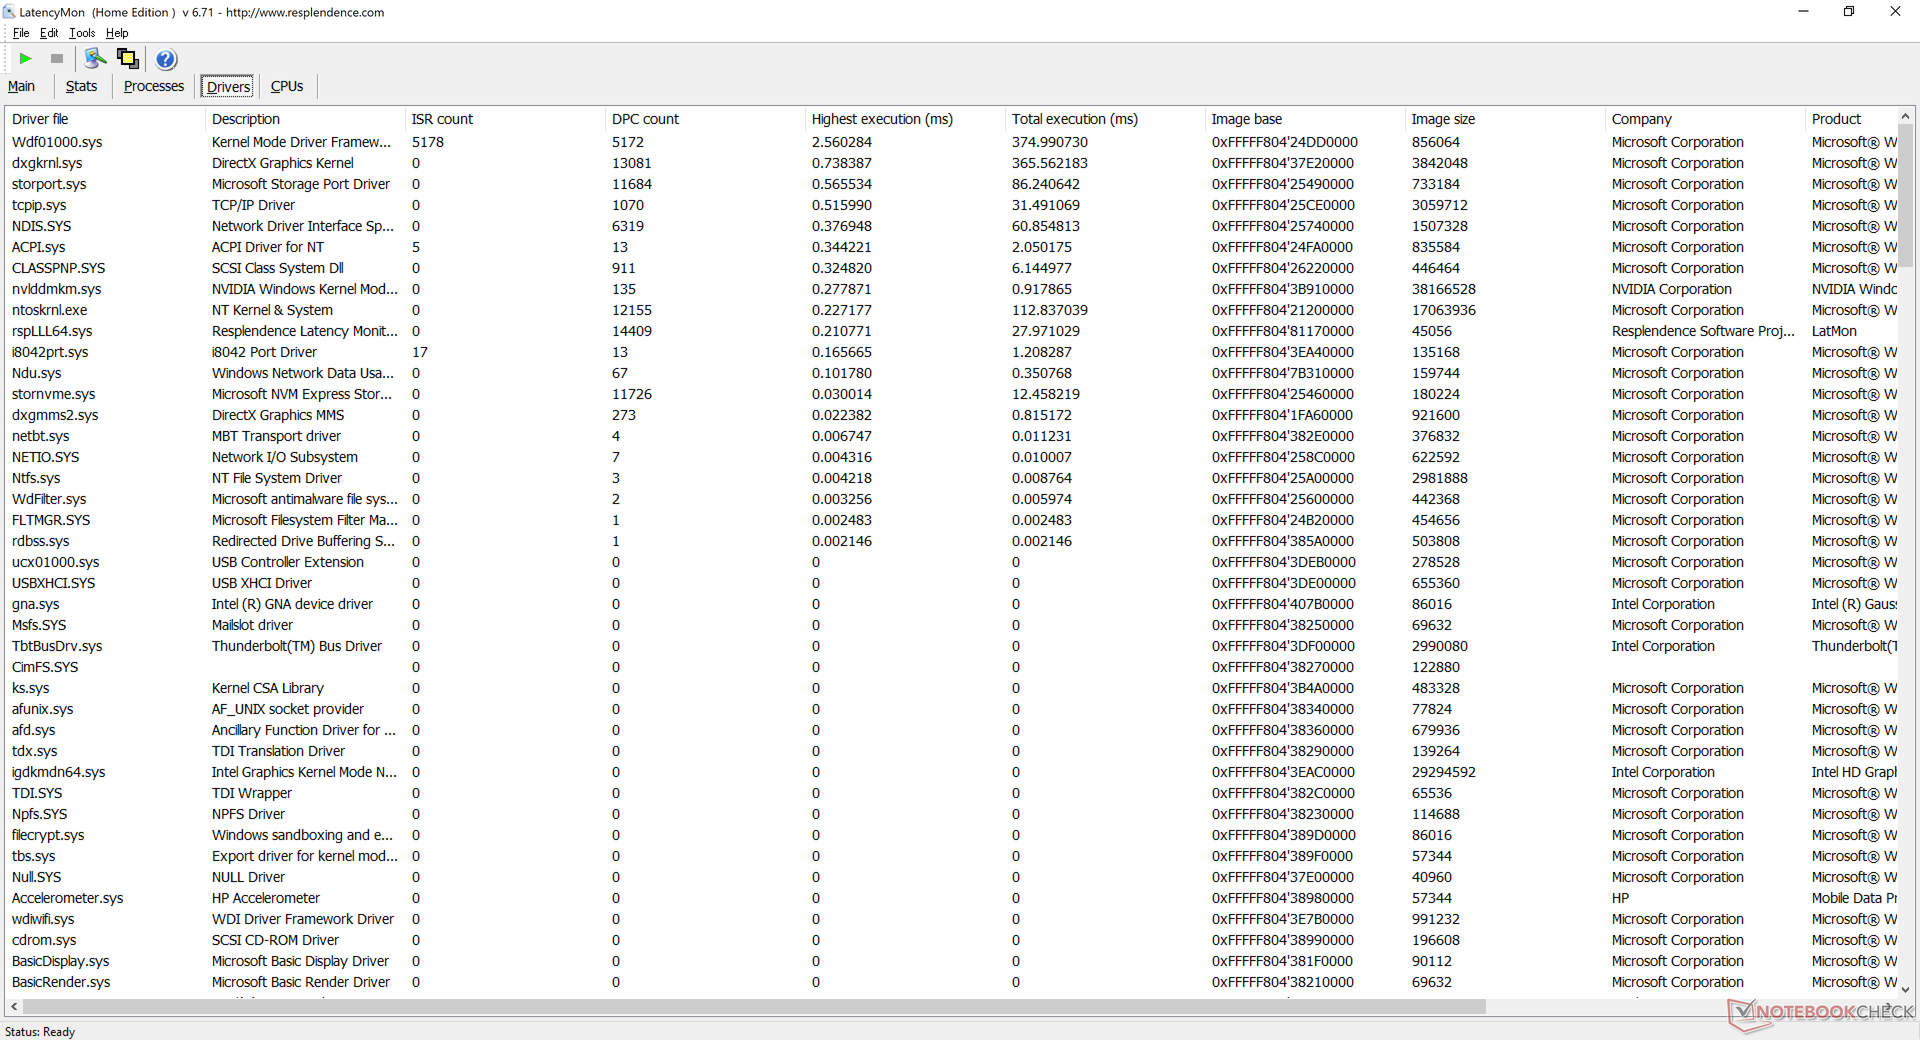
Latence DPC
LatencyMon ne révèle aucune interruption majeure de la latence lors de l'ouverture de plusieurs onglets de navigateur sur notre page d'accueil ou lors de l'exécution du stress Prime95. Les temps de routine DPC, cependant, connaîtraient des pics un peu comme ce que nous avons observé sur le Fury 15 G7 de l'année dernière. La lecture de vidéos 4K à 60 FPS est par ailleurs fluide et ne présente aucune perte d'images.
| DPC Latencies / LatencyMon - interrupt to process latency (max), Web, Youtube, Prime95 | |
| Lenovo ThinkPad P15s Gen2-20W6000GGE | |
| HP ZBook Firefly 15 G7 | |
| HP ZBook Fury 15 G7 | |
| HP ZBook Studio 15 G8 | |
| Dell Precision 5000 5560 | |
| HP ZBook Fury 15 G8 | |
* ... Moindre est la valeur, meilleures sont les performances
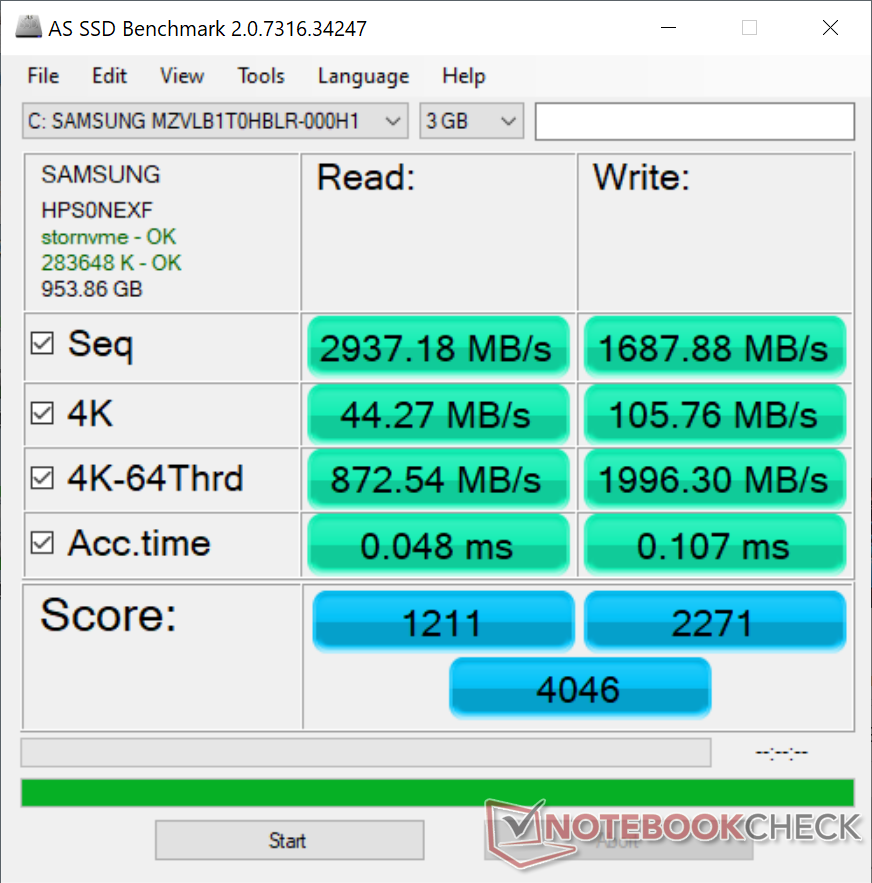
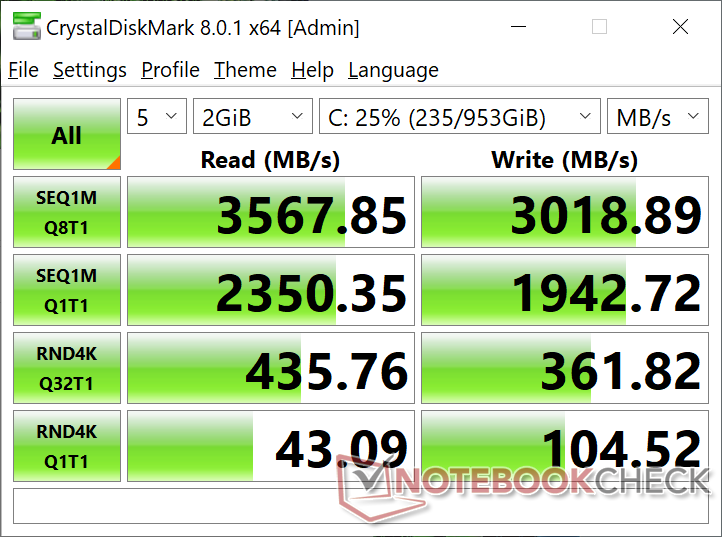
Dispositifs de stockage - De nombreuses options
Notre unité peut supporter jusqu'à quatre disques de stockage internes (2x M.2 2280, 1x M.2 2242, 1x 2,5 pouces SATA III). Il est intéressant de noter que HP n'offre pas d'options PCIe4, car toutes les UGS actuelles sont livrées avec des SSD PCIe3, tels que le familier Samsung PM981a. Nous avons contacté HP pour essayer de confirmer si les vitesses PCIe4 NVMe sont supportées et nous mettrons à jour cette page en conséquence.
| HP ZBook Fury 15 G8 Samsung PM981a MZVLB1T0HBLR | HP ZBook Fury 15 G7 Samsung PM981a MZVLB1T0HBLR | Dell Precision 5000 5560 Samsung PM9A1 MZVL22T0HBLB | HP ZBook Studio 15 G8 Samsung PM981a MZVLB2T0HALB | Lenovo ThinkPad P15s Gen2-20W6000GGE WDC PC SN720 SDAQNTW-1T00 | HP ZBook Firefly 15 G7 Toshiba XG6 KXG60ZNV1T02 | |
|---|---|---|---|---|---|---|
| AS SSD | 24% | 93% | 104% | 19% | -1% | |
| Seq Read (MB/s) | 2937 | 2127 -28% | 5169 76% | 2953 1% | 2796 -5% | 2666 -9% |
| Seq Write (MB/s) | 1688 | 1296 -23% | 1986 18% | 1691 0% | 2525 50% | 1257 -26% |
| 4K Read (MB/s) | 44.27 | 54.8 24% | 78 76% | 43.98 -1% | 50.9 15% | 48.04 9% |
| 4K Write (MB/s) | 105.8 | 110.8 5% | 214.6 103% | 105.4 0% | 211.9 100% | 137.5 30% |
| 4K-64 Read (MB/s) | 873 | 1420 63% | 1232 41% | 1065 22% | 1505 72% | 977 12% |
| 4K-64 Write (MB/s) | 1996 | 2012 1% | 2719 36% | 1957 -2% | 949 -52% | 1142 -43% |
| Access Time Read * (ms) | 0.048 | 0.046 4% | 0.024 50% | 0.04 17% | 0.081 -69% | 0.053 -10% |
| Access Time Write * (ms) | 0.107 | 0.099 7% | 0.059 45% | 0.105 2% | 0.019 82% | 0.03 72% |
| Score Read (Points) | 1211 | 1687 39% | 1827 51% | 1404 16% | 1835 52% | 1292 7% |
| Score Write (Points) | 2271 | 2253 -1% | 3133 38% | 2232 -2% | 1413 -38% | 1406 -38% |
| Score Total (Points) | 4046 | 4770 18% | 5753 42% | 4297 6% | 4177 3% | 3297 -19% |
| Copy ISO MB/s (MB/s) | 901 | 2779 208% | 3201 255% | 2474 175% | ||
| Copy Program MB/s (MB/s) | 118.7 | 123.3 4% | 415.8 250% | 1074 805% | ||
| Copy Game MB/s (MB/s) | 372 | 440.8 18% | 1212 226% | 1929 419% | ||
| CrystalDiskMark 5.2 / 6 | 10% | 54% | 7% | 31% | 7% | |
| Write 4K (MB/s) | 96.3 | 114.1 18% | 172.4 79% | 110.5 15% | 237.6 147% | 133.1 38% |
| Read 4K (MB/s) | 51.5 | 57.2 11% | 78.8 53% | 51.8 1% | 54.7 6% | 51.6 0% |
| Write Seq (MB/s) | 1942 | 2580 33% | 2991 54% | 2071 7% | 2603 34% | 1986 2% |
| Read Seq (MB/s) | 2504 | 2527 1% | 3351 34% | 2505 0% | 1889 -25% | 2208 -12% |
| Write 4K Q32T1 (MB/s) | 346.6 | 480.2 39% | 459.2 32% | 429.8 24% | 505 46% | 462.3 33% |
| Read 4K Q32T1 (MB/s) | 408 | 387.6 -5% | 484.3 19% | 418.3 3% | 606 49% | 400.2 -2% |
| Write Seq Q32T1 (MB/s) | 3019 | 2996 -1% | 4761 58% | 3060 1% | 2795 -7% | 3074 2% |
| Read Seq Q32T1 (MB/s) | 3514 | 2853 -19% | 7071 101% | 3539 1% | 3448 -2% | 3268 -7% |
| Moyenne finale (programmes/paramètres) | 17% /
19% | 74% /
79% | 56% /
69% | 25% /
24% | 3% /
2% |
* ... Moindre est la valeur, meilleures sont les performances

Disk Throttling: DiskSpd Read Loop, Queue Depth 8
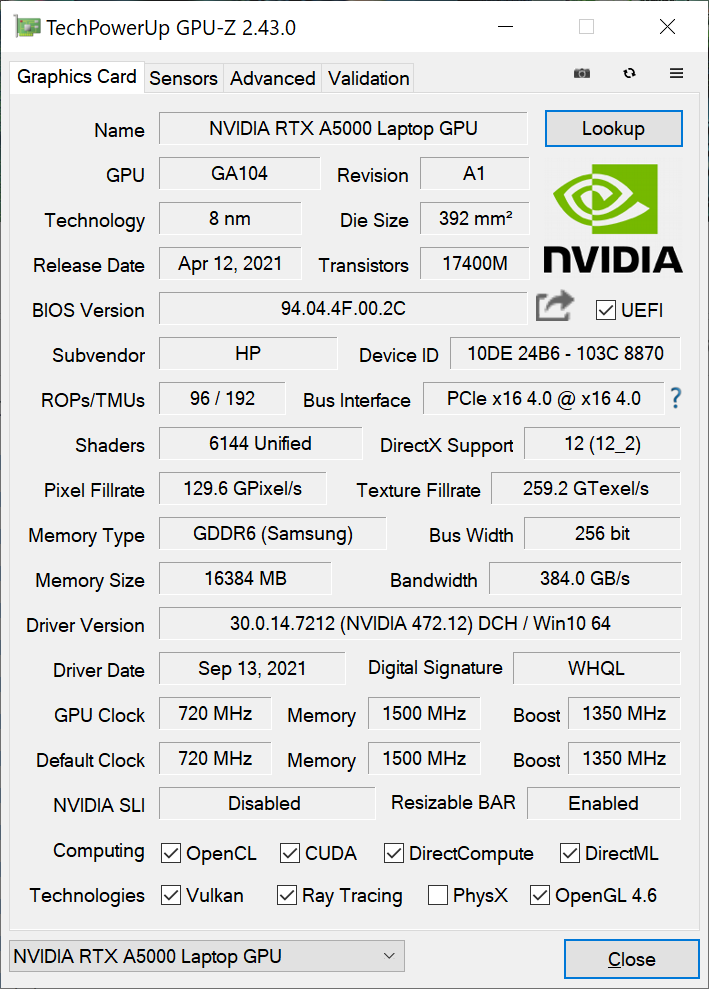
Performances du GPU - La puissance de la Quadro RTX A5000
Les performances graphiques brutes se situent entre les mobile GeForce RTX 3060 et rTX 3070 mobile pour être environ 10 à 20 % plus rapide que la Quadro RTX 5000 Max-Q dans l'ancienne Fury 15 G7. Certains sous-benchmarks dans SpecViewPerf peuvent même voir une amélioration de 40 à 50 pour cent
Bien qu'il ne soit pas optimisé pour les jeux, le système est capable d'exécuter les titres les plus exigeants en résolution QHD. Les performances globales de jeu sont similaires à celles de la carte mobile GeForce RTX 3060 dans la plupart des cas.
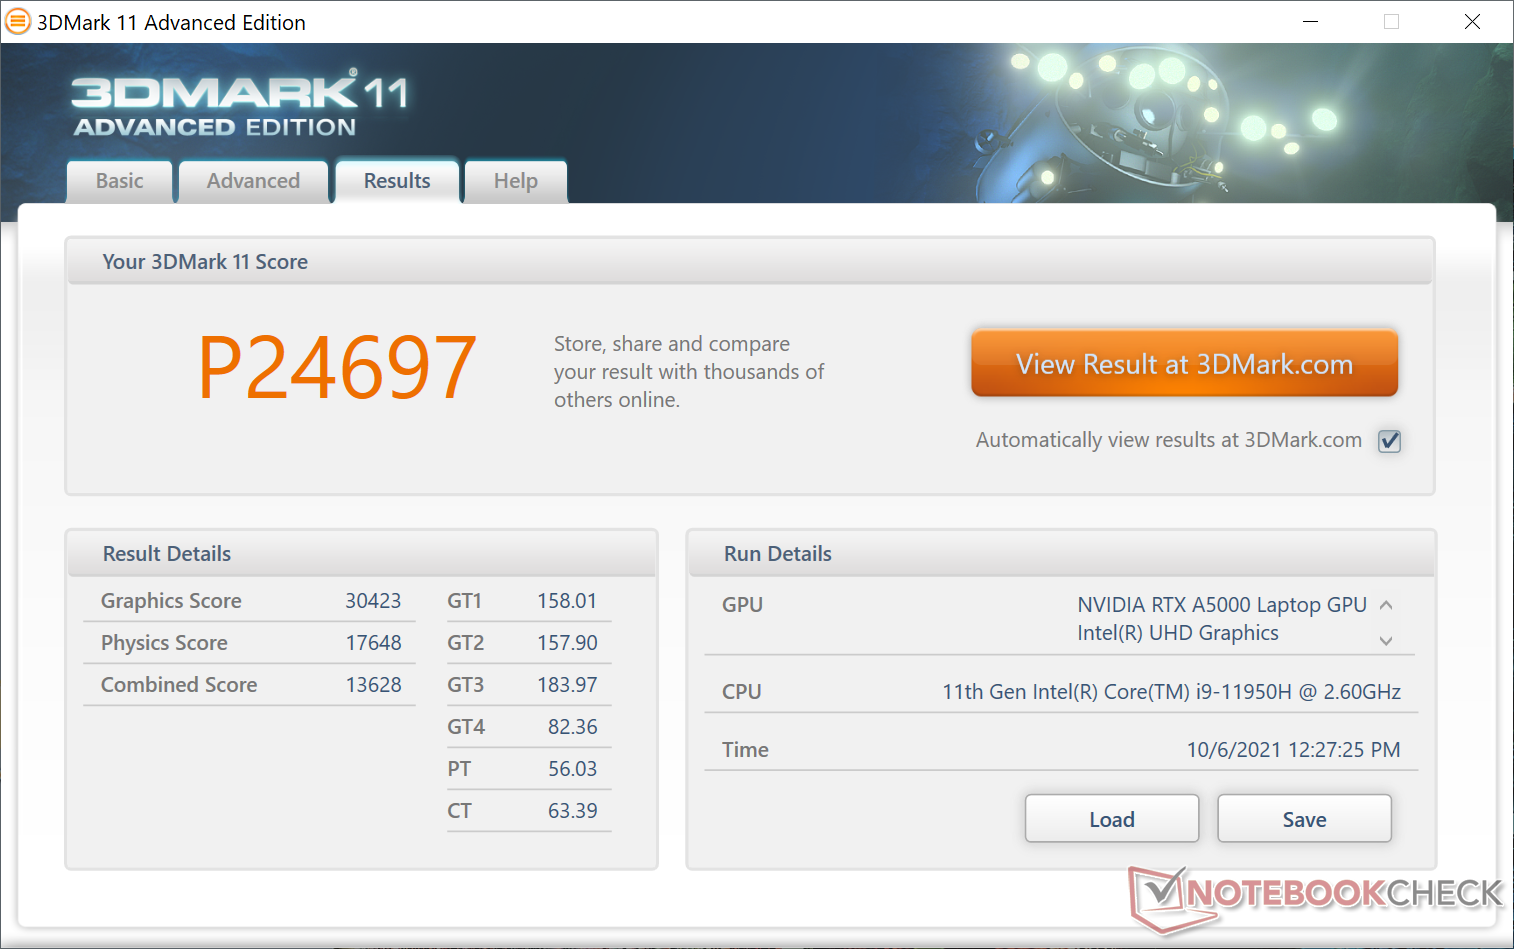
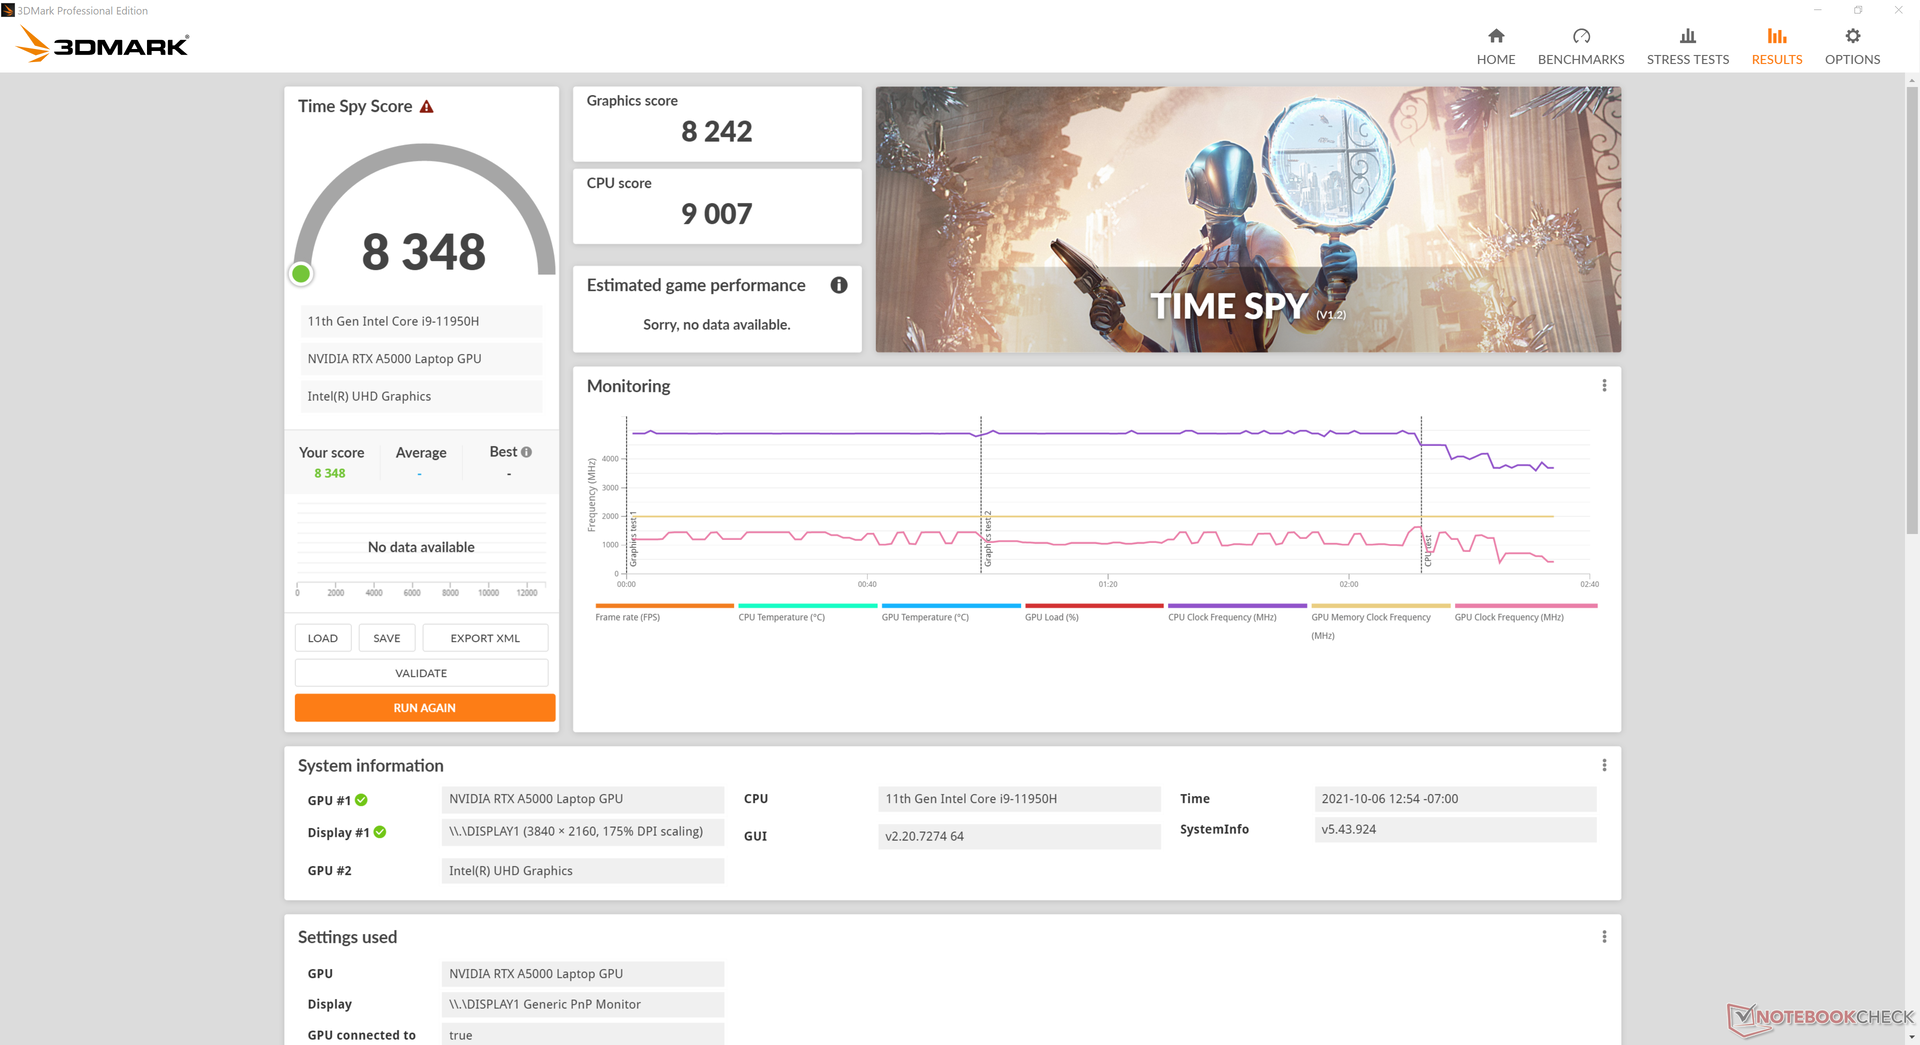
| 3DMark 11 Performance | 24697 points | |
| 3DMark Cloud Gate Standard Score | 32082 points | |
| 3DMark Fire Strike Score | 18791 points | |
| 3DMark Time Spy Score | 8348 points | |
Aide | ||
Witcher 3 FPS Chart
| Bas | Moyen | Élevé | Ultra | QHD | 4K | |
|---|---|---|---|---|---|---|
| GTA V (2015) | 175 | 169 | 131 | 76.1 | 70.4 | 75.5 |
| The Witcher 3 (2015) | 335.1 | 227.4 | 149.5 | 81.7 | 57.5 | |
| Dota 2 Reborn (2015) | 164 | 148 | 140 | 131 | 95 | |
| Final Fantasy XV Benchmark (2018) | 155 | 110 | 81.1 | 62.6 | 35.4 | |
| X-Plane 11.11 (2018) | 108 | 90.8 | 76.5 | 48.6 | ||
| Far Cry 5 (2018) | 137 | 93 | 90 | 85 | 79 | 44 |
| Strange Brigade (2018) | 337 | 195 | 165 | 147 | 108 | 64 |
| Shadow of the Tomb Raider (2018) | 128 | 109 | 106 | 94 | 71 | 38 |
| Far Cry New Dawn (2019) | 105 | 85 | 78 | 71 | 62 | 43 |
| Metro Exodus (2019) | 154 | 94.8 | 74.5 | 59.8 | 46.3 | 28.5 |
| Borderlands 3 (2019) | 159.6 | 121.6 | 85.9 | 67.1 | 46.8 | 25.6 |
| Gears Tactics (2020) | 145.8 | 181.2 | 120.3 | 94.7 | 66.6 | 34.9 |
| Horizon Zero Dawn (2020) | 133 | 109 | 101 | 91 | 73 | 40 |
| Watch Dogs Legion (2020) | 69 | 64 | 60 | 45 | 43 | 26 |
| Dirt 5 (2020) | 178.1 | 115.2 | 91.7 | 74.8 | 59.5 | 39 |
| Assassin´s Creed Valhalla (2020) | 113 | 76 | 64 | 55 | 44 | 29 |
| Immortals Fenyx Rising (2020) | 123 | 90 | 84 | 80 | 59 | 38 |
| Hitman 3 (2021) | 206.6 | 147.3 | 138.1 | 125.8 | 87.1 | 47.1 |
| F1 2021 (2021) | 164 | 136 | 122 | 85 | 59 | 38 |
Emissions
Bruit du système
Les deux ventilateurs de ~50 mm du Fury 15 G8 ont tendance à monter en régime plus tôt que sur le Fury 15 G7 lorsque des charges stressantes sont introduites. Par exemple, nous sommes capables d'enregistrer un haut 37.8 dB(A) en exécutant la première scène de benchmark de 3DMark 06 comparée à seulement 31.7 dB(A) sur le modèle plus ancien. Le bruit global du ventilateur reste plus silencieux que sur le ZBook Studio 15 G8 mais beaucoup plus fort que sur le ZBook Firefly 15 G7, plus lent.
| HP ZBook Fury 15 G8 RTX A5000 Laptop GPU, i9-11950H, Samsung PM981a MZVLB1T0HBLR | HP ZBook Fury 15 G7 Quadro RTX 5000 Max-Q, W-10885M, Samsung PM981a MZVLB1T0HBLR | Dell Precision 5000 5560 RTX A2000 Laptop GPU, i7-11850H, Samsung PM9A1 MZVL22T0HBLB | HP ZBook Studio 15 G8 GeForce RTX 3070 Laptop GPU, i9-11950H, Samsung PM981a MZVLB2T0HALB | Lenovo ThinkPad P15s Gen2-20W6000GGE T500 Laptop GPU, i7-1165G7, WDC PC SN720 SDAQNTW-1T00 | HP ZBook Firefly 15 G7 Quadro P520, i7-10610U, Toshiba XG6 KXG60ZNV1T02 | |
|---|---|---|---|---|---|---|
| Noise | -5% | 8% | -6% | 2% | -3% | |
| arrêt / environnement * (dB) | 24.1 | 26.4 -10% | 23.4 3% | 23.5 2% | 24.3 -1% | 29.3 -22% |
| Idle Minimum * (dB) | 24.1 | 26.4 -10% | 23.6 2% | 25.3 -5% | 25.5 -6% | 29.3 -22% |
| Idle Average * (dB) | 24.1 | 26.4 -10% | 23.6 2% | 25.3 -5% | 25.5 -6% | 29.3 -22% |
| Idle Maximum * (dB) | 24.8 | 26.4 -6% | 23.6 5% | 25.3 -2% | 25.5 -3% | 30 -21% |
| Load Average * (dB) | 37.8 | 31.7 16% | 25.8 32% | 41.2 -9% | 35.65 6% | 32.8 13% |
| Witcher 3 ultra * (dB) | 44.2 | 47 -6% | 40.1 9% | 49.4 -12% | 32.8 26% | |
| Load Maximum * (dB) | 44.2 | 47 -6% | 41.4 6% | 49.4 -12% | 35.65 19% | 32.8 26% |
* ... Moindre est la valeur, meilleures sont les performances
Degré de la nuisance sonore
| Au repos |
| 24.1 / 24.1 / 24.8 dB(A) |
| Fortement sollicité |
| 37.8 / 44.2 dB(A) |
 | ||
30 dB silencieux 40 dB(A) audible 50 dB(A) bruyant |
||
min: | ||
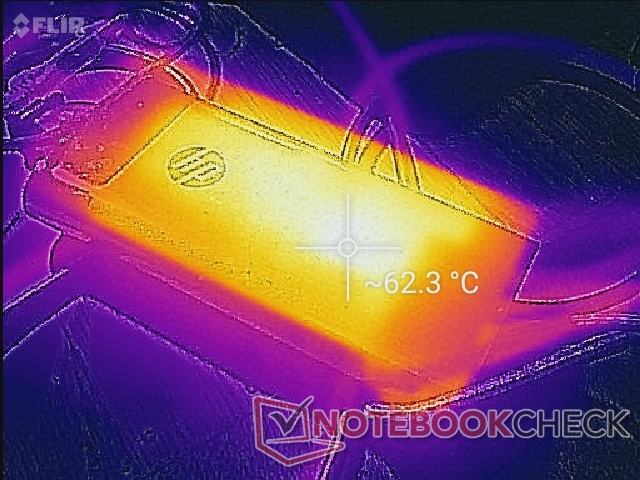
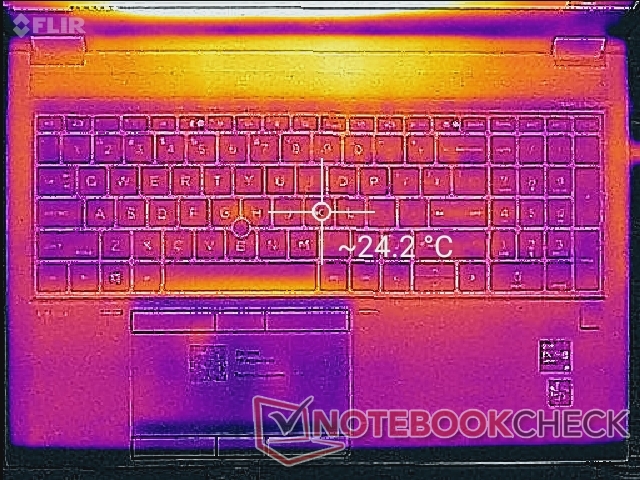
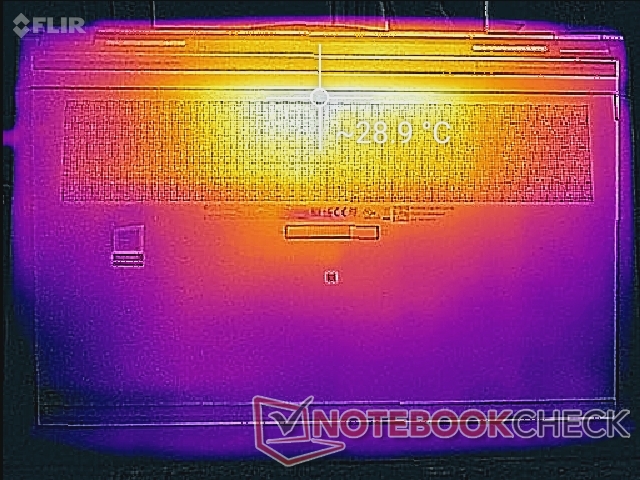
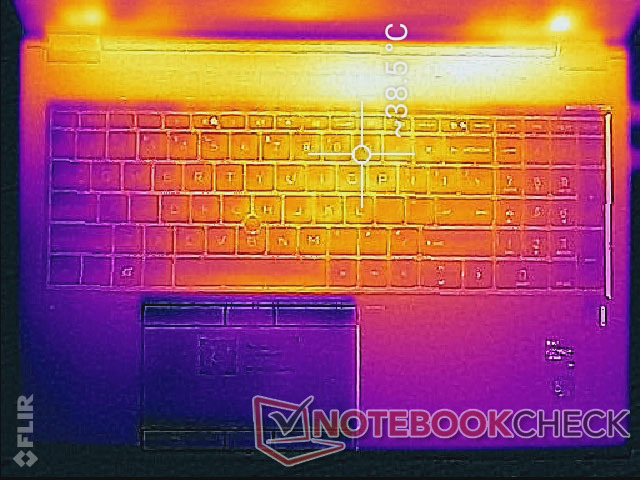
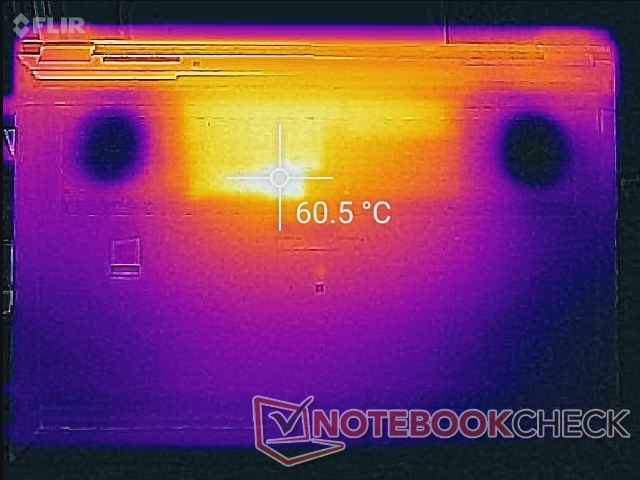
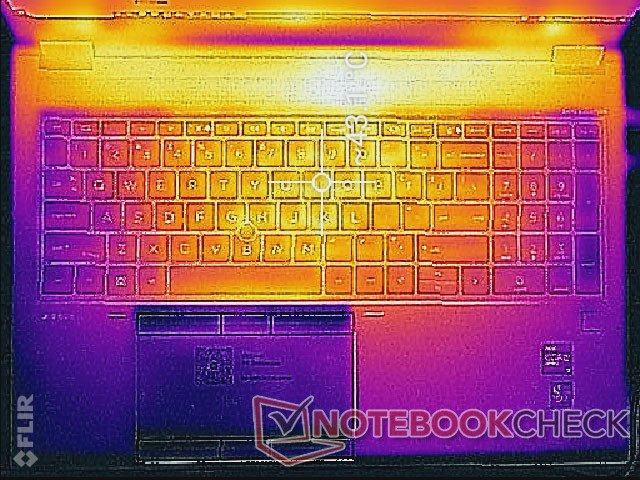
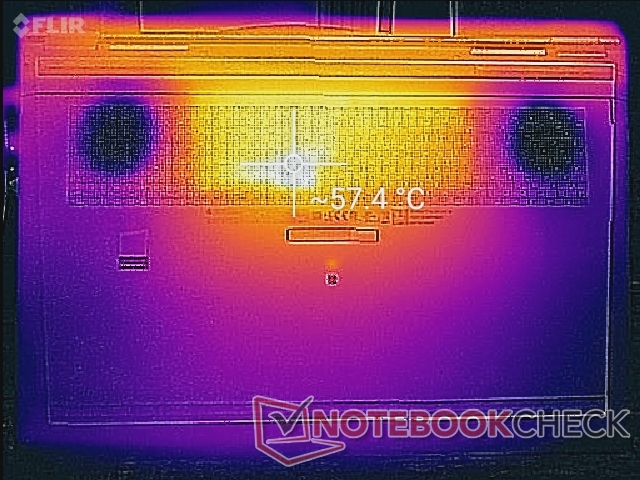
Température - Refroidissement de la chambre à vapeur
Les températures de surface peuvent atteindre jusqu'à 43 C et 60 C en haut et en bas, respectivement, contre 49 C à 53 C en haut et en bas Precision 7550 lors de l'exécution de charges exigeantes pendant des périodes prolongées. En d'autres termes, le HP est plus froid sur le dessus au prix d'un fond plus chaud, tandis que le Dell est plus froid sur le dessous au prix de touches de clavier plus chaudes.
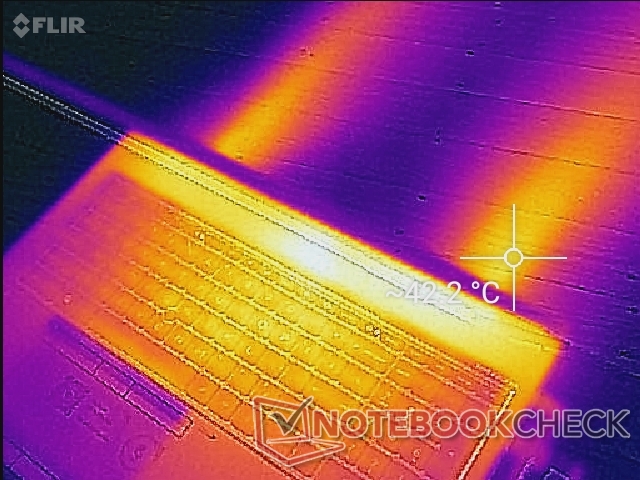
(-) La température maximale du côté supérieur est de 45.6 °C / 114 F, par rapport à la moyenne de 38.2 °C / 101 F, allant de 22.2 à 69.8 °C pour la classe Workstation.
(-) Le fond chauffe jusqu'à un maximum de 57.6 °C / 136 F, contre une moyenne de 41.1 °C / 106 F
(+) En utilisation inactive, la température moyenne du côté supérieur est de 24.4 °C / 76 F, par rapport à la moyenne du dispositif de 32 °C / 90 F.
(±) En jouant à The Witcher 3, la température moyenne du côté supérieur est de 34 °C / 93 F, alors que la moyenne de l'appareil est de 32 °C / 90 F.
(+) Les repose-poignets et le pavé tactile atteignent la température maximale de la peau (33 °C / 91.4 F) et ne sont donc pas chauds.
(-) La température moyenne de la zone de l'appui-paume de dispositifs similaires était de 27.8 °C / 82 F (-5.2 °C / #-9.4 F).
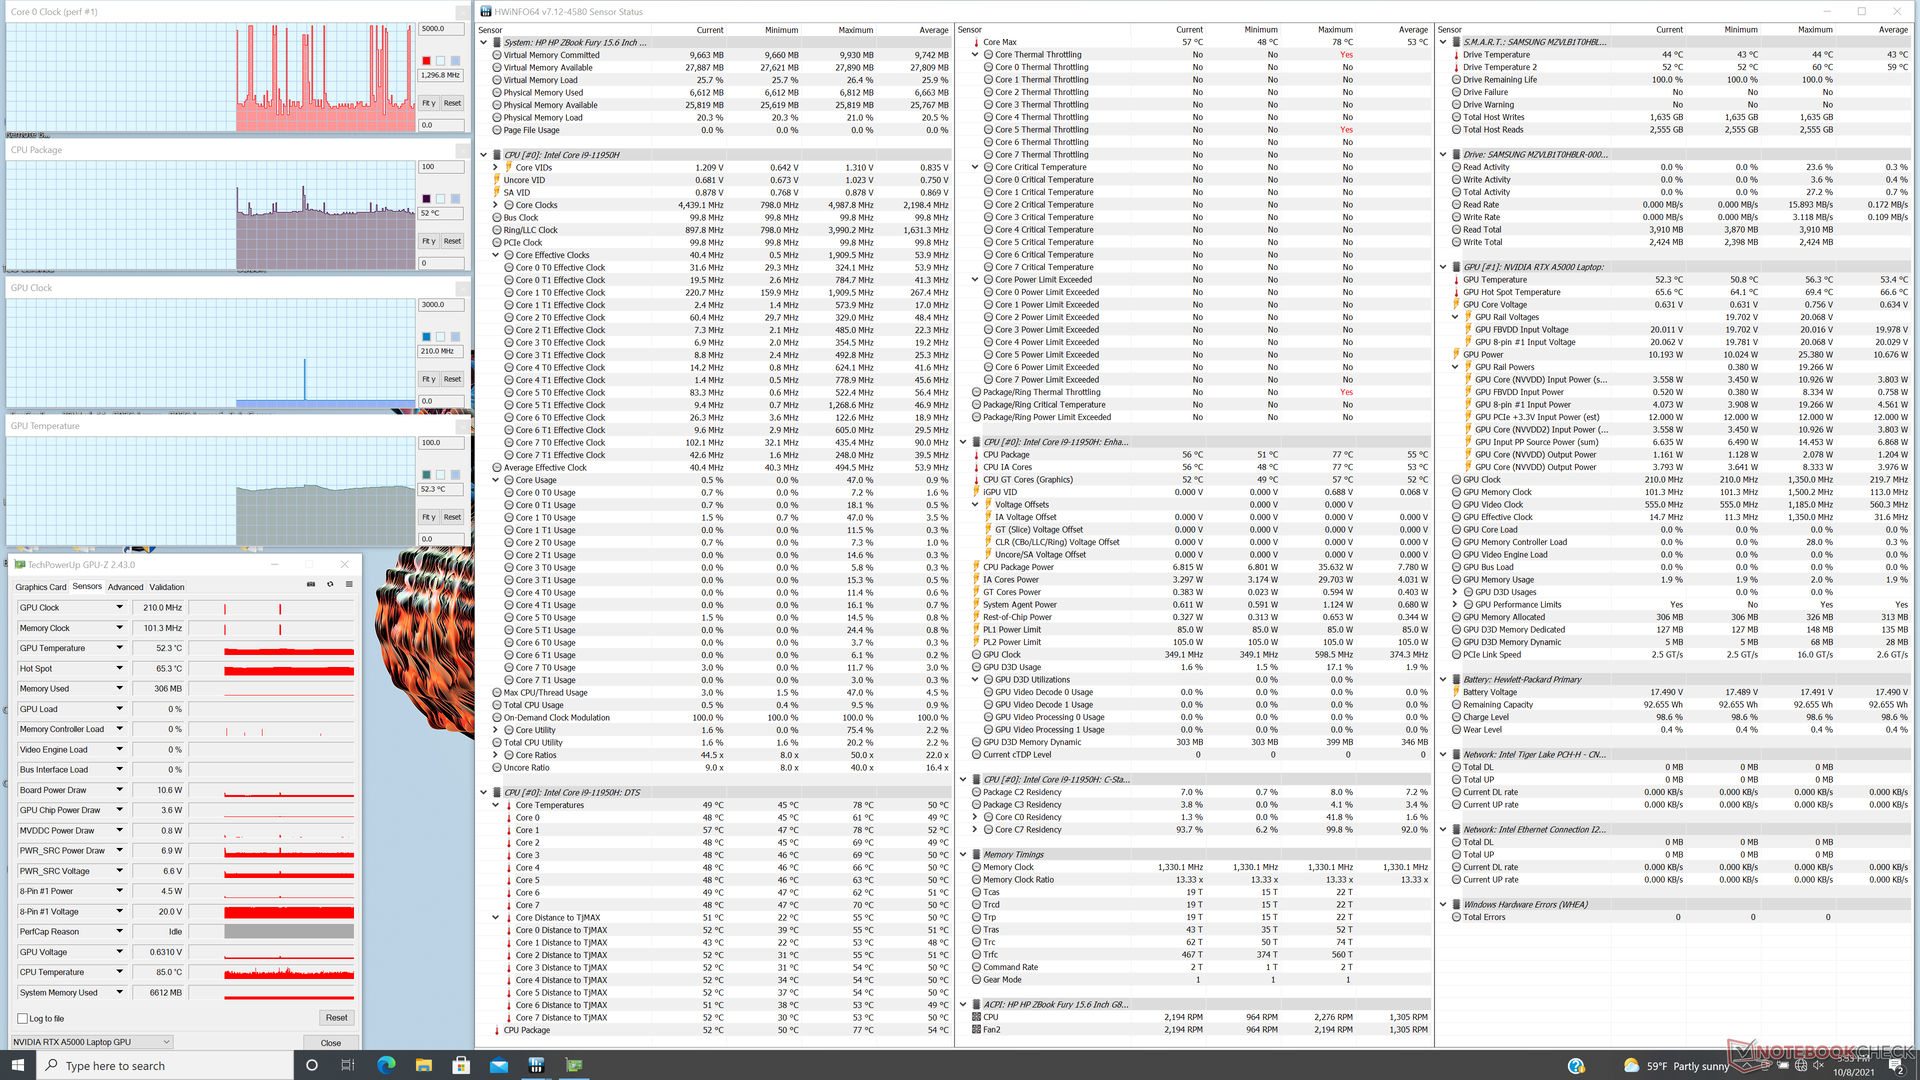
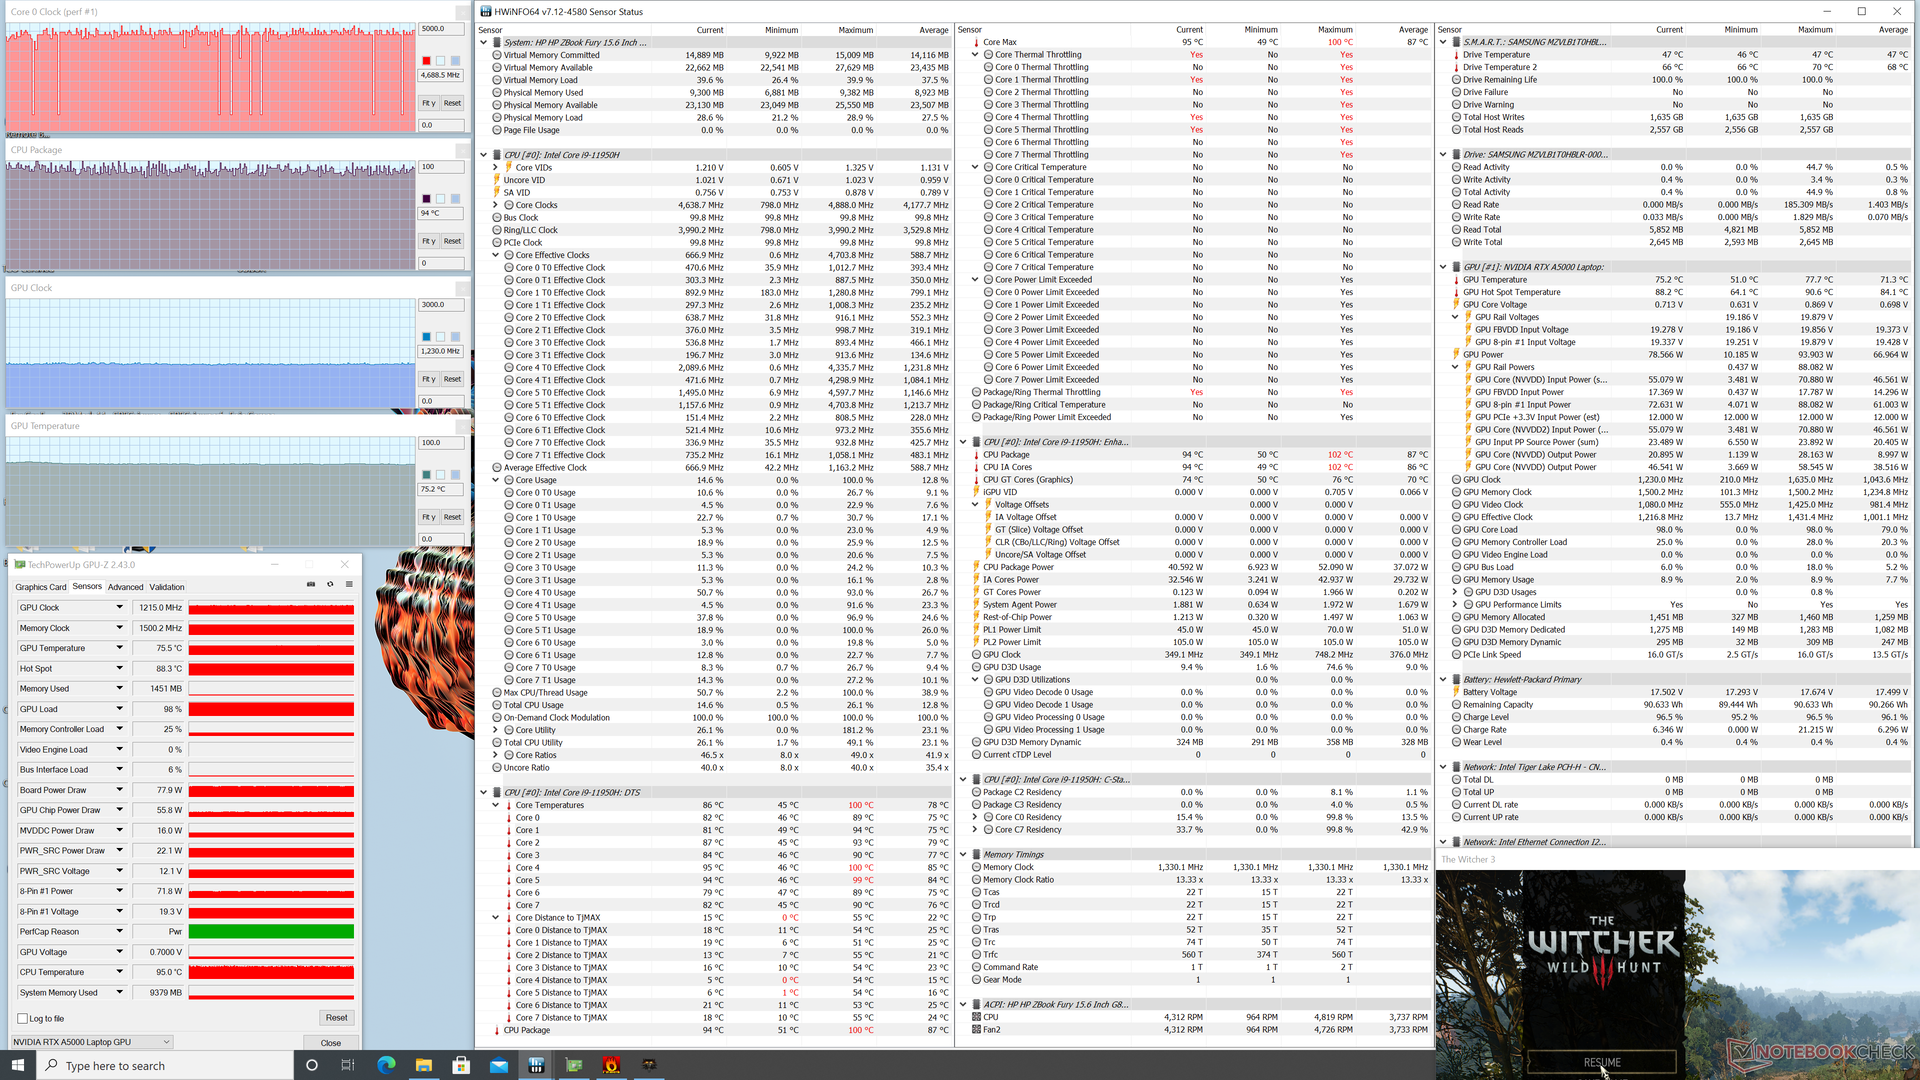
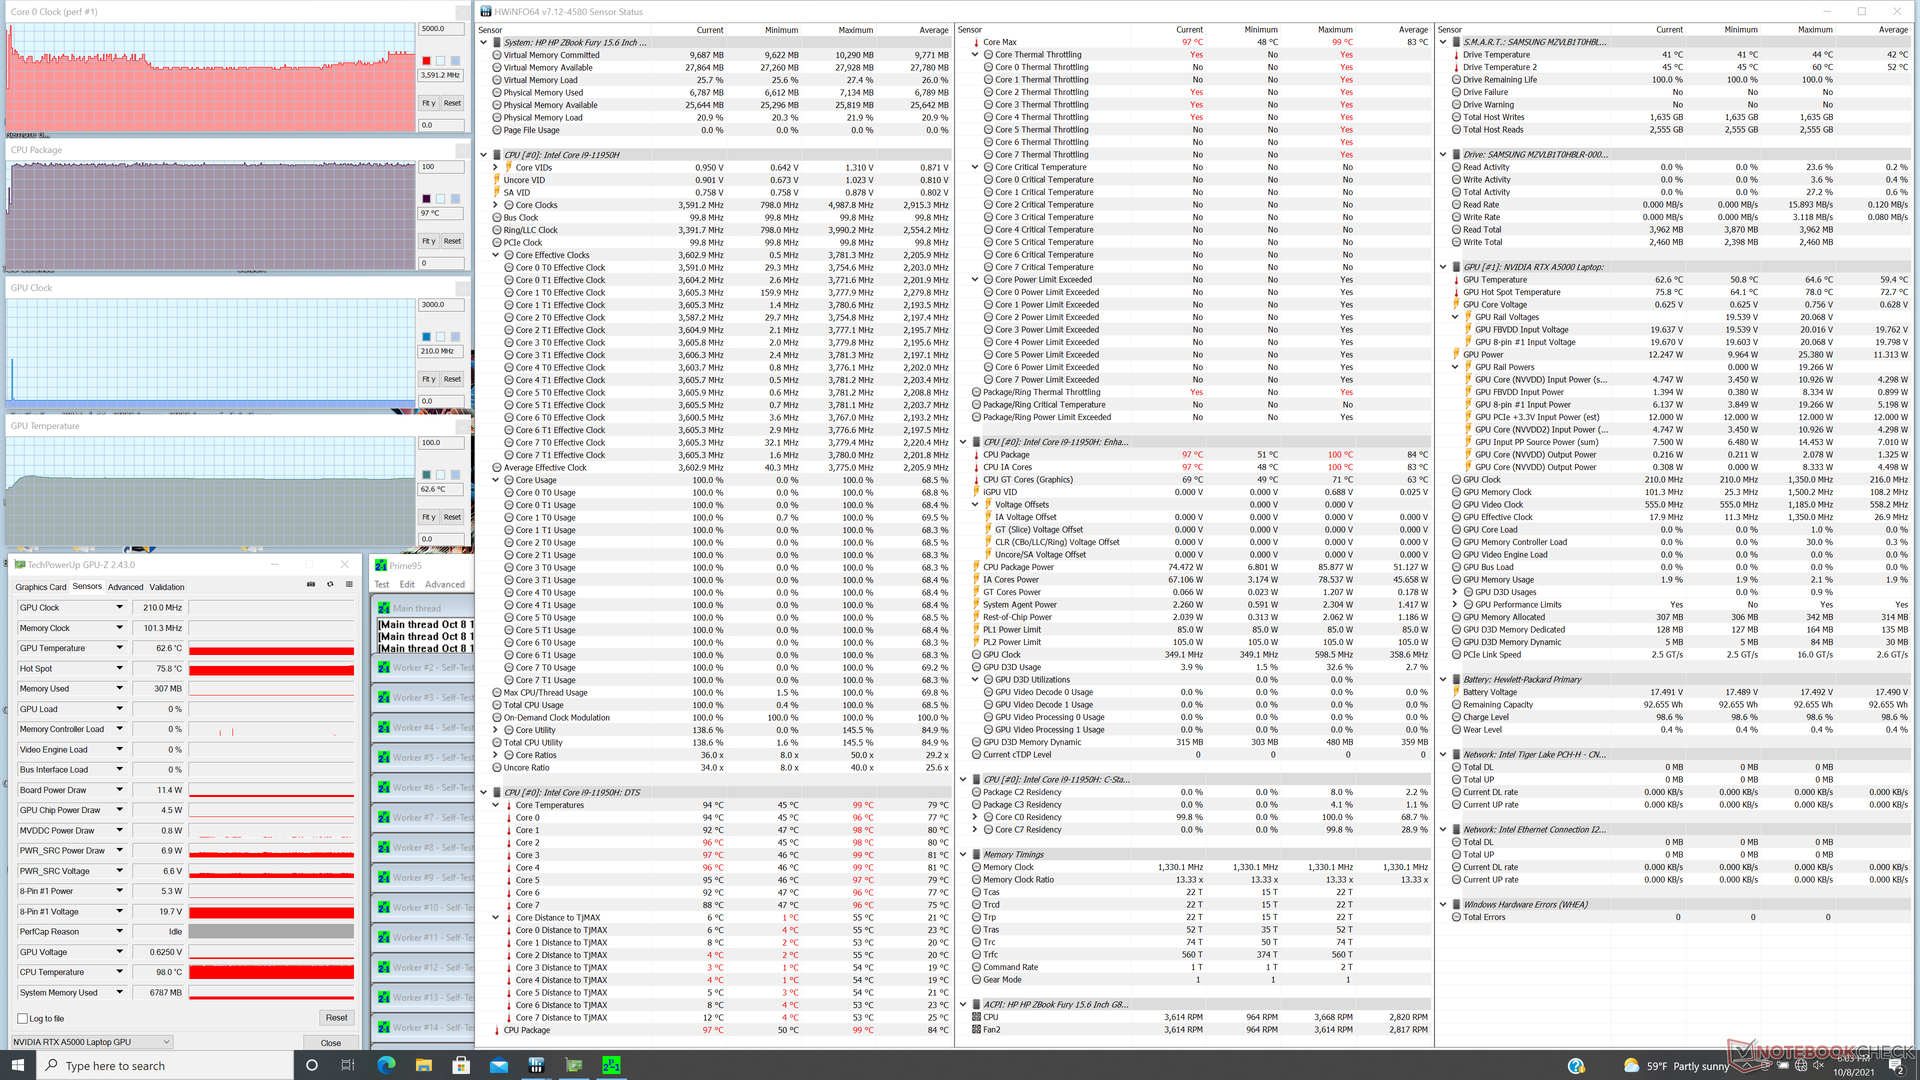
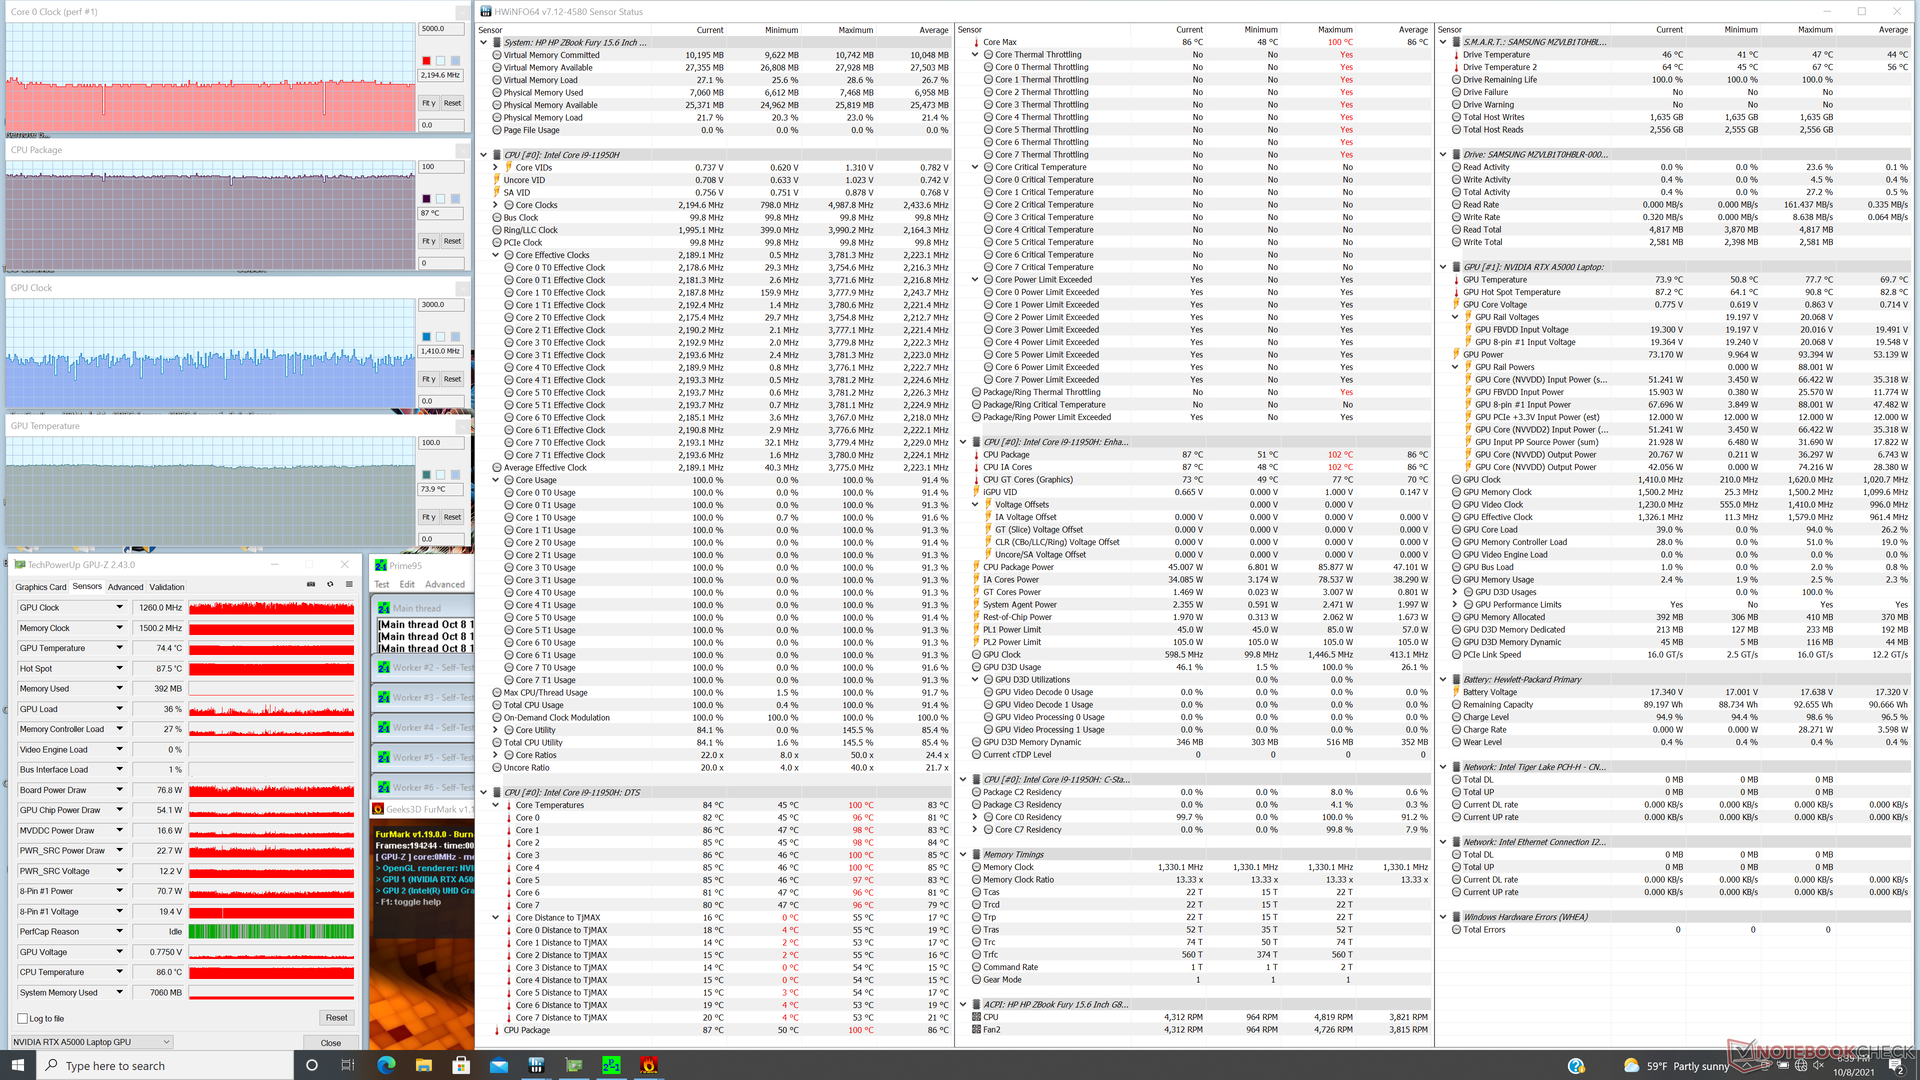
Test de stress
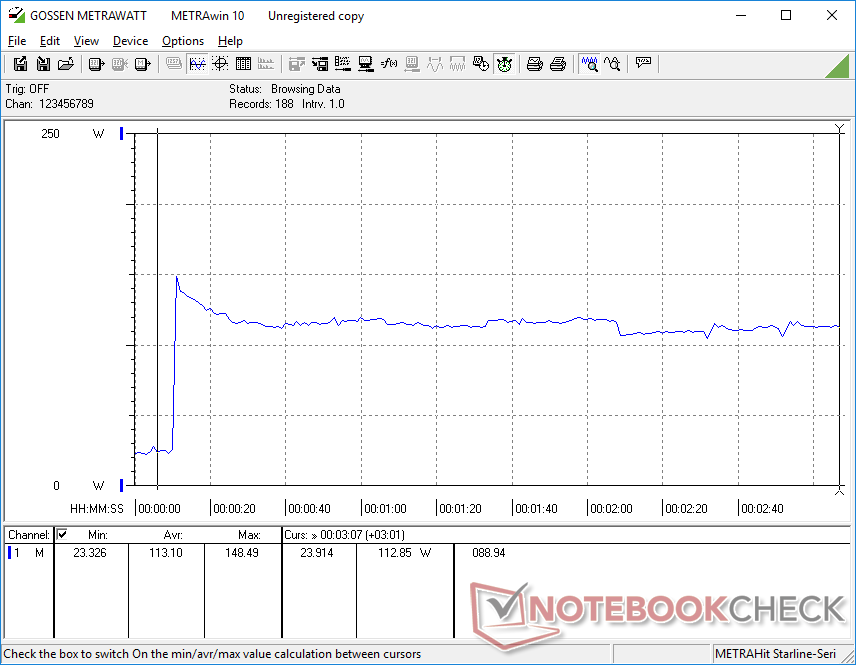
Lorsqu'il est sollicité avec Prime95, le CPU monte à 3,6 GHz pendant les premières secondes jusqu'à ce qu'il atteigne une température de 96 C. Les fréquences d'horloge se stabilisent ensuite dans la plage de 3,0 à 3,5 GHz tout en maintenant une température de 96 C. Les résultats sont similaires à ceux que nous avons observés sur le Dell Precision 7550 et l'ancien Fury 15 G7, ce qui montre que ces stations de travail hautes performances donnent la priorité aux performances du CPU, même si cela signifie des températures centrales beaucoup plus élevées.
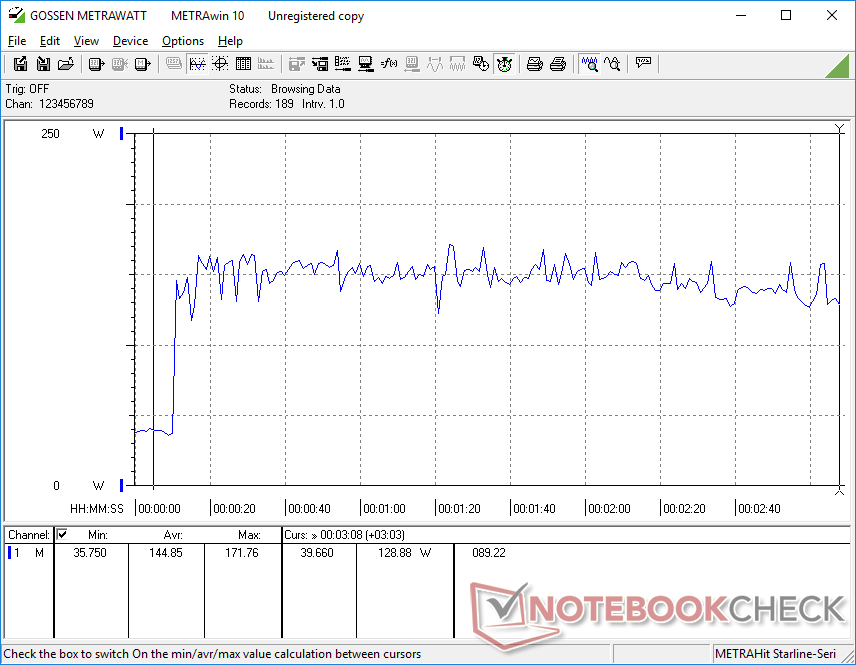
En exécutant Witcher 3, les températures du CPU et du GPU se stabilisent respectivement à 94 C et 75 C, contre 85 C et 70 C sur la Fury 15 G7. Ainsi, l'augmentation des performances d'une année sur l'autre entraîne une légère hausse des températures. Les processeurs de notre Precision 7550 se stabiliseraient à des températures plus froides avec des marges relativement larges de 10 à 20 C lors de l'exécution du même jeu.
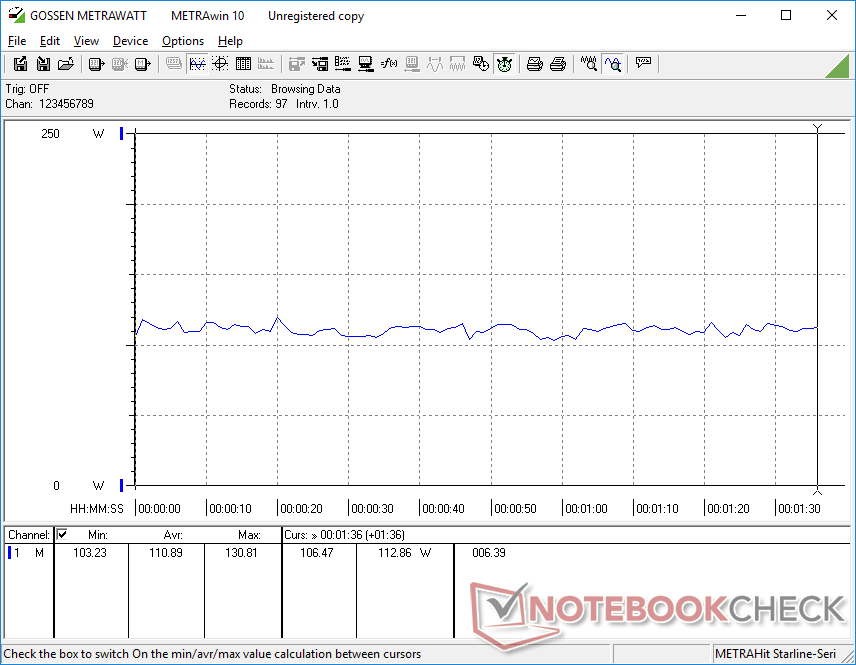
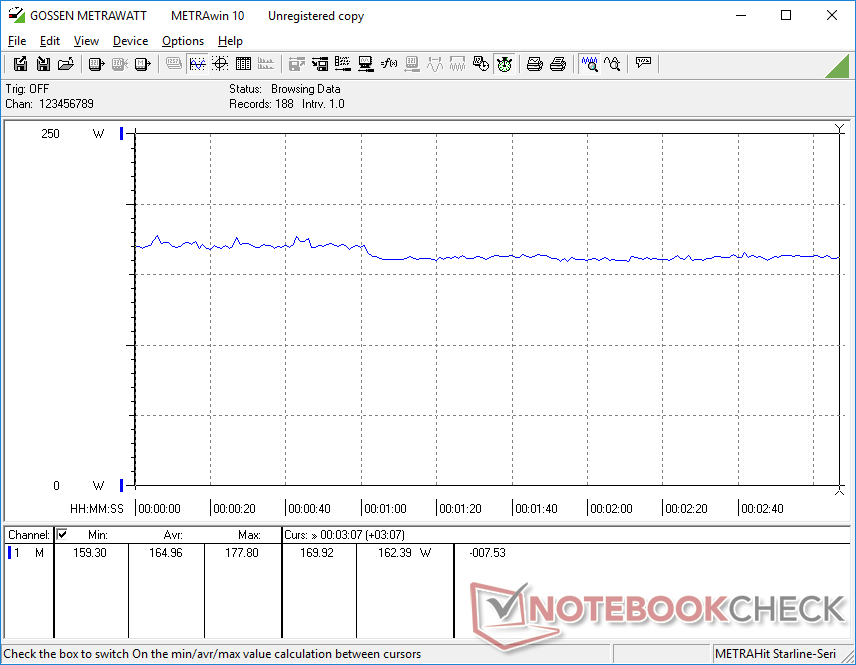
La consommation d'énergie de la carte GPU se stabiliserait à 78 W lors de l'exécution de charges de jeu par rapport à son objectif de 90 W TGP. Nous sommes capables d'atteindre une consommation de 93 W, mais seulement pendant une courte période au début du test.
Le fonctionnement sur batterie limite les performances. Un test 3DMark Fire Strike sur batterie donne des scores de physique et de graphisme de 17779 et 6244 points, respectivement, contre 22483 et 23579 points sur secteur.
| Température moyennedu CPU(°C)Température moyennedu GPU (°C) |
| Système au repos |
| Prime95 Stress |
| Prime95+ FurMark Stress |
| Witcher 3 Stress |
Haut-parleurs

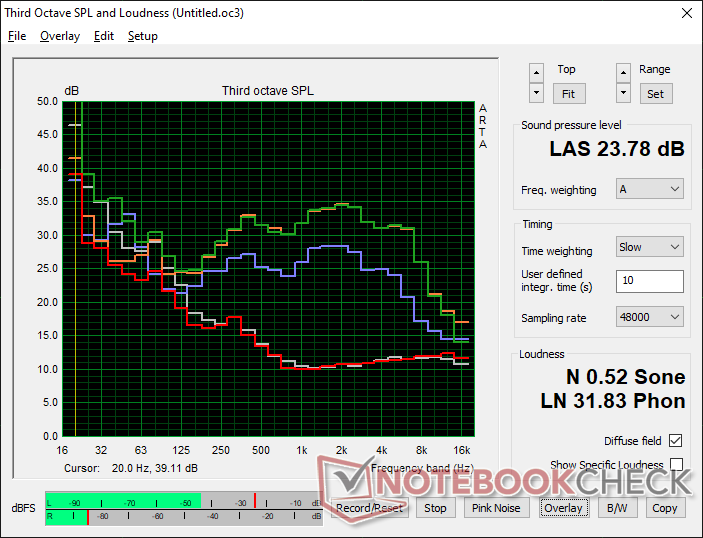
HP ZBook Fury 15 G8 analyse audio
(±) | le niveau sonore du haut-parleur est moyen mais bon (79.8# dB)
Basses 100 - 315 Hz
(±) | basse réduite - en moyenne 10.6% inférieure à la médiane
(±) | la linéarité des basses est moyenne (8.8% delta à la fréquence précédente)
Médiums 400 - 2000 Hz
(+) | médiane équilibrée - seulement 3.9% de la médiane
(+) | les médiums sont linéaires (4.8% delta à la fréquence précédente)
Aiguës 2 - 16 kHz
(+) | des sommets équilibrés - à seulement 2.9% de la médiane
(+) | les aigus sont linéaires (5.3% delta à la fréquence précédente)
Globalement 100 - 16 000 Hz
(+) | le son global est linéaire (11.9% différence à la médiane)
Par rapport à la même classe
» 17% de tous les appareils testés de cette catégorie étaient meilleurs, 4% similaires, 79% pires
» Le meilleur avait un delta de 7%, la moyenne était de 17%, le pire était de 35%.
Par rapport à tous les appareils testés
» 9% de tous les appareils testés étaient meilleurs, 2% similaires, 89% pires
» Le meilleur avait un delta de 4%, la moyenne était de 24%, le pire était de 134%.
Apple MacBook 12 (Early 2016) 1.1 GHz analyse audio
(+) | les haut-parleurs peuvent jouer relativement fort (83.6# dB)
Basses 100 - 315 Hz
(±) | basse réduite - en moyenne 11.3% inférieure à la médiane
(±) | la linéarité des basses est moyenne (14.2% delta à la fréquence précédente)
Médiums 400 - 2000 Hz
(+) | médiane équilibrée - seulement 2.4% de la médiane
(+) | les médiums sont linéaires (5.5% delta à la fréquence précédente)
Aiguës 2 - 16 kHz
(+) | des sommets équilibrés - à seulement 2% de la médiane
(+) | les aigus sont linéaires (4.5% delta à la fréquence précédente)
Globalement 100 - 16 000 Hz
(+) | le son global est linéaire (10.2% différence à la médiane)
Par rapport à la même classe
» 7% de tous les appareils testés de cette catégorie étaient meilleurs, 2% similaires, 91% pires
» Le meilleur avait un delta de 5%, la moyenne était de 18%, le pire était de 53%.
Par rapport à tous les appareils testés
» 5% de tous les appareils testés étaient meilleurs, 1% similaires, 94% pires
» Le meilleur avait un delta de 4%, la moyenne était de 24%, le pire était de 134%.
Energy Management
Consommation d'énergie - Écran gourmand en énergie
Le système consomme un peu plus d'énergie que son prédécesseur immédiat, le Fury 15 G7, notamment en cas de faible charge de traitement. Notre appareil s'installe dans des plages légèrement plus élevées de 8 W à 20 W, contre 4 W à 14 W sur l'ancien modèle. La consommation d'énergie est autrement très proche entre les deux modèles lors de l'exécution de charges exigeantes.
L'exécution de charges extrêmes (Prime95+FurMark) fait grimper la consommation d'énergie jusqu'à 172 W sur l'adaptateur secteur de taille moyenne (~15,2 x 7,2 x 2,4 cm) de 200 W. Le système continue à se recharger même en cas de charge élevée, mais à un rythme plus lent
Passer du réglage minimum au réglage maximum de la luminosité consomme environ 11 W de plus, contre environ la moitié sur la plupart des Ultrabooks, en raison de l'écran très lumineux de notre HP.
| Éteint/en veille | |
| Au repos | |
| Fortement sollicité |
|
Légende:
min: | |
| HP ZBook Fury 15 G8 i9-11950H, RTX A5000 Laptop GPU, Samsung PM981a MZVLB1T0HBLR, IPS, 3840x2160, 15.6" | HP ZBook Fury 15 G7 W-10885M, Quadro RTX 5000 Max-Q, Samsung PM981a MZVLB1T0HBLR, IPS, 3840x2160, 15.6" | Dell Precision 5000 5560 i7-11850H, RTX A2000 Laptop GPU, Samsung PM9A1 MZVL22T0HBLB, IPS, 3840x2400, 15.6" | HP ZBook Studio 15 G8 i9-11950H, GeForce RTX 3070 Laptop GPU, Samsung PM981a MZVLB2T0HALB, OLED, 3840x2160, 15.6" | Lenovo ThinkPad P15s Gen2-20W6000GGE i7-1165G7, T500 Laptop GPU, WDC PC SN720 SDAQNTW-1T00, IPS LED, 3840x2160, 15.6" | HP ZBook Firefly 15 G7 i7-10610U, Quadro P520, Toshiba XG6 KXG60ZNV1T02, IPS LED, 3840x2160, 15.6" | |
|---|---|---|---|---|---|---|
| Power Consumption | 11% | 22% | -10% | 49% | 59% | |
| Idle Minimum * (Watt) | 8.3 | 4.6 45% | 6.2 25% | 11 -33% | 5.8 30% | 3.5 58% |
| Idle Average * (Watt) | 19.9 | 13.6 32% | 13.9 30% | 18.8 6% | 13.3 33% | 6.7 66% |
| Idle Maximum * (Watt) | 21.8 | 21.5 1% | 23.8 -9% | 31.7 -45% | 15.6 28% | 9.6 56% |
| Load Average * (Watt) | 110.9 | 113.1 -2% | 95.7 14% | 105.2 5% | 43.2 61% | 60 46% |
| Witcher 3 ultra * (Watt) | 165 | 157.5 5% | 87 47% | 148 10% | 37.1 78% | 49.3 70% |
| Load Maximum * (Watt) | 171.8 | 199 -16% | 132.6 23% | 171.8 -0% | 67.3 61% | 68.6 60% |
* ... Moindre est la valeur, meilleures sont les performances
Power Consumption Witcher 3 / Stresstest
Autonomie de la batterie
Les durées d'exécution du WLAN sont inférieures de quelques heures sur le Fury 15 G8 par rapport au Fury 15 G7, même avec le même profil équilibré, la même luminosité d'affichage et les mêmes paramètres graphiques intégrés. Nous soupçonnons que le taux de rafraîchissement natif plus élevé ou l'activité de fond automatique potentielle peuvent être en partie responsables de la durée de vie de la batterie sensiblement plus courte.
Le chargement d'une batterie vide à sa pleine capacité prend environ 90 minutes. La plupart des chargeurs USB-C fonctionnent également sur le système, à condition que la puissance de sortie soit suffisamment élevée.
| HP ZBook Fury 15 G8 i9-11950H, RTX A5000 Laptop GPU, 94 Wh | HP ZBook Fury 15 G7 W-10885M, Quadro RTX 5000 Max-Q, 94 Wh | Dell Precision 5000 5560 i7-11850H, RTX A2000 Laptop GPU, 86 Wh | HP ZBook Studio 15 G8 i9-11950H, GeForce RTX 3070 Laptop GPU, 83 Wh | Lenovo ThinkPad P15s Gen2-20W6000GGE i7-1165G7, T500 Laptop GPU, 57 Wh | HP ZBook Firefly 15 G7 i7-10610U, Quadro P520, 53 Wh | |
|---|---|---|---|---|---|---|
| Autonomie de la batterie | 39% | 2% | 0% | 24% | 47% | |
| WiFi v1.3 (h) | 6.2 | 8.6 39% | 6.3 2% | 6.2 0% | 7.7 24% | 9.1 47% |
| Reader / Idle (h) | 13.2 | 12 | 12.9 | |||
| Load (h) | 1.3 | 1.8 | 1.8 | 1.9 | 2 |
Points positifs
Points négatifs
Verdict : une performance digne d'une furie
Le ZBook Fury 15 G8 tire davantage de performances du même châssis Fury 15 G7 que nous connaissons déjà. Les utilisateurs constateront des gains marginaux à modérés grâce au CPU et au GPU de dernière génération, tout en conservant le même adaptateur secteur et les mêmes caractéristiques physiques. Il serait irréaliste de s'attendre à une refonte complète du Fury 15 G8 alors que le saut du Fury 15 G6 au Fury 15 G7 était déjà si important pour la série. Les utilisateurs puissants peuvent envisager le Fury 15 G8 si les gains de performance sont pertinents pour leurs charges de travail. Sinon, le Fury 15 G7 peut offrir essentiellement la même expérience pour moins cher.
La nouvelle option de panneau 4K 120 Hz mérite des éloges, peut-être même plus que les mises à niveau du processeur, car le mouvement plus fluide et la réduction des images fantômes sont beaucoup plus perceptibles. C'est définitivement une dalle que nous aimerions voir sur d'autres ordinateurs portables que ceux de la série ZBook.
La série Fury 15 en général reste une excellente alternative aux stations de travail comme le MSI WS66, Razer Blade Studio, ZBook Fireflyou Lenovo ThinkPad P1 qui sacrifient des fonctionnalités et des options au profit d'une apparence plus fine et plus élégante.
Prix et disponibilité
Le ZBook Fury 15 G8 n'est pas encore disponible chez les revendeurs tiers à ce jour. Au moins un SKU peut être trouvé sur Walmartmais les utilisateurs devraient acheter directement auprès de HP pour bénéficier d'options beaucoup plus configurables.
HP ZBook Fury 15 G8
- 10/13/2021 v7 (old)
Allen Ngo
Price comparison

