Test du Dell Precision 5560 : le coup de pouce de la Quadro RTX A2000
Le Dell Precision 5560 est un rafraîchissement interne du Precision 5550 de l'année dernière. Les deux modèles sont basés sur le nouveau XPS 15 9500Les deux modèles sont basés sur le nouveau châssis XPS 15 9500/9510 et tous les modèles ont des écrans 16:10 et d'autres caractéristiques physiques similaires. En tant que tel, nous vous recommandons de consulter nos commentaires sur les modèles suivants Precision 5550, XPS 15 9500ou XPS 15 9510 puisque la plupart de nos commentaires s'appliquent également au Precision 5560
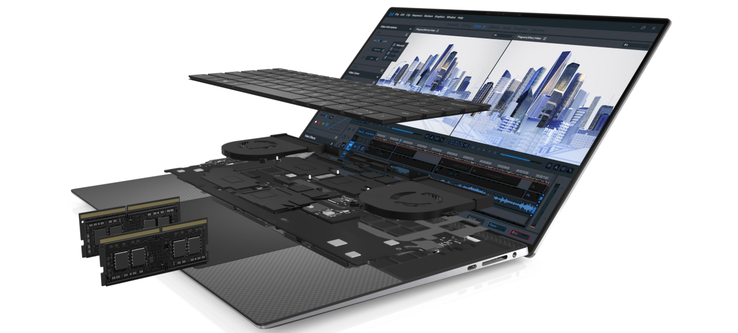
Par rapport au Precision 5550, le Precision 5560 est équipé de processeurs Tiger Lake-H de 11e génération et de GPU Ampere de Nvidia pour remplacer les anciens processeurs Comet Lake-H et GPU Turing de 10e génération, respectivement. Les SKUs vont du Core i5-11500H de base avec des graphiques Quadro T1200, un écran 1200p, et 8 GB de RAM pour $2000 USD jusqu'au CPU i9-11950H ou Xeon W-11955M vPro avec des graphiques Quadro RTX A2000, un écran tactile 2400p, et 64 GB ECC RAM pour plus de $4000 USD. Notre unité de test spécifique est une configuration de milieu de gamme qui se vend un peu plus de 3 000 USD
Parmi les concurrents dans cet espace, on trouve d'autres stations de travail mobiles ultrafines de 15,6 pouces, comme le HP ZBook Studio 15 G8 Test du HP ZBook Studio 15 G8 : plus d'options que jamais ,Asus ProArt StudioBook Pro 15,Lenovo ThinkPad P15 Gen 2, MSI WS66, ouRazer Blade 15 Studio Edition. Une version 17 pouces de notre modèle est disponible. Elle s'appelle Precision 5750 et est basée sur le XPS 17.
Plus de commentaires sur Dell :
potential competitors in comparison
Note | Date | Modèle | Poids | Épaisseur | Taille | Résolution | Prix |
|---|---|---|---|---|---|---|---|
| 88.3 % v7 (old) | 10/21 | Dell Precision 5000 5560 i7-11850H, RTX A2000 Laptop GPU | 2 kg | 18 mm | 15.60" | 3840x2400 | |
| 87.2 % v7 (old) | 10/21 | Lenovo ThinkPad P15 G2-20YQ001JGE i7-11800H, RTX A3000 Laptop GPU | 2.9 kg | 31.5 mm | 15.60" | 1920x1080 | |
| 87.8 % v7 (old) | 08/21 | HP ZBook Studio 15 G8 i9-11950H, GeForce RTX 3070 Laptop GPU | 1.9 kg | 18 mm | 15.60" | 3840x2160 | |
| 83.1 % v7 (old) | 11/20 | Asus ProArt StudioBook Pro 15 W500G5T i7-9750H, Quadro RTX 5000 Max-Q | 2 kg | 18.9 mm | 15.60" | 3840x2160 | |
| 87.8 % v7 (old) | 09/20 | Dell Precision 7550 W-10885M, Quadro RTX 5000 Max-Q | 2.8 kg | 27.36 mm | 15.60" | 3840x2160 | |
| 86.3 % v7 (old) | 09/20 | Dell Precision 5550 P91F i7-10875H, Quadro T2000 Max-Q | 2 kg | 18 mm | 15.60" | 3840x2400 | |
| 87 % v7 (old) | 09/20 | Razer Blade 15 Studio Edition 2020 i7-10875H, Quadro RTX 5000 Max-Q | 2.2 kg | 13.98 mm | 15.60" | 3840x2160 |
Mallette - Professional XPS
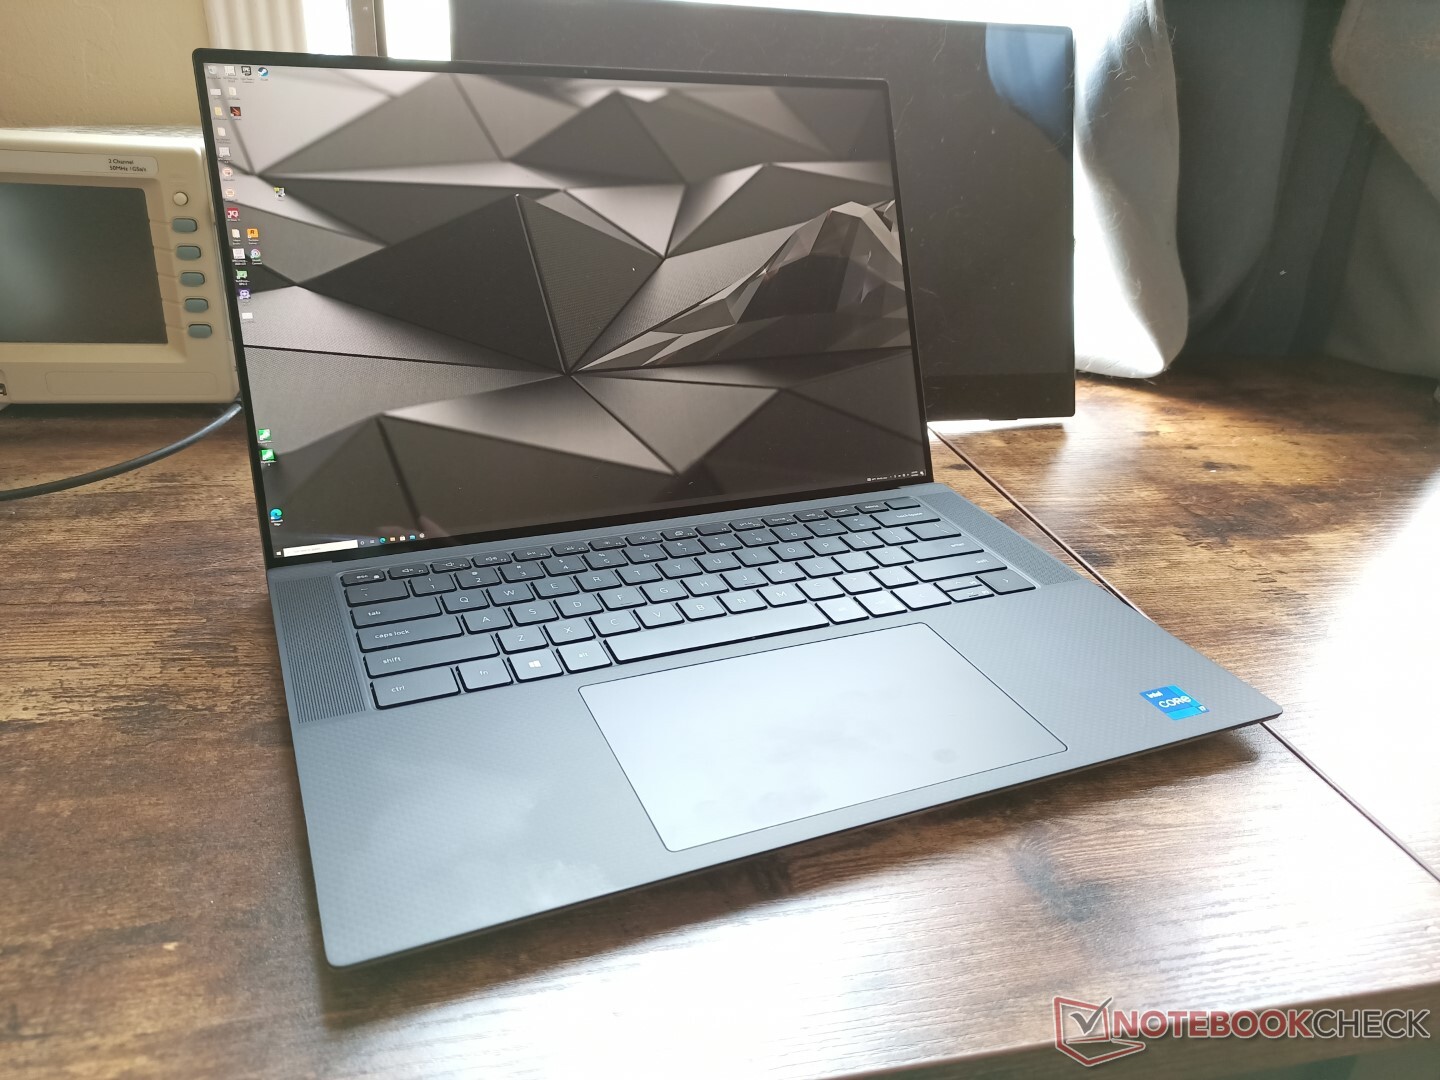
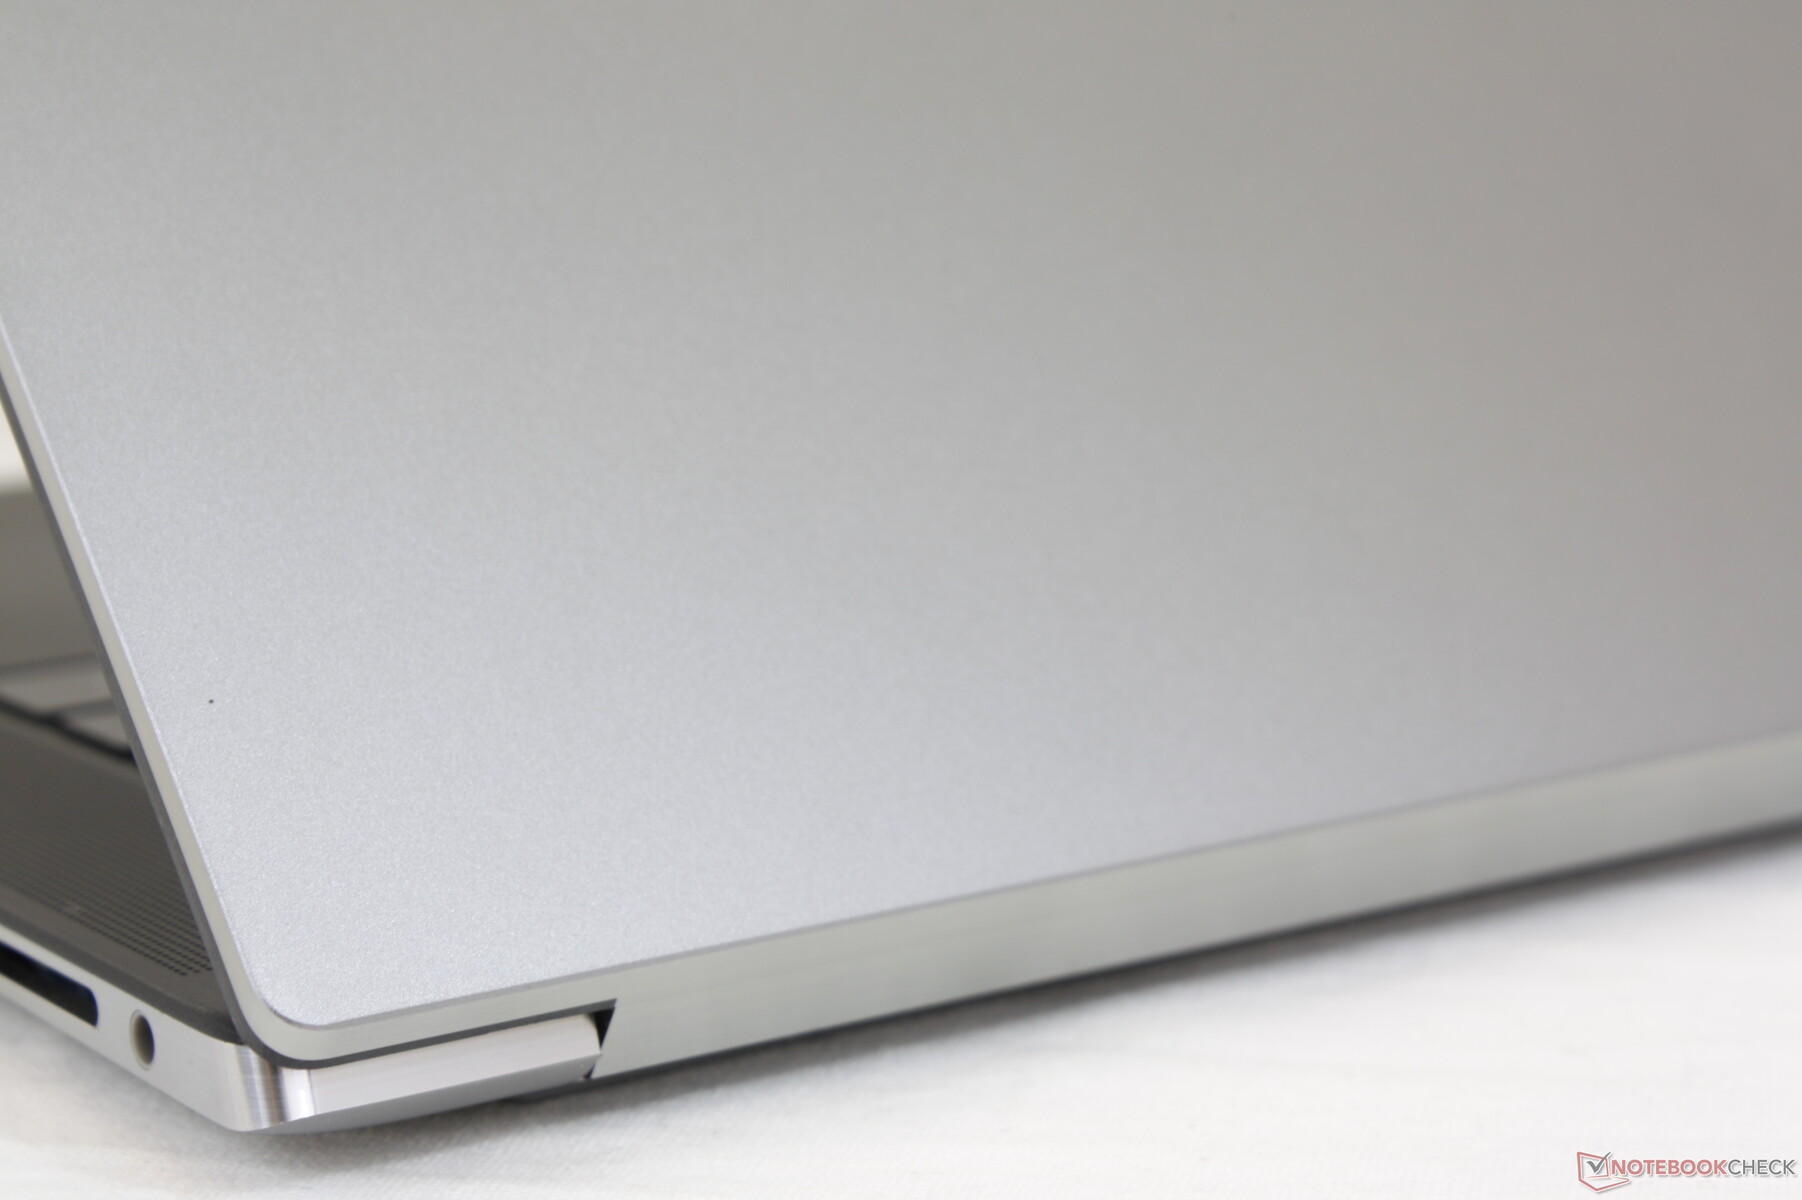
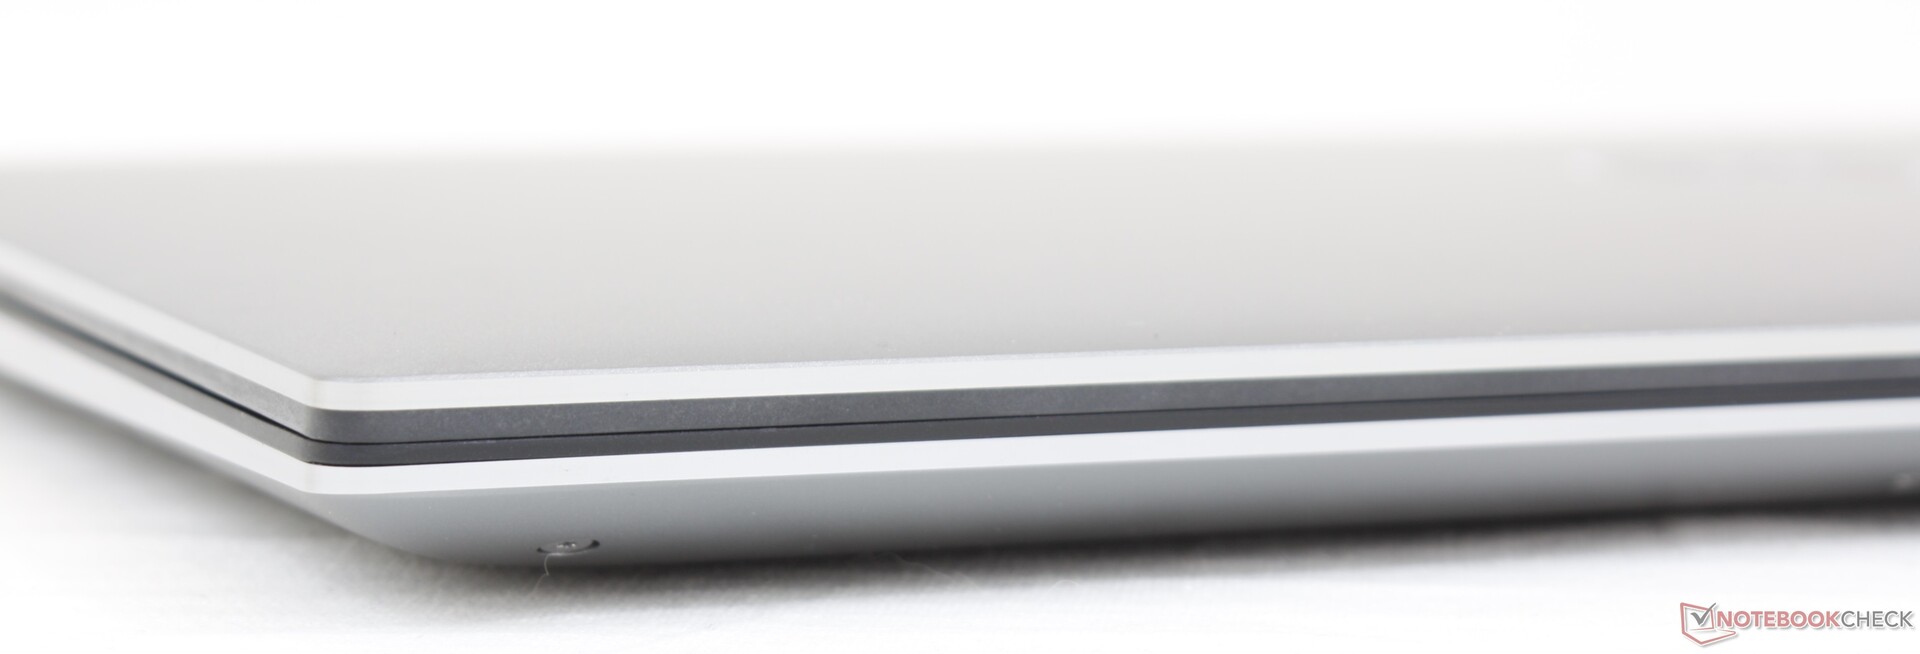
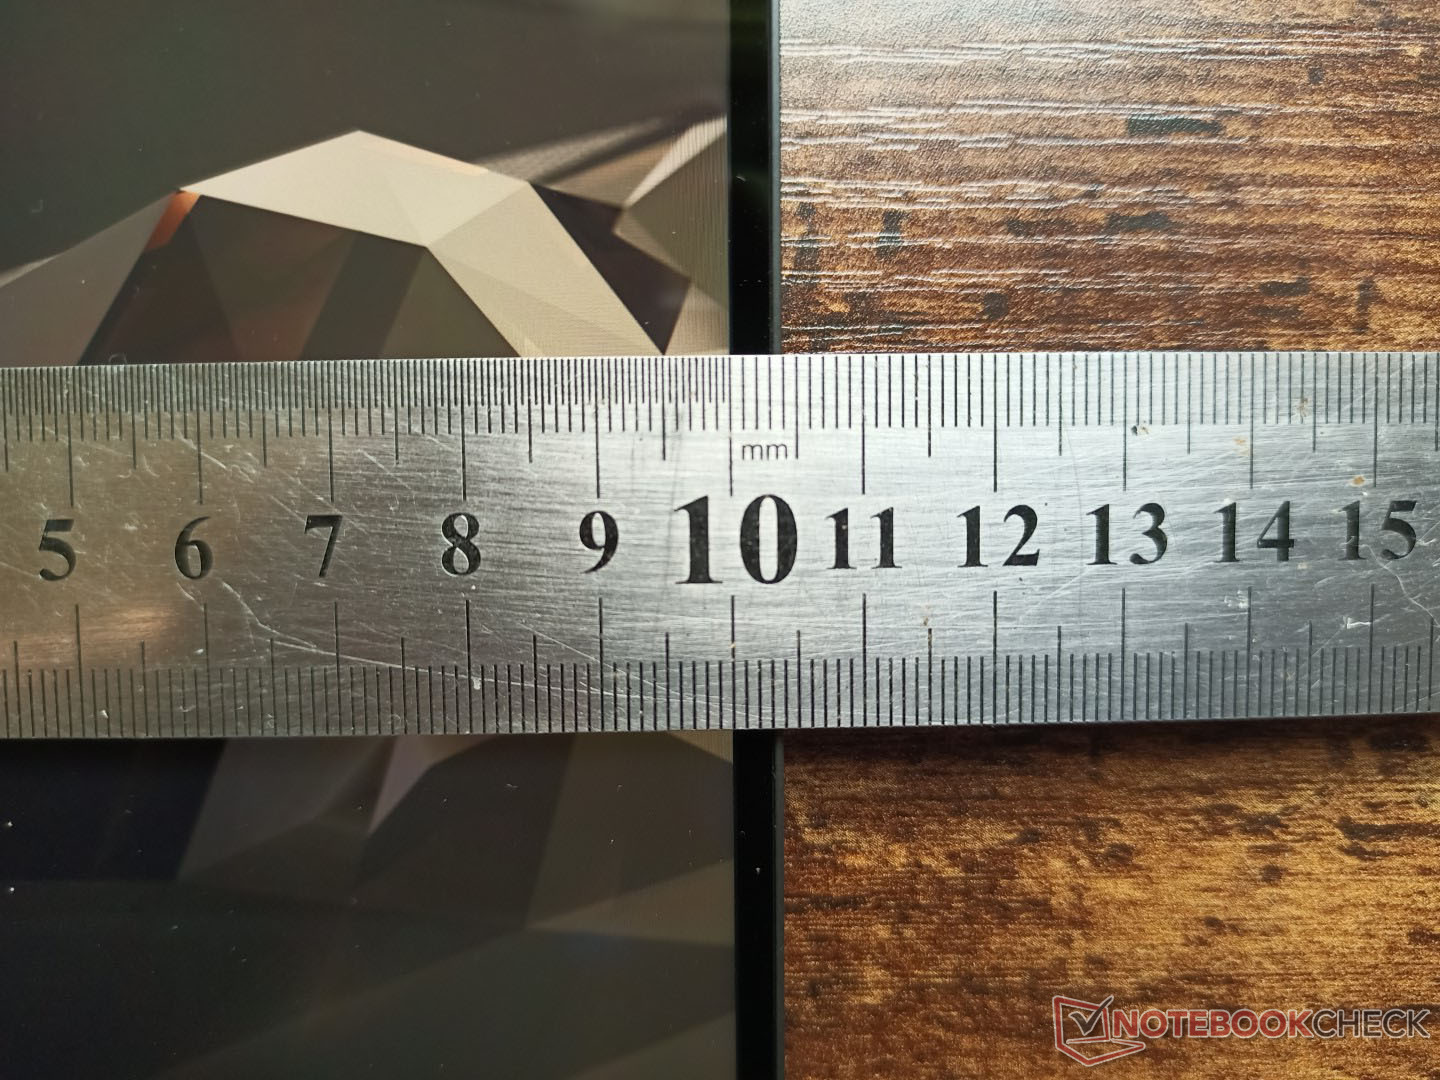
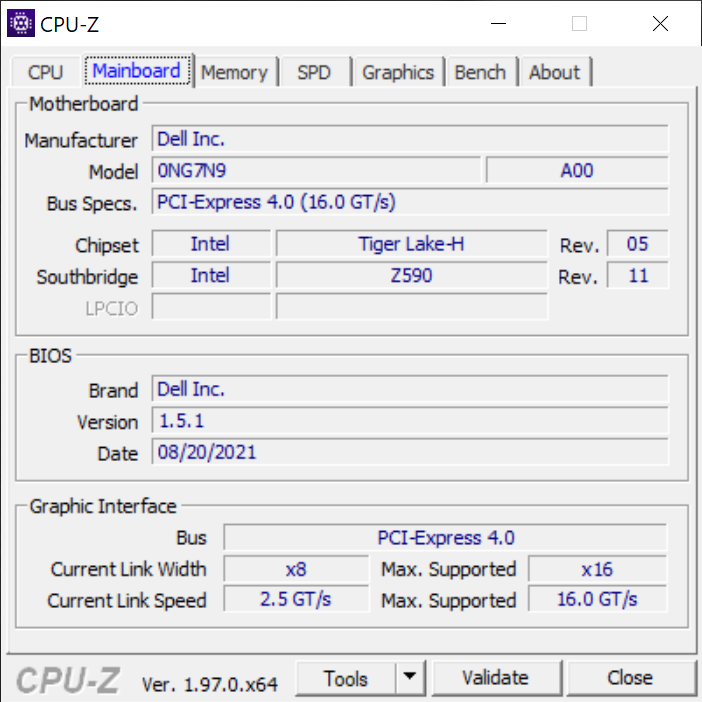
Le châssis et les dimensions sont identiques à ceux du XPS 15 9500 ou 9510, soit 18 x 344,72 x 230,14 mm. Cependant, la page officielle des produits Dell affirme que le Precision 5560 est beaucoup plus fin, à 11,64 mm de son point le plus épais, ce qui est absolument faux. Nous pensons que Dell a modifié sa méthode de mesure de l'épaisseur, ce qui peut être très trompeur pour les consommateurs. Nous avons observé une différence d'épaisseur similaire Test du Dell XPS 13 9310 2-en-1 : meilleur que le XPS 13 7390 2-en-1 sur un point précis entre les XPS 13 7390 2-en-1 et XPS 13 9310 2-en-1 identiques.
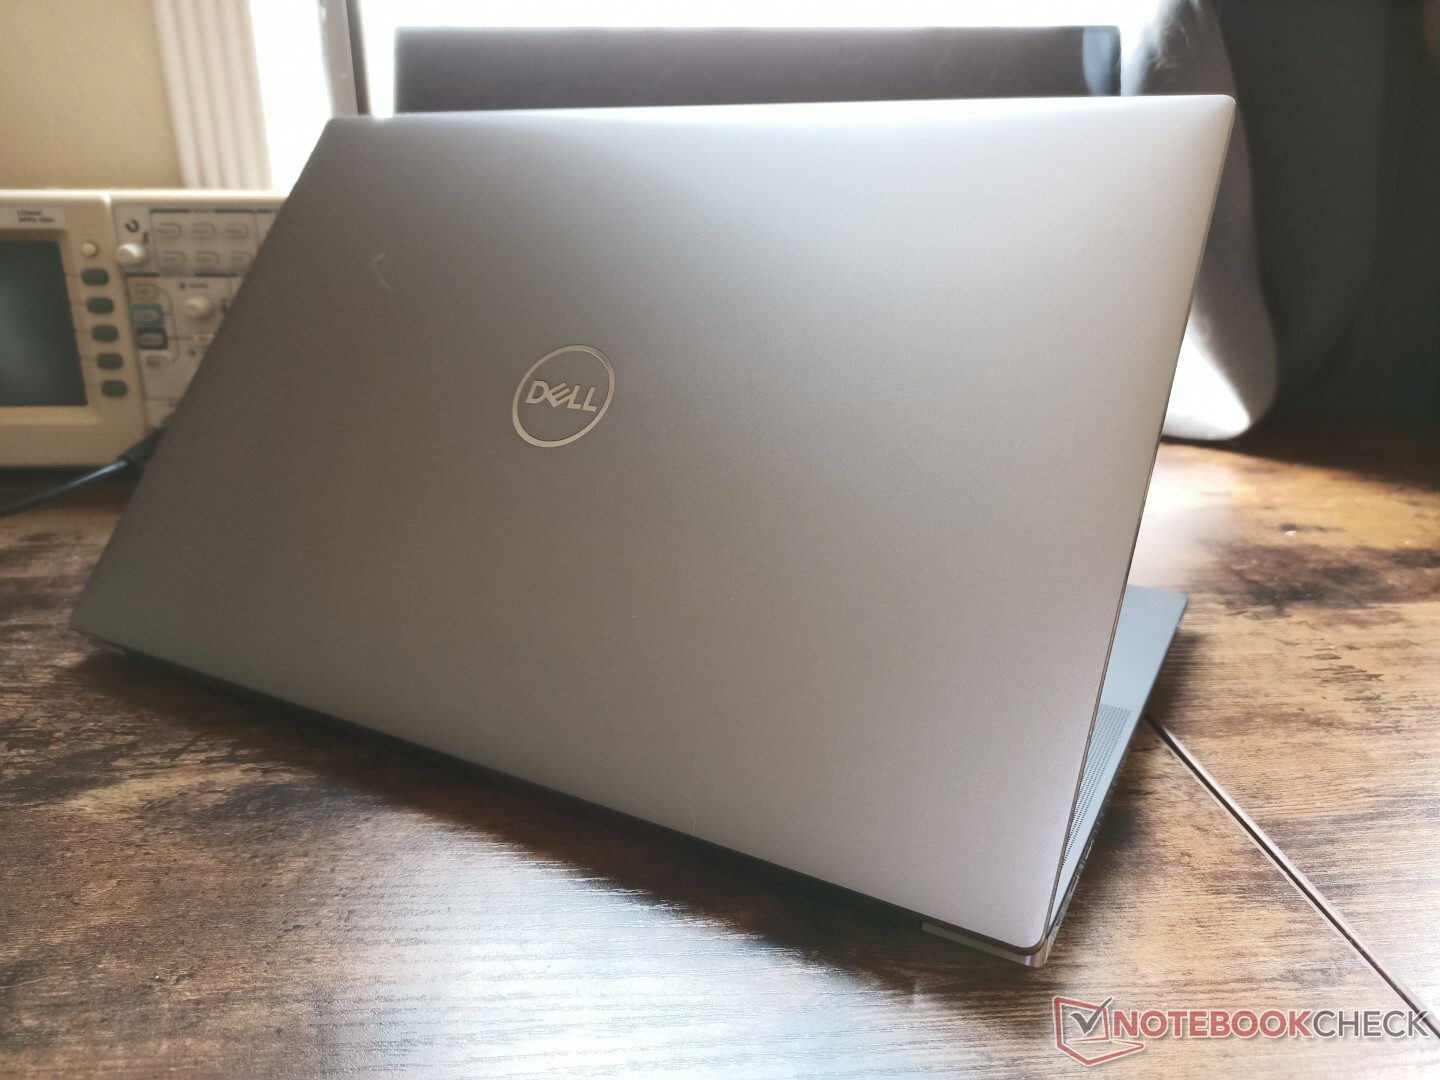
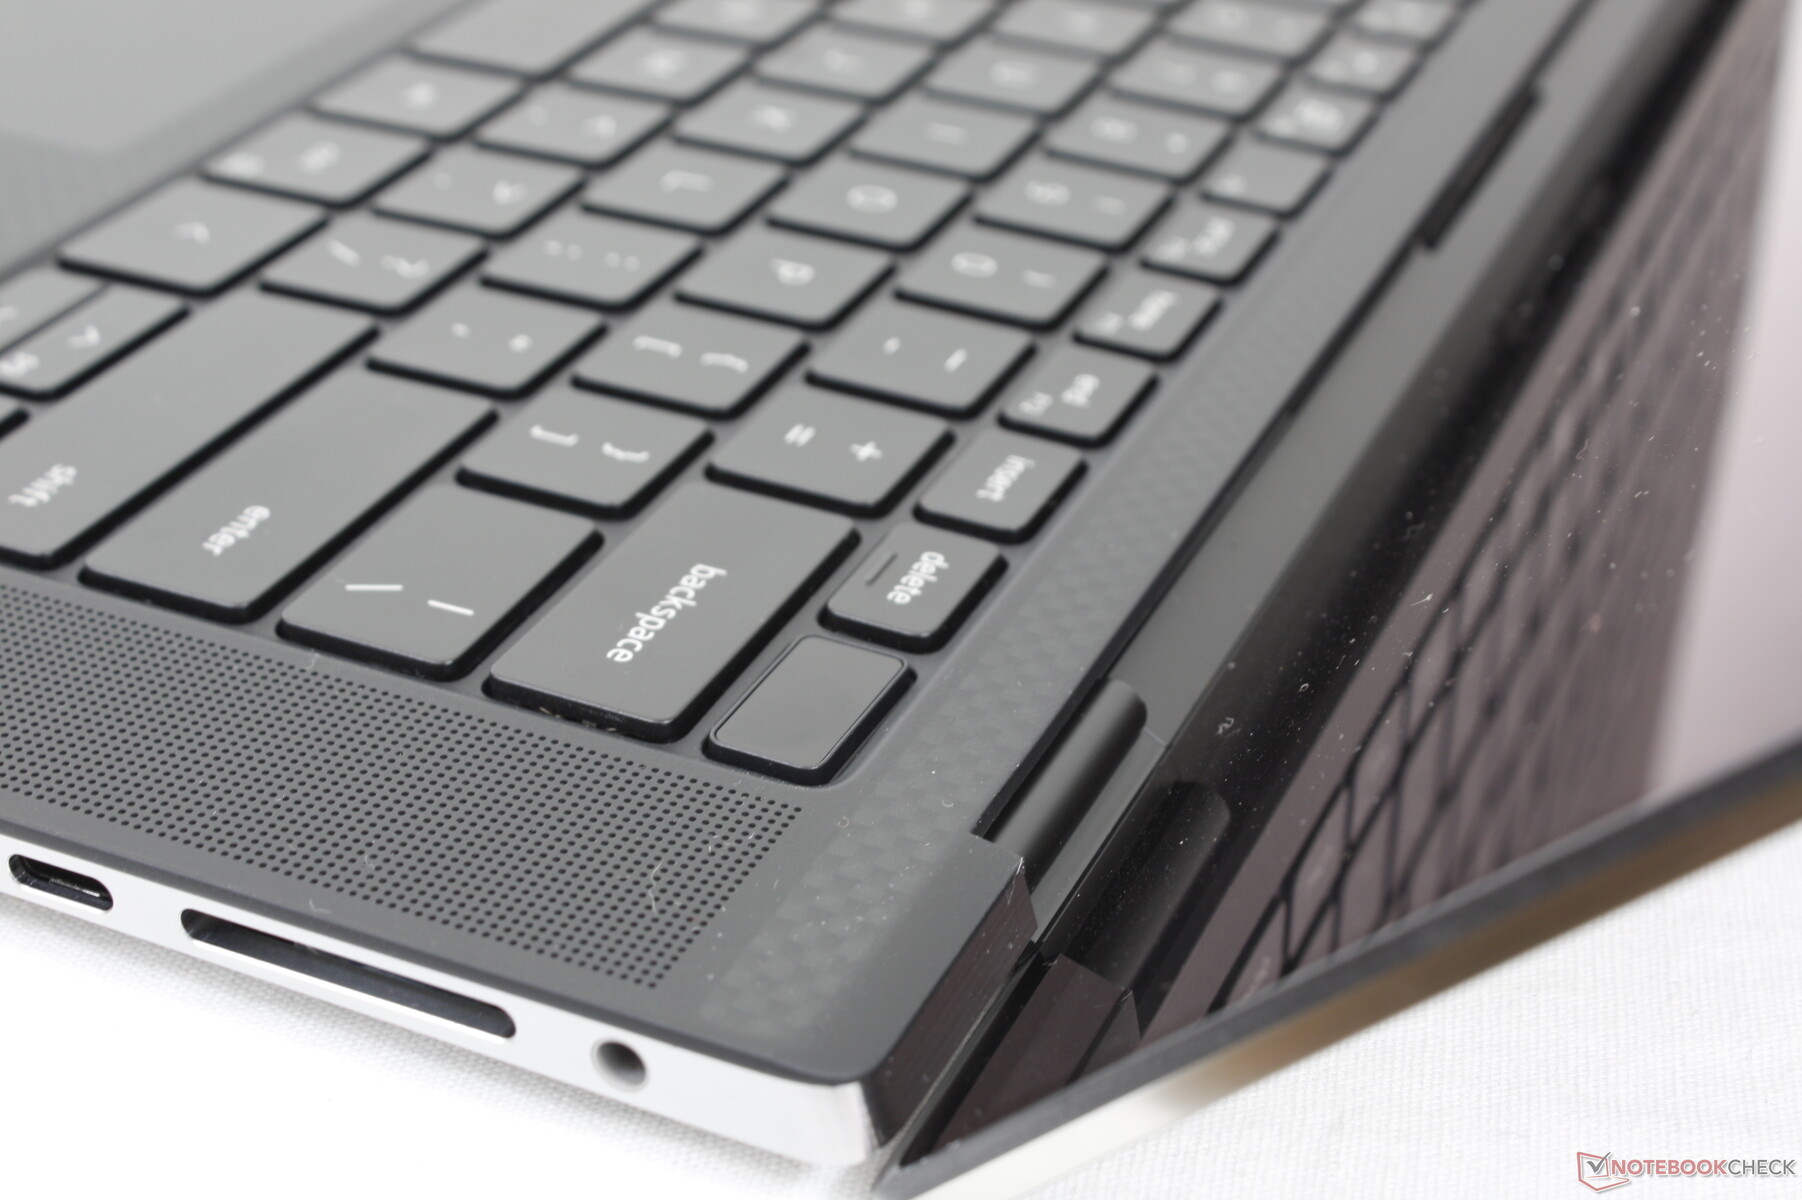
Comme d'habitude, le couvercle extérieur en alliage de magnésium est d'un gris légèrement plus foncé que celui du XPS 15 typique afin d'aider à identifier visuellement la série Precision 55x0 de la série XPS 15.
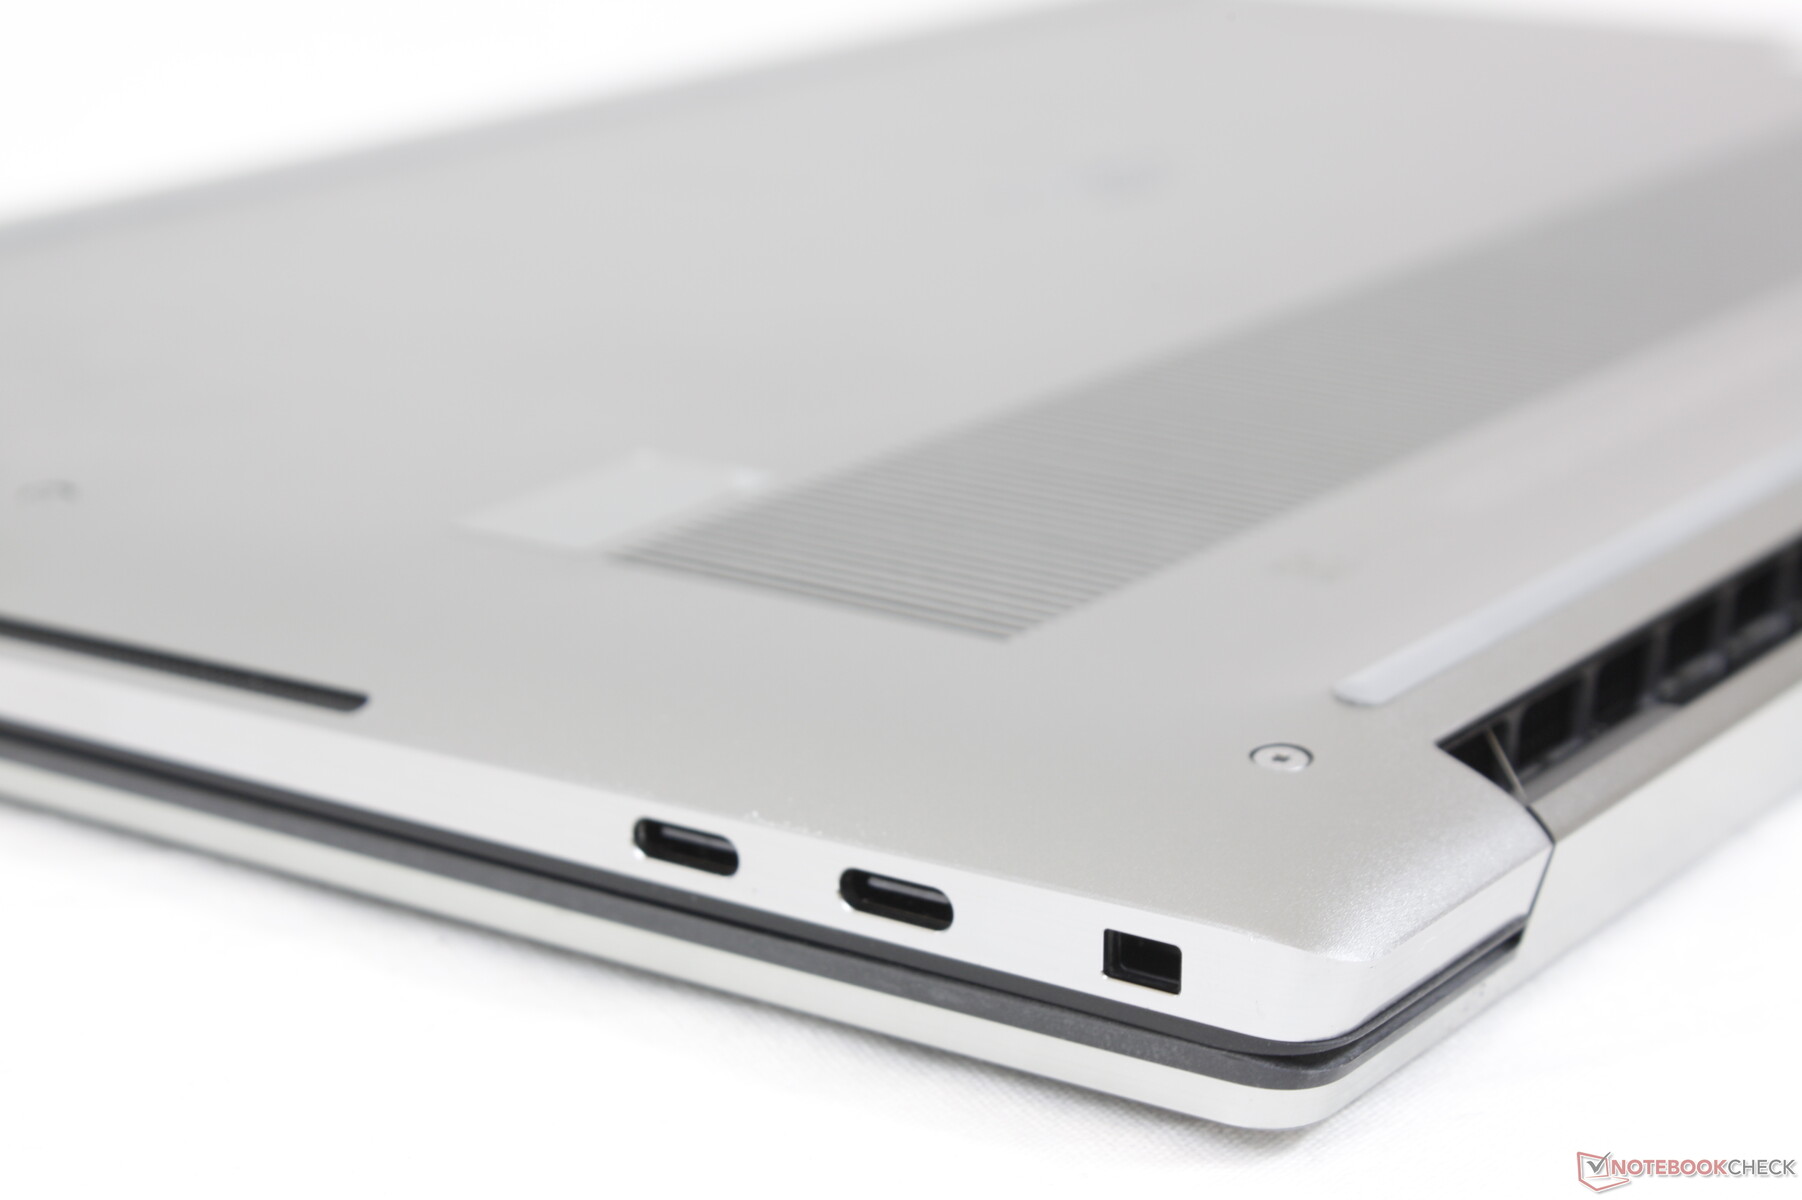
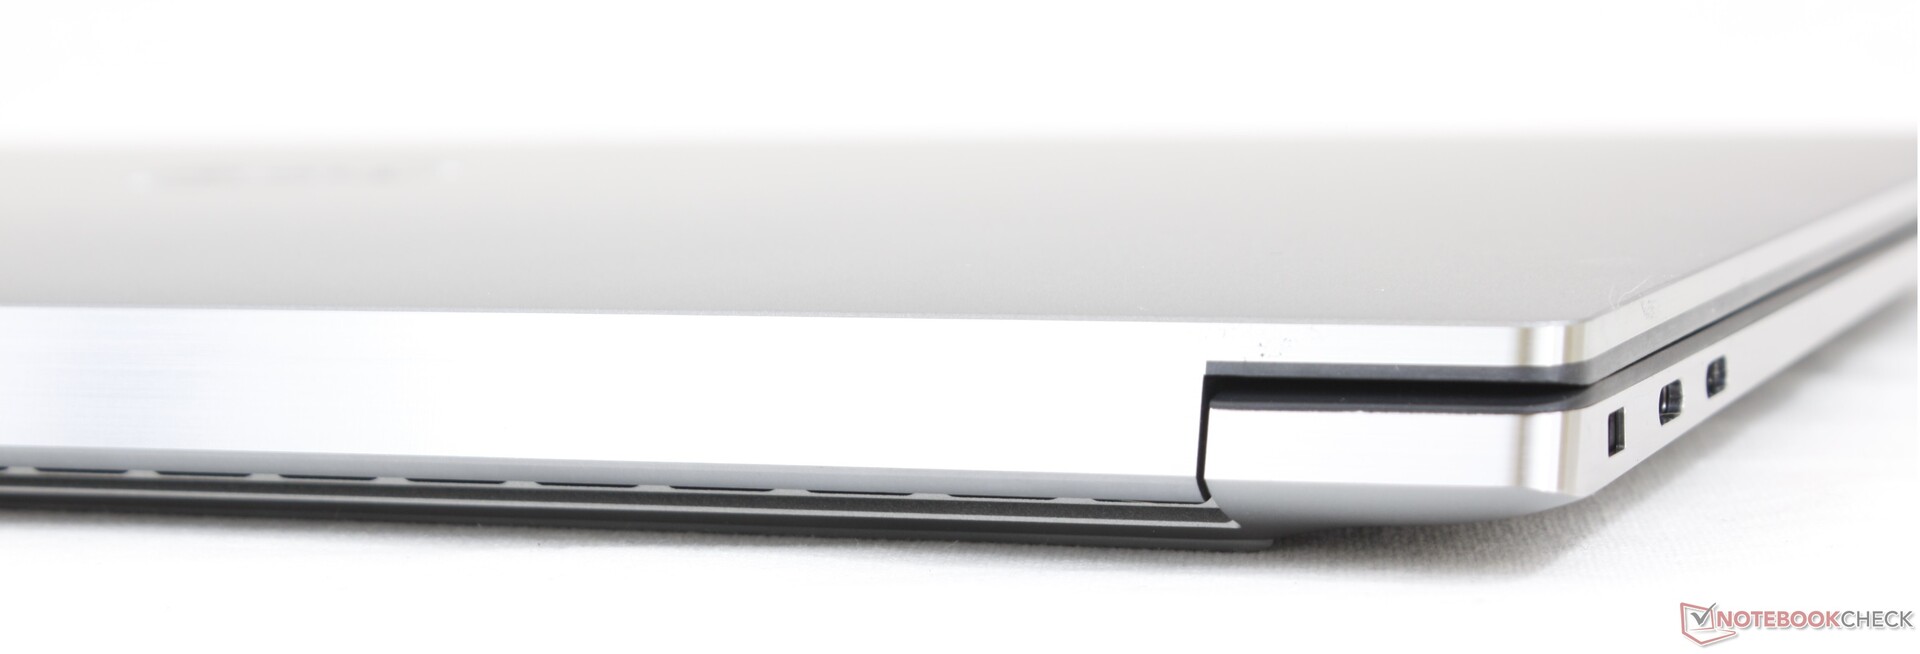
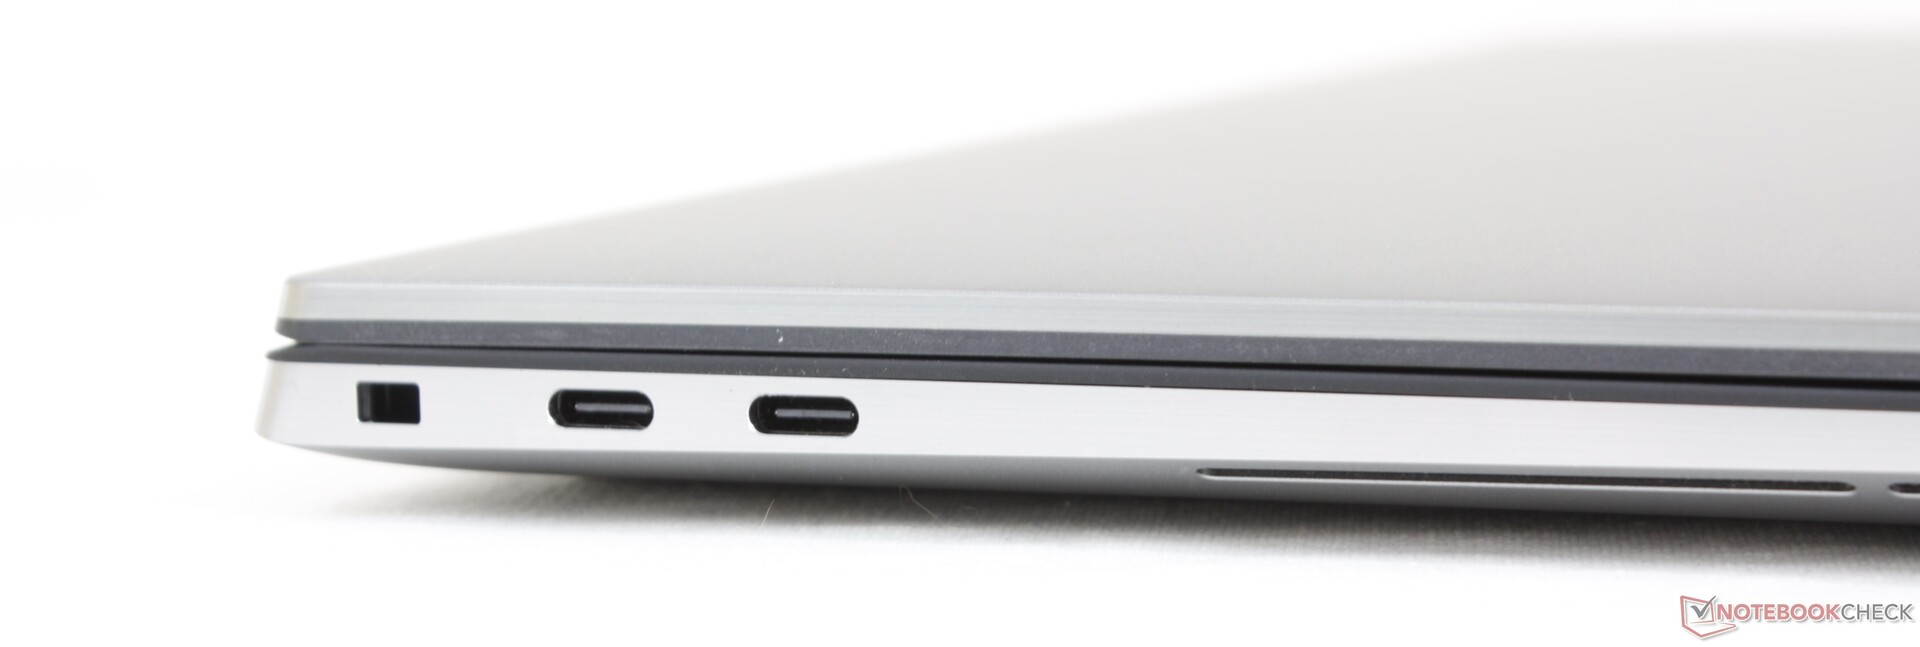
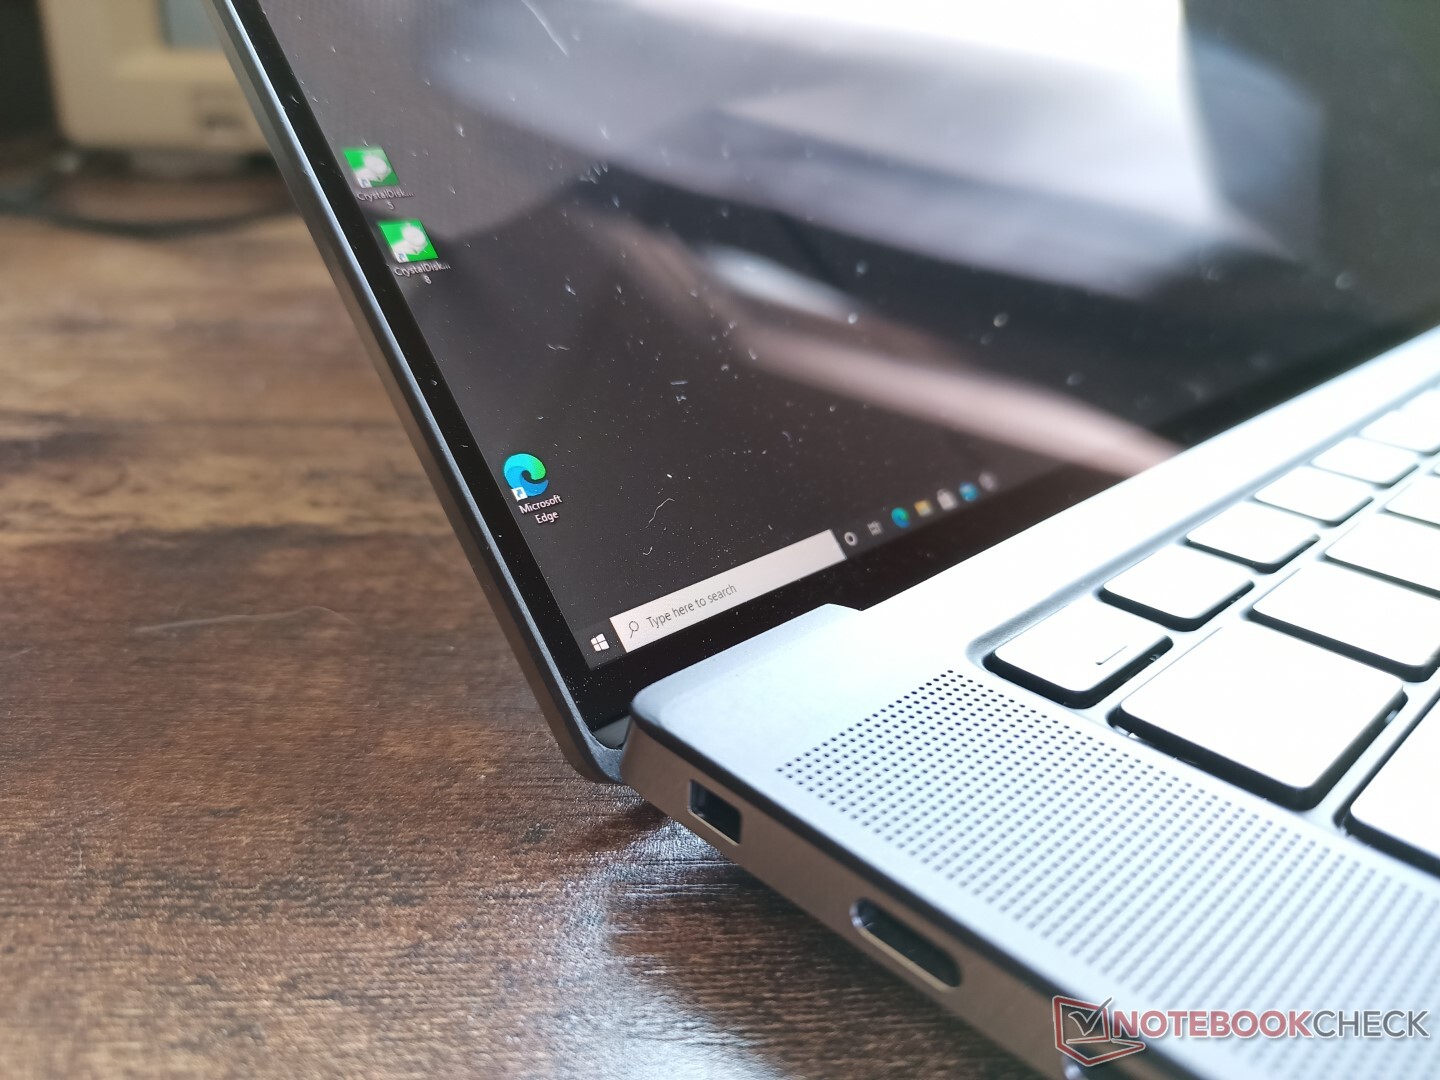
Connectivité - Thunderbolt 4 prêt à l'emploi
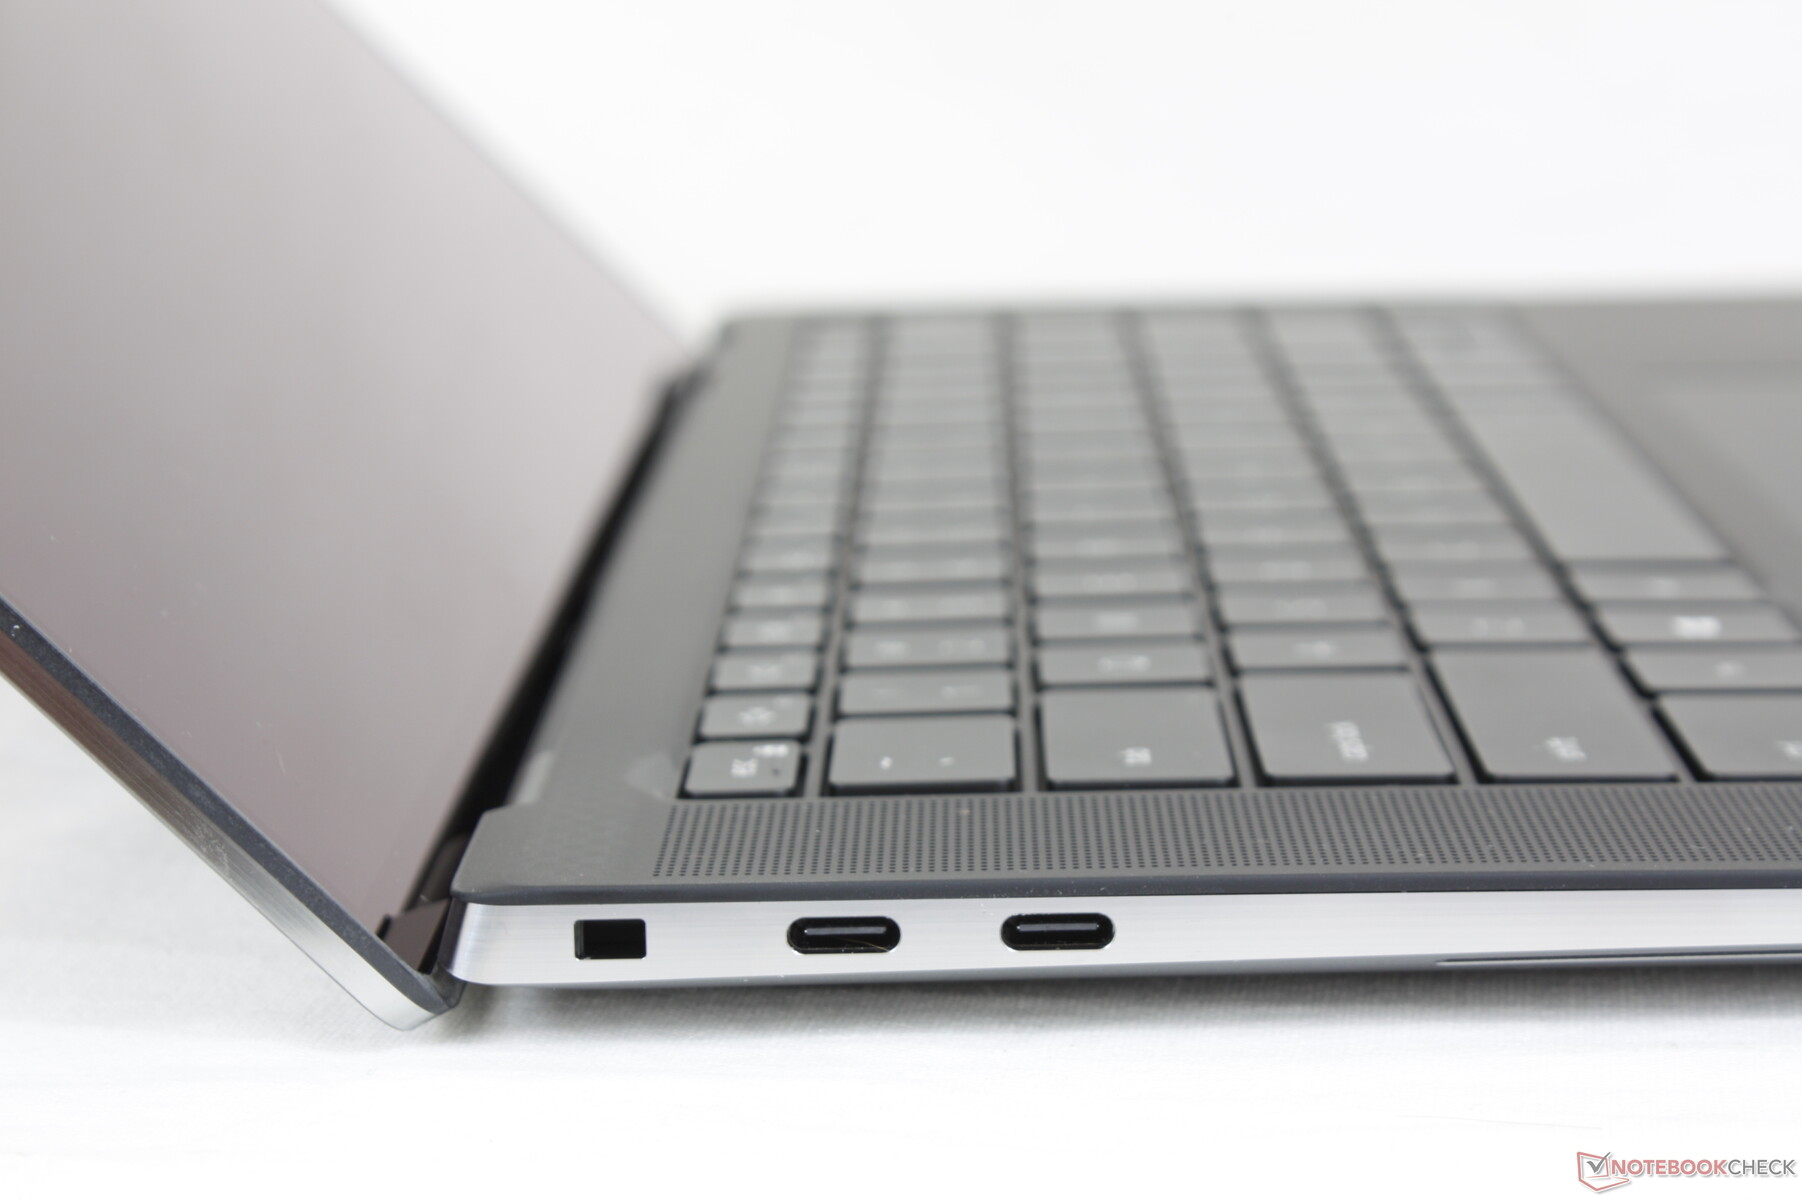
Les options de port ne comprennent que l'USB-C, alors préparez-vous à avoir des adaptateurs partout où vous allez. Les trois ports USB-C prennent en charge DisplayPort et Power Delivery, mais seuls les deux ports USB-C de gauche prennent en charge les périphériques Thunderbolt. Ces deux ports en particulier ont été mis à niveau de Thunderbolt 3 sur le Precision 5550 à Thunderbolt 4 sur le Precision 5560.
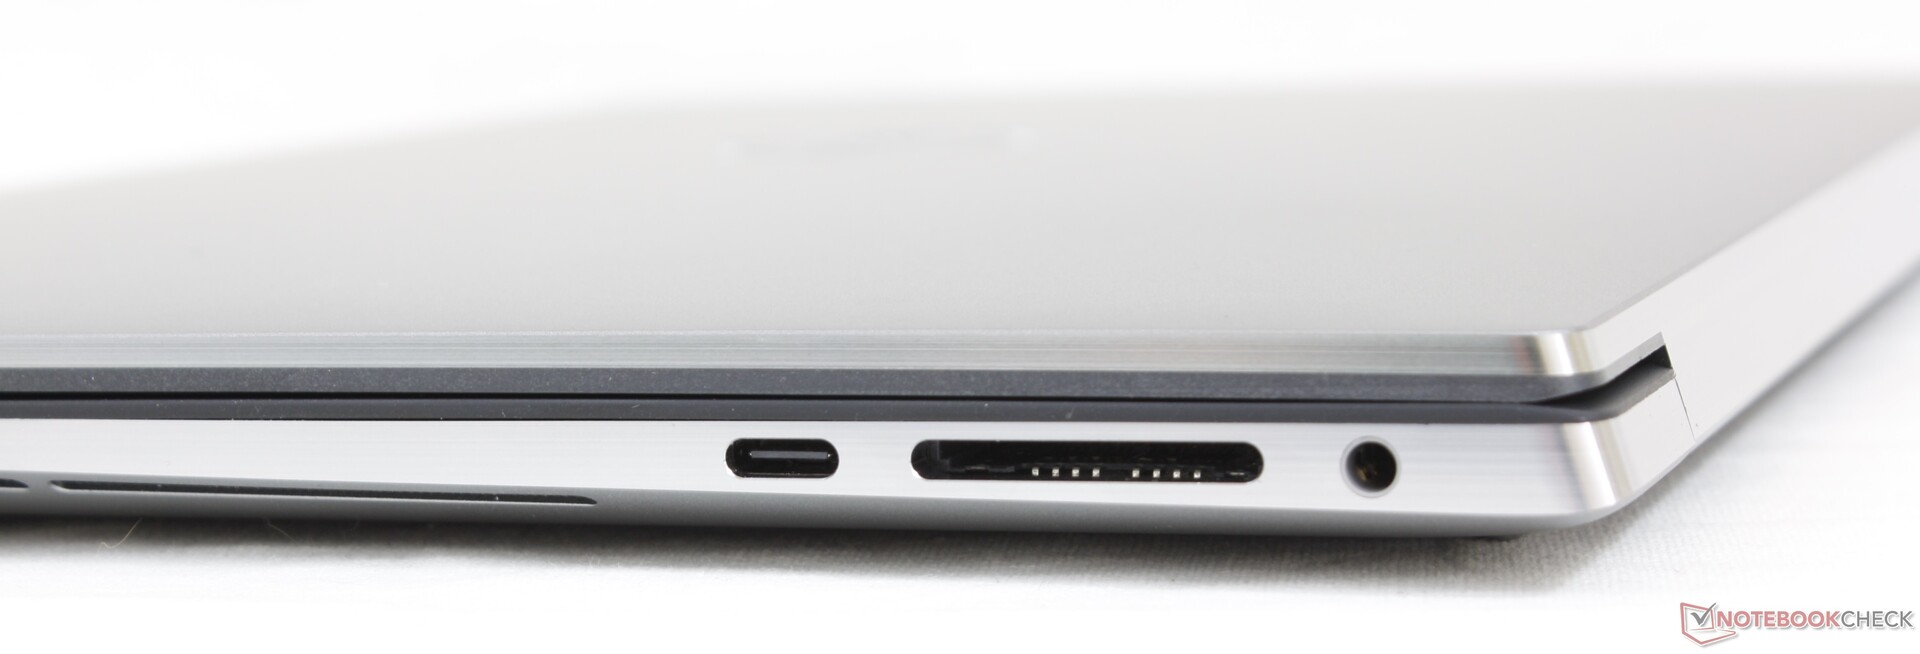
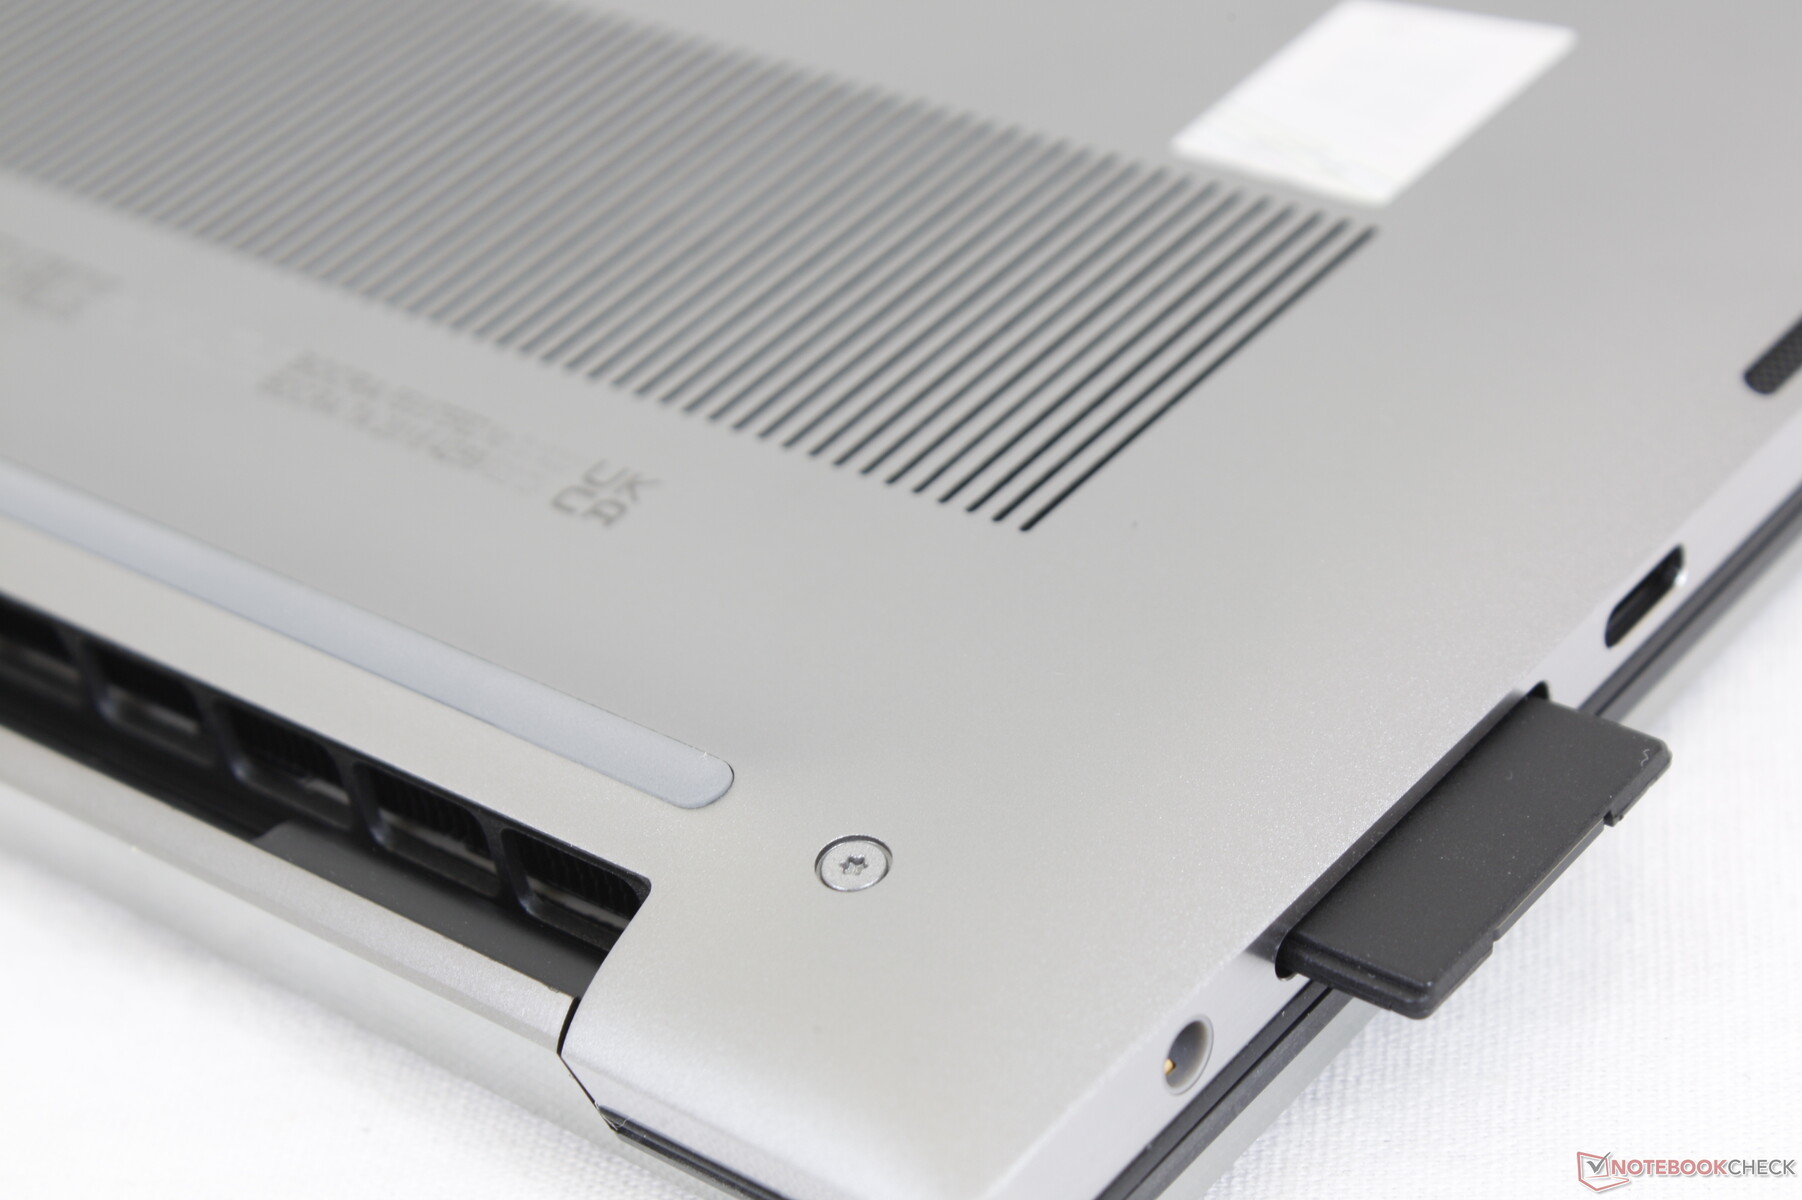
Lecteur de carte SD
Les taux de transfert sont très rapides, approchant les 200 Mo/s sur notre carte de test UHS-II. La fente n'est pas à ressort et la carte SD dépassera donc du bord.
| SD Card Reader | |
| average JPG Copy Test (av. of 3 runs) | |
| Lenovo ThinkPad P15 G2-20YQ001JGE (AV Pro V60) | |
| Dell Precision 5000 5560 (AV Pro V60) | |
| Dell Precision 5550 P91F (Toshiba Exceria Pro SDXC 64 GB UHS-II) | |
| Dell Precision 7550 (Toshiba Exceria Pro SDXC 64 GB UHS-II) | |
| Razer Blade 15 Studio Edition 2020 (Toshiba Exceria Pro SDXC 64 GB UHS-II) | |
| HP ZBook Studio 15 G8 (AV Pro V60) | |
| maximum AS SSD Seq Read Test (1GB) | |
| Lenovo ThinkPad P15 G2-20YQ001JGE (AV Pro V60) | |
| Dell Precision 5000 5560 (AV Pro V60) | |
| Dell Precision 5550 P91F (Toshiba Exceria Pro SDXC 64 GB UHS-II) | |
| Dell Precision 7550 (Toshiba Exceria Pro SDXC 64 GB UHS-II) | |
| HP ZBook Studio 15 G8 (AV Pro V60) | |
Communication
Webcam - Toujours pas de volet de confidentialité


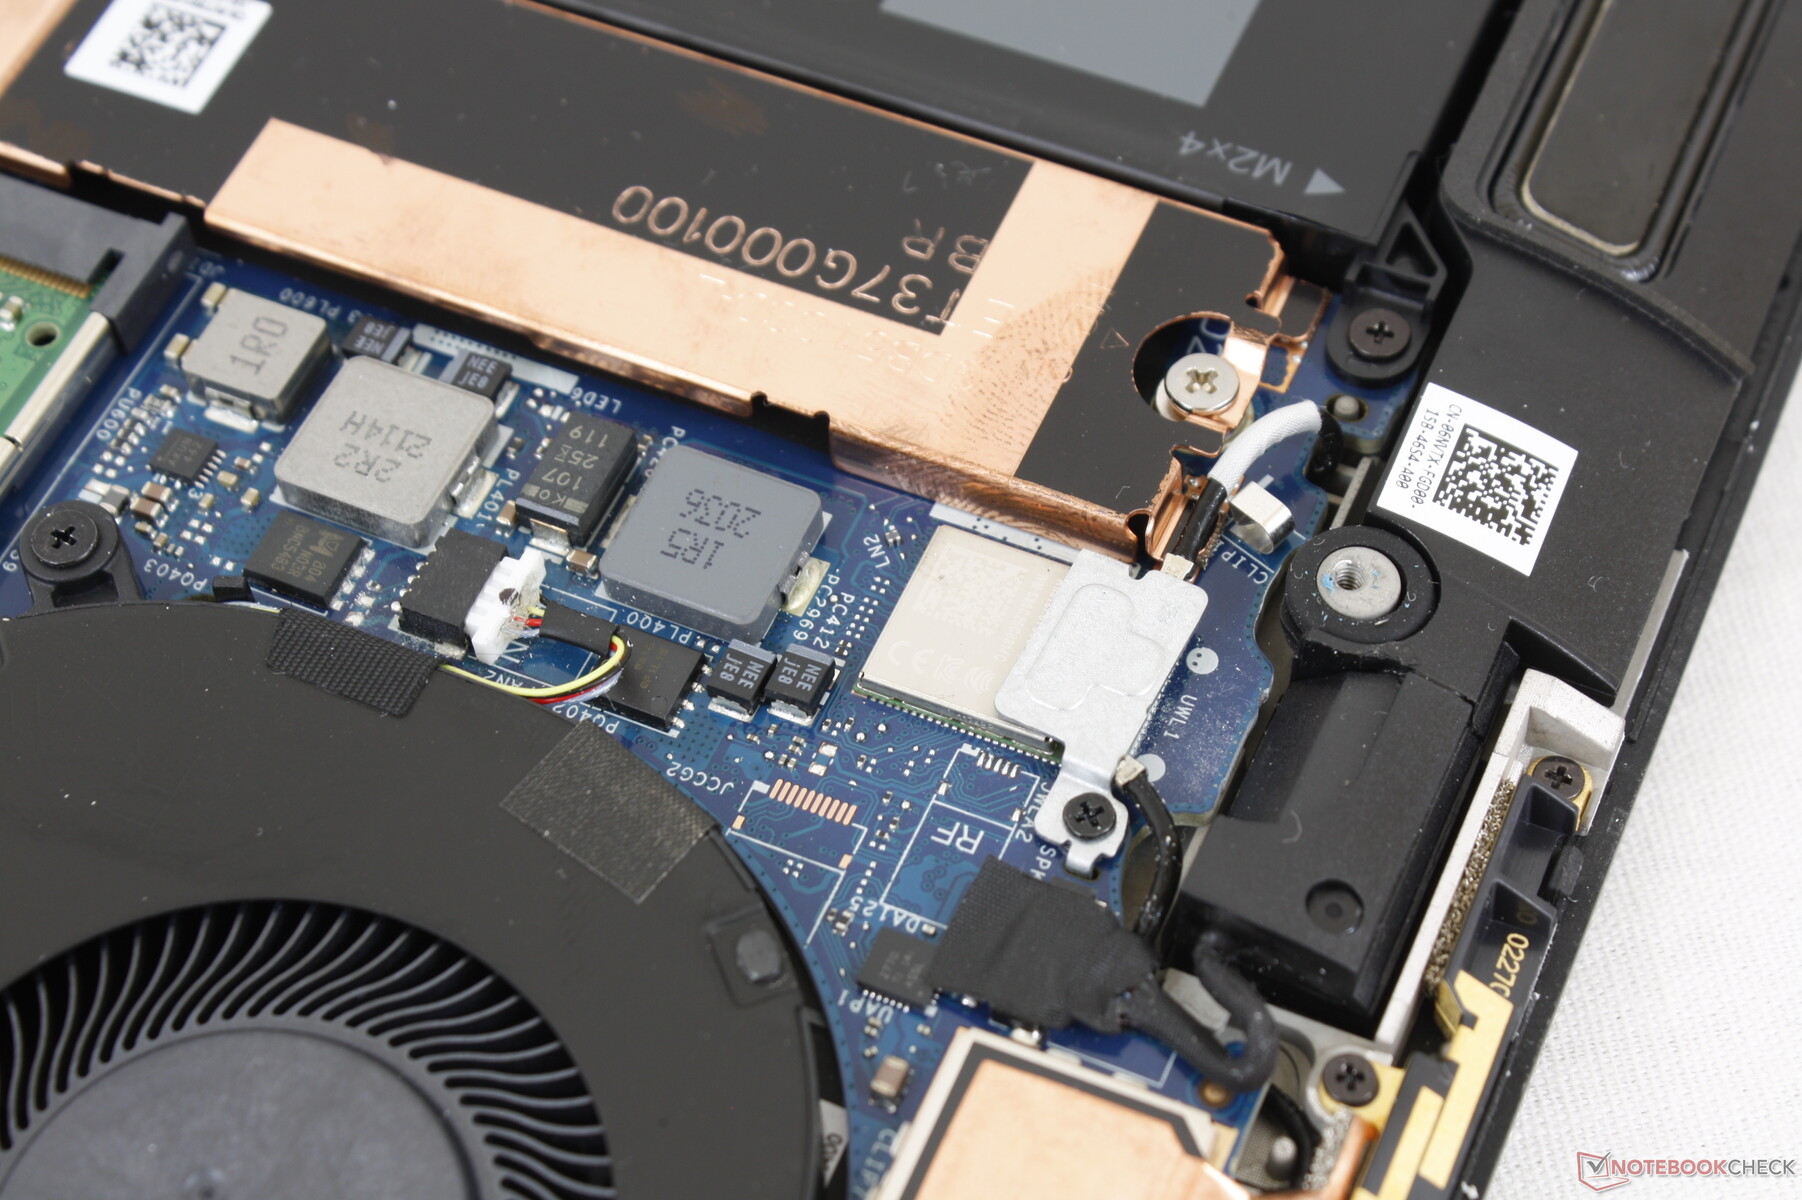
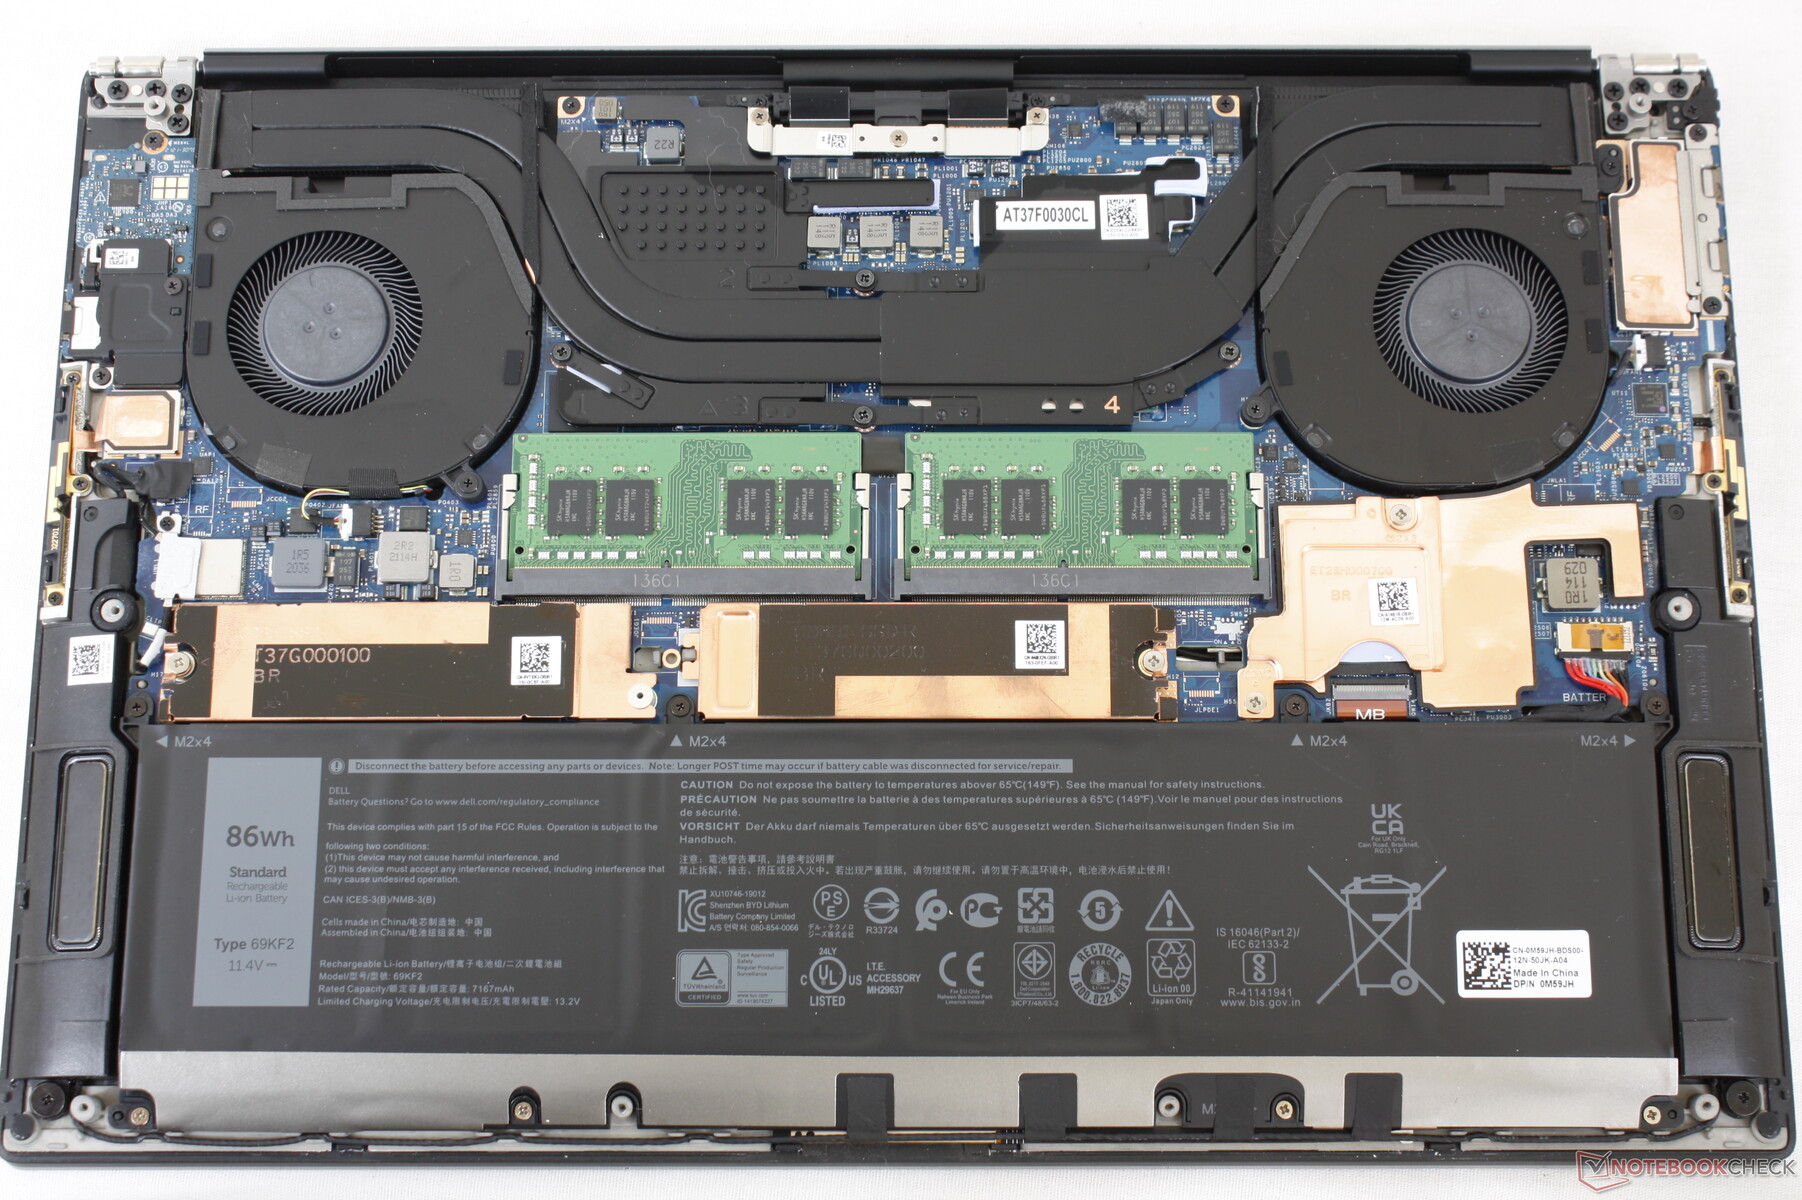
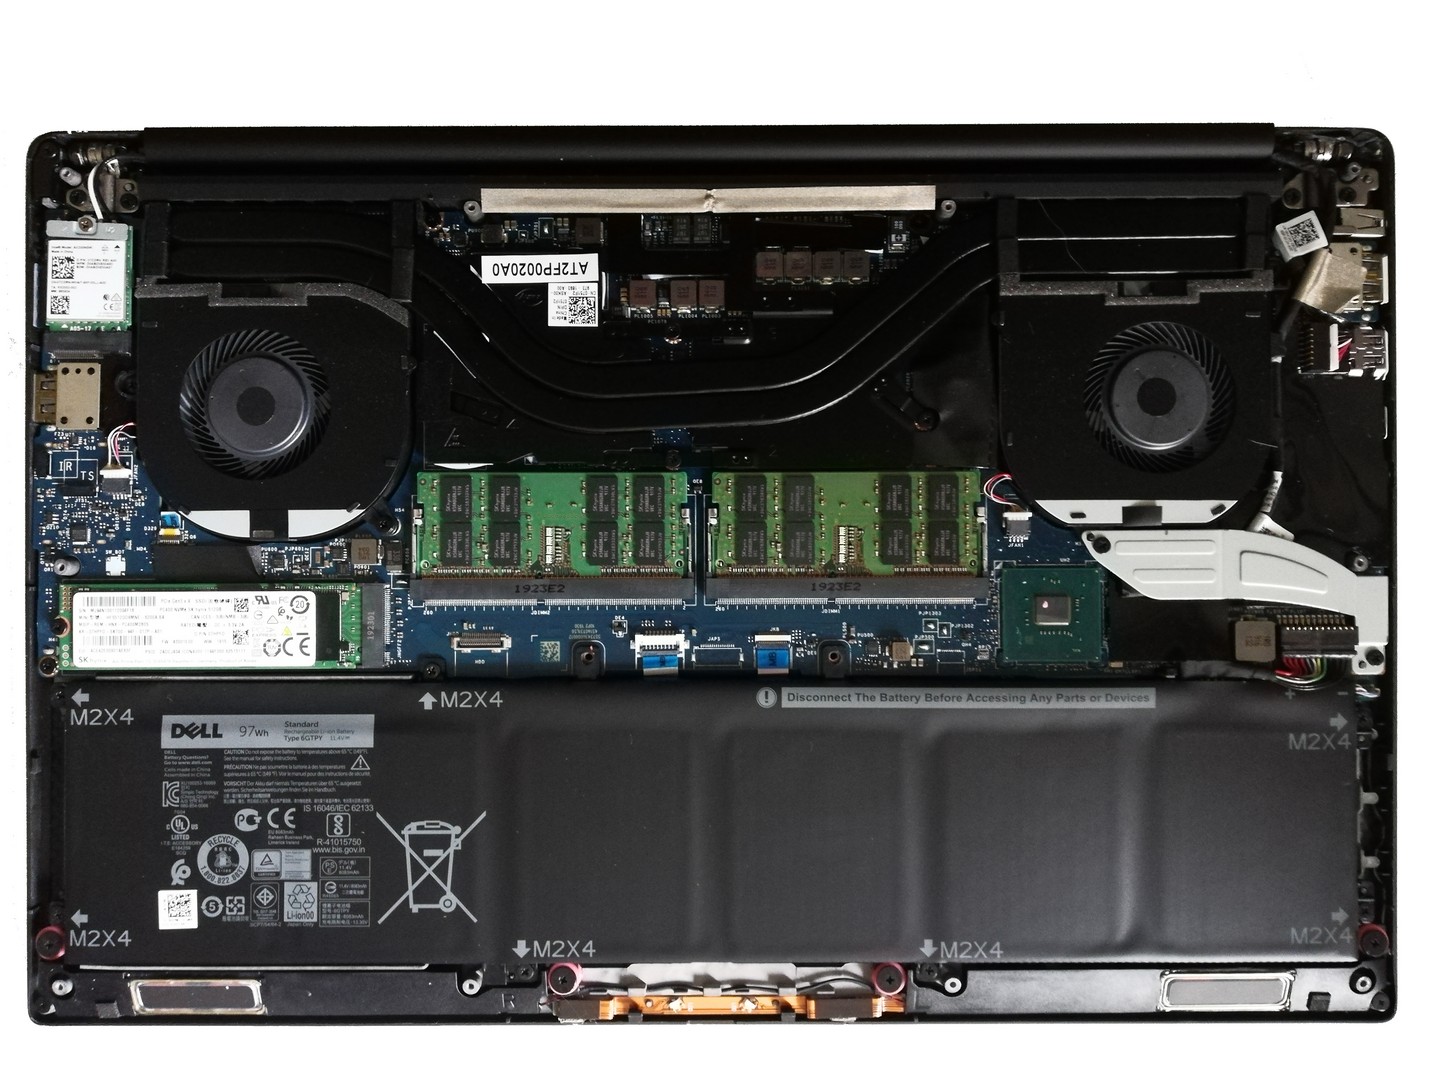
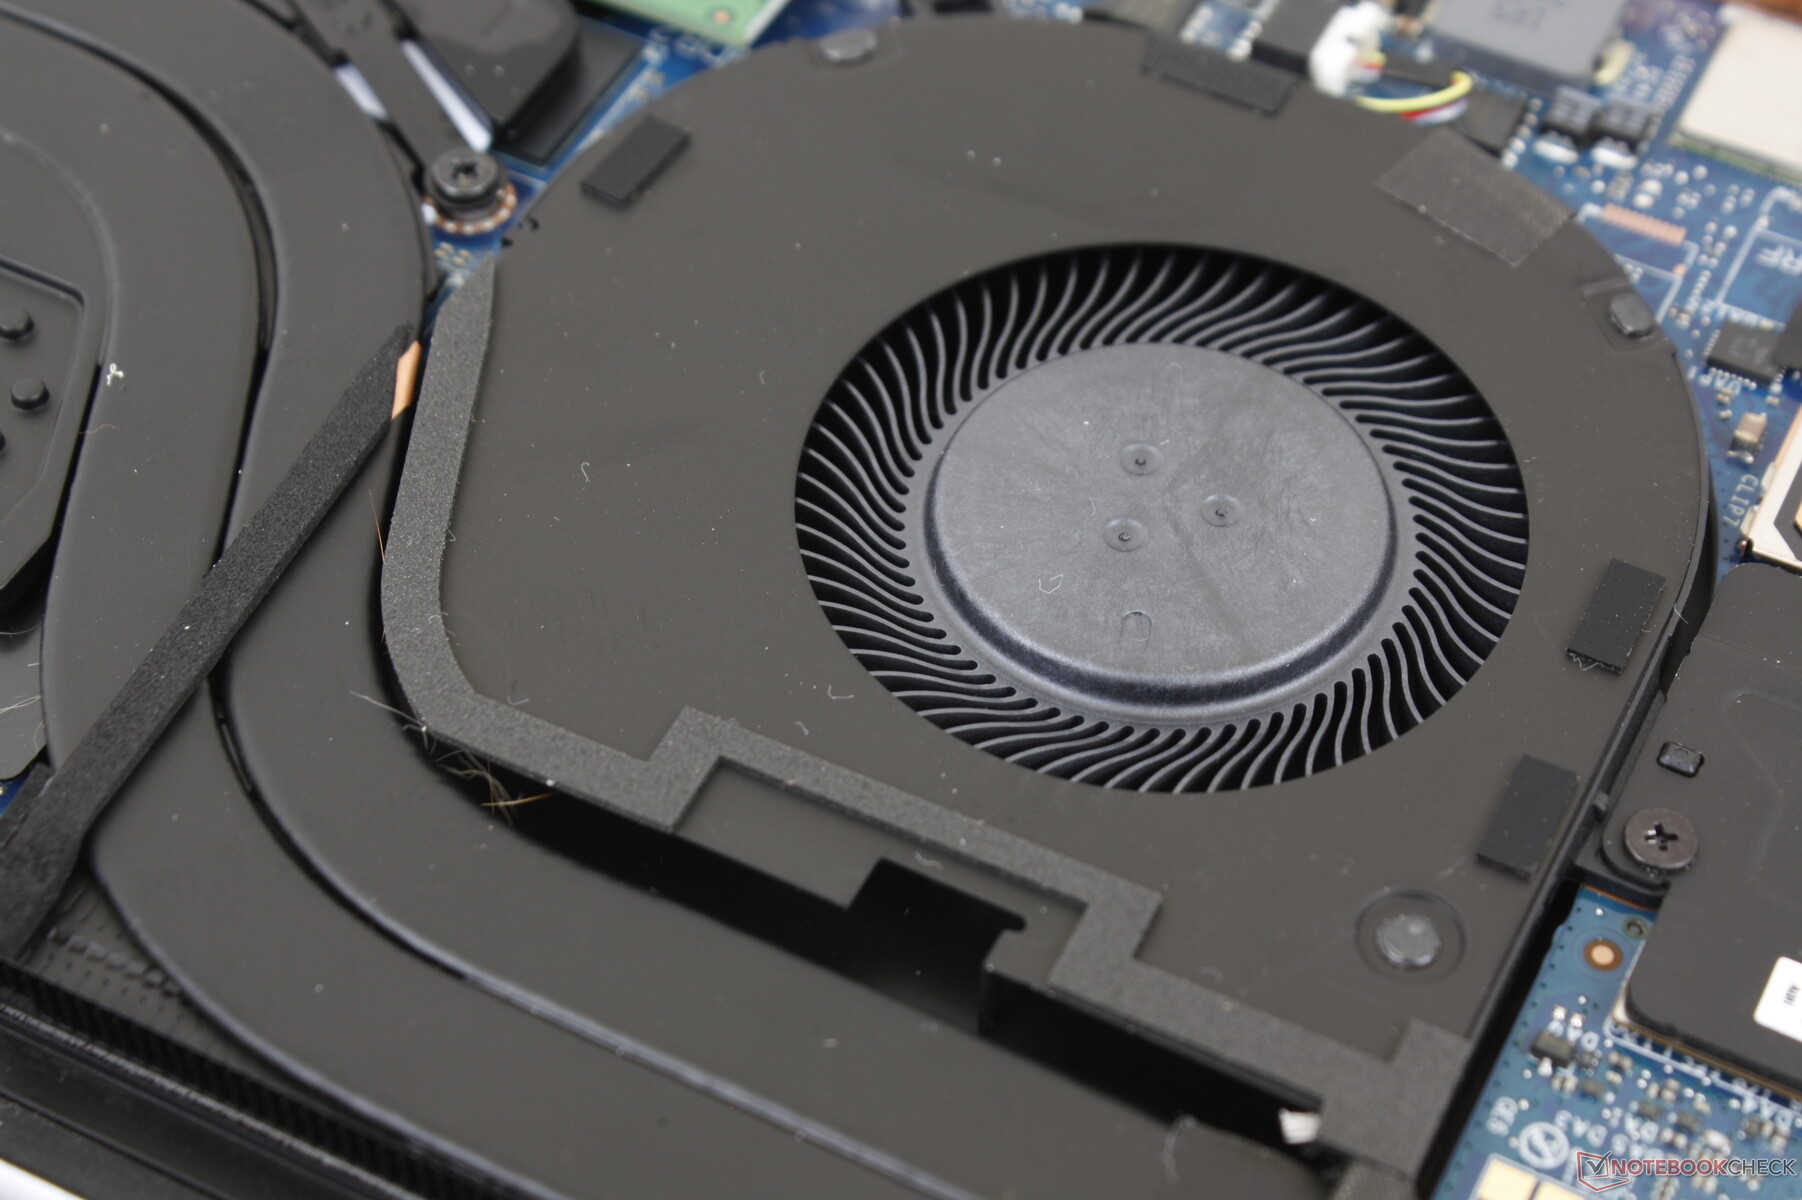
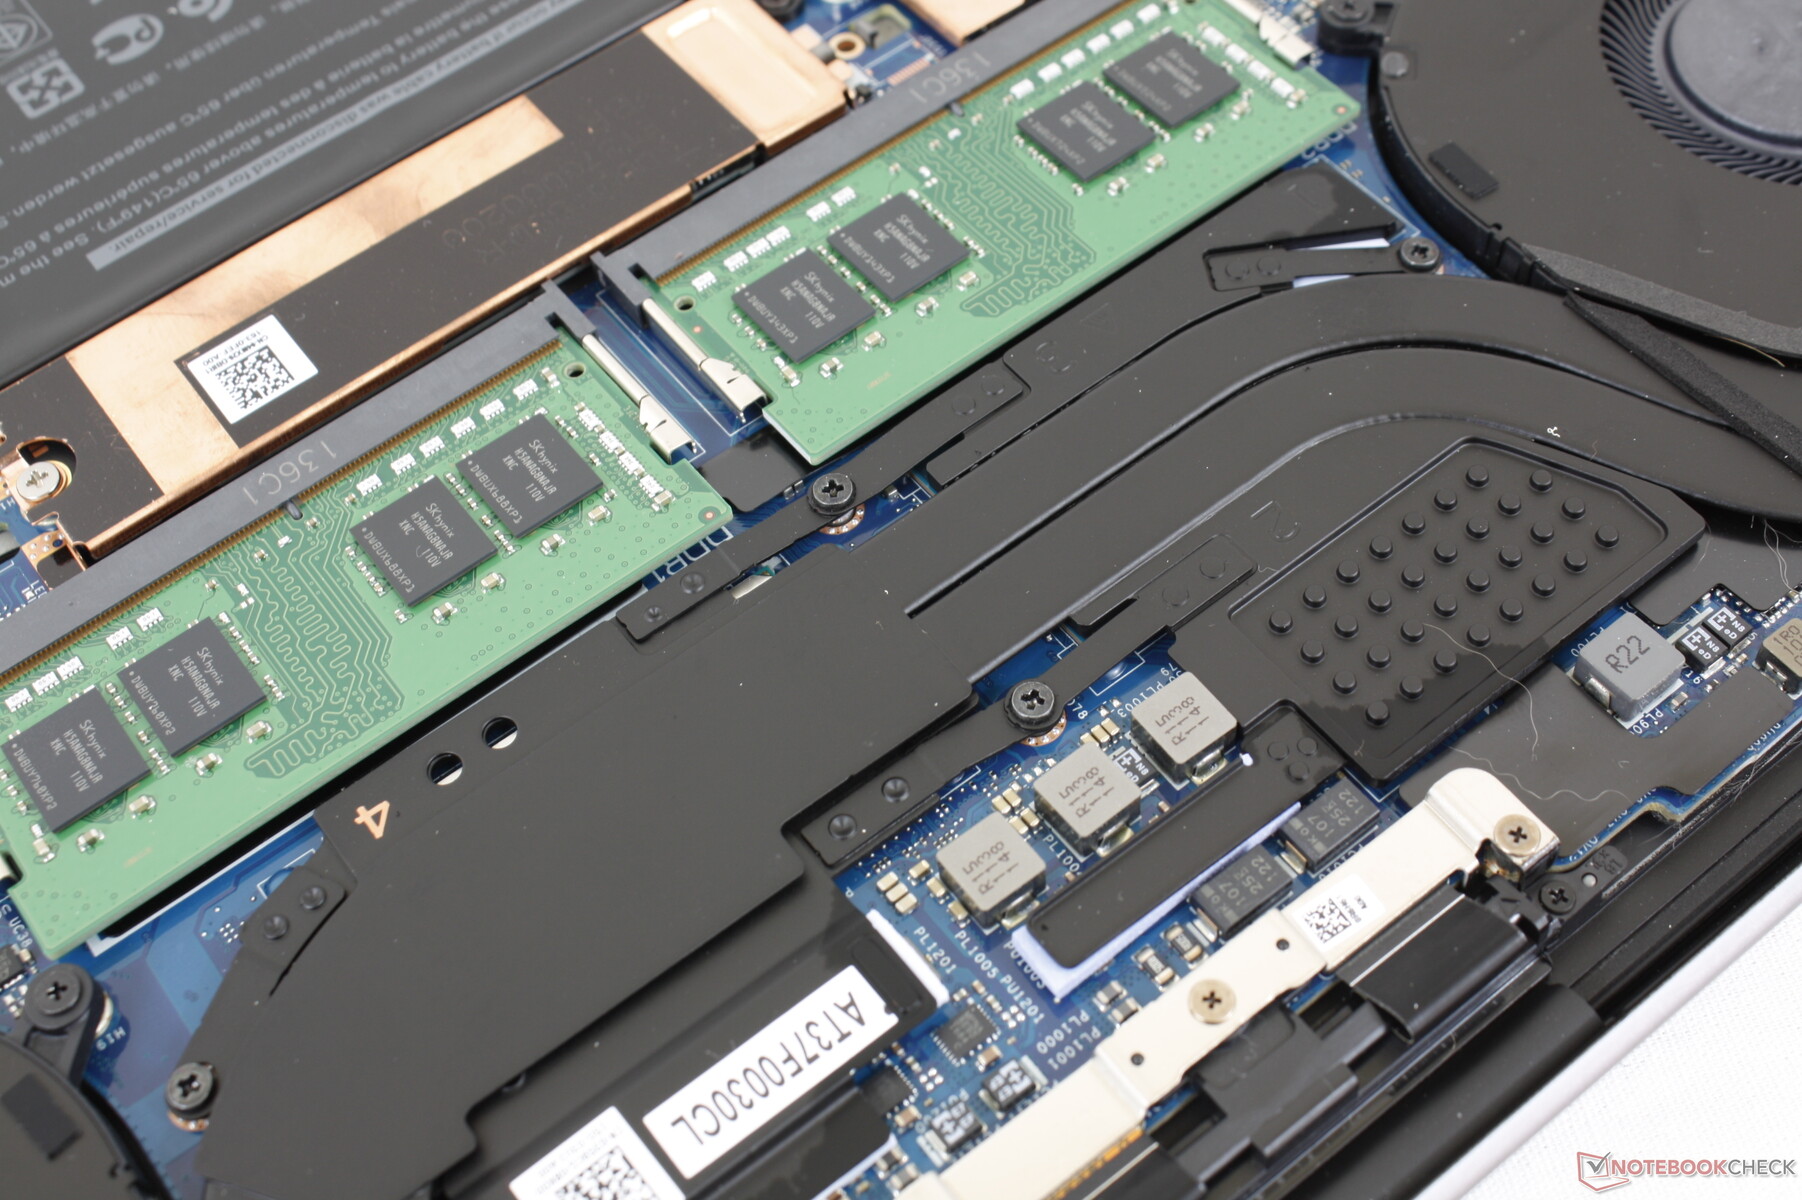
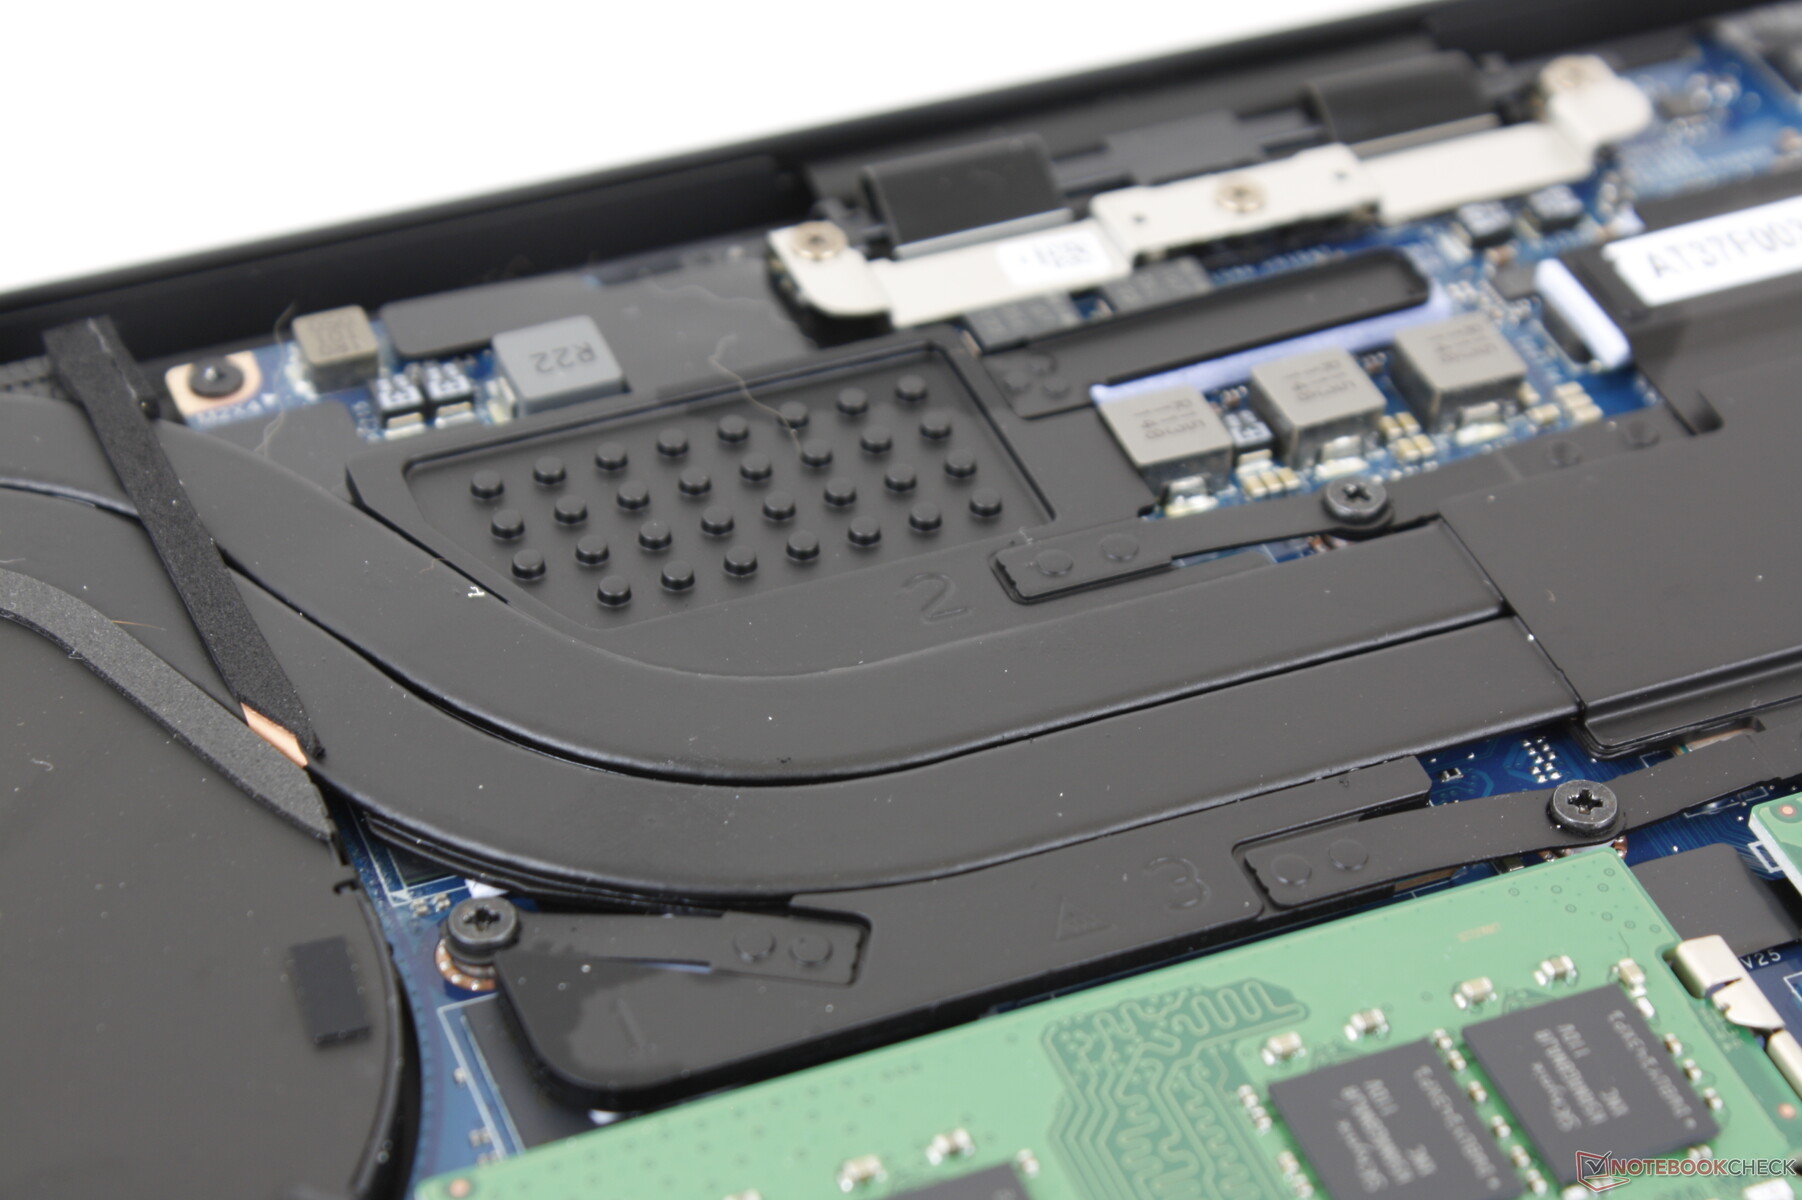
Maintenance
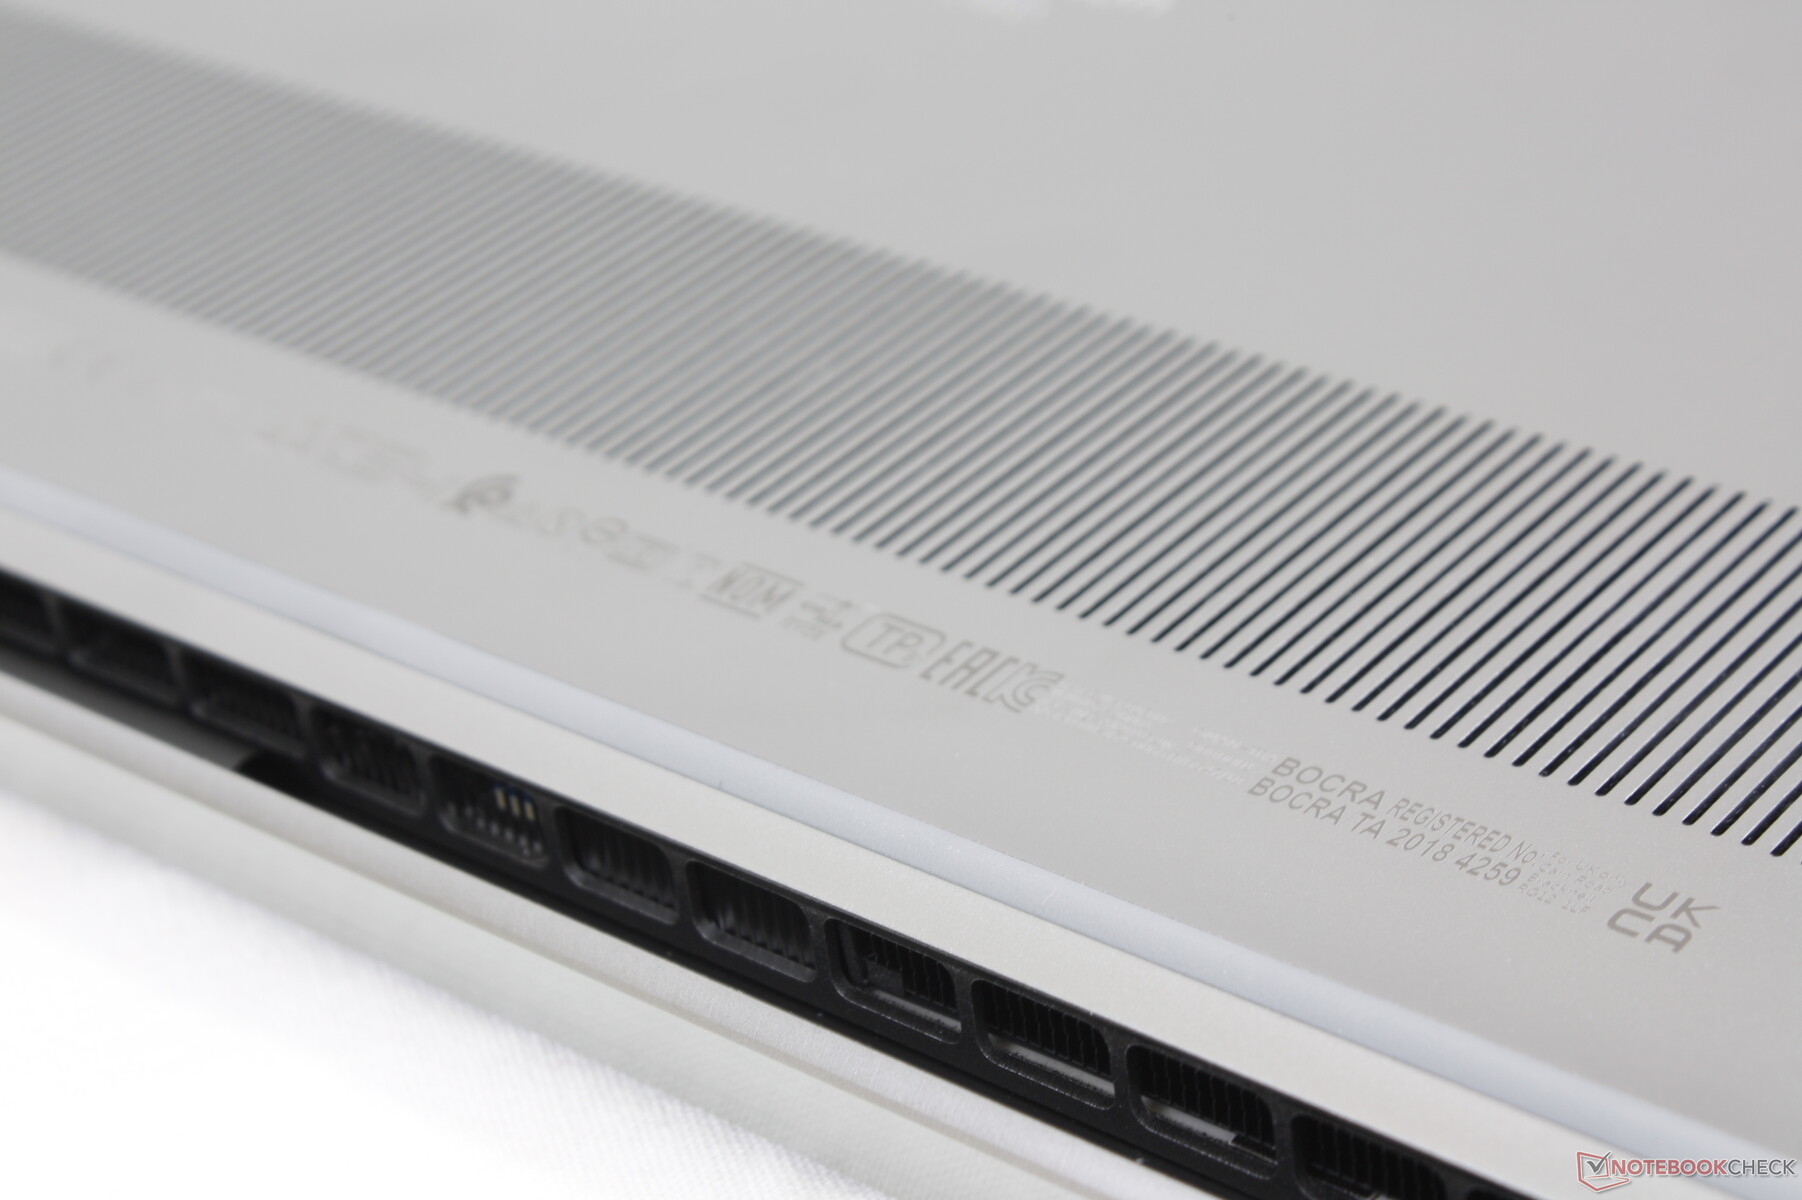
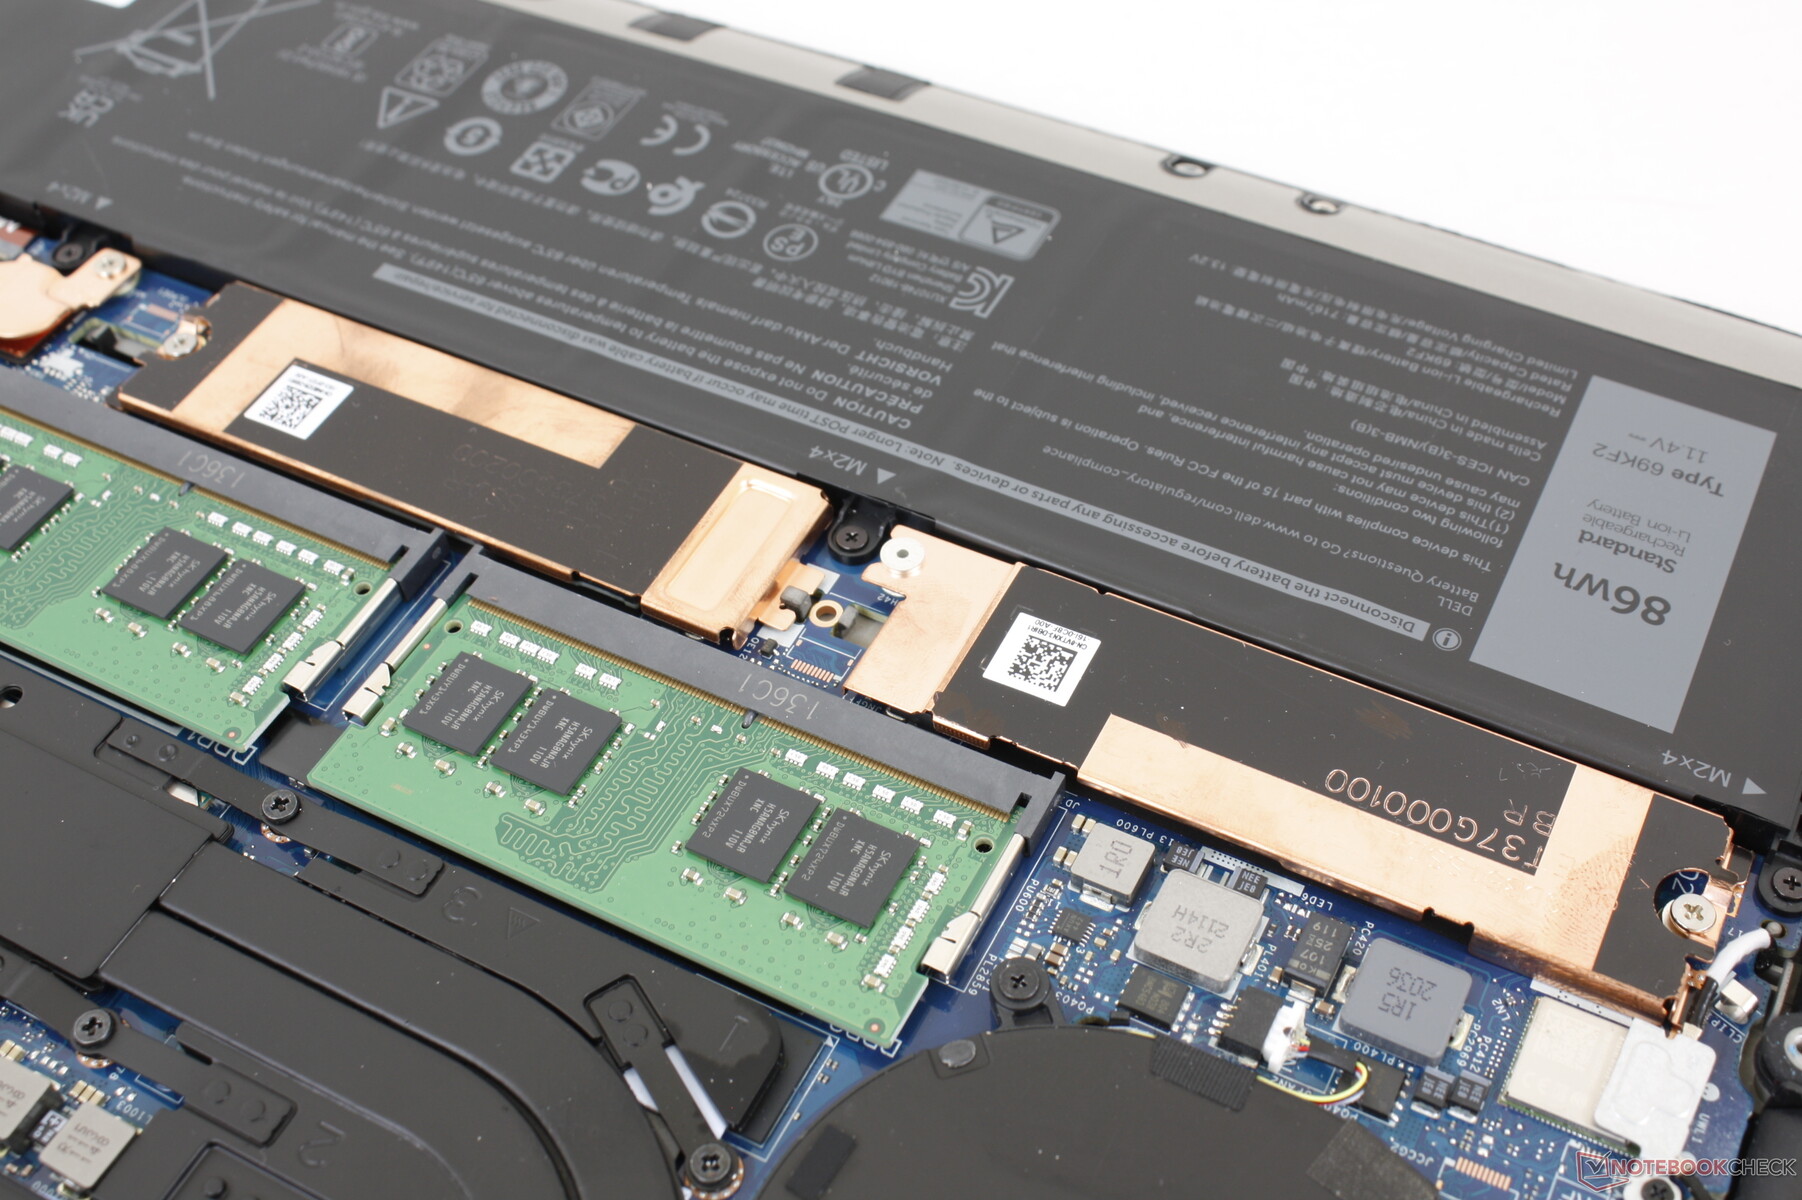
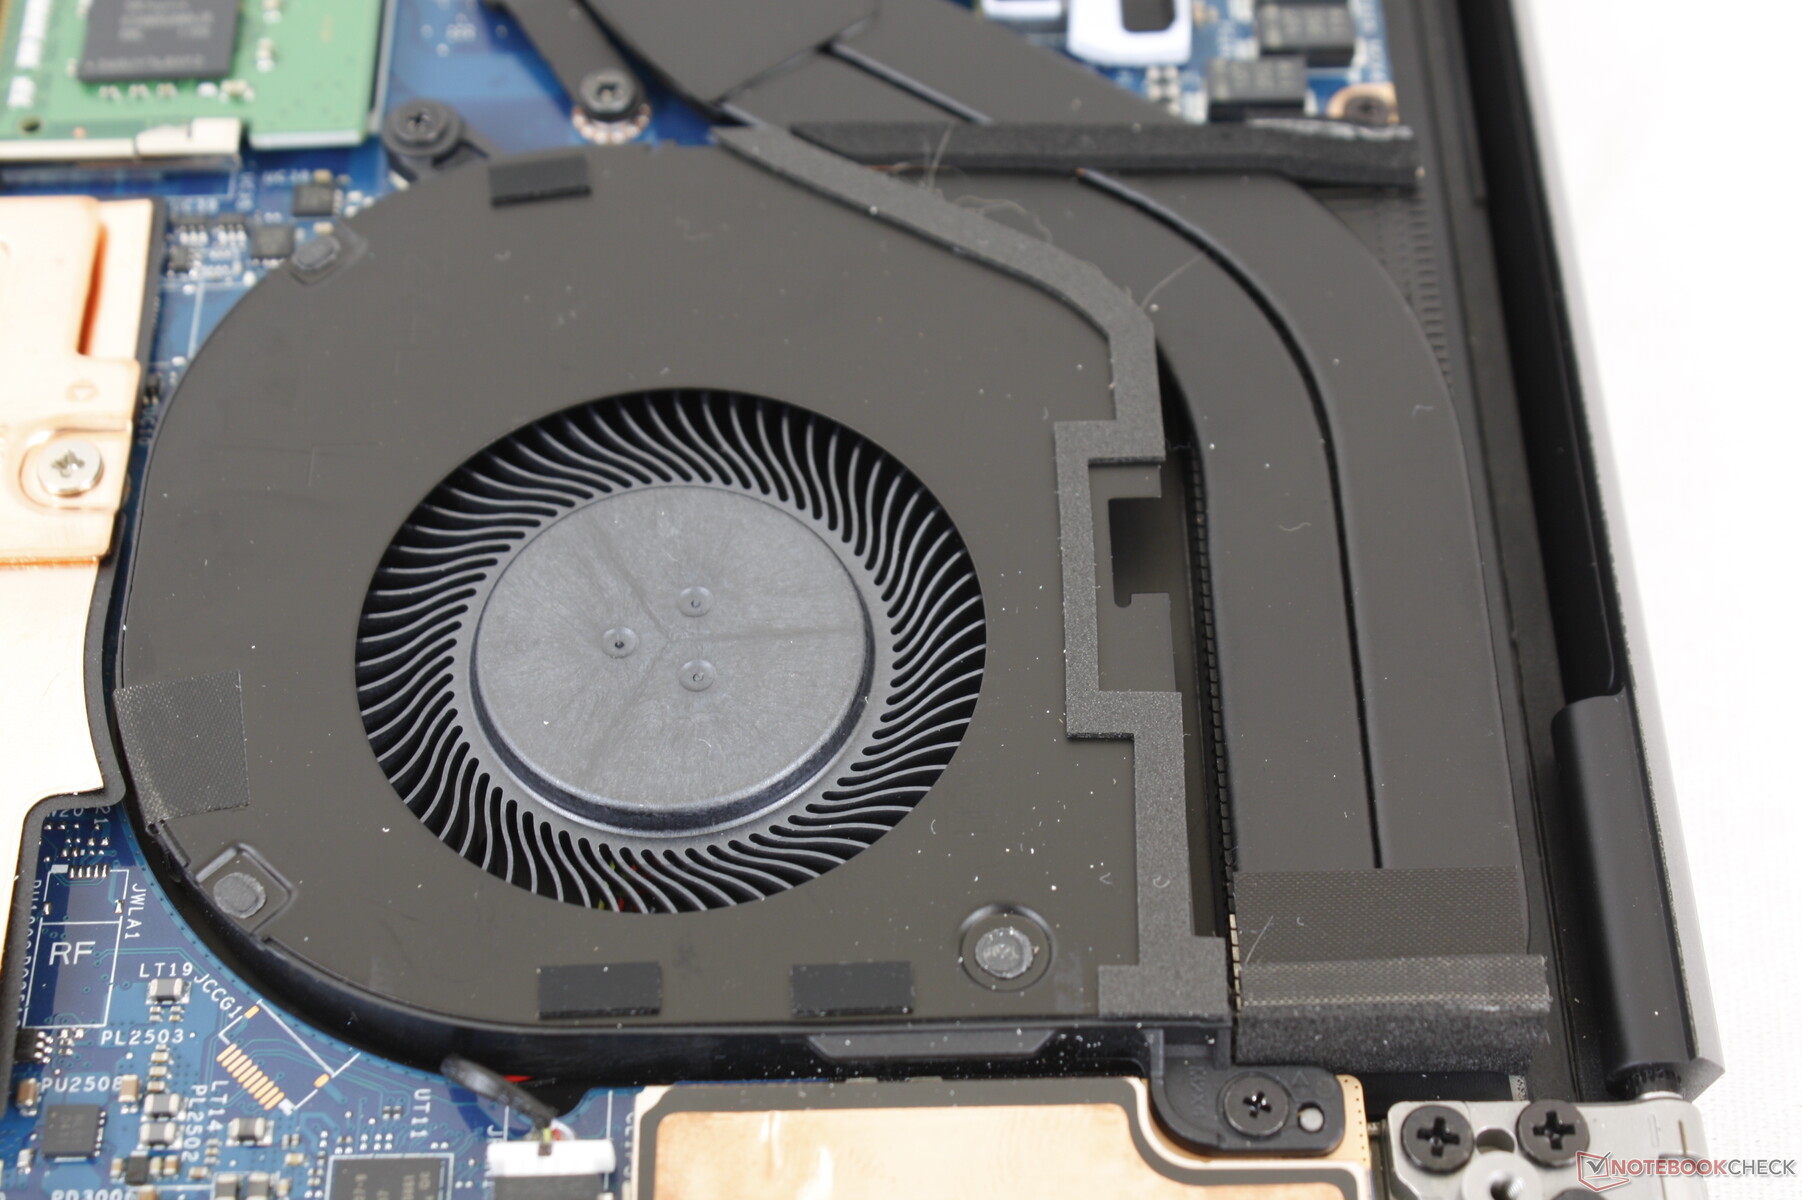
Le panneau inférieur est plus difficile à retirer par rapport à l'ancien modèle Precision 5540. La disposition interne est essentiellement identique à celle du Precision 5550.
Accessoires et garantie
La boîte de détail comprend un adaptateur USB-C vers USB-A et HDMI de taille normale, comme pour le XPS 15.
Décevant, la garantie de base n'est que d'un an au lieu de deux ou trois ans sur de nombreuses autres stations de travail mobiles. Les utilisateurs devront passer à la série supérieure Precision 7000 pour bénéficier d'une garantie de base plus longue.
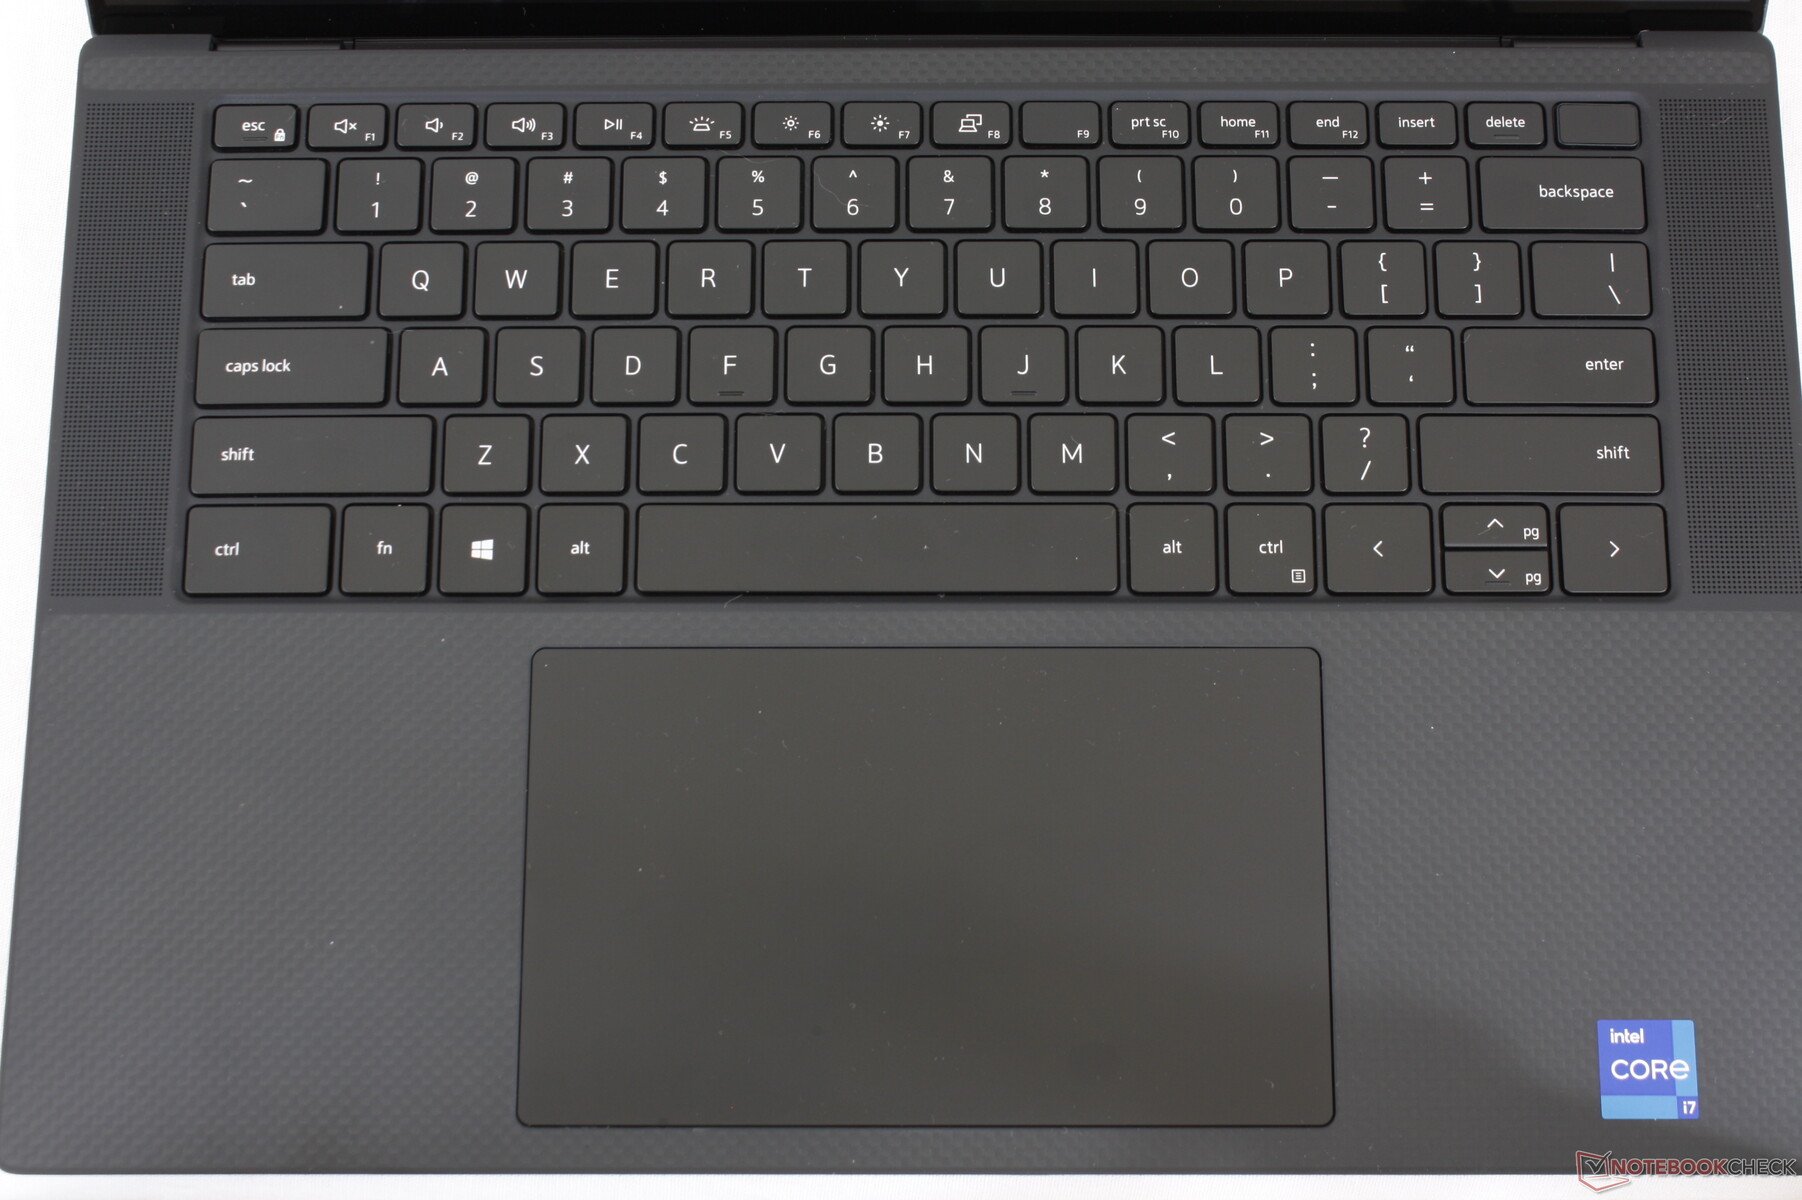
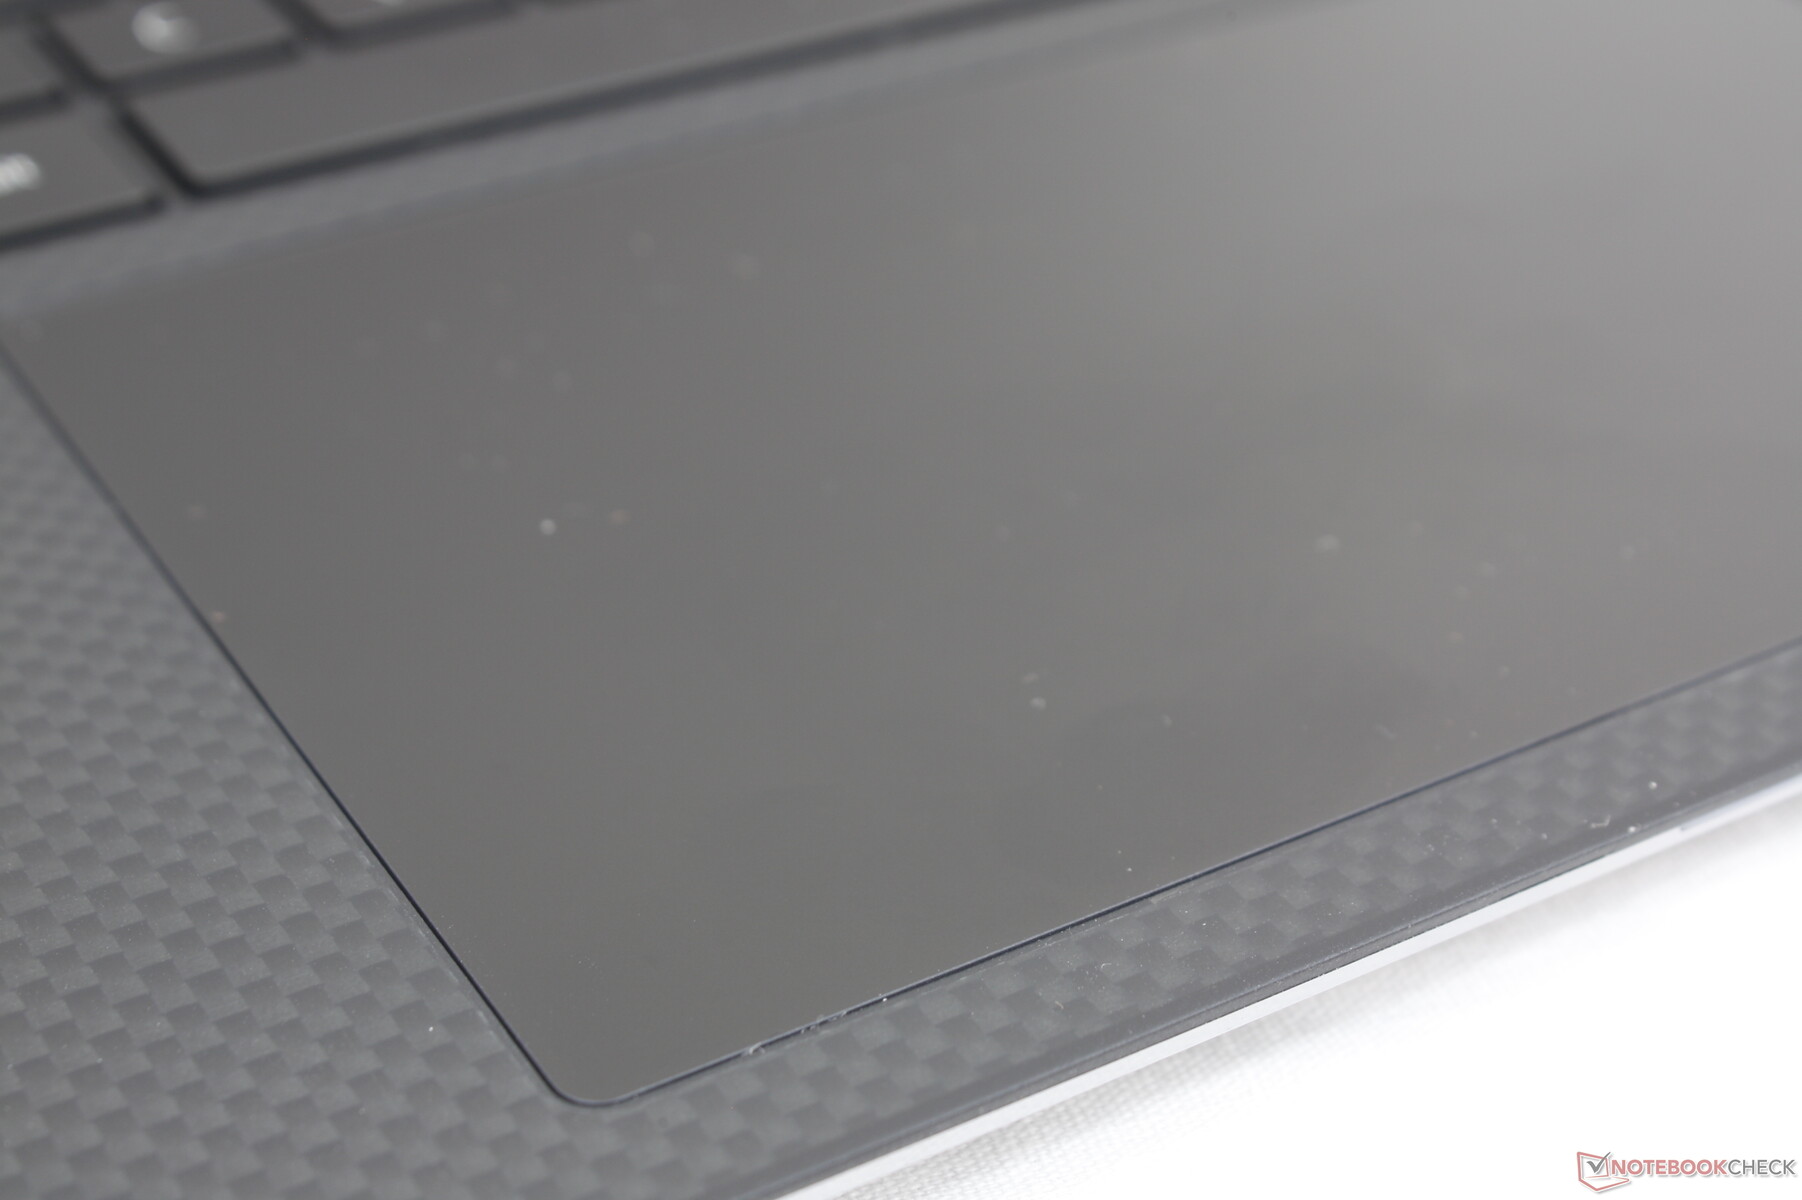
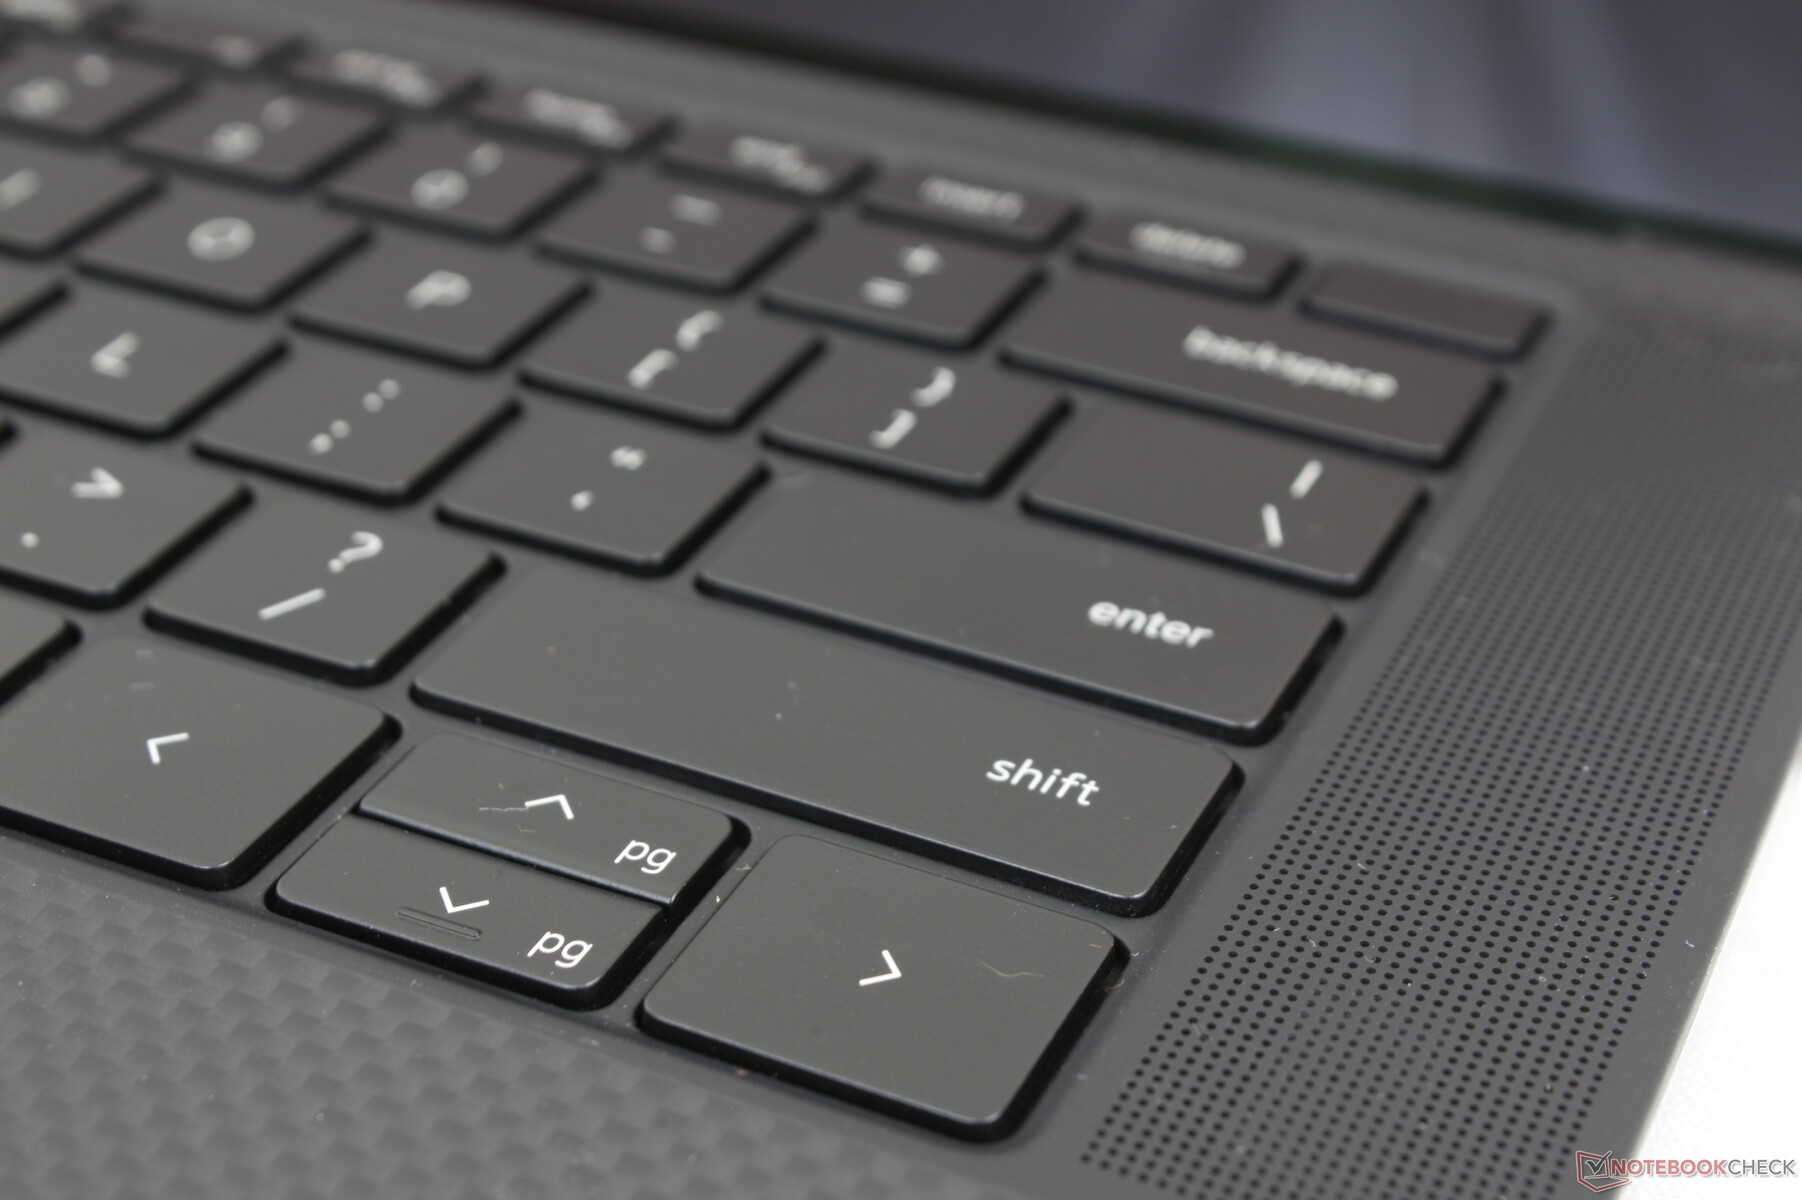
Périphériques d'entrée

Afficher
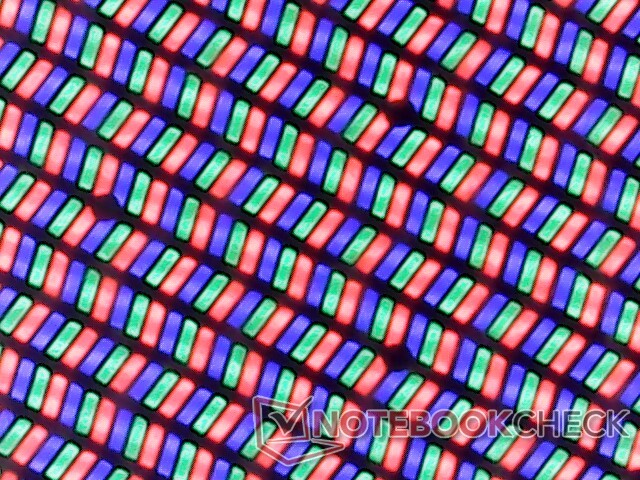
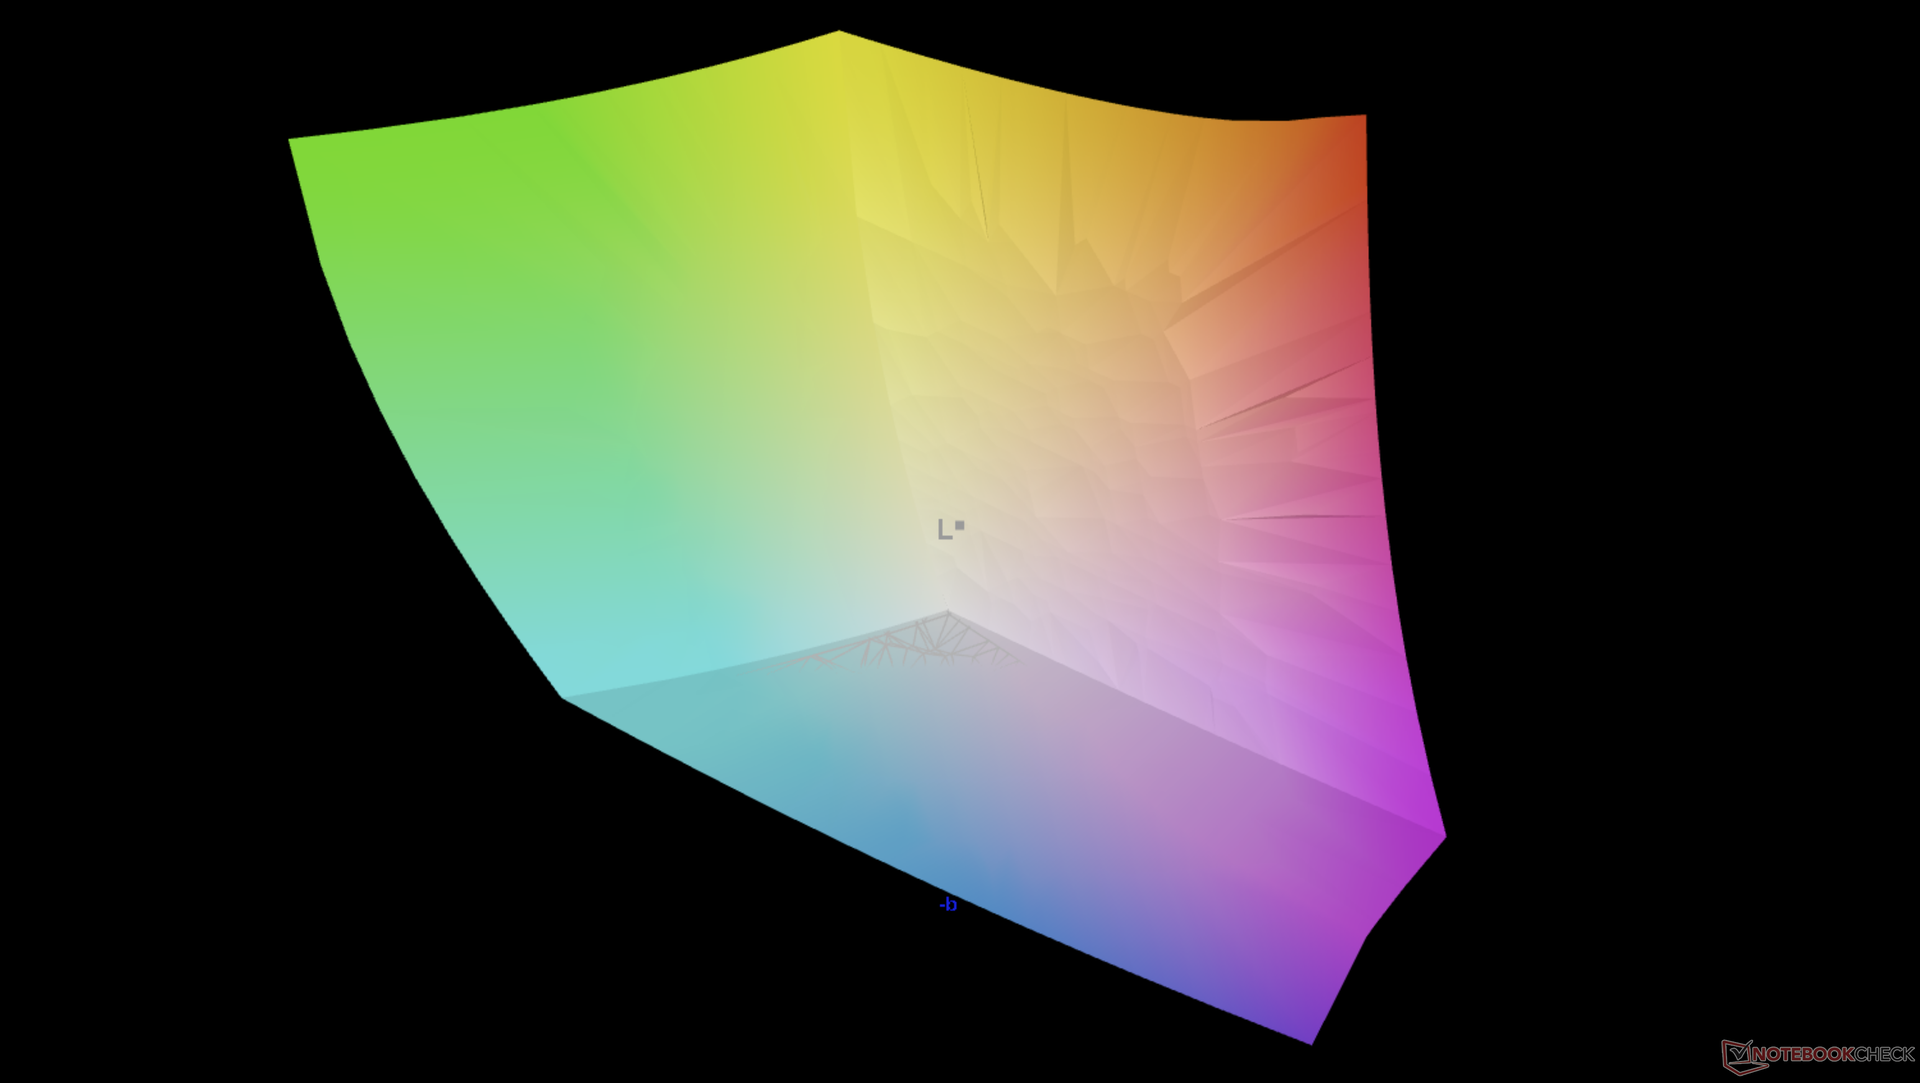
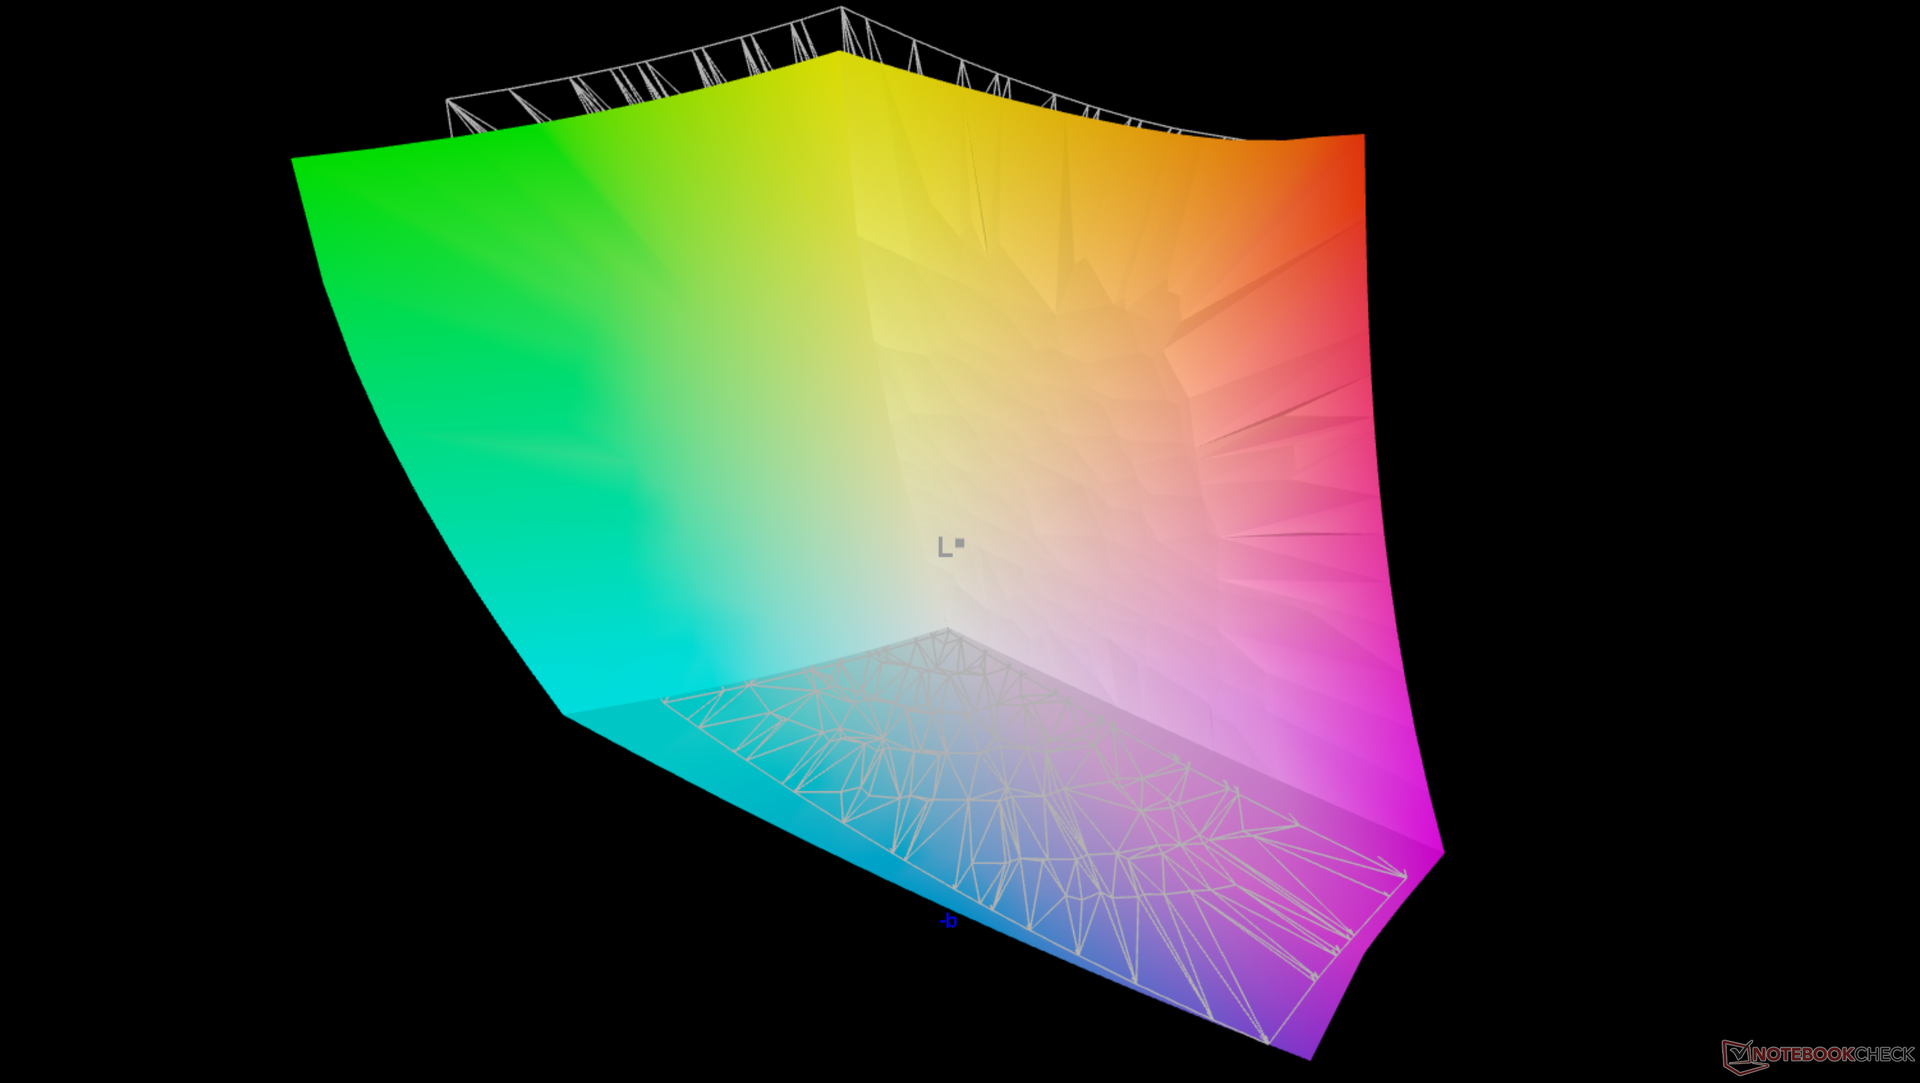
Dell continue d'utiliser le même écran tactile IPS Sharp LQ156R1 sur tous ses XPS 15 16:10 et Precision 5550/5560 4K SKUs, ce qui est très bien car il s'agit toujours d'un écran haut de gamme avec une couverture AdobeRGB complète, un rapport de contraste élevé >1000:1 et un rétroéclairage brillant ~500 nit. L'expérience visuelle est donc cohérente entre les derniers modèles XPS 15 et Precision 55x0. Un écran mat 1200p non tactile de moindre qualité est disponible sur certaines UGS comme sur le XPS 15, mais l'OLED est curieusement omis sur le Precision 5560
La lenteur des temps de réponse noir-blanc et gris-gris reste le principal inconvénient, ce qui signifie que l'effet fantôme est très perceptible, surtout par rapport à l'OLED. Ce n'est pas un gros problème pour la plupart des applications de type CAO.
| |||||||||||||||||||||||||
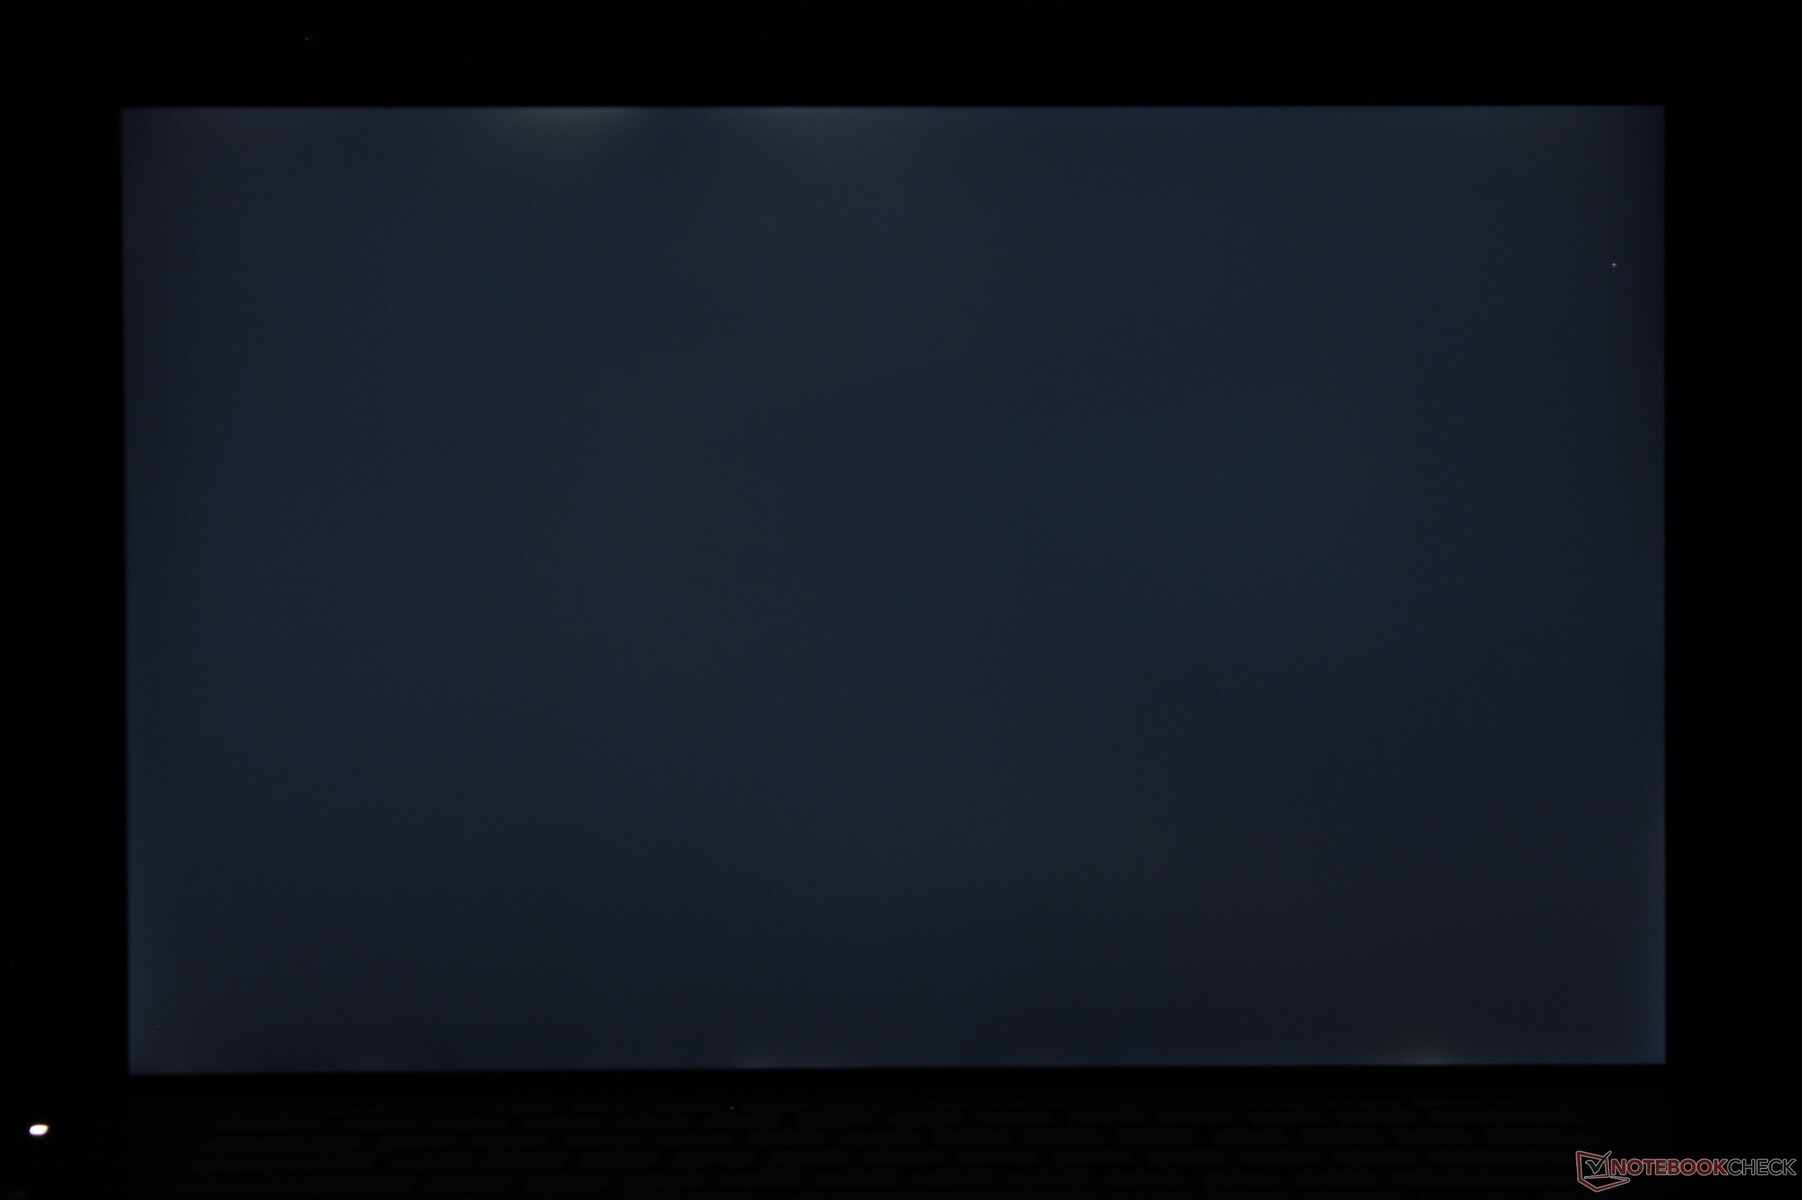
Homogénéité de la luminosité: 83 %
Valeur mesurée au centre, sur batterie: 501.5 cd/m²
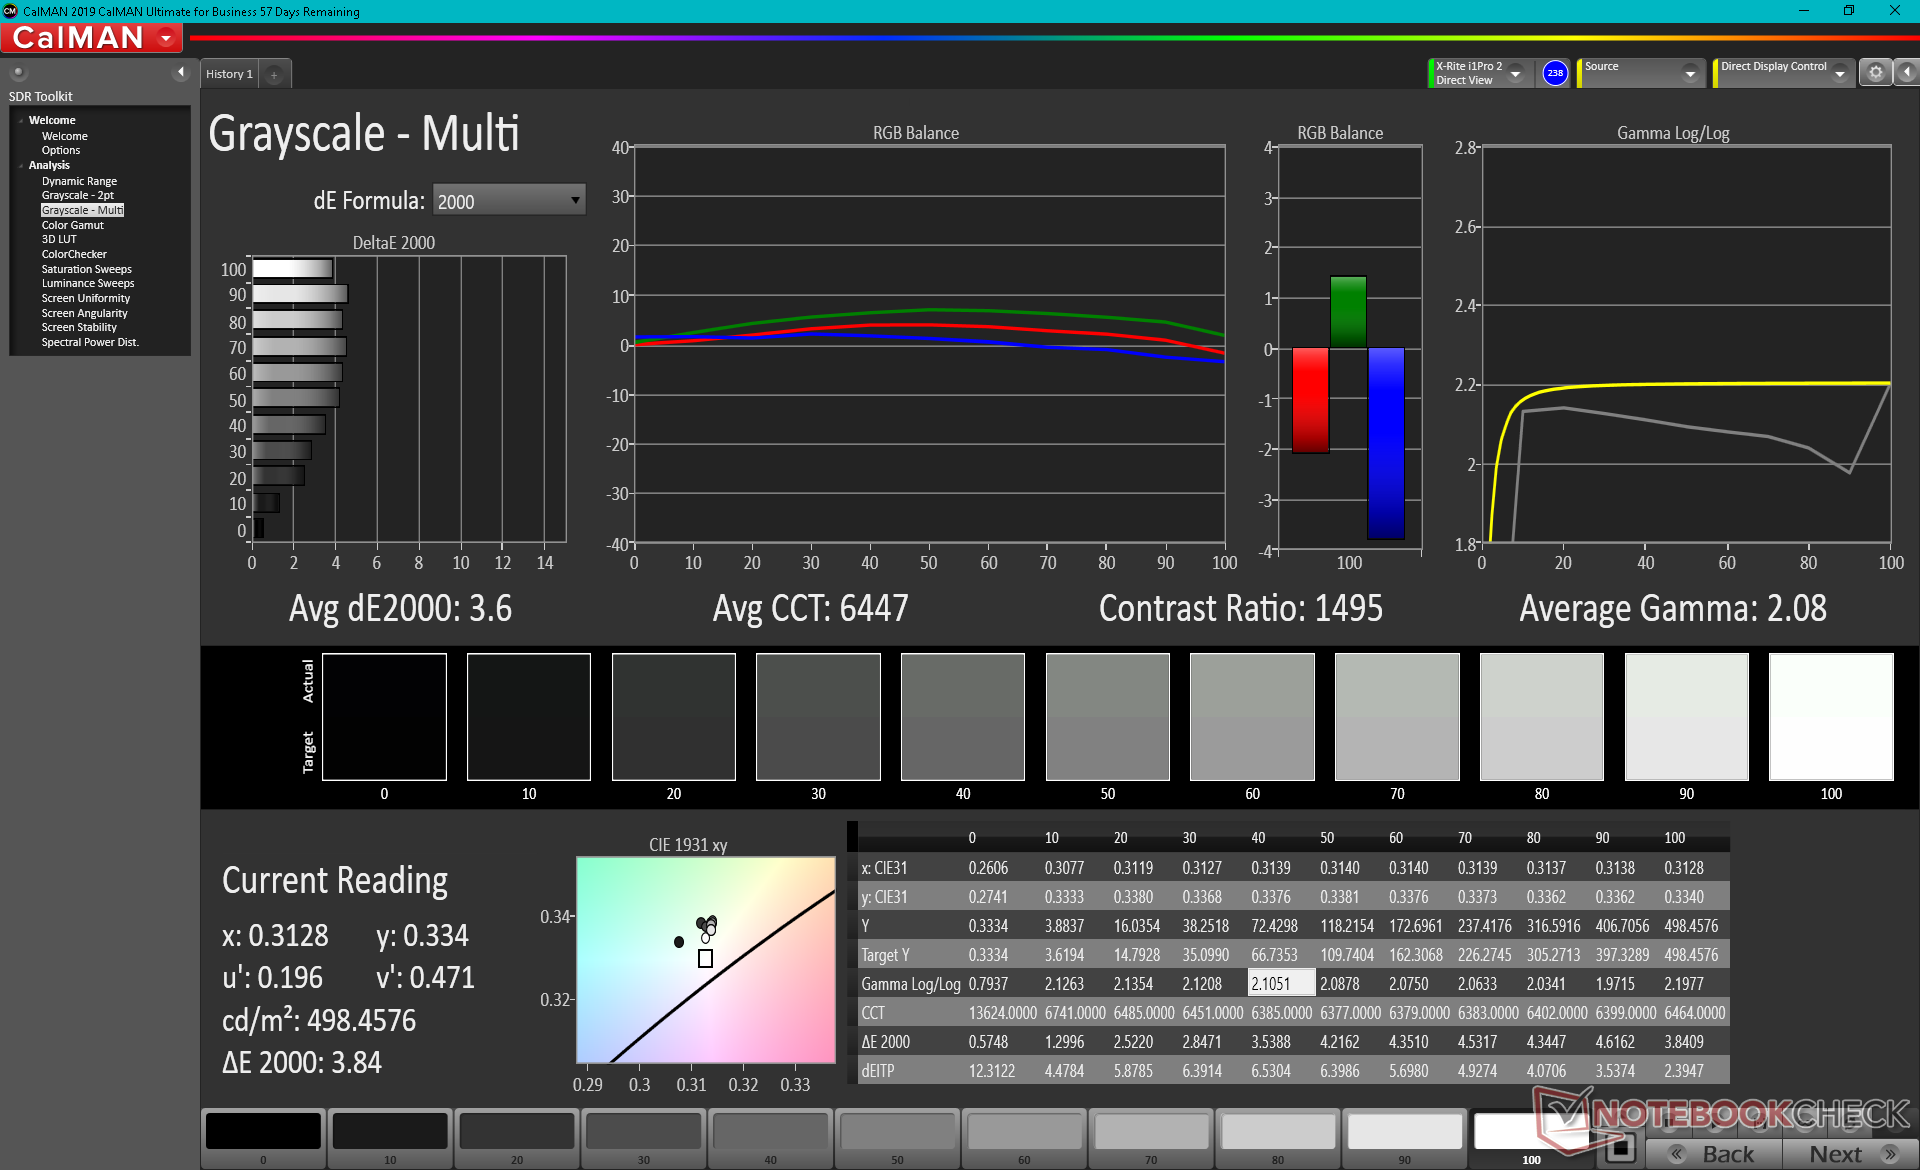
Contraste: 1140:1 (Valeurs des noirs: 0.44 cd/m²)
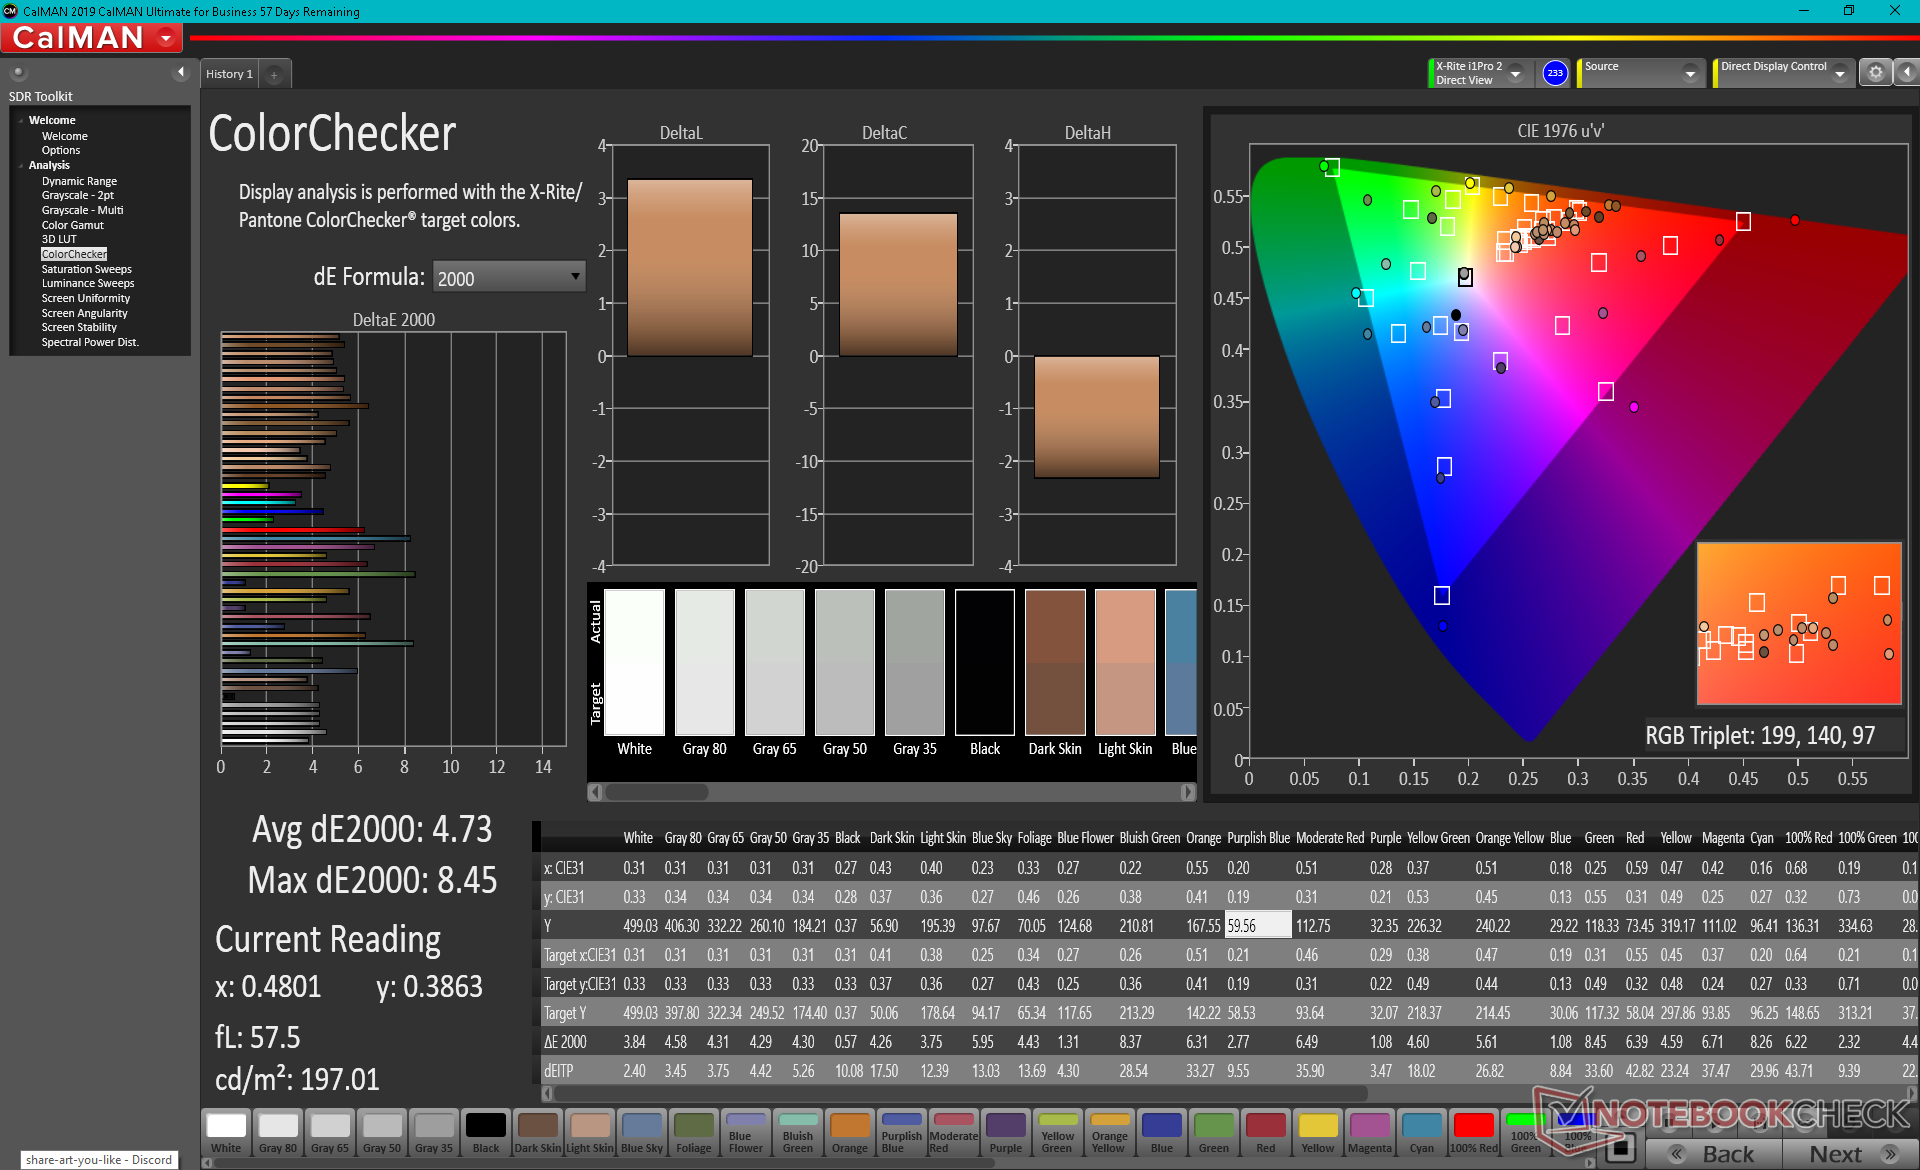
ΔE ColorChecker Calman: 4.73 | ∀{0.5-29.43 Ø4.73}
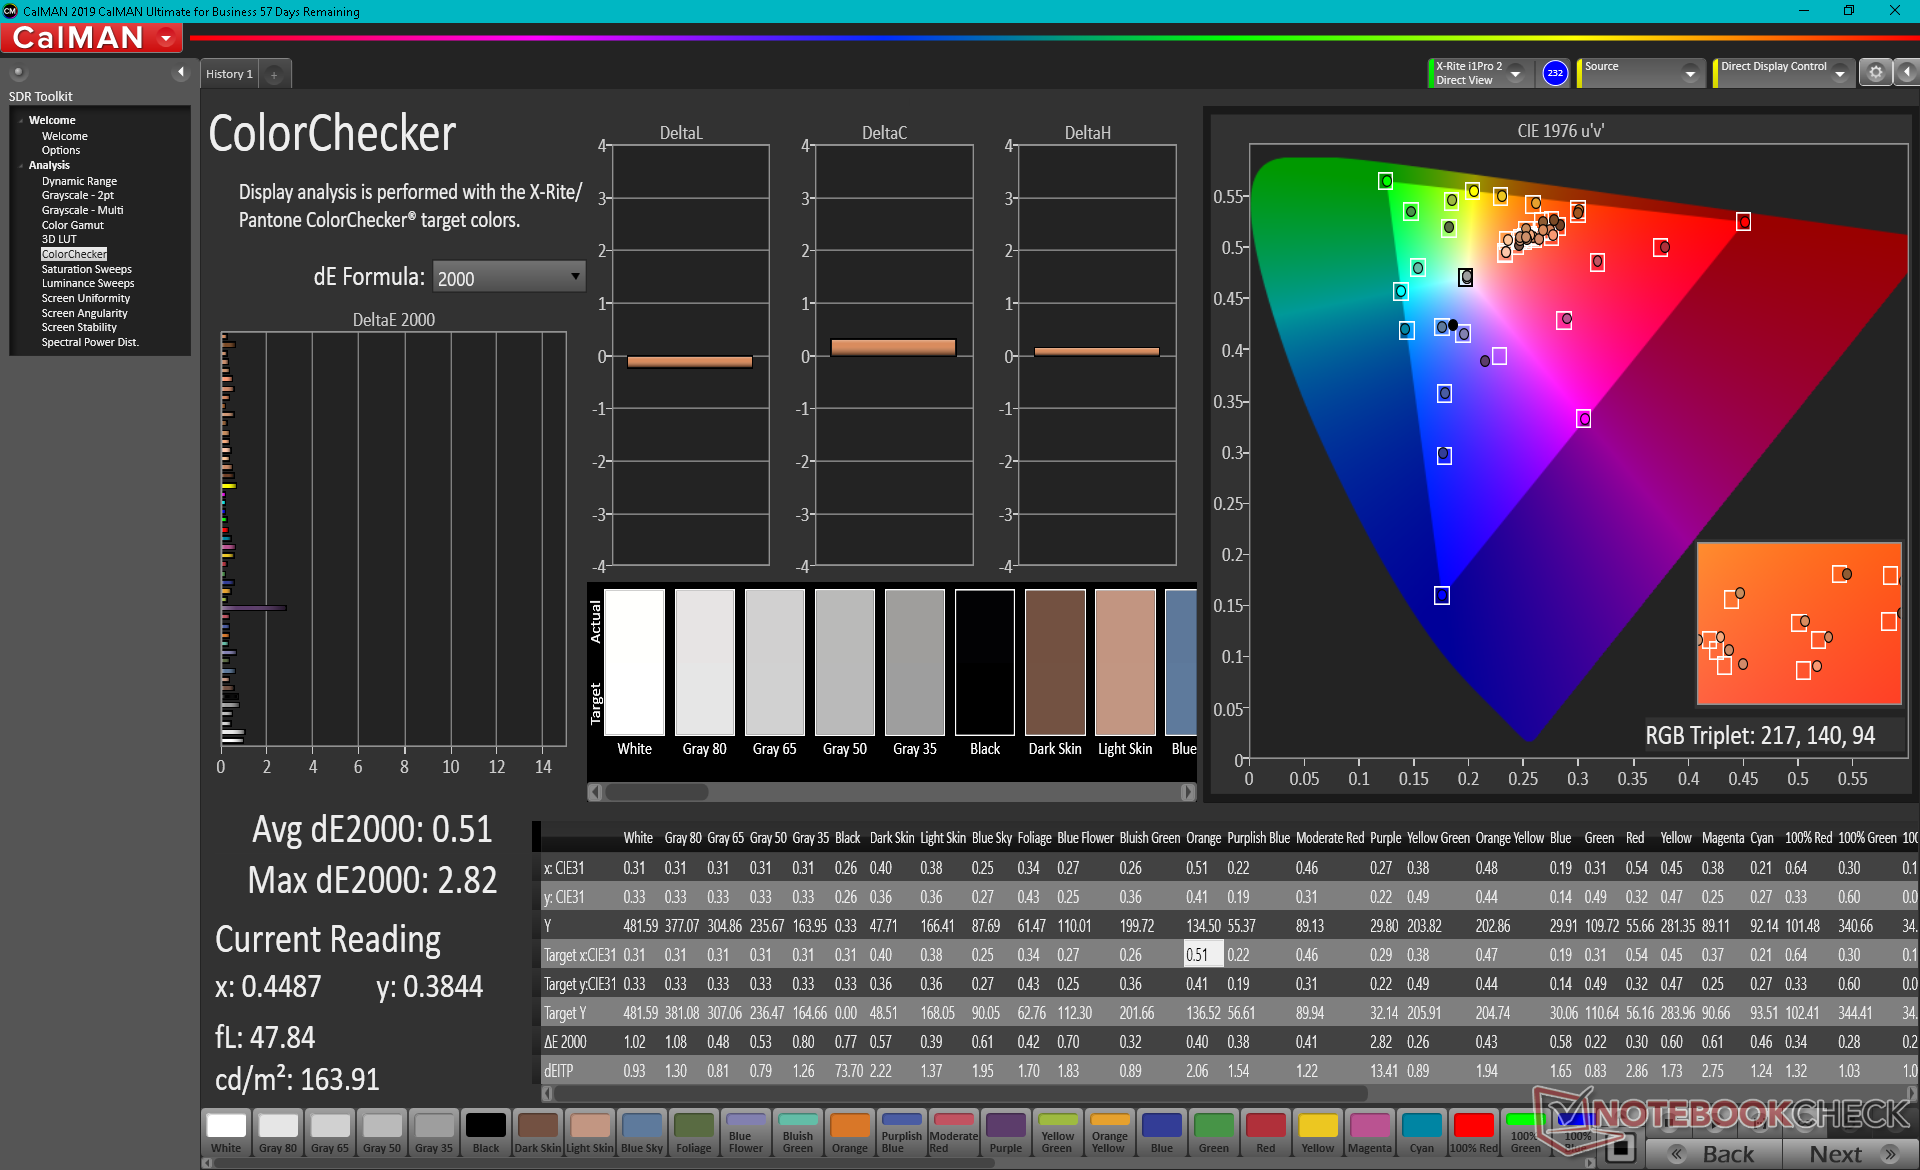
calibrated: 0.51
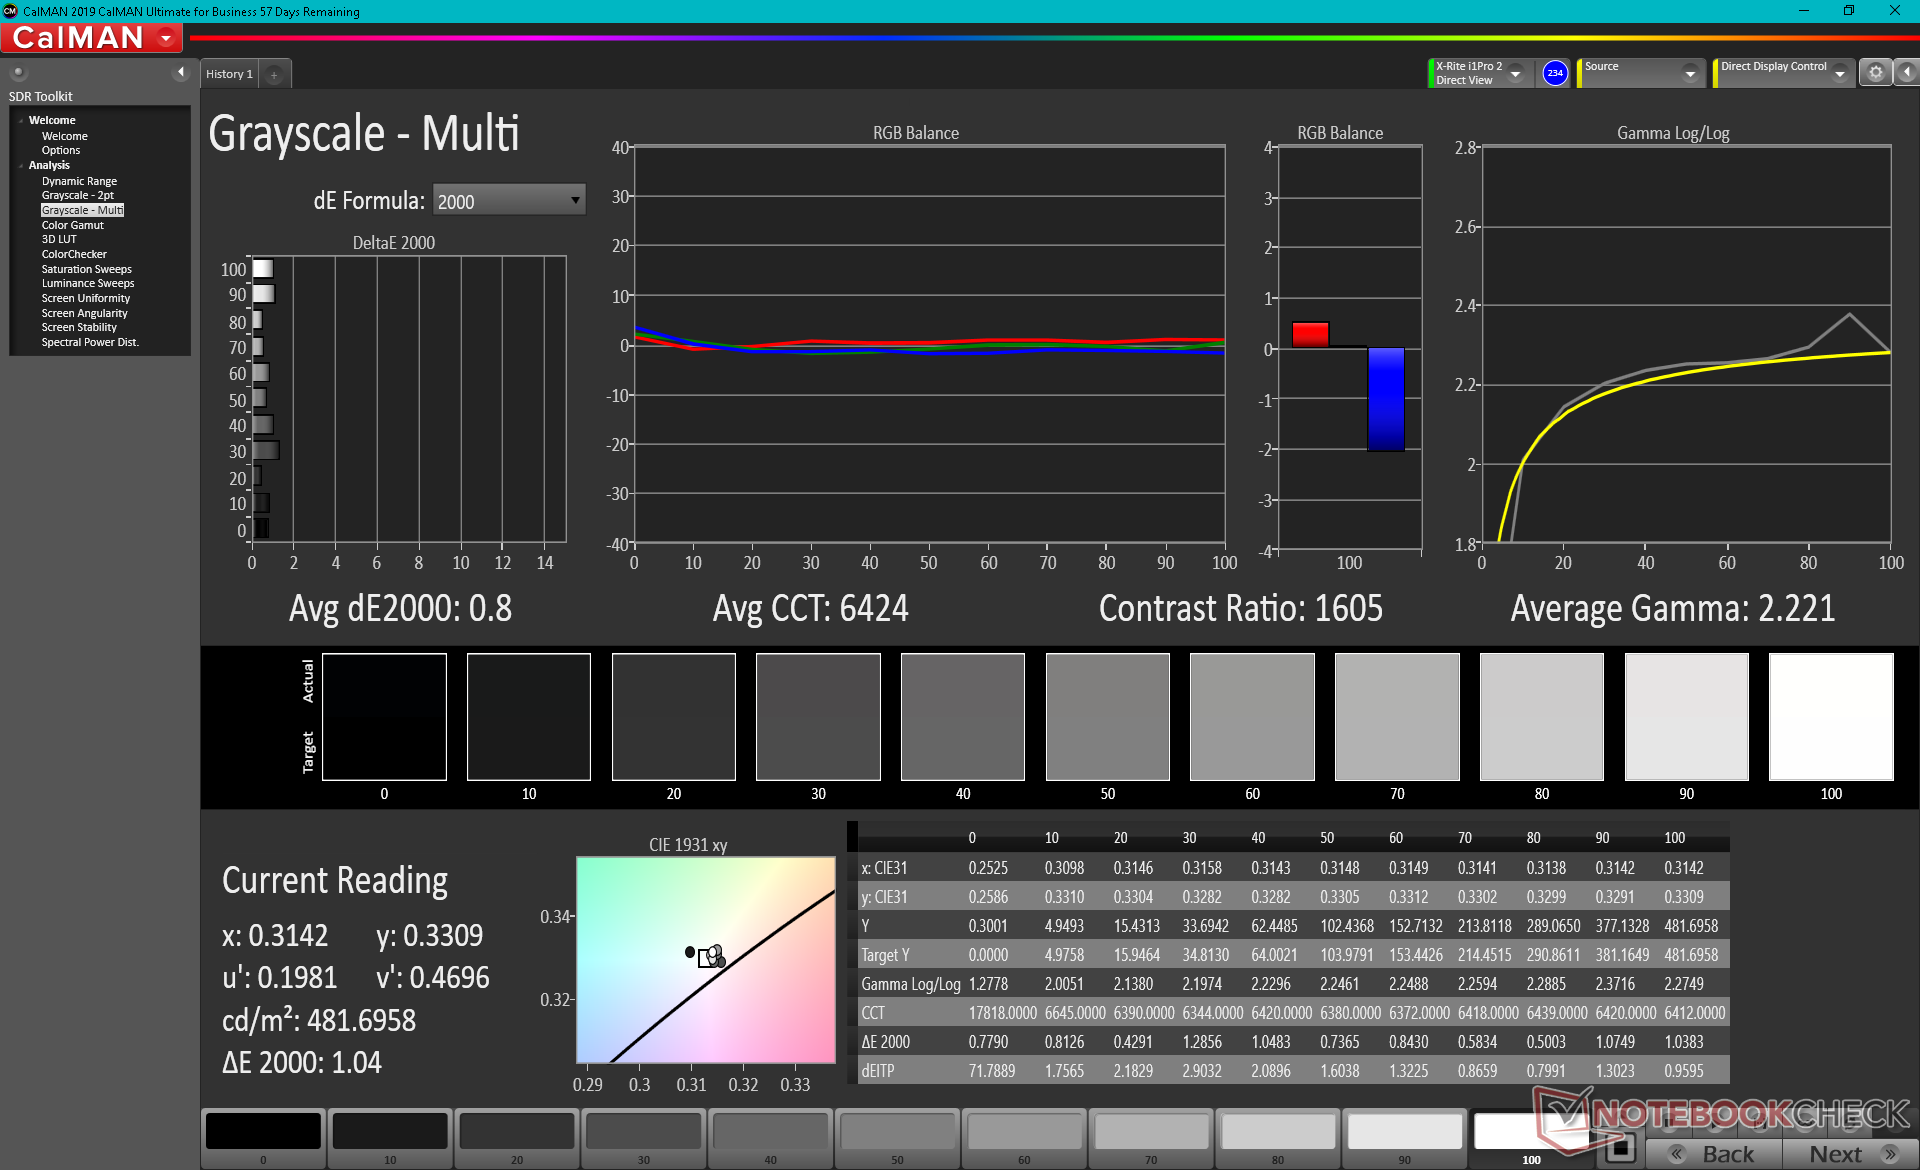
ΔE Greyscale Calman: 3.6 | ∀{0.09-98 Ø4.97}
100% AdobeRGB 1998 (Argyll 3D)
100% sRGB (Argyll 3D)
94.9% Display P3 (Argyll 3D)
Gamma: 2.08
CCT: 6447 K
| Dell Precision 5000 5560 Sharp LQ156R1, IPS, 15.6", 3840x2400 | Lenovo ThinkPad P15 G2-20YQ001JGE N156HCE_GN1, IPS, 15.6", 1920x1080 | HP ZBook Studio 15 G8 SDC4145, OLED, 15.6", 3840x2160 | Asus ProArt StudioBook Pro 15 W500G5T AU Optronics B156ZAN03.1, IPS, 15.6", 3840x2160 | Dell Precision 7550 AU Optronics B156ZAN, IPS, 15.6", 3840x2160 | Dell Precision 5550 P91F Sharp LQ156R1, IPS, 15.6", 3840x2400 | Razer Blade 15 Studio Edition 2020 Samsung SDCA029, OLED, 15.6", 3840x2160 | |
|---|---|---|---|---|---|---|---|
| Display | -19% | 0% | -7% | -5% | -2% | 1% | |
| Display P3 Coverage (%) | 94.9 | 68.6 -28% | 99.9 5% | 82.1 -13% | 82.1 -13% | 89.9 -5% | 99.9 5% |
| sRGB Coverage (%) | 100 | 99.8 0% | 100 0% | 97.6 -2% | 99.6 0% | 100 0% | 100 0% |
| AdobeRGB 1998 Coverage (%) | 100 | 70.6 -29% | 95.3 -5% | 95 -5% | 96.8 -3% | 99.9 0% | 97.3 -3% |
| Response Times | 34% | 94% | -19% | -10% | -5% | 90% | |
| Response Time Grey 50% / Grey 80% * (ms) | 47.2 ? | 37.6 ? 20% | 2.4 ? 95% | 58 ? -23% | 51.2 ? -8% | 46 ? 3% | 4 ? 92% |
| Response Time Black / White * (ms) | 30.4 ? | 16 ? 47% | 2.4 ? 92% | 35 ? -15% | 34 ? -12% | 34 ? -12% | 4 ? 87% |
| PWM Frequency (Hz) | 26040 ? | 240.4 ? | |||||
| Screen | 9% | -73% | 10% | -68% | -79% | 140% | |
| Brightness middle (cd/m²) | 501.5 | 498 -1% | 379.6 -24% | 344 -31% | 473.5 -6% | 469.8 -6% | 380 -24% |
| Brightness (cd/m²) | 467 | 490 5% | 380 -19% | 335 -28% | 461 -1% | 464 -1% | 388 -17% |
| Brightness Distribution (%) | 83 | 95 14% | 95 14% | 93 12% | 90 8% | 85 2% | 93 12% |
| Black Level * (cd/m²) | 0.44 | 0.39 11% | 0.37 16% | 0.55 -25% | 0.42 5% | 0.018 96% | |
| Contrast (:1) | 1140 | 1277 12% | 930 -18% | 861 -24% | 1119 -2% | 21111 1752% | |
| Colorchecker dE 2000 * | 4.73 | 2.1 56% | 5.15 -9% | 1.76 63% | 4.8 -1% | 5.16 -9% | 5.47 -16% |
| Colorchecker dE 2000 max. * | 8.45 | 5.6 34% | 7.79 8% | 4.31 49% | 8.73 -3% | 9.33 -10% | 8.19 3% |
| Colorchecker dE 2000 calibrated * | 0.51 | 0.8 -57% | 3.1 -508% | 3.08 -504% | 3.75 -635% | 3.04 -496% | |
| Greyscale dE 2000 * | 3.6 | 3.4 6% | 2.6 28% | 3.12 13% | 5.6 -56% | 5.5 -53% | 5.3 -47% |
| Gamma | 2.08 106% | 2.32 95% | 1.99 111% | 2.2 100% | 2.34 94% | 2 110% | 2.15 102% |
| CCT | 6447 101% | 7162 91% | 6166 105% | 6563 99% | 7549 86% | 6198 105% | 6128 106% |
| Color Space (Percent of AdobeRGB 1998) (%) | 85 | 86.4 | 89.2 | 86 | |||
| Color Space (Percent of sRGB) (%) | 98 | 99.7 | 100 | 100 | |||
| Moyenne finale (programmes/paramètres) | 8% /
6% | 7% /
-27% | -5% /
1% | -28% /
-46% | -29% /
-52% | 77% /
103% |
* ... Moindre est la valeur, meilleures sont les performances
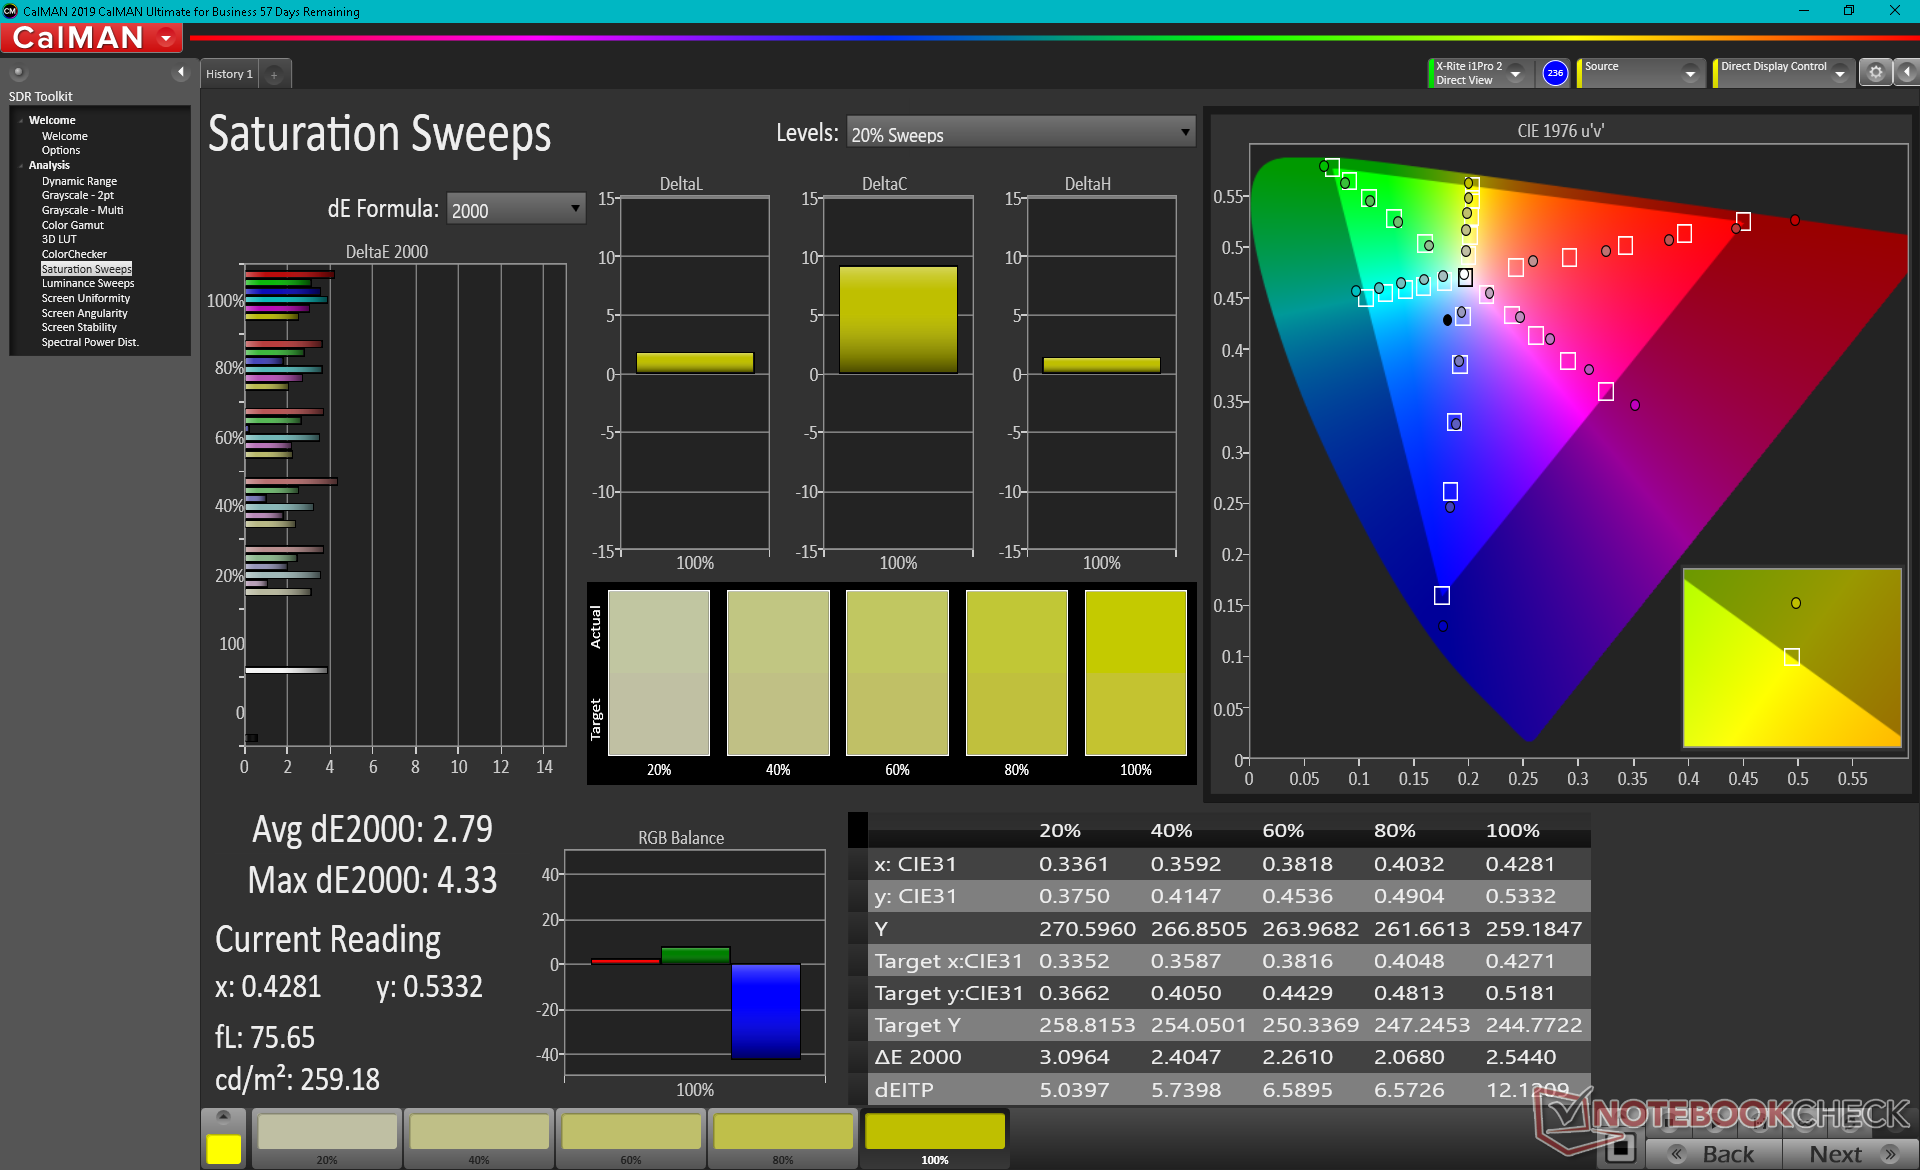
Les couleurs auraient pu être mieux calibrées dès la sortie de l'emballage, car les valeurs moyennes du deltaE des niveaux de gris et des couleurs ne sont que décentes, avec respectivement 3,6 et 4,73. Nous sommes en mesure de réduire ces deux valeurs à moins d'un après les avoir calibrées avec notre colorimètre X-Rite.
Temps de réponse de l'écran
| ↔ Temps de réponse noir à blanc | ||
|---|---|---|
| 30.4 ms ... hausse ↗ et chute ↘ combinées | ↗ 16.4 ms hausse | 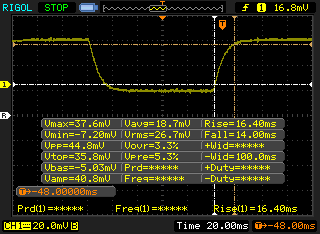 |
| ↘ 14 ms chute | ||
| L'écran souffre de latences très élevées, à éviter pour le jeu. En comparaison, tous les appareils testés affichent entre 0.1 (minimum) et 240 (maximum) ms. » 82 % des appareils testés affichent de meilleures performances. Cela signifie que les latences relevées sont moins bonnes que la moyenne (19.9 ms) de tous les appareils testés. | ||
| ↔ Temps de réponse gris 50% à gris 80% | ||
| 47.2 ms ... hausse ↗ et chute ↘ combinées | ↗ 25.2 ms hausse | 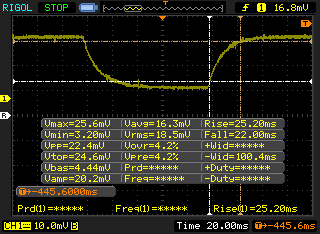 |
| ↘ 22 ms chute | ||
| L'écran souffre de latences très élevées, à éviter pour le jeu. En comparaison, tous les appareils testés affichent entre 0.165 (minimum) et 636 (maximum) ms. » 81 % des appareils testés affichent de meilleures performances. Cela signifie que les latences relevées sont moins bonnes que la moyenne (31.1 ms) de tous les appareils testés. | ||
Scintillement / MLI (Modulation de largeur d'impulsion)
| Scintillement / MLI (Modulation de largeur d'impulsion) non décelé | 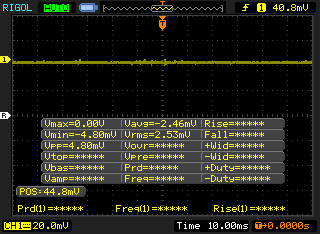 | ||
En comparaison, 52 % des appareils testés n'emploient pas MDI pour assombrir leur écran. Nous avons relevé une moyenne à 7794 (minimum : 5 - maximum : 343500) Hz dans le cas où une MDI était active. | |||
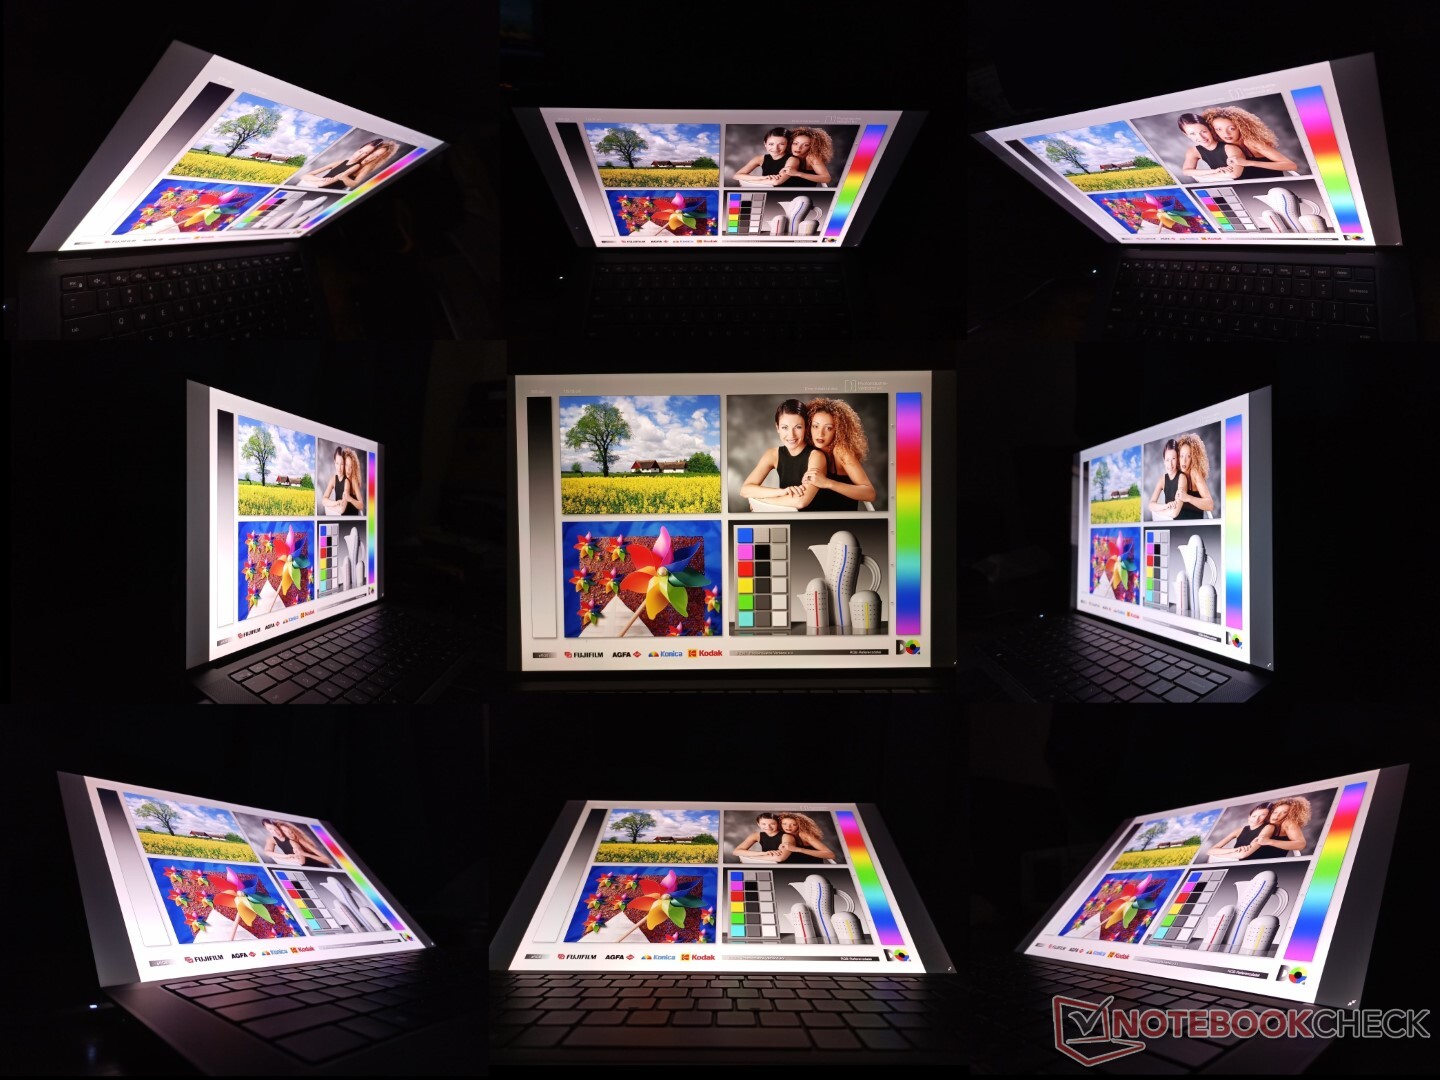
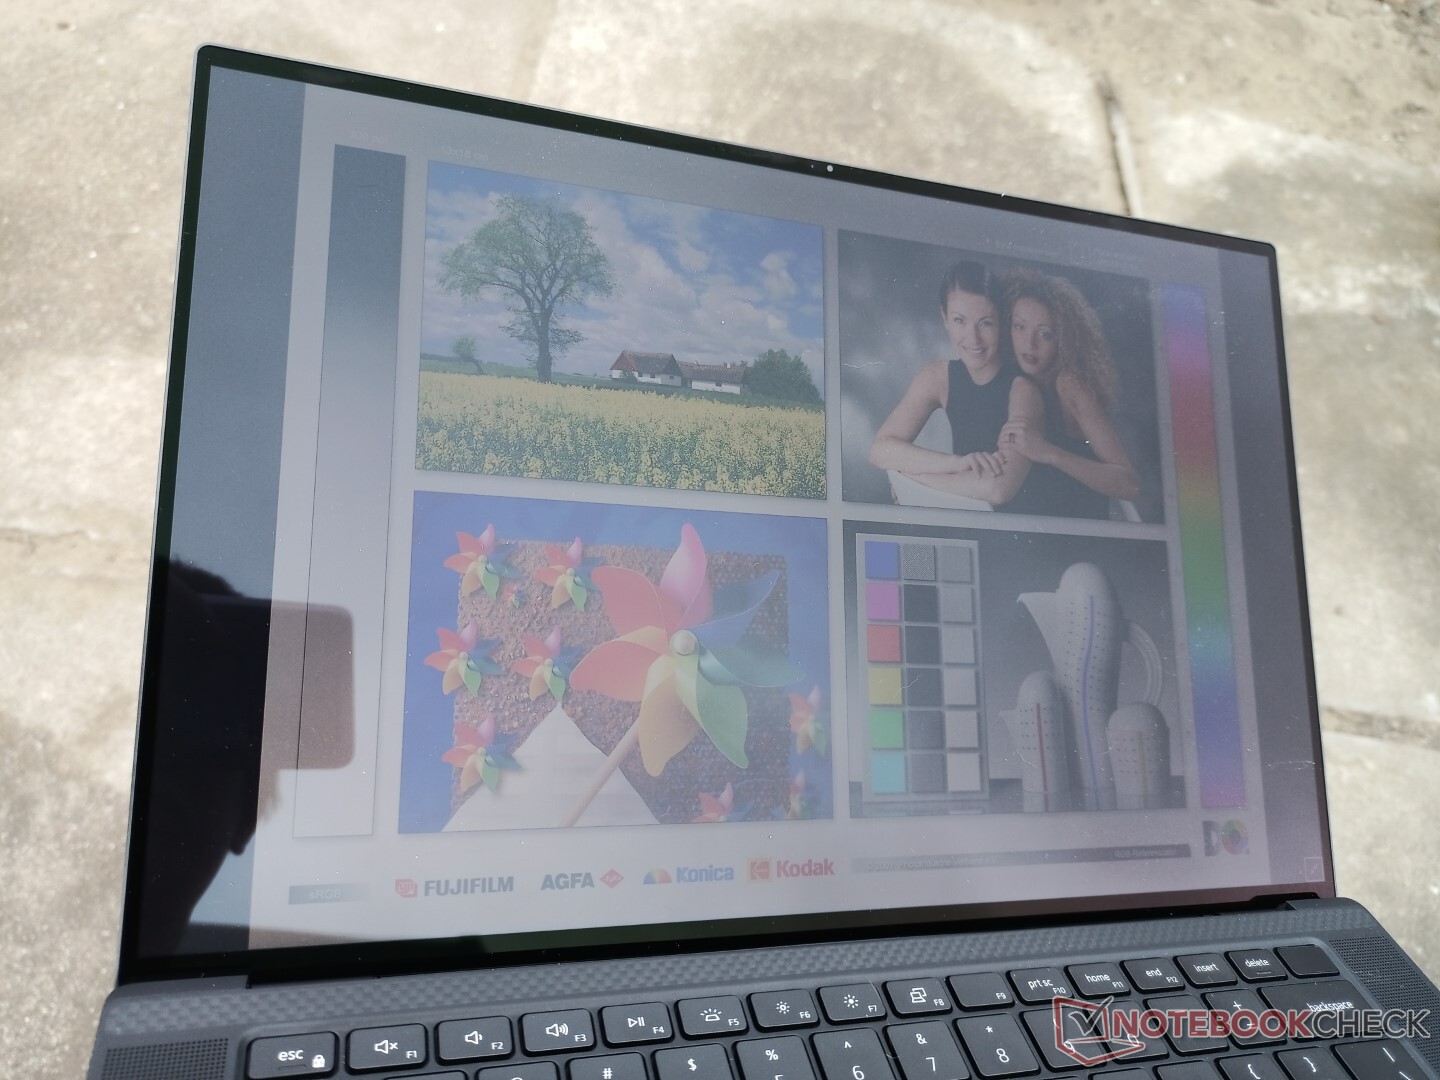
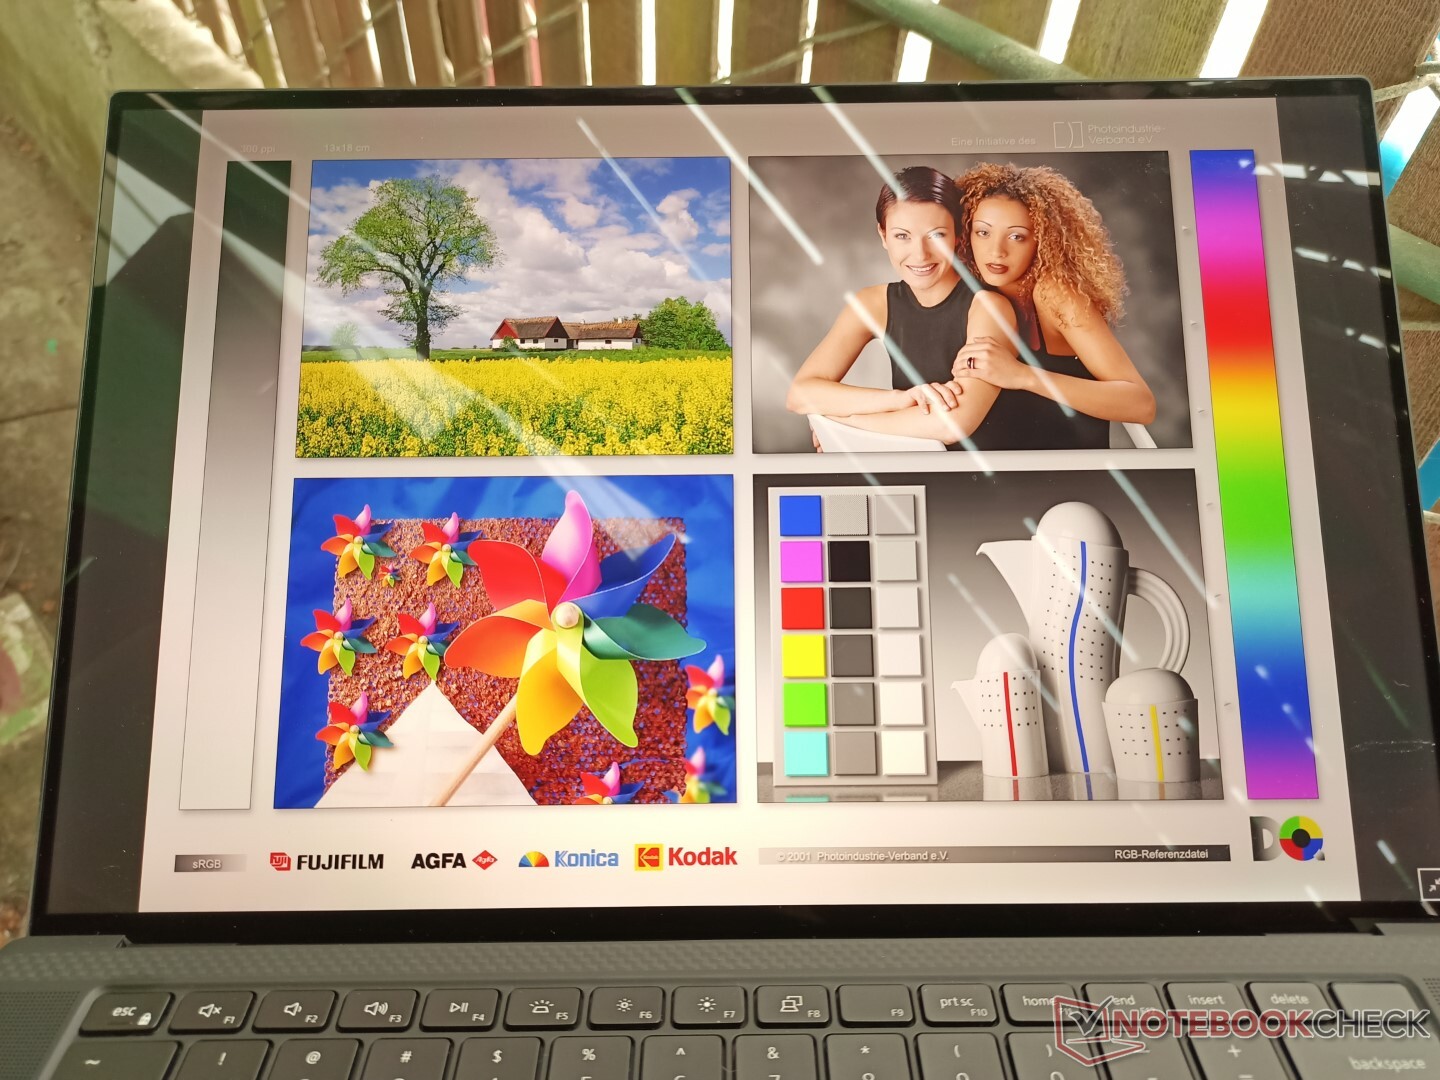
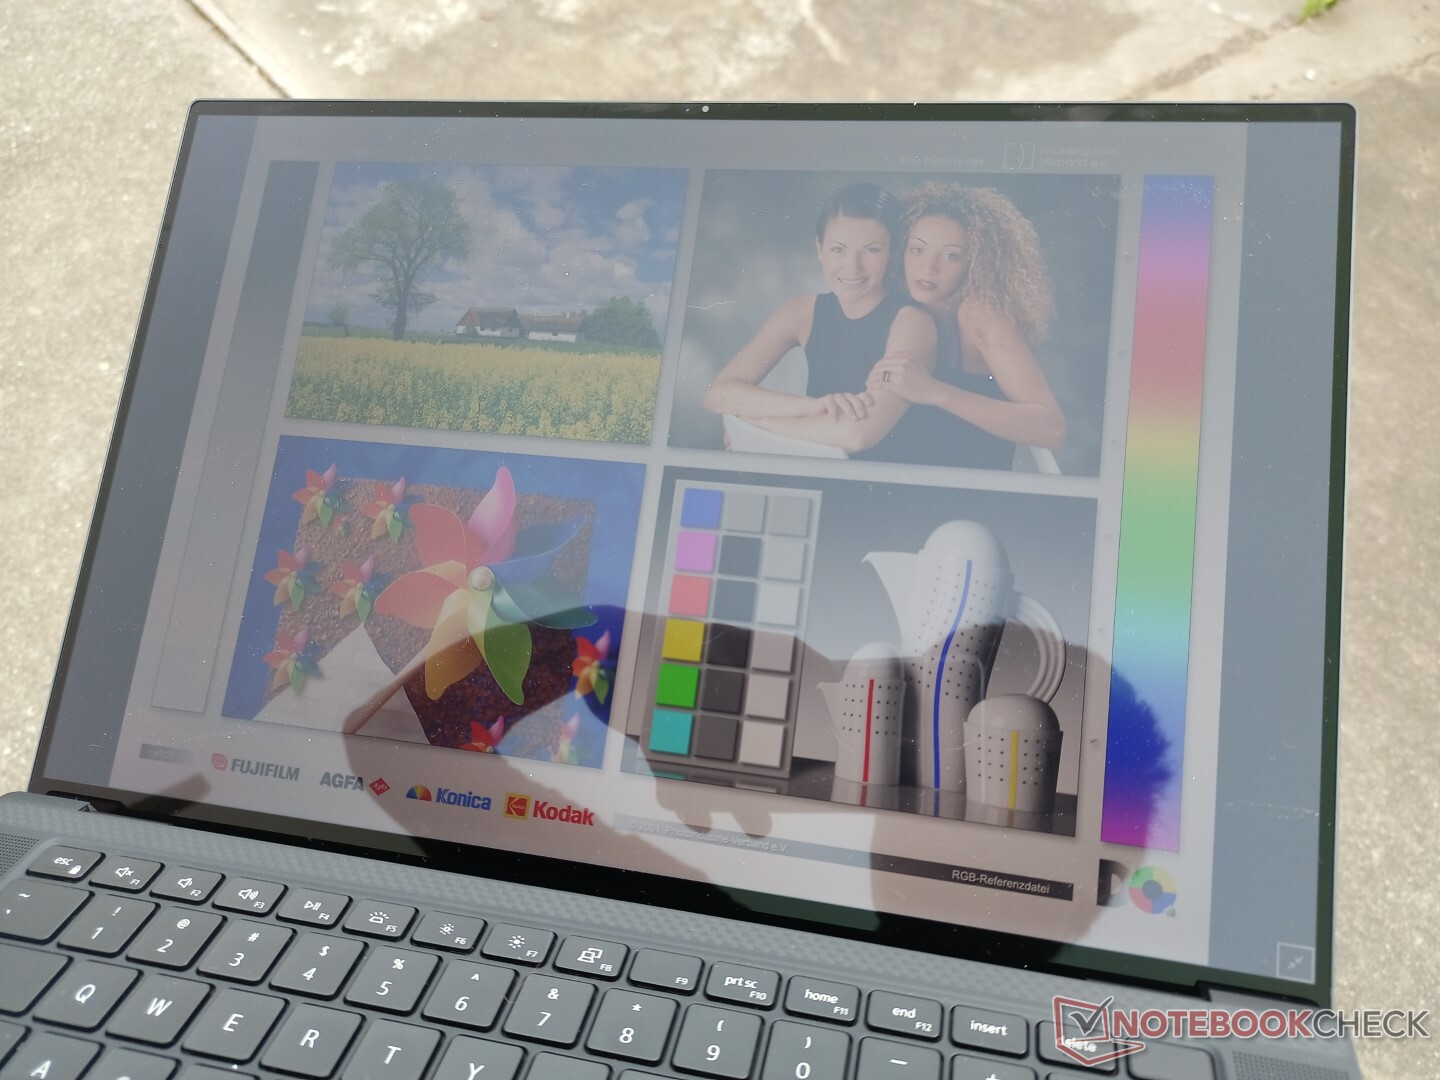
La visibilité extérieure est meilleure que sur le Razer Blade 15 Studio ou Asus ProArt, grâce au rétroéclairage plus lumineux de notre Precision 5560. Cependant, il y aura toujours des reflets sur la couche brillante. Les utilisateurs voudront peut-être envisager l'option d'affichage mat 1200p à la place pour réduire les reflets.
Performance - 45 W TGP Quadro RTX Graphics
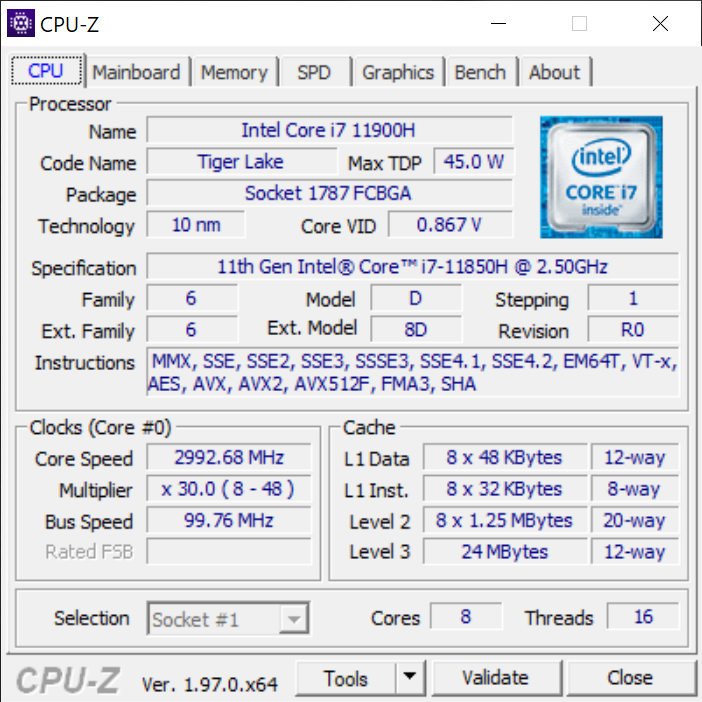
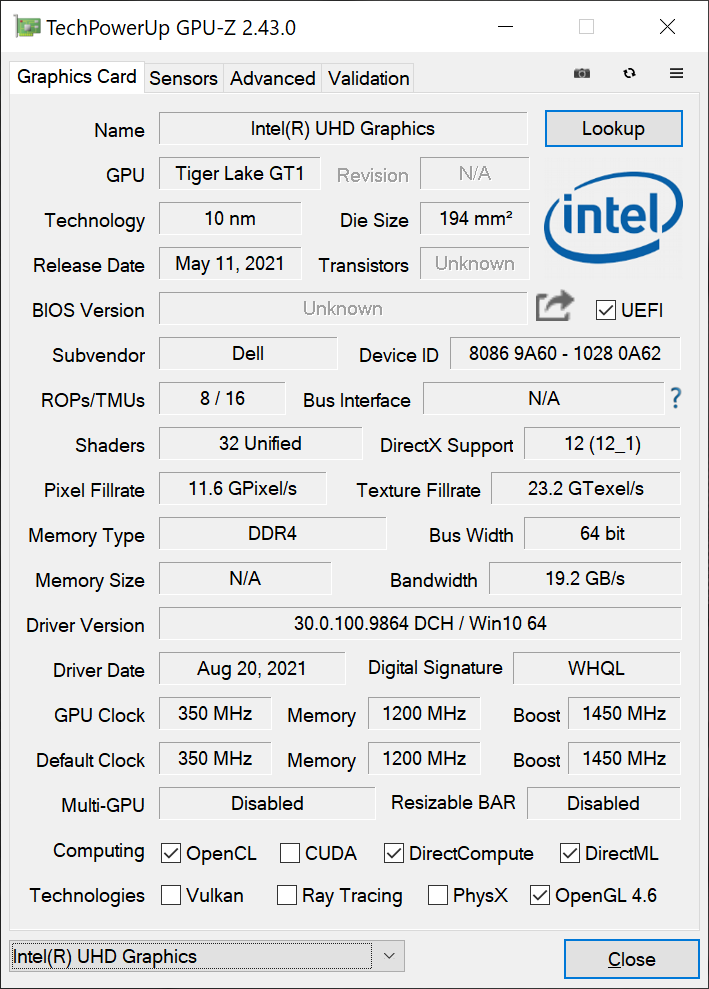
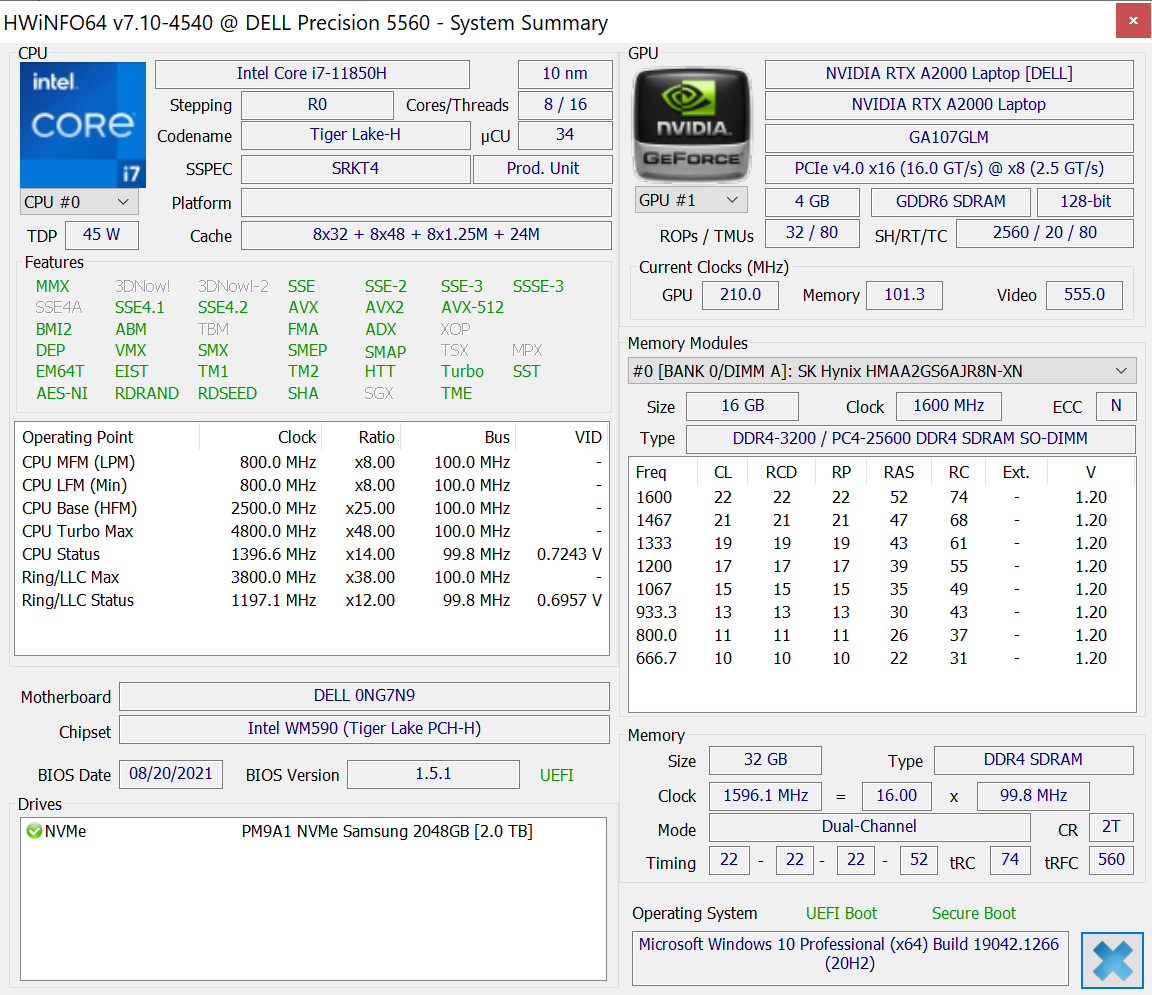
Dell propose les deux modèles non-vPro (i5-11500H, i7-11800H) et vPro (i7-11850H, i9-11950H, Xeon W-11955M) Tiger Lake-H aux côtés des GPU Nvidia Quadro (NVIDIA T1200, RTX A2000) pour presque toutes les configurations. Ces GPU, les CPU vPro et la RAM ECC optionnelle associée sont ce qui distingue le Precision 5560 de la série XPS 15 grand public
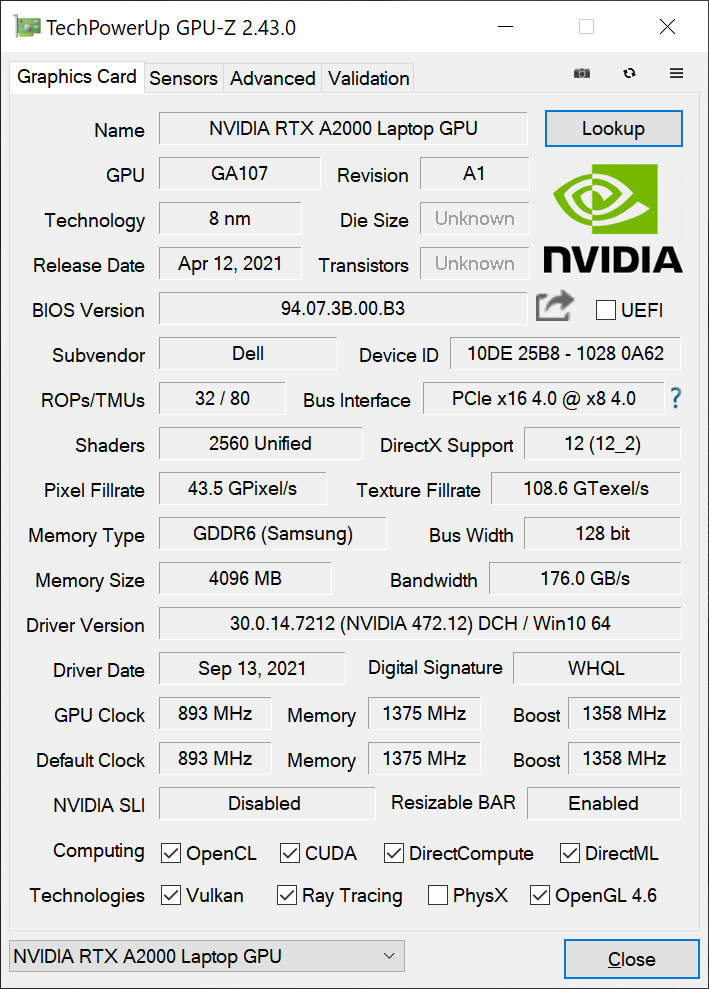
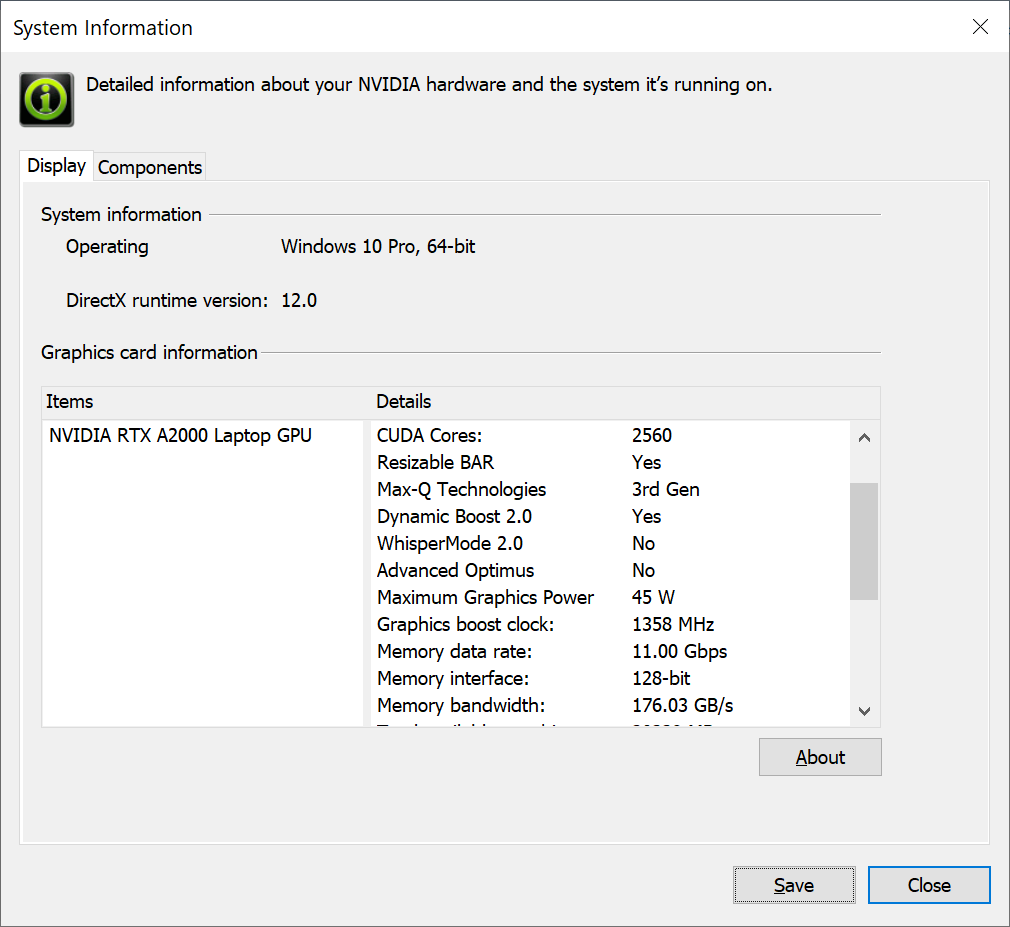
Le GPU Quadro RTX A2000 de notre unité de test prend en charge Resizable Bar et Dynamic Boost 2.0 mais pas Advanced Optimus ni WhisperMode 2.0. Avec seulement 45 W TGP, il s'agit techniquement d'un GPU Max-Q, même si Max-Q n'est pas dans le nom. L'ancienne Quadro T2000 Max-Q dans le Precision 5550 était estimée à 40 W TGP en comparaison
Notre unité a été réglée en mode Ultra Performance via le logiciel Dell Power Manager avant d'exécuter nos benchmarks ci-dessous pour obtenir les meilleurs résultats possibles.
Processeur
Les performances multithread globales sont environ 15 % plus faibles que celles du Core i7-11800H, ce qui est le prix à payer pour la prise en charge intégrée de vPro. La mise à niveau vers le Core i9-11950H devrait améliorer les performances multithread jusqu'à 20 pour cent, d'après notre expérience avec le HP ZBook Studio 15 G8. Les performances en mode monofil restent toutefois presque identiques
La durabilité des performances est excellente, comme le montrent les résultats constants de CineBench R15 xT ci-dessous.
Cinebench R15 Multi Loop
Cinebench R23: Multi Core | Single Core
Cinebench R15: CPU Multi 64Bit | CPU Single 64Bit
Blender: v2.79 BMW27 CPU
7-Zip 18.03: 7z b 4 -mmt1 | 7z b 4
Geekbench 5.5: Single-Core | Multi-Core
HWBOT x265 Benchmark v2.2: 4k Preset
LibreOffice : 20 Documents To PDF
R Benchmark 2.5: Overall mean
| Cinebench R23 / Multi Core | |
| Lenovo Legion 5 15ACH-82JU00C6GE-FL | |
| HP ZBook Studio 15 G8 | |
| Lenovo ThinkPad P15 G2-20YQ001JGE | |
| Moyenne Intel Core i7-11850H (9779 - 11935, n=2) | |
| HP ZBook Studio G7 | |
| Dell Precision 5000 5560 | |
| Lenovo ThinkPad P15 Gen1-20ST000DGE | |
| Lenovo ThinkPad P15s Gen2-20W6000GGE | |
| Cinebench R23 / Single Core | |
| HP ZBook Studio 15 G8 | |
| Moyenne Intel Core i7-11850H (1513 - 1552, n=2) | |
| Dell Precision 5000 5560 | |
| Lenovo ThinkPad P15 G2-20YQ001JGE | |
| Lenovo ThinkPad P15s Gen2-20W6000GGE | |
| Lenovo Legion 5 15ACH-82JU00C6GE-FL | |
| HP ZBook Studio G7 | |
| Lenovo ThinkPad P15 Gen1-20ST000DGE | |
Cinebench R23: Multi Core | Single Core
Cinebench R15: CPU Multi 64Bit | CPU Single 64Bit
Blender: v2.79 BMW27 CPU
7-Zip 18.03: 7z b 4 -mmt1 | 7z b 4
Geekbench 5.5: Single-Core | Multi-Core
HWBOT x265 Benchmark v2.2: 4k Preset
LibreOffice : 20 Documents To PDF
R Benchmark 2.5: Overall mean
* ... Moindre est la valeur, meilleures sont les performances
Performance du système
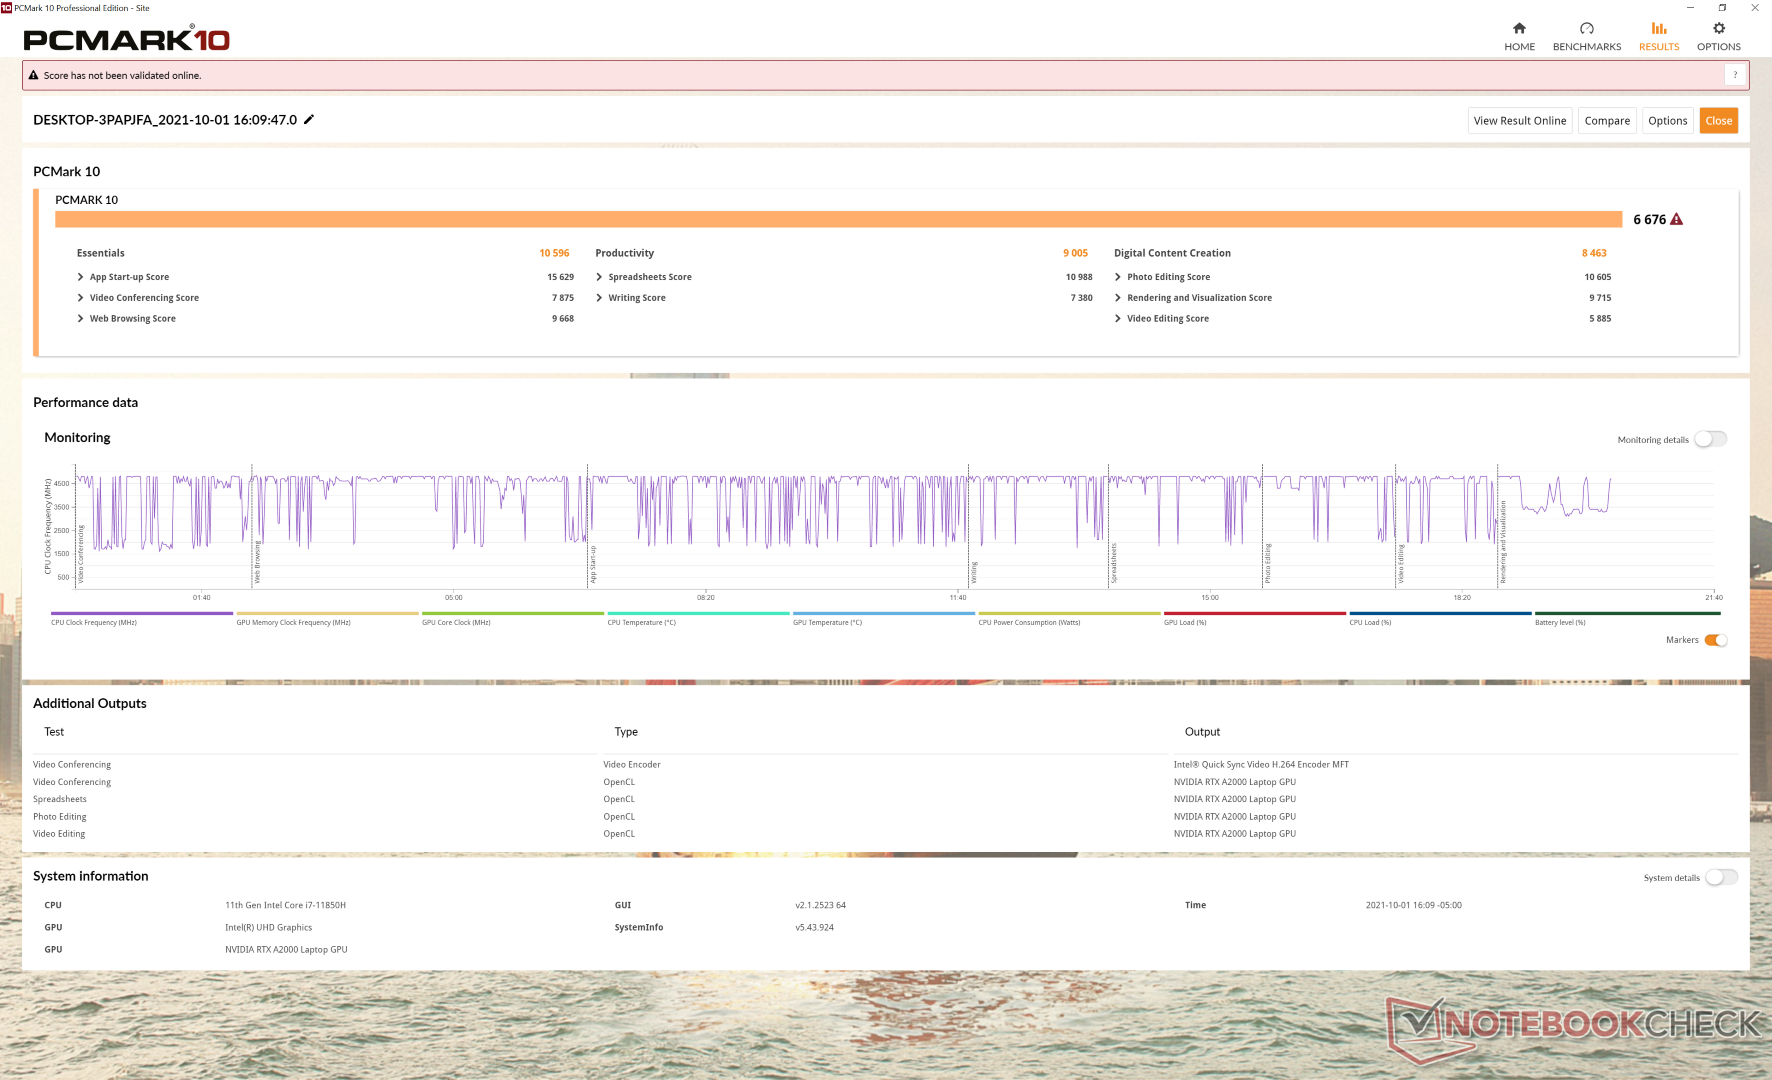
Les scores PCMark sont systématiquement plus élevés que ceux de la Precision 5550, en particulier dans le benchmark de création de contenu numérique à forte densité de GPU où la RTX A2000 peut s'imposer face à la Quadro T2000 Max-Q.
| PCMark 10 / Score | |
| HP ZBook Studio 15 G8 | |
| Dell Precision 5000 5560 | |
| Moyenne Intel Core i7-11850H, NVIDIA RTX A2000 Laptop GPU (n=1) | |
| Lenovo ThinkPad P15 G2-20YQ001JGE | |
| Dell Precision 7550 | |
| Dell Precision 5550 P91F | |
| Razer Blade 15 Studio Edition 2020 | |
| Asus ProArt StudioBook Pro 15 W500G5T | |
| PCMark 10 / Essentials | |
| Dell Precision 5000 5560 | |
| Moyenne Intel Core i7-11850H, NVIDIA RTX A2000 Laptop GPU (n=1) | |
| Lenovo ThinkPad P15 G2-20YQ001JGE | |
| HP ZBook Studio 15 G8 | |
| Dell Precision 5550 P91F | |
| Dell Precision 7550 | |
| Razer Blade 15 Studio Edition 2020 | |
| Asus ProArt StudioBook Pro 15 W500G5T | |
| PCMark 10 / Productivity | |
| Dell Precision 5000 5560 | |
| Moyenne Intel Core i7-11850H, NVIDIA RTX A2000 Laptop GPU (n=1) | |
| HP ZBook Studio 15 G8 | |
| Lenovo ThinkPad P15 G2-20YQ001JGE | |
| Razer Blade 15 Studio Edition 2020 | |
| Dell Precision 7550 | |
| Dell Precision 5550 P91F | |
| Asus ProArt StudioBook Pro 15 W500G5T | |
| PCMark 10 / Digital Content Creation | |
| HP ZBook Studio 15 G8 | |
| Lenovo ThinkPad P15 G2-20YQ001JGE | |
| Dell Precision 5000 5560 | |
| Moyenne Intel Core i7-11850H, NVIDIA RTX A2000 Laptop GPU (n=1) | |
| Dell Precision 7550 | |
| Dell Precision 5550 P91F | |
| Asus ProArt StudioBook Pro 15 W500G5T | |
| Razer Blade 15 Studio Edition 2020 | |
| PCMark 10 Score | 6676 points | |
Aide | ||
Latence DPC
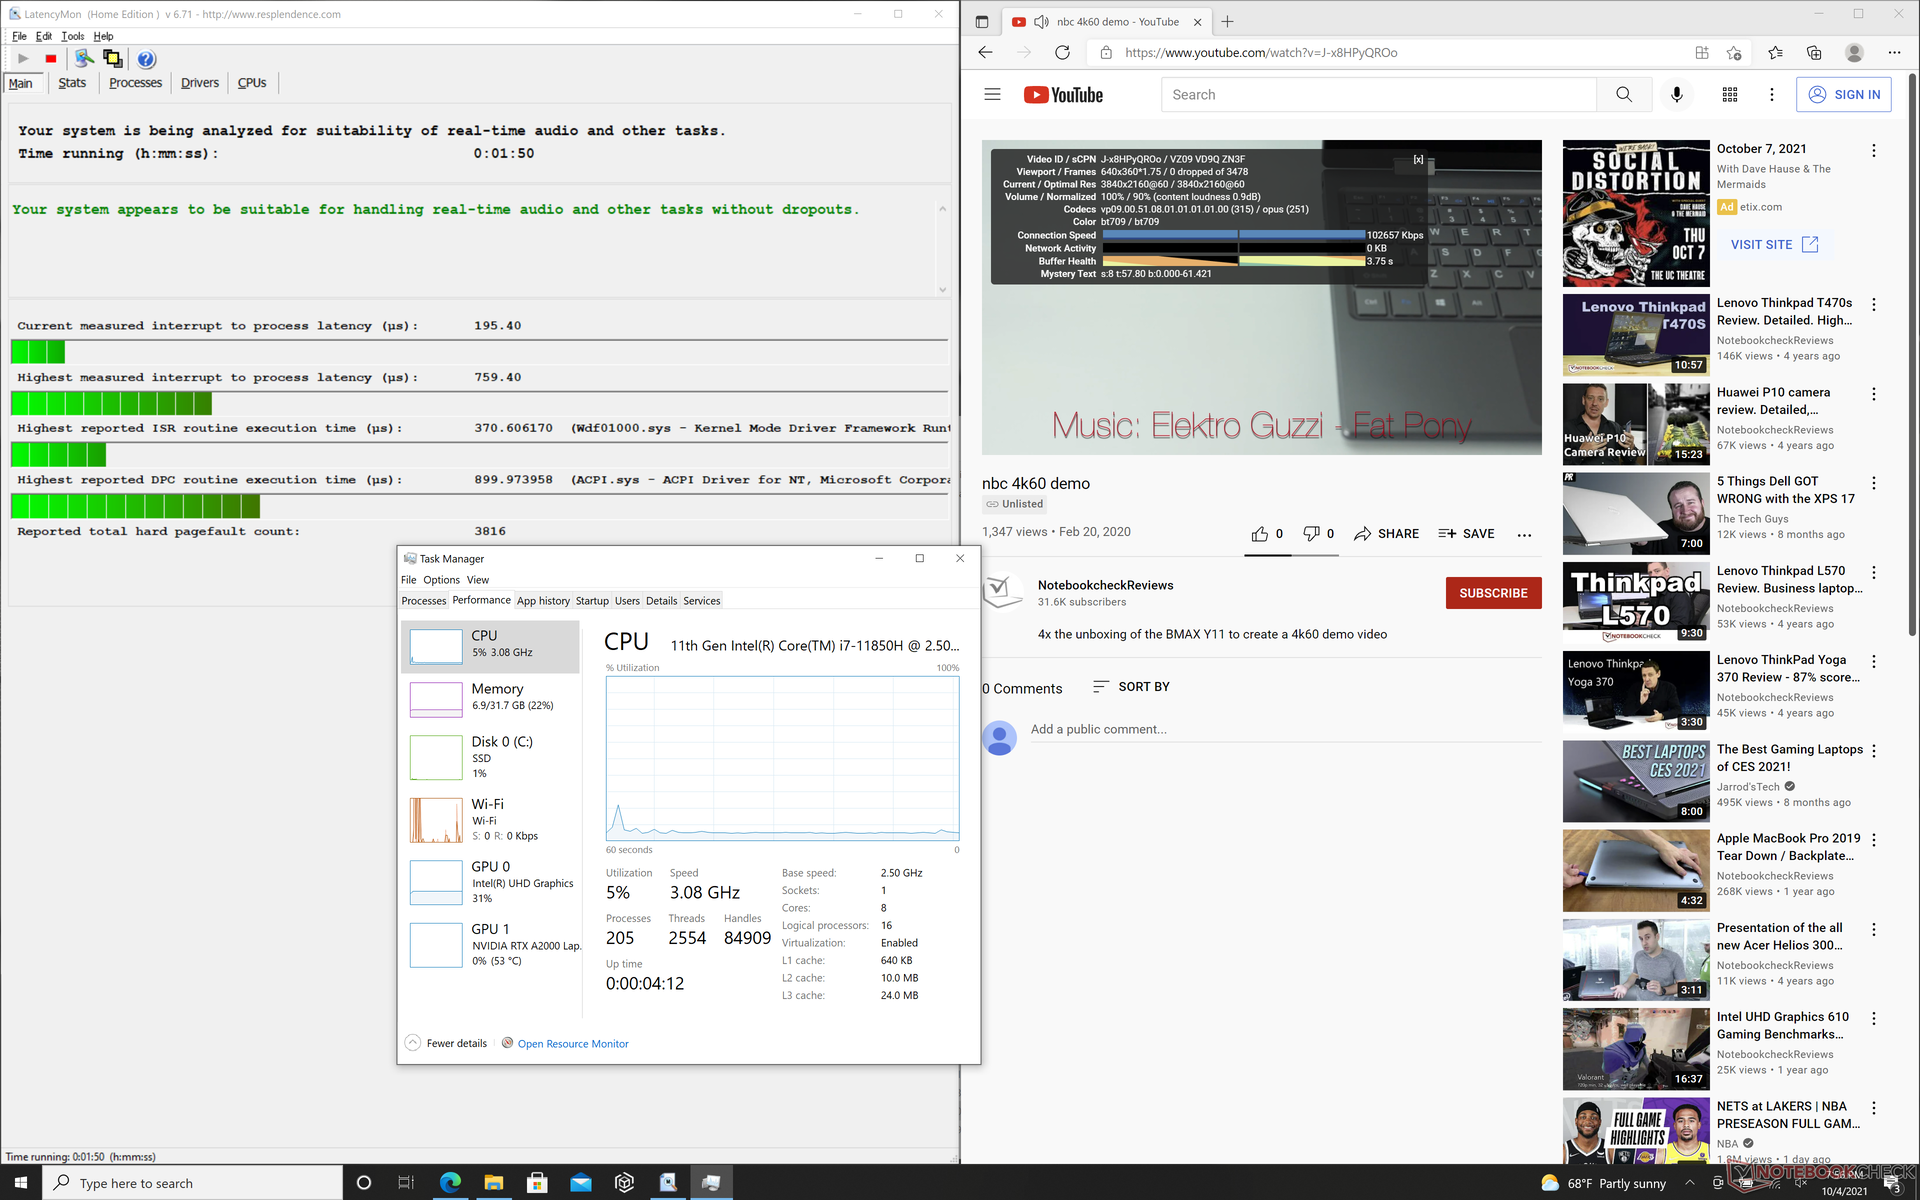
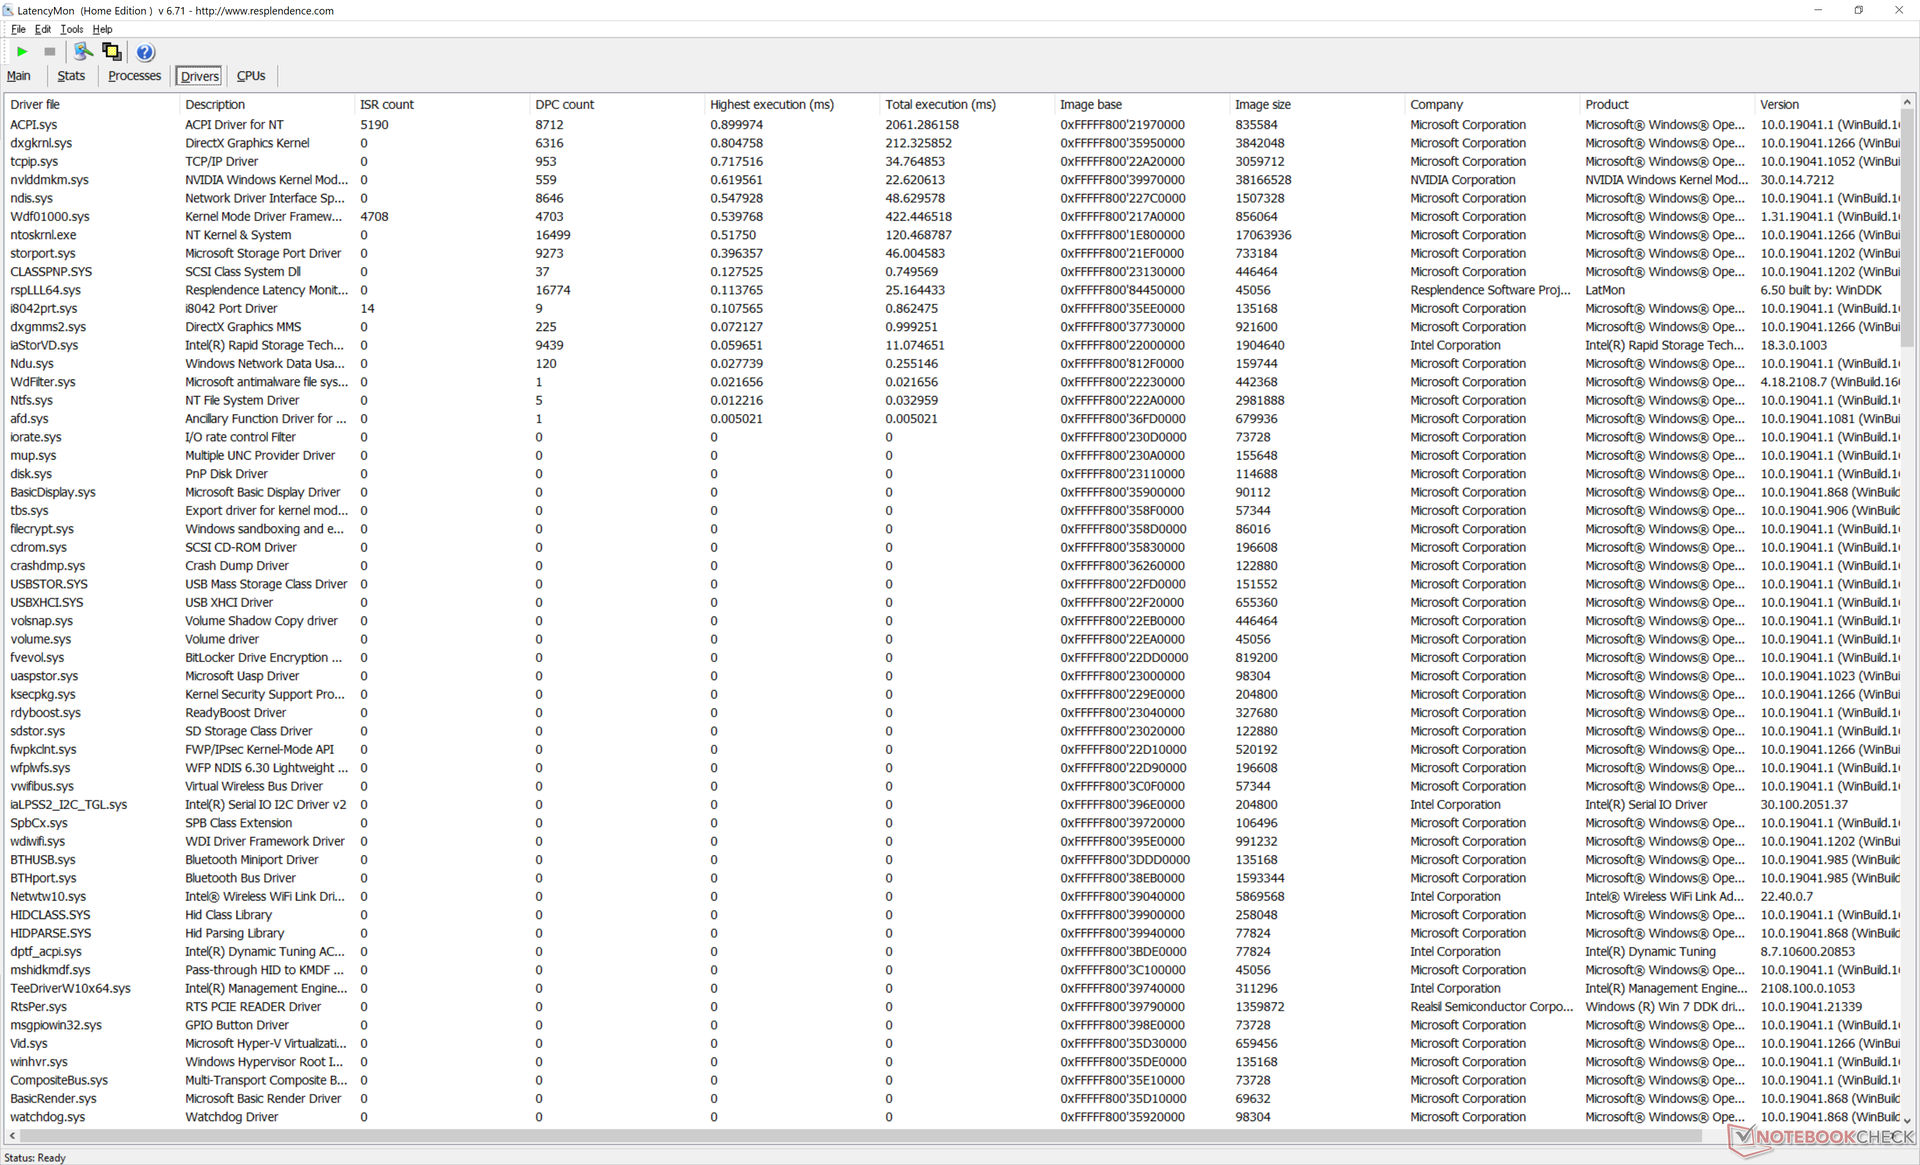
LatencyMon ne montre aucun problème de latence DPC lors de l'ouverture de plusieurs onglets de navigateur ou lors de l'exécution de Prime95. La lecture de vidéos 4K à 60 FPS est également totalement fluide et sans aucune perte d'images. Nous n'en attendons pas moins d'une station de travail.
| DPC Latencies / LatencyMon - interrupt to process latency (max), Web, Youtube, Prime95 | |
| Dell Precision 7550 | |
| Lenovo ThinkPad P15 G2-20YQ001JGE | |
| Asus ProArt StudioBook Pro 15 W500G5T | |
| HP ZBook Studio 15 G8 | |
| Dell Precision 5000 5560 | |
| Razer Blade 15 Studio Edition 2020 | |
| Dell Precision 5550 P91F | |
* ... Moindre est la valeur, meilleures sont les performances
Périphériques de stockage
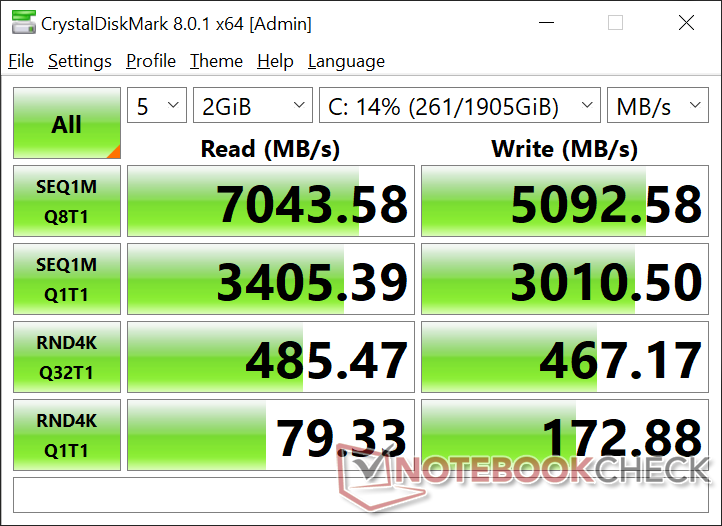
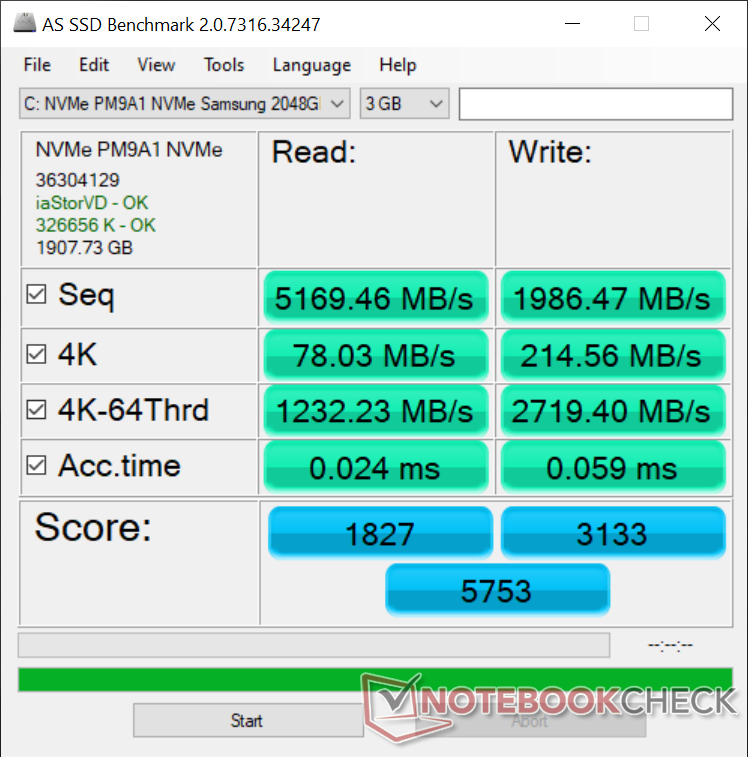
Dell nous a confirmé que les deux baies de stockage M.2 prennent chacune en charge les SSD PCIe4 x4, contre seulement PCIe3 sur le Precision 5550. Même le Alienware x17 R1 ne peut prendre en charge qu'un seul SSD PCIe4 x4 malgré ses deux emplacements M.2 pour SSD. Notre unité de test est livrée avec un Samsung PM9A1 qui est l'un des SSD PCIe4 grand public les plus rapides actuellement disponibles et qui constitue donc une énorme amélioration des performances par rapport au SK Hynix PC601A du modèle de l'année dernière.
| Dell Precision 5000 5560 Samsung PM9A1 MZVL22T0HBLB | Lenovo ThinkPad P15 G2-20YQ001JGE Kioxia XG7 KXG7AZNV512G | HP ZBook Studio 15 G8 Samsung PM981a MZVLB2T0HALB | Asus ProArt StudioBook Pro 15 W500G5T Samsung SSD PM981 MZVLB1T0HALR | Dell Precision 7550 SK Hynix PC601A NVMe 1TB | Dell Precision 5550 P91F SK Hynix PC601A NVMe 1TB | Razer Blade 15 Studio Edition 2020 Samsung PM981a MZVLB1T0HBLR | |
|---|---|---|---|---|---|---|---|
| AS SSD | -8% | -16% | -16% | -42% | -142% | -33% | |
| Seq Read (MB/s) | 5169 | 5105 -1% | 2953 -43% | 2702 -48% | 2028 -61% | 2039 -61% | 1982 -62% |
| Seq Write (MB/s) | 1986 | 1815 -9% | 1691 -15% | 2348 18% | 1193 -40% | 1376 -31% | 2252 13% |
| 4K Read (MB/s) | 78 | 47.46 -39% | 43.98 -44% | 37.59 -52% | 42.31 -46% | 44.11 -43% | 47.13 -40% |
| 4K Write (MB/s) | 214.6 | 137.3 -36% | 105.4 -51% | 107.1 -50% | 105.5 -51% | 113.3 -47% | 88.2 -59% |
| 4K-64 Read (MB/s) | 1232 | 2112 71% | 1065 -14% | 1491 21% | 1128 -8% | 1094 -11% | 1481 20% |
| 4K-64 Write (MB/s) | 2719 | 1702 -37% | 1957 -28% | 1794 -34% | 1537 -43% | 1630 -40% | 1842 -32% |
| Access Time Read * (ms) | 0.024 | 0.065 -171% | 0.04 -67% | 0.046 -92% | 0.069 -188% | 0.059 -146% | 0.087 -262% |
| Access Time Write * (ms) | 0.059 | 0.03 49% | 0.105 -78% | 0.034 42% | 0.106 -80% | 0.99 -1578% | 0.04 32% |
| Score Read (Points) | 1827 | 2670 46% | 1404 -23% | 1798 -2% | 1373 -25% | 1342 -27% | 1726 -6% |
| Score Write (Points) | 3133 | 2021 -35% | 2232 -29% | 2136 -32% | 1762 -44% | 1881 -40% | 2155 -31% |
| Score Total (Points) | 5753 | 5885 2% | 4297 -25% | 4835 -16% | 3801 -34% | 3883 -33% | 4781 -17% |
| Copy ISO MB/s (MB/s) | 3201 | 2054 -36% | 2474 -23% | 2302 -28% | 1768 -45% | 2489 -22% | 1982 -38% |
| Copy Program MB/s (MB/s) | 415.8 | 714 72% | 1074 158% | 564 36% | 627 51% | 682 64% | 501 20% |
| Copy Game MB/s (MB/s) | 1212 | 1431 18% | 1929 59% | 1336 10% | 1477 22% | 1515 25% | 1140 -6% |
| CrystalDiskMark 5.2 / 6 | -9% | -29% | 38% | -35% | -36% | -26% | |
| Write 4K (MB/s) | 172.4 | 141.1 -18% | 110.5 -36% | 1107 542% | 121 -30% | 122.6 -29% | 132.9 -23% |
| Read 4K (MB/s) | 78.8 | 58.8 -25% | 51.8 -34% | 43.38 -45% | 42.16 -46% | 42.4 -46% | 46.73 -41% |
| Write Seq (MB/s) | 2991 | 3320 11% | 2071 -31% | 2387 -20% | 2150 -28% | 2167 -28% | 2214 -26% |
| Read Seq (MB/s) | 3351 | 2994 -11% | 2505 -25% | 2431 -27% | 1755 -48% | 1747 -48% | 2018 -40% |
| Write 4K Q32T1 (MB/s) | 459.2 | 626 36% | 429.8 -6% | 340.7 -26% | 395.3 -14% | 388.8 -15% | 478.9 4% |
| Read 4K Q32T1 (MB/s) | 484.3 | 401.8 -17% | 418.3 -14% | 397.8 -18% | 381.8 -21% | 367.3 -24% | 540 12% |
| Write Seq Q32T1 (MB/s) | 4761 | 3742 -21% | 3060 -36% | 2390 -50% | 2730 -43% | 2629 -45% | 2975 -38% |
| Read Seq Q32T1 (MB/s) | 7071 | 5097 -28% | 3539 -50% | 3502 -50% | 3468 -51% | 3460 -51% | 3195 -55% |
| Moyenne finale (programmes/paramètres) | -9% /
-8% | -23% /
-21% | 11% /
4% | -39% /
-40% | -89% /
-103% | -30% /
-31% |
* ... Moindre est la valeur, meilleures sont les performances

Disk Throttling: DiskSpd Read Loop, Queue Depth 8
Performances du GPU
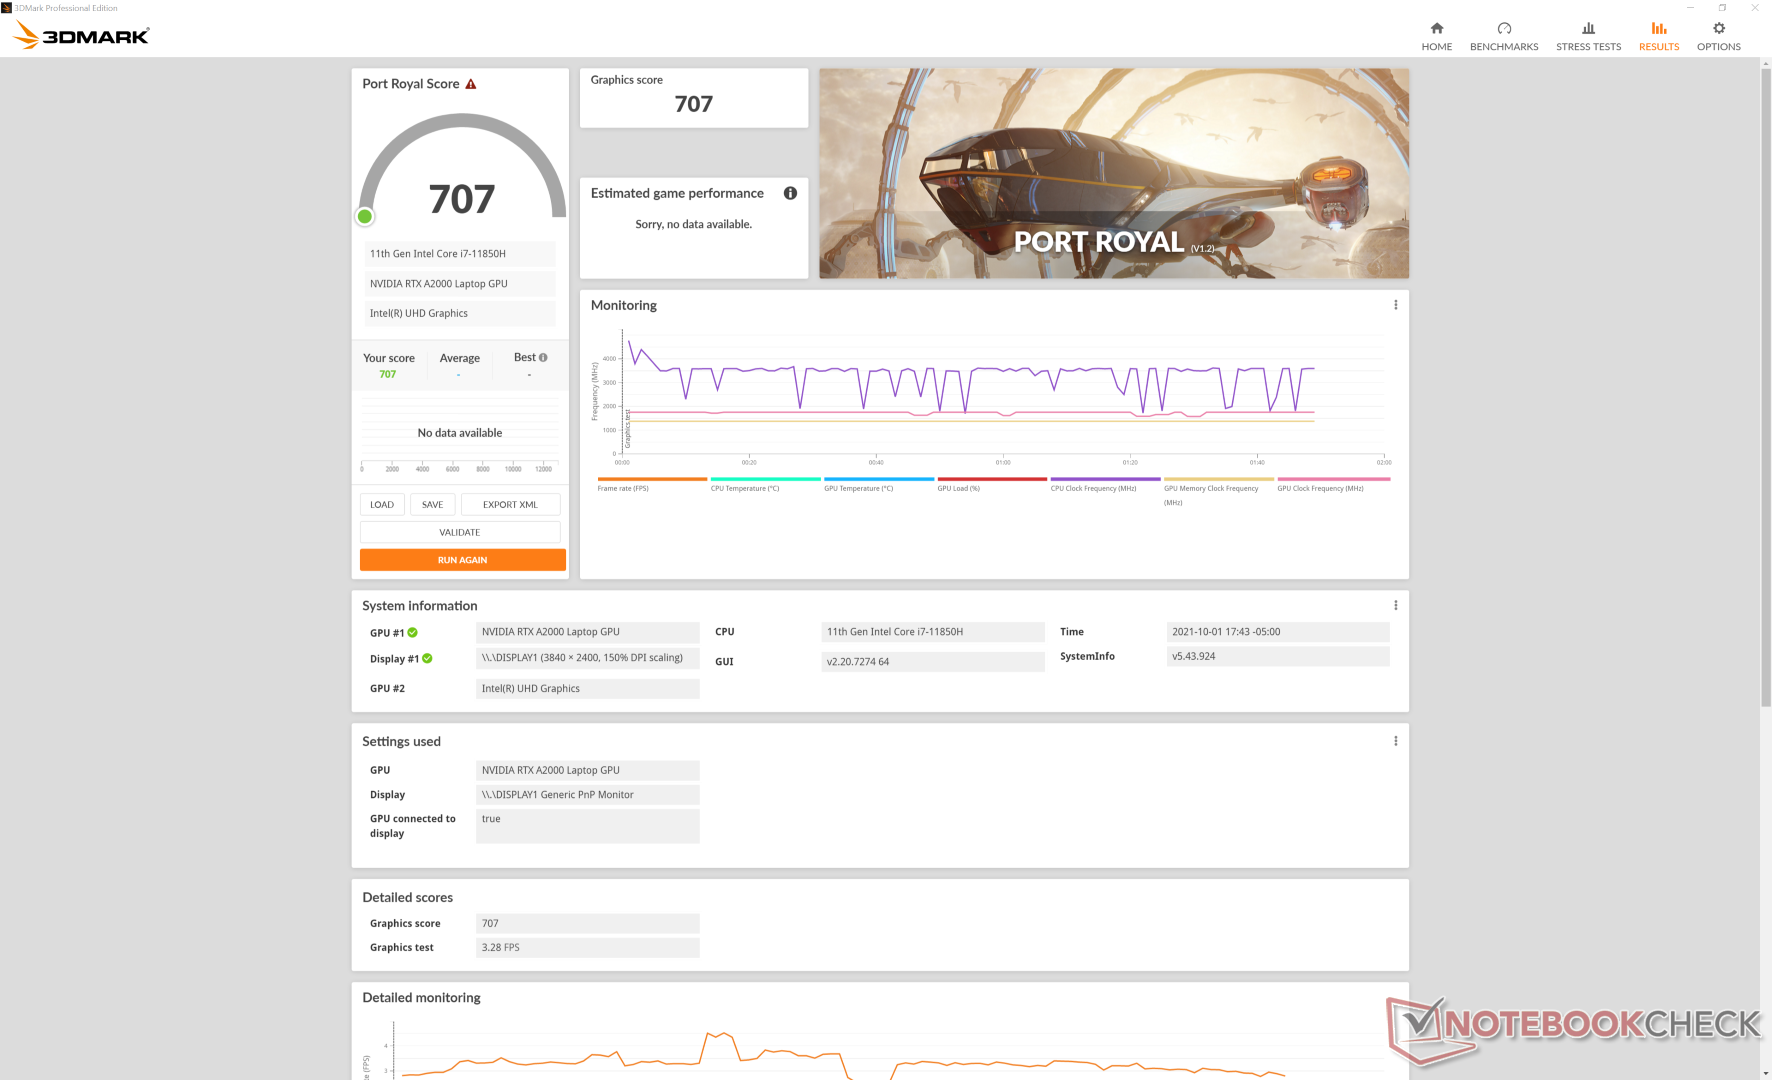
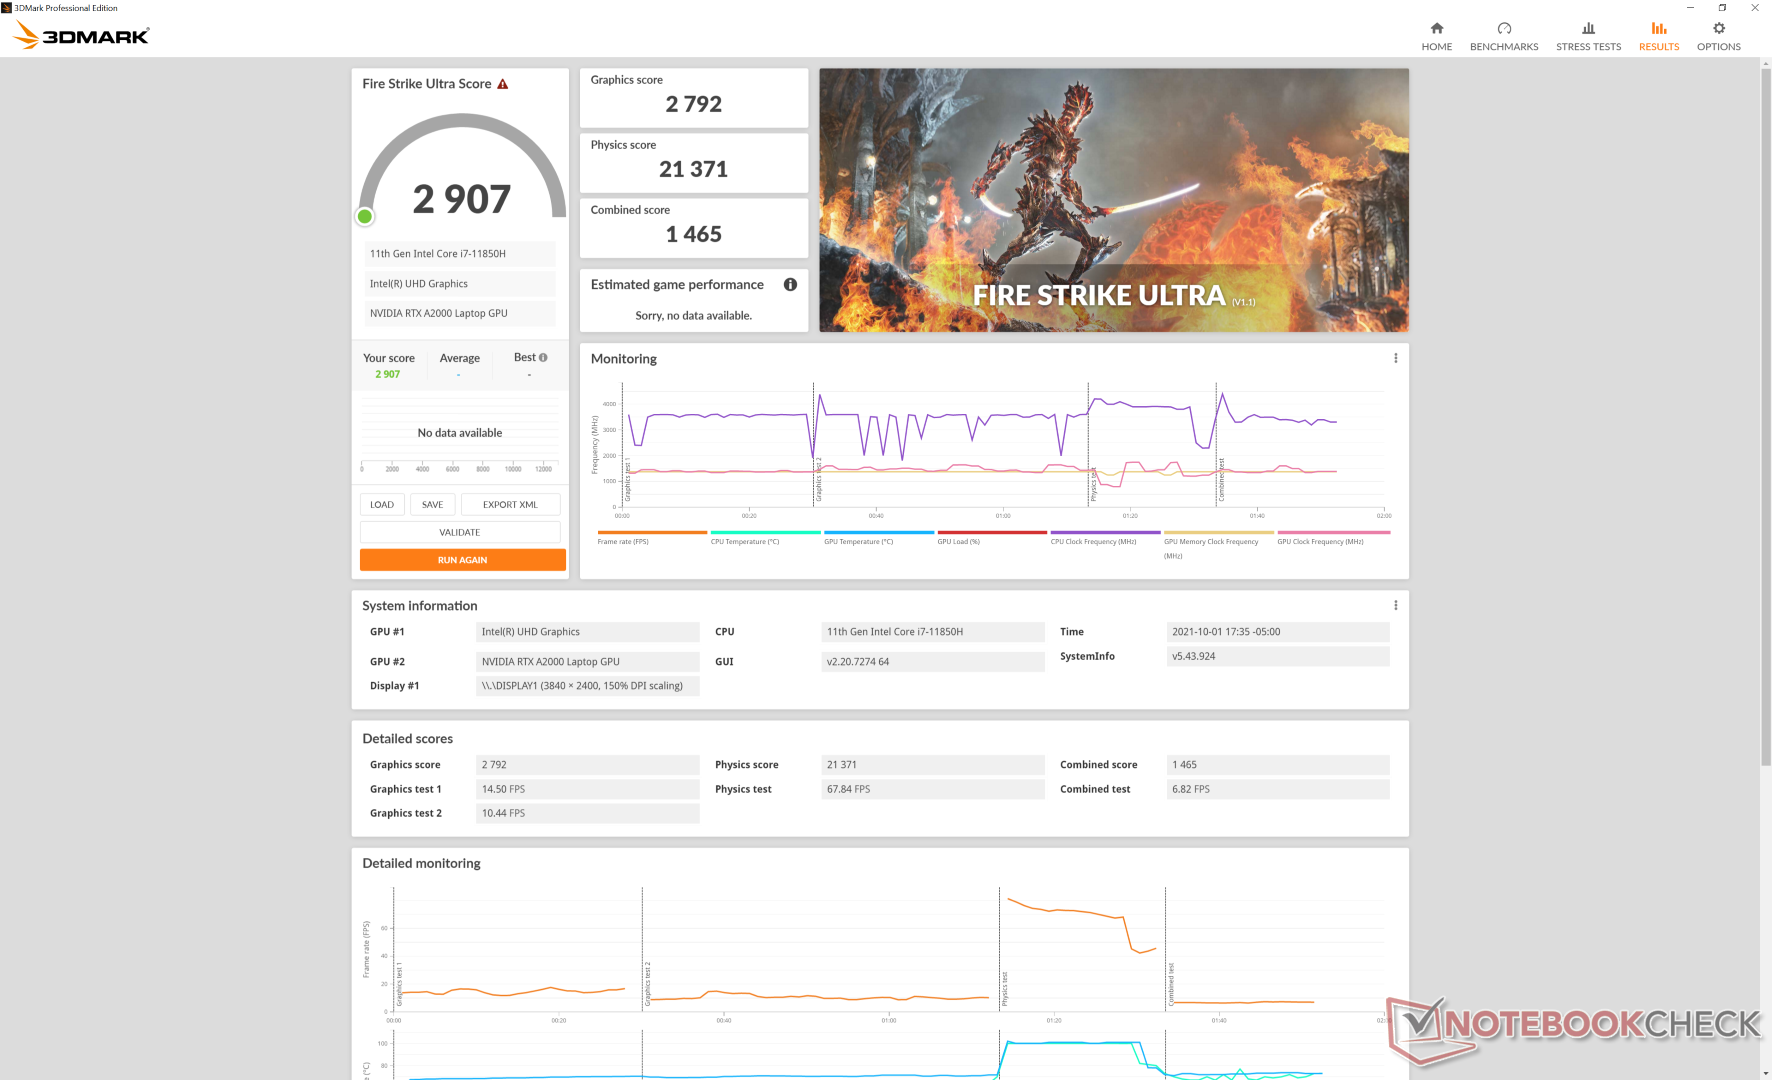
Les performances graphiques brutes de la Quadro RTX A2000 se situent confortablement entre les performances de la GeForce GTX 1650 Ti et GTX 1660 Ti ou environ 10 % plus lente que l'ancienne Quadro RTX 3000 Max-Q. L'augmentation des performances est plus significative, de l'ordre de 40 à 50 %, par rapport à la Quadro T2000 Max-Q Quadro T2000 Max-Q sur le site Precision 5550. La mise à niveau vers une Quadro RTX A3000, qui n'est pas disponible sur la série Precision 5560, peut apporter une augmentation des performances de 30 à 40 % par rapport à notre Quadro RTX A2000
Il est intéressant de noter que les scores SpecViewPerf sont plus proches que prévu entre notre RTX A2000 et la Quadro RTX 3000 Max-Q de dernière génération, malgré le fait que l'ancien GPU Turing soit plus gourmand en énergie, ce qui suggère une meilleure optimisation dans les charges de type station de travail pour notre GPU Ampere
Si vous jouez, attendez-vous à ce que les performances soient de 20 à 30 % inférieures à celles de la GTX 1660 Ti, car les GPU Quadro ne sont pas optimisés pour les jeux. Strange Brigade, par exemple, se plantait parfois une ou deux minutes après le début du benchmark.
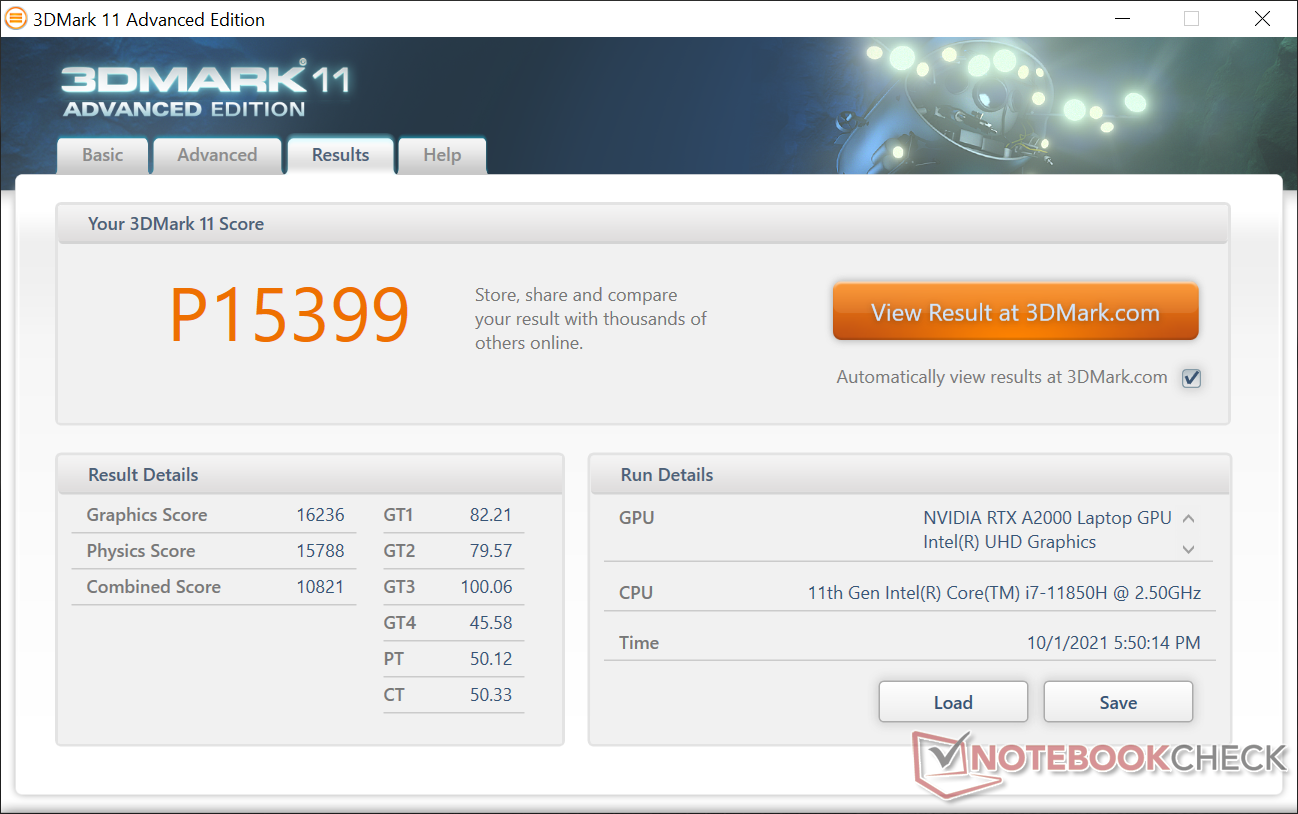
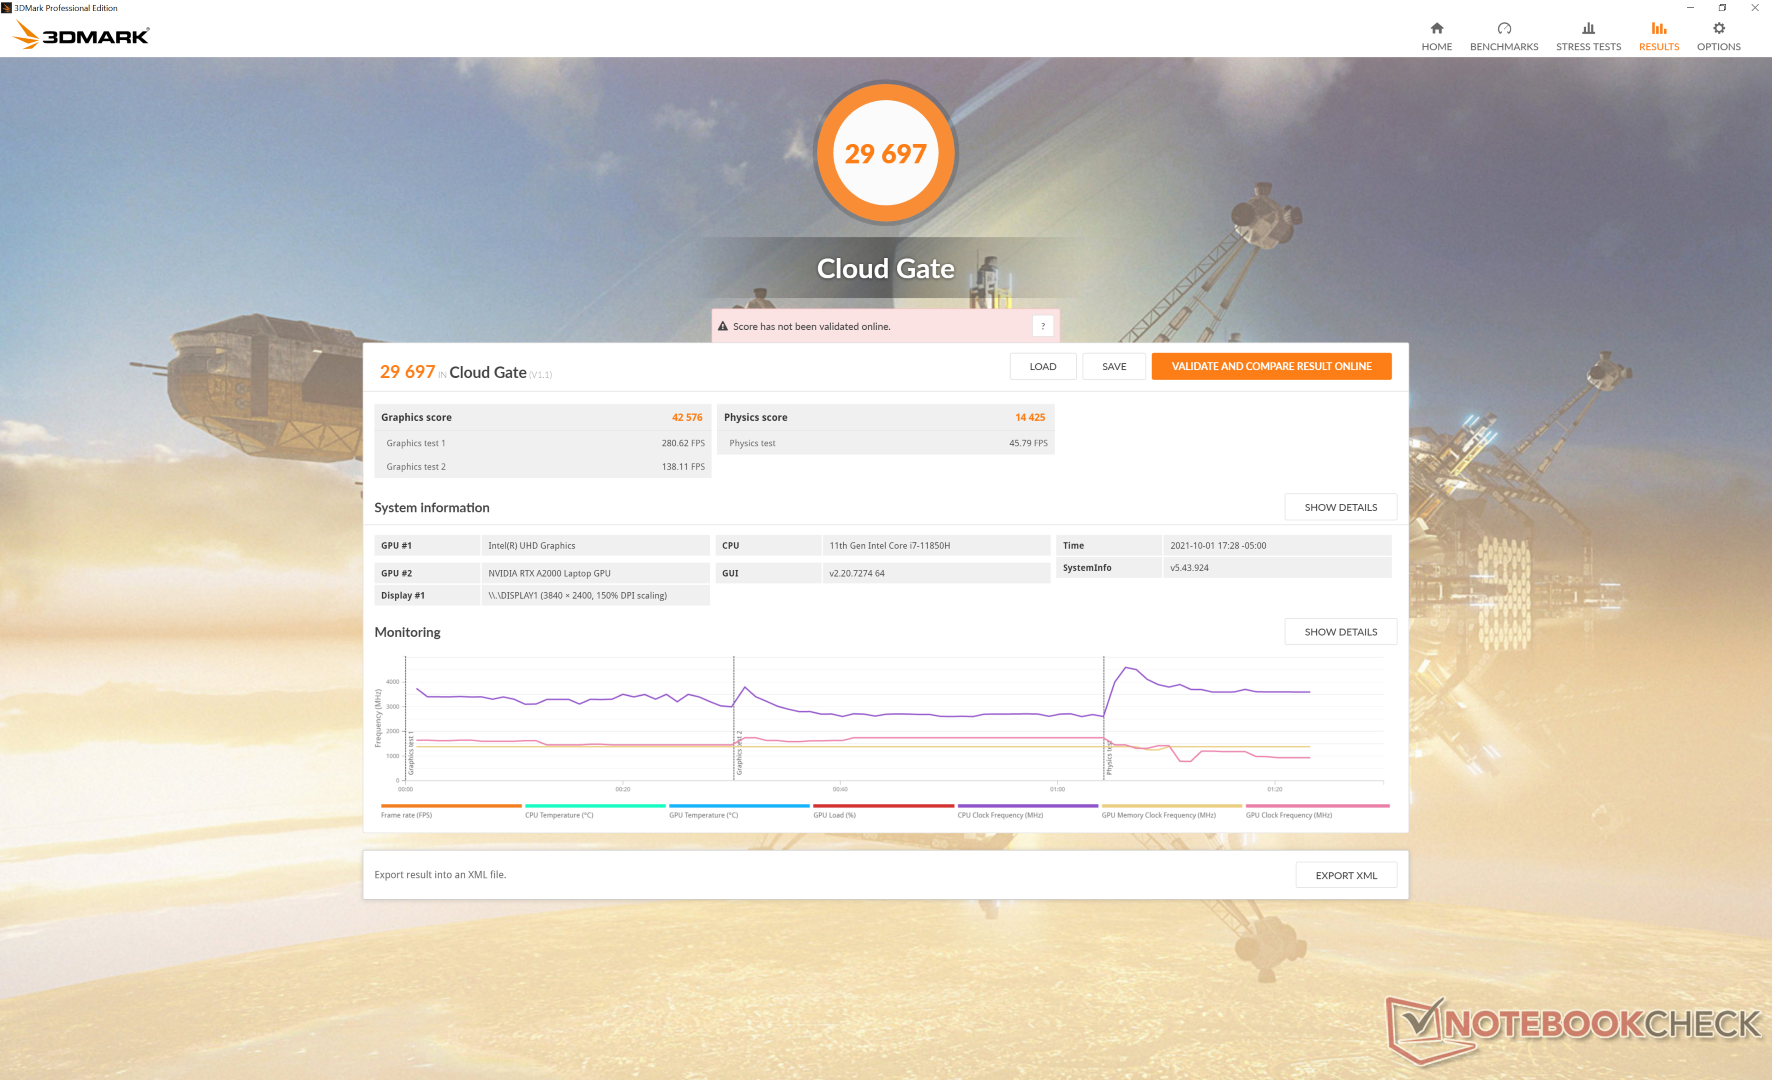
| 3DMark 11 Performance | 15399 points | |
| 3DMark Cloud Gate Standard Score | 29697 points | |
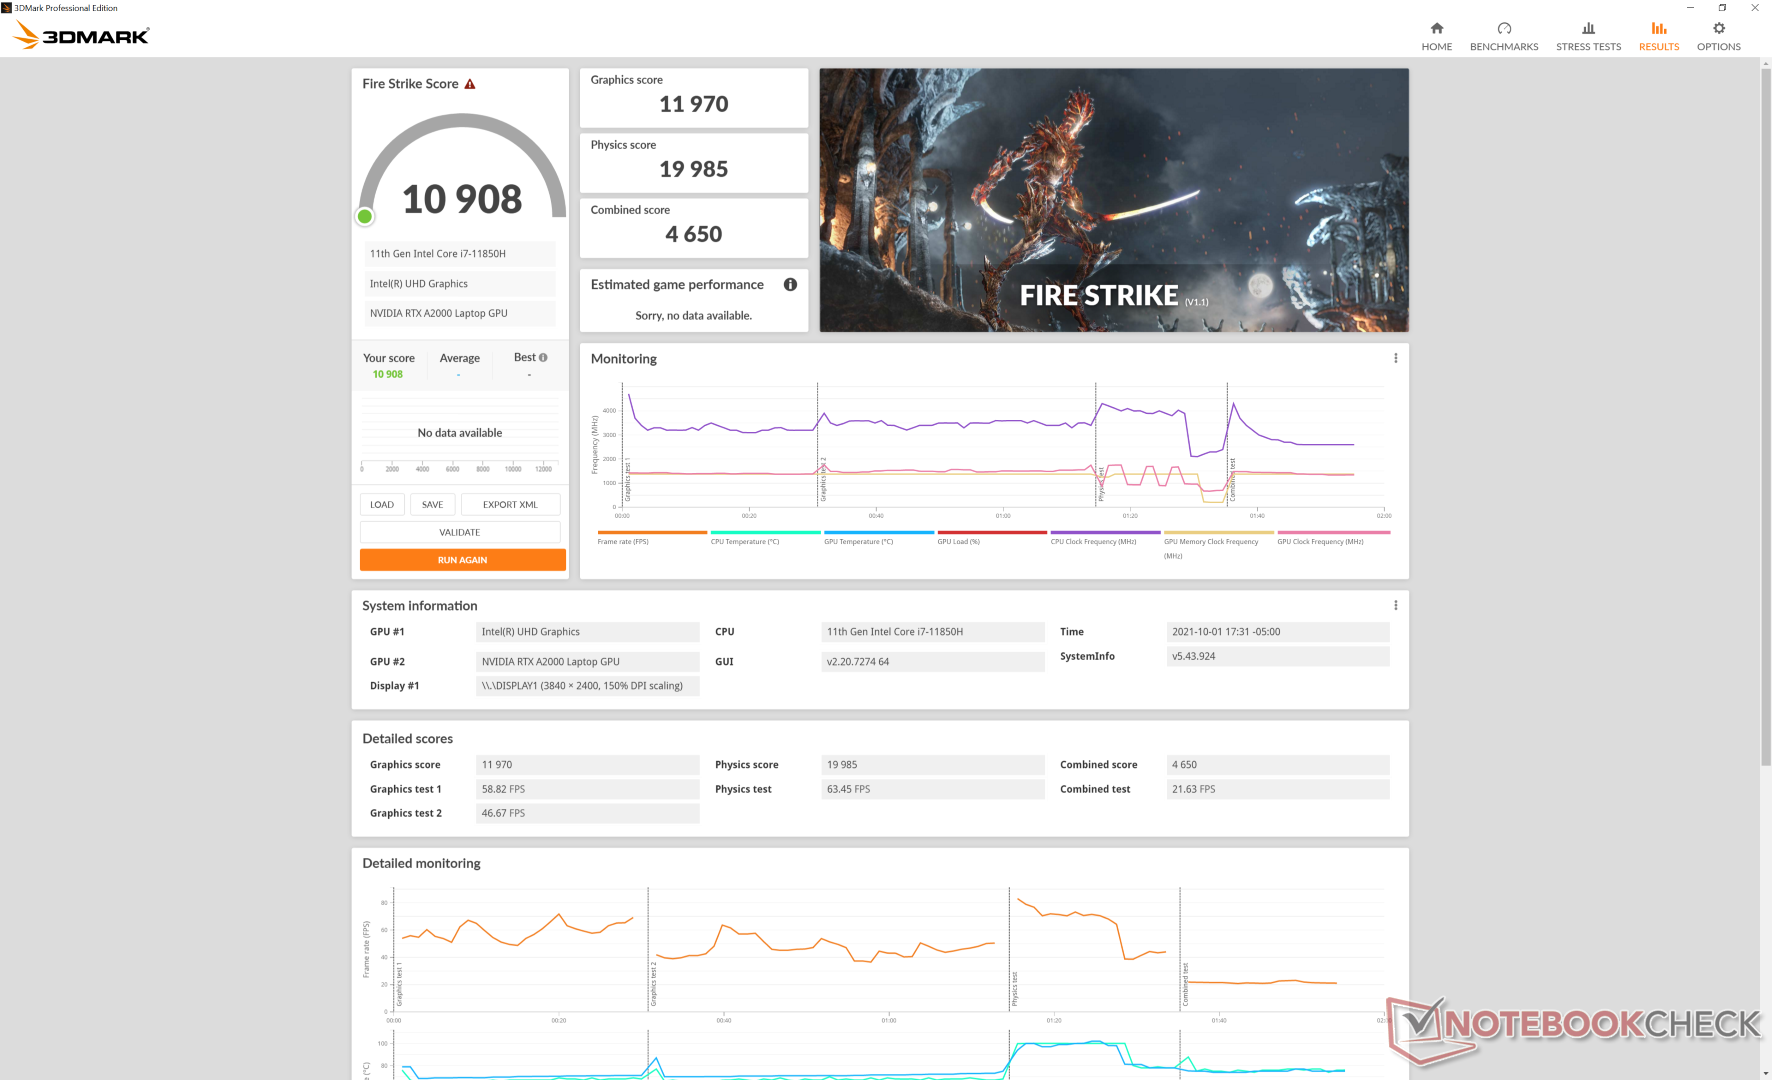
| 3DMark Fire Strike Score | 10908 points | |
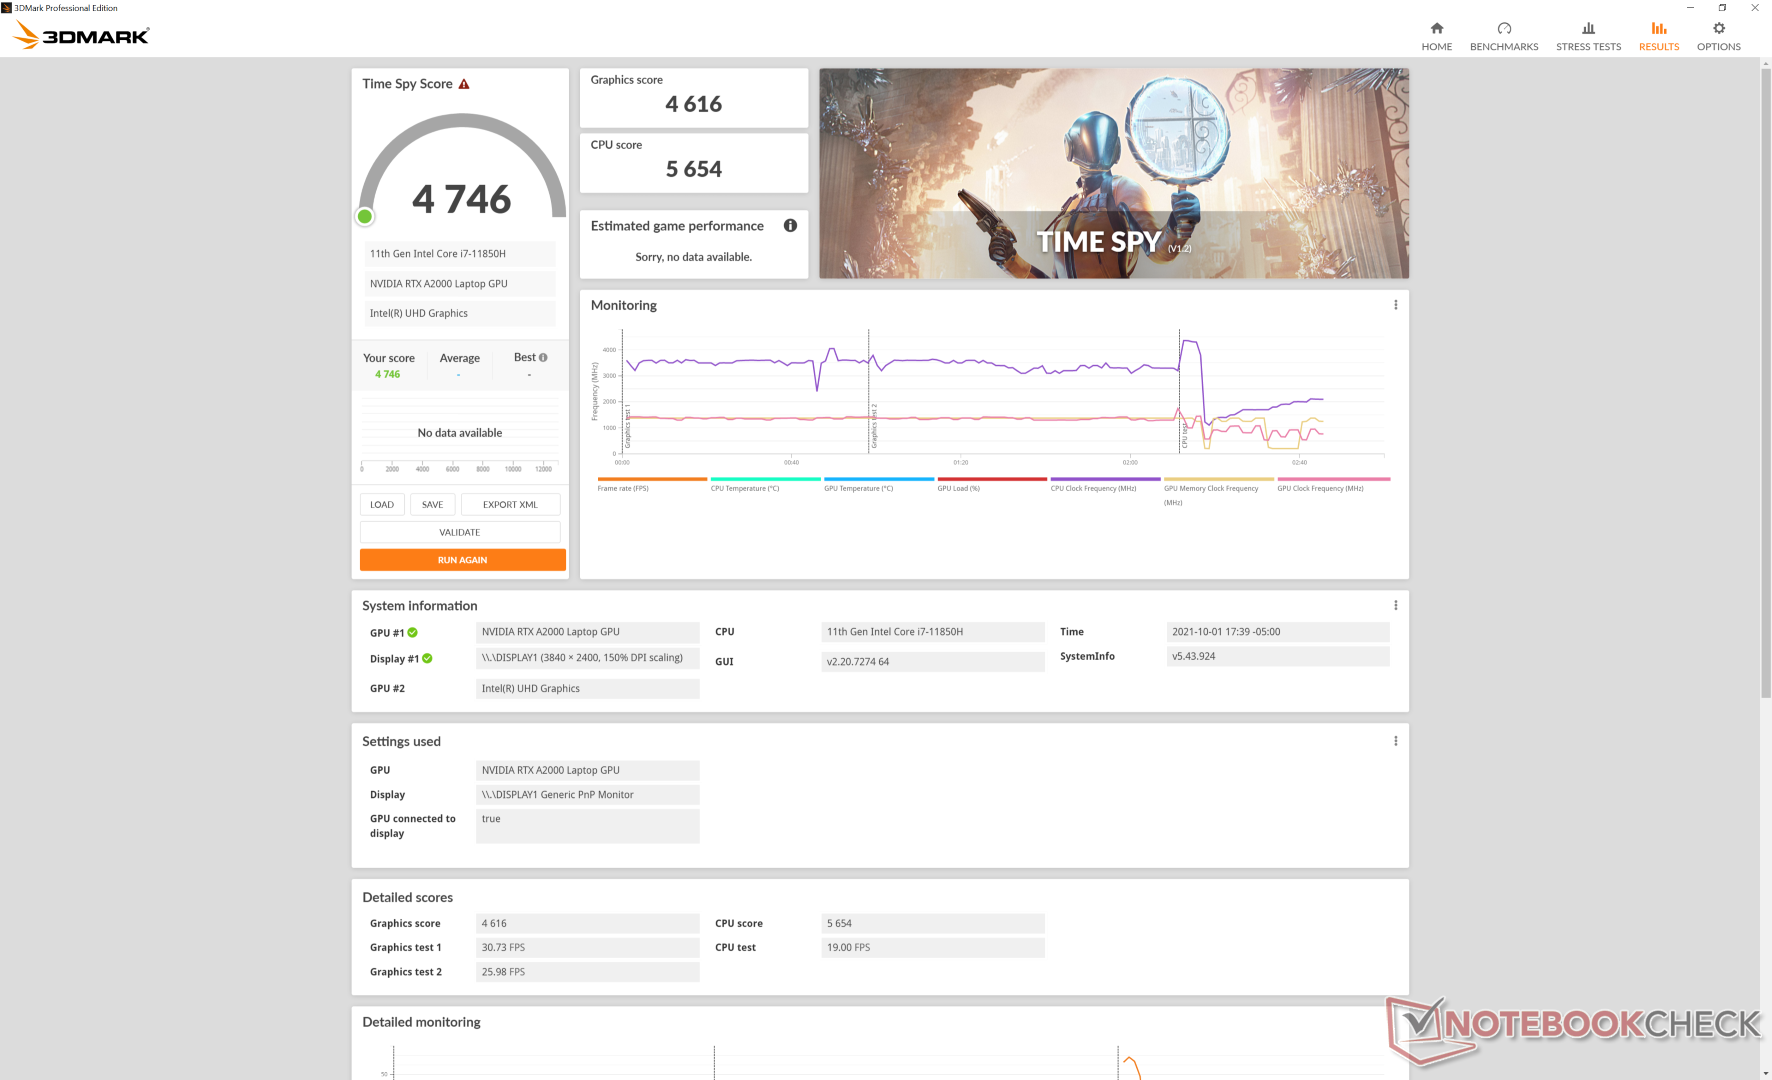
| 3DMark Time Spy Score | 4746 points | |
Aide | ||
Witcher 3 FPS Chart
| Bas | Moyen | Élevé | Ultra | QHD | 4K | |
|---|---|---|---|---|---|---|
| GTA V (2015) | 179 | 170 | 112 | 57.8 | 42.9 | |
| The Witcher 3 (2015) | 259.8 | 151.9 | 92.4 | 50 | 33.1 | |
| Dota 2 Reborn (2015) | 173 | 155 | 130 | 119 | 62.9 | |
| Final Fantasy XV Benchmark (2018) | 86.9 | 63.2 | 46.6 | 34.4 | 19.3 | |
| X-Plane 11.11 (2018) | 112 | 89.2 | 75.1 | 45.3 | ||
| Far Cry 5 (2018) | 120 | 82 | 77 | 69 | 49 | |
| Strange Brigade (2018) | 251 | 60.4 | ||||
| Shadow of the Tomb Raider (2018) | 107 | 62 | 58 | 55 | 40 | 17 |
| Far Cry New Dawn (2019) | 106 | 72 | 71 | 59 | 49 | |
| Metro Exodus (2019) | 110.4 | 55.1 | 42.3 | 34.9 | 27 | |
| Borderlands 3 (2019) | 115.5 | 60.7 | 46.2 | 36 | ||
| Gears Tactics (2020) | 104.3 | 113.7 | 77.5 | 53.4 | 37.3 | |
| Horizon Zero Dawn (2020) | 81 | 60 | 55 | 49 | 41 | |
| Watch Dogs Legion (2020) | 86 | 62 | 51 | 29 | 20 | |
| Dirt 5 (2020) | 86.3 | 68 | 54.6 | 41.9 | 34 | |
| Assassin´s Creed Valhalla (2020) | 80 | 55 | 39 | 32 | 27 | |
| Immortals Fenyx Rising (2020) | 107 | 80 | 72 | 64 | 53 | |
| Hitman 3 (2021) | 166.6 | 83.4 | 78.6 | 73.9 | 48.4 | |
| F1 2021 (2021) | 114 | 120 | 104 | 37 | 24 |
Emissions
Bruit du système
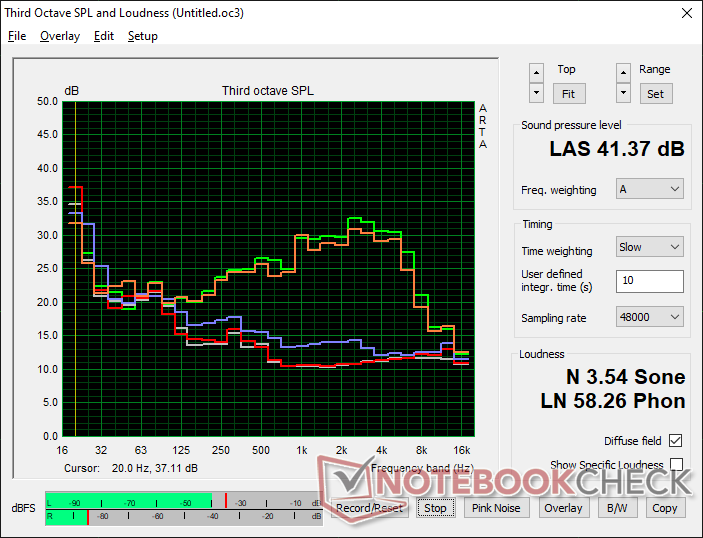
Il est intéressant de noter que le bruit du ventilateur est nettement plus faible que celui que nous avons observé sur le Precision 5550. Alors que le bruit du ventilateur peut atteindre plus de 50 dB(A) sur le Precision 5550, nous ne parvenons qu'à 41,4 dB(A) au maximum sur notre Precision 5560, même lorsqu'il est soumis aux mêmes conditions de stress. Ce plafond de ventilateur plus bas sur le nouveau modèle est apprécié et il aide le système à être l'une des stations de travail mobiles ultra-minces les plus silencieuses du marché, mais cela se fait au prix de températures centrales plus élevées. Notre section sur les tests de stress ci-dessous montre une différence de température du CPU de 16 C entre les deux ordinateurs portables lors de l'exécution de Prime95.
| Dell Precision 5000 5560 RTX A2000 Laptop GPU, i7-11850H, Samsung PM9A1 MZVL22T0HBLB | Lenovo ThinkPad P15 G2-20YQ001JGE RTX A3000 Laptop GPU, i7-11800H, Kioxia XG7 KXG7AZNV512G | HP ZBook Studio 15 G8 GeForce RTX 3070 Laptop GPU, i9-11950H, Samsung PM981a MZVLB2T0HALB | Asus ProArt StudioBook Pro 15 W500G5T Quadro RTX 5000 Max-Q, i7-9750H, Samsung SSD PM981 MZVLB1T0HALR | Dell Precision 7550 Quadro RTX 5000 Max-Q, W-10885M, SK Hynix PC601A NVMe 1TB | Dell Precision 5550 P91F Quadro T2000 Max-Q, i7-10875H, SK Hynix PC601A NVMe 1TB | Razer Blade 15 Studio Edition 2020 Quadro RTX 5000 Max-Q, i7-10875H, Samsung PM981a MZVLB1T0HBLR | |
|---|---|---|---|---|---|---|---|
| Noise | -25% | -18% | -26% | -27% | -17% | -28% | |
| arrêt / environnement * (dB) | 23.4 | 24.3 -4% | 23.5 -0% | 25.2 -8% | 25.8 -10% | 26.2 -12% | 30.1 -29% |
| Idle Minimum * (dB) | 23.6 | 24.3 -3% | 25.3 -7% | 27.9 -18% | 25.8 -9% | 26.2 -11% | 30.1 -28% |
| Idle Average * (dB) | 23.6 | 24.3 -3% | 25.3 -7% | 27.9 -18% | 25.8 -9% | 26.2 -11% | 30.1 -28% |
| Idle Maximum * (dB) | 23.6 | 28.6 -21% | 25.3 -7% | 27.9 -18% | 25.9 -10% | 26.2 -11% | 30.1 -28% |
| Load Average * (dB) | 25.8 | 47.5 -84% | 41.2 -60% | 47 -82% | 51.2 -98% | 39.2 -52% | 42.3 -64% |
| Witcher 3 ultra * (dB) | 40.1 | 49.4 -23% | 51.9 -29% | 39 3% | 48.2 -20% | ||
| Load Maximum * (dB) | 41.4 | 54.9 -33% | 49.4 -19% | 46.9 -13% | 51.9 -25% | 50.6 -22% | 42.1 -2% |
* ... Moindre est la valeur, meilleures sont les performances
Degré de la nuisance sonore
| Au repos |
| 23.6 / 23.6 / 23.6 dB(A) |
| Fortement sollicité |
| 25.8 / 41.4 dB(A) |
 | ||
30 dB silencieux 40 dB(A) audible 50 dB(A) bruyant |
||
min: | ||
Température
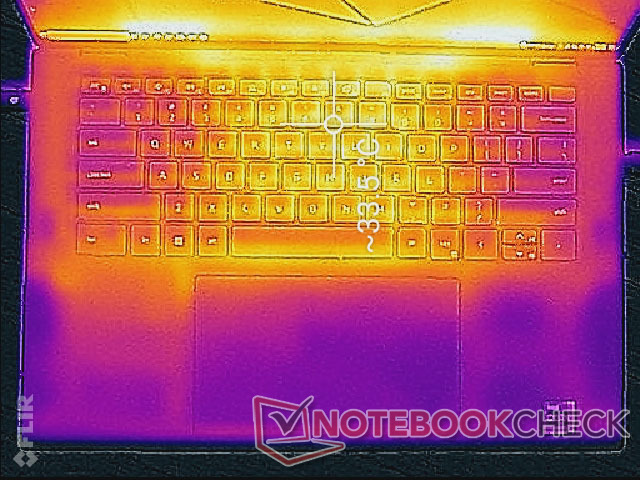
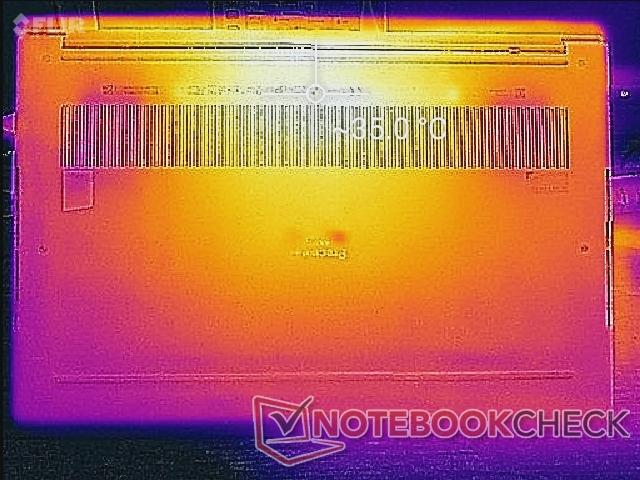
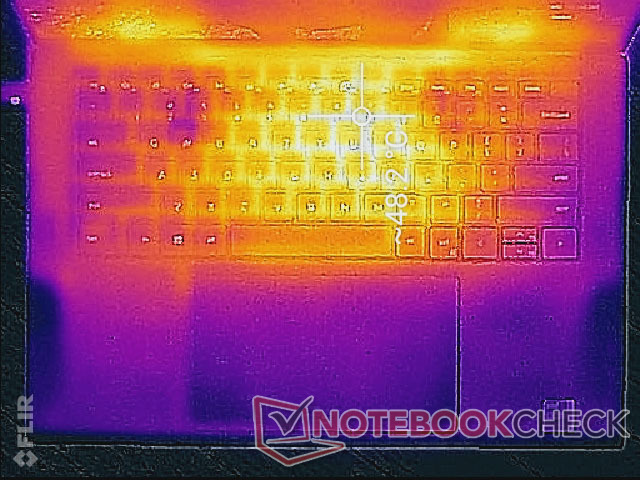
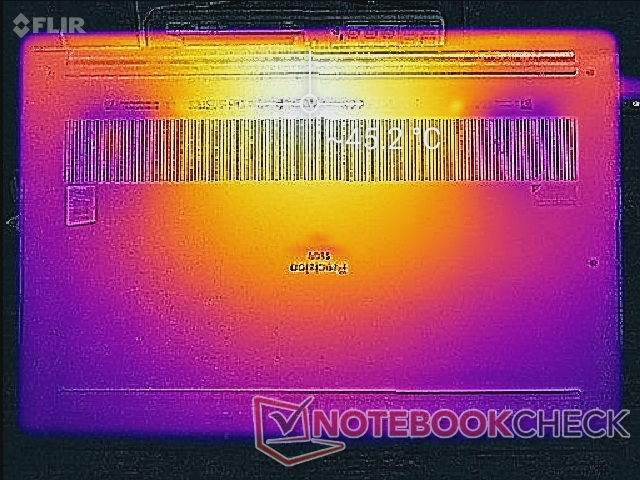
Les températures de surface sous charge sont similaires à celles que nous avons enregistrées sur le Precision 5550 avec des points chauds approchant 49 C et 45 C sur le dessus et le dessous, respectivement. Le développement de la température est largement symétrique en raison de la solution de refroidissement symétrique à l'intérieur et donc le centre du clavier sera beaucoup plus chaud que les repose-paumes ou les bords. Le siteThinkPad P15 Gen 2 est une station de travail mobile plus puissante que notre Precision 5560, mais ses points chauds peuvent devenir beaucoup plus chauds à plus de 63 C en conséquence.
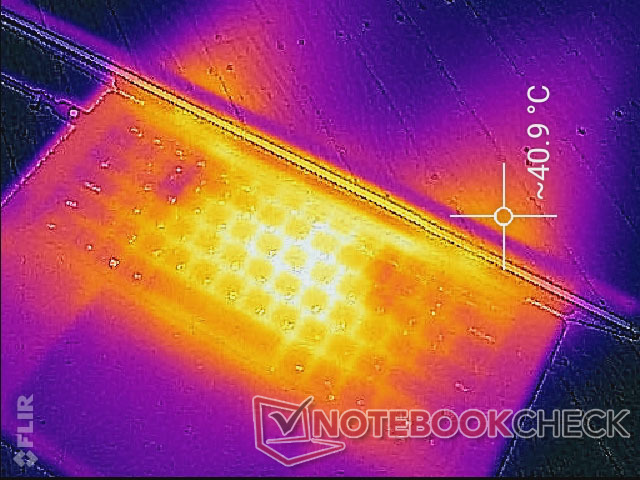
(-) La température maximale du côté supérieur est de 48.2 °C / 119 F, par rapport à la moyenne de 38.2 °C / 101 F, allant de 22.2 à 69.8 °C pour la classe Workstation.
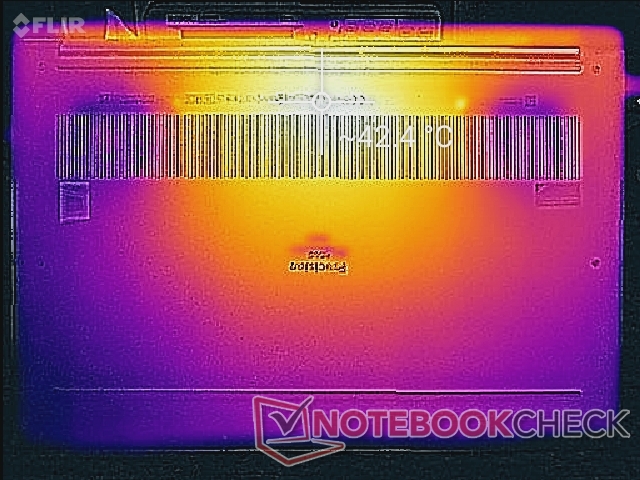
(±) Le fond chauffe jusqu'à un maximum de 42.6 °C / 109 F, contre une moyenne de 41.1 °C / 106 F
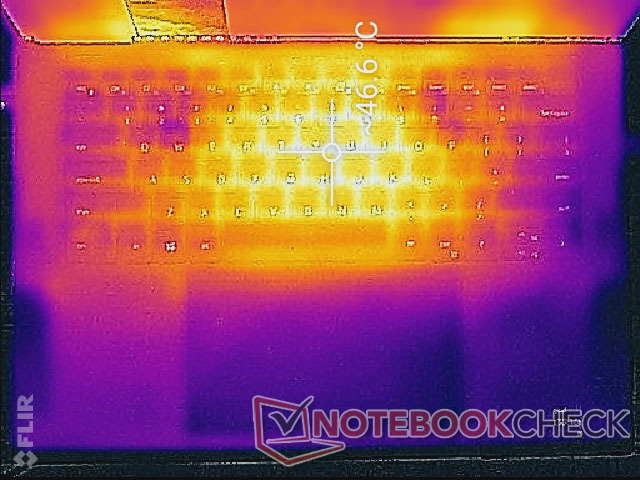
(+) En utilisation inactive, la température moyenne du côté supérieur est de 30.6 °C / 87 F, par rapport à la moyenne du dispositif de 32 °C / 90 F.
(±) En jouant à The Witcher 3, la température moyenne du côté supérieur est de 35.4 °C / 96 F, alors que la moyenne de l'appareil est de 32 °C / 90 F.
(+) Les repose-poignets et le pavé tactile sont plus froids que la température de la peau avec un maximum de 30.8 °C / 87.4 F et sont donc froids au toucher.
(-) La température moyenne de la zone de l'appui-paume de dispositifs similaires était de 27.8 °C / 82 F (-3 °C / #-5.4 F).
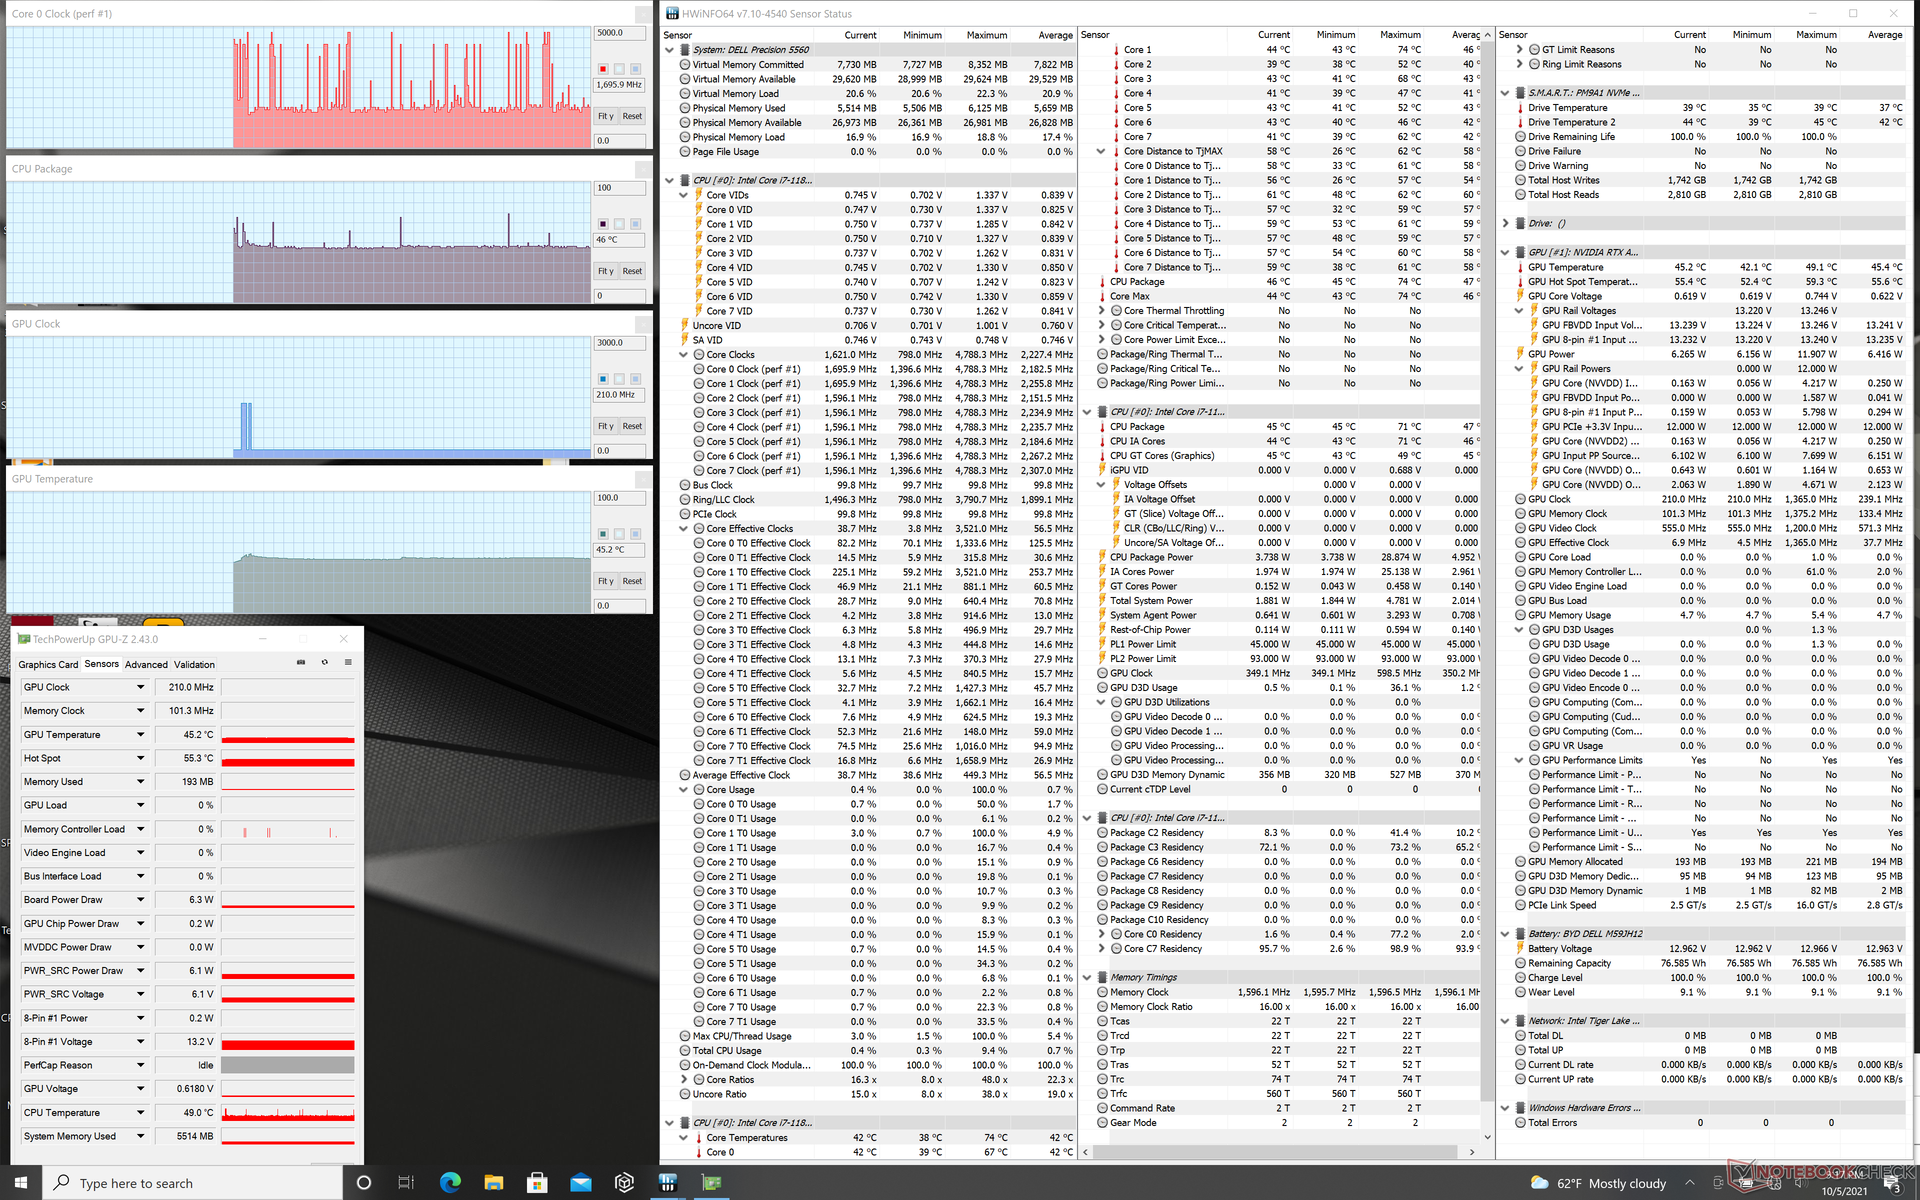
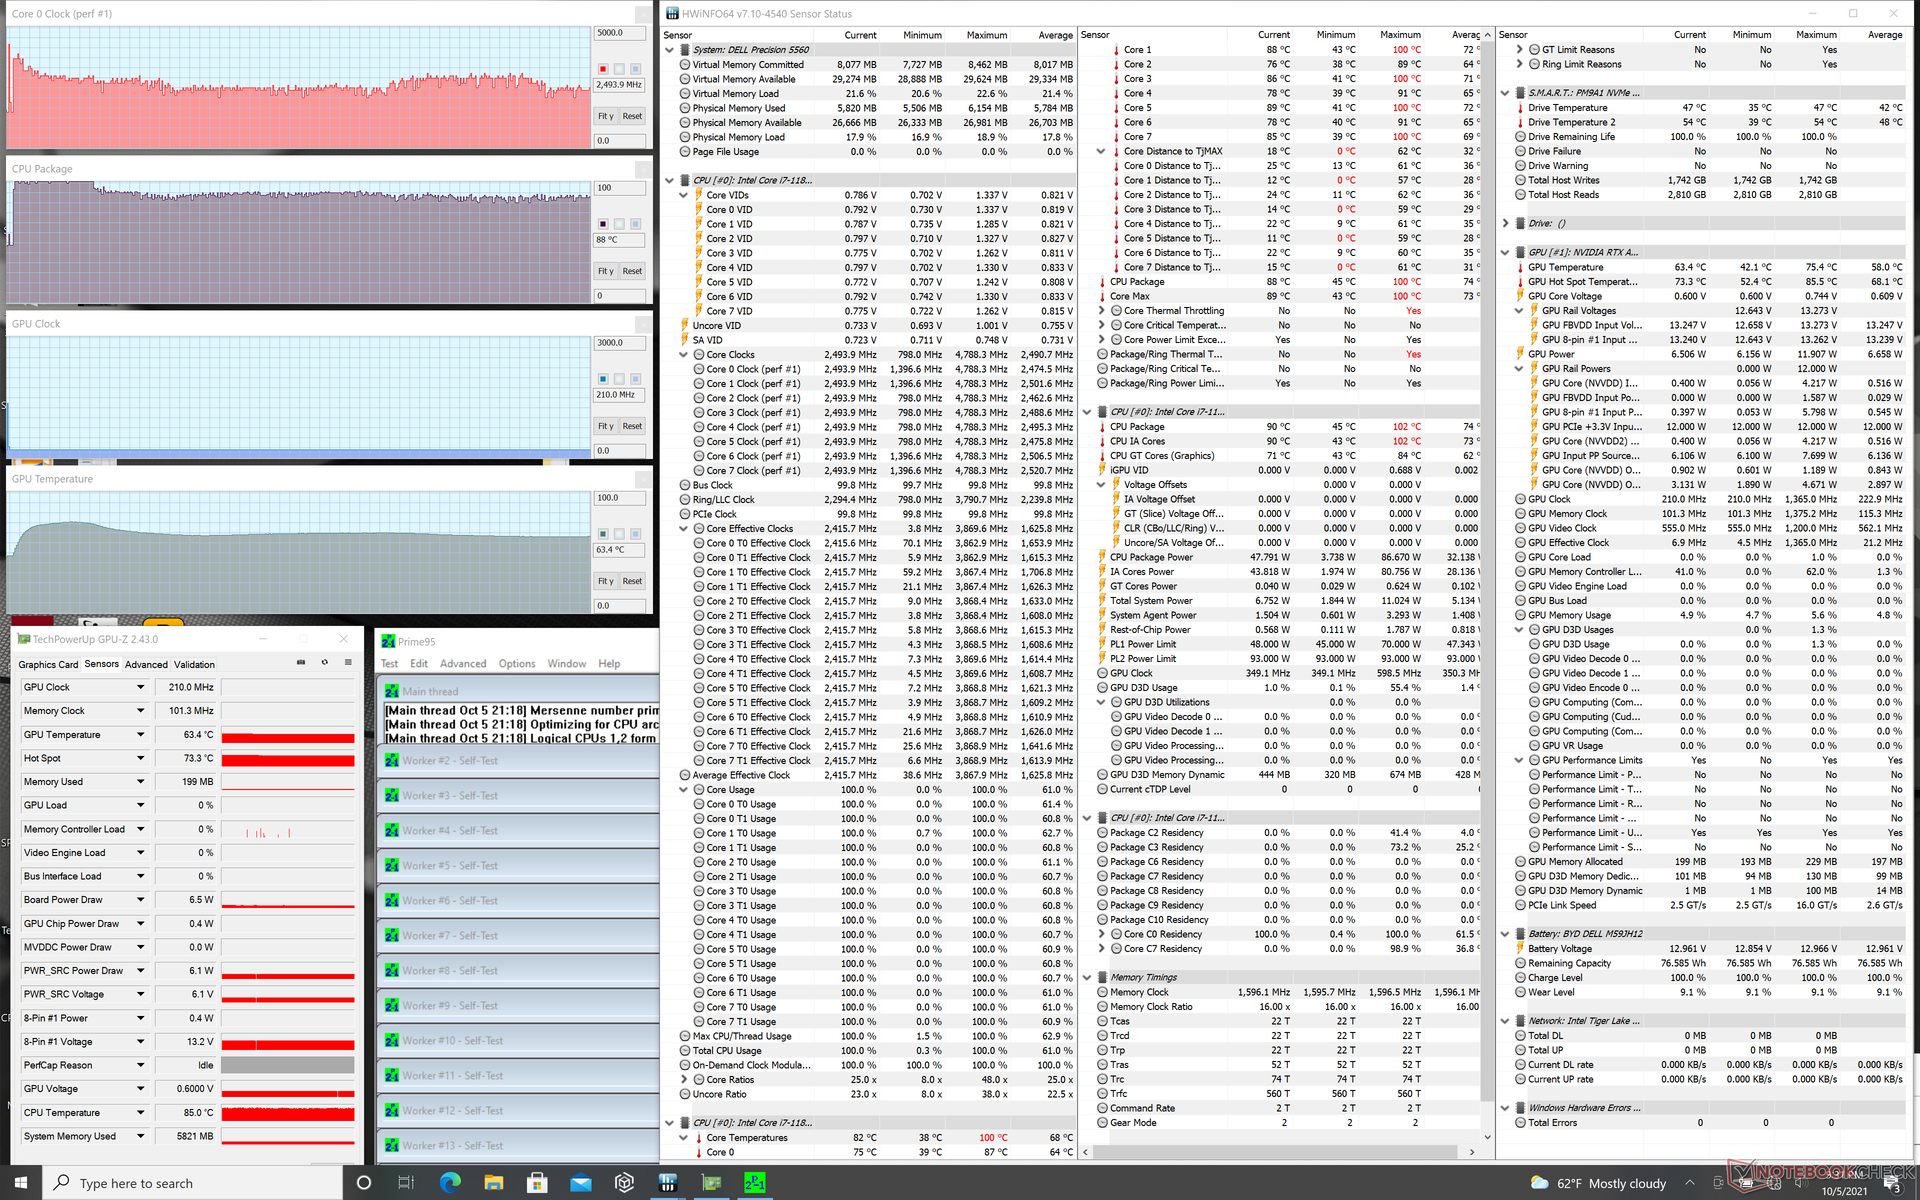
Test de stress
Lors de l'exécution de Prime95, le processeur monte à 3,8 GHz pendant les deux premières secondes avant d'atteindre une température de 100 C. La fréquence d'horloge descend ensuite dans la fourchette de 2,8 à 3,0 GHz pendant la minute suivante avant de descendre encore plus bas dans la fourchette de 2,5 à 2,8 GHz. La température du cœur s'est finalement stabilisée à environ 90 °C, contre 98 °C sur le HP ZBook Studio 15 G8 ou 74 °C sur le Precision 5550
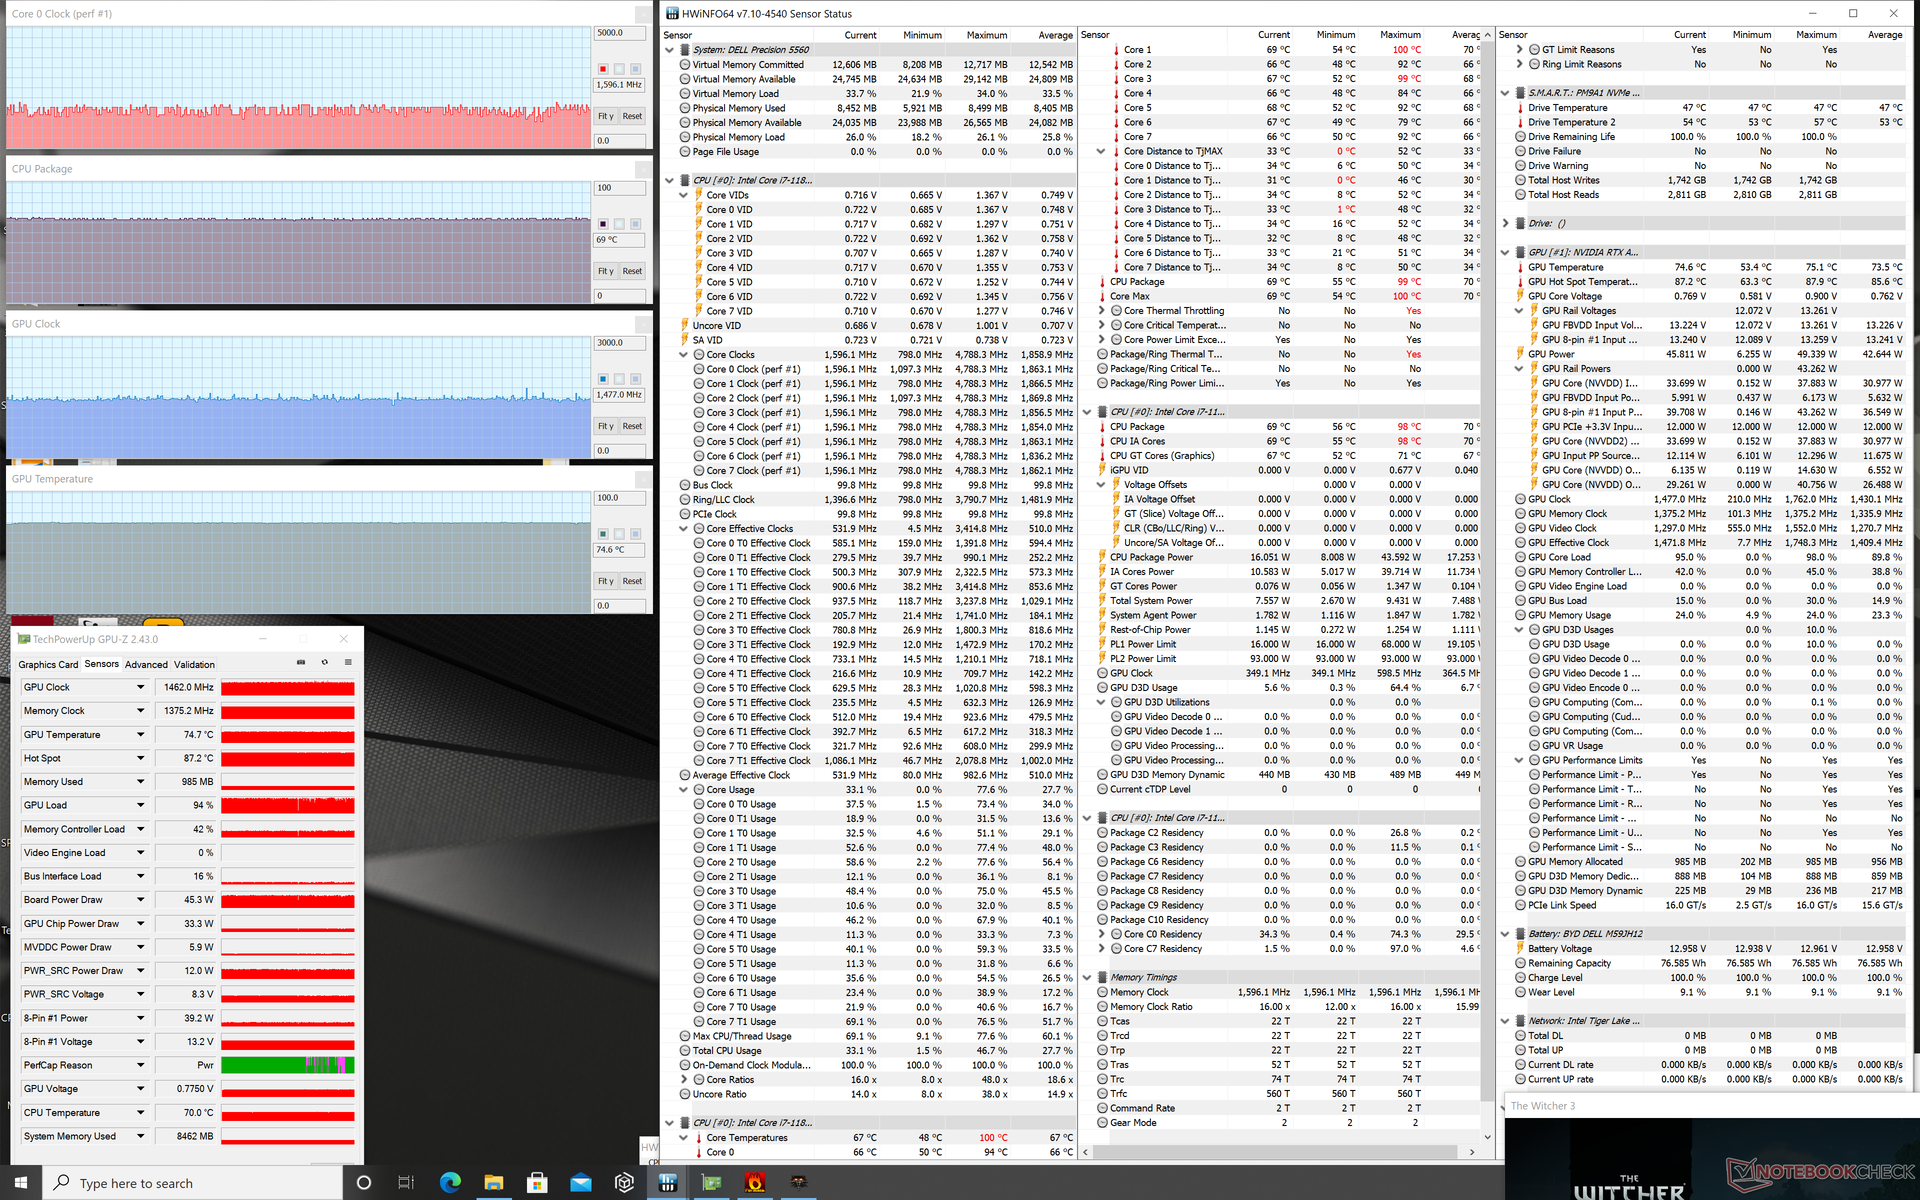
Lors de l'exécution Witcher 3 pour représenter des charges stressantes, le CPU et le GPU se stabilisent à 69 C et 75 C, respectivement, contre 66 C et 67 C sur le Precision 5550. La consommation d'énergie en temps réel de la carte GPU est stable à 45 W, contre 40 W sur le site Precision 5550, ce qui peut expliquer en partie la température légèrement plus élevée du GPU sur notre site Precision 5560
Le fonctionnement sur batterie a un impact sur les performances. Un test 3DMark 11 sur batterie donnerait des scores de physique et de graphisme de 14330 et 12191 points, respectivement, contre 15788 et 16236 points sur le secteur.
| Fréquence CPU(GHz) | Fréquence GPU(MHz) | Température CPU moyenne(°C) | Température GPUmoyenne(°C) |
| Système au repos | -- | ||
| Prime95 Stress | 2.5 - 2.8 | -- | ~90 |
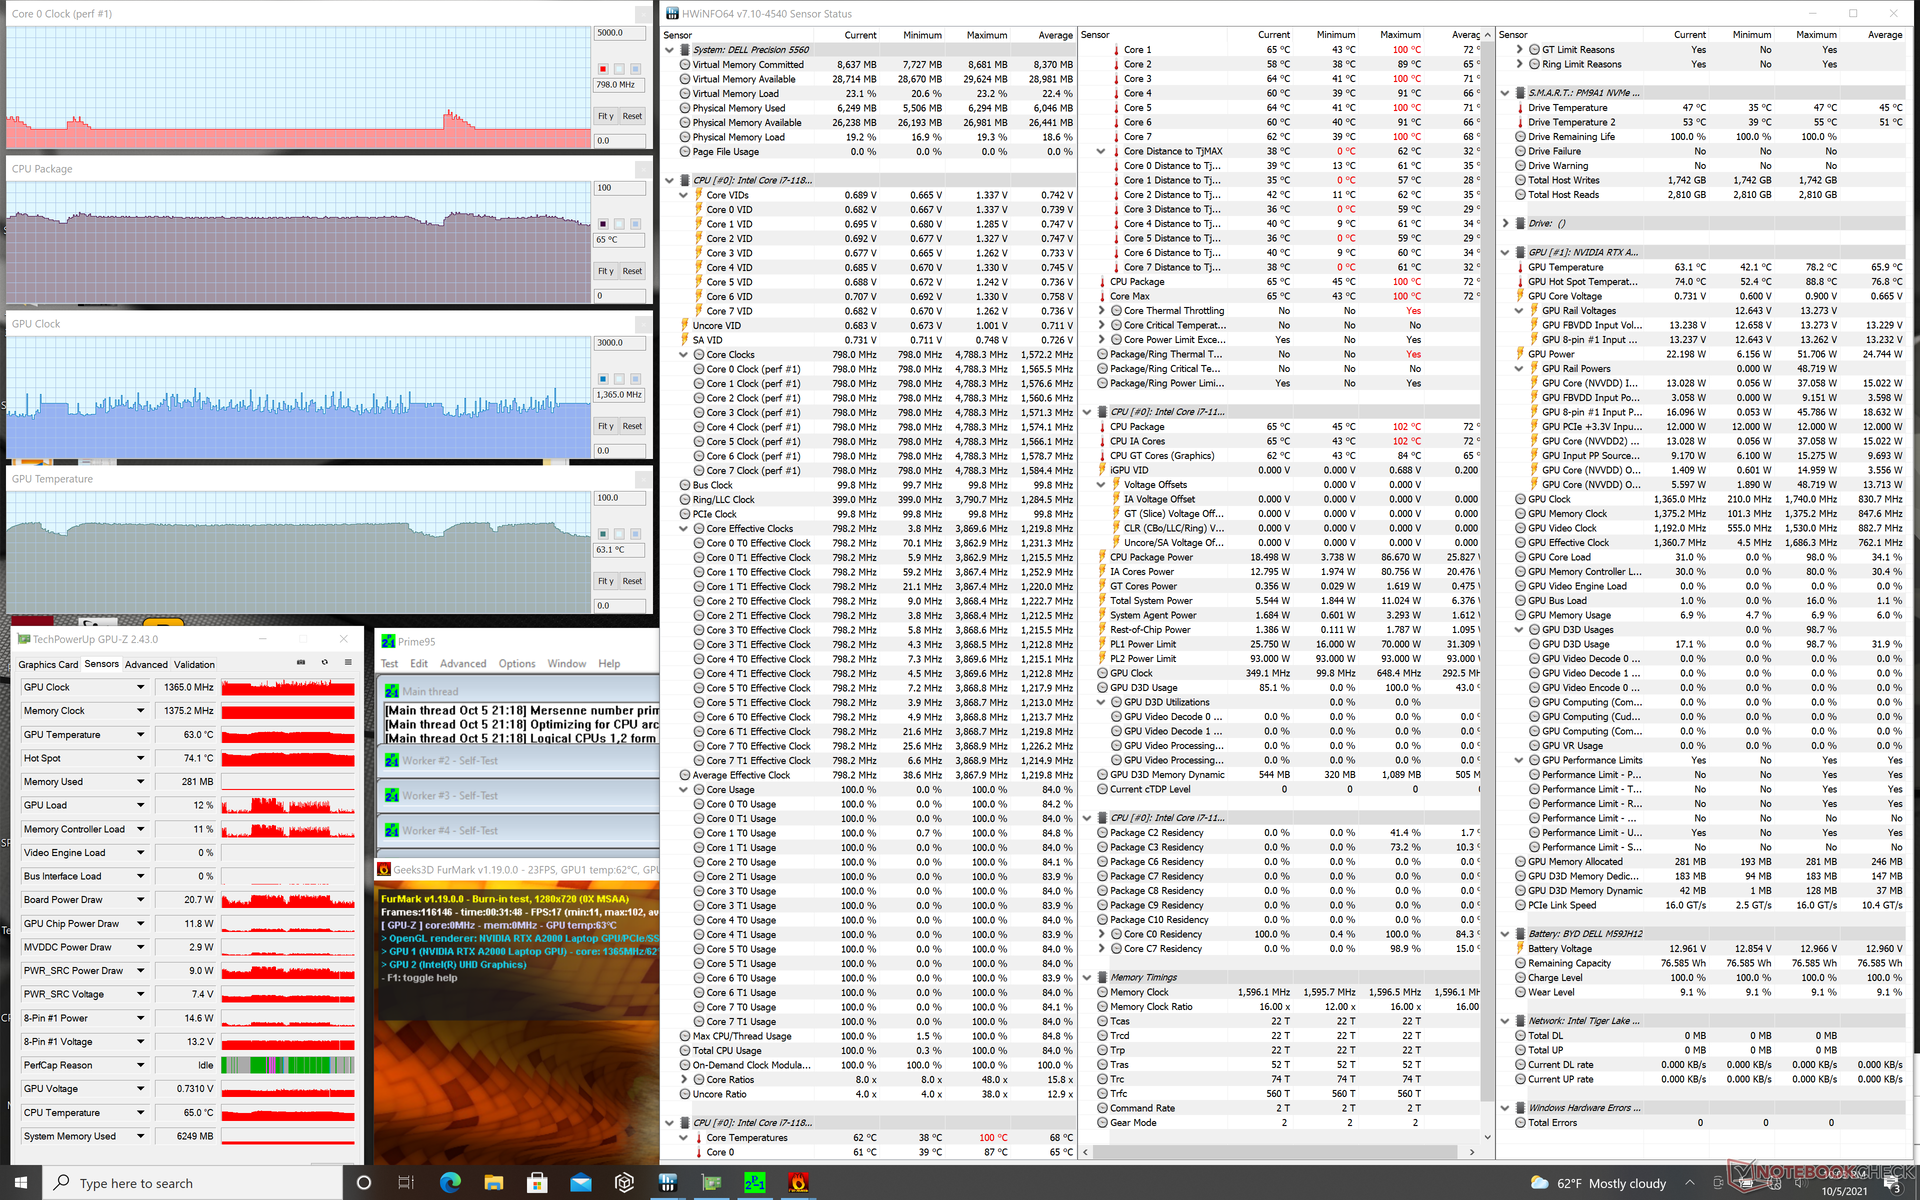
| Prime95+ FurMark Stress | 0.8 - 1.4 | 1000 - 1400 | 64 - 75 |
| Witcher 3 Stress | ~1.6 | 1462 | 69 |
Haut-parleurs

Dell Precision 5000 5560 analyse audio
(±) | le niveau sonore du haut-parleur est moyen mais bon (75.2# dB)
Basses 100 - 315 Hz
(±) | basse réduite - en moyenne 9.8% inférieure à la médiane
(±) | la linéarité des basses est moyenne (8.8% delta à la fréquence précédente)
Médiums 400 - 2000 Hz
(±) | médiane supérieure - en moyenne 5.7% supérieure à la médiane
(+) | les médiums sont linéaires (3.7% delta à la fréquence précédente)
Aiguës 2 - 16 kHz
(+) | des sommets équilibrés - à seulement 2.7% de la médiane
(+) | les aigus sont linéaires (6.4% delta à la fréquence précédente)
Globalement 100 - 16 000 Hz
(+) | le son global est linéaire (14.8% différence à la médiane)
Par rapport à la même classe
» 33% de tous les appareils testés de cette catégorie étaient meilleurs, 6% similaires, 61% pires
» Le meilleur avait un delta de 7%, la moyenne était de 17%, le pire était de 35%.
Par rapport à tous les appareils testés
» 20% de tous les appareils testés étaient meilleurs, 4% similaires, 76% pires
» Le meilleur avait un delta de 4%, la moyenne était de 24%, le pire était de 134%.
Apple MacBook 12 (Early 2016) 1.1 GHz analyse audio
(+) | les haut-parleurs peuvent jouer relativement fort (83.6# dB)
Basses 100 - 315 Hz
(±) | basse réduite - en moyenne 11.3% inférieure à la médiane
(±) | la linéarité des basses est moyenne (14.2% delta à la fréquence précédente)
Médiums 400 - 2000 Hz
(+) | médiane équilibrée - seulement 2.4% de la médiane
(+) | les médiums sont linéaires (5.5% delta à la fréquence précédente)
Aiguës 2 - 16 kHz
(+) | des sommets équilibrés - à seulement 2% de la médiane
(+) | les aigus sont linéaires (4.5% delta à la fréquence précédente)
Globalement 100 - 16 000 Hz
(+) | le son global est linéaire (10.2% différence à la médiane)
Par rapport à la même classe
» 7% de tous les appareils testés de cette catégorie étaient meilleurs, 2% similaires, 91% pires
» Le meilleur avait un delta de 5%, la moyenne était de 18%, le pire était de 53%.
Par rapport à tous les appareils testés
» 5% de tous les appareils testés étaient meilleurs, 1% similaires, 94% pires
» Le meilleur avait un delta de 4%, la moyenne était de 24%, le pire était de 134%.
Energy Management
Consommation d'énergie
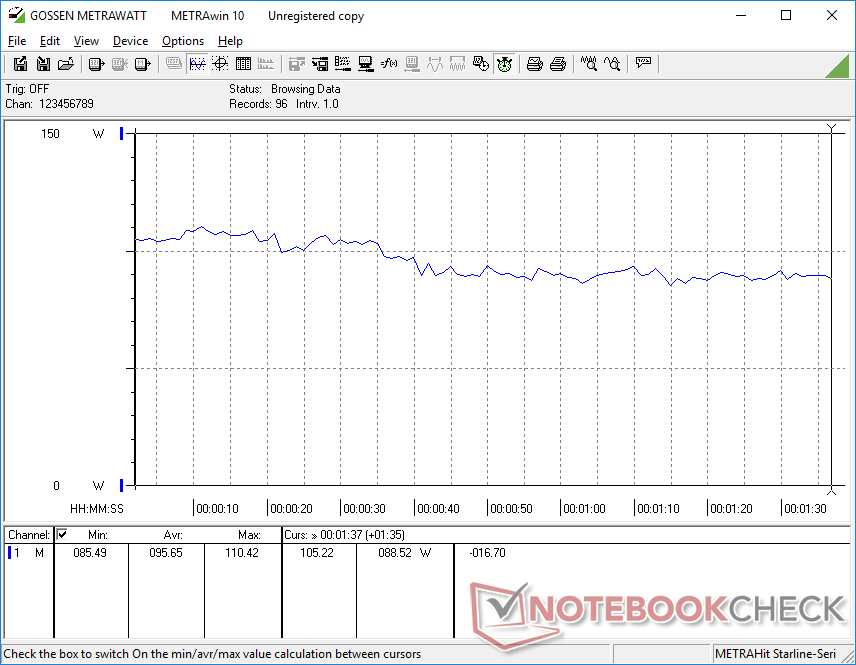
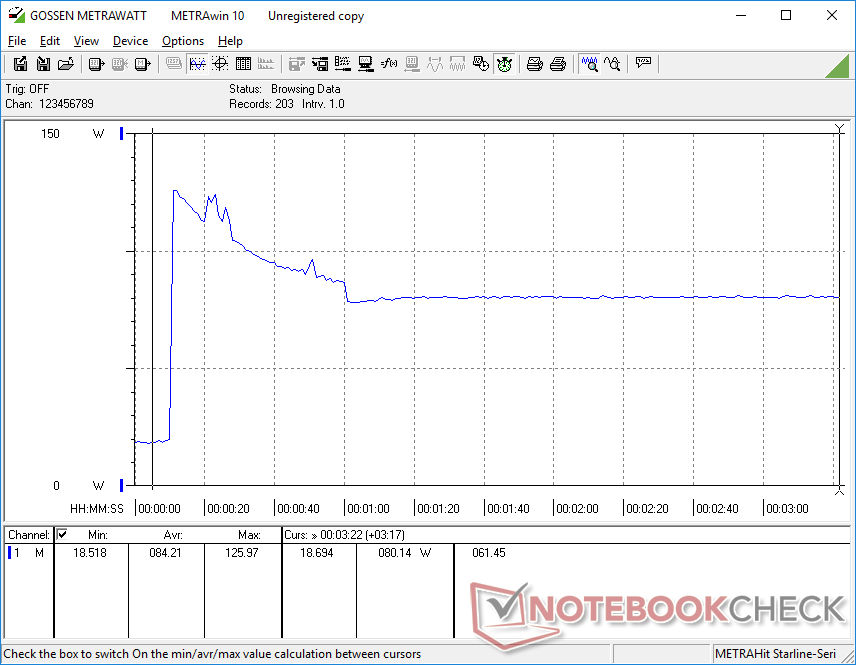
La consommation d'énergie est mitigée. Sous de faibles charges, notre appareil est plus gourmand en énergie que le Precision 5550 (6 W à 24 W contre 5 W à 19 W), ce qui a probablement contribué à la réduction de l'autonomie de la batterie dans notre prochaine section. D'autre part, la consommation d'énergie resterait presque la même que celle du Precision 5550 lors de l'exécution de charges plus élevées comme les jeux, même si notre CPU et notre GPU peuvent être jusqu'à 15 % et 50 % plus rapides que le Core i7-10875H et le Quadro T2000 Max-Q, respectivement. La performance par watt est donc plus élevée d'une année sur l'autre lors de l'exécution d'applications exigeantes.
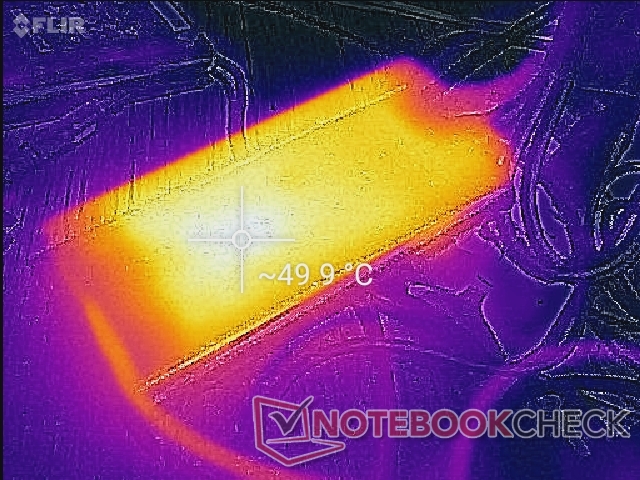
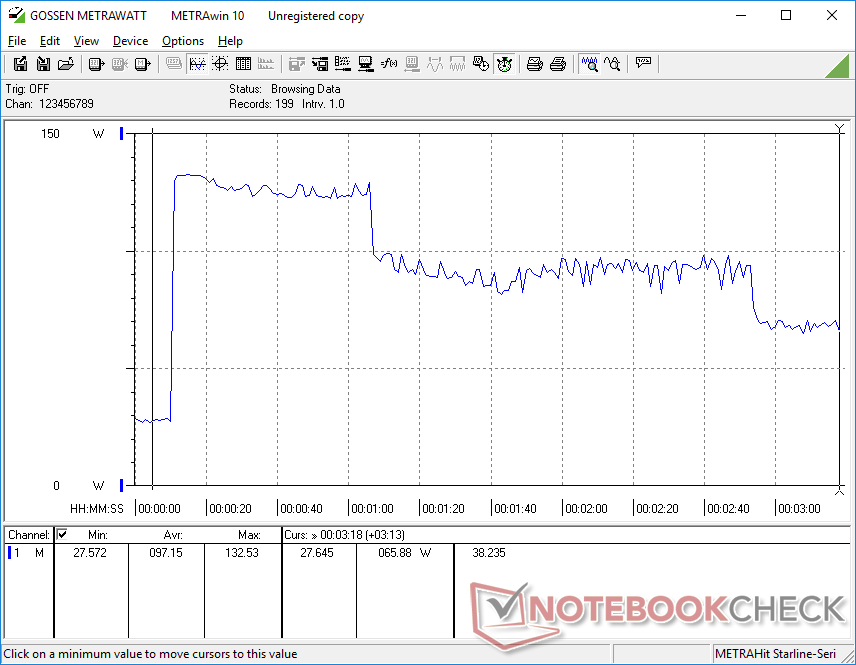
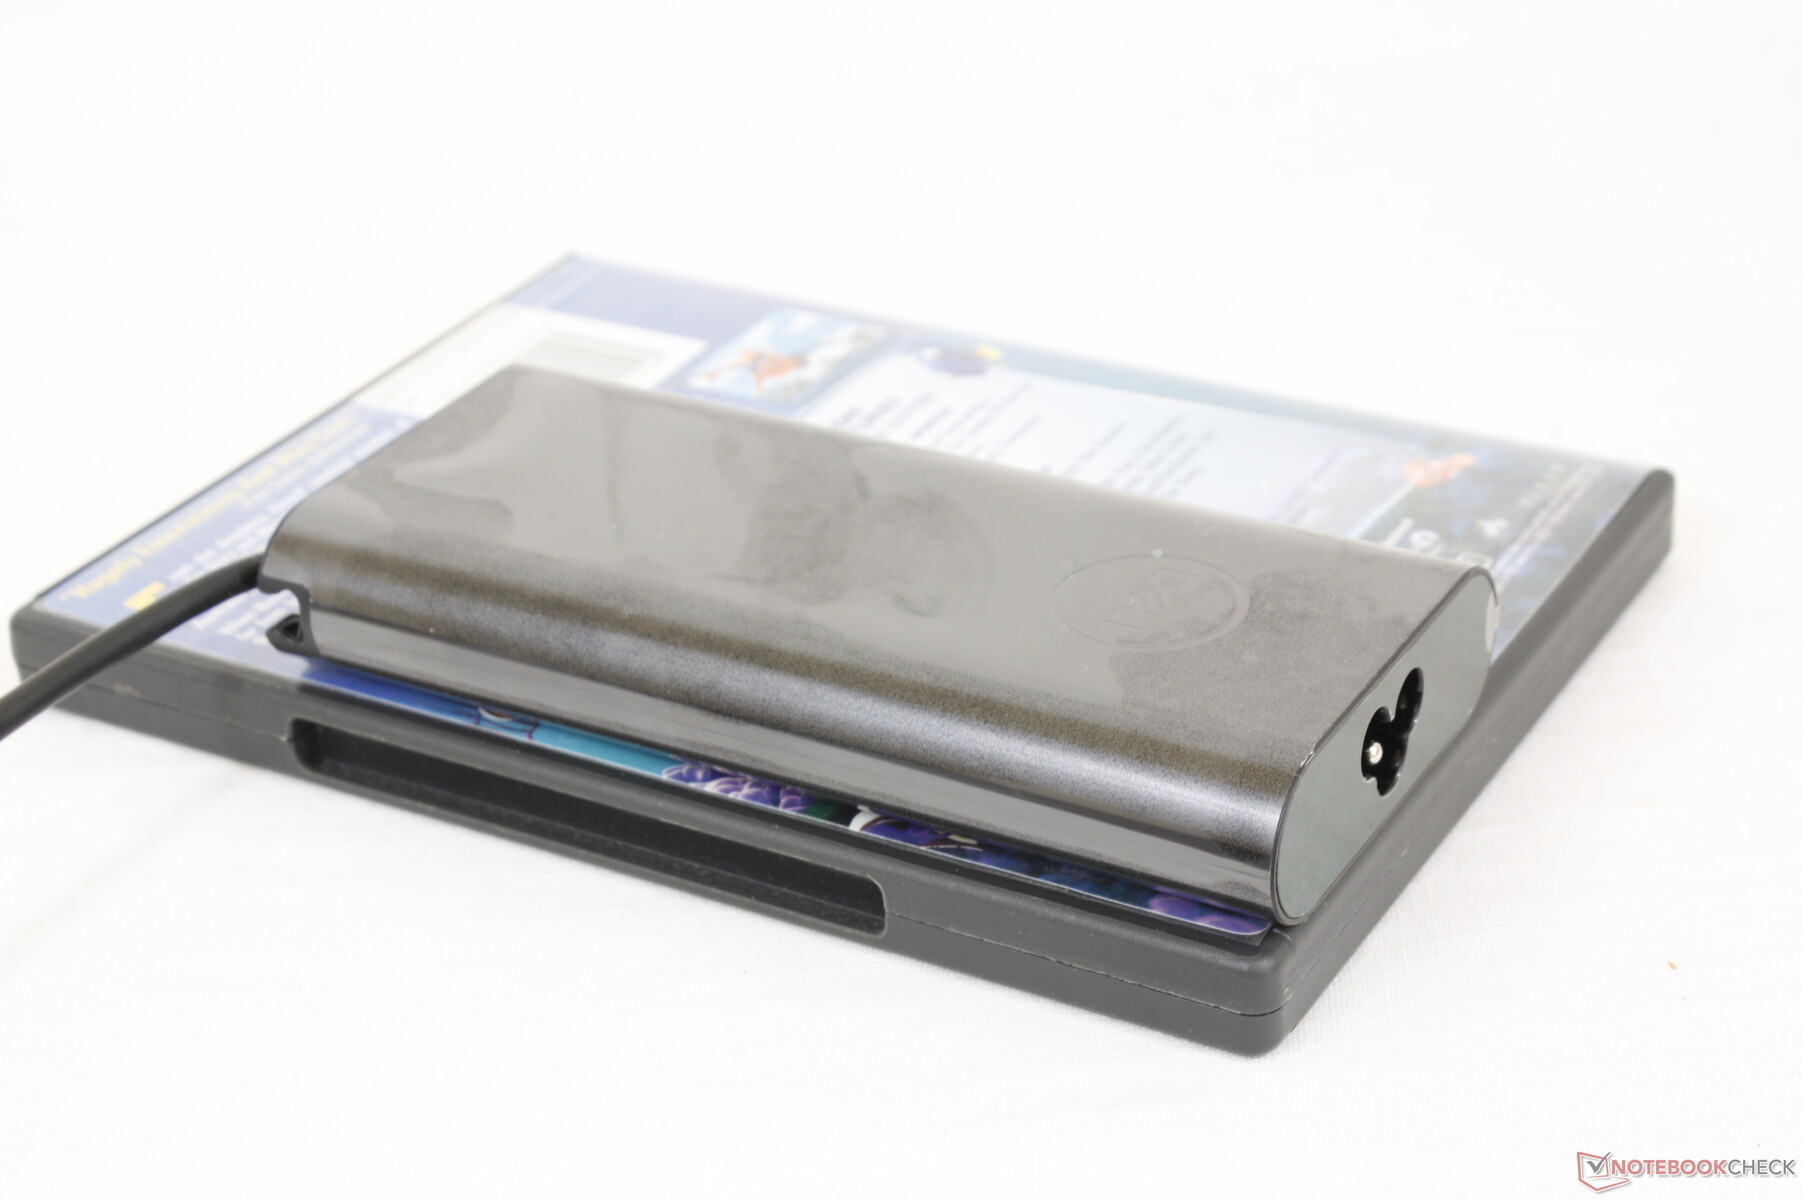
Nous sommes en mesure d'enregistrer une consommation maximale temporaire de 133 W à partir du petit adaptateur secteur USB-C 130 W (~14,3 x 6,5 x 2,2 cm). La consommation diminue avec le temps comme le montrent nos graphiques ci-dessous en raison des limitations thermiques. La batterie ne se vide pas lorsqu'elle est connectée au secteur, ce qui n'est pas le cas sur certains modèles précoces de Precision 5750.

| Éteint/en veille | |
| Au repos | |
| Fortement sollicité |
|
Légende:
min: | |
| Dell Precision 5000 5560 i7-11850H, RTX A2000 Laptop GPU, Samsung PM9A1 MZVL22T0HBLB, IPS, 3840x2400, 15.6" | Lenovo ThinkPad P15 G2-20YQ001JGE i7-11800H, RTX A3000 Laptop GPU, Kioxia XG7 KXG7AZNV512G, IPS, 1920x1080, 15.6" | HP ZBook Studio 15 G8 i9-11950H, GeForce RTX 3070 Laptop GPU, Samsung PM981a MZVLB2T0HALB, OLED, 3840x2160, 15.6" | Asus ProArt StudioBook Pro 15 W500G5T i7-9750H, Quadro RTX 5000 Max-Q, Samsung SSD PM981 MZVLB1T0HALR, IPS, 3840x2160, 15.6" | Dell Precision 7550 W-10885M, Quadro RTX 5000 Max-Q, SK Hynix PC601A NVMe 1TB, IPS, 3840x2160, 15.6" | Dell Precision 5550 P91F i7-10875H, Quadro T2000 Max-Q, SK Hynix PC601A NVMe 1TB, IPS, 3840x2400, 15.6" | Razer Blade 15 Studio Edition 2020 i7-10875H, Quadro RTX 5000 Max-Q, Samsung PM981a MZVLB1T0HBLR, OLED, 3840x2160, 15.6" | |
|---|---|---|---|---|---|---|---|
| Power Consumption | -11% | -43% | -30% | -38% | 7% | -44% | |
| Idle Minimum * (Watt) | 6.2 | 6.3 -2% | 11 -77% | 11.6 -87% | 8.2 -32% | 5.6 10% | 13.4 -116% |
| Idle Average * (Watt) | 13.9 | 10.7 23% | 18.8 -35% | 19 -37% | 16.8 -21% | 11.2 19% | 18 -29% |
| Idle Maximum * (Watt) | 23.8 | 11.6 51% | 31.7 -33% | 20.6 13% | 24.4 -3% | 18.4 23% | 26.1 -10% |
| Load Average * (Watt) | 95.7 | 99.3 -4% | 105.2 -10% | 102 -7% | 131 -37% | 114 -19% | 115 -20% |
| Witcher 3 ultra * (Watt) | 87 | 154 -77% | 148 -70% | 156.6 -80% | 76.7 12% | 145 -67% | |
| Load Maximum * (Watt) | 132.6 | 210 -58% | 171.8 -30% | 178 -34% | 201.8 -52% | 134.2 -1% | 165 -24% |
* ... Moindre est la valeur, meilleures sont les performances
Power Consumption Witcher 3 / Stresstest
Autonomie de la batterie
Les durées d'exécution sont généralement plus courtes que celles que nous avons enregistrées sur le Precision 5550 de l'année dernière. L'utilisation du WLAN dans le monde réel ne dure que 6,5 heures environ, contre 9 heures pour l'ancien modèle, même lorsque les deux appareils sont réglés sur des profils d'alimentation équilibrés identiques avec Optimus actif
La charge de la batterie vide à la pleine capacité prend environ 2 heures. Nous apprécions le fait que le système puisse être rechargé via l'un de ses trois ports USB-C alors que certains ordinateurs portables ne prennent en charge la charge que sur un seul port USB-C. Ce même chargeur Dell peut également être utilisé pour charger les ordinateurs portables modernes XPS.
| Dell Precision 5000 5560 i7-11850H, RTX A2000 Laptop GPU, 86 Wh | Lenovo ThinkPad P15 G2-20YQ001JGE i7-11800H, RTX A3000 Laptop GPU, 94 Wh | HP ZBook Studio 15 G8 i9-11950H, GeForce RTX 3070 Laptop GPU, 83 Wh | Asus ProArt StudioBook Pro 15 W500G5T i7-9750H, Quadro RTX 5000 Max-Q, 76 Wh | Dell Precision 7550 W-10885M, Quadro RTX 5000 Max-Q, 95 Wh | Dell Precision 5550 P91F i7-10875H, Quadro T2000 Max-Q, 86 Wh | Razer Blade 15 Studio Edition 2020 i7-10875H, Quadro RTX 5000 Max-Q, 80 Wh | |
|---|---|---|---|---|---|---|---|
| Autonomie de la batterie | 15% | 2% | -25% | -3% | 36% | -9% | |
| Reader / Idle (h) | 12 | 12.9 8% | 11.1 -7% | 22.6 88% | 8.8 -27% | ||
| WiFi v1.3 (h) | 6.3 | 9.9 57% | 6.2 -2% | 4.7 -25% | 8.9 41% | 9 43% | 5.7 -10% |
| Load (h) | 1.8 | 1.3 -28% | 1.8 0% | 1 -44% | 1.4 -22% | 2 11% |
Points positifs
Points négatifs
Verdict - Même apparence, graphismes beaucoup plus rapides
Pourquoi acheter le Precision 5560 alors qu'il est visuellement identique au Precision 5550? Le saut en puissance du GPU sera la principale raison de considérer le nouveau modèle plutôt que l'ancien. La Quadro RTX A2000 de Nvidia a une génération d'avance sur la Quadro T2000 Max-Q et offre des performances de GPU jusqu'à 50 % plus rapides pour un coût minimal en termes de consommation d'énergie, d'autonomie de la batterie, de poids, de température de surface et même de bruit du ventilateur. Les gains en performance par watt contribuent à eux seuls à rendre le système plus rapide que son profil ultra-mince ne le laisserait supposer. Les utilisateurs bénéficieront également d'une augmentation des performances du processeur, mais dans des proportions bien moindres.
Une augmentation considérable de la puissance du GPU par rapport au Precision 5550. Cependant, si la Quadro RTX A2000 ne vous intéresse pas, vous pouvez vous tourner vers le modèle visuellement identique de l'année dernière.
Pour une raison quelconque, notre Precision 5560 ne peut pas atteindre le même plafond de bruit de ventilateur maximal que celui que nous avons connu sur le 5550. Cela pourrait avoir été fait exprès par le fabricant pour tenter de réduire le bruit du ventilateur, mais cela a un impact sur les températures centrales.
Les utilisateurs qui savent qu'ils peuvent bénéficier de l'augmentation de la puissance graphique voudront sauter le 5550 de Precision pour le 5560. Sinon, le 5550 peut offrir une expérience utilisateur identique en termes de caractéristiques physiques et d'affichage. Des concurrents comme le MSI WS66, Razer Blade 15 Studioou le Lenovo ThinkPad P15 G2 sont légèrement plus épais, mais ils embarquent des GPU encore plus rapides de la Quadro RTX A3000 et plus, qui ne sont pas disponibles sur la série Precision 5000.
Prix et disponibilité
Dell Precision 5000 5560
- 10/06/2021 v7 (old)
Allen Ngo
Price comparison

