Test du Lenovo IdeaPad Gaming 3 15IAH7 : l'un des plus puissants PC portables RTX 3050 Ti

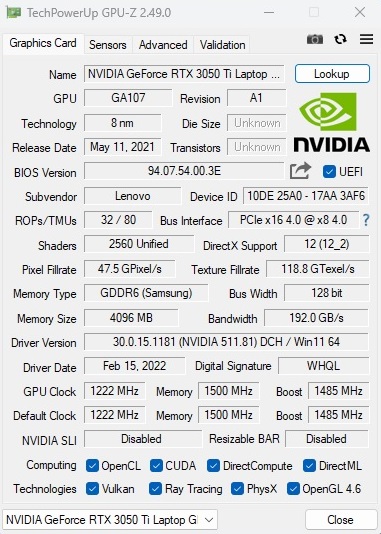
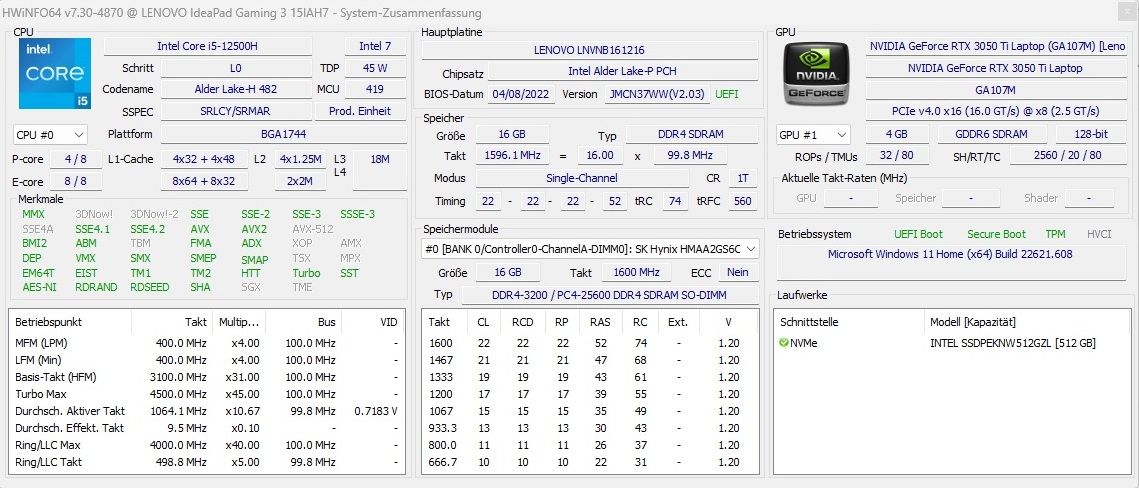
Bien que divers ordinateurs portables de jeu soient disponibles dans la gamme de prix autour de 1 000 euros (~978 $), la plupart d'entre eux renoncent à un écran avec une luminosité décente et une solide couverture de l'espace colorimétrique. Cependant, de temps en temps, nous pouvons trouver une exception positive comme l'IdeaPad Gaming 3 15IAH7 que nous avons testé, qui offre un Core i5-12500H, aGeForce RTX 3050 Ti, 16 Go de RAM DDR4 (malheureusement uniquement en mode monocanal), et un SSD NVMe de 512 Go. L'écran IPS de 15,6 pouces a un taux de rafraîchissement de 165 Hz, promettant de bons temps de réponse, et une résolution de 1920 x 1080 pixels.
Les concurrents de l'IdeaPad Gaming 3 15IAH7 comprennent d'autres ordinateurs portables équipés de la RTX 3050 Ti tels que le HP Victus 16-e0145ngleDell G15 5515et le Dell Inspiron 16 Plus 7620. Nous incluons également le modèle frère 15ARH7 (Ryzen 5 6600H & RTX 3050) dans nos tableaux à titre de comparaison.
Comparaison avec les concurrents potentiels
Note | Date | Modèle | Poids | Épaisseur | Taille | Résolution | Prix |
|---|---|---|---|---|---|---|---|
| 82.8 % v7 (old) | 10/22 | Lenovo IdeaPad Gaming 3 15IAH7 i5-12500H, GeForce RTX 3050 Ti Laptop GPU | 2.4 kg | 26 mm | 15.60" | 1920x1080 | |
| 80.8 % v7 (old) | 09/22 | Lenovo IdeaPad Gaming 3 15ARH7 R5 6600H, GeForce RTX 3050 4GB Laptop GPU | 2.4 kg | 21.8 mm | 15.60" | 1920x1080 | |
| 82.7 % v7 (old) | 10/21 | Dell G15 5515 R7 5800H, GeForce RTX 3050 Ti Laptop GPU | 2.4 kg | 24.9 mm | 15.60" | 1920x1080 | |
| 82.3 % v7 (old) | 05/22 | HP Victus 16-e0145ng R5 5600H, GeForce RTX 3050 Ti Laptop GPU | 2.4 kg | 23.5 mm | 16.10" | 1920x1080 | |
| 87.4 % v7 (old) | 08/22 | Dell Inspiron 16 Plus 7620 i7-12700H, GeForce RTX 3050 Ti Laptop GPU | 2.1 kg | 18.99 mm | 16.00" | 3072x1920 |
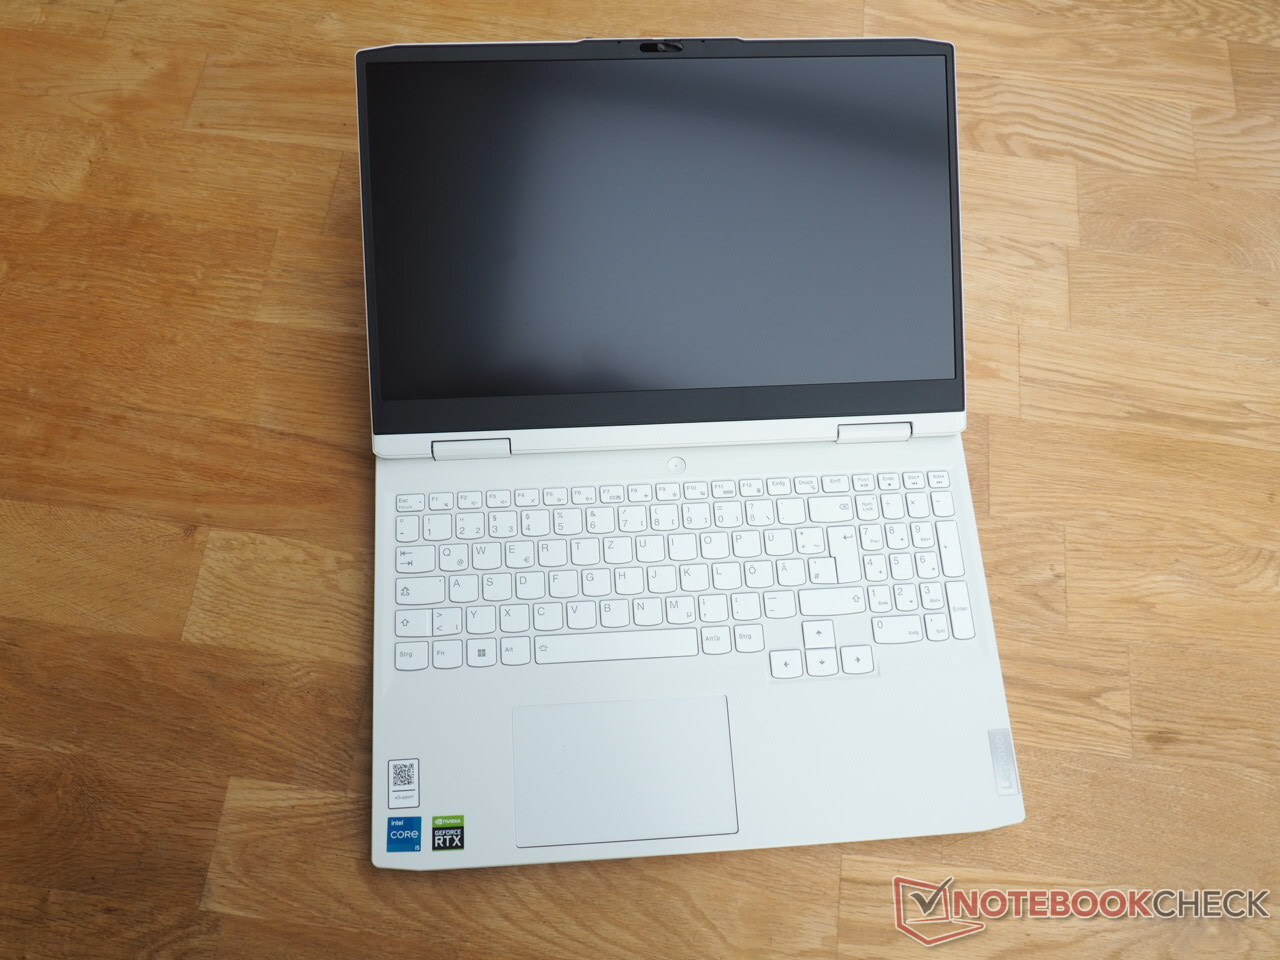
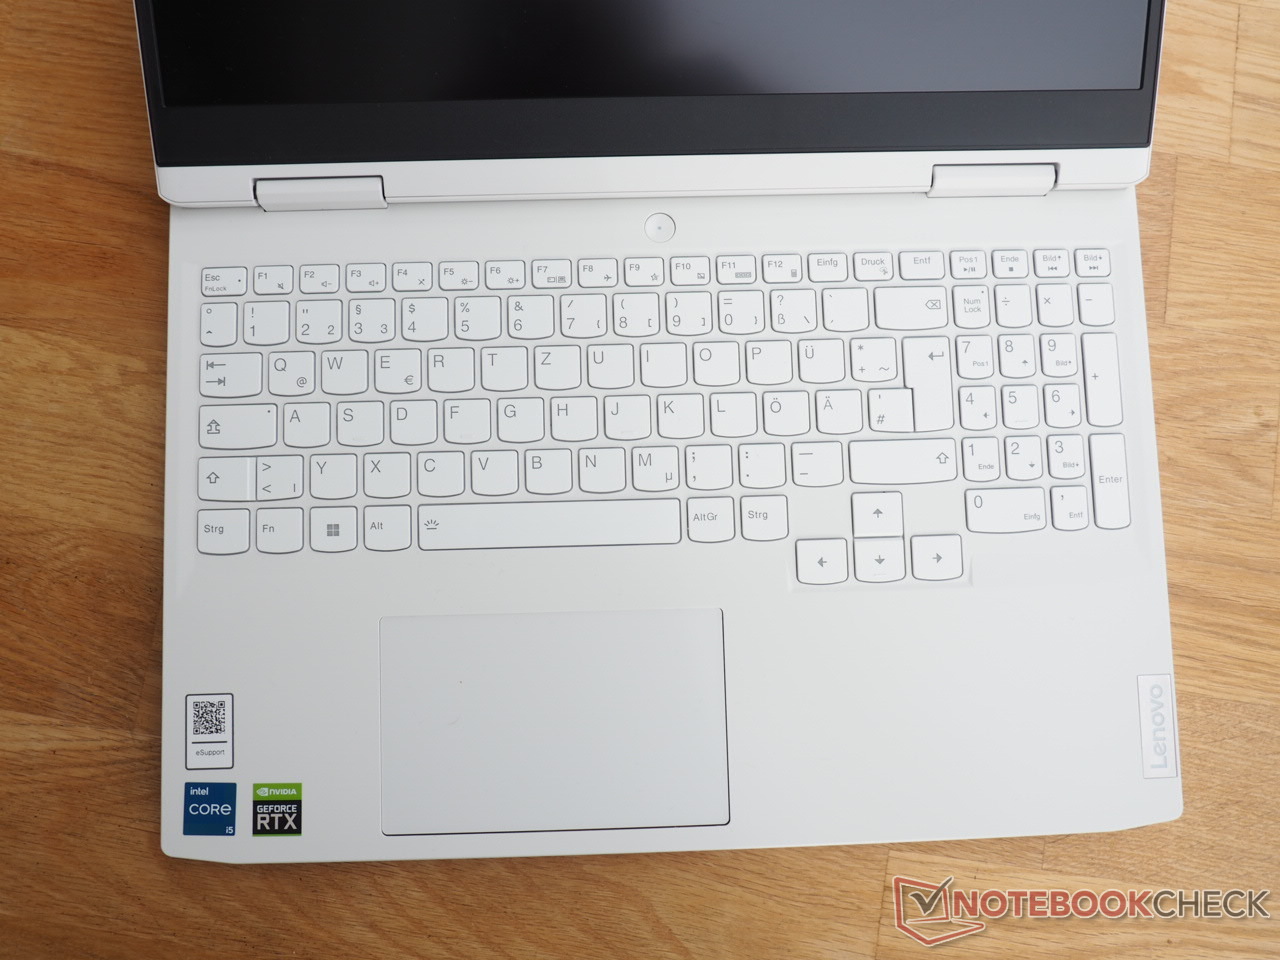
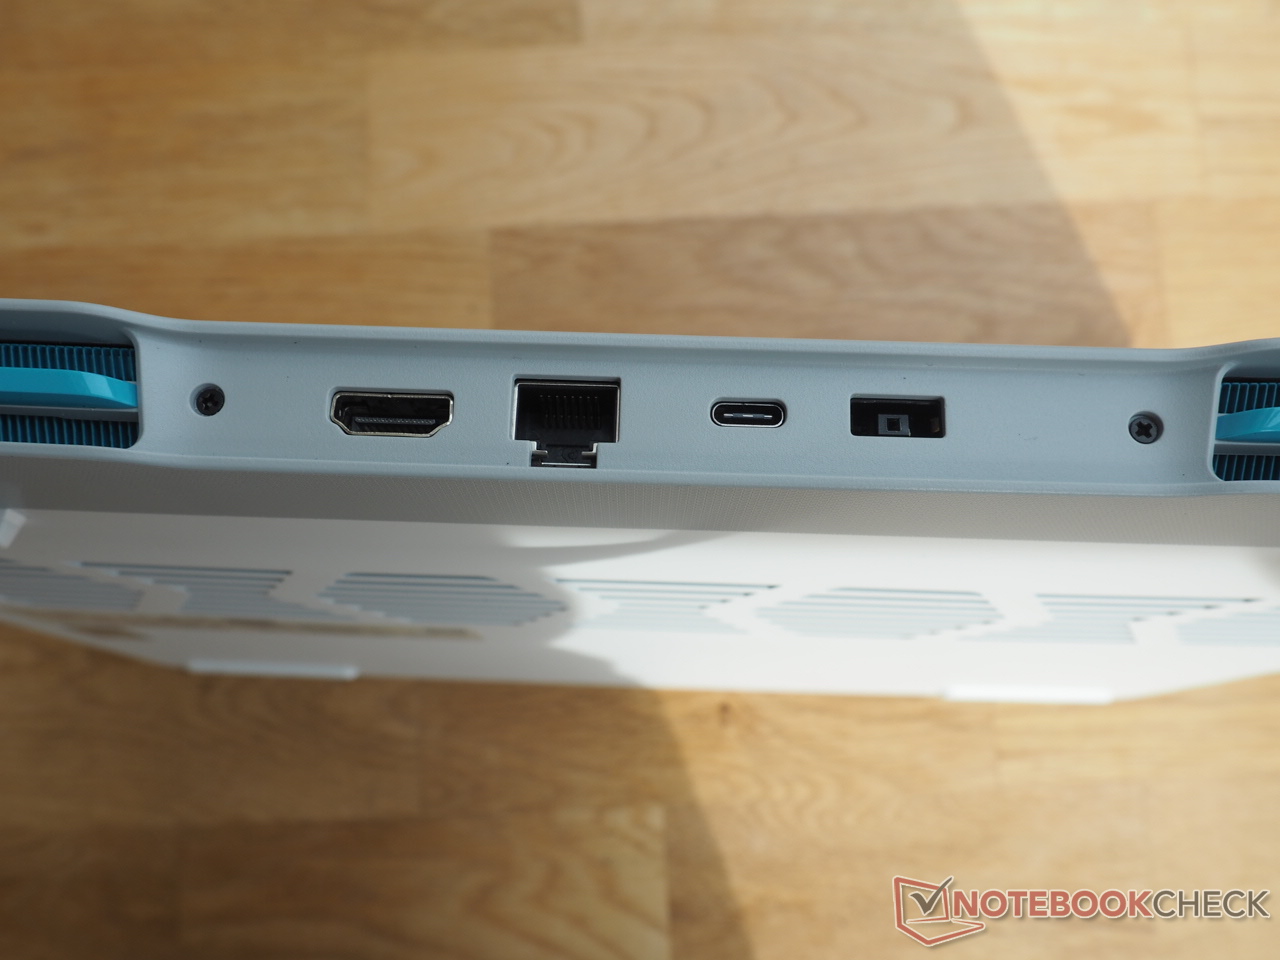
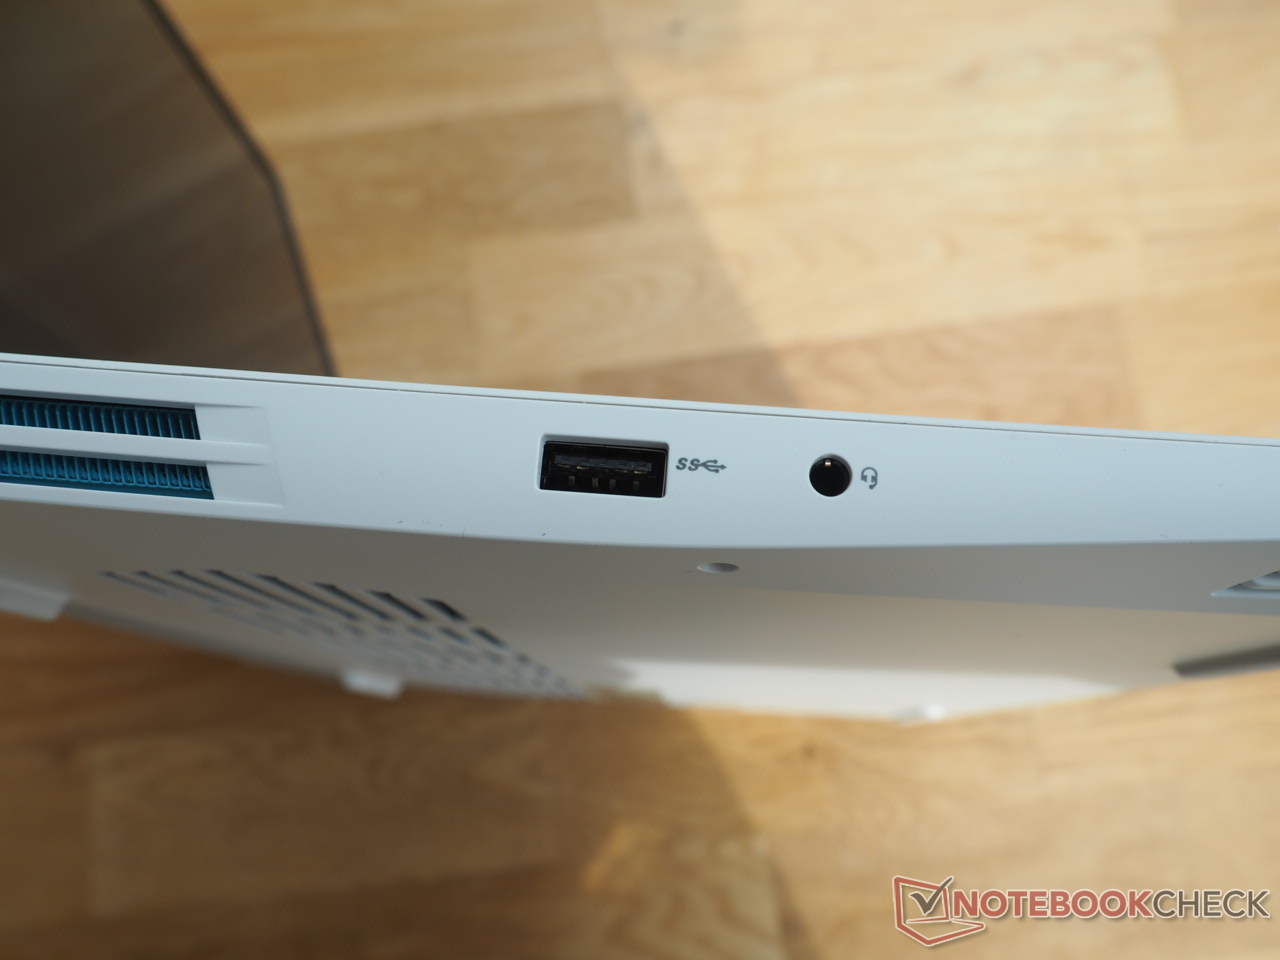
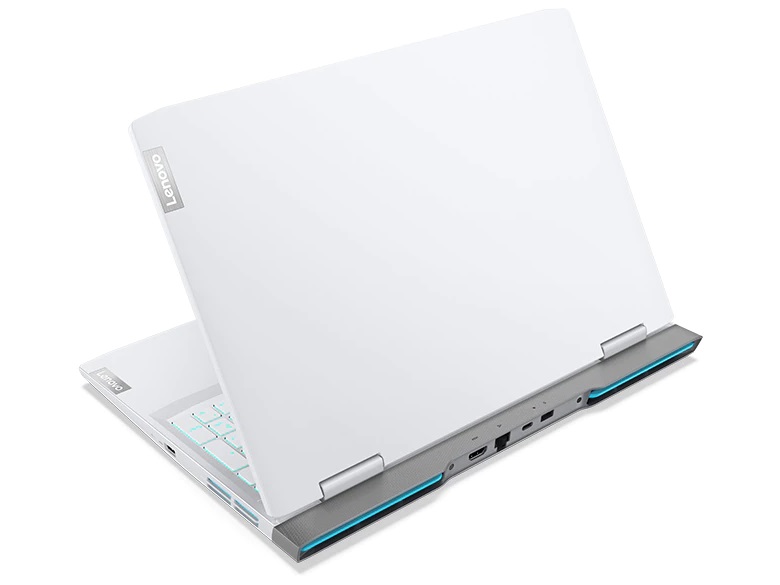
Étant donné qu'à l'exception de la couleur (Glacier White au lieu de Onyx Grey) et de la disposition du clavier (allemand au lieu de US), le boîtier est identique au modèle frère mentionné ci-dessus, nous ne discuterons pas davantage du boîtier, de l'équipement et des périphériques d'entrée ici. Vous pouvez trouver les informations correspondantes dans la revue du modèle frère.

Webcam


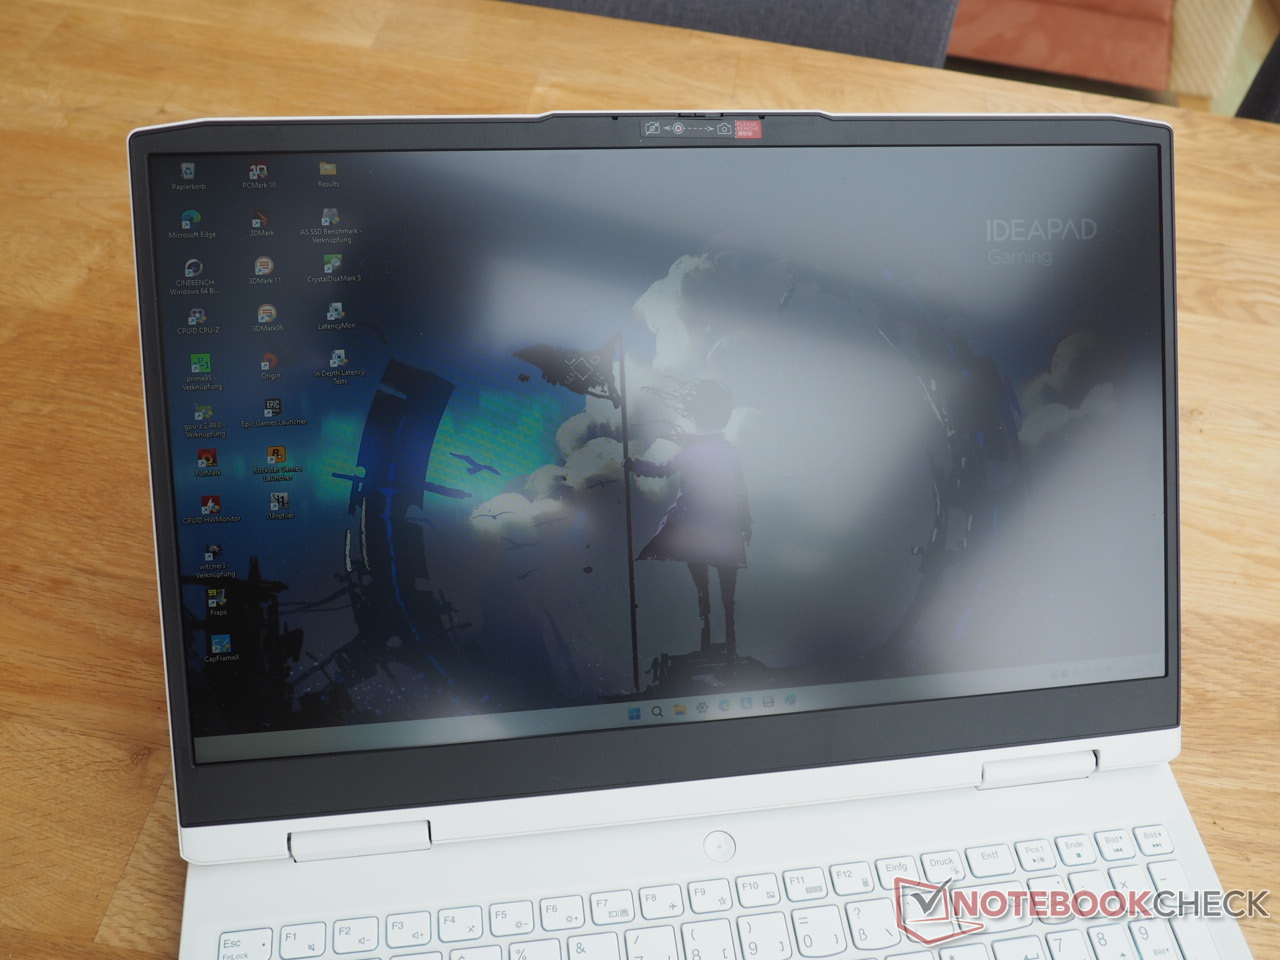
Afficher
En examinant le champ de comparaison, vous pouvez facilement constater que les ordinateurs portables de jeu abordables sont souvent dotés d'un maigre écran.
| |||||||||||||||||||||||||
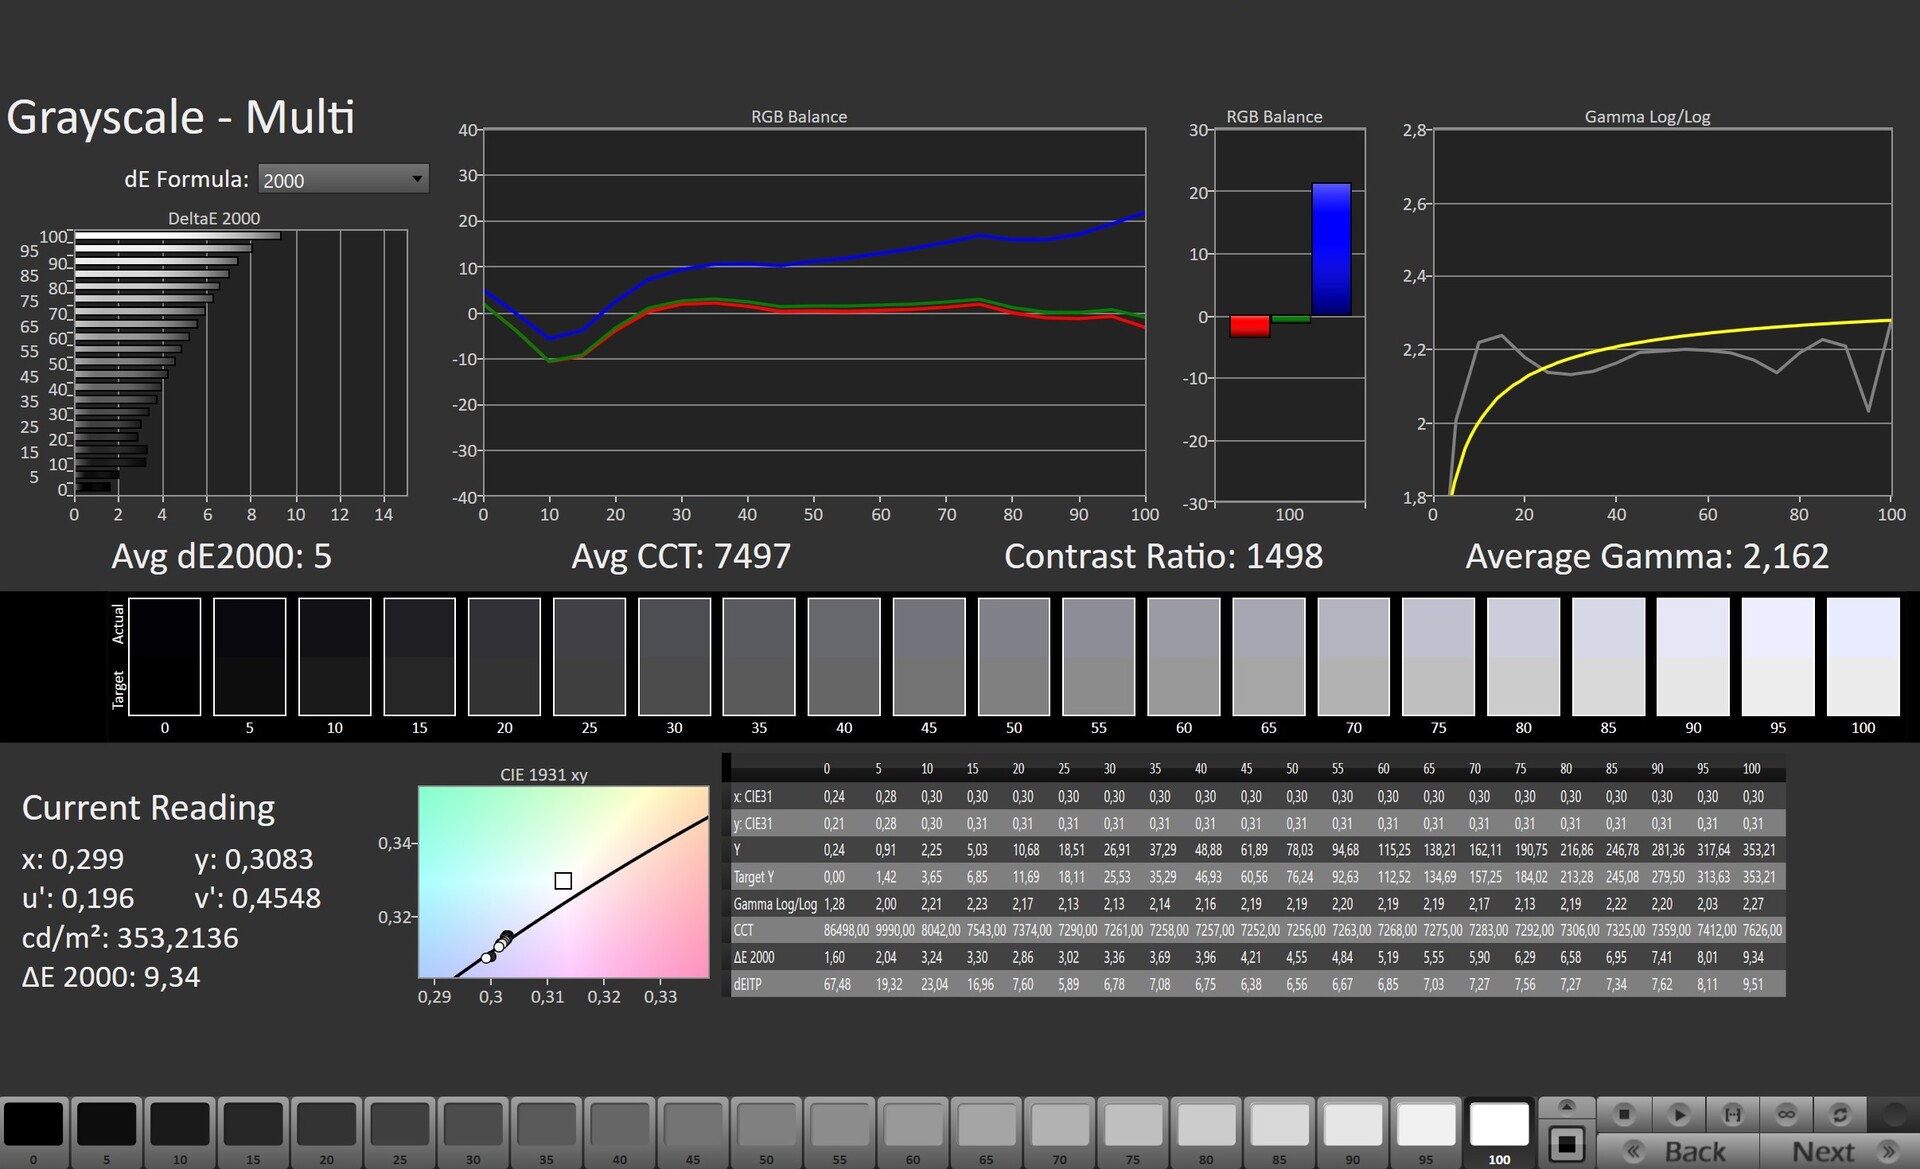
Homogénéité de la luminosité: 92 %
Valeur mesurée au centre, sur batterie: 338 cd/m²
Contraste: 1252:1 (Valeurs des noirs: 0.27 cd/m²)
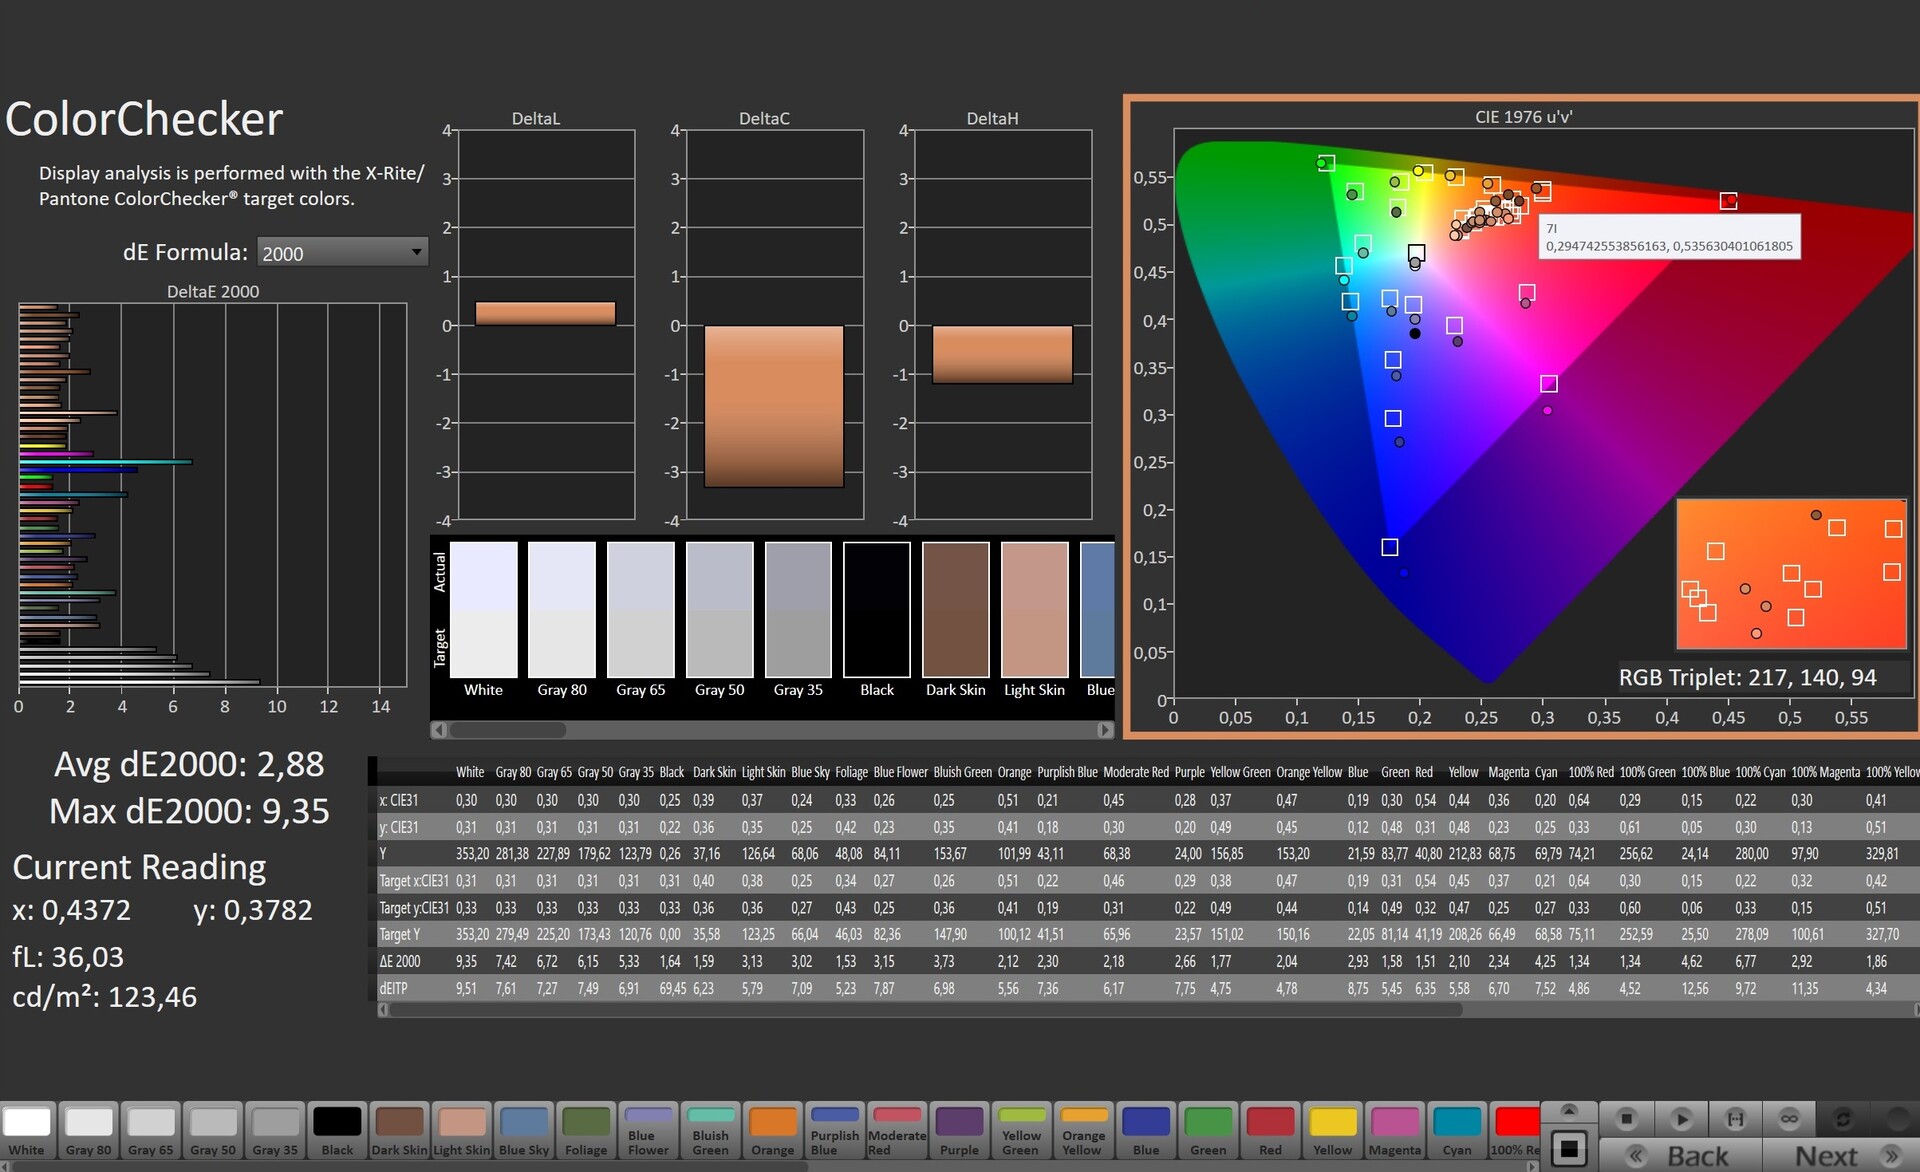
ΔE ColorChecker Calman: 2.88 | ∀{0.5-29.43 Ø4.72}
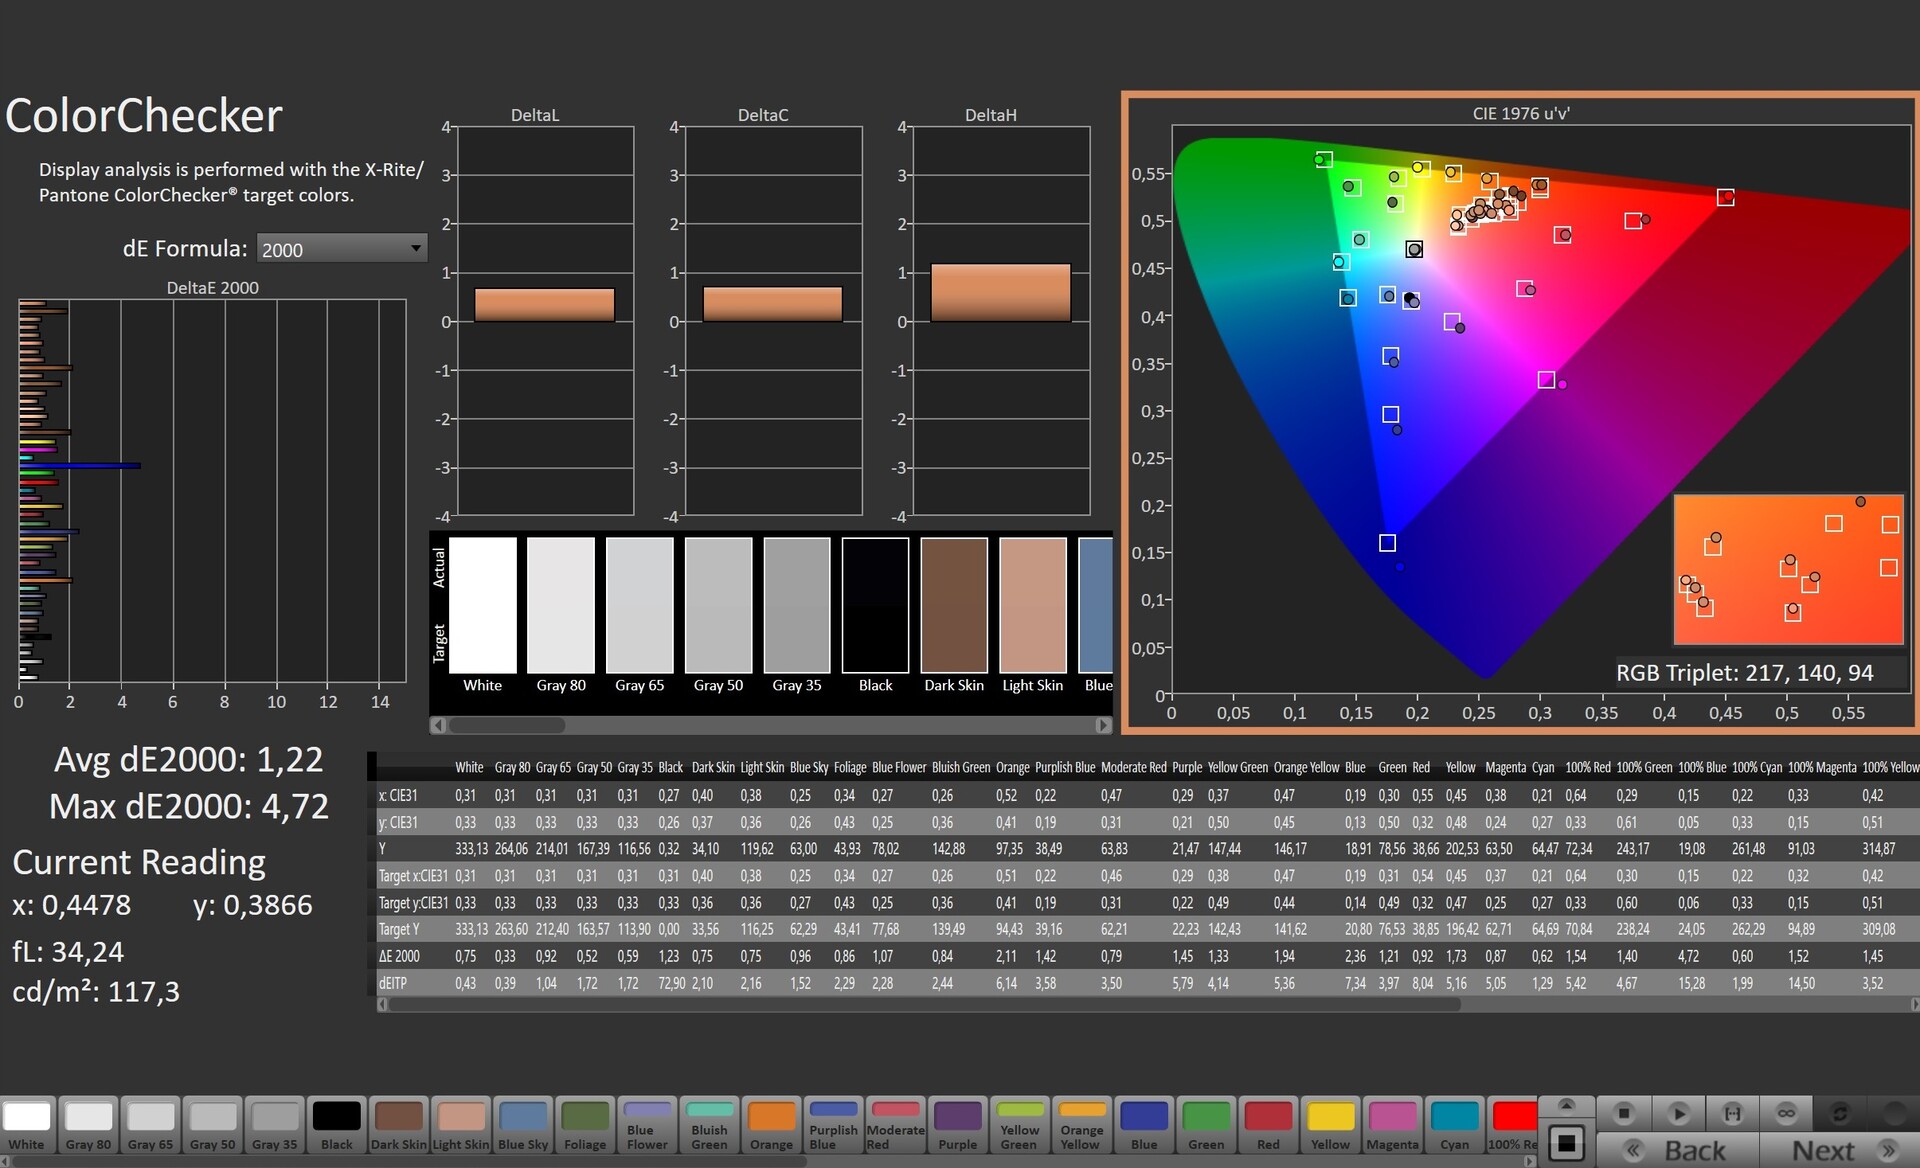
calibrated: 1.22
ΔE Greyscale Calman: 5 | ∀{0.09-98 Ø4.97}
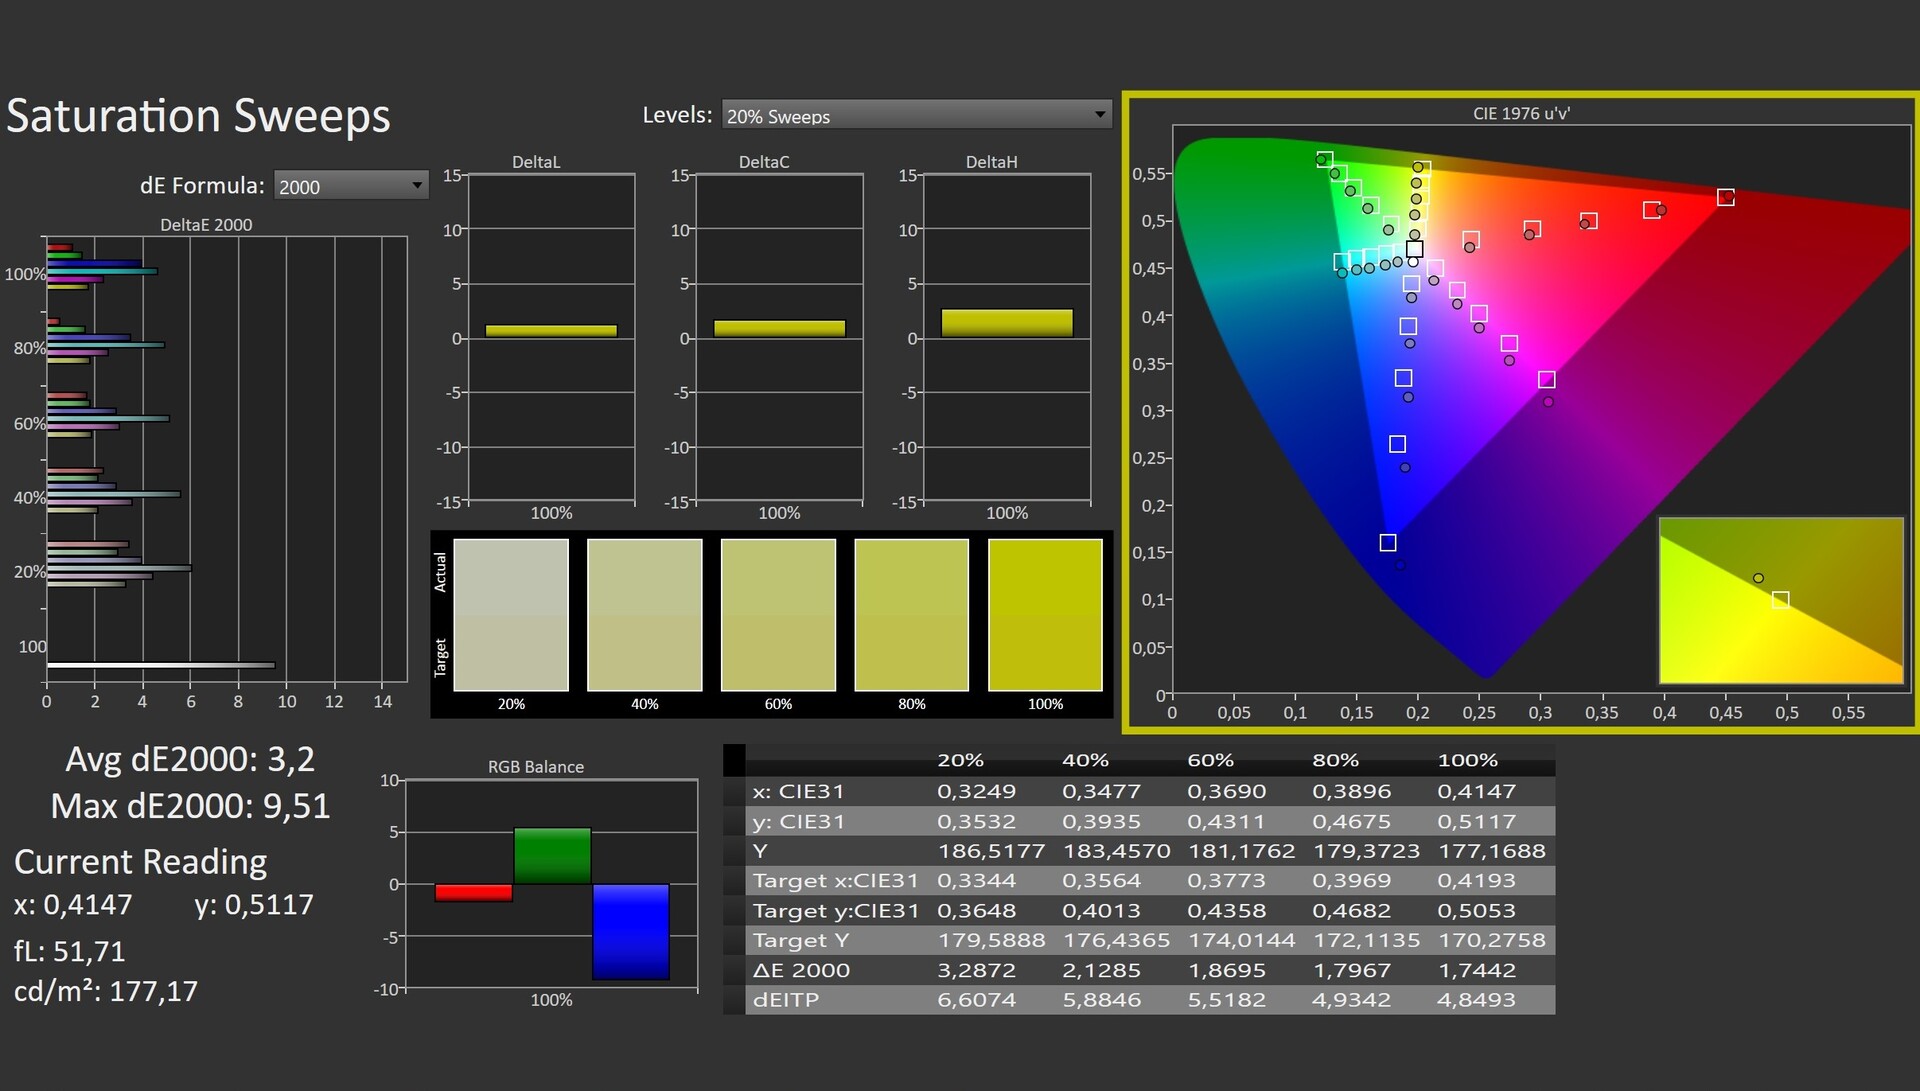
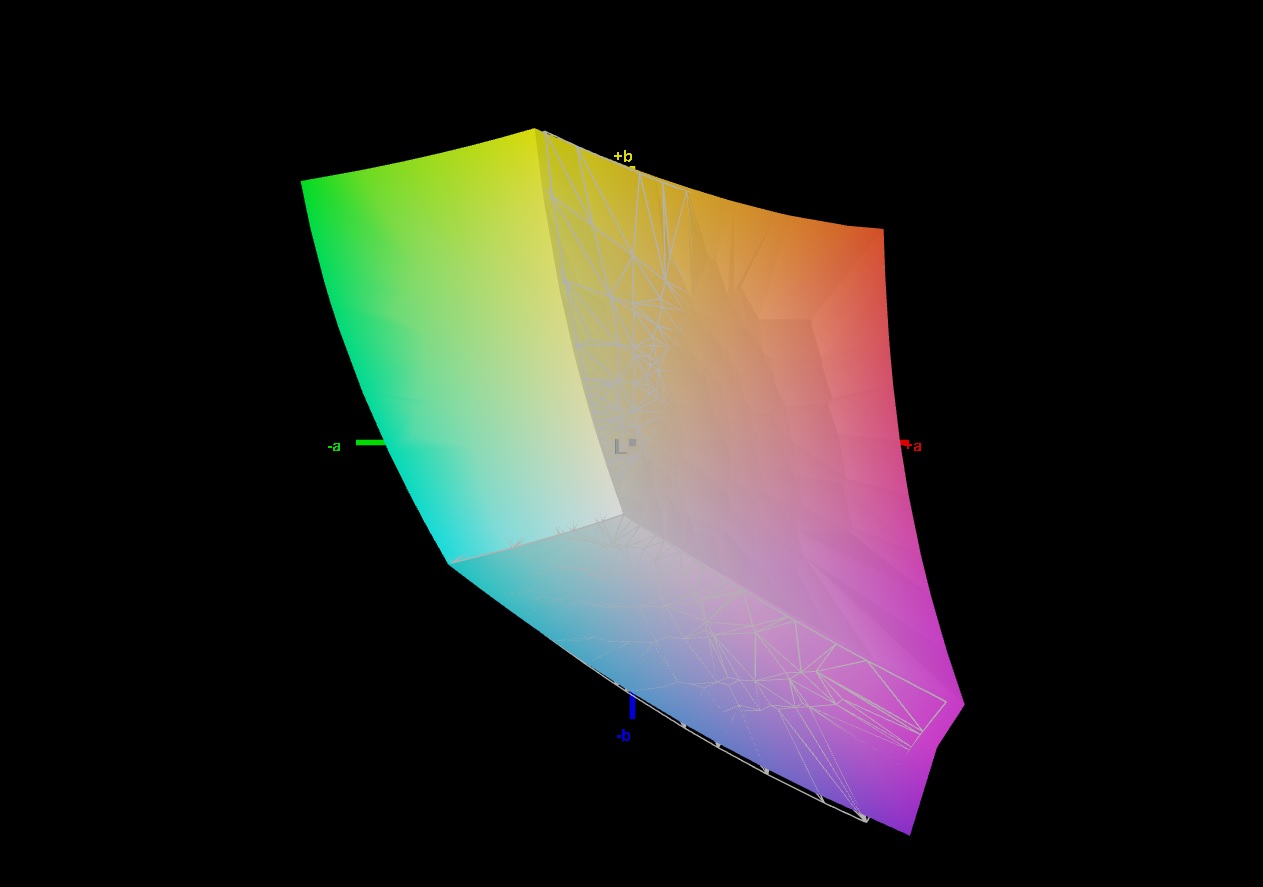
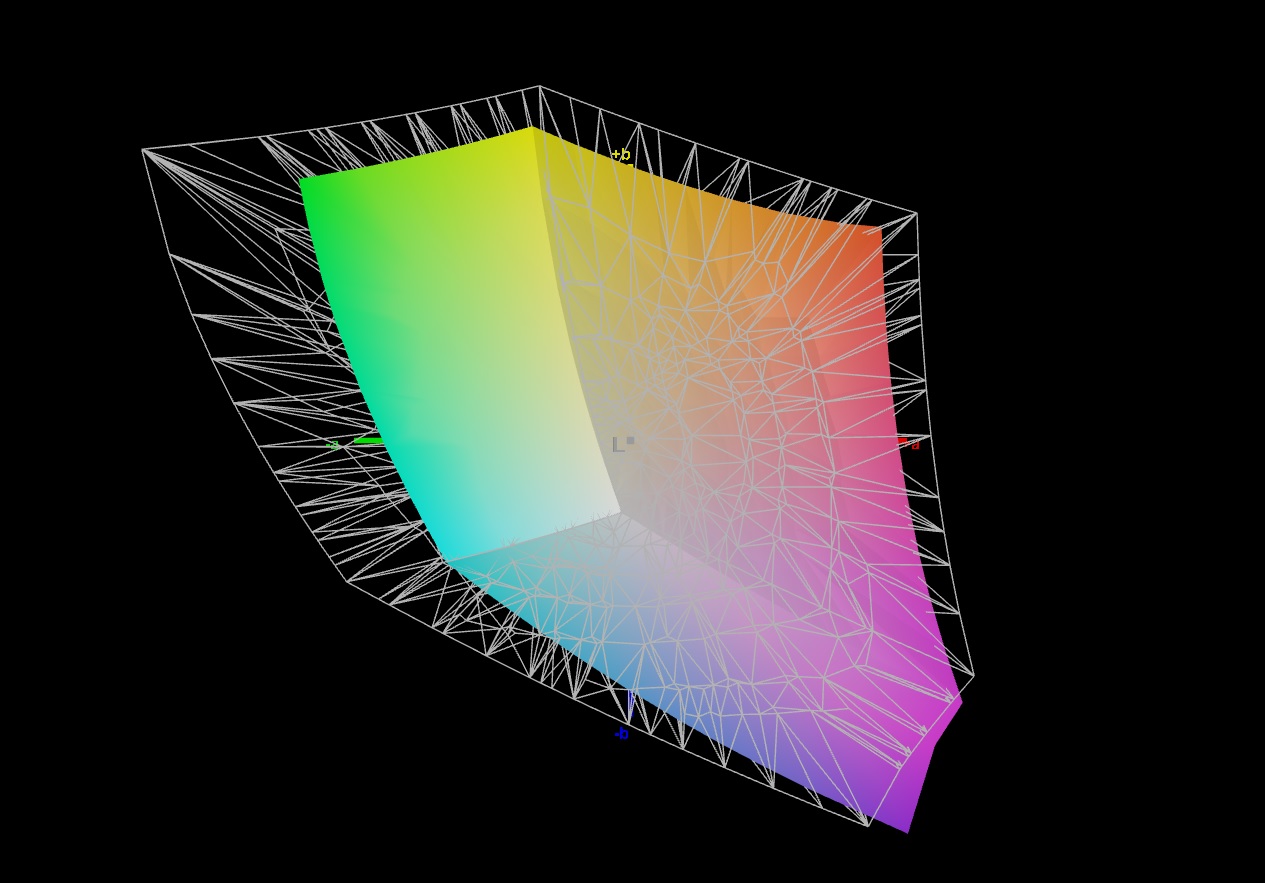
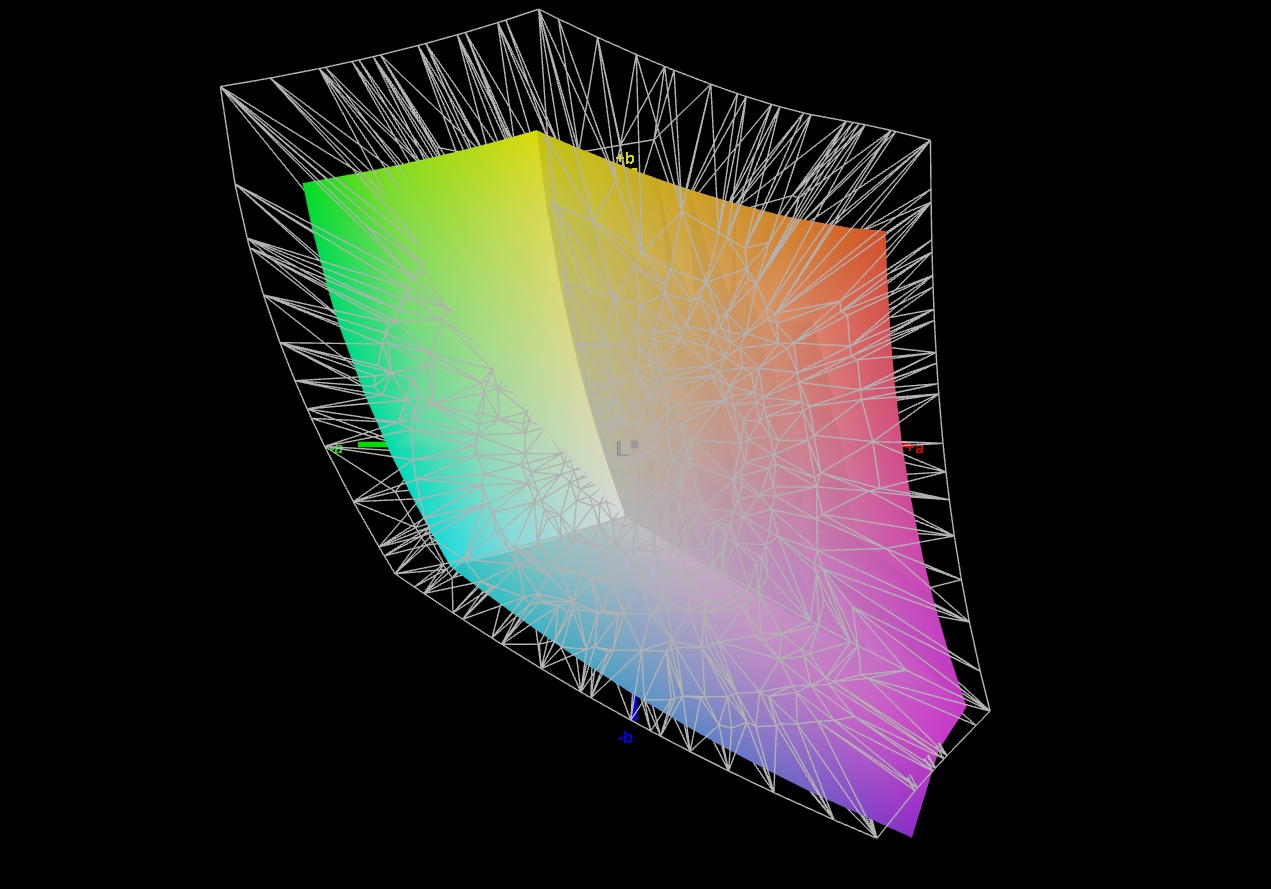
69.9% AdobeRGB 1998 (Argyll 3D)
99.2% sRGB (Argyll 3D)
69.1% Display P3 (Argyll 3D)
Gamma: 2.162
CCT: 7497 K
| Lenovo IdeaPad Gaming 3 15IAH7 Lenovo LEN156FHD, IPS, 1920x1080, 15.6" | Lenovo IdeaPad Gaming 3 15ARH7 LEN156FHD, IPS, 1920x1080, 15.6" | Dell G15 5515 BOE092A, IPS, 1920x1080, 15.6" | HP Victus 16-e0145ng CMN1609, IPS, 1920x1080, 16.1" | Dell Inspiron 16 Plus 7620 BOE NE16N41, IPS, 3072x1920, 16" | |
|---|---|---|---|---|---|
| Display | -42% | -43% | -39% | 2% | |
| Display P3 Coverage (%) | 69.1 | 39.4 -43% | 39.1 -43% | 41.6 -40% | 70.8 2% |
| sRGB Coverage (%) | 99.2 | 58 -42% | 56.9 -43% | 61.9 -38% | 99.5 0% |
| AdobeRGB 1998 Coverage (%) | 69.9 | 40.7 -42% | 40.4 -42% | 43 -38% | 73.2 5% |
| Response Times | -90% | -97% | -130% | -213% | |
| Response Time Grey 50% / Grey 80% * (ms) | 13 ? | 20.8 ? -60% | 25.2 ? -94% | 29.6 ? -128% | 38 ? -192% |
| Response Time Black / White * (ms) | 8.4 ? | 18.4 ? -119% | 16.8 ? -100% | 19.4 ? -131% | 28 ? -233% |
| PWM Frequency (Hz) | 200 ? | ||||
| Screen | -45% | -64% | -66% | 21% | |
| Brightness middle (cd/m²) | 338 | 287.8 -15% | 278 -18% | 257 -24% | 288.9 -15% |
| Brightness (cd/m²) | 329 | 268 -19% | 262 -20% | 239 -27% | 276 -16% |
| Brightness Distribution (%) | 92 | 86 -7% | 83 -10% | 88 -4% | 92 0% |
| Black Level * (cd/m²) | 0.27 | 0.3 -11% | 0.36 -33% | 0.25 7% | 0.26 4% |
| Contrast (:1) | 1252 | 959 -23% | 772 -38% | 1028 -18% | 1111 -11% |
| Colorchecker dE 2000 * | 2.88 | 6.3 -119% | 5.74 -99% | 6.91 -140% | 1.88 35% |
| Colorchecker dE 2000 max. * | 9.35 | 21.32 -128% | 19.63 -110% | 22.27 -138% | 4.37 53% |
| Colorchecker dE 2000 calibrated * | 1.22 | 2.53 -107% | 4.7 -285% | 3.61 -196% | 0.42 66% |
| Greyscale dE 2000 * | 5 | 4 20% | 3.1 38% | 7.5 -50% | 1.4 72% |
| Gamma | 2.162 102% | 2.21 100% | 2.011 109% | 2.125 104% | 2.3 96% |
| CCT | 7497 87% | 6762 96% | 6207 105% | 6025 108% | 6634 98% |
| Moyenne finale (programmes/paramètres) | -59% /
-51% | -68% /
-64% | -78% /
-69% | -63% /
-16% |
* ... Moindre est la valeur, meilleures sont les performances
Les petits espaces colorimétriques et une faible luminosité sont très répandus dans le segment des 1 000 euros. Mais ce n'est pas le cas de l'IdeaPad Gaming 15 15IAH7 : une couverture sRGB d'environ 100 % et une luminosité moyenne de 329 cd/m² rendent justice au prix de l'ordinateur portable.

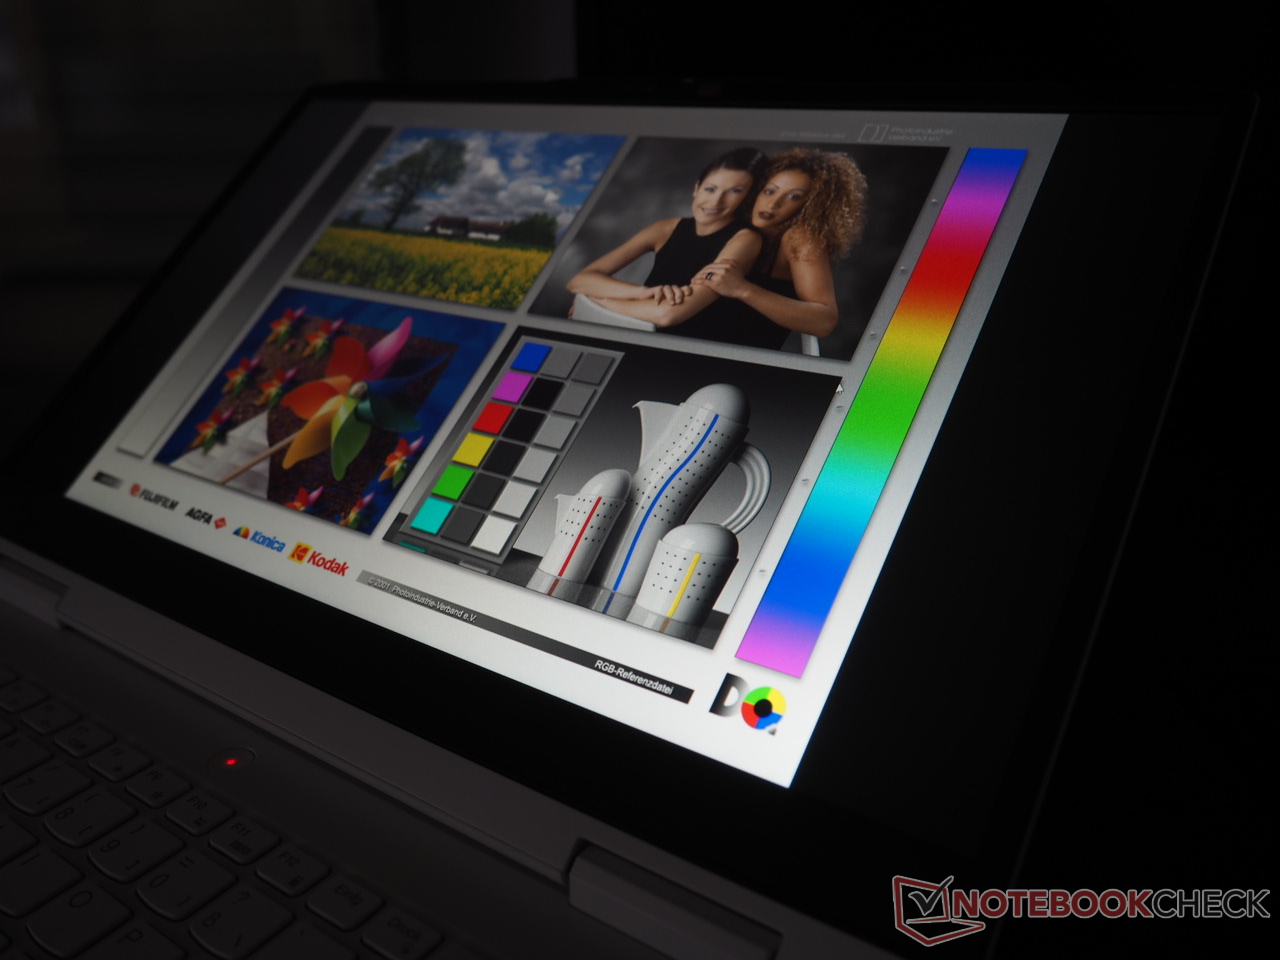
L'ordinateur portable de 15 pouces fait également bonne figure dans les autres disciplines. Un temps de réponse de 8 à 13 ms est assurément une bonne valeur. Il en va de même pour le contraste de 1252:1, qui est également supérieur à la moyenne.
La seule chose dont on pourrait se plaindre est la précision des couleurs. Dans l'état de livraison, le panneau 165-Hz a une nette teinte bleue. Cependant, cela peut être corrigé avec un calibrage (notre fichier ICC est lié pour un téléchargement gratuit en haut à droite, à côté du graphique de distribution de la luminosité). Notre unité de test ne montre aucun saignement d'écran ou scintillement PWM.
Temps de réponse de l'écran
| ↔ Temps de réponse noir à blanc | ||
|---|---|---|
| 8.4 ms ... hausse ↗ et chute ↘ combinées | ↗ 4.2 ms hausse | 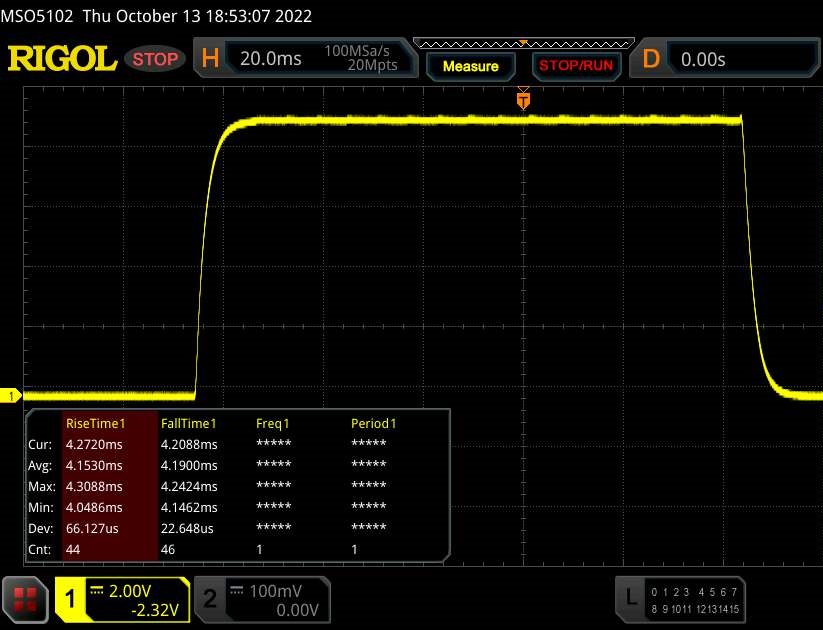 |
| ↘ 4.2 ms chute | ||
| L'écran montre de faibles temps de réponse, un bon écran pour jouer. En comparaison, tous les appareils testés affichent entre 0.1 (minimum) et 240 (maximum) ms. » 24 % des appareils testés affichent de meilleures performances. Cela signifie que les latences relevées sont meilleures que la moyenne (19.9 ms) de tous les appareils testés. | ||
| ↔ Temps de réponse gris 50% à gris 80% | ||
| 13 ms ... hausse ↗ et chute ↘ combinées | ↗ 6.3 ms hausse | 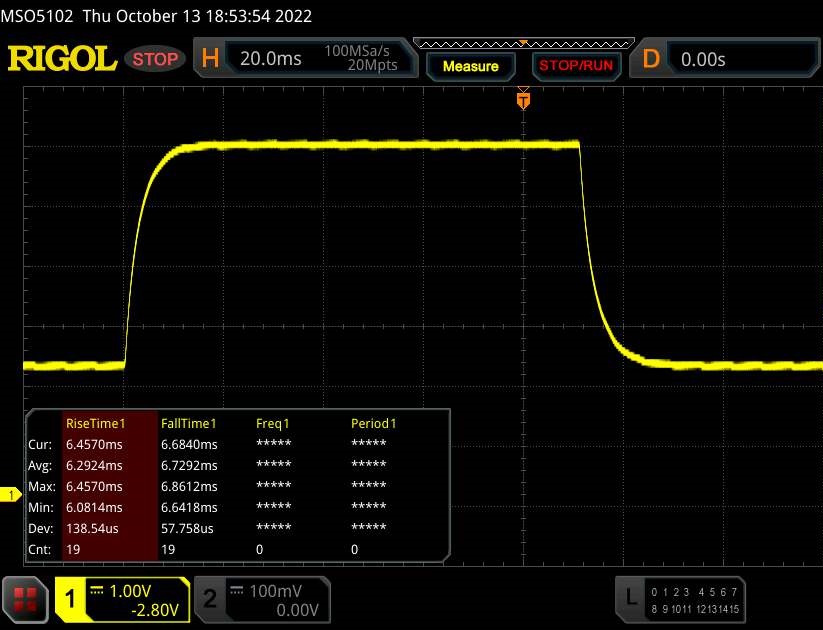 |
| ↘ 6.7 ms chute | ||
| L'écran montre de bons temps de réponse, mais insuffisant pour du jeu compétitif. En comparaison, tous les appareils testés affichent entre 0.165 (minimum) et 636 (maximum) ms. » 26 % des appareils testés affichent de meilleures performances. Cela signifie que les latences relevées sont meilleures que la moyenne (31.1 ms) de tous les appareils testés. | ||
Scintillement / MLI (Modulation de largeur d'impulsion)
| Scintillement / MLI (Modulation de largeur d'impulsion) non décelé | 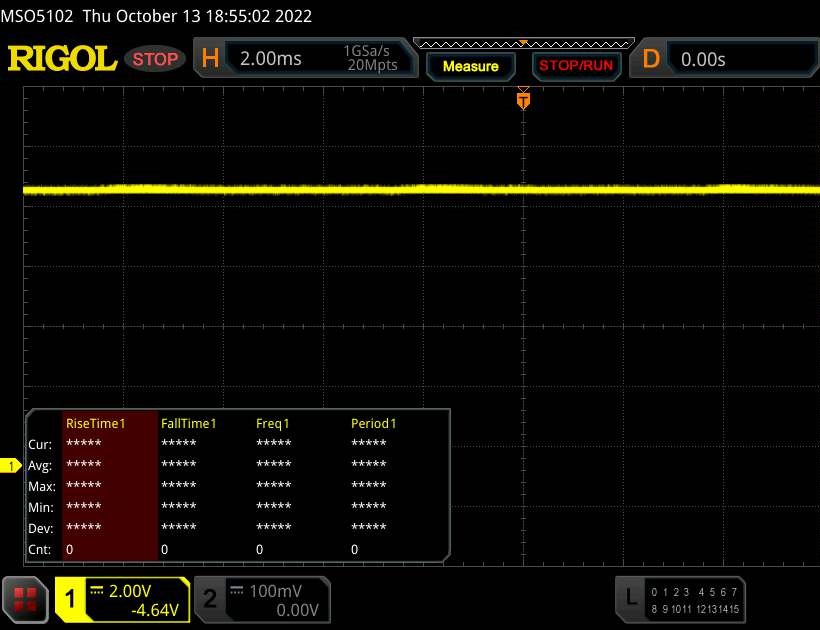 | ||
En comparaison, 52 % des appareils testés n'emploient pas MDI pour assombrir leur écran. Nous avons relevé une moyenne à 7784 (minimum : 5 - maximum : 343500) Hz dans le cas où une MDI était active. | |||
Performance
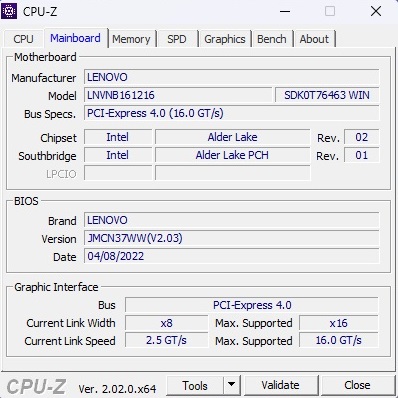
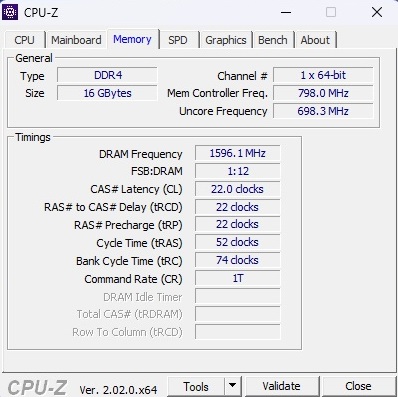
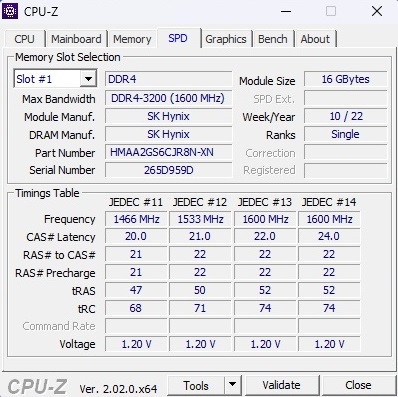
Les performances de l'IdeaPad Gaming 3 15IAH7 le placent dans le milieu de gamme. Le processeur doté de nombreux cœurs et la mémoire de travail de 16 Go devraient offrir des réserves suffisantes pour les années à venir, même si pour des raisons de performances, Lenovo aurait dû utiliser de la mémoire vive à double canal au lieu d'un seul module de mémoire vive. Bien que le SSD M.2 intégré ne soit disponible qu'au format 2242, le boîtier offre toujours de la place pour un SSD 2280 classique. La carte graphique laisse des impressions mitigées. D'un côté, la RTX 3050 Ti offre un bon rapport qualité-prix, mais d'un autre côté, 4 Go de VRAM ne sont pas très évolutifs.
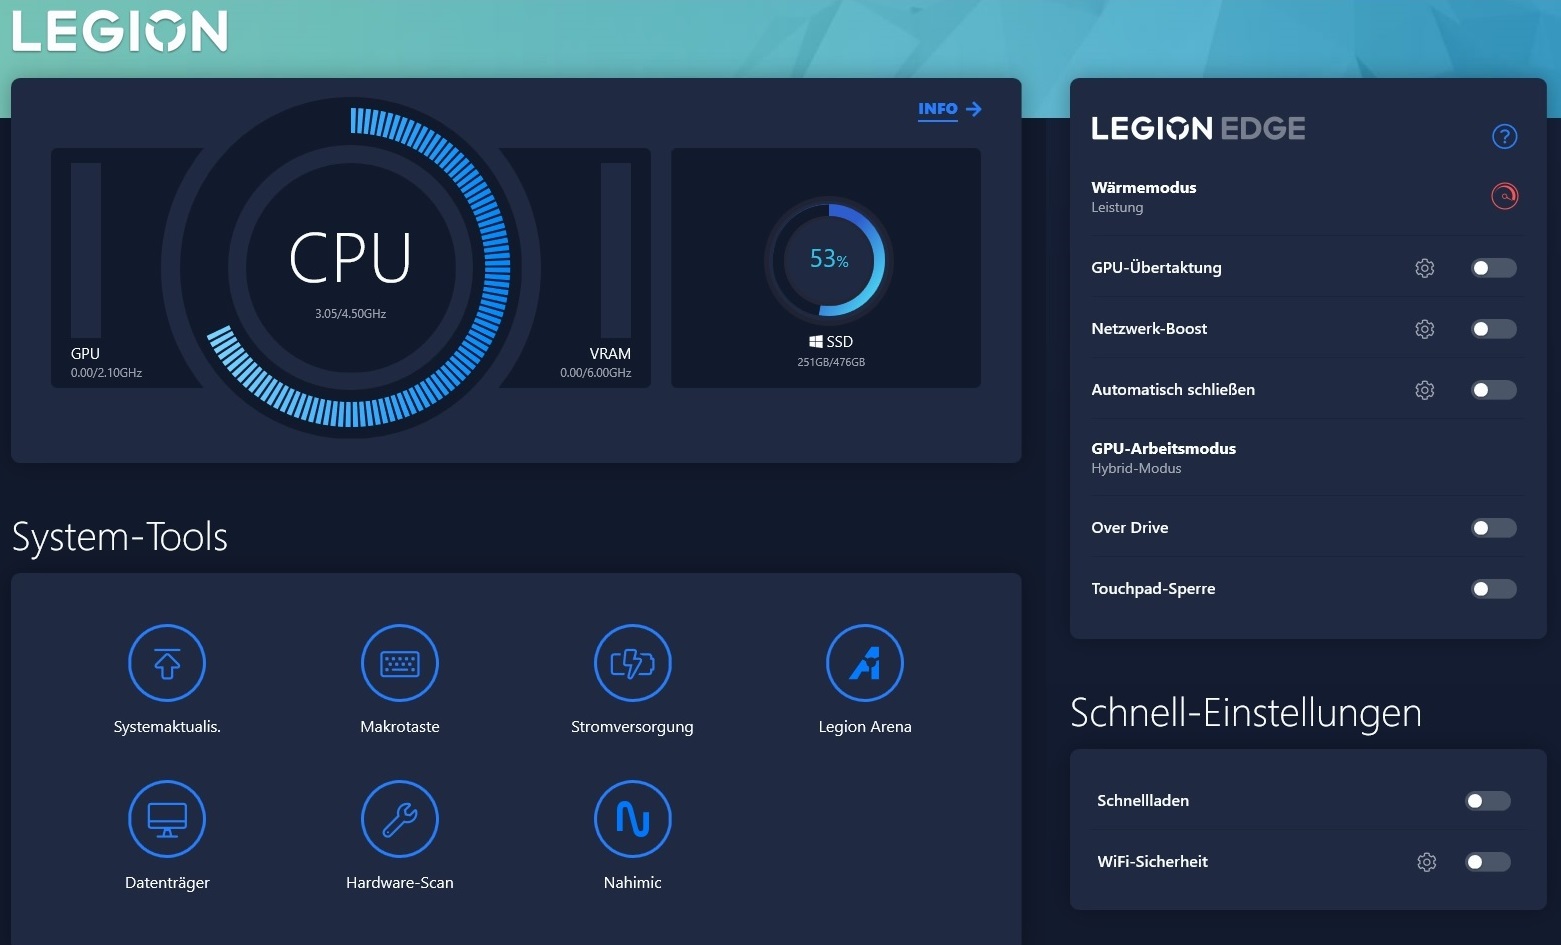
Conditions d'essai
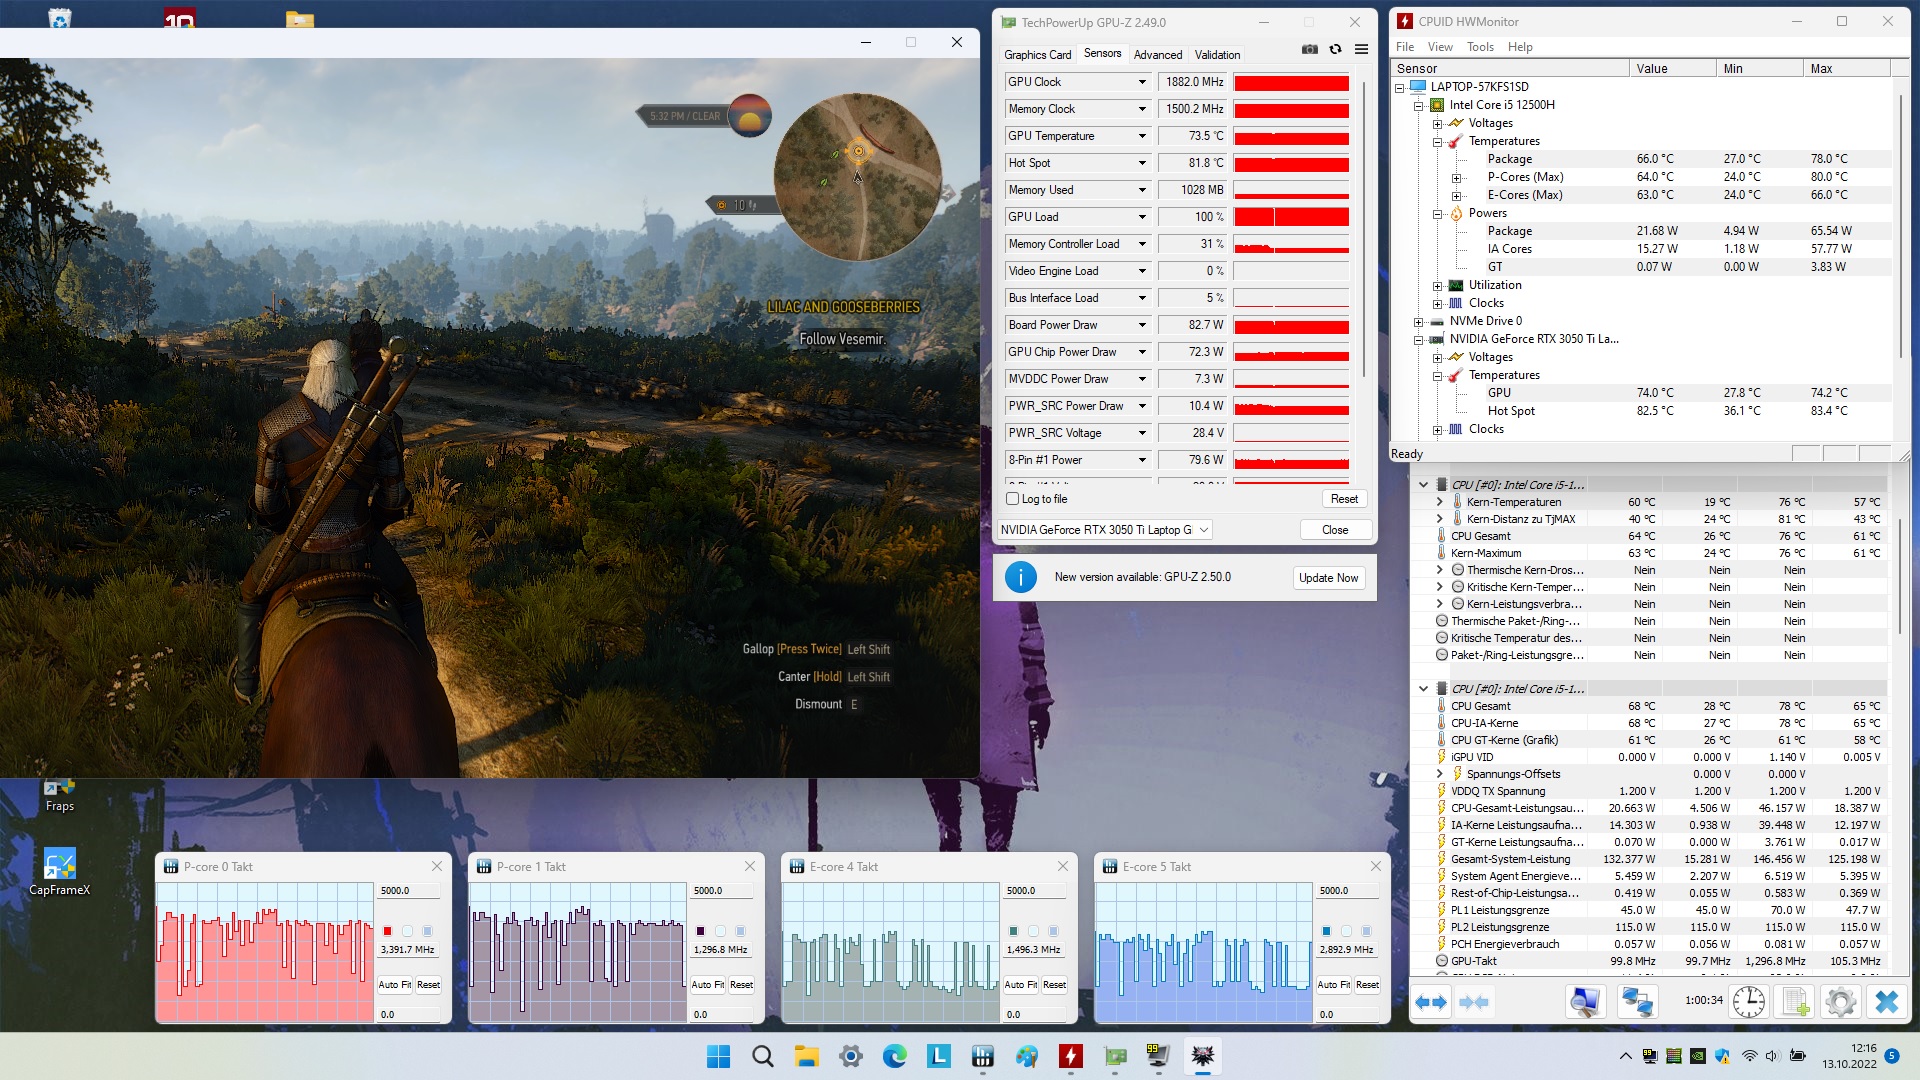
Le logiciel préinstallé Lenovo Vantage offre des dizaines d'options de réglage, parmi lesquelles le mode d'alimentation et le mode de fonctionnement du GPU sont particulièrement pertinents. Sauf indication contraire, toutes nos mesures sont effectuées avec le mode Performance et la commutation graphique hybride normale activée. Toutefois, compte tenu de la faible baisse des performances (voir le tableau), nous recommandons plutôt d'utiliser le mode équilibré (profil ajusté) dans la pratique. En mode Silencieux, le fonctionnement de l'appareil est à nouveau nettement plus silencieux. Malgré une baisse d'environ 30 % des fréquences d'images, de nombreux jeux sont encore jouables.


| Le Witcher 3 (FHD/Ultra) | Niveau sonore | Performance |
| Mode performance | 46 dB(A) | base (~60 FPS) |
| Mode ajusté | 43 dB(A) | -7% (~56 FPS) |
| Mode silencieux | 34 dB(A) | -30% (~42 FPS) |
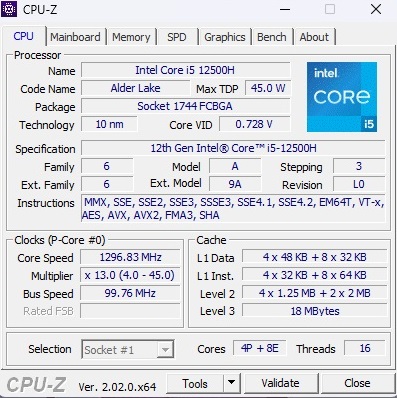
Processeur
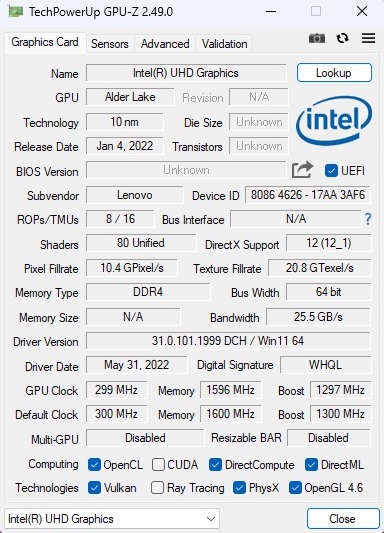
Le Core i5-12500H est un modèle à 12 cœurs de la génération Alder Lake d'Intel qui comprend 4 cœurs de performance (avec hyperthreading) et 8 cœurs d'efficacité (sans hyperthreading) et est spécifié à un TDP de 45 watts. Dans les tests CPU, la puce 10-nm fournit une très bonne performance. Comme les performances restent stables en permanence, l'IdeaPad Gaming 3 15IAH7 se place même devant le Core i7-12700Hdu Dell Inspiron 16 Plus après un certain temps dans la boucle Cinebench, atteignant la première place. Les CPU Ryzen des autres concurrents (R5 5600Hr5 6600H ET R7 5800H) sont légèrement à la traîne.
Cinebench R15 Multi Constant Load Test
* ... Moindre est la valeur, meilleures sont les performances
AIDA64: FP32 Ray-Trace | FPU Julia | CPU SHA3 | CPU Queen | FPU SinJulia | FPU Mandel | CPU AES | CPU ZLib | FP64 Ray-Trace | CPU PhotoWorxx
| Performance rating | |
| Moyenne de la classe Gaming | |
| Dell G15 5515 | |
| Dell Inspiron 16 Plus 7620 | |
| Lenovo IdeaPad Gaming 3 15IAH7 | |
| Lenovo IdeaPad Gaming 3 15ARH7 | |
| Moyenne Intel Core i5-12500H | |
| HP Victus 16-e0145ng | |
| AIDA64 / FP32 Ray-Trace | |
| Moyenne de la classe Gaming (10227 - 85542, n=107, 2 dernières années) | |
| Dell G15 5515 | |
| Lenovo IdeaPad Gaming 3 15IAH7 | |
| Dell Inspiron 16 Plus 7620 | |
| Lenovo IdeaPad Gaming 3 15ARH7 | |
| Moyenne Intel Core i5-12500H (6851 - 13947, n=9) | |
| HP Victus 16-e0145ng | |
| AIDA64 / FPU Julia | |
| Moyenne de la classe Gaming (51376 - 238426, n=107, 2 dernières années) | |
| Dell G15 5515 | |
| Lenovo IdeaPad Gaming 3 15ARH7 | |
| HP Victus 16-e0145ng | |
| Lenovo IdeaPad Gaming 3 15IAH7 | |
| Dell Inspiron 16 Plus 7620 | |
| Moyenne Intel Core i5-12500H (29874 - 68178, n=9) | |
| AIDA64 / CPU SHA3 | |
| Moyenne de la classe Gaming (2180 - 9817, n=107, 2 dernières années) | |
| Lenovo IdeaPad Gaming 3 15IAH7 | |
| Dell G15 5515 | |
| Moyenne Intel Core i5-12500H (2287 - 3337, n=9) | |
| Dell Inspiron 16 Plus 7620 | |
| Lenovo IdeaPad Gaming 3 15ARH7 | |
| HP Victus 16-e0145ng | |
| AIDA64 / CPU Queen | |
| Moyenne de la classe Gaming (49785 - 173351, n=98, 2 dernières années) | |
| Dell G15 5515 | |
| Dell Inspiron 16 Plus 7620 | |
| Lenovo IdeaPad Gaming 3 15IAH7 | |
| Moyenne Intel Core i5-12500H (77935 - 80703, n=9) | |
| Lenovo IdeaPad Gaming 3 15ARH7 | |
| HP Victus 16-e0145ng | |
| AIDA64 / FPU SinJulia | |
| Moyenne de la classe Gaming (4424 - 33636, n=107, 2 dernières années) | |
| Dell G15 5515 | |
| Lenovo IdeaPad Gaming 3 15ARH7 | |
| HP Victus 16-e0145ng | |
| Dell Inspiron 16 Plus 7620 | |
| Lenovo IdeaPad Gaming 3 15IAH7 | |
| Moyenne Intel Core i5-12500H (6590 - 7431, n=9) | |
| AIDA64 / FPU Mandel | |
| Moyenne de la classe Gaming (25115 - 128721, n=107, 2 dernières années) | |
| Dell G15 5515 | |
| Lenovo IdeaPad Gaming 3 15ARH7 | |
| HP Victus 16-e0145ng | |
| Lenovo IdeaPad Gaming 3 15IAH7 | |
| Dell Inspiron 16 Plus 7620 | |
| Moyenne Intel Core i5-12500H (18252 - 34041, n=9) | |
| AIDA64 / CPU AES | |
| Dell G15 5515 | |
| Lenovo IdeaPad Gaming 3 15IAH7 | |
| Moyenne de la classe Gaming (39258 - 247074, n=107, 2 dernières années) | |
| Lenovo IdeaPad Gaming 3 15ARH7 | |
| Moyenne Intel Core i5-12500H (50298 - 111567, n=9) | |
| Dell Inspiron 16 Plus 7620 | |
| HP Victus 16-e0145ng | |
| AIDA64 / CPU ZLib | |
| Moyenne de la classe Gaming (574 - 2531, n=107, 2 dernières années) | |
| Dell Inspiron 16 Plus 7620 | |
| Lenovo IdeaPad Gaming 3 15IAH7 | |
| Moyenne Intel Core i5-12500H (746 - 924, n=9) | |
| Dell G15 5515 | |
| Lenovo IdeaPad Gaming 3 15ARH7 | |
| HP Victus 16-e0145ng | |
| AIDA64 / FP64 Ray-Trace | |
| Moyenne de la classe Gaming (5509 - 45446, n=107, 2 dernières années) | |
| Dell G15 5515 | |
| Lenovo IdeaPad Gaming 3 15IAH7 | |
| Dell Inspiron 16 Plus 7620 | |
| Lenovo IdeaPad Gaming 3 15ARH7 | |
| Moyenne Intel Core i5-12500H (3848 - 7405, n=9) | |
| HP Victus 16-e0145ng | |
| AIDA64 / CPU PhotoWorxx | |
| Moyenne de la classe Gaming (12271 - 89891, n=107, 2 dernières années) | |
| Dell Inspiron 16 Plus 7620 | |
| Moyenne Intel Core i5-12500H (13686 - 43813, n=9) | |
| HP Victus 16-e0145ng | |
| Lenovo IdeaPad Gaming 3 15ARH7 | |
| Dell G15 5515 | |
| Lenovo IdeaPad Gaming 3 15IAH7 | |
Performance du système
Selon PCMark 10, les performances du système sont également respectables. Avec 6 755 points, il n'est battu que par le Dell Inspiron 16 Plus. Subjectivement, le système d'exploitation réagit confortablement et rapidement.
CrossMark: Overall | Productivity | Creativity | Responsiveness
| PCMark 10 / Score | |
| Moyenne de la classe Gaming (5828 - 11574, n=94, 2 dernières années) | |
| Dell Inspiron 16 Plus 7620 | |
| Lenovo IdeaPad Gaming 3 15IAH7 | |
| Lenovo IdeaPad Gaming 3 15ARH7 | |
| Dell G15 5515 | |
| HP Victus 16-e0145ng | |
| PCMark 10 / Essentials | |
| Moyenne de la classe Gaming (8810 - 12600, n=98, 2 dernières années) | |
| Dell Inspiron 16 Plus 7620 | |
| Lenovo IdeaPad Gaming 3 15IAH7 | |
| HP Victus 16-e0145ng | |
| Dell G15 5515 | |
| Lenovo IdeaPad Gaming 3 15ARH7 | |
| PCMark 10 / Productivity | |
| Moyenne de la classe Gaming (6845 - 18766, n=96, 2 dernières années) | |
| Lenovo IdeaPad Gaming 3 15IAH7 | |
| Dell Inspiron 16 Plus 7620 | |
| Lenovo IdeaPad Gaming 3 15ARH7 | |
| Dell G15 5515 | |
| HP Victus 16-e0145ng | |
| PCMark 10 / Digital Content Creation | |
| Moyenne de la classe Gaming (7602 - 19657, n=96, 2 dernières années) | |
| Dell Inspiron 16 Plus 7620 | |
| Lenovo IdeaPad Gaming 3 15IAH7 | |
| HP Victus 16-e0145ng | |
| Dell G15 5515 | |
| Lenovo IdeaPad Gaming 3 15ARH7 | |
| CrossMark / Overall | |
| Moyenne de la classe Gaming (1366 - 2409, n=96, 2 dernières années) | |
| Dell Inspiron 16 Plus 7620 | |
| Lenovo IdeaPad Gaming 3 15ARH7 | |
| CrossMark / Productivity | |
| Moyenne de la classe Gaming (1386 - 2254, n=96, 2 dernières années) | |
| Dell Inspiron 16 Plus 7620 | |
| Lenovo IdeaPad Gaming 3 15ARH7 | |
| CrossMark / Creativity | |
| Moyenne de la classe Gaming (1343 - 2729, n=96, 2 dernières années) | |
| Dell Inspiron 16 Plus 7620 | |
| Lenovo IdeaPad Gaming 3 15ARH7 | |
| CrossMark / Responsiveness | |
| Moyenne de la classe Gaming (1226 - 2334, n=96, 2 dernières années) | |
| Dell Inspiron 16 Plus 7620 | |
| Lenovo IdeaPad Gaming 3 15ARH7 | |
| PCMark 10 Score | 6755 points | |
Aide | ||
| AIDA64 / Memory Copy | |
| Moyenne de la classe Gaming (21750 - 129946, n=107, 2 dernières années) | |
| Dell Inspiron 16 Plus 7620 | |
| Moyenne Intel Core i5-12500H (23850 - 66598, n=9) | |
| HP Victus 16-e0145ng | |
| Dell G15 5515 | |
| Lenovo IdeaPad Gaming 3 15ARH7 | |
| Lenovo IdeaPad Gaming 3 15IAH7 | |
| AIDA64 / Memory Read | |
| Moyenne de la classe Gaming (22956 - 118858, n=107, 2 dernières années) | |
| Dell Inspiron 16 Plus 7620 | |
| Moyenne Intel Core i5-12500H (24879 - 68013, n=9) | |
| HP Victus 16-e0145ng | |
| Dell G15 5515 | |
| Lenovo IdeaPad Gaming 3 15ARH7 | |
| Lenovo IdeaPad Gaming 3 15IAH7 | |
| AIDA64 / Memory Write | |
| Moyenne de la classe Gaming (22297 - 135096, n=107, 2 dernières années) | |
| Dell Inspiron 16 Plus 7620 | |
| Moyenne Intel Core i5-12500H (23543 - 58797, n=9) | |
| HP Victus 16-e0145ng | |
| Dell G15 5515 | |
| Lenovo IdeaPad Gaming 3 15ARH7 | |
| Lenovo IdeaPad Gaming 3 15IAH7 | |
| AIDA64 / Memory Latency | |
| Moyenne de la classe Gaming (75.3 - 259, n=107, 2 dernières années) | |
| Moyenne Intel Core i5-12500H (83.8 - 114.7, n=9) | |
| Dell Inspiron 16 Plus 7620 | |
| Lenovo IdeaPad Gaming 3 15IAH7 | |
| Lenovo IdeaPad Gaming 3 15ARH7 | |
| Dell G15 5515 | |
| HP Victus 16-e0145ng | |
* ... Moindre est la valeur, meilleures sont les performances
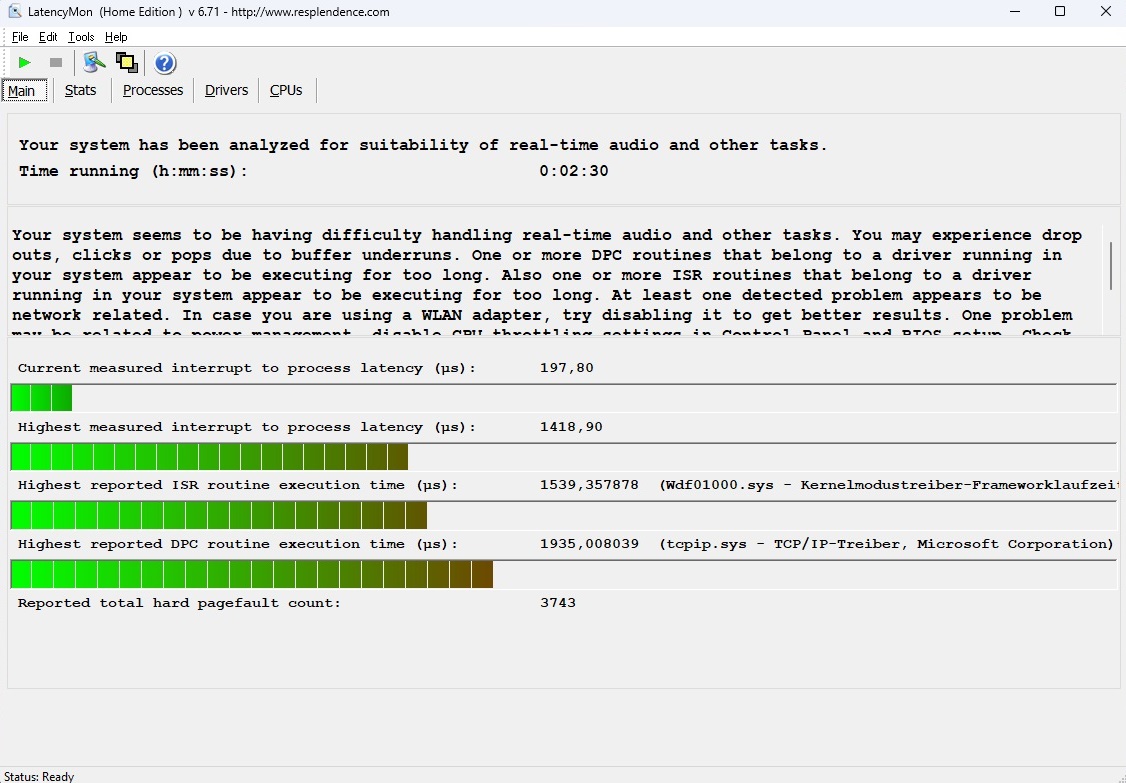
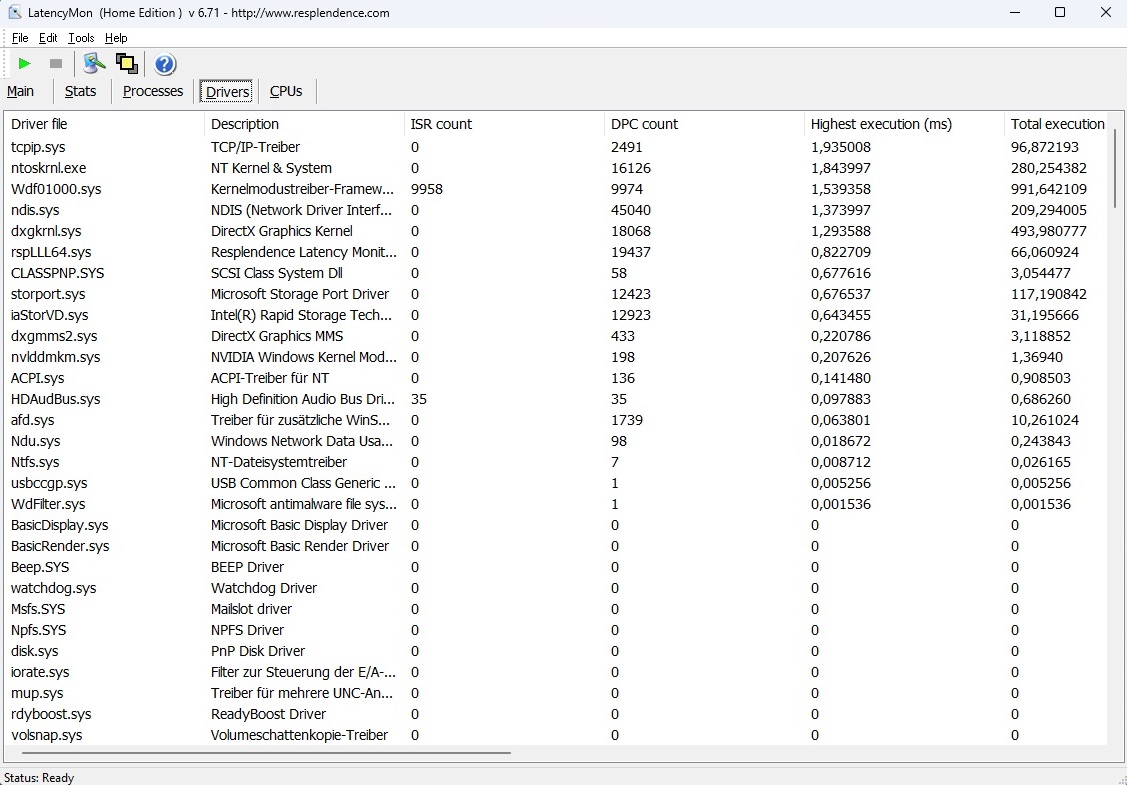
Latences DPC
Dans le test de latence, l'ordinateur portable de 15 pouces ne s'en sort pas si bien. L'outil LatencyMon mentionne des problèmes potentiels avec le traitement audio et vidéo en temps réel. Toutefois, seuls quelques utilisateurs devraient être affectés par ces scénarios d'application.
| DPC Latencies / LatencyMon - interrupt to process latency (max), Web, Youtube, Prime95 | |
| Lenovo IdeaPad Gaming 3 15IAH7 | |
| Dell Inspiron 16 Plus 7620 | |
| HP Victus 16-e0145ng | |
| Lenovo IdeaPad Gaming 3 15ARH7 | |
| Dell G15 5515 | |
* ... Moindre est la valeur, meilleures sont les performances
Solution de stockage
Les performances du SSD se situent au milieu de notre champ de comparaison. Le modèle de 512 Go d'Intel (660p) n'est ni particulièrement rapide ni particulièrement lent pour un disque NVMe. Le fait que la vitesse du SSD reste relativement constante, comme celle du CPU, est une bonne chose.

* ... Moindre est la valeur, meilleures sont les performances
Constant Performance Reading: DiskSpd Read Loop, Queue Depth 8
Carte graphique
Les performances des GPU Ampere de Nvidia dépendent dans une large mesure du TGP ajusté. Lenovo a opté pour une valeur relativement élevée dans l'IdeaPad Gaming 3, ce qui profite aux résultats du benchmark. 85 Watts, c'est beaucoup pour une RTX 3050 Ti. L'ordinateur portable de 15 pouces s'en sort bien dans les benchmarks 3DMarks. Si l'on additionne toutes les valeurs, la RTX 3050 Ti est presque 25 % plus rapide que la moyenne actuelle de cette carte graphique. Dans une certaine mesure, cela compense le fait que l'on peut déjà obtenir des appareils équipés de la carte RTX 3060qui comprend 6 au lieu de 4 Go de VRAM, dans le segment des 1000 euros.
| 3DMark 11 Performance | 19254 points | |
| 3DMark Cloud Gate Standard Score | 48874 points | |
| 3DMark Fire Strike Score | 14086 points | |
| 3DMark Time Spy Score | 6213 points | |
Aide | ||
* ... Moindre est la valeur, meilleures sont les performances
Performances en matière de jeux
La tendance positive des tests graphiques synthétiques se poursuit dans nos tests de jeu. Bien que les performances de certains jeux puissent souffrir considérablement de la RAM à canal unique (c'est pourquoi nous recommandons de passer à 2 x 8 Go), les jeux qui ne sont pas gourmands en RAM tournent également beaucoup plus vite que sur une RTX 3050 Ti avec un TGP inférieur.
| The Witcher 3 | |
| 1920x1080 High Graphics & Postprocessing (Nvidia HairWorks Off) | |
| Moyenne de la classe Gaming (181 - 341, n=3, 2 dernières années) | |
| Lenovo IdeaPad Gaming 3 15IAH7 | |
| Dell Inspiron 16 Plus 7620 | |
| Lenovo IdeaPad Gaming 3 15ARH7 | |
| HP Victus 16-e0145ng | |
| Dell G15 5515 | |
| Moyenne NVIDIA GeForce RTX 3050 Ti Laptop GPU (30 - 110, n=26) | |
| 1920x1080 Ultra Graphics & Postprocessing (HBAO+) | |
| Moyenne de la classe Gaming (95 - 240, n=8, 2 dernières années) | |
| Lenovo IdeaPad Gaming 3 15IAH7 | |
| Dell Inspiron 16 Plus 7620 | |
| Dell G15 5515 | |
| Lenovo IdeaPad Gaming 3 15ARH7 | |
| HP Victus 16-e0145ng | |
| Moyenne NVIDIA GeForce RTX 3050 Ti Laptop GPU (19 - 58.5, n=29) | |
Nous n'avons pas remarqué de comportement particulier lors de notre test constant de 60 minutes avec Le site Witcher 3. En gros, l'IdeaPad Gaming 3 15IAH7 est capable de gérer la quasi-totalité des jeux modernes à des niveaux de détails élevés à maximum dans la résolution native de 1920 x 1080 pixels, tant que vous vous passez du ray tracing (où la RTX 3050 Ti montre quelques faiblesses considérables).
The Witcher 3 FPS Chart
| Bas | Moyen | Élevé | Ultra | |
|---|---|---|---|---|
| GTA V (2015) | 160.7 | 130.6 | 73.5 | |
| The Witcher 3 (2015) | 173 | 110 | 58.5 | |
| Dota 2 Reborn (2015) | 145.9 | 127.3 | 113.8 | 107.8 |
| Final Fantasy XV Benchmark (2018) | 81.5 | 58.8 | ||
| X-Plane 11.11 (2018) | 109.9 | 98.1 | 81.1 | |
| Strange Brigade (2018) | 145.5 | 117.3 | 101.3 | |
| Ghostwire Tokyo (2022) | 79.5 | 76.8 | 75.9 | |
| Tiny Tina's Wonderlands (2022) | 92.1 | 67.2 | 51.7 | |
| Vampire Bloodhunt (2022) | 111.8 | 110.9 | 106.1 | |
| F1 22 (2022) | 111 | 92 | 32 | |
| The Quarry (2022) | 69.7 | 58.3 | 45.8 |
Émissions
Émissions sonores
En mode Performance, l'ordinateur portable de 15 pouces n'est pas très silencieux. Déjà en mode veille, vous pouvez entendre beaucoup de bruit de ventilateur à 29 à 32 dB(A). En charge, l'appareil produit un volume sonore énorme de 42 à 54 dB(A), bien que d'autres ordinateurs portables de jeu tels que le Victus 16 soient aussi bruyants. Toutefois, grâce aux deux autres modes d'alimentation, l'appareil peut être facilement et rapidement atténué.
Degré de la nuisance sonore
| Au repos |
| 29 / 30 / 32 dB(A) |
| Fortement sollicité |
| 42 / 54 dB(A) |
 | ||
30 dB silencieux 40 dB(A) audible 50 dB(A) bruyant |
||
min: | ||
| Lenovo IdeaPad Gaming 3 15IAH7 GeForce RTX 3050 Ti Laptop GPU, i5-12500H | Lenovo IdeaPad Gaming 3 15ARH7 GeForce RTX 3050 4GB Laptop GPU, R5 6600H | Dell G15 5515 GeForce RTX 3050 Ti Laptop GPU, R7 5800H | HP Victus 16-e0145ng GeForce RTX 3050 Ti Laptop GPU, R5 5600H | Dell Inspiron 16 Plus 7620 GeForce RTX 3050 Ti Laptop GPU, i7-12700H | |
|---|---|---|---|---|---|
| Noise | 11% | 7% | 0% | 4% | |
| arrêt / environnement * (dB) | 25 | 23.3 7% | 24 4% | 26 -4% | 23.3 7% |
| Idle Minimum * (dB) | 29 | 23.8 18% | 25 14% | 26 10% | 25.7 11% |
| Idle Average * (dB) | 30 | 23.8 21% | 26 13% | 28 7% | 26.1 13% |
| Idle Maximum * (dB) | 32 | 27.2 15% | 30 6% | 34 -6% | 30.6 4% |
| Load Average * (dB) | 42 | 34.8 17% | 44 -5% | 44 -5% | 46.2 -10% |
| Witcher 3 ultra * (dB) | 46 | 49.3 -7% | 44 4% | 48 -4% | 49.2 -7% |
| Load Maximum * (dB) | 54 | 49.4 9% | 48 11% | 53 2% | 49.4 9% |
* ... Moindre est la valeur, meilleures sont les performances
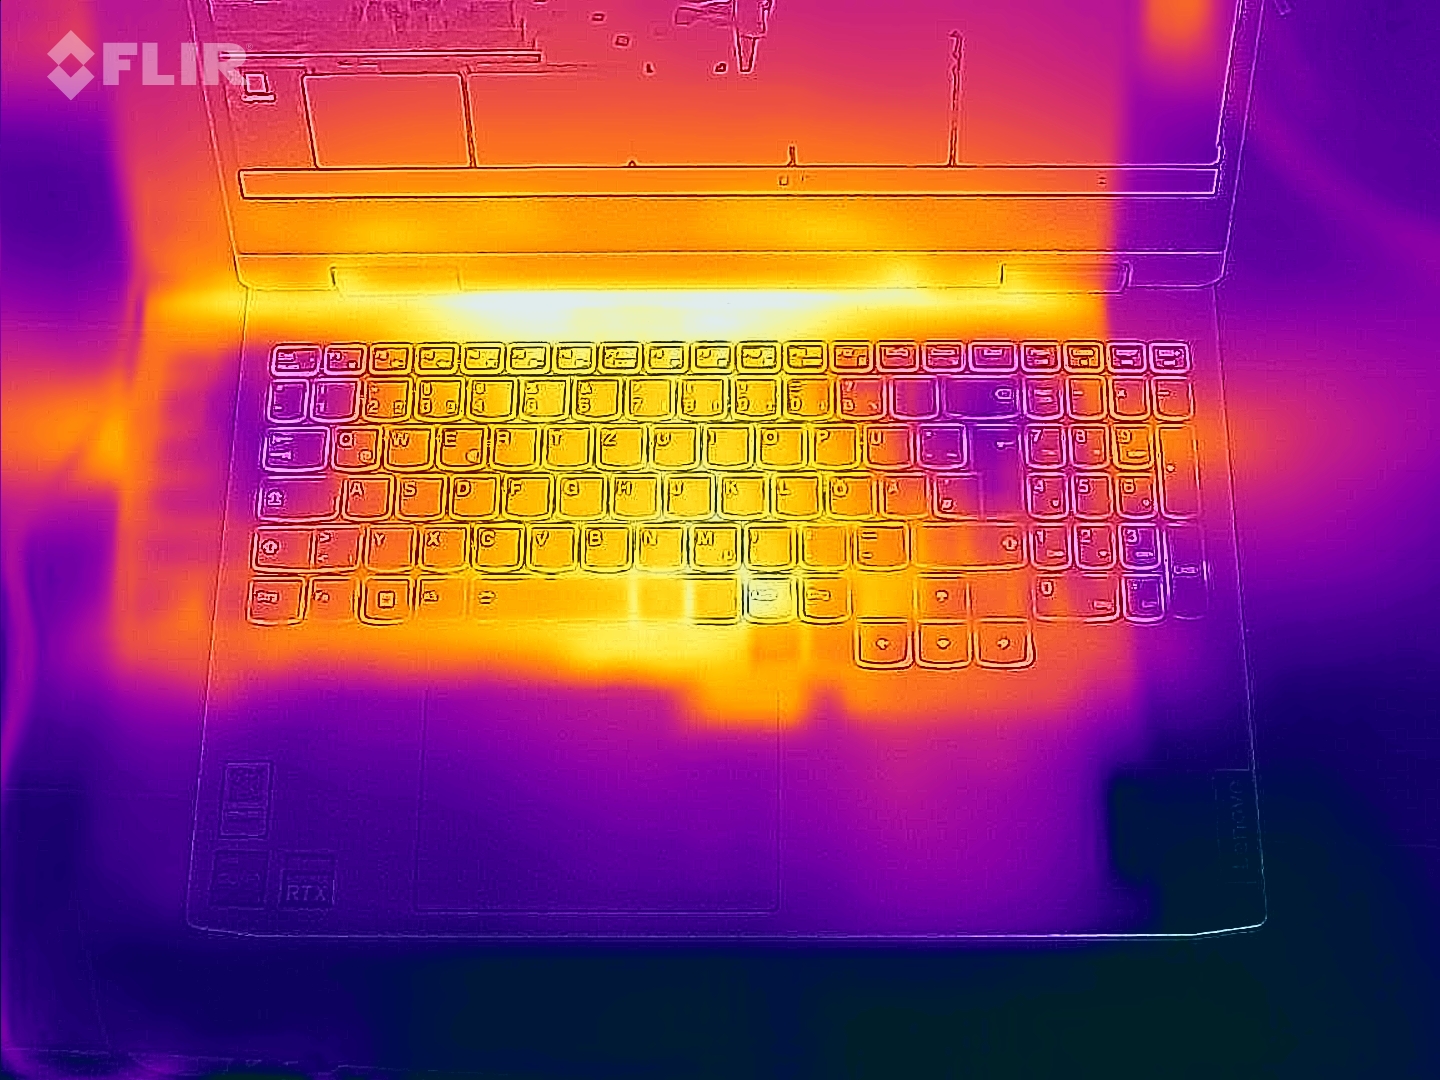
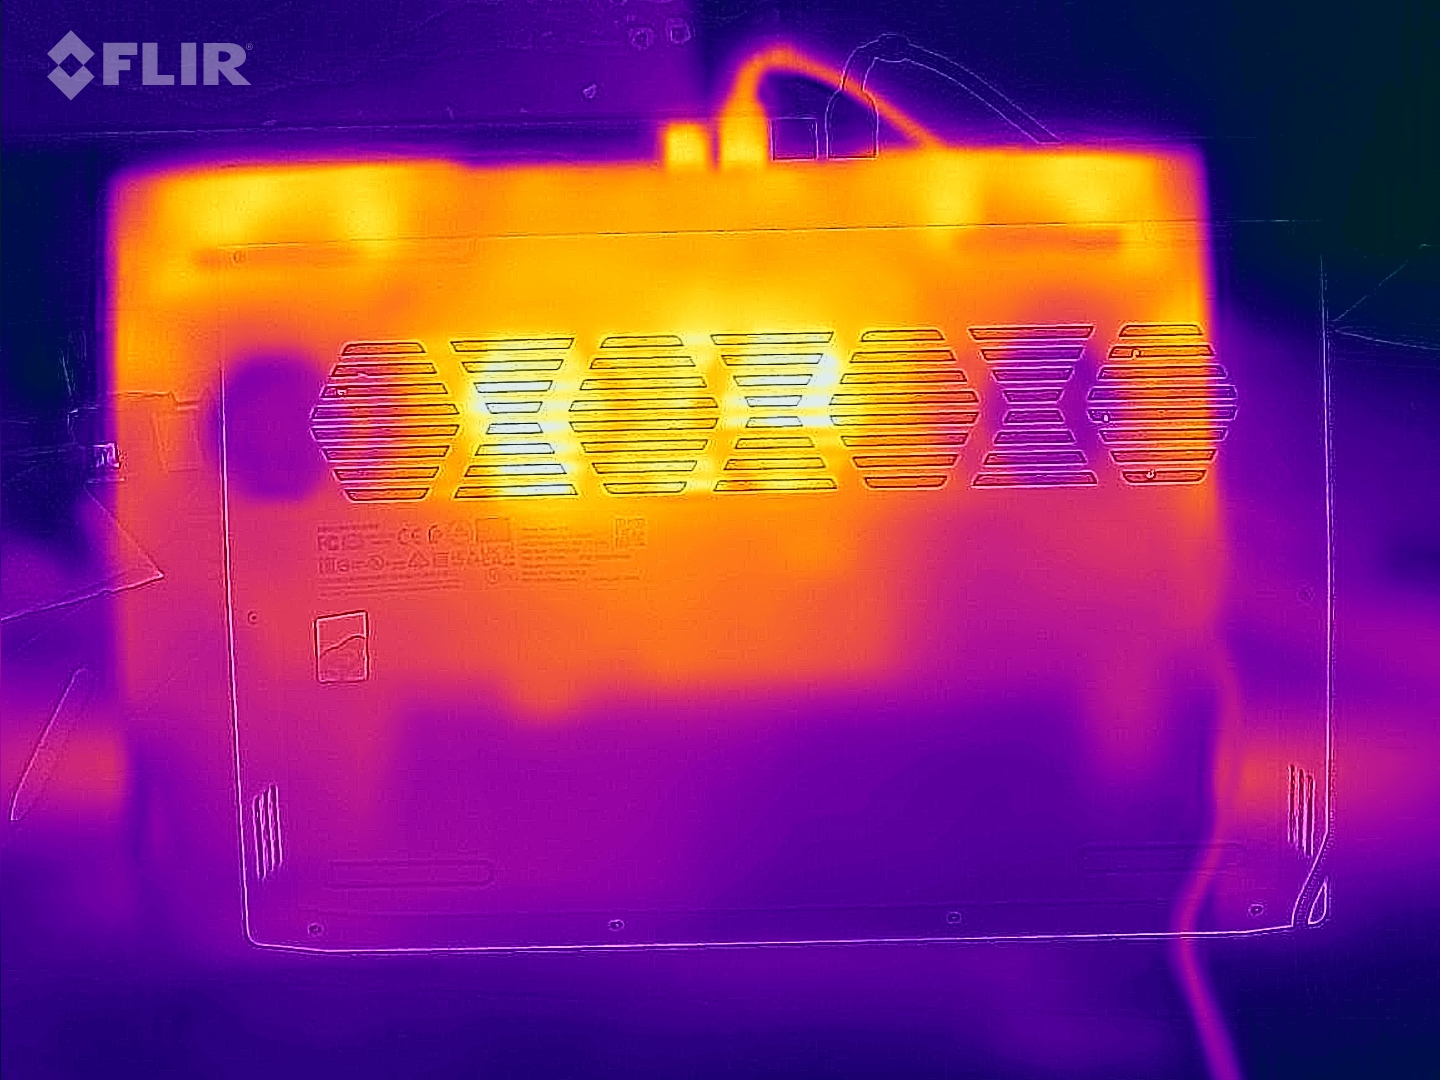
Températures
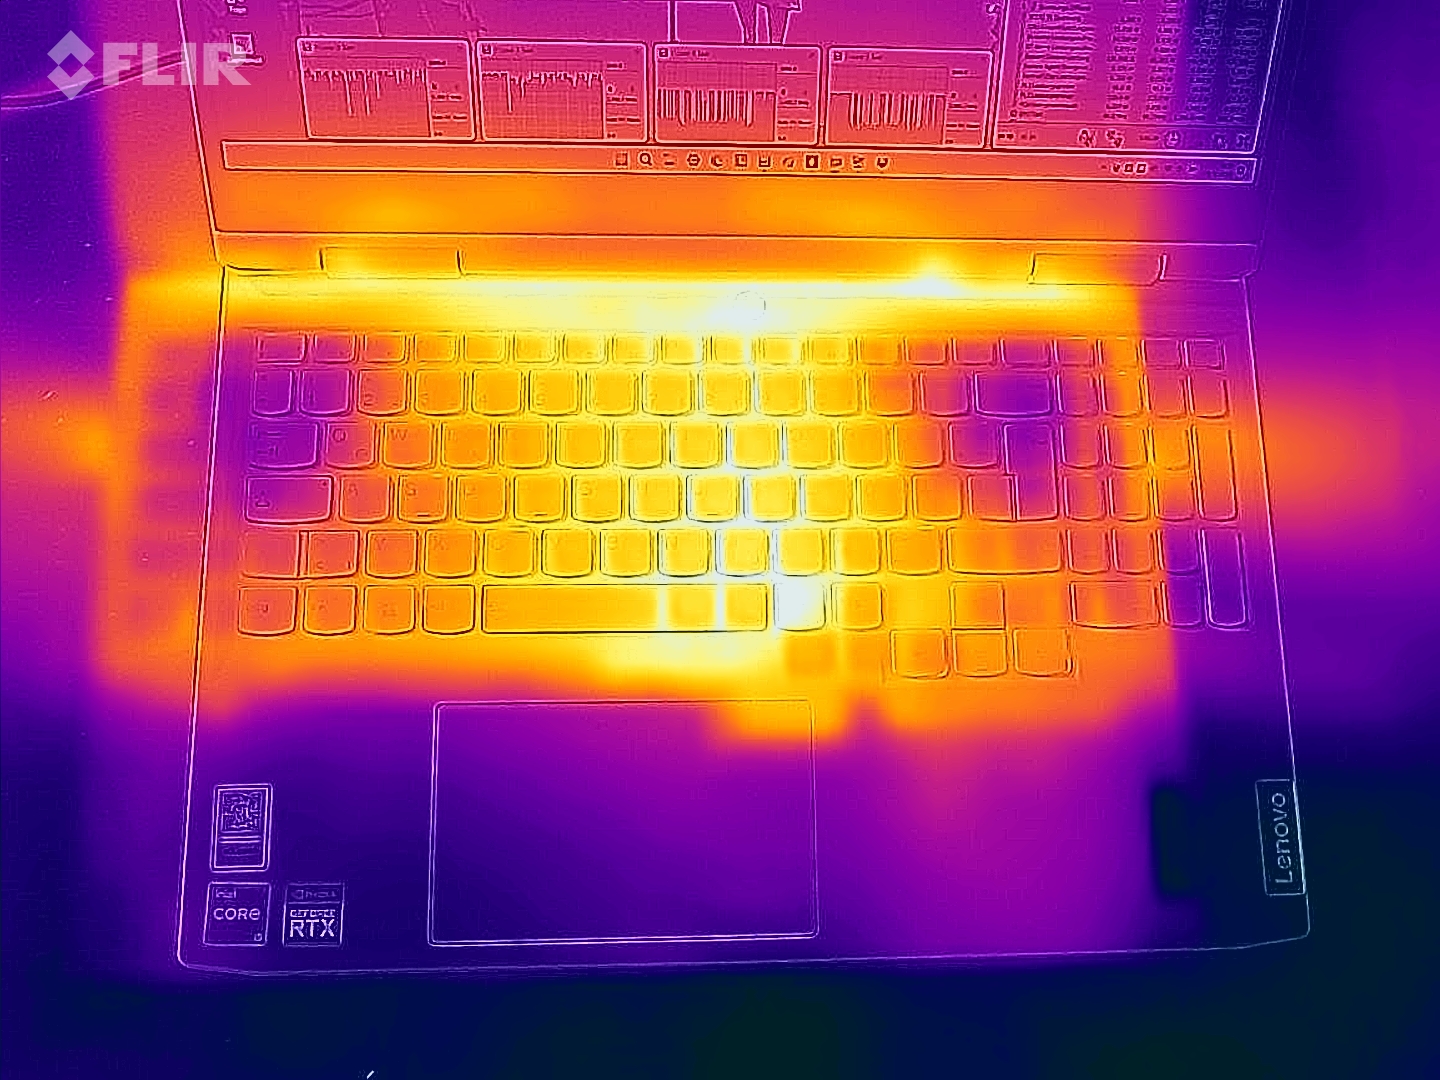
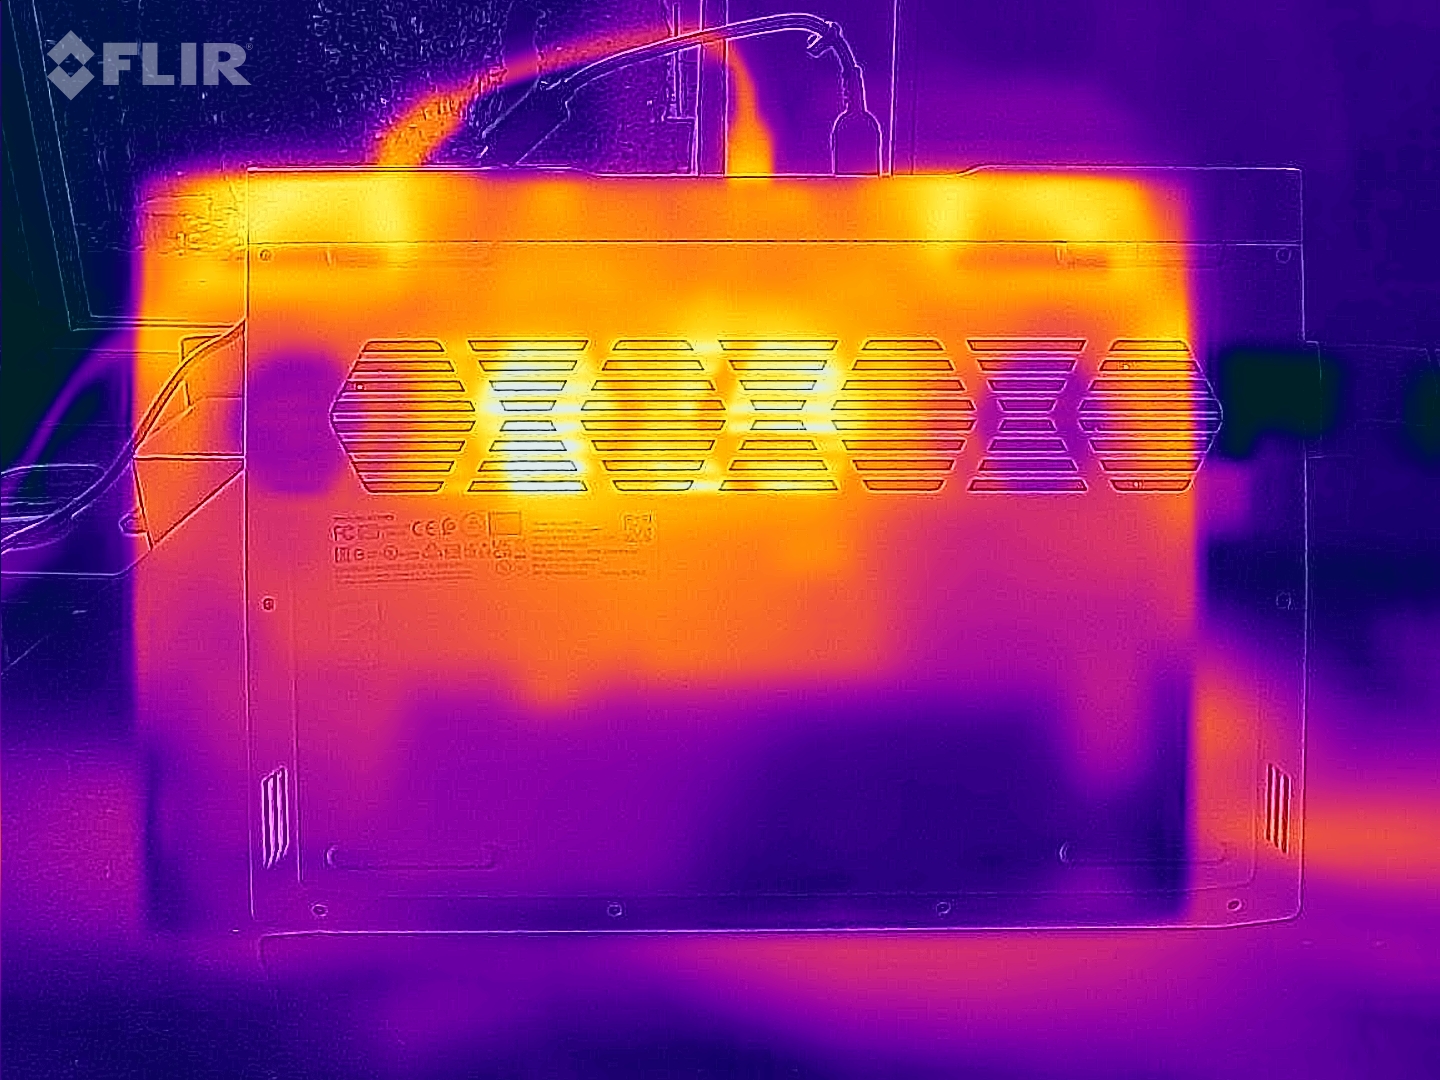
L'évolution de la température est également typique d'un ordinateur portable de jeu. Alors que l'appareil Lenovo reste confortablement froid en mode veille, les températures atteignent jusqu'à 47 °C (~117 °F) sur le dessus et 52 °C (~126 °F) sur le dessous pendant le fonctionnement en 3D. Vous ne devriez donc pas essayer de jouer avec l'ordinateur portable sur vos genoux.
(-) La température maximale du côté supérieur est de 47 °C / 117 F, par rapport à la moyenne de 40.4 °C / 105 F, allant de 21.2 à 68.8 °C pour la classe Gaming.
(-) Le fond chauffe jusqu'à un maximum de 52 °C / 126 F, contre une moyenne de 43.2 °C / 110 F
(+) En utilisation inactive, la température moyenne du côté supérieur est de 24.2 °C / 76 F, par rapport à la moyenne du dispositif de 33.9 °C / 93 F.
(-) En jouant à The Witcher 3, la température moyenne du côté supérieur est de 39.2 °C / 103 F, alors que la moyenne de l'appareil est de 33.9 °C / 93 F.
(±) Les repose-poignets et le pavé tactile peuvent devenir très chauds au toucher, avec un maximum de 37 °C / 98.6# F.
(-) La température moyenne de la zone de l'appui-paume de dispositifs similaires était de 28.8 °C / 83.8 F (-8.2 °C / #-14.8 F).
| Lenovo IdeaPad Gaming 3 15IAH7 GeForce RTX 3050 Ti Laptop GPU, i5-12500H | Lenovo IdeaPad Gaming 3 15ARH7 GeForce RTX 3050 4GB Laptop GPU, R5 6600H | Dell G15 5515 GeForce RTX 3050 Ti Laptop GPU, R7 5800H | HP Victus 16-e0145ng GeForce RTX 3050 Ti Laptop GPU, R5 5600H | Dell Inspiron 16 Plus 7620 GeForce RTX 3050 Ti Laptop GPU, i7-12700H | |
|---|---|---|---|---|---|
| Heat | -3% | -3% | -25% | -8% | |
| Maximum Upper Side * (°C) | 47 | 47.6 -1% | 50 -6% | 54 -15% | 46 2% |
| Maximum Bottom * (°C) | 52 | 46.6 10% | 49 6% | 47 10% | 45.8 12% |
| Idle Upper Side * (°C) | 25 | 27.2 -9% | 26 -4% | 41 -64% | 29.2 -17% |
| Idle Bottom * (°C) | 24 | 27.2 -13% | 26 -8% | 31 -29% | 31 -29% |
* ... Moindre est la valeur, meilleures sont les performances
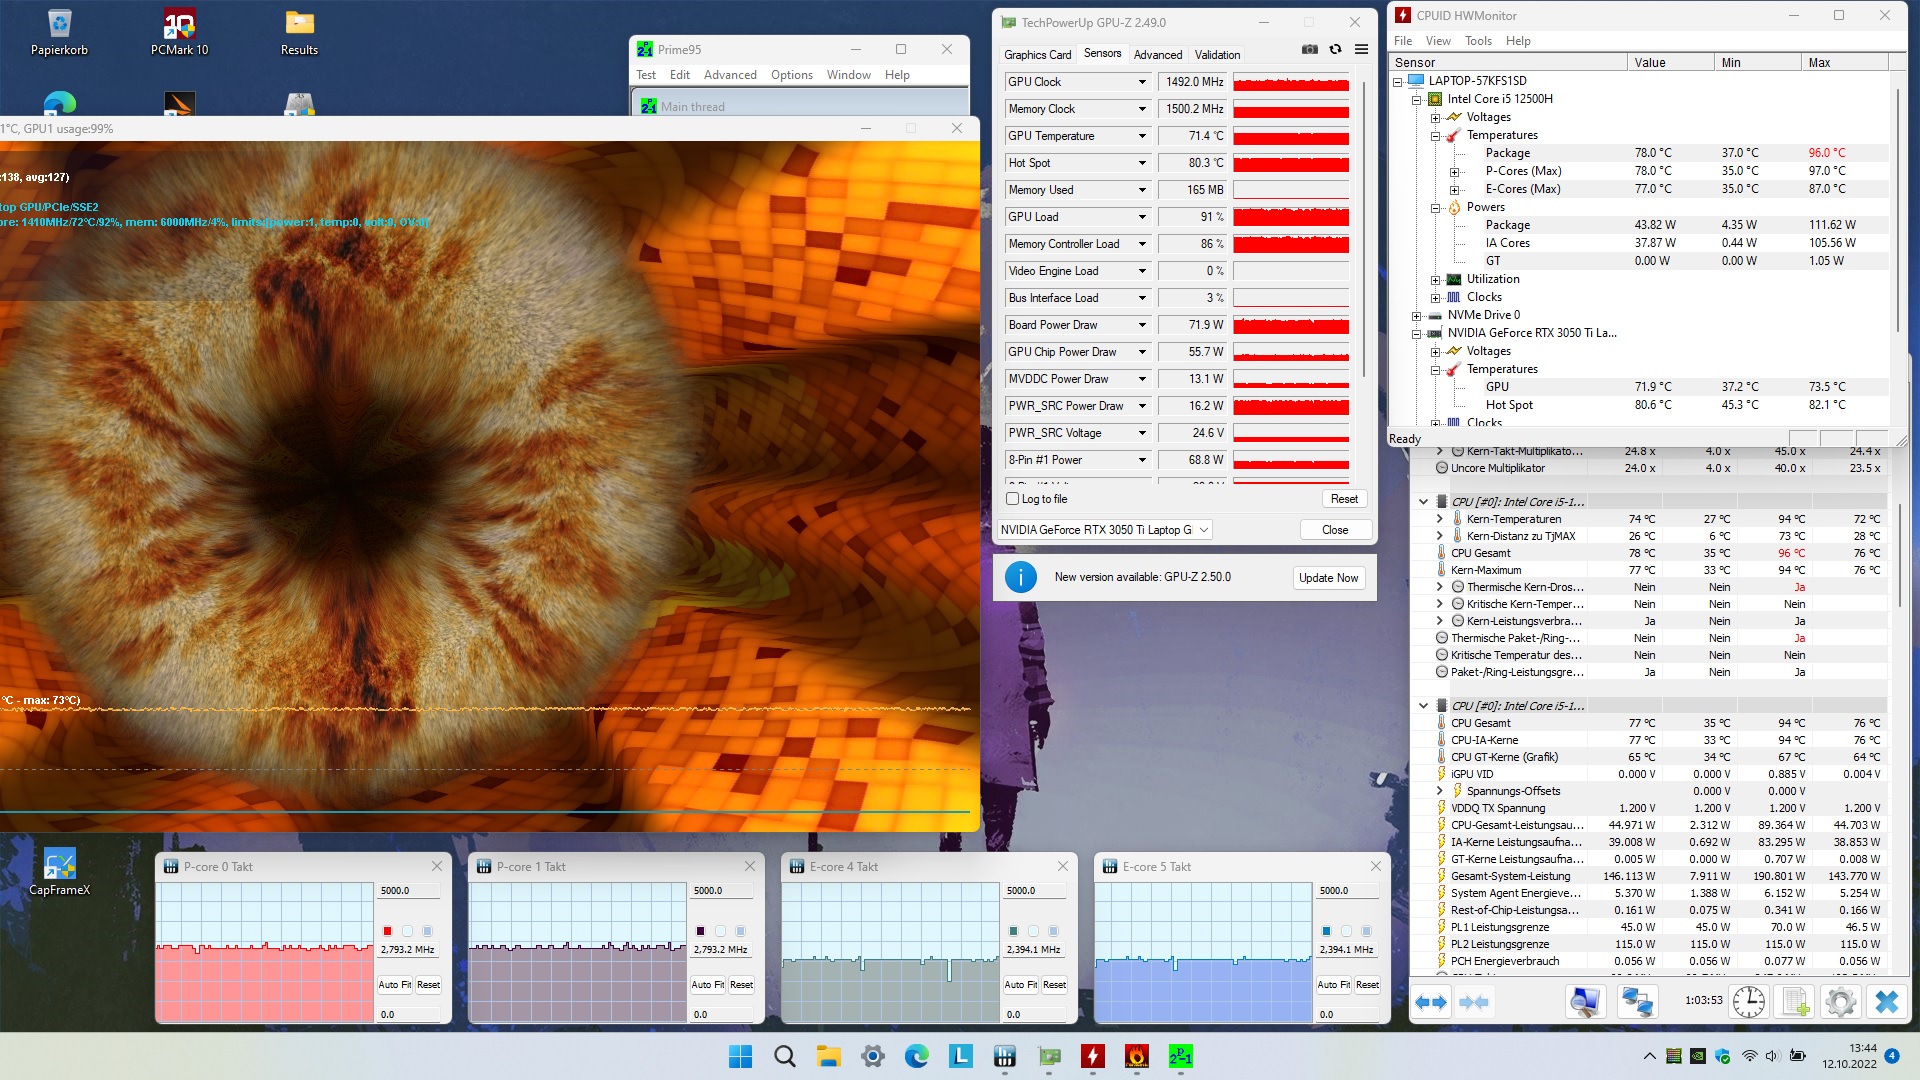
Test de stress
Le test de stress avec une heure de FurMark et Prime95 ne révèle rien d'étrange. L'ordinateur portable de 15 pouces reste à l'écart de l'étranglement et des valeurs matérielles critiques. Nous considérons qu'environ 71 °C (~160 °F) pour le GPU et 78 °C (~172 °F) pour le CPU à pleine charge sont des valeurs modérées.
Haut-parleurs
Lenovo IdeaPad Gaming 3 15IAH7 analyse audio
(+) | les haut-parleurs peuvent jouer relativement fort (83# dB)
Basses 100 - 315 Hz
(-) | presque aucune basse - en moyenne 17.1% plus bas que la médiane
(±) | la linéarité des basses est moyenne (12.8% delta à la fréquence précédente)
Médiums 400 - 2000 Hz
(±) | médiane supérieure - en moyenne 5.6% supérieure à la médiane
(+) | les médiums sont linéaires (4.5% delta à la fréquence précédente)
Aiguës 2 - 16 kHz
(+) | des sommets équilibrés - à seulement 2% de la médiane
(+) | les aigus sont linéaires (4.6% delta à la fréquence précédente)
Globalement 100 - 16 000 Hz
(+) | le son global est linéaire (14.4% différence à la médiane)
Par rapport à la même classe
» 27% de tous les appareils testés de cette catégorie étaient meilleurs, 7% similaires, 66% pires
» Le meilleur avait un delta de 6%, la moyenne était de 18%, le pire était de 132%.
Par rapport à tous les appareils testés
» 18% de tous les appareils testés étaient meilleurs, 4% similaires, 78% pires
» Le meilleur avait un delta de 4%, la moyenne était de 24%, le pire était de 134%.
Dell G15 5515 analyse audio
(±) | le niveau sonore du haut-parleur est moyen mais bon (76# dB)
Basses 100 - 315 Hz
(-) | presque aucune basse - en moyenne 22% plus bas que la médiane
(±) | la linéarité des basses est moyenne (14.9% delta à la fréquence précédente)
Médiums 400 - 2000 Hz
(+) | médiane équilibrée - seulement 2.8% de la médiane
(+) | les médiums sont linéaires (3% delta à la fréquence précédente)
Aiguës 2 - 16 kHz
(+) | des sommets équilibrés - à seulement 1.4% de la médiane
(+) | les aigus sont linéaires (3.7% delta à la fréquence précédente)
Globalement 100 - 16 000 Hz
(±) | la linéarité du son global est moyenne (16.8% de différence avec la médiane)
Par rapport à la même classe
» 44% de tous les appareils testés de cette catégorie étaient meilleurs, 11% similaires, 46% pires
» Le meilleur avait un delta de 6%, la moyenne était de 18%, le pire était de 132%.
Par rapport à tous les appareils testés
» 29% de tous les appareils testés étaient meilleurs, 8% similaires, 63% pires
» Le meilleur avait un delta de 4%, la moyenne était de 24%, le pire était de 134%.
Gestion de l'alimentation
Consommation d'énergie
La consommation d'énergie ne se distingue pas non plus. Même si, en moyenne, le Gaming 3 consomme légèrement plus d'énergie que les autres ordinateurs portables RTX 3050 Ti, cela est principalement dû à la TGP plus élevée.
| Éteint/en veille | |
| Au repos | |
| Fortement sollicité |
|
Légende:
min: | |
| Lenovo IdeaPad Gaming 3 15IAH7 GeForce RTX 3050 Ti Laptop GPU, i5-12500H | Lenovo IdeaPad Gaming 3 15ARH7 GeForce RTX 3050 4GB Laptop GPU, R5 6600H | Dell G15 5515 GeForce RTX 3050 Ti Laptop GPU, R7 5800H | HP Victus 16-e0145ng GeForce RTX 3050 Ti Laptop GPU, R5 5600H | Dell Inspiron 16 Plus 7620 GeForce RTX 3050 Ti Laptop GPU, i7-12700H | Moyenne de la classe Gaming | |
|---|---|---|---|---|---|---|
| Power Consumption | 8% | 7% | 5% | 6% | -53% | |
| Idle Minimum * (Watt) | 8 | 7.7 4% | 5 37% | 7 12% | 6.8 15% | 13.2 ? -65% |
| Idle Average * (Watt) | 10 | 9.1 9% | 9 10% | 9 10% | 9.6 4% | 18.9 ? -89% |
| Idle Maximum * (Watt) | 16 | 15.6 2% | 20 -25% | 15 6% | 17 -6% | 24.3 ? -52% |
| Load Average * (Watt) | 99 | 90.7 8% | 94 5% | 93 6% | 117.5 -19% | 108.3 ? -9% |
| Witcher 3 ultra * (Watt) | 144.6 | 122.9 15% | 123 15% | 134.5 7% | 113.1 22% | |
| Load Maximum * (Watt) | 168 | 155.2 8% | 172 -2% | 185 -10% | 137.4 18% | 254 ? -51% |
* ... Moindre est la valeur, meilleures sont les performances
Power Consumption The Witcher 3 / Stress Test
Power Consumption With External Monitor
Autonomie de la batterie
Selon le modèle, l'IdeaPad propose une batterie de 45 Wh ou de 60 Wh. Contrairement à son homologue AMD, la version Intel testée est heureusement capable de s'en sortir avec la batterie la plus puissante. Toutefois, en raison de la consommation plus élevée, les différences restent dans les limites. Avec à peine 6 heures, l'autonomie de la batterie pendant la navigation sans fil sur Internet avec une luminosité d'écran réduite à 150 cd/m² s'avère même légèrement inférieure à celle de la version AMD. Les autres concurrents sont également en avance à cet égard.
| Lenovo IdeaPad Gaming 3 15IAH7 GeForce RTX 3050 Ti Laptop GPU, i5-12500H, 60 Wh | Lenovo IdeaPad Gaming 3 15ARH7 GeForce RTX 3050 4GB Laptop GPU, R5 6600H, 45 Wh | Dell G15 5515 GeForce RTX 3050 Ti Laptop GPU, R7 5800H, 56 Wh | HP Victus 16-e0145ng GeForce RTX 3050 Ti Laptop GPU, R5 5600H, 70 Wh | Dell Inspiron 16 Plus 7620 GeForce RTX 3050 Ti Laptop GPU, i7-12700H, 86 Wh | Moyenne de la classe Gaming | |
|---|---|---|---|---|---|---|
| Autonomie de la batterie | 10% | 36% | 20% | 63% | 19% | |
| WiFi v1.3 (h) | 5.9 | 6.5 10% | 8 36% | 7.1 20% | 9.6 63% | 7.04 ? 19% |
| Reader / Idle (h) | 2.4 | 13.5 | 18.6 | 8.71 ? | ||
| Load (h) | 0.9 | 1.5 | 1.2 | 1.47 ? | ||
| H.264 (h) | 8.8 | 8.26 ? |
Points positifs
Points négatifs
Verdict
Si l'on fait abstraction de la qualité médiocre du boîtier en termes de matériaux et de fabrication, Lenovo a créé un ordinateur portable de jeu à petit budget réussi avec l'IdeaPad Gaming 3 15IAH7.
Grâce à des TDP élevés et à un développement constant des performances, leCore i5-12500Het GeForce RTX 3050 Tisont capables de montrer toute leur puissance, tandis qu'à l'inverse, les concurrents (généralement plus lents) offrent une meilleure autonomie. Cependant, pratiquement aucun des ordinateurs portables alternatifs n'est capable d'atteindre la qualité d'image du Gaming 3. La plupart des concurrents sont à la traîne en termes d'espace colorimétrique et de luminosité. Dans notre champ de comparaison, seul le Dell Inspiron 16 Plusest capable de se rapprocher de l'ordinateur portable Lenovo.
Ceux qui attendent un bon affichage mais ne veulent pas dépenser trop d'argent pour un ordinateur portable de jeu devraient regarder de plus près l'IdeaPad Gaming 3 15IAH7.
Prix et disponibilité
Au moment de ce test, le IdeaPad Gaming 3 15IAH7 avec un Core i5-12500H, GeForce RTX 3050 Ti, 8 Go de RAM et 512 Go SSD est disponible pour 1031 $ chez BestBuy.
Lenovo IdeaPad Gaming 3 15IAH7
- 10/14/2022 v7 (old)
Florian Glaser
Price comparison

