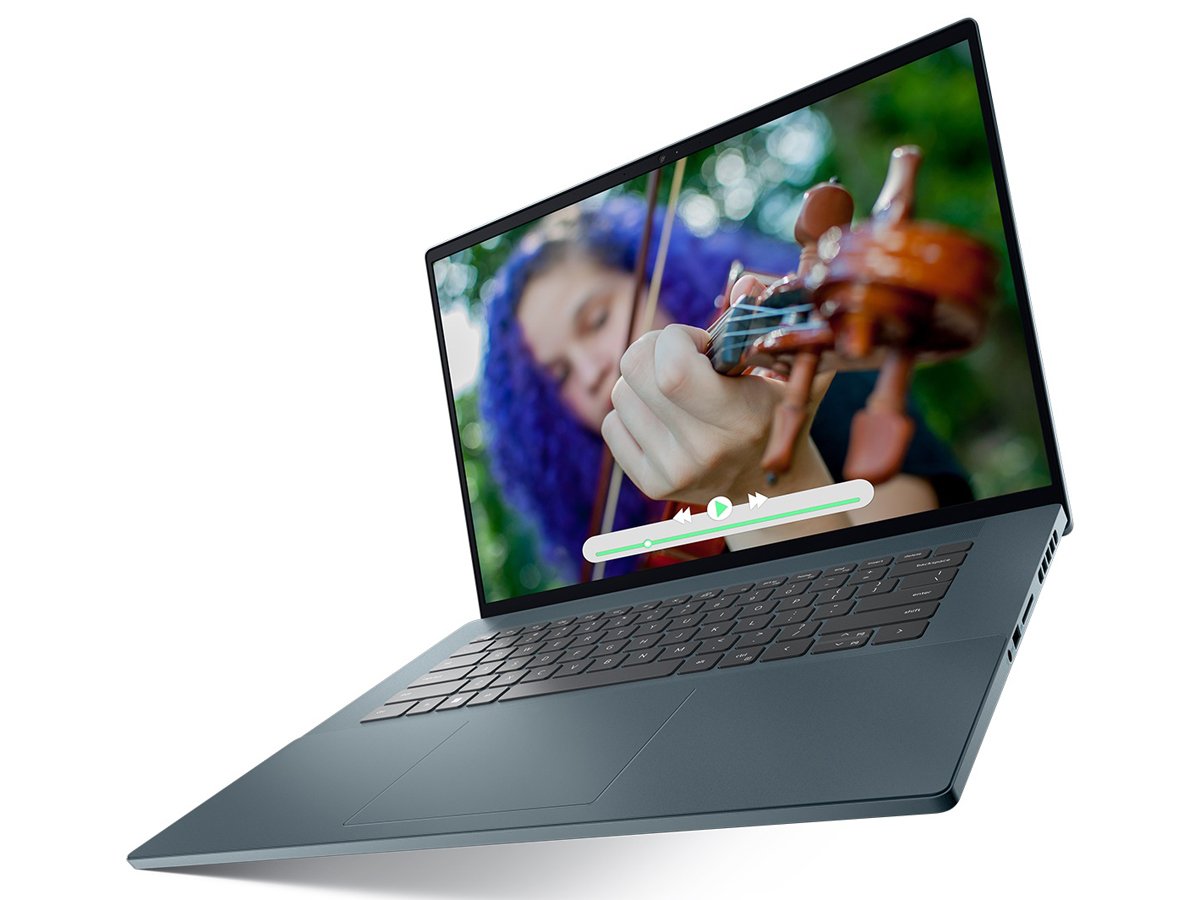
Test du Dell Inspiron 16 Plus 7620 : ordinateur portable multimédia polyvalent
Le Dell Inspiron 16 Plus 7620 de 2022 succède directement au Inspiron 16 Plus 7610 de 2021 en introduisant des CPU de 12e génération et des GPU RTX GeForce plus rapides pour remplacer les CPU de 11e génération du modèle de l'année dernière. Le fabricant a même révisé le châssis pour un look différent après seulement un an sur le marché pour la série.
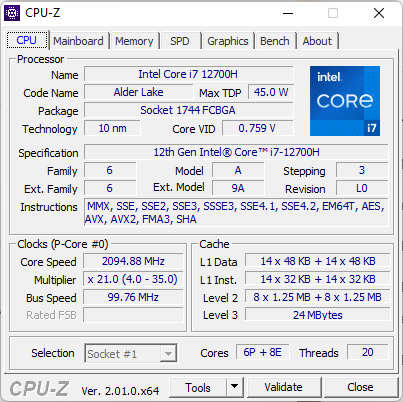
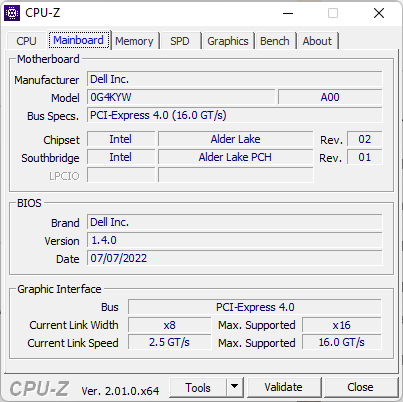
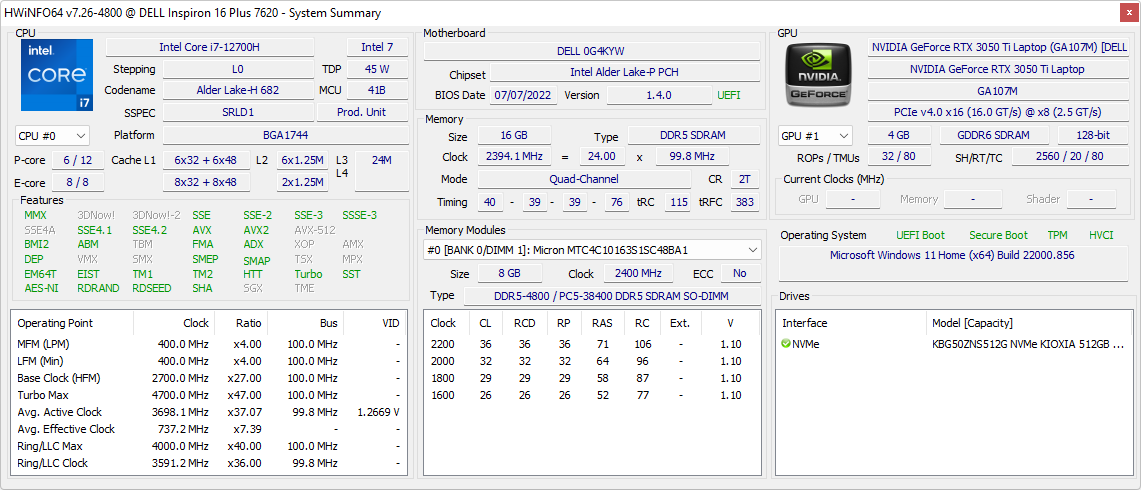
Notre unité de test est configurée avec le CPU Core i7-12700H d'Alder Lake-H, le 65 W GeForce RTX 3050 Ti et l'écran IPS 16:10 3072 x 1280 pour environ 1400 USD. D'autres SKUs avec le Core i5-12500H, la RTX 3060 de 60 W et un écran tactile de 1920 x 1200 sont également disponibles. Il existe une version 2-en-1 de ce modèle appelée Inspiron 16 Plus 7620 2-en-1.
Les concurrents dans cet espace incluent d'autres ordinateurs portables multimédia ou de création de 16 pouces de milieu à haut de gamme, comme le Lenovo Yoga 7 16IAP7, Huawei MateBook D 16, Acer Swift X, Asus Vivobook Pro 16X, ou même le MSI Creator Z16 Test du MSI Creator Z16 : le PC portable créatif avec AdobeRVB .
Plus de commentaires sur Dell :
Comparaison avec les concurrents potentiels
Note | Date | Modèle | Poids | Épaisseur | Taille | Résolution | Prix |
|---|---|---|---|---|---|---|---|
| 87.4 % v7 (old) | 08/22 | Dell Inspiron 16 Plus 7620 i7-12700H, GeForce RTX 3050 Ti Laptop GPU | 2.1 kg | 18.99 mm | 16.00" | 3072x1920 | |
| 86.7 % v7 (old) | 08/21 | Dell Inspiron 16 Plus 7610 i7-11800H, GeForce RTX 3050 4GB Laptop GPU | 2 kg | 18.99 mm | 16.00" | 3072x1920 | |
| 88.7 % v7 (old) | 08/22 | Lenovo Yoga 7 16IAP7 i7-1260P, Iris Xe G7 96EUs | 2 kg | 19.2 mm | 16.00" | 2560x1600 | |
| 83.6 % v7 (old) | 07/22 | Huawei MateBook D 16 2022 i7-12700H, Iris Xe G7 96EUs | 1.7 kg | 18.4 mm | 16.00" | 1920x1200 | |
| 86.2 % v7 (old) | 07/22 | Acer Swift X SFX16-51G-5388 i5-11320H, GeForce RTX 3050 4GB Laptop GPU | 1.8 kg | 18.9 mm | 16.10" | 1920x1080 | |
v (old) | 12/21 | Asus Vivobook Pro 16X-M7600QE R9 5900HX, GeForce RTX 3050 Ti Laptop GPU | 1.9 kg | 19 mm | 16.10" | 3840x2400 |
Cas - Tons plus foncés
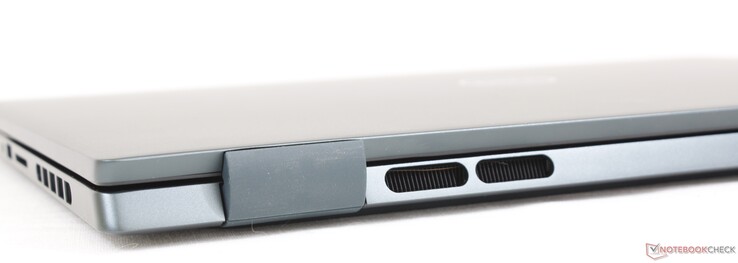
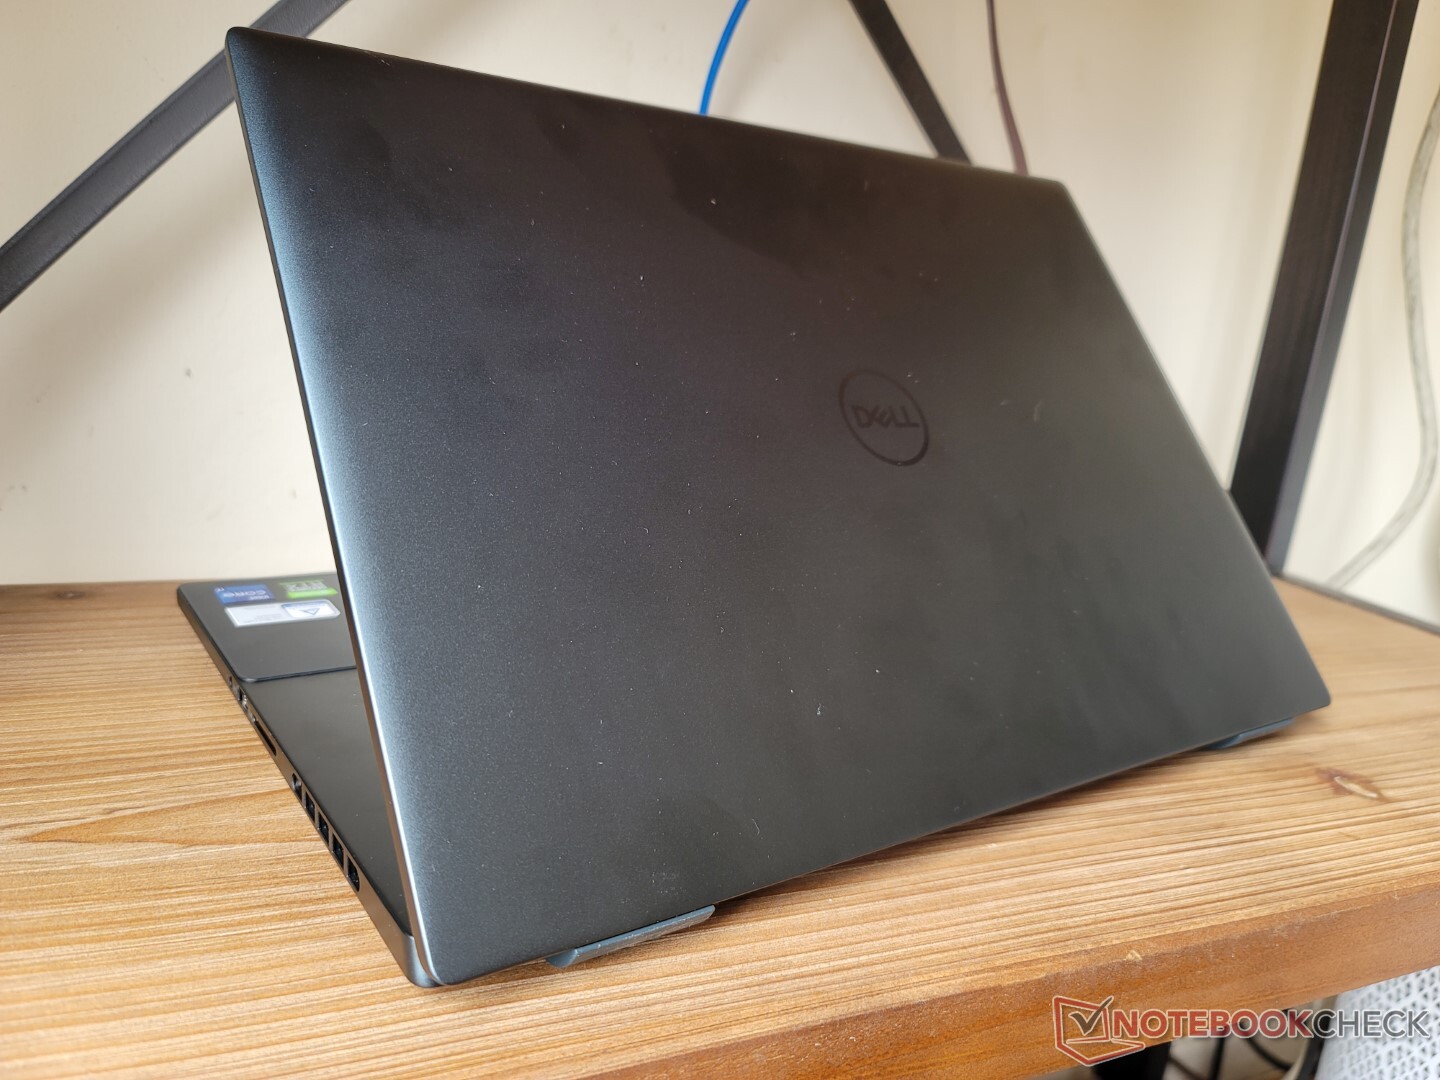
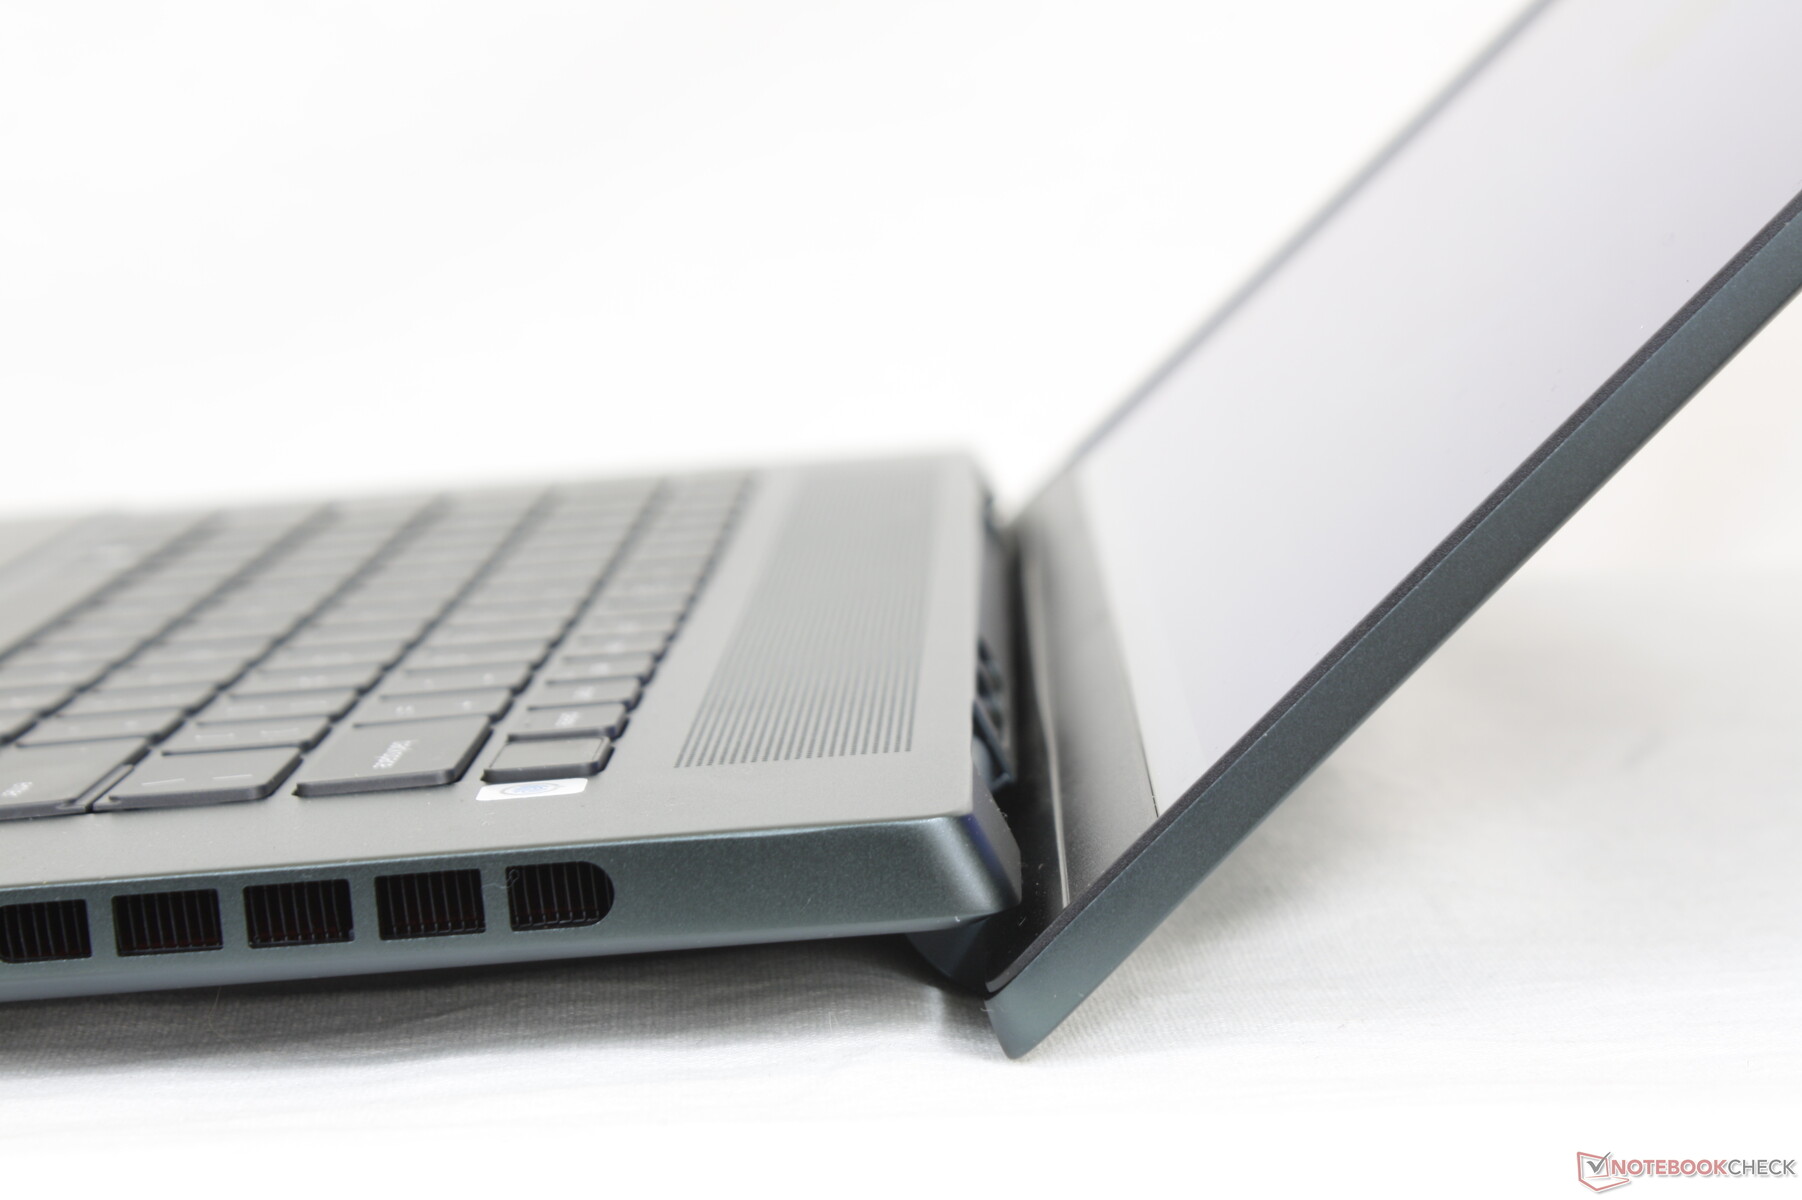
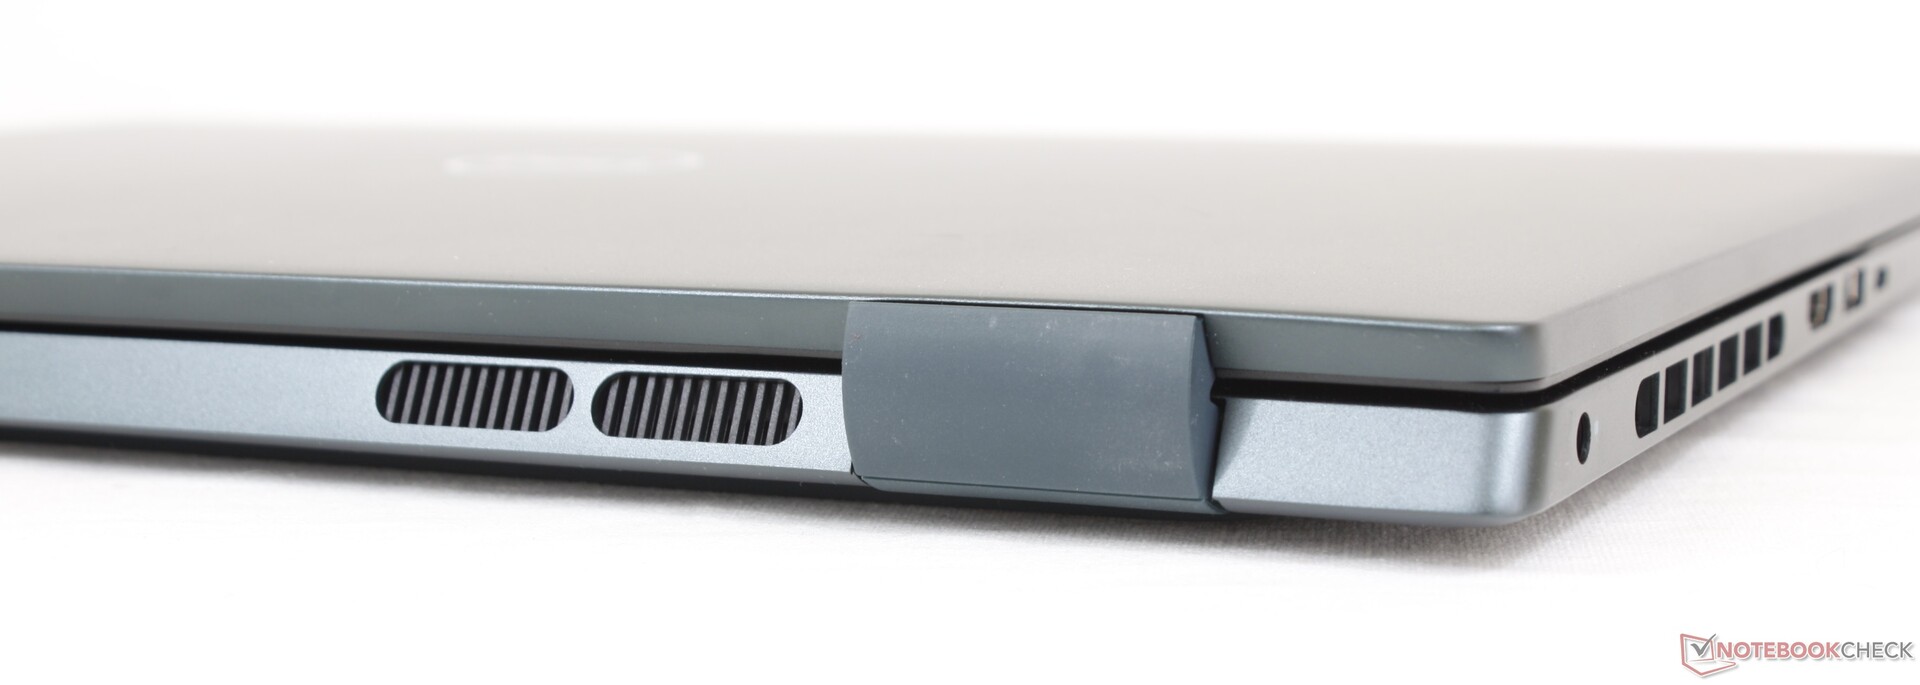
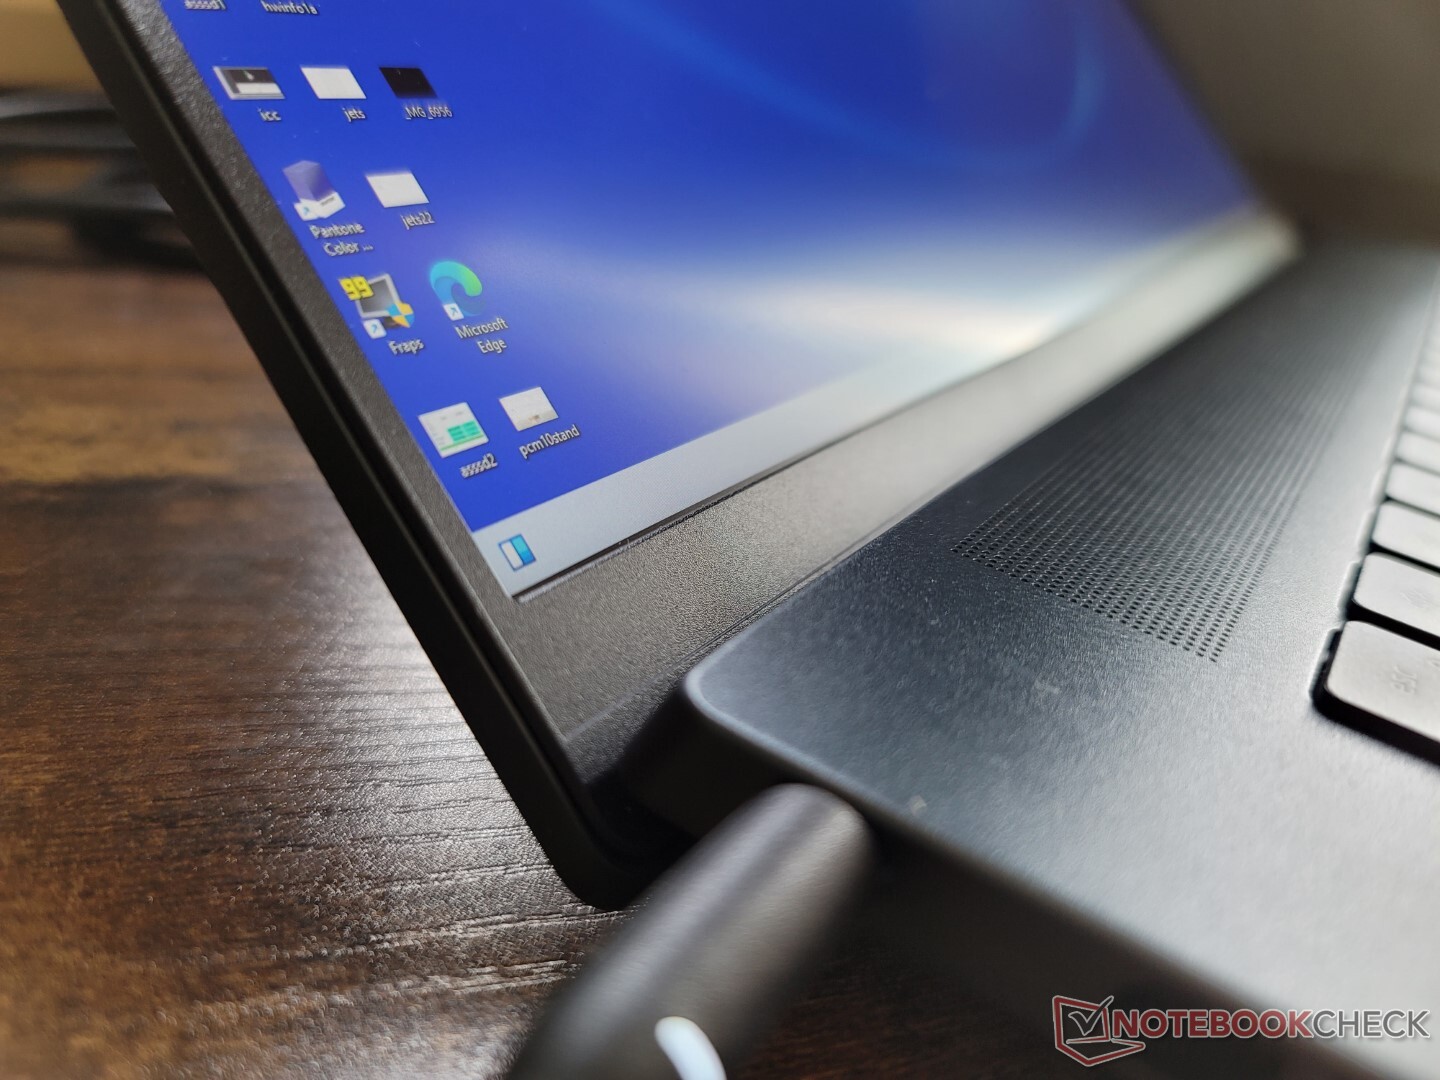
Visuellement, les différences entre les modèles 2021 et 2022 sont immédiatement perceptibles. Les grilles d'aération sur les côtés et à l'arrière, par exemple, sont désormais rectangulaires et ovales, respectivement, et non plus circulaires. Les bords et les coins chromés ont disparu pour un aspect plus monochrome et moins orné
La qualité de fabrication reste à peu près la même. La base métallique se tord et grince un peu plus que sur un XPS ou un Spectre plus cher, et c'est particulièrement vrai pour le couvercle. Nous espérions que tous les changements visuels conduiraient à un châssis plus solide, mais cela ne semble pas être le cas. Si vous avez toujours le modèle 2021, vous ne manquerez pas grand-chose du point de vue du design avec le modèle 2022.
L'un de nos reproches à l'égard de l'Inspiron 16 Plus 7610 était son poids et cela reste vrai pour le 7620, malgré la refonte du châssis. Avec un poids de 2 à 2,1 kg, le système est plus lourd de quelques centaines de grammes que l'Inspiron 16 Plus 7610 de 16 pouces Acer Swift X ou le Huawei MateBook D 16. Le nouveau design n'est pas plus petit non plus, puisque les dimensions sont en fait légèrement supérieures à celles du 7610.
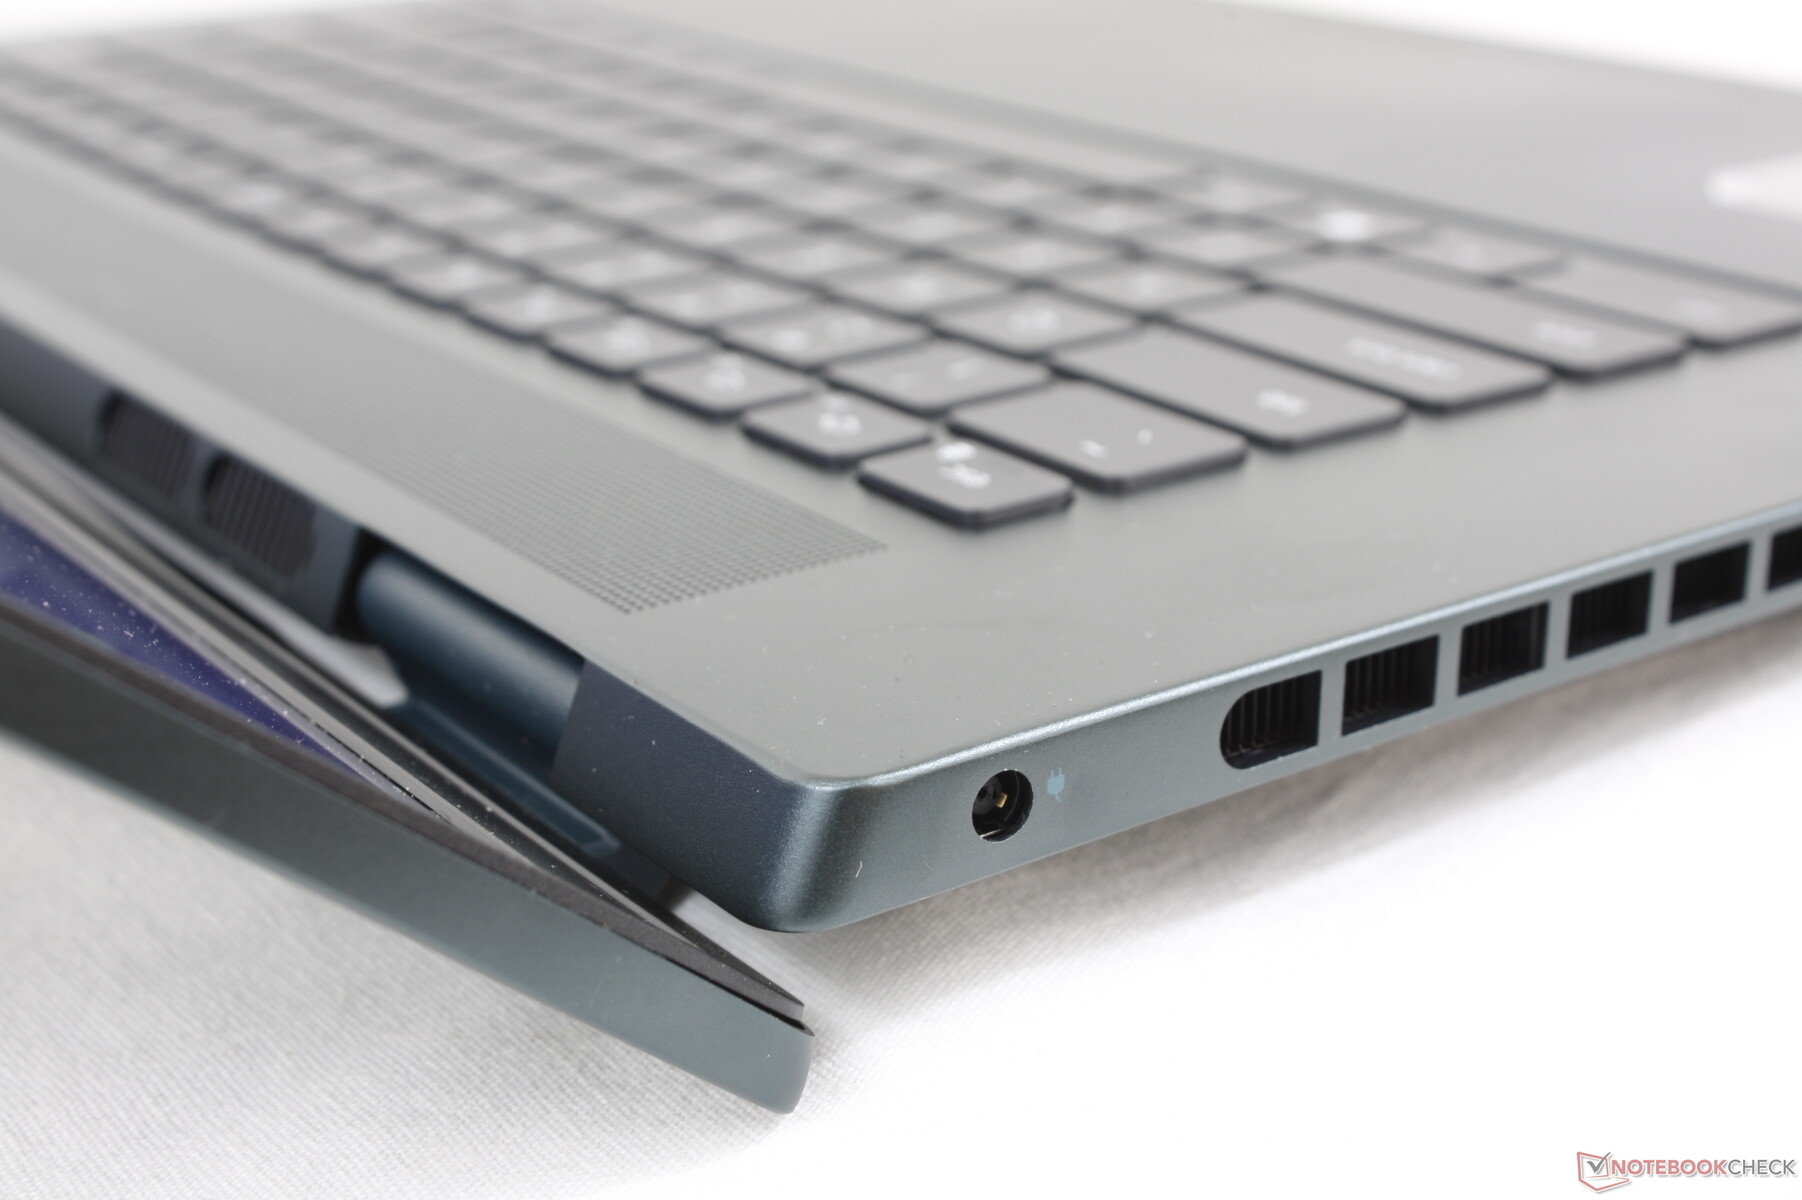
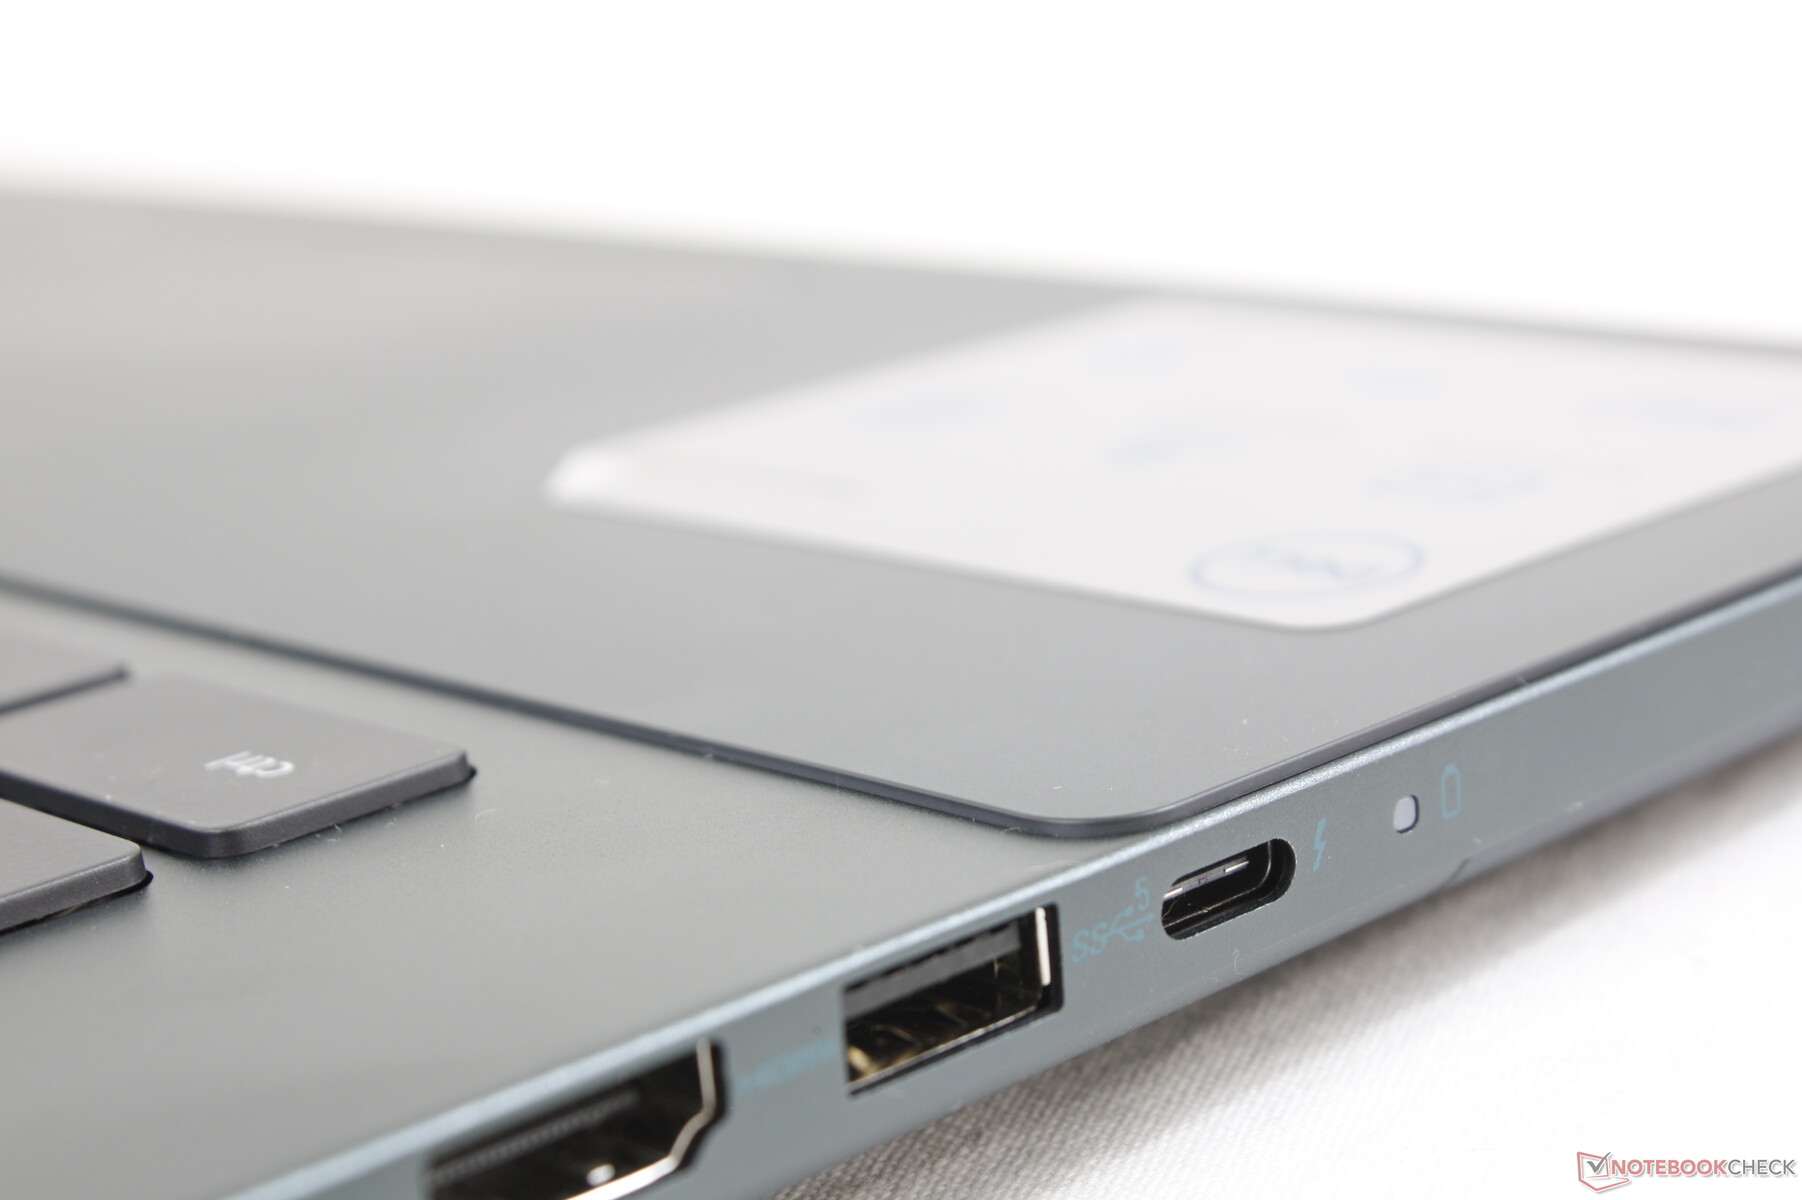
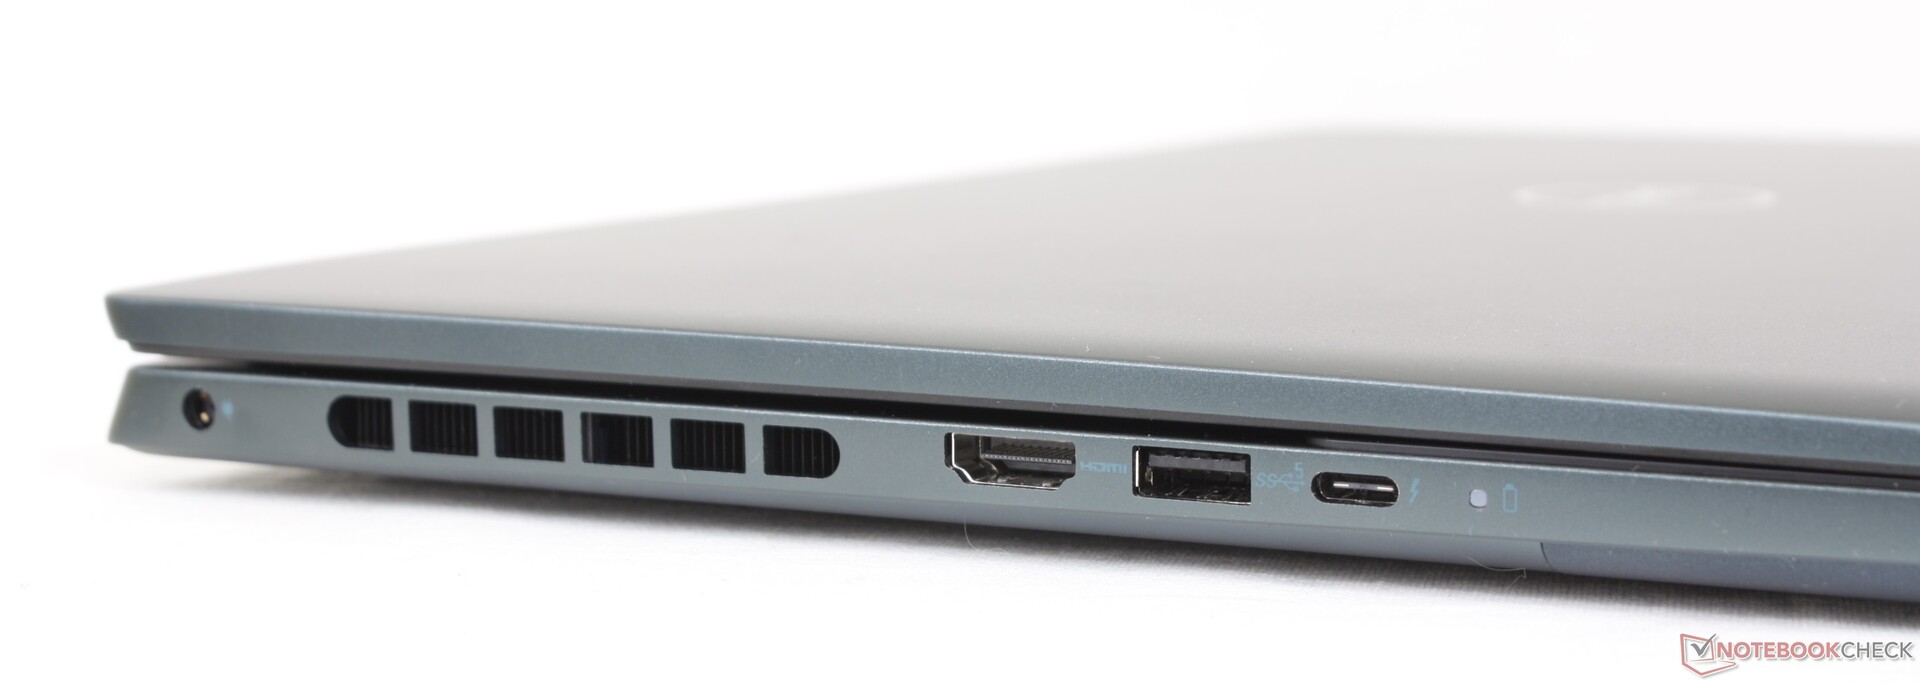
Connectivité - Support Thunderbolt 4
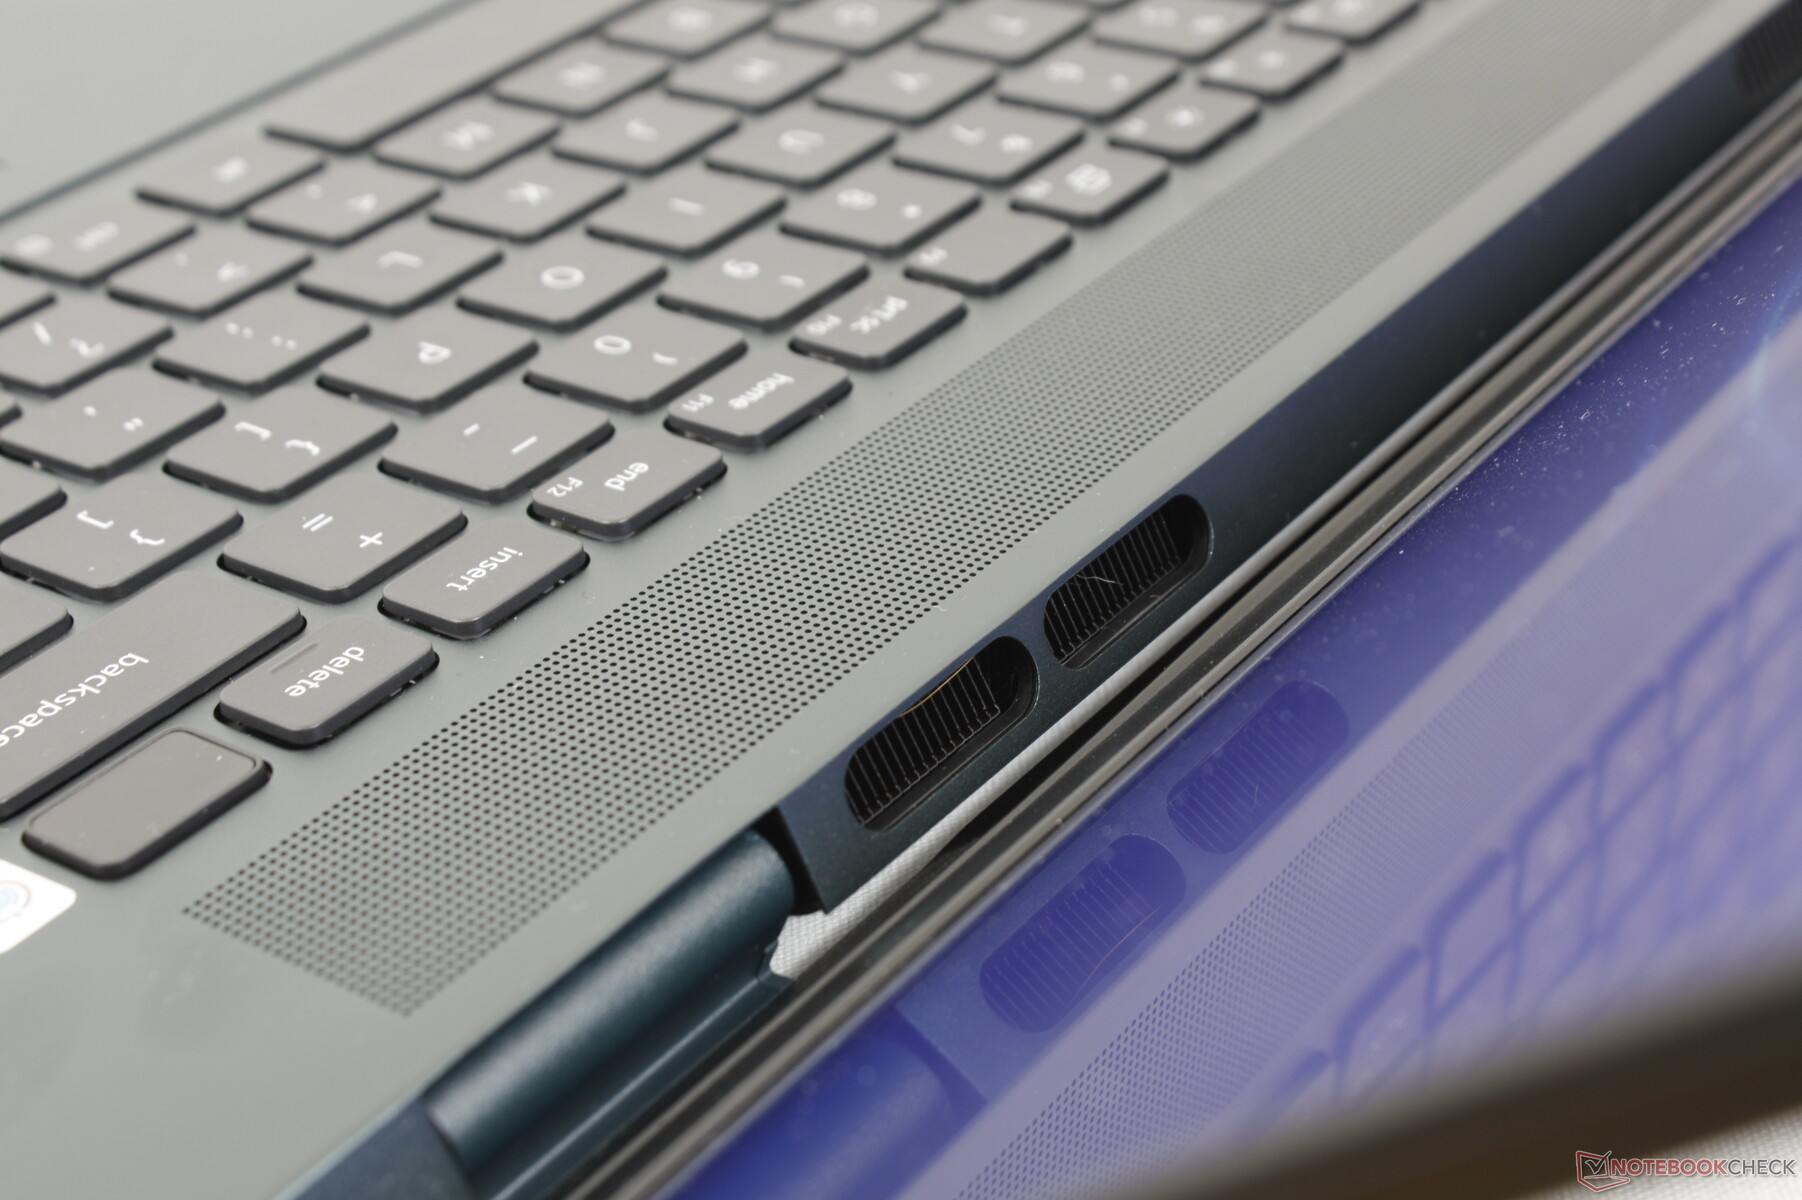
Le 7620 embarque tous les mêmes ports que l'on trouve sur le 7610 malgré les changements extérieurs. Un deuxième port USB-C comme sur le Lenovo Yoga 7 16 Gen 7 aurait été agréable à avoir étant donné la taille et le poids de l'appareil.
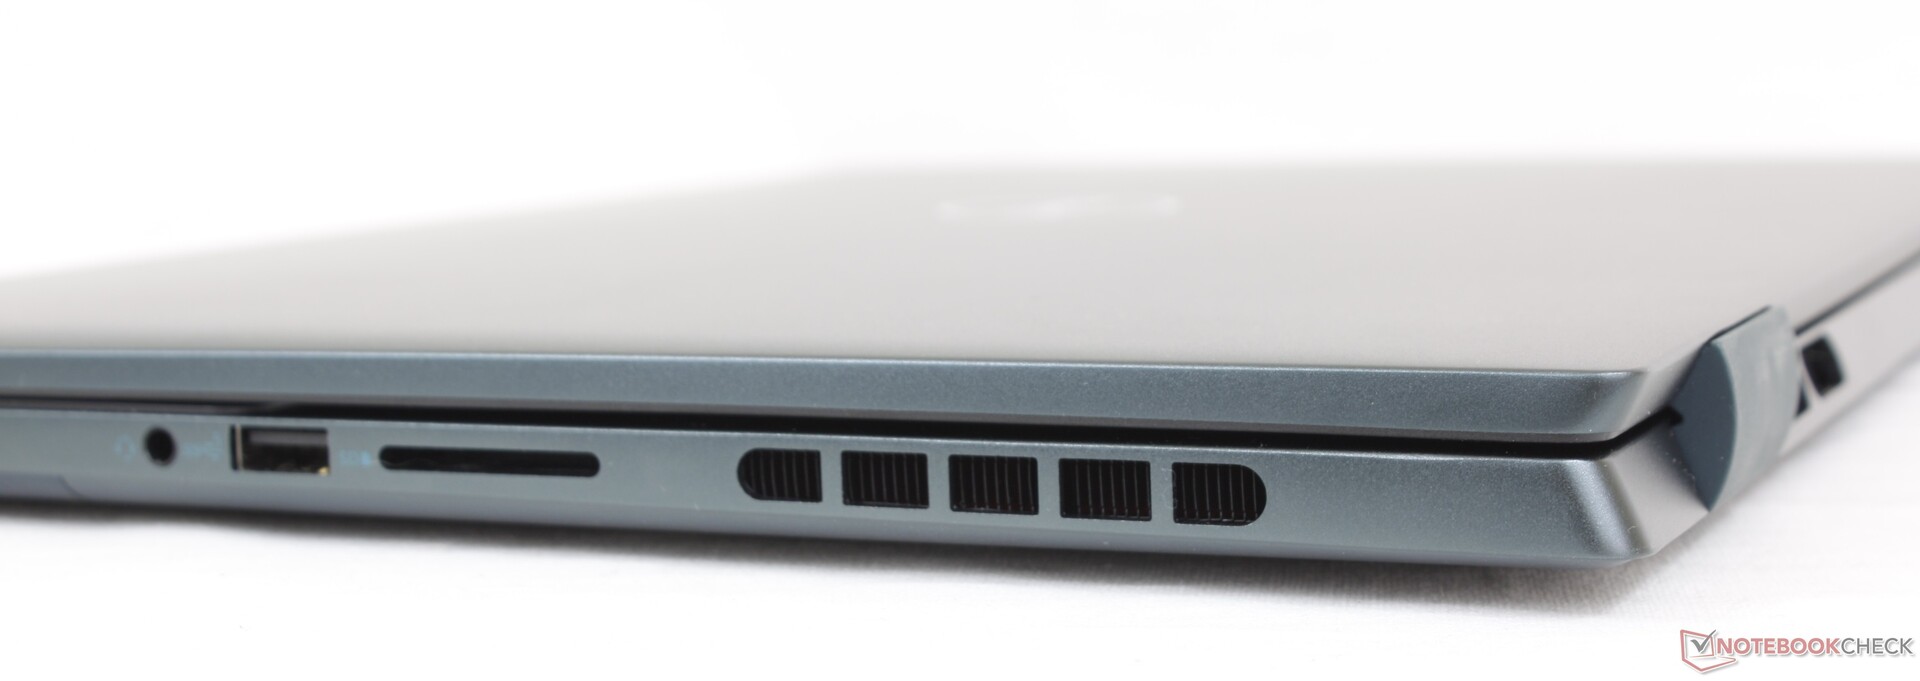
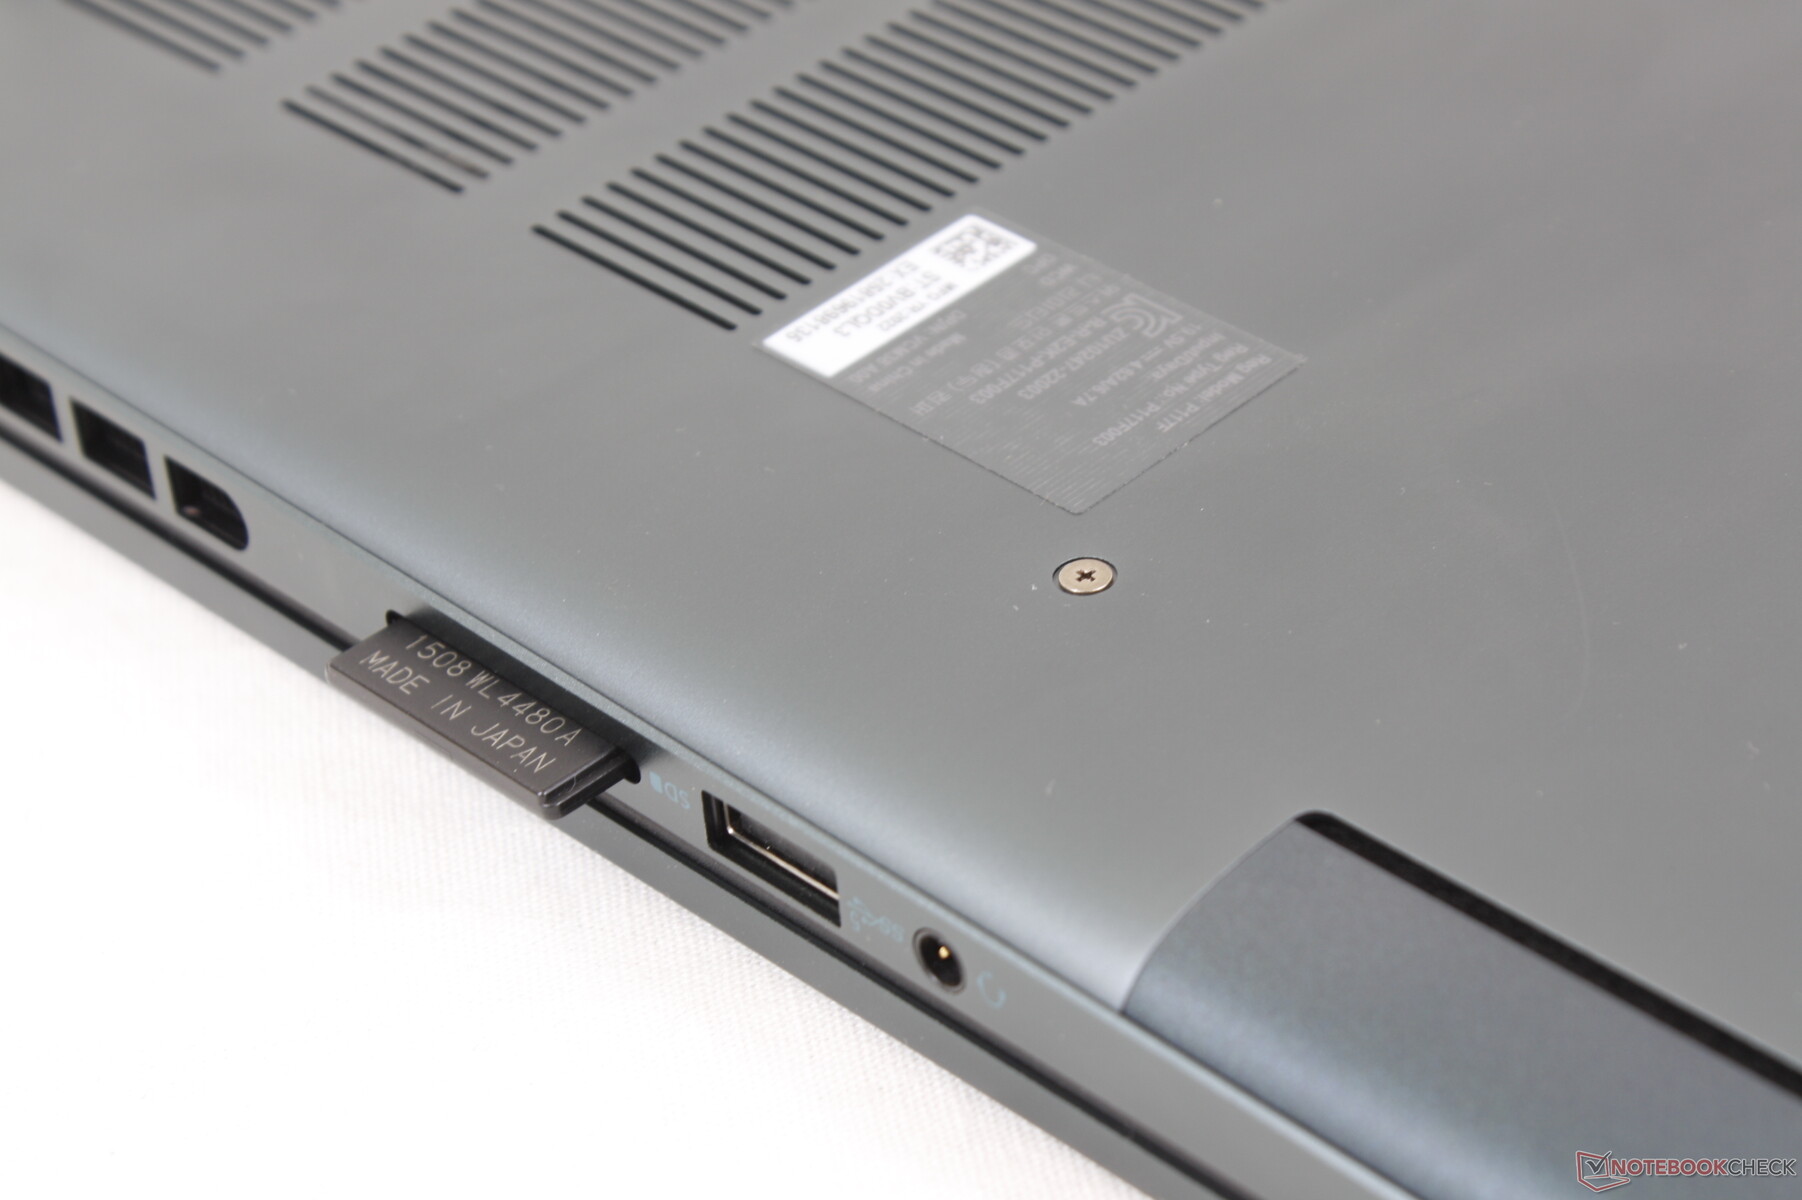
Lecteur de carte SD
Les taux de transfert avec la carte SD continuent d'être très lents. Il est clair maintenant que Dell veut que les utilisateurs passent à la série XPS, plus onéreuse s'ils veulent des performances plus rapides avec la carte SD.
Notez que le RTX 3060 SKU est livré avec un lecteur MicroSD au lieu d'un lecteur de taille normale.
| SD Card Reader | |
| average JPG Copy Test (av. of 3 runs) | |
| Dell XPS 15 9520 RTX 3050 Ti (Toshiba Exceria Pro SDXC 64 GB UHS-II) | |
| Lenovo Yoga 7 16IAP7 (Toshiba Exceria Pro SDXC 64 GB UHS-II) | |
| Asus Vivobook Pro 16X-M7600QE (AV Pro SD microSD 128 GB V60) | |
| Dell Inspiron 16 Plus 7620 (Toshiba Exceria Pro SDXC 64 GB UHS-II) | |
| Dell Inspiron 16 Plus 7610 (AV PRO microSD 128 GB V60) | |
| maximum AS SSD Seq Read Test (1GB) | |
| Dell XPS 15 9520 RTX 3050 Ti (Toshiba Exceria Pro SDXC 64 GB UHS-II) | |
| Lenovo Yoga 7 16IAP7 (Toshiba Exceria Pro SDXC 64 GB UHS-II) | |
| Asus Vivobook Pro 16X-M7600QE (AV Pro SD microSD 128 GB V60) | |
| Dell Inspiron 16 Plus 7620 (Toshiba Exceria Pro SDXC 64 GB UHS-II) | |
| Dell Inspiron 16 Plus 7610 (AV PRO microSD 128 GB V60) | |
Communication
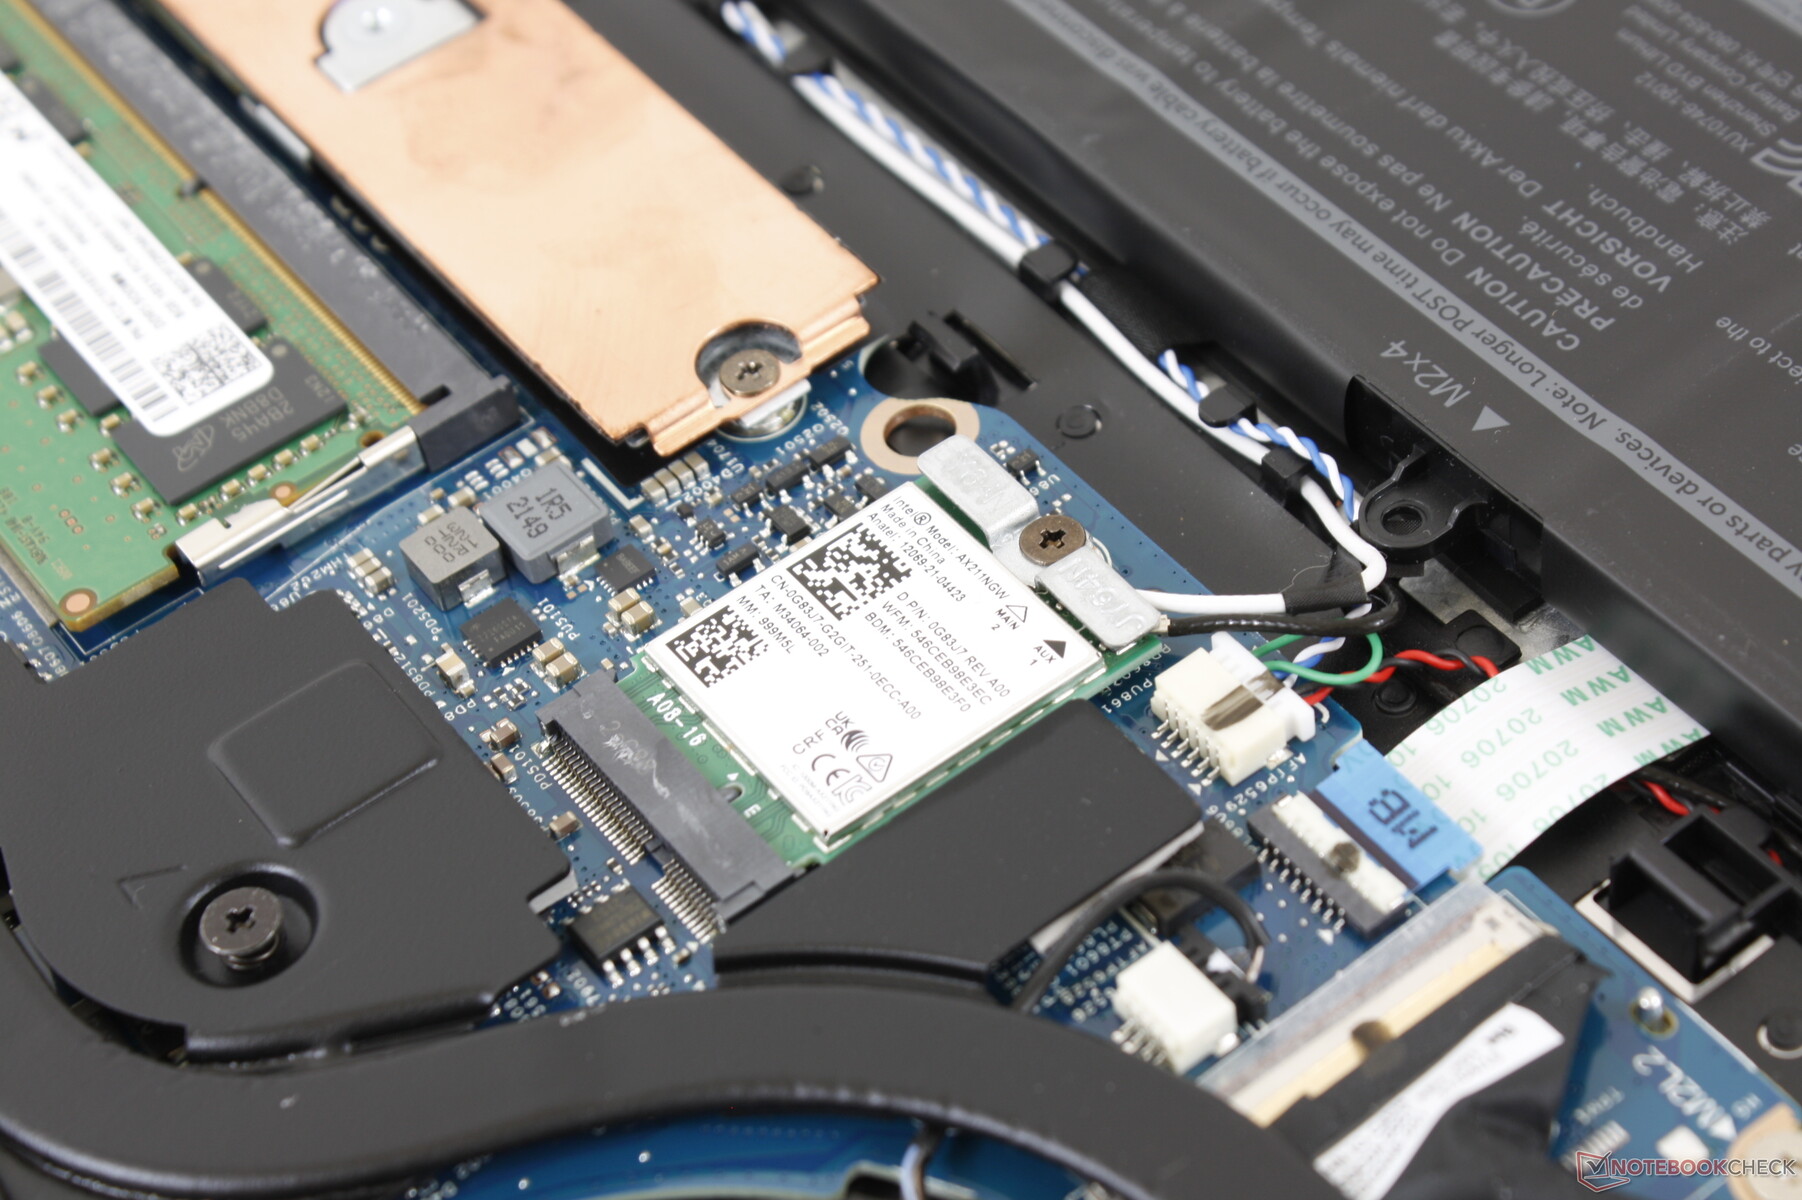
Les SKUs peuvent être configurés avec le Intel AX201 ou AX211 pour la connectivité Wi-Fi 6 et Wi-Fi 6E, respectivement. Dans notre unité, l'AX211 présente d'excellents taux de réception lorsqu'il est couplé à notre routeur 6 GHz, mais les taux de transmission ne sont pas aussi stables que prévu, même après plusieurs tentatives.
| Networking | |
| iperf3 transmit AX12 | |
| Acer Swift X SFX16-51G-5388 | |
| Dell Inspiron 16 Plus 7610 | |
| Asus Vivobook Pro 16X-M7600QE | |
| iperf3 receive AX12 | |
| Acer Swift X SFX16-51G-5388 | |
| Dell Inspiron 16 Plus 7610 | |
| Asus Vivobook Pro 16X-M7600QE | |
| iperf3 receive AXE11000 6GHz | |
| Lenovo Yoga 7 16IAP7 | |
| Dell Inspiron 16 Plus 7620 | |
| iperf3 transmit AXE11000 6GHz | |
| Lenovo Yoga 7 16IAP7 | |
| Dell Inspiron 16 Plus 7620 | |
Webcam - désormais 2 MP au lieu de 1 MP
Dell a fait passer la webcam de 720p ou 1 MP sur l'Inspiron 16 Plus 7610 à 1080p ou 2 MP sur le modèle 7620 pour des images plus nettes. Il y a un support pour Windows Hello et un obturateur physique de la webcam pour la confidentialité.


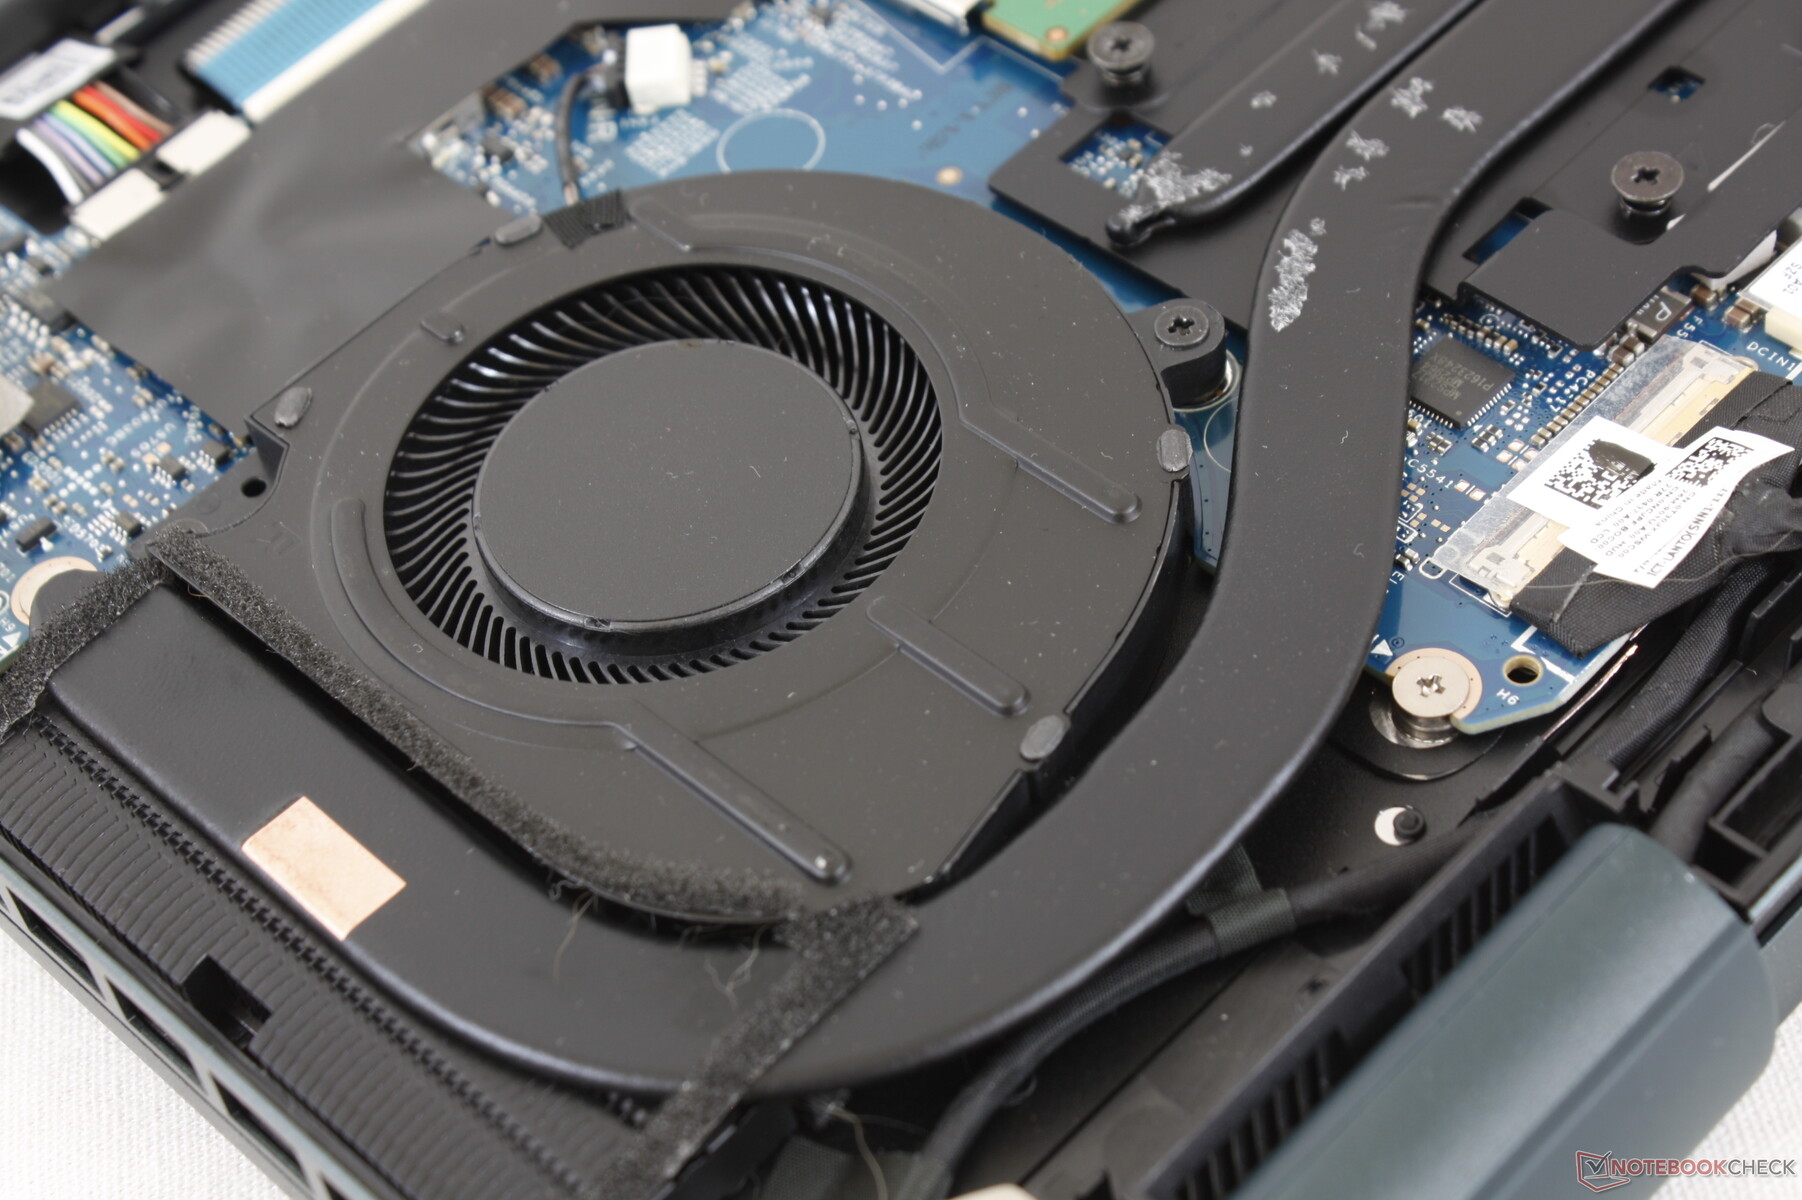
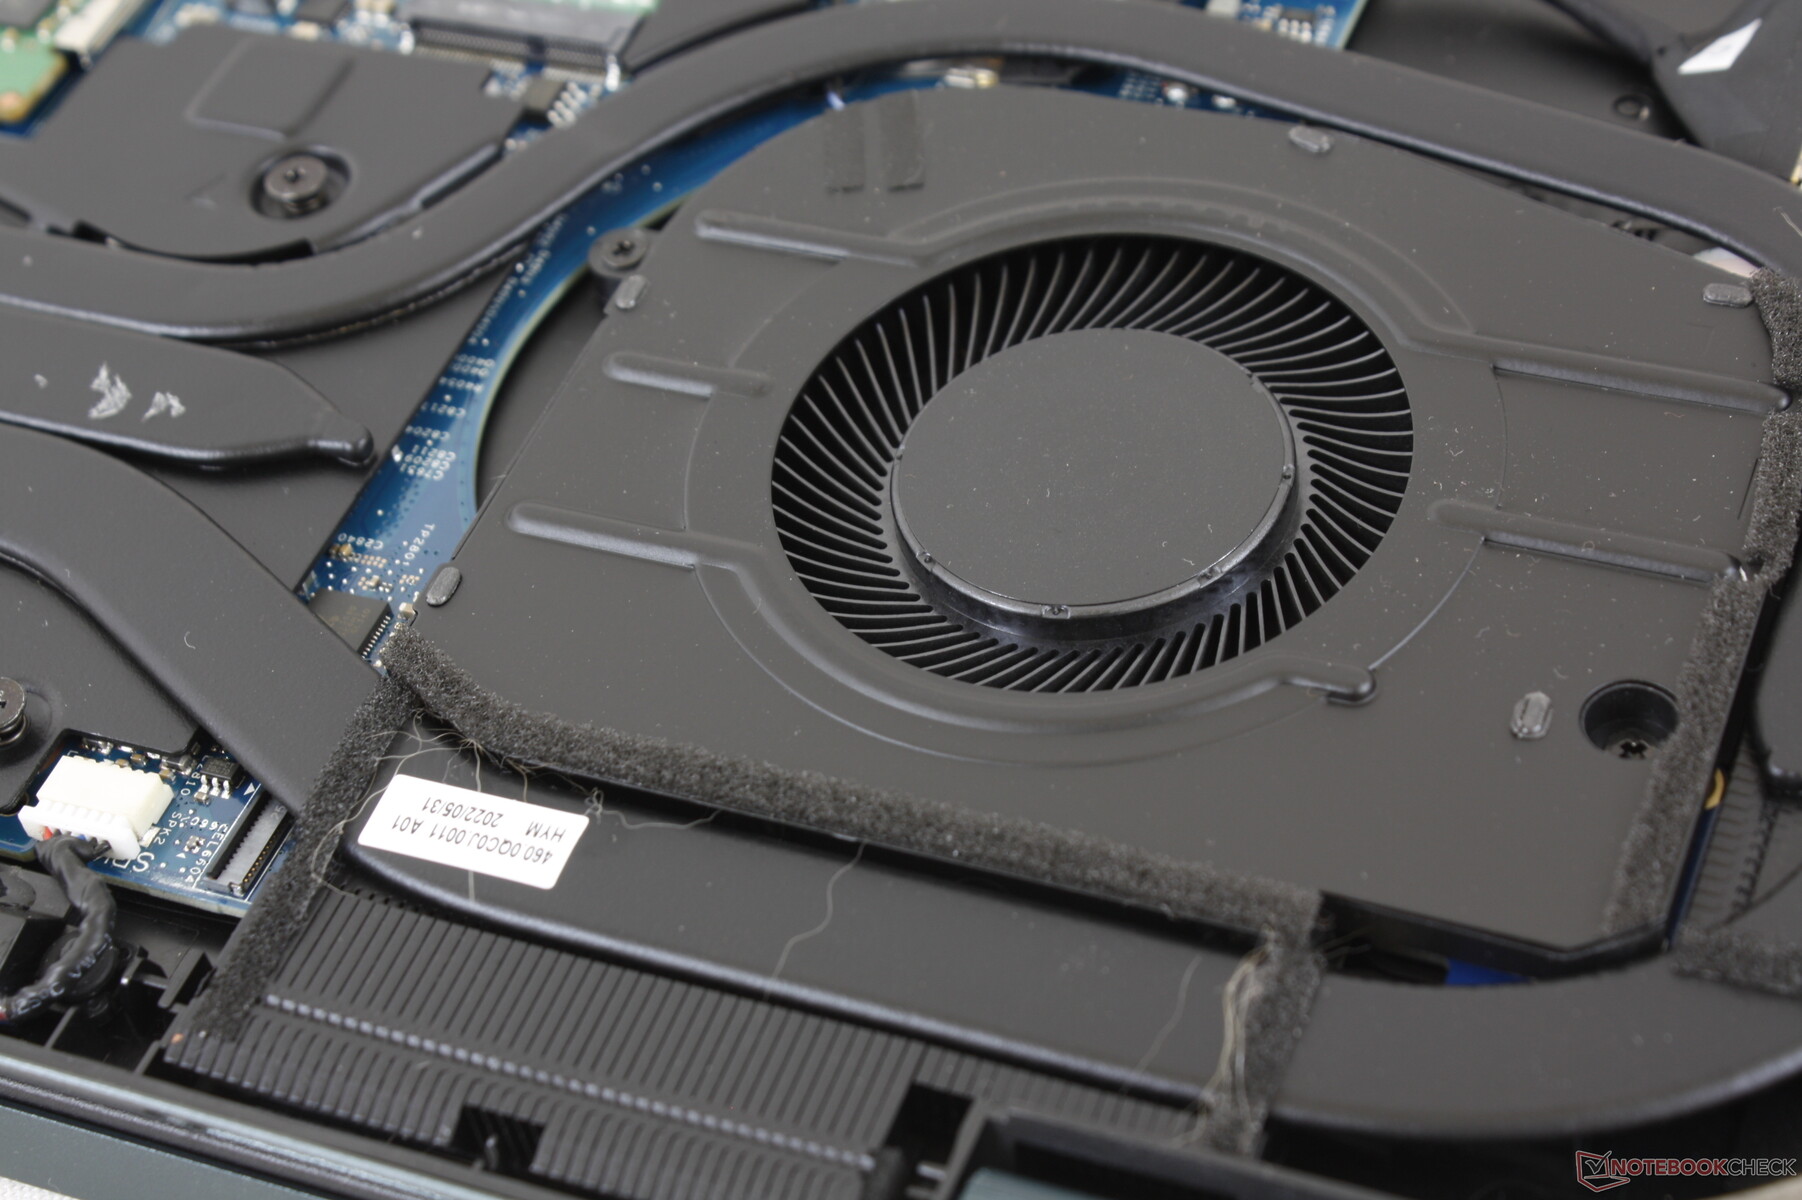
Maintenance
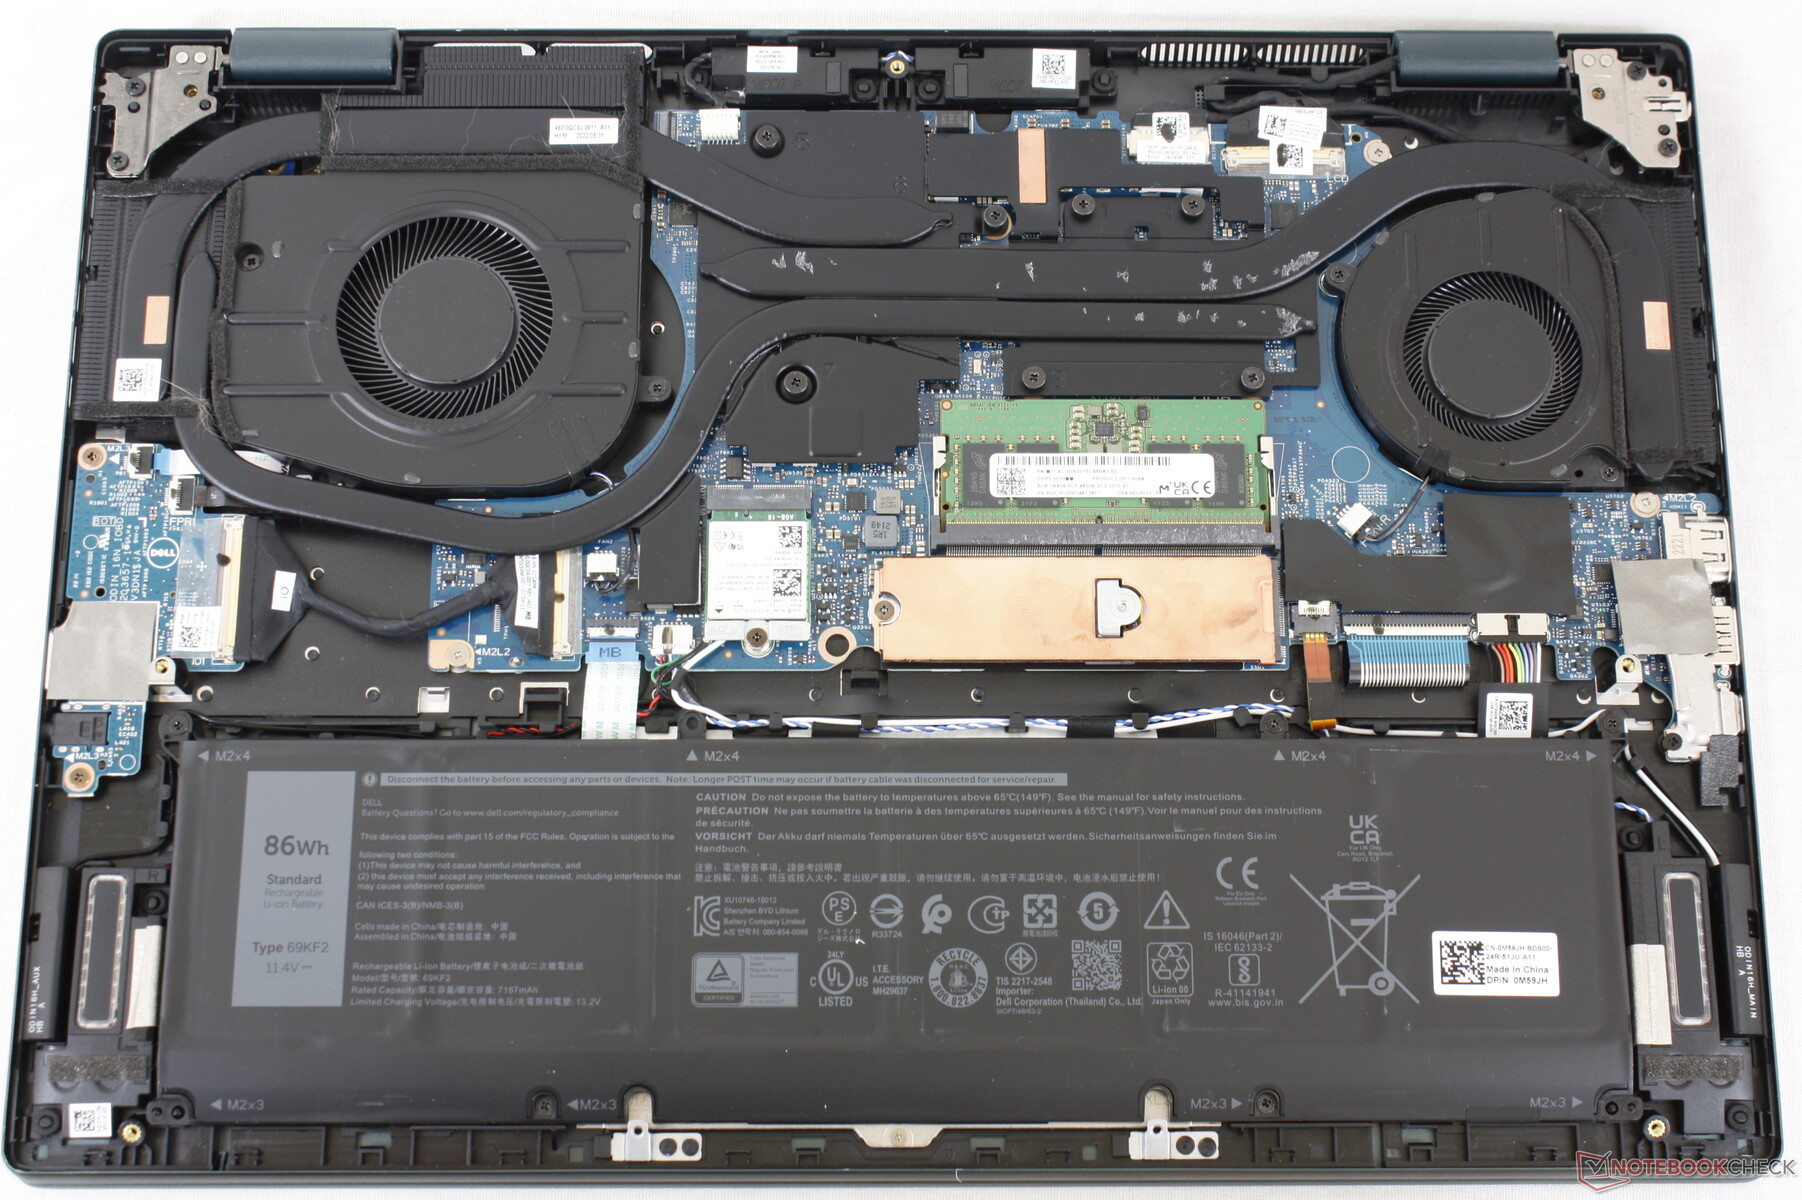
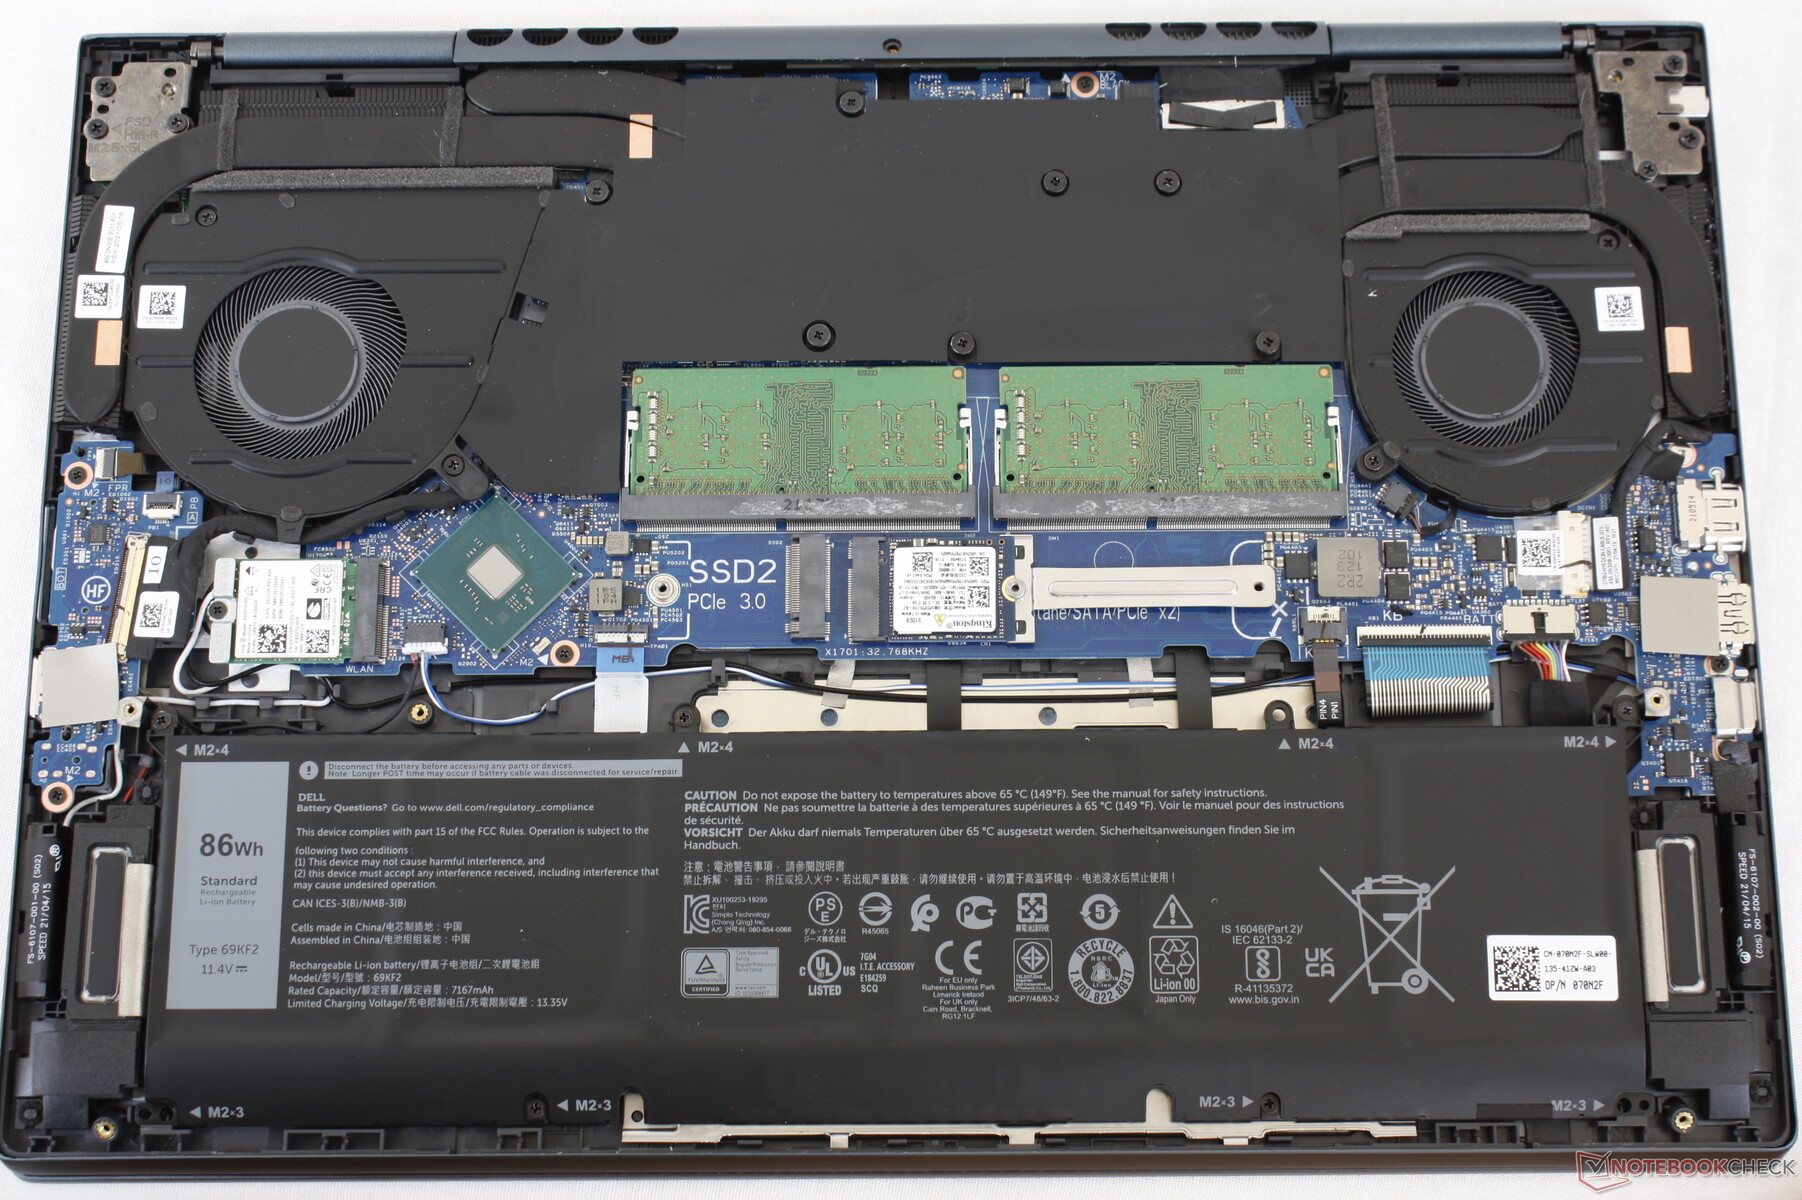
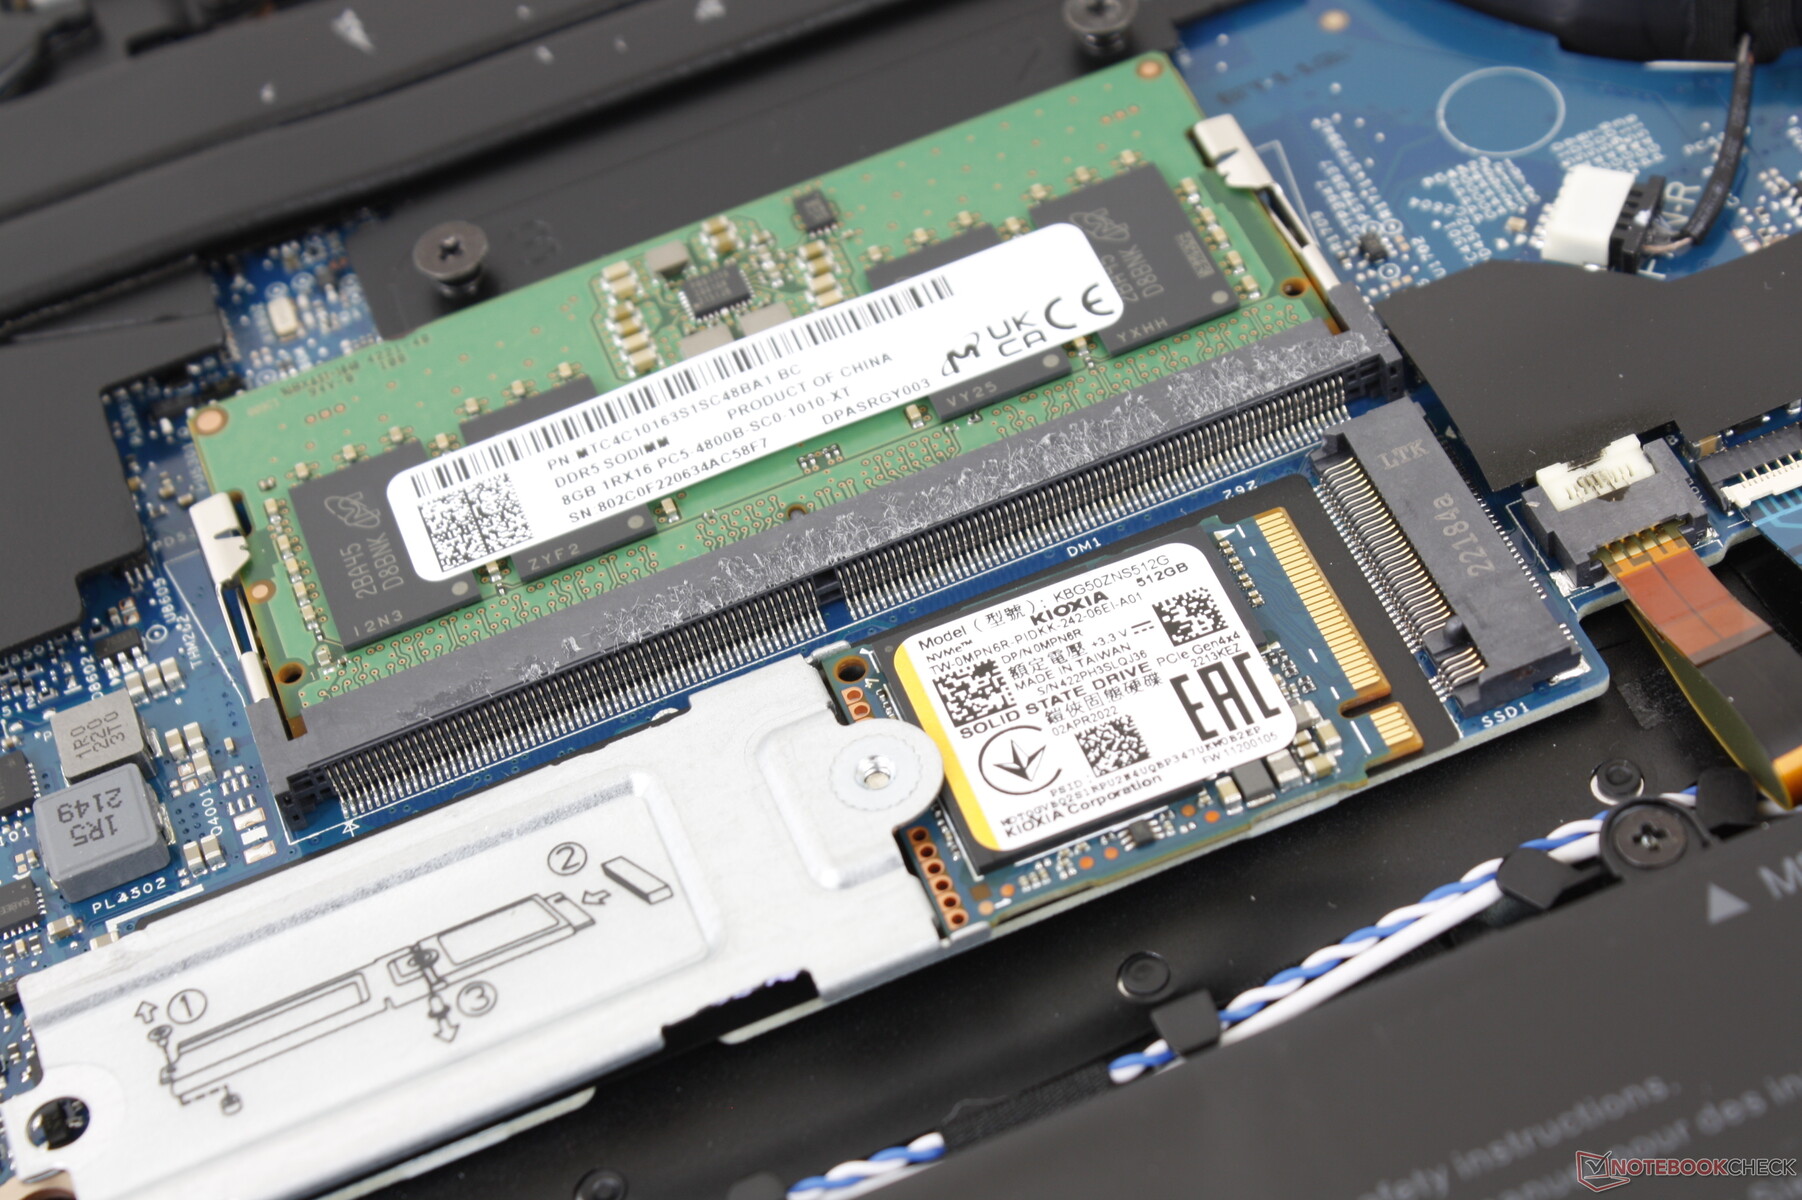
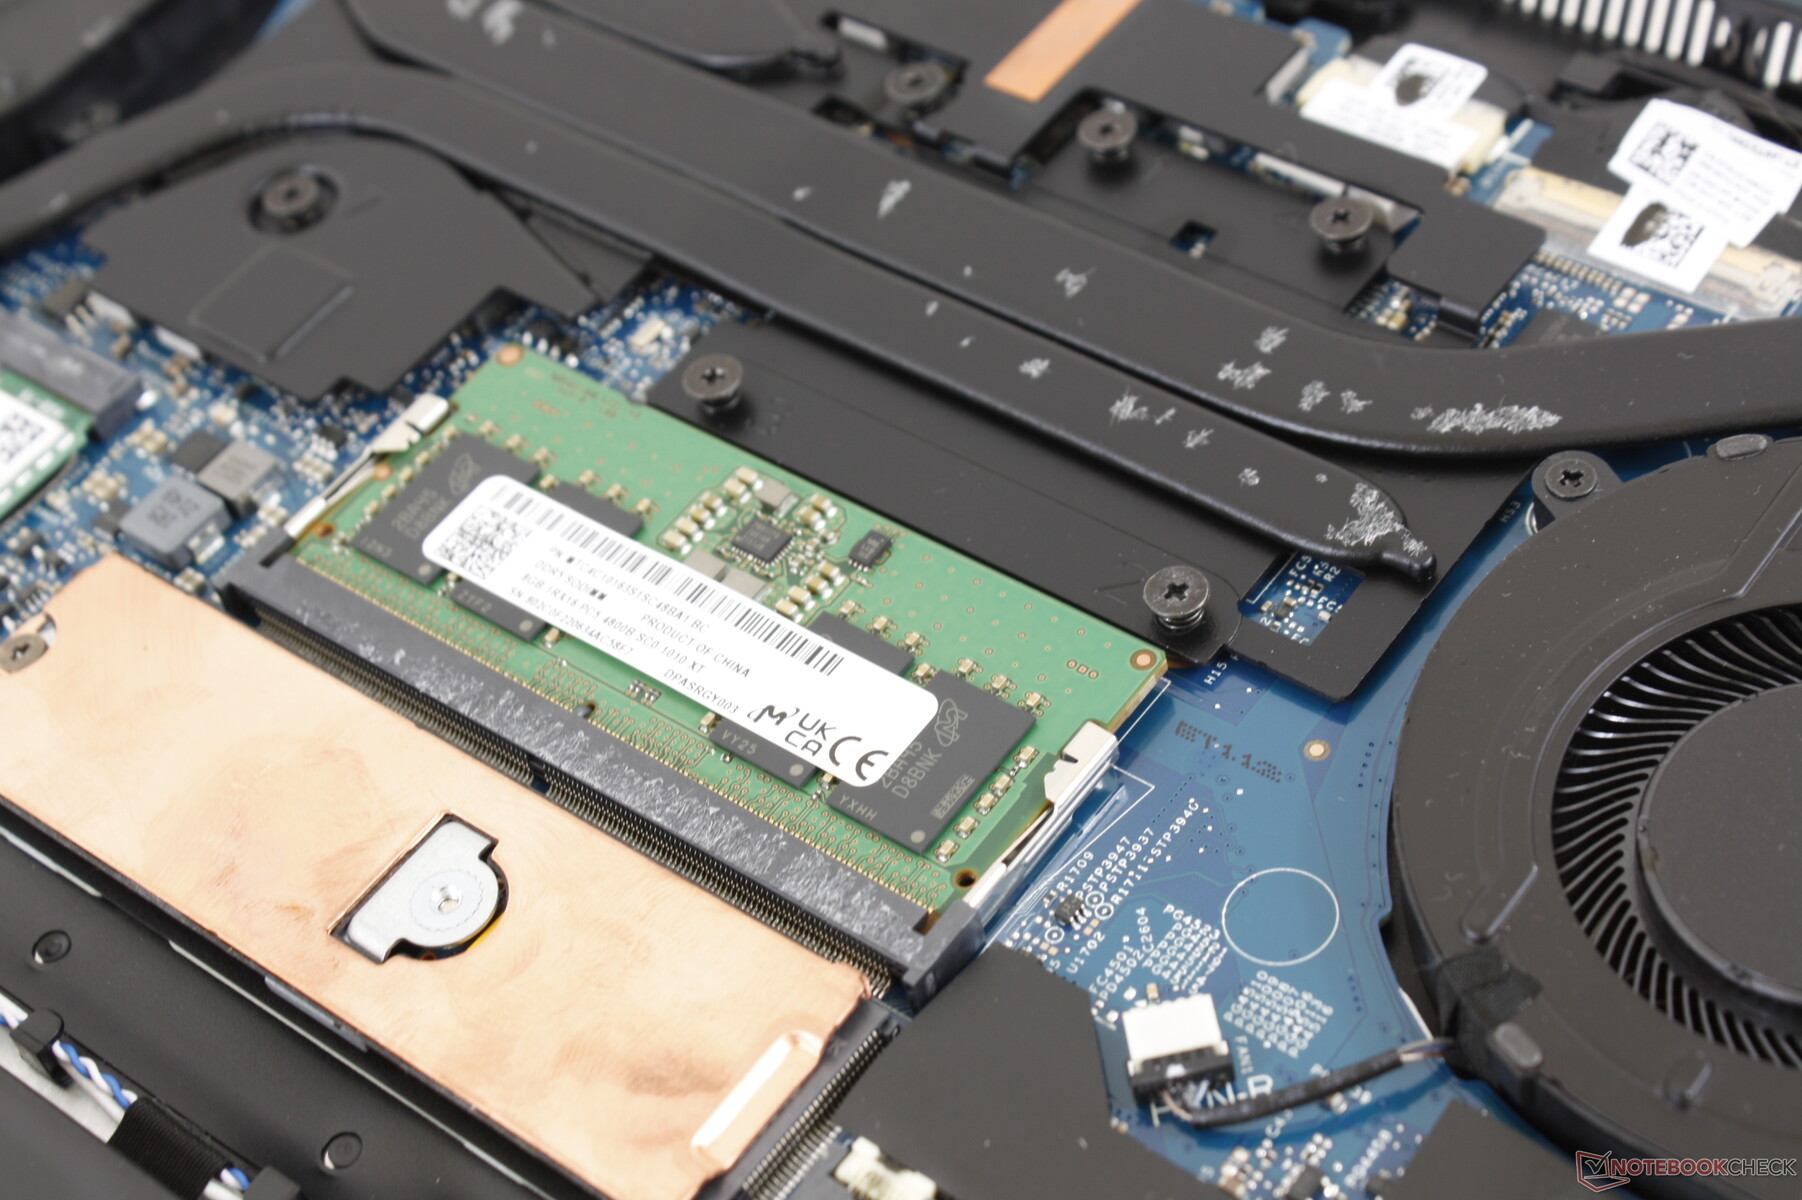
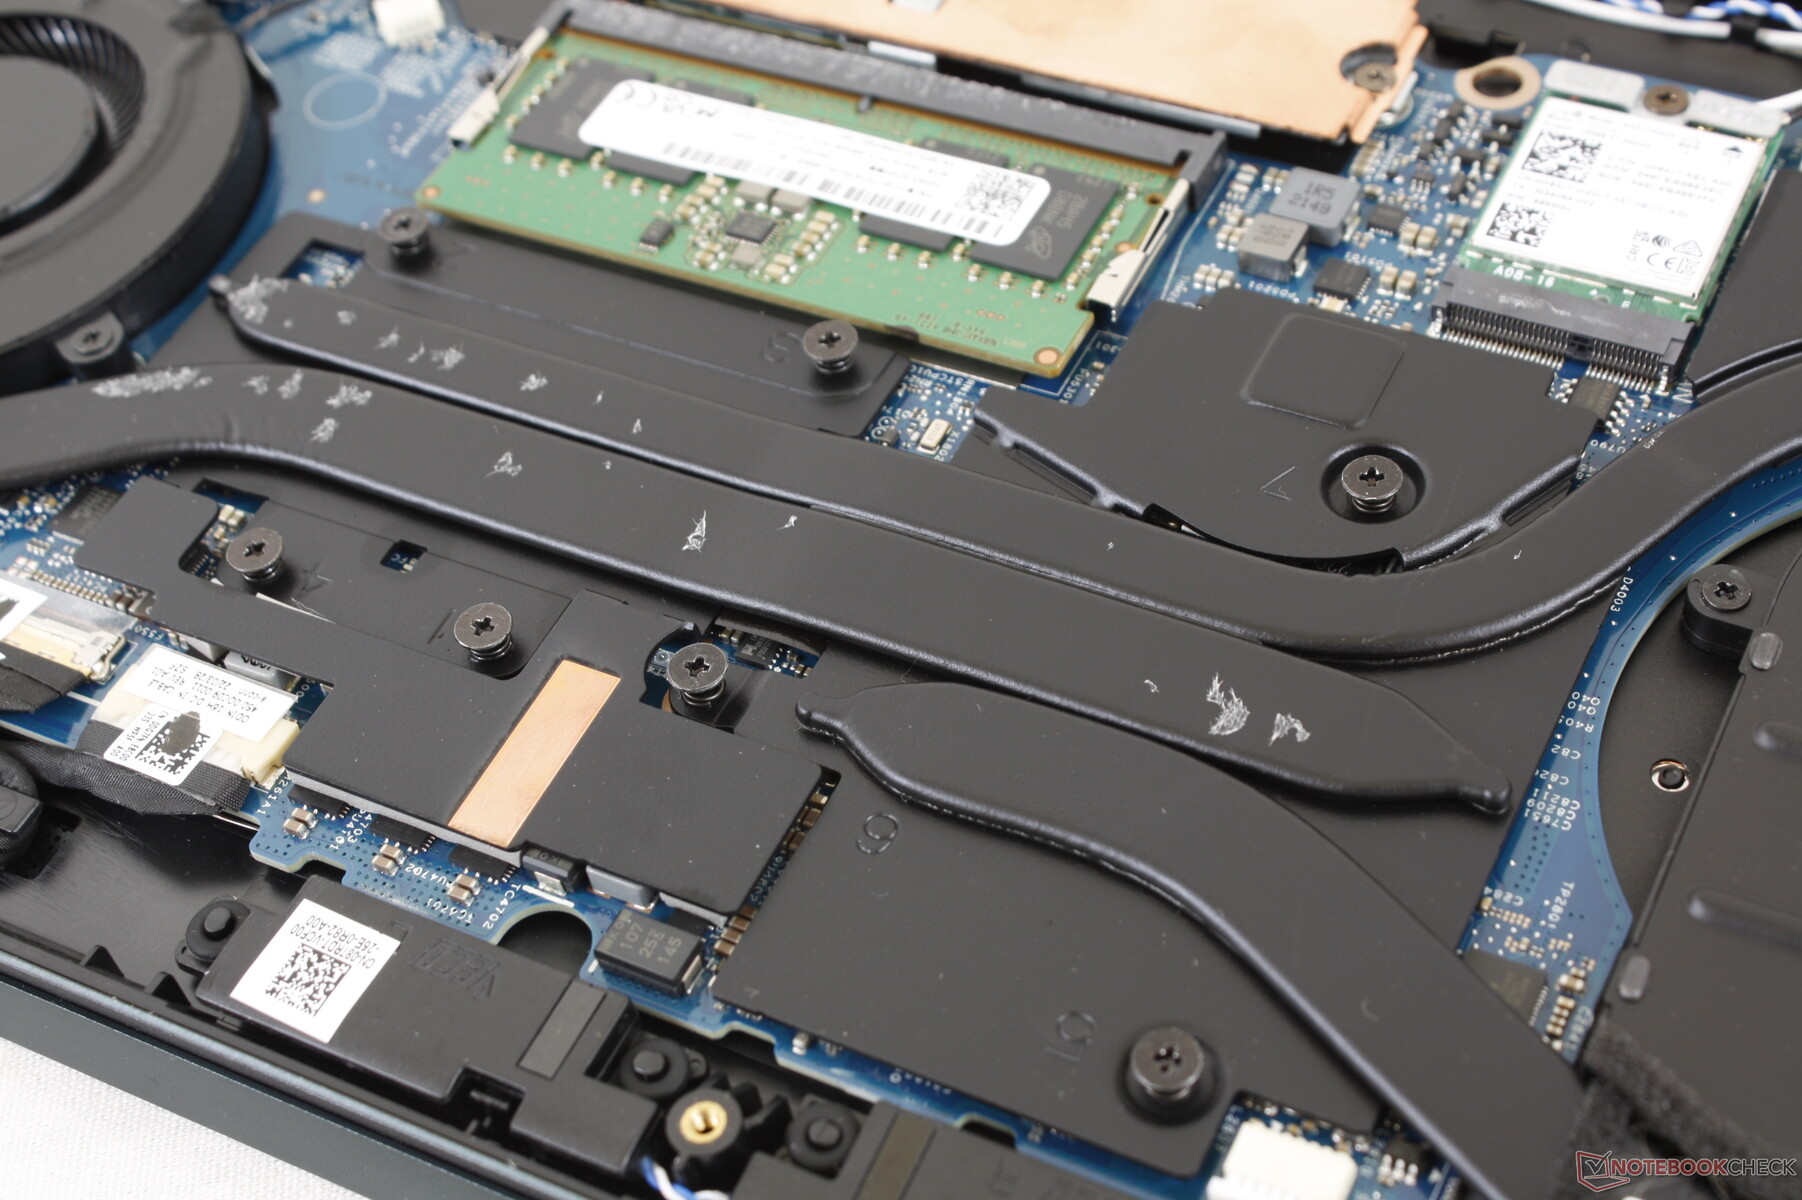
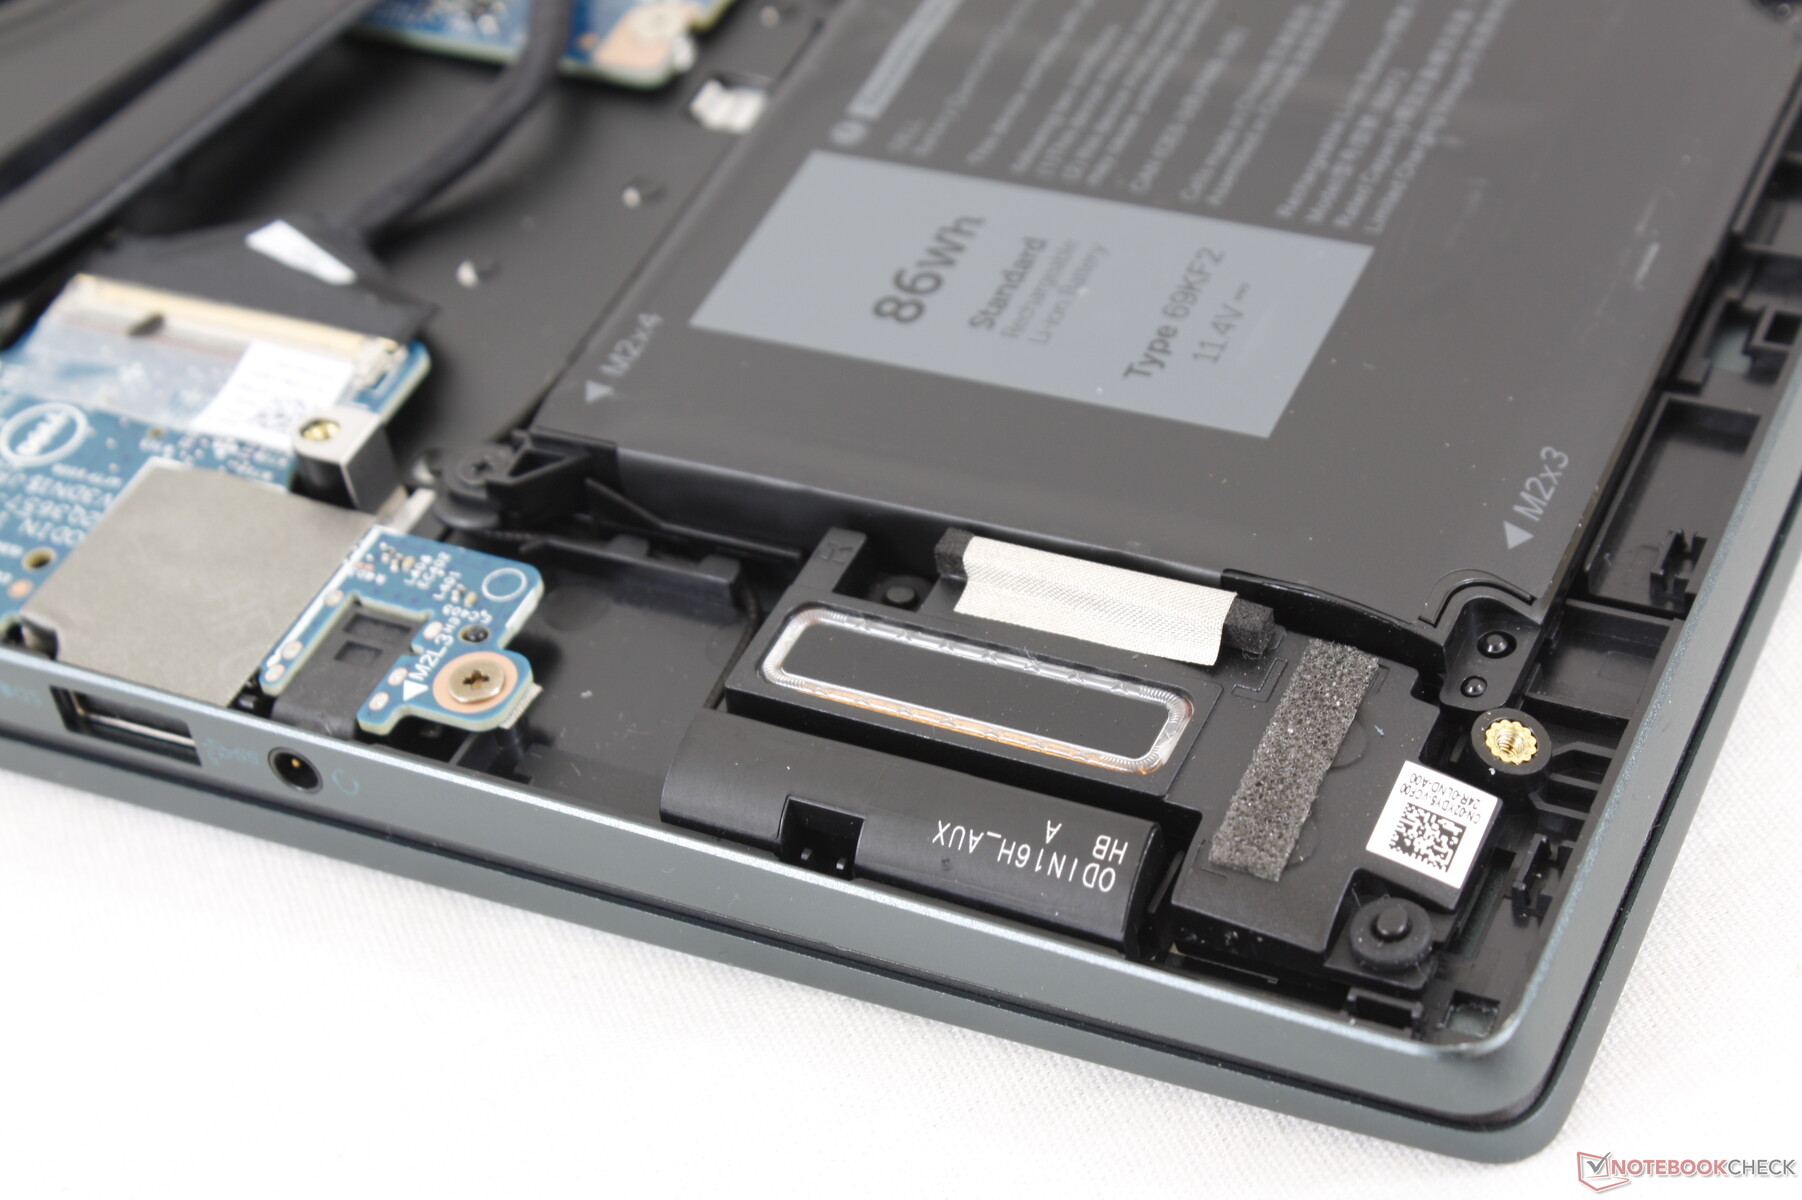
Le panneau inférieur se retire facilement à l'aide d'un simple tournevis Philips. Une fois à l'intérieur, les utilisateurs remarqueront la solution de refroidissement révisée par rapport à l'ancien 7610. Les changements ont en fait supprimé un emplacement SODIMM et un emplacement SSD M.2 du 7620, ne laissant qu'un emplacement SSD et un emplacement SODIMM pour travailler comme le montrent nos images ci-dessous. Plus déroutant encore, les utilisateurs qui optent pour le SKU RTX 3060 auront 2 slots SODIMM.
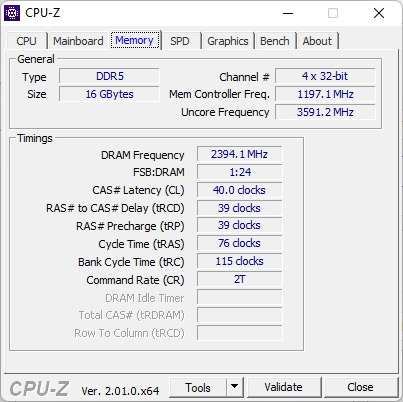
8 Go de RAM sont soudés sur notre carte pour un maximum de 40 Go si configuré avec un module de RAM DDR5 amovible de 32 Go. Les SKU RTX 3060 peuvent être configurés avec un maximum de 64 Go puisqu'ils disposent de 2 slots SODIMM et pas de RAM soudée.
Accessoires et garantie
Il n'y a pas d'autres éléments dans la boîte que l'adaptateur secteur et les documents. La garantie limitée standard d'un an s'applique si l'appareil est acheté aux États-Unis.
Périphériques d'entrée - identiques à ceux de l'Inspiron 16 Plus 7620 2-en-1
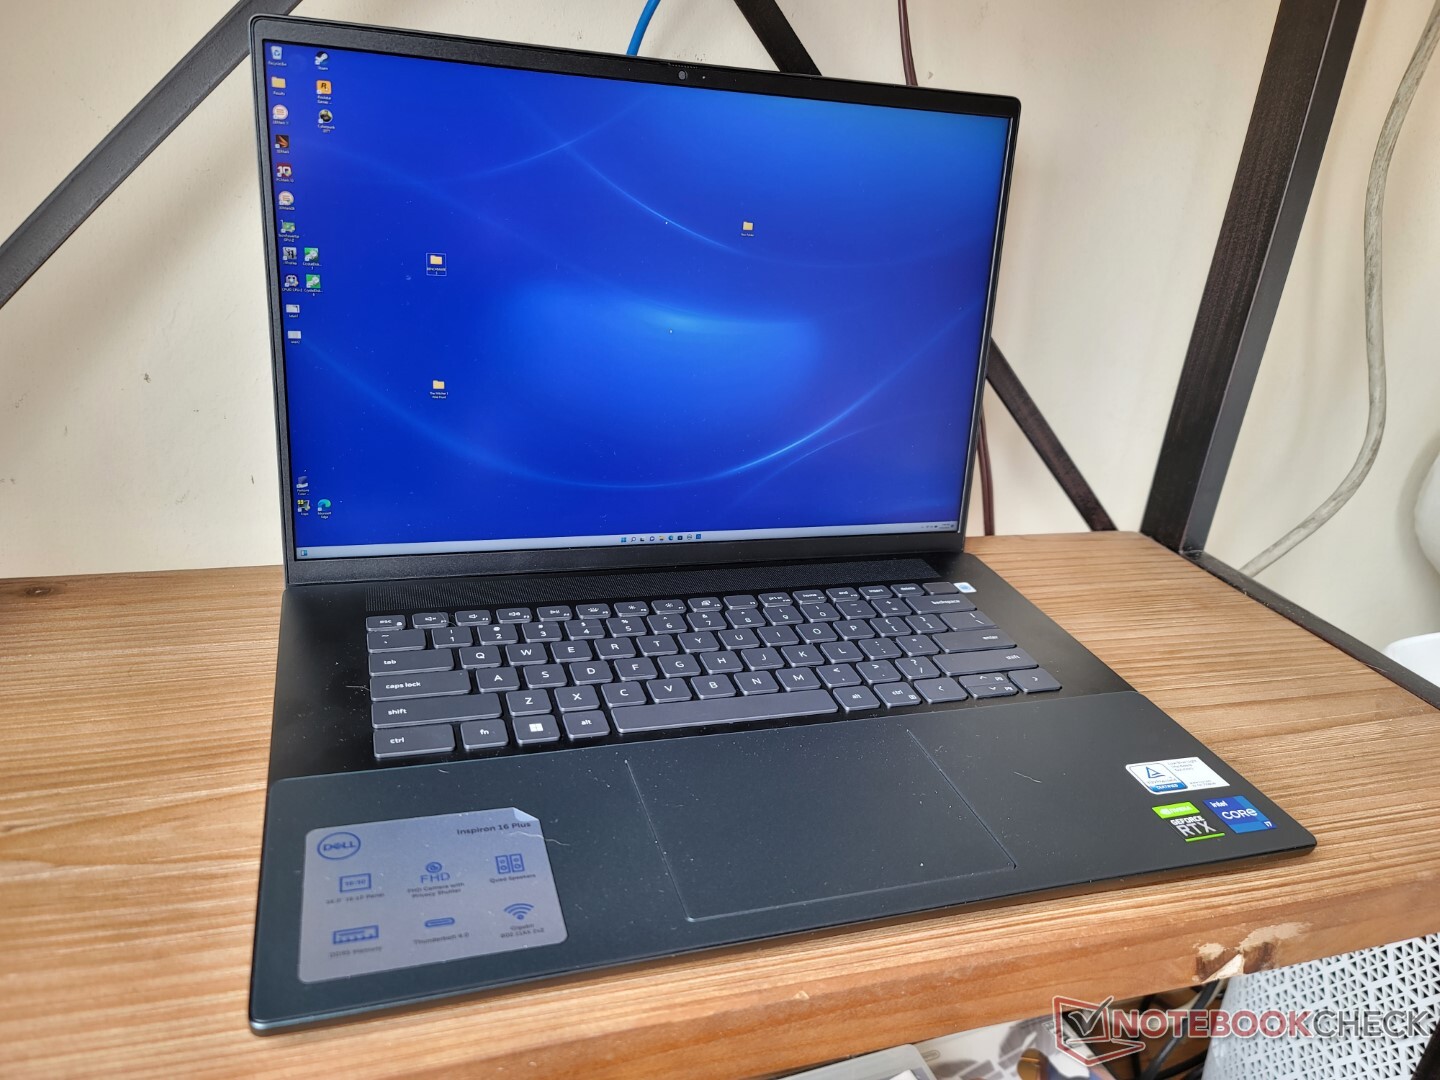
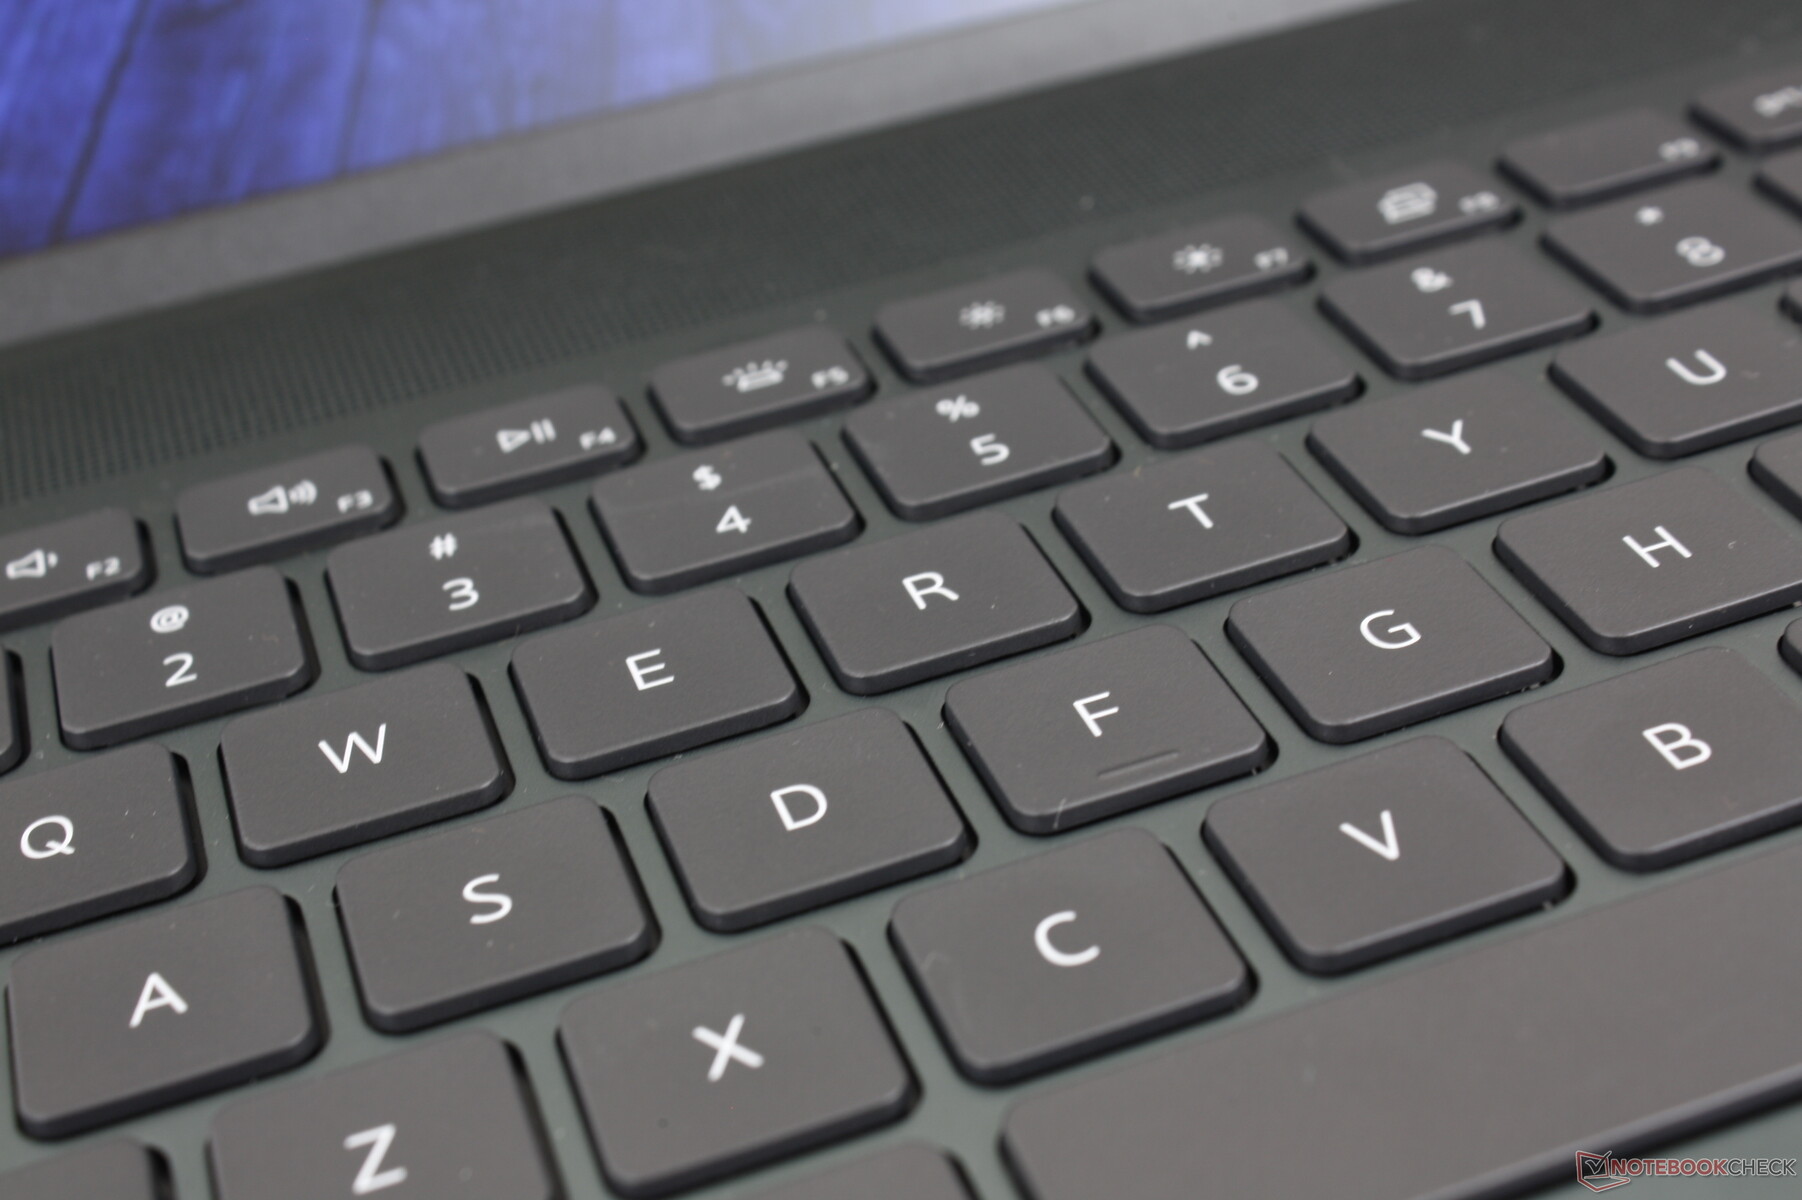
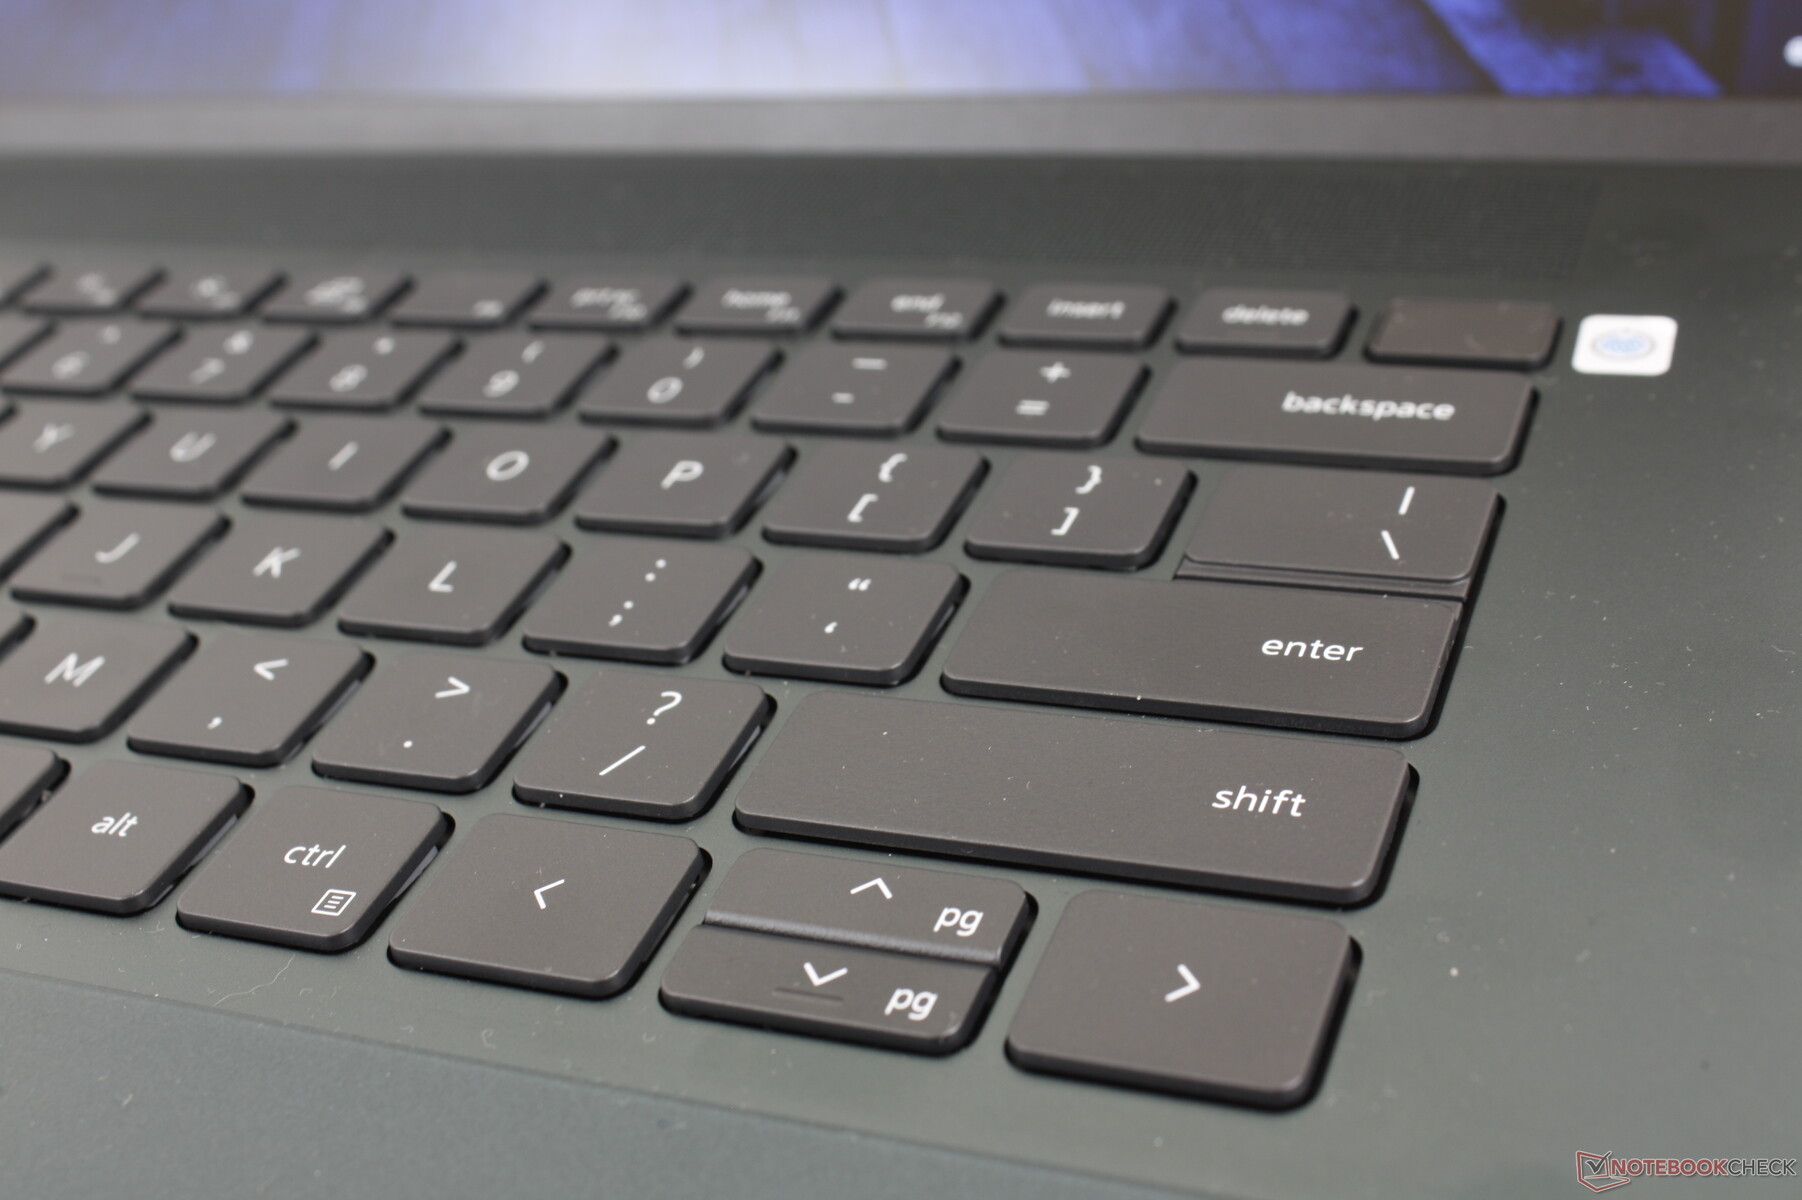
Clavier
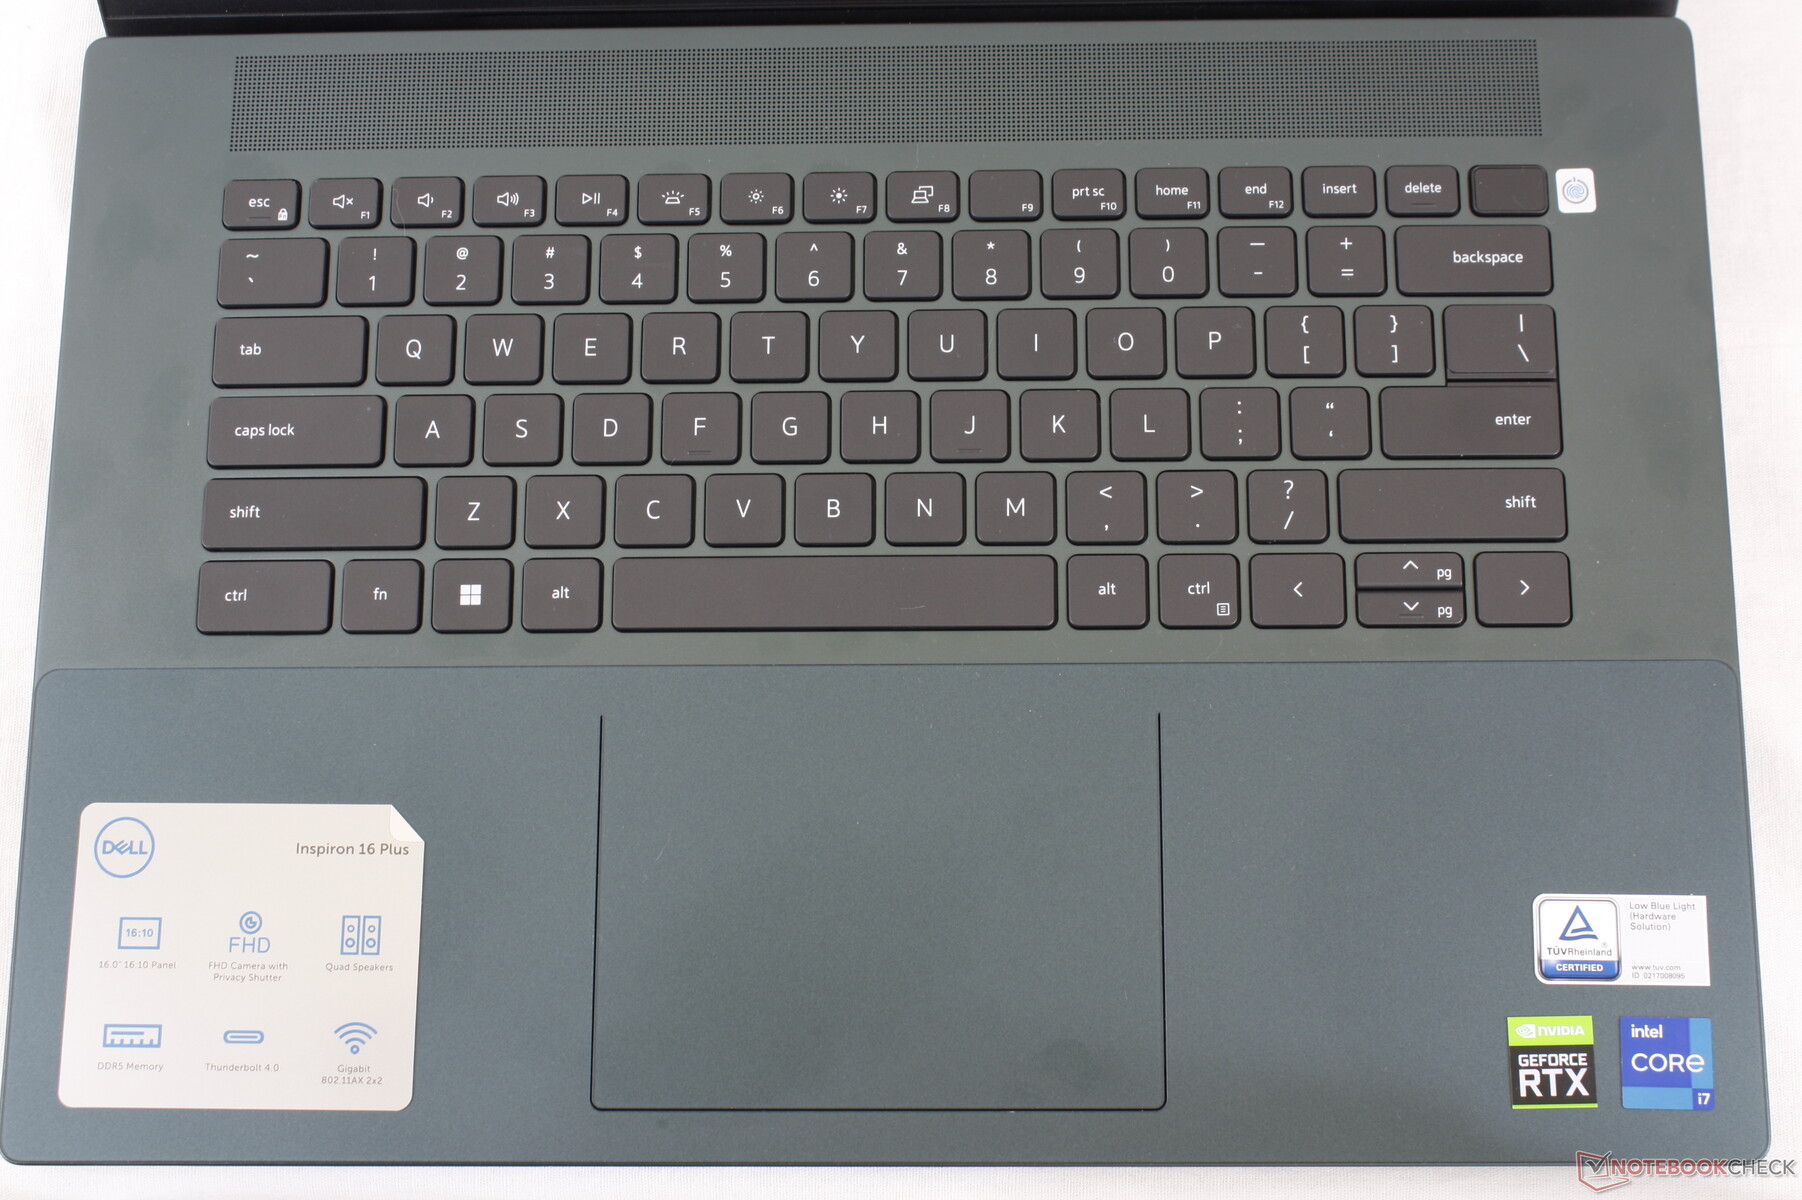
Dell a remanié le clavier cette année pour exclure le pavé numérique. L'expérience de frappe est autrement similaire à celle de lInspiron 16 Plus 7620 2-en-1 car les touches sont toujours légèrement plus souples que celles du LG Gram 16 ou de la série HP Spectre.
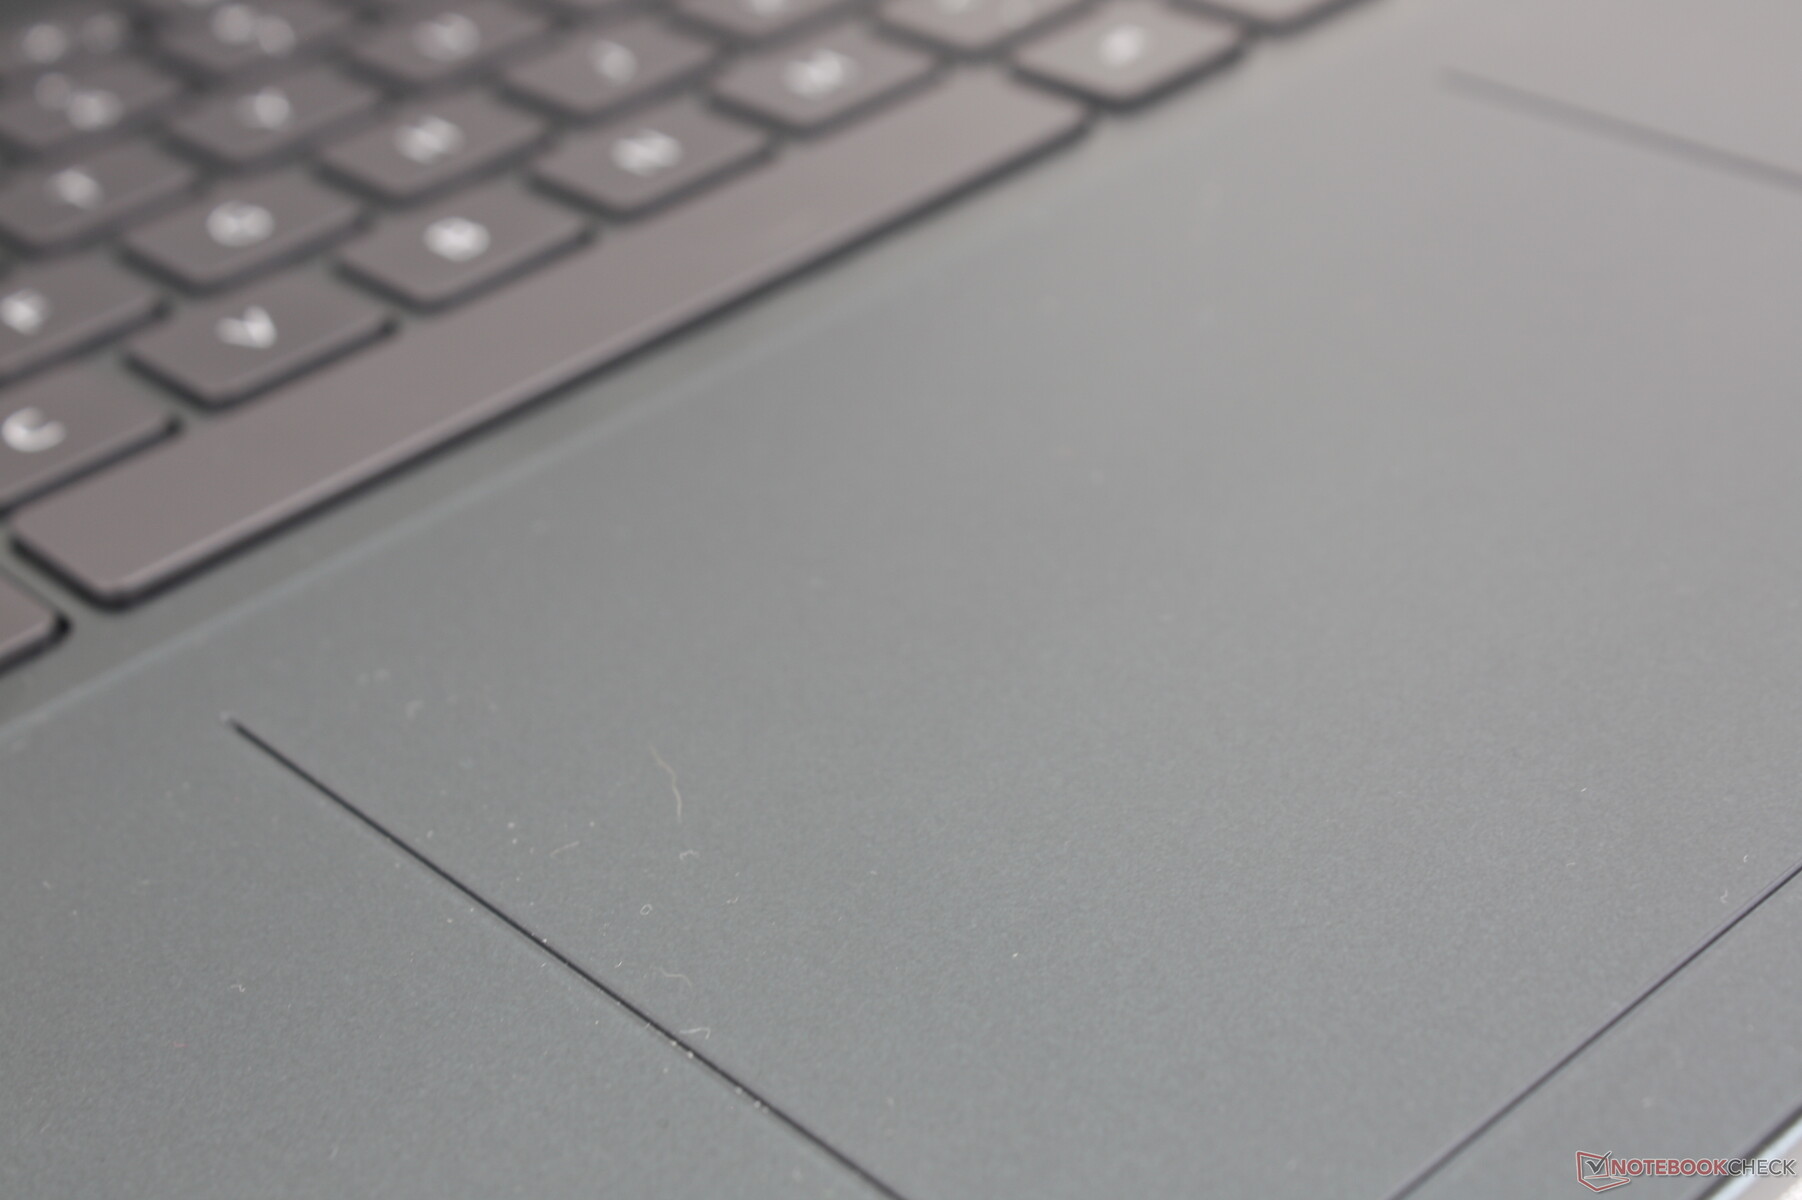
Pavé tactile
Le pavé tactile de notre modèle 2022 est plus petit que celui du modèle 2021 (11,5 x 8 cm contre 13,5 x 9 cm) pour être sur un pied d'égalité avec le pavé tactile de l'Inspiron 16 7620 2-en-1. La nouvelle surface en Mylar est idéale pour le contrôle du curseur, car elle est lisse lorsqu'elle glisse rapidement, mais un peu collante lorsqu'elle glisse lentement, ce qui permet des clics plus précis. Cependant, les clics sur le pavé tactile sont toujours plus mous et plus spongieux que nous le souhaiterions.
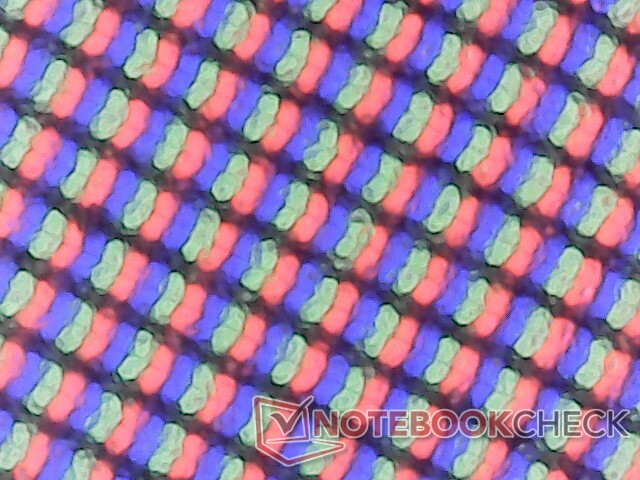
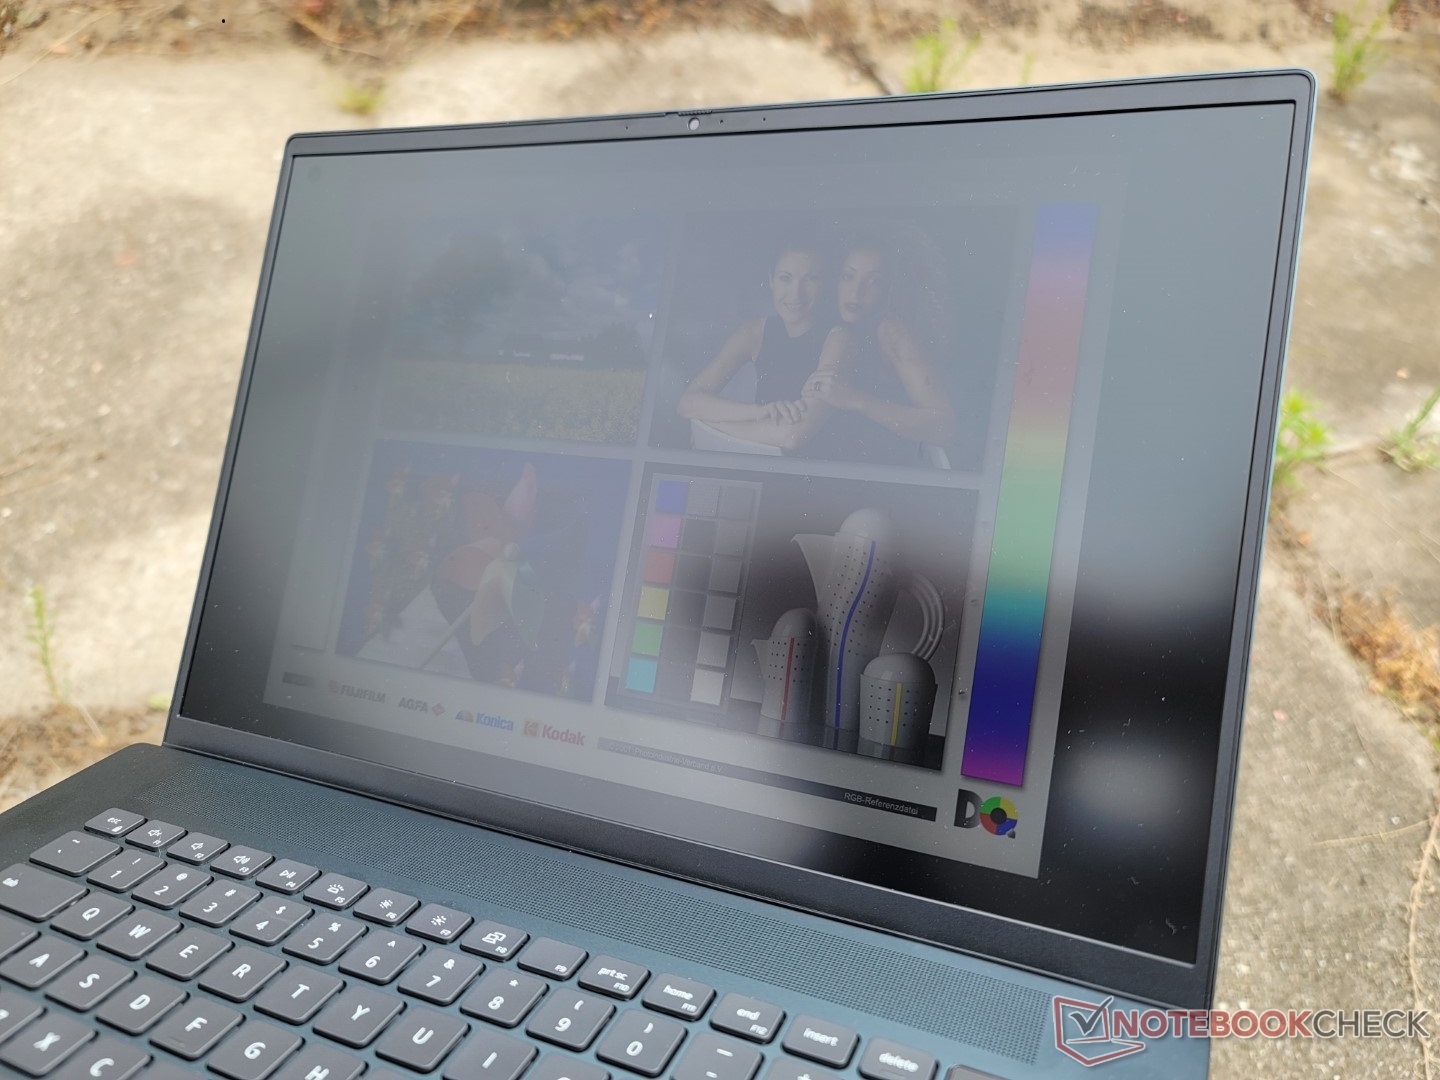
Affichage - Pas de changements majeurs
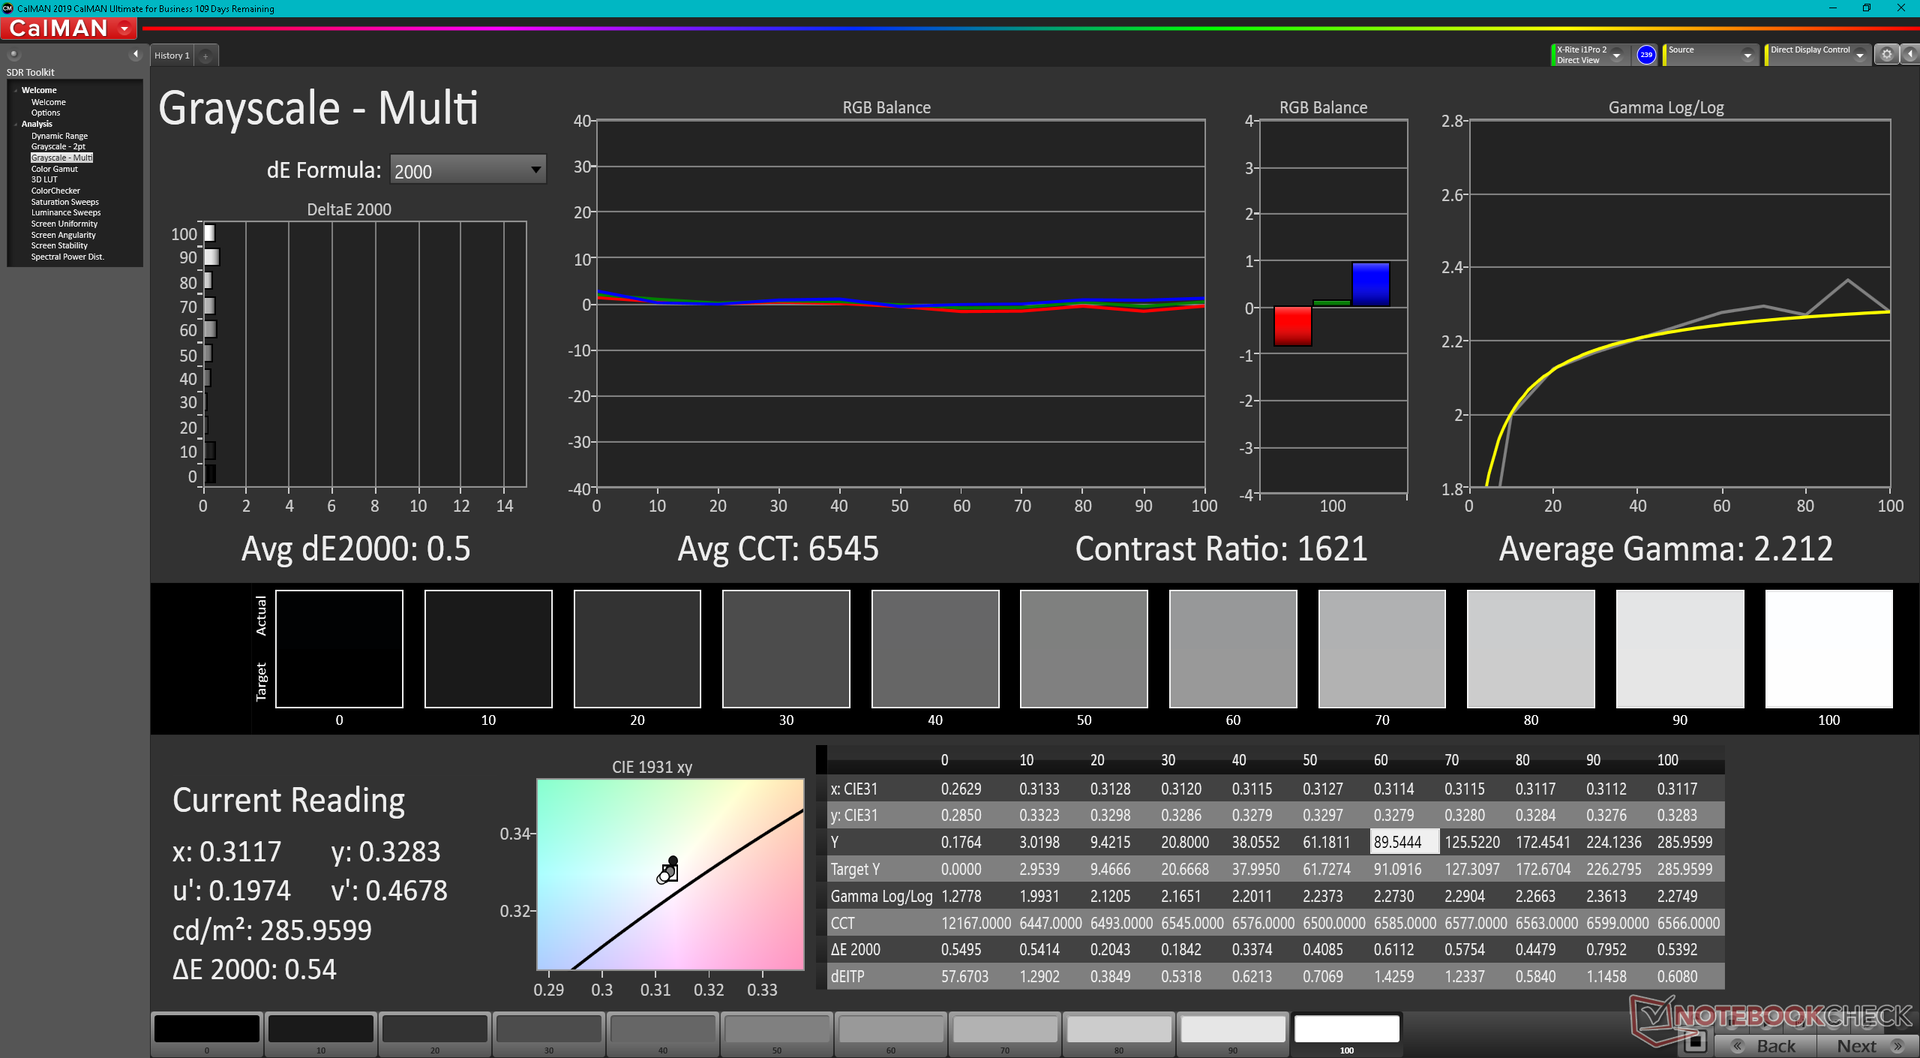
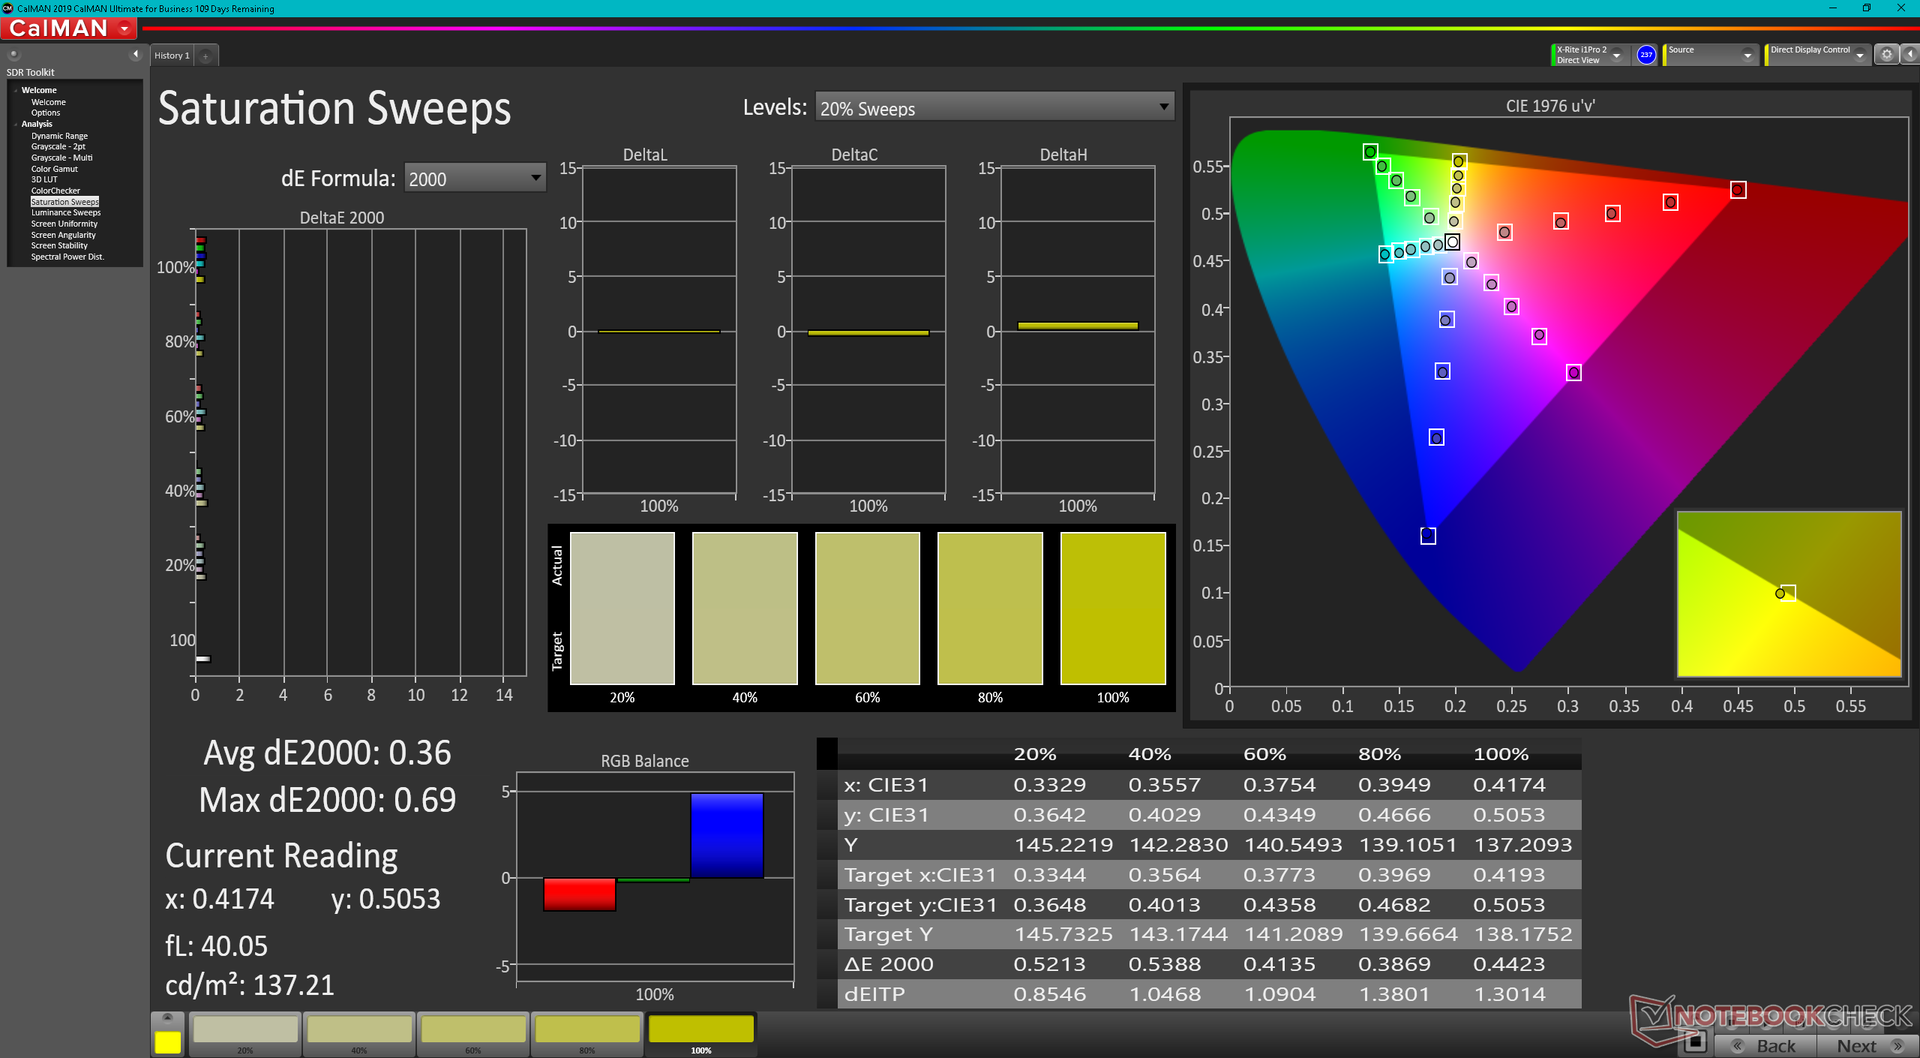
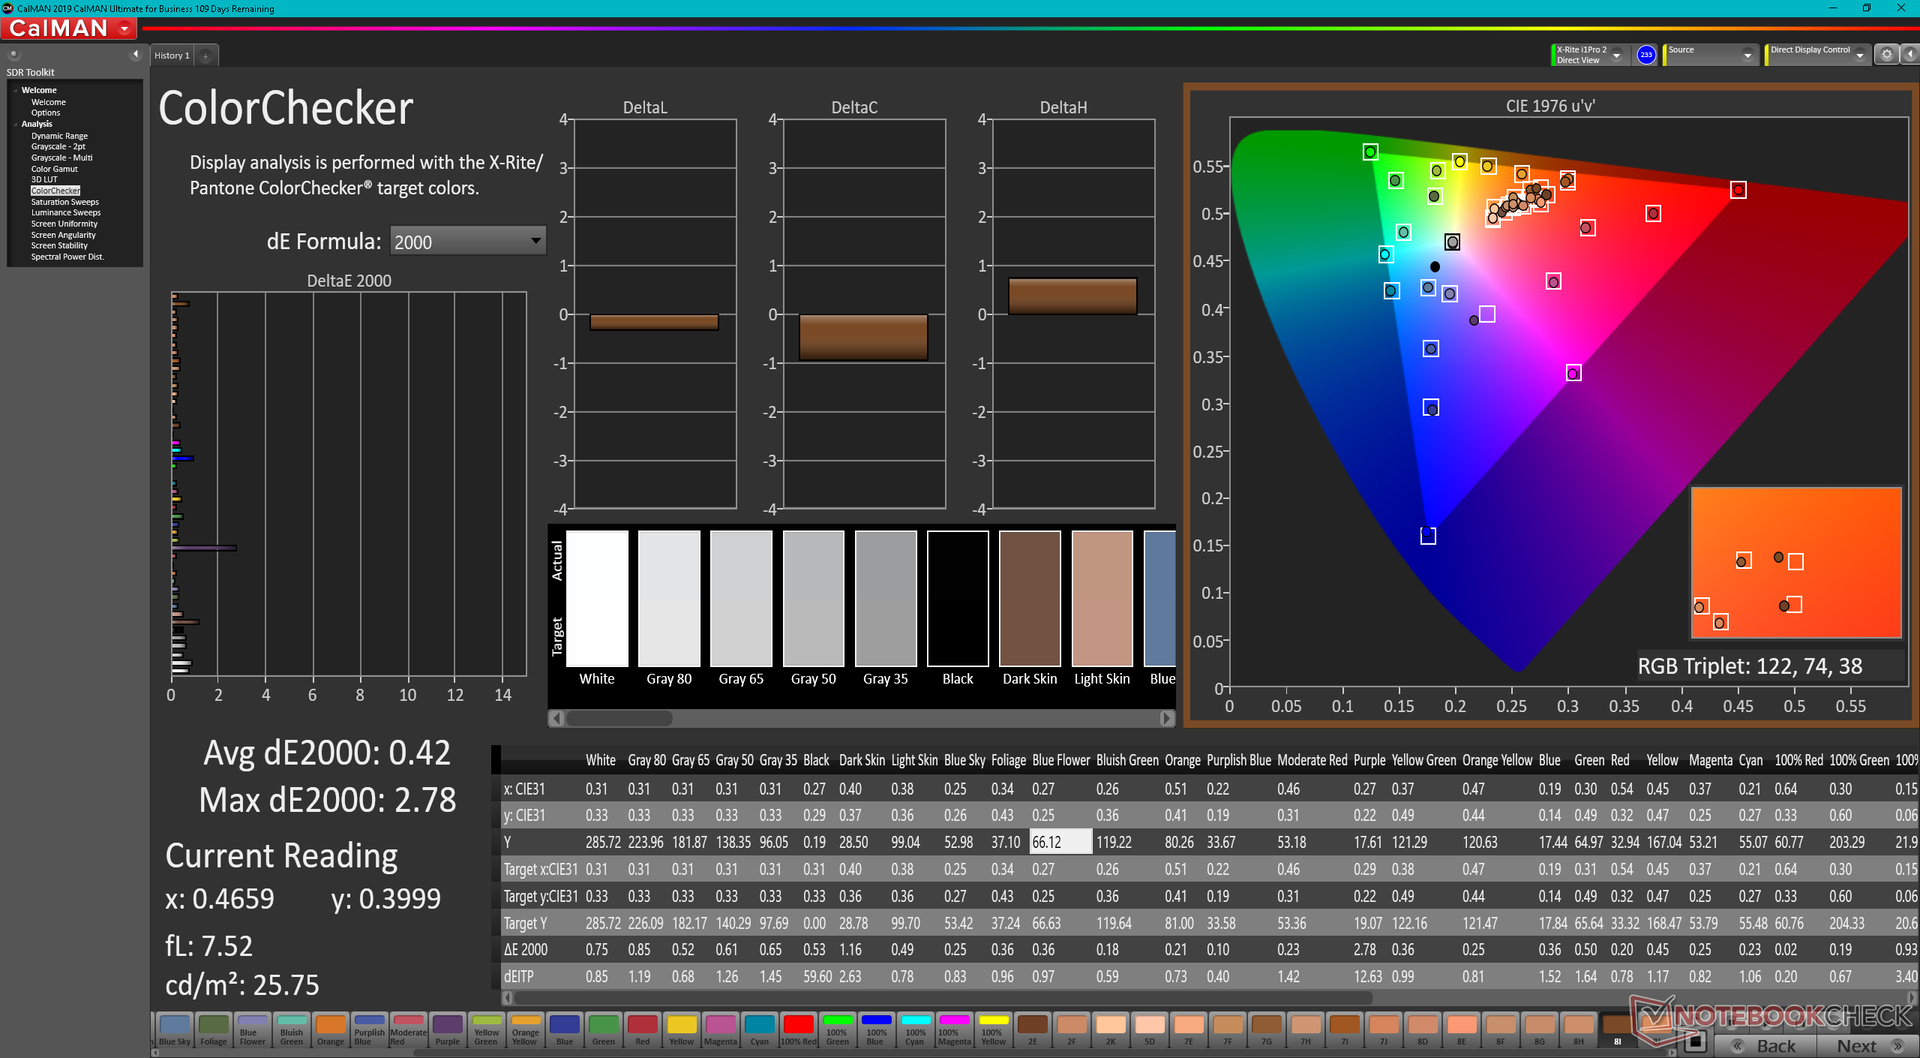
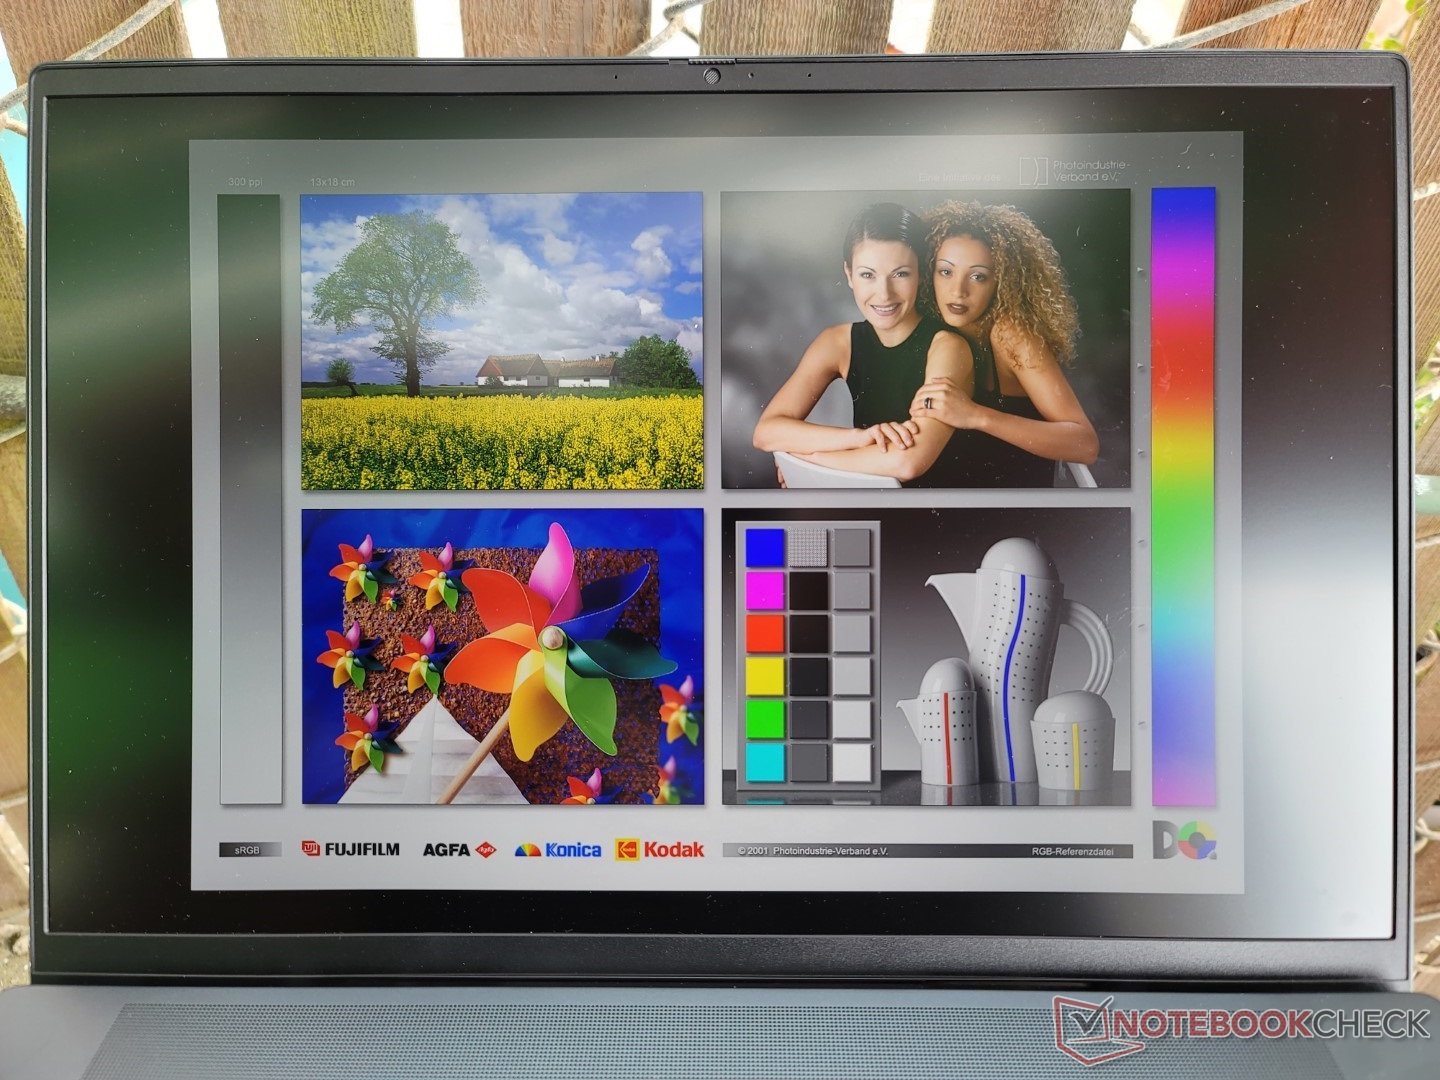
Il est intéressant de noter que Dell a changé de fournisseur de dalles, passant d'AU Optronics sur l'Inspiron 16 Plus 7610 de l'année dernière à BOE pour ce dernier modèle. Les temps de réponse sont légèrement plus rapides pour un ghosting moins sévère, mais tout le reste reste est pratiquement identique, y compris la couverture sRGB complète, le rapport de contraste ~1000:1, et la luminosité maximale ~290 nit
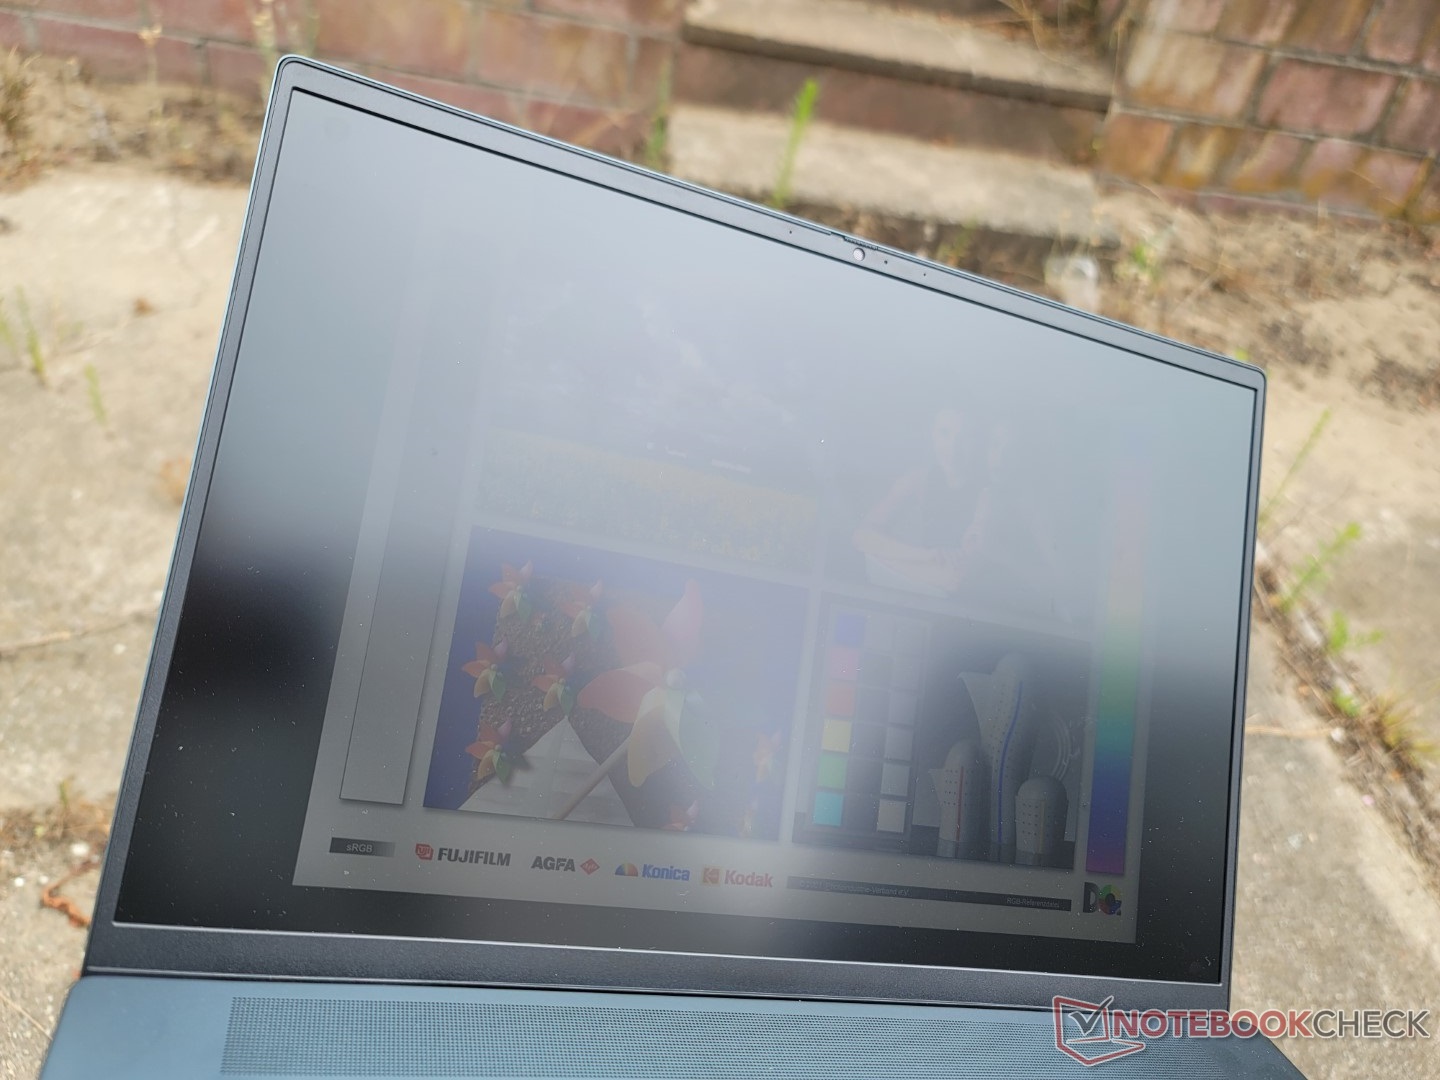
L'expérience visuelle est bonne, mais toujours un peu en dessous de la série XPS ou de la dalle OLED sur l'Asus VivoBook Pro 16X Asus VivoBook Pro 16X. La qualité de l'image est sensiblement plus granuleuse en raison de la couche mate agressive, tandis que les couleurs ne sont pas aussi vibrantes que sur l'OLED. Nous comprenons que la série Inspiron n'est pas censée être haut de gamme, mais il est décevant que Dell n'ait pas fait de changements significatifs à l'écran cette année
Vous avez le choix entre trois options de dalles 300-nit : 3072 x 1920 matte non-touch, 1920 x 1200 matte non-touch, et 1920 x 1200 glossy touch. Nos mesures ci-dessous reflètent uniquement la dalle de plus haute résolution.
| |||||||||||||||||||||||||
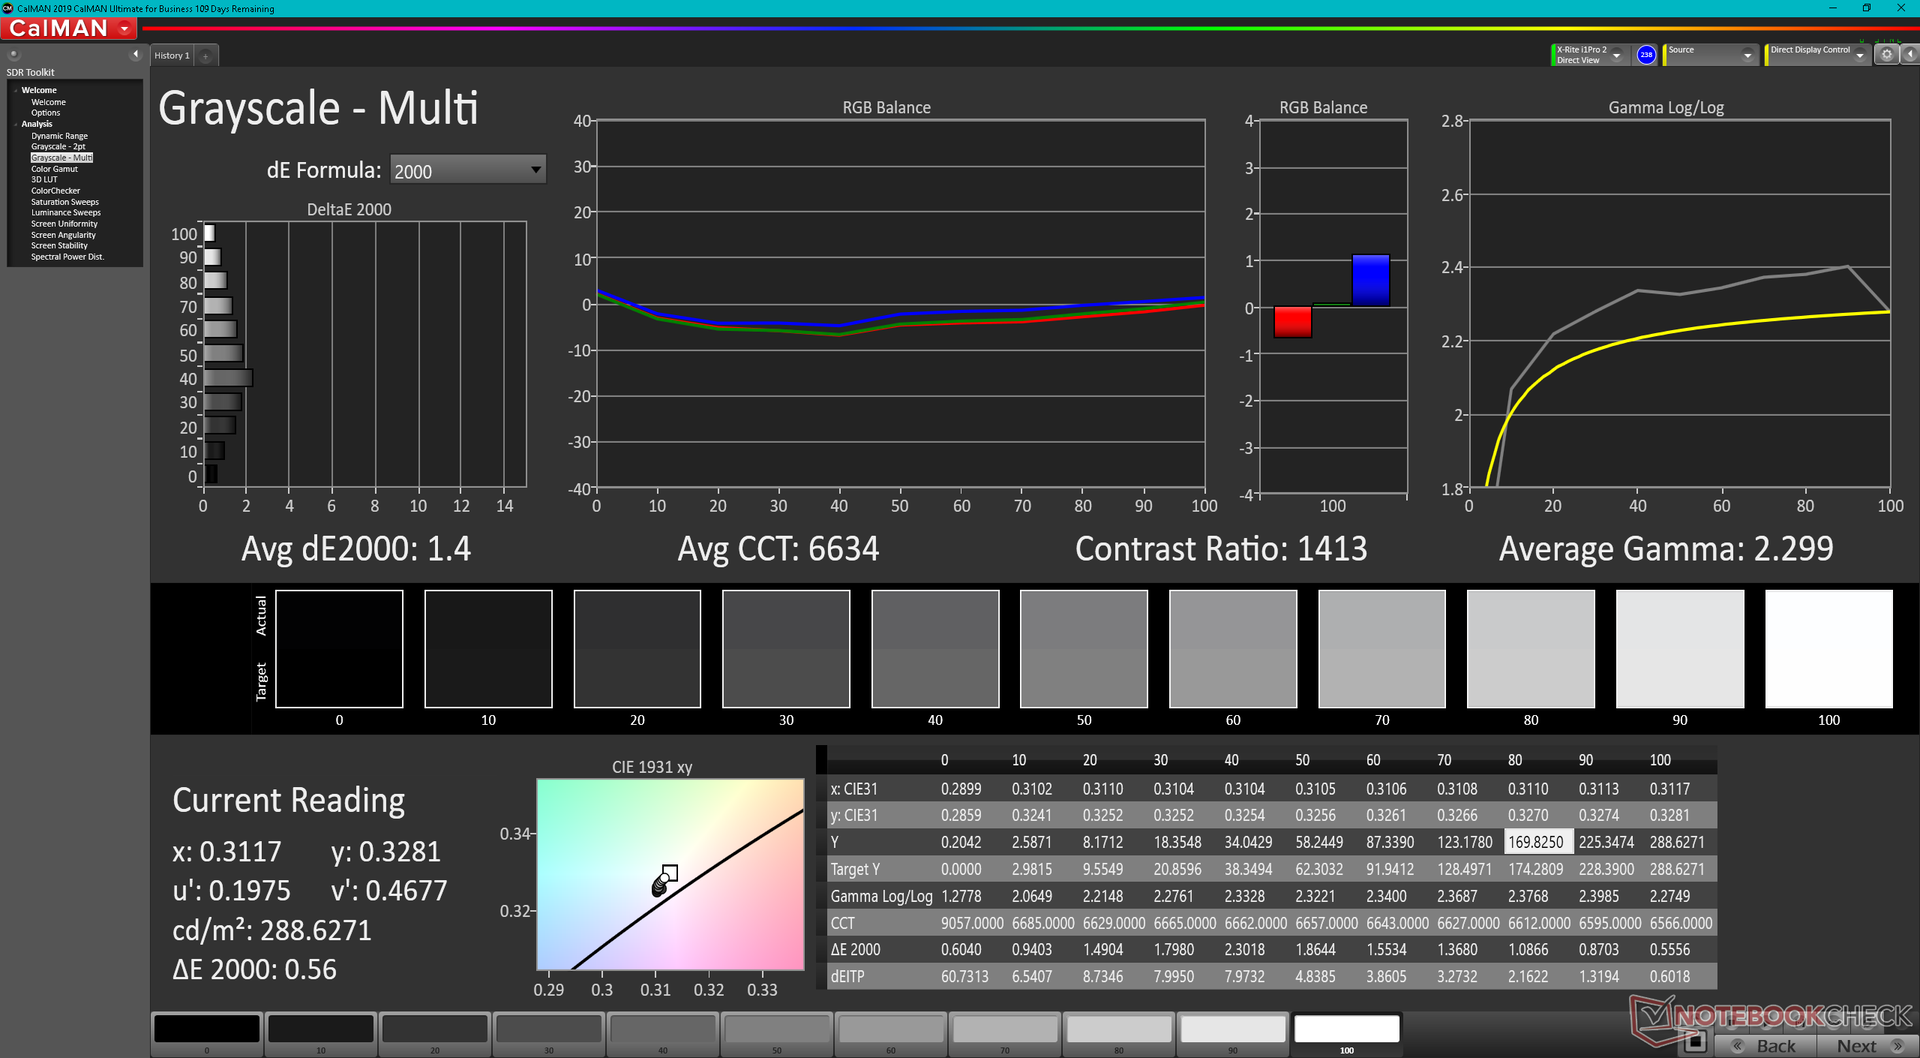
Homogénéité de la luminosité: 92 %
Valeur mesurée au centre, sur batterie: 288.9 cd/m²
Contraste: 1111:1 (Valeurs des noirs: 0.26 cd/m²)
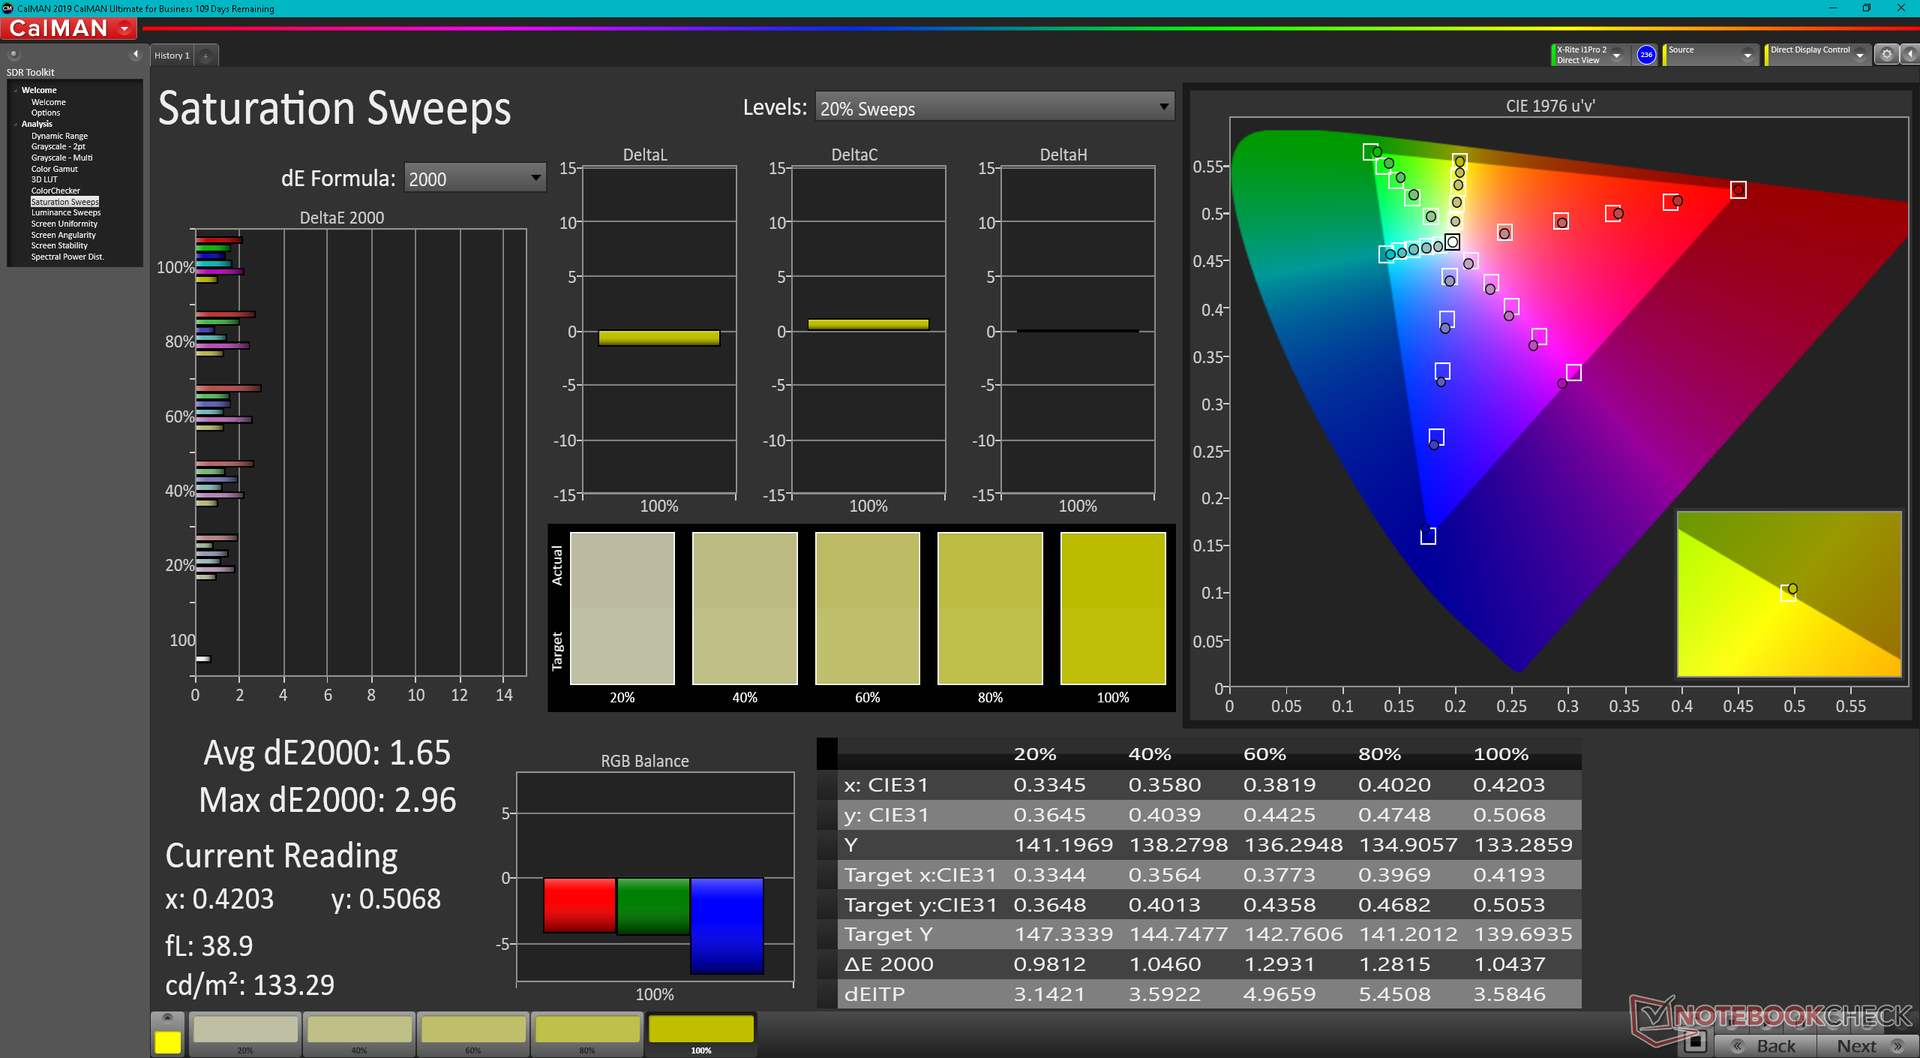
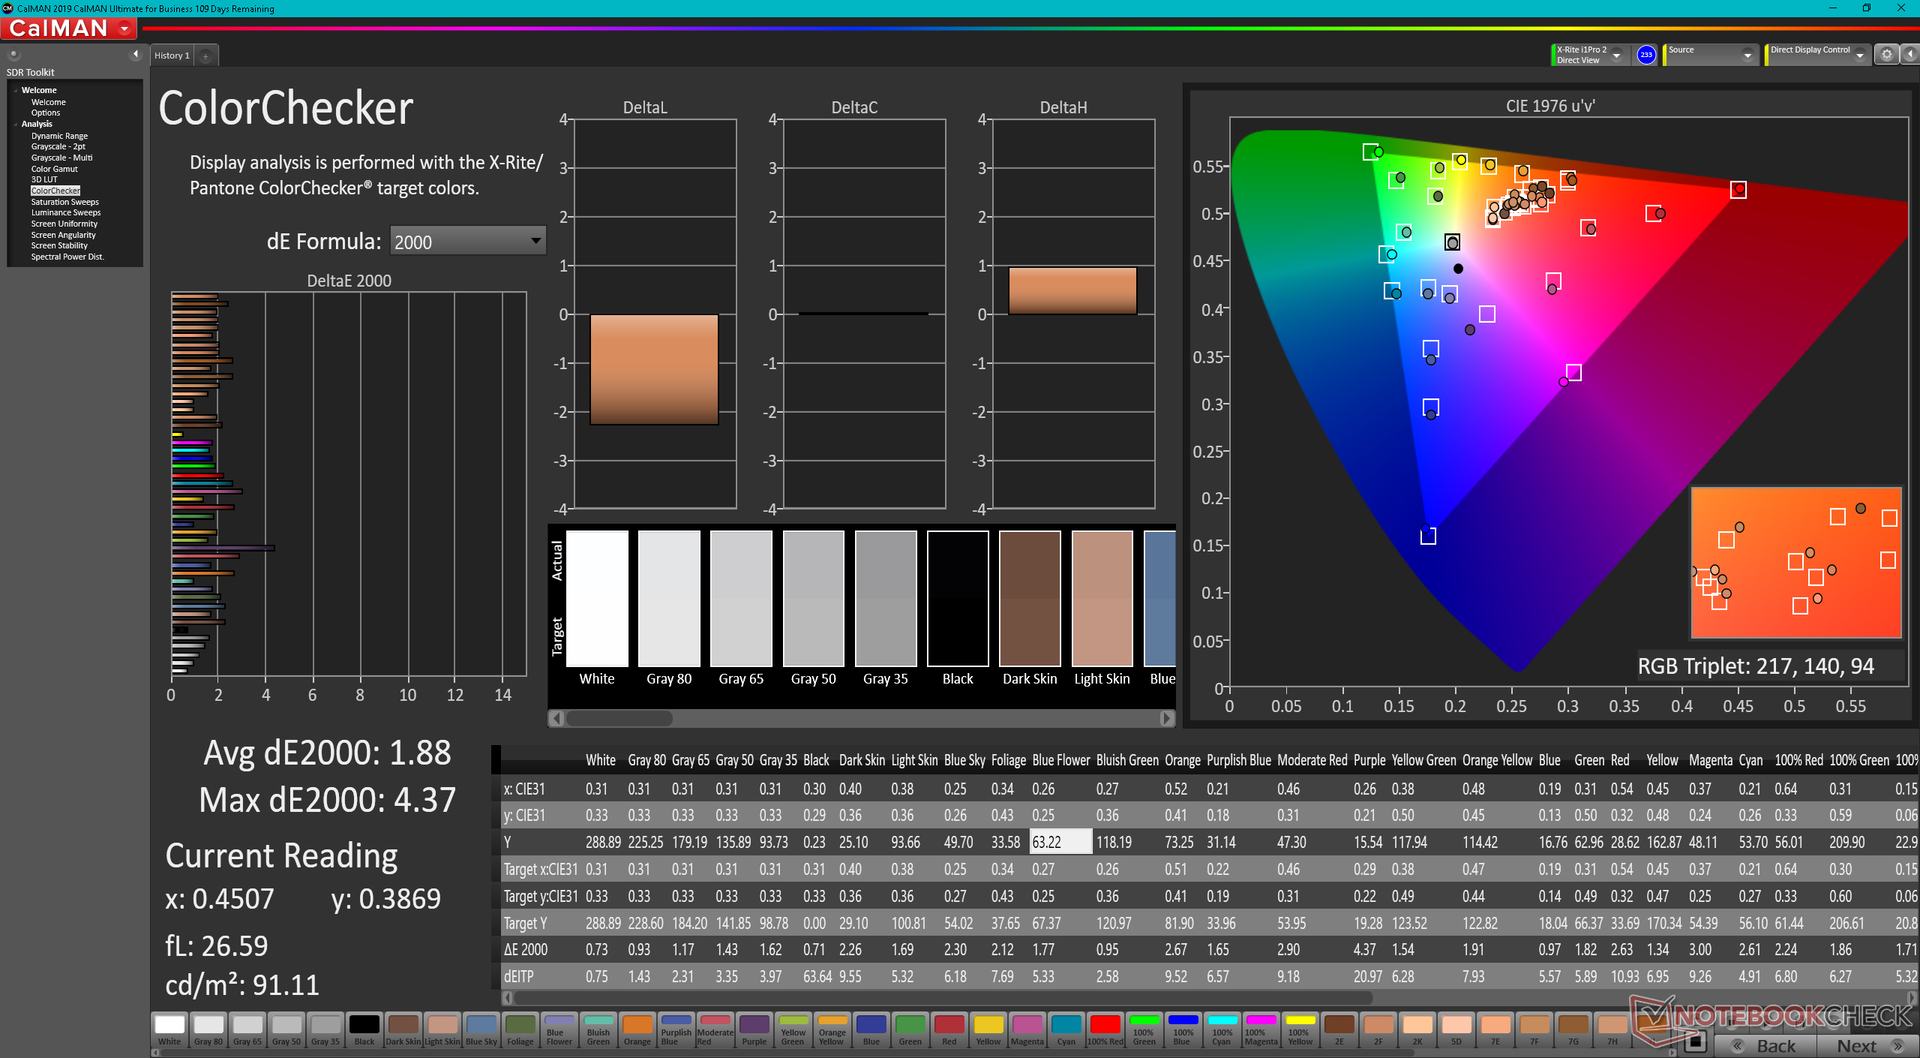
ΔE ColorChecker Calman: 1.88 | ∀{0.5-29.43 Ø4.73}
calibrated: 0.42
ΔE Greyscale Calman: 1.4 | ∀{0.09-98 Ø4.97}
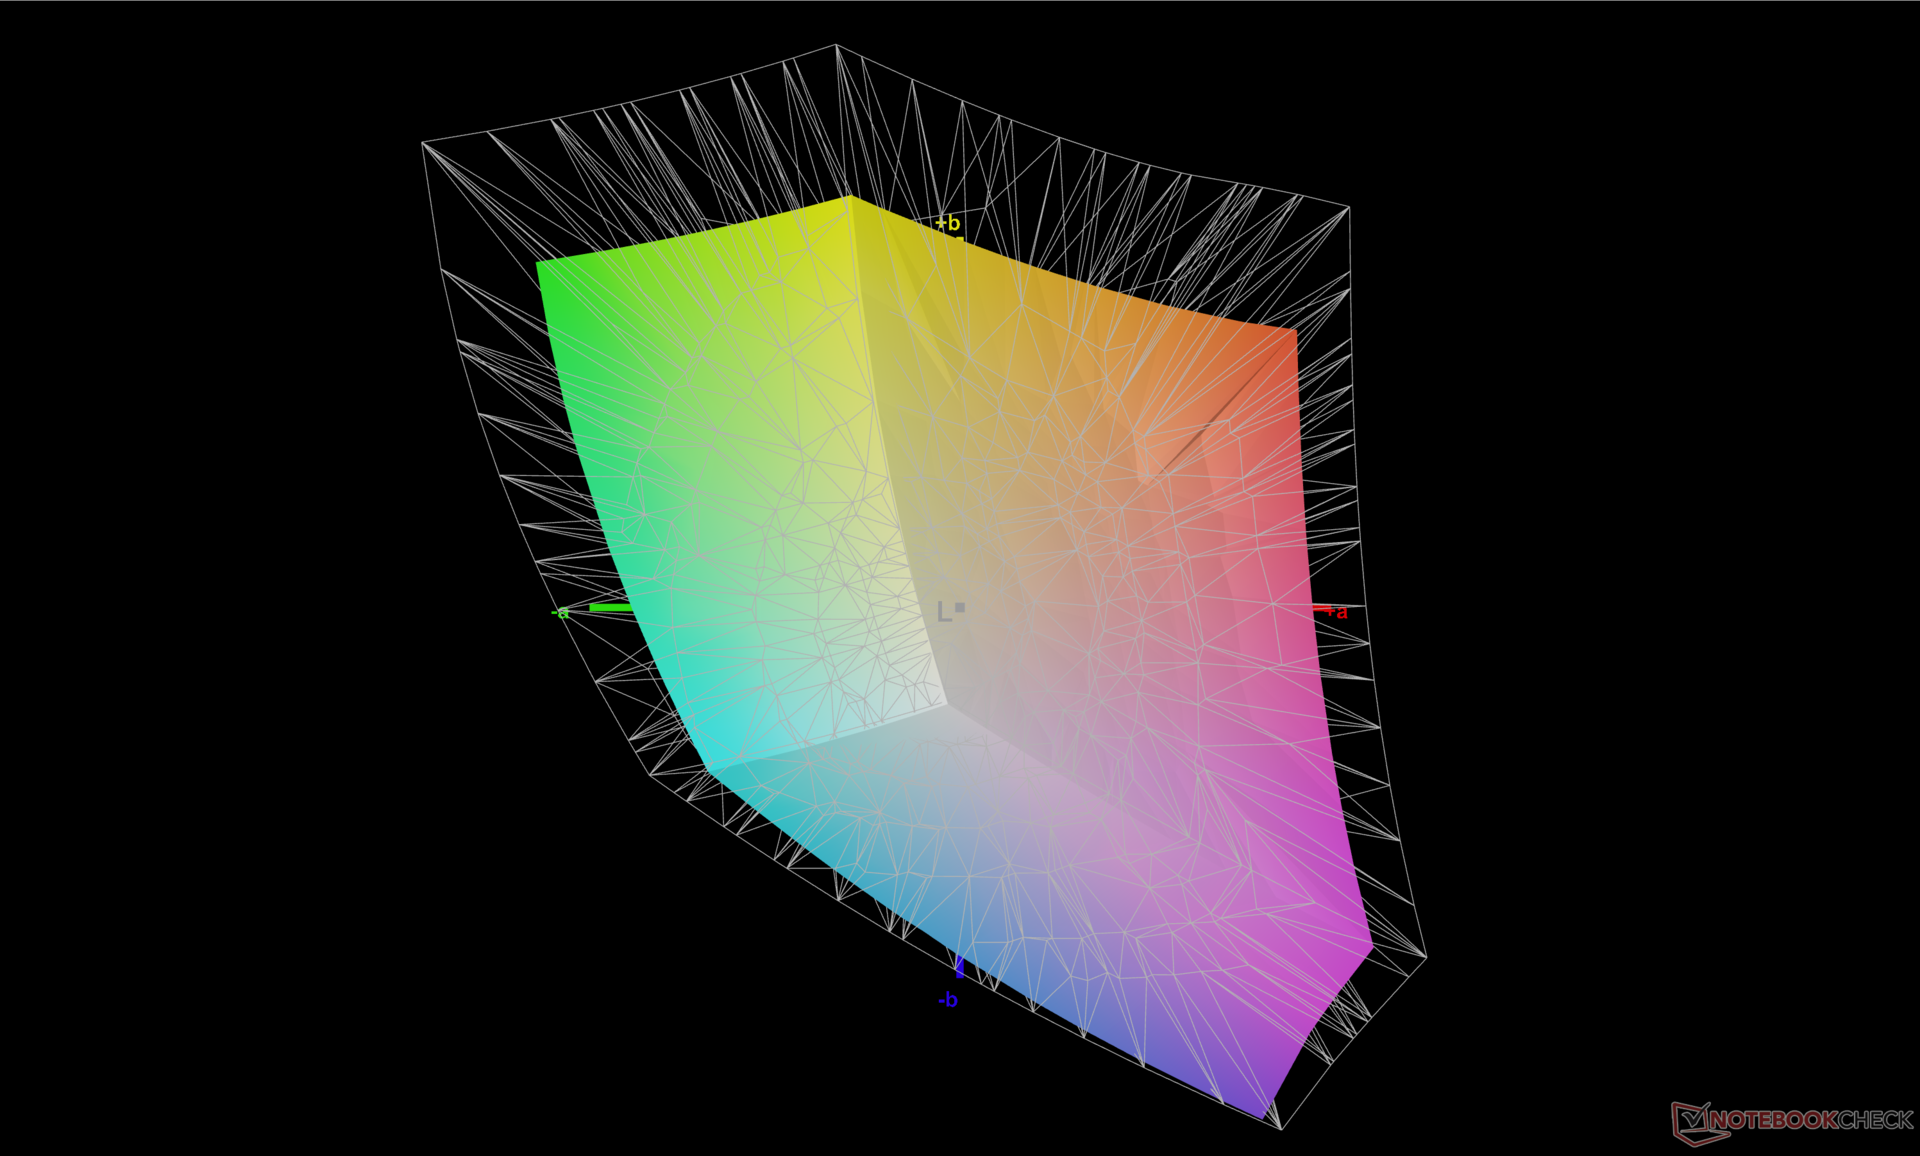
73.2% AdobeRGB 1998 (Argyll 3D)
99.5% sRGB (Argyll 3D)
70.8% Display P3 (Argyll 3D)
Gamma: 2.3
CCT: 6634 K
| Dell Inspiron 16 Plus 7620 BOE NE16N41, IPS, 3072x1920, 16" | Dell Inspiron 16 Plus 7610 AU Optronics B160QAN, IPS, 3072x1920, 16" | Lenovo Yoga 7 16IAP7 Lenovo LEN160WQXGA, IPS, 2560x1600, 16" | Huawei MateBook D 16 2022 BOE NV160WUM-NH0, IPS, 1920x1200, 16" | Acer Swift X SFX16-51G-5388 Chi Mei N161HCA-EA3, , 1920x1080, 16.1" | Asus Vivobook Pro 16X-M7600QE Samsung ATNA60YV02-0, OLED, 3840x2400, 16.1" | |
|---|---|---|---|---|---|---|
| Display | 3% | -5% | -5% | -7% | 25% | |
| Display P3 Coverage (%) | 70.8 | 74.1 5% | 67 -5% | 66.2 -6% | 65.1 -8% | 99.8 41% |
| sRGB Coverage (%) | 99.5 | 99.4 0% | 95.7 -4% | 96.4 -3% | 95.65 -4% | 100 1% |
| AdobeRGB 1998 Coverage (%) | 73.2 | 75.8 4% | 69.3 -5% | 68.3 -7% | 66.75 -9% | 96.9 32% |
| Response Times | -30% | 8% | 27% | 25% | 94% | |
| Response Time Grey 50% / Grey 80% * (ms) | 38 ? | 49.2 ? -29% | 36 ? 5% | 30.5 ? 20% | 30 ? 21% | 2 ? 95% |
| Response Time Black / White * (ms) | 28 ? | 36.8 ? -31% | 24.8 ? 11% | 18.7 ? 33% | 20 ? 29% | 2 ? 93% |
| PWM Frequency (Hz) | 60 ? | |||||
| Screen | -47% | -13% | -56% | -6% | -35% | |
| Brightness middle (cd/m²) | 288.9 | 296.8 3% | 393.7 36% | 319 10% | 276 -4% | 392 36% |
| Brightness (cd/m²) | 276 | 292 6% | 367 33% | 317 15% | 264 -4% | 396 43% |
| Brightness Distribution (%) | 92 | 87 -5% | 84 -9% | 90 -2% | 85 -8% | 98 7% |
| Black Level * (cd/m²) | 0.26 | 0.21 19% | 0.38 -46% | 0.23 12% | 0.16 38% | |
| Contrast (:1) | 1111 | 1413 27% | 1036 -7% | 1387 25% | 1725 55% | |
| Colorchecker dE 2000 * | 1.88 | 2.56 -36% | 1.97 -5% | 3.4 -81% | 1.8 4% | 1.74 7% |
| Colorchecker dE 2000 max. * | 4.37 | 4.76 -9% | 5.46 -25% | 8.1 -85% | 3.77 14% | 3.18 27% |
| Colorchecker dE 2000 calibrated * | 0.42 | 1.86 -343% | 0.62 -48% | 0.8 -90% | 0.63 -50% | 1.85 -340% |
| Greyscale dE 2000 * | 1.4 | 2.6 -86% | 2.1 -50% | 5.7 -307% | 2.76 -97% | 1.77 -26% |
| Gamma | 2.3 96% | 2.07 106% | 2.1 105% | 2.1 105% | 2.37 93% | 2.22 99% |
| CCT | 6634 98% | 6628 98% | 6461 101% | 7433 87% | 6564 99% | 6483 100% |
| Moyenne finale (programmes/paramètres) | -25% /
-34% | -3% /
-9% | -11% /
-33% | 4% /
-2% | 28% /
1% |
* ... Moindre est la valeur, meilleures sont les performances
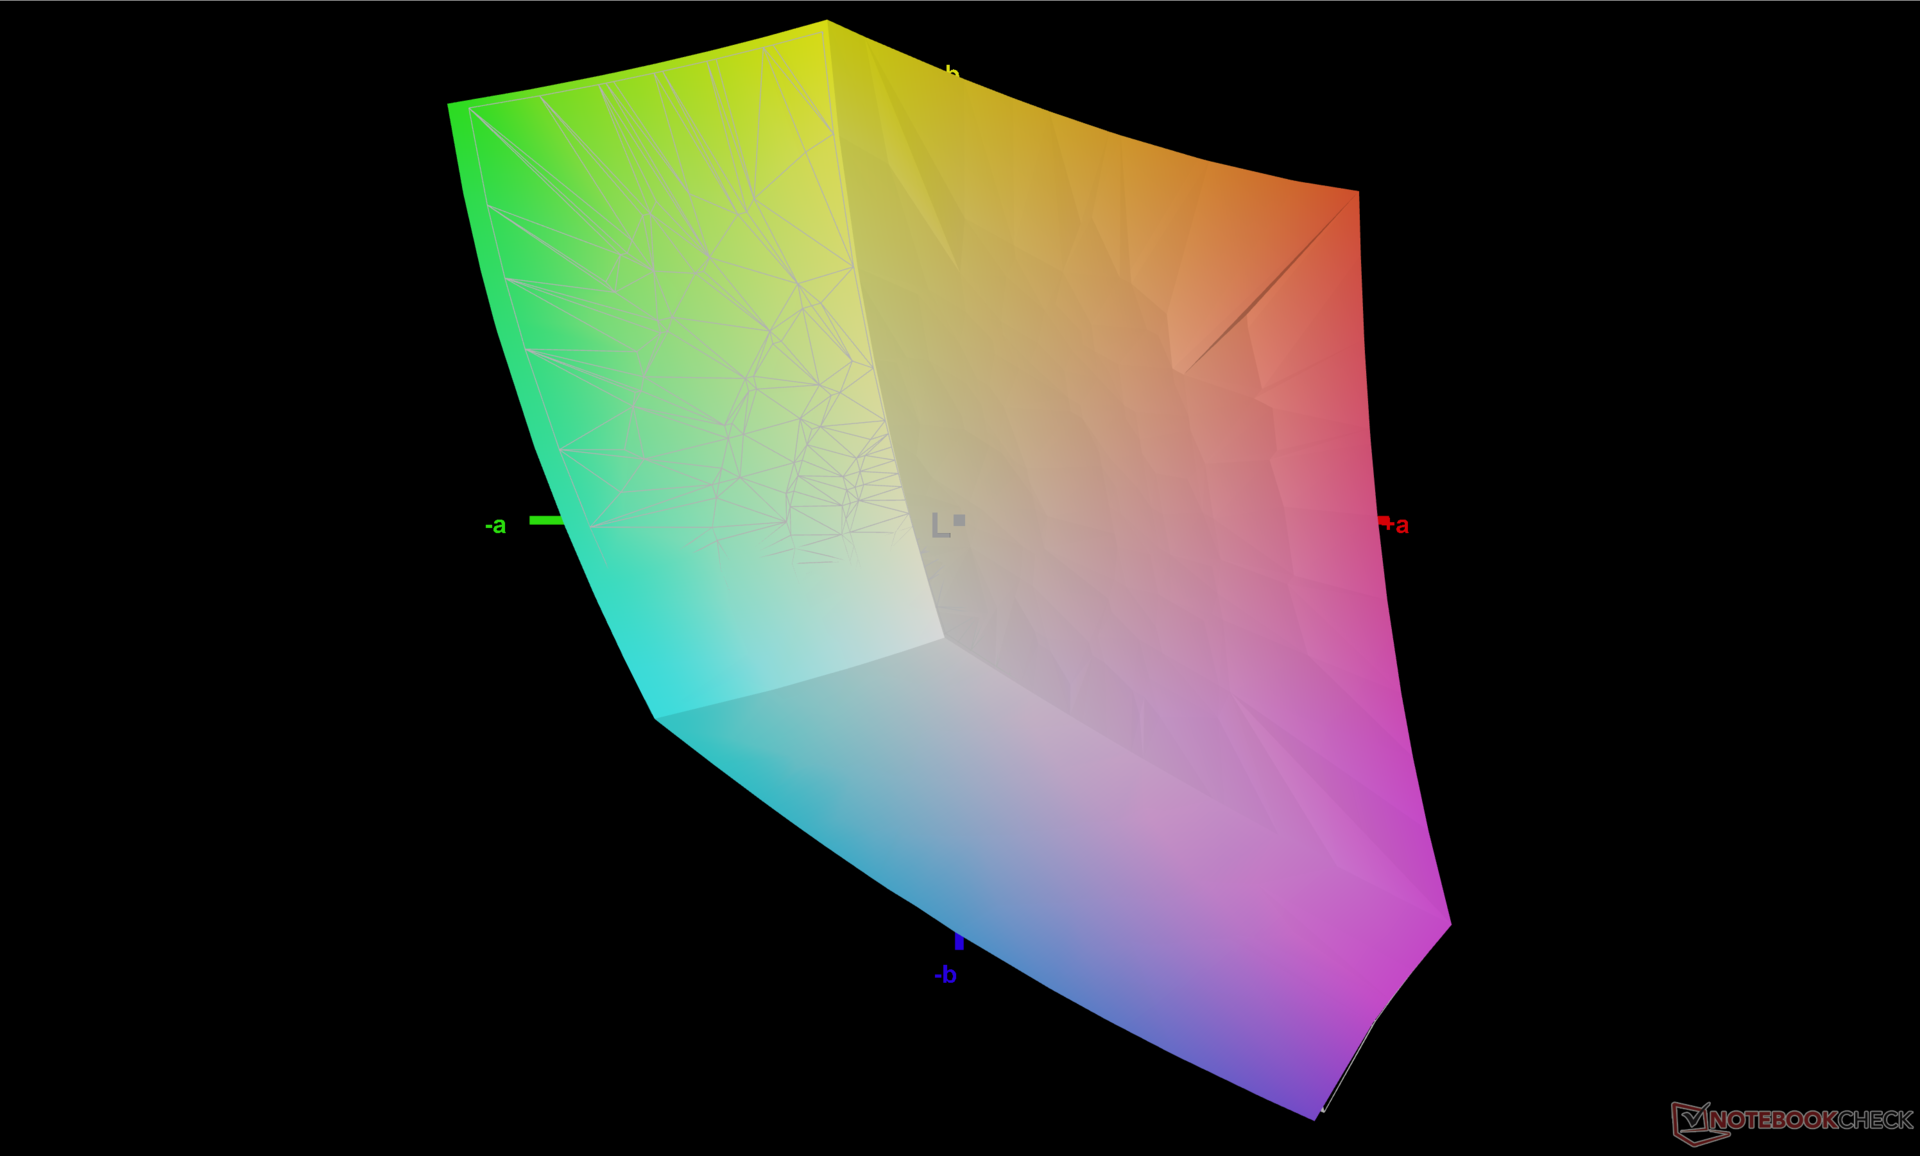
L'écran est bien calibré dès sa sortie de l'emballage, à l'instar de ce que nous avons découvert sur le 7610. Les valeurs moyennes de DeltaE pour les niveaux de gris et les couleurs sont respectivement de 1,4 et 1,88, tandis que nos propres tentatives de calibrage ont permis d'améliorer encore les moyennes à seulement 0,5 et 0,42. Si vous appréciez les écrans sRGB précis, vous aimerez ce que vous verrez ici.
Temps de réponse de l'écran
| ↔ Temps de réponse noir à blanc | ||
|---|---|---|
| 28 ms ... hausse ↗ et chute ↘ combinées | ↗ 13.2 ms hausse | 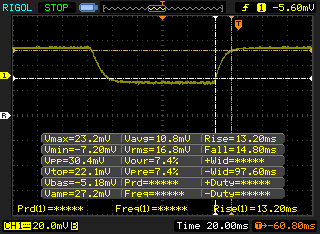 |
| ↘ 14.8 ms chute | ||
| L'écran souffre de latences relativement élevées, insuffisant pour le jeu. En comparaison, tous les appareils testés affichent entre 0.1 (minimum) et 240 (maximum) ms. » 71 % des appareils testés affichent de meilleures performances. Cela signifie que les latences relevées sont moins bonnes que la moyenne (19.9 ms) de tous les appareils testés. | ||
| ↔ Temps de réponse gris 50% à gris 80% | ||
| 38 ms ... hausse ↗ et chute ↘ combinées | ↗ 21.2 ms hausse | 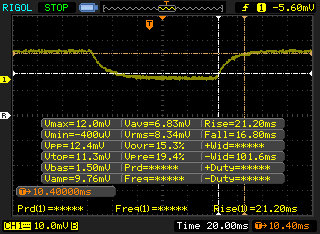 |
| ↘ 16.8 ms chute | ||
| L'écran souffre de latences très élevées, à éviter pour le jeu. En comparaison, tous les appareils testés affichent entre 0.165 (minimum) et 636 (maximum) ms. » 55 % des appareils testés affichent de meilleures performances. Cela signifie que les latences relevées sont moins bonnes que la moyenne (31.1 ms) de tous les appareils testés. | ||
Scintillement / MLI (Modulation de largeur d'impulsion)
| Scintillement / MLI (Modulation de largeur d'impulsion) non décelé | 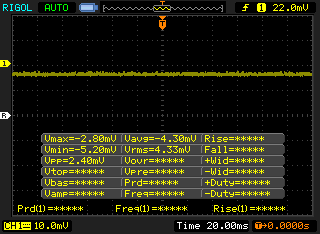 | ||
En comparaison, 52 % des appareils testés n'emploient pas MDI pour assombrir leur écran. Nous avons relevé une moyenne à 7798 (minimum : 5 - maximum : 343500) Hz dans le cas où une MDI était active. | |||
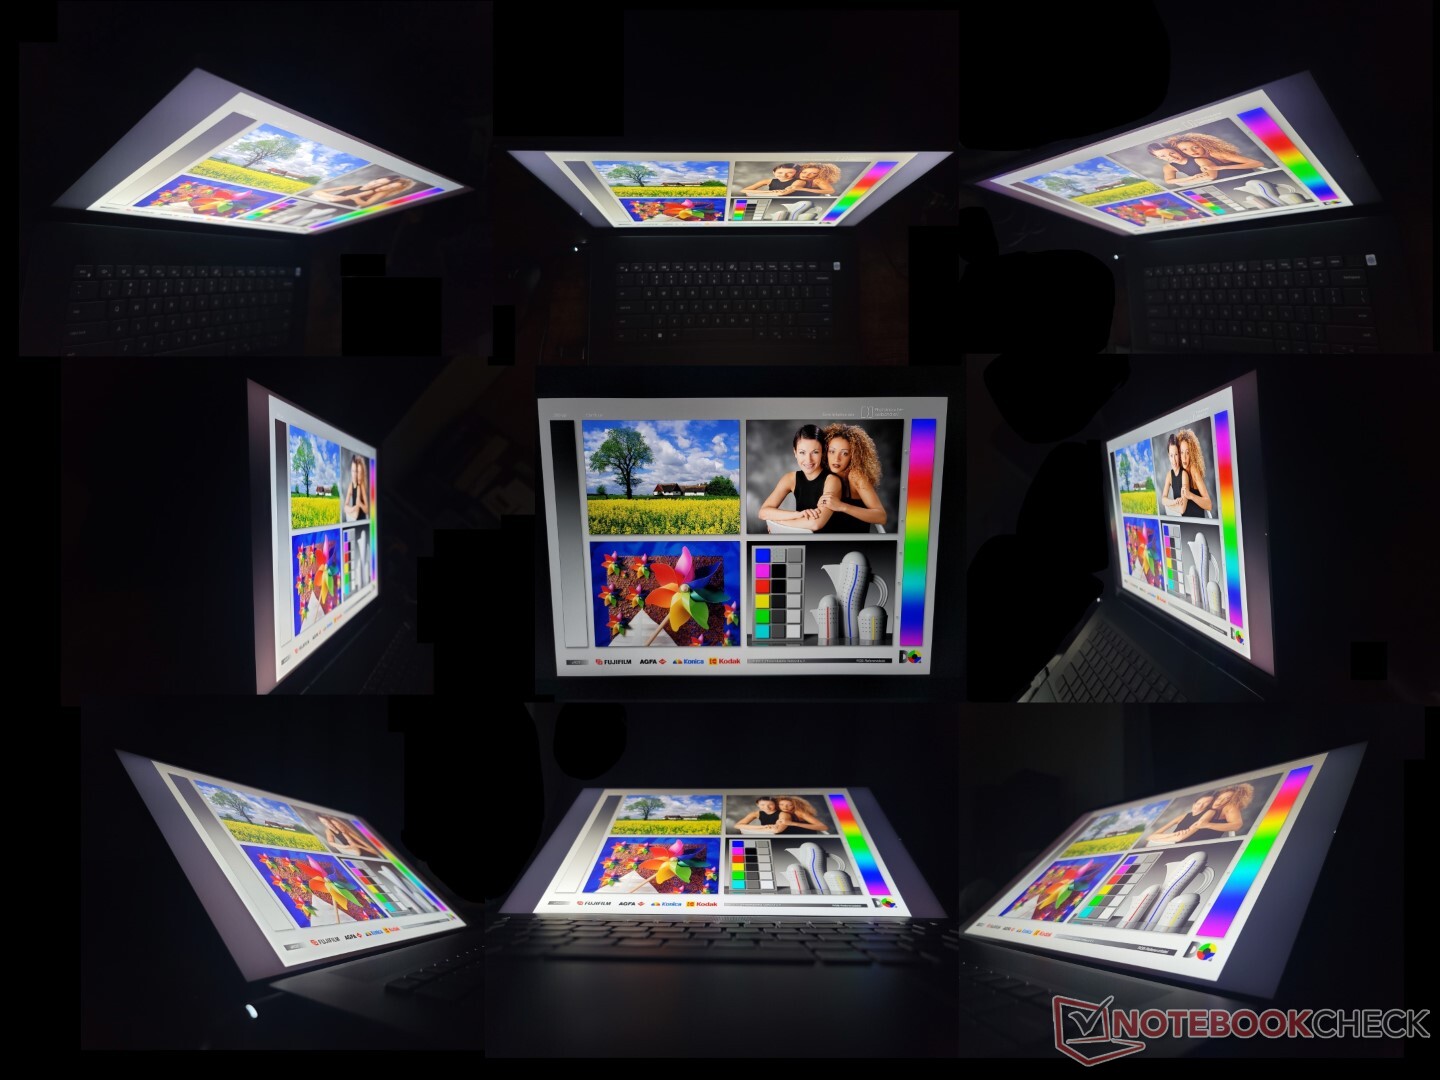
La visibilité en extérieur est comparable au modèle de l'année dernière puisque la luminosité maximale n'a pas changé. Le Lenovo Yoga 7 ou l'Asus VivoBook Pro 16X ont des écrans plus lumineux, mais les reflets de leurs superpositions brillantes sont plus difficiles à éviter.
Performances - La 12e génération offre des performances et une consommation d'énergie accrues
Conditions d'essai
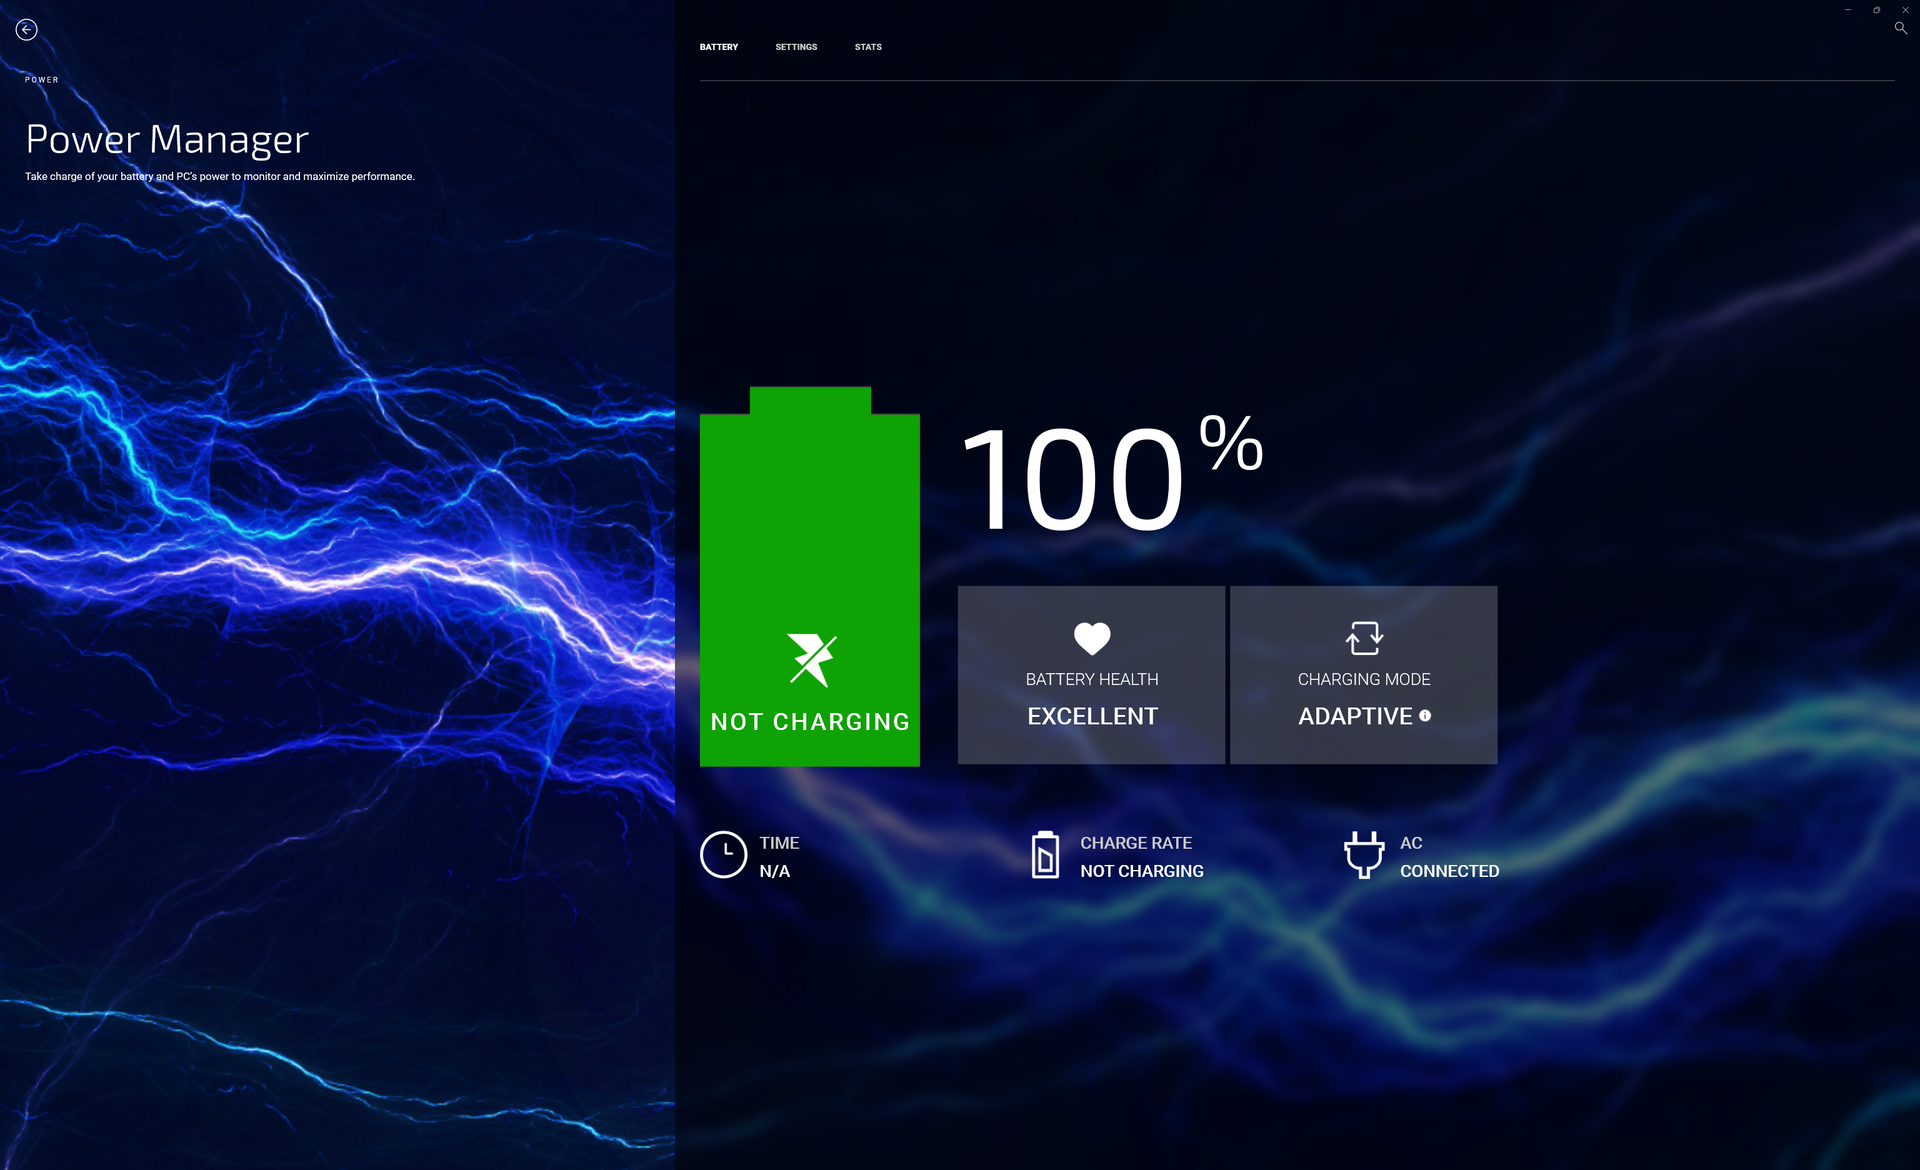
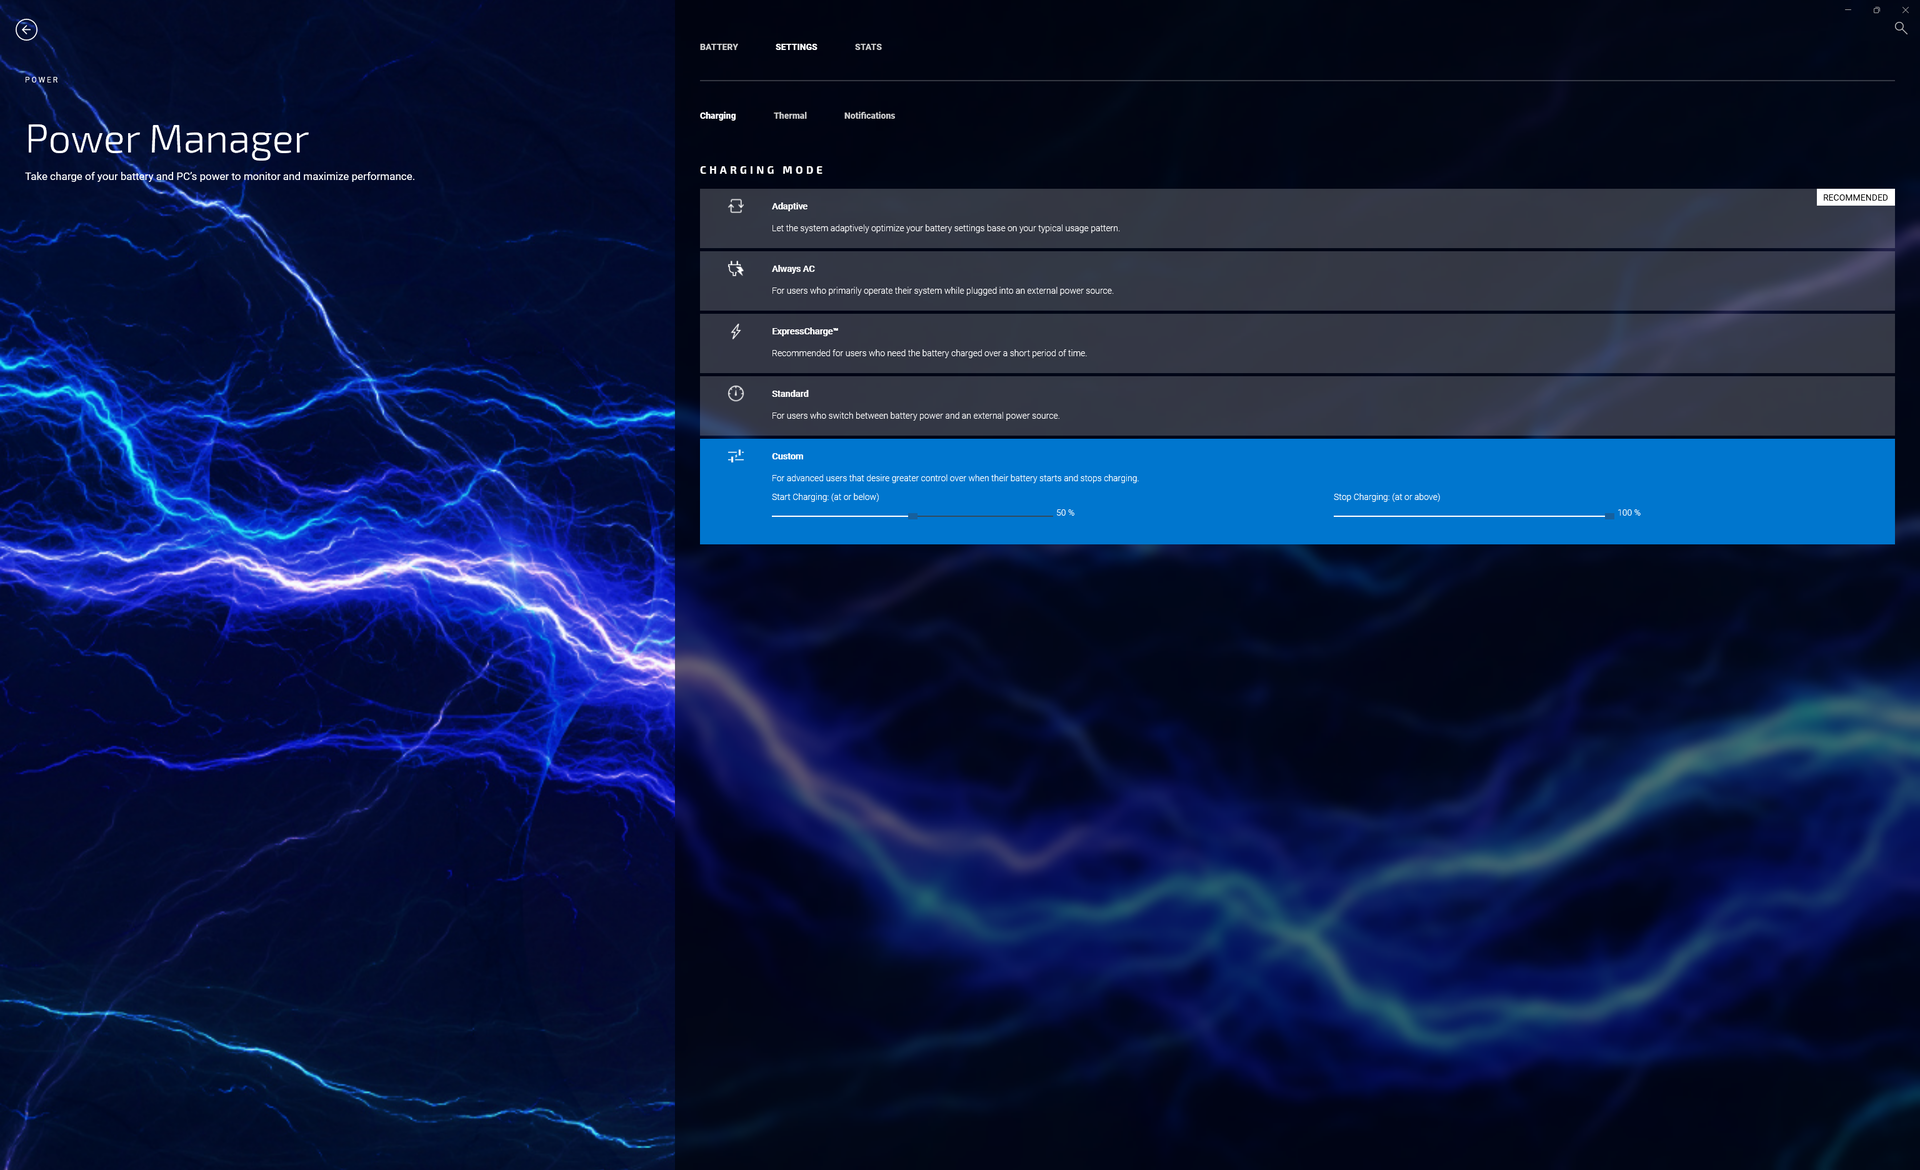
Nous avons réglé notre appareil en mode Performance via Windows et en mode Ultra Performance via le logiciel MyDell préinstallé avant d'effectuer les tests de référence ci-dessous. Les utilisateurs doivent se familiariser avec MyDell, car c'est la plaque tournante pour les questions de garantie, l'enregistrement du produit, les paramètres de charge de la batterie et les modes de performance
Nvidia Optimus est livré en standard sans option MUX.
Processeur
Les performances brutes en multithread sont de 30 à 50 % plus rapides que celles de la dernière génération du Core i7-11800H ce qui représente une augmentation assez significative d'une année sur l'autre. La durabilité des performances pourrait être un peu meilleure, cependant, car les scores de CineBench R15 xT chutent d'environ 18 % lorsque le benchmark est exécuté en boucle. Nous ne sommes pas sûrs de l'ampleur de la baisse de performance à laquelle les utilisateurs doivent s'attendre s'ils rétrogradent vers le Core i5-12500H car nous n'avons pas encore testé d'ordinateur portable équipé d'un tel processeur à ce jour.
Cinebench R15 Multi Loop
Cinebench R23: Multi Core | Single Core
Cinebench R15: CPU Multi 64Bit | CPU Single 64Bit
Blender: v2.79 BMW27 CPU
7-Zip 18.03: 7z b 4 | 7z b 4 -mmt1
Geekbench 5.5: Multi-Core | Single-Core
HWBOT x265 Benchmark v2.2: 4k Preset
LibreOffice : 20 Documents To PDF
R Benchmark 2.5: Overall mean
| Cinebench R20 / CPU (Single Core) | |
| MSI Creator Z16P B12UHST | |
| Razer Blade 15 2022 | |
| Gigabyte Aero 16 YE5 | |
| Dell Inspiron 14 7420 2-in-1 | |
| Dell Inspiron 16 Plus 7620 | |
| Moyenne Intel Core i7-12700H (300 - 704, n=64) | |
| Lenovo Yoga 7 16IAP7 | |
| Dell Inspiron 16 Plus 7610-MHJ8F | |
| Acer Swift X SFX16-51G-5388 | |
| HP Victus 16-e0145ng | |
| HP Pavilion Gaming 16-a0242ng | |
| Cinebench R23 / Single Core | |
| Gigabyte Aero 16 YE5 | |
| MSI Creator Z16P B12UHST | |
| Razer Blade 15 2022 | |
| Dell Inspiron 14 7420 2-in-1 | |
| Dell Inspiron 16 Plus 7620 | |
| Moyenne Intel Core i7-12700H (778 - 1826, n=63) | |
| Lenovo Yoga 7 16IAP7 | |
| Dell Inspiron 16 Plus 7610-MHJ8F | |
| HP Victus 16-e0145ng | |
| Acer Swift X SFX16-51G-5388 | |
| HWBOT x265 Benchmark v2.2 / 4k Preset | |
| MSI Creator Z16P B12UHST | |
| Gigabyte Aero 16 YE5 | |
| Razer Blade 15 2022 | |
| Moyenne Intel Core i7-12700H (4.67 - 21.8, n=64) | |
| Dell Inspiron 16 Plus 7620 | |
| HP Victus 16-e0145ng | |
| Lenovo Yoga 7 16IAP7 | |
| Dell Inspiron 16 Plus 7610-MHJ8F | |
| Dell Inspiron 14 7420 2-in-1 | |
| Acer Swift X SFX16-51G-5388 | |
| HP Pavilion Gaming 16-a0242ng | |
* ... Moindre est la valeur, meilleures sont les performances
AIDA64: FP32 Ray-Trace | FPU Julia | CPU SHA3 | CPU Queen | FPU SinJulia | FPU Mandel | CPU AES | CPU ZLib | FP64 Ray-Trace | CPU PhotoWorxx
| Performance rating | |
| Asus Vivobook Pro 16X-M7600QE | |
| Dell Inspiron 16 Plus 7620 | |
| Moyenne Intel Core i7-12700H | |
| Huawei MateBook D 16 2022 | |
| Lenovo Yoga 7 16IAP7 | |
| Acer Swift X SFX16-51G-5388 | |
| Dell Inspiron 16 Plus 7610 -9! | |
| AIDA64 / FP32 Ray-Trace | |
| Asus Vivobook Pro 16X-M7600QE | |
| Asus Vivobook Pro 16X-M7600QE | |
| Dell Inspiron 16 Plus 7620 | |
| Huawei MateBook D 16 2022 | |
| Moyenne Intel Core i7-12700H (2585 - 17957, n=64) | |
| Lenovo Yoga 7 16IAP7 | |
| Acer Swift X SFX16-51G-5388 | |
| AIDA64 / FPU Julia | |
| Asus Vivobook Pro 16X-M7600QE | |
| Asus Vivobook Pro 16X-M7600QE | |
| Dell Inspiron 16 Plus 7620 | |
| Huawei MateBook D 16 2022 | |
| Moyenne Intel Core i7-12700H (12439 - 90760, n=64) | |
| Lenovo Yoga 7 16IAP7 | |
| Acer Swift X SFX16-51G-5388 | |
| AIDA64 / CPU SHA3 | |
| Asus Vivobook Pro 16X-M7600QE | |
| Asus Vivobook Pro 16X-M7600QE | |
| Moyenne Intel Core i7-12700H (833 - 4242, n=64) | |
| Dell Inspiron 16 Plus 7620 | |
| Huawei MateBook D 16 2022 | |
| Lenovo Yoga 7 16IAP7 | |
| Acer Swift X SFX16-51G-5388 | |
| AIDA64 / CPU Queen | |
| Asus Vivobook Pro 16X-M7600QE | |
| Asus Vivobook Pro 16X-M7600QE | |
| Moyenne Intel Core i7-12700H (57923 - 103202, n=63) | |
| Huawei MateBook D 16 2022 | |
| Dell Inspiron 16 Plus 7620 | |
| Lenovo Yoga 7 16IAP7 | |
| Acer Swift X SFX16-51G-5388 | |
| AIDA64 / FPU SinJulia | |
| Asus Vivobook Pro 16X-M7600QE | |
| Asus Vivobook Pro 16X-M7600QE | |
| Moyenne Intel Core i7-12700H (3249 - 9939, n=64) | |
| Dell Inspiron 16 Plus 7620 | |
| Huawei MateBook D 16 2022 | |
| Lenovo Yoga 7 16IAP7 | |
| Acer Swift X SFX16-51G-5388 | |
| AIDA64 / FPU Mandel | |
| Asus Vivobook Pro 16X-M7600QE | |
| Asus Vivobook Pro 16X-M7600QE | |
| Dell Inspiron 16 Plus 7620 | |
| Moyenne Intel Core i7-12700H (7135 - 44760, n=64) | |
| Huawei MateBook D 16 2022 | |
| Lenovo Yoga 7 16IAP7 | |
| Acer Swift X SFX16-51G-5388 | |
| AIDA64 / CPU AES | |
| Asus Vivobook Pro 16X-M7600QE | |
| Asus Vivobook Pro 16X-M7600QE | |
| Huawei MateBook D 16 2022 | |
| Moyenne Intel Core i7-12700H (31839 - 144360, n=64) | |
| Dell Inspiron 16 Plus 7620 | |
| Acer Swift X SFX16-51G-5388 | |
| Lenovo Yoga 7 16IAP7 | |
| AIDA64 / FP64 Ray-Trace | |
| Asus Vivobook Pro 16X-M7600QE | |
| Asus Vivobook Pro 16X-M7600QE | |
| Dell Inspiron 16 Plus 7620 | |
| Moyenne Intel Core i7-12700H (1437 - 9692, n=64) | |
| Huawei MateBook D 16 2022 | |
| Lenovo Yoga 7 16IAP7 | |
| Acer Swift X SFX16-51G-5388 | |
| AIDA64 / CPU PhotoWorxx | |
| Lenovo Yoga 7 16IAP7 | |
| Huawei MateBook D 16 2022 | |
| Acer Swift X SFX16-51G-5388 | |
| Dell Inspiron 16 Plus 7620 | |
| Moyenne Intel Core i7-12700H (12863 - 52207, n=64) | |
| Asus Vivobook Pro 16X-M7600QE | |
| Asus Vivobook Pro 16X-M7600QE | |
Performance du système
Les résultats de PCMark 10 sont systématiquement supérieurs à ceux de la génération précédente de l'Inspiron 16 Plus 7610 ainsi qu'à ceux de la plupart des autres ordinateurs portables multimédias de 16 pouces.
CrossMark: Overall | Productivity | Creativity | Responsiveness
| PCMark 10 / Score | |
| Dell Inspiron 16 Plus 7620 | |
| Moyenne Intel Core i7-12700H, NVIDIA GeForce RTX 3050 Ti Laptop GPU (6623 - 7075, n=5) | |
| Asus Vivobook Pro 16X-M7600QE | |
| Dell Inspiron 16 Plus 7610 | |
| Huawei MateBook D 16 2022 | |
| Lenovo Yoga 7 16IAP7 | |
| Acer Swift X SFX16-51G-5388 | |
| PCMark 10 / Essentials | |
| Huawei MateBook D 16 2022 | |
| Lenovo Yoga 7 16IAP7 | |
| Asus Vivobook Pro 16X-M7600QE | |
| Moyenne Intel Core i7-12700H, NVIDIA GeForce RTX 3050 Ti Laptop GPU (9540 - 10970, n=5) | |
| Dell Inspiron 16 Plus 7620 | |
| Dell Inspiron 16 Plus 7610 | |
| Acer Swift X SFX16-51G-5388 | |
| PCMark 10 / Productivity | |
| Asus Vivobook Pro 16X-M7600QE | |
| Dell Inspiron 16 Plus 7620 | |
| Moyenne Intel Core i7-12700H, NVIDIA GeForce RTX 3050 Ti Laptop GPU (8530 - 9555, n=5) | |
| Acer Swift X SFX16-51G-5388 | |
| Dell Inspiron 16 Plus 7610 | |
| Huawei MateBook D 16 2022 | |
| Lenovo Yoga 7 16IAP7 | |
| PCMark 10 / Digital Content Creation | |
| Dell Inspiron 16 Plus 7620 | |
| Moyenne Intel Core i7-12700H, NVIDIA GeForce RTX 3050 Ti Laptop GPU (8855 - 9542, n=5) | |
| Dell Inspiron 16 Plus 7610 | |
| Asus Vivobook Pro 16X-M7600QE | |
| Lenovo Yoga 7 16IAP7 | |
| Huawei MateBook D 16 2022 | |
| Acer Swift X SFX16-51G-5388 | |
| CrossMark / Overall | |
| Huawei MateBook D 16 2022 | |
| Dell Inspiron 16 Plus 7620 | |
| Moyenne Intel Core i7-12700H, NVIDIA GeForce RTX 3050 Ti Laptop GPU (1654 - 1872, n=5) | |
| Lenovo Yoga 7 16IAP7 | |
| Acer Swift X SFX16-51G-5388 | |
| CrossMark / Productivity | |
| Huawei MateBook D 16 2022 | |
| Moyenne Intel Core i7-12700H, NVIDIA GeForce RTX 3050 Ti Laptop GPU (1595 - 1792, n=5) | |
| Dell Inspiron 16 Plus 7620 | |
| Lenovo Yoga 7 16IAP7 | |
| Acer Swift X SFX16-51G-5388 | |
| CrossMark / Creativity | |
| Huawei MateBook D 16 2022 | |
| Dell Inspiron 16 Plus 7620 | |
| Lenovo Yoga 7 16IAP7 | |
| Moyenne Intel Core i7-12700H, NVIDIA GeForce RTX 3050 Ti Laptop GPU (1699 - 1993, n=5) | |
| Acer Swift X SFX16-51G-5388 | |
| CrossMark / Responsiveness | |
| Huawei MateBook D 16 2022 | |
| Moyenne Intel Core i7-12700H, NVIDIA GeForce RTX 3050 Ti Laptop GPU (1383 - 1768, n=5) | |
| Dell Inspiron 16 Plus 7620 | |
| Lenovo Yoga 7 16IAP7 | |
| Acer Swift X SFX16-51G-5388 | |
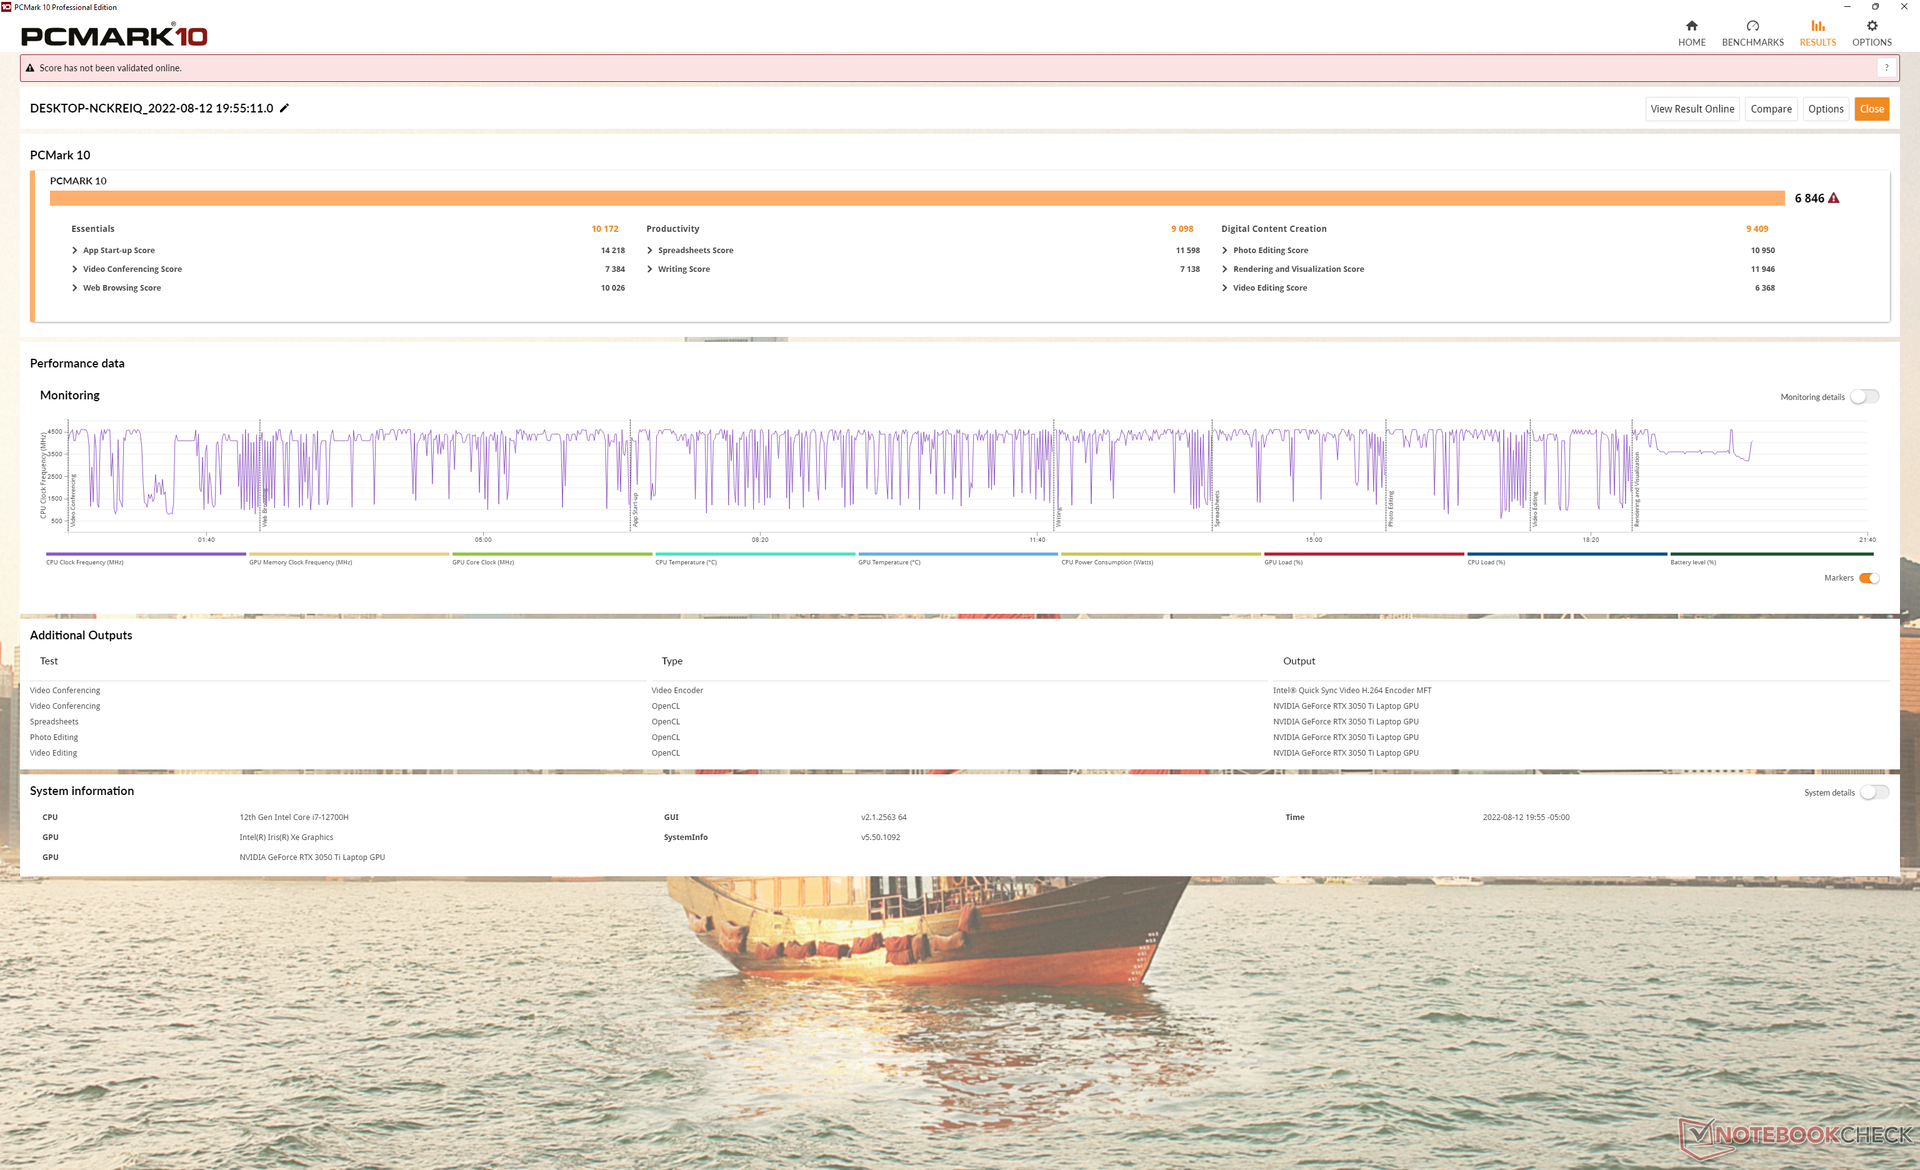
| PCMark 10 Score | 6846 points | |
Aide | ||
| AIDA64 / Memory Copy | |
| Lenovo Yoga 7 16IAP7 | |
| Huawei MateBook D 16 2022 | |
| Acer Swift X SFX16-51G-5388 | |
| Dell Inspiron 16 Plus 7620 | |
| Moyenne Intel Core i7-12700H (25615 - 80511, n=64) | |
| Asus Vivobook Pro 16X-M7600QE | |
| Asus Vivobook Pro 16X-M7600QE | |
| AIDA64 / Memory Read | |
| Lenovo Yoga 7 16IAP7 | |
| Dell Inspiron 16 Plus 7620 | |
| Moyenne Intel Core i7-12700H (25586 - 79442, n=64) | |
| Huawei MateBook D 16 2022 | |
| Acer Swift X SFX16-51G-5388 | |
| Asus Vivobook Pro 16X-M7600QE | |
| Asus Vivobook Pro 16X-M7600QE | |
| AIDA64 / Memory Write | |
| Acer Swift X SFX16-51G-5388 | |
| Lenovo Yoga 7 16IAP7 | |
| Huawei MateBook D 16 2022 | |
| Dell Inspiron 16 Plus 7620 | |
| Moyenne Intel Core i7-12700H (23679 - 88660, n=64) | |
| Asus Vivobook Pro 16X-M7600QE | |
| Asus Vivobook Pro 16X-M7600QE | |
| AIDA64 / Memory Latency | |
| Acer Swift X SFX16-51G-5388 | |
| Huawei MateBook D 16 2022 | |
| Lenovo Yoga 7 16IAP7 | |
| Dell Inspiron 16 Plus 7620 | |
| Moyenne Intel Core i7-12700H (76.2 - 133.9, n=62) | |
| Asus Vivobook Pro 16X-M7600QE | |
| Asus Vivobook Pro 16X-M7600QE | |
| Dell Inspiron 16 Plus 7610 | |
* ... Moindre est la valeur, meilleures sont les performances
Latence DPC
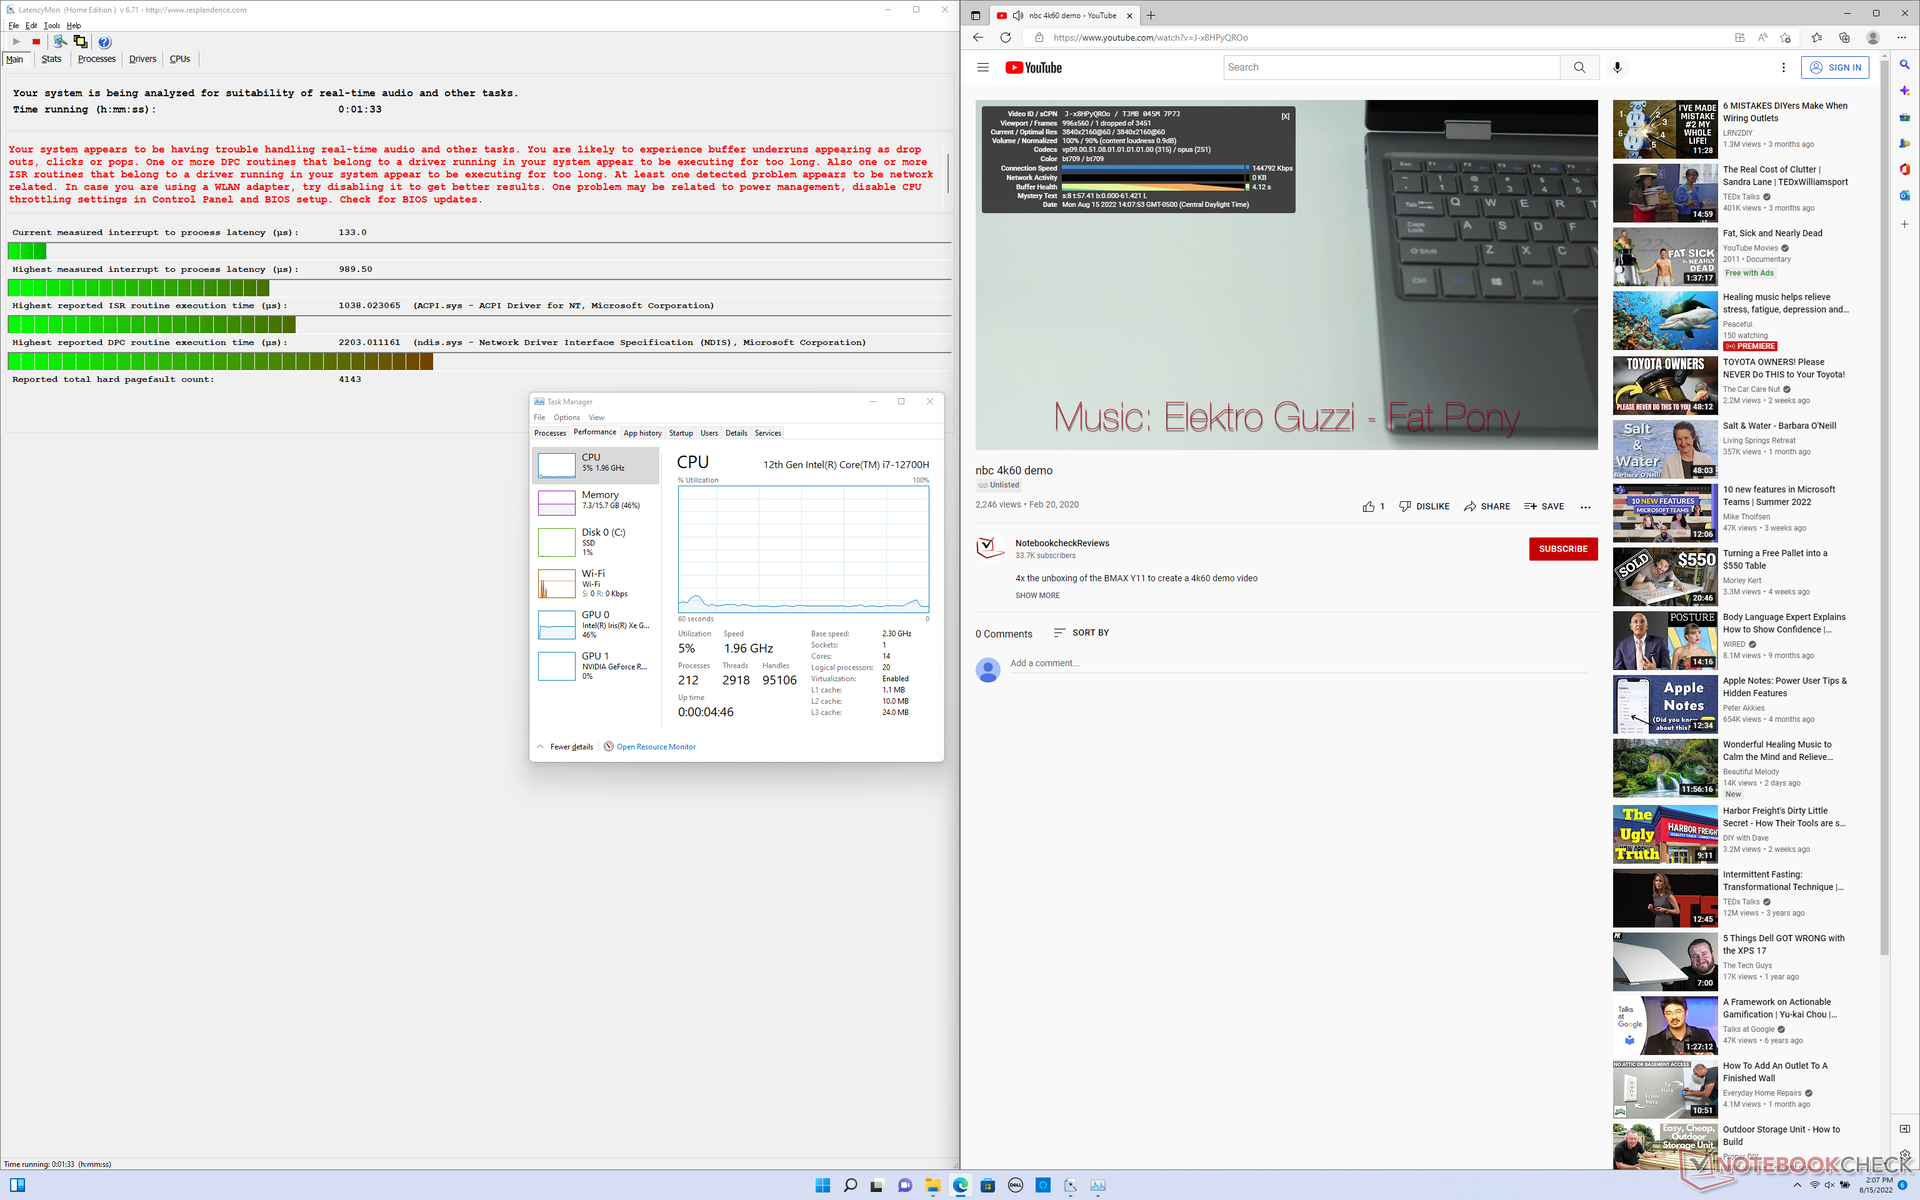
LatencyMon révèle des problèmes mineurs de DPC lors de l'ouverture de plusieurs onglets de navigateur sur notre page d'accueil. la lecture de vidéos 4K à 60 FPS est autrement fluide, avec une seule image perdue pendant notre vidéo de test d'une minute.
| DPC Latencies / LatencyMon - interrupt to process latency (max), Web, Youtube, Prime95 | |
| Acer Swift X SFX16-51G-5388 | |
| Asus Vivobook Pro 16X-M7600QE | |
| Dell Inspiron 16 Plus 7610 | |
| Dell Inspiron 16 Plus 7620 | |
| Huawei MateBook D 16 2022 | |
| Lenovo Yoga 7 16IAP7 | |
* ... Moindre est la valeur, meilleures sont les performances
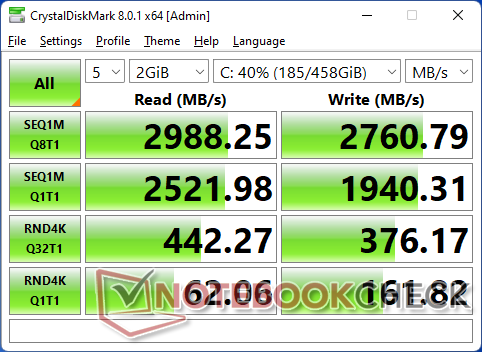
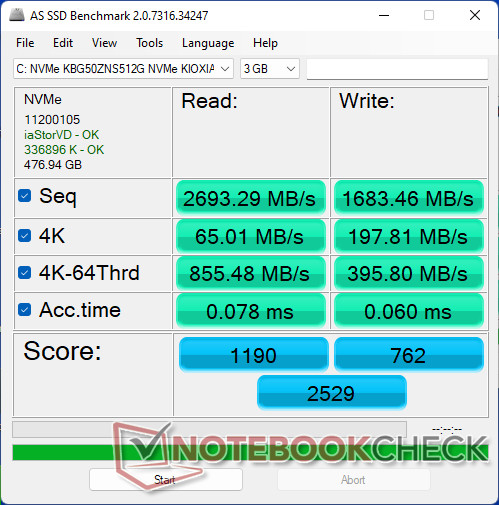
Périphériques de stockage
Notre unité de test est équipée d'un SSD Kioxia de 512 Go PCIe4 x4 M.2.SSD Kioxia pour des taux de lecture et d'écriture séquentiels allant jusqu'à ~2700 Mo/s chacun. Un dissipateur thermique en cuivre est placé sur le dessus pour faciliter le refroidissement. Le disque de notre unité n'a présenté aucun problème d'étranglement des performances lors de l'exécution de DiskSpd en boucle.

| Drive Performance rating - Percent | |
| Huawei MateBook D 16 2022 | |
| Asus Vivobook Pro 16X-M7600QE | |
| Lenovo Yoga 7 16IAP7 | |
| Dell Inspiron 16 Plus 7620 | |
| Acer Swift X SFX16-51G-5388 | |
| Dell Inspiron 16 Plus 7610 | |
* ... Moindre est la valeur, meilleures sont les performances
Disk Throttling: DiskSpd Read Loop, Queue Depth 8
Performances du GPU - Légèrement plus rapide qu'avant
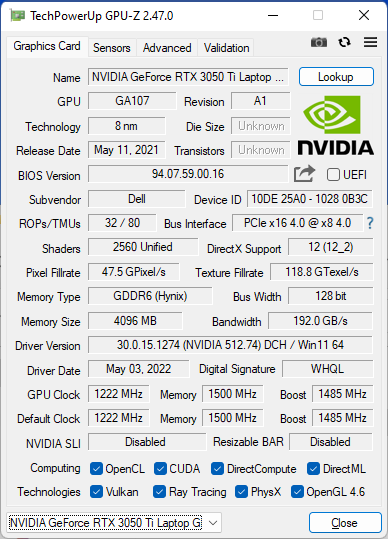
Les performances graphiques de notre GeForce RTX 3050 Ti n'est qu'environ 10 % plus rapide que celle de la RTX 3050 du modèle de l'année dernière. Bien que la série RTX 3050 soit généralement décevante depuis que l'ancienne et moins chère GTX 1660 Ti est supérieure, au moins la mise en œuvre de Dell est plus rapide que la plupart des autres ordinateurs portables équipés du même GPU
La mise à niveau vers la configuration RTX 3060 devrait permettre d'augmenter les performances graphiques de près de 20 %. Le GPU serait toutefois limité à un TGP de 60 W, ce qui est dans le bas du spectre des options mobiles RTX 3060.
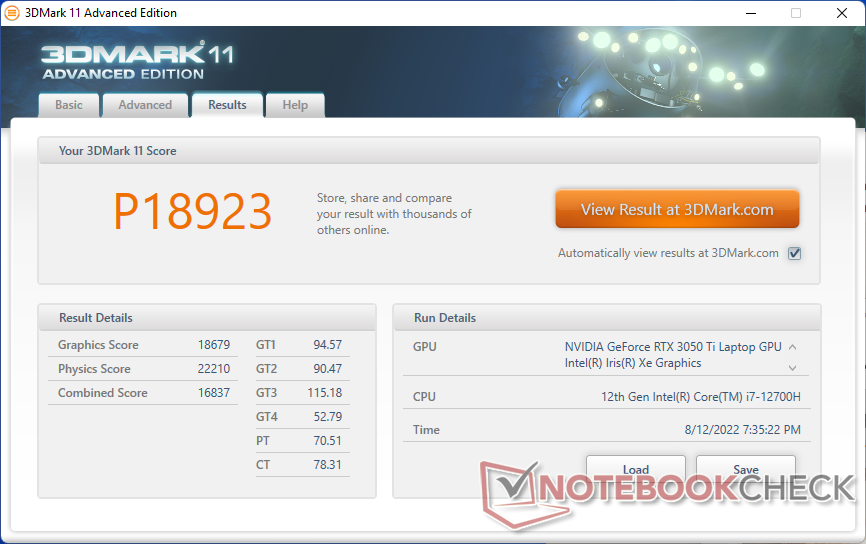
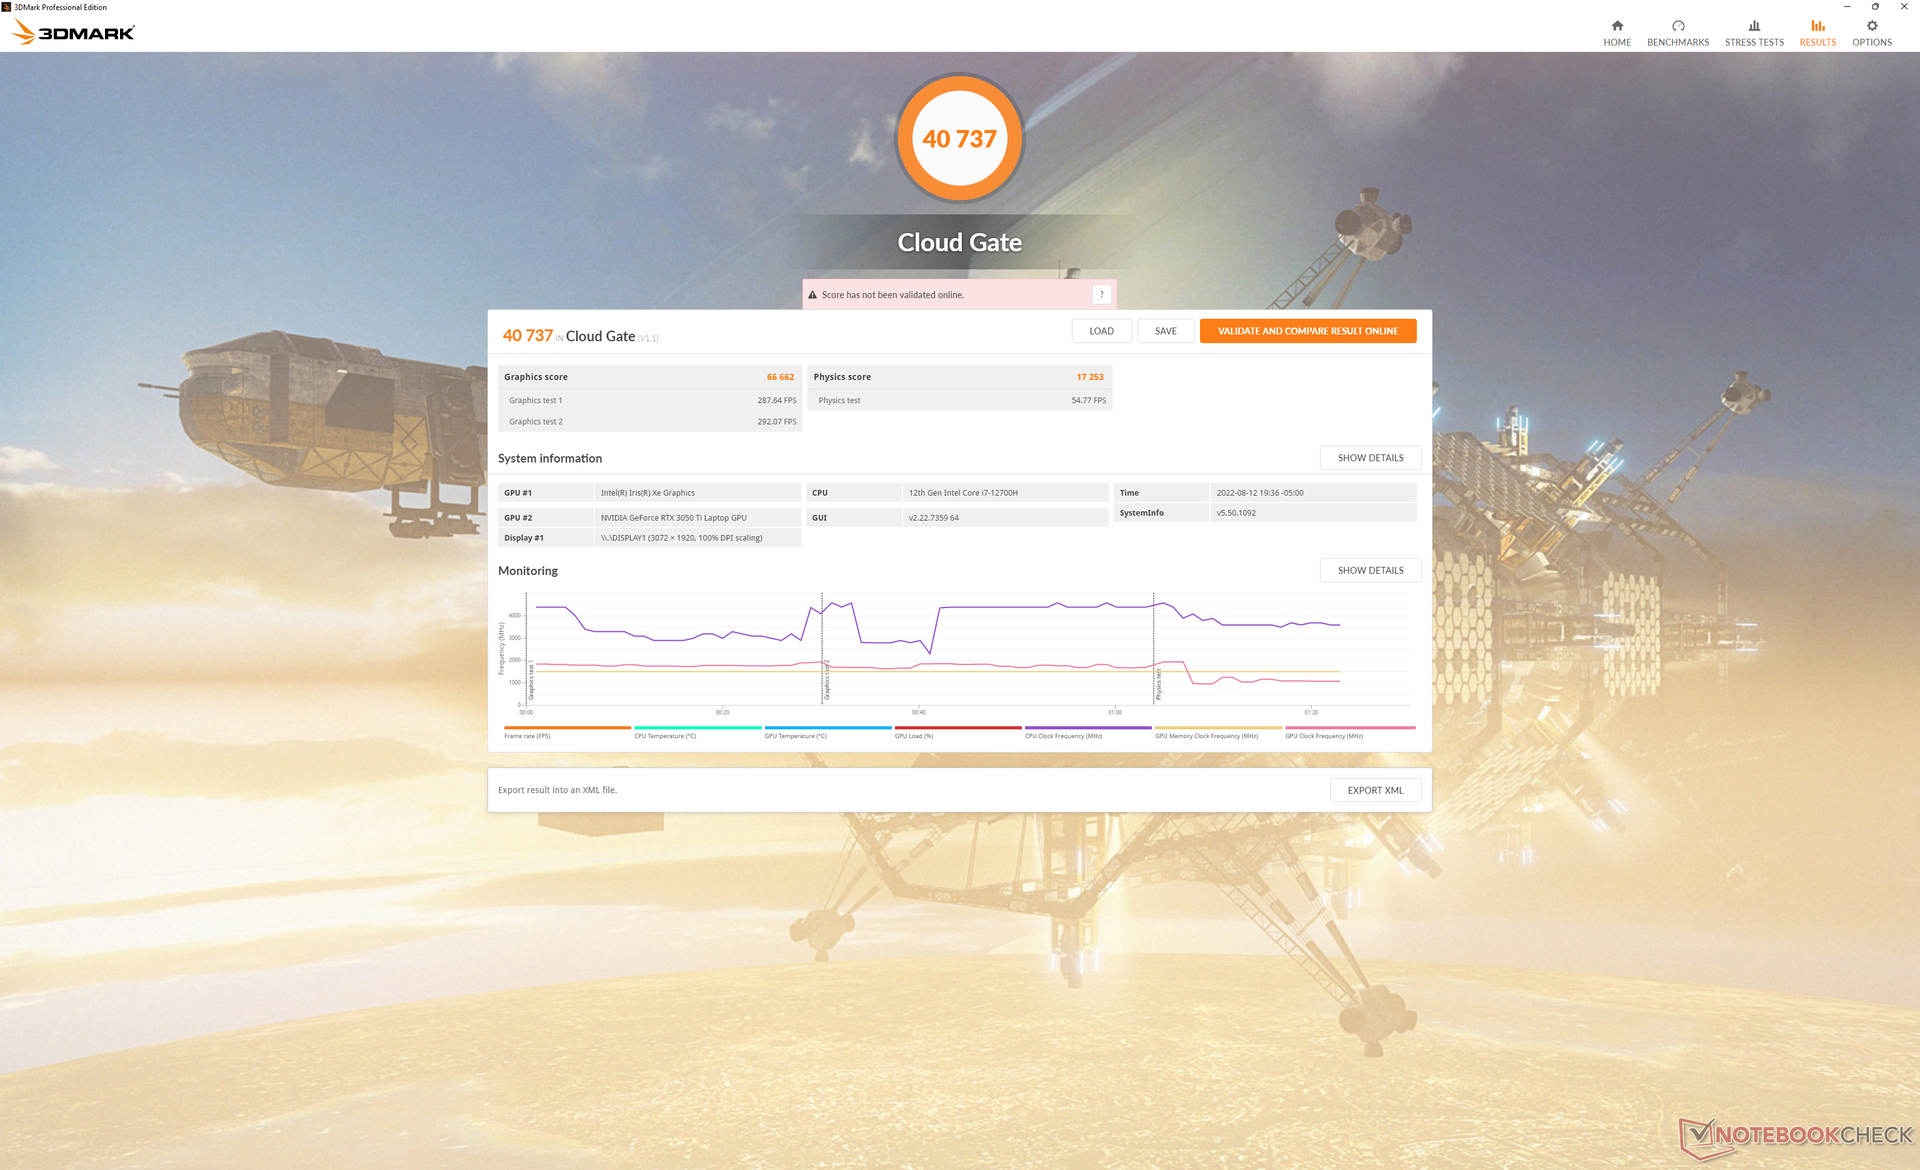
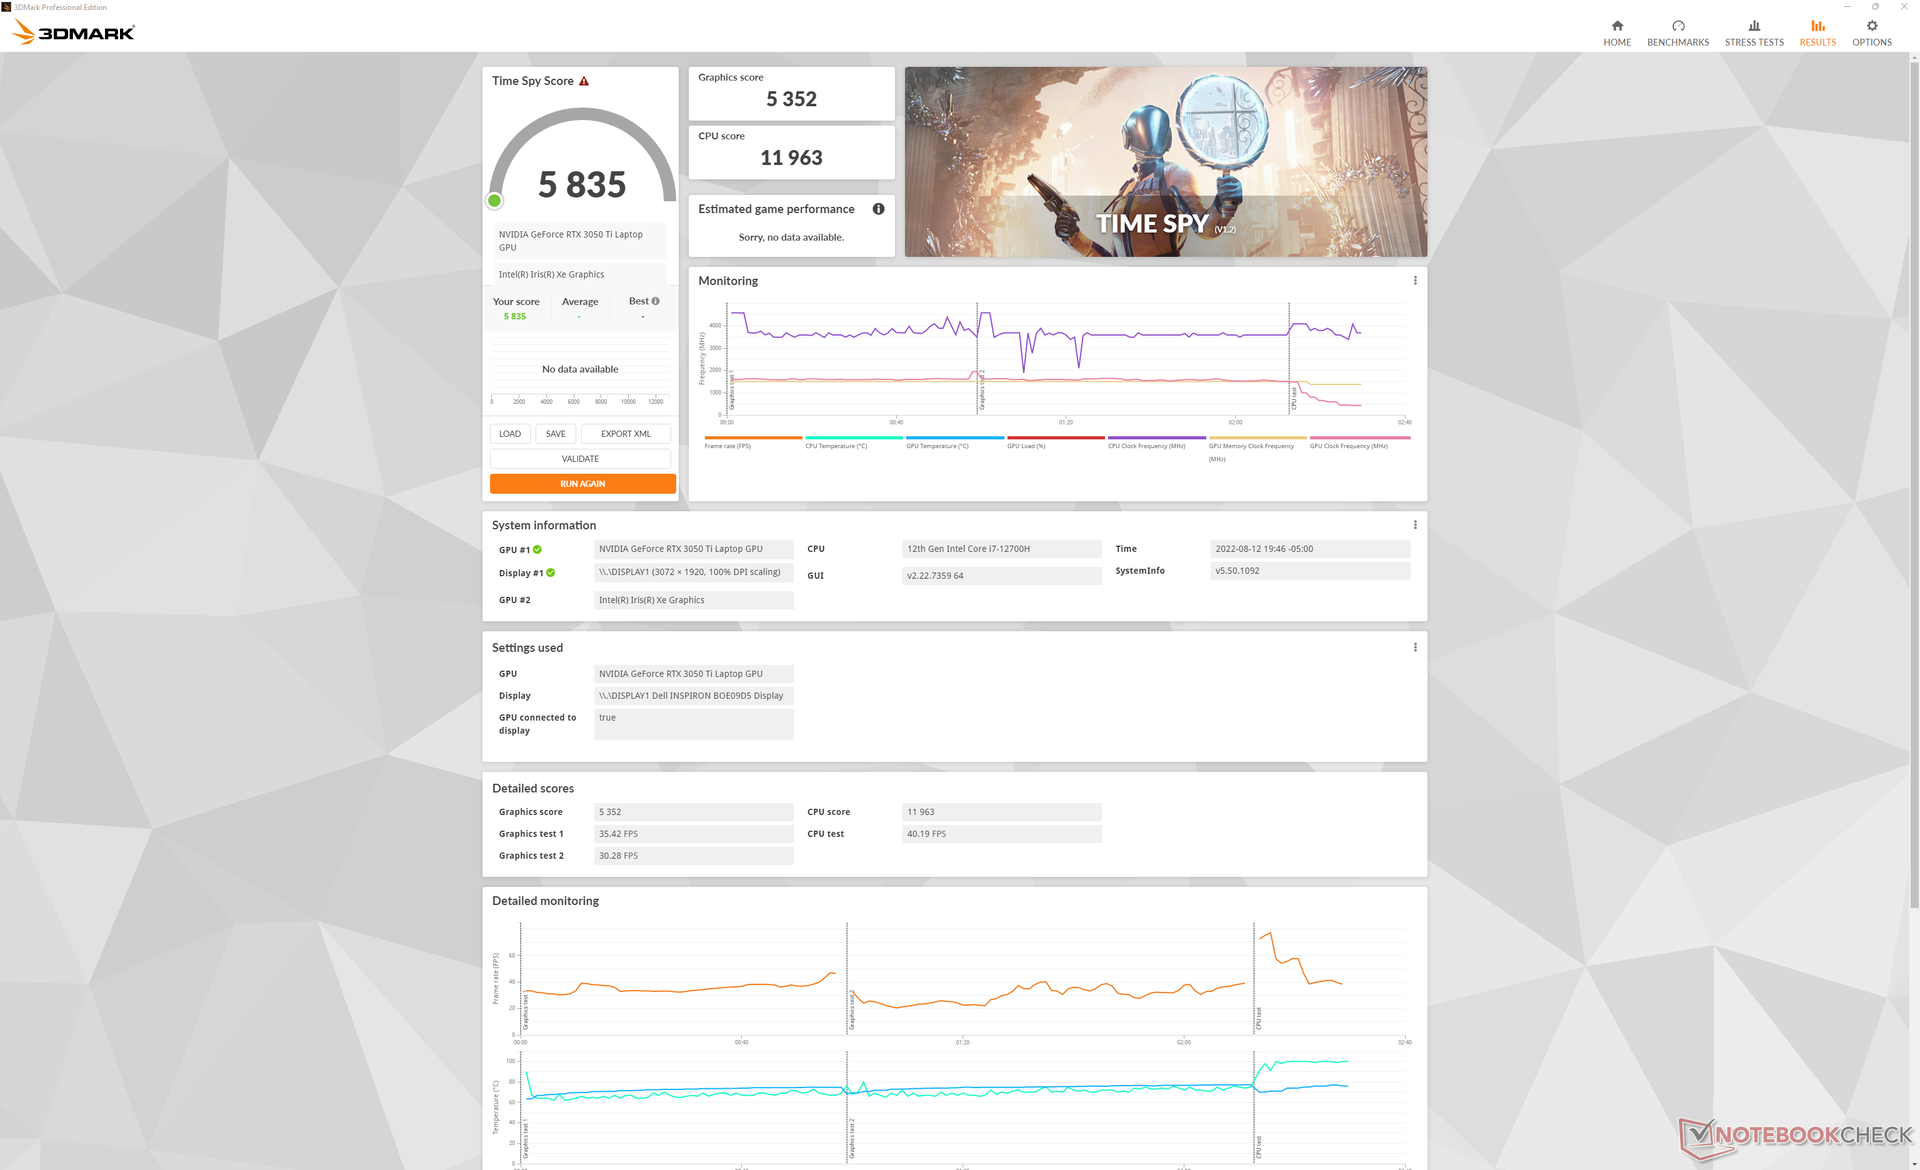
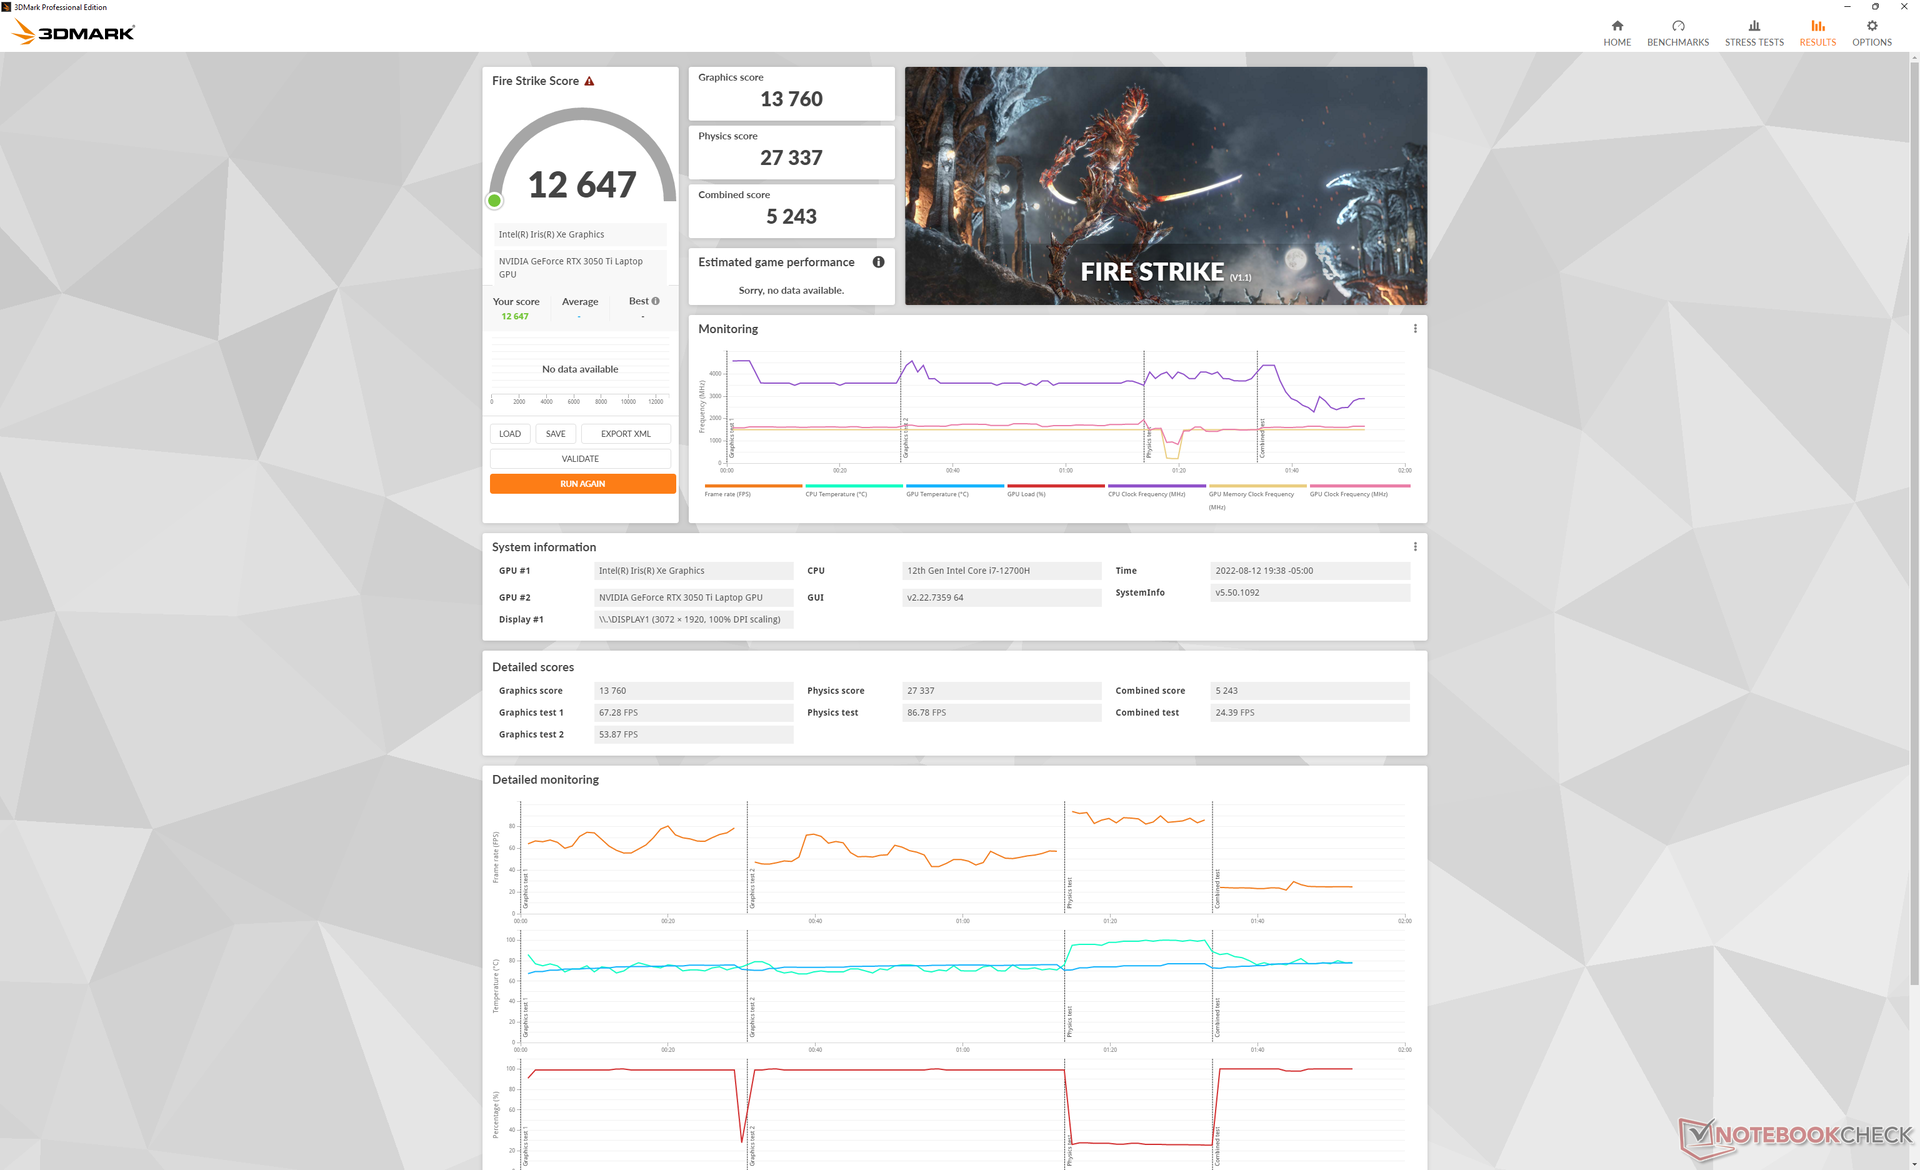
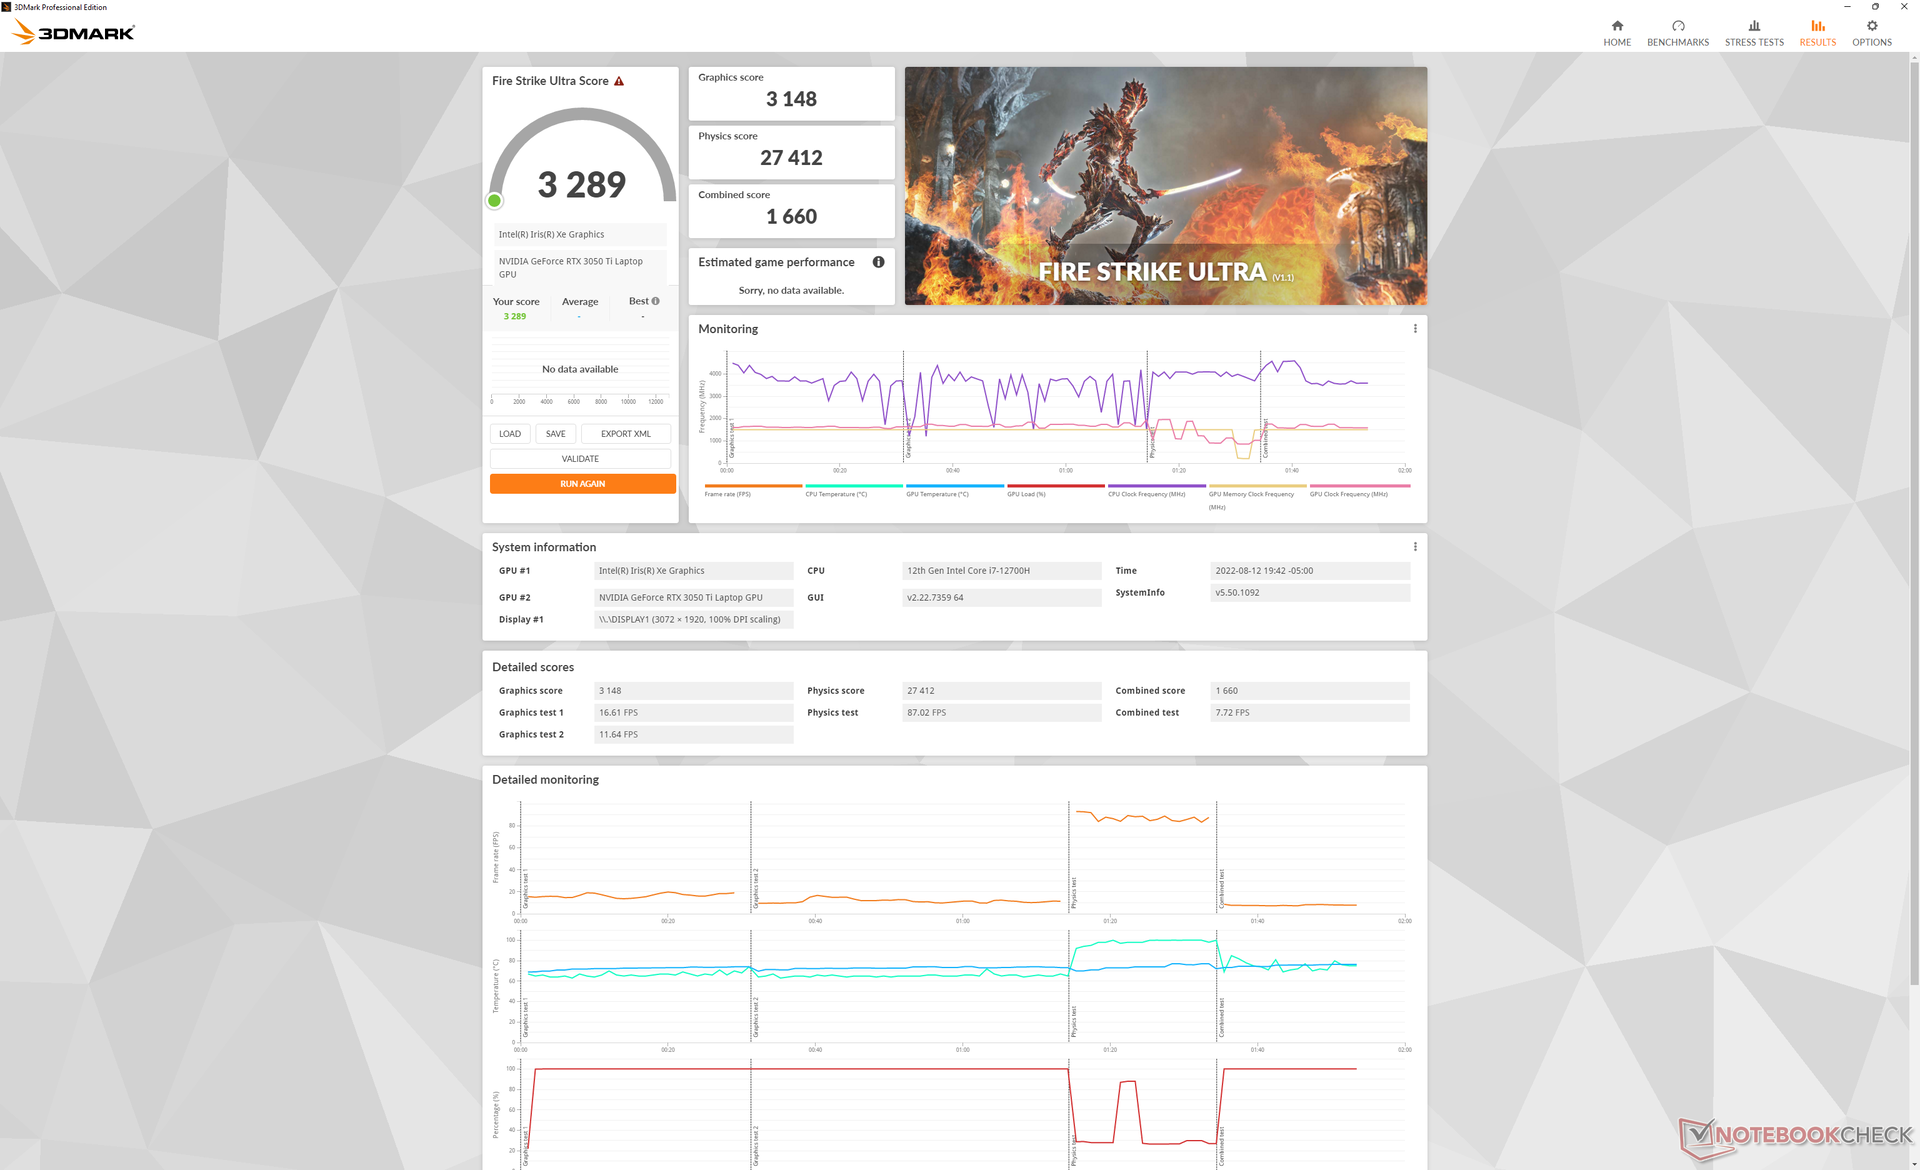
| 3DMark 11 Performance | 18923 points | |
| 3DMark Cloud Gate Standard Score | 40737 points | |
| 3DMark Fire Strike Score | 12647 points | |
| 3DMark Time Spy Score | 5835 points | |
Aide | ||
| Cyberpunk 2077 1.6 | |
| 1920x1080 Low Preset | |
| Dell Inspiron 16 Plus 7620 | |
| Moyenne NVIDIA GeForce RTX 3050 Ti Laptop GPU (48.2 - 81.9, n=9) | |
| Lenovo Yoga 7 16IAP7 | |
| 1920x1080 Medium Preset | |
| Dell Inspiron 16 Plus 7620 | |
| Moyenne NVIDIA GeForce RTX 3050 Ti Laptop GPU (47.4 - 67.4, n=9) | |
| Lenovo Yoga 7 16IAP7 | |
| 1920x1080 High Preset | |
| Dell Inspiron 16 Plus 7620 | |
| Moyenne NVIDIA GeForce RTX 3050 Ti Laptop GPU (39 - 51.5, n=9) | |
| Lenovo Yoga 7 16IAP7 | |
| 1920x1080 Ultra Preset | |
| Moyenne NVIDIA GeForce RTX 3050 Ti Laptop GPU (31 - 50.5, n=9) | |
| Dell Inspiron 16 Plus 7620 | |
| Lenovo Yoga 7 16IAP7 | |
| 2560x1440 Ultra Preset | |
| Dell Inspiron 16 Plus 7620 | |
| Moyenne NVIDIA GeForce RTX 3050 Ti Laptop GPU (20 - 25, n=4) | |
Witcher 3 FPS Chart
| Bas | Moyen | Élevé | Ultra | QHD | |
|---|---|---|---|---|---|
| GTA V (2015) | 181.7 | 176.1 | 148.7 | 75.4 | 53.4 |
| The Witcher 3 (2015) | 297.3 | 183 | 108.4 | 57 | |
| Dota 2 Reborn (2015) | 171.8 | 157.5 | 148 | 140.7 | |
| Final Fantasy XV Benchmark (2018) | 138.9 | 77.7 | 54.1 | 38.1 | |
| X-Plane 11.11 (2018) | 132.5 | 115.6 | 92.8 | ||
| Strange Brigade (2018) | 307 | 138.3 | 110.2 | 95.2 | 69.1 |
| Cyberpunk 2077 1.6 (2022) | 79.5 | 66.2 | 47.9 | 39.5 | 23.4 |
Émissions - pourrait être plus silencieux
Bruit du système
Le bruit des ventilateurs est omniprésent, car les deux ventilateurs ne sont jamais vraiment au repos, même lorsqu'on est assis sur le bureau sans aucune application en cours. Dans sa version la plus silencieuse, nous avons pu enregistrer un bruit de 25,7 dB(A) contre un bruit de fond de 23,3 dB(A), même avec le profil d'alimentation "Quiet". En outre, il faut un certain temps pour que le bruit du ventilateur se calme après l'exécution de charges élevées comme les jeux. Après avoir fermé Witcher 3par exemple, les ventilateurs restent bruyants pendant plusieurs minutes.
Le bruit du ventilateur se stabilise à 49,2 dB(A) en mode Ultra Performance ou à 46,1 dB(A) en mode de veille Witcher 3 en mode Ultra Performance ou 46,1 dB(A) en mode Équilibré, soit plus fort que celui du Vivobook Pro 16X équipé du même GPU RTX 3050 Ti. La fourchette élevée de 40 dB(A) a plus de points communs avec les ordinateurs portables de jeu de grande puissance qu'avec les autres ordinateurs portables multimédias.
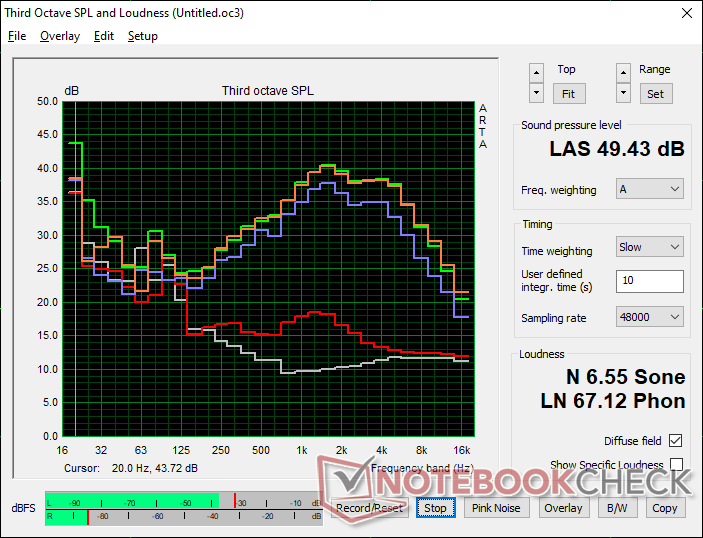
Degré de la nuisance sonore
| Au repos |
| 25.7 / 26.1 / 30.6 dB(A) |
| Fortement sollicité |
| 46.2 / 49.4 dB(A) |
 | ||
30 dB silencieux 40 dB(A) audible 50 dB(A) bruyant |
||
min: | ||
| Dell Inspiron 16 Plus 7620 GeForce RTX 3050 Ti Laptop GPU, i7-12700H, Kioxia BG5 KBG50ZNS512G | Dell Inspiron 16 Plus 7610 GeForce RTX 3050 4GB Laptop GPU, i7-11800H, Kingston OM3PDP3512B | Lenovo Yoga 7 16IAP7 Iris Xe G7 96EUs, i7-1260P, Micron 2450 512GB MTFDKCD512TFK | Huawei MateBook D 16 2022 Iris Xe G7 96EUs, i7-12700H, Silicon Motion PCIe-8 SSD | Acer Swift X SFX16-51G-5388 GeForce RTX 3050 4GB Laptop GPU, i5-11320H, Samsung PM991 MZVLQ512HBLU | Asus Vivobook Pro 16X-M7600QE GeForce RTX 3050 Ti Laptop GPU, R9 5900HX, SK Hynix HFM001TD3JX013N | |
|---|---|---|---|---|---|---|
| Noise | 3% | 14% | 8% | 3% | 1% | |
| arrêt / environnement * (dB) | 23.3 | 24.4 -5% | 23.6 -1% | 24.2 -4% | 25.4 -9% | 26 -12% |
| Idle Minimum * (dB) | 25.7 | 24.4 5% | 23.6 8% | 24.2 6% | 25.4 1% | 27 -5% |
| Idle Average * (dB) | 26.1 | 24.4 7% | 23.6 10% | 25.8 1% | 25.4 3% | 27 -3% |
| Idle Maximum * (dB) | 30.6 | 24.4 20% | 23.6 23% | 30.5 -0% | 27.8 9% | 27.5 10% |
| Load Average * (dB) | 46.2 | 48.3 -5% | 37.7 18% | 39.8 14% | 41 11% | 41.7 10% |
| Witcher 3 ultra * (dB) | 49.2 | 48.9 1% | 40 19% | 39.8 19% | ||
| Load Maximum * (dB) | 49.4 | 48.9 1% | 40.2 19% | 39.8 19% | 47 5% | 45.3 8% |
* ... Moindre est la valeur, meilleures sont les performances
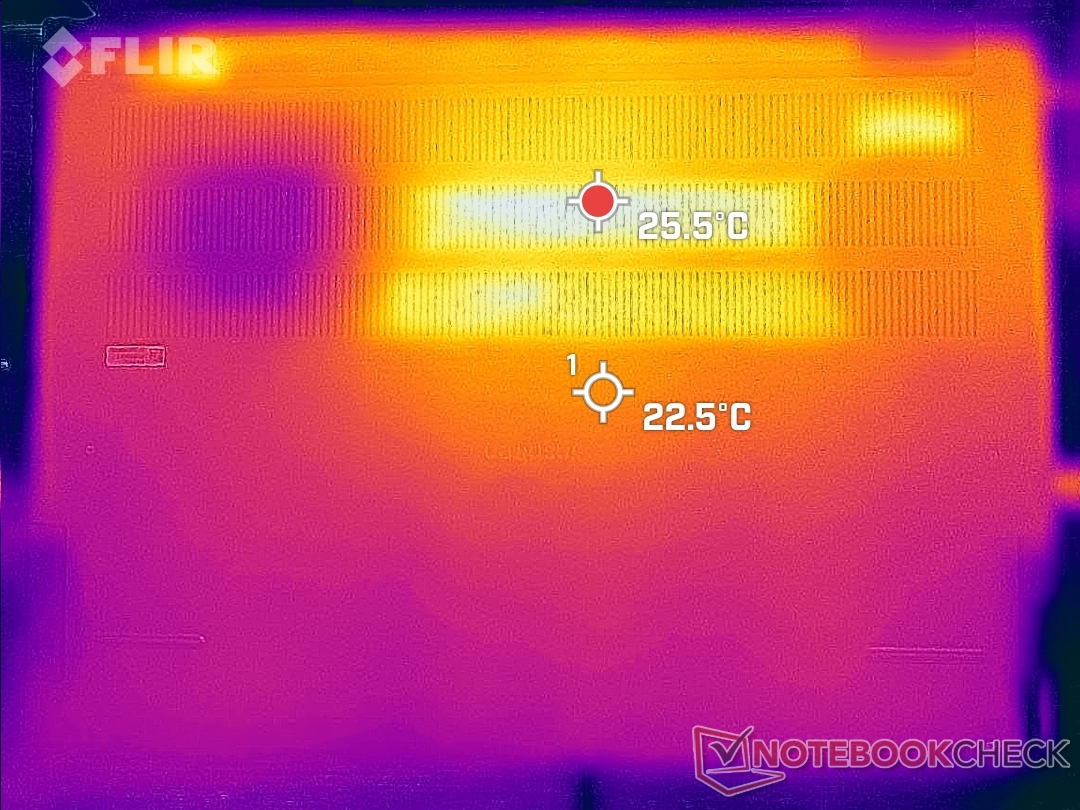
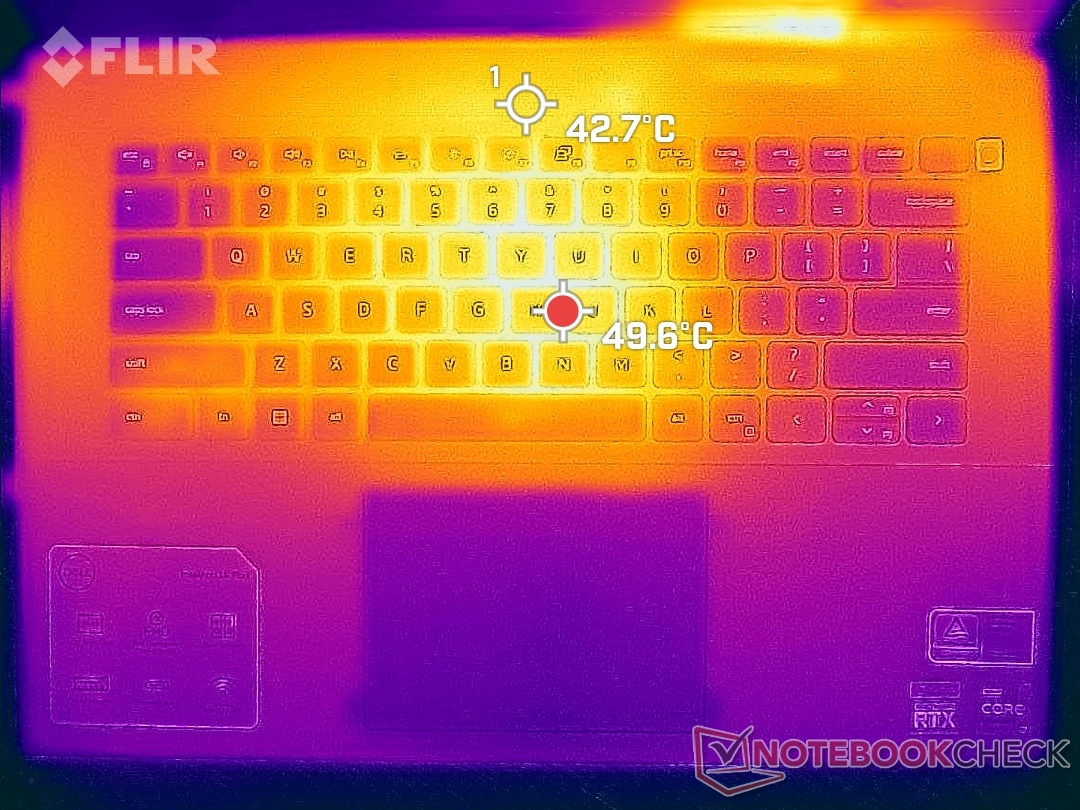
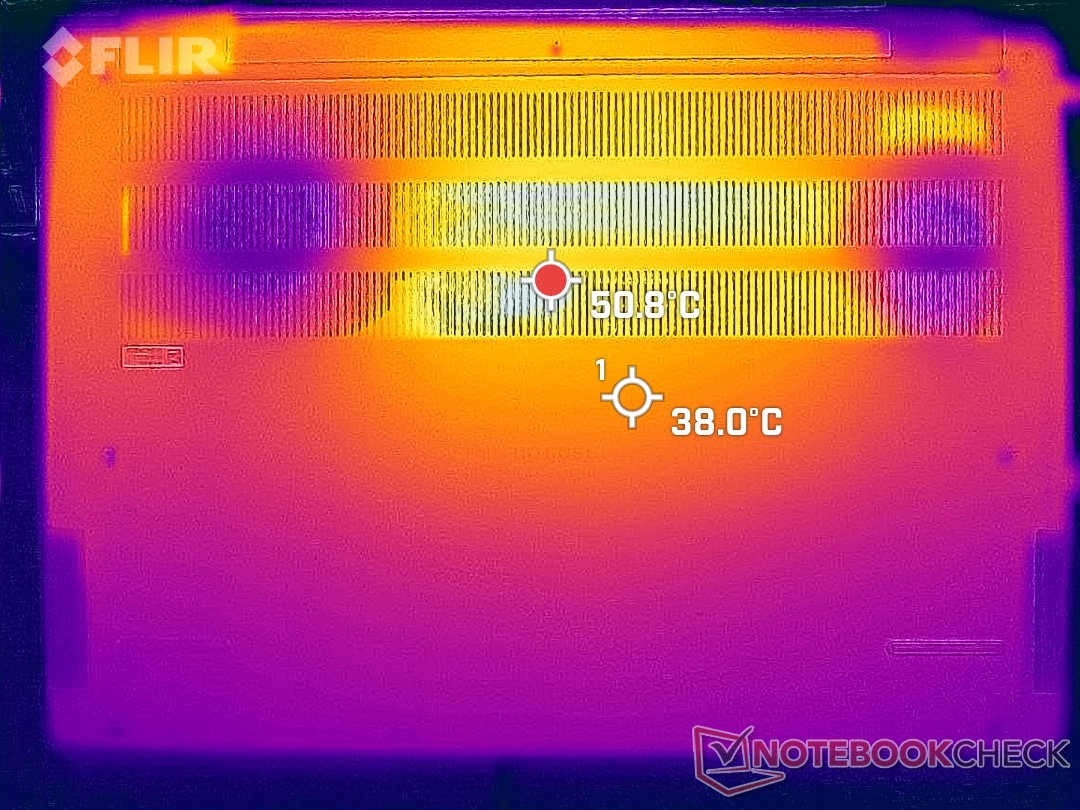
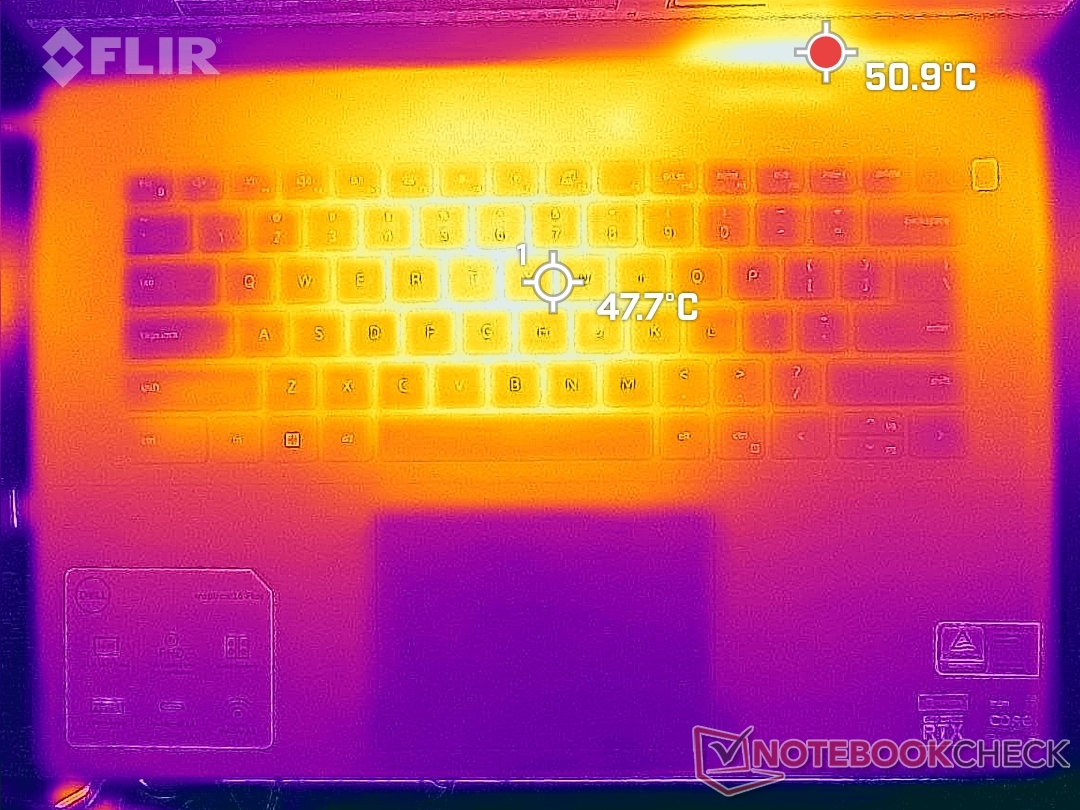
Température
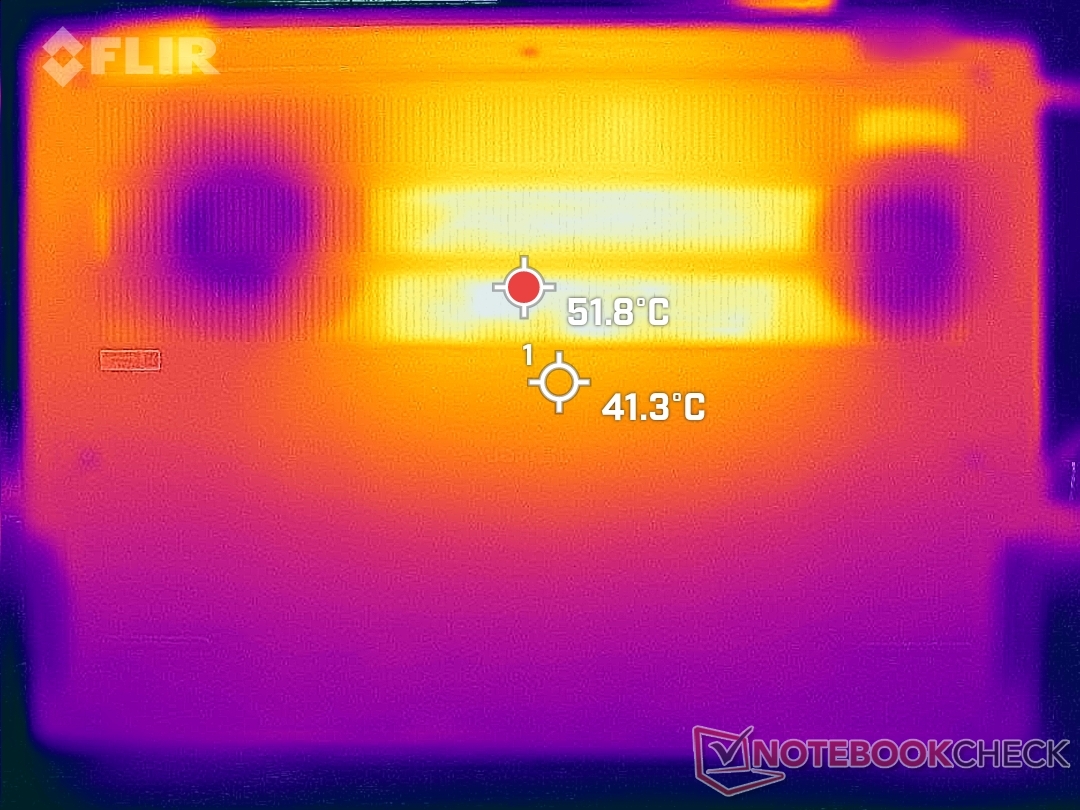
Les points chauds se situent au centre du clavier, où les températures peuvent atteindre 50 °C en cas d'utilisation intensive, comme pour les jeux. D'autres ordinateurs portables de 16 pouces comme l Asus Vivobook Pro 16Xlenovo Yoga 7, et même l'ancien Inspiron 16 7610 sont plus froids de plus de quelques degrés lorsqu'ils sont soumis à des charges similaires. Les repose-poignets peuvent également être plus chauds que prévu, à 30°C par rapport aux 20°C habituels. L'Inspiron 16 Plus 7620 est certainement plus un ordinateur de bureau qu'un ordinateur portable.
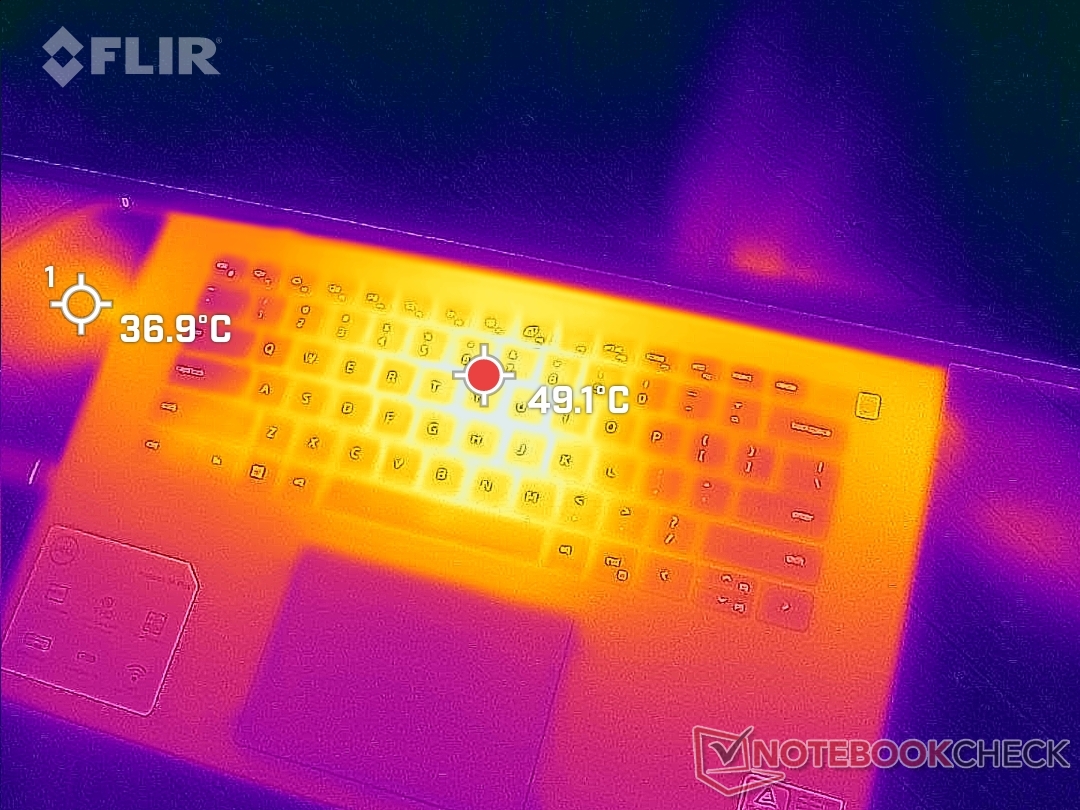
(-) La température maximale du côté supérieur est de 46 °C / 115 F, par rapport à la moyenne de 36.8 °C / 98 F, allant de 21 à 71 °C pour la classe Multimedia.
(-) Le fond chauffe jusqu'à un maximum de 45.8 °C / 114 F, contre une moyenne de 39.1 °C / 102 F
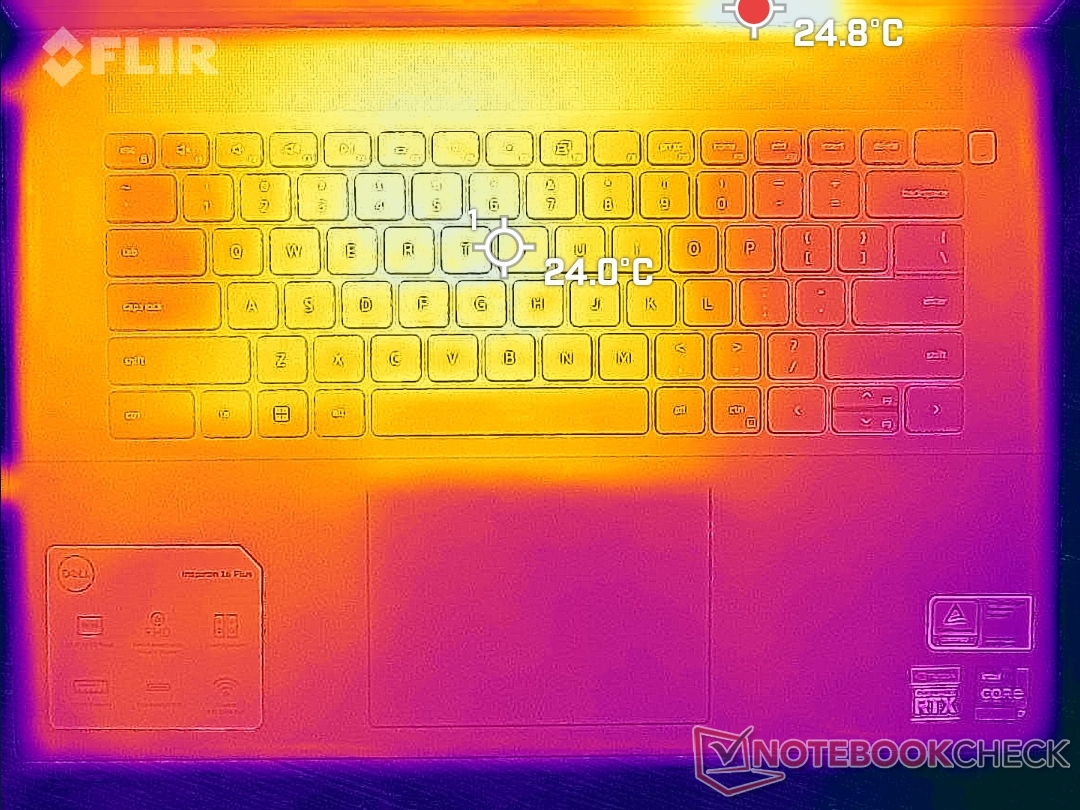
(+) En utilisation inactive, la température moyenne du côté supérieur est de 26.8 °C / 80 F, par rapport à la moyenne du dispositif de 31.3 °C / 88 F.
(±) En jouant à The Witcher 3, la température moyenne du côté supérieur est de 36.8 °C / 98 F, alors que la moyenne de l'appareil est de 31.3 °C / 88 F.
(+) Les repose-poignets et le pavé tactile sont plus froids que la température de la peau avec un maximum de 30.6 °C / 87.1 F et sont donc froids au toucher.
(±) La température moyenne de la zone de l'appui-paume de dispositifs similaires était de 28.7 °C / 83.7 F (-1.9 °C / #-3.4 F).
| Dell Inspiron 16 Plus 7620 Intel Core i7-12700H, NVIDIA GeForce RTX 3050 Ti Laptop GPU | Dell Inspiron 16 Plus 7610 Intel Core i7-11800H, NVIDIA GeForce RTX 3050 4GB Laptop GPU | Lenovo Yoga 7 16IAP7 Intel Core i7-1260P, Intel Iris Xe Graphics G7 96EUs | Huawei MateBook D 16 2022 Intel Core i7-12700H, Intel Iris Xe Graphics G7 96EUs | Acer Swift X SFX16-51G-5388 Intel Core i5-11320H, NVIDIA GeForce RTX 3050 4GB Laptop GPU | Asus Vivobook Pro 16X-M7600QE AMD Ryzen 9 5900HX, NVIDIA GeForce RTX 3050 Ti Laptop GPU | |
|---|---|---|---|---|---|---|
| Heat | -12% | 24% | 3% | -6% | 9% | |
| Maximum Upper Side * (°C) | 46 | 46.4 -1% | 39 15% | 41.8 9% | 52.4 -14% | 39.4 14% |
| Maximum Bottom * (°C) | 45.8 | 54.8 -20% | 34.2 25% | 47.3 -3% | 50 -9% | 43.6 5% |
| Idle Upper Side * (°C) | 29.2 | 31.4 -8% | 21.2 27% | 28.3 3% | 30.3 -4% | 27.6 5% |
| Idle Bottom * (°C) | 31 | 36.6 -18% | 21.6 30% | 30.2 3% | 30.4 2% | 27.5 11% |
* ... Moindre est la valeur, meilleures sont les performances
Test de stress
Lors de l'exécution du test Prime95, le processeur atteint 3,5 GHz et 80 W pendant les 15 premières secondes environ, jusqu'à ce que la température centrale atteigne 90 C. Ensuite, les fréquences d'horloge et la consommation d'énergie de la carte chutent progressivement avant de se stabiliser à 2,3 GHz et 50 W, respectivement, afin de maintenir une température centrale de 86 C. L'exécution de ce même test sur le modèle 2021 donne des températures centrales légèrement inférieures et une consommation d'énergie de 83 C et 45 W, respectivement.
La fréquence d'horloge, la température et la consommation d'énergie du GPU se stabilisent à 1627 MHz, 85 C et 64 W, respectivement, lorsqu'il fonctionne sur batterie Witcher 3 contre 1837 MHz, 69 C et 63 W sur l'Inspiron 16 Plus 7610. Il ne fait aucun doute que les processeurs du modèle 2022 fonctionnent à une température plus élevée afin d'offrir des niveaux de performance supérieurs.
Le fonctionnement sur batterie limite les performances, même en mode Ultra Performance. Un test 3DMark 11 sur batterie donnerait des scores de physique et de graphisme de 10252 et 8609 points, respectivement, contre 22210 et 18923 points sur le secteur.
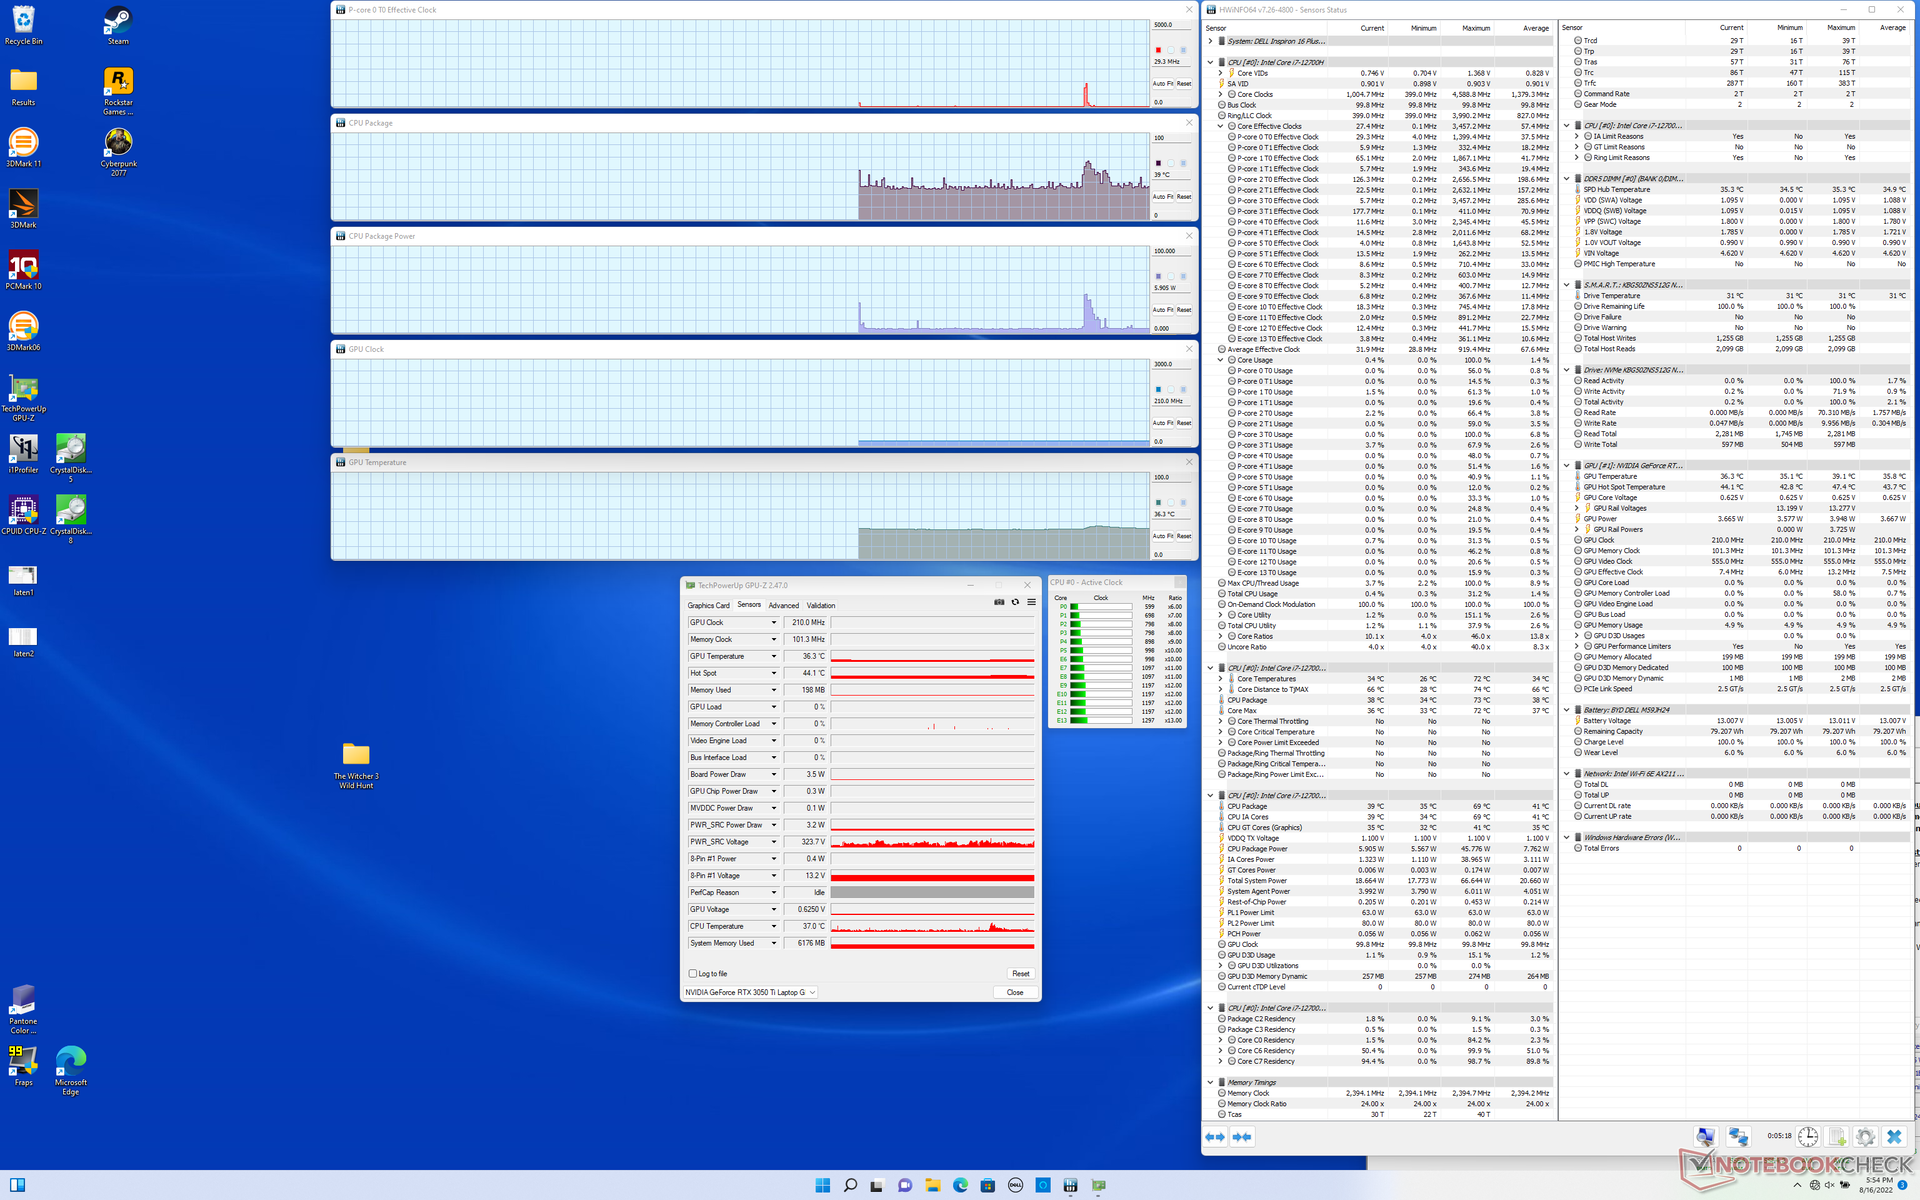
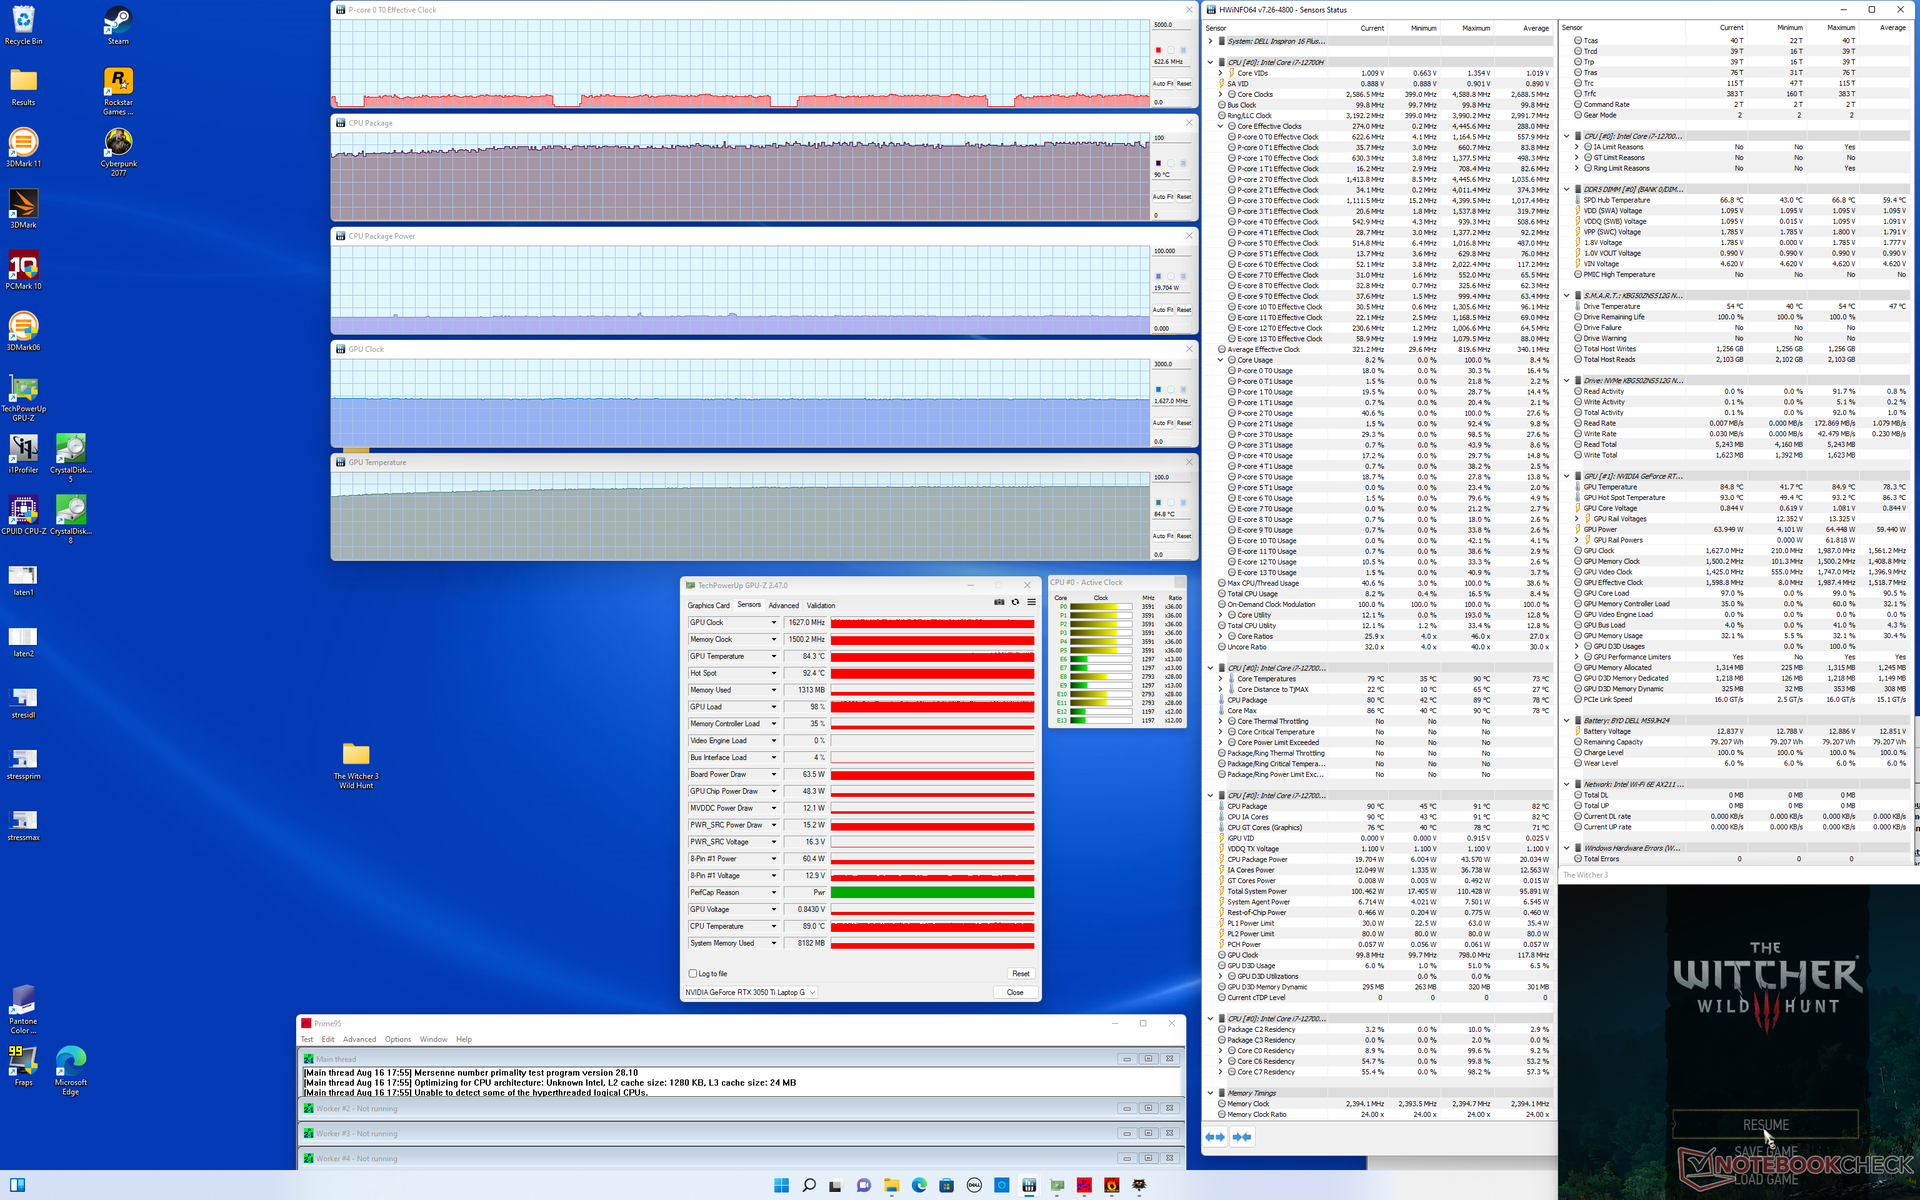
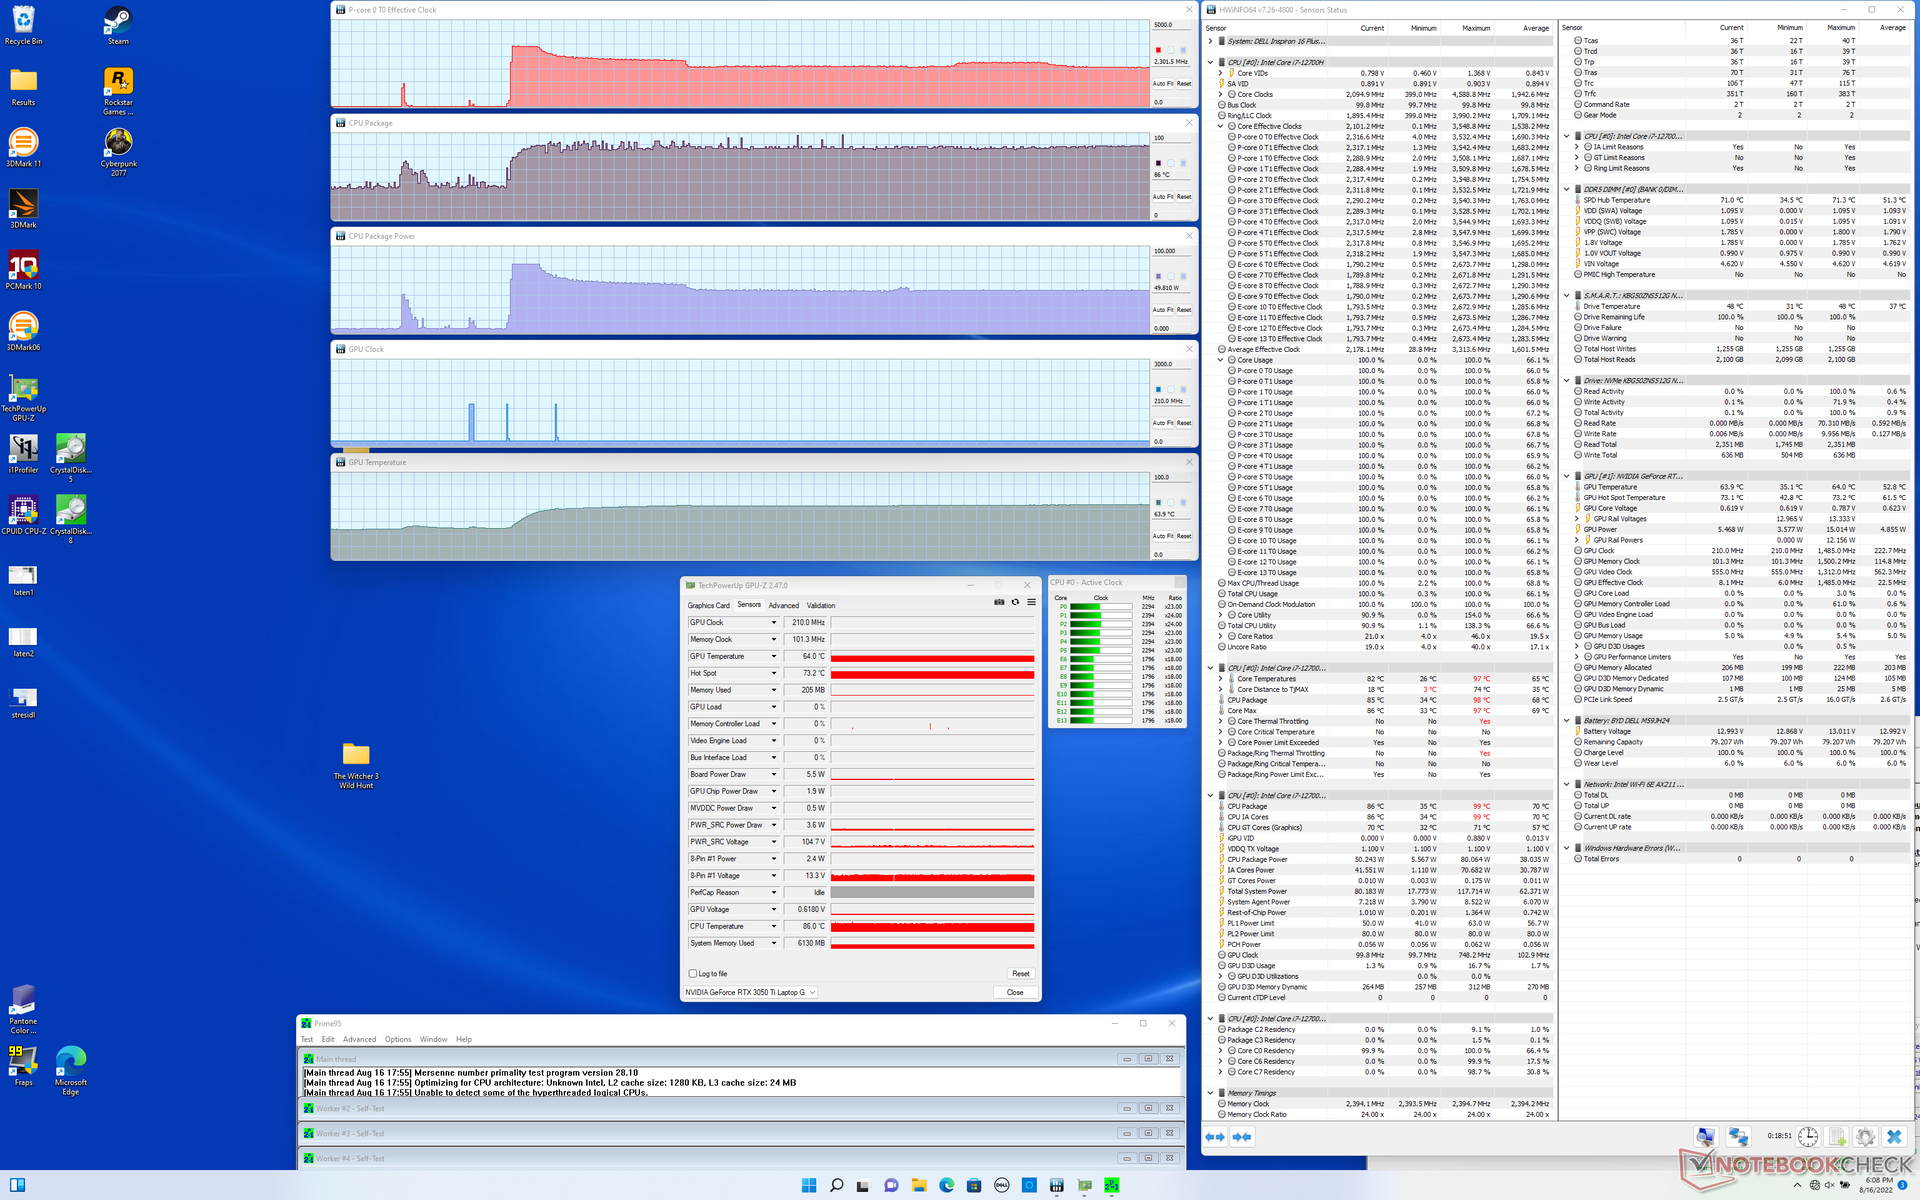
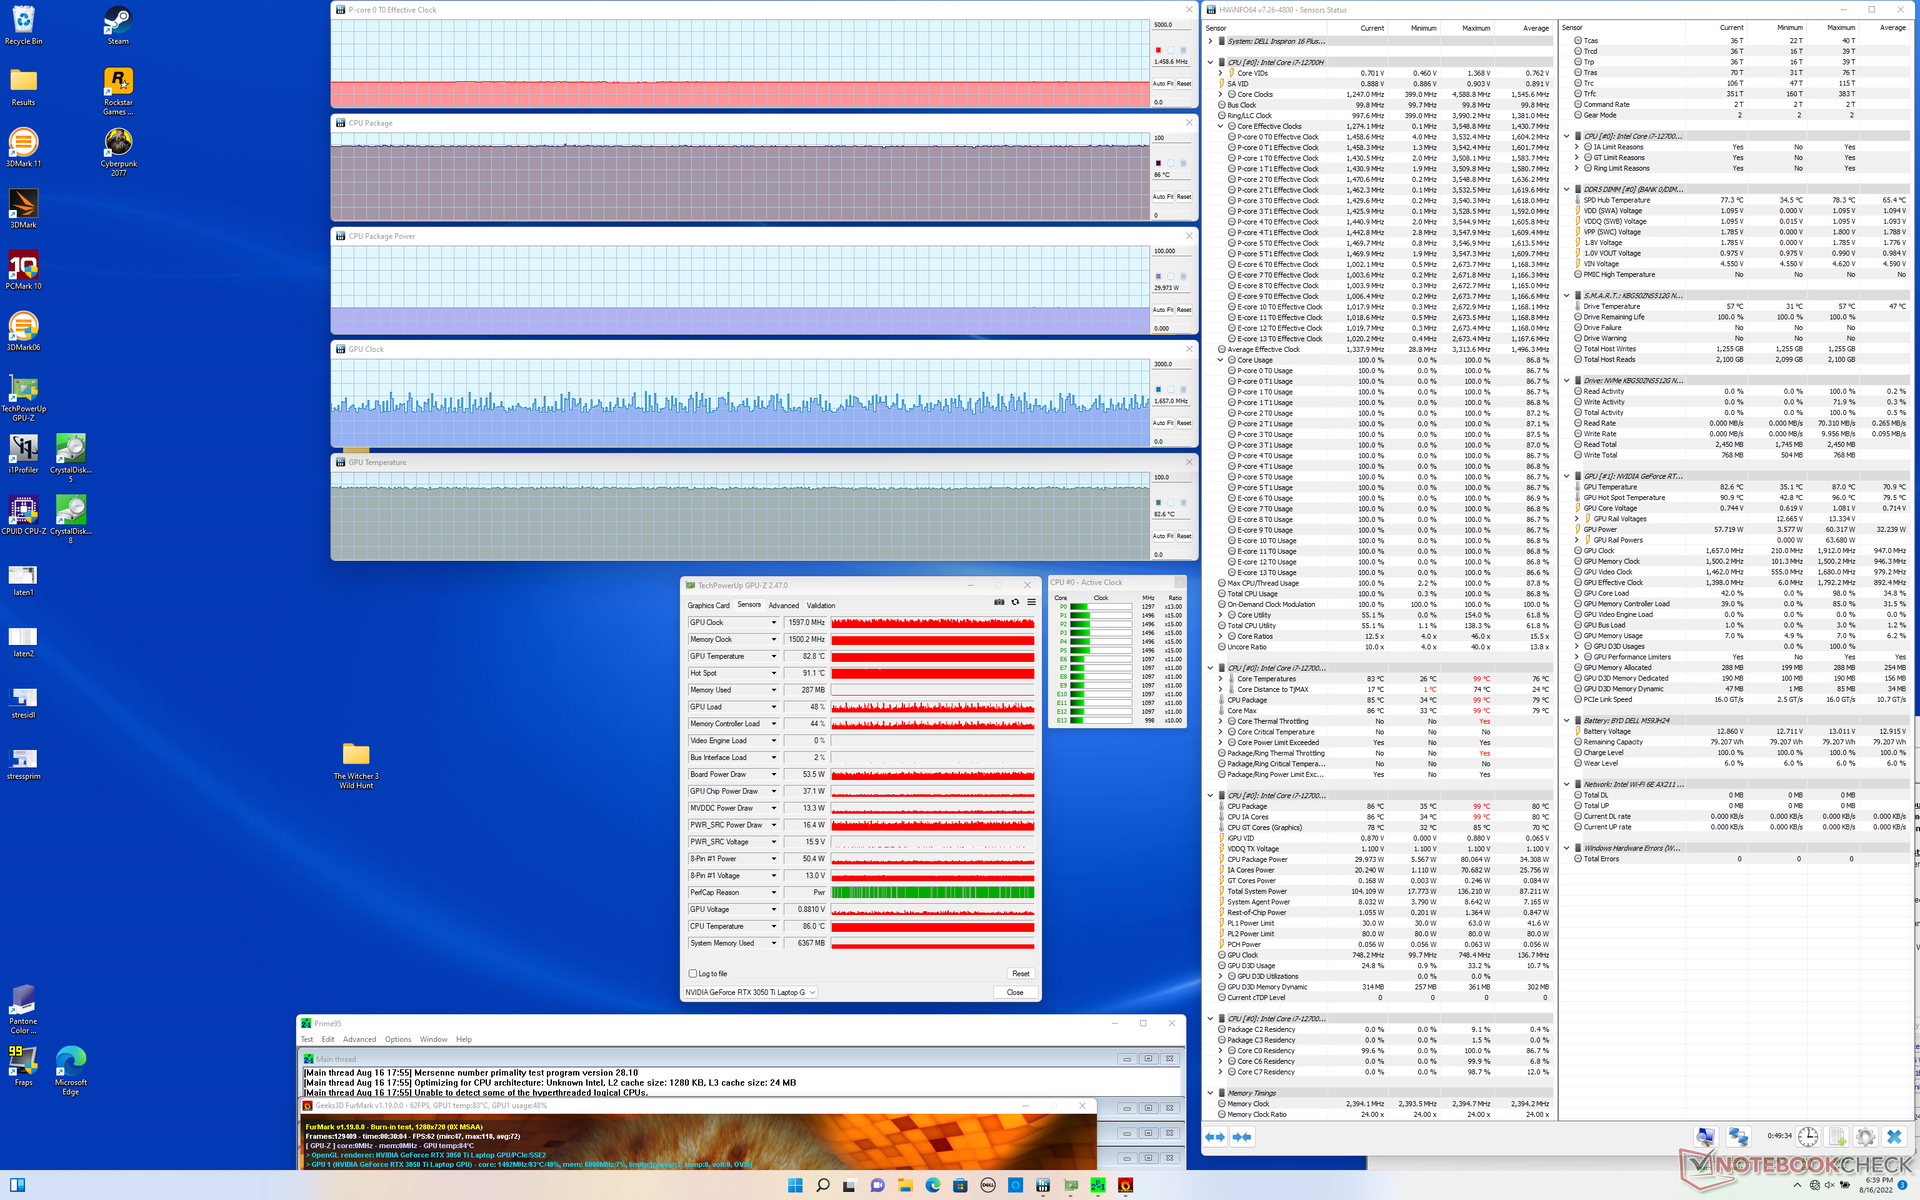
| Fréquence CPU (GHz) | Fréquence GPU (MHz) | Température CPU moyenne (°C) | Température GPU moyenne (°C) | |
| Système au repos | -- | -- | 39 | 36 |
| Prime95 Stress | 2.3 | -- | 86 | 64 |
| Prime95 + FurMark Stress | 1.5 | ~1597 | 86 | 83 |
| Witcher 3 Stress | ~0.6 | 1627 | 90 | 85 |
Haut-parleurs
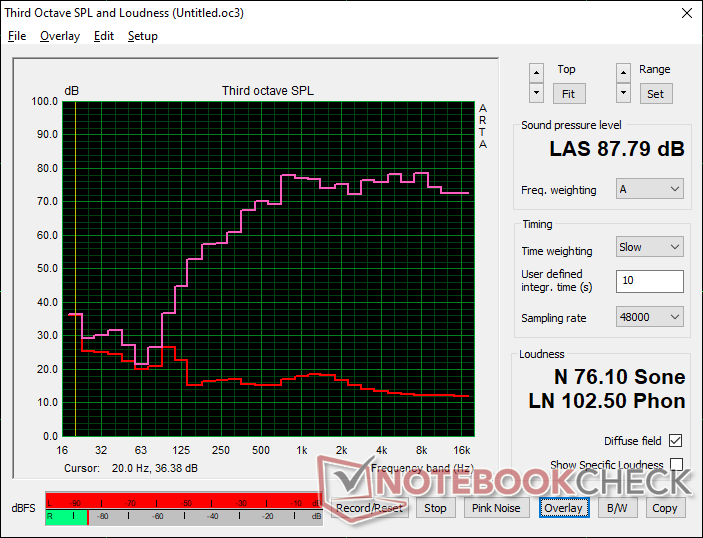
Dell Inspiron 16 Plus 7620 analyse audio
(+) | les haut-parleurs peuvent jouer relativement fort (87.8# dB)
Basses 100 - 315 Hz
(-) | presque aucune basse - en moyenne 22.2% plus bas que la médiane
(±) | la linéarité des basses est moyenne (9.7% delta à la fréquence précédente)
Médiums 400 - 2000 Hz
(+) | médiane équilibrée - seulement 3.3% de la médiane
(+) | les médiums sont linéaires (5.3% delta à la fréquence précédente)
Aiguës 2 - 16 kHz
(+) | des sommets équilibrés - à seulement 2.5% de la médiane
(+) | les aigus sont linéaires (4.7% delta à la fréquence précédente)
Globalement 100 - 16 000 Hz
(+) | le son global est linéaire (13.4% différence à la médiane)
Par rapport à la même classe
» 28% de tous les appareils testés de cette catégorie étaient meilleurs, 5% similaires, 68% pires
» Le meilleur avait un delta de 5%, la moyenne était de 17%, le pire était de 45%.
Par rapport à tous les appareils testés
» 14% de tous les appareils testés étaient meilleurs, 4% similaires, 83% pires
» Le meilleur avait un delta de 4%, la moyenne était de 24%, le pire était de 134%.
Apple MacBook Pro 16 2021 M1 Pro analyse audio
(+) | les haut-parleurs peuvent jouer relativement fort (84.7# dB)
Basses 100 - 315 Hz
(+) | bonne basse - seulement 3.8% loin de la médiane
(+) | les basses sont linéaires (5.2% delta à la fréquence précédente)
Médiums 400 - 2000 Hz
(+) | médiane équilibrée - seulement 1.3% de la médiane
(+) | les médiums sont linéaires (2.1% delta à la fréquence précédente)
Aiguës 2 - 16 kHz
(+) | des sommets équilibrés - à seulement 1.9% de la médiane
(+) | les aigus sont linéaires (2.7% delta à la fréquence précédente)
Globalement 100 - 16 000 Hz
(+) | le son global est linéaire (4.6% différence à la médiane)
Par rapport à la même classe
» 0% de tous les appareils testés de cette catégorie étaient meilleurs, 0% similaires, 100% pires
» Le meilleur avait un delta de 5%, la moyenne était de 17%, le pire était de 45%.
Par rapport à tous les appareils testés
» 0% de tous les appareils testés étaient meilleurs, 0% similaires, 100% pires
» Le meilleur avait un delta de 4%, la moyenne était de 24%, le pire était de 134%.
Gestion de l'énergie - CPU gourmand en énergie
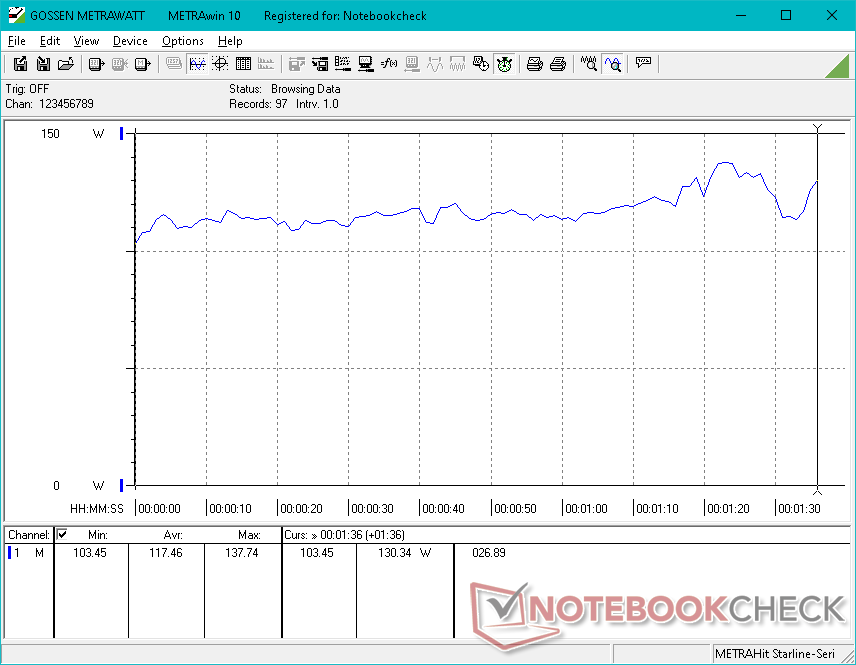
Consommation d'énergie
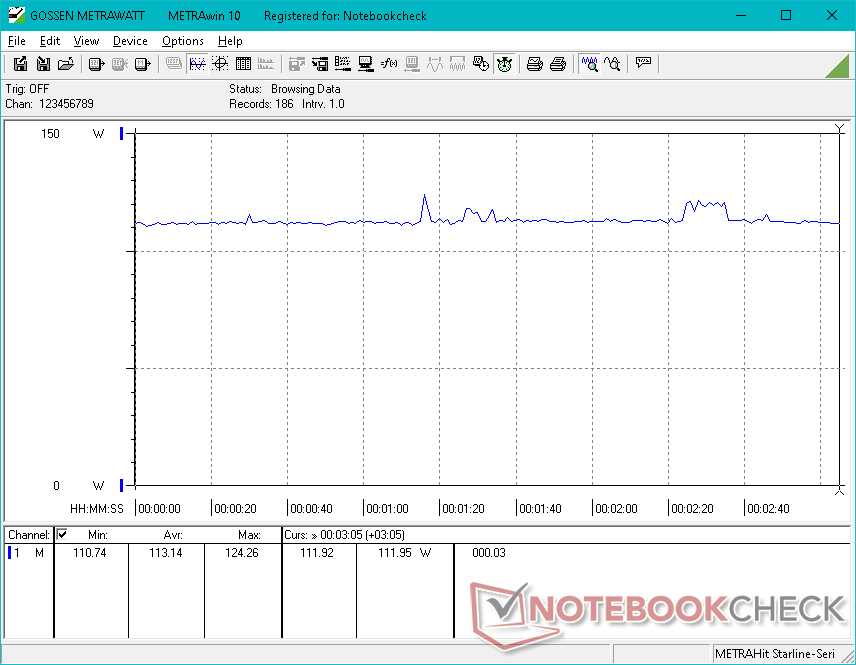
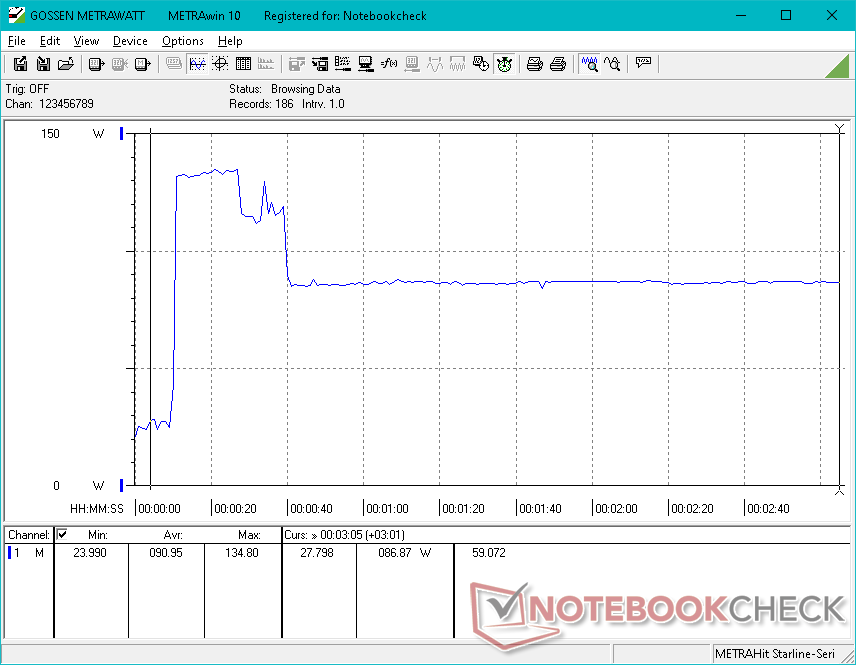
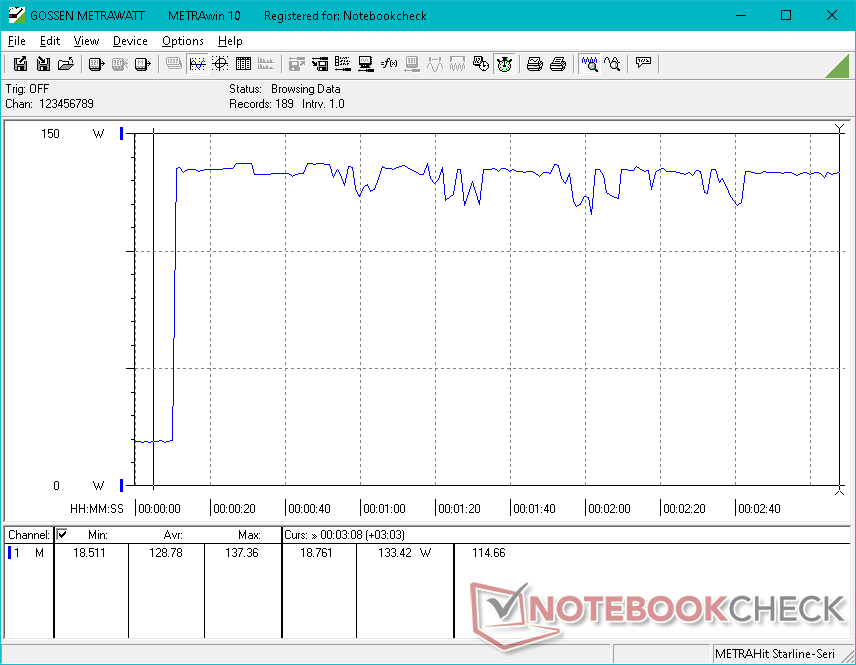
La consommation d'énergie est similaire à celle du modèle 2021 lorsque l'ordinateur de bureau tourne au ralenti ou lorsque les charges sont très faibles. En revanche, lorsque les charges sont plus élevées, le modèle 2022 devient plus exigeant, surtout si ces charges sont gourmandes en ressources CPU. L'exécution de Witcher 3par exemple, ne consomme que 5 % d'énergie en plus, alors que Prime95 en consomme 72 % de plus. La consommation nettement plus élevée est conforme à la plupart des autres ordinateurs portables que nous avons testés jusqu'à présent et qui sont équipés de processeurs Alder Lake de 12e génération
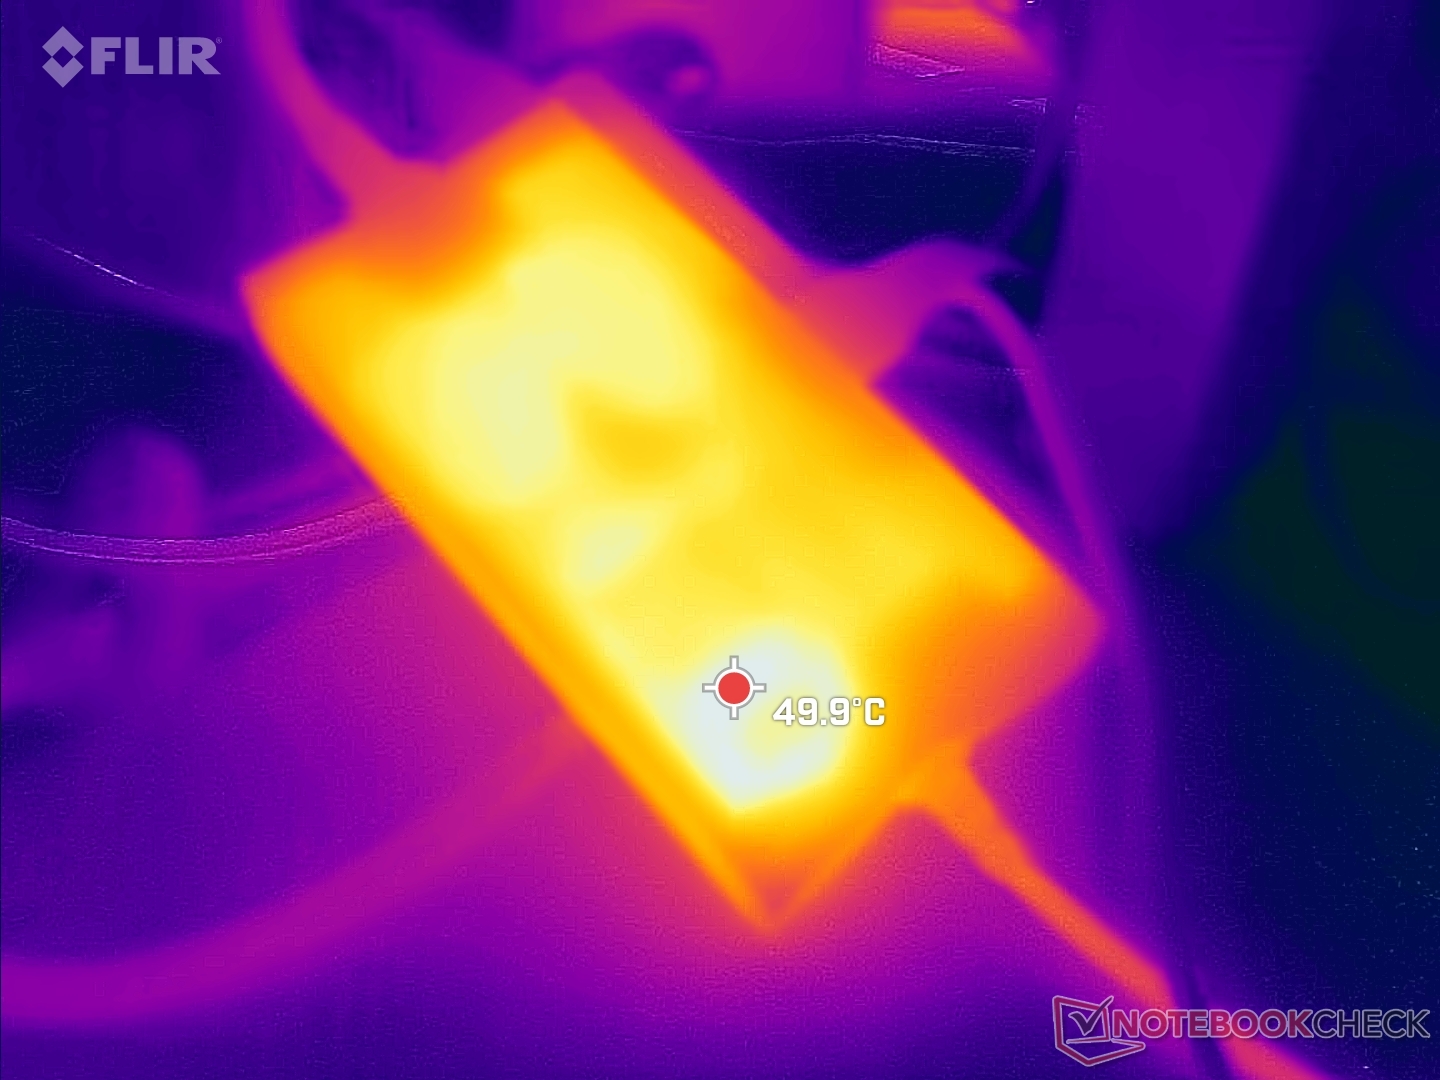
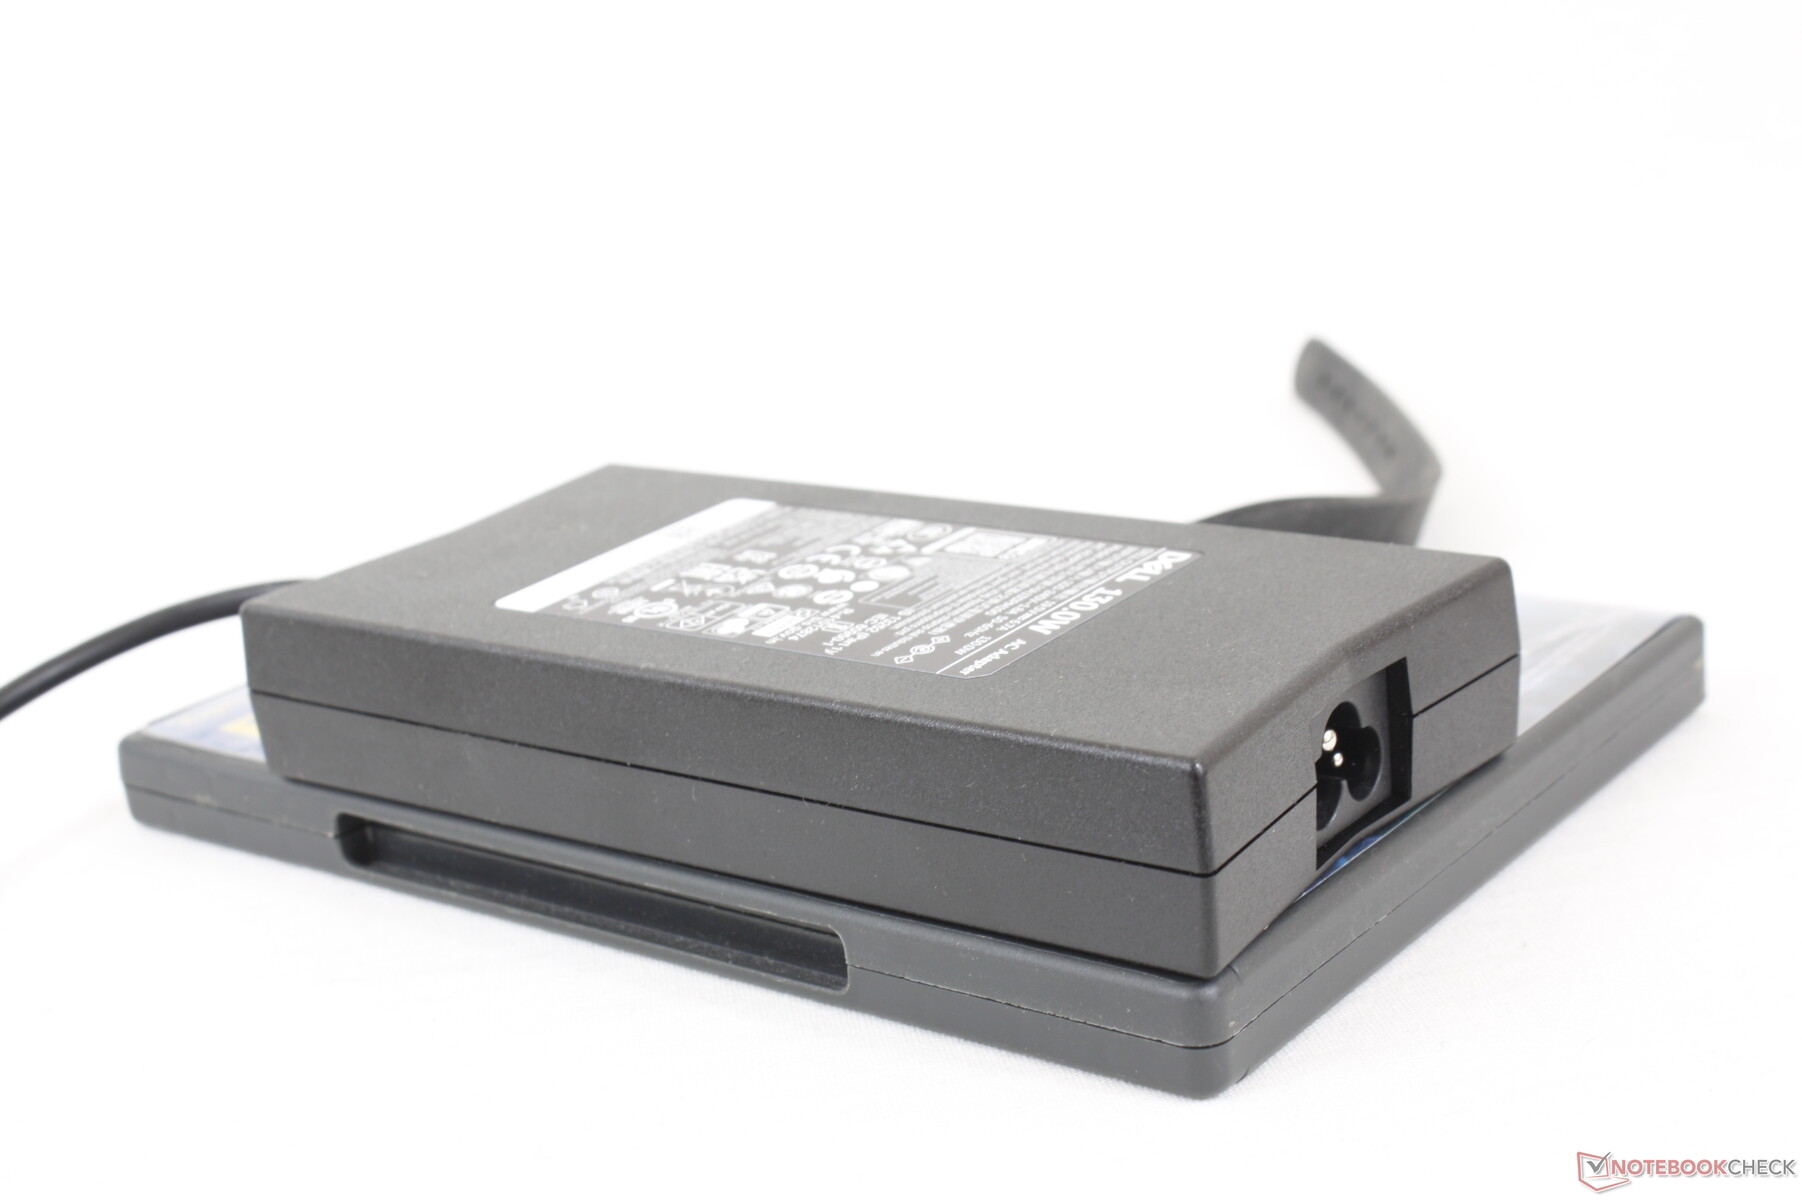
Nous avons pu enregistrer une consommation maximale de 137 W sur l'adaptateur secteur 130 W de taille moyenne (~15,3 x 7,5 x 2,6 cm). Dell n'a apporté aucune modification à l'adaptateur secteur ou à sa capacité nominale malgré la présence d'un processeur plus gourmand en énergie.
| Éteint/en veille | |
| Au repos | |
| Fortement sollicité |
|
Légende:
min: | |
| Dell Inspiron 16 Plus 7620 i7-12700H, GeForce RTX 3050 Ti Laptop GPU, Kioxia BG5 KBG50ZNS512G, IPS, 3072x1920, 16" | Dell Inspiron 16 Plus 7610 i7-11800H, GeForce RTX 3050 4GB Laptop GPU, Kingston OM3PDP3512B, IPS, 3072x1920, 16" | Lenovo Yoga 7 16IAP7 i7-1260P, Iris Xe G7 96EUs, Micron 2450 512GB MTFDKCD512TFK, IPS, 2560x1600, 16" | Huawei MateBook D 16 2022 i7-12700H, Iris Xe G7 96EUs, Silicon Motion PCIe-8 SSD, IPS, 1920x1200, 16" | Acer Swift X SFX16-51G-5388 i5-11320H, GeForce RTX 3050 4GB Laptop GPU, Samsung PM991 MZVLQ512HBLU, , 1920x1080, 16.1" | Asus Vivobook Pro 16X-M7600QE R9 5900HX, GeForce RTX 3050 Ti Laptop GPU, SK Hynix HFM001TD3JX013N, OLED, 3840x2400, 16.1" | |
|---|---|---|---|---|---|---|
| Power Consumption | 1% | 35% | 29% | 21% | 1% | |
| Idle Minimum * (Watt) | 6.8 | 7.7 -13% | 6.6 3% | 6.1 10% | 7 -3% | 8.2 -21% |
| Idle Average * (Watt) | 9.6 | 10.7 -11% | 8.3 14% | 10.6 -10% | 10.1 -5% | 16.2 -69% |
| Idle Maximum * (Watt) | 17 | 16.8 1% | 9.8 42% | 11.5 32% | 15 12% | 19.7 -16% |
| Load Average * (Watt) | 117.5 | 100.39 15% | 66 44% | 65.5 44% | 63.3 46% | 65.8 44% |
| Witcher 3 ultra * (Watt) | 113.1 | 108 5% | 52 54% | 61.2 46% | 63.3 44% | 65.6 42% |
| Load Maximum * (Watt) | 137.4 | 129 6% | 67.1 51% | 68.4 50% | 94 32% | 104 24% |
* ... Moindre est la valeur, meilleures sont les performances
Power Consumption Witcher 3 / Stresstest
Power Consumption external Monitor
Autonomie de la batterie
La capacité de la batterie n'a pas changé par rapport au modèle de l'année dernière pour des durées d'exécution similaires entre eux. Les utilisateurs peuvent s'attendre à 9,5 heures d'utilisation du WLAN dans le monde réel avec le profil d'alimentation équilibré. Une batterie de 56 Wh est disponible en option sur certains modèles pour un poids total plus léger.
Le chargement d'une batterie vide à une batterie pleine prend environ 2 heures avec l'adaptateur secteur fourni. Le système peut également être rechargé via des chargeurs USB-C tiers.
| Dell Inspiron 16 Plus 7620 i7-12700H, GeForce RTX 3050 Ti Laptop GPU, 86 Wh | Dell Inspiron 16 Plus 7610 i7-11800H, GeForce RTX 3050 4GB Laptop GPU, 86 Wh | Lenovo Yoga 7 16IAP7 i7-1260P, Iris Xe G7 96EUs, 71 Wh | Huawei MateBook D 16 2022 i7-12700H, Iris Xe G7 96EUs, 60 Wh | Acer Swift X SFX16-51G-5388 i5-11320H, GeForce RTX 3050 4GB Laptop GPU, 58.7 Wh | Asus Vivobook Pro 16X-M7600QE R9 5900HX, GeForce RTX 3050 Ti Laptop GPU, 96 Wh | |
|---|---|---|---|---|---|---|
| Autonomie de la batterie | 63% | 2% | -26% | 5% | 6% | |
| Reader / Idle (h) | 18.6 | 20.5 10% | 12.2 -34% | 20.3 9% | ||
| WiFi v1.3 (h) | 9.6 | 9.9 3% | 7.9 -18% | 7.1 -26% | 8.1 -16% | 11.3 18% |
| Load (h) | 1.2 | 3.3 175% | 1.9 58% | 1.5 25% | 1.1 -8% | |
| H.264 (h) | 8.4 | |||||
| Gaming (h) | 1.1 |
Points positifs
Points négatifs
Verdict - En partie Multimédia, en partie Créateur, en partie Joueur
L'avantage le plus notable de l'Inspiron 16 Plus 7620 par rapport au 7610 est son processeur Intel Core-H de 12e génération, qui offre des performances multithread jusqu'à 50 % plus rapides. Si vos charges de travail peuvent exploiter ce processeur plus rapide, alors le 7620 peut être un investissement intéressant par rapport à son prédécesseur.
La plupart des autres changements ne sont qu'un pas en avant pour la série ou, au mieux, des mises à niveau relativement mineures. Par exemple, la webcam de 2 mégapixels à plus haute résolution est agréable, mais elle est loin des webcams de 5 mégapixels des HP Spectre ou Envy 16. La nouvelle conception du châssis est également intéressante, mais elle ne rend pas vraiment le système plus léger, plus petit ou plus solide que l'ancien modèle 7610. Des alternatives comme le plus léger Asus VivoBook Pro 16X sont équipés de la RTX 3050 Ti et d'un écran OLED, ce dernier n'étant toujours pas proposé par notre Dell. Une dalle à rafraîchissement plus rapide, comme la dalle 120 Hz du HP Envy 16, serait une excellente option à avoir.
L'Inspiron 16 Plus 7620 est beaucoup plus rapide que le 7610 en ce qui concerne les performances du processeur. Sinon, presque tout le reste est identique, voire pire, comme les températures plus chaudes et le nombre réduit d'emplacements d'extension.
En revanche, plusieurs autres changements peuvent être considérés comme des dégradations, comme le pavé numérique omis, le pavé tactile plus petit, la consommation d'énergie plus élevée en charge, les températures plus chaudes et le nombre réduit d'emplacements SODIMM et M.2 SSD. C'est toujours un système puissant avec des couleurs et des performances adaptées aux jeux occasionnels et à la création de contenu, mais ce n'est pas exactement un homerun quand certaines caractéristiques manquent.
Prix et disponibilité
Amazon propose actuellement une configuration avec le Core i7-12700H, 16 Go de RAM, 512 Go de SSD, un écran 3K et des graphiques RTX 3050 pour 1450 USD. Nous vous recommandons de commander directement auprès de Dell pour plus d'options.
Dell Inspiron 16 Plus 7620
- 08/18/2022 v7 (old)
Allen Ngo
Price comparison

