Test du Lenovo IdeaPad Gaming 3 15ARH7 : les débuts du Ryzen 5 6600H
La série IdeaPad Gaming 3 abrite certains des ordinateurs portables de jeu les moins chers de Lenovo, qui contrastent avec la série de milieu de gamme Legion 5 Pro et la série plus haut de gamme Legion 7. Ce dernier modèle 2022 se distingue par le fait qu'il est l'un des premiers à embarquer le processeur AMD Zen 3+ Ryzen 5 6600H pour remplacer la solution Intel de 10e génération dans la série 2022 2020 IdeaPad Gaming 3i. Il présente également un nouveau design de châssis pour se distinguer davantage des modèles d'ancienne génération
Les configurations comprennent soit le CPU Ryzen 5 6600H ou Ryzen 7 6800H avec le GPU RTX 3050 ou 3050 Ti de 85 W GeForce. La même dalle IPS 1080p à 120 Hz est présente sur tous les modèles. Notre unité d'examen spécifique avec le 6600H, le RTX 3050, le SSD de 256 Go et la RAM de 8 Go est l'option la plus bas de gamme pour environ 800 $ US au détail
Parmi les concurrents, on trouve d'autres ordinateurs portables de 15,6 ou 16 pouces pour le jeu, comme le Acer Nitro 5, HP Victus, Asus TUF Dash 15ou la Série GF de MSI
Plus de commentaires sur Lenovo
Comparaison avec les concurrents potentiels
Note | Date | Modèle | Poids | Épaisseur | Taille | Résolution | Prix |
|---|---|---|---|---|---|---|---|
| 80.8 % v7 (old) | 09/22 | Lenovo IdeaPad Gaming 3 15ARH7 R5 6600H, GeForce RTX 3050 4GB Laptop GPU | 2.4 kg | 21.8 mm | 15.60" | 1920x1080 | |
| 78.4 % v7 (old) | 08/20 | Lenovo IdeaPad Gaming 3i 15IMH05 i5-10300H, GeForce GTX 1650 Mobile | 2.2 kg | 24.9 mm | 15.60" | 1920x1080 | |
| 82.6 % v7 (old) | 05/22 | Lenovo Legion 5 15ACH6A-82NW0010GE R5 5600H, Radeon RX 6600M | 2.5 kg | 25.75 mm | 15.60" | 1920x1080 | |
| 82.3 % v7 (old) | 09/22 | Gigabyte A5 K1 R5 5600H, GeForce RTX 3060 Laptop GPU | 2.2 kg | 34 mm | 15.60" | 1920x1080 | |
| 85.8 % v7 (old) | 07/22 | Asus TUF Dash F15 FX517ZR i7-12650H, GeForce RTX 3070 Laptop GPU | 2 kg | 20.7 mm | 15.60" | 2560x1440 | |
| 81 % v7 (old) | 06/22 | Dell G15 5510 i5-10500H, GeForce RTX 3050 4GB Laptop GPU | 2.5 kg | 23 mm | 15.60" | 1920x1080 |
Affaire - New Look Inspired By Legion
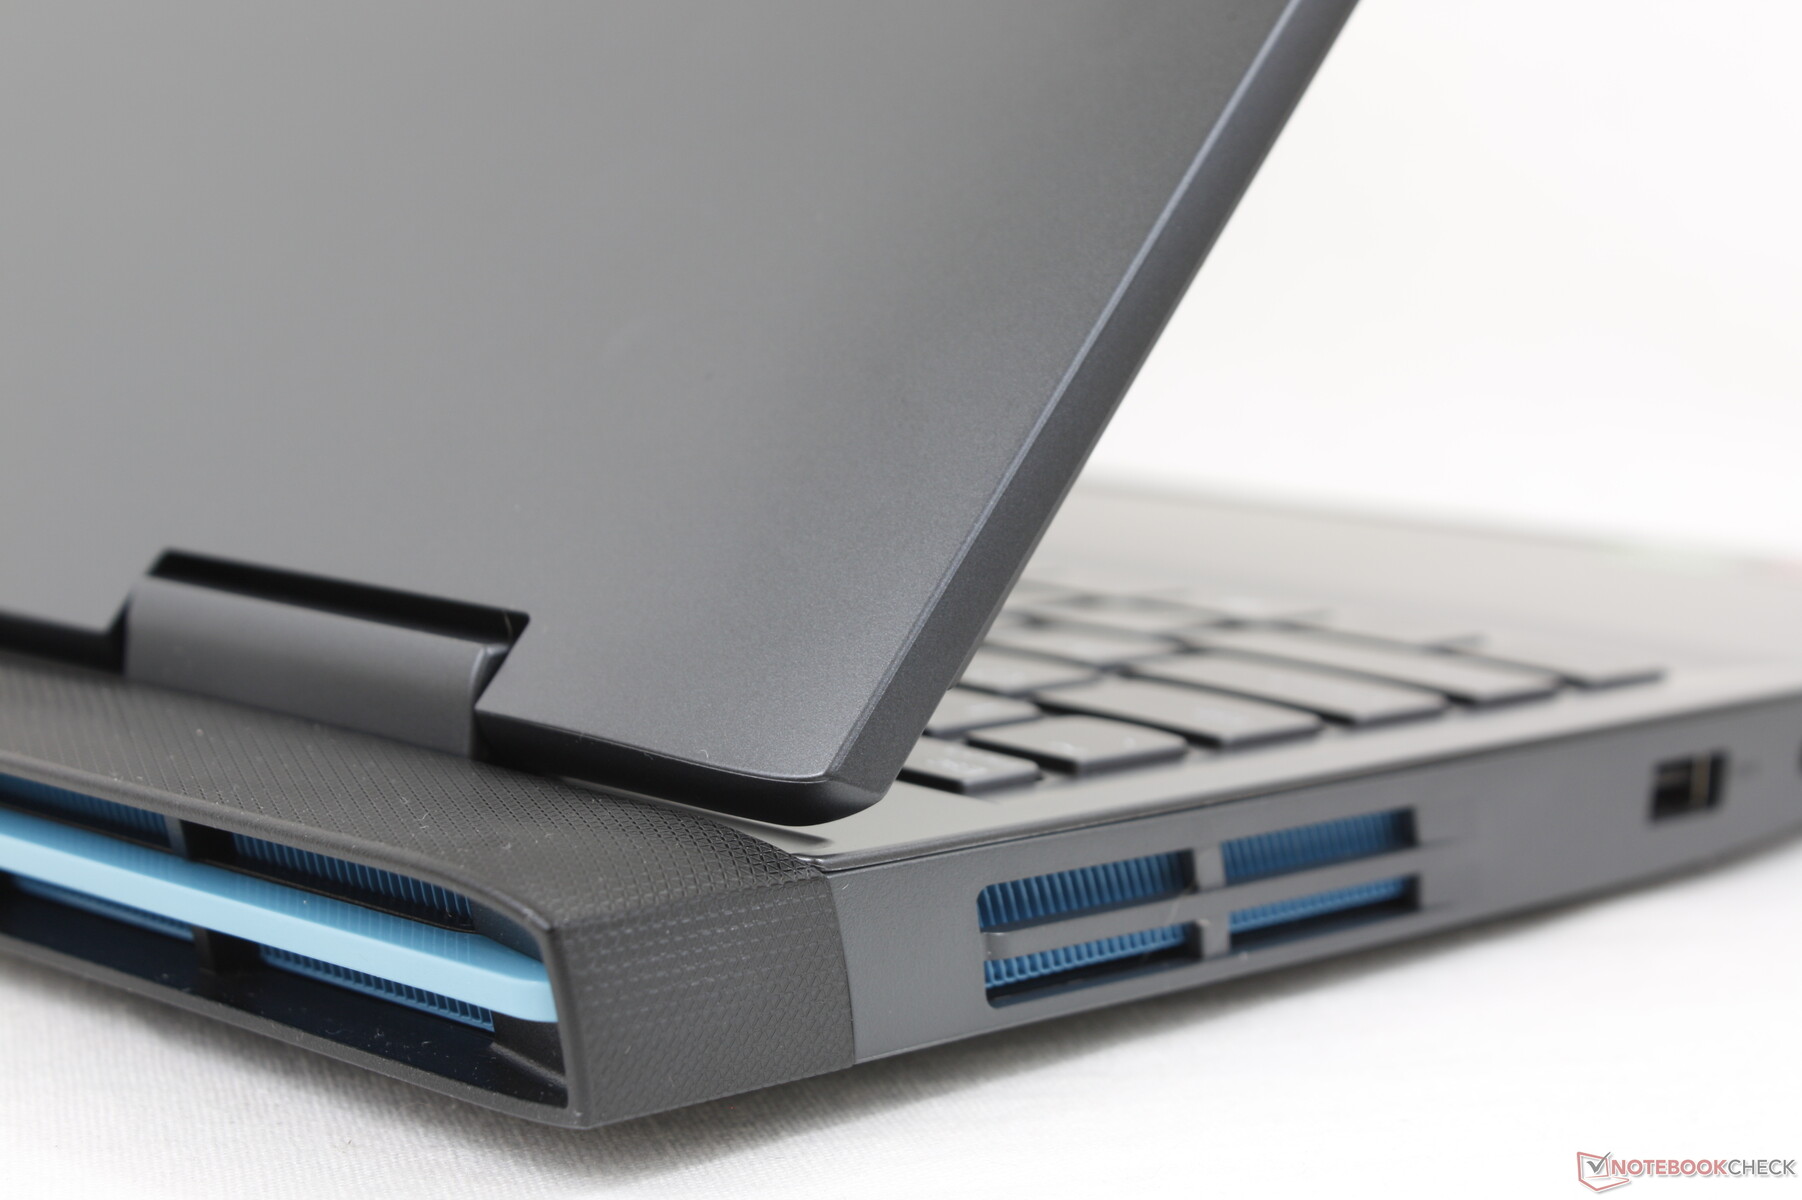
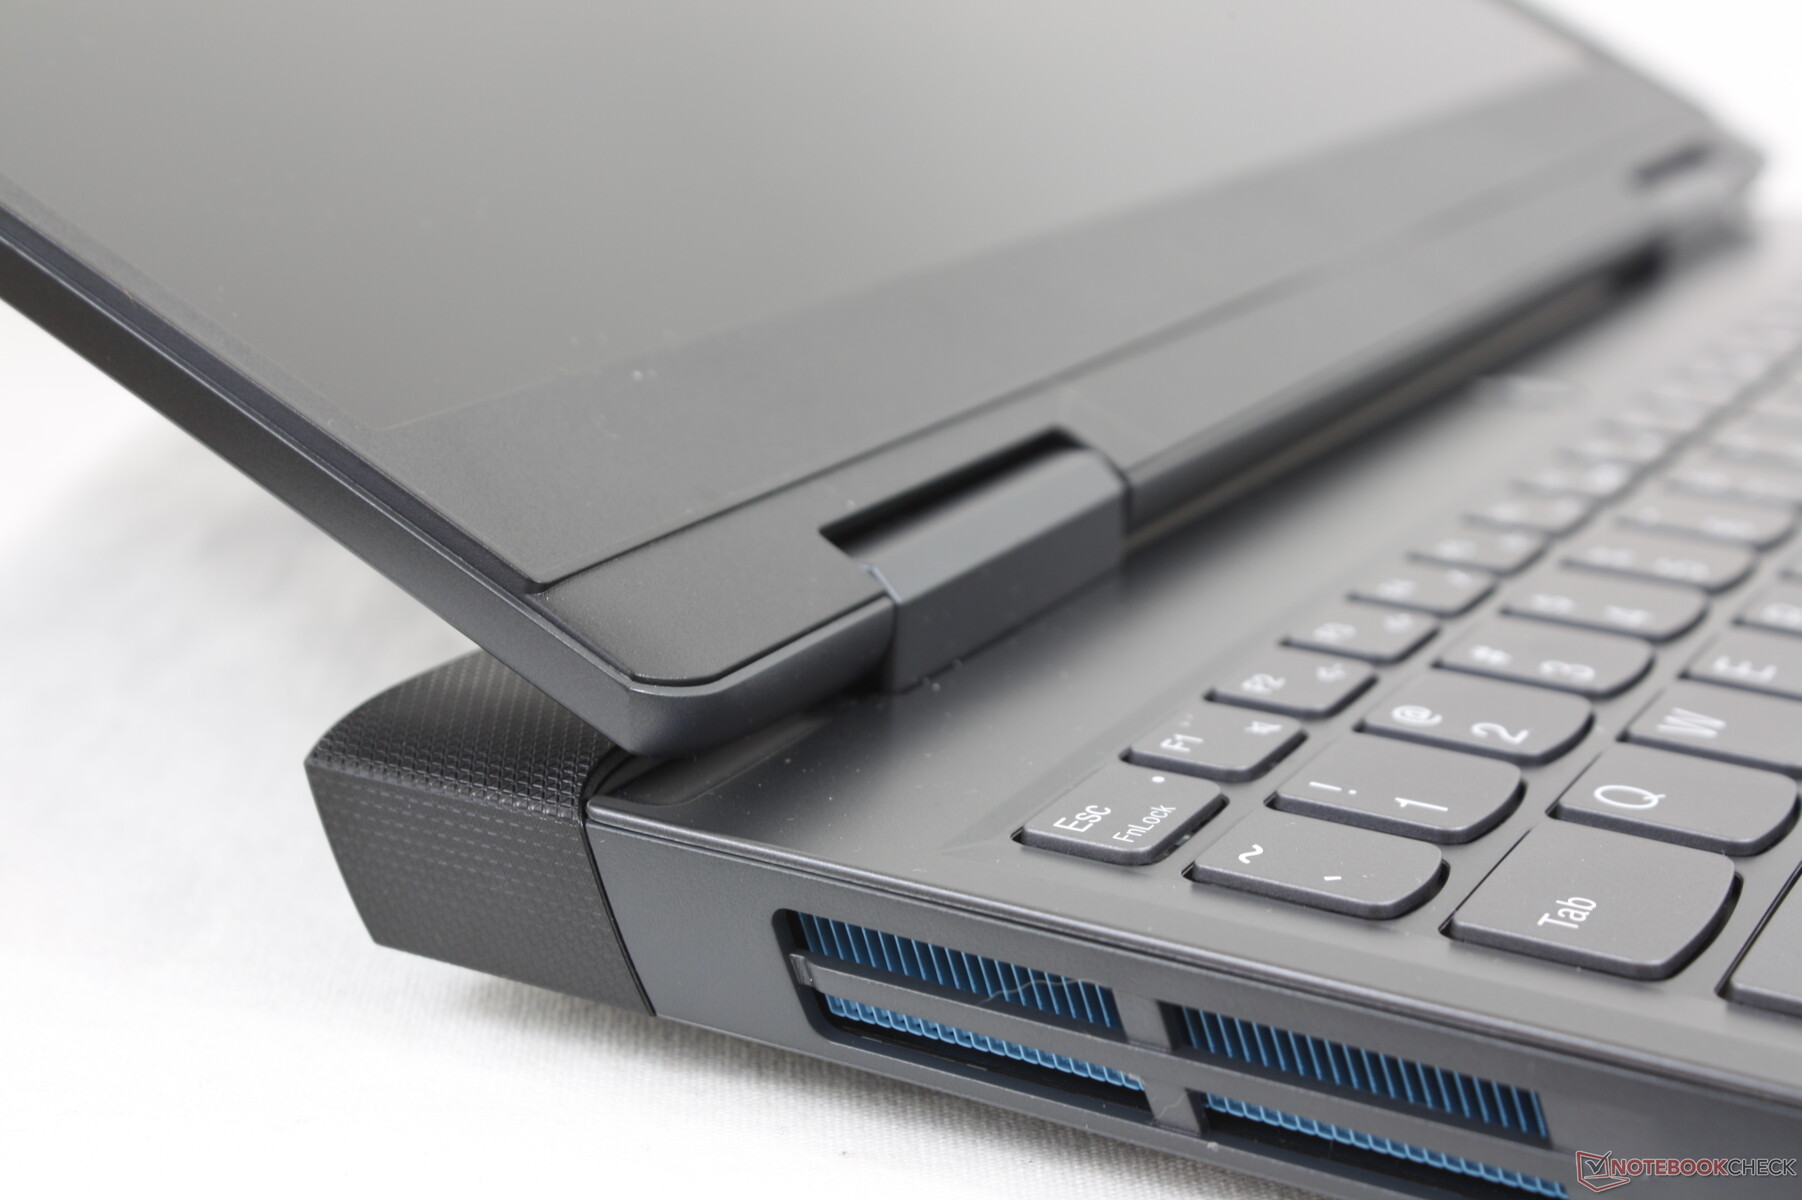
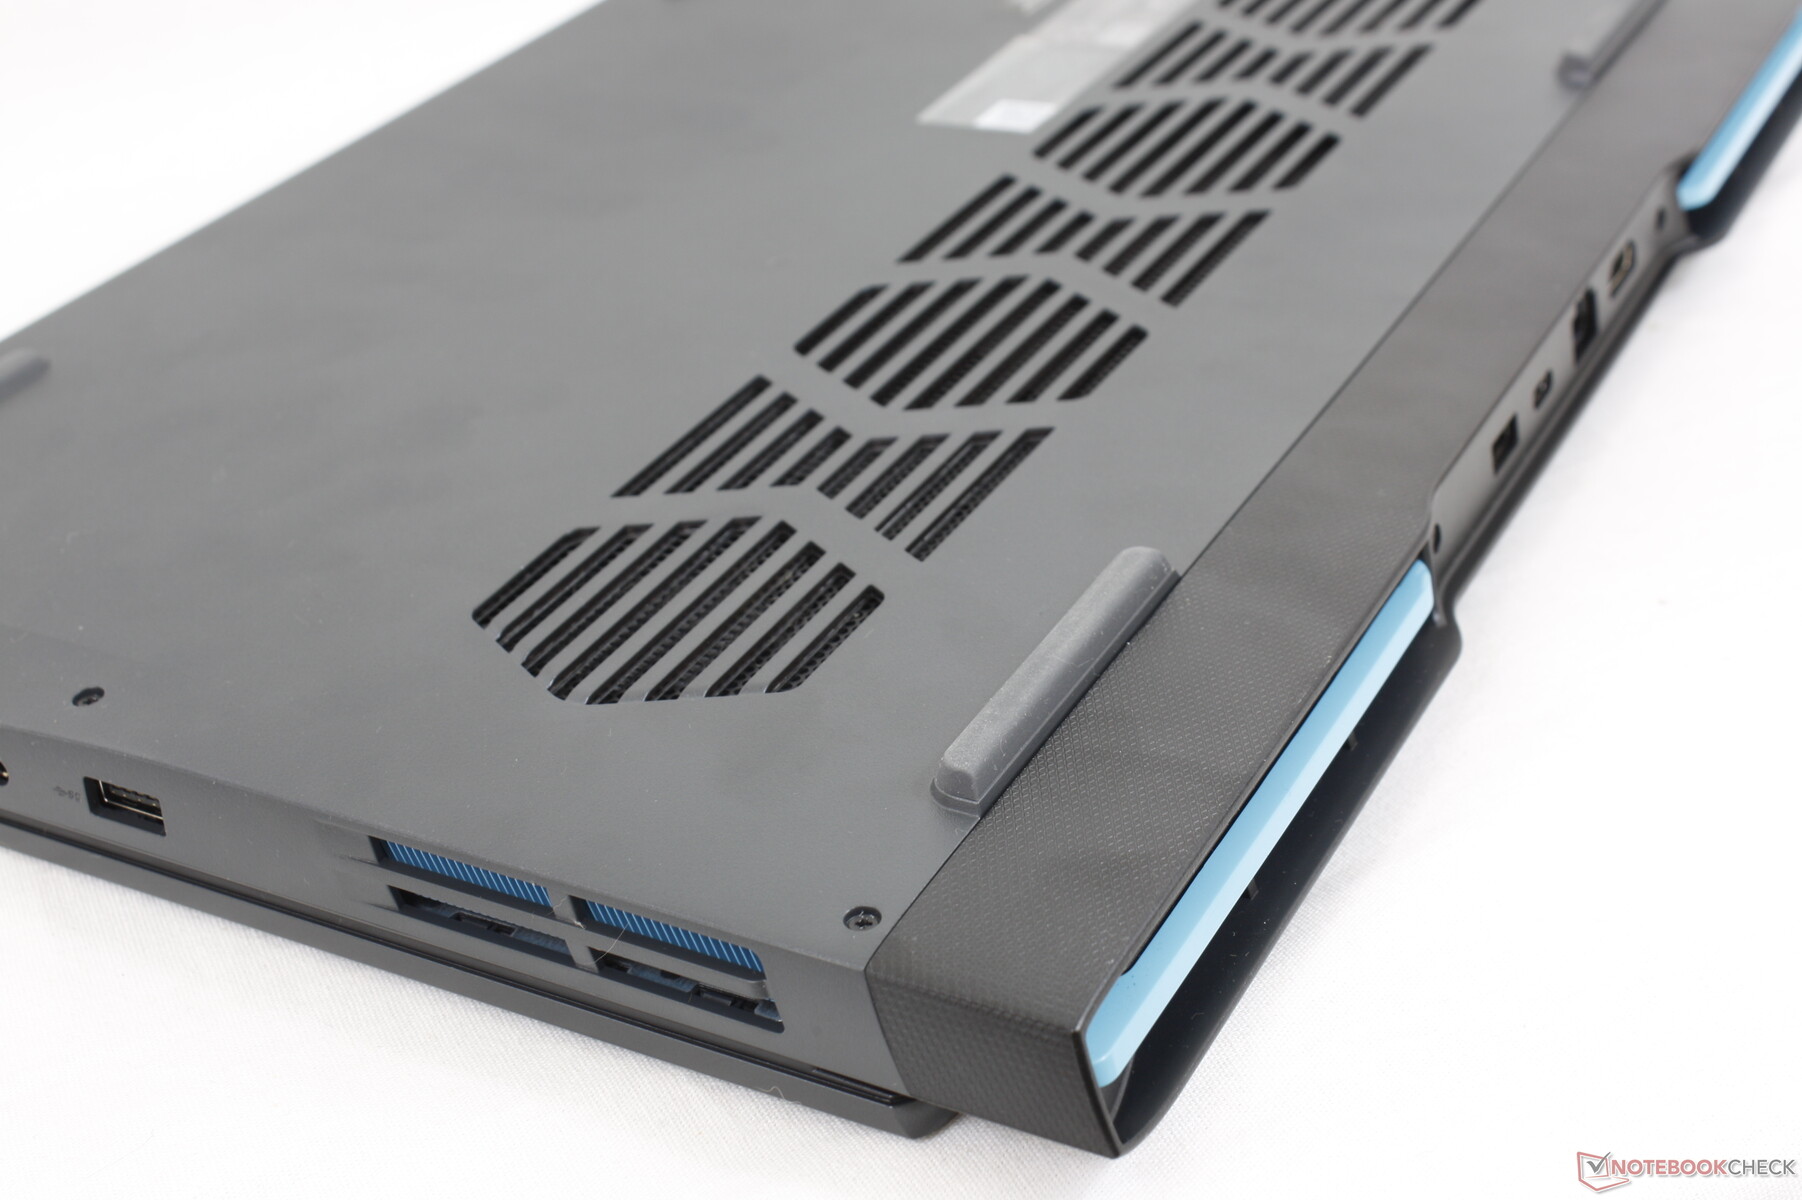
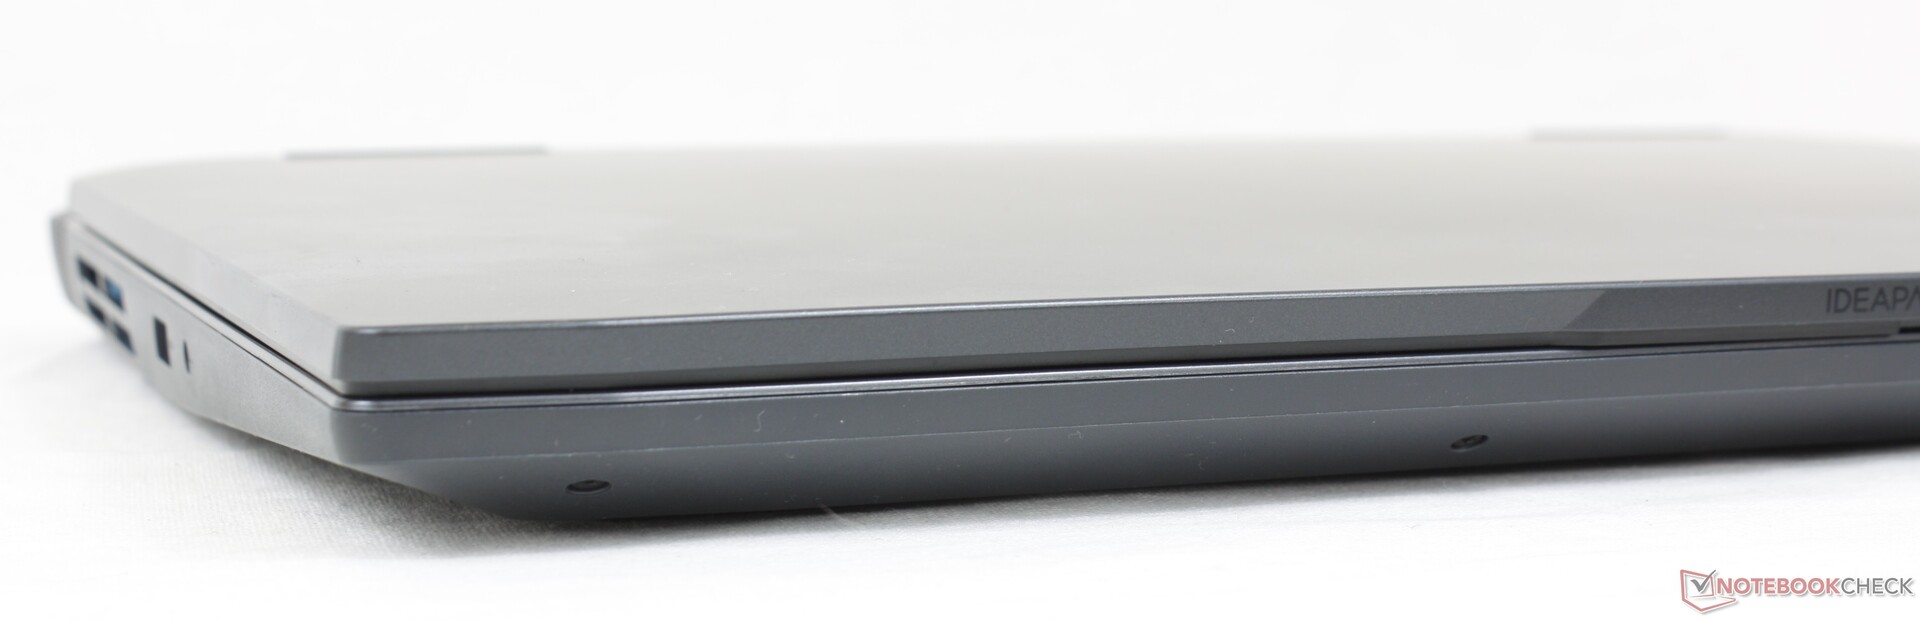
Le châssis redessiné peut être décrit comme une version moins chère du Legion 5alors que ce dernier est principalement composé d'un alliage métallique, le nouvel IdeaPad Gaming 3 15 est principalement composé de polycarbonate et de plastique. Le changement visuel le plus notable par rapport au design de l'IdeaPad 2020 2020 concerne le nouveau design arrière destiné à améliorer le refroidissement, mais au prix d'un encombrement plus important et d'un poids plus élevé.
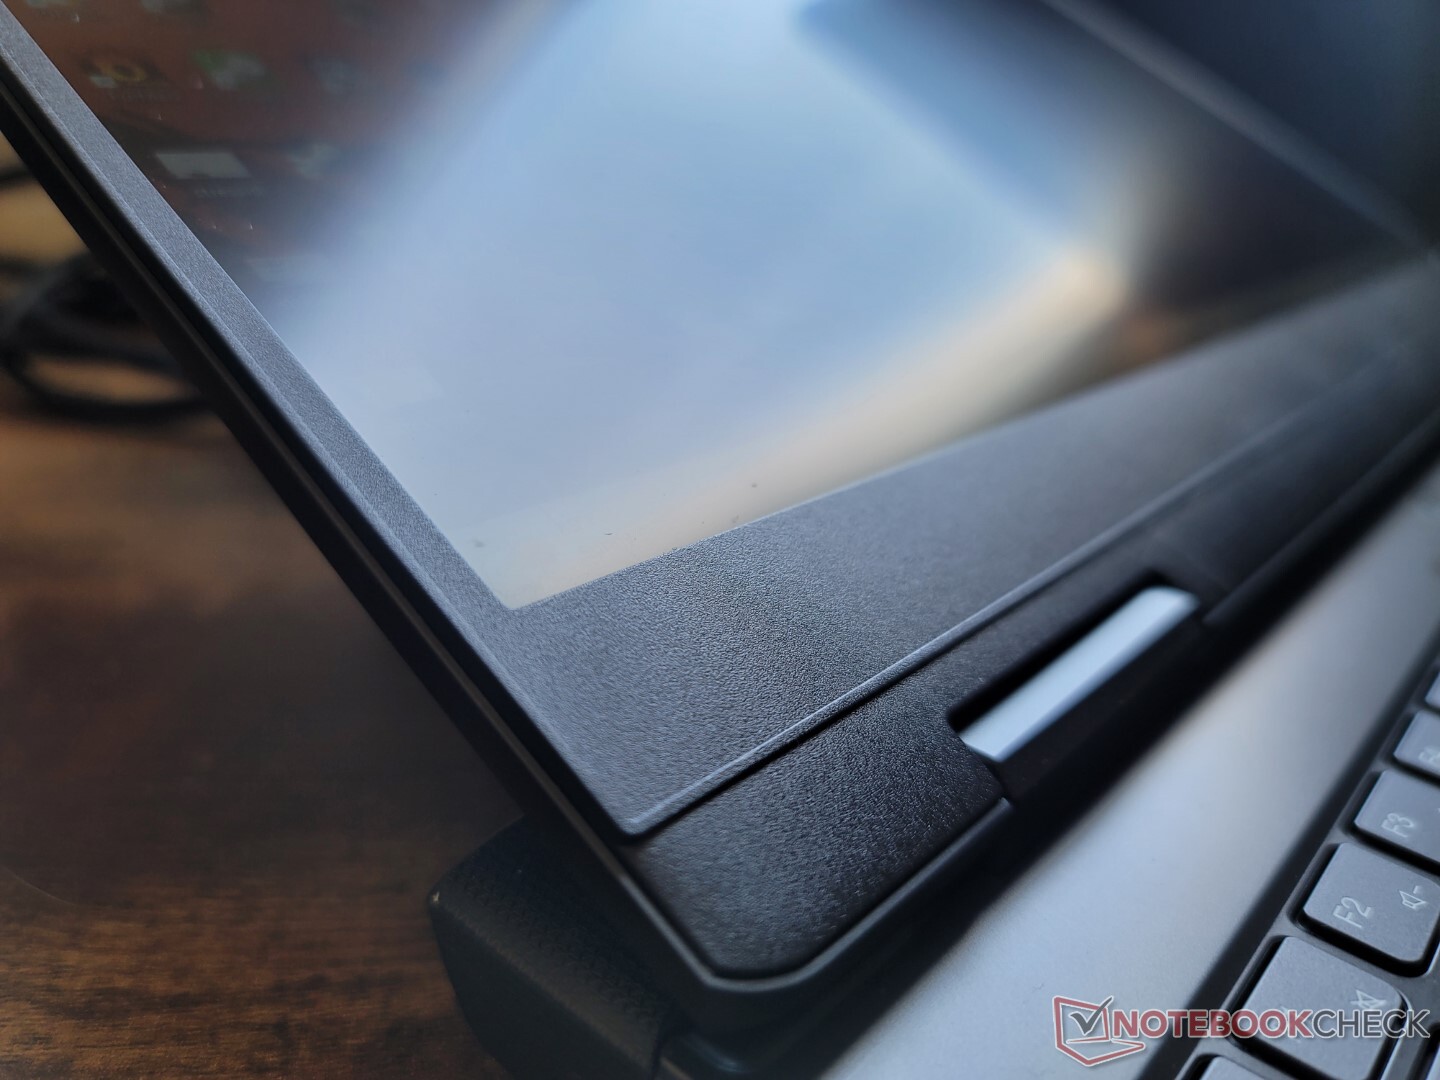
La rigidité du châssis est assez bonne à la base, car les torsions et les dépressions sont minimes par rapport à d'autres ordinateurs portables de jeu bon marché comme le GF63 de MSI ou le GF63 d'HP HP Pavilion Gaming 15. Les charnières, cependant, sont une autre histoire, car l'écran a tendance à vaciller plus que nous ne le voudrions lorsque nous ajustons les angles. Des craquements sont audibles lorsque l'écran est ouvert à fond, ce qui pourrait être un problème potentiel dans plusieurs années.
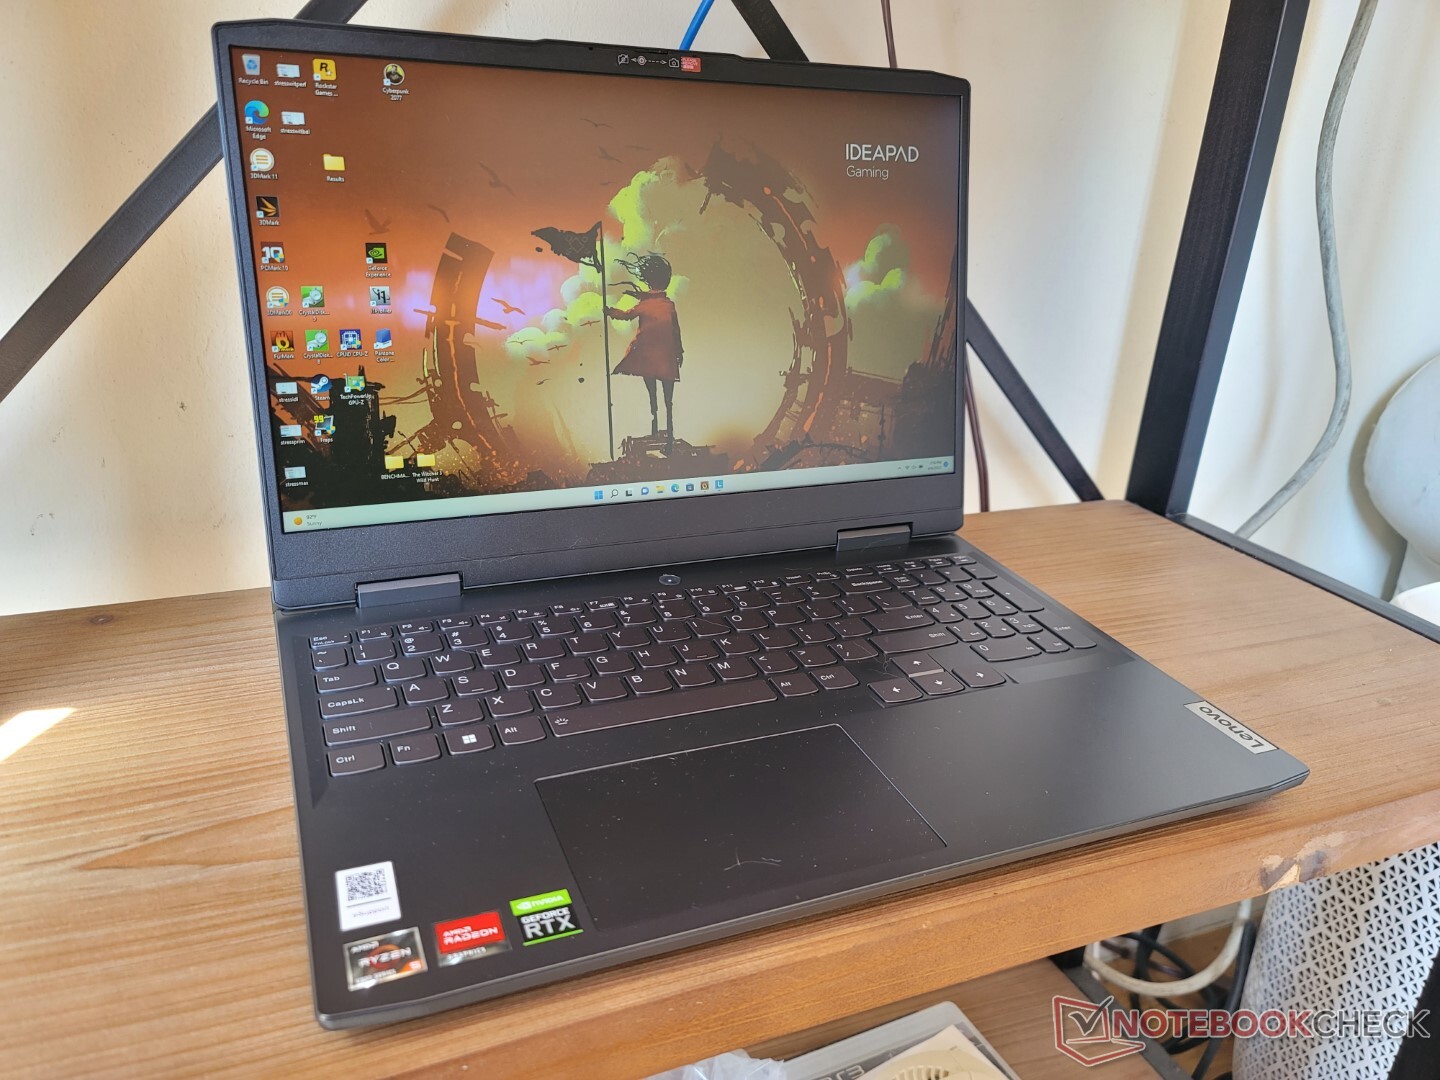
Par rapport à l'IdeaPad Gaming 3 de 2020, notre modèle 2022 est plus grand et plus lourd d'environ 200 g. Il est également plus fin de quelques millimètres, mais le profil légèrement plus fin ne fait rien pour apaiser le châssis sensiblement plus volumineux. Le gain de taille et de poids peut être attribué au nouvel arrière allongé inspiré de la série Legion.
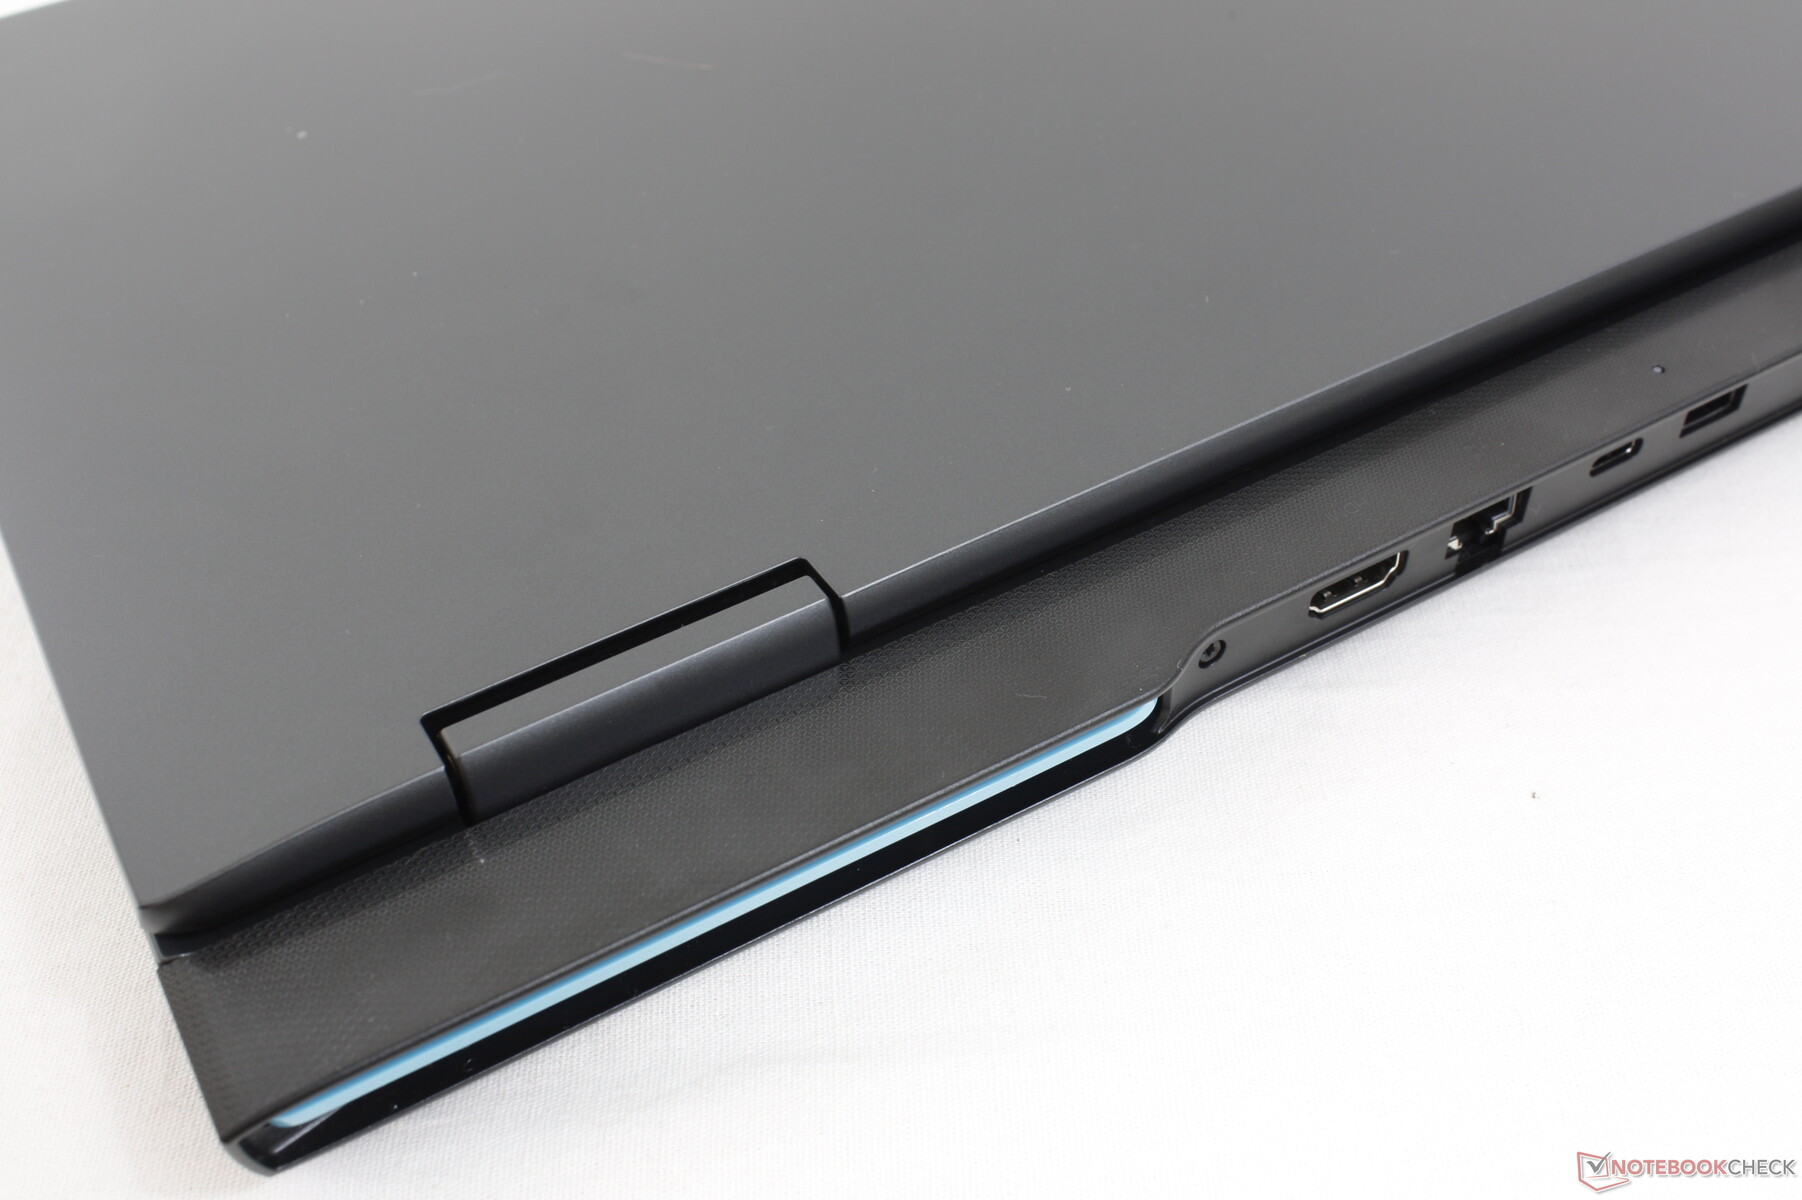
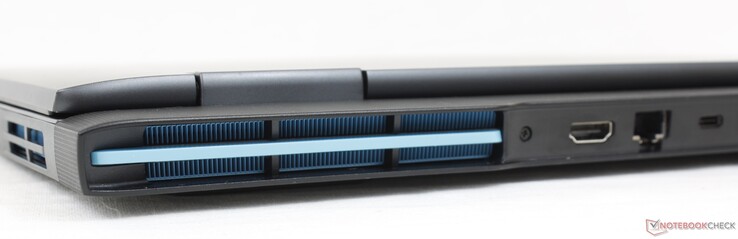
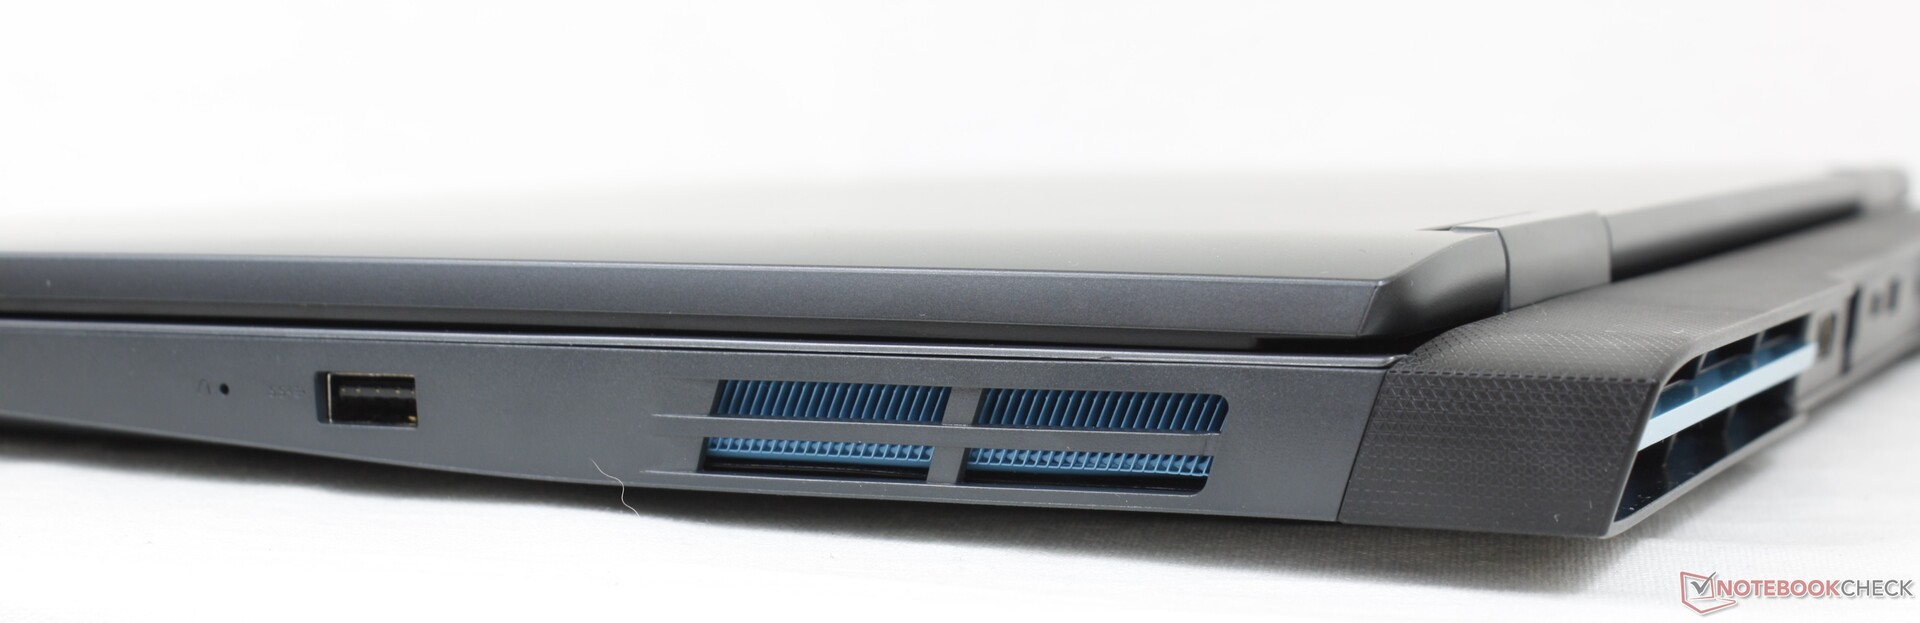
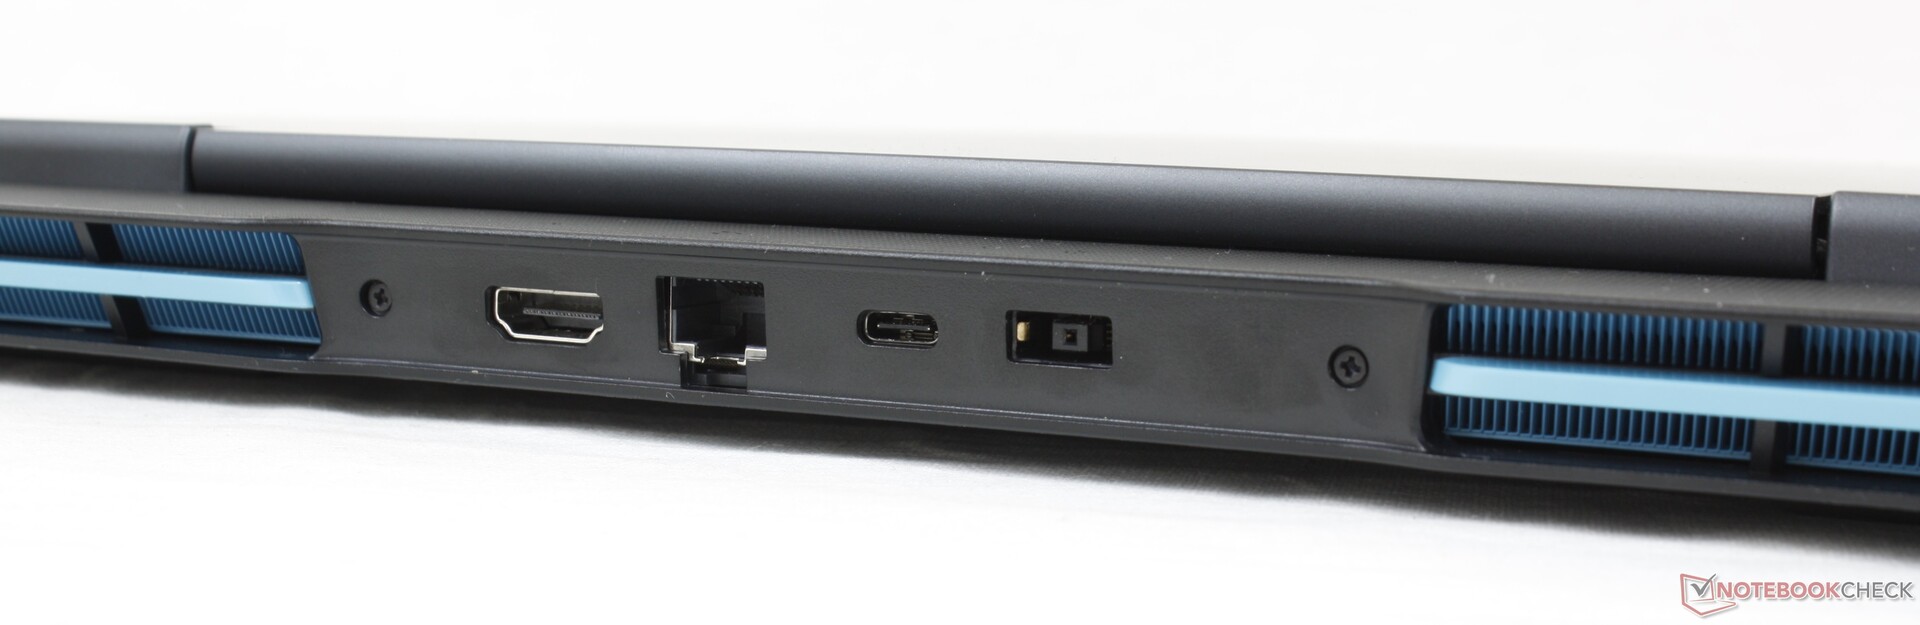
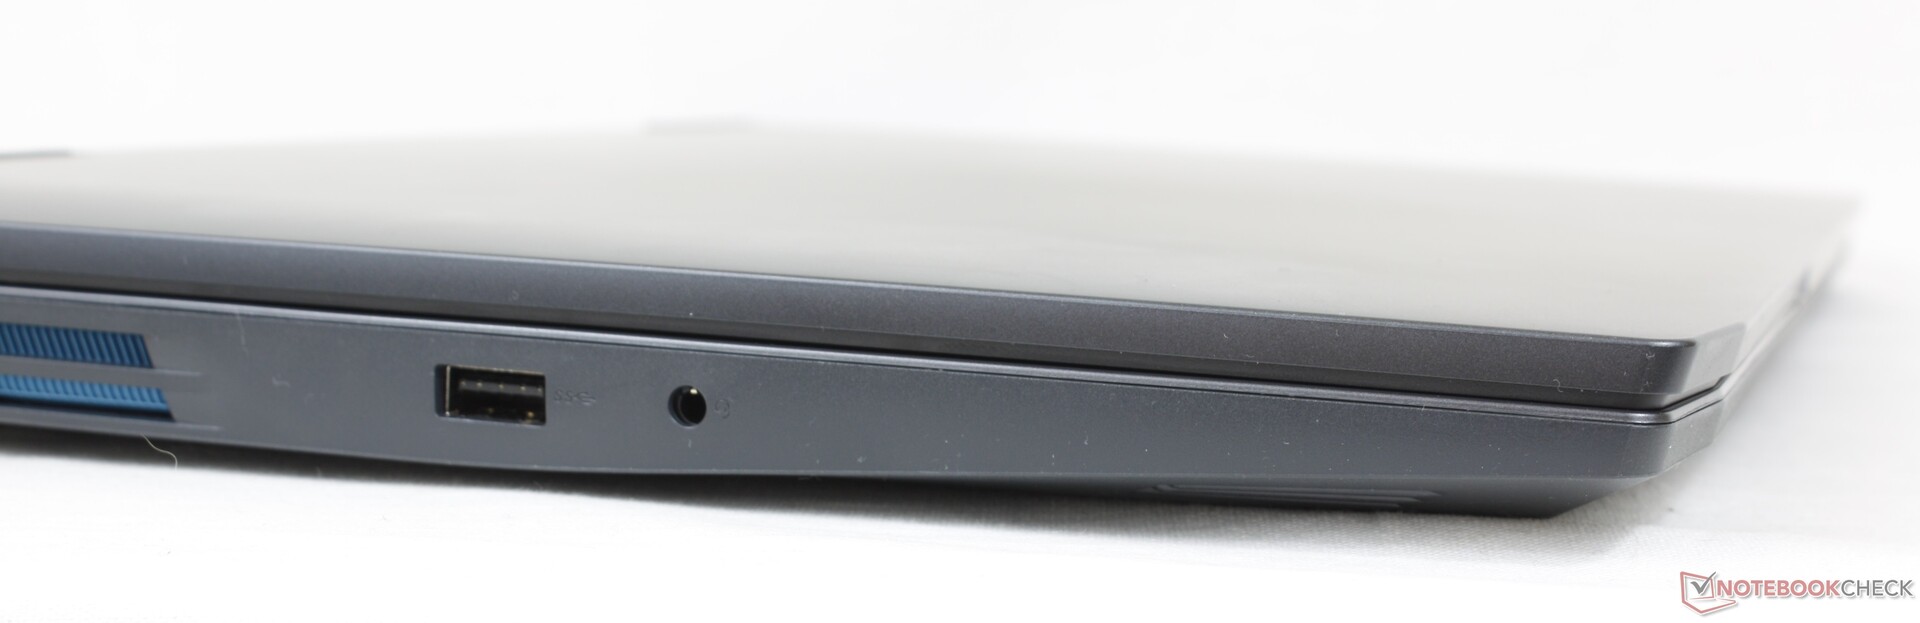
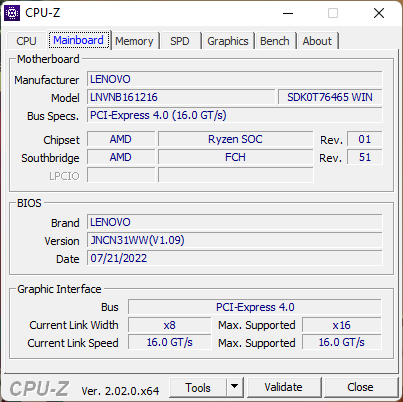
Connectivité - Pas de support Thunderbolt
Les options de port sont décentes et comparables à celles d'autres ordinateurs portables de jeu à petit budget. Le positionnement des ports est cependant mitigé, puisque la plupart des ports se trouvent à l'arrière de l'appareil, où ils peuvent être difficiles à atteindre. Gardez à l'esprit que Thunderbolt n'est pas pris en charge, contrairement à de nombreux ordinateurs portables de jeu équipés de processeurs Intel.
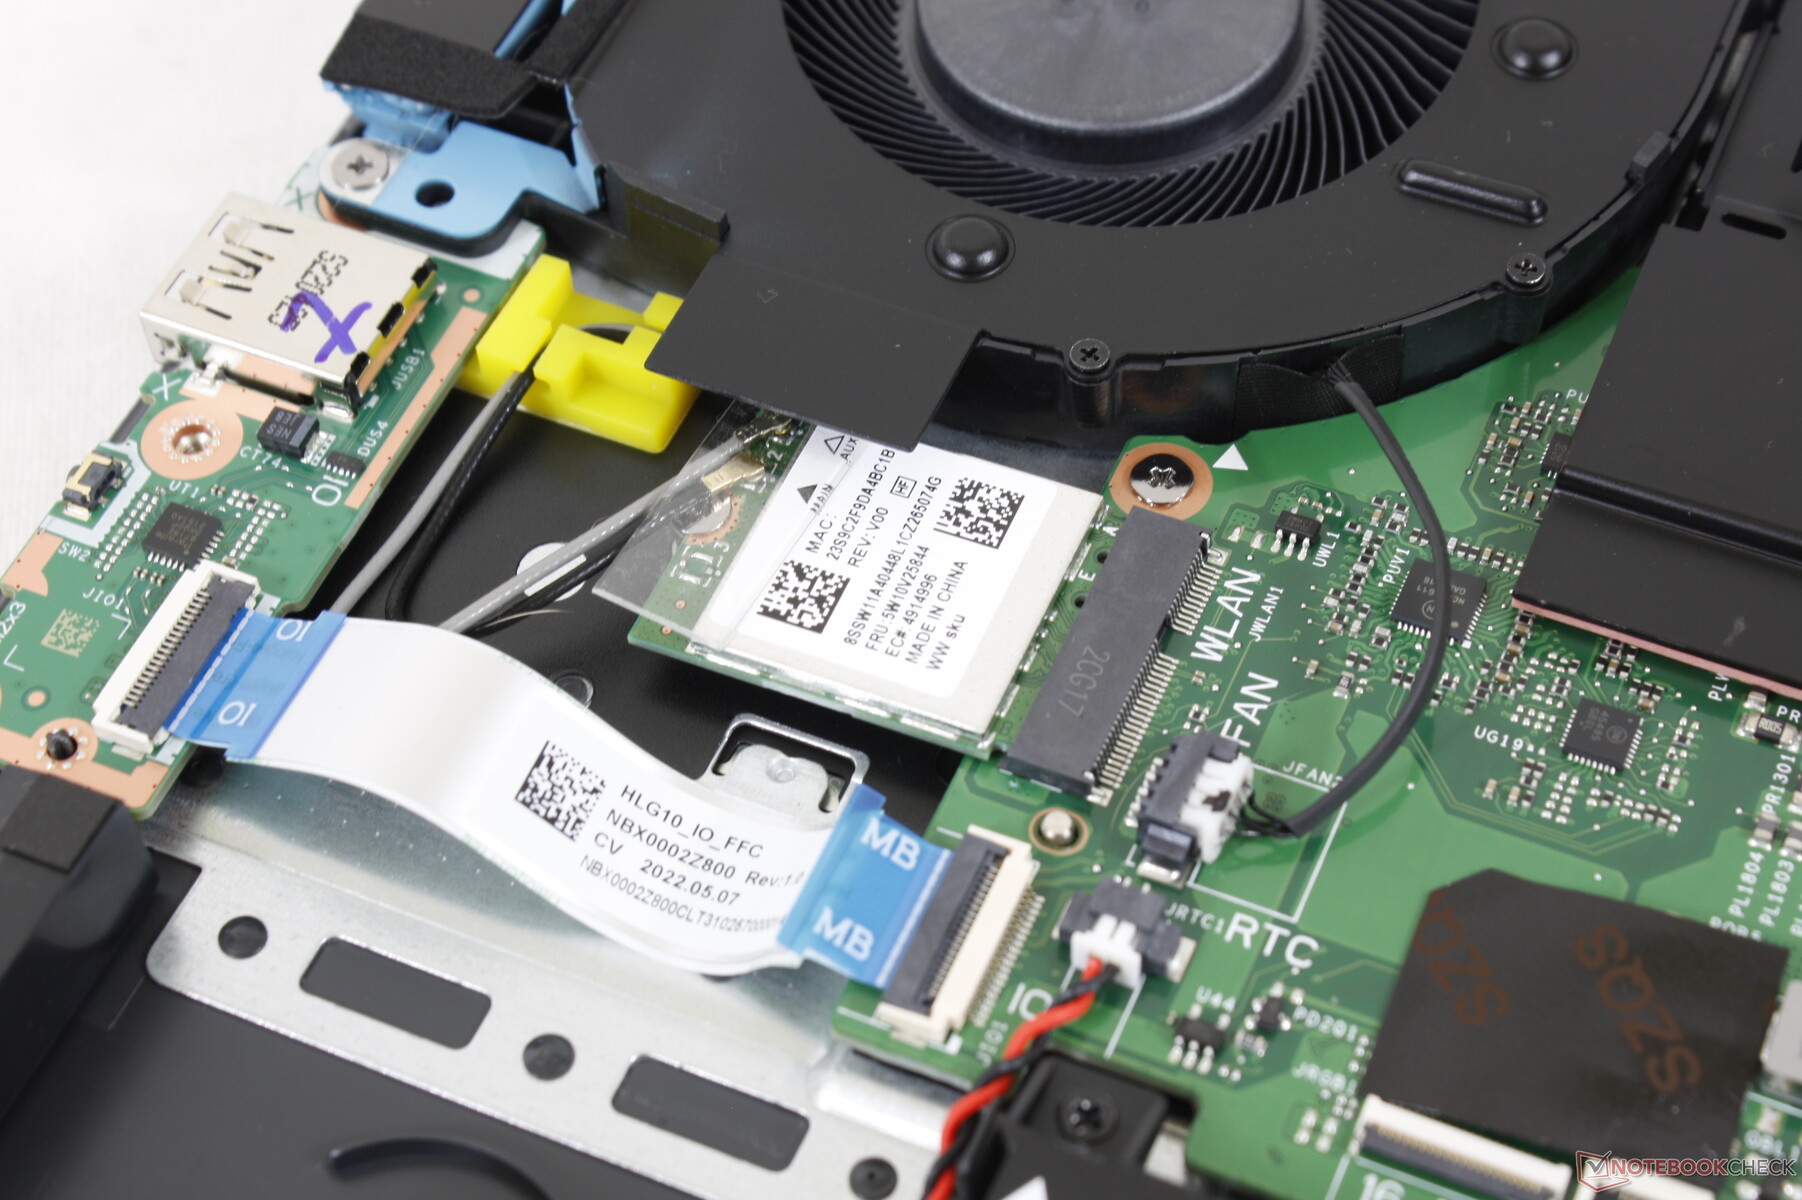
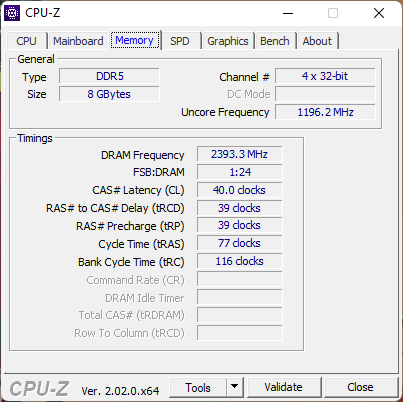
Communication
L'appareil est livré avec un Realtek RTL8852BE pour la connectivité Wi-Fi 6 et Bluetooth 5.1 au lieu d'un module Intel AX, probablement pour réduire les coûts. Les taux de transfert sont nettement plus lents, mais ils sont néanmoins réguliers et suffisamment rapides pour la plupart des usages, y compris le streaming vidéo 4K ou les téléchargements.
| Networking | |
| iperf3 transmit AX12 | |
| Lenovo Legion 5 15ACH6A-82NW0010GE | |
| Lenovo IdeaPad Gaming 3i 15IMH05 | |
| iperf3 receive AX12 | |
| Lenovo Legion 5 15ACH6A-82NW0010GE | |
| Lenovo IdeaPad Gaming 3i 15IMH05 | |
| iperf3 receive AXE11000 | |
| Gigabyte A5 K1 | |
| Dell G15 5510 | |
| Asus TUF Dash F15 FX517ZR | |
| Lenovo IdeaPad Gaming 3 15ARH7 | |
| iperf3 transmit AXE11000 | |
| Gigabyte A5 K1 | |
| Asus TUF Dash F15 FX517ZR | |
| Lenovo IdeaPad Gaming 3 15ARH7 | |
Webcam
La webcam intégrée n'a qu'une résolution de 1 MP, ce qui donne des images peu nettes. Bien qu'il y ait un obturateur pour la confidentialité, il n'y a pas d'IR pour le support de l'Allo.


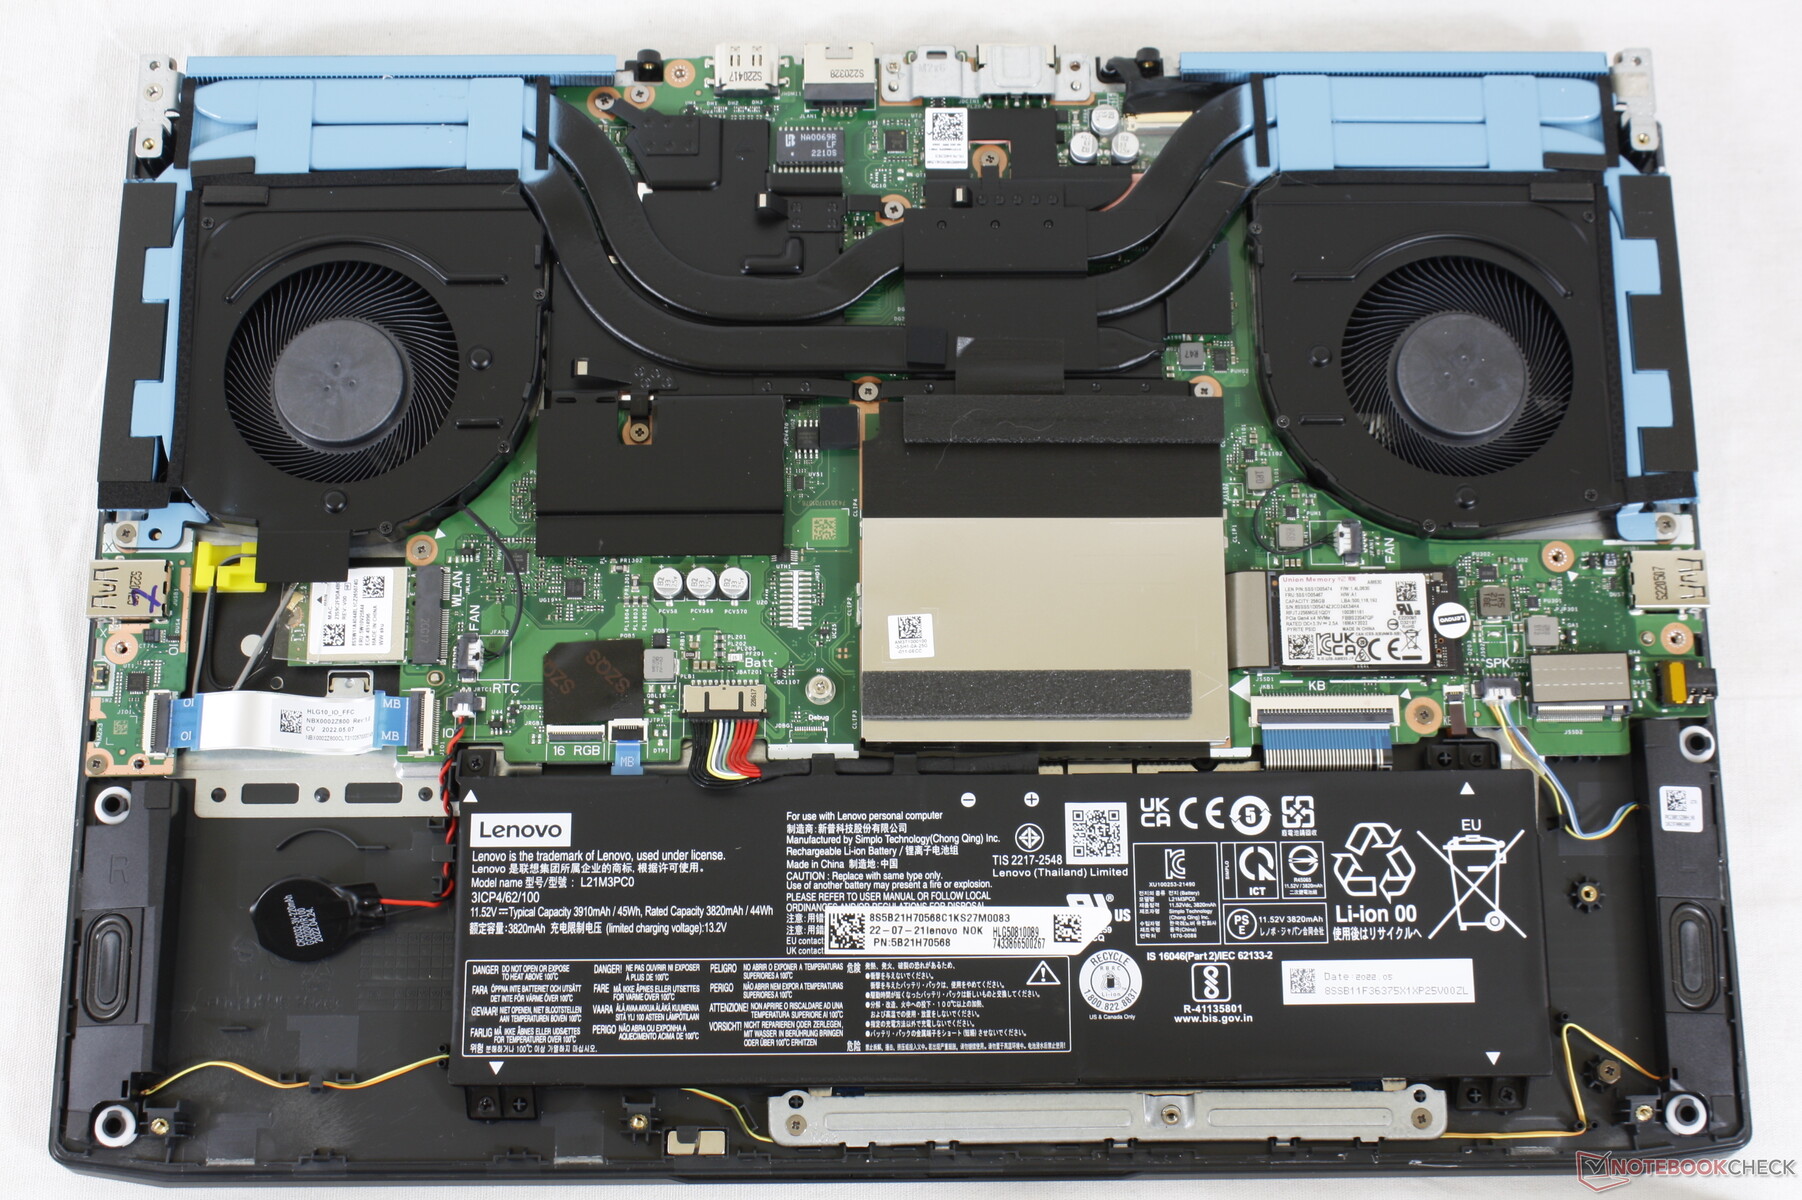
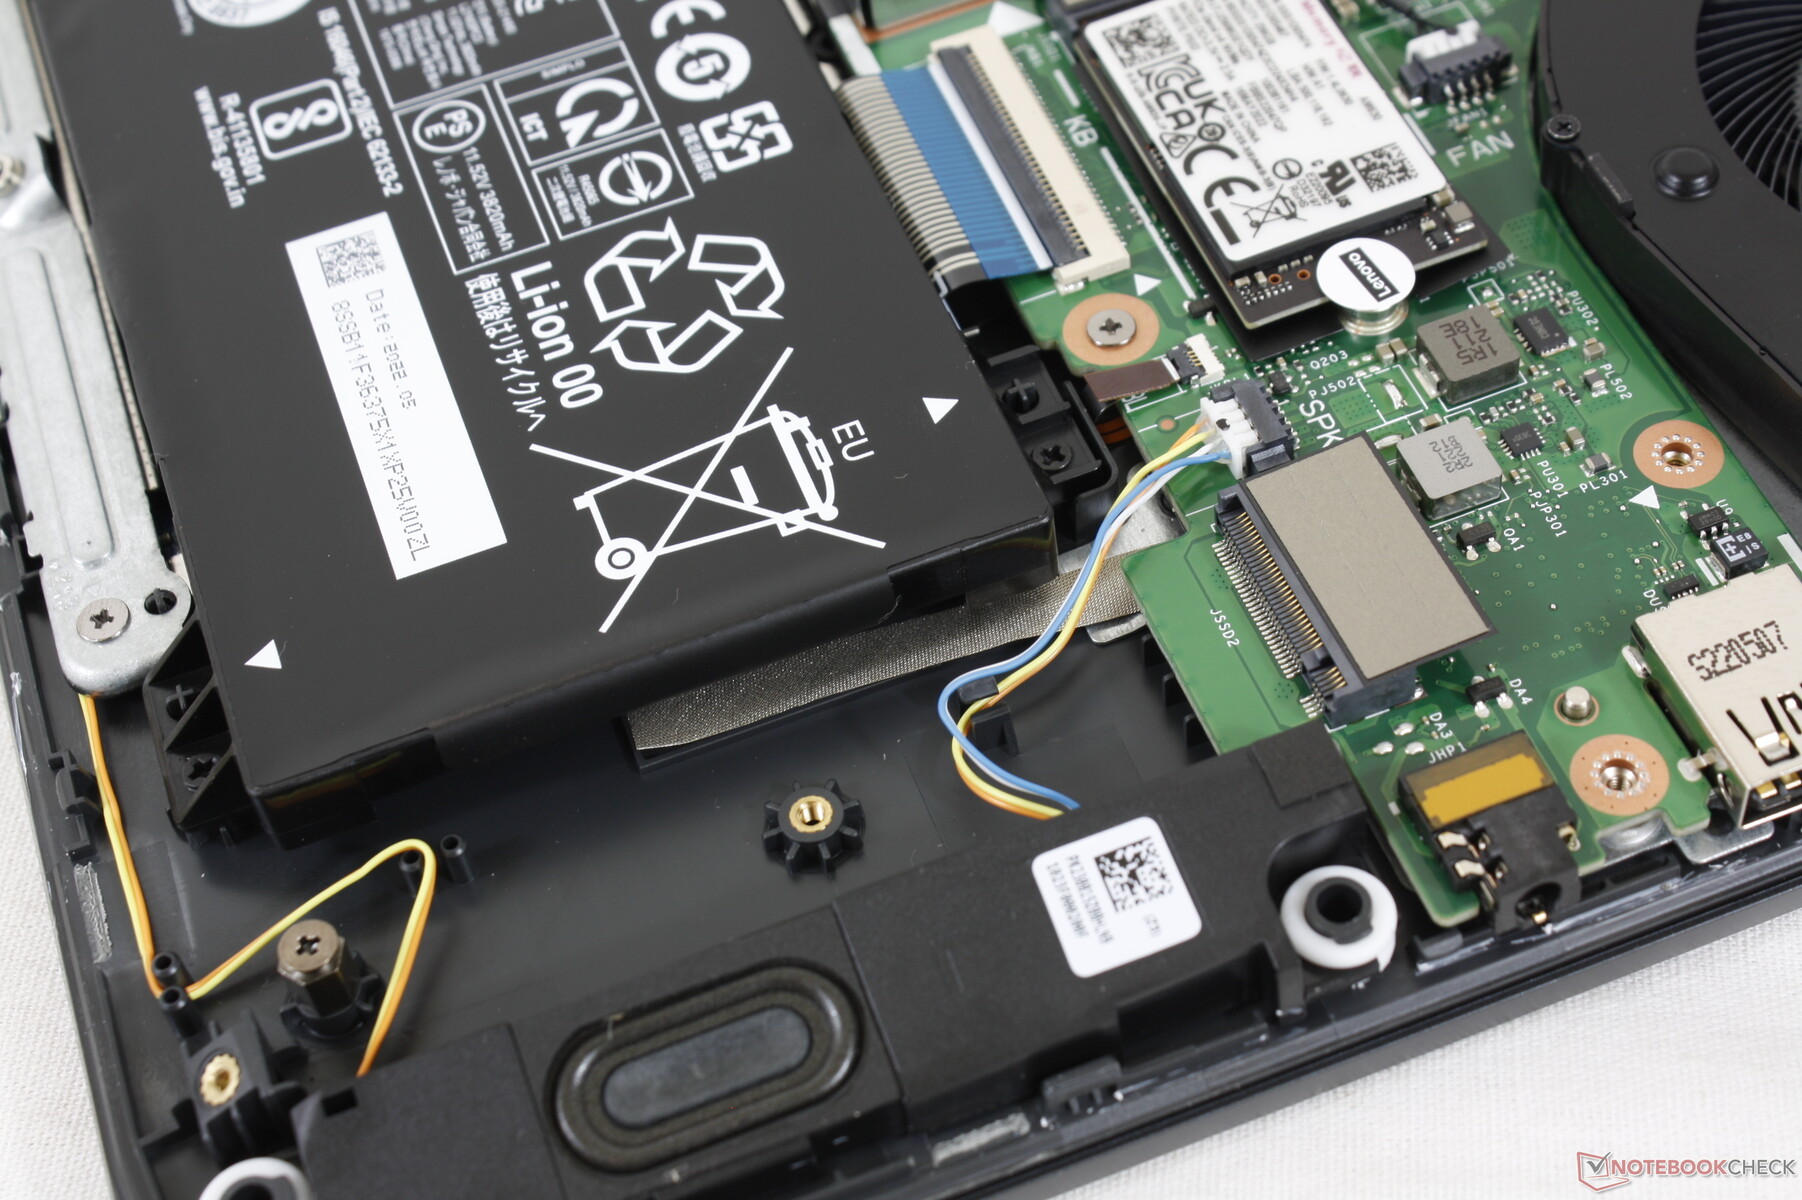
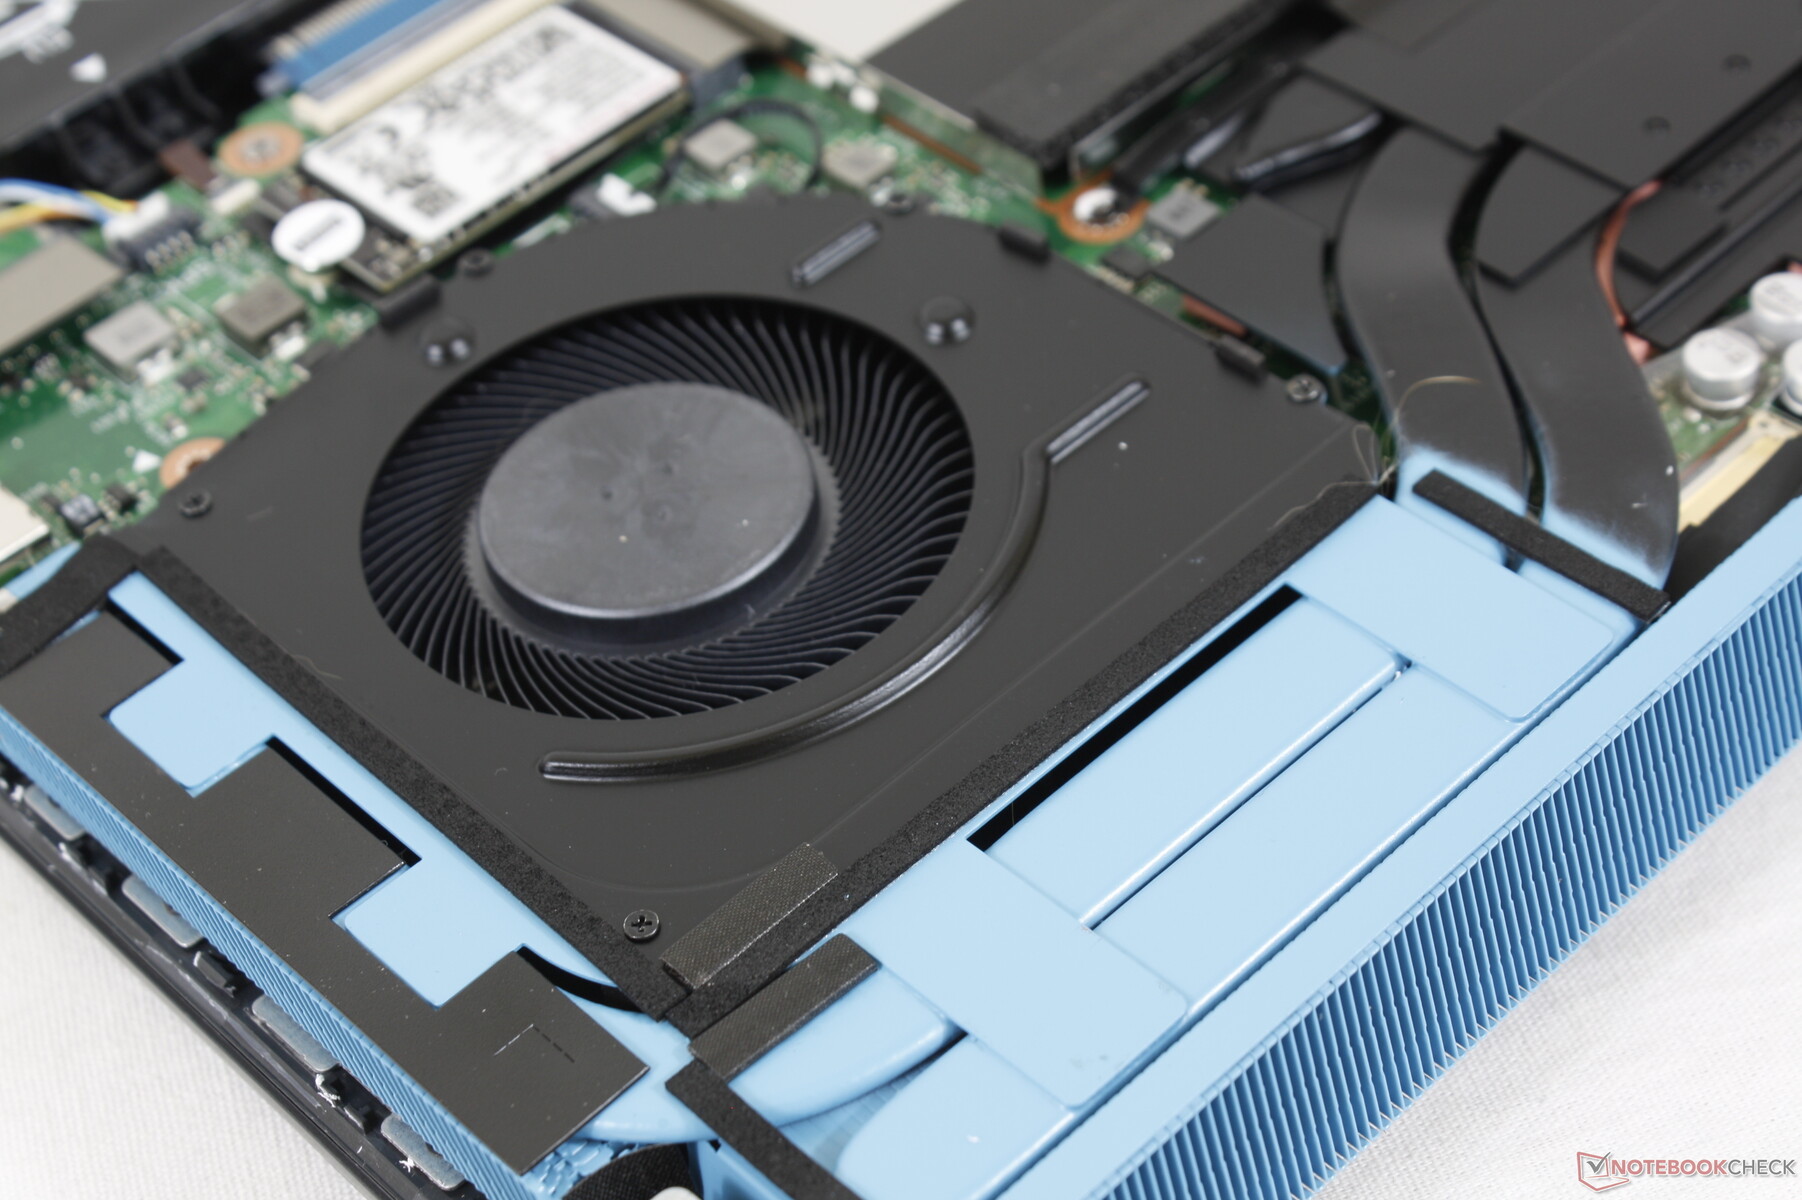
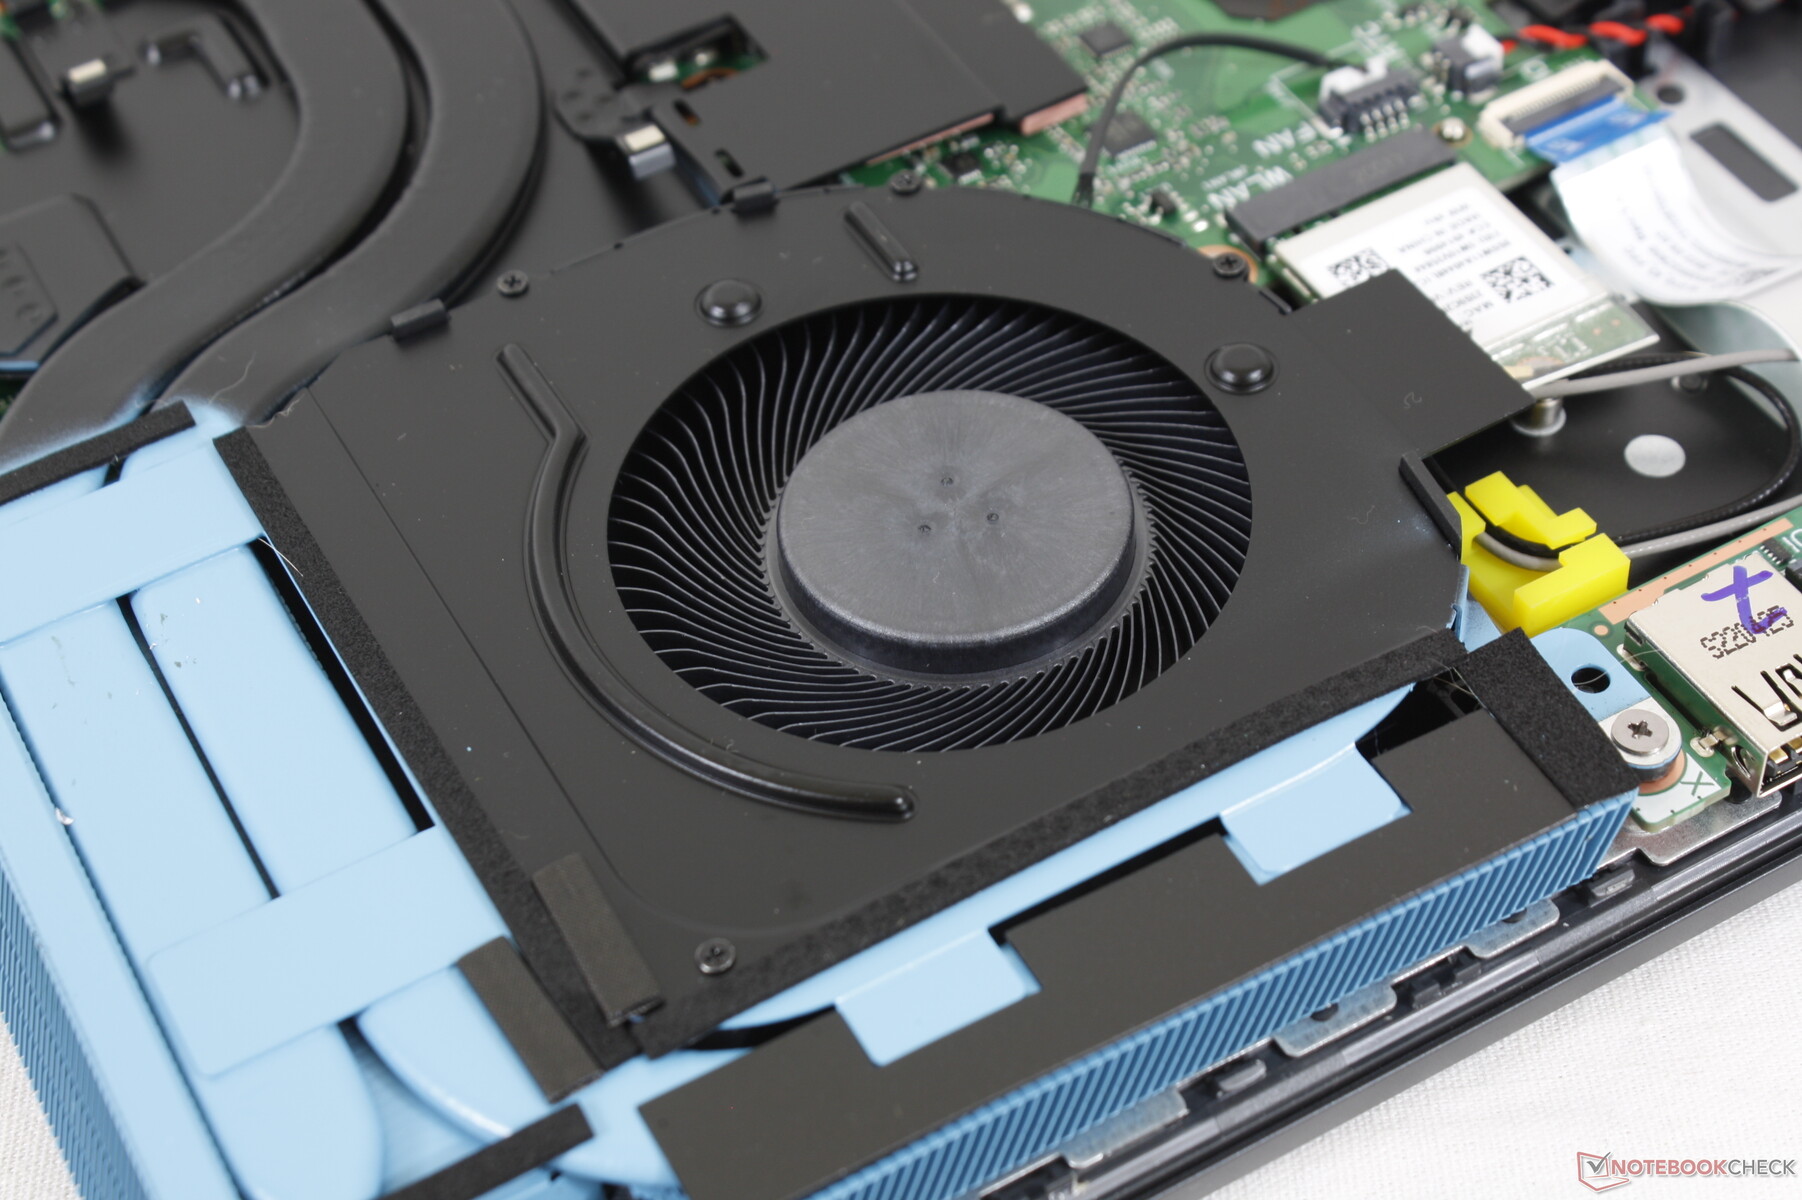
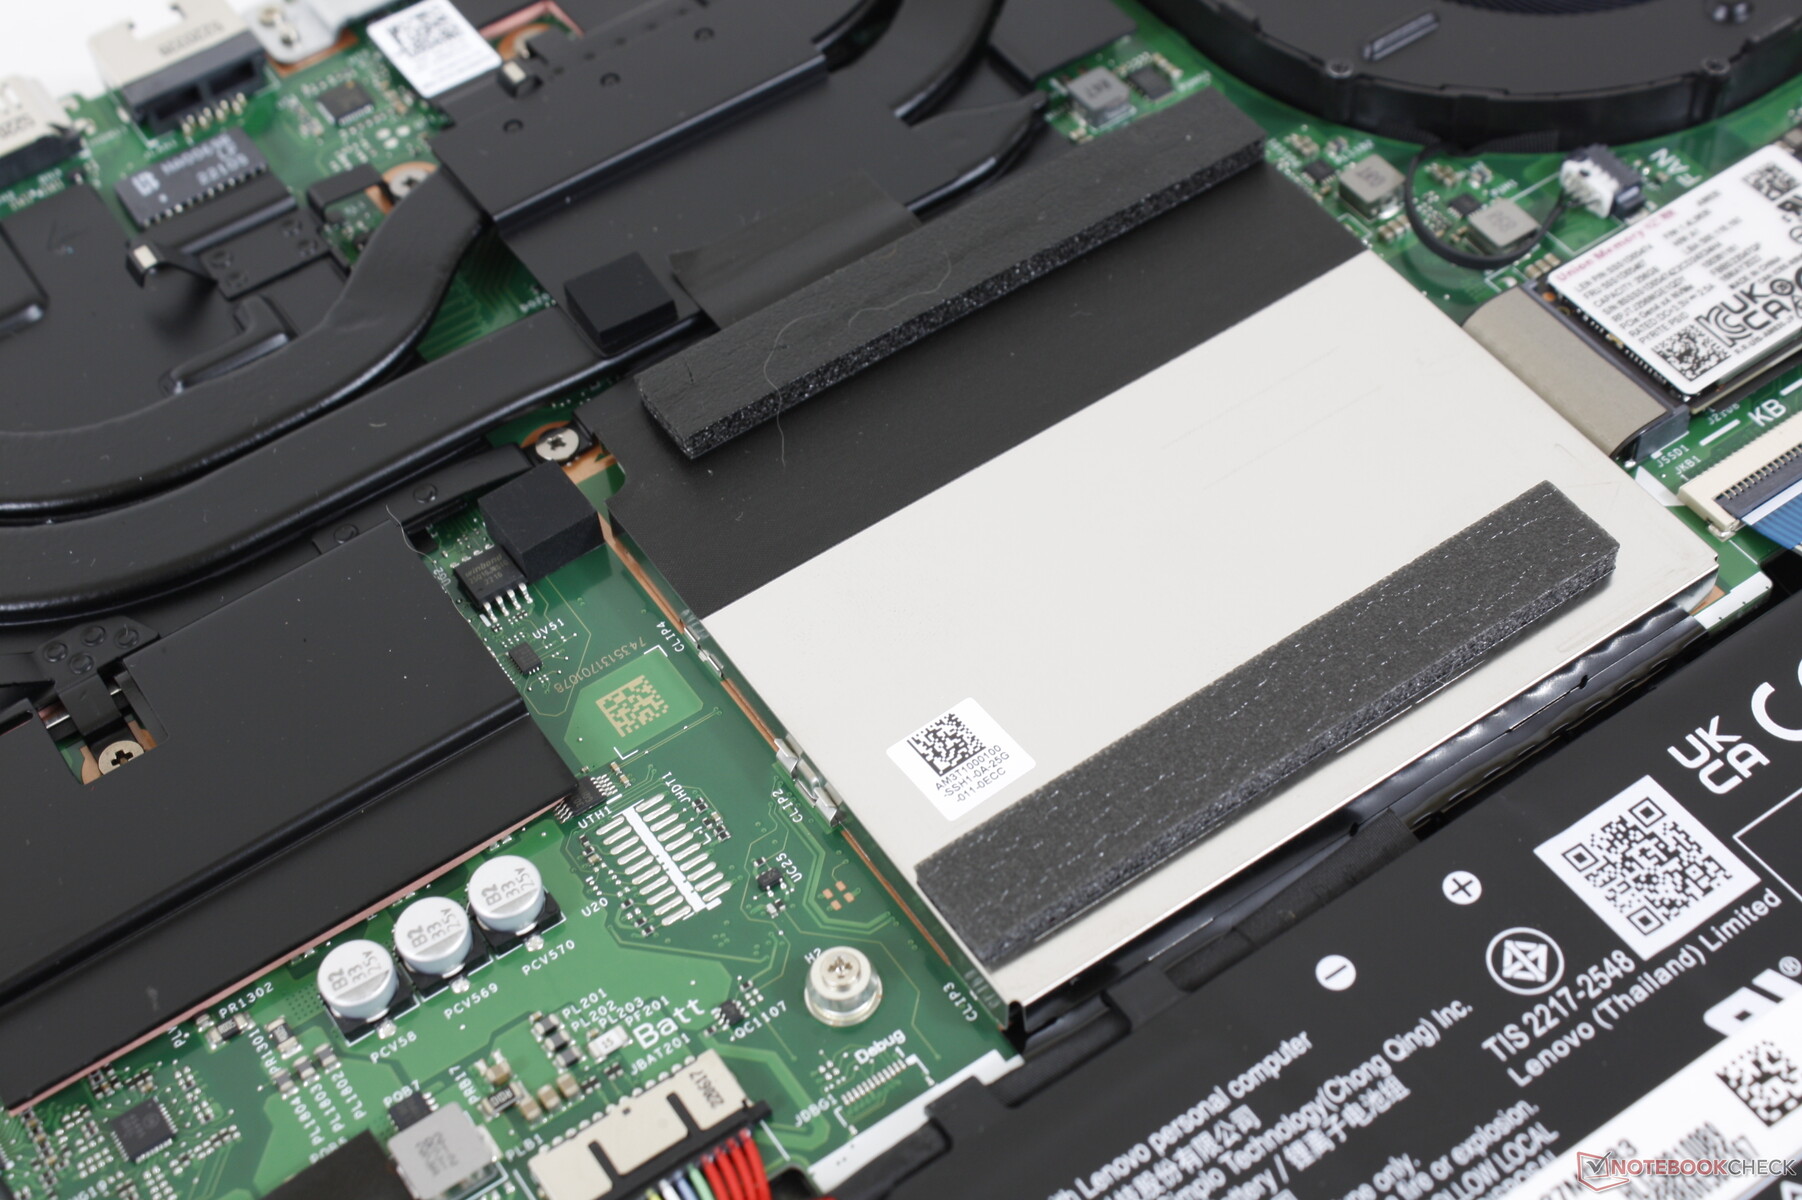
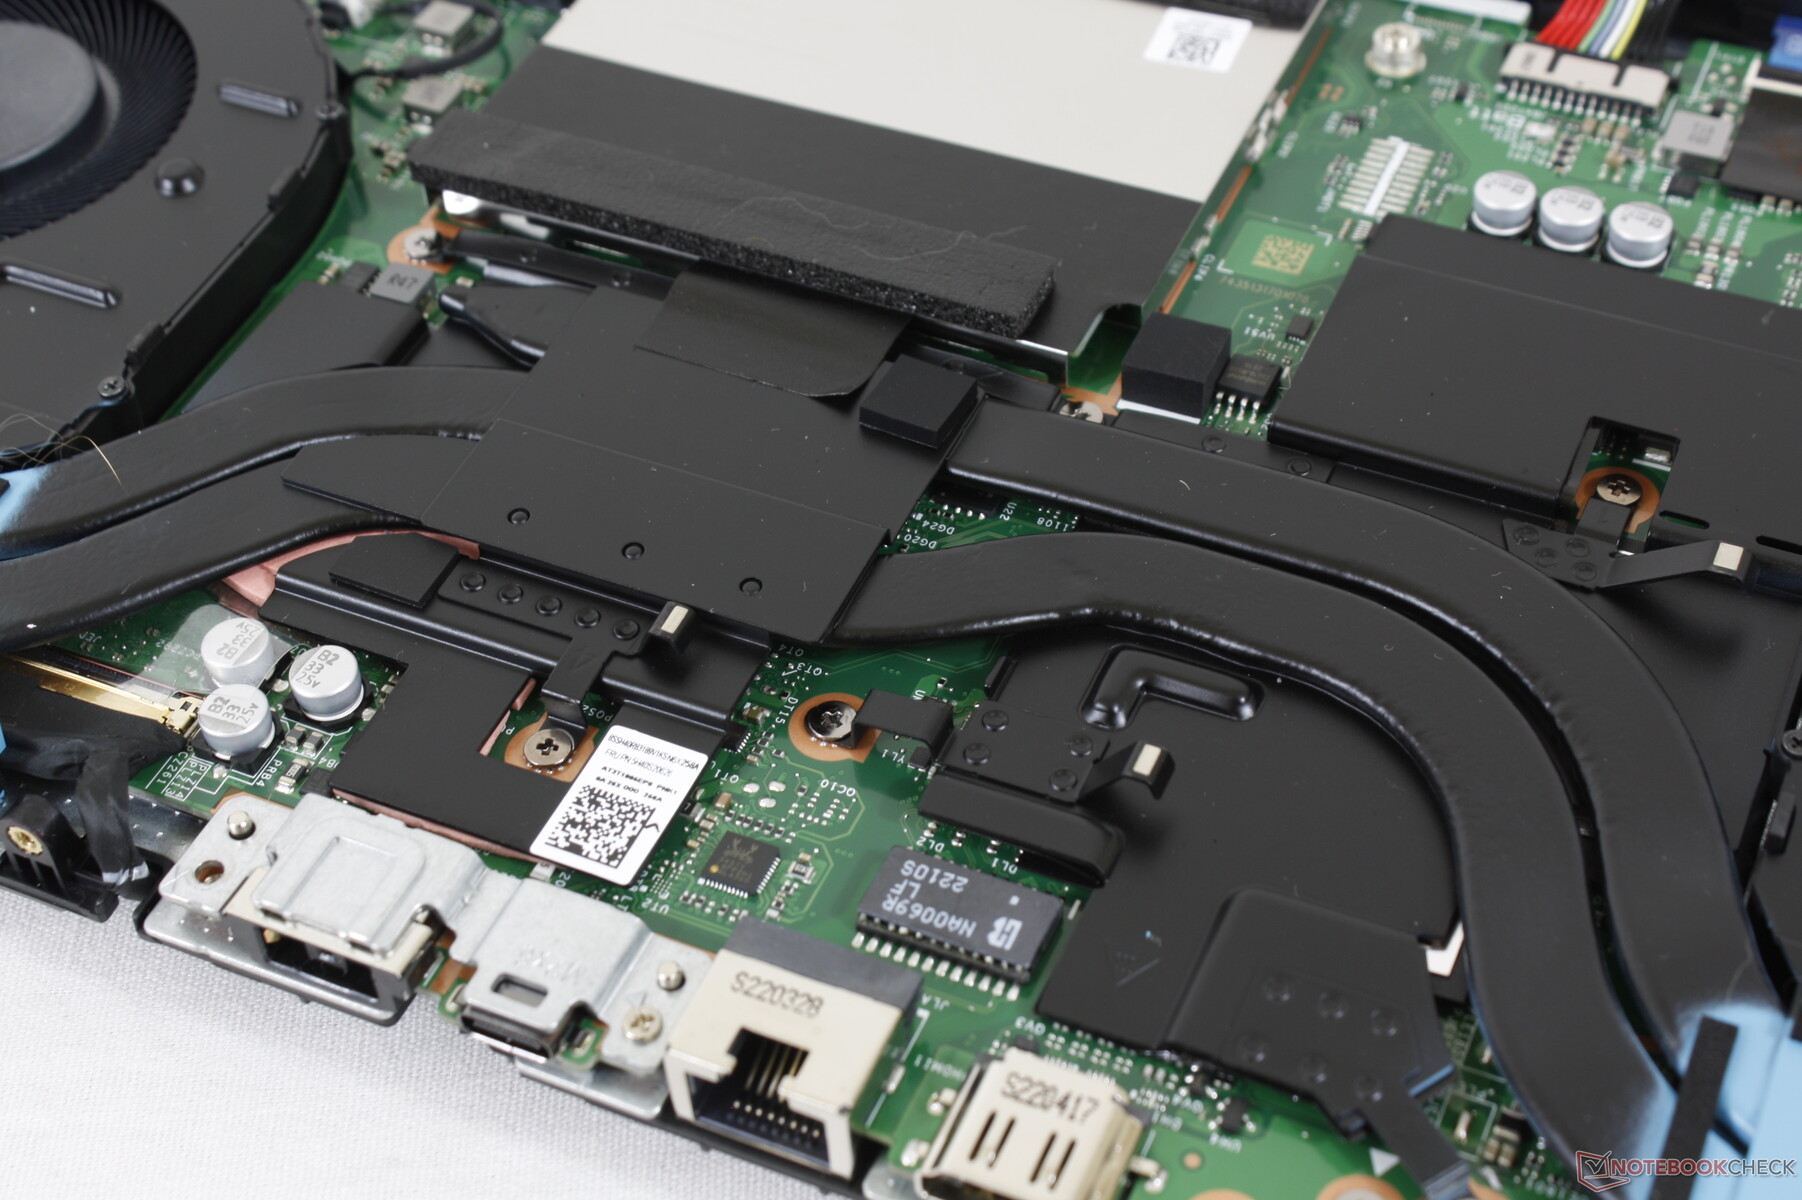
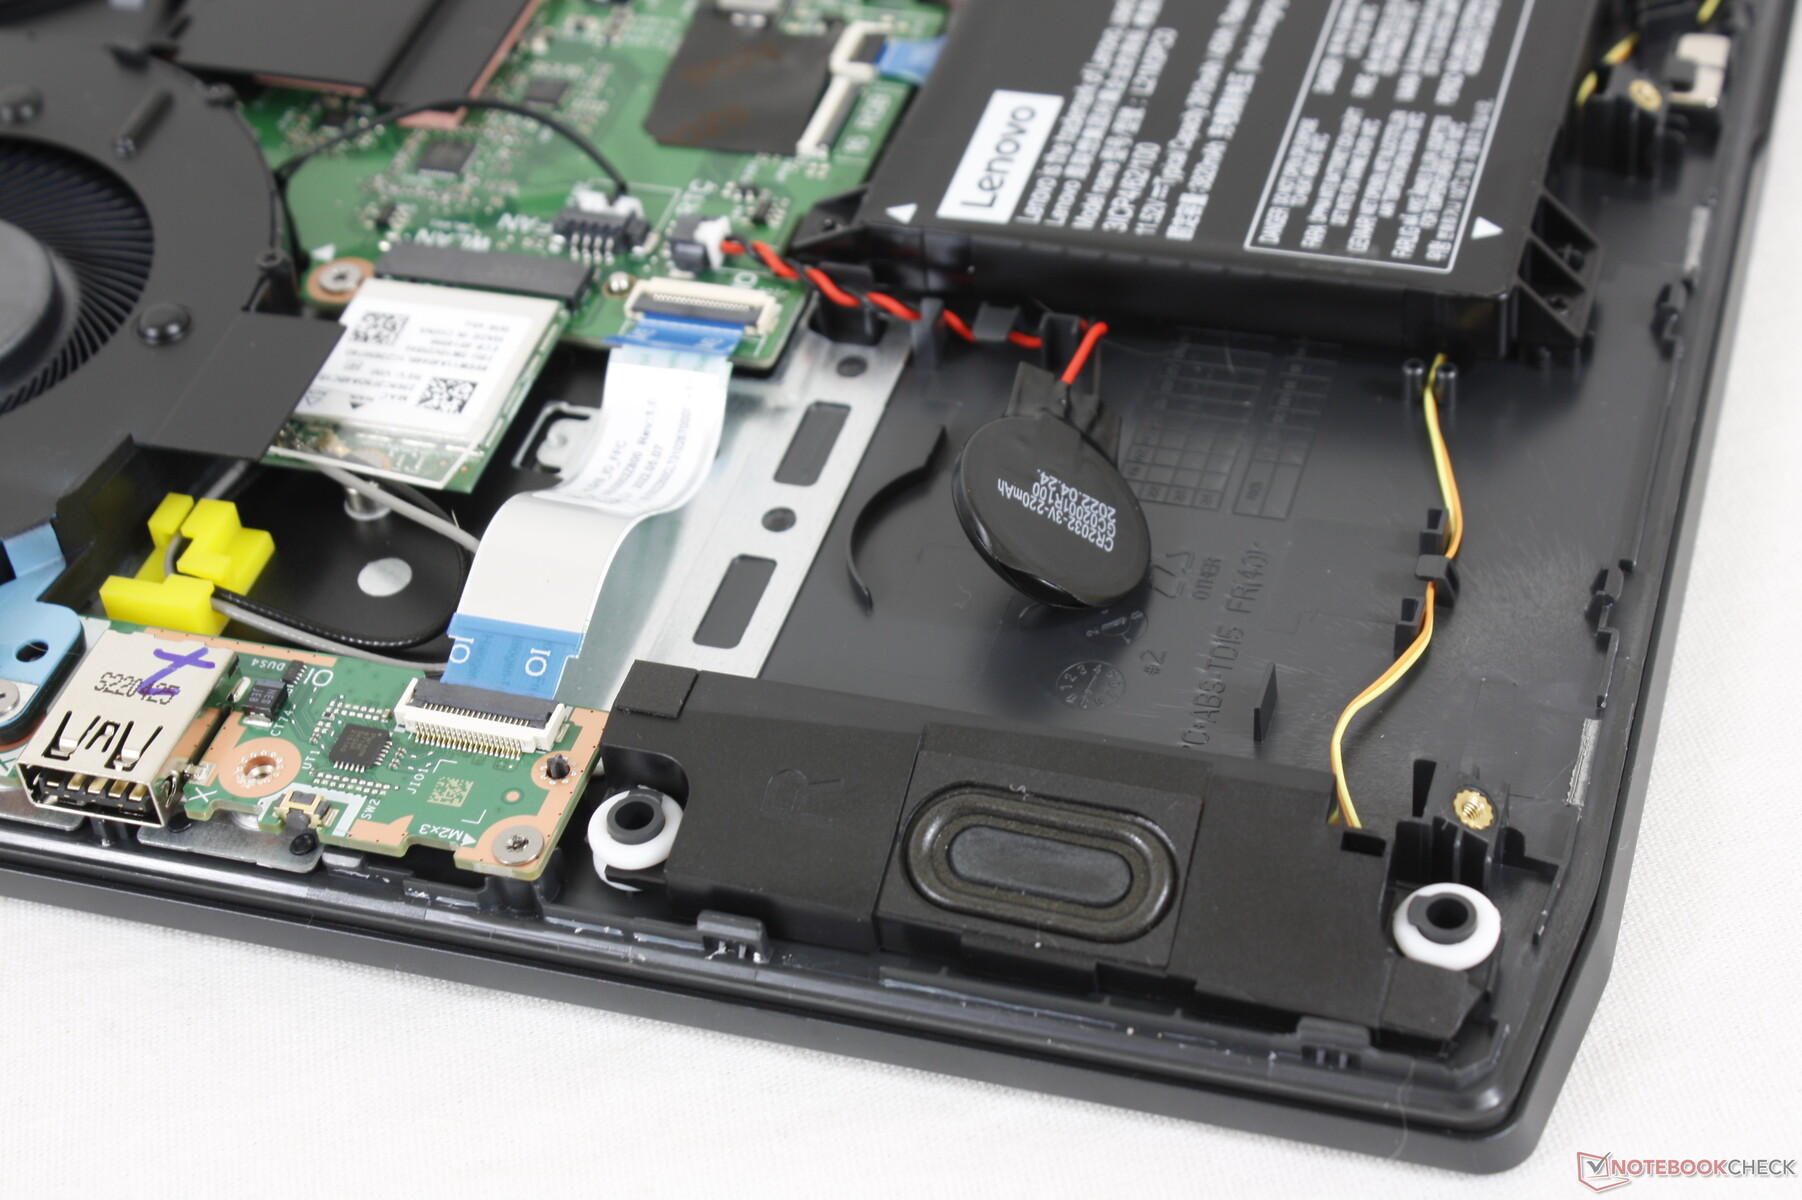
Maintenance - Trop difficile à ouvrir
Le panneau inférieur est très difficile à retirer. Il est fixé par 12 vis Philips, mais seules 8 sont facilement accessibles. Pour accéder aux 4 autres, il faut d'abord détacher la coque arrière qui est fixée par 2 autres vis près des ports arrière. Retirer cette coque arrière du corps est une étape supplémentaire qui n'est pas présente sur la plupart des autres ordinateurs portables de jeu. Il est clair que Lenovo n'a pas conçu l'IdeaPad Gaming 3 15 pour qu'il puisse être facilement mis à niveau par l'utilisateur final, ce qui est dommage car il existe en fait de nombreuses possibilités de mise à niveau, notamment 2 emplacements SODIMM et 2 baies de stockage M.2.
Accessoires et garantie
La boîte ne contient rien d'autre que l'adaptateur secteur et les documents. La garantie limitée habituelle d'un an s'applique si l'appareil est acheté aux États-Unis.
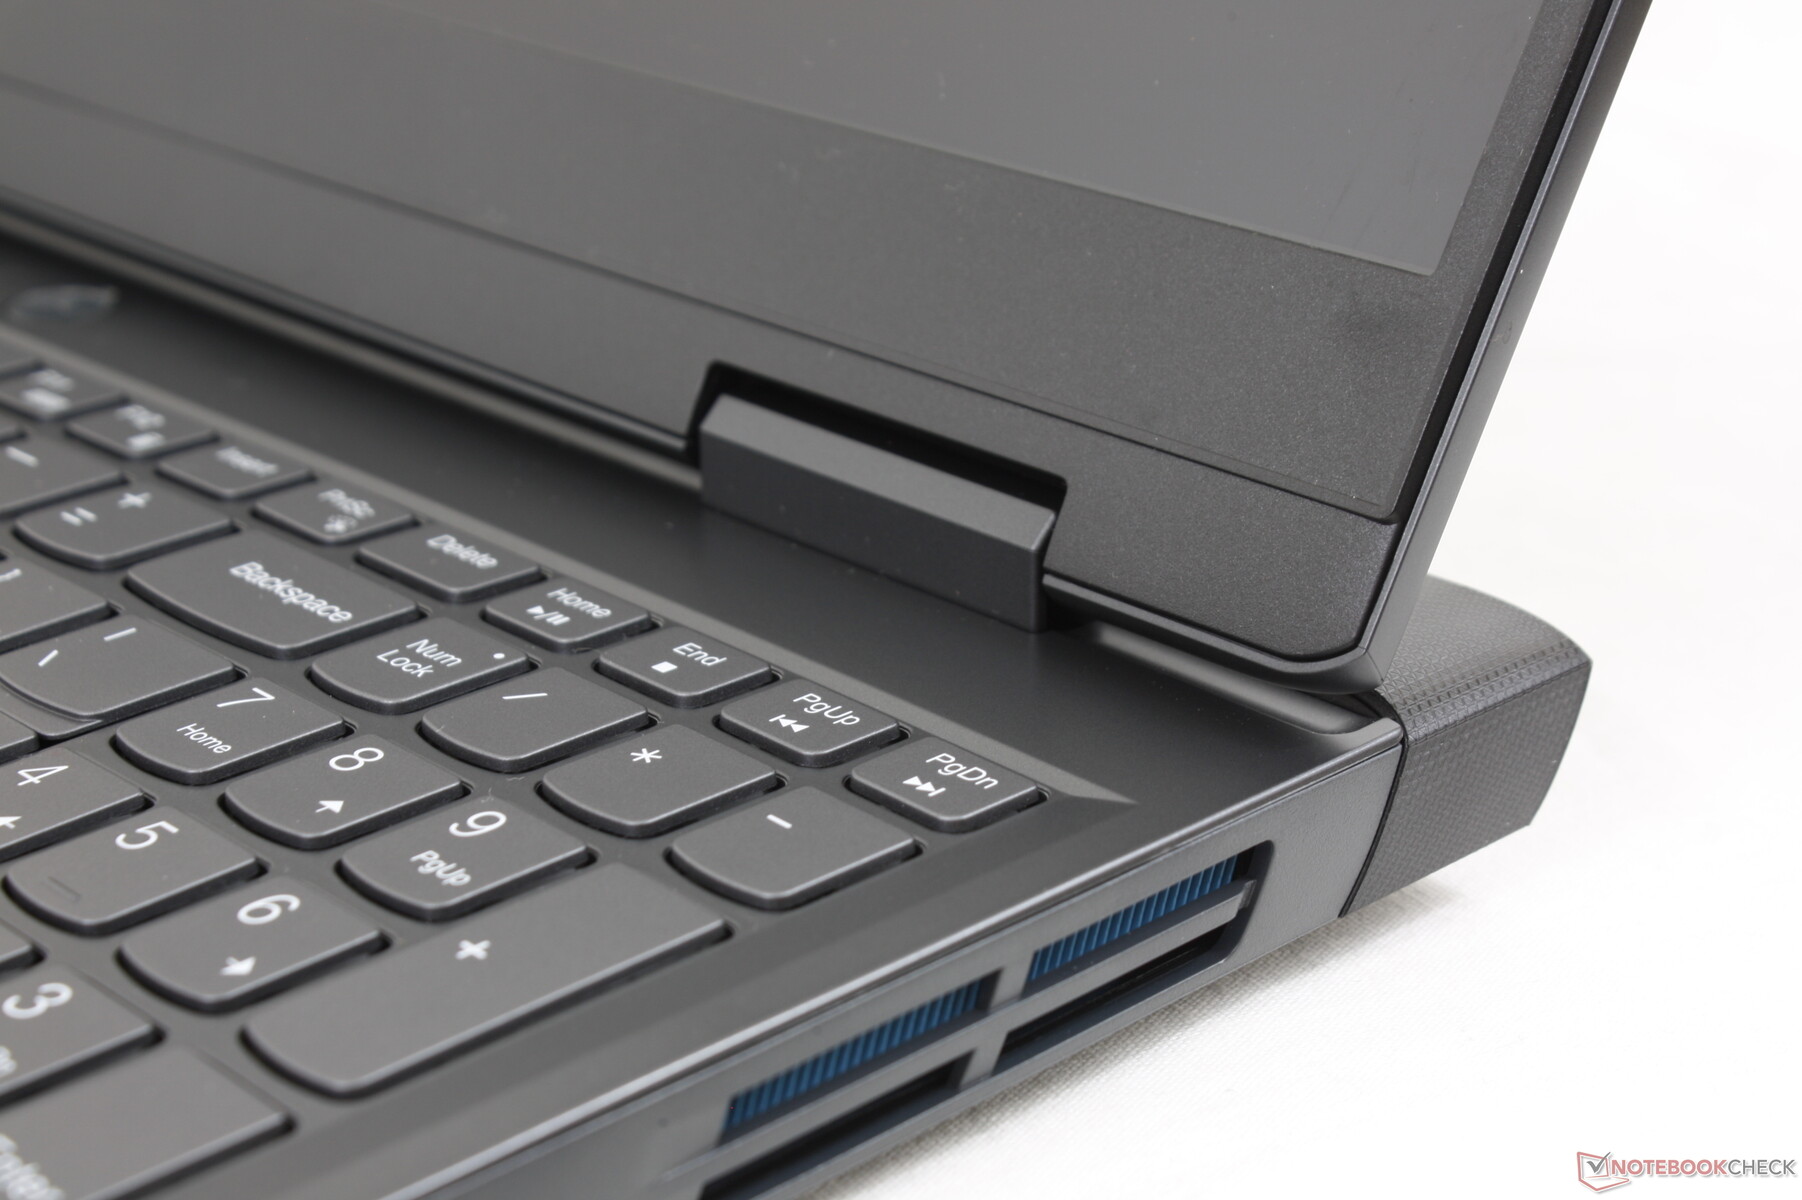
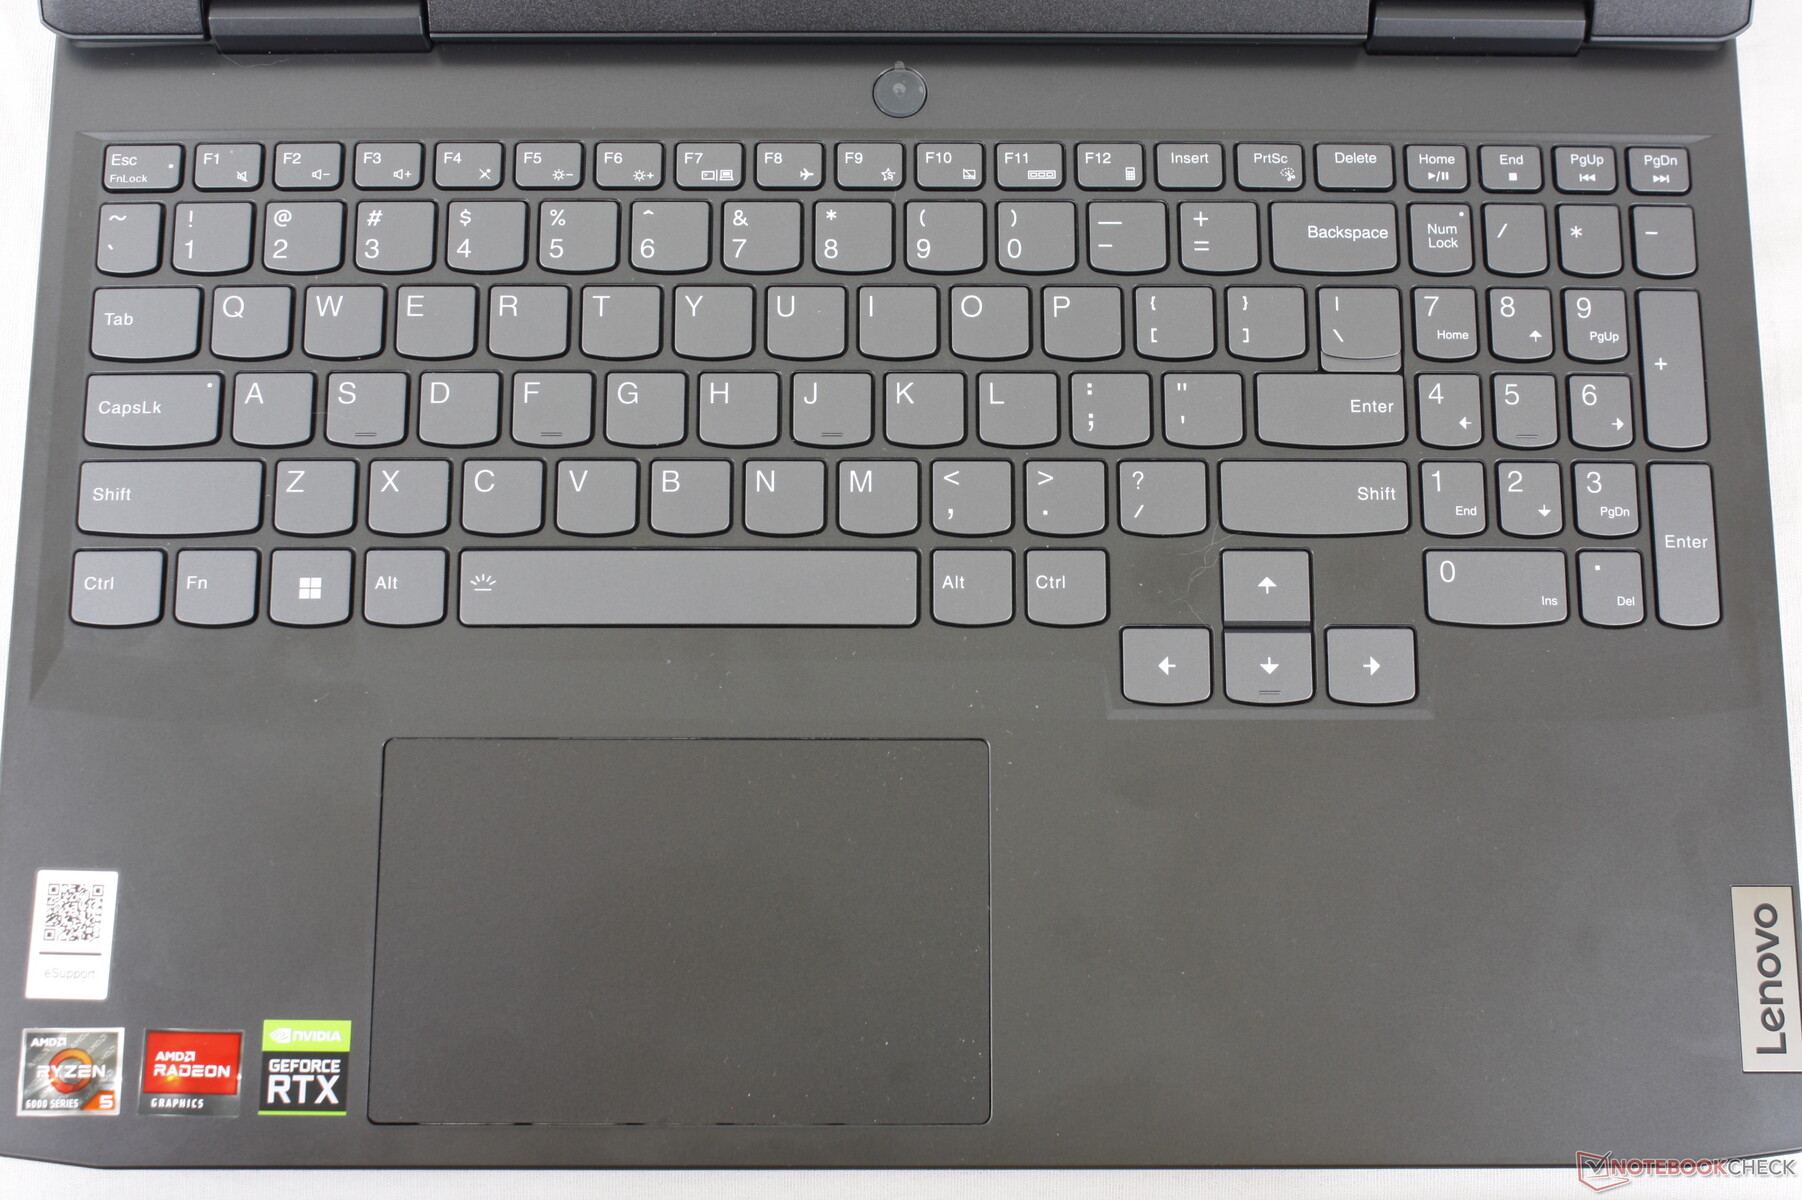
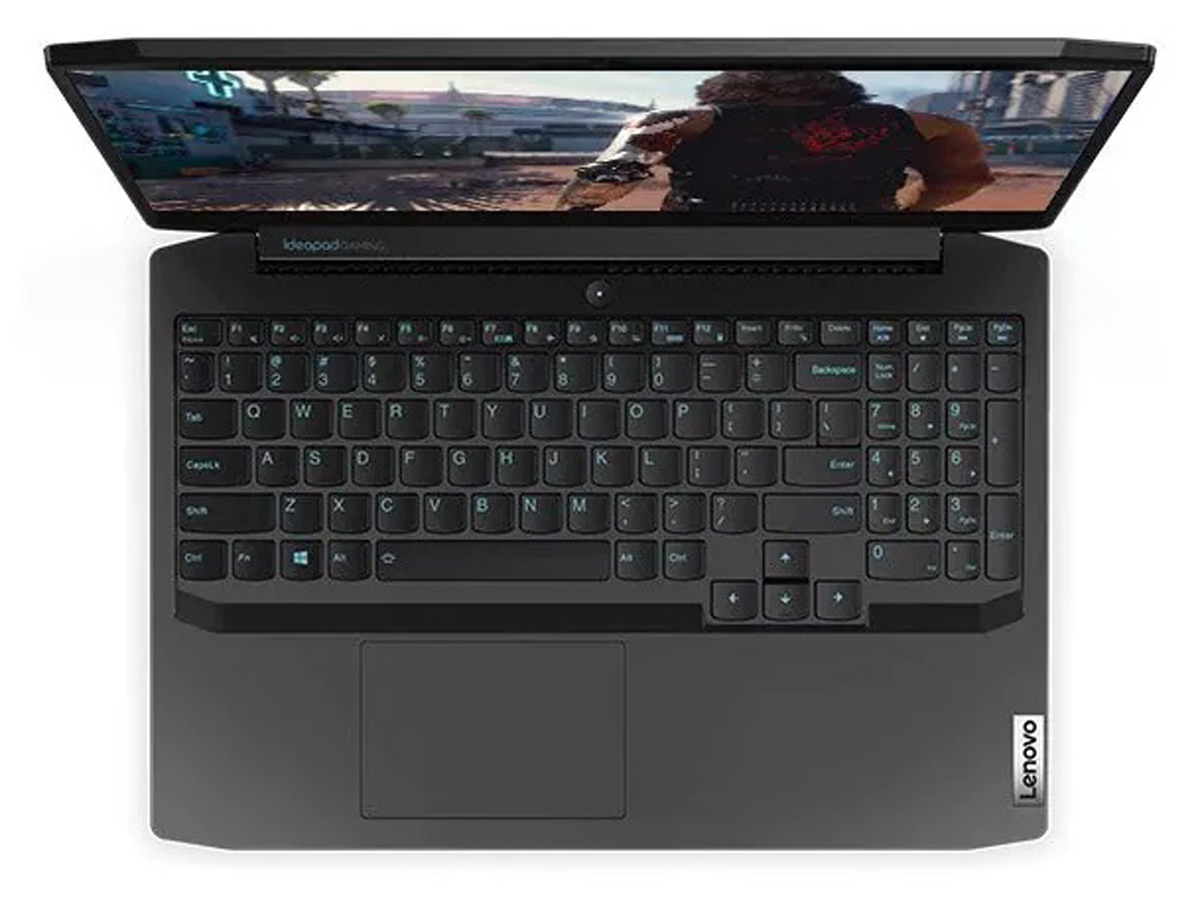
Périphériques d'entrée - Classic IdeaPad
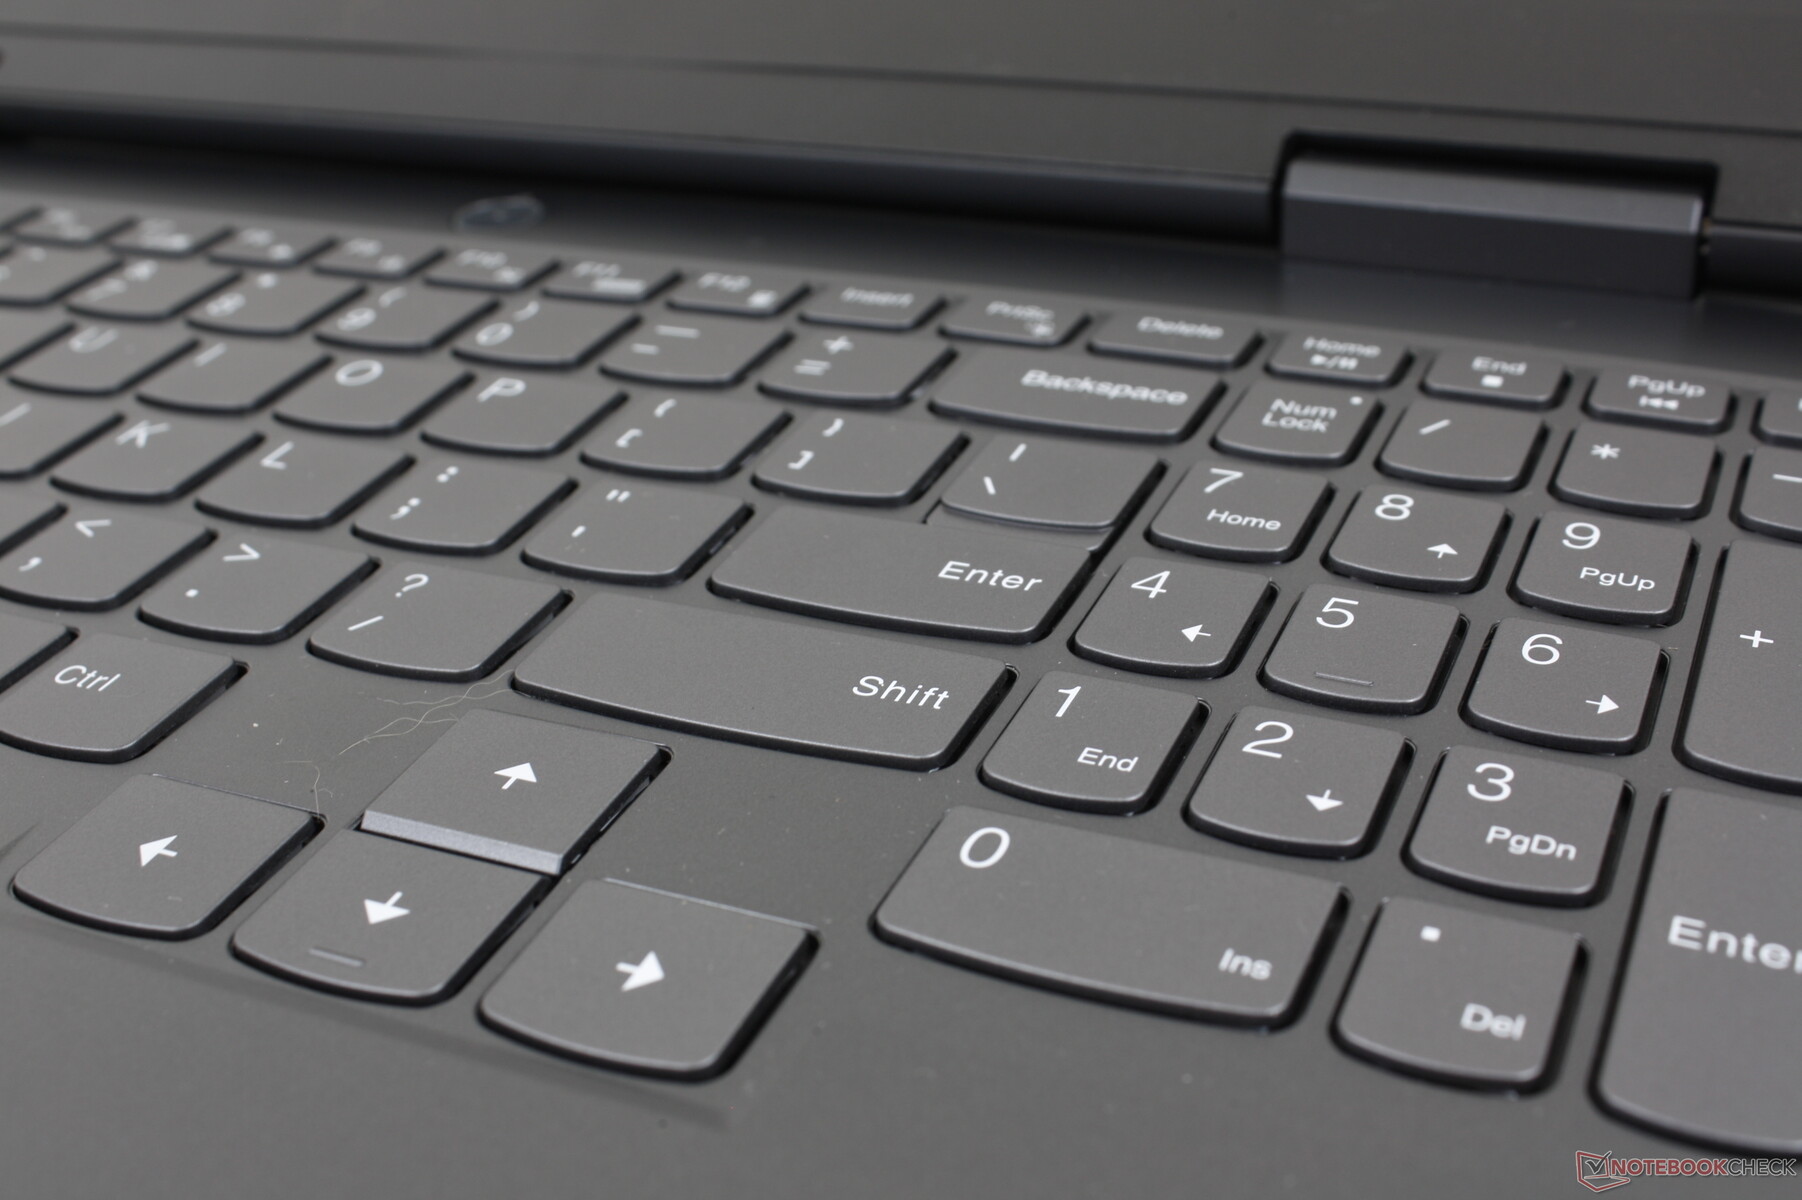
Clavier
Les lettres et les symboles sur chaque touche sont désormais blancs alors qu'ils étaient bleu clair sur l'IdeaPad Gaming 3i 2020. Sinon, la taille et la sensation des touches restent inchangées et l'expérience de frappe est essentiellement la même entre les deux modèles, malgré les changements de châssis. Les touches sont légères et peu profondes, ce qui les rend similaires à celles de nombreux Ultrabooks de milieu de gamme comme le VivoBook d'Asus ou l'IdeaPad standard.
Un rétroéclairage blanc à deux niveaux est fourni en standard pour éclairer l'impression sur chaque touche, y compris les petits symboles secondaires.
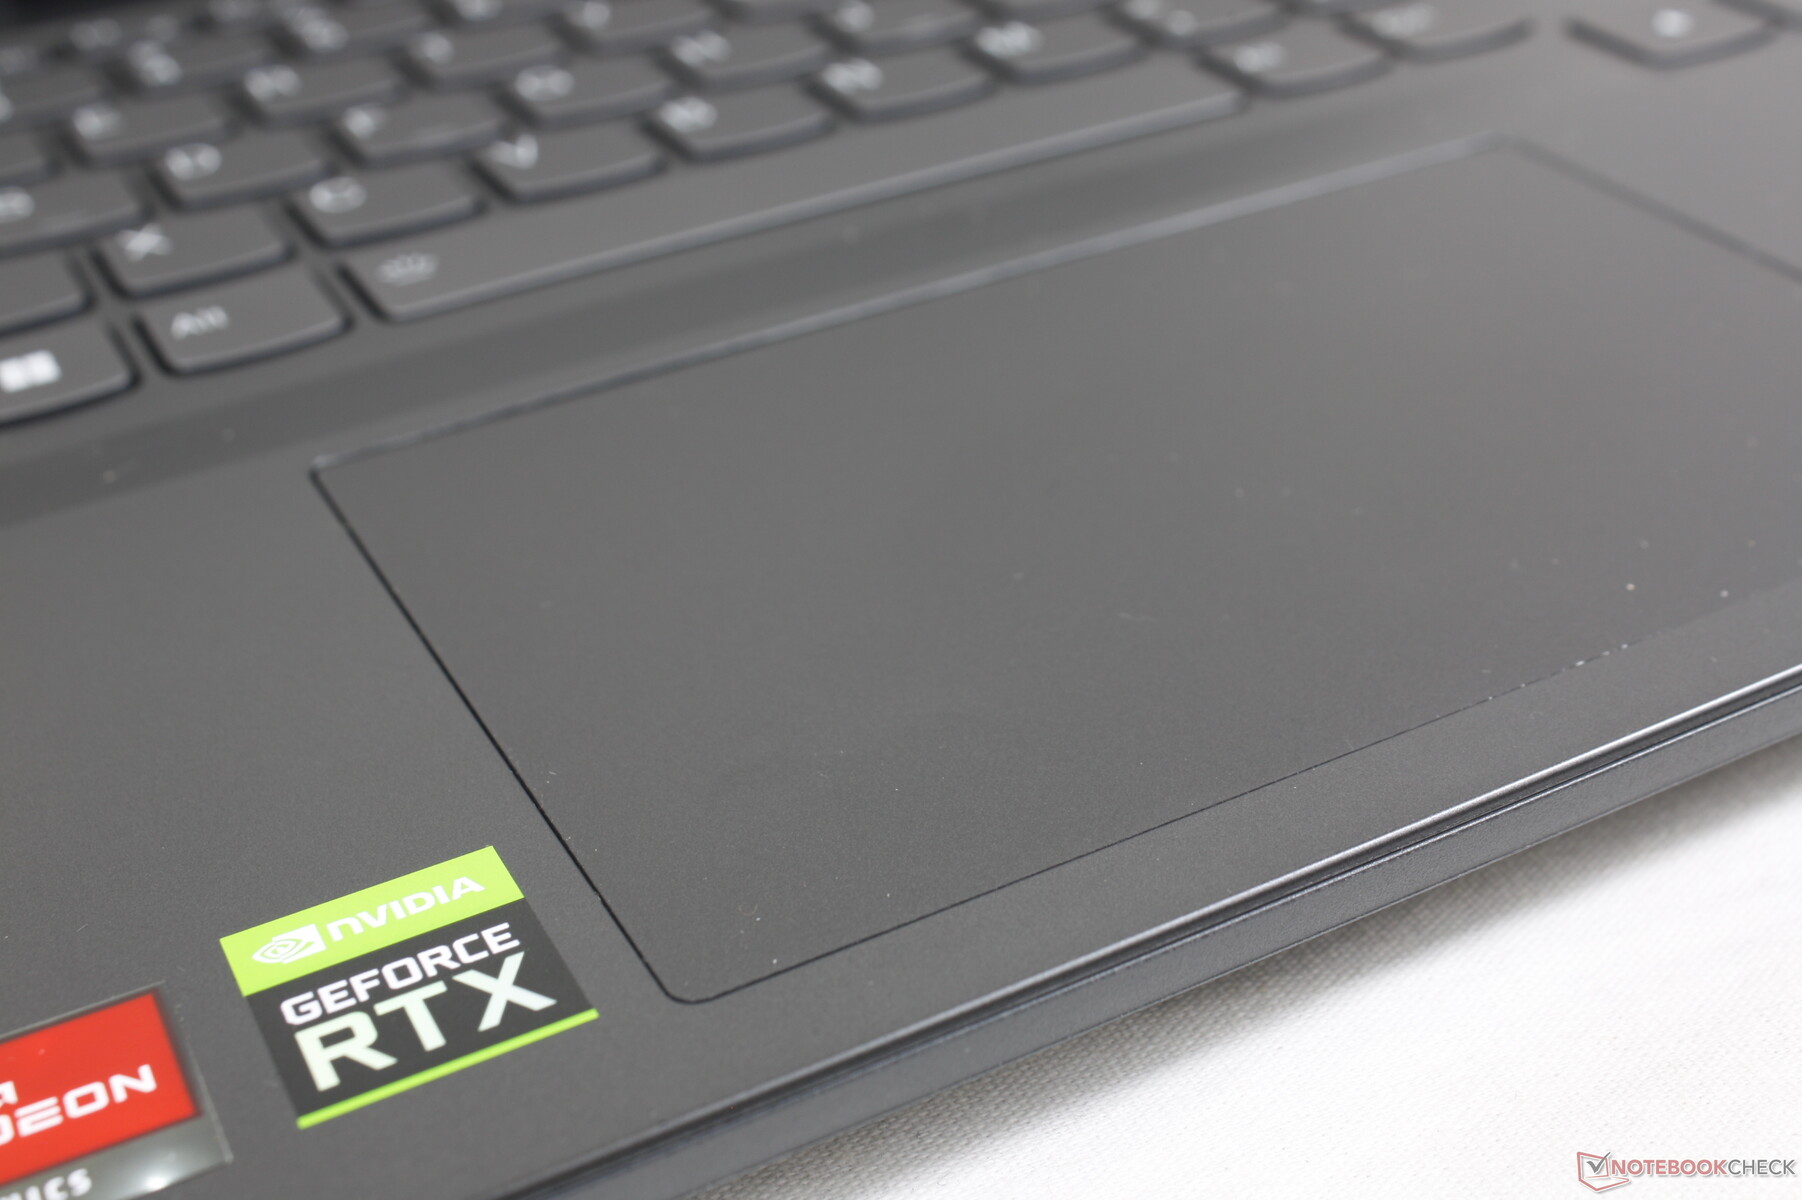
Pavé tactile
Le pavé tactile est plus grand que celui de l'ordinateur de bureau MSI Bravo 15 (12,5 x 7,5 cm contre 10,5 x 6,5 cm). Malheureusement, la traction et le retour d'information sont respectivement plus collants et plus spongieux que sur la plupart des autres ordinateurs portables, ce qui rend l'expérience utilisateur moins agréable. Le doigt colle souvent lorsqu'on glisse à vitesse moyenne et le clic n'est pas satisfaisant à cause du retour d'information spongieux.

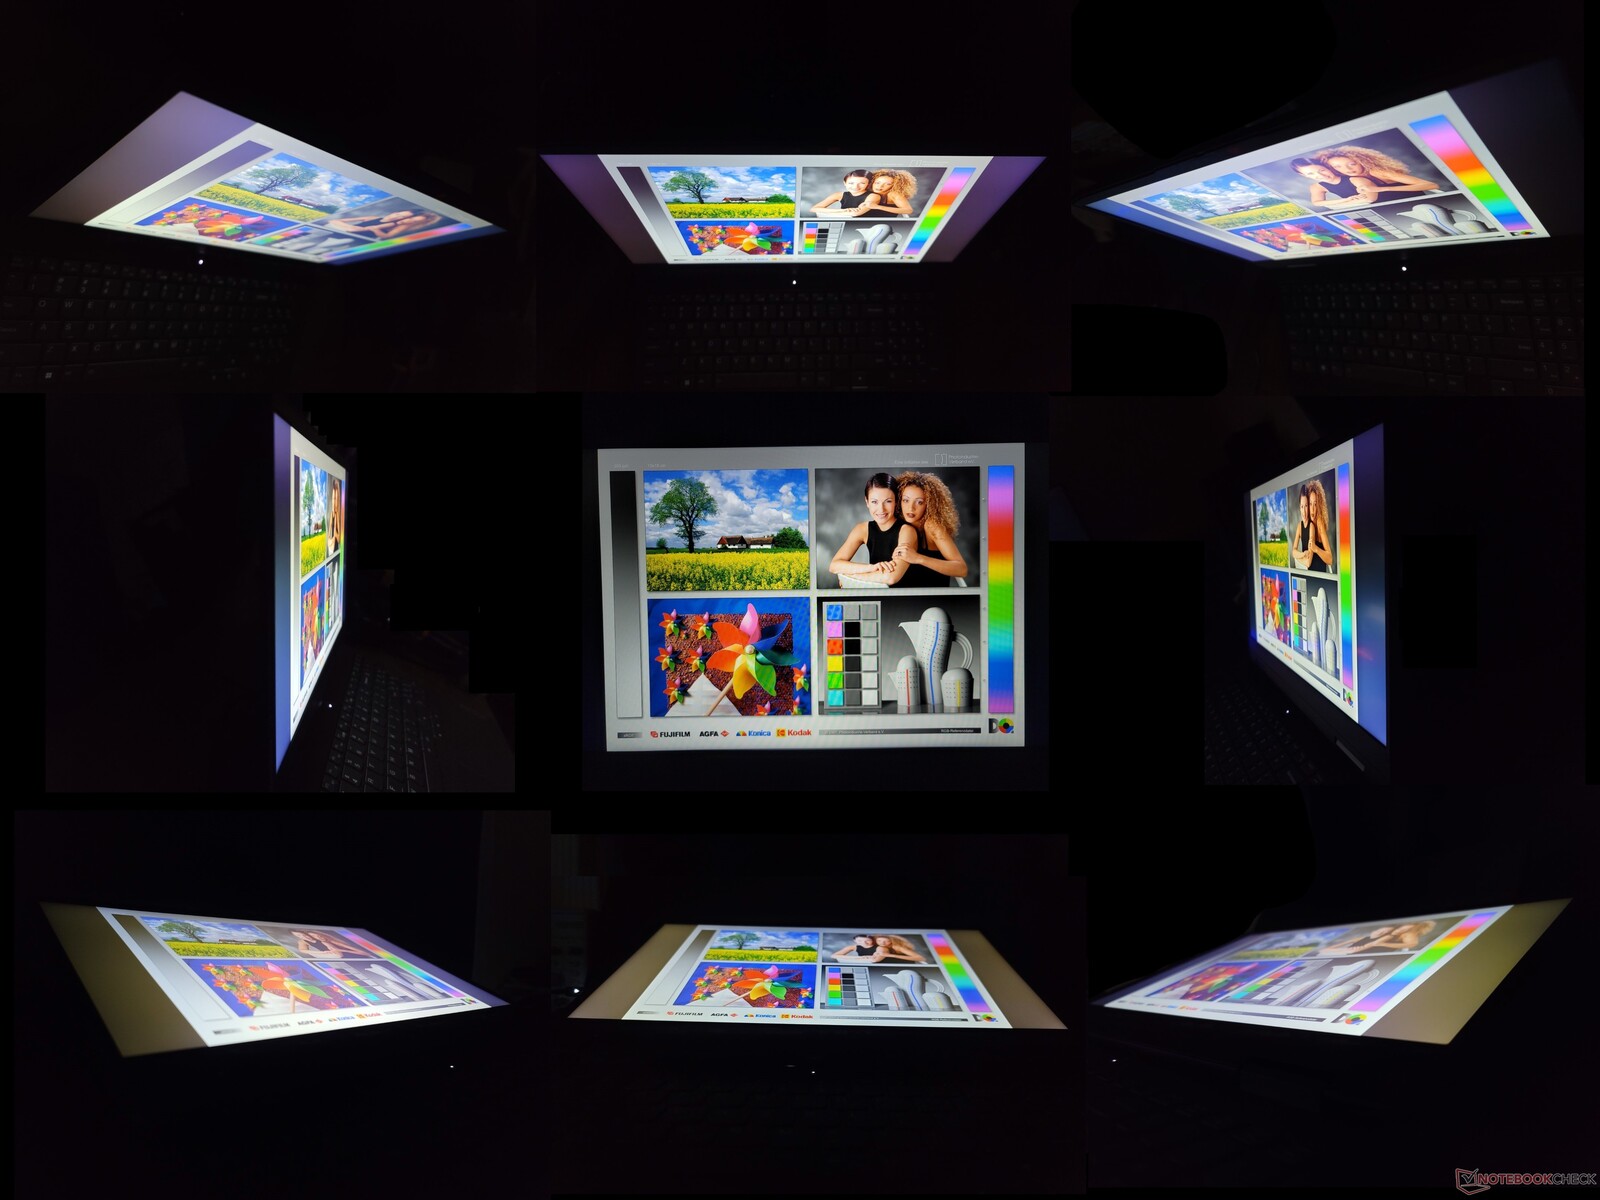
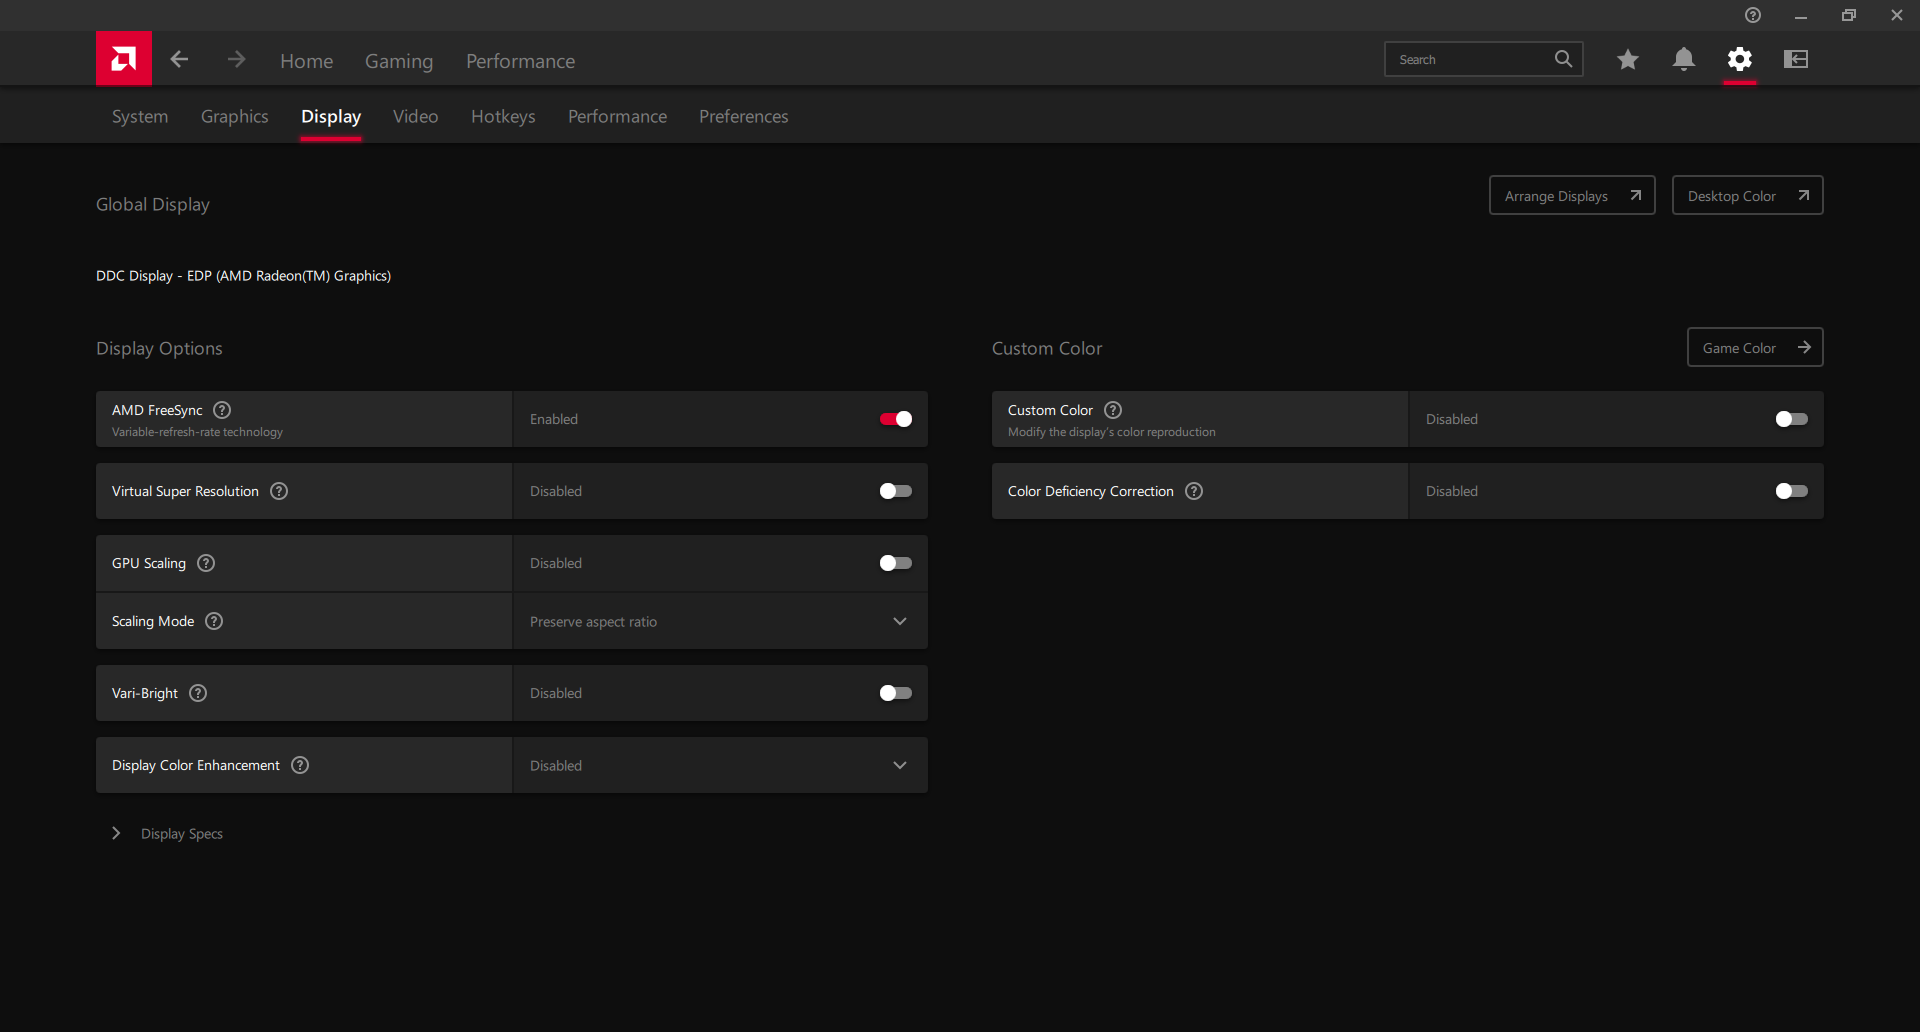
Affichage - FreeSync et 120 Hz en standard
Les caractéristiques positives de l'écran comprennent la prise en charge de la fréquence de rafraîchissement native de 120 Hz et de FreeSync. Les temps de réponse noir-blanc et gris-gris sont également corrects, avec environ 9 à 10 ms chacun. Pour les jeux, l'écran est très performant lorsqu'il s'agit de minimiser les images fantômes et le déchirement de l'écran.
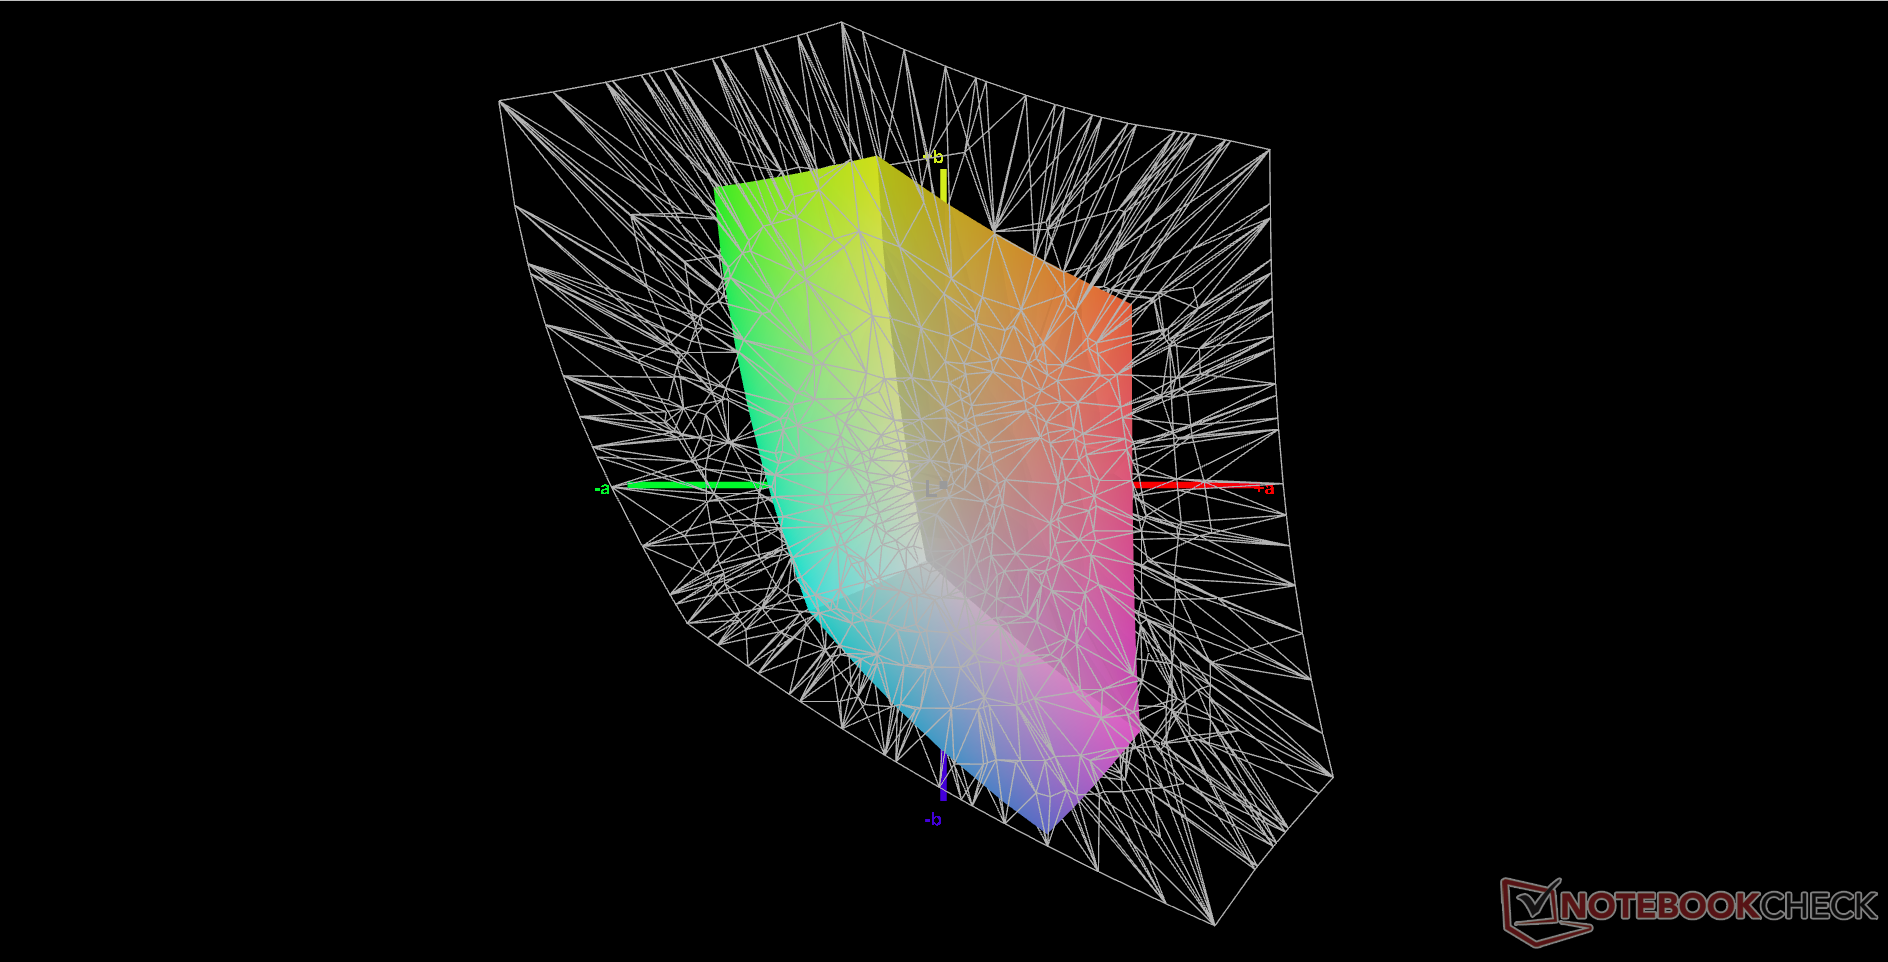
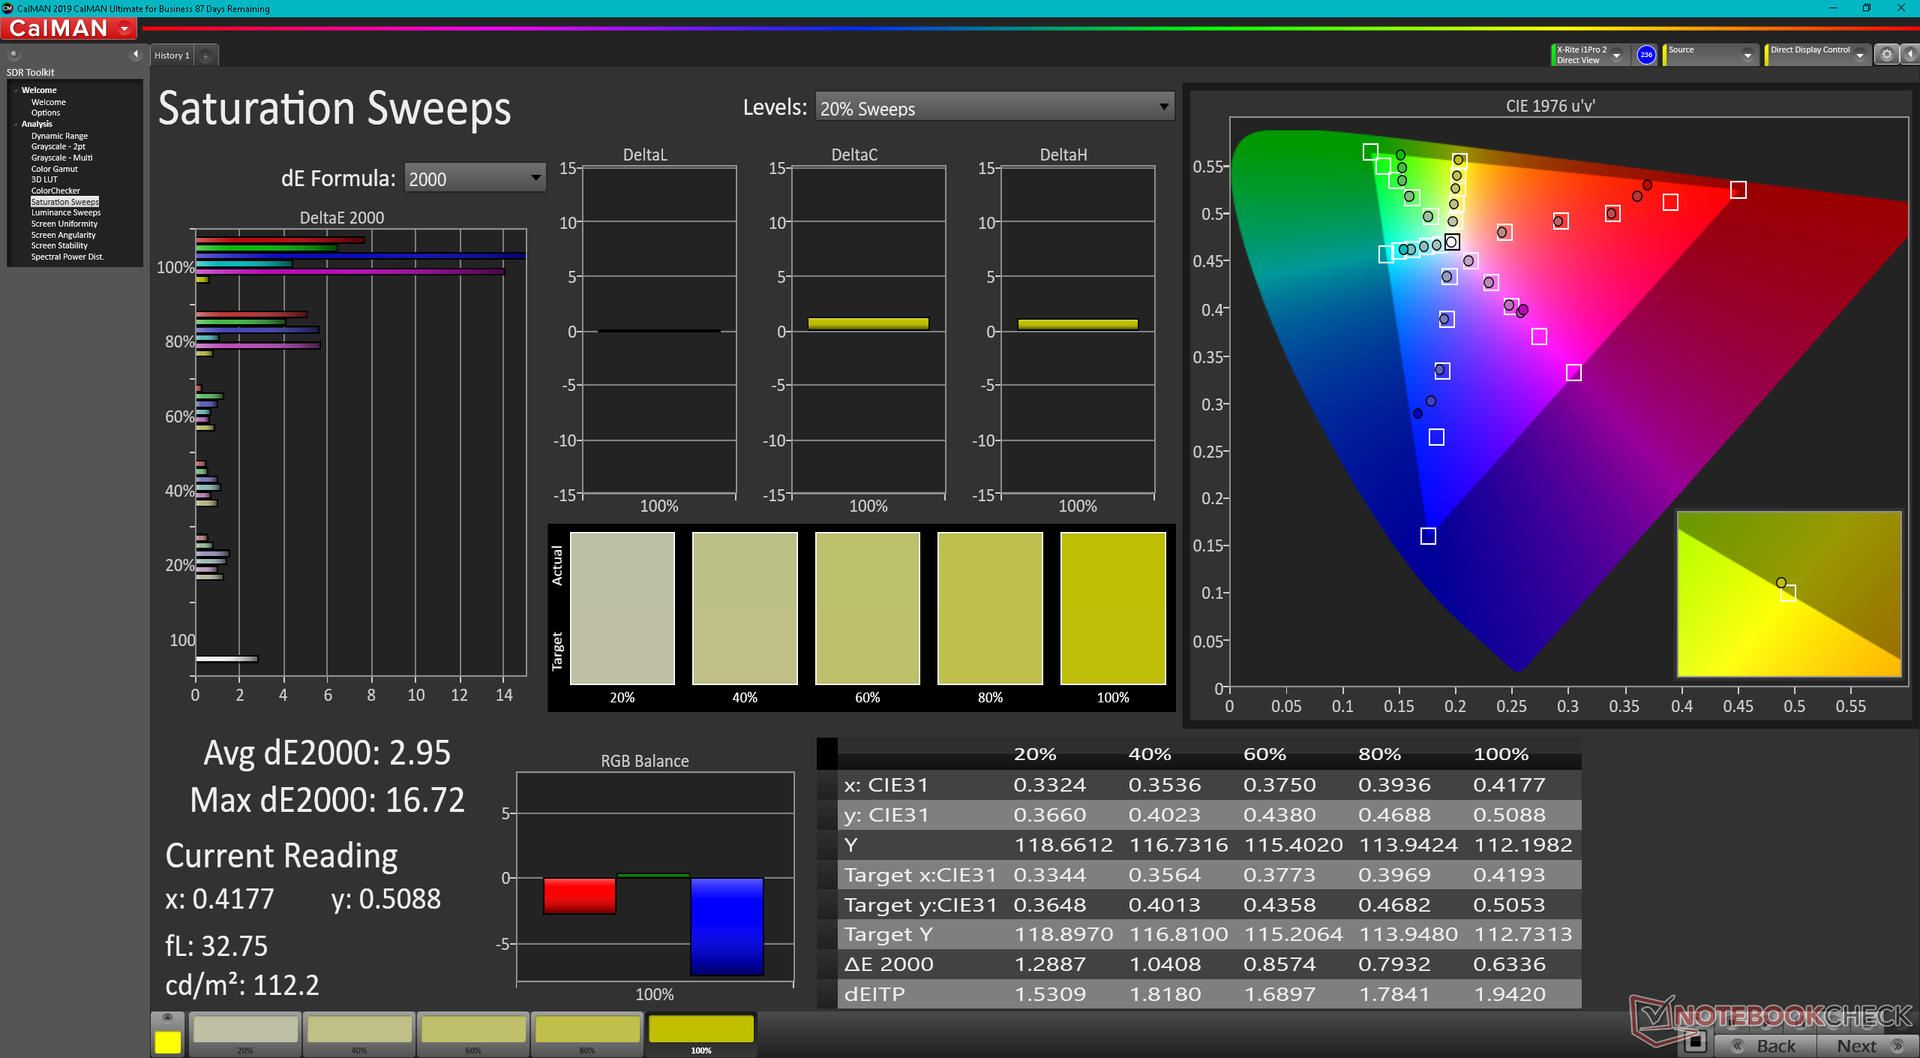
L'aspect le plus négatif de l'écran est son profil de couleurs limité à seulement 58 % de sRGB, ce qui indique qu'il s'agit d'un écran économique qui ne convient pas à la plupart des éditeurs. Lenovo souhaite que les utilisateurs passent à la série d'ordinateurs portables Legion pour obtenir de meilleures couleurs et un rétroéclairage plus lumineux, car il n'y a pas d'autres options d'affichage à choisir sur ce modèle IdeaPad.
Notez que si le panneau ici partage la même ID LEN156FHD que sur le ThinkBook 15 G4 ou IdeaPad 5 15ALC05ils sont néanmoins très différents sur certains points. Par exemple, les écrans des ThinkBook ou IdeaPad 5 susmentionnés ne prennent pas en charge la fréquence de 120 Hz ou FreeSync.


| |||||||||||||||||||||||||
Homogénéité de la luminosité: 86 %
Valeur mesurée au centre, sur batterie: 287.8 cd/m²
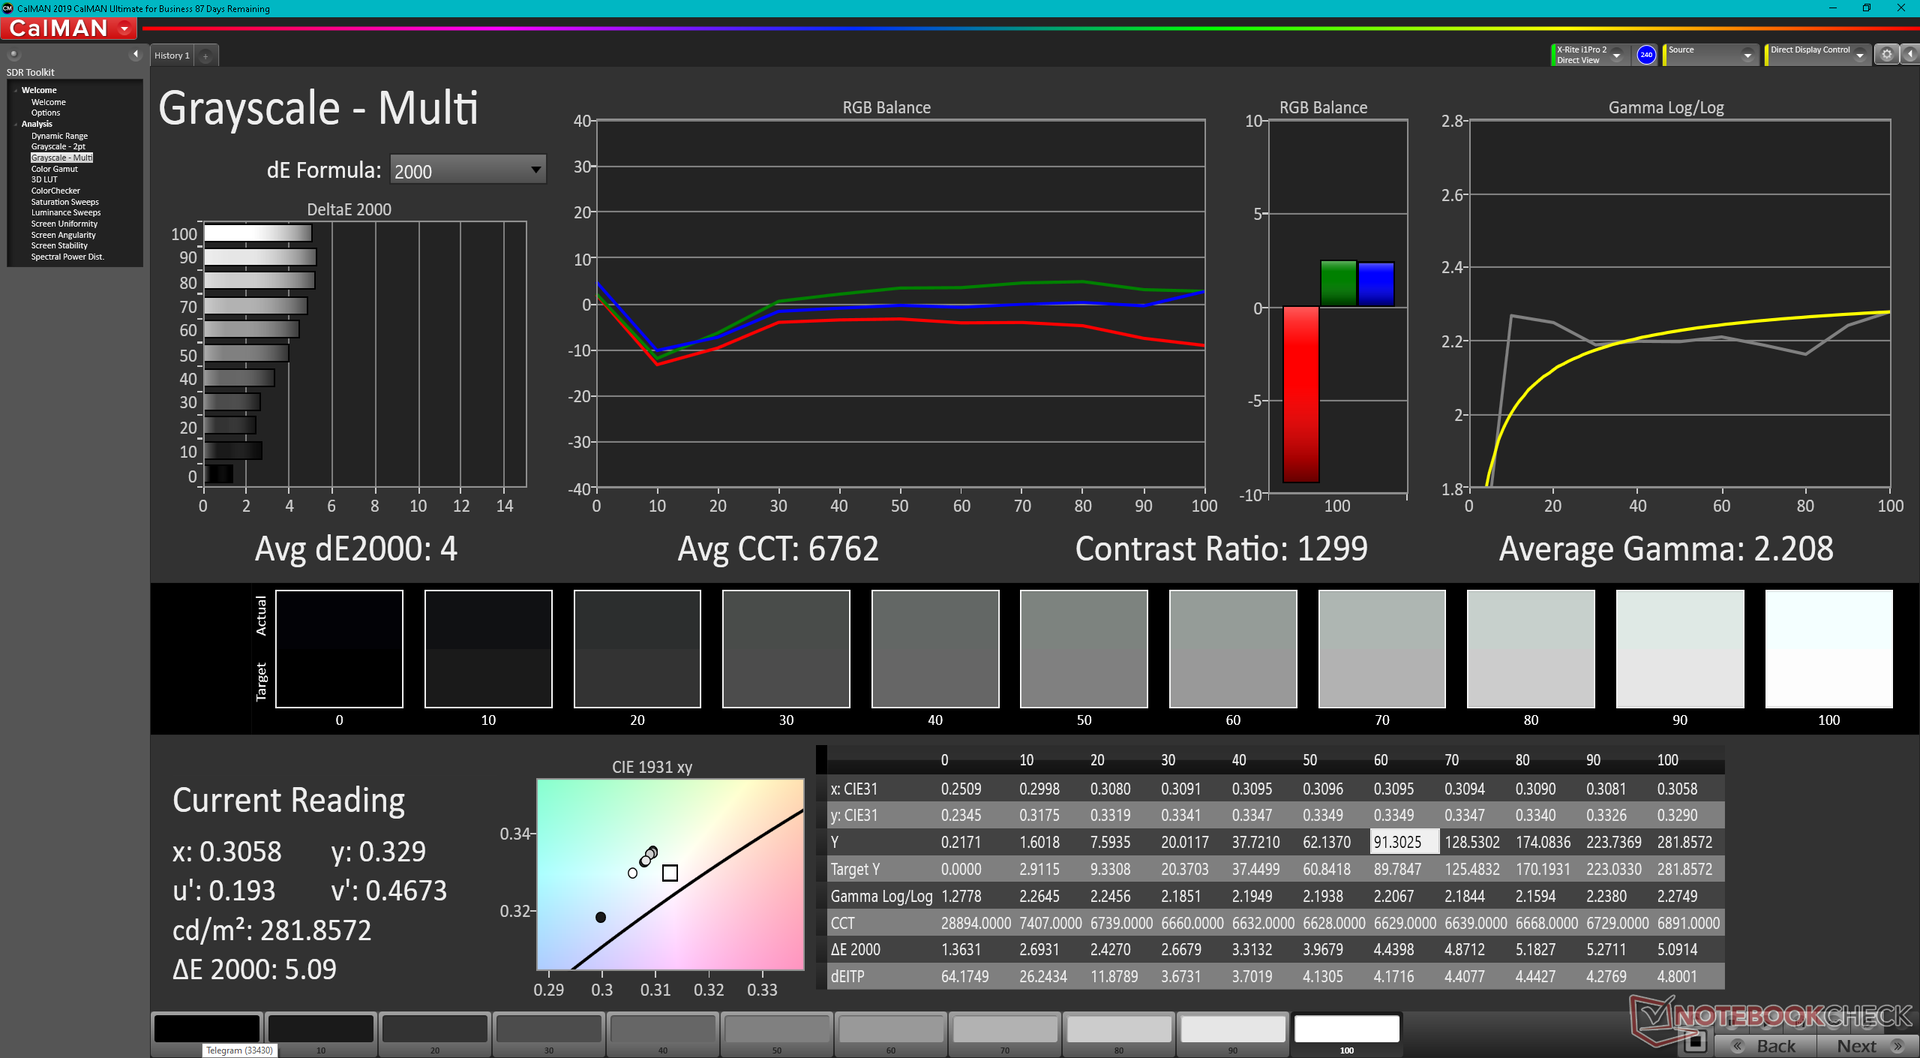
Contraste: 959:1 (Valeurs des noirs: 0.3 cd/m²)
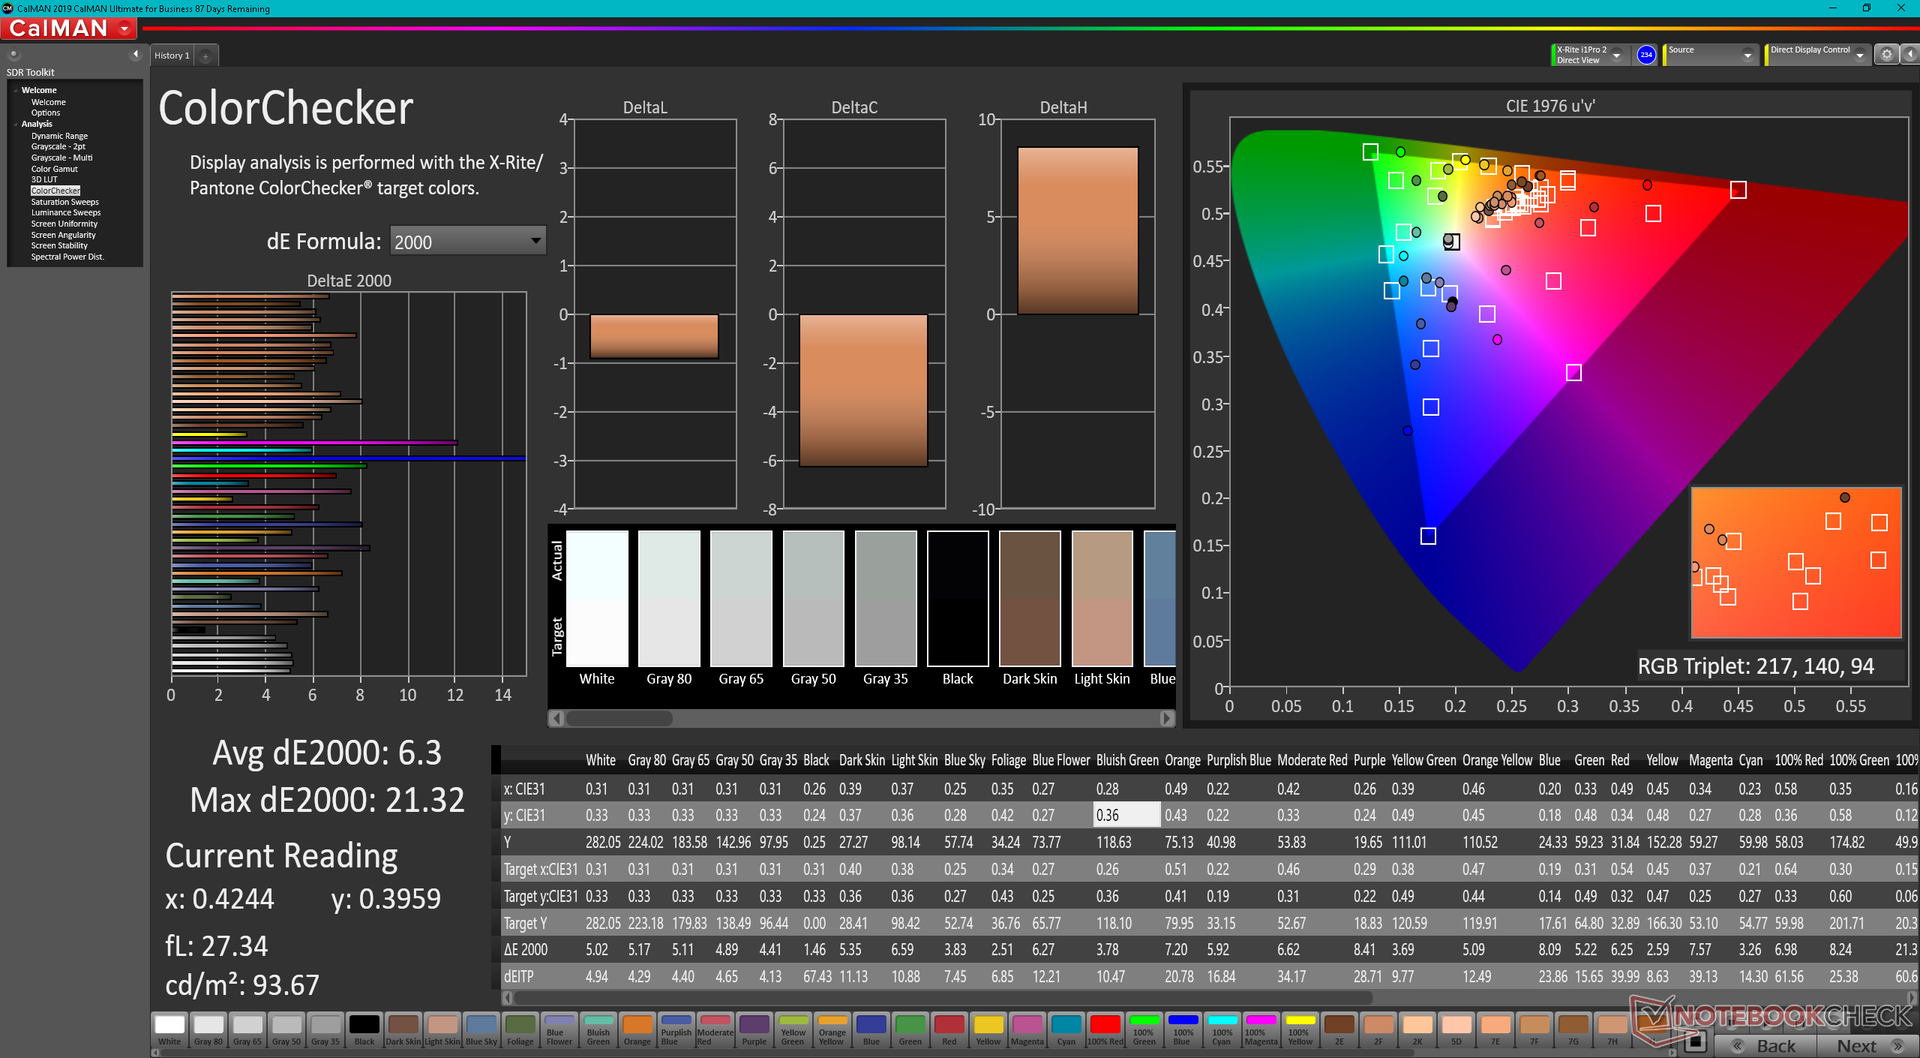
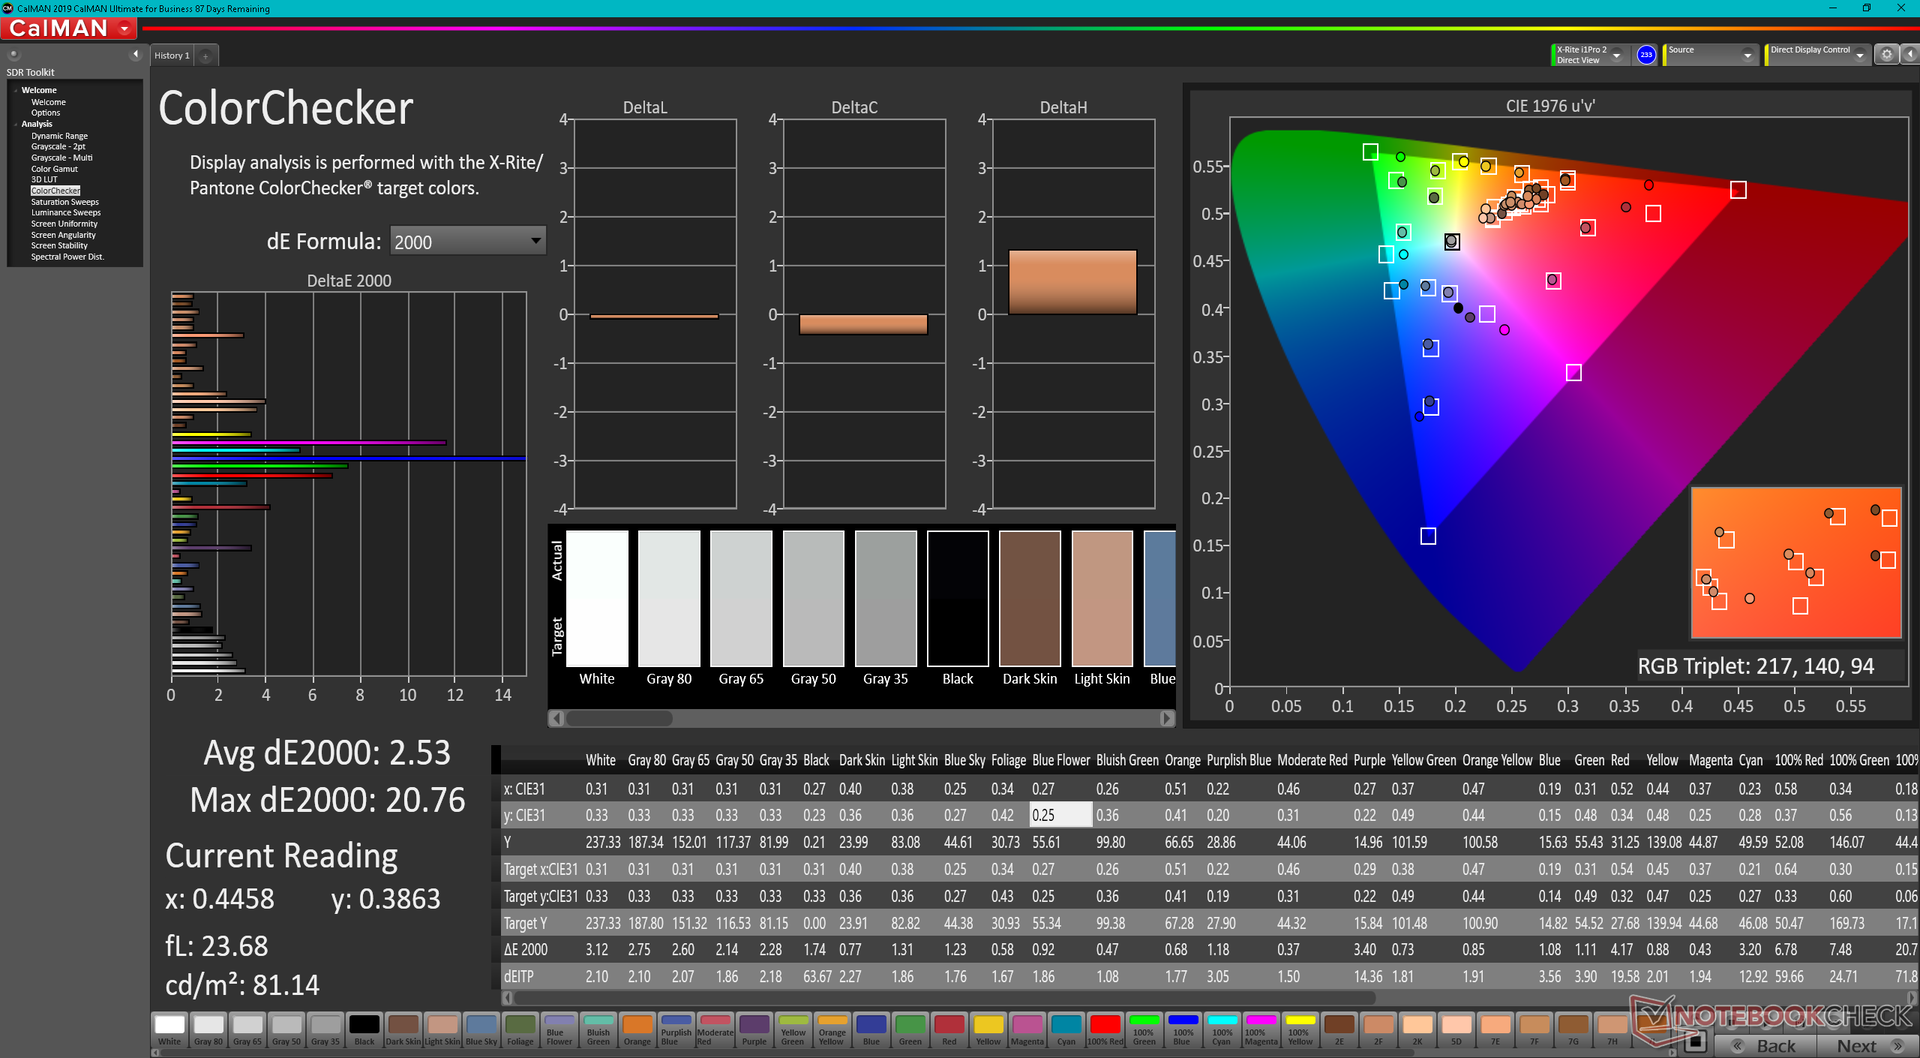
ΔE ColorChecker Calman: 6.3 | ∀{0.5-29.43 Ø4.73}
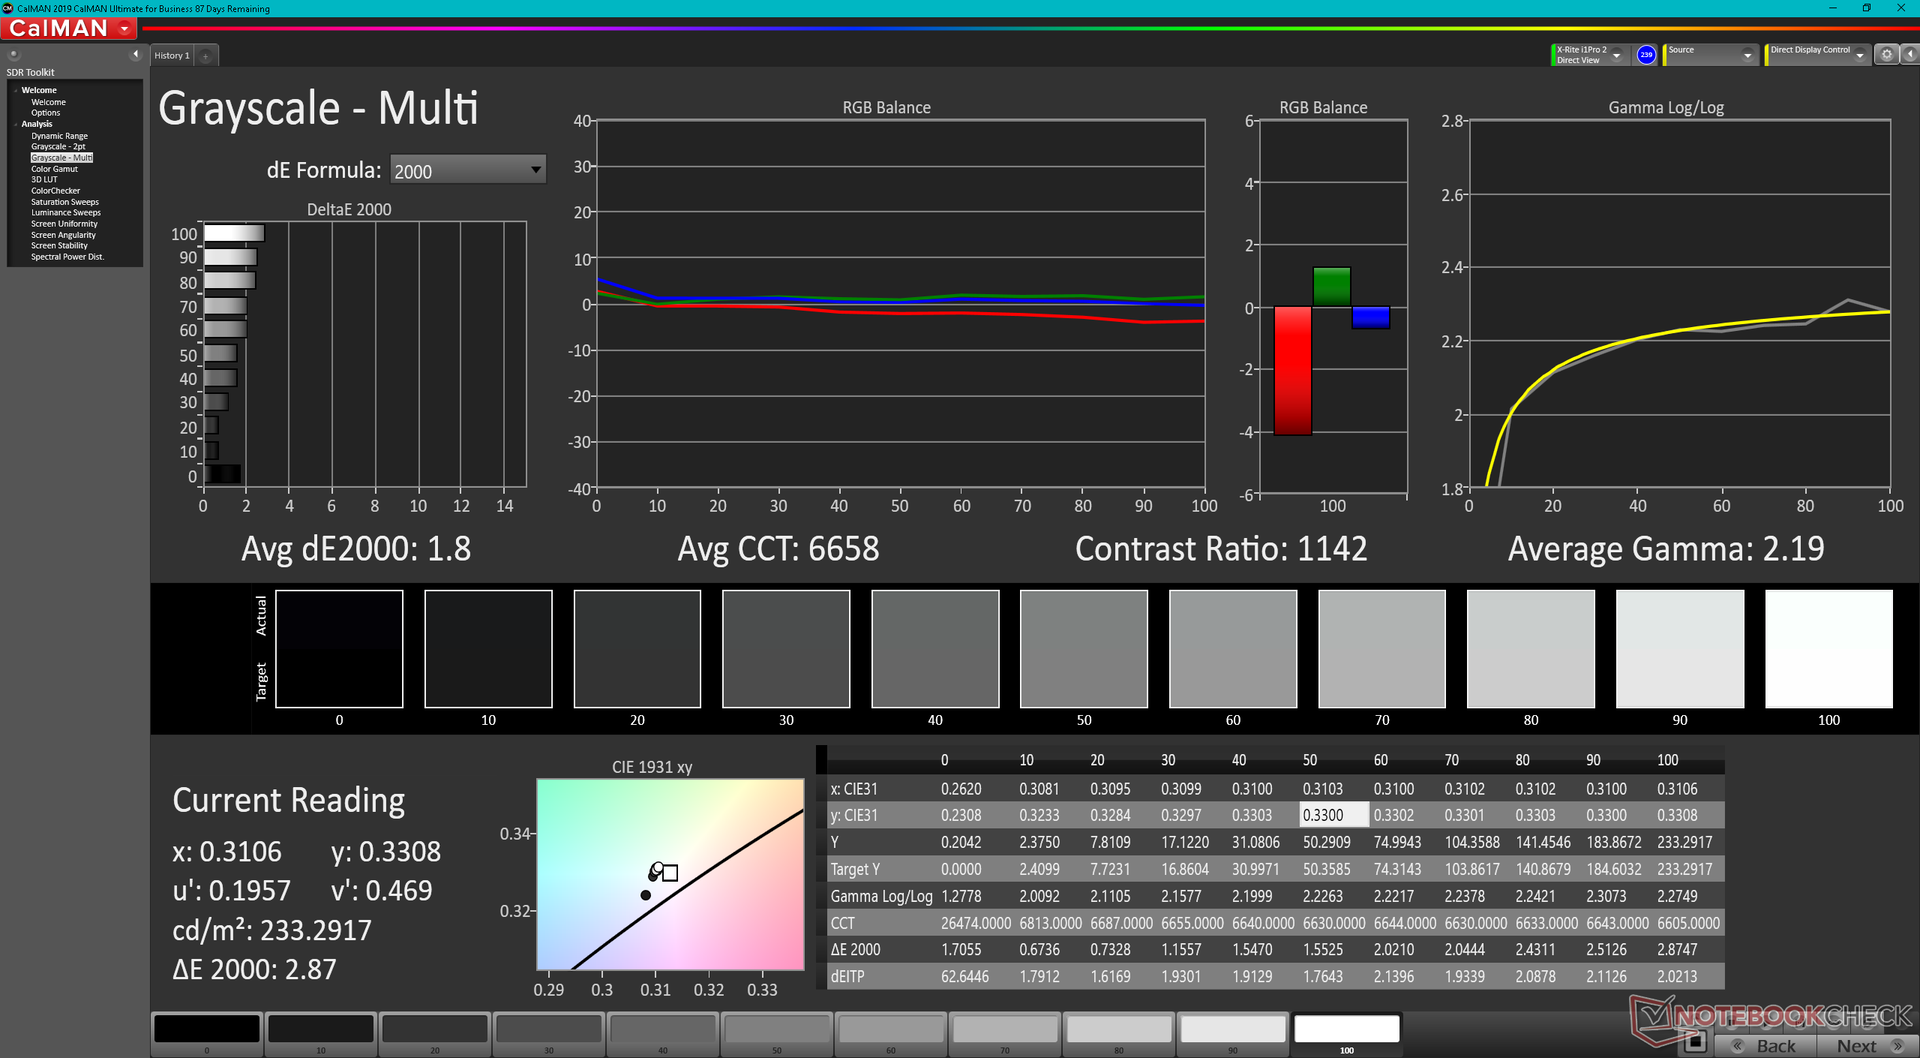
calibrated: 2.53
ΔE Greyscale Calman: 4 | ∀{0.09-98 Ø4.97}
40.7% AdobeRGB 1998 (Argyll 3D)
58% sRGB (Argyll 3D)
39.4% Display P3 (Argyll 3D)
Gamma: 2.21
CCT: 6762 K
| Lenovo IdeaPad Gaming 3 15ARH7 LEN156FHD, IPS, 1920x1080, 15.6" | Lenovo IdeaPad Gaming 3i 15IMH05 BOE CQ NV156FHM-NX1, IPS, 1920x1080, 15.6" | Lenovo Legion 5 15ACH6A-82NW0010GE LGD06A5, IPS, 1920x1080, 15.6" | Gigabyte A5 K1 BOEhydis NV156FHM-N4K (BOE08B3), IPS, 1920x1080, 15.6" | Asus TUF Dash F15 FX517ZR BOE CQ NE156QHM-NY1, IPS, 2560x1440, 15.6" | Dell G15 5510 YMHWH_156HRA (CMN1522), IPS, 1920x1080, 15.6" | |
|---|---|---|---|---|---|---|
| Display | -3% | 76% | 61% | 111% | 6% | |
| Display P3 Coverage (%) | 39.4 | 38.04 -3% | 71.1 80% | 64.4 63% | 98.4 150% | 41.6 6% |
| sRGB Coverage (%) | 58 | 56.6 -2% | 99.1 71% | 92.5 59% | 99.9 72% | 62.2 7% |
| AdobeRGB 1998 Coverage (%) | 40.7 | 39.3 -3% | 72.3 78% | 66.1 62% | 85.9 111% | 43 6% |
| Response Times | -6% | 48% | 39% | 61% | -37% | |
| Response Time Grey 50% / Grey 80% * (ms) | 20.8 ? | 25 ? -20% | 15 ? 28% | 14.5 ? 30% | 5.6 ? 73% | 33.3 ? -60% |
| Response Time Black / White * (ms) | 18.4 ? | 17 ? 8% | 6 ? 67% | 9.5 ? 48% | 9.4 ? 49% | 20.7 ? -13% |
| PWM Frequency (Hz) | ||||||
| Screen | -16% | 24% | 19% | 31% | 12% | |
| Brightness middle (cd/m²) | 287.8 | 305 6% | 371 29% | 295 3% | 286 -1% | 288 0% |
| Brightness (cd/m²) | 268 | 294 10% | 328 22% | 281 5% | 266 -1% | 264 -1% |
| Brightness Distribution (%) | 86 | 70 -19% | 85 -1% | 83 -3% | 87 1% | 88 2% |
| Black Level * (cd/m²) | 0.3 | 0.405 -35% | 0.32 -7% | 0.29 3% | 0.25 17% | 0.24 20% |
| Contrast (:1) | 959 | 753 -21% | 1159 21% | 1017 6% | 1144 19% | 1200 25% |
| Colorchecker dE 2000 * | 6.3 | 6.01 5% | 3.25 48% | 4.36 31% | 2.14 66% | 3.67 42% |
| Colorchecker dE 2000 max. * | 21.32 | 21.9 -3% | 6.33 70% | 6.92 68% | 5.22 76% | 18.12 15% |
| Colorchecker dE 2000 calibrated * | 2.53 | 5.12 -102% | 1.11 56% | 1.2 53% | 0.67 74% | 3.22 -27% |
| Greyscale dE 2000 * | 4 | 3.23 19% | 4.94 -24% | 3.9 2% | 2.8 30% | 2.6 35% |
| Gamma | 2.21 100% | 2.43 91% | 2.45 90% | 2.106 104% | 2.23 99% | 2.187 101% |
| CCT | 6762 96% | 6818 95% | 6064 107% | 7300 89% | 7092 92% | 6971 93% |
| Color Space (Percent of AdobeRGB 1998) (%) | 36 | |||||
| Color Space (Percent of sRGB) (%) | 56 | |||||
| Moyenne finale (programmes/paramètres) | -8% /
-11% | 49% /
38% | 40% /
31% | 68% /
53% | -6% /
4% |
* ... Moindre est la valeur, meilleures sont les performances
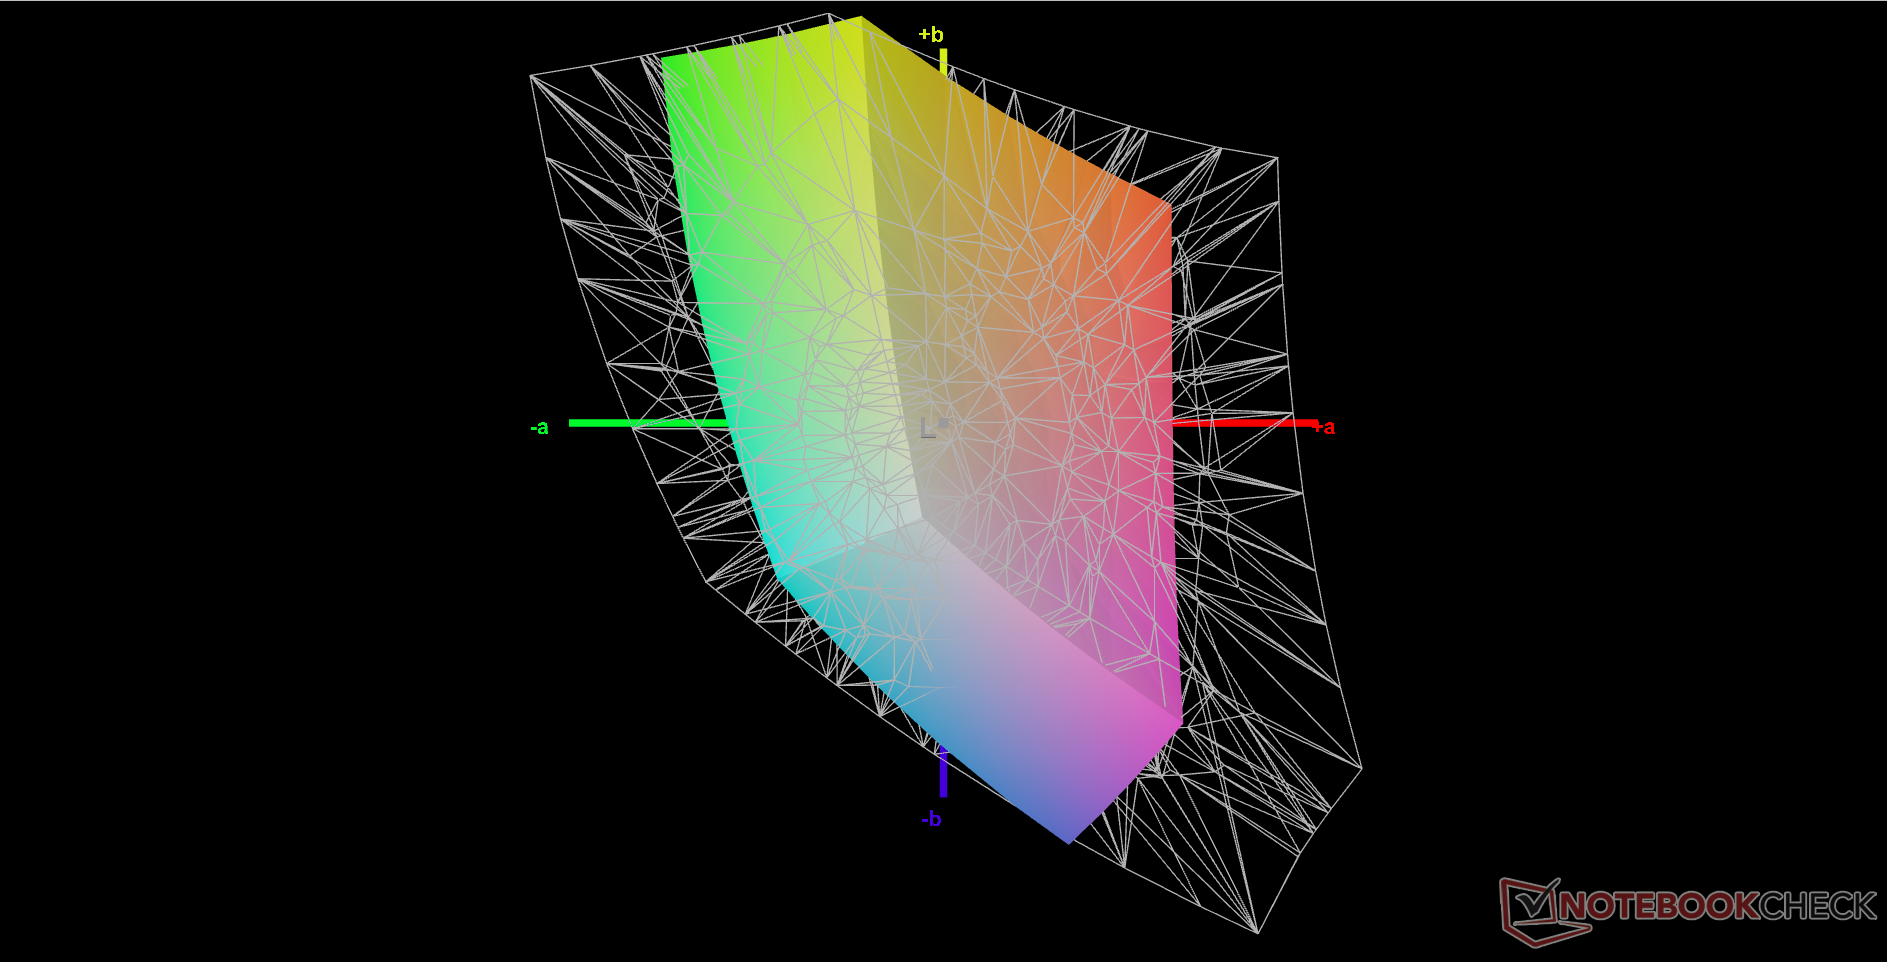
L'écran n'est pas calibré en usine, ce qui est normal pour un ordinateur portable de jeu à petit budget. Néanmoins, les valeurs moyennes du deltaE des niveaux de gris et des couleurs ne sont pas terribles, respectivement 4 et 6,3. En calibrant l'écran nous-mêmes, nous pourrions améliorer ces valeurs à 1,8 et 2,53, respectivement, mais les couleurs saturées restent très imprécises en raison de la gamme étroite mentionnée ci-dessus.

Temps de réponse de l'écran
| ↔ Temps de réponse noir à blanc | ||
|---|---|---|
| 18.4 ms ... hausse ↗ et chute ↘ combinées | ↗ 10 ms hausse | 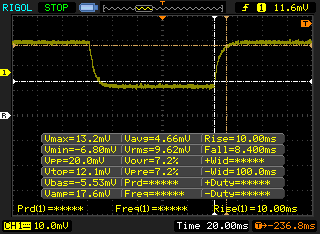 |
| ↘ 8.4 ms chute | ||
| L'écran montre de bons temps de réponse, mais insuffisant pour du jeu compétitif. En comparaison, tous les appareils testés affichent entre 0.1 (minimum) et 240 (maximum) ms. » 41 % des appareils testés affichent de meilleures performances. Cela signifie que les latences relevées sont similaires à la moyenne (19.9 ms) de tous les appareils testés. | ||
| ↔ Temps de réponse gris 50% à gris 80% | ||
| 20.8 ms ... hausse ↗ et chute ↘ combinées | ↗ 11.2 ms hausse | 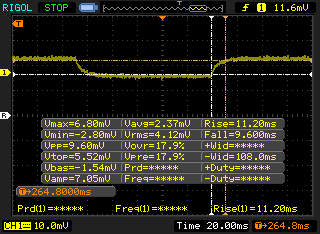 |
| ↘ 9.6 ms chute | ||
| L'écran montre de bons temps de réponse, mais insuffisant pour du jeu compétitif. En comparaison, tous les appareils testés affichent entre 0.165 (minimum) et 636 (maximum) ms. » 33 % des appareils testés affichent de meilleures performances. Cela signifie que les latences relevées sont meilleures que la moyenne (31.1 ms) de tous les appareils testés. | ||
Scintillement / MLI (Modulation de largeur d'impulsion)
| Scintillement / MLI (Modulation de largeur d'impulsion) non décelé |  | ||
En comparaison, 52 % des appareils testés n'emploient pas MDI pour assombrir leur écran. Nous avons relevé une moyenne à 7798 (minimum : 5 - maximum : 343500) Hz dans le cas où une MDI était active. | |||
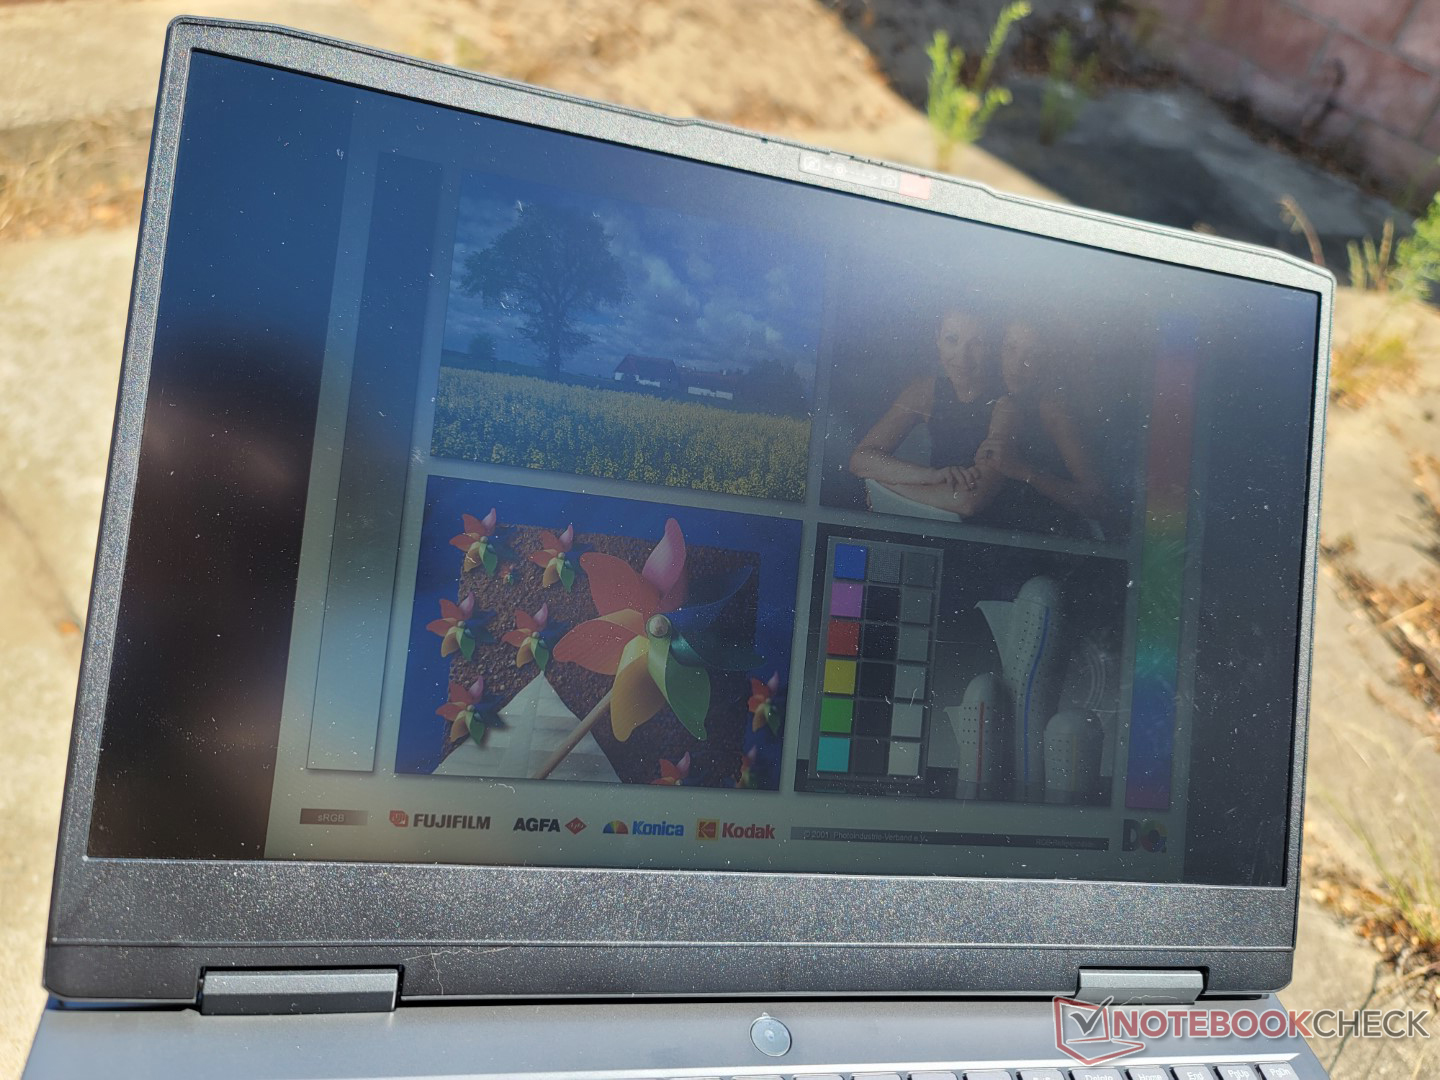
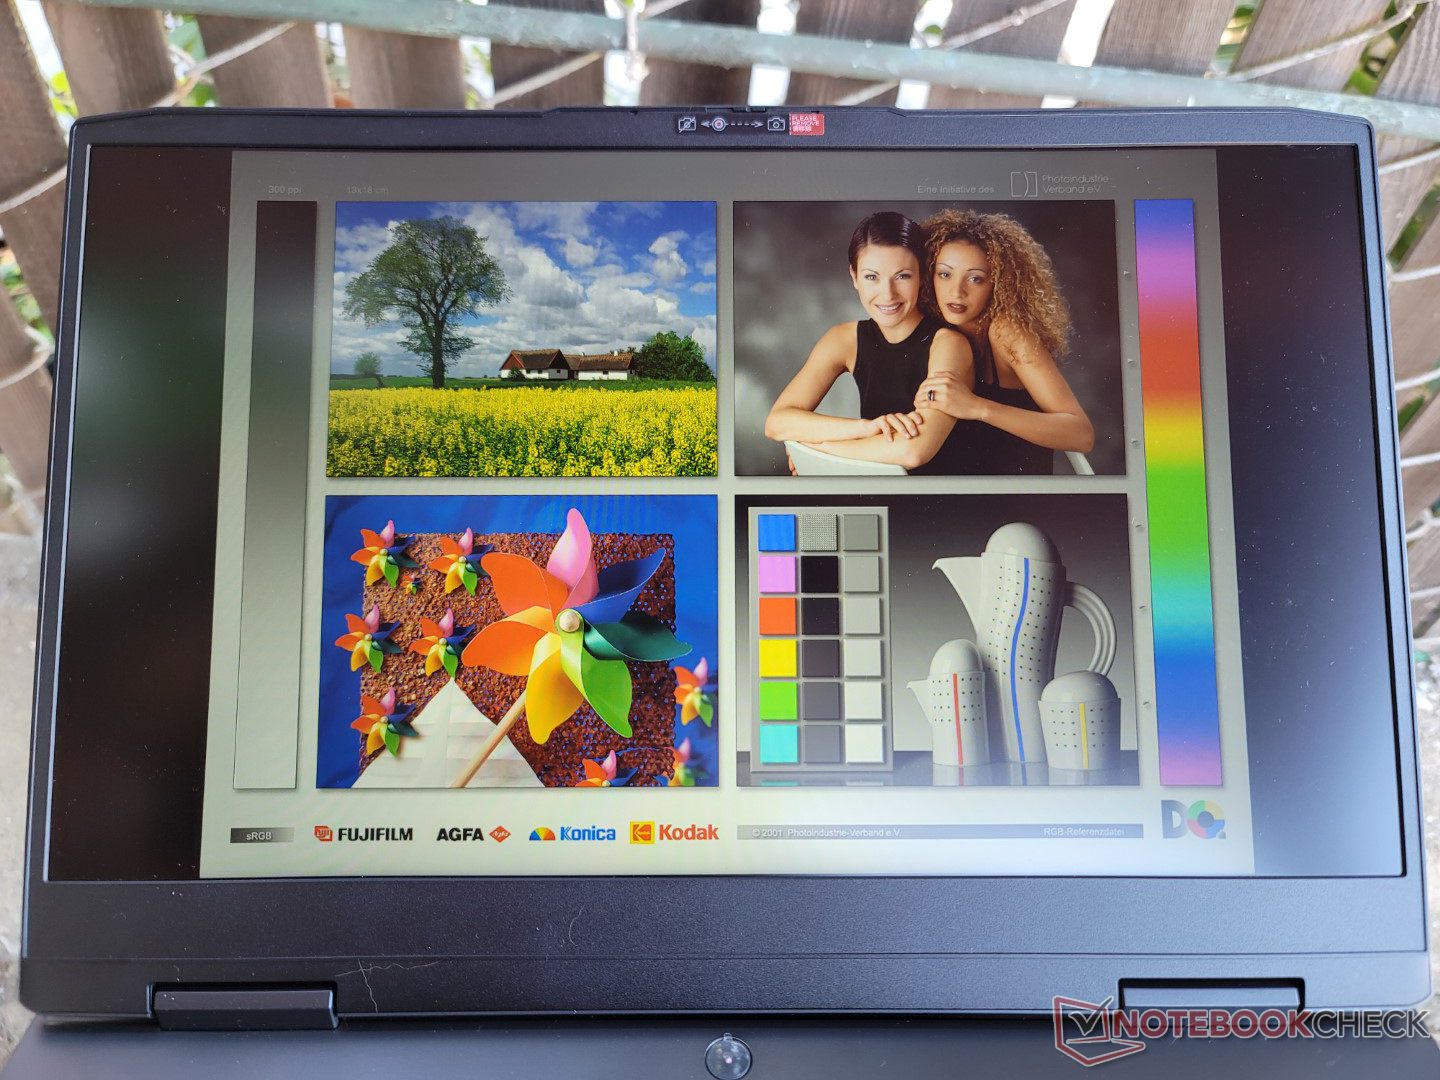
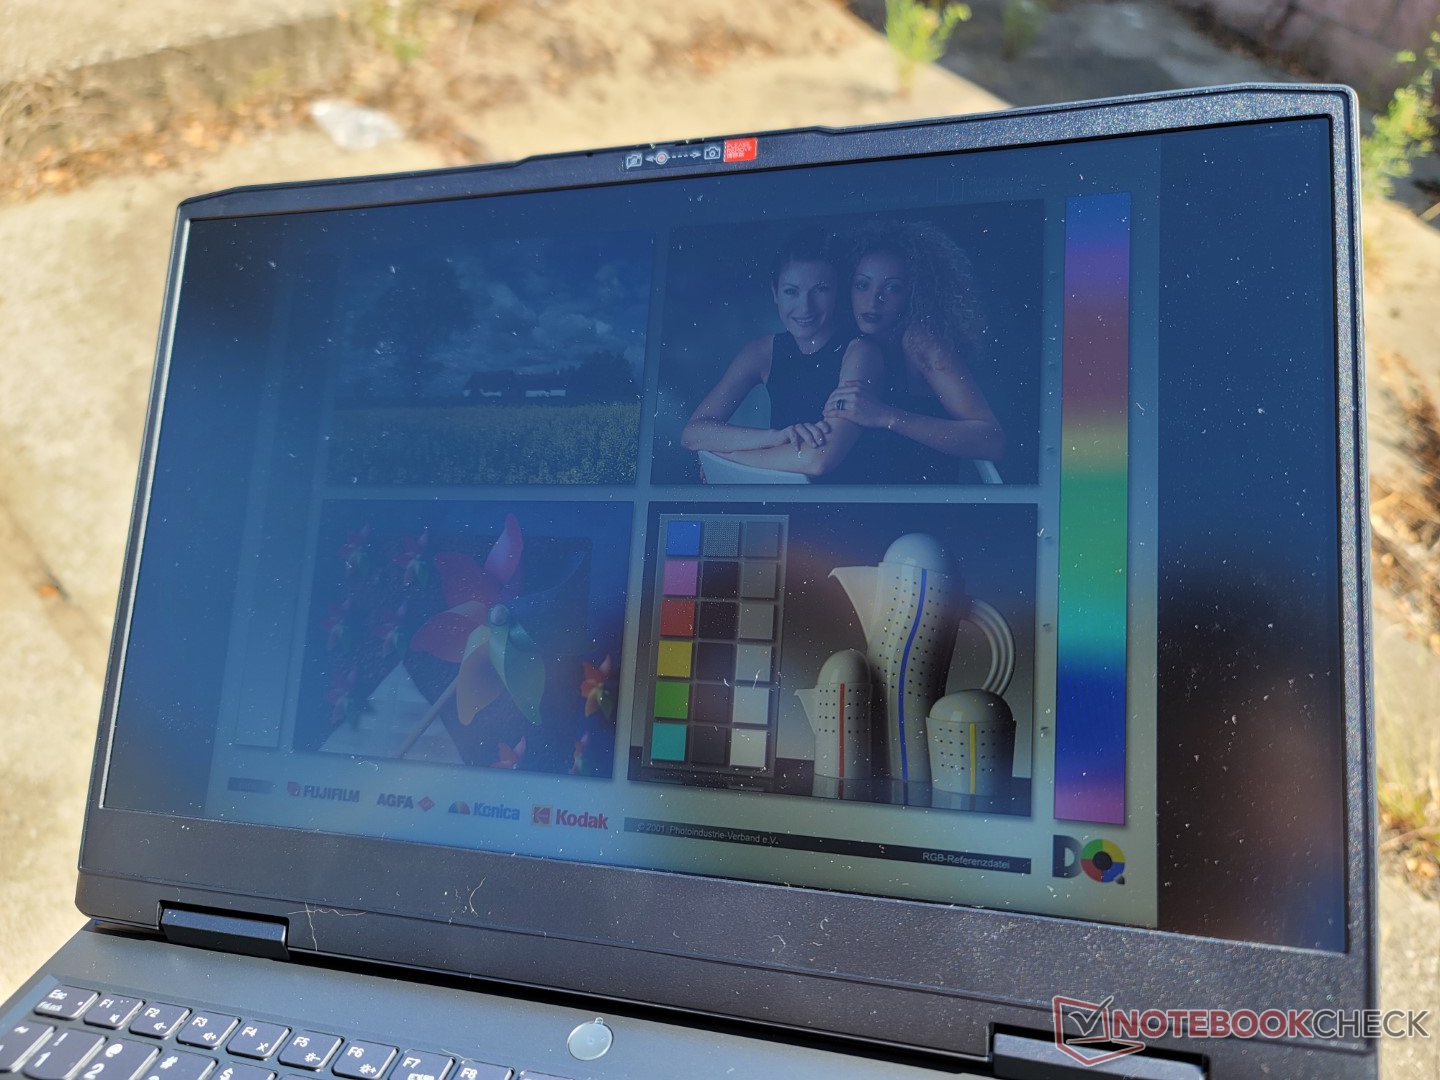
La visibilité en extérieur n'est ni meilleure ni pire que celle de la plupart des autres ordinateurs portables de jeu bon marché ou même haut de gamme, car ces types de systèmes ne sont pas conçus pour être utilisés en extérieur de manière fréquente. Vous devrez travailler à l'ombre si possible, sinon l'écran sera délavé.
Performance
Conditions d'essai
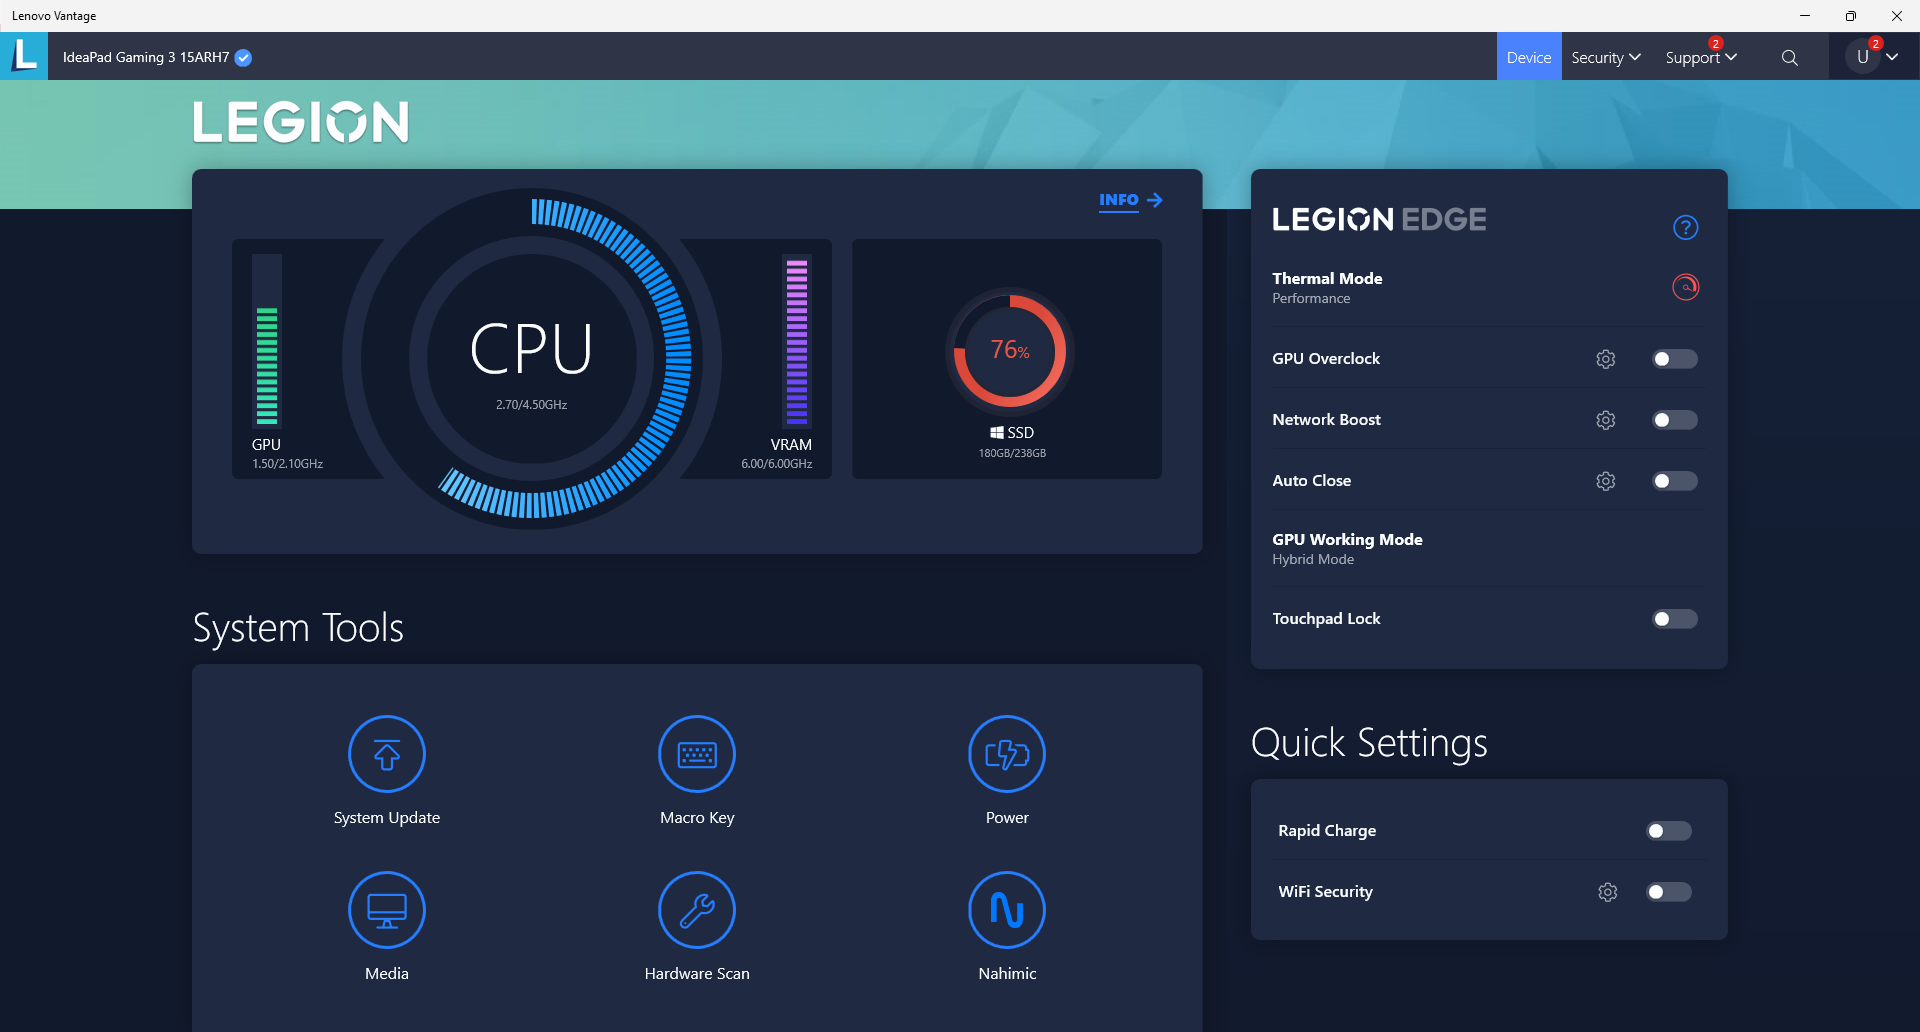
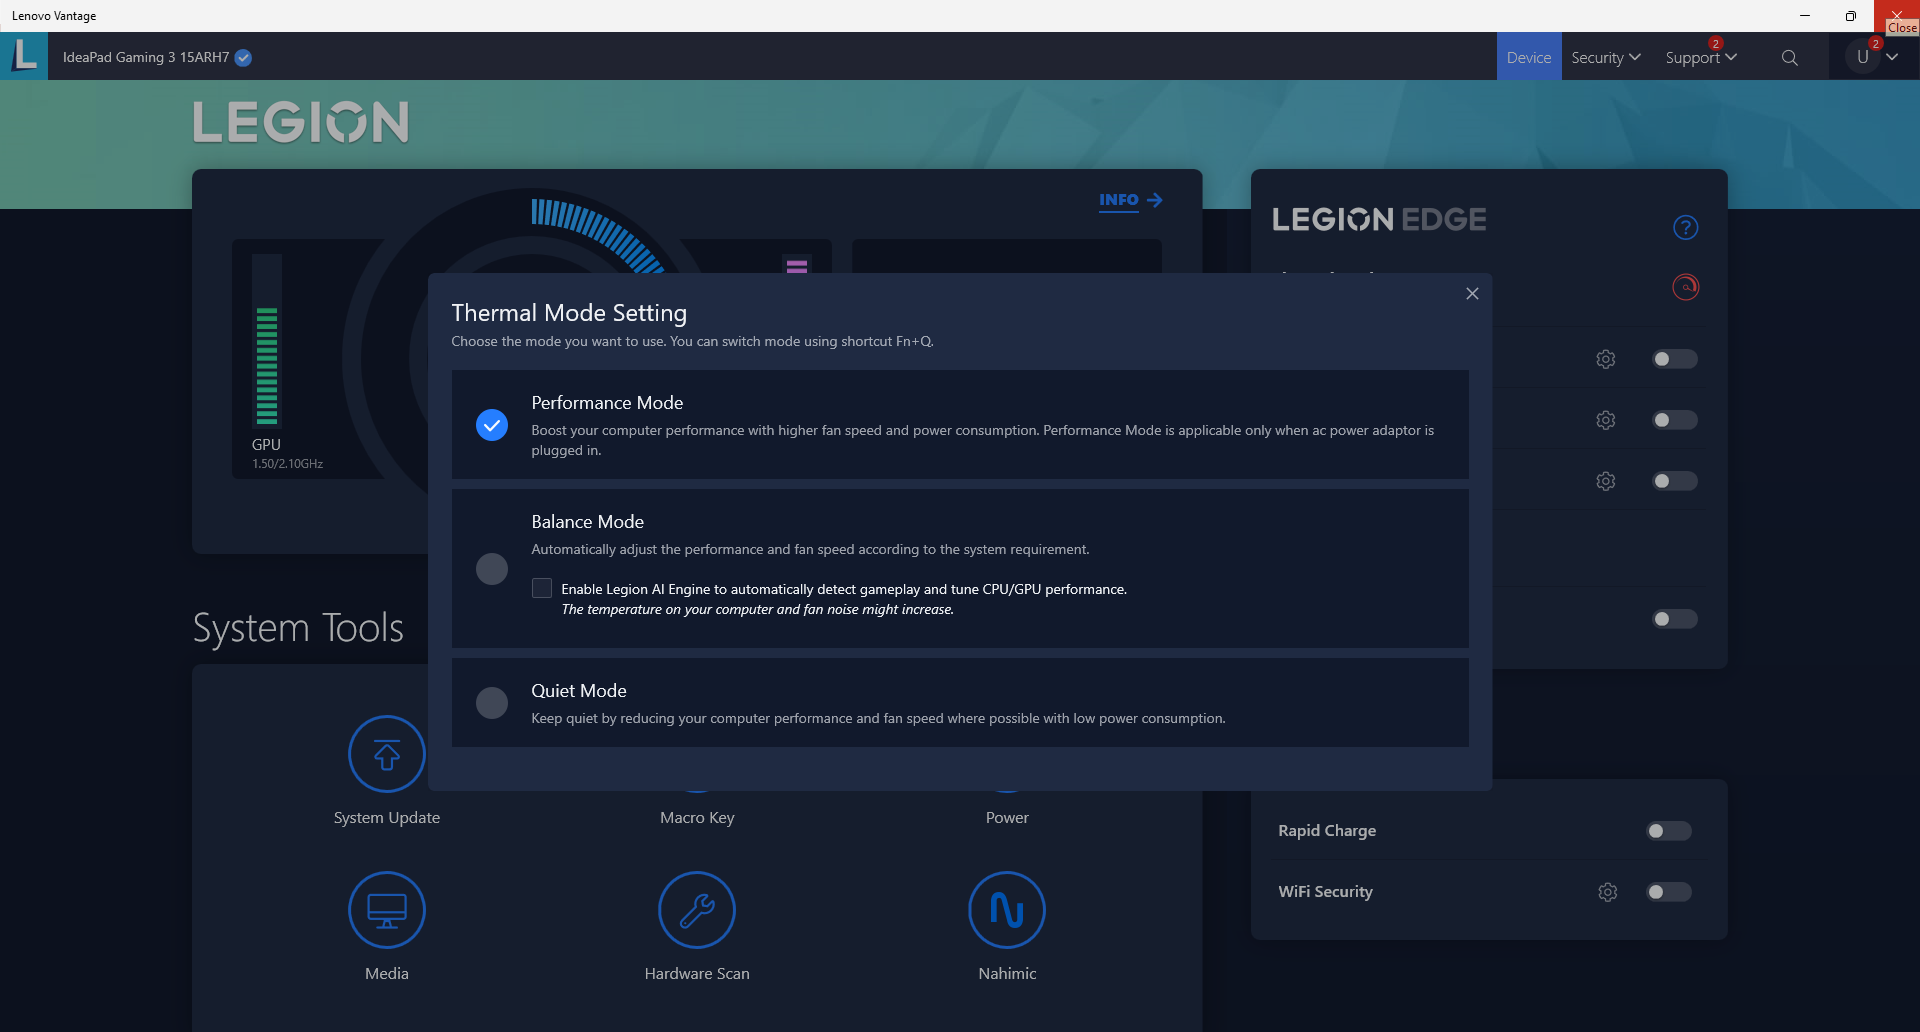
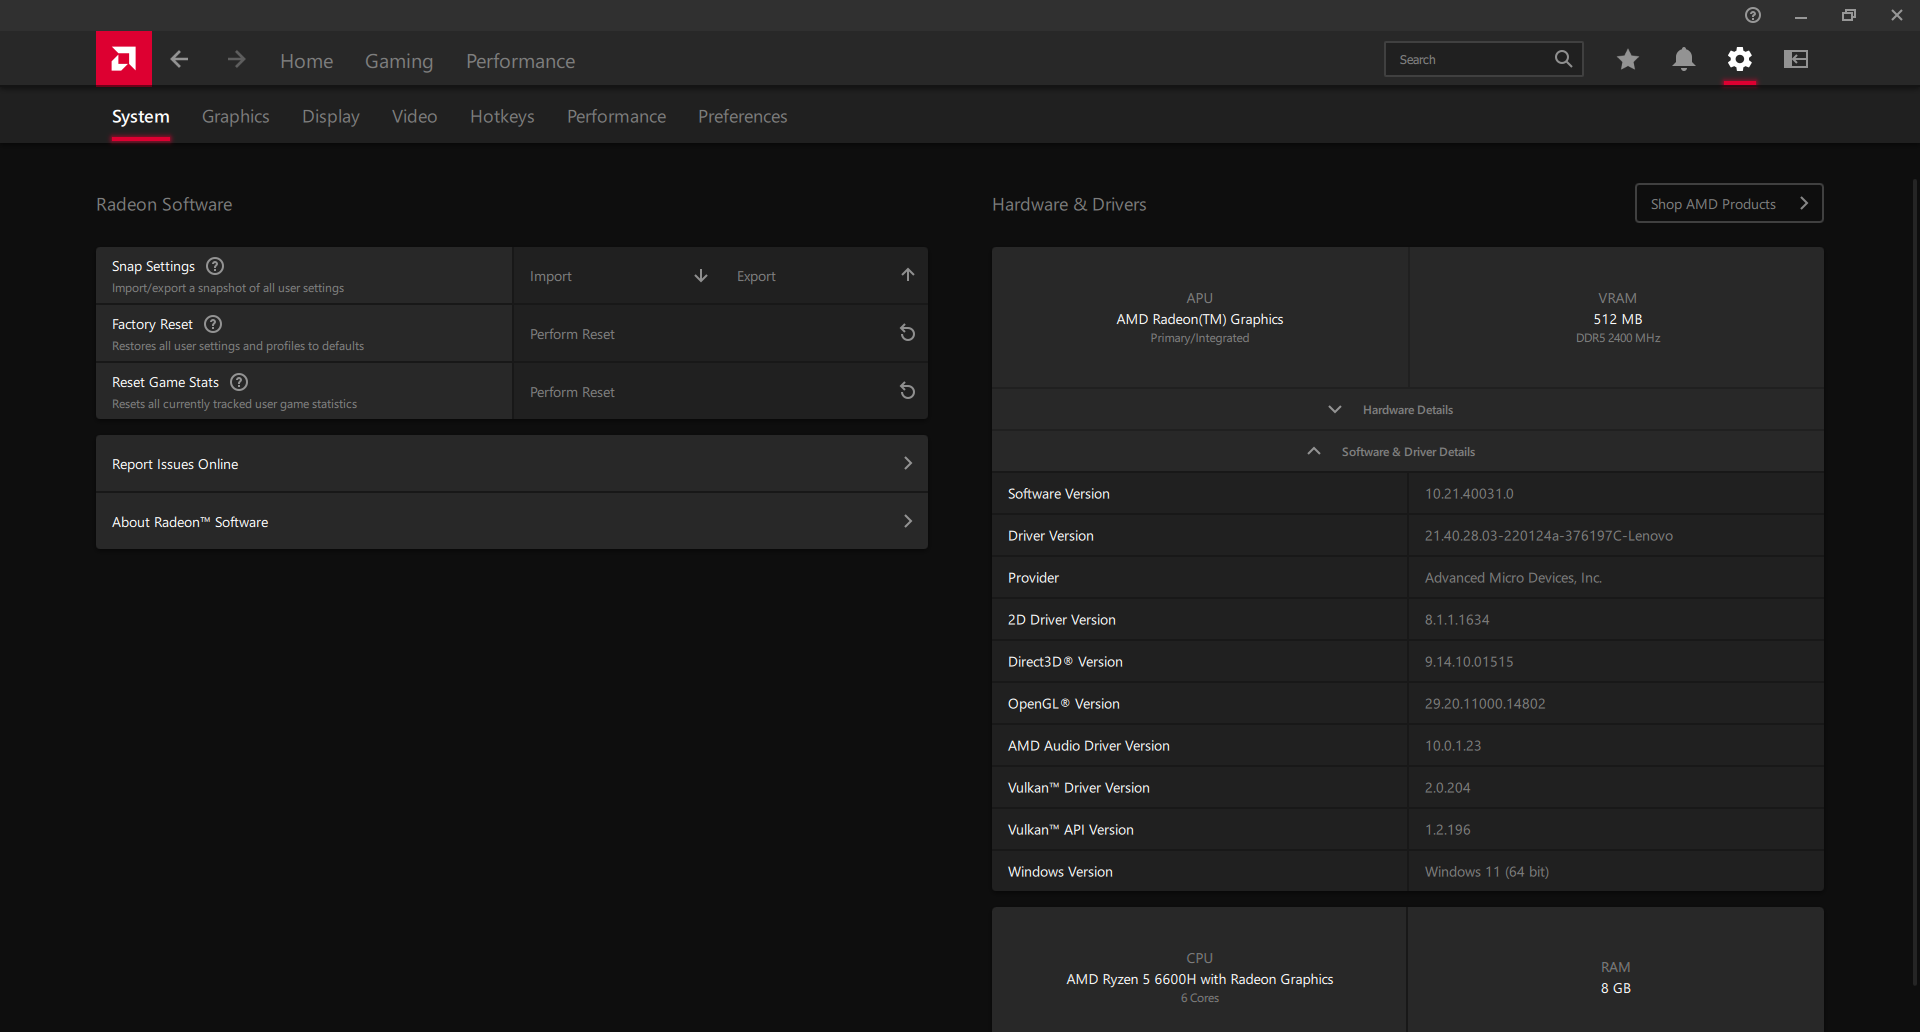
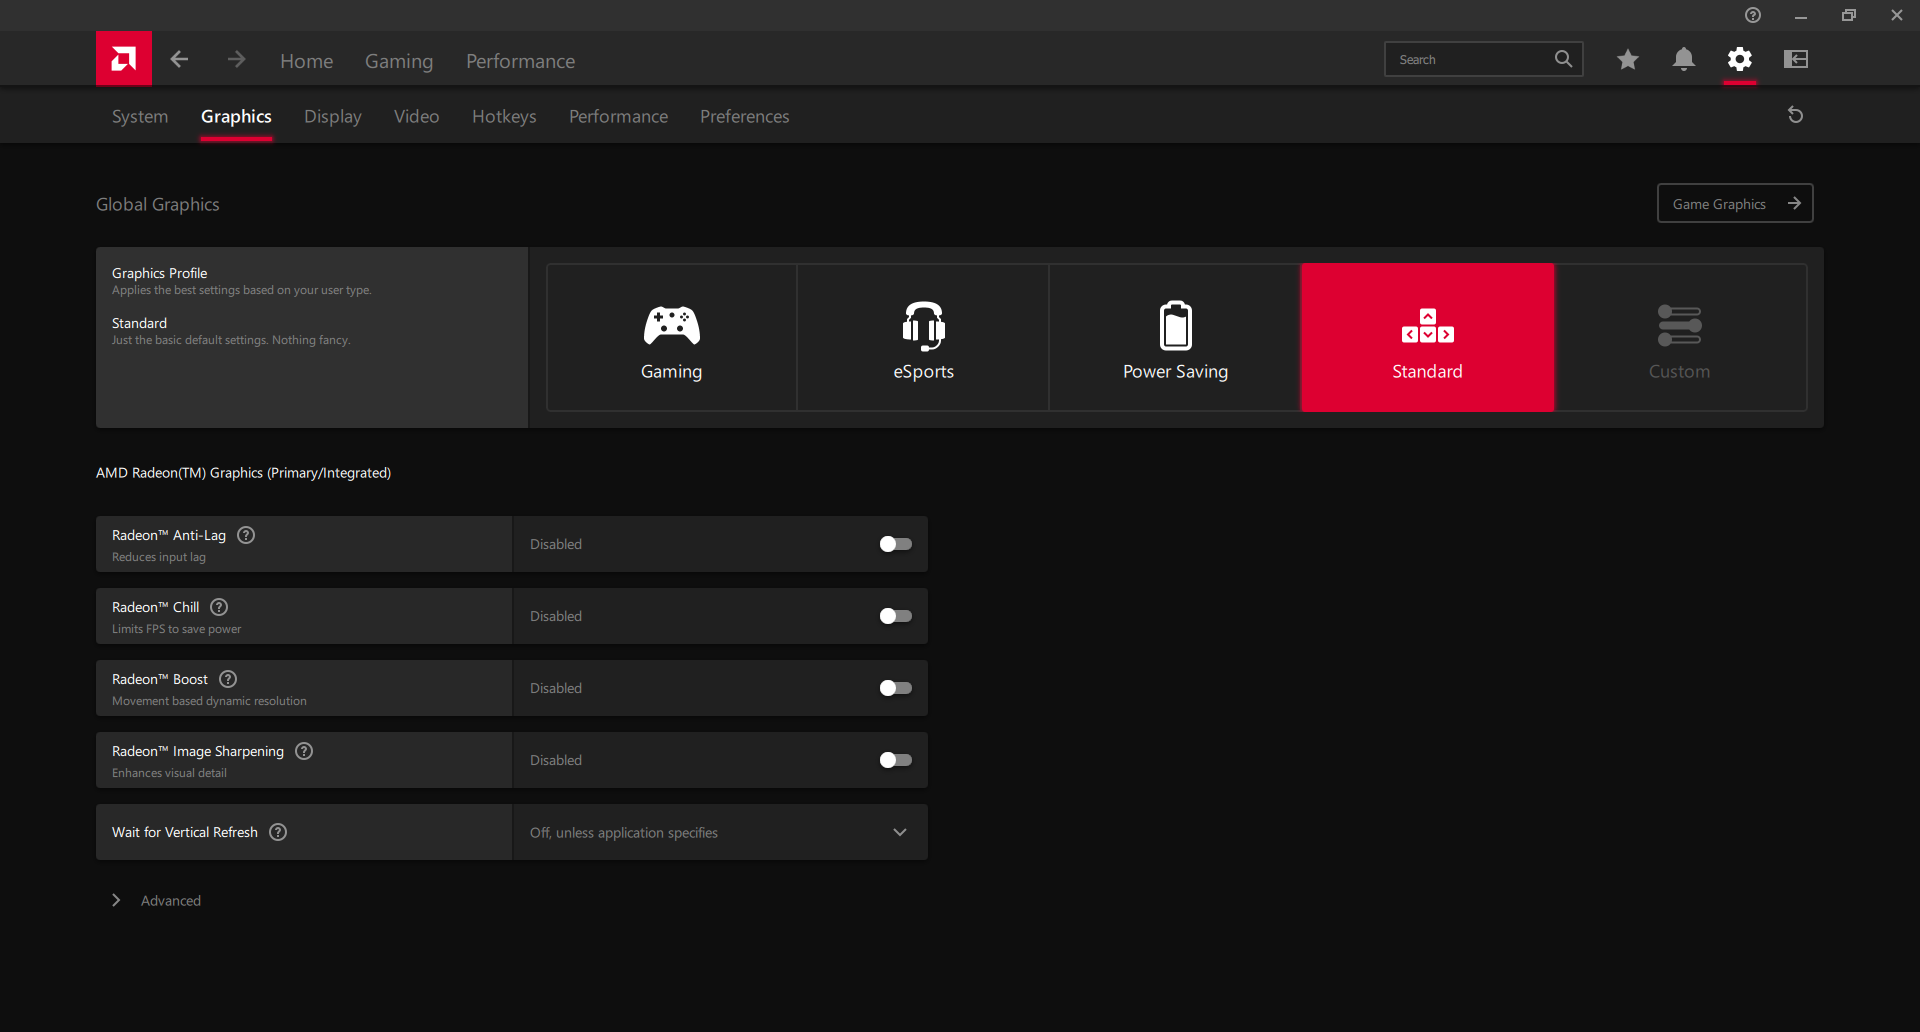
Notre unité a été réglée en mode Performance dans Windows et dans le logiciel préinstallé Lenovo Vantage avant d'exécuter les benchmarks ci-dessous. Nous nous sommes également assurés que le GPU Nvidia était actif via le panneau de configuration Nvidia et que les paramètres graphiques globaux du logiciel Radeon étaient réglés sur Standard. Il est recommandé aux utilisateurs de se familiariser avec les logiciels Vantage et Radeon, car ils servent de centres de contrôle pour les mises à jour de Lenovo et la plupart des paramètres d'affichage, respectivement.
Il n'y a pas de commutateur MUX, ce qui est normal sur une machine de jeu à petit budget.

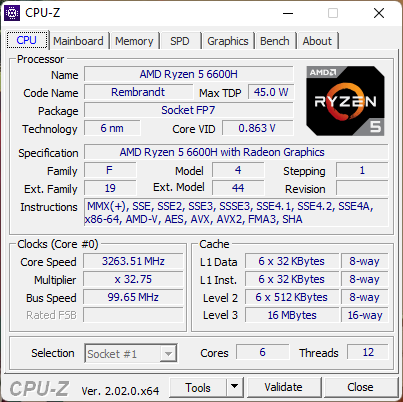
Processeur - Performant comme le Ryzen 5 5600H
Le Zen 3 Ryzen 5 5600H représentait déjà une augmentation appréciable par rapport au Zen 2 Ryzen 5 4600H. Ainsi, le passage du Zen 3 Ryzen 5 5600H au Zen3+ Ryzen 5 6600H ne devrait offrir au mieux que des avantages mineurs au niveau du processeur. Les avantages sont si mineurs, en fait, que les résultats des benchmarks sont presque les mêmes entre eux. Le siteGigabyte A5 K1 avec le 5600H, par exemple, n'est qu'à quelques points de pourcentage du 6600H dans notre Lenovo. La dernière génération Ryzen 7 5800H ou Core i7-11800H sont donc toujours des processeurs plus rapides, sans conteste.
Voir notre page dédiée au Ryzen 5 6600H pour un aperçu du processeur.
Cinebench R15 Multi Loop
Cinebench R23: Multi Core | Single Core
Cinebench R15: CPU Multi 64Bit | CPU Single 64Bit
Blender: v2.79 BMW27 CPU
7-Zip 18.03: 7z b 4 | 7z b 4 -mmt1
Geekbench 5.5: Multi-Core | Single-Core
HWBOT x265 Benchmark v2.2: 4k Preset
LibreOffice : 20 Documents To PDF
R Benchmark 2.5: Overall mean
Cinebench R23: Multi Core | Single Core
Cinebench R15: CPU Multi 64Bit | CPU Single 64Bit
Blender: v2.79 BMW27 CPU
7-Zip 18.03: 7z b 4 | 7z b 4 -mmt1
Geekbench 5.5: Multi-Core | Single-Core
HWBOT x265 Benchmark v2.2: 4k Preset
LibreOffice : 20 Documents To PDF
R Benchmark 2.5: Overall mean
* ... Moindre est la valeur, meilleures sont les performances
AIDA64: FP32 Ray-Trace | FPU Julia | CPU SHA3 | CPU Queen | FPU SinJulia | FPU Mandel | CPU AES | CPU ZLib | FP64 Ray-Trace | CPU PhotoWorxx
| Performance rating | |
| Asus TUF Dash F15 FX517ZR | |
| Moyenne AMD Ryzen 5 6600H | |
| Lenovo IdeaPad Gaming 3 15ARH7 | |
| Lenovo Legion 5 15ACH6A-82NW0010GE | |
| Gigabyte A5 K1 | |
| Dell G15 5510 | |
| Lenovo IdeaPad Gaming 3i 15IMH05 | |
| AIDA64 / FP32 Ray-Trace | |
| Asus TUF Dash F15 FX517ZR | |
| Lenovo Legion 5 15ACH6A-82NW0010GE | |
| Gigabyte A5 K1 | |
| Lenovo IdeaPad Gaming 3 15ARH7 | |
| Moyenne AMD Ryzen 5 6600H (10645 - 12871, n=4) | |
| Dell G15 5510 | |
| Lenovo IdeaPad Gaming 3i 15IMH05 | |
| AIDA64 / FPU Julia | |
| Lenovo Legion 5 15ACH6A-82NW0010GE | |
| Gigabyte A5 K1 | |
| Lenovo IdeaPad Gaming 3 15ARH7 | |
| Moyenne AMD Ryzen 5 6600H (66739 - 78277, n=4) | |
| Asus TUF Dash F15 FX517ZR | |
| Dell G15 5510 | |
| Lenovo IdeaPad Gaming 3i 15IMH05 | |
| AIDA64 / CPU SHA3 | |
| Asus TUF Dash F15 FX517ZR | |
| Lenovo Legion 5 15ACH6A-82NW0010GE | |
| Lenovo IdeaPad Gaming 3 15ARH7 | |
| Moyenne AMD Ryzen 5 6600H (2231 - 2689, n=4) | |
| Gigabyte A5 K1 | |
| Dell G15 5510 | |
| Lenovo IdeaPad Gaming 3i 15IMH05 | |
| AIDA64 / CPU Queen | |
| Asus TUF Dash F15 FX517ZR | |
| Moyenne AMD Ryzen 5 6600H (77711 - 82119, n=4) | |
| Lenovo IdeaPad Gaming 3 15ARH7 | |
| Gigabyte A5 K1 | |
| Lenovo Legion 5 15ACH6A-82NW0010GE | |
| Dell G15 5510 | |
| Lenovo IdeaPad Gaming 3i 15IMH05 | |
| AIDA64 / FPU SinJulia | |
| Moyenne AMD Ryzen 5 6600H (9184 - 9739, n=4) | |
| Lenovo IdeaPad Gaming 3 15ARH7 | |
| Gigabyte A5 K1 | |
| Lenovo Legion 5 15ACH6A-82NW0010GE | |
| Asus TUF Dash F15 FX517ZR | |
| Dell G15 5510 | |
| Lenovo IdeaPad Gaming 3i 15IMH05 | |
| AIDA64 / FPU Mandel | |
| Lenovo Legion 5 15ACH6A-82NW0010GE | |
| Gigabyte A5 K1 | |
| Lenovo IdeaPad Gaming 3 15ARH7 | |
| Moyenne AMD Ryzen 5 6600H (36591 - 43222, n=4) | |
| Asus TUF Dash F15 FX517ZR | |
| Dell G15 5510 | |
| Lenovo IdeaPad Gaming 3i 15IMH05 | |
| AIDA64 / CPU AES | |
| Lenovo IdeaPad Gaming 3 15ARH7 | |
| Lenovo Legion 5 15ACH6A-82NW0010GE | |
| Moyenne AMD Ryzen 5 6600H (43461 - 104138, n=4) | |
| Asus TUF Dash F15 FX517ZR | |
| Gigabyte A5 K1 | |
| Dell G15 5510 | |
| Lenovo IdeaPad Gaming 3i 15IMH05 | |
| AIDA64 / CPU ZLib | |
| Asus TUF Dash F15 FX517ZR | |
| Lenovo IdeaPad Gaming 3 15ARH7 | |
| Lenovo Legion 5 15ACH6A-82NW0010GE | |
| Gigabyte A5 K1 | |
| Moyenne AMD Ryzen 5 6600H (523 - 660, n=4) | |
| Dell G15 5510 | |
| Lenovo IdeaPad Gaming 3i 15IMH05 | |
| AIDA64 / FP64 Ray-Trace | |
| Asus TUF Dash F15 FX517ZR | |
| Lenovo Legion 5 15ACH6A-82NW0010GE | |
| Gigabyte A5 K1 | |
| Lenovo IdeaPad Gaming 3 15ARH7 | |
| Moyenne AMD Ryzen 5 6600H (5659 - 6911, n=4) | |
| Dell G15 5510 | |
| Lenovo IdeaPad Gaming 3i 15IMH05 | |
| AIDA64 / CPU PhotoWorxx | |
| Asus TUF Dash F15 FX517ZR | |
| Moyenne AMD Ryzen 5 6600H (16218 - 29621, n=4) | |
| Gigabyte A5 K1 | |
| Lenovo IdeaPad Gaming 3i 15IMH05 | |
| Lenovo IdeaPad Gaming 3 15ARH7 | |
| Dell G15 5510 | |
| Lenovo Legion 5 15ACH6A-82NW0010GE | |
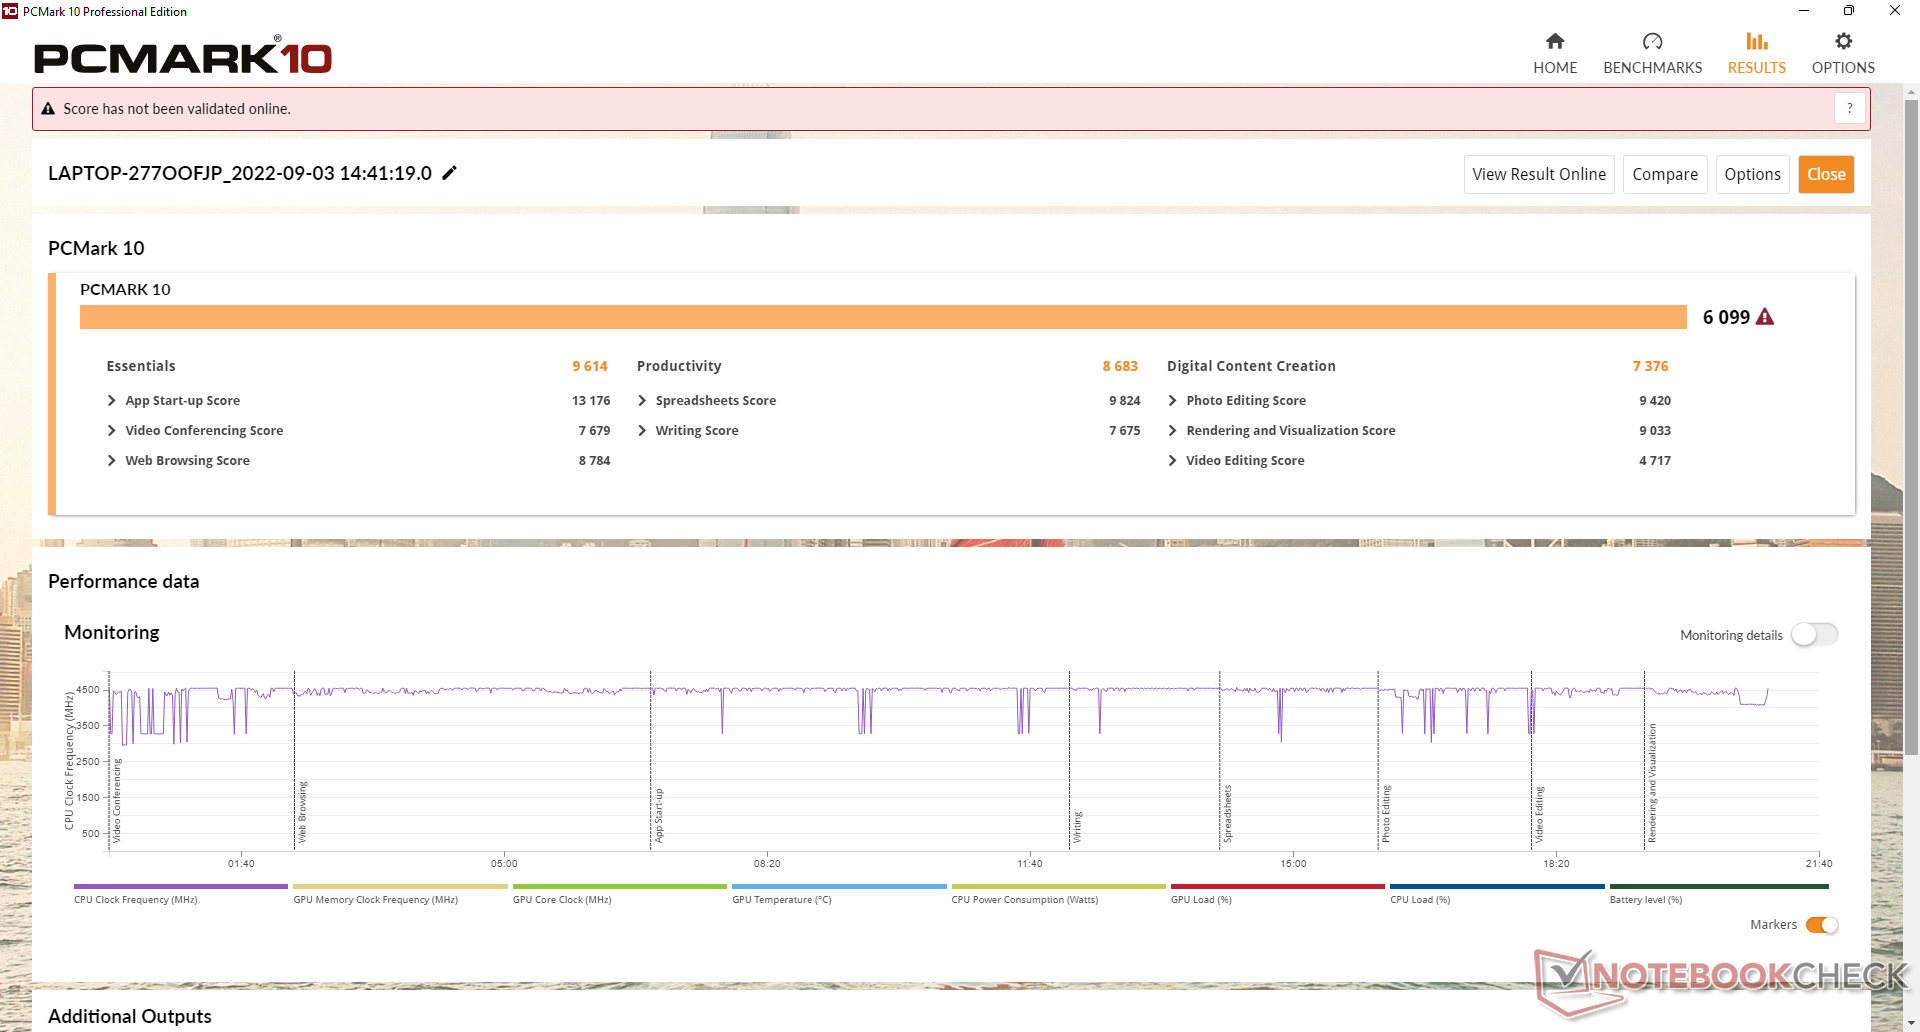
Performance du système
Les scores PCMark sont systématiquement supérieurs à ceux de l'IdeaPad Gaming 3i 15IMH05, mais restent inférieurs à ceux de l'IdeaPad Gaming 3i 15ACH6 Legion 5 15ACH6A doté d'un GPU Radeon RX 6600M plus puissant. Le sous-score de création de contenu numérique, en particulier, est nettement meilleur que sur l'IdeaPad Gaming 3i 15IMH05 en raison du saut générationnel dans les performances graphiques.
CrossMark: Overall | Productivity | Creativity | Responsiveness
| PCMark 10 / Score | |
| Lenovo Legion 5 15ACH6A-82NW0010GE | |
| Asus TUF Dash F15 FX517ZR | |
| Gigabyte A5 K1 | |
| Lenovo IdeaPad Gaming 3 15ARH7 | |
| Moyenne AMD Ryzen 5 6600H, NVIDIA GeForce RTX 3050 4GB Laptop GPU (n=1) | |
| Dell G15 5510 | |
| Lenovo IdeaPad Gaming 3i 15IMH05 | |
| PCMark 10 / Essentials | |
| Lenovo Legion 5 15ACH6A-82NW0010GE | |
| Gigabyte A5 K1 | |
| Asus TUF Dash F15 FX517ZR | |
| Lenovo IdeaPad Gaming 3 15ARH7 | |
| Moyenne AMD Ryzen 5 6600H, NVIDIA GeForce RTX 3050 4GB Laptop GPU (n=1) | |
| Lenovo IdeaPad Gaming 3i 15IMH05 | |
| Dell G15 5510 | |
| PCMark 10 / Productivity | |
| Asus TUF Dash F15 FX517ZR | |
| Lenovo Legion 5 15ACH6A-82NW0010GE | |
| Gigabyte A5 K1 | |
| Lenovo IdeaPad Gaming 3 15ARH7 | |
| Moyenne AMD Ryzen 5 6600H, NVIDIA GeForce RTX 3050 4GB Laptop GPU (n=1) | |
| Lenovo IdeaPad Gaming 3i 15IMH05 | |
| Dell G15 5510 | |
| PCMark 10 / Digital Content Creation | |
| Lenovo Legion 5 15ACH6A-82NW0010GE | |
| Asus TUF Dash F15 FX517ZR | |
| Gigabyte A5 K1 | |
| Lenovo IdeaPad Gaming 3 15ARH7 | |
| Moyenne AMD Ryzen 5 6600H, NVIDIA GeForce RTX 3050 4GB Laptop GPU (n=1) | |
| Dell G15 5510 | |
| Lenovo IdeaPad Gaming 3i 15IMH05 | |
| CrossMark / Overall | |
| Asus TUF Dash F15 FX517ZR | |
| Lenovo IdeaPad Gaming 3 15ARH7 | |
| Moyenne AMD Ryzen 5 6600H, NVIDIA GeForce RTX 3050 4GB Laptop GPU (n=1) | |
| CrossMark / Productivity | |
| Asus TUF Dash F15 FX517ZR | |
| Lenovo IdeaPad Gaming 3 15ARH7 | |
| Moyenne AMD Ryzen 5 6600H, NVIDIA GeForce RTX 3050 4GB Laptop GPU (n=1) | |
| CrossMark / Creativity | |
| Asus TUF Dash F15 FX517ZR | |
| Lenovo IdeaPad Gaming 3 15ARH7 | |
| Moyenne AMD Ryzen 5 6600H, NVIDIA GeForce RTX 3050 4GB Laptop GPU (n=1) | |
| CrossMark / Responsiveness | |
| Asus TUF Dash F15 FX517ZR | |
| Lenovo IdeaPad Gaming 3 15ARH7 | |
| Moyenne AMD Ryzen 5 6600H, NVIDIA GeForce RTX 3050 4GB Laptop GPU (n=1) | |
| PCMark 10 Score | 6099 points | |
Aide | ||
| AIDA64 / Memory Copy | |
| Asus TUF Dash F15 FX517ZR | |
| Moyenne AMD Ryzen 5 6600H (28335 - 50886, n=4) | |
| Gigabyte A5 K1 | |
| Lenovo Legion 5 15ACH6A-82NW0010GE | |
| Dell G15 5510 | |
| Lenovo IdeaPad Gaming 3i 15IMH05 | |
| Lenovo IdeaPad Gaming 3 15ARH7 | |
| AIDA64 / Memory Read | |
| Asus TUF Dash F15 FX517ZR | |
| Gigabyte A5 K1 | |
| Moyenne AMD Ryzen 5 6600H (34300 - 51684, n=4) | |
| Lenovo Legion 5 15ACH6A-82NW0010GE | |
| Lenovo IdeaPad Gaming 3i 15IMH05 | |
| Dell G15 5510 | |
| Lenovo IdeaPad Gaming 3 15ARH7 | |
| AIDA64 / Memory Write | |
| Asus TUF Dash F15 FX517ZR | |
| Moyenne AMD Ryzen 5 6600H (31788 - 55160, n=4) | |
| Gigabyte A5 K1 | |
| Dell G15 5510 | |
| Lenovo IdeaPad Gaming 3i 15IMH05 | |
| Lenovo IdeaPad Gaming 3 15ARH7 | |
| Lenovo Legion 5 15ACH6A-82NW0010GE | |
| AIDA64 / Memory Latency | |
| Asus TUF Dash F15 FX517ZR | |
| Moyenne AMD Ryzen 5 6600H (81.7 - 112.7, n=4) | |
| Lenovo Legion 5 15ACH6A-82NW0010GE | |
| Lenovo IdeaPad Gaming 3 15ARH7 | |
| Dell G15 5510 | |
| Gigabyte A5 K1 | |
| Lenovo IdeaPad Gaming 3i 15IMH05 | |
* ... Moindre est la valeur, meilleures sont les performances
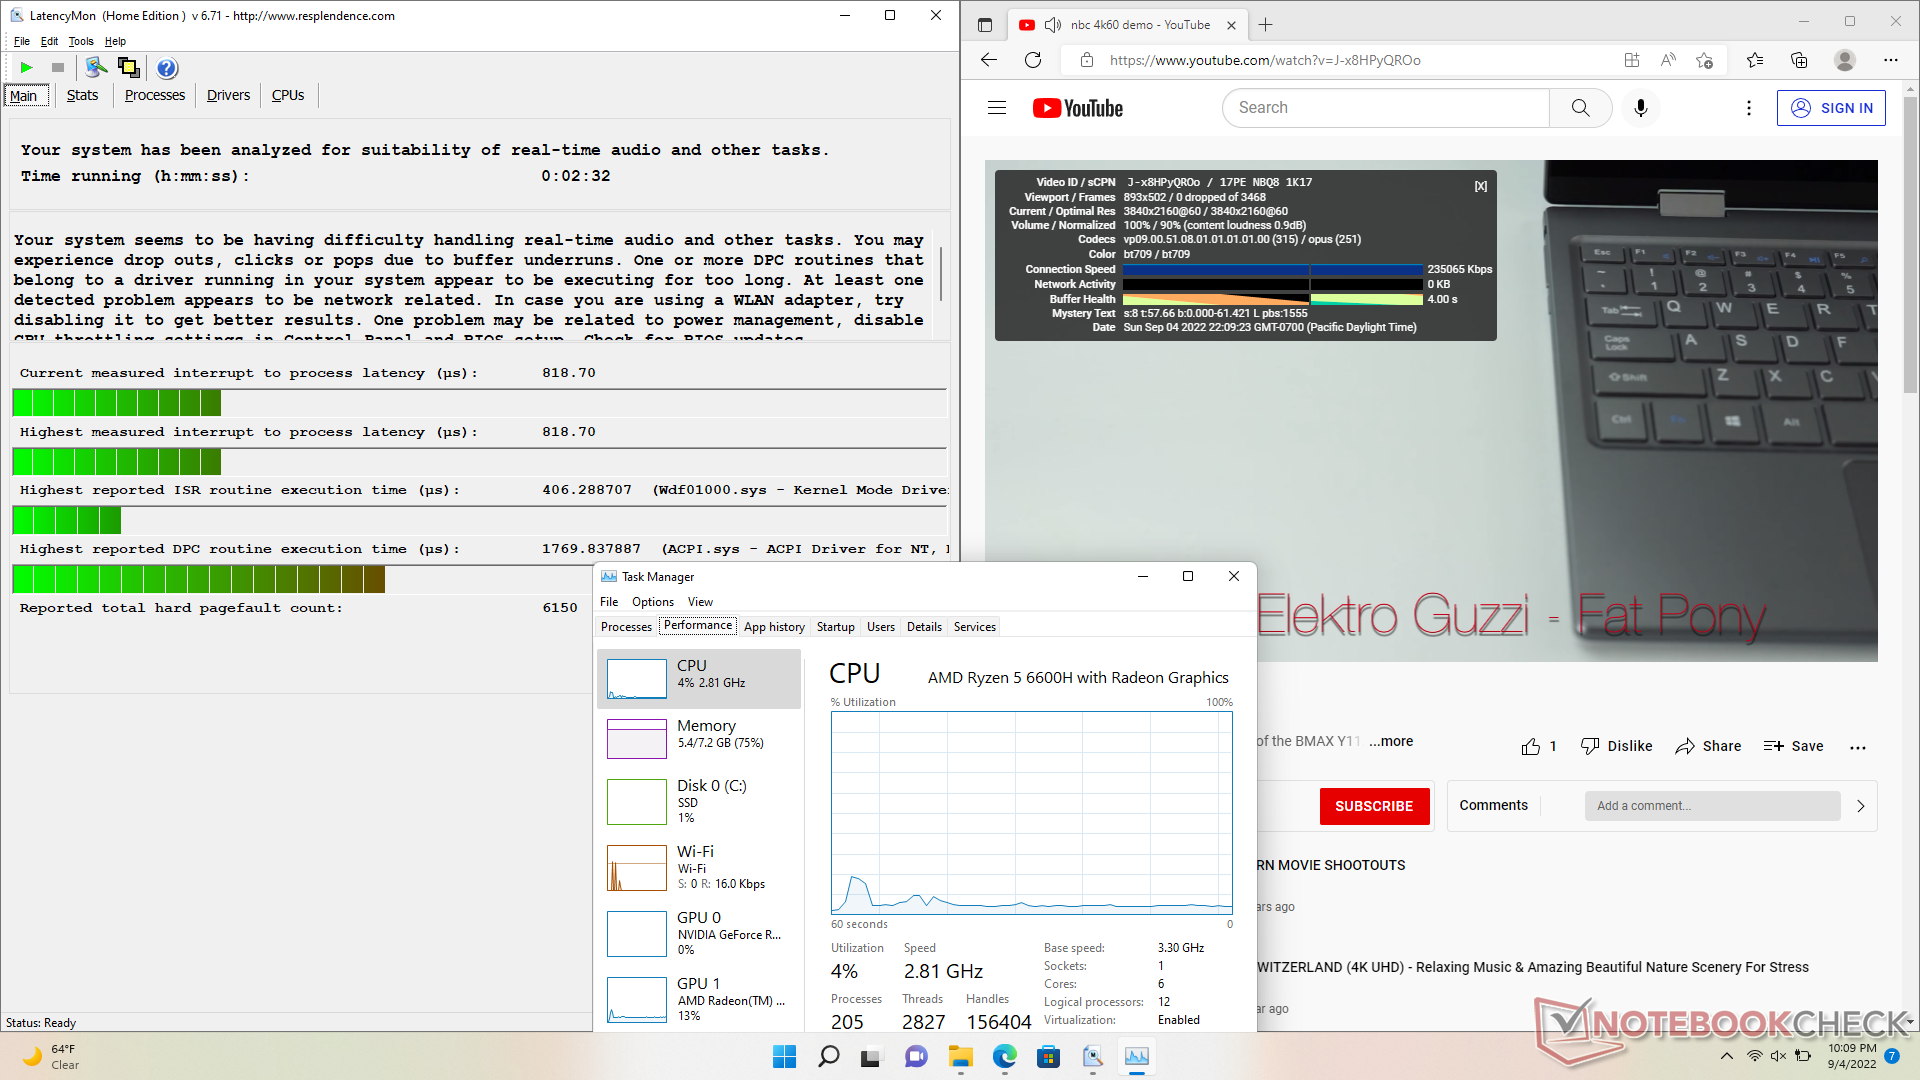
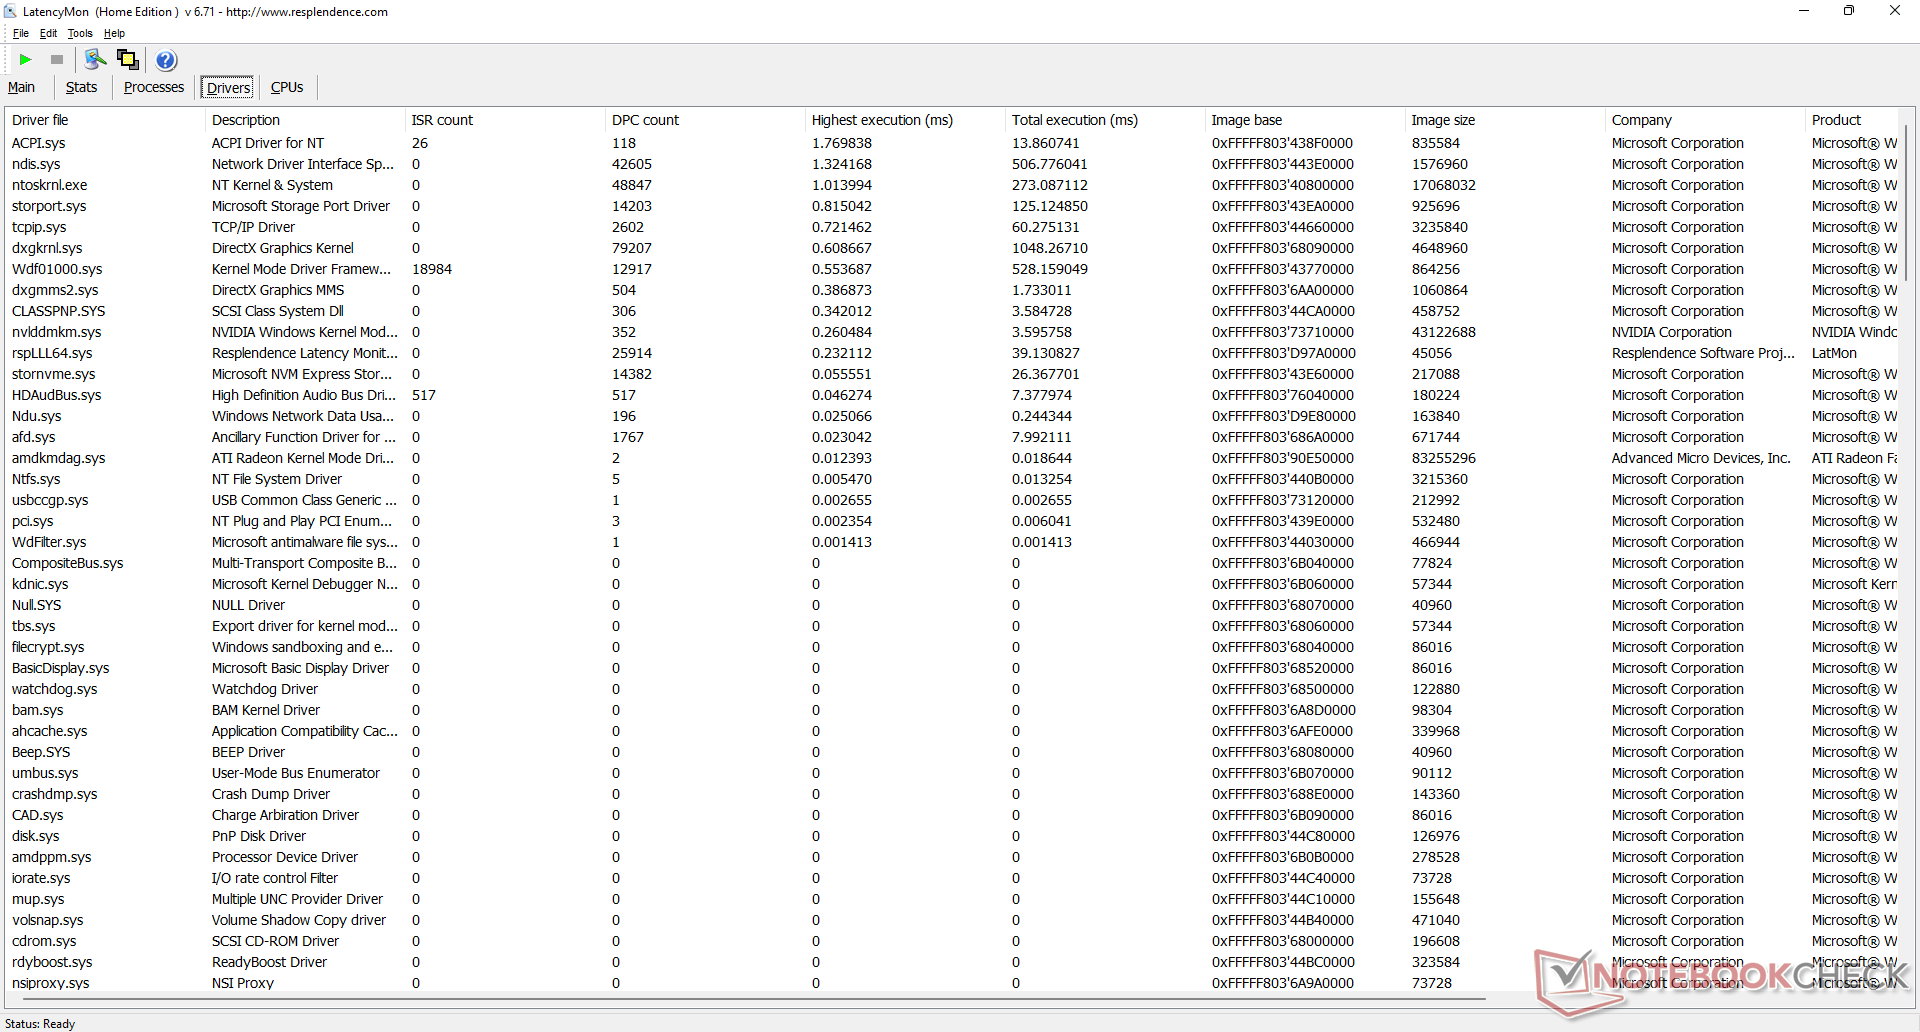
Latence DPC
LatencyMon révèle des problèmes mineurs de DPC lors de l'ouverture de plusieurs onglets de navigateur de notre page d'accueil. la lecture de vidéos 4K à 60 FPS est par ailleurs parfaite, avec 0 image perdue et une utilisation plus faible de l'iGPU par rapport à l'Intel Core U-series Iris Xe (13 % contre ~40 %).
| DPC Latencies / LatencyMon - interrupt to process latency (max), Web, Youtube, Prime95 | |
| Dell G15 5510 | |
| Gigabyte A5 K1 | |
| Lenovo Legion 5 15ACH6A-82NW0010GE | |
| Lenovo IdeaPad Gaming 3 15ARH7 | |
| Lenovo IdeaPad Gaming 3i 15IMH05 | |
| Asus TUF Dash F15 FX517ZR | |
* ... Moindre est la valeur, meilleures sont les performances
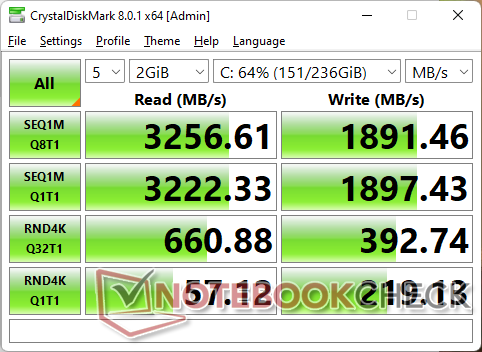
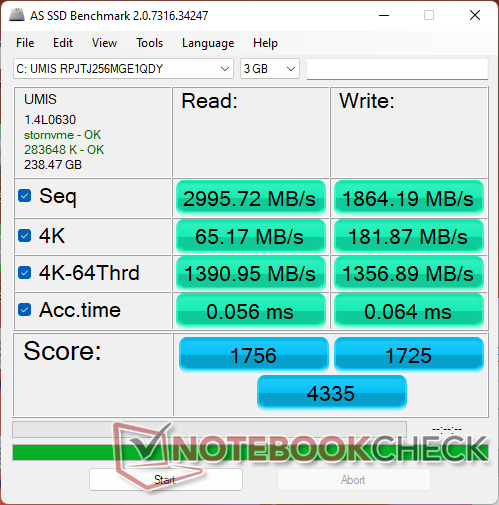
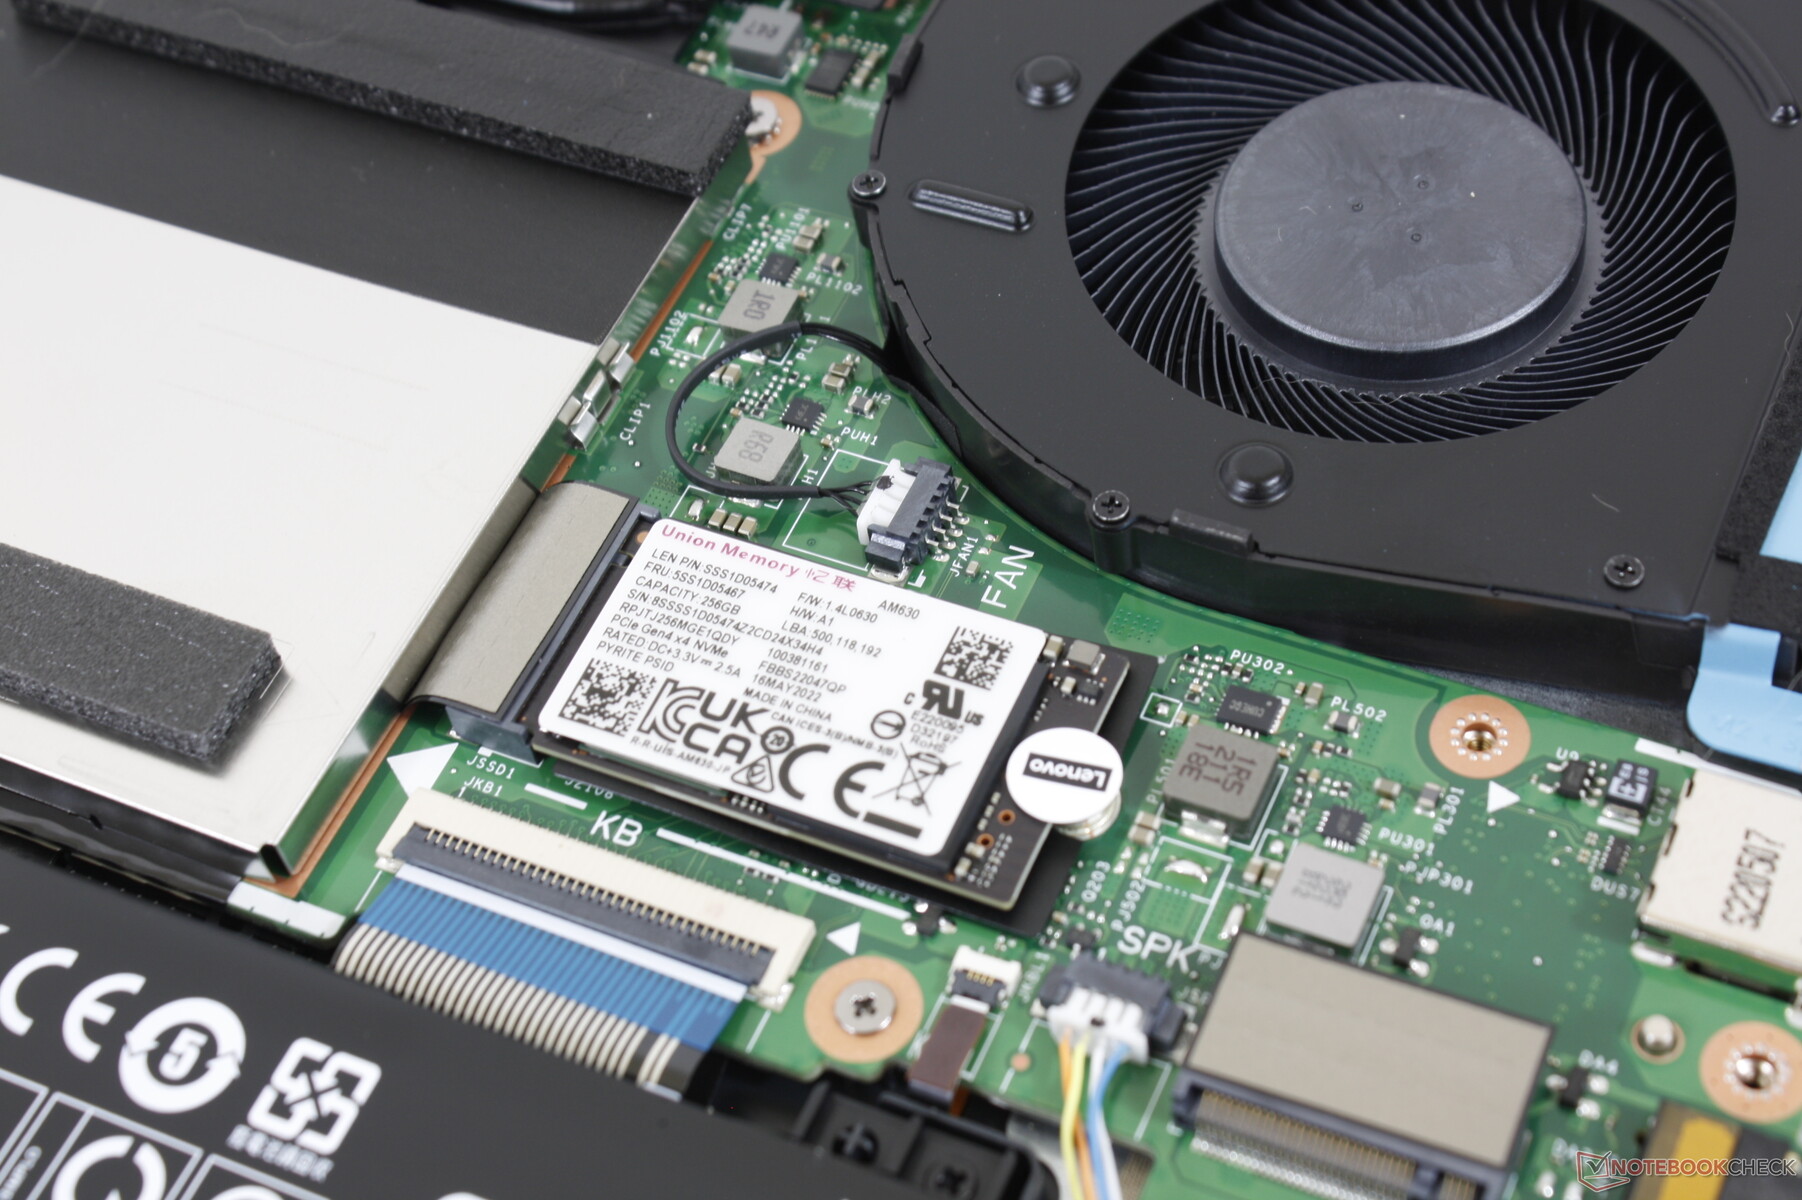
Dispositifs de stockage - Jusqu'à deux SSD PCIe4 x4
Bien que le système puisse prendre en charge jusqu'à deux SSD NVMe PCIe4 x4 M.2 simultanément, le SSD NVMe PCIe4 x4 de 256 Go est le seul à pouvoir être utilisé Lenovo AM630 SSD de notre unité de test est lent par rapport aux autres SSD PCIe4 x4. Le Samsung PM9A1, par exemple, peut atteindre des vitesses allant jusqu'à 7000 Mo/s, contre seulement ~3000 Mo/s sur notre IdeaPad. De plus, le disque de notre unité descendait jusqu'à 2000 MB/s en exécutant DiskSpd en boucle comme le montre le graphique ci-dessous, ce qui signifie qu'il ne peut pas maintenir ses taux de transfert maximum pendant de longues périodes. Pour un ordinateur portable de jeu à petit budget, cependant, ce n'est pas une plainte particulièrement critique.

| Drive Performance rating - Percent | |
| Lenovo IdeaPad Gaming 3 15ARH7 | |
| Asus TUF Dash F15 FX517ZR | |
| Gigabyte A5 K1 | |
| Dell G15 5510 | |
| Lenovo Legion 5 15ACH6A-82NW0010GE | |
| Lenovo IdeaPad Gaming 3i 15IMH05 | |
* ... Moindre est la valeur, meilleures sont les performances
Disk Throttling: DiskSpd Read Loop, Queue Depth 8
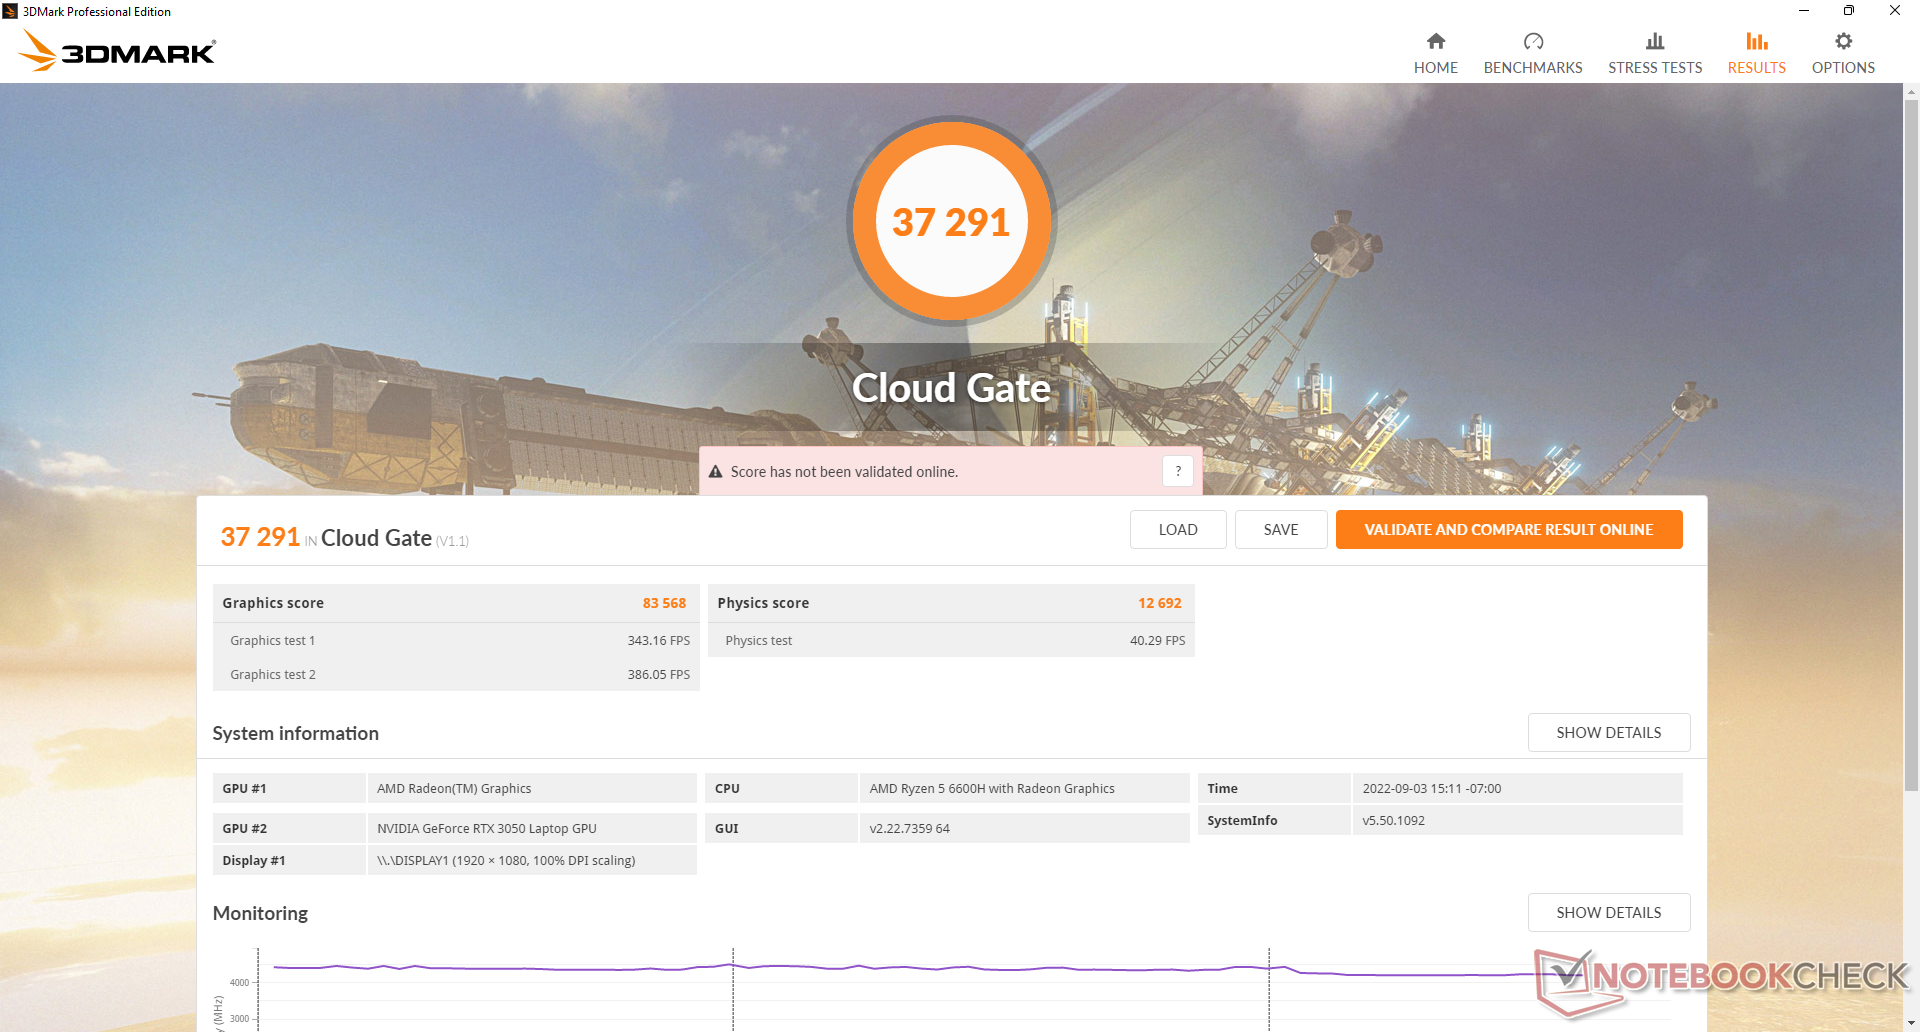
Performances du GPU
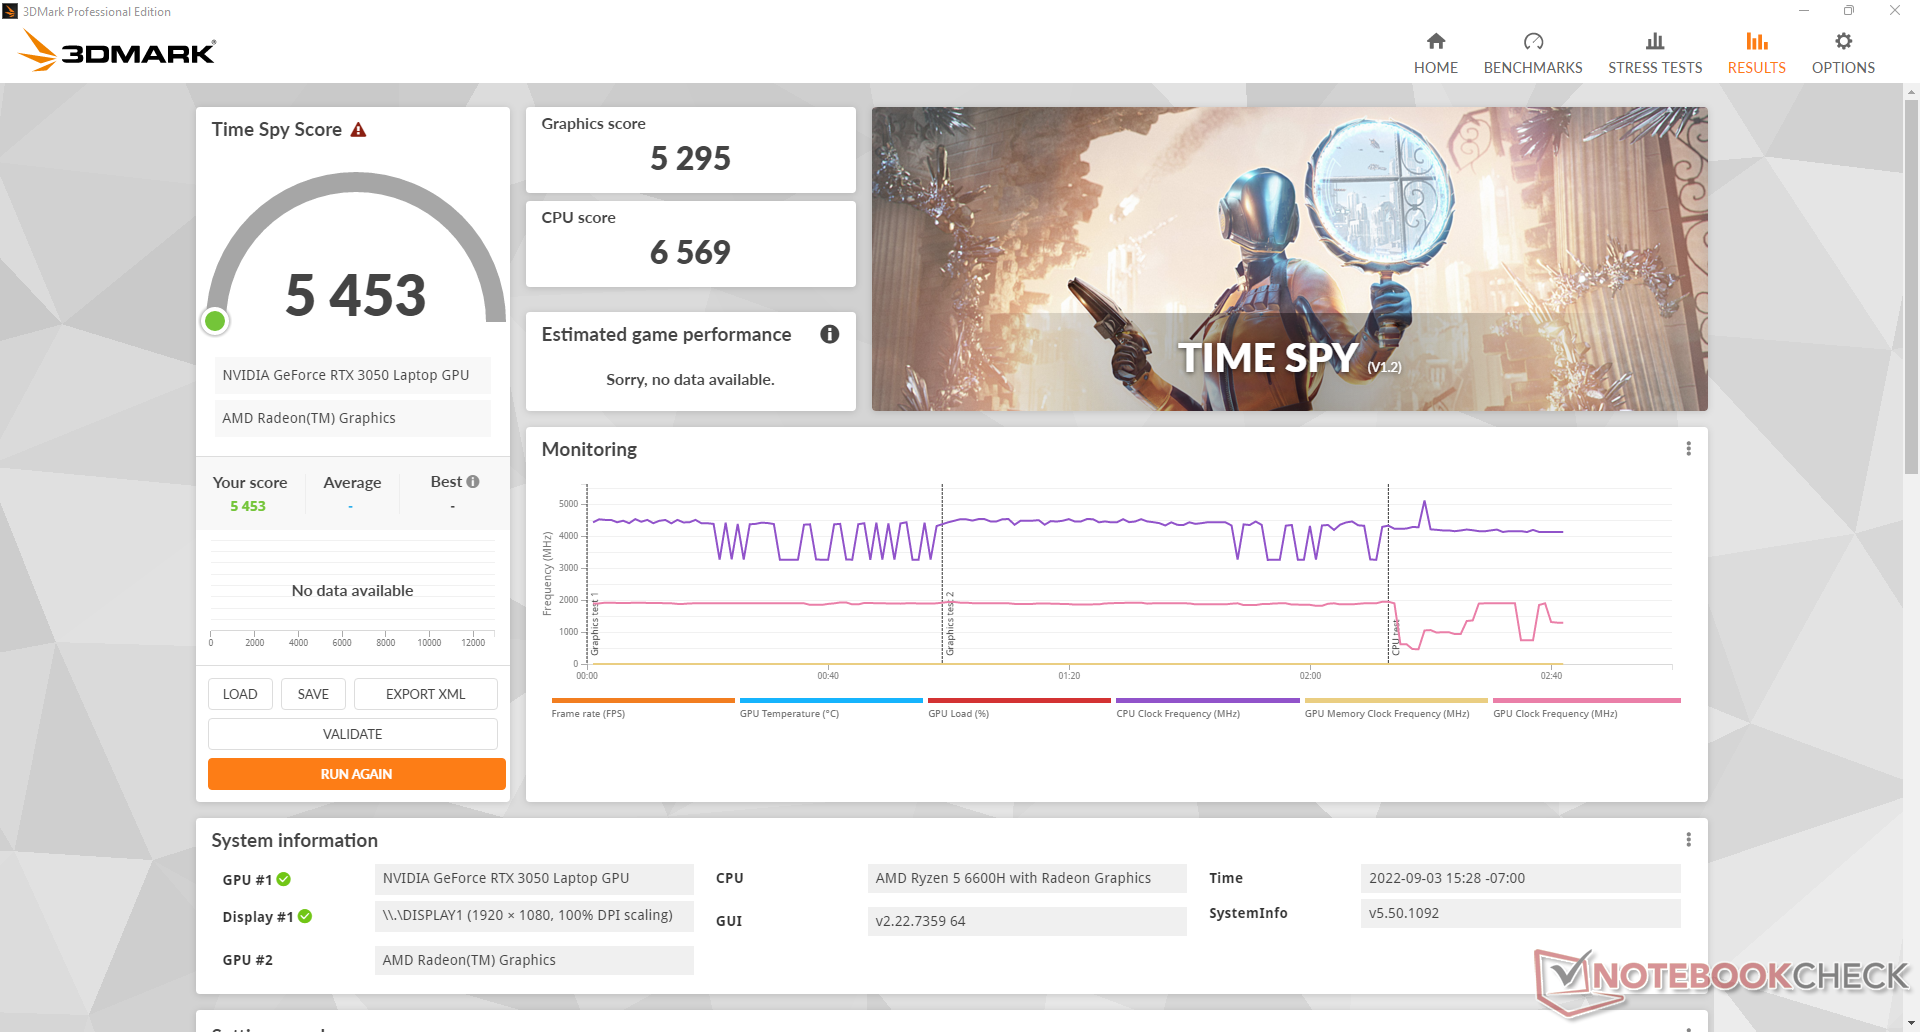
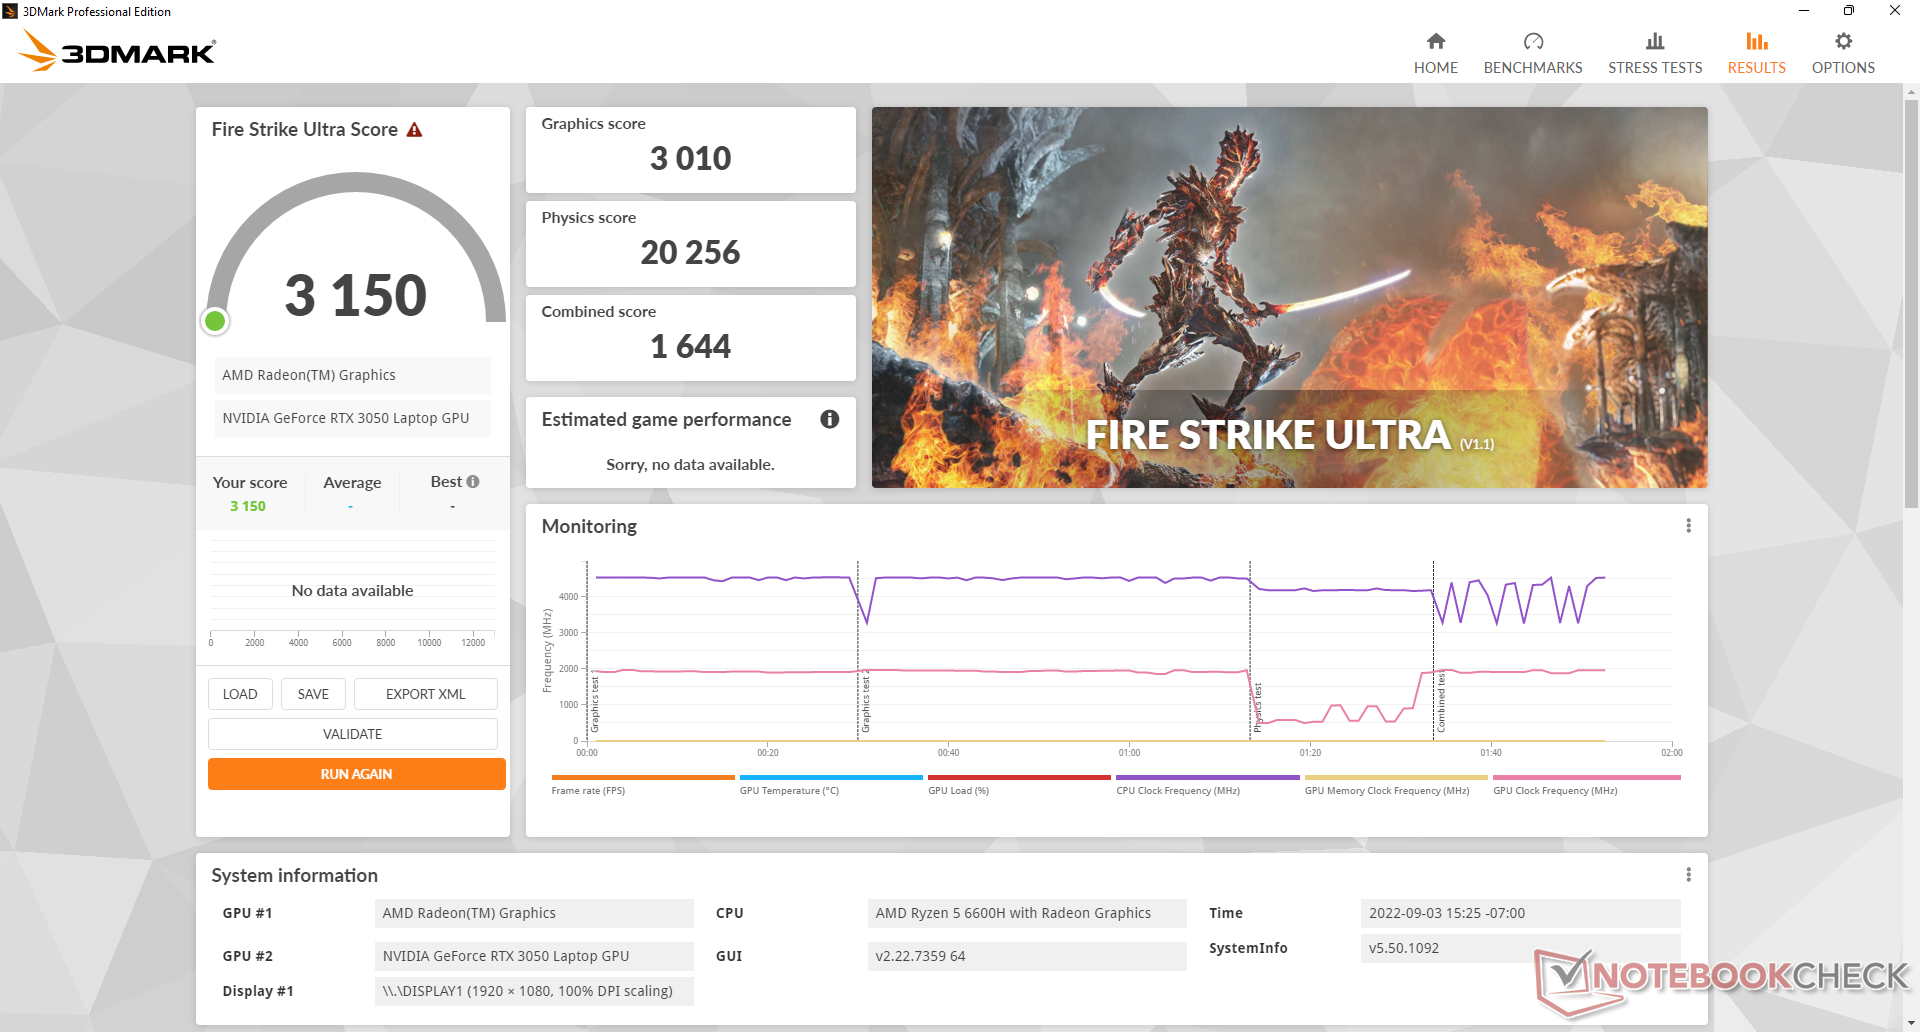
Les performances graphiques sont environ 15 % plus rapides que celles de l'ordinateur portable moyen de notre base de données équipé de la même technologie GeForce RTX 3050 GPU. La mise à niveau vers la carte RTX 3050 Ti n'augmentera probablement les performances que de 10 % supplémentaires, d'après notre expérience avec d'autres ordinateurs portables RTX 3050 Ti. Les utilisateurs à la recherche d'une option RTX 3060 devront se tourner vers la série Legion, plus onéreuse.
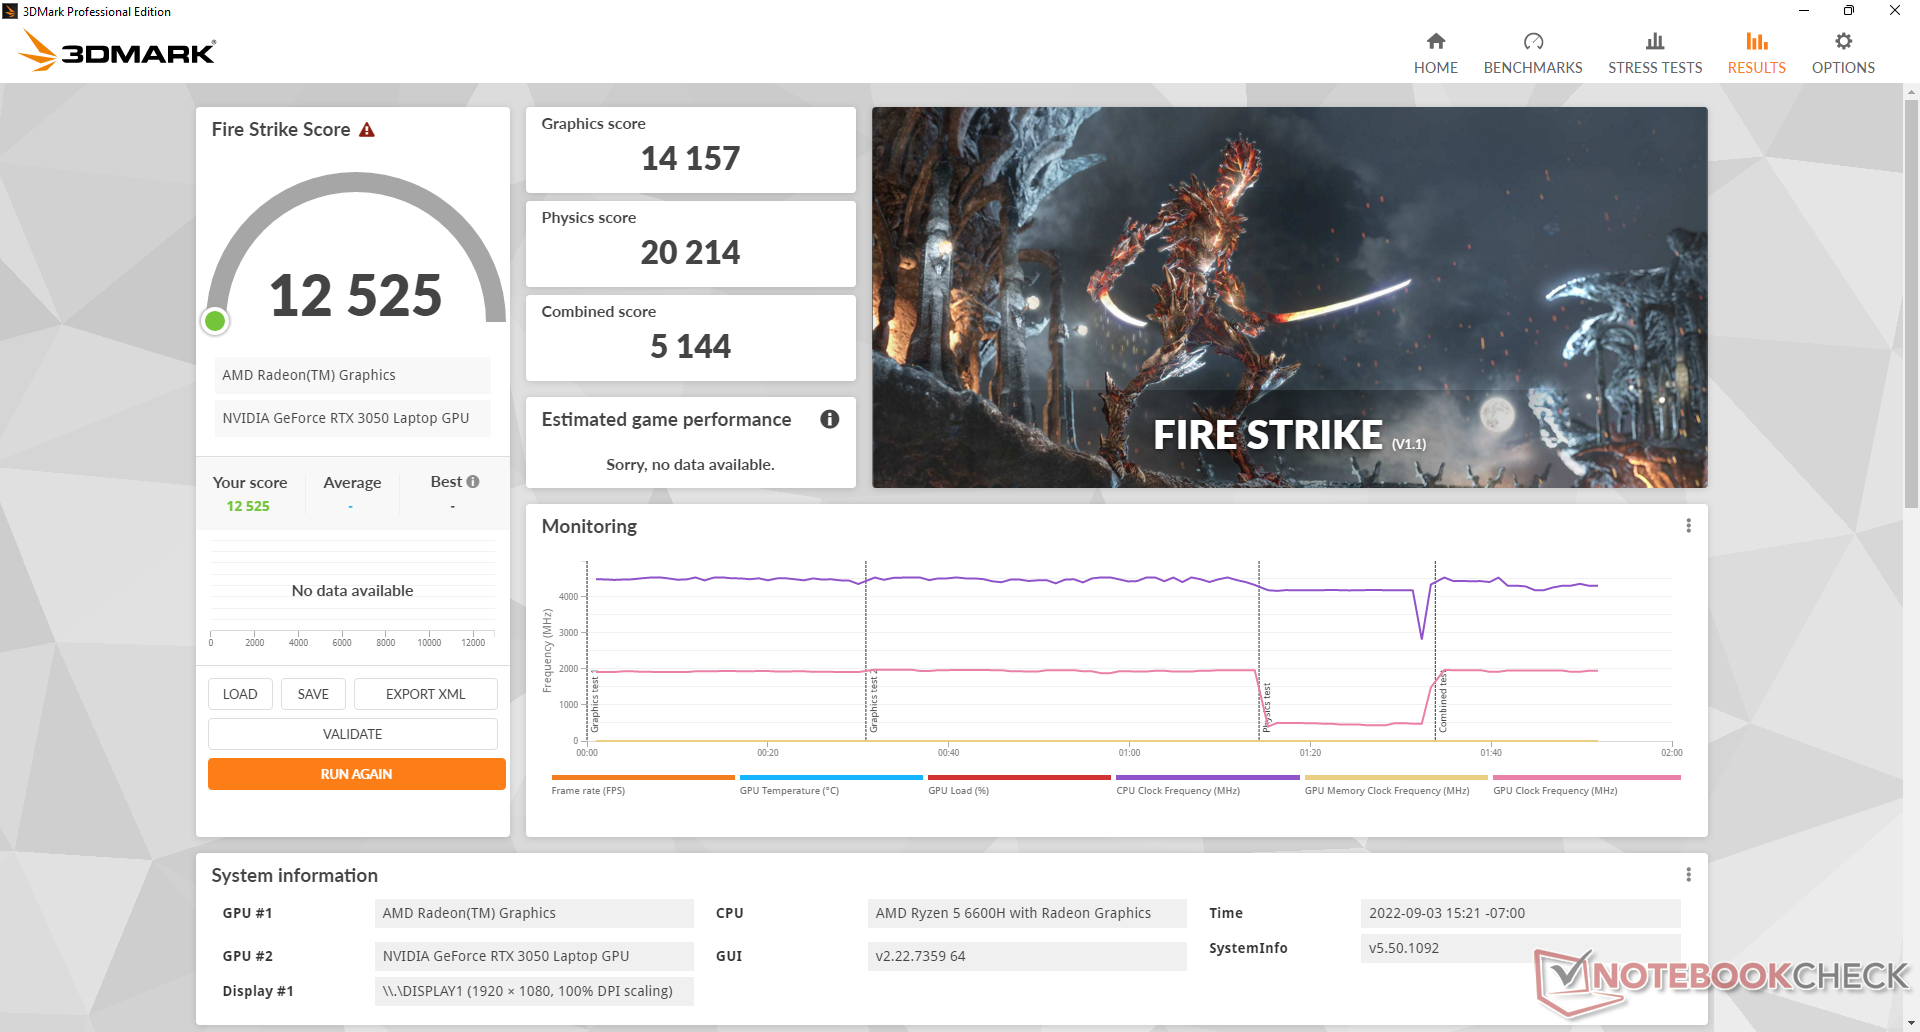
Les performances sont réduites si l'on utilise le profil d'alimentation Balanced. Un test sur Fire Strike en mode équilibré réduirait les performances graphiques de 8 % (14157 contre 12978 points) tandis que les performances du processeur resteraient à peu près les mêmes.
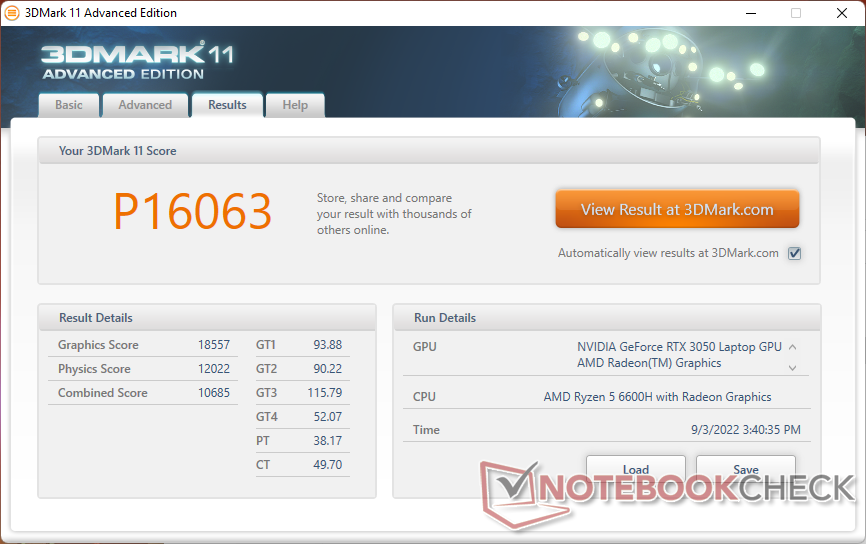

| 3DMark 11 Performance | 16063 points | |
| 3DMark Cloud Gate Standard Score | 37291 points | |
| 3DMark Fire Strike Score | 12525 points | |
| 3DMark Time Spy Score | 5453 points | |
Aide | ||
Witcher 3 FPS Chart
| Bas | Moyen | Élevé | Ultra | |
|---|---|---|---|---|
| GTA V (2015) | 144 | 133.3 | 103.5 | 60.3 |
| The Witcher 3 (2015) | 213.9 | 167.7 | 105.1 | 55.8 |
| Dota 2 Reborn (2015) | 117.2 | 106.4 | 100.6 | 95.2 |
| Final Fantasy XV Benchmark (2018) | 116.4 | 73.6 | 53.5 | |
| X-Plane 11.11 (2018) | 84.4 | 77.1 | 63.6 | |
| Strange Brigade (2018) | 248 | 134.7 | 109.1 | 95.1 |
| Cyberpunk 2077 1.6 (2022) | 72.9 | 62.4 | 45.5 | 36.5 |
Emissions - près de 50 dB(A) en jeu
Bruit du système
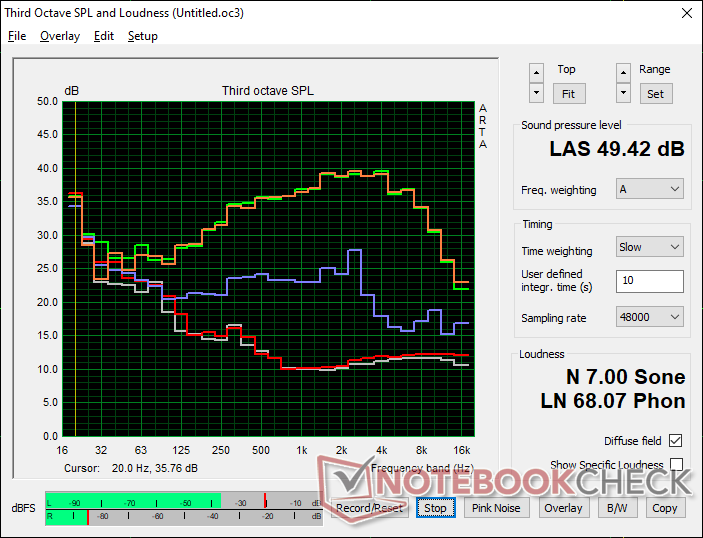
Le bruit du ventilateur au ralenti peut être aussi faible que 23,8 dB(A) ou aussi élevé que 27,3 dB(A) s'il est réglé sur le profil de puissance Performance. Par conséquent, le mode Performance n'est pas recommandé si vous vous contentez de naviguer sur le Web ou de lire en continu. Attendez-vous à un niveau sonore d'environ 31,4 dB(A) ou moins pour la plupart des charges quotidiennes.
Les ventilateurs peuvent atteindre 49,3 dB(A) en mode Performance, ce qui est comparable à la plupart des autres ordinateurs portables de jeu, y compris celui de Lenovo Legion 5 15. Le bruit des ventilateurs diminue sensiblement à 43,9 dB(A) si l'on joue avec le profil d'alimentation équilibré, mais cela se fait au détriment des performances graphiques, comme indiqué ci-dessus. Certains joueurs trouveront que la baisse des performances en vaut la peine pour une machine globalement plus silencieuse.
Degré de la nuisance sonore
| Au repos |
| 23.8 / 23.8 / 27.2 dB(A) |
| Fortement sollicité |
| 34.8 / 49.4 dB(A) |
 | ||
30 dB silencieux 40 dB(A) audible 50 dB(A) bruyant |
||
min: | ||
| Lenovo IdeaPad Gaming 3 15ARH7 GeForce RTX 3050 4GB Laptop GPU, R5 6600H, Lenovo UMIS AM630 RPJTJ256MGE1QDY | Lenovo IdeaPad Gaming 3i 15IMH05 GeForce GTX 1650 Mobile, i5-10300H, SK hynix BC511 HFM512GDHTNI-87A0B | Lenovo Legion 5 15ACH6A-82NW0010GE Radeon RX 6600M, R5 5600H, Micron 2210 MTFDHBA512QFD | Gigabyte A5 K1 GeForce RTX 3060 Laptop GPU, R5 5600H, ESR512GTLG-E6GBTNB4 | Asus TUF Dash F15 FX517ZR GeForce RTX 3070 Laptop GPU, i7-12650H, Samsung PM991a MZVLQ1T0HBLB | Dell G15 5510 GeForce RTX 3050 4GB Laptop GPU, i5-10500H, SK Hynix BC711 HFM512GD3HX015N | |
|---|---|---|---|---|---|---|
| Noise | -20% | -16% | -22% | -15% | -10% | |
| arrêt / environnement * (dB) | 23.3 | 30.7 -32% | 25 -7% | 26 -12% | 26 -12% | 26 -12% |
| Idle Minimum * (dB) | 23.8 | 30.7 -29% | 25 -5% | 26 -9% | 26 -9% | 26 -9% |
| Idle Average * (dB) | 23.8 | 30.7 -29% | 25 -5% | 29 -22% | 32 -34% | 27 -13% |
| Idle Maximum * (dB) | 27.2 | 30.7 -13% | 34.5 -27% | 32 -18% | 33 -21% | 33 -21% |
| Load Average * (dB) | 34.8 | 49.7 -43% | 51.1 -47% | 57 -64% | 48 -38% | 45 -29% |
| Witcher 3 ultra * (dB) | 49.3 | 47 5% | 56 -14% | 47 5% | 45 9% | |
| Load Maximum * (dB) | 49.4 | 50.3 -2% | 51.3 -4% | 58 -17% | 49 1% | 47 5% |
* ... Moindre est la valeur, meilleures sont les performances
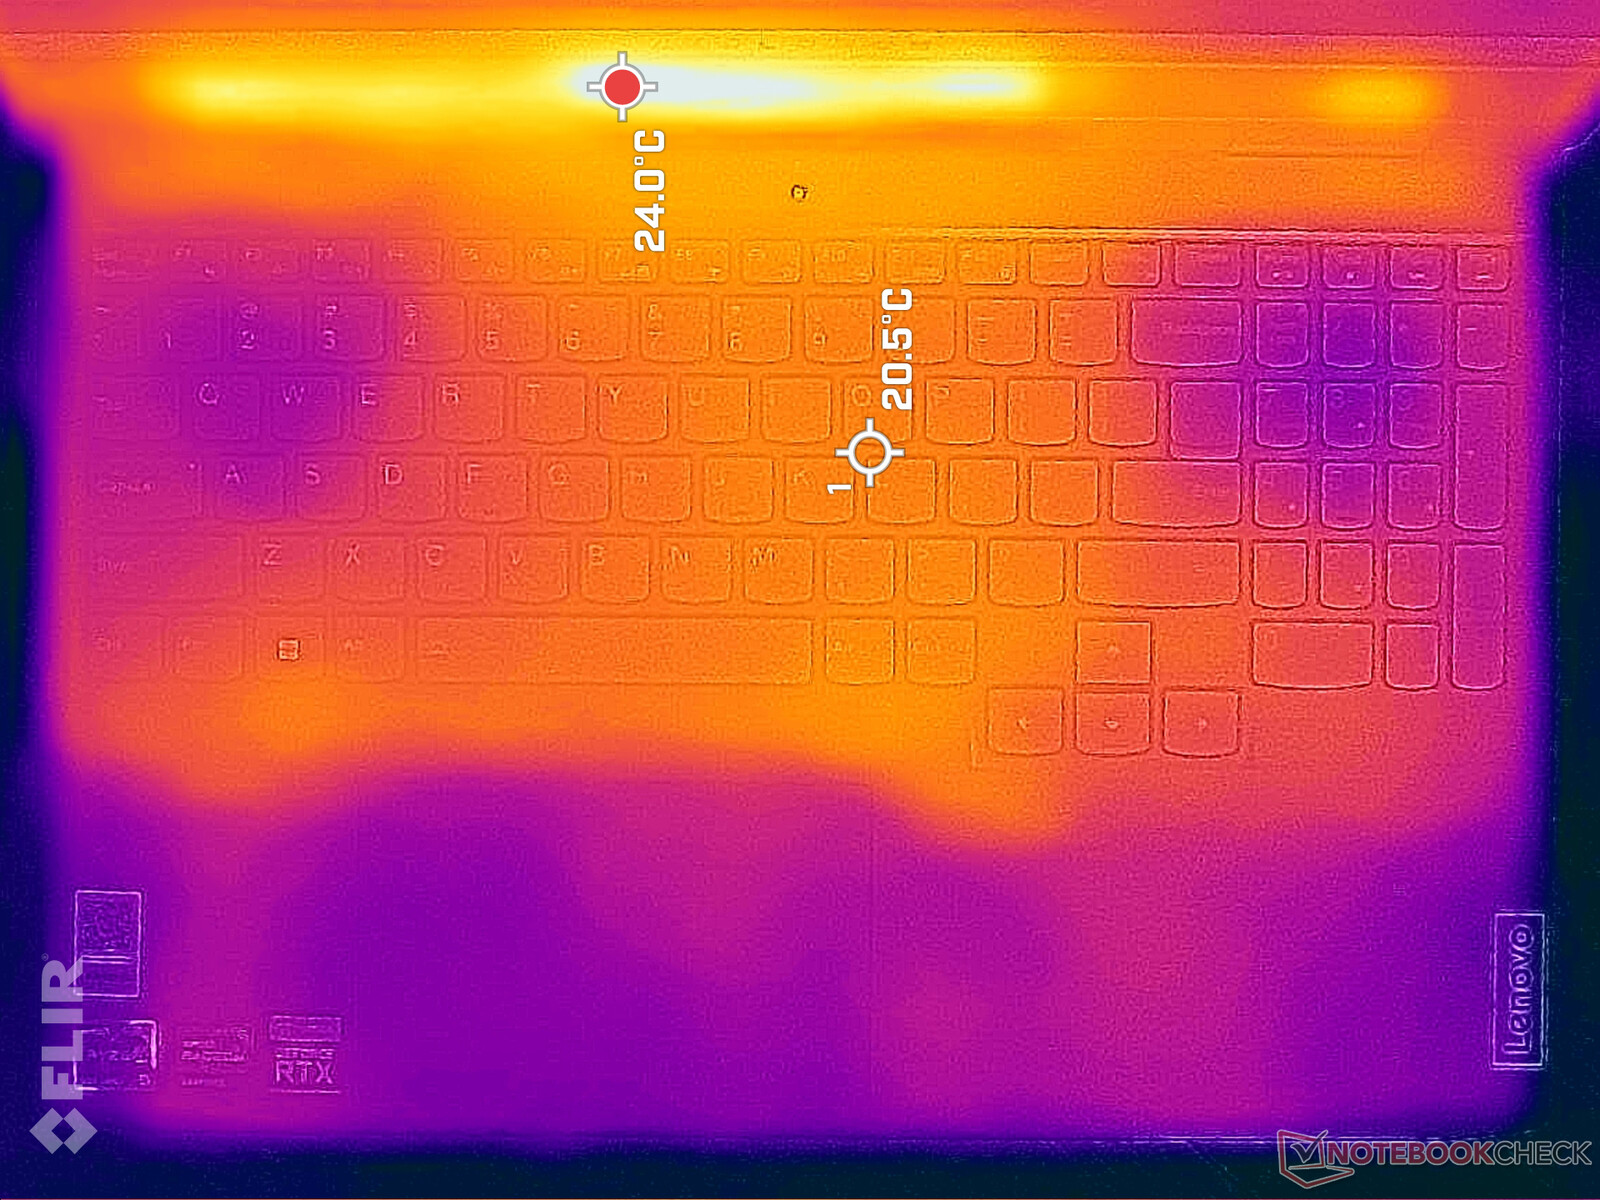
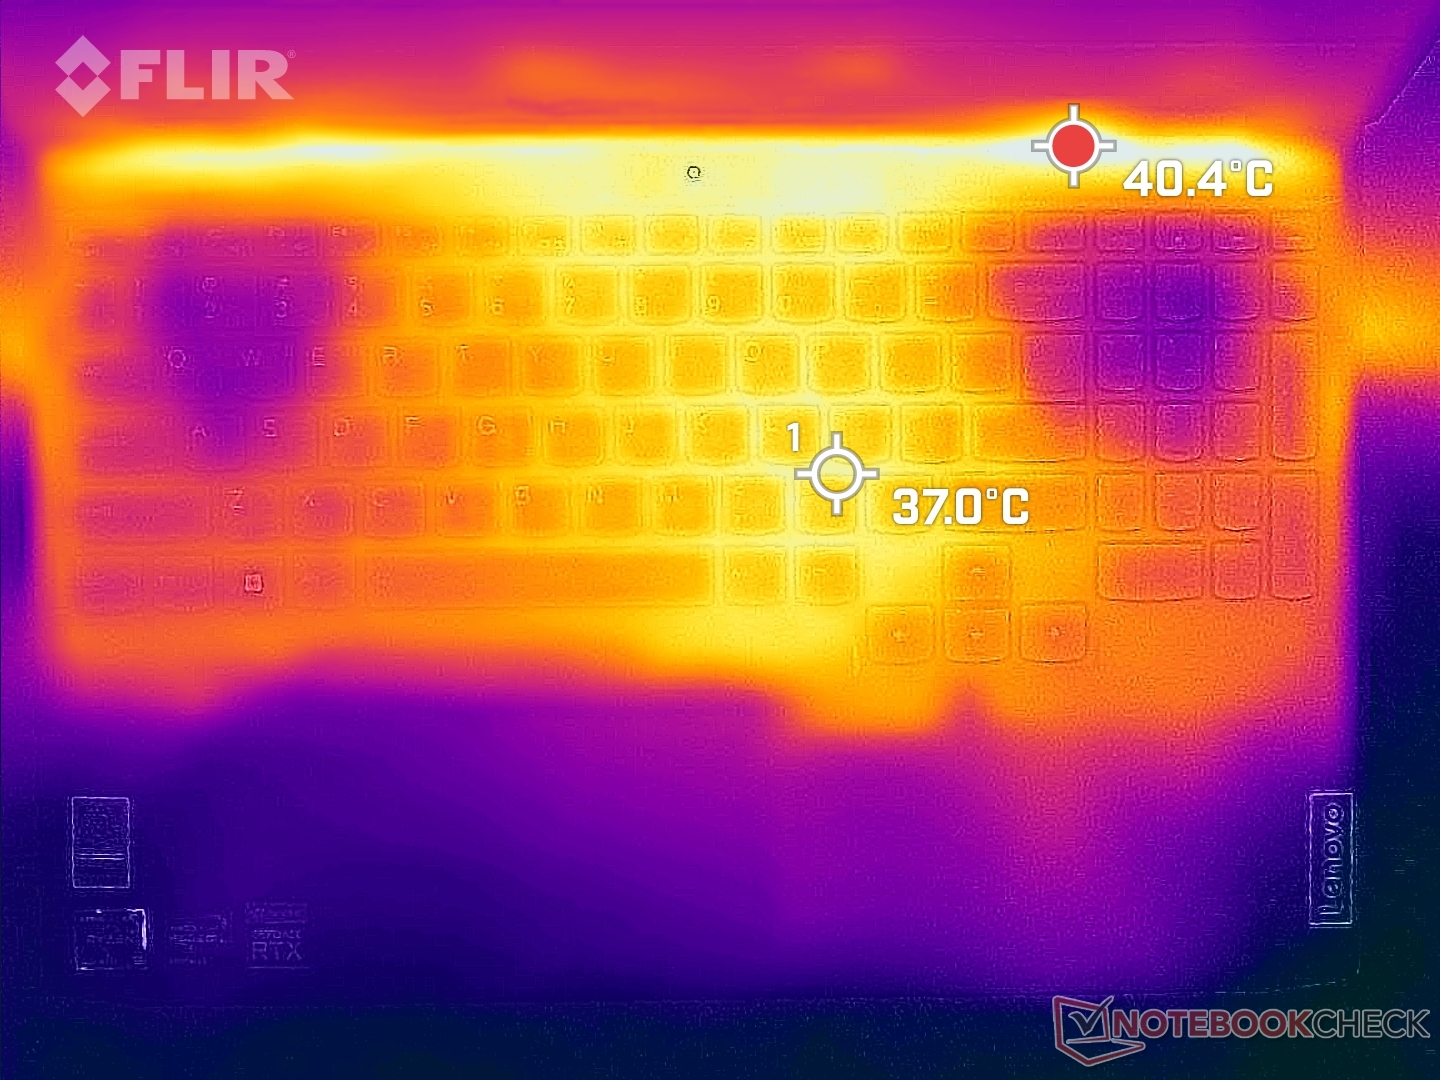
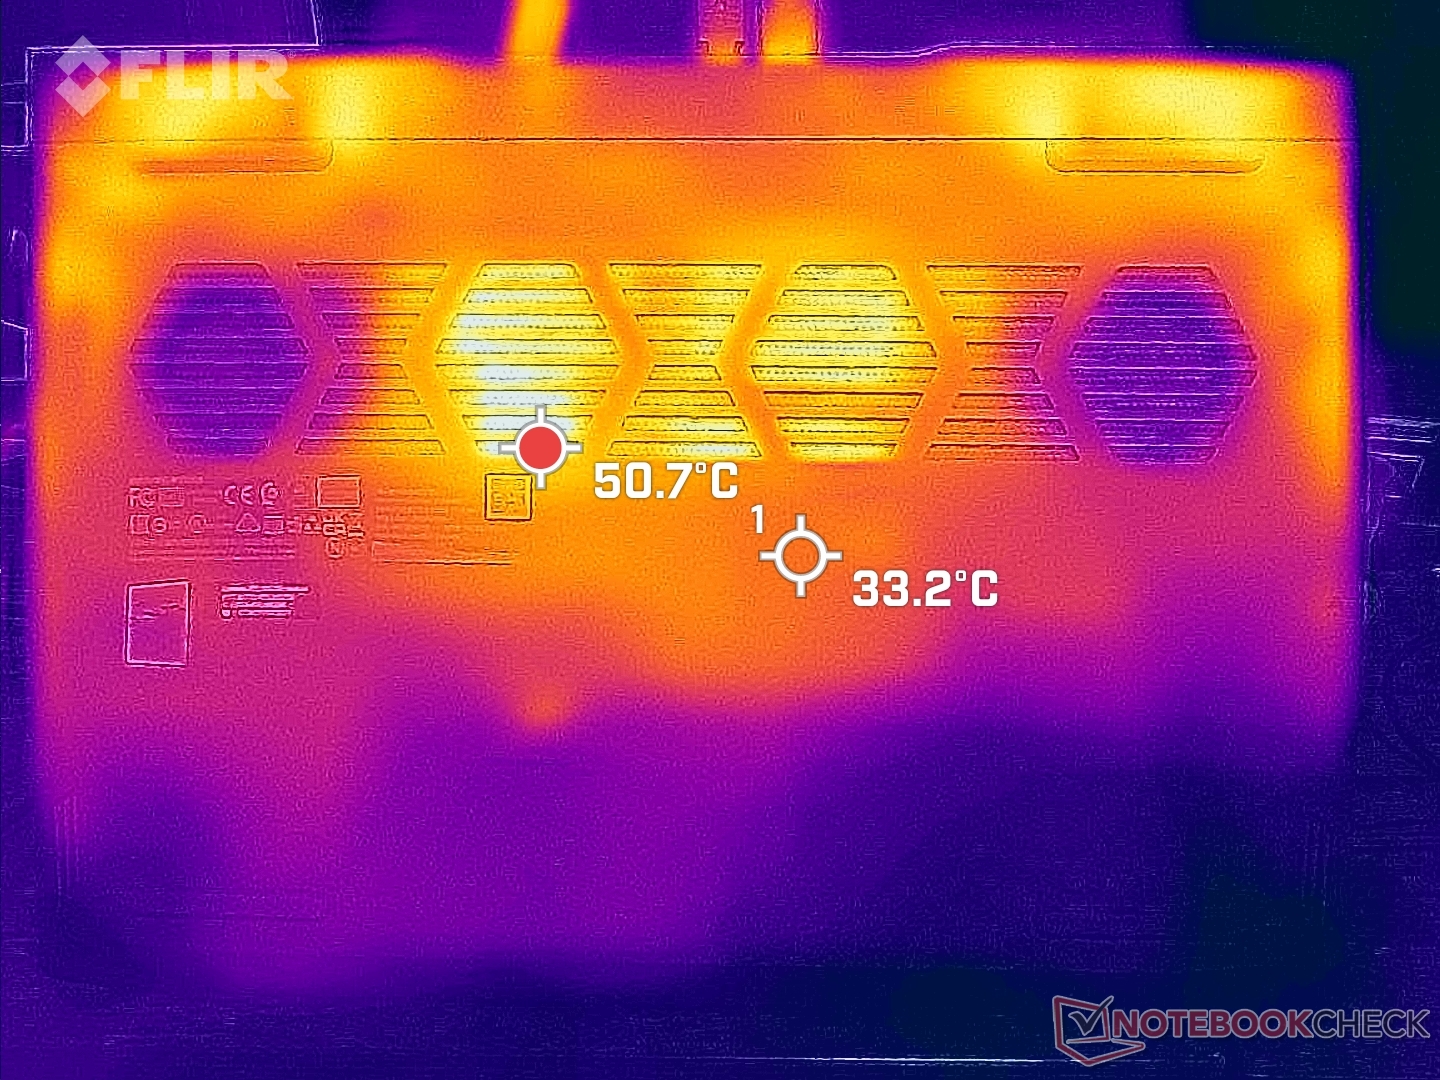
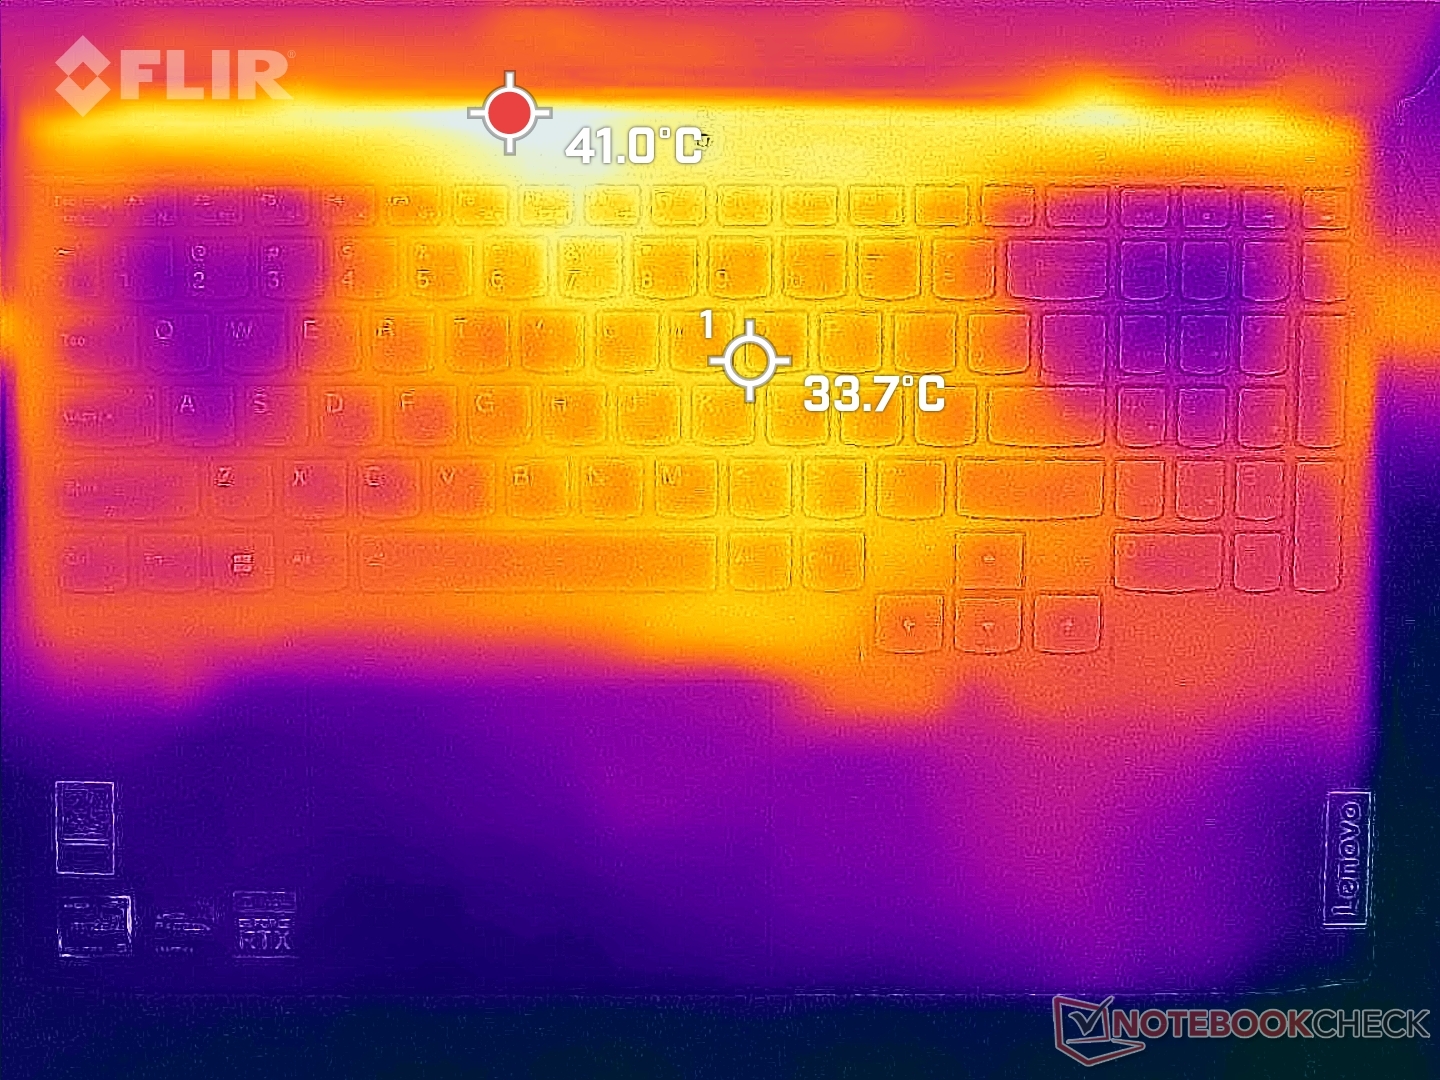
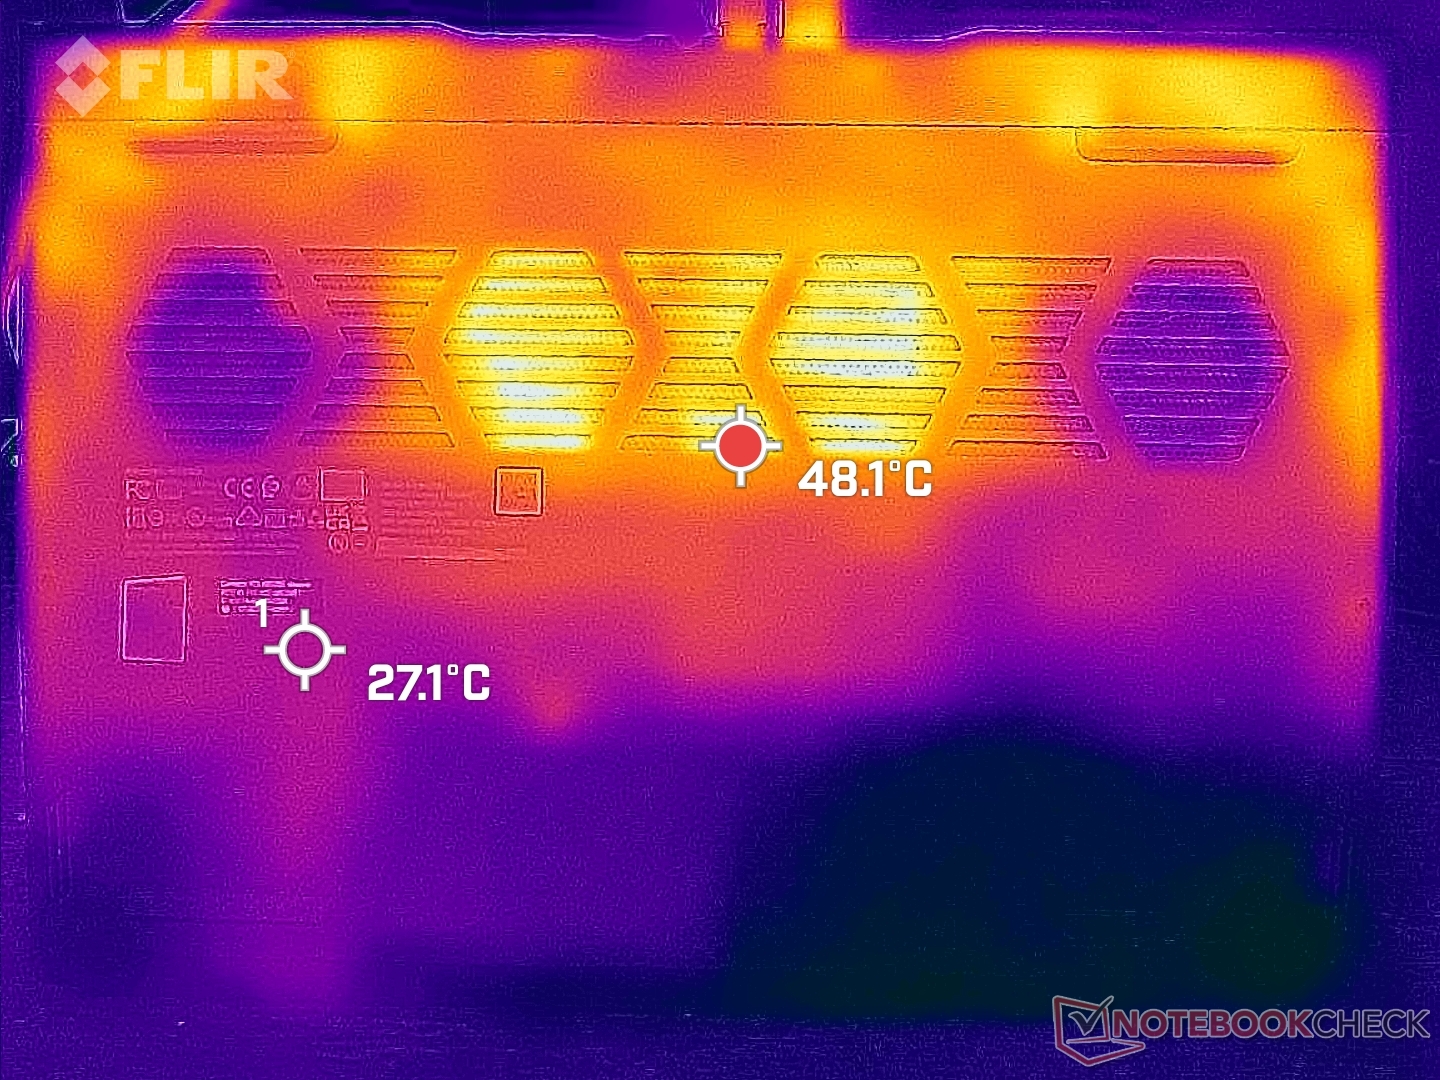
Température
Les températures de surface sont les plus chaudes près du centre du clavier, tandis que les touches WASD et numpad sont beaucoup plus fraîches car l'air frais est aspiré par ces touches, comme le montrent les cartes de température ci-dessous. C'est mieux que sur l'ancien IdeaPad Gaming 3i 15IMH05 ou leDell G15 5510 qui ont des touches WASD plus chaudes en comparaison. Le point chaud du clavier peut atteindre 43°C lors des jeux, ce qui reste comparable aux points chauds des IdeaPad et Dell G15 susmentionnés.
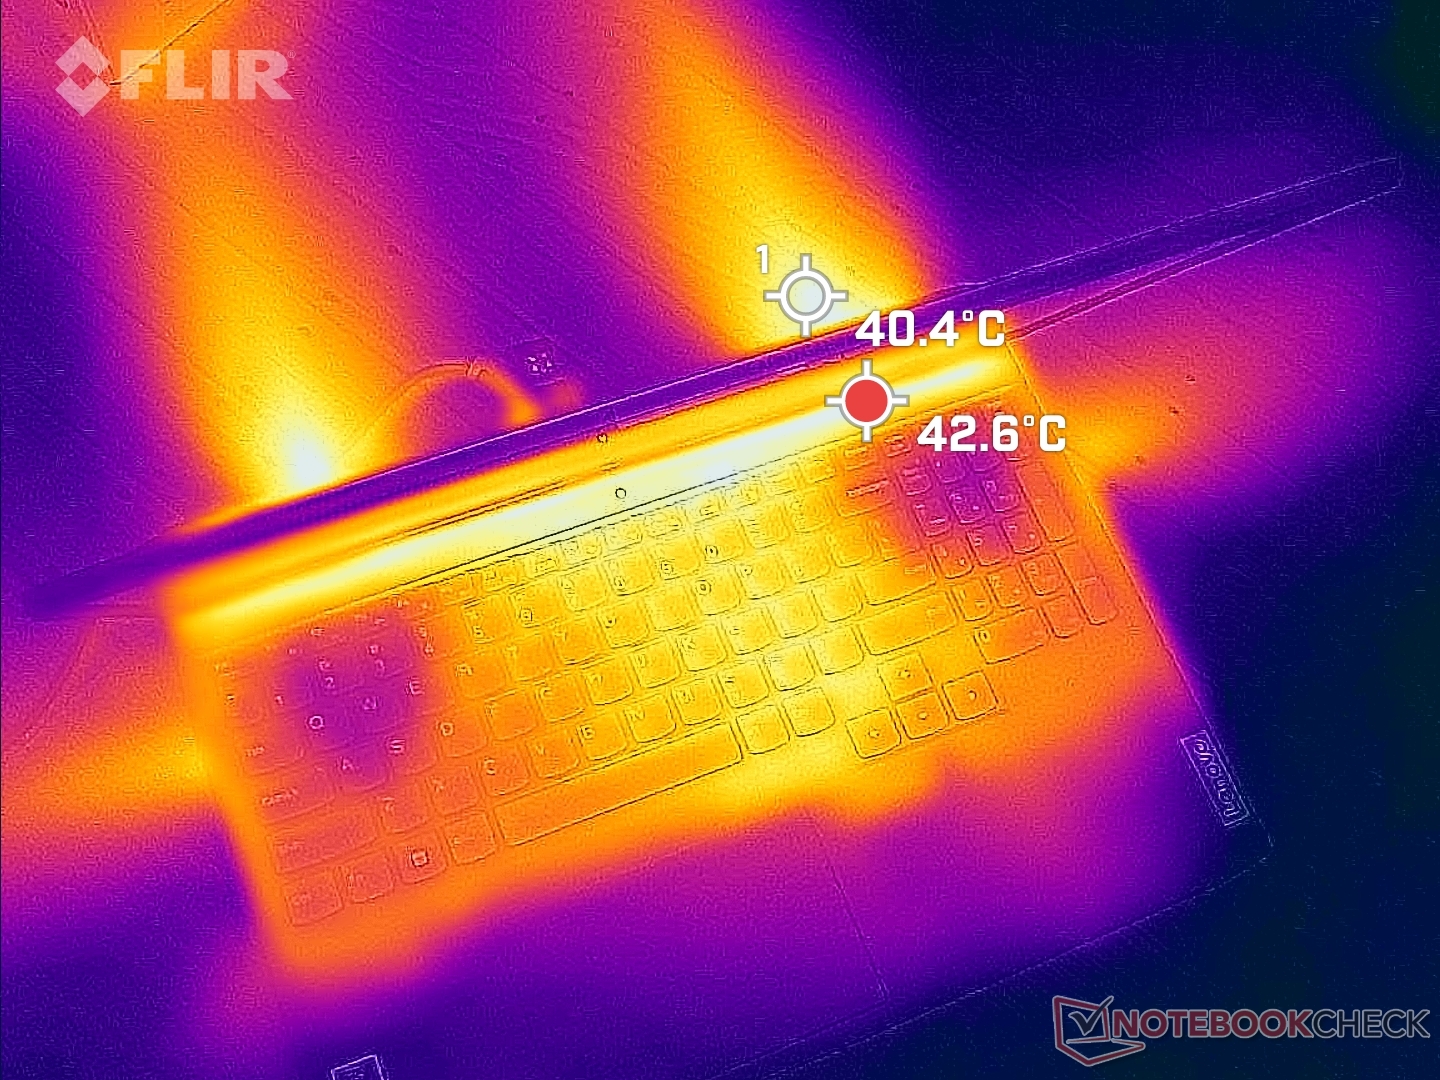
(-) La température maximale du côté supérieur est de 47.6 °C / 118 F, par rapport à la moyenne de 40.4 °C / 105 F, allant de 21.2 à 68.8 °C pour la classe Gaming.
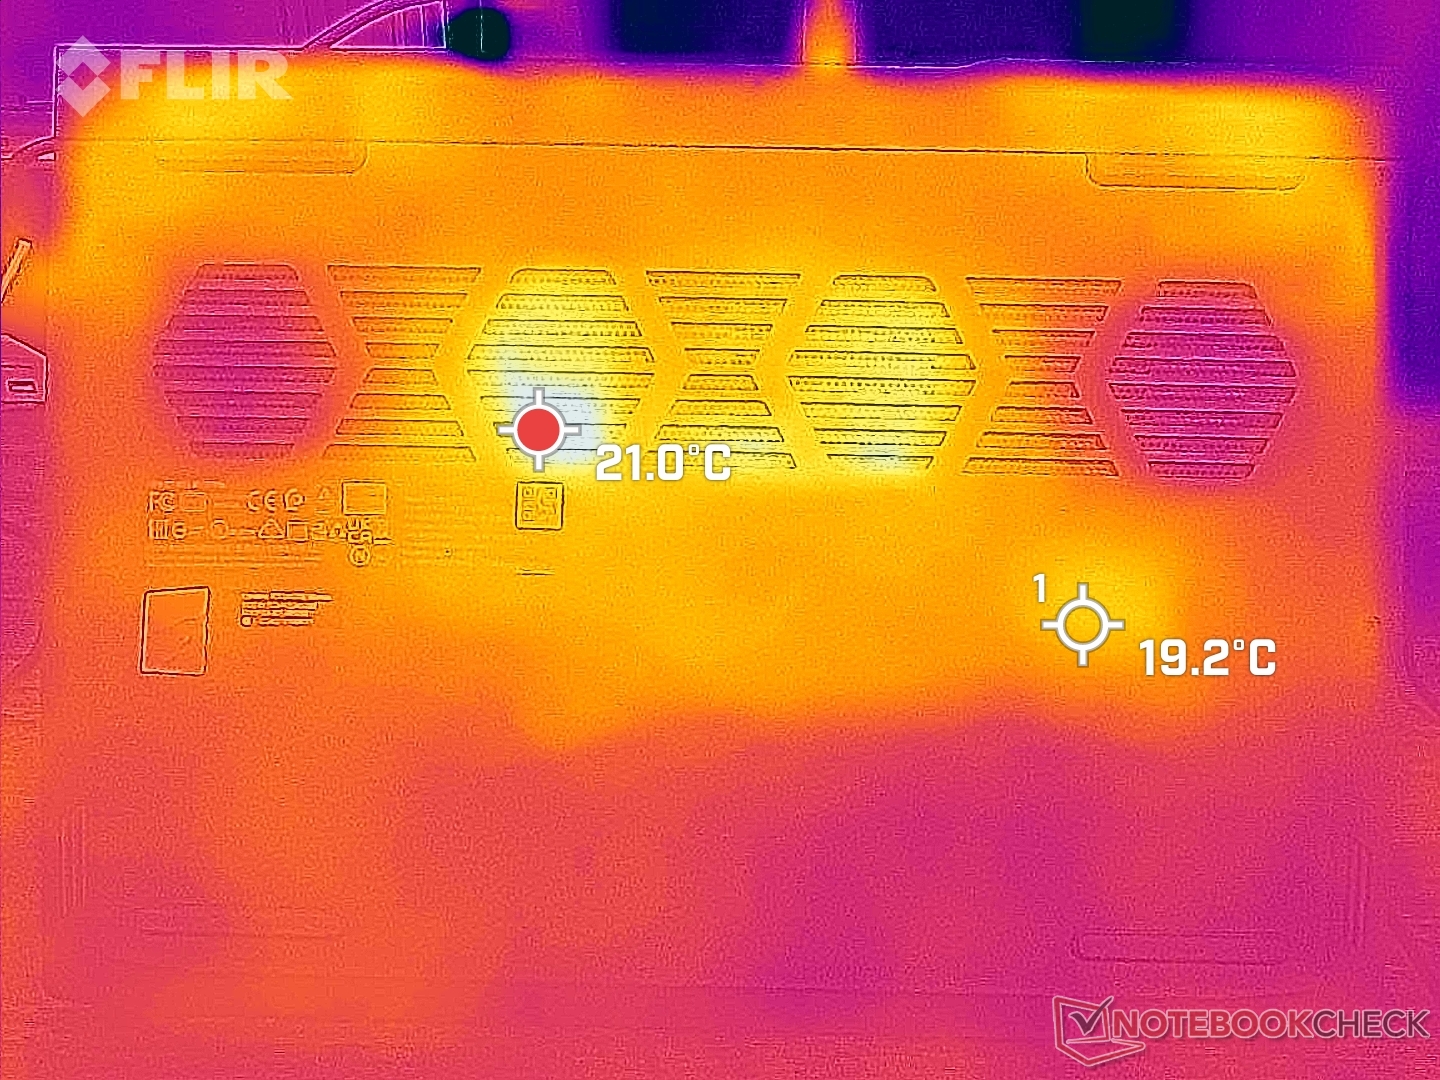
(-) Le fond chauffe jusqu'à un maximum de 46.6 °C / 116 F, contre une moyenne de 43.2 °C / 110 F
(+) En utilisation inactive, la température moyenne du côté supérieur est de 25.7 °C / 78 F, par rapport à la moyenne du dispositif de 33.9 °C / 93 F.
(±) En jouant à The Witcher 3, la température moyenne du côté supérieur est de 36.4 °C / 98 F, alors que la moyenne de l'appareil est de 33.9 °C / 93 F.
(+) Les repose-poignets et le pavé tactile atteignent la température maximale de la peau (34.2 °C / 93.6 F) et ne sont donc pas chauds.
(-) La température moyenne de la zone de l'appui-paume de dispositifs similaires était de 28.8 °C / 83.8 F (-5.4 °C / #-9.8 F).
| Lenovo IdeaPad Gaming 3 15ARH7 AMD Ryzen 5 6600H, NVIDIA GeForce RTX 3050 4GB Laptop GPU | Lenovo IdeaPad Gaming 3i 15IMH05 Intel Core i5-10300H, NVIDIA GeForce GTX 1650 Mobile | Lenovo Legion 5 15ACH6A-82NW0010GE AMD Ryzen 5 5600H, AMD Radeon RX 6600M | Gigabyte A5 K1 AMD Ryzen 5 5600H, NVIDIA GeForce RTX 3060 Laptop GPU | Asus TUF Dash F15 FX517ZR Intel Core i7-12650H, NVIDIA GeForce RTX 3070 Laptop GPU | Dell G15 5510 Intel Core i5-10500H, NVIDIA GeForce RTX 3050 4GB Laptop GPU | |
|---|---|---|---|---|---|---|
| Heat | 0% | -5% | -11% | -19% | -2% | |
| Maximum Upper Side * (°C) | 47.6 | 43 10% | 39.9 16% | 50 -5% | 52 -9% | 52 -9% |
| Maximum Bottom * (°C) | 46.6 | 50.6 -9% | 43.8 6% | 51 -9% | 52 -12% | 49 -5% |
| Idle Upper Side * (°C) | 27.2 | 27.2 -0% | 34.1 -25% | 30 -10% | 33 -21% | 26 4% |
| Idle Bottom * (°C) | 27.2 | 27.5 -1% | 31.7 -17% | 33 -21% | 36 -32% | 26 4% |
* ... Moindre est la valeur, meilleures sont les performances
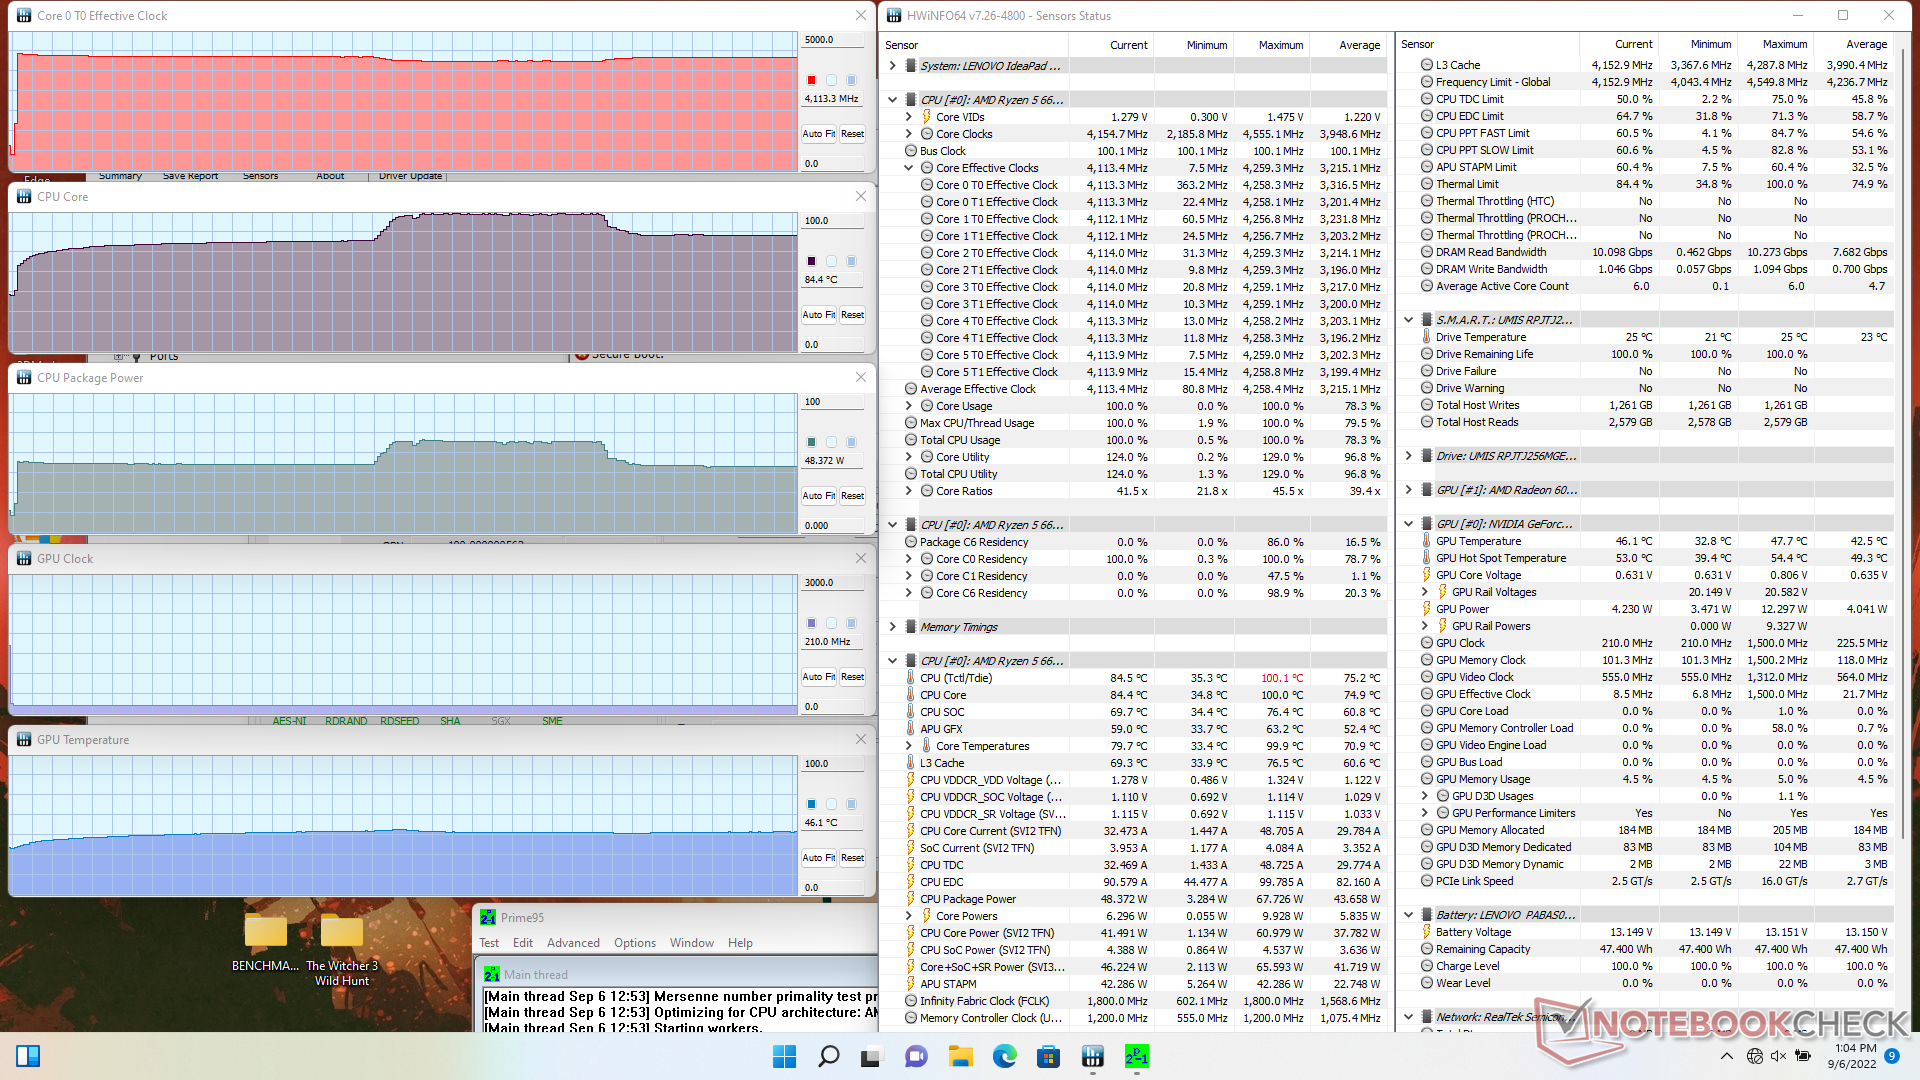
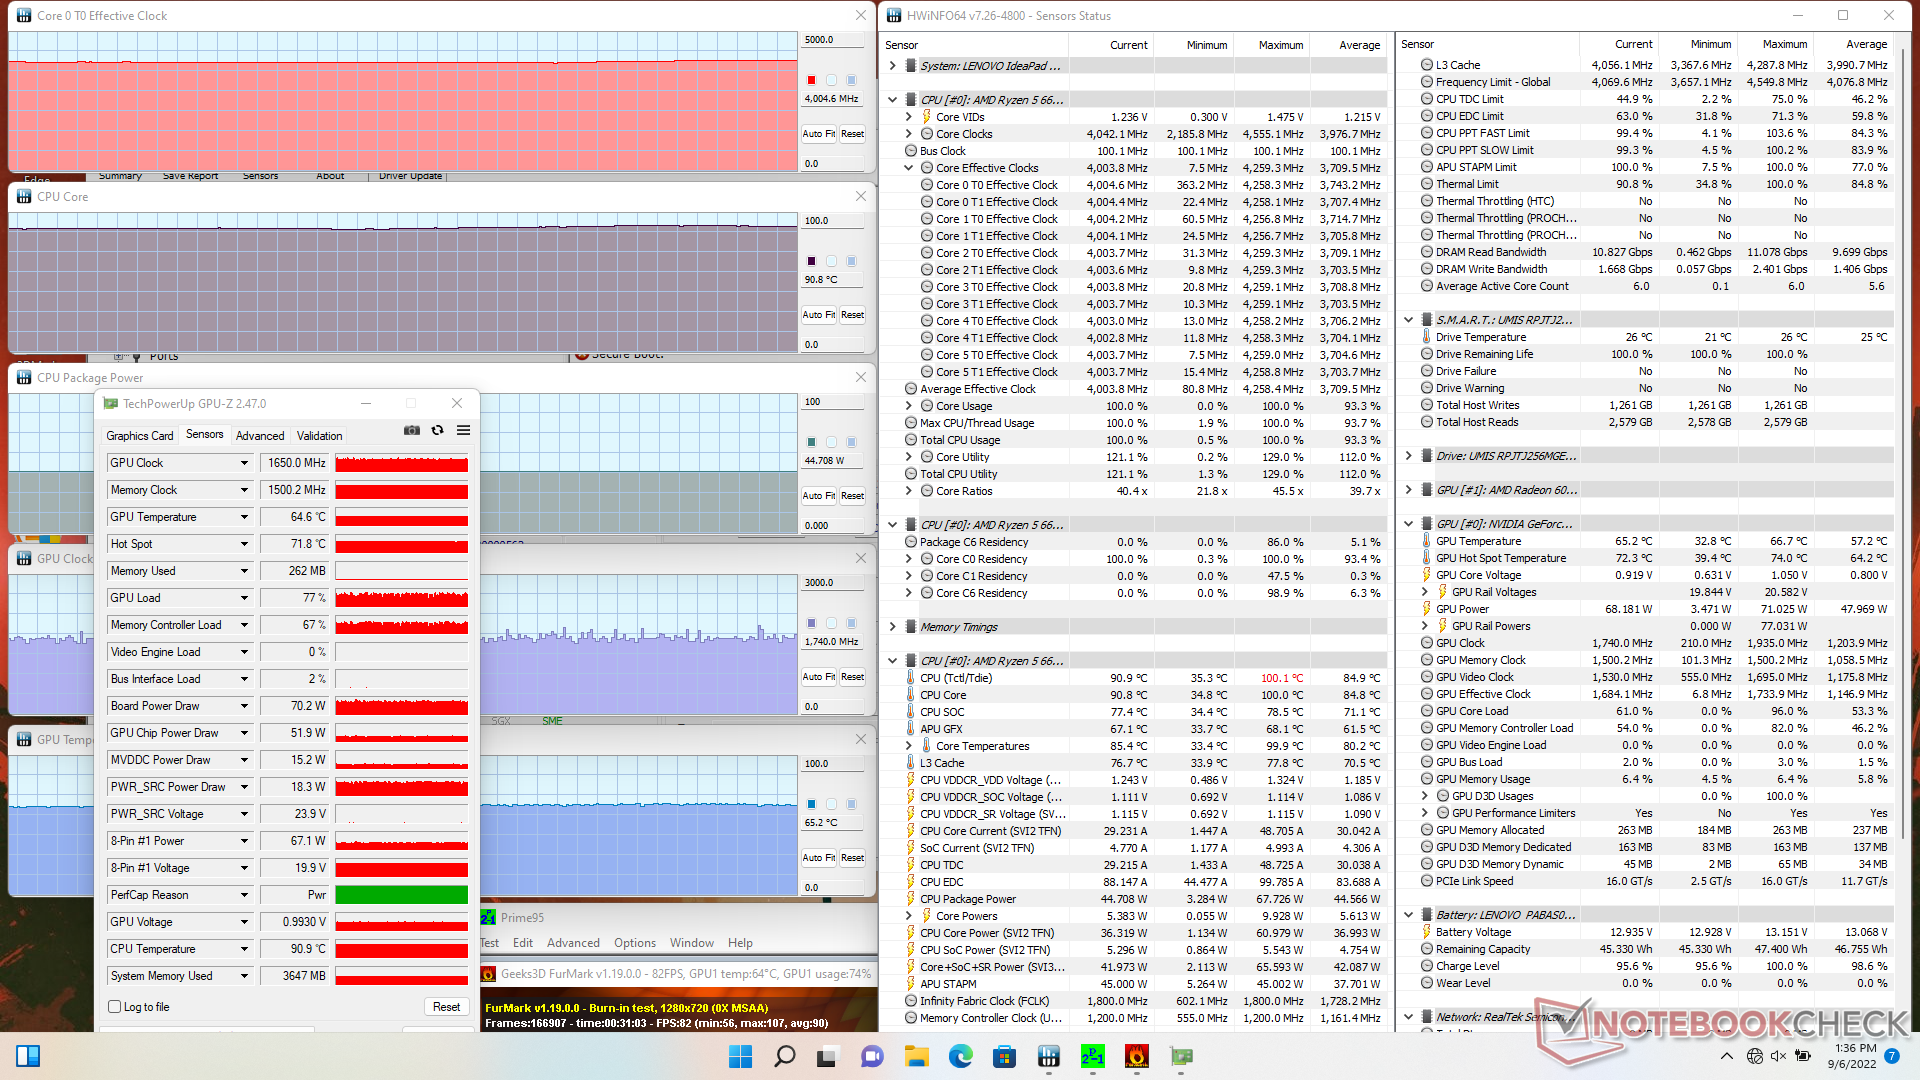
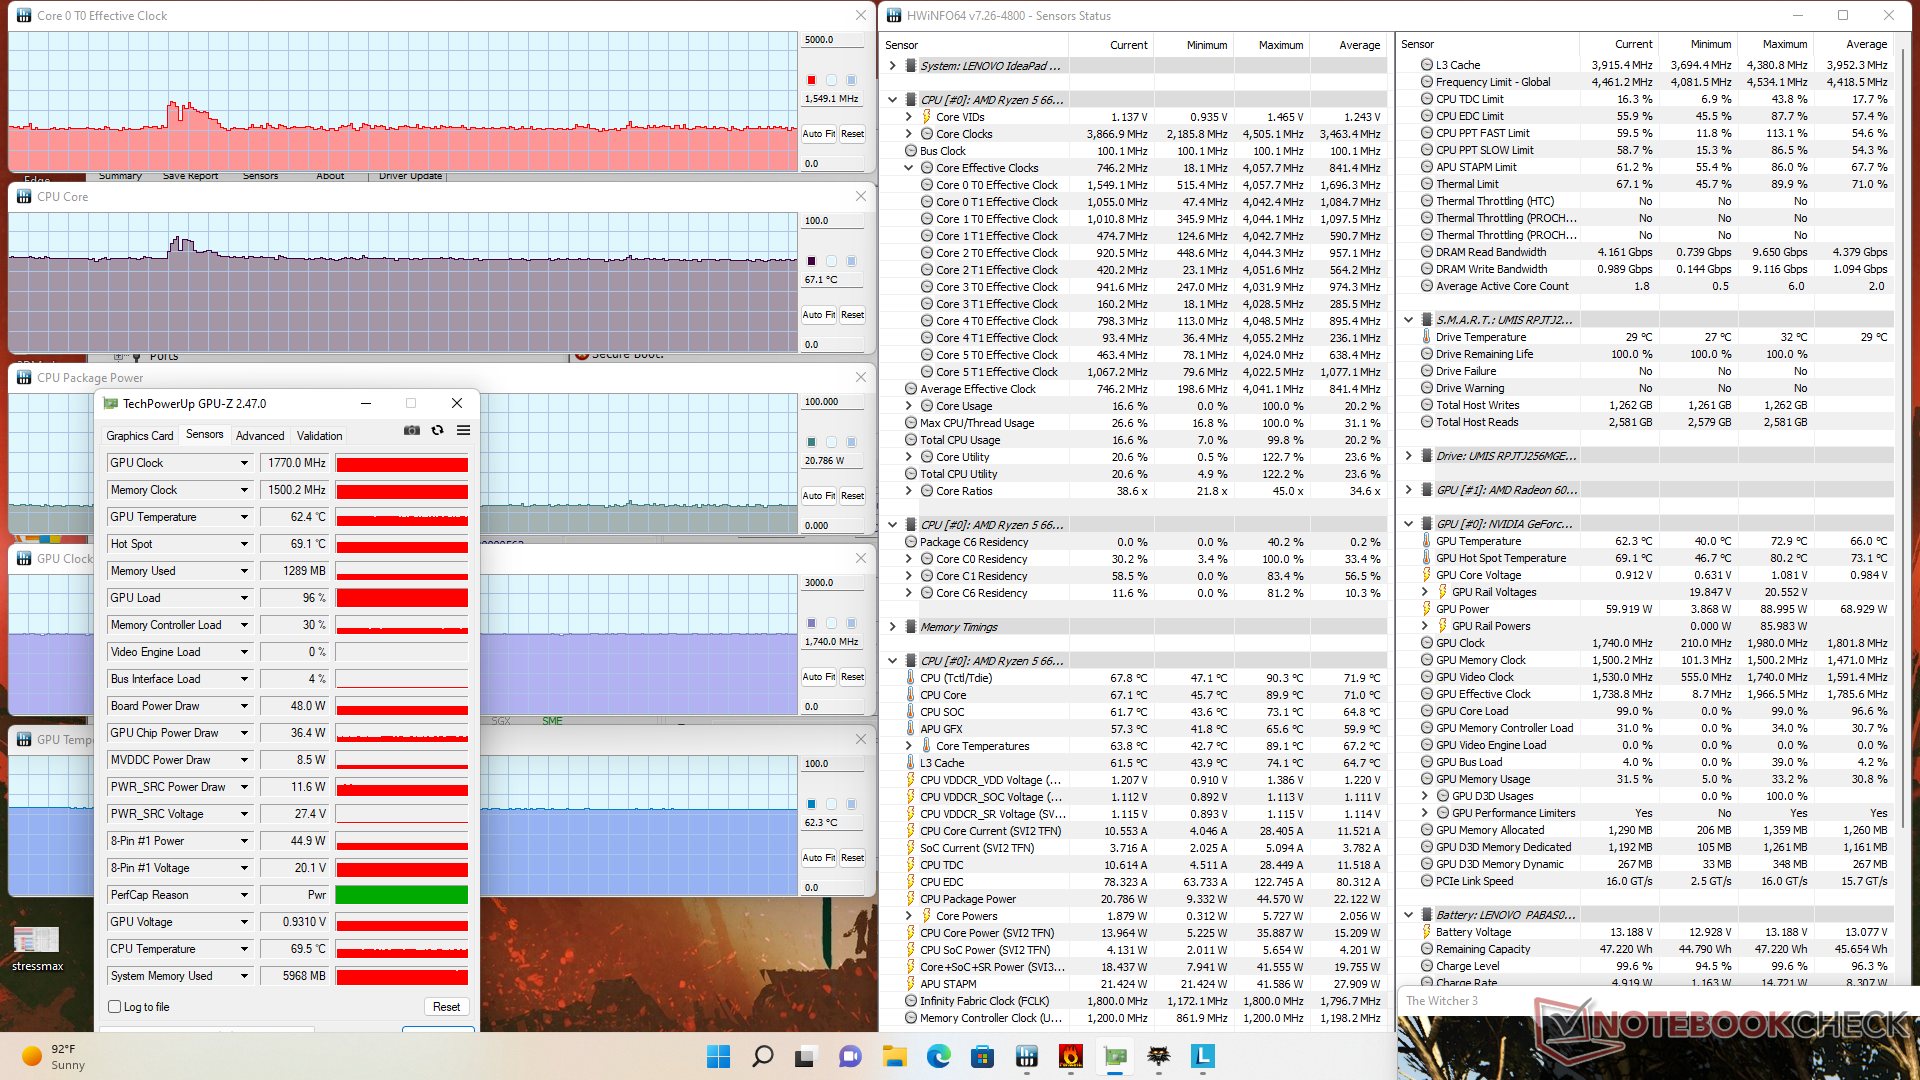
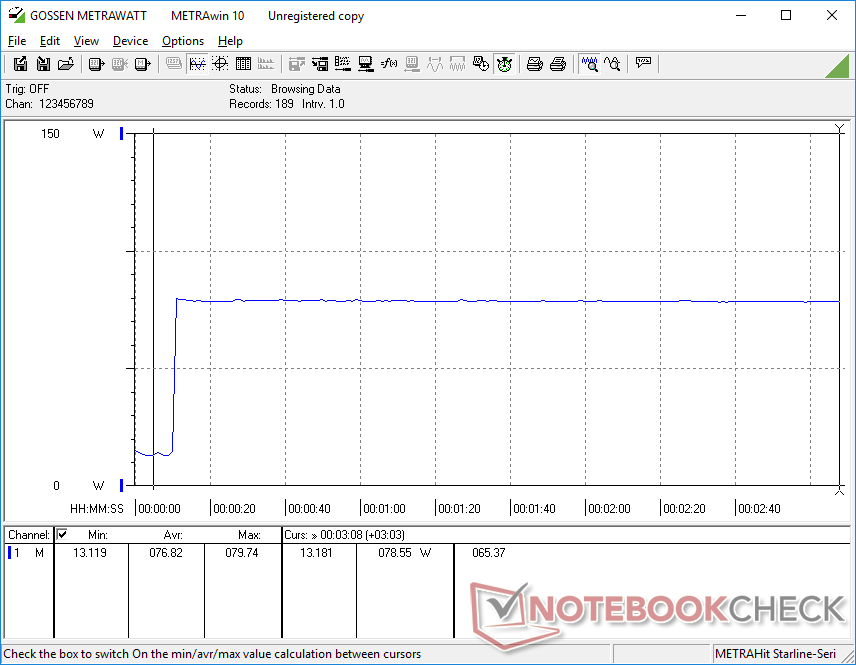
Test de stress
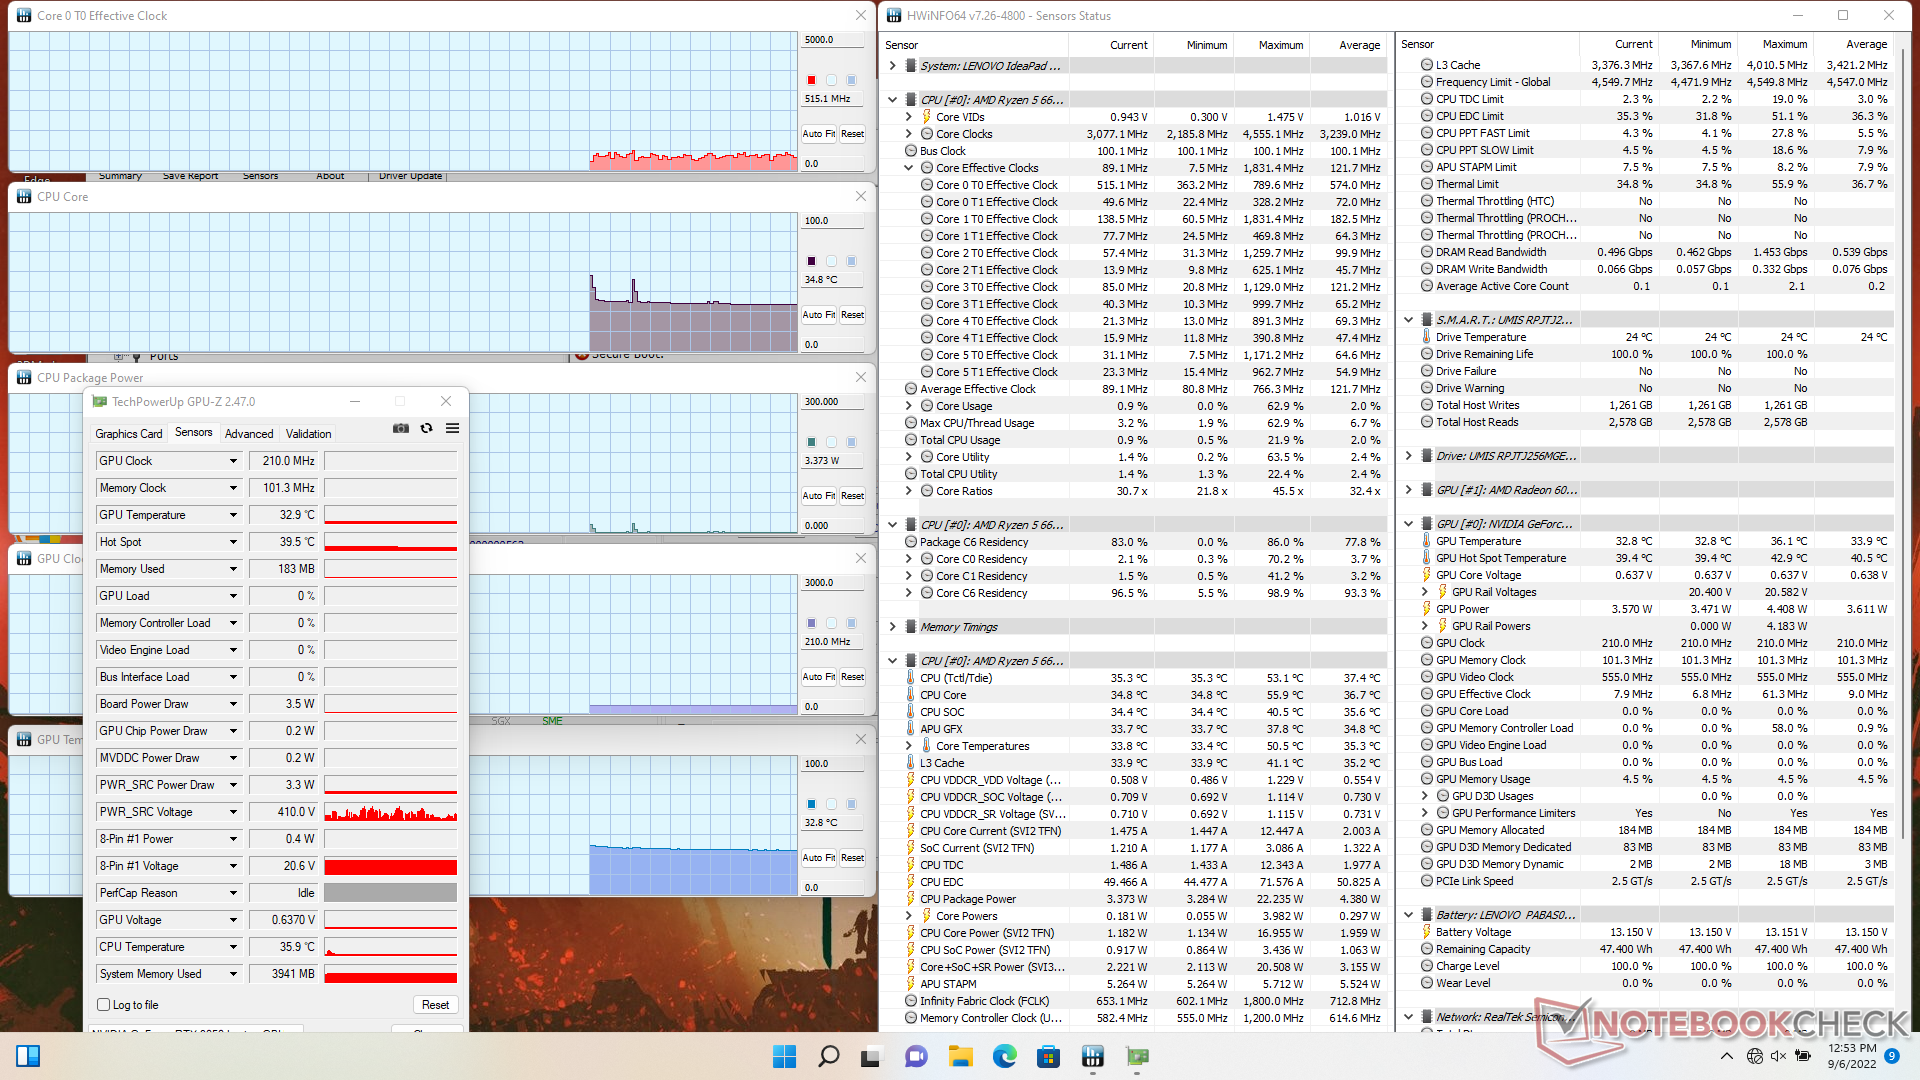
Lors de l'exécution de Prime95 pour stresser le CPU, les fréquences d'horloge et la température atteignent 4,3 GHz et 70 C, respectivement, avec une consommation d'énergie de 51 W. Il est intéressant de noter que la température du cœur et la consommation d'énergie de la carte après quelques minutes atteignent 67 W et 100 C, respectivement, avant de redescendre à 48 W et 84 C, comme le montre la capture d'écran ci-dessous. Le processeur ne souffre d'aucun étranglement même lorsqu'il est soumis à une utilisation à 100 % pendant de longues périodes, ce qui est cohérent avec nos résultats CineBench R15 xT ci-dessus.
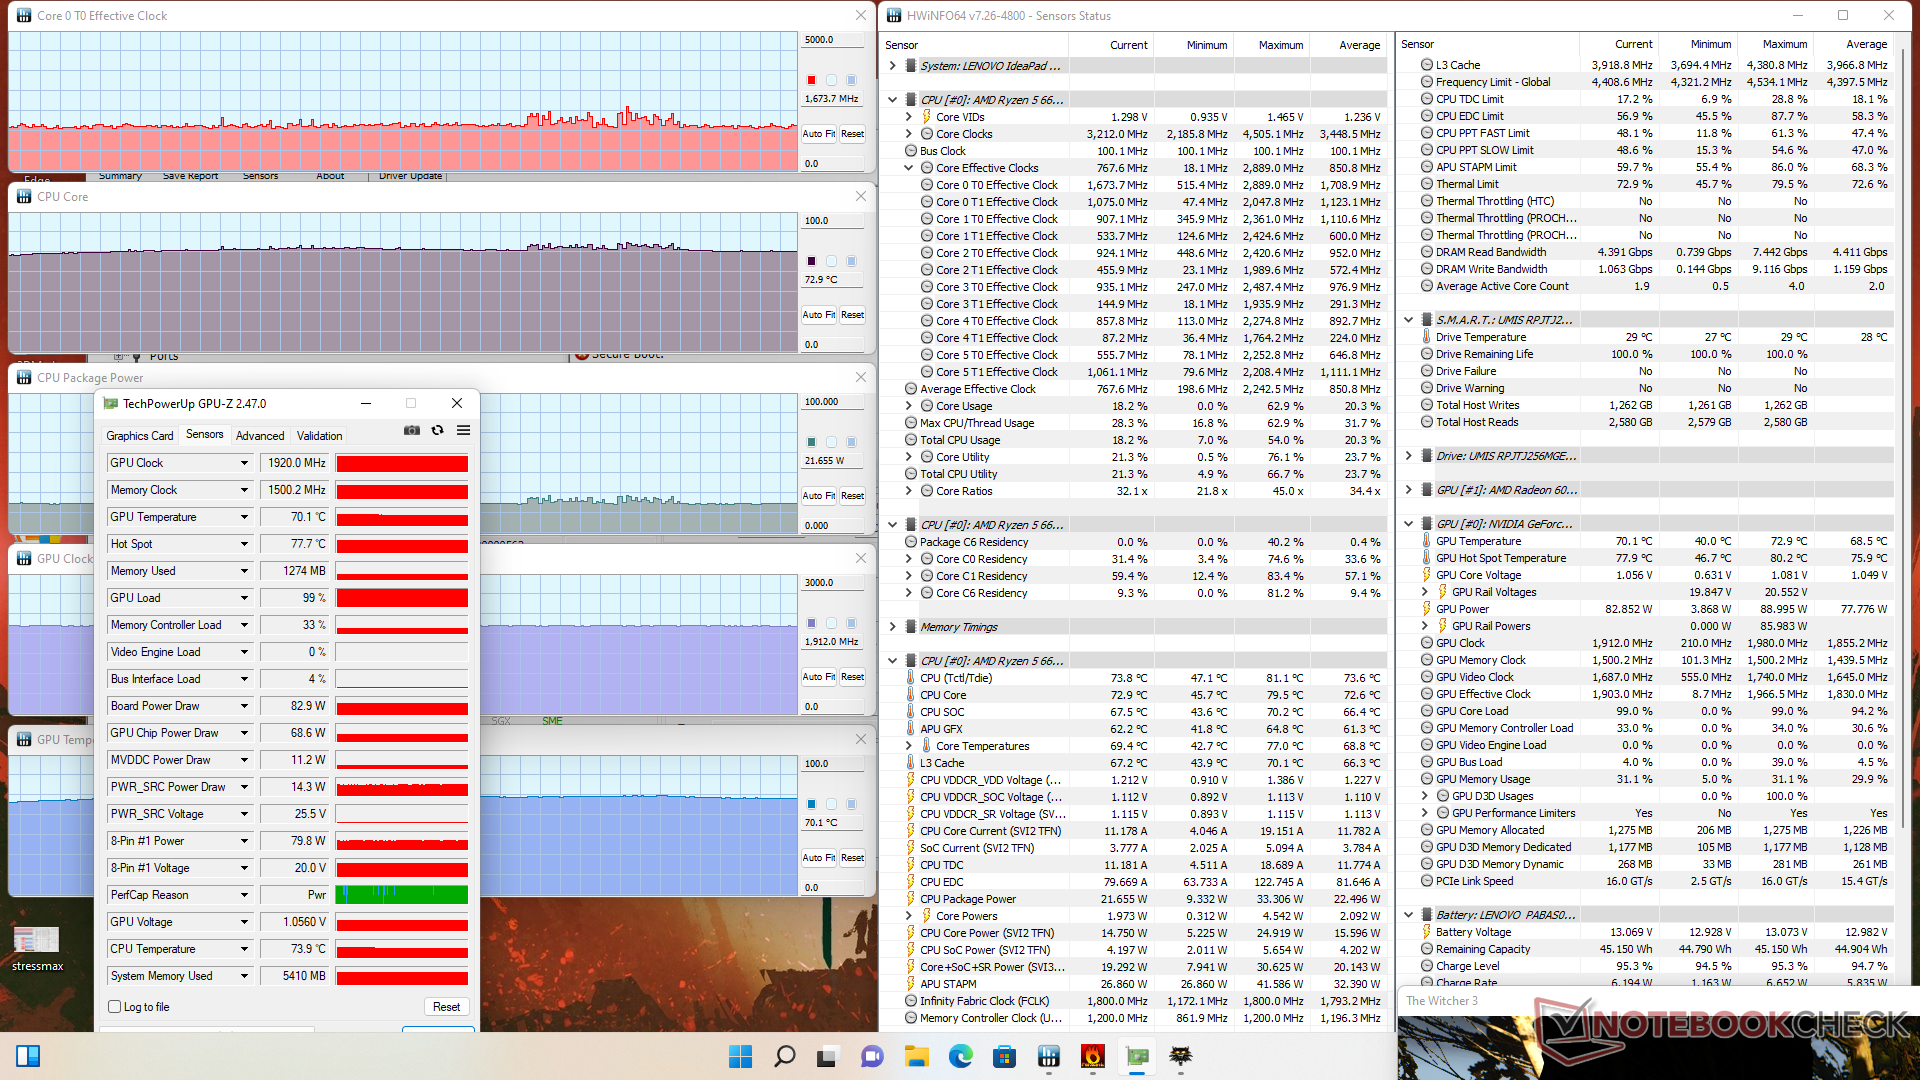
La fréquence d'horloge, la température et la consommation d'énergie du GPU en mode Performance Witcher 3 en mode Performance se stabilisent à 1920 MHz, 70 C et 83 W, respectivement, contre 1770 MHz, 62 C et 48 W en mode Équilibré. Le bruit du ventilateur étant réduit en mode Équilibré, les utilisateurs doivent supporter le bruit maximal du ventilateur de l'ordinateur portable en mode Performance s'ils souhaitent exploiter le GPU au maximum.
Le fonctionnement sur batterie limite la puissance du GPU plus que celle du CPU. Un test sur Fire Strike sur batteries donnerait des scores de physique et de graphisme de 19770 et 9119 points, respectivement, contre 20214 et 14157 points sur secteur.
| Fréquence CPU (GHz) | Fréquence GPU (MHz) | Température CPU moyenne (°C) | Température GPU moyenne (°C) | |
| Système en veille | -- | -- | 35 | 33 |
| Prime95 Stress | 4.0 - 4.1 | -- | 85 | 46 |
| Prime95 + FurMark Stress | 4.0 | 1650 | 91 | 65 |
| Witcher 3 Stress (mode Performance) | 1.7 | 1920 | 73 | 70 |
| Witcher 3 Stress (mode équilibré) | 1.6 | 1770 | 67 | 62 |
Haut-parleurs
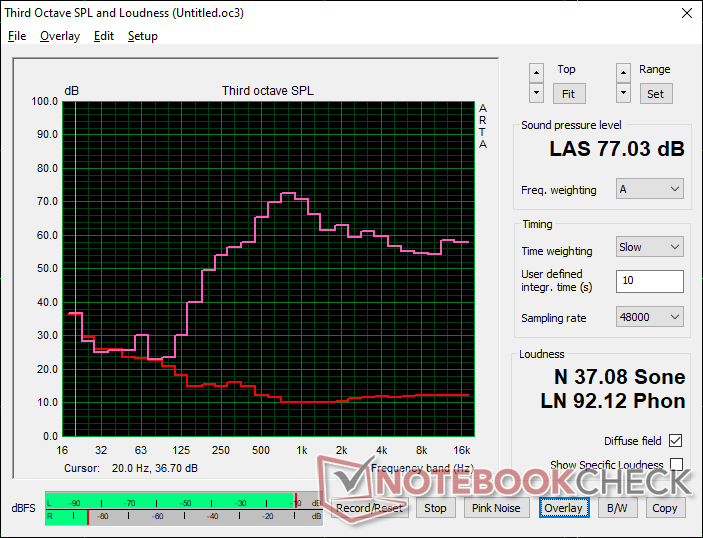
Lenovo IdeaPad Gaming 3 15ARH7 analyse audio
(±) | le niveau sonore du haut-parleur est moyen mais bon (77# dB)
Basses 100 - 315 Hz
(-) | presque aucune basse - en moyenne 15.6% plus bas que la médiane
(±) | la linéarité des basses est moyenne (12.2% delta à la fréquence précédente)
Médiums 400 - 2000 Hz
(±) | médiane supérieure - en moyenne 8% supérieure à la médiane
(±) | la linéarité des médiums est moyenne (7.7% delta à la fréquence précédente)
Aiguës 2 - 16 kHz
(+) | des sommets équilibrés - à seulement 2.5% de la médiane
(+) | les aigus sont linéaires (3.8% delta à la fréquence précédente)
Globalement 100 - 16 000 Hz
(±) | la linéarité du son global est moyenne (18.8% de différence avec la médiane)
Par rapport à la même classe
» 62% de tous les appareils testés de cette catégorie étaient meilleurs, 8% similaires, 30% pires
» Le meilleur avait un delta de 6%, la moyenne était de 18%, le pire était de 132%.
Par rapport à tous les appareils testés
» 43% de tous les appareils testés étaient meilleurs, 8% similaires, 49% pires
» Le meilleur avait un delta de 4%, la moyenne était de 24%, le pire était de 134%.
Apple MacBook Pro 16 2021 M1 Pro analyse audio
(+) | les haut-parleurs peuvent jouer relativement fort (84.7# dB)
Basses 100 - 315 Hz
(+) | bonne basse - seulement 3.8% loin de la médiane
(+) | les basses sont linéaires (5.2% delta à la fréquence précédente)
Médiums 400 - 2000 Hz
(+) | médiane équilibrée - seulement 1.3% de la médiane
(+) | les médiums sont linéaires (2.1% delta à la fréquence précédente)
Aiguës 2 - 16 kHz
(+) | des sommets équilibrés - à seulement 1.9% de la médiane
(+) | les aigus sont linéaires (2.7% delta à la fréquence précédente)
Globalement 100 - 16 000 Hz
(+) | le son global est linéaire (4.6% différence à la médiane)
Par rapport à la même classe
» 0% de tous les appareils testés de cette catégorie étaient meilleurs, 0% similaires, 100% pires
» Le meilleur avait un delta de 5%, la moyenne était de 17%, le pire était de 45%.
Par rapport à tous les appareils testés
» 0% de tous les appareils testés étaient meilleurs, 0% similaires, 100% pires
» Le meilleur avait un delta de 4%, la moyenne était de 24%, le pire était de 134%.
Gestion de l'énergie - similaire à la dernière génération
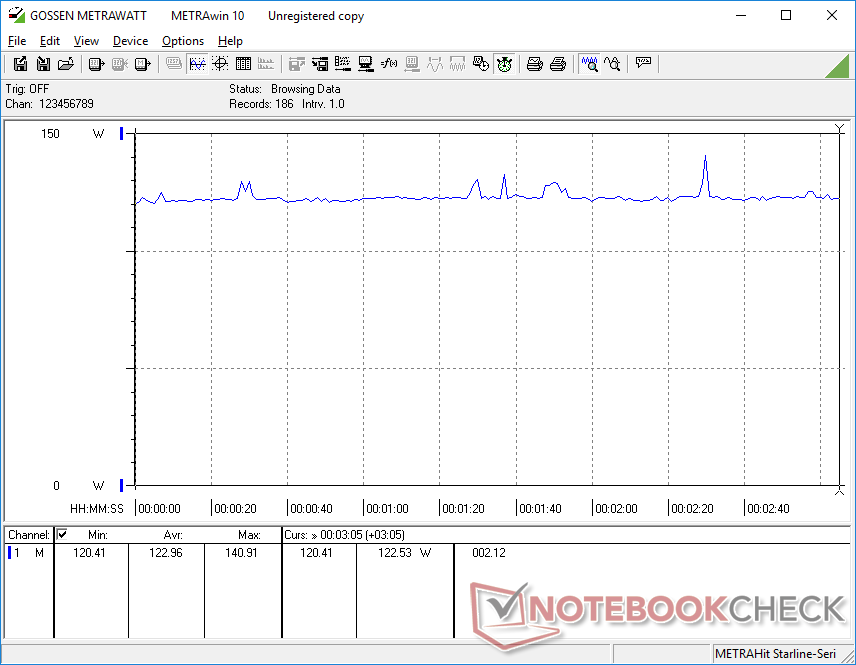
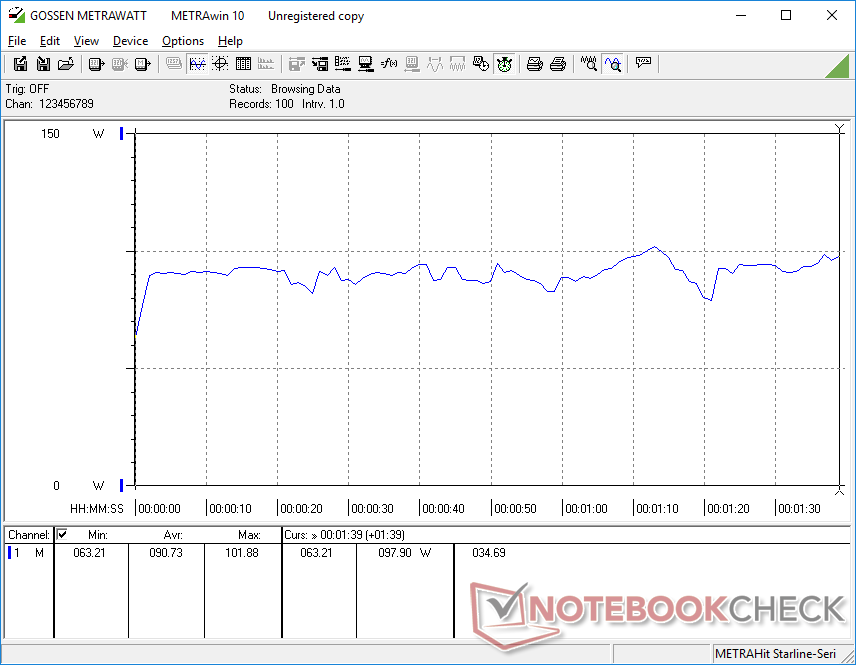
Consommation d'énergie
La consommation varie entre 90 W et 123 W lors des jeux, contre 103 W et 140 W sur le Dell G5 5510 équipé du même GPU mais d'un CPU Core i5-10500H de 10e génération. La consommation est généralement plus faible sur notre Lenovo lors de l'exécution de Prime95, malgré une augmentation de 40 % des performances par rapport au Core i5, ce qui permet d'obtenir un meilleur rendement par watt. Cependant, il n'est pas plus efficace que le Ryzen 5 5600H, ce qui fait que le 6600H ressemble encore plus à un changement de marque.
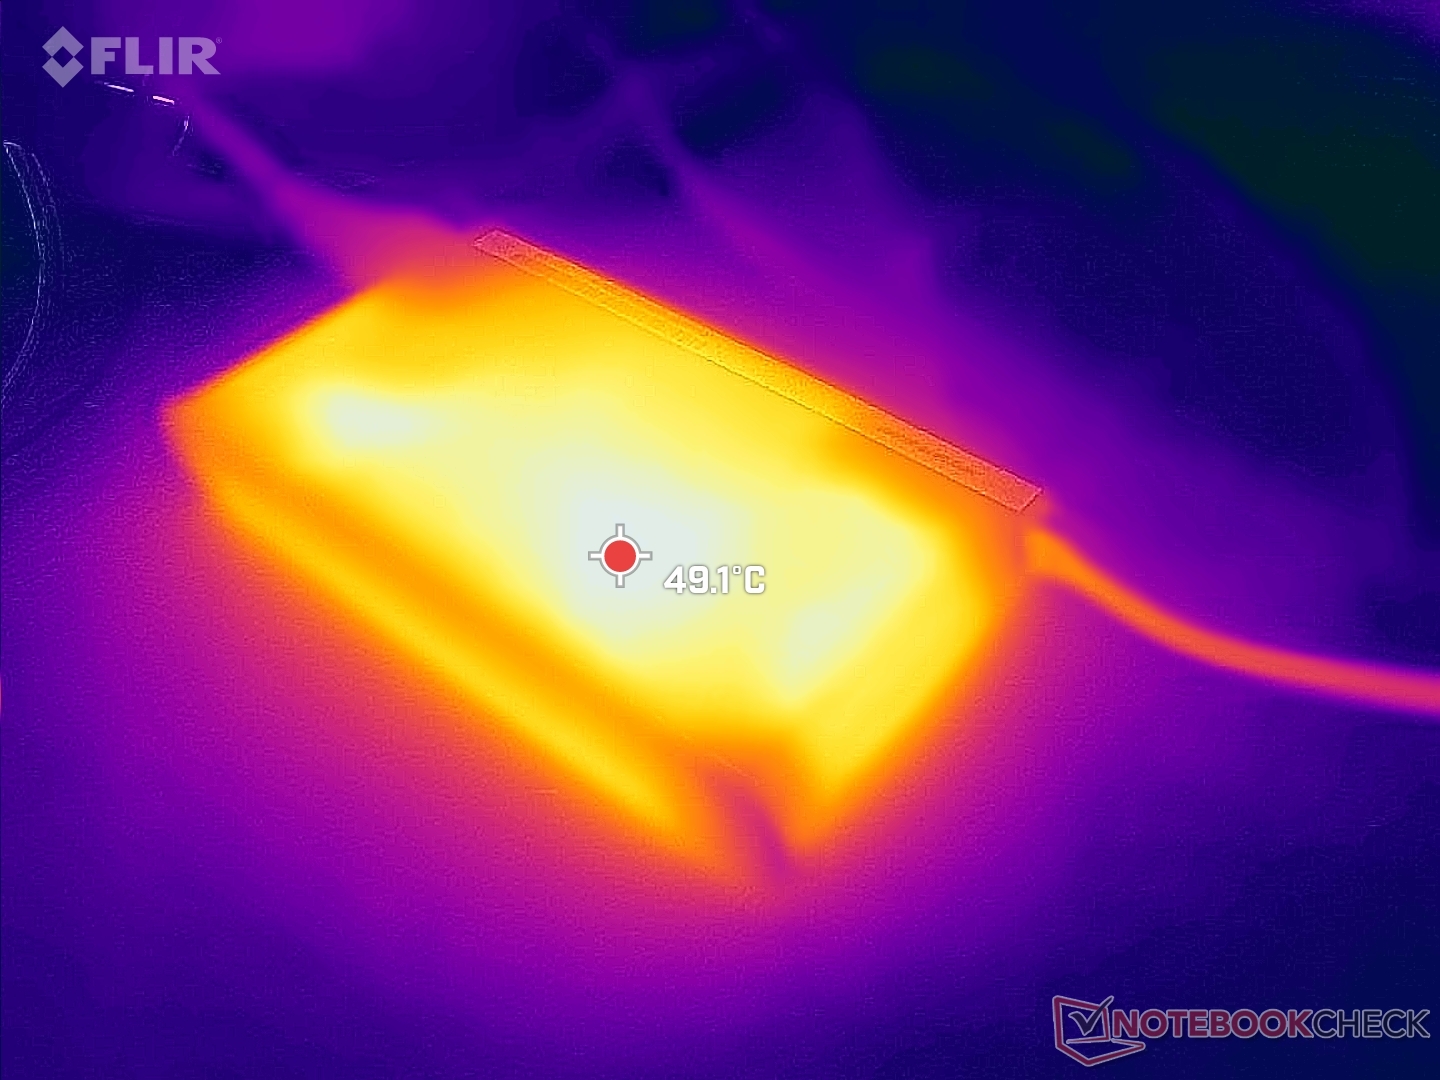
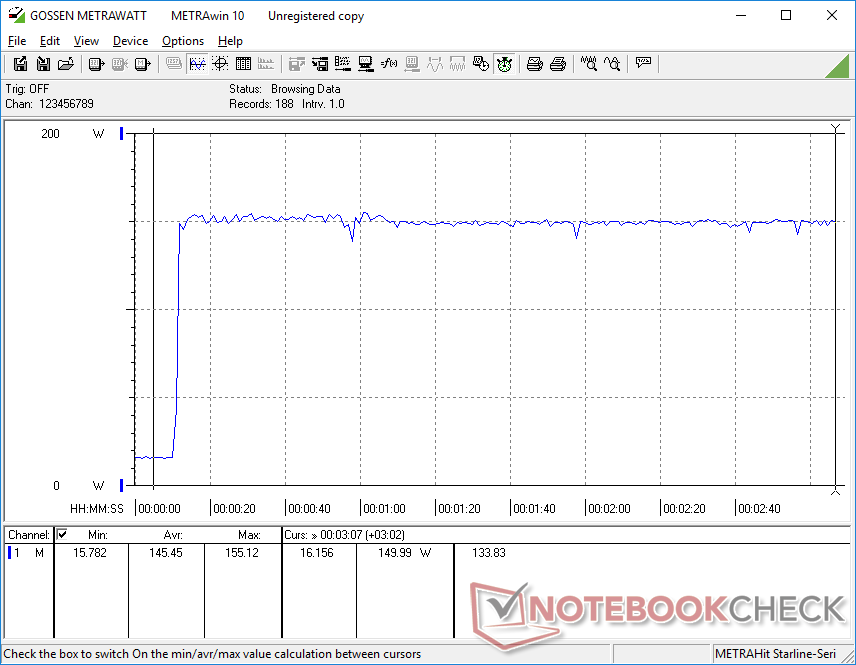
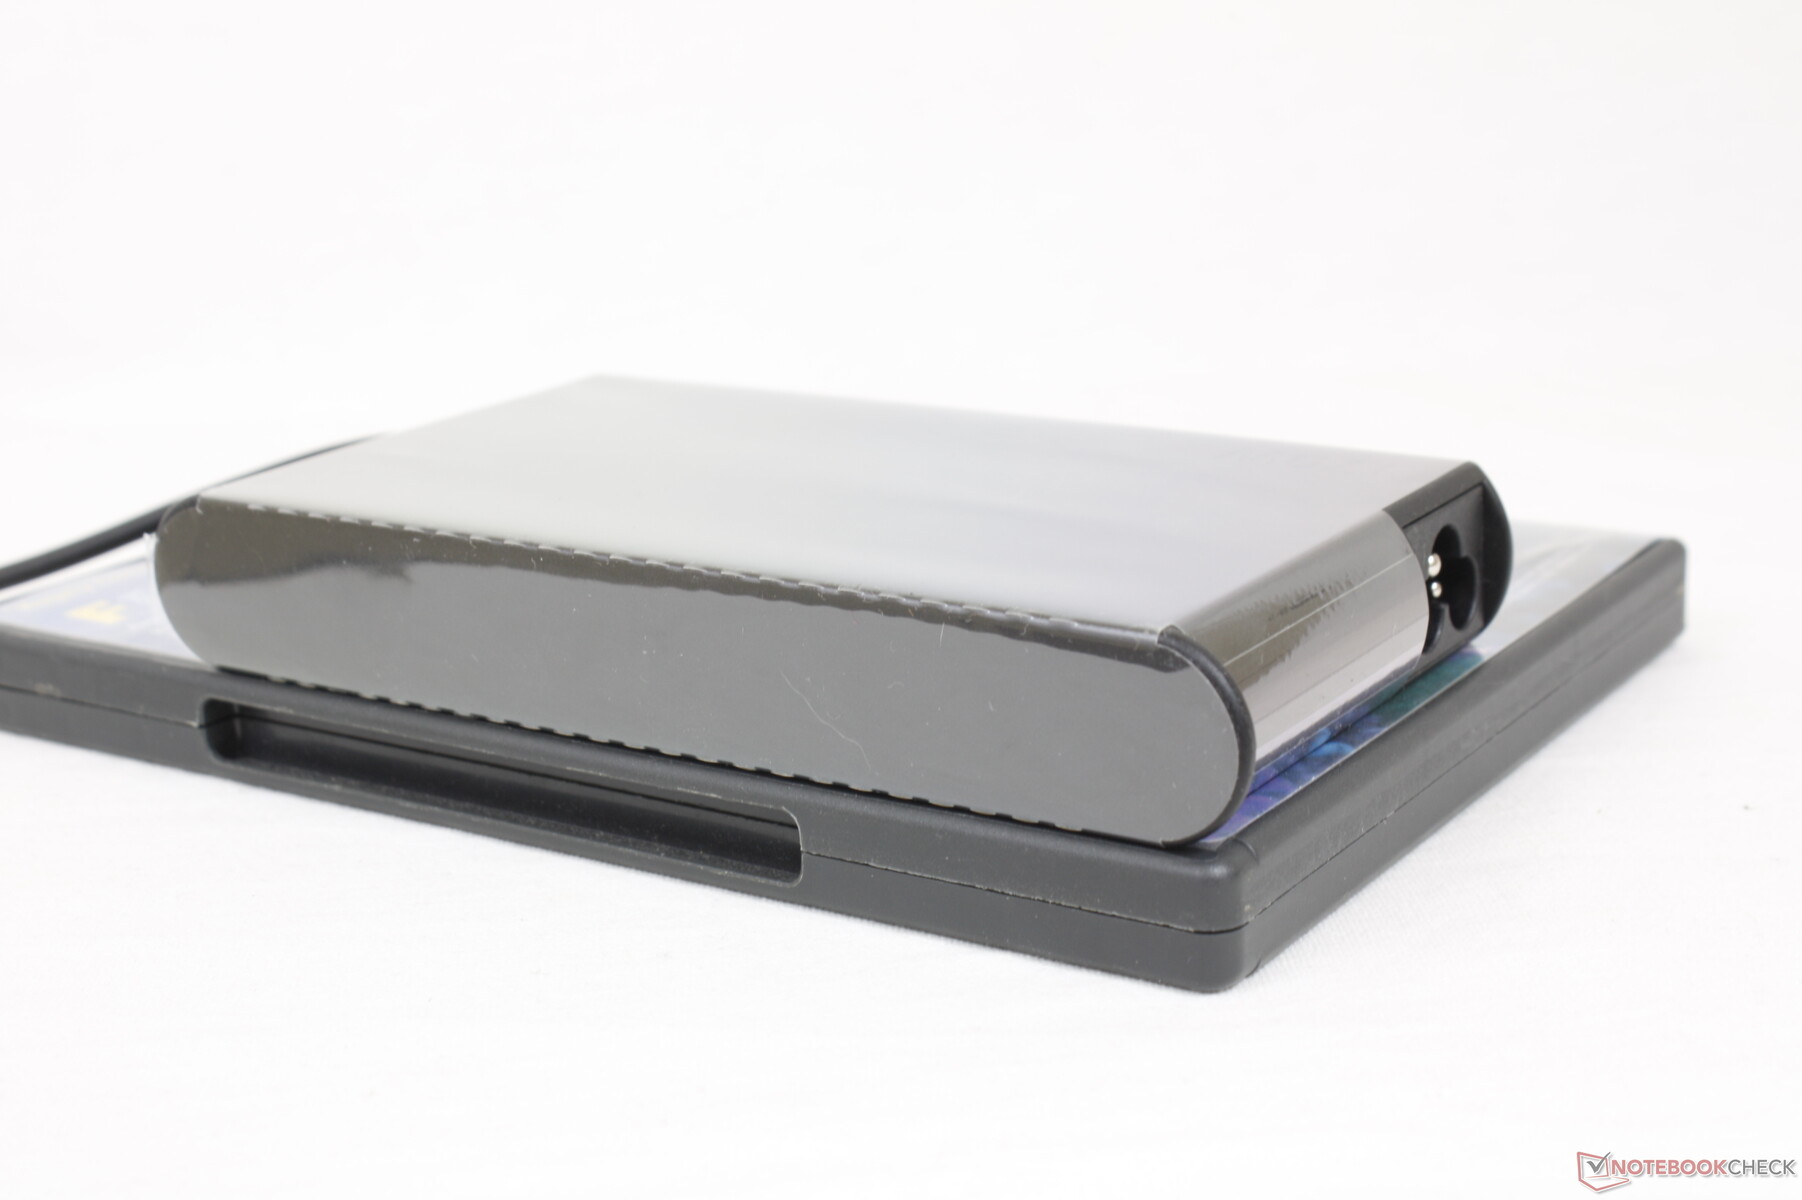
Nous avons pu mesurer une consommation maximale de 156 W sur l'adaptateur secteur 170 W de taille moyenne (~14,8 x 7,8 x 2,2 cm) lorsque Prime95 et FurMark sont utilisés simultanément. Le niveau de charge de la batterie est passé de 100 % à 95 % en une demi-heure avant de revenir à 100 % à la fin du test.
| Éteint/en veille | |
| Au repos | |
| Fortement sollicité |
|
Légende:
min: | |
| Lenovo IdeaPad Gaming 3 15ARH7 R5 6600H, GeForce RTX 3050 4GB Laptop GPU, Lenovo UMIS AM630 RPJTJ256MGE1QDY, IPS, 1920x1080, 15.6" | Lenovo IdeaPad Gaming 3i 15IMH05 i5-10300H, GeForce GTX 1650 Mobile, SK hynix BC511 HFM512GDHTNI-87A0B, IPS, 1920x1080, 15.6" | Lenovo Legion 5 15ACH6A-82NW0010GE R5 5600H, Radeon RX 6600M, Micron 2210 MTFDHBA512QFD, IPS, 1920x1080, 15.6" | Gigabyte A5 K1 R5 5600H, GeForce RTX 3060 Laptop GPU, ESR512GTLG-E6GBTNB4, IPS, 1920x1080, 15.6" | Asus TUF Dash F15 FX517ZR i7-12650H, GeForce RTX 3070 Laptop GPU, Samsung PM991a MZVLQ1T0HBLB, IPS, 2560x1440, 15.6" | Dell G15 5510 i5-10500H, GeForce RTX 3050 4GB Laptop GPU, SK Hynix BC711 HFM512GD3HX015N, IPS, 1920x1080, 15.6" | |
|---|---|---|---|---|---|---|
| Power Consumption | 8% | -39% | -34% | -30% | 5% | |
| Idle Minimum * (Watt) | 7.7 | 5.1 34% | 10 -30% | 10 -30% | 10 -30% | 3 61% |
| Idle Average * (Watt) | 9.1 | 8.2 10% | 13.2 -45% | 12 -32% | 14 -54% | 8 12% |
| Idle Maximum * (Watt) | 15.6 | 10.6 32% | 15.6 -0% | 17 -9% | 20 -28% | 13 17% |
| Load Average * (Watt) | 90.7 | 128 -41% | 178 -96% | 113 -25% | 122 -35% | 103 -14% |
| Witcher 3 ultra * (Watt) | 122.9 | 109 11% | 181 -47% | 181.4 -48% | 138.6 -13% | 139.5 -14% |
| Load Maximum * (Watt) | 155.2 | 150 3% | 180 -16% | 245 -58% | 189 -22% | 204 -31% |
* ... Moindre est la valeur, meilleures sont les performances
Power Consumption Witcher 3 / Stresstest
Power Consumption external Monitor
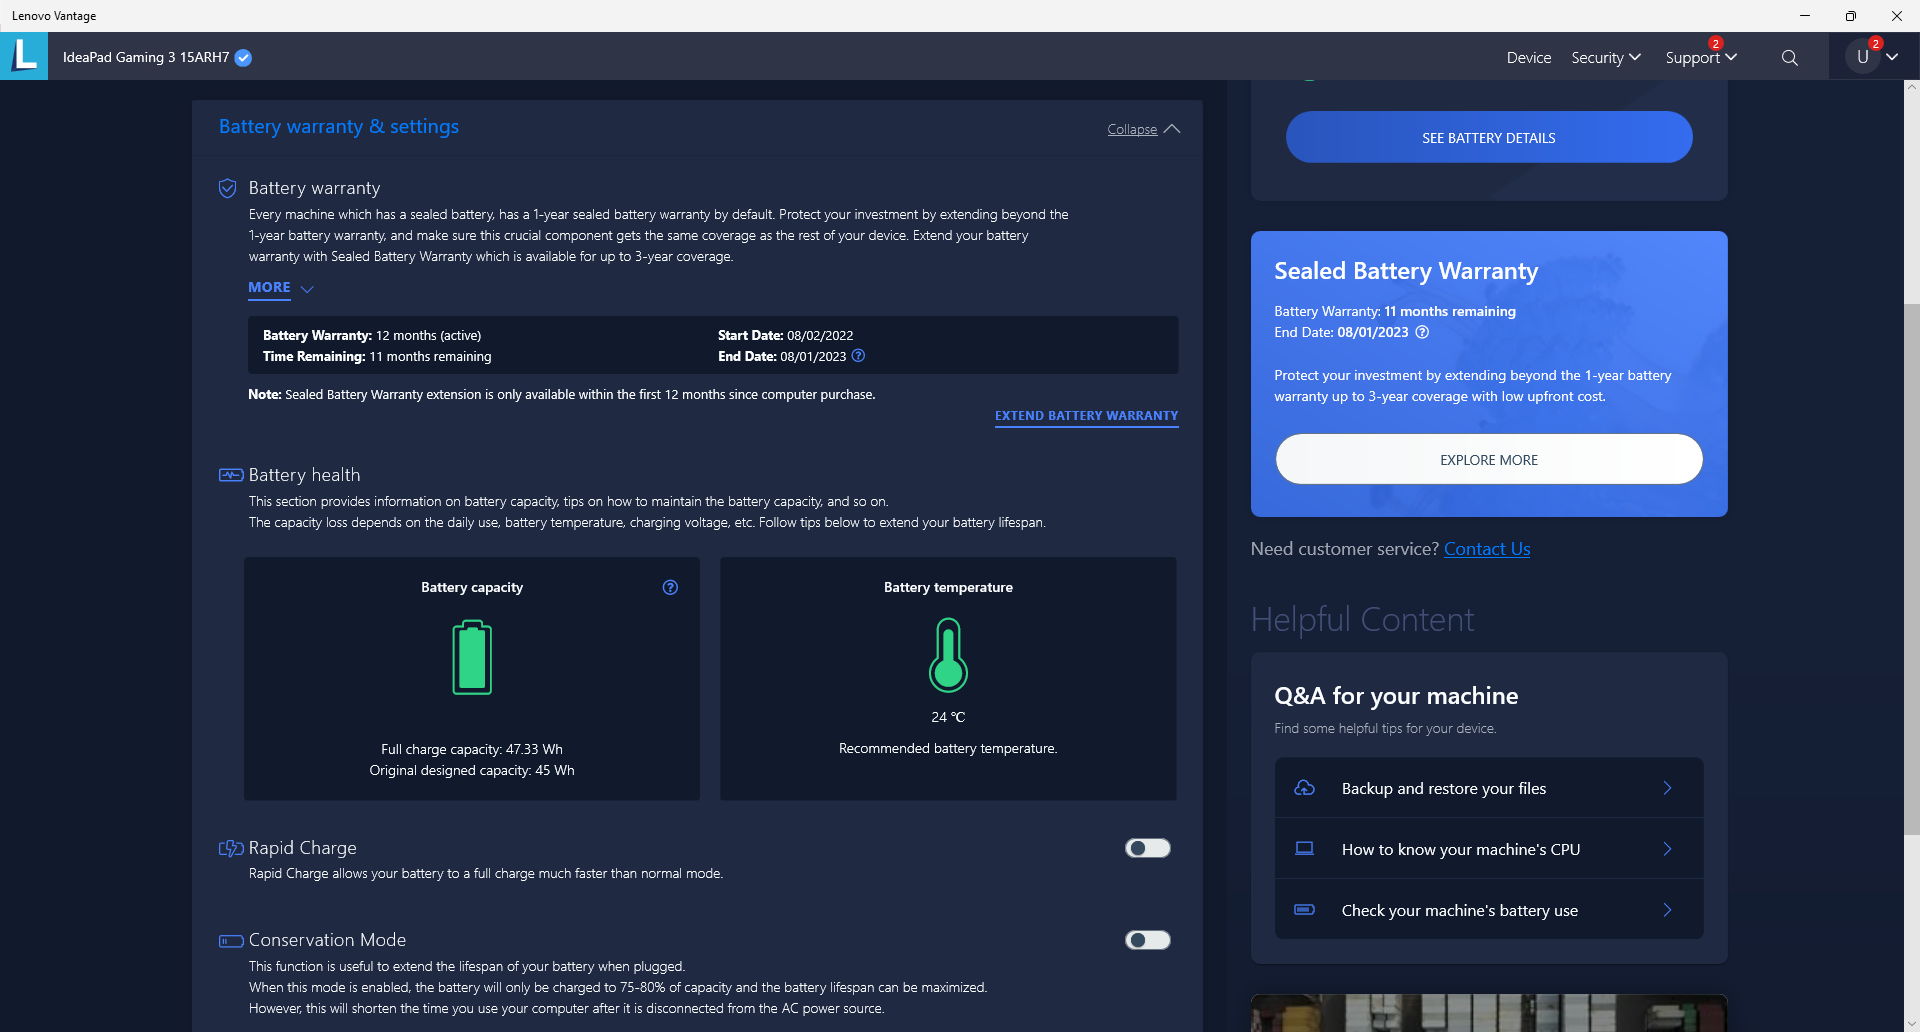
Autonomie de la batterie
La capacité de la batterie est faible, à peine 45 Wh, ce qui est typique des ordinateurs portables de jeu à petit budget. La navigation sur Internet en mode réel avec le profil d'alimentation équilibré et le GPU intégré actif durerait environ 6,5 heures avant de devoir être rechargé, comme nous l'avons observé sur l'IdeaPad Gaming 3i.IdeaPad Gaming 3i.
La charge du vide au plein avec l'adaptateur secteur propriétaire inclus prend environ 1,5 à 2 heures. Nous pouvons confirmer que la plupart des chargeurs USB-C peuvent également recharger le système.
Nous devons mentionner que l'autonomie en mode économie d'énergie (ou mode silencieux Lenovo) avec l'iGPU actif et la luminosité de l'écran réglée au minimum est inhabituellement courte, à seulement 2 heures et 22 minutes. Nous avons répété ce test juste pour être sûrs et les résultats n'ont pas changé. Il est possible que le système souffre d'un bug de consommation d'énergie dans certains paramètres et conditions de batterie.
| Lenovo IdeaPad Gaming 3 15ARH7 R5 6600H, GeForce RTX 3050 4GB Laptop GPU, 45 Wh | Lenovo IdeaPad Gaming 3i 15IMH05 i5-10300H, GeForce GTX 1650 Mobile, 45 Wh | Lenovo Legion 5 15ACH6A-82NW0010GE R5 5600H, Radeon RX 6600M, 80 Wh | Gigabyte A5 K1 R5 5600H, GeForce RTX 3060 Laptop GPU, 48.96 Wh | Asus TUF Dash F15 FX517ZR i7-12650H, GeForce RTX 3070 Laptop GPU, 76 Wh | Dell G15 5510 i5-10500H, GeForce RTX 3050 4GB Laptop GPU, 56 Wh | |
|---|---|---|---|---|---|---|
| Autonomie de la batterie | 171% | 199% | 6% | 171% | 125% | |
| Reader / Idle (h) | 2.4 | 12.4 417% | 12.8 433% | 10.8 350% | 11.3 371% | |
| WiFi v1.3 (h) | 6.5 | 6.3 -3% | 9.2 42% | 6.9 6% | 7 8% | 6 -8% |
| Load (h) | 0.9 | 1.8 100% | 2 122% | 2.3 156% | 1 11% | |
| H.264 (h) | 7.3 | 5.8 |
Points positifs
Points négatifs
Verdict - Le nouveau CPU Ryzen 5 6600U n'offre pas grand-chose aux ordinateurs portables de jeu
La plus grande différence entre les Ryzen 5 5600H et Ryzen 5 6600H est que le premier est équipé d'une carte graphique Radeon RX Vega intégrée, tandis que le second est équipé d'une carte Radeon 660M intégrée pour des performances iGPU nettement plus rapides. Sinon, les deux processeurs sont presque identiques en termes de performances du CPU. Le problème avec les ordinateurs portables de jeu est que presque tous les modèles d'ordinateurs portables de jeu sont déjà livrés avec des graphiques discrets plus rapides qui rendent la solution intégrée presque inutile dans la grande majorité des cas. Ainsi, afin de maximiser les performances de jeu, vous devrez renoncer à la Radeon 660M ou 680M et opter pour un GPU plus rapide comme la RTX 3060 même si cela signifie se contenter d'un Ryzen 5 5600H ou Ryzen 7 5800H de dernière génération Ryzen 7 5800H PROCESSEUR AMD.
Le Ryzen 5 6600H est donc à son meilleur sur les ordinateurs portables et les mini PC sans option de GPU dédié. Ce n'est que dans ce cas que les performances et l'efficacité de la Radeon 660M intégrée peuvent vraiment briller.
Quant à l'ordinateur portable Lenovo lui-même, il mérite certainement des éloges pour ses grandes touches fléchées, son faible prix de départ et son écran IPS 1080p 120 Hz standard avec FreeSync et des temps de réponse décents. Les couleurs sont médiocres, mais c'est un inconvénient courant sur les ordinateurs portables de jeu bon marché comme celui-ci. Nos critiques les plus cruciales concernent plutôt la difficulté d'entretien et le poids élevé de l'ordinateur portable. Des alternatives économiques comme le MSI GF63, Acer Nitro 5, HP Pavilion Gaming 15ou Asus TUF Dash sont tous plus légers et plus faciles à mettre à niveau. Tenter d'ajouter plus de RAM ou de stockage dans l'IdeaPad Gaming 3 est fâcheusement plus gênant en comparaison.
Prix et disponibilité
Le Lenovo IdeaPad Gaming 3 15ARH7 est maintenant largement disponible chez les principaux revendeurs en ligne comme Walmart Best Buyet Amazon au prix de 969 USD. Notez que ces UGS sont toutes livrées avec le GPU légèrement plus rapide GeForce RTX 3050 Ti au lieu du RTX 3050. Notre configuration avec la RTX 3050 est loin d'être aussi courante pour le moment.
Lenovo IdeaPad Gaming 3 15ARH7
- 09/09/2022 v7 (old)
Allen Ngo
Price comparison

