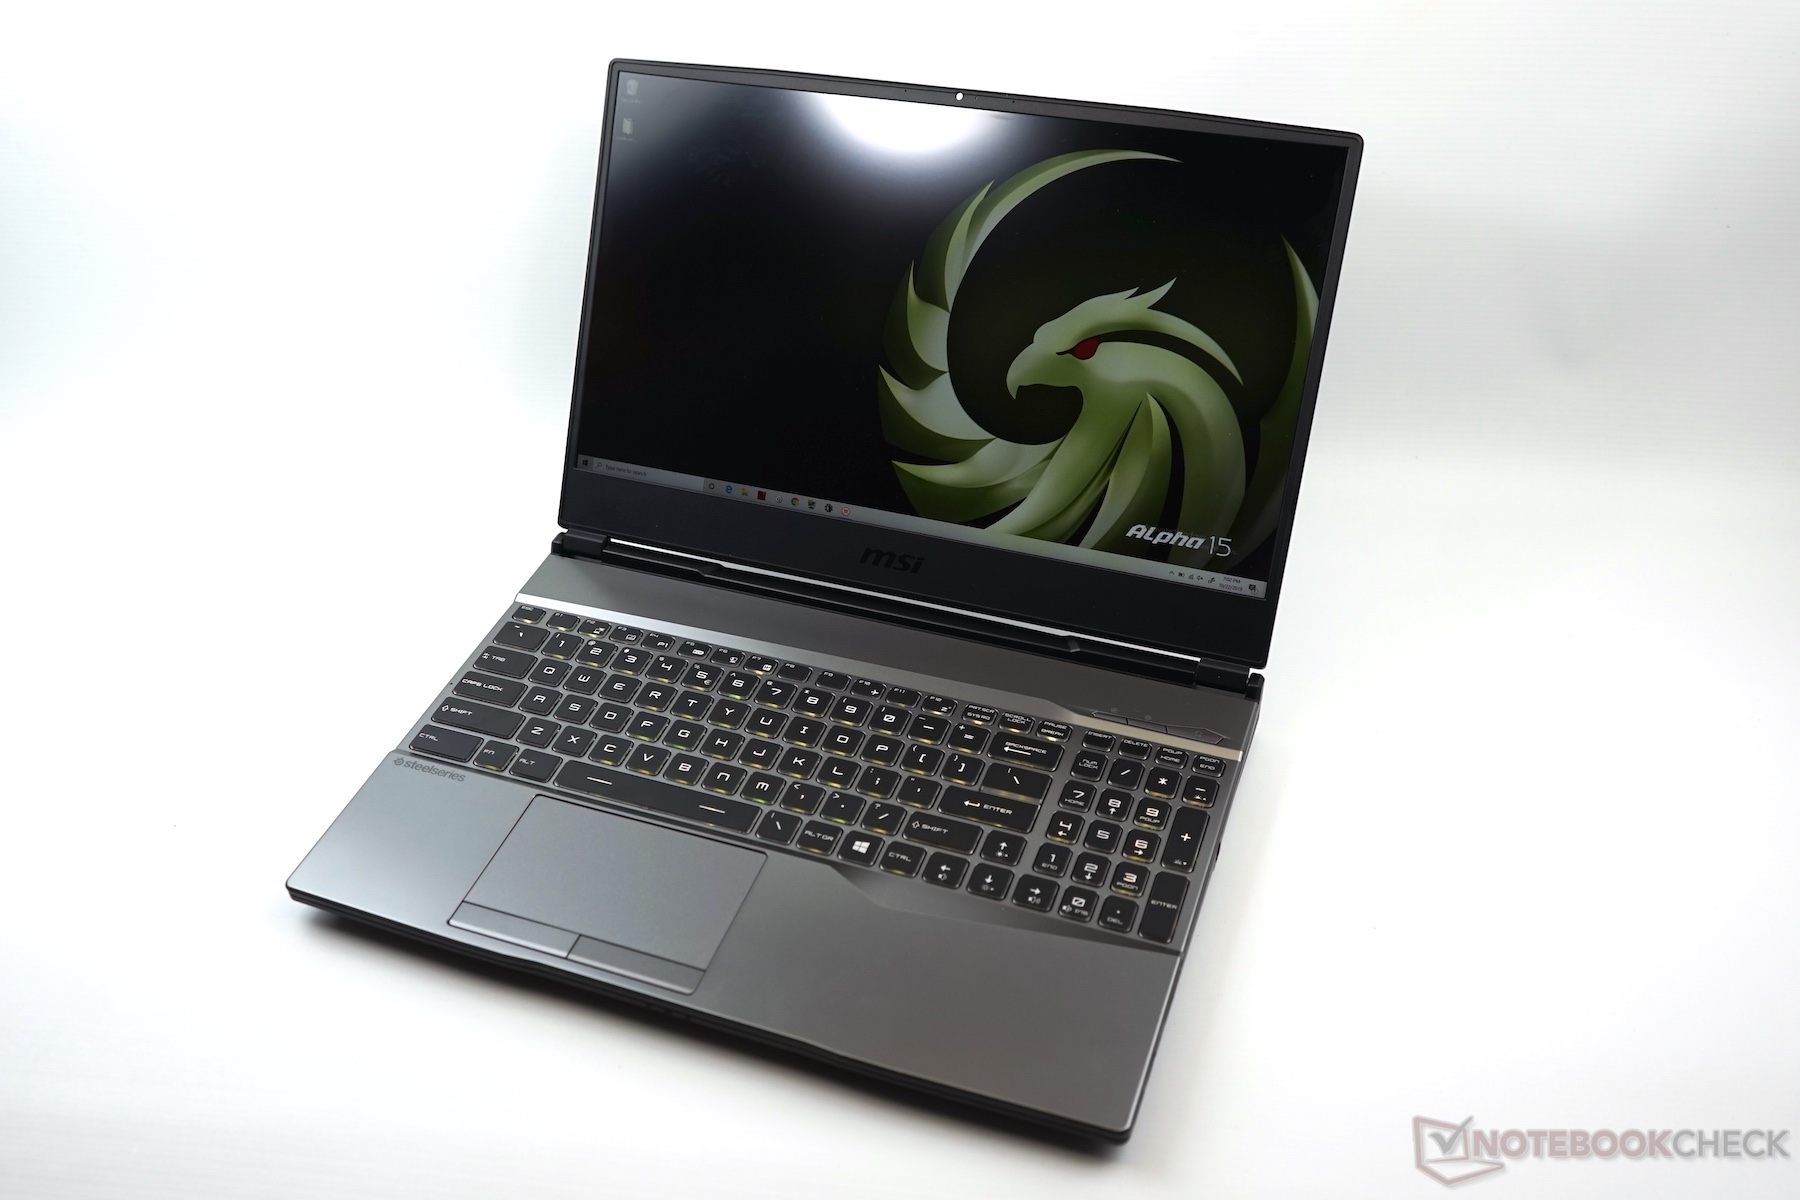
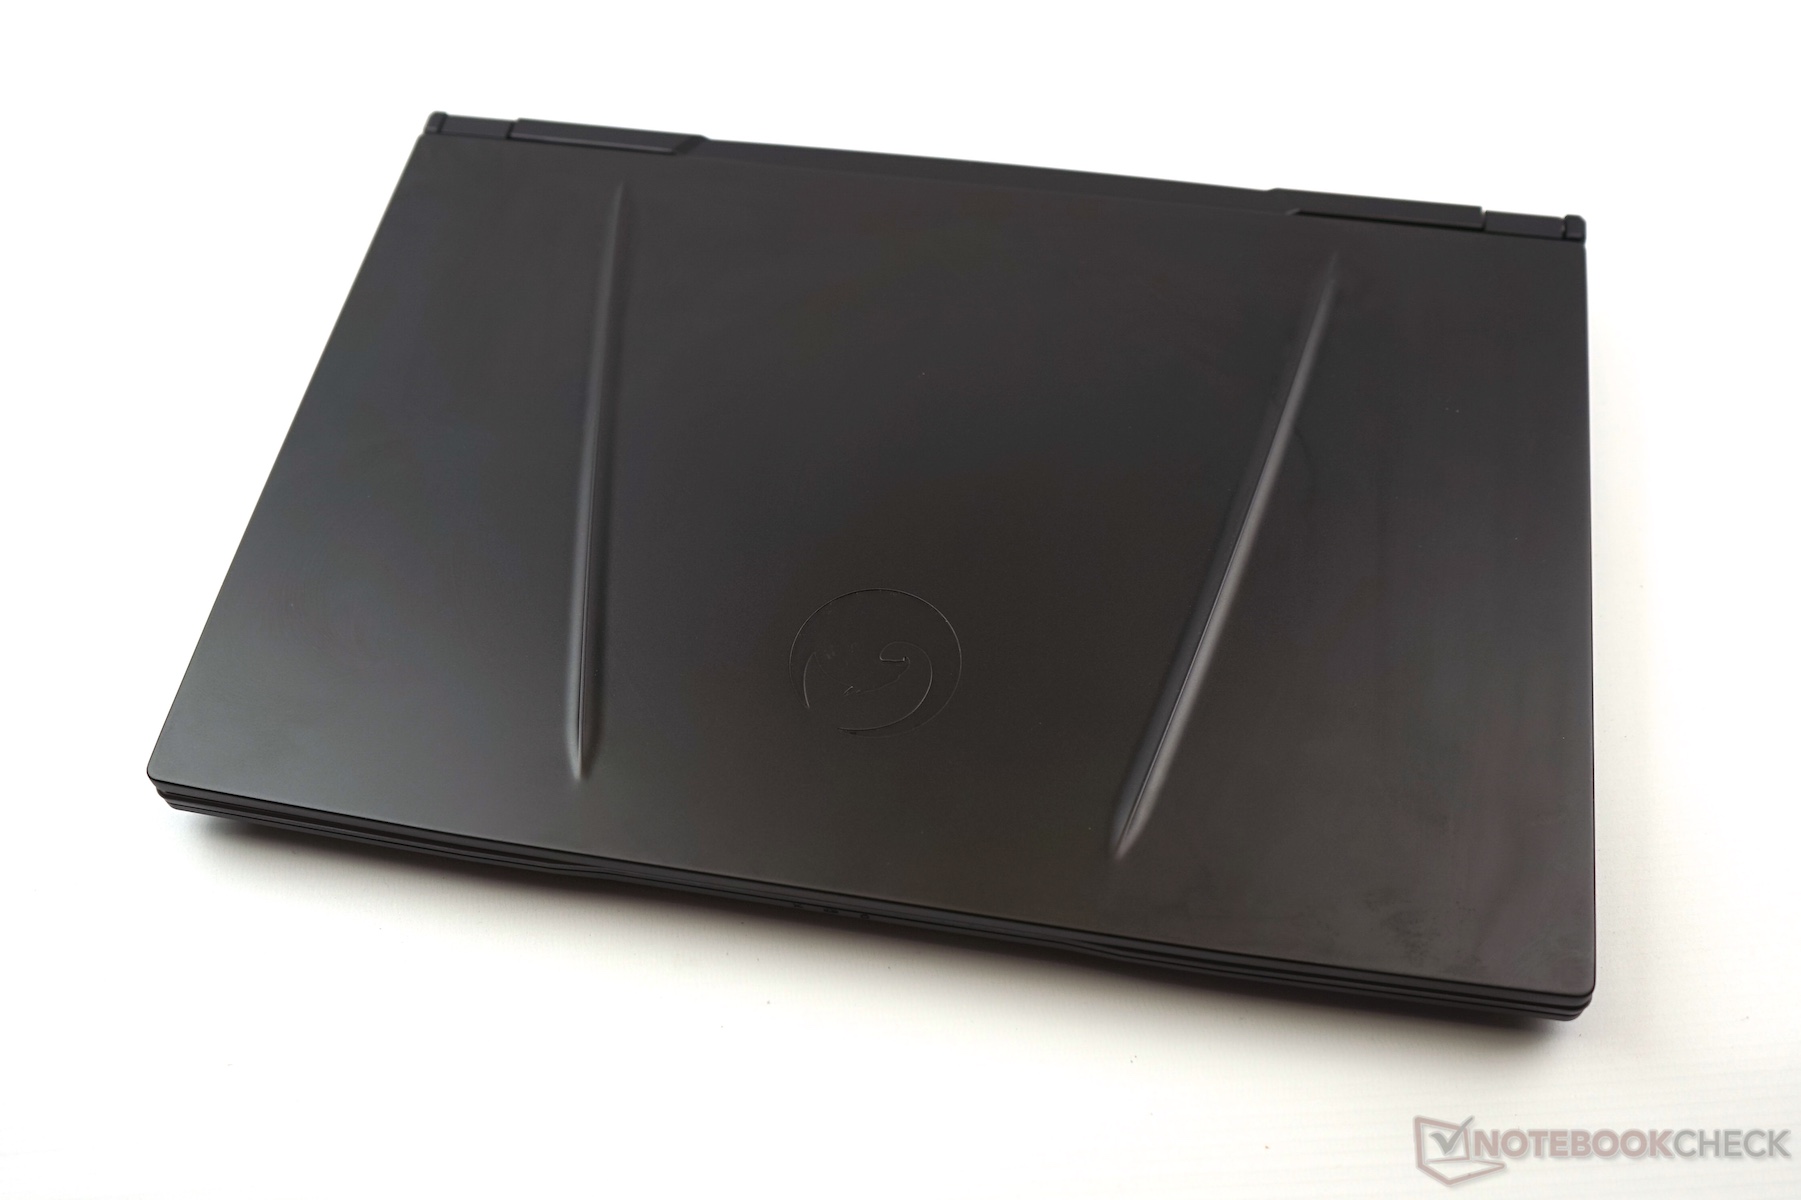
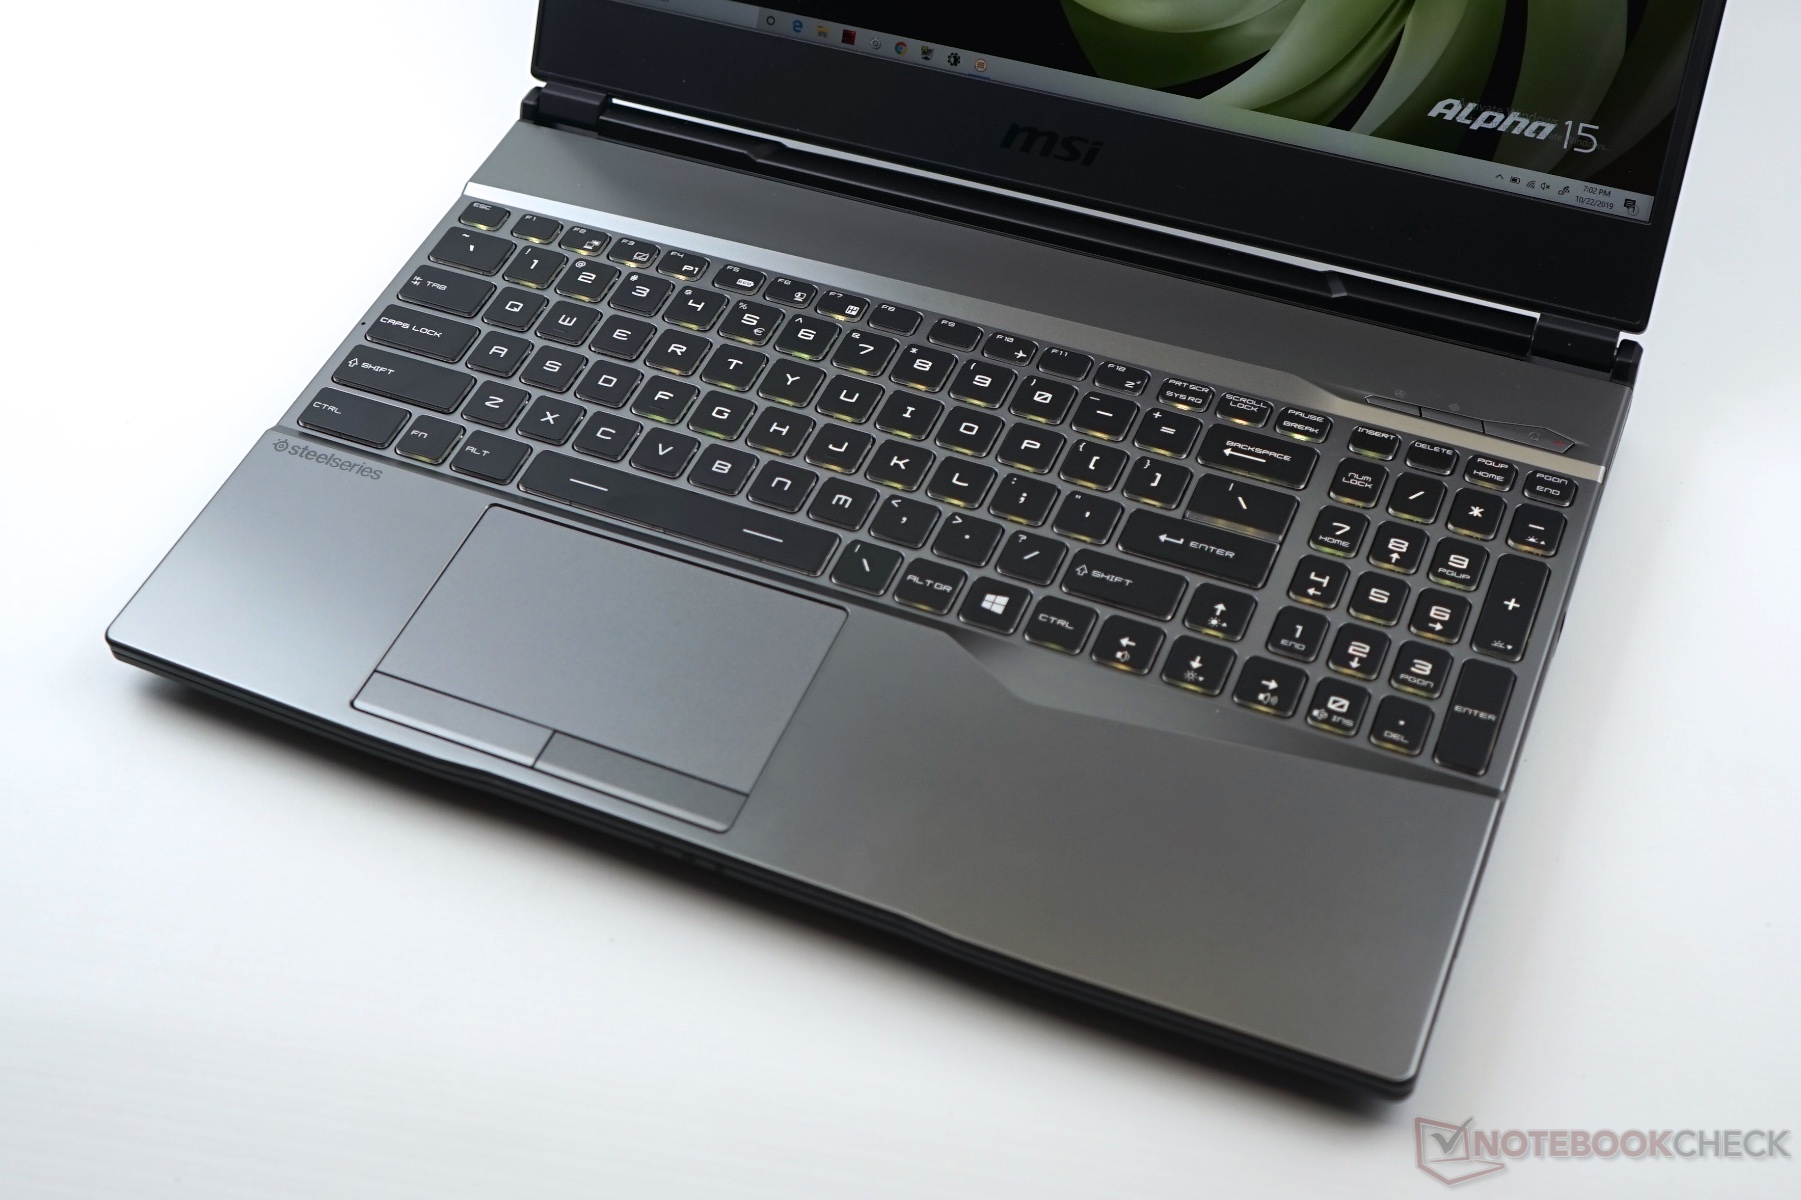
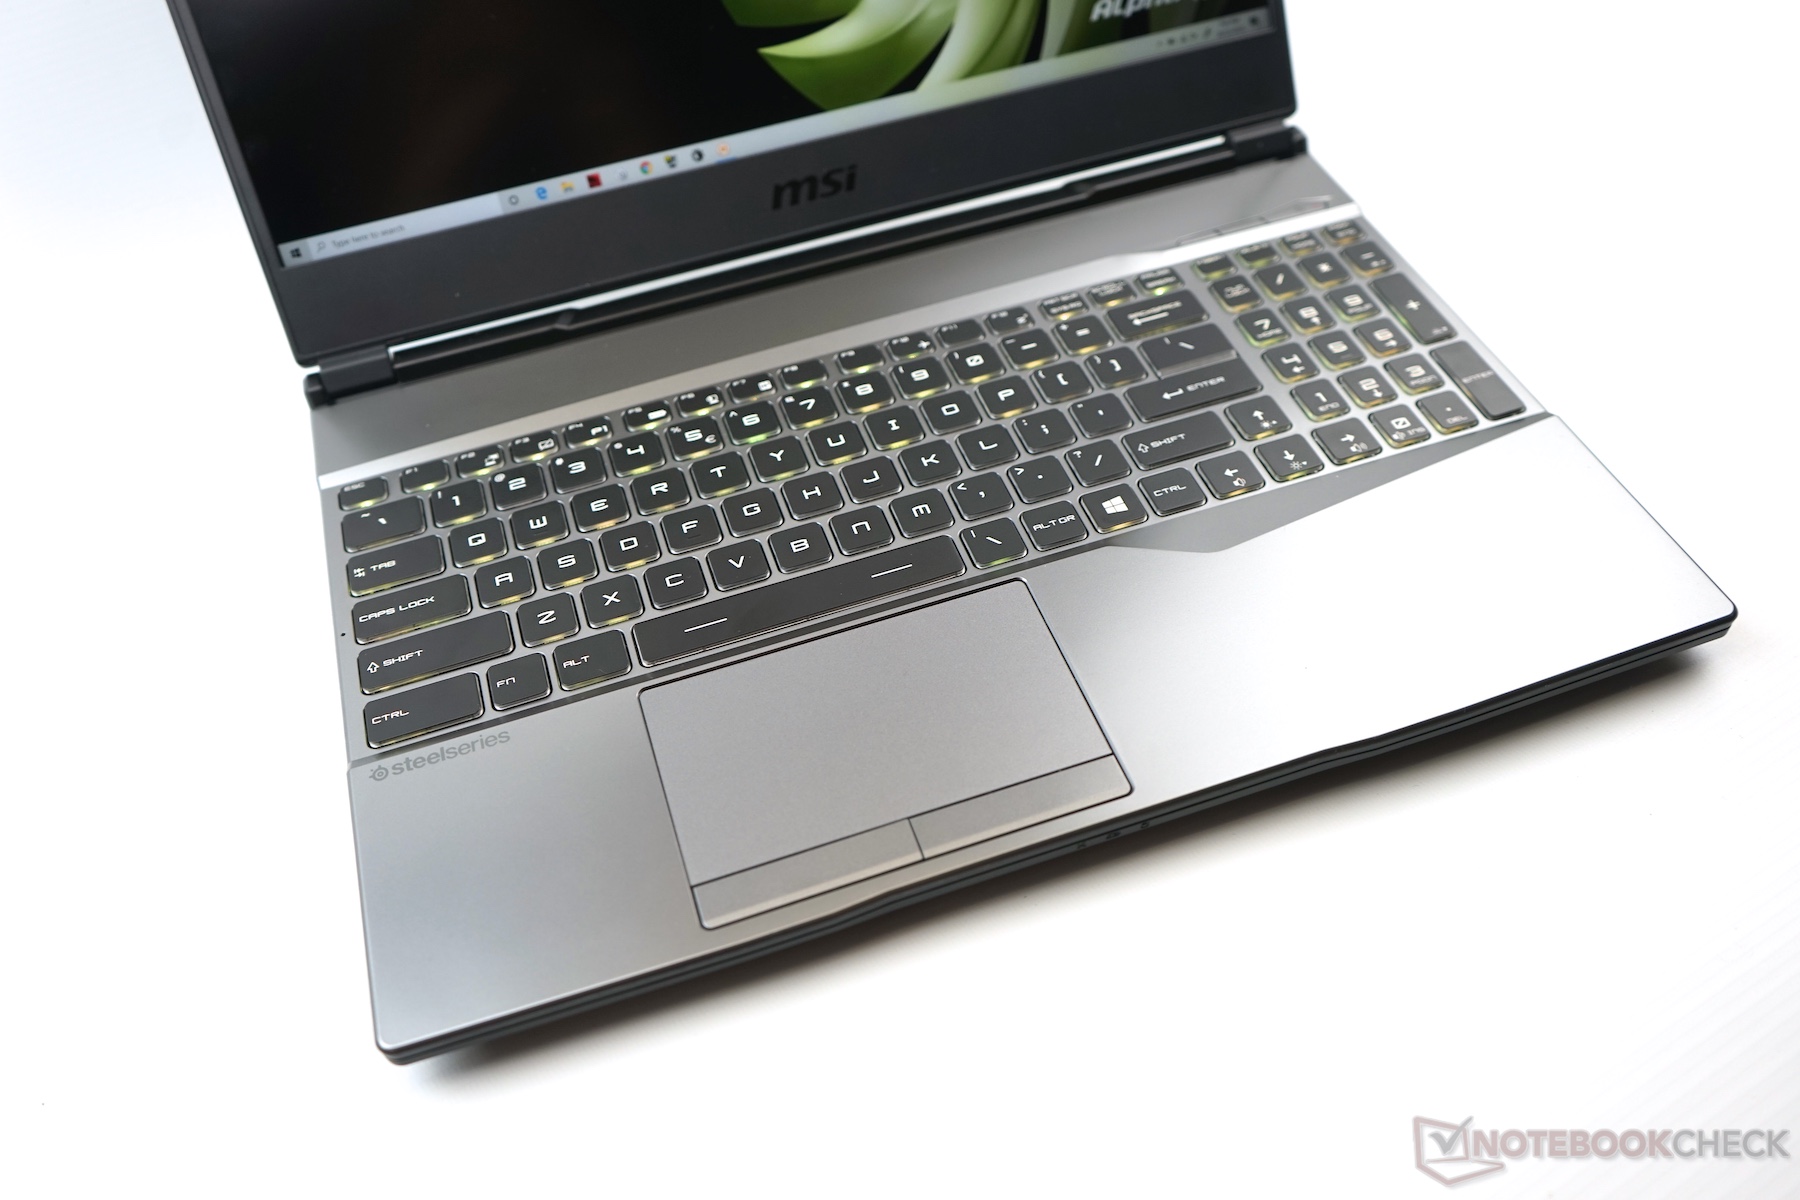
Test du MSI Alpha 15 (Ryzen 7 3750H, RX 5500M, FHD, 120 Hz) : Ryzen et Navi plutôt que Intel et Nvidia
Aperçu
Note | Date | Modèle | Poids | Épaisseur | Taille | Résolution | Prix |
|---|---|---|---|---|---|---|---|
v (old) | 11/19 | MSI Alpha 15 A3DDK R7 3750H, Radeon RX 5500M | 2.3 kg | 27.5 mm | 15.60" | 1920x1080 | |
| 80.4 % v6 (old) | 08/19 | Asus TUF FX505DT-EB73 R7 3750H, GeForce GTX 1650 Mobile | 2.2 kg | 26.8 mm | 15.60" | 1920x1080 | |
| 79.3 % v7 (old) | 10/19 | Dell G3 3590 i5-9300H, GeForce GTX 1650 Mobile | 2.5 kg | 21.6 mm | 15.60" | 1920x1080 | |
| 77 % v7 (old) | 10/19 | Lenovo IdeaPad L340-15IRH 81LK00BMGE i5-9300H, GeForce GTX 1650 Mobile | 2.1 kg | 23.9 mm | 15.60" | 1920x1080 | |
| 81.5 % v7 (old) | 07/19 | HP Omen 15-dc1020ng i5-9300H, GeForce GTX 1650 Mobile | 2.3 kg | 25 mm | 15.60" | 1920x1080 | |
| 82.5 % v6 (old) | 05/19 | Acer Aspire Nitro 5 AN515-54-53Z2 i5-9300H, GeForce GTX 1650 Mobile | 2.2 kg | 27 mm | 15.60" | 1920x1080 | |
| 82.3 % v7 (old) | 08/19 | Lenovo Legion Y540-15IRH-81SX00B2GE i7-9750H, GeForce GTX 1660 Ti Mobile | 2.2 kg | 26 mm | 15.60" | 1920x1080 | |
| 83.9 % v7 (old) | 08/19 | HP Gaming Pavilion 15-dk0009ng i7-9750H, GeForce GTX 1660 Ti Max-Q | 2.4 kg | 23.4 mm | 15.60" | 1920x1080 | |
| 83.3 % v6 (old) | 07/19 | Asus ROG Zephyrus G15 GA502DU R7 3750H, GeForce GTX 1660 Ti Max-Q | 2.1 kg | 20.4 mm | 15.60" | 1920x1080 |
| |||||||||||||||||||||||||
Homogénéité de la luminosité: 91 %
Valeur mesurée au centre, sur batterie: 266 cd/m²
Contraste: 1506:1 (Valeurs des noirs: 0.18 cd/m²)
ΔE ColorChecker Calman: 4.38 | ∀{0.5-29.43 Ø4.73}
calibrated: 4.29
ΔE Greyscale Calman: 2.1 | ∀{0.09-98 Ø4.97}
36.74% AdobeRGB 1998 (Argyll 3D)
53.5% sRGB (Argyll 3D)
35.56% Display P3 (Argyll 3D)
Gamma: 2.15
CCT: 6867 K
| MSI Alpha 15 A3DDK AU Optronics B156HAN13.0 (AUOD0ED), IPS, 1920x1080, 15.6" | Asus TUF FX505DT-EB73 Panda LM156LF-GL, IPS, 1920x1080, 15.6" | Dell G3 3590 BOE NV15N3D, IPS, 1920x1080, 15.6" | Lenovo IdeaPad L340-15IRH 81LK00BMGE CMN 156HCA-EAB, IPS, 1920x1080, 15.6" | Lenovo Legion Y540-15IRH-81SX00B2GE BOE 084D, IPS, 1920x1080, 15.6" | HP Gaming Pavilion 15-dk0009ng LG Philips LGD05FE, IPS, 1920x1080, 15.6" | |
|---|---|---|---|---|---|---|
| Display | 11% | 13% | 20% | 76% | 79% | |
| Display P3 Coverage (%) | 35.56 | 39.56 11% | 40.13 13% | 42.81 20% | 63.6 79% | 64.2 81% |
| sRGB Coverage (%) | 53.5 | 59.5 11% | 59.8 12% | 63.8 19% | 91.7 71% | 95.1 78% |
| AdobeRGB 1998 Coverage (%) | 36.74 | 40.91 11% | 41.47 13% | 44.31 21% | 65.2 77% | 65.8 79% |
| Response Times | 6% | -25% | -22% | 66% | 58% | |
| Response Time Grey 50% / Grey 80% * (ms) | 36.1 | 30.4 ? 16% | 46 ? -27% | 45.6 ? -26% | 8.8 ? 76% | 16.4 ? 55% |
| Response Time Black / White * (ms) | 26.4 | 27.6 ? -5% | 32.4 ? -23% | 30.8 ? -17% | 12 ? 55% | 10.4 ? 61% |
| PWM Frequency (Hz) | 200 ? | 25910 ? | ||||
| Screen | -34% | -20% | -15% | -5% | 15% | |
| Brightness middle (cd/m²) | 271 | 286.2 6% | 276.2 2% | 275 1% | 299 10% | 345 27% |
| Brightness (cd/m²) | 266 | 267 0% | 261 -2% | 253 -5% | 290 9% | 324 22% |
| Brightness Distribution (%) | 91 | 84 -8% | 86 -5% | 83 -9% | 89 -2% | 86 -5% |
| Black Level * (cd/m²) | 0.18 | 0.33 -83% | 0.24 -33% | 0.18 -0% | 0.29 -61% | 0.42 -133% |
| Contrast (:1) | 1506 | 867 -42% | 1151 -24% | 1528 1% | 1031 -32% | 821 -45% |
| Colorchecker dE 2000 * | 4.38 | 5.45 -24% | 5.56 -27% | 5.4 -23% | 3.7 16% | 1.3 70% |
| Colorchecker dE 2000 max. * | 17.6 | 18.08 -3% | 23.45 -33% | 21.3 -21% | 7 60% | 2.8 84% |
| Colorchecker dE 2000 calibrated * | 4.29 | 4.47 -4% | 5.23 -22% | 4.4 -3% | 2 53% | 1.1 74% |
| Greyscale dE 2000 * | 2.1 | 5.3 -152% | 2.8 -33% | 3.7 -76% | 4.1 -95% | 1.2 43% |
| Gamma | 2.15 102% | 2.1 105% | 2.37 93% | 2.12 104% | 2.19 100% | 2.31 95% |
| CCT | 6867 95% | 7679 85% | 6710 97% | 6376 102% | 7166 91% | 6476 100% |
| Color Space (Percent of AdobeRGB 1998) (%) | 37.6 | 37.8 | 40.8 | 59.3 | 60.5 | |
| Color Space (Percent of sRGB) (%) | 59.1 | 59 | 63.6 | 91.5 | 94.9 | |
| Moyenne finale (programmes/paramètres) | -6% /
-19% | -11% /
-14% | -6% /
-8% | 46% /
23% | 51% /
35% |
* ... Moindre est la valeur, meilleures sont les performances
Temps de réponse de l'écran
| ↔ Temps de réponse noir à blanc | ||
|---|---|---|
| 26.4 ms ... hausse ↗ et chute ↘ combinées | ↗ ms hausse | 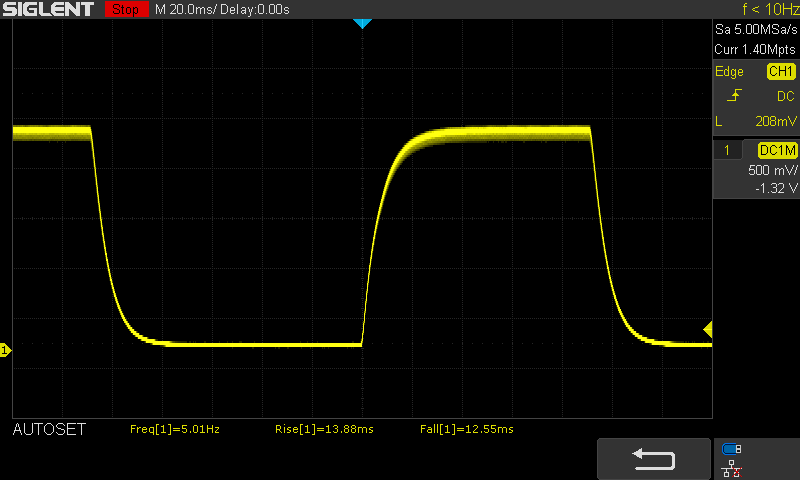 |
| ↘ ms chute | ||
| L'écran souffre de latences relativement élevées, insuffisant pour le jeu. En comparaison, tous les appareils testés affichent entre 0.1 (minimum) et 240 (maximum) ms. » 66 % des appareils testés affichent de meilleures performances. Cela signifie que les latences relevées sont moins bonnes que la moyenne (19.9 ms) de tous les appareils testés. | ||
| ↔ Temps de réponse gris 50% à gris 80% | ||
| 36.1 ms ... hausse ↗ et chute ↘ combinées | ↗ ms hausse | 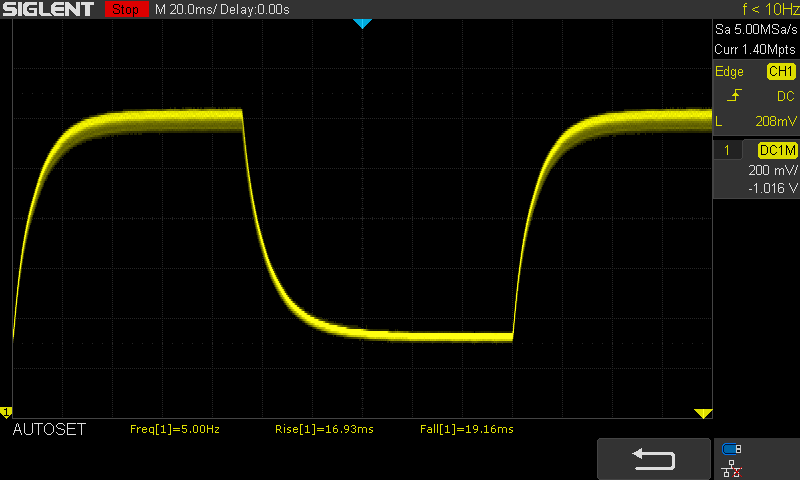 |
| ↘ ms chute | ||
| L'écran souffre de latences très élevées, à éviter pour le jeu. En comparaison, tous les appareils testés affichent entre 0.165 (minimum) et 636 (maximum) ms. » 52 % des appareils testés affichent de meilleures performances. Cela signifie que les latences relevées sont moins bonnes que la moyenne (31.1 ms) de tous les appareils testés. | ||
Scintillement / MLI (Modulation de largeur d'impulsion)
| Scintillement / MLI (Modulation de largeur d'impulsion) non décelé |  | ||
En comparaison, 52 % des appareils testés n'emploient pas MDI pour assombrir leur écran. Nous avons relevé une moyenne à 7798 (minimum : 5 - maximum : 343500) Hz dans le cas où une MDI était active. | |||
| PCMark 8 Home Score Accelerated v2 | 4800 points | |
| PCMark 8 Creative Score Accelerated v2 | 6613 points | |
| PCMark 8 Work Score Accelerated v2 | 5167 points | |
| PCMark 10 Score | 4733 points | |
Aide | ||
| 3DMark 06 Standard Score | 26559 points | |
| 3DMark 11 Performance | 13344 points | |
| 3DMark Cloud Gate Standard Score | 22627 points | |
| 3DMark Fire Strike Score | 10080 points | |
| 3DMark Time Spy Score | 4024 points | |
Aide | ||
| F1 2019 - 1920x1080 Ultra High Preset AA:T AF:16x | |
| Moyenne NVIDIA GeForce GTX 1660 Ti Mobile (91 - 99, n=4) | |
| HP Pavilion Gaming 15-ec0017ng | |
| Moyenne NVIDIA GeForce GTX 1660 Ti Max-Q (71 - 77, n=2) | |
| HP Gaming Pavilion 15-dk0009ng | |
| MSI Alpha 15 A3DDK | |
| HP Omen 15-dc1020ng | |
| Moyenne NVIDIA GeForce GTX 1650 Mobile (59 - 65, n=5) | |
| HP Omen 15-dc1020ng | |
| Dell G5 15 5590-PCNJJ | |
| Rage 2 - 1920x1080 Ultra Preset (Resolution Scale Off) | |
| Moyenne NVIDIA GeForce GTX 1660 Ti Mobile (67.9 - 68.8, n=2) | |
| HP Pavilion Gaming 15-ec0017ng | |
| Moyenne NVIDIA GeForce GTX 1660 Ti Max-Q (58.2 - 64.8, n=2) | |
| HP Omen 15-dc1020ng | |
| HP Gaming Pavilion 15-dk0009ng | |
| MSI Alpha 15 A3DDK | |
| Moyenne NVIDIA GeForce GTX 1650 Mobile (45.1 - 60, n=3) | |
| HP Omen 15-dc1020ng | |
| Dell G5 15 5590-PCNJJ | |
| Ghost Recon Breakpoint - 1920x1080 Ultra Preset AA:T | |
| Moyenne NVIDIA GeForce GTX 1660 Ti Mobile (51 - 55, n=2) | |
| Moyenne NVIDIA GeForce GTX 1660 Ti Max-Q (48 - 51, n=2) | |
| HP Pavilion Gaming 15-ec0017ng | |
| Moyenne NVIDIA GeForce GTX 1650 Mobile (30 - 37, n=2) | |
| Dell G5 15 5590-PCNJJ | |
| MSI Alpha 15 A3DDK | |
| Borderlands 3 - 1920x1080 Badass Overall Quality (DX11) | |
| Moyenne NVIDIA GeForce GTX 1660 Ti Mobile (46.6 - 48.6, n=3) | |
| Moyenne NVIDIA GeForce GTX 1660 Ti Max-Q (41.5 - 42.3, n=2) | |
| HP Pavilion Gaming 15-ec0017ng | |
| MSI Alpha 15 A3DDK | |
| Moyenne NVIDIA GeForce GTX 1650 Mobile (29 - 34.6, n=5) | |
| Dell G5 15 5590-PCNJJ | |
| Total War: Three Kingdoms - 1920x1080 Ultra (incl textures) | |
| Moyenne NVIDIA GeForce GTX 1660 Ti Mobile (n=1) | |
| HP Gaming Pavilion 15-dk0009ng | |
| Moyenne NVIDIA GeForce GTX 1660 Ti Max-Q (41.1 - 41.6, n=2) | |
| HP Pavilion Gaming 15-ec0017ng | |
| MSI Alpha 15 A3DDK | |
| Moyenne NVIDIA GeForce GTX 1650 Mobile (24.4 - 26.9, n=4) | |
| Dell G5 15 5590-PCNJJ | |
| Bas | Moyen | Élevé | Ultra | QHD | 4K | |
|---|---|---|---|---|---|---|
| Counter-Strike: GO (2012) | 191 | 137 | 76.3 | |||
| BioShock Infinite (2013) | 201 | 169 | 123 | |||
| GTA V (2015) | 93 | 48.6 | 20.2 | |||
| The Witcher 3 (2015) | 165 | 72 | 43.6 | |||
| Dota 2 Reborn (2015) | 93 | 86 | 81 | 72 | 53 | |
| World of Warships (2015) | 93 | 54.9 | ||||
| Rainbow Six Siege (2015) | 151 | 143 | 59.6 | |||
| Overwatch (2016) | 124 | 109 | 74 | |||
| Rocket League (2017) | 175 | 175 | 72 | |||
| Playerunknown's Battlegrounds (PUBG) (2017) | 59.4 | |||||
| Middle-earth: Shadow of War (2017) | 70 | 24 | ||||
| Assassin´s Creed Origins (2017) | 41 | 35 | ||||
| Fortnite (2018) | 65 | |||||
| Far Cry 5 (2018) | 62 | 59 | 48 | |||
| Shadow of the Tomb Raider (2018) | 59 | 53 | 32 | 15 | ||
| Assassin´s Creed Odyssey (2018) | 48 | 43 | 40 | 31 | ||
| Call of Duty Black Ops 4 (2018) | 67.5 | 53.9 | 28.8 | |||
| Battlefield V (2018) | 61 | 43.7 | 16.2 | |||
| Farming Simulator 19 (2018) | 70 | 49.1 | 32.8 | |||
| Apex Legends (2019) | 72 | 51.7 | 28.4 | |||
| Far Cry New Dawn (2019) | 51 | 47 | 25 | |||
| Metro Exodus (2019) | 92.3 | 45.4 | 38.1 | 32.2 | 25 | |
| Anthem (2019) | 48 (stuttering) | 47 (stuttering) | 44 (stuttering) | 32 (stuttering) | ||
| Dirt Rally 2.0 (2019) | 58.4 | 38.1 | 22.8 | |||
| The Division 2 (2019) | 51 | 42 | ||||
| Anno 1800 (2019) | 60 | 46.3 | 23.9 | |||
| Rage 2 (2019) | 67 | 55.7 | 53.4 | 15.4 | ||
| Total War: Three Kingdoms (2019) | 134 | 69.1 | 48.7 | 35.8 | 19.4 | 6.9 |
| F1 2019 (2019) | 79 | 74 | 64 | 64 | 49.1 | 33.3 |
| Control (2019) | 119 | 47.5 | 34.2 | |||
| Borderlands 3 (2019) | 76 | 66 | 47.2 | 35.6 | 23.9 | 6.7 |
| FIFA 20 (2019) | 122 | 122 | 96 | |||
| Ghost Recon Breakpoint (2019) | 58 | 53 | 48 | 26 | ||
| GRID 2019 (2019) | 81 | 67 | 36.7 | 29.9 | 15.2 | |
| Call of Duty Modern Warfare 2019 (2019) | 112 | 94 | 81 | 64 | 35.4 | 20.1 |
| Need for Speed Heat (2019) | 63 | 57.7 | 52.3 | 45.8 | 41 | 14.1 |
| Star Wars Jedi Fallen Order (2019) | 58.6 | 40.1 | 19.8 | |||
| Red Dead Redemption 2 (2019) | 92 | 63 | 40.5 | 23.8 | ||
| God of War (2022) | 36.1 | 36 | 33 | 9.06 | ||
| Rainbow Six Extraction (2022) | 95 | 78 | 76 | 36 | ||
| GRID Legends (2022) | 81 | 71.8 | 71.1 | 59.2 | ||
| Elden Ring (2022) | 37 | 35.8 | 35.2 | 35.2 | ||
| Cyberpunk 2077 1.6 (2022) | 55.9 | 44.9 | 34.4 | 27.7 | ||
| Elex 2 (2022) | 20.1 | 19.3 | 19.4 | 18.8 | ||
| Ghostwire Tokyo (2022) | 56 | 56 | 55.7 | 54.9 | ||
| Tiny Tina's Wonderlands (2022) | 88.5 | 71.2 | 38.6 | 28.3 | ||
| Vampire Bloodhunt (2022) | 93.8 | 82.1 | 78.7 | 77.3 | ||
| F1 22 (2022) | 95 | 92 | 78 | 66 | ||
| The Quarry (2022) | 65.5 | 47 | 40.3 | 23.8 | ||
| FIFA 23 (2022) | 46.6 | 38.4 | 33.3 | 33.2 | ||
| A Plague Tale Requiem (2022) | 47.2 | 36.9 | 26.9 | 20.7 | ||
| Uncharted Legacy of Thieves Collection (2022) | 36.6 | 32.3 | 20.6 | 18.6 | ||
| Call of Duty Modern Warfare 2 2022 (2022) | 70 | 66 | 56 | 43 | ||
| Spider-Man Miles Morales (2022) | 48 | 43.3 | 30.6 | 26 | ||
| The Callisto Protocol (2022) | 57.7 | 47.4 | 29.8 | 28.6 | ||
| Need for Speed Unbound (2022) | 43.2 | 41 | 34.7 | 27.3 |
Degré de la nuisance sonore
| Au repos |
| 31.1 / 34.8 / 35.5 dB(A) |
| Fortement sollicité |
| 43 / 53.6 dB(A) |
 | ||
30 dB silencieux 40 dB(A) audible 50 dB(A) bruyant |
||
min: | ||
(±) La température maximale du côté supérieur est de 42 °C / 108 F, par rapport à la moyenne de 40.4 °C / 105 F, allant de 21.2 à 68.8 °C pour la classe Gaming.
(±) Le fond chauffe jusqu'à un maximum de 45 °C / 113 F, contre une moyenne de 43.2 °C / 110 F
(+) En utilisation inactive, la température moyenne du côté supérieur est de 29.1 °C / 84 F, par rapport à la moyenne du dispositif de 33.9 °C / 93 F.
(+) En jouant à The Witcher 3, la température moyenne du côté supérieur est de 31.3 °C / 88 F, alors que la moyenne de l'appareil est de 33.9 °C / 93 F.
(+) Les repose-poignets et le pavé tactile atteignent la température maximale de la peau (32 °C / 89.6 F) et ne sont donc pas chauds.
(-) La température moyenne de la zone de l'appui-paume de dispositifs similaires était de 28.8 °C / 83.8 F (-3.2 °C / #-5.8 F).
MSI Alpha 15 A3DDK analyse audio
(+) | les haut-parleurs peuvent jouer relativement fort (90.6# dB)
Basses 100 - 315 Hz
(-) | presque aucune basse - en moyenne 26.4% plus bas que la médiane
(±) | la linéarité des basses est moyenne (7.3% delta à la fréquence précédente)
Médiums 400 - 2000 Hz
(±) | médiane supérieure - en moyenne 6.9% supérieure à la médiane
(±) | la linéarité des médiums est moyenne (7.6% delta à la fréquence précédente)
Aiguës 2 - 16 kHz
(+) | des sommets équilibrés - à seulement 2% de la médiane
(+) | les aigus sont linéaires (6.2% delta à la fréquence précédente)
Globalement 100 - 16 000 Hz
(±) | la linéarité du son global est moyenne (17.7% de différence avec la médiane)
Par rapport à la même classe
» 52% de tous les appareils testés de cette catégorie étaient meilleurs, 10% similaires, 38% pires
» Le meilleur avait un delta de 6%, la moyenne était de 18%, le pire était de 132%.
Par rapport à tous les appareils testés
» 35% de tous les appareils testés étaient meilleurs, 8% similaires, 57% pires
» Le meilleur avait un delta de 4%, la moyenne était de 24%, le pire était de 134%.
Apple MacBook 12 (Early 2016) 1.1 GHz analyse audio
(+) | les haut-parleurs peuvent jouer relativement fort (83.6# dB)
Basses 100 - 315 Hz
(±) | basse réduite - en moyenne 11.3% inférieure à la médiane
(±) | la linéarité des basses est moyenne (14.2% delta à la fréquence précédente)
Médiums 400 - 2000 Hz
(+) | médiane équilibrée - seulement 2.4% de la médiane
(+) | les médiums sont linéaires (5.5% delta à la fréquence précédente)
Aiguës 2 - 16 kHz
(+) | des sommets équilibrés - à seulement 2% de la médiane
(+) | les aigus sont linéaires (4.5% delta à la fréquence précédente)
Globalement 100 - 16 000 Hz
(+) | le son global est linéaire (10.2% différence à la médiane)
Par rapport à la même classe
» 7% de tous les appareils testés de cette catégorie étaient meilleurs, 2% similaires, 91% pires
» Le meilleur avait un delta de 5%, la moyenne était de 18%, le pire était de 53%.
Par rapport à tous les appareils testés
» 5% de tous les appareils testés étaient meilleurs, 1% similaires, 94% pires
» Le meilleur avait un delta de 4%, la moyenne était de 24%, le pire était de 134%.
| Éteint/en veille | |
| Au repos | |
| Fortement sollicité |
|
Légende:
min: | |
| MSI Alpha 15 A3DDK R7 3750H, Radeon RX 5500M, Toshiba KBG30ZMV256G, IPS, 1920x1080, 15.6" | Asus TUF FX505DT-EB73 R7 3750H, GeForce GTX 1650 Mobile, Intel SSD 660p SSDPEKNW512G8, IPS, 1920x1080, 15.6" | Dell G3 3590 i5-9300H, GeForce GTX 1650 Mobile, Toshiba BG4 KBG40ZNS128G, IPS, 1920x1080, 15.6" | Acer Aspire Nitro 5 AN515-54-53Z2 i5-9300H, GeForce GTX 1650 Mobile, WDC PC SN520 SDAPNUW-512G, IPS, 1920x1080, 15.6" | Asus ROG Zephyrus G15 GA502DU R7 3750H, GeForce GTX 1660 Ti Max-Q, Intel SSD 660p SSDPEKNW512G8, IPS, 1920x1080, 15.6" | Lenovo IdeaPad L340-15IRH 81LK00BMGE i5-9300H, GeForce GTX 1650 Mobile, WDC PC SN520 SDAPMUW-512, IPS, 1920x1080, 15.6" | HP Omen 15-dc1020ng i5-9300H, GeForce GTX 1650 Mobile, WDC PC SN720 SDAQNTW-512G, IPS, 1920x1080, 15.6" | Dell G5 15 5590-PCNJJ i5-9300H, GeForce GTX 1650 Mobile, KBG30ZMS128G, IPS, 1920x1080, 15.6" | HP Pavilion Gaming 15-ec0017ng R7 3750H, GeForce GTX 1660 Ti Max-Q, WDC PC SN720 SDAPNTW-256G, IPS, 1920x1080, 15.6" | |
|---|---|---|---|---|---|---|---|---|---|
| Power Consumption | 32% | 18% | 35% | 11% | 43% | 36% | 34% | 38% | |
| Idle Minimum * (Watt) | 11.7 | 7 40% | 6.2 47% | 5 57% | 7.4 37% | 3.8 68% | 4.04 65% | 4 66% | 3.4 71% |
| Idle Average * (Watt) | 15.7 | 9.9 37% | 8.4 46% | 7 55% | 8.6 45% | 6.6 58% | 7.2 54% | 7 55% | 7.6 52% |
| Idle Maximum * (Watt) | 22.4 | 12 46% | 27.7 -24% | 11 51% | 39.1 -75% | 8.9 60% | 11.4 49% | 12 46% | 10.2 54% |
| Load Average * (Watt) | 70.7 | 68.4 3% | 91 -29% | 89 -26% | 65.9 7% | 78.4 -11% | 80.8 -14% | 95 -34% | 73 -3% |
| Witcher 3 ultra * (Watt) | 148 | 94.9 36% | 94.4 36% | 90 39% | 106.9 28% | 82 45% | 93.6 37% | 86 42% | 107 28% |
| Load Maximum * (Watt) | 191 | 130.9 31% | 131.5 31% | 132 31% | 141.3 26% | 124 35% | 144.5 24% | 135 29% | 140.5 26% |
* ... Moindre est la valeur, meilleures sont les performances
Verdict initial
Alors que MSI n’a pas essayé d’atteindre la première place avec l’Alpha 15, il a développé une machine qui secoue indéniablement le marché du milieu de gamme, qu’Intel et Nvidia ont dominé jusqu’à aujourd’hui. En bref, l’Alpha 15 est le premier pas sur un marché sur lequel AMD devrait monter en puissance.
Le composant-phare de l’Alpha 15 est son GPU Radeon RX 5500M, basé sur l’architecture Navi d’AMD. La carte graphique, fabriquée en 7 nm, se situe sur le papier entre les GeForce GTX 1650 et GTX 1660 Ti Max-Q, ce que nos tests avec ce modèle de préproduction confirment. Il faut cependant noter que la disparité des résultats est pour l’instant élevée – la RX 5500M ne dépasse pas la GTX 1650 dans certains jeux, tandis qu’elle atteint la GTX 1660 Ti Max-Q dans d’autres. Elle se situe cependant entre les deux la plupart du temps.
Le MSI Alpha 15 peut concurrencer les portables équipés d’un Core i5-9300H et d’une GeForce 1660 Ti Max-Q dans certains jeux, avec son processeur Ryzen 7 3750H et sa nouvelle carte graphique RX 5500M.
Que l’on parle d’un succès pour AMD ou MSI dépendra du prix de lancement de l’Alpha 15. Des informations non officielles laissent entendre que l’appareil sera vendu entre 999 et 1 099 € pour des versions 120 et 144 Hz, ce qui place l’Alpha 15 bien au-delà des appareils Core i5-9300H et GTX 1650, qui coûtent généralement bien moins de 1 000 $. Cependant, les portables GTX 1660 Ti Max-Q coûtent souvent plus de 1 000 $, ce qui met mieux en avant la RX 5500M. Nous imaginons que le choix entre ces trois cartes graphiques dépendra également des autres fonctionnalités que proposeront les portables qui en seront équipés.
Dans l’ensemble, l’Alpha 15 donne une bonne impression de la Radeon RX 5500M, et de l’architecture RDNA sur portables. Il semblerait que le choix entre AMD et Nvidia sera à nouveau un véritable choix, même si la capacité d’AMD à pénétrer le marché du portable de jeu haut de gamme est encore à confirmer. Ce qui est certain, c’est que des cartes graphiques pour portables plus puissantes que la RX 5500M sont sur les rails.
L’intégralité de cette critique est disponible en anglais en suivant ce lien.
Price comparison
