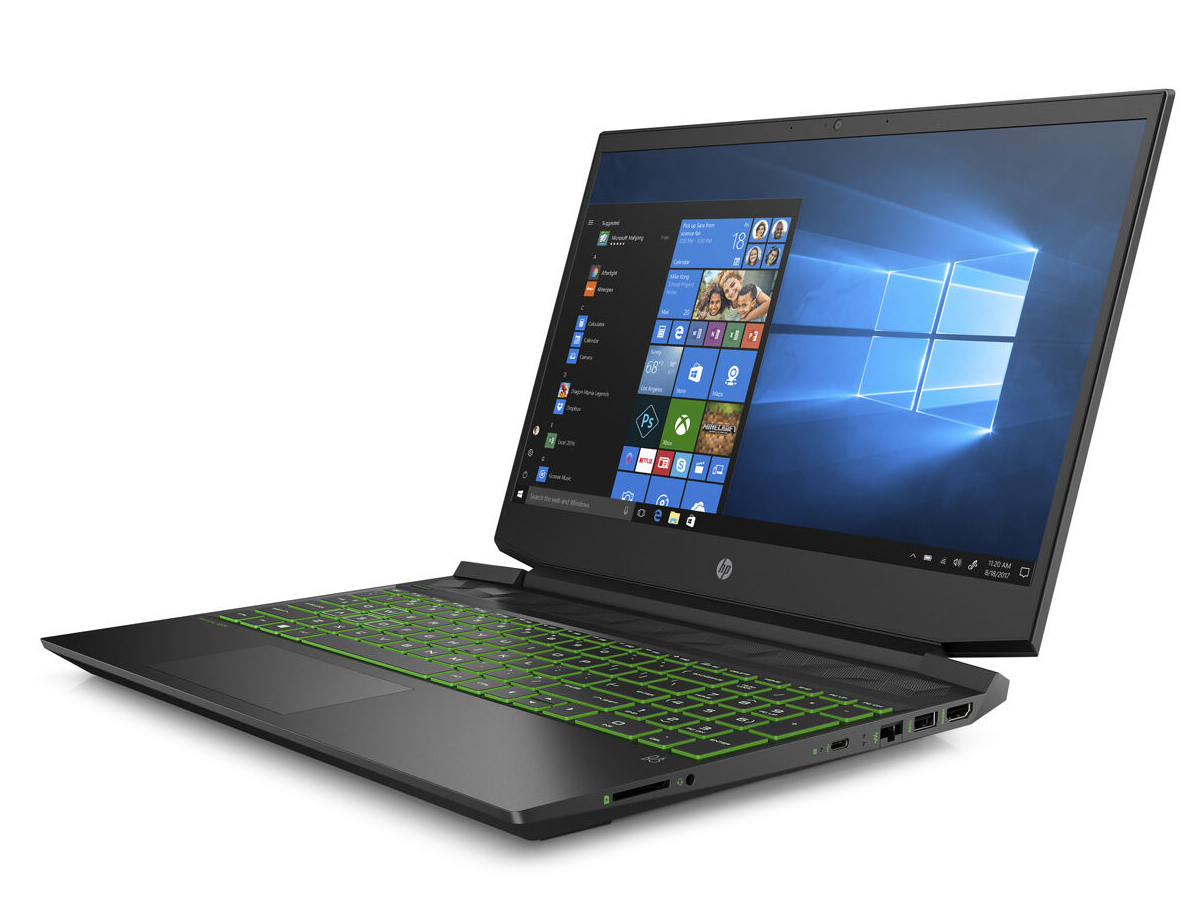
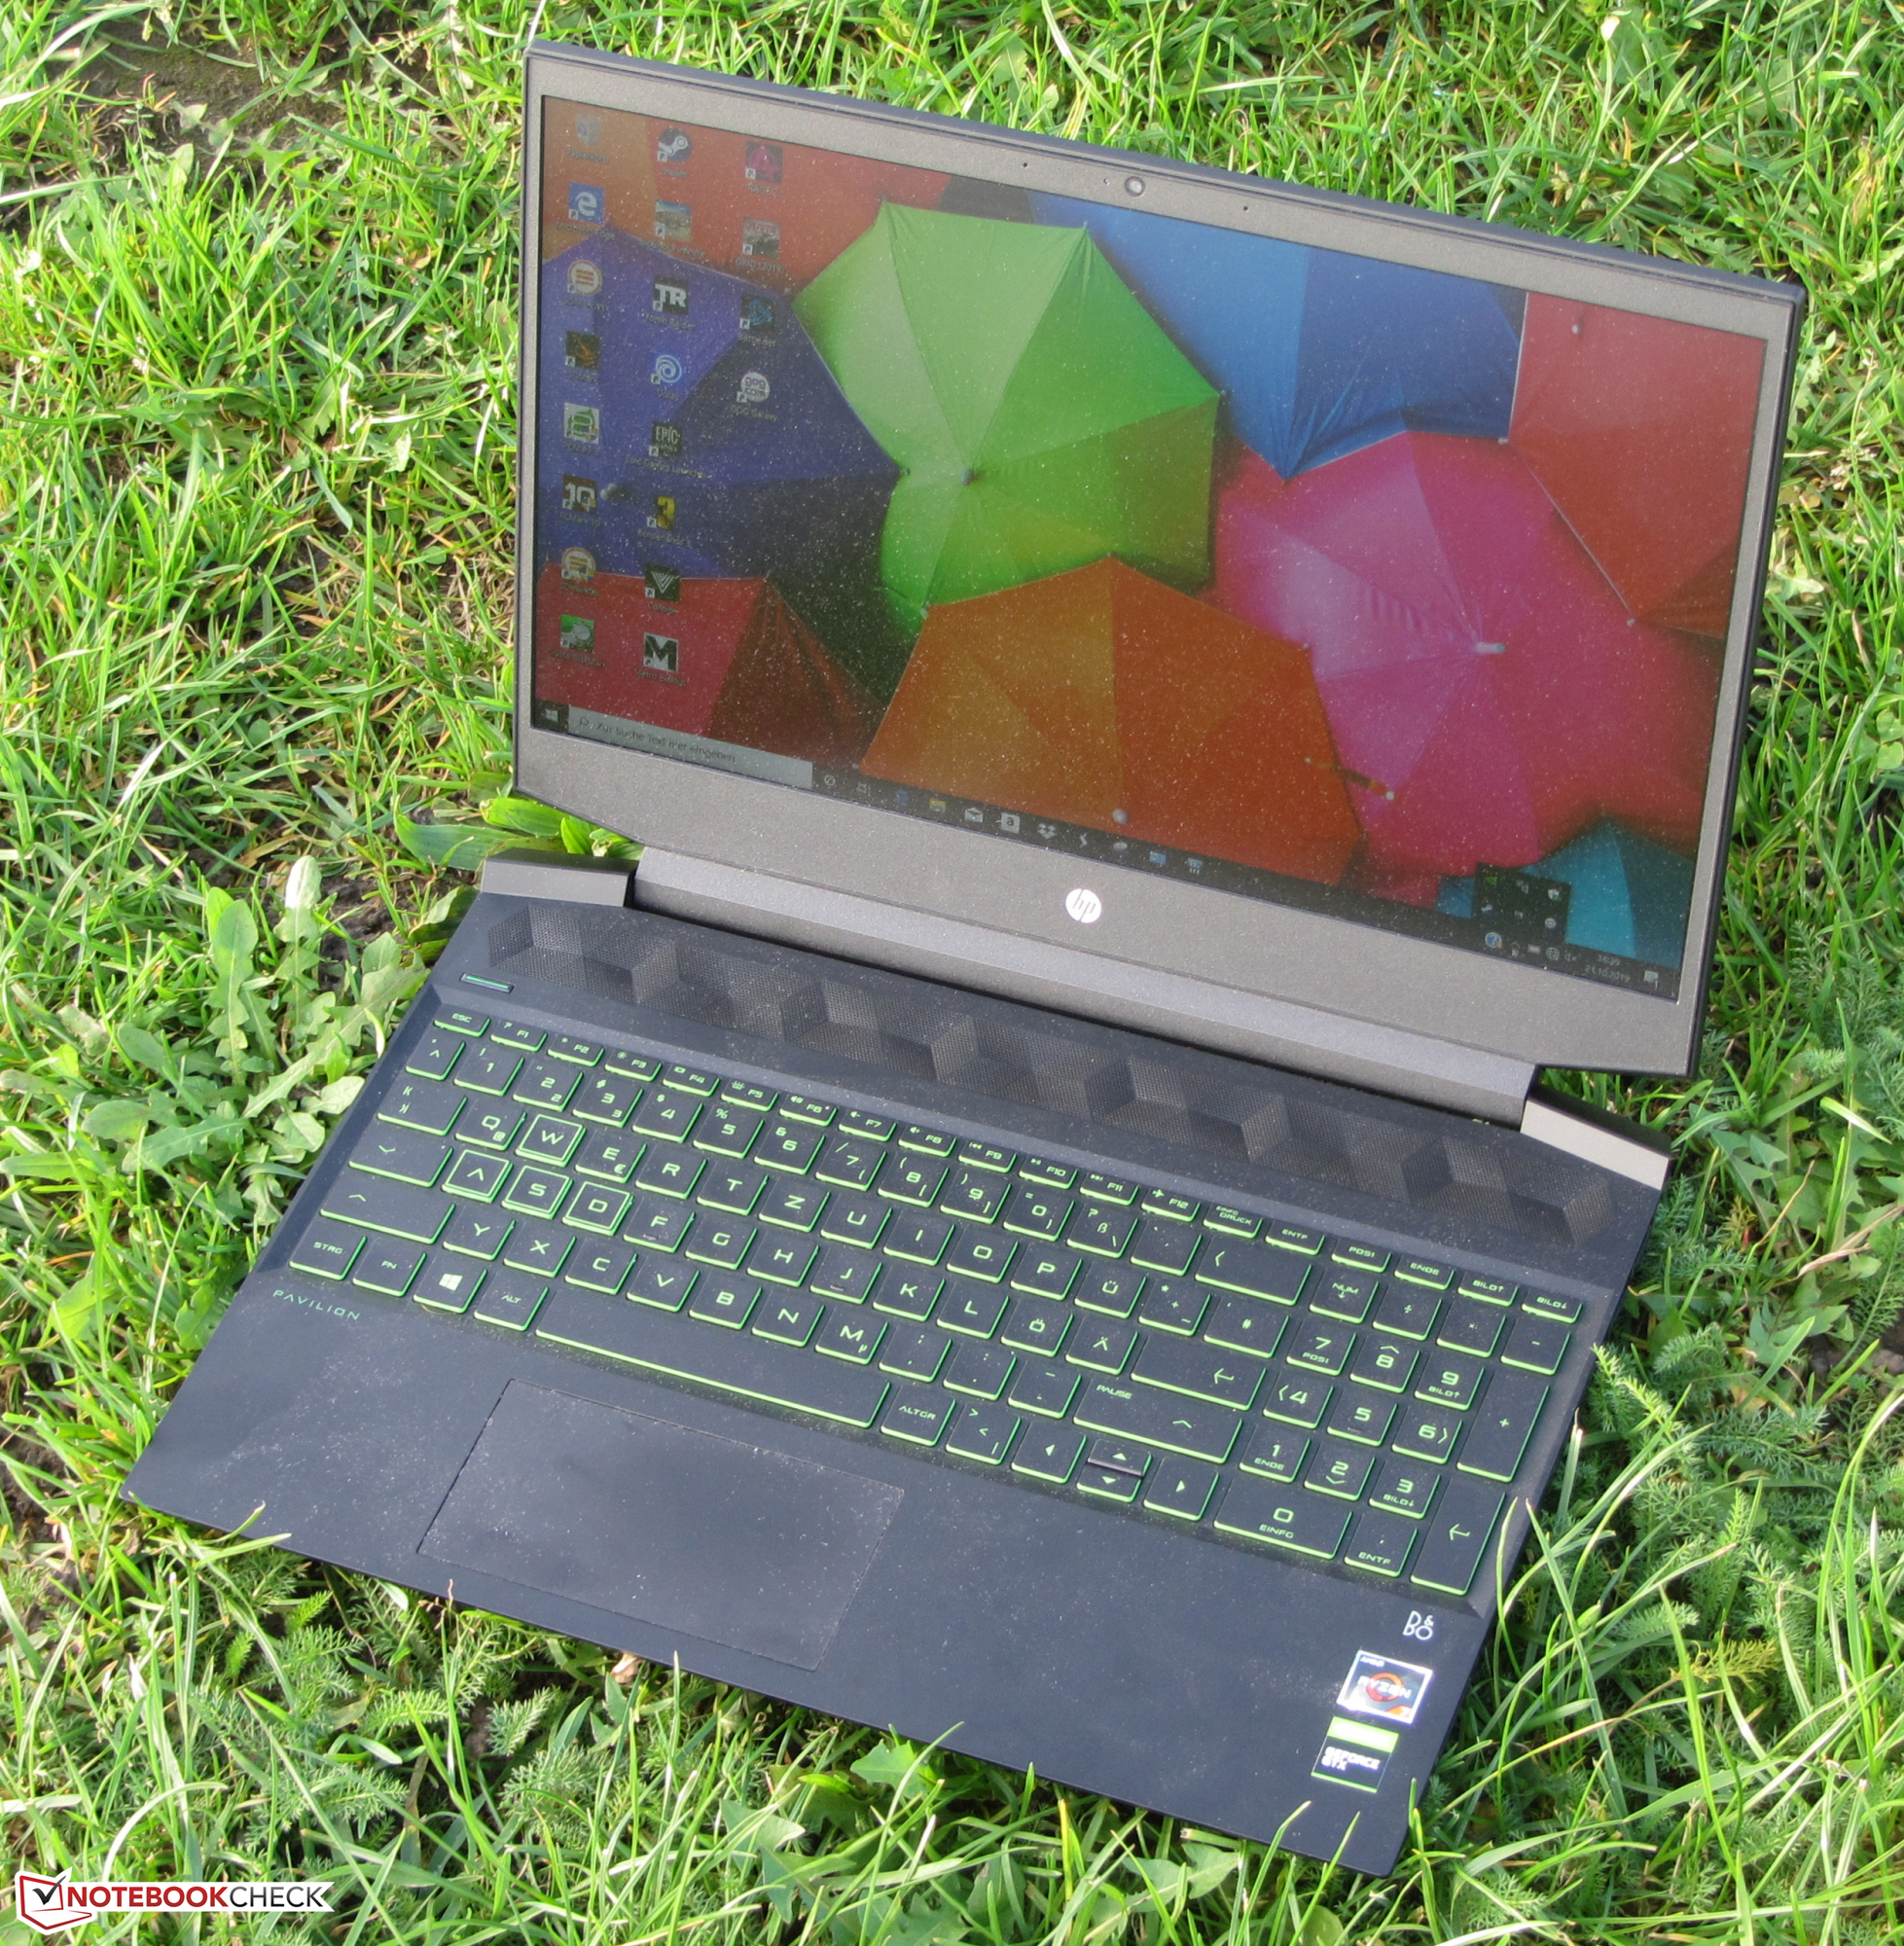
Test du HP Pavilion Gaming 15 (Ryzen 7 3750H, GTX 1660 Ti Max-Q, FHD) : puissance de jeu et autonomie
Note | Date | Modèle | Poids | Épaisseur | Taille | Résolution | Prix |
|---|---|---|---|---|---|---|---|
| 79.7 % v7 (old) | 11/19 | HP Pavilion Gaming 15-ec0017ng R7 3750H, GeForce GTX 1660 Ti Max-Q | 2.3 kg | 23.5 mm | 15.60" | 1920x1080 | |
| 83.9 % v7 (old) | 08/19 | HP Gaming Pavilion 15-dk0009ng i7-9750H, GeForce GTX 1660 Ti Max-Q | 2.4 kg | 23.4 mm | 15.60" | 1920x1080 | |
| 79.6 % v7 (old) | 10/19 | Dell G5 15 5590-PCNJJ i5-9300H, GeForce GTX 1650 Mobile | 2.7 kg | 23.7 mm | 15.60" | 1920x1080 | |
| 82.3 % v7 (old) | 08/19 | Lenovo Legion Y540-15IRH-81SX00B2GE i7-9750H, GeForce GTX 1660 Ti Mobile | 2.2 kg | 26 mm | 15.60" | 1920x1080 | |
| 82.5 % v6 (old) | 05/19 | Acer Aspire Nitro 5 AN515-54-53Z2 i5-9300H, GeForce GTX 1650 Mobile | 2.2 kg | 27 mm | 15.60" | 1920x1080 |
| SD Card Reader | |
| average JPG Copy Test (av. of 3 runs) | |
| Moyenne de la classe Gaming (20.9 - 210, n=54, 2 dernières années) | |
| HP Gaming Pavilion 15-dk0009ng (Toshiba Exceria Pro SDXC 64 GB UHS-II) | |
| HP Pavilion Gaming 15-ec0017ng (Toshiba Exceria Pro SDXC 64 GB UHS-II) | |
| Dell G5 15 5590-PCNJJ (Toshiba Exceria Pro SDXC 64 GB UHS-II) | |
| maximum AS SSD Seq Read Test (1GB) | |
| Moyenne de la classe Gaming (25.5 - 261, n=51, 2 dernières années) | |
| HP Gaming Pavilion 15-dk0009ng (Toshiba Exceria Pro SDXC 64 GB UHS-II) | |
| HP Pavilion Gaming 15-ec0017ng (Toshiba Exceria Pro SDXC 64 GB UHS-II) | |
| Dell G5 15 5590-PCNJJ (Toshiba Exceria Pro SDXC 64 GB UHS-II) | |
| |||||||||||||||||||||||||
Homogénéité de la luminosité: 84 %
Valeur mesurée au centre, sur batterie: 302 cd/m²
Contraste: 1208:1 (Valeurs des noirs: 0.25 cd/m²)
ΔE ColorChecker Calman: 4.84 | ∀{0.5-29.43 Ø4.72}
calibrated: 2.63
ΔE Greyscale Calman: 4.31 | ∀{0.09-98 Ø4.97}
89% sRGB (Argyll 1.6.3 3D)
58% AdobeRGB 1998 (Argyll 1.6.3 3D)
63.8% AdobeRGB 1998 (Argyll 3D)
89.2% sRGB (Argyll 3D)
62.8% Display P3 (Argyll 3D)
Gamma: 2.56
CCT: 7318 K
| HP Pavilion Gaming 15-ec0017ng IPS, 1920x1080, 15.6" | HP Gaming Pavilion 15-dk0009ng IPS, 1920x1080, 15.6" | Dell G5 15 5590-PCNJJ IPS, 1920x1080, 15.6" | Lenovo Legion Y540-15IRH-81SX00B2GE IPS, 1920x1080, 15.6" | Acer Aspire Nitro 5 AN515-54-53Z2 IPS, 1920x1080, 15.6" | |
|---|---|---|---|---|---|
| Display | 4% | 32% | 2% | -38% | |
| Display P3 Coverage (%) | 62.8 | 64.2 2% | 83.1 32% | 63.6 1% | 37.97 -40% |
| sRGB Coverage (%) | 89.2 | 95.1 7% | 99.9 12% | 91.7 3% | 57 -36% |
| AdobeRGB 1998 Coverage (%) | 63.8 | 65.8 3% | 96.8 52% | 65.2 2% | 39.23 -39% |
| Response Times | 62% | -12% | 69% | 2% | |
| Response Time Grey 50% / Grey 80% * (ms) | 40 ? | 16.4 ? 59% | 48 ? -20% | 8.8 ? 78% | 42 ? -5% |
| Response Time Black / White * (ms) | 29 ? | 10.4 ? 64% | 30 ? -3% | 12 ? 59% | 26.8 ? 8% |
| PWM Frequency (Hz) | |||||
| Screen | 19% | -22% | 4% | -10% | |
| Brightness middle (cd/m²) | 302 | 345 14% | 234 -23% | 299 -1% | 238 -21% |
| Brightness (cd/m²) | 291 | 324 11% | 216 -26% | 290 0% | 226 -22% |
| Brightness Distribution (%) | 84 | 86 2% | 87 4% | 89 6% | 83 -1% |
| Black Level * (cd/m²) | 0.25 | 0.42 -68% | 0.22 12% | 0.29 -16% | 0.27 -8% |
| Contrast (:1) | 1208 | 821 -32% | 1064 -12% | 1031 -15% | 881 -27% |
| Colorchecker dE 2000 * | 4.84 | 1.3 73% | 6.52 -35% | 3.7 24% | 4.11 15% |
| Colorchecker dE 2000 max. * | 8.18 | 2.8 66% | 10.58 -29% | 7 14% | 6.89 16% |
| Colorchecker dE 2000 calibrated * | 2.63 | 1.1 58% | 3.56 -35% | 2 24% | 3.76 -43% |
| Greyscale dE 2000 * | 4.31 | 1.2 72% | 5.33 -24% | 4.1 5% | 1.78 59% |
| Gamma | 2.56 86% | 2.31 95% | 2.86 77% | 2.19 100% | 2.41 91% |
| CCT | 7318 89% | 6476 100% | 5983 109% | 7166 91% | 6311 103% |
| Color Space (Percent of AdobeRGB 1998) (%) | 58 | 60.5 4% | 36 -38% | 59.3 2% | 36 -38% |
| Color Space (Percent of sRGB) (%) | 89 | 94.9 7% | 57 -36% | 91.5 3% | 57 -36% |
| Moyenne finale (programmes/paramètres) | 28% /
21% | -1% /
-11% | 25% /
12% | -15% /
-14% |
* ... Moindre est la valeur, meilleures sont les performances
Temps de réponse de l'écran
| ↔ Temps de réponse noir à blanc | ||
|---|---|---|
| 29 ms ... hausse ↗ et chute ↘ combinées | ↗ 16 ms hausse |  |
| ↘ 13 ms chute | ||
| L'écran souffre de latences relativement élevées, insuffisant pour le jeu. En comparaison, tous les appareils testés affichent entre 0.1 (minimum) et 240 (maximum) ms. » 77 % des appareils testés affichent de meilleures performances. Cela signifie que les latences relevées sont moins bonnes que la moyenne (19.8 ms) de tous les appareils testés. | ||
| ↔ Temps de réponse gris 50% à gris 80% | ||
| 40 ms ... hausse ↗ et chute ↘ combinées | ↗ 19 ms hausse | 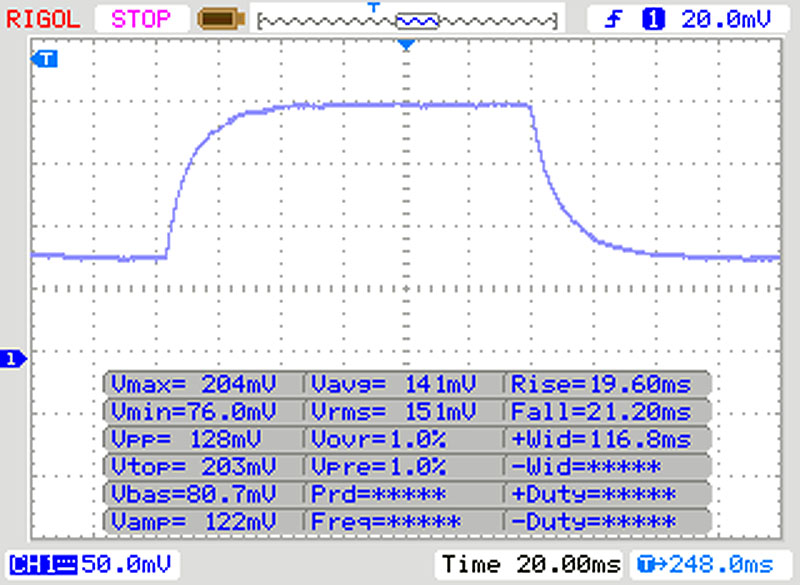 |
| ↘ 21 ms chute | ||
| L'écran souffre de latences très élevées, à éviter pour le jeu. En comparaison, tous les appareils testés affichent entre 0.165 (minimum) et 636 (maximum) ms. » 61 % des appareils testés affichent de meilleures performances. Cela signifie que les latences relevées sont moins bonnes que la moyenne (31 ms) de tous les appareils testés. | ||
Scintillement / MLI (Modulation de largeur d'impulsion)
| Scintillement / MLI (Modulation de largeur d'impulsion) non décelé | 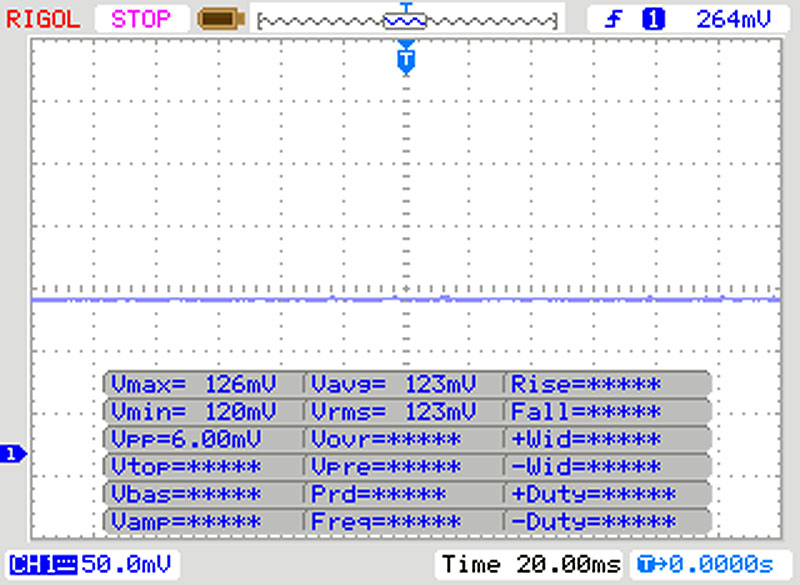 | ||
En comparaison, 52 % des appareils testés n'emploient pas MDI pour assombrir leur écran. Nous avons relevé une moyenne à 7765 (minimum : 5 - maximum : 343500) Hz dans le cas où une MDI était active. | |||

| Geekbench 3 | |
| 32 Bit Multi-Core Score | |
| HP Gaming Pavilion 15-dk0009ng | |
| HP Pavilion Gaming 15-ec0017ng | |
| Moyenne AMD Ryzen 7 3750H (14478 - 15019, n=2) | |
| 32 Bit Single-Core Score | |
| HP Gaming Pavilion 15-dk0009ng | |
| HP Pavilion Gaming 15-ec0017ng | |
| Moyenne AMD Ryzen 7 3750H (3717 - 3819, n=2) | |
| Mozilla Kraken 1.1 - Total | |
| Lenovo Legion Y540-15IRH-81SX00B2GE | |
| Asus TUF FX505DY (Edge 44.17763.1.0) | |
| Moyenne AMD Ryzen 7 3750H (1132 - 1228, n=4) | |
| Asus TUF FX505DT-EB73 (Edge 44.17763.1.0) | |
| HP Pavilion Gaming 15-ec0017ng (Edge 44) | |
| HP Gaming Pavilion 15-dk0009ng (Edge 44) | |
| Moyenne de la classe Gaming (391 - 590, n=105, 2 dernières années) | |
| Octane V2 - Total Score | |
| Moyenne de la classe Gaming (93292 - 139447, n=27, 2 dernières années) | |
| HP Gaming Pavilion 15-dk0009ng (Edge 44) | |
| Lenovo Legion Y540-15IRH-81SX00B2GE | |
| HP Pavilion Gaming 15-ec0017ng (Edge 44) | |
| Asus TUF FX505DT-EB73 (Edge 44.17763.1.0) | |
| Moyenne AMD Ryzen 7 3750H (29949 - 30714, n=4) | |
| Asus TUF FX505DY (Edge 44.17763.1.0) | |
| JetStream 1.1 - 1.1 Total | |
| Moyenne de la classe Gaming (549 - 647, n=3, 2 dernières années) | |
| HP Gaming Pavilion 15-dk0009ng (Edge 44) | |
| HP Pavilion Gaming 15-ec0017ng (Edge 44) | |
| Asus TUF FX505DT-EB73 (Edge 44.17763.1.0) | |
| Moyenne AMD Ryzen 7 3750H (205 - 220, n=5) | |
| Lenovo Legion Y540-15IRH-81SX00B2GE | |
| Asus TUF FX505DY (Edge 44.17763.1.0) | |
* ... Moindre est la valeur, meilleures sont les performances
| PCMark 8 Home Score Accelerated v2 | 3944 points | |
| PCMark 8 Creative Score Accelerated v2 | 3987 points | |
| PCMark 8 Work Score Accelerated v2 | 4967 points | |
| PCMark 10 Score | 4565 points | |
Aide | ||

| HP Pavilion Gaming 15-ec0017ng WDC PC SN720 SDAPNTW-256G | HP Gaming Pavilion 15-dk0009ng Samsung SSD PM981 MZVLB256HAHQ | Dell G5 15 5590-PCNJJ KBG30ZMS128G | Lenovo Legion Y540-15IRH-81SX00B2GE WDC PC SN720 SDAPNTW-512G | Acer Aspire Nitro 5 AN515-54-53Z2 WDC PC SN520 SDAPNUW-512G | Moyenne WDC PC SN720 SDAPNTW-256G | |
|---|---|---|---|---|---|---|
| CrystalDiskMark 5.2 / 6 | -8% | -61% | 20% | -14% | 0% | |
| Write 4K (MB/s) | 148 | 100 -32% | 65.3 -56% | 158.8 7% | 109.1 -26% | 148 ? 0% |
| Read 4K (MB/s) | 43.73 | 31.39 -28% | 29.71 -32% | 29.11 -33% | 42.05 -4% | 43.7 ? 0% |
| Write Seq (MB/s) | 1617 | 1308 -19% | 128.8 -92% | 1584 -2% | 1457 -10% | 1617 ? 0% |
| Read Seq (MB/s) | 1753 | 1083 -38% | 859 -51% | 1694 -3% | 1421 -19% | 1753 ? 0% |
| Write 4K Q32T1 (MB/s) | 246.3 | 362.9 47% | 95.8 -61% | 536 118% | 287.8 17% | 246 ? 0% |
| Read 4K Q32T1 (MB/s) | 368 | 425.7 16% | 197.6 -46% | 363.9 -1% | 317.9 -14% | 368 ? 0% |
| Write Seq Q32T1 (MB/s) | 1618 | 1411 -13% | 132.5 -92% | 2536 57% | 1455 -10% | 1618 ? 0% |
| Read Seq Q32T1 (MB/s) | 3027 | 3240 7% | 1208 -60% | 3458 14% | 1739 -43% | 3027 ? 0% |
| 3DMark 06 Standard Score | 25038 points | |
| 3DMark 11 Performance | 14271 points | |
| 3DMark Ice Storm Standard Score | 77644 points | |
| 3DMark Cloud Gate Standard Score | 24182 points | |
| 3DMark Fire Strike Score | 11198 points | |
| 3DMark Time Spy Score | 4842 points | |
Aide | ||
| Metro Exodus - 1920x1080 High Quality AF:16x | |
| Moyenne NVIDIA GeForce GTX 1660 Ti Max-Q (45.1 - 49.1, n=3) | |
| HP Pavilion Gaming 15-ec0017ng | |
| Dell G5 15 5590-PCNJJ | |
| Rocket League - 1920x1080 High Quality AA:High FX | |
| Acer Aspire Nitro 5 AN517-51-7887 | |
| HP Pavilion Gaming 15-ec0017ng | |
| Moyenne NVIDIA GeForce GTX 1660 Ti Max-Q (141.7 - 173.7, n=2) | |
| Dell G5 15 5590-PCNJJ | |
| Asus TUF FX505DT-EB73 | |
| Bas | Moyen | Élevé | Ultra | |
|---|---|---|---|---|
| Tomb Raider (2013) | 343.8 | 322.9 | 296.9 | 166.1 |
| BioShock Infinite (2013) | 224.2 | 195.6 | 180.9 | 107.4 |
| The Witcher 3 (2015) | 186.8 | 142.6 | 89.9 | 52.2 |
| Dota 2 Reborn (2015) | 93.3 | 88.7 | 81.4 | 75.7 |
| Rocket League (2017) | 247.4 | 212.1 | 173.7 | |
| X-Plane 11.11 (2018) | 60.6 | 54.5 | 47.8 | |
| World of Tanks enCore (2018) | 376.8 | 215.9 | 117.3 | |
| Shadow of the Tomb Raider (2018) | 82 | 53 | 52 | 49 |
| Assassin´s Creed Odyssey (2018) | 64 | 56 | 51 | 42 |
| Call of Duty Black Ops 4 (2018) | 115.2 | 87.9 | 84.6 | 83.1 |
| Darksiders III (2018) | 135.6 | 85.8 | 77.4 | 72.8 |
| Metro Exodus (2019) | 83.5 | 60 | 45.1 | 36.8 |
| Anthem (2019) | 53.6 | 48.9 | 48.8 | 46.4 |
| Dirt Rally 2.0 (2019) | 181.2 | 102.6 | 88.7 | 57.3 |
| The Division 2 (2019) | 110 | 80 | 66 | 49 |
| Anno 1800 (2019) | 59.6 | 58.7 | 45.3 | 26 |
| Rage 2 (2019) | 146.4 | 76.2 | 65.8 | 64.8 |
| Total War: Three Kingdoms (2019) | 144.1 | 76.5 | 54.7 | 41.1 |
| F1 2019 (2019) | 155 | 119 | 106 | 77 |
| Control (2019) | 158.3 | 63.7 | 47.1 | |
| Borderlands 3 (2019) | 87 | 72.1 | 52.9 | 41.5 |
| FIFA 20 (2019) | 147.9 | 145.4 | 141 | 139.3 |
| Ghost Recon Breakpoint (2019) | 83 | 68 | 65 | 48 |
| GRID 2019 (2019) | 112.9 | 86.5 | 72 | 58.7 |
Degré de la nuisance sonore
| Au repos |
| 31.5 / 31.5 / 31.5 dB(A) |
| Disque dur |
| 31.7 dB(A) |
| Fortement sollicité |
| 41.4 / 45.5 dB(A) |
 | ||
30 dB silencieux 40 dB(A) audible 50 dB(A) bruyant |
||
min: | ||
| HP Pavilion Gaming 15-ec0017ng R7 3750H, GeForce GTX 1660 Ti Max-Q | HP Gaming Pavilion 15-dk0009ng i7-9750H, GeForce GTX 1660 Ti Max-Q | Dell G5 15 5590-PCNJJ i5-9300H, GeForce GTX 1650 Mobile | Lenovo Legion Y540-15IRH-81SX00B2GE i7-9750H, GeForce GTX 1660 Ti Mobile | Acer Aspire Nitro 5 AN515-54-53Z2 i5-9300H, GeForce GTX 1650 Mobile | Moyenne NVIDIA GeForce GTX 1660 Ti Max-Q | Moyenne de la classe Gaming | |
|---|---|---|---|---|---|---|---|
| Noise | 12% | -7% | 5% | -3% | 5% | 6% | |
| arrêt / environnement * (dB) | 30.2 | 28.2 7% | 30 1% | 29.3 3% | 30 1% | 28.3 ? 6% | 24.1 ? 20% |
| Idle Minimum * (dB) | 31.5 | 29.3 7% | 31 2% | 29.3 7% | 30 5% | 29.2 ? 7% | 25.9 ? 18% |
| Idle Average * (dB) | 31.5 | 29.3 7% | 32 -2% | 29.3 7% | 31 2% | 29.5 ? 6% | 27.4 ? 13% |
| Idle Maximum * (dB) | 31.5 | 29.3 7% | 35 -11% | 29.3 7% | 33 -5% | 30.4 ? 3% | 29.9 ? 5% |
| Load Average * (dB) | 41.4 | 32.3 22% | 49 -18% | 35.7 14% | 46 -11% | 37.3 ? 10% | 43 ? -4% |
| Witcher 3 ultra * (dB) | 43.7 | 34 22% | 47 -8% | 44.2 -1% | 46 -5% | ||
| Load Maximum * (dB) | 45.5 | 41.2 9% | 53 -16% | 45.6 -0% | 49 -8% | 46.1 ? -1% | 54.1 ? -19% |
* ... Moindre est la valeur, meilleures sont les performances
(±) La température maximale du côté supérieur est de 44.8 °C / 113 F, par rapport à la moyenne de 40.4 °C / 105 F, allant de 21.2 à 68.8 °C pour la classe Gaming.
(±) Le fond chauffe jusqu'à un maximum de 40.8 °C / 105 F, contre une moyenne de 43.2 °C / 110 F
(+) En utilisation inactive, la température moyenne du côté supérieur est de 23.5 °C / 74 F, par rapport à la moyenne du dispositif de 33.9 °C / 93 F.
(+) En jouant à The Witcher 3, la température moyenne du côté supérieur est de 30.5 °C / 87 F, alors que la moyenne de l'appareil est de 33.9 °C / 93 F.
(±) Les repose-poignets et le pavé tactile peuvent devenir très chauds au toucher, avec un maximum de 37.1 °C / 98.8# F.
(-) La température moyenne de la zone de l'appui-paume de dispositifs similaires était de 28.8 °C / 83.8 F (-8.3 °C / #-15 F).
| HP Pavilion Gaming 15-ec0017ng R7 3750H, GeForce GTX 1660 Ti Max-Q | HP Gaming Pavilion 15-dk0009ng i7-9750H, GeForce GTX 1660 Ti Max-Q | Dell G5 15 5590-PCNJJ i5-9300H, GeForce GTX 1650 Mobile | Lenovo Legion Y540-15IRH-81SX00B2GE i7-9750H, GeForce GTX 1660 Ti Mobile | Acer Aspire Nitro 5 AN515-54-53Z2 i5-9300H, GeForce GTX 1650 Mobile | Moyenne NVIDIA GeForce GTX 1660 Ti Max-Q | Moyenne de la classe Gaming | |
|---|---|---|---|---|---|---|---|
| Heat | -5% | -10% | -27% | -4% | -15% | -18% | |
| Maximum Upper Side * (°C) | 44.8 | 46.7 -4% | 49 -9% | 42.7 5% | 47 -5% | 46.6 ? -4% | 45.2 ? -1% |
| Maximum Bottom * (°C) | 40.8 | 53.7 -32% | 55 -35% | 52.7 -29% | 50 -23% | 49.4 ? -21% | 48.1 ? -18% |
| Idle Upper Side * (°C) | 25.4 | 23.8 6% | 25 2% | 33.1 -30% | 24 6% | 30.1 ? -19% | 31.1 ? -22% |
| Idle Bottom * (°C) | 26.6 | 23.7 11% | 26 2% | 41 -54% | 25 6% | 31 ? -17% | 34.3 ? -29% |
* ... Moindre est la valeur, meilleures sont les performances
HP Pavilion Gaming 15-ec0017ng analyse audio
(-) | haut-parleurs pas très forts (68 dB)
Basses 100 - 315 Hz
(-) | presque aucune basse - en moyenne 22.5% plus bas que la médiane
(±) | la linéarité des basses est moyenne (10.5% delta à la fréquence précédente)
Médiums 400 - 2000 Hz
(+) | médiane équilibrée - seulement 1.7% de la médiane
(±) | la linéarité des médiums est moyenne (8.4% delta à la fréquence précédente)
Aiguës 2 - 16 kHz
(+) | des sommets équilibrés - à seulement 4.4% de la médiane
(±) | la linéarité des aigus est moyenne (8.1% delta à la fréquence précédente)
Globalement 100 - 16 000 Hz
(±) | la linéarité du son global est moyenne (23.8% de différence avec la médiane)
Par rapport à la même classe
» 86% de tous les appareils testés de cette catégorie étaient meilleurs, 5% similaires, 10% pires
» Le meilleur avait un delta de 6%, la moyenne était de 18%, le pire était de 132%.
Par rapport à tous les appareils testés
» 71% de tous les appareils testés étaient meilleurs, 6% similaires, 22% pires
» Le meilleur avait un delta de 4%, la moyenne était de 24%, le pire était de 134%.
Lenovo Legion Y540-15IRH-81SX00B2GE analyse audio
(±) | le niveau sonore du haut-parleur est moyen mais bon (77.4# dB)
Basses 100 - 315 Hz
(-) | presque aucune basse - en moyenne 17.7% plus bas que la médiane
(±) | la linéarité des basses est moyenne (11.6% delta à la fréquence précédente)
Médiums 400 - 2000 Hz
(+) | médiane équilibrée - seulement 3.7% de la médiane
(+) | les médiums sont linéaires (4.5% delta à la fréquence précédente)
Aiguës 2 - 16 kHz
(+) | des sommets équilibrés - à seulement 3.3% de la médiane
(+) | les aigus sont linéaires (5.9% delta à la fréquence précédente)
Globalement 100 - 16 000 Hz
(±) | la linéarité du son global est moyenne (18.1% de différence avec la médiane)
Par rapport à la même classe
» 57% de tous les appareils testés de cette catégorie étaient meilleurs, 8% similaires, 35% pires
» Le meilleur avait un delta de 6%, la moyenne était de 18%, le pire était de 132%.
Par rapport à tous les appareils testés
» 38% de tous les appareils testés étaient meilleurs, 8% similaires, 54% pires
» Le meilleur avait un delta de 4%, la moyenne était de 24%, le pire était de 134%.
| Éteint/en veille | |
| Au repos | |
| Fortement sollicité |
|
Légende:
min: | |
| HP Pavilion Gaming 15-ec0017ng R7 3750H, GeForce GTX 1660 Ti Max-Q | HP Gaming Pavilion 15-dk0009ng i7-9750H, GeForce GTX 1660 Ti Max-Q | Dell G5 15 5590-PCNJJ i5-9300H, GeForce GTX 1650 Mobile | Lenovo Legion Y540-15IRH-81SX00B2GE i7-9750H, GeForce GTX 1660 Ti Mobile | Acer Aspire Nitro 5 AN515-54-53Z2 i5-9300H, GeForce GTX 1650 Mobile | Moyenne NVIDIA GeForce GTX 1660 Ti Max-Q | Moyenne de la classe Gaming | |
|---|---|---|---|---|---|---|---|
| Power Consumption | -39% | -6% | -108% | -8% | -24% | -141% | |
| Idle Minimum * (Watt) | 3.4 | 6.8 -100% | 4 -18% | 14.5 -326% | 5 -47% | 5.16 ? -52% | 13.2 ? -288% |
| Idle Average * (Watt) | 7.6 | 10.7 -41% | 7 8% | 18.5 -143% | 7 8% | 8.51 ? -12% | 18.9 ? -149% |
| Idle Maximum * (Watt) | 10.2 | 12.5 -23% | 12 -18% | 20 -96% | 11 -8% | 14.6 ? -43% | 24.5 ? -140% |
| Load Average * (Watt) | 73 | 87.2 -19% | 95 -30% | 81.6 -12% | 89 -22% | 76.4 ? -5% | 108.8 ? -49% |
| Witcher 3 ultra * (Watt) | 107 | 121 -13% | 86 20% | 132 -23% | 90 16% | ||
| Load Maximum * (Watt) | 140.5 | 191.4 -36% | 135 4% | 208.1 -48% | 132 6% | 151.4 ? -8% | 254 ? -81% |
* ... Moindre est la valeur, meilleures sont les performances
| HP Pavilion Gaming 15-ec0017ng R7 3750H, GeForce GTX 1660 Ti Max-Q, 52.5 Wh | HP Gaming Pavilion 15-dk0009ng i7-9750H, GeForce GTX 1660 Ti Max-Q, 52.5 Wh | Dell G5 15 5590-PCNJJ i5-9300H, GeForce GTX 1650 Mobile, 60 Wh | Lenovo Legion Y540-15IRH-81SX00B2GE i7-9750H, GeForce GTX 1660 Ti Mobile, 57 Wh | Acer Aspire Nitro 5 AN515-54-53Z2 i5-9300H, GeForce GTX 1650 Mobile, 57 Wh | Moyenne de la classe Gaming | |
|---|---|---|---|---|---|---|
| Autonomie de la batterie | -29% | 25% | -47% | 14% | -10% | |
| Reader / Idle (h) | 13.7 | 8.7 -36% | 14.5 6% | 4 -71% | 17.4 27% | 8.71 ? -36% |
| H.264 (h) | 8.5 | 5.3 -38% | 8.28 ? -3% | |||
| WiFi v1.3 (h) | 8 | 4.8 -40% | 8 0% | 2.4 -70% | 8.1 1% | 6.96 ? -13% |
| Load (h) | 1.3 | 1.3 0% | 2.2 69% | 1.3 0% | 1.5 15% | 1.47 ? 13% |
| Witcher 3 ultra (h) | 1 |
Points positifs
Points négatifs
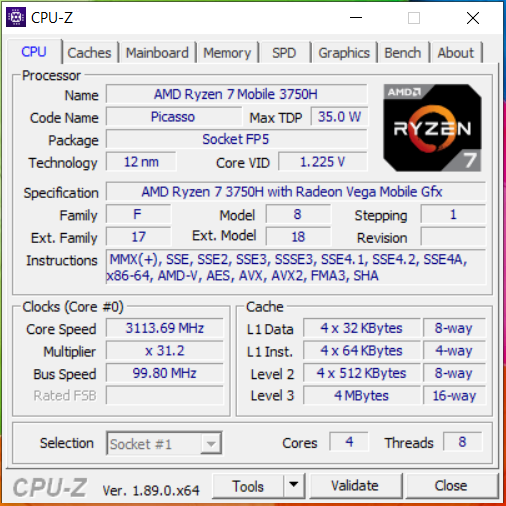
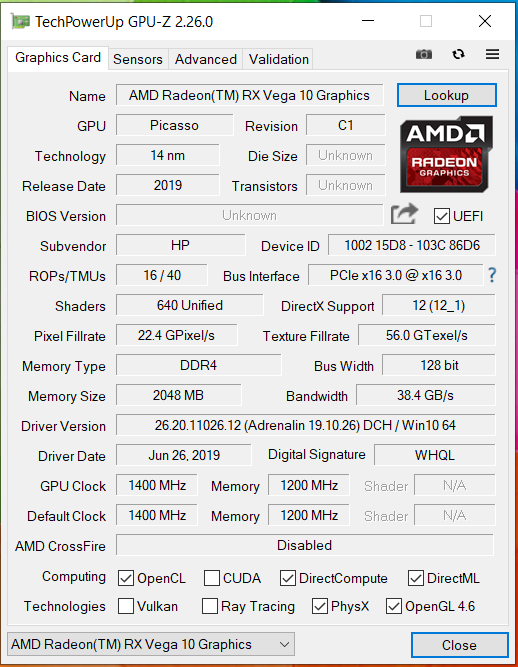
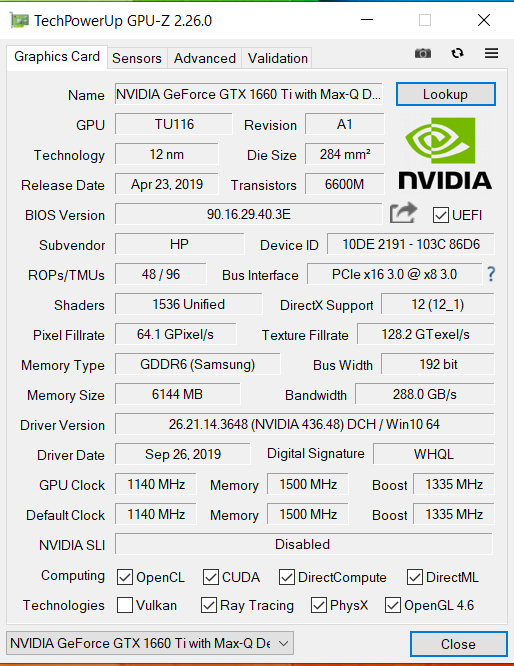
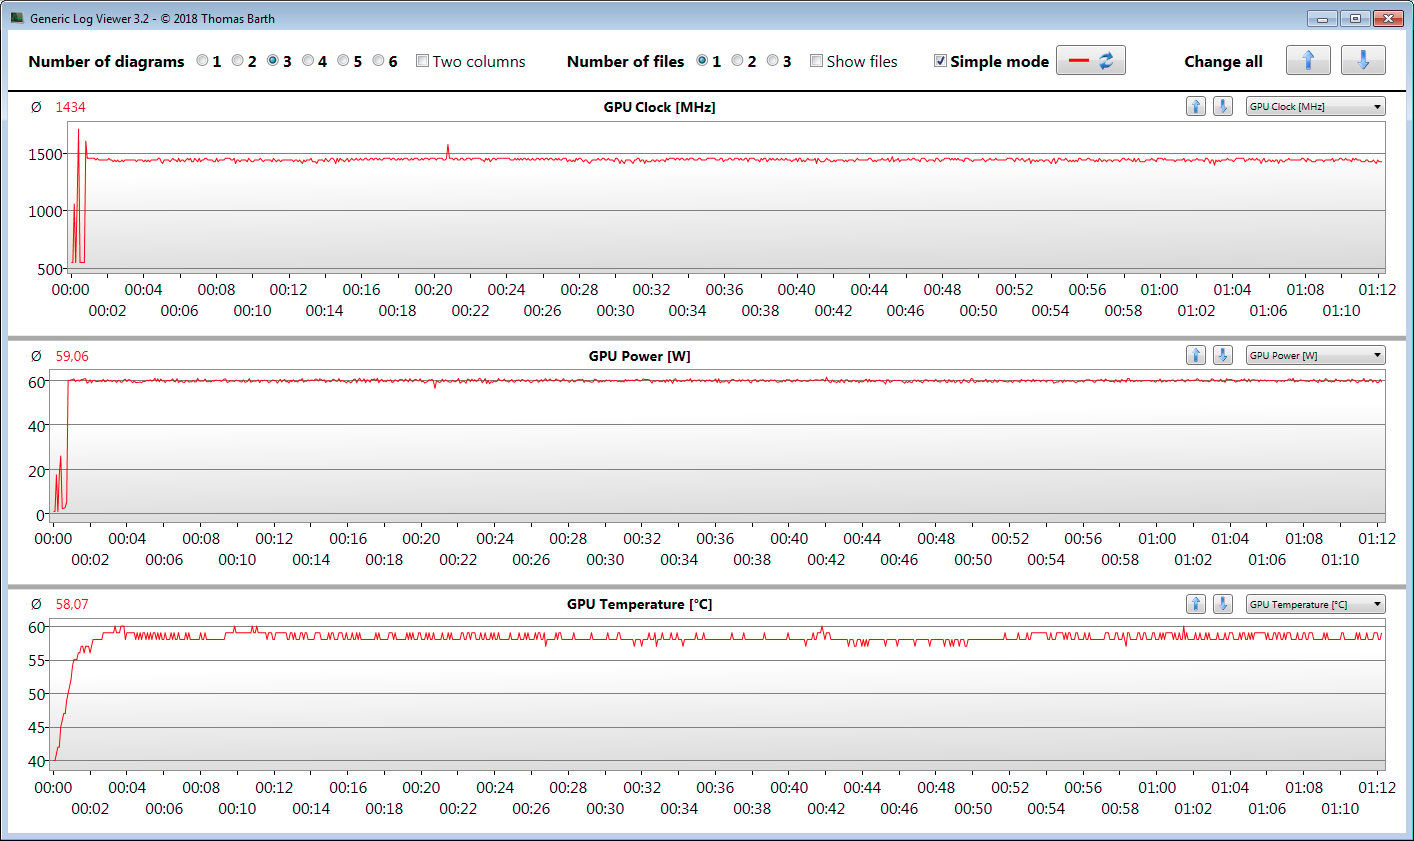
Hawlett Packard équipe le Pavilion Gaming 15 d’un APU Ryzen 7 3750H, et d’une carte graphique GeForce GTX 1660 Ti. Combinés, ils permettent de faire tourner fluidement tous les jeux de notre base de données. Dans la plupart des cas, il est possible de jouer en Full HD, et avec des réglages élevés ou maximaux.
Avec le Pavilion Gaming 15-ec0017ng, HP propose un portable de jeu bien équilibré, qui possède néanmoins quelques défauts.
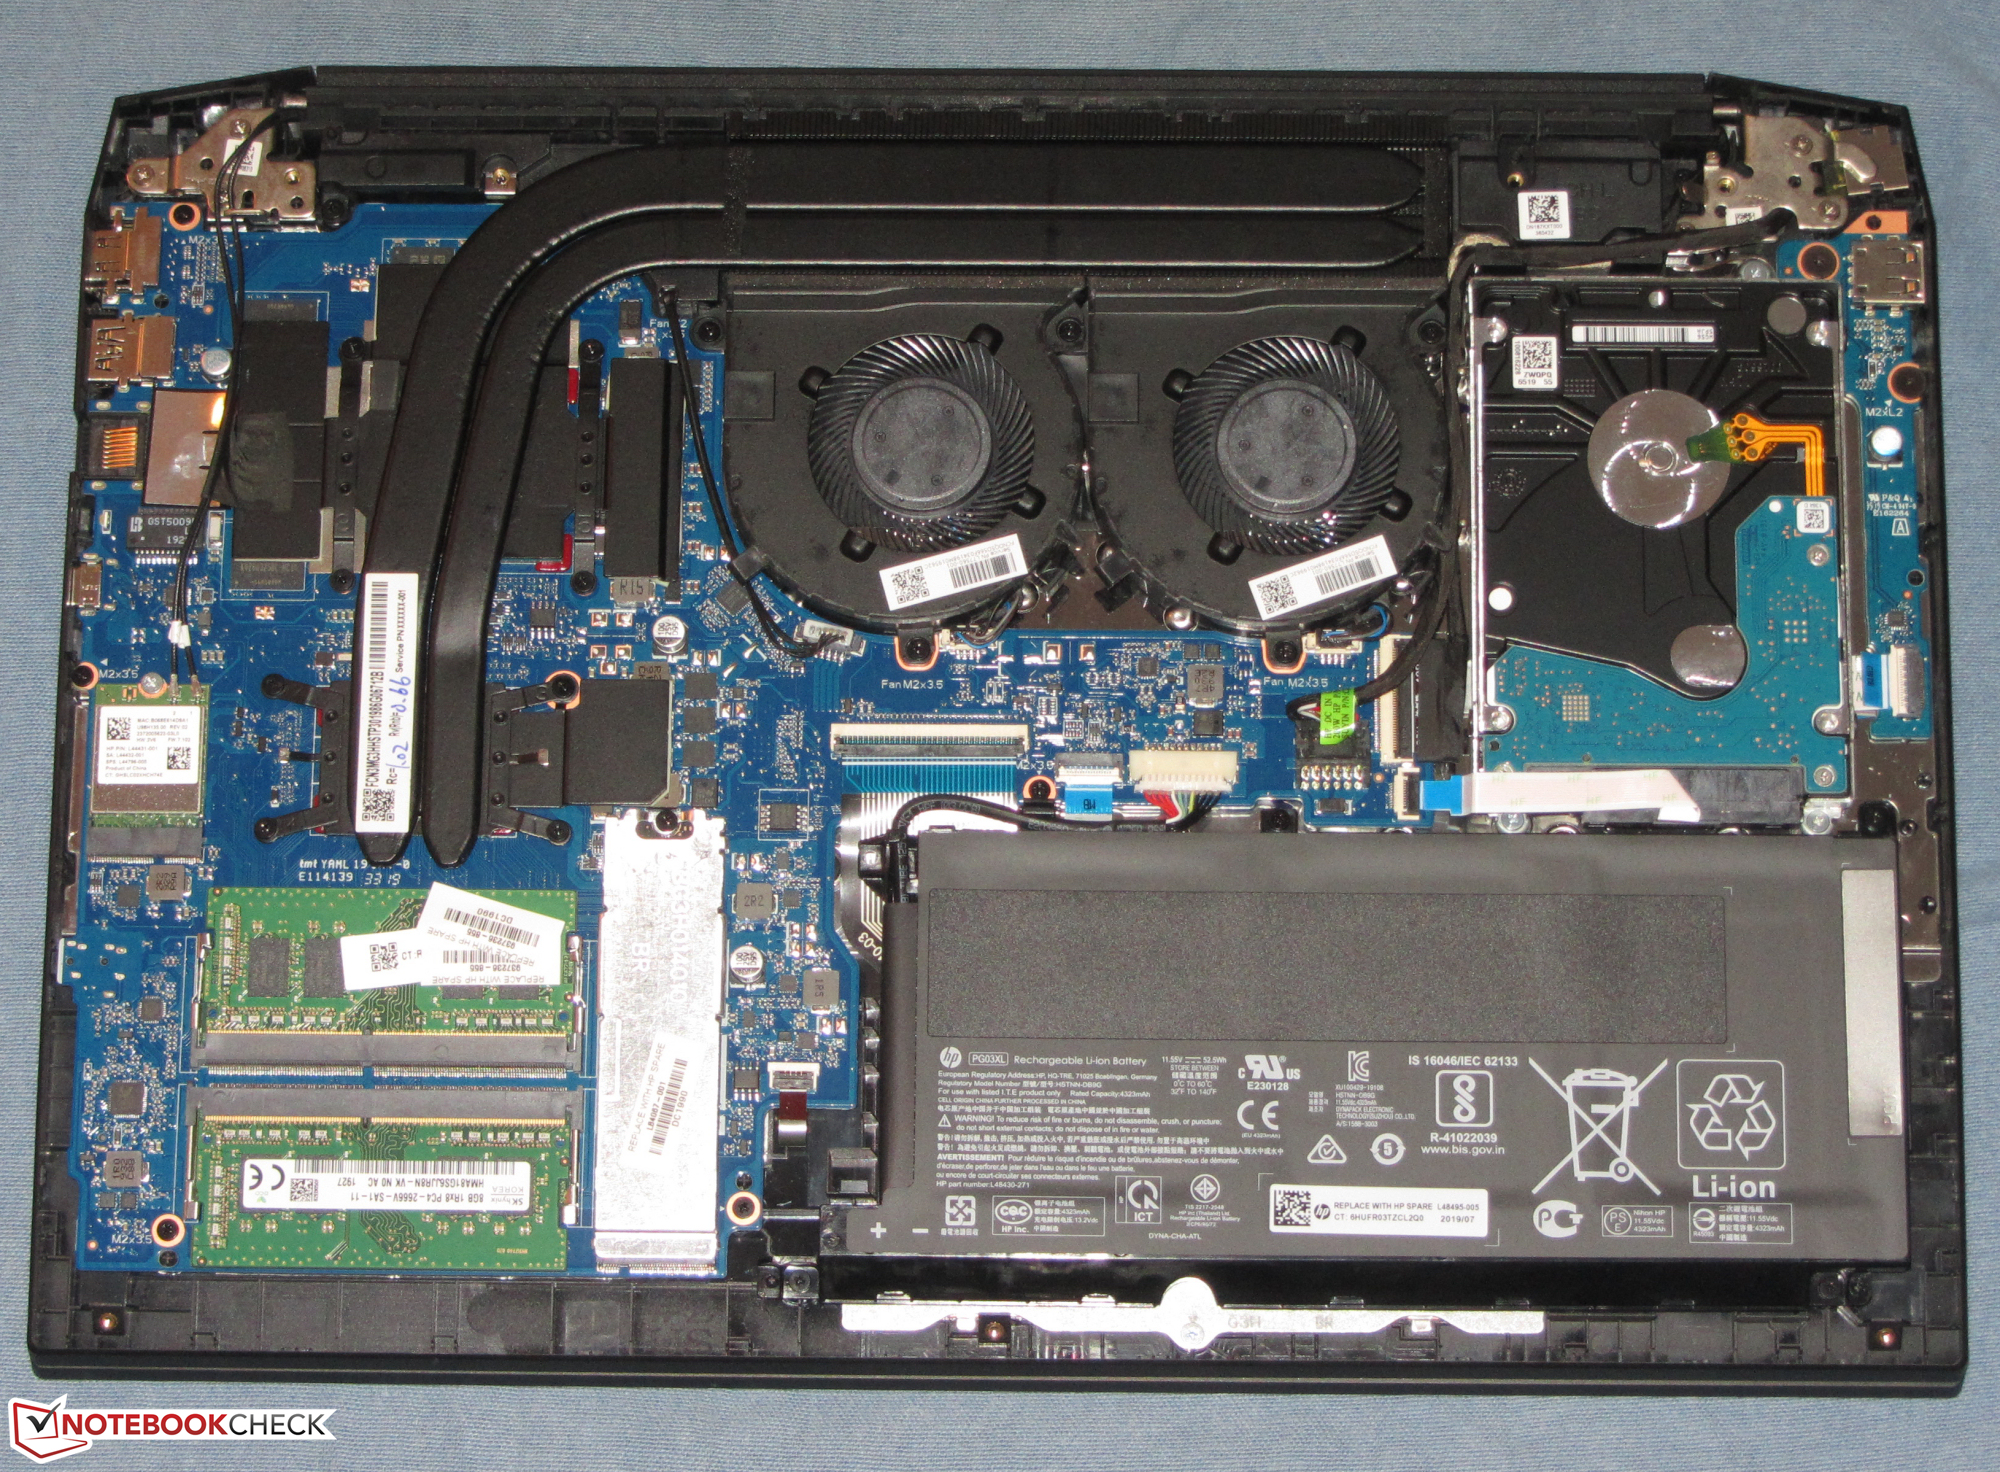
Le SSD NVMe rapide permet au système d’être réactif et fluide, et grâce au disque dur supplémentaire de 1 To, le portable ne manque pas de stockage. Les deux disques peuvent être changés, mais il faut pour cela retirer la coque inférieure.
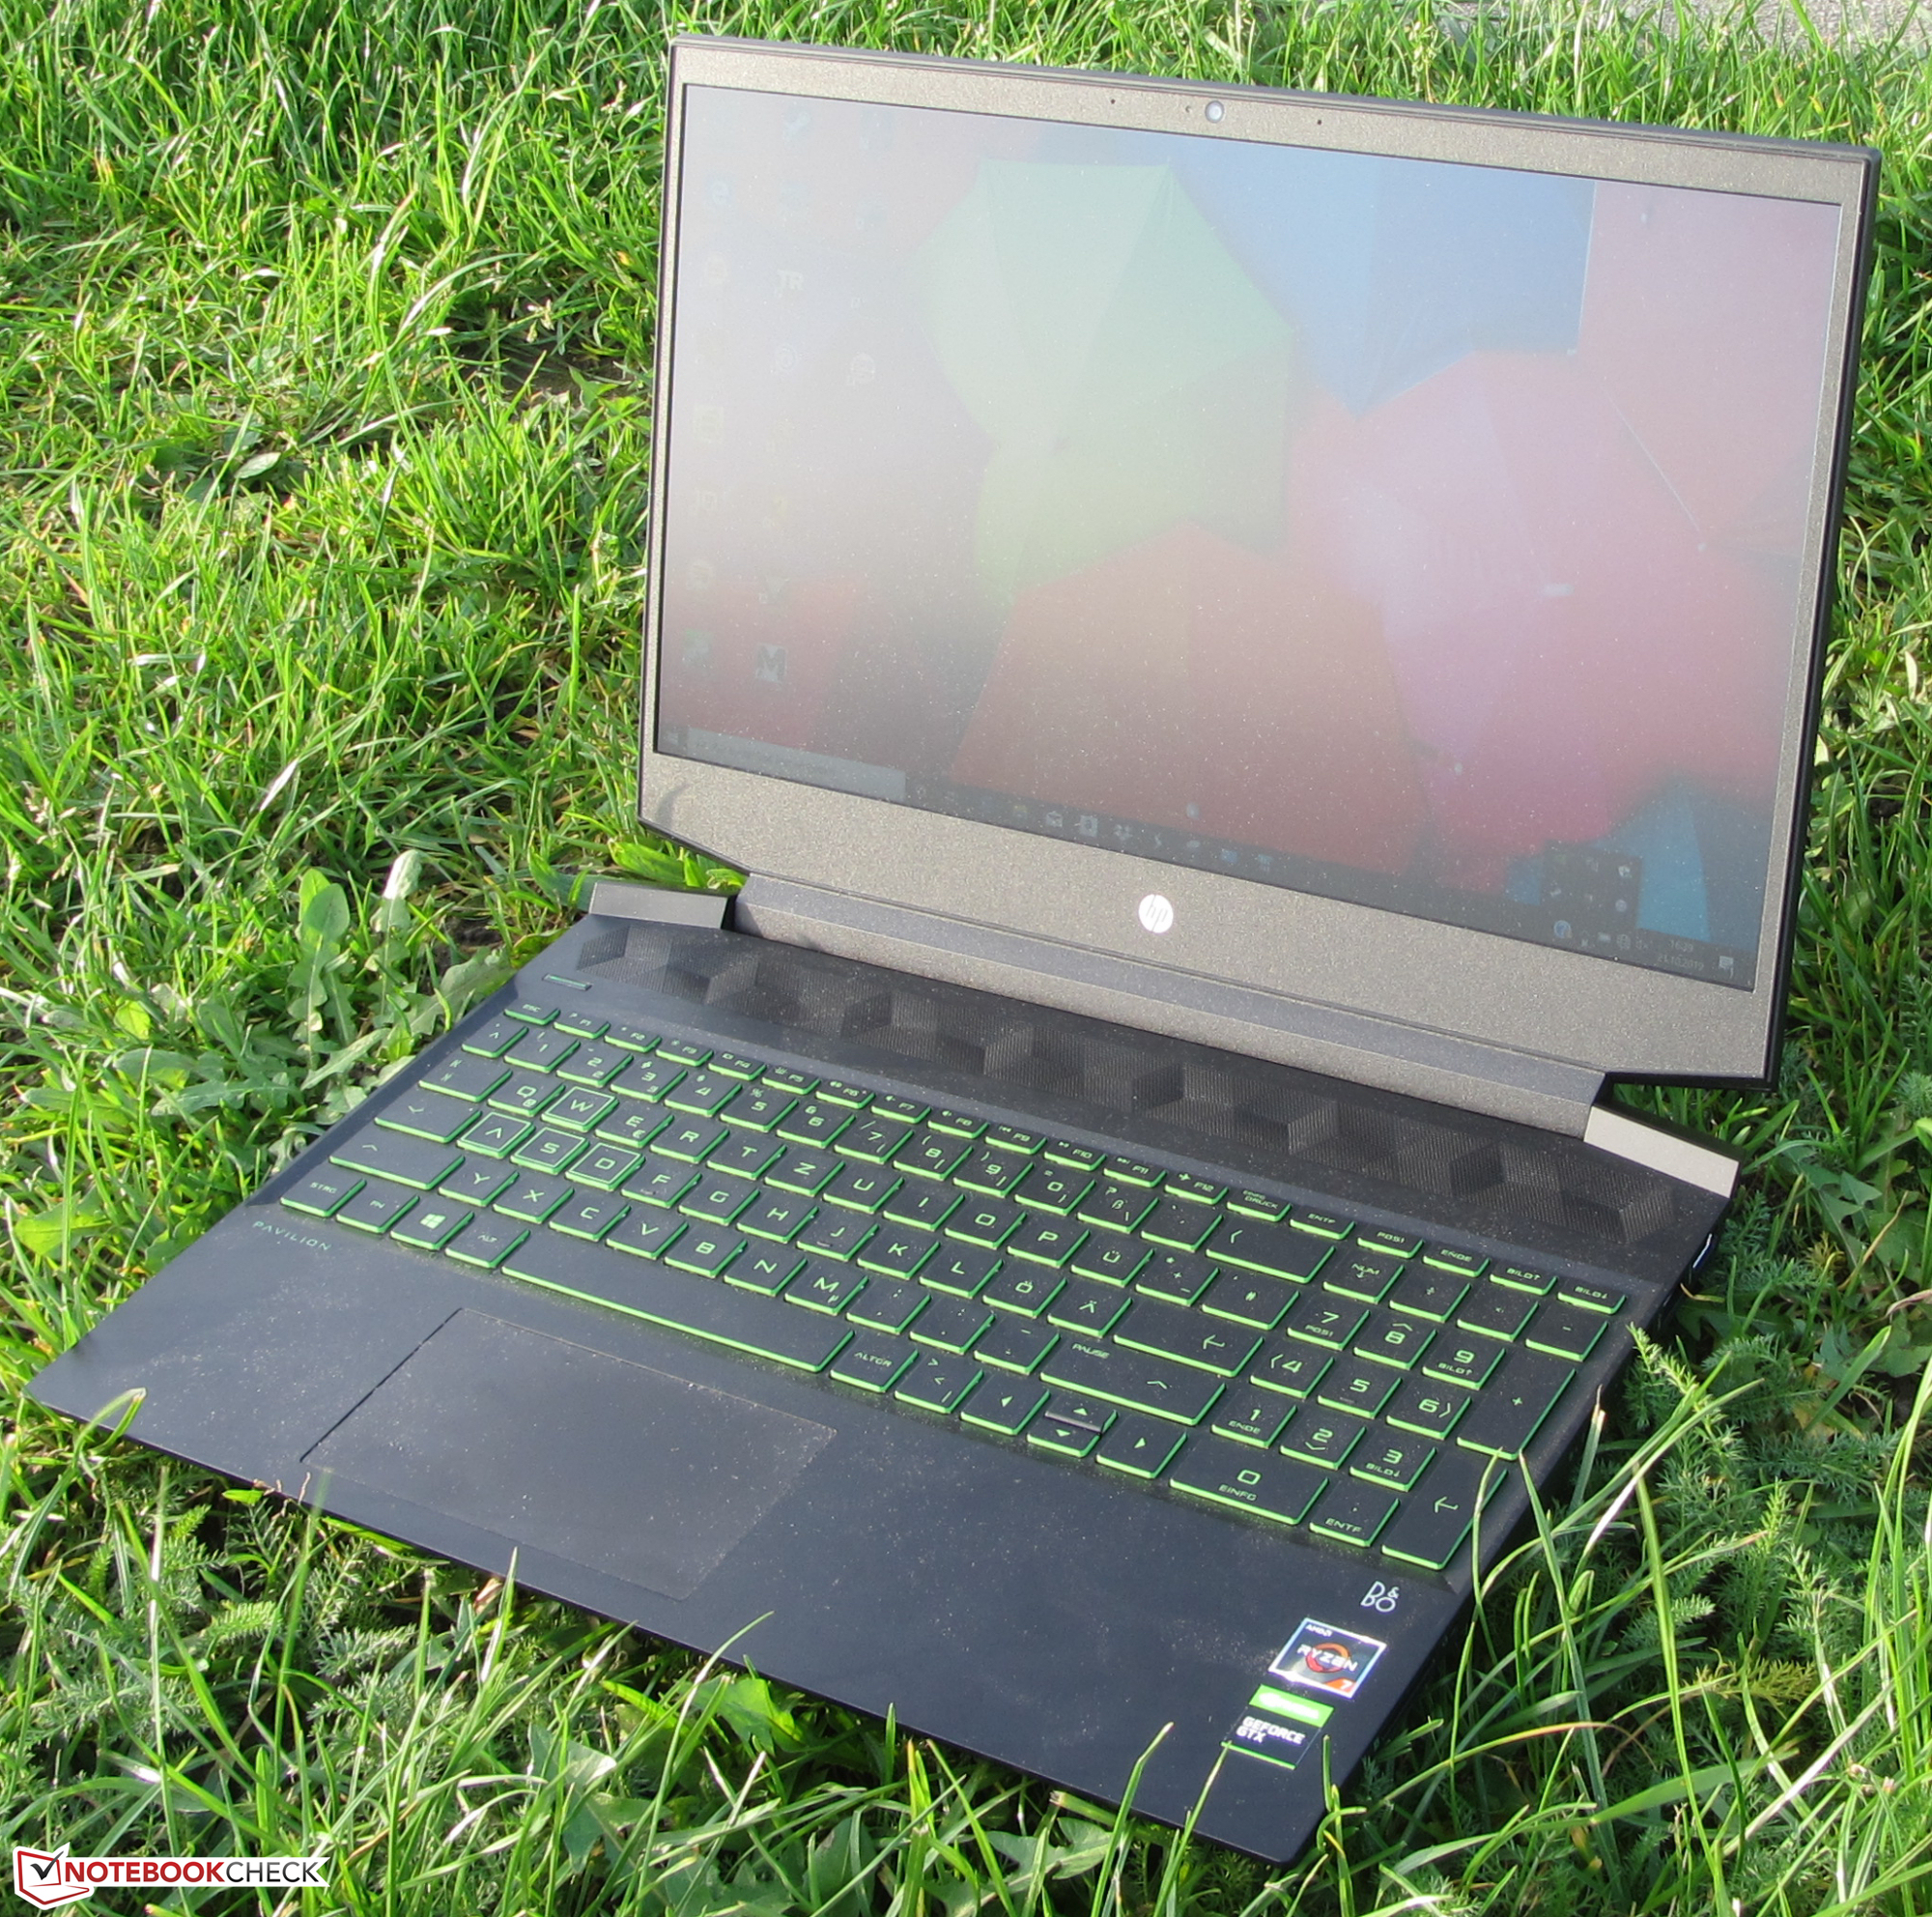
L’écran mat IPS marque des points avec de bons angles de vision, un bon contraste et des couleurs fidèles. Mais si sa luminosité est acceptable, il aurait été appréciable qu’elle soit supérieure, surtout à ce niveau de prix.
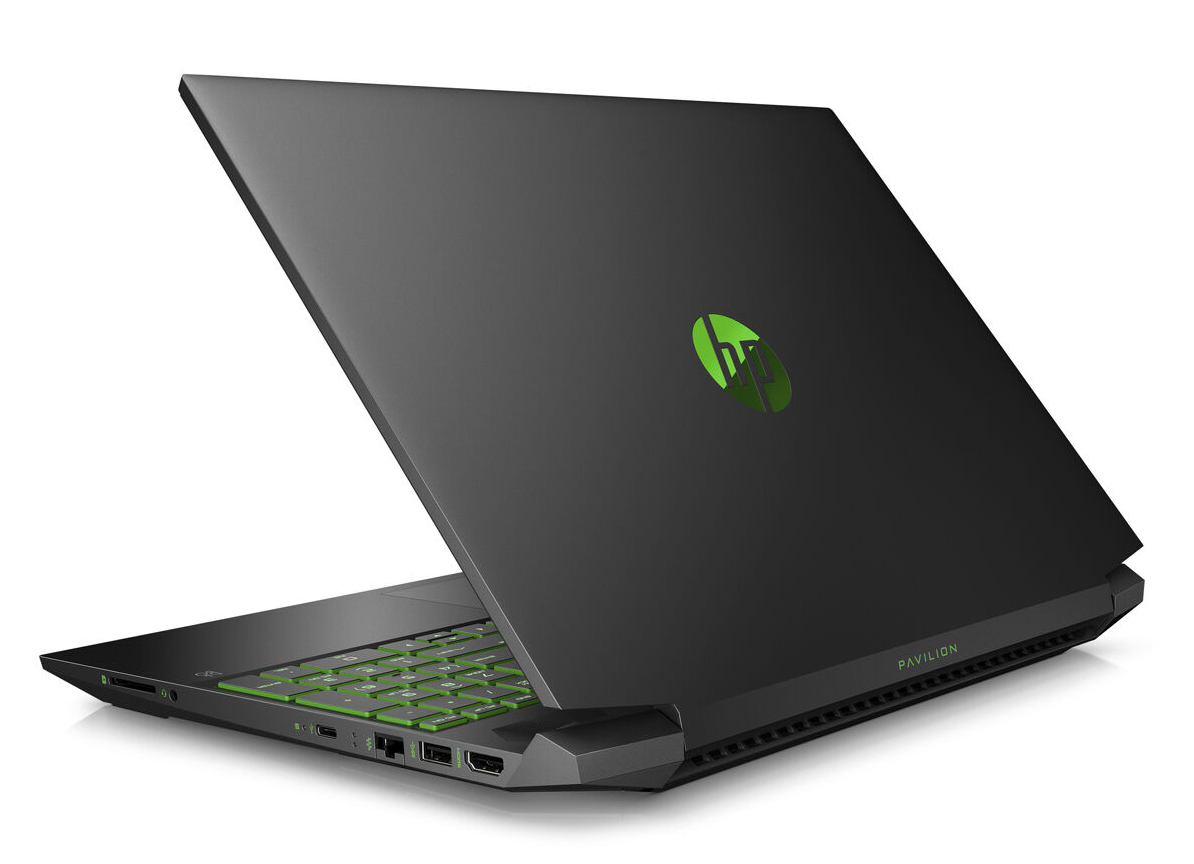
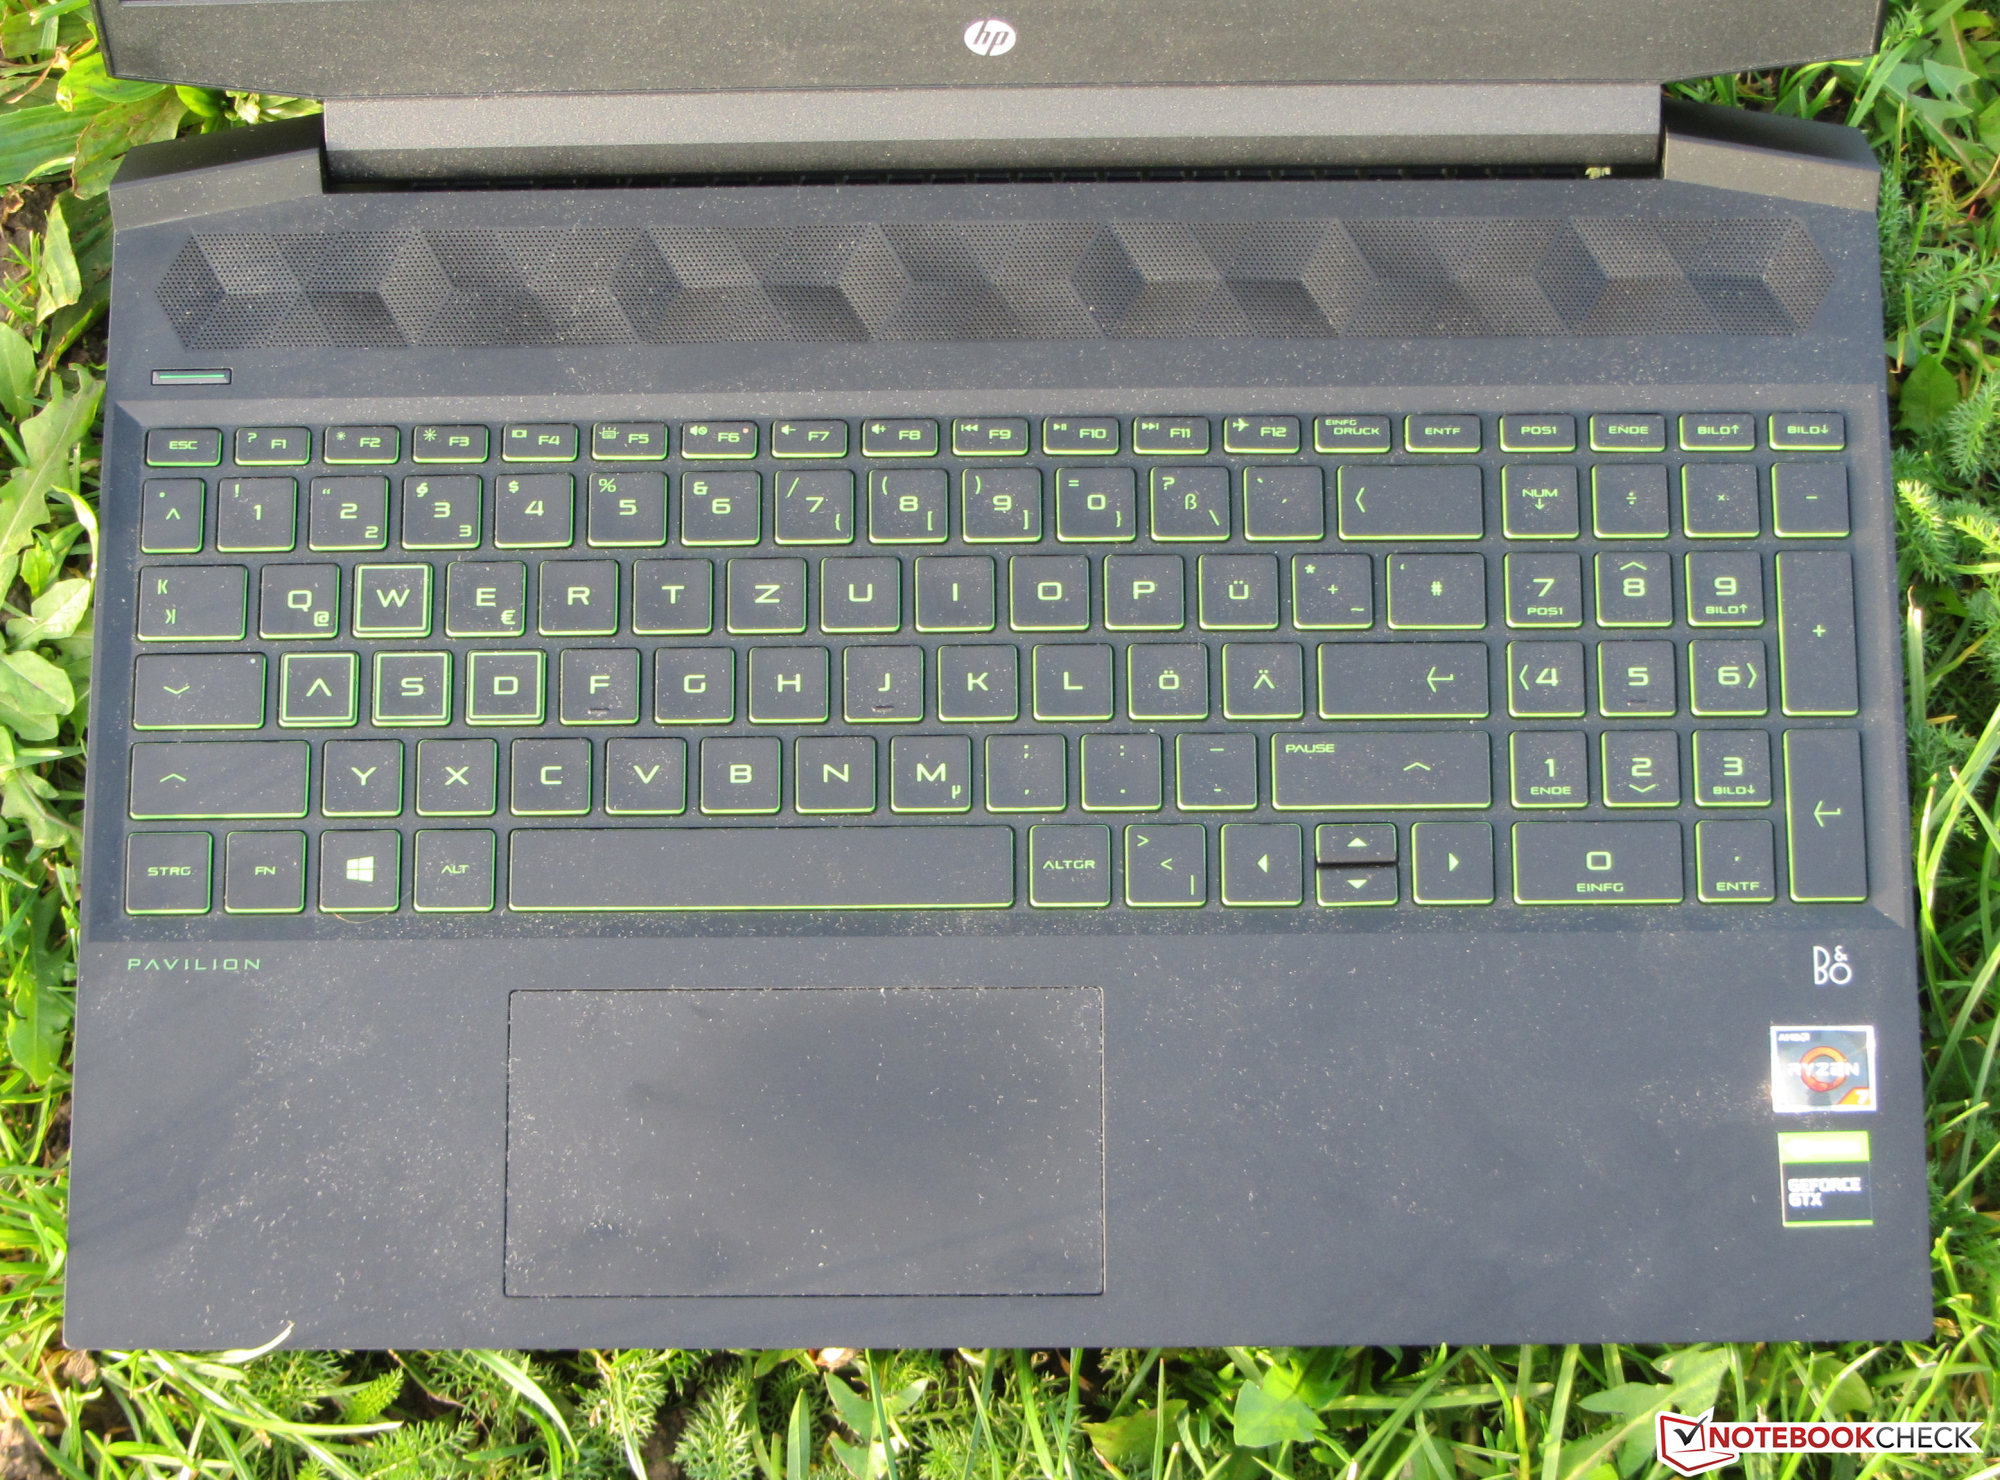
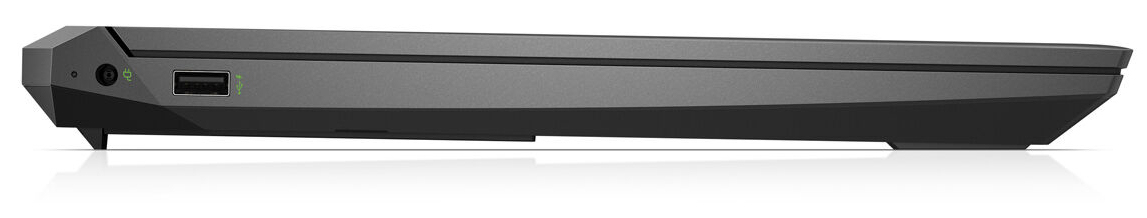
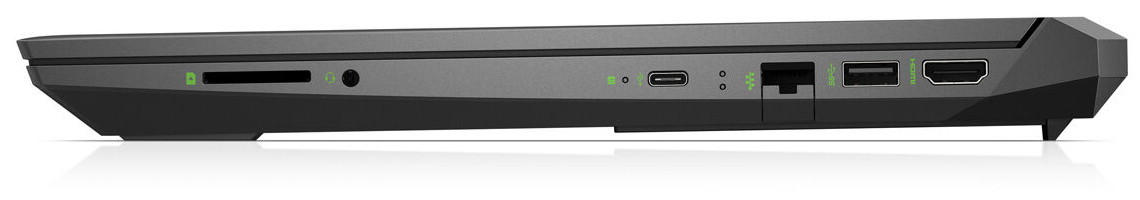
L’autonomie est étonnamment longue. Le Pavilion tient significativement plus longtemps que la plupart des portables de jeu. Le clavier chiclet (rétroéclairé, deux niveaux de luminosité) est adapté à un usage régulier. La sélection des ports n’est pas large, mais le nécessaire est là. Nous regrettons quand même la présence d’un port Thunderbolt 3. Malheureusement, HP ne fournit qu’une garantie d’un an.
L’intégralité de cette critique est disponible en anglais en suivant ce lien.
HP Pavilion Gaming 15-ec0017ng
- 10/27/2019 v7 (old)
Sascha Mölck
Price comparison
