Test du MSI GS66 Stealth 10SE (i7-10750H, RTX 2060, FHD 240 Hz) : PC de jeu élégant avec écran 240 Hz
Note | Date | Modèle | Poids | Épaisseur | Taille | Résolution | Prix |
|---|---|---|---|---|---|---|---|
| 82.5 % v7 (old) | 09/20 | MSI GS66 Stealth 10SE-045 i7-10750H, GeForce RTX 2060 Mobile | 2.2 kg | 19.8 mm | 15.60" | 1920x1080 | |
| 84.2 % v7 (old) | 09/19 | Razer Blade 15 GTX 1660 Ti i7-9750H, GeForce GTX 1660 Ti Mobile | 2.1 kg | 19.9 mm | 15.60" | 1920x1080 | |
| 83.7 % v7 (old) | 08/20 | Dell G5 15 SE 5505 P89F R7 4800H, Radeon RX 5600M | 2.4 kg | 21.6 mm | 15.60" | 1920x1080 | |
| 83.3 % v7 (old) | 08/20 | Lenovo Legion 5 15IMH05H i5-10300H, GeForce RTX 2060 Mobile | 2.5 kg | 26.1 mm | 15.60" | 1920x1080 | |
| 82.7 % v7 (old) | Asus TUF Gaming A15 FA506IV-HN172 R7 4800H, GeForce RTX 2060 Mobile | 2.2 kg | 24.9 mm | 15.60" | 1920x1080 | ||
| 81.3 % v7 (old) | 02/20 | Schenker XMG Core 15 GK5CP6V i7-9750H, GeForce GTX 1660 Ti Mobile | 2 kg | 26 mm | 15.60" | 1920x1080 |


| |||||||||||||||||||||||||
Homogénéité de la luminosité: 91 %
Valeur mesurée au centre, sur batterie: 272 cd/m²
Contraste: 1007:1 (Valeurs des noirs: 0.27 cd/m²)
ΔE ColorChecker Calman: 2.42 | ∀{0.5-29.43 Ø4.72}
calibrated: 0.88
ΔE Greyscale Calman: 4.5 | ∀{0.09-98 Ø4.97}
91% sRGB (Argyll 1.6.3 3D)
69% AdobeRGB 1998 (Argyll 1.6.3 3D)
68.9% AdobeRGB 1998 (Argyll 3D)
98.3% sRGB (Argyll 3D)
67.5% Display P3 (Argyll 3D)
Gamma: 2.188
CCT: 7369 K
| MSI GS66 Stealth 10SE-045 Sharp LQ156M1JW03, IPS, 1920x1080, 15.6" | MSI GS66 Stealth 10SFS AUO B156HAN12.0 (AUO328E), IPS, 1920x1080, 15.6" | Razer Blade 15 GTX 1660 Ti BOE NV156FHM-N4K, IPS, 1920x1080, 15.6" | Dell G5 15 SE 5505 P89F BOE NV156FH, WVA, 1920x1080, 15.6" | Lenovo Legion 5 15IMH05H BOE CQ NV156FHM-NX1, IPS, 1920x1080, 15.6" | Asus TUF Gaming A15 FA506IV-HN172 LM156LF-2F01, IPS, 1920x1080, 15.6" | Schenker XMG Core 15 GK5CP6V BOEhydis NV156FHM-N4G (BOE084D), IPS, 1920x1080, 15.6" | |
|---|---|---|---|---|---|---|---|
| Display | 2% | -4% | -7% | -42% | -41% | -6% | |
| Display P3 Coverage (%) | 67.5 | 69.5 3% | 65.3 -3% | 63 -7% | 38.8 -43% | 38.92 -42% | 63.3 -6% |
| sRGB Coverage (%) | 98.3 | 99.6 1% | 91.8 -7% | 90.1 -8% | 57.8 -41% | 58.5 -40% | 91.2 -7% |
| AdobeRGB 1998 Coverage (%) | 68.9 | 70.8 3% | 66.5 -3% | 64.1 -7% | 40.09 -42% | 40.22 -42% | 65 -6% |
| Response Times | -5% | -5% | -37% | -90% | -157% | 14% | |
| Response Time Grey 50% / Grey 80% * (ms) | 12 ? | 14 ? -17% | 13.6 ? -13% | 20.4 ? -70% | 26 ? -117% | 34 ? -183% | 8.8 ? 27% |
| Response Time Black / White * (ms) | 10.4 ? | 9.6 ? 8% | 10 ? 4% | 10.8 ? -4% | 17 ? -63% | 24 ? -131% | 10.4 ? -0% |
| PWM Frequency (Hz) | 23580 ? | 200 ? | 198.4 ? | ||||
| Screen | 6% | -26% | -25% | -58% | -64% | -8% | |
| Brightness middle (cd/m²) | 272 | 316 16% | 312.7 15% | 292 7% | 301 11% | 280 3% | 324 19% |
| Brightness (cd/m²) | 259 | 311 20% | 305 18% | 290 12% | 277 7% | 254 -2% | 296 14% |
| Brightness Distribution (%) | 91 | 92 1% | 90 -1% | 77 -15% | 77 -15% | 88 -3% | 88 -3% |
| Black Level * (cd/m²) | 0.27 | 0.21 22% | 0.27 -0% | 0.27 -0% | 0.26 4% | 0.15 44% | 0.27 -0% |
| Contrast (:1) | 1007 | 1505 49% | 1158 15% | 1081 7% | 1158 15% | 1867 85% | 1200 19% |
| Colorchecker dE 2000 * | 2.42 | 3.03 -25% | 4.57 -89% | 3.99 -65% | 5.12 -112% | 5.89 -143% | 4.07 -68% |
| Colorchecker dE 2000 max. * | 6.93 | 7.32 -6% | 6.81 2% | 6.11 12% | 8.86 -28% | 19 -174% | 6.39 8% |
| Colorchecker dE 2000 calibrated * | 0.88 | 1.1 -25% | 2.91 -231% | 3.02 -243% | 4.88 -455% | 4.79 -444% | 1.49 -69% |
| Greyscale dE 2000 * | 4.5 | 3.9 13% | 4.3 4% | 3.3 27% | 3.47 23% | 4.08 9% | 4.01 11% |
| Gamma | 2.188 101% | 2.42 91% | 2.29 96% | 2.25 98% | 2.37 93% | 2.33 94% | 2.6 85% |
| CCT | 7369 88% | 7439 87% | 7098 92% | 7047 92% | 7062 92% | 7303 89% | 7350 88% |
| Color Space (Percent of AdobeRGB 1998) (%) | 69 | 65 -6% | 59.4 -14% | 58.1 -16% | 37 -46% | 37 -46% | 59 -14% |
| Color Space (Percent of sRGB) (%) | 91 | 100 10% | 91.3 0% | 89.7 -1% | 57 -37% | 58 -36% | 91 0% |
| Moyenne finale (programmes/paramètres) | 1% /
4% | -12% /
-19% | -23% /
-23% | -63% /
-59% | -87% /
-72% | 0% /
-5% |
* ... Moindre est la valeur, meilleures sont les performances
Temps de réponse de l'écran
| ↔ Temps de réponse noir à blanc | ||
|---|---|---|
| 10.4 ms ... hausse ↗ et chute ↘ combinées | ↗ 6 ms hausse | 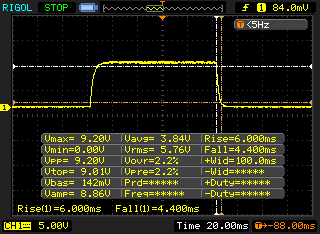 |
| ↘ 4.4 ms chute | ||
| L'écran montre de bons temps de réponse, mais insuffisant pour du jeu compétitif. En comparaison, tous les appareils testés affichent entre 0.1 (minimum) et 240 (maximum) ms. » 28 % des appareils testés affichent de meilleures performances. Cela signifie que les latences relevées sont meilleures que la moyenne (19.8 ms) de tous les appareils testés. | ||
| ↔ Temps de réponse gris 50% à gris 80% | ||
| 12 ms ... hausse ↗ et chute ↘ combinées | ↗ 7.6 ms hausse | 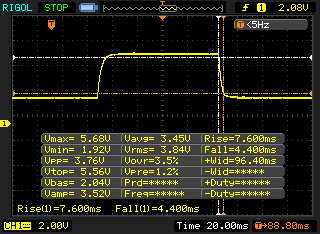 |
| ↘ 4.4 ms chute | ||
| L'écran montre de bons temps de réponse, mais insuffisant pour du jeu compétitif. En comparaison, tous les appareils testés affichent entre 0.165 (minimum) et 636 (maximum) ms. » 25 % des appareils testés affichent de meilleures performances. Cela signifie que les latences relevées sont meilleures que la moyenne (31 ms) de tous les appareils testés. | ||
Scintillement / MLI (Modulation de largeur d'impulsion)
| Scintillement / MLI (Modulation de largeur d'impulsion) décelé | 23580 Hz | ≤ 19 Niveau de luminosité | 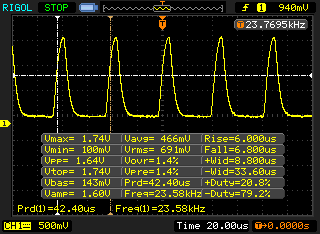 |
Le rétroéclairage de l'écran scintille à la fréquence de 23580 Hz (certainement du fait de l'utilisation d'une MDI - Modulation de largeur d'impulsion) à un niveau de luminosité inférieur ou égal à 19 % . Aucun scintillement ne devrait être perceptible au-dessus de cette valeur. La fréquence de rafraîchissement de 23580 Hz est élevée, la grande majorité des utilisateurs ne devrait pas percevoir de scintillements et être sujette à une fatigue oculaire accrue. En comparaison, 52 % des appareils testés n'emploient pas MDI pour assombrir leur écran. Nous avons relevé une moyenne à 7763 (minimum : 5 - maximum : 343500) Hz dans le cas où une MDI était active. | |||
| HWBOT x265 Benchmark v2.2 - 4k Preset | |
| Moyenne de la classe Gaming (11.5 - 44.3, n=108, 2 dernières années) | |
| Gigabyte Aero 15 OLED XB-8DE51B0SP | |
| Dell G5 15 SE 5505 P89F | |
| MSI GS66 Stealth 10SFS | |
| Asus TUF Gaming A15 FA506IV-HN172 | |
| MSI GS66 10SGS | |
| MSI GS66 Stealth 10SE-045 | |
| Razer Blade 15 RZ09-0328 | |
| Schenker XMG Core 15 GK5CP6V | |
| Lenovo Legion 5 15IMH05H | |
| LibreOffice - 20 Documents To PDF | |
| Dell G5 15 SE 5505 P89F | |
| MSI GS66 Stealth 10SE-045 | |
| MSI GS66 10SGS | |
| Razer Blade 15 RZ09-0328 | |
| Lenovo Legion 5 15IMH05H | |
| MSI GS66 Stealth 10SFS | |
| Gigabyte Aero 15 OLED XB-8DE51B0SP | |
| Moyenne de la classe Gaming (19 - 88.8, n=108, 2 dernières années) | |
| Asus TUF Gaming A15 FA506IV-HN172 | |
| R Benchmark 2.5 - Overall mean | |
| MSI GS66 Stealth 10SE-045 | |
| Schenker XMG Core 15 GK5CP6V | |
| Lenovo Legion 5 15IMH05H | |
| MSI GS66 10SGS | |
| Asus TUF Gaming A15 FA506IV-HN172 | |
| MSI GS66 Stealth 10SFS | |
| Dell G5 15 SE 5505 P89F | |
| Gigabyte Aero 15 OLED XB-8DE51B0SP | |
| Moyenne de la classe Gaming (0.3439 - 0.759, n=109, 2 dernières années) | |
* ... Moindre est la valeur, meilleures sont les performances
| PCMark 8 Home Score Accelerated v2 | 4539 points | |
| PCMark 8 Creative Score Accelerated v2 | 4314 points | |
| PCMark 8 Work Score Accelerated v2 | 5908 points | |
| PCMark 10 Score | 4984 points | |
Aide | ||
| PCMark 8 | |
| Home Score Accelerated v2 | |
| Moyenne de la classe Gaming (n=12 dernières années) | |
| Dell G5 15 SE 5505 P89F | |
| Asus TUF Gaming A15 FA506IV-HN172 | |
| MSI GS66 10SGS | |
| MSI GS66 Stealth 10SE-045 | |
| Razer Blade 15 GTX 1660 Ti | |
| Lenovo Legion 5 15IMH05H | |
| Razer Blade 15 RZ09-0328 | |
| Work Score Accelerated v2 | |
| MSI GS66 10SGS | |
| MSI GS66 Stealth 10SE-045 | |
| Asus TUF Gaming A15 FA506IV-HN172 | |
| Razer Blade 15 GTX 1660 Ti | |
| Dell G5 15 SE 5505 P89F | |
| Lenovo Legion 5 15IMH05H | |
| Razer Blade 15 RZ09-0328 | |
| Moyenne de la classe Gaming (n=12 dernières années) | |
| DPC Latencies / LatencyMon - interrupt to process latency (max), Web, Youtube, Prime95 | |
| Dell G5 15 SE 5505 P89F | |
| MSI GS66 Stealth 10SFS | |
| Gigabyte Aero 15 OLED XB-8DE51B0SP | |
| MSI GS66 10SGS | |
| MSI GS66 Stealth 10SE-045 | |
| Razer Blade 15 RZ09-0328 | |
| Asus TUF Gaming A15 FA506IV-HN172 | |
| Lenovo Legion 5 15IMH05H | |
* ... Moindre est la valeur, meilleures sont les performances
| MSI GS66 Stealth 10SE-045 Samsung SSD PM981 MZVLB1T0HALR | Dell G5 15 SE 5505 P89F Samsung PM991 MZ9LQ512HALU | Lenovo Legion 5 15IMH05H Samsung PM991 MZALQ512HALU | Asus TUF Gaming A15 FA506IV-HN172 Kingston OM8PCP3512F-AB | Schenker XMG Core 15 GK5CP6V Samsung SSD 970 EVO Plus 500GB | MSI GS66 Stealth 10SFS Samsung SSD PM981 MZVLB1T0HALR | Razer Blade 15 GTX 1660 Ti Samsung SSD PM981 MZVLB256HAHQ | |
|---|---|---|---|---|---|---|---|
| CrystalDiskMark 5.2 / 6 | -20% | -21% | -18% | -14% | -4% | -14% | |
| Write 4K (MB/s) | 156.3 | 142.1 -9% | 145.4 -7% | 219.8 41% | 102 -35% | 131.3 -16% | 135 -14% |
| Read 4K (MB/s) | 47.65 | 46.43 -3% | 51.6 8% | 50.2 5% | 41.39 -13% | 45.84 -4% | 41.1 -14% |
| Write Seq (MB/s) | 2374 | 1108 -53% | 1007 -58% | 979 -59% | 1649 -31% | 2370 0% | 1427 -40% |
| Read Seq (MB/s) | 2045 | 1622 -21% | 1145 -44% | 1990 -3% | 1367 -33% | 1509 -26% | 1494 -27% |
| Write 4K Q32T1 (MB/s) | 431.3 | 467 8% | 468.4 9% | 516 20% | 379 -12% | 481.5 12% | 494.9 15% |
| Read 4K Q32T1 (MB/s) | 509 | 525 3% | 528 4% | 298.3 -41% | 401.2 -21% | 560 10% | 578 14% |
| Write Seq Q32T1 (MB/s) | 2385 | 1203 -50% | 1381 -42% | 982 -59% | 3276 37% | 2392 0% | 1417 -41% |
| Read Seq Q32T1 (MB/s) | 3505 | 2288 -35% | 2291 -35% | 1907 -46% | 3417 -3% | 3232 -8% | 3251 -7% |
| Write 4K Q8T8 (MB/s) | 981 | ||||||
| Read 4K Q8T8 (MB/s) | 300.9 | ||||||
| AS SSD | -61% | -48% | -45% | -7% | -17% | -48% | |
| Seq Read (MB/s) | 2612 | 1386 -47% | 2012 -23% | 1682 -36% | 2261 -13% | 1065 -59% | 1829 -30% |
| Seq Write (MB/s) | 2368 | 1234 -48% | 1261 -47% | 904 -62% | 2393 1% | 2360 0% | 1315 -44% |
| 4K Read (MB/s) | 51.1 | 41.32 -19% | 43.66 -15% | 60.2 18% | 54.6 7% | 48.09 -6% | 51.3 0% |
| 4K Write (MB/s) | 135.9 | 128 -6% | 109.3 -20% | 164.8 21% | 118.4 -13% | 110.7 -19% | 106 -22% |
| 4K-64 Read (MB/s) | 1635 | 854 -48% | 851 -48% | 472.5 -71% | 1376 -16% | 1635 0% | 917 -44% |
| 4K-64 Write (MB/s) | 1831 | 721 -61% | 780 -57% | 845 -54% | 2299 26% | 1829 0% | 1212 -34% |
| Access Time Read * (ms) | 0.042 | 0.098 -133% | 0.117 -179% | 0.087 -107% | 0.07 -67% | 0.071 -69% | 0.063 -50% |
| Access Time Write * (ms) | 0.028 | 0.095 -239% | 0.036 -29% | 0.02 29% | 0.031 -11% | 0.034 -21% | 0.104 -271% |
| Score Read (Points) | 1947 | 1034 -47% | 1096 -44% | 701 -64% | 1657 -15% | 1790 -8% | 1152 -41% |
| Score Write (Points) | 2204 | 973 -56% | 1016 -54% | 1101 -50% | 2657 21% | 2176 -1% | 1450 -34% |
| Score Total (Points) | 5138 | 2536 -51% | 2643 -49% | 2143 -58% | 5175 1% | 4950 -4% | 3177 -38% |
| Copy ISO MB/s (MB/s) | 2334 | 1284 -45% | 1481 -37% | 675 -71% | 1539 -34% | ||
| Copy Program MB/s (MB/s) | 569 | 401.9 -29% | 467.5 -18% | 248.4 -56% | 513 -10% | ||
| Copy Game MB/s (MB/s) | 1401 | 1013 -28% | 734 -48% | 535 -62% | 1150 -18% | ||
| Moyenne finale (programmes/paramètres) | -41% /
-46% | -35% /
-38% | -32% /
-35% | -11% /
-10% | -11% /
-12% | -31% /
-36% |
* ... Moindre est la valeur, meilleures sont les performances

Continuous load read: DiskSpd Read Loop, Queue Depth 8
| 3DMark 11 Performance | 18163 points | |
| 3DMark Cloud Gate Standard Score | 36138 points | |
| 3DMark Fire Strike Score | 14290 points | |
| 3DMark Time Spy Score | 6038 points | |
Aide | ||
| 3DMark 11 - 1280x720 Performance GPU | |
| Moyenne de la classe Gaming (21841 - 80022, n=106, 2 dernières années) | |
| Gigabyte Aero 15 OLED XB-8DE51B0SP | |
| MSI GS66 10SGS | |
| Dell G5 15 SE 5505 P89F | |
| MSI GS66 Stealth 10SFS | |
| Razer Blade 15 RZ09-0328 | |
| Lenovo Legion 5 15IMH05H | |
| Asus TUF Gaming A15 FA506IV-HN172 | |
| MSI GS66 Stealth 10SE-045 | |
| Schenker XMG Core 15 GK5CP6V | |
| Razer Blade 15 GTX 1660 Ti | |
| The Witcher 3 - 1920x1080 Ultra Graphics & Postprocessing (HBAO+) | |
| Moyenne de la classe Gaming (95 - 240, n=8, 2 dernières années) | |
| Gigabyte Aero 15 OLED XB-8DE51B0SP | |
| MSI GS66 10SGS | |
| MSI GS66 Stealth 10SFS | |
| Lenovo Legion 5 15IMH05H | |
| Dell G5 15 SE 5505 P89F | |
| MSI GS66 Stealth 10SE-045 | |
| Razer Blade 15 RZ09-0328 | |
| Asus TUF Gaming A15 FA506IV-HN172 | |
| Schenker XMG Core 15 GK5CP6V | |
| Razer Blade 15 GTX 1660 Ti | |
| BioShock Infinite - 1920x1080 Ultra Preset, DX11 (DDOF) | |
| Lenovo Legion 5 15IMH05H | |
| MSI GS66 Stealth 10SE-045 | |
| Razer Blade 15 GTX 1660 Ti | |
| Asus TUF Gaming A15 FA506IV-HN172 | |
| Metro Exodus - 1920x1080 Ultra Quality AF:16x | |
| Gigabyte Aero 15 OLED XB-8DE51B0SP | |
| MSI GS66 10SGS | |
| Dell G5 15 SE 5505 P89F | |
| MSI GS66 Stealth 10SE-045 | |
| Far Cry 5 - 1920x1080 Ultra Preset AA:T | |
| Moyenne de la classe Gaming (70 - 151, n=9, 2 dernières années) | |
| MSI GS66 Stealth 10SE-045 | |
| Lenovo Legion 5 15IMH05H | |
| Call of Duty Modern Warfare 2019 - 1920x1080 Maximum Settings AA:T2X Filmic SM | |
| Schenker XMG Core 15 GK5CP6V | |
| MSI GS66 Stealth 10SE-045 | |
| Red Dead Redemption 2 - 1920x1080 High Settings | |
| Gigabyte Aero 15 OLED XB-8DE51B0SP | |
| Lenovo Legion 5 15IMH05H | |
| MSI GS66 Stealth 10SE-045 | |
| Schenker XMG Core 15 GK5CP6V | |
| Bas | Moyen | Élevé | Ultra | |
|---|---|---|---|---|
| BioShock Infinite (2013) | 336 | 290 | 268.3 | 135.8 |
| The Witcher 3 (2015) | 280.6 | 196.7 | 117.7 | 63.4 |
| Far Cry 5 (2018) | 128 | 96 | 90 | 86 |
| Shadow of the Tomb Raider (2018) | 114 | 93 | 86 | 77 |
| Metro Exodus (2019) | 140.9 | 69.9 | 53.4 | 42.2 |
| Call of Duty Modern Warfare 2019 (2019) | 143.9 | 97.3 | 80.8 | 70.7 |
| Red Dead Redemption 2 (2019) | 118.5 | 81.9 | 54.9 | 35.1 |
| Doom Eternal (2020) | 209.2 | 136.9 | 124.6 | 121.9 |
| Gears Tactics (2020) | 243.5 | 144.4 | 95.9 | 62.8 |
| F1 2020 (2020) | 230 | 150 | 131 | 93 |
| Death Stranding (2020) | 146.6 | 102 | 93.1 | 91 |
Degré de la nuisance sonore
| Au repos |
| 29 / 30 / 40 dB(A) |
| Fortement sollicité |
| 51 / 54 dB(A) |
 | ||
30 dB silencieux 40 dB(A) audible 50 dB(A) bruyant |
||
min: | ||
| MSI GS66 Stealth 10SE-045 i7-10750H, GeForce RTX 2060 Mobile | MSI GS66 Stealth 10SFS i9-10980HK, GeForce RTX 2070 Super Max-Q | Razer Blade 15 GTX 1660 Ti i7-9750H, GeForce GTX 1660 Ti Mobile | Dell G5 15 SE 5505 P89F R7 4800H, Radeon RX 5600M | Lenovo Legion 5 15IMH05H i5-10300H, GeForce RTX 2060 Mobile | Asus TUF Gaming A15 FA506IV-HN172 R7 4800H, GeForce RTX 2060 Mobile | Schenker XMG Core 15 GK5CP6V i7-9750H, GeForce GTX 1660 Ti Mobile | Moyenne de la classe Gaming | |
|---|---|---|---|---|---|---|---|---|
| Noise | -6% | 4% | 11% | 4% | 4% | -0% | 11% | |
| arrêt / environnement * (dB) | 25 | 30 -20% | 28.5 -14% | 28 -12% | 30.7 -23% | 30.2 -21% | 30 -20% | 24.1 ? 4% |
| Idle Minimum * (dB) | 29 | 32 -10% | 30.3 -4% | 28 3% | 30.7 -6% | 30.2 -4% | 30 -3% | 25.9 ? 11% |
| Idle Average * (dB) | 30 | 34 -13% | 30.5 -2% | 28 7% | 30.7 -2% | 30.2 -1% | 31 -3% | 27.4 ? 9% |
| Idle Maximum * (dB) | 40 | 39 2% | 30.5 24% | 28 30% | 30.7 23% | 30.2 24% | 33 17% | 29.9 ? 25% |
| Load Average * (dB) | 51 | 53 -4% | 41 20% | 28 45% | 36.6 28% | 40 22% | 48 6% | 43 ? 16% |
| Witcher 3 ultra * (dB) | 48 | 48 -0% | 48 -0% | 50.6 -5% | 47 2% | 49 -2% | 51 -6% | |
| Load Maximum * (dB) | 54 | 53 2% | 51.9 4% | 50.6 6% | 50.9 6% | 49 9% | 51 6% | 54.1 ? -0% |
* ... Moindre est la valeur, meilleures sont les performances
(-) La température maximale du côté supérieur est de 53 °C / 127 F, par rapport à la moyenne de 40.4 °C / 105 F, allant de 21.2 à 68.8 °C pour la classe Gaming.
(-) Le fond chauffe jusqu'à un maximum de 53 °C / 127 F, contre une moyenne de 43.2 °C / 110 F
(+) En utilisation inactive, la température moyenne du côté supérieur est de 27.4 °C / 81 F, par rapport à la moyenne du dispositif de 33.9 °C / 93 F.
(-) En jouant à The Witcher 3, la température moyenne du côté supérieur est de 42.6 °C / 109 F, alors que la moyenne de l'appareil est de 33.9 °C / 93 F.
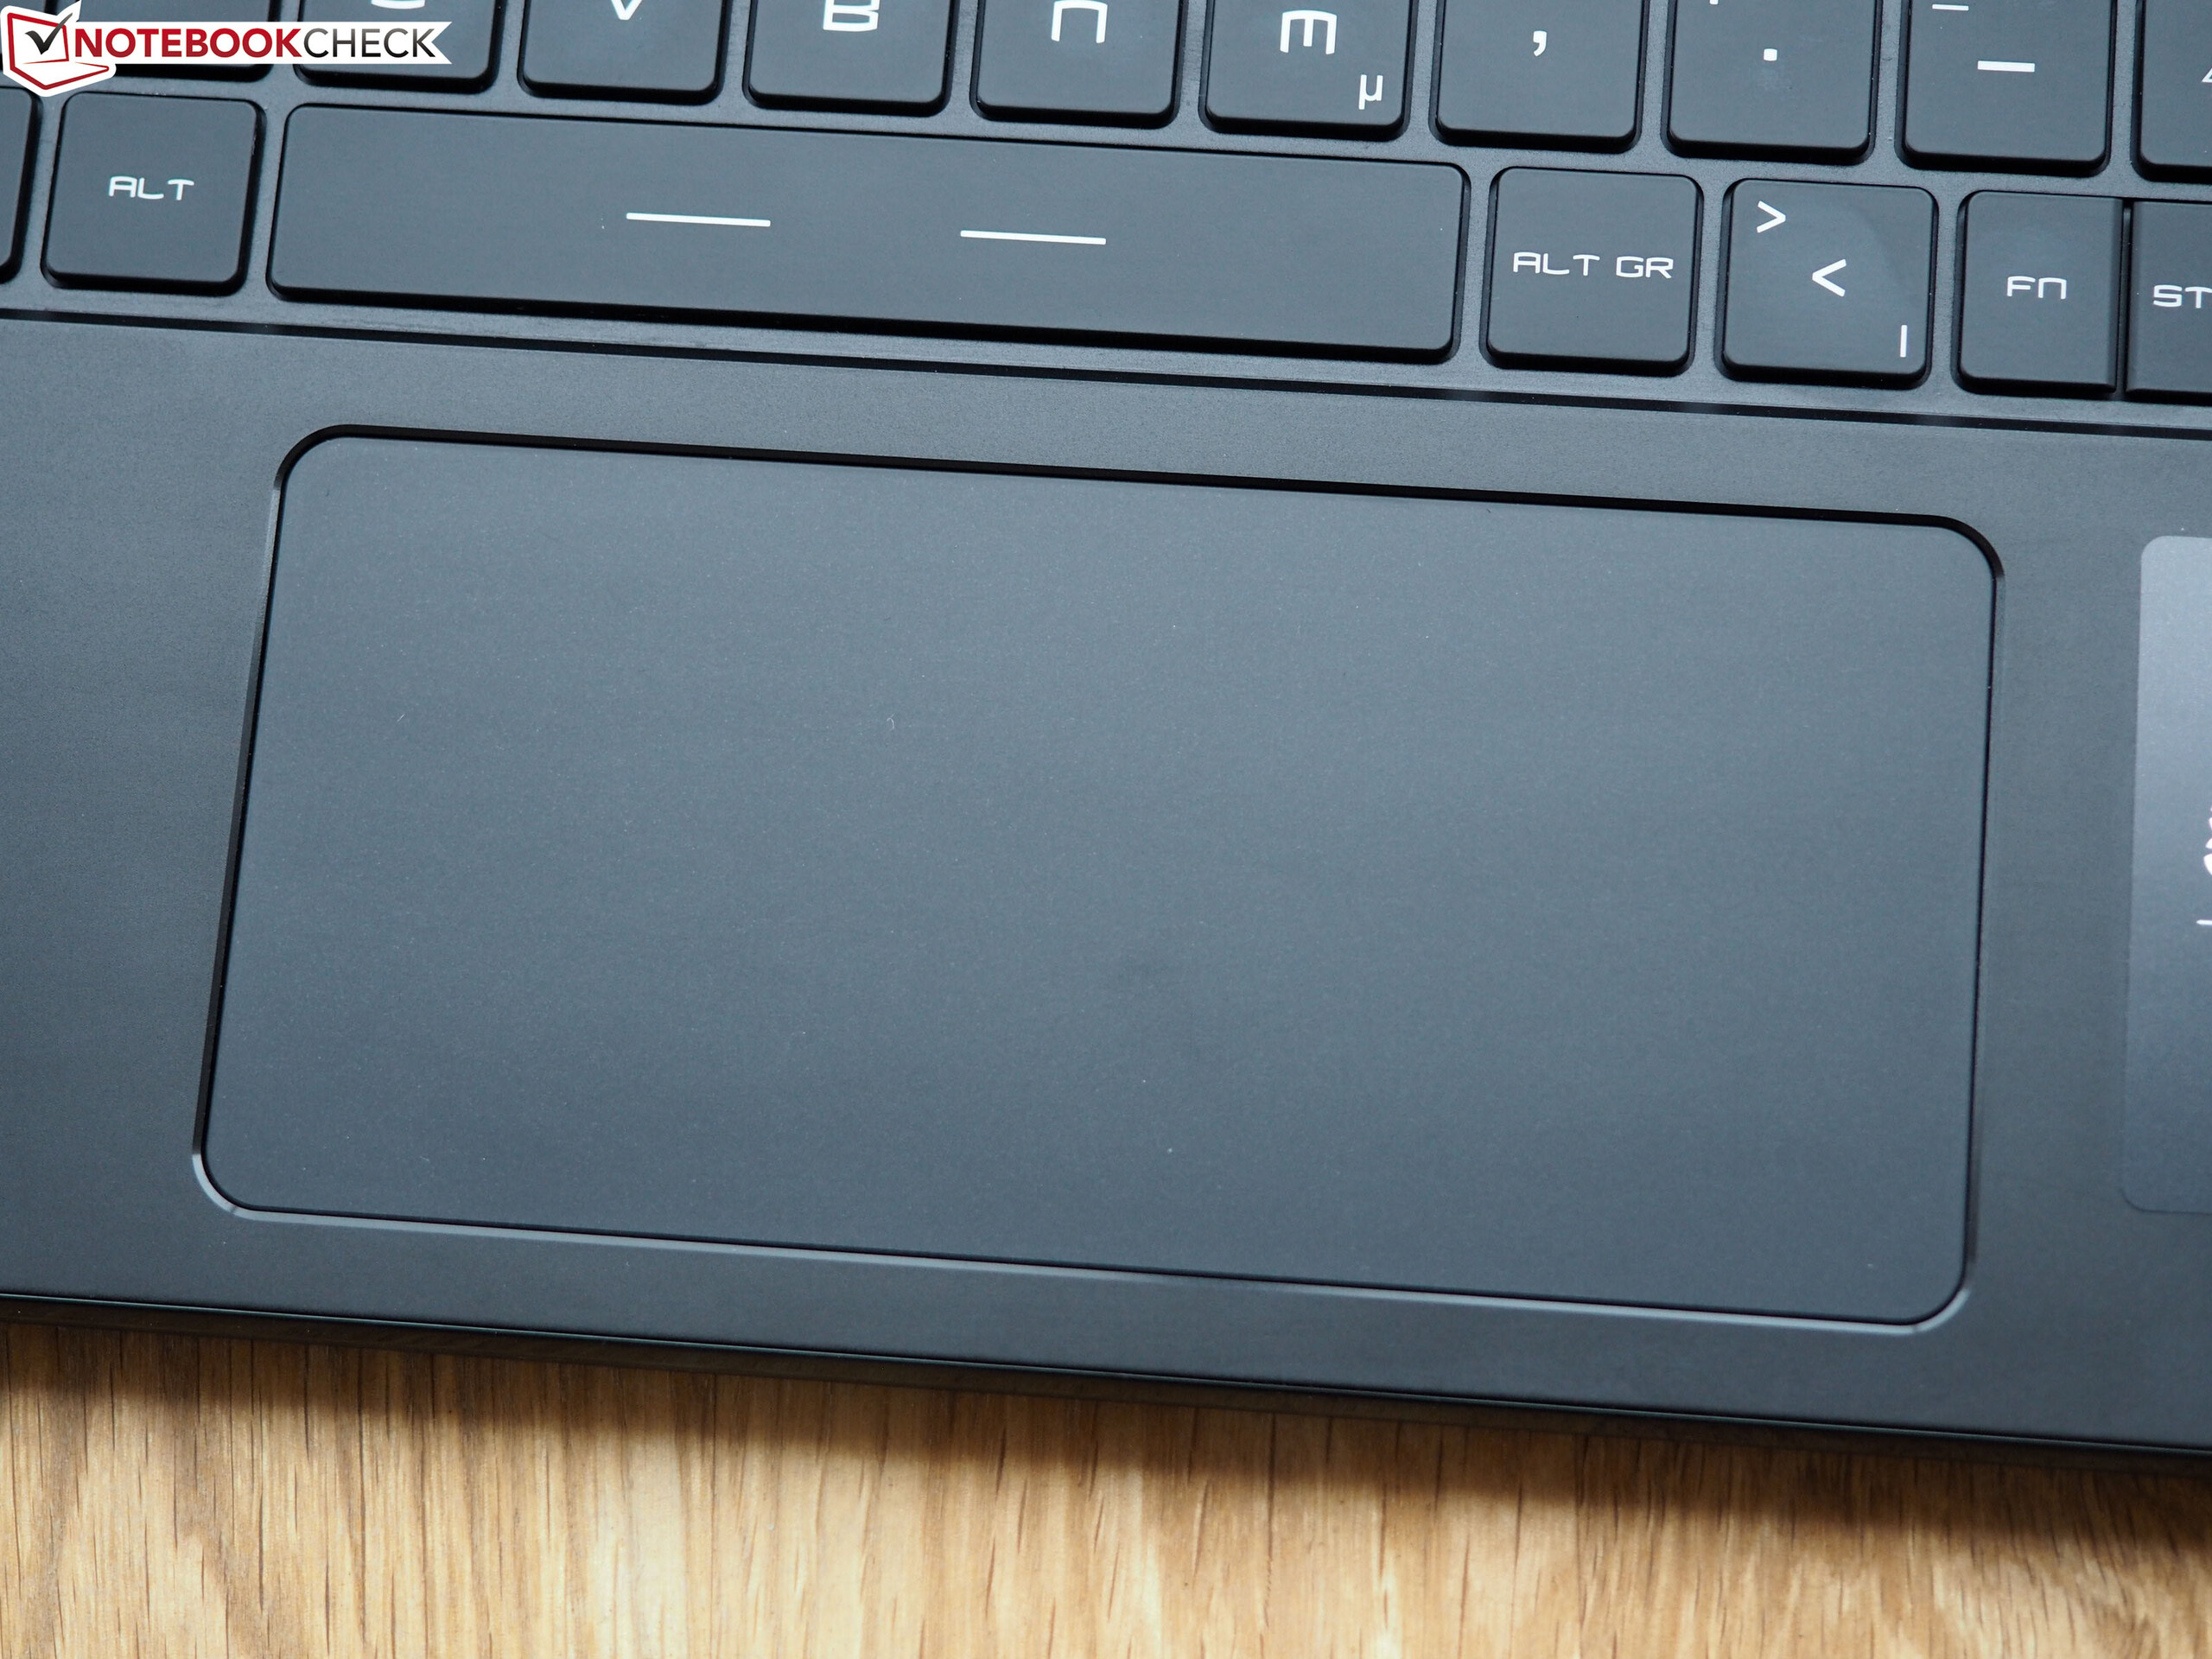
(+) Les repose-poignets et le pavé tactile atteignent la température maximale de la peau (35 °C / 95 F) et ne sont donc pas chauds.
(-) La température moyenne de la zone de l'appui-paume de dispositifs similaires était de 28.8 °C / 83.8 F (-6.2 °C / #-11.2 F).
| MSI GS66 Stealth 10SE-045 i7-10750H, GeForce RTX 2060 Mobile | MSI GS66 Stealth 10SFS i9-10980HK, GeForce RTX 2070 Super Max-Q | Razer Blade 15 GTX 1660 Ti i7-9750H, GeForce GTX 1660 Ti Mobile | Dell G5 15 SE 5505 P89F R7 4800H, Radeon RX 5600M | Lenovo Legion 5 15IMH05H i5-10300H, GeForce RTX 2060 Mobile | Asus TUF Gaming A15 FA506IV-HN172 R7 4800H, GeForce RTX 2060 Mobile | Schenker XMG Core 15 GK5CP6V i7-9750H, GeForce GTX 1660 Ti Mobile | Moyenne de la classe Gaming | |
|---|---|---|---|---|---|---|---|---|
| Heat | -0% | -17% | -3% | 8% | 9% | 2% | -0% | |
| Maximum Upper Side * (°C) | 53 | 53 -0% | 52 2% | 53 -0% | 46.3 13% | 42.9 19% | 48 9% | 45.2 ? 15% |
| Maximum Bottom * (°C) | 53 | 55 -4% | 52.2 2% | 57.6 -9% | 44.4 16% | 49.9 6% | 59 -11% | 48.1 ? 9% |
| Idle Upper Side * (°C) | 29 | 28 3% | 38 -31% | 27.4 6% | 28.1 3% | 27.8 4% | 27 7% | 31.1 ? -7% |
| Idle Bottom * (°C) | 29 | 29 -0% | 40.4 -39% | 31 -7% | 29.4 -1% | 27 7% | 28 3% | 34.3 ? -18% |
* ... Moindre est la valeur, meilleures sont les performances
MSI GS66 Stealth 10SE-045 analyse audio
(+) | les haut-parleurs peuvent jouer relativement fort (86# dB)
Basses 100 - 315 Hz
(-) | presque aucune basse - en moyenne 30.3% plus bas que la médiane
(±) | la linéarité des basses est moyenne (8.1% delta à la fréquence précédente)
Médiums 400 - 2000 Hz
(±) | médiane supérieure - en moyenne 7.7% supérieure à la médiane
(±) | la linéarité des médiums est moyenne (7.3% delta à la fréquence précédente)
Aiguës 2 - 16 kHz
(+) | des sommets équilibrés - à seulement 3.3% de la médiane
(+) | les aigus sont linéaires (6% delta à la fréquence précédente)
Globalement 100 - 16 000 Hz
(±) | la linéarité du son global est moyenne (24% de différence avec la médiane)
Par rapport à la même classe
» 86% de tous les appareils testés de cette catégorie étaient meilleurs, 4% similaires, 9% pires
» Le meilleur avait un delta de 6%, la moyenne était de 18%, le pire était de 132%.
Par rapport à tous les appareils testés
» 72% de tous les appareils testés étaient meilleurs, 6% similaires, 22% pires
» Le meilleur avait un delta de 4%, la moyenne était de 24%, le pire était de 134%.
| Éteint/en veille | |
| Au repos | |
| Fortement sollicité |
|
Légende:
min: | |
| MSI GS66 Stealth 10SE-045 i7-10750H, GeForce RTX 2060 Mobile | MSI GS66 Stealth 10SFS i9-10980HK, GeForce RTX 2070 Super Max-Q | Razer Blade 15 GTX 1660 Ti i7-9750H, GeForce GTX 1660 Ti Mobile | Dell G5 15 SE 5505 P89F R7 4800H, Radeon RX 5600M | Lenovo Legion 5 15IMH05H i5-10300H, GeForce RTX 2060 Mobile | Asus TUF Gaming A15 FA506IV-HN172 R7 4800H, GeForce RTX 2060 Mobile | Schenker XMG Core 15 GK5CP6V i7-9750H, GeForce GTX 1660 Ti Mobile | Moyenne de la classe Gaming | |
|---|---|---|---|---|---|---|---|---|
| Power Consumption | -16% | -41% | 22% | 33% | 22% | 15% | -22% | |
| Idle Minimum * (Watt) | 7 | 13 -86% | 18.7 -167% | 6.5 7% | 3.2 54% | 5.4 23% | 9 -29% | 13.2 ? -89% |
| Idle Average * (Watt) | 18 | 16 11% | 30.7 -71% | 10.6 41% | 8.3 54% | 10 44% | 12 33% | 18.9 ? -5% |
| Idle Maximum * (Watt) | 31 | 27 13% | 33.9 -9% | 11 65% | 8.7 72% | 10.5 66% | 18 42% | 24.5 ? 21% |
| Load Average * (Watt) | 107 | 109 -2% | 93.4 13% | 84.1 21% | 82 23% | 135 -26% | 86 20% | 108.8 ? -2% |
| Witcher 3 ultra * (Watt) | 146 | 155 -6% | 158.9 -9% | 152.9 -5% | 151 -3% | 144 1% | 126 14% | |
| Load Maximum * (Watt) | 186 | 236 -27% | 195.3 -5% | 180.4 3% | 195 -5% | 147 21% | 173 7% | 254 ? -37% |
* ... Moindre est la valeur, meilleures sont les performances
| MSI GS66 Stealth 10SE-045 i7-10750H, GeForce RTX 2060 Mobile, 99.9 Wh | Dell G5 15 SE 5505 P89F R7 4800H, Radeon RX 5600M, 51 Wh | Lenovo Legion 5 15IMH05H i5-10300H, GeForce RTX 2060 Mobile, 60 Wh | Asus TUF Gaming A15 FA506IV-HN172 R7 4800H, GeForce RTX 2060 Mobile, 48 Wh | Schenker XMG Core 15 GK5CP6V i7-9750H, GeForce GTX 1660 Ti Mobile, 46 Wh | MSI GS66 10SGS i7-10750H, GeForce RTX 2080 Super Max-Q, 99.99 Wh | MSI GS66 Stealth 10SFS i9-10980HK, GeForce RTX 2070 Super Max-Q, 99.99 Wh | Razer Blade 15 GTX 1660 Ti i7-9750H, GeForce GTX 1660 Ti Mobile, 65 Wh | Moyenne de la classe Gaming | |
|---|---|---|---|---|---|---|---|---|---|
| Autonomie de la batterie | 15% | 32% | 12% | -39% | 18% | 10% | -14% | 14% | |
| Reader / Idle (h) | 9 | 11.2 24% | 14.1 57% | 9.8 9% | 6.1 -32% | 10.2 13% | 8.4 -7% | 8.71 ? -3% | |
| H.264 (h) | 6.6 | 9.2 39% | 5.4 -18% | 8.28 ? 25% | |||||
| WiFi v1.3 (h) | 6.4 | 6.2 -3% | 7.2 13% | 6.2 -3% | 3.6 -44% | 6.9 8% | 6.1 -5% | 5.5 -14% | 6.96 ? 9% |
| Load (h) | 1.2 | 1.5 25% | 1.4 17% | 1.9 58% | 0.7 -42% | 1.6 33% | 1.7 42% | 1.47 ? 23% |
Points positifs
Points négatifs
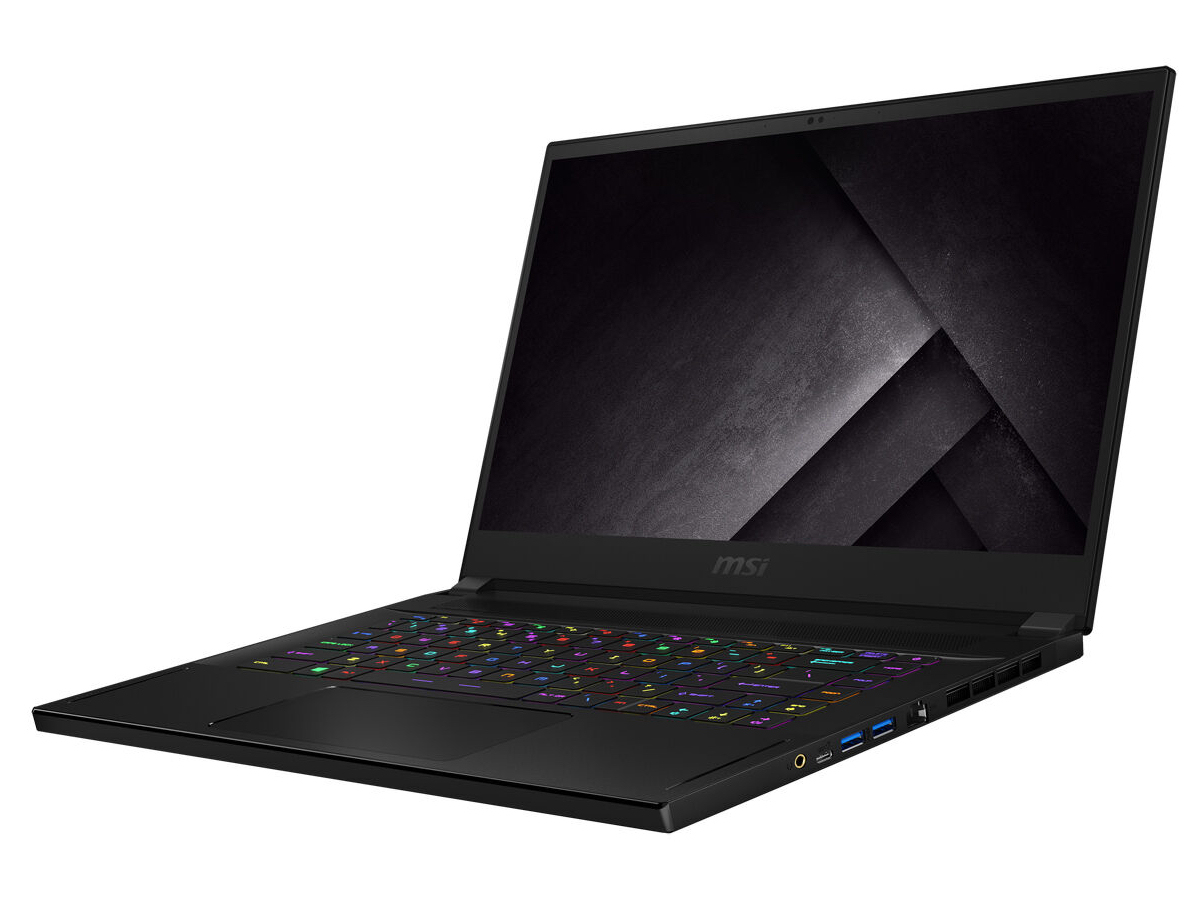
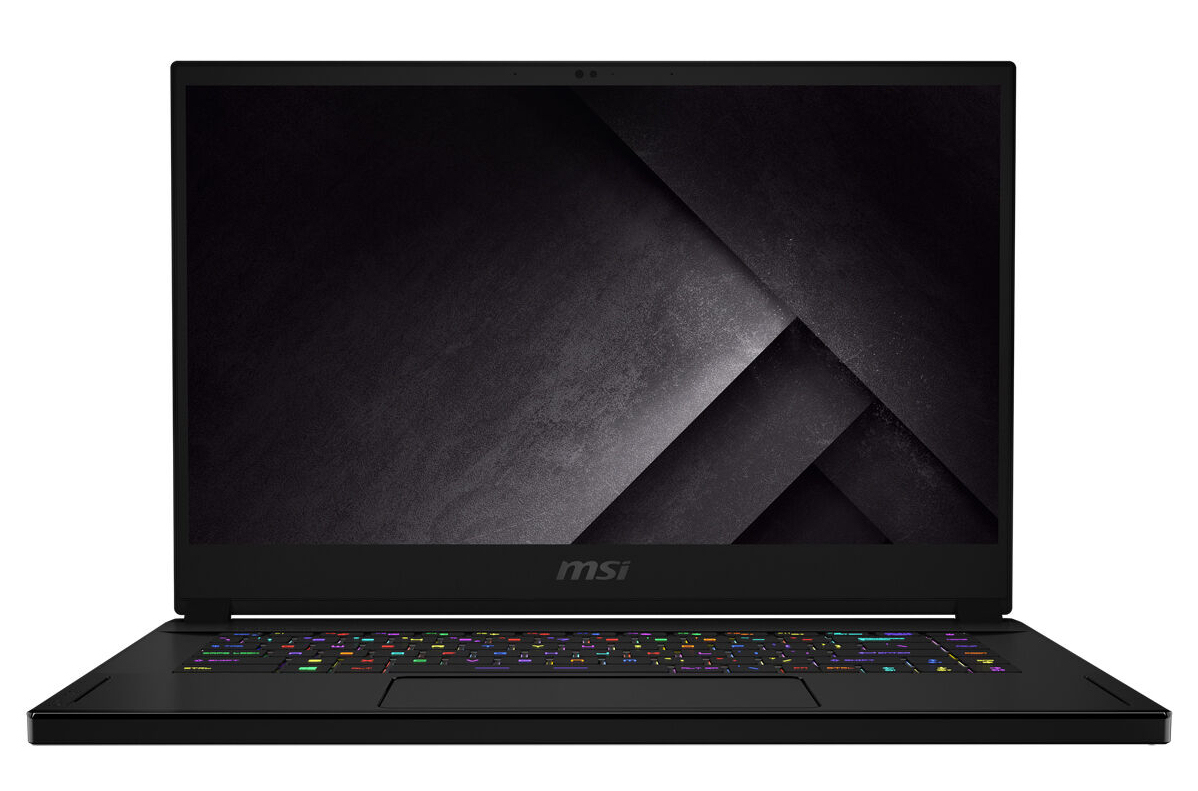
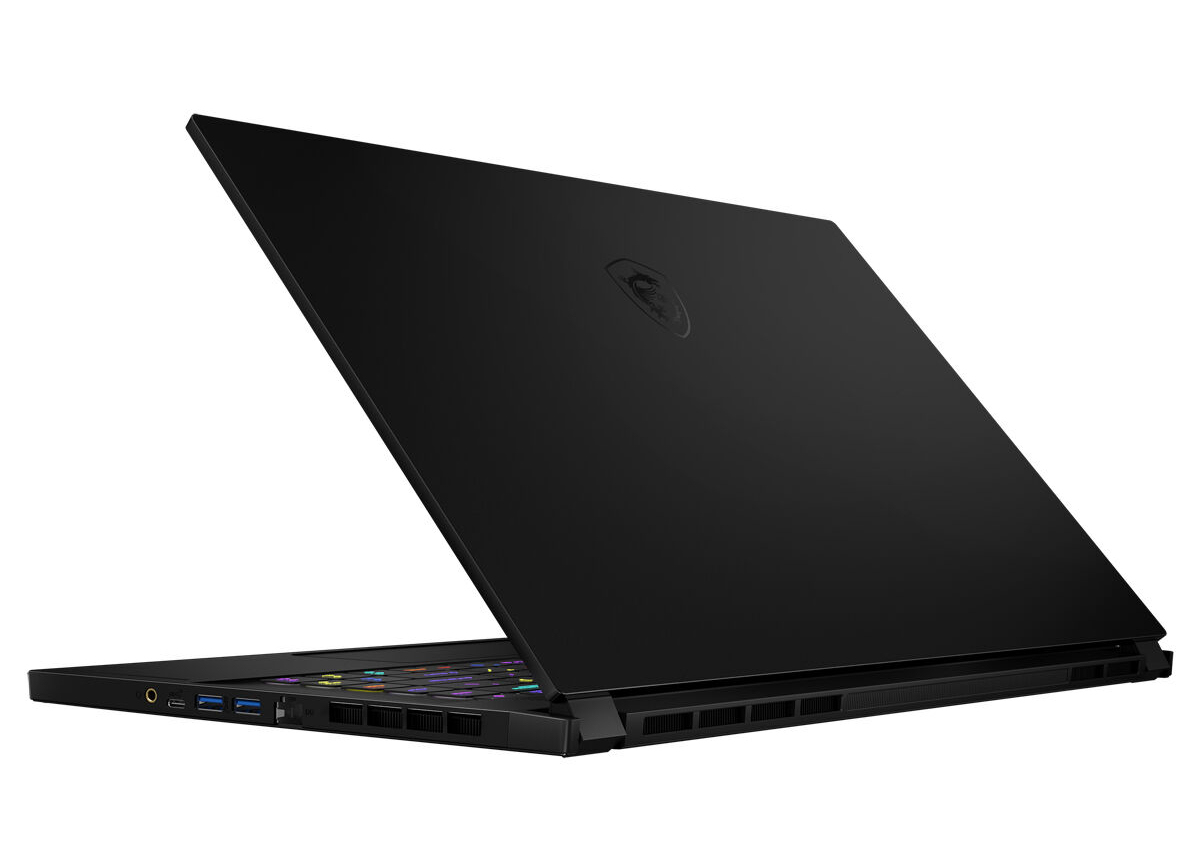
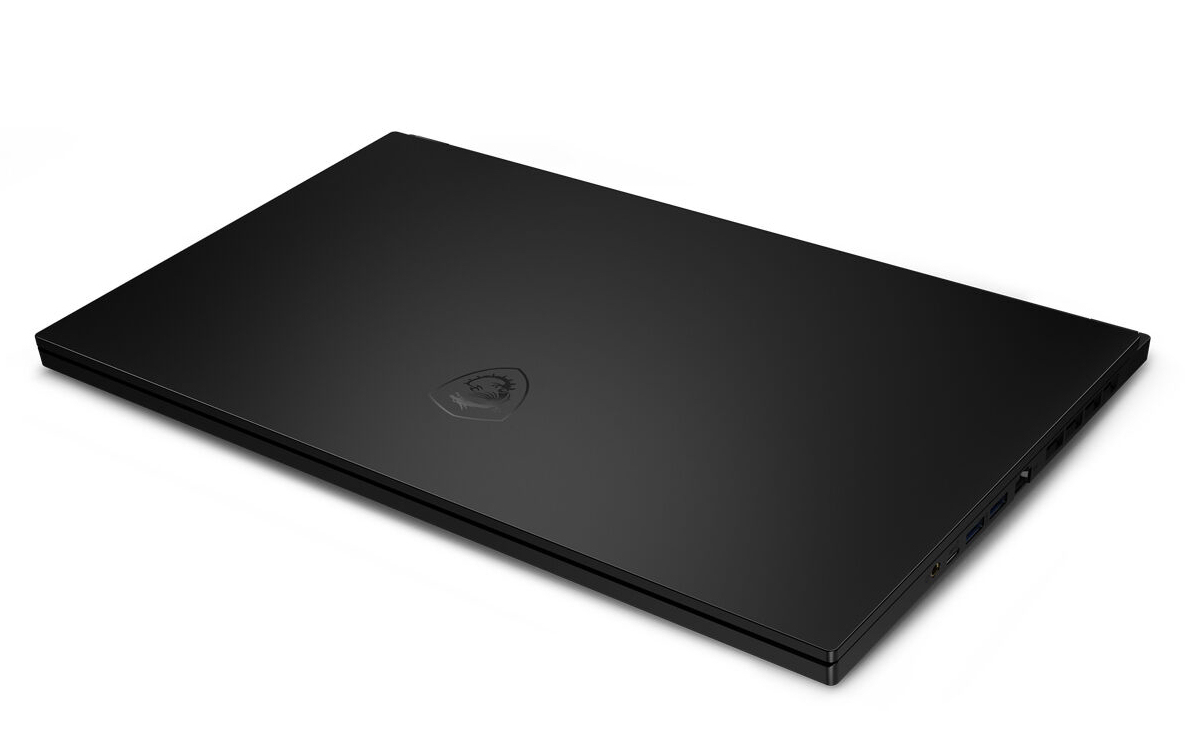
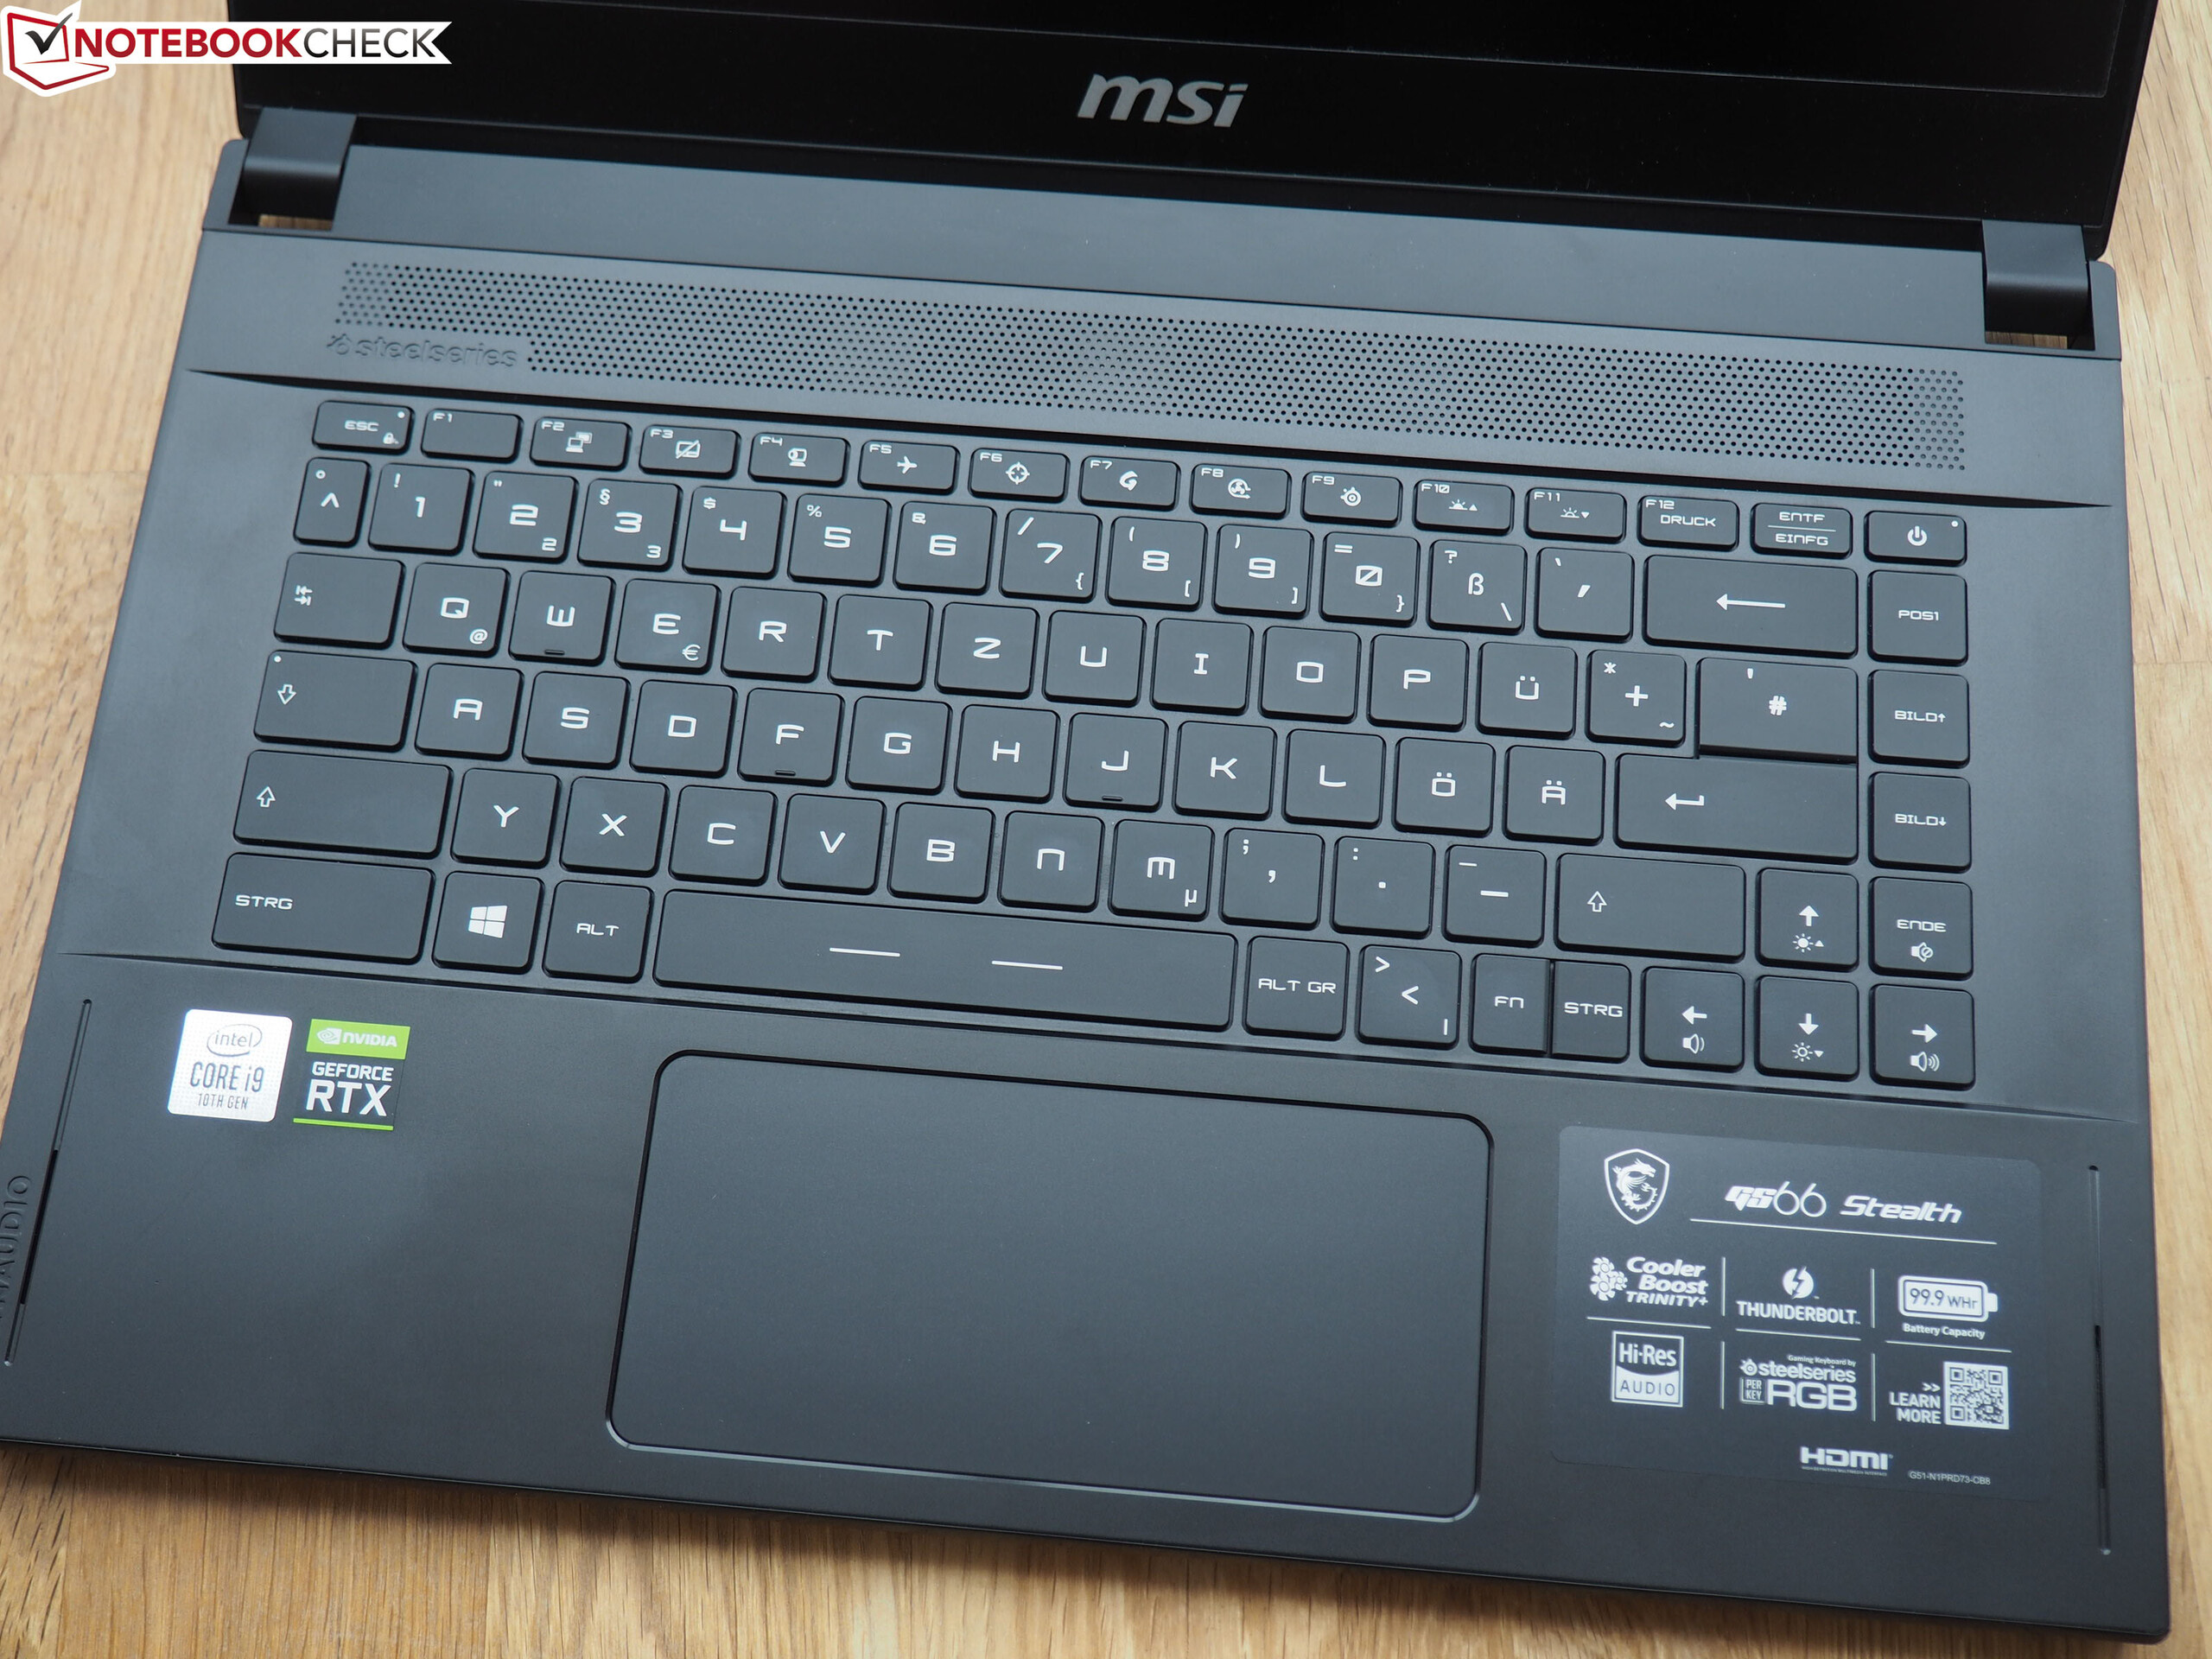
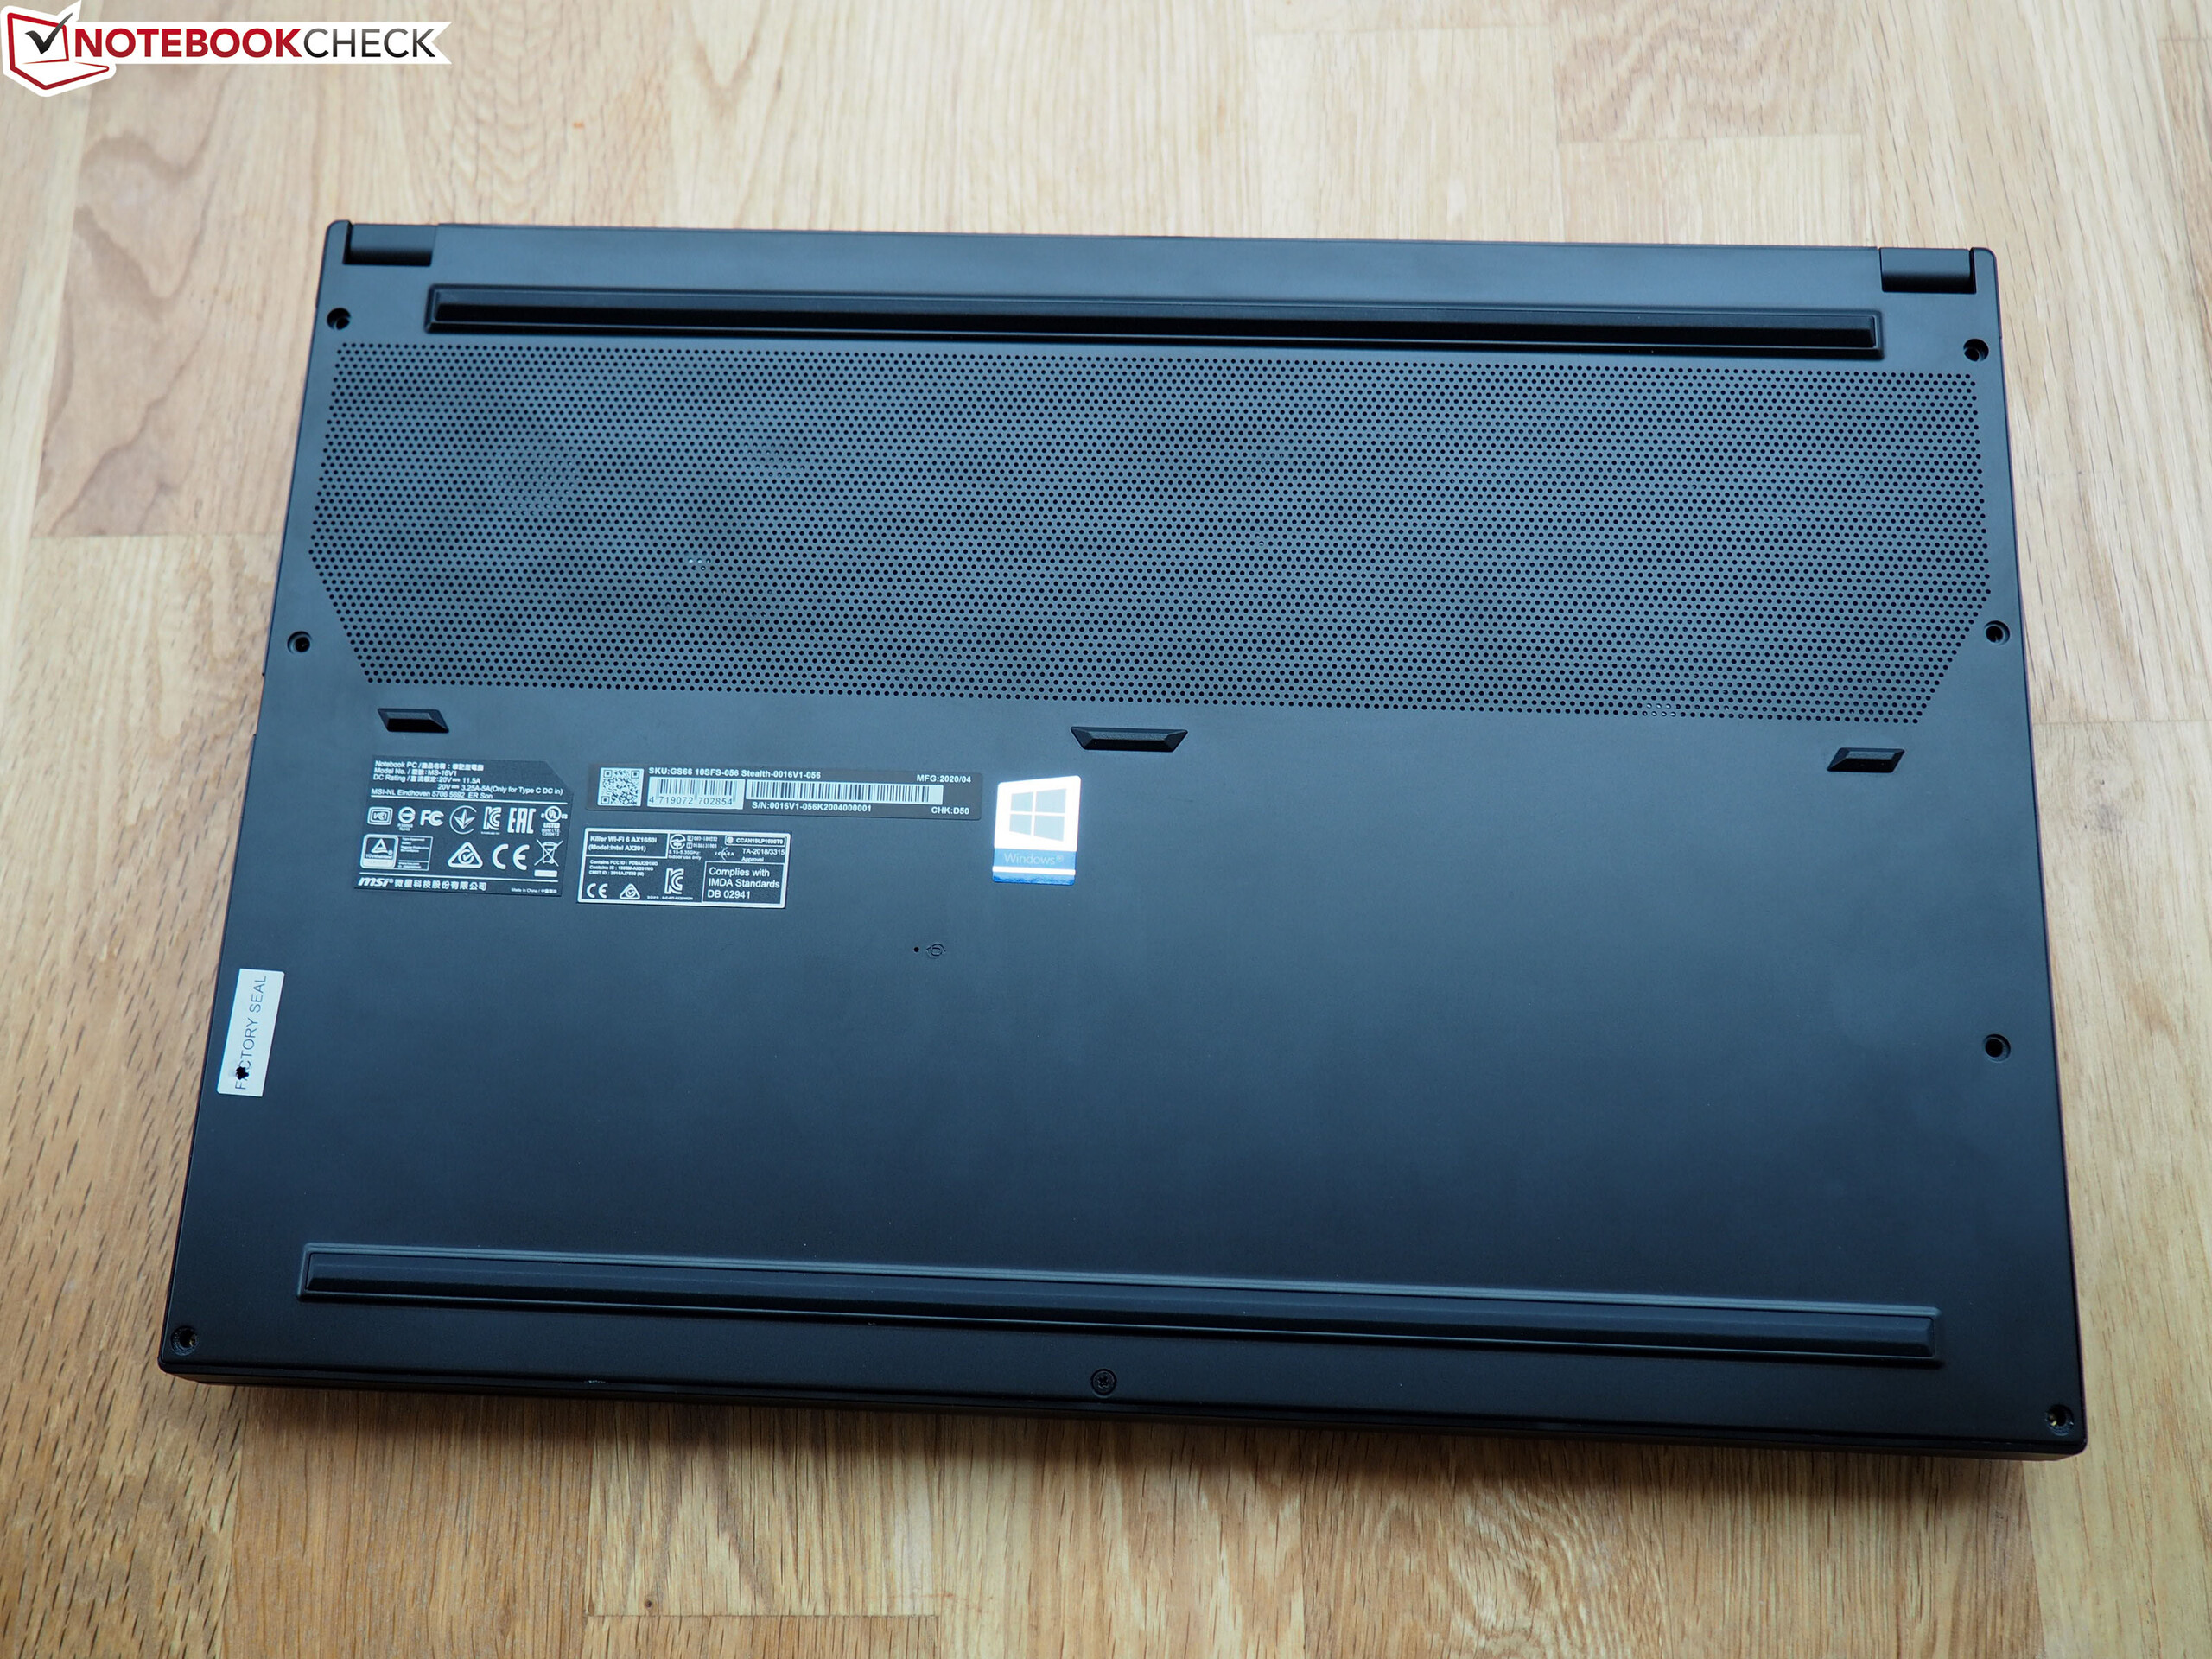
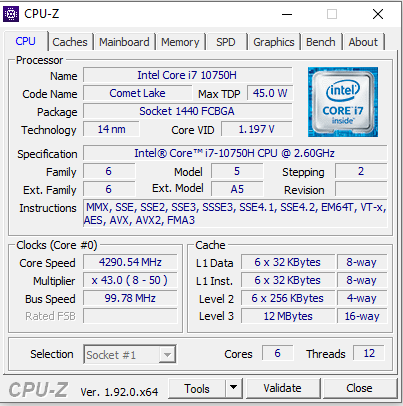
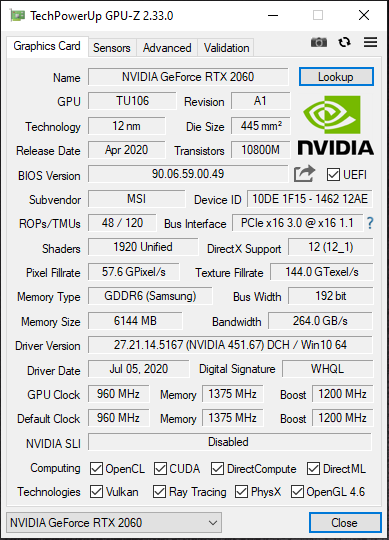
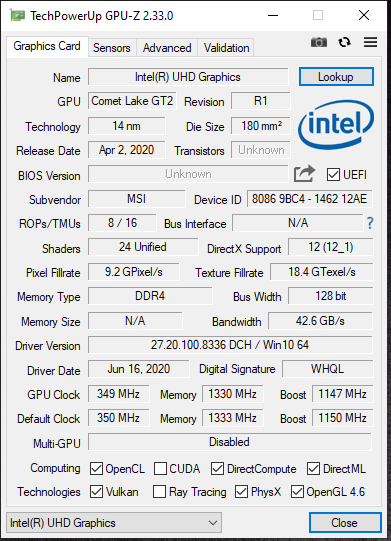
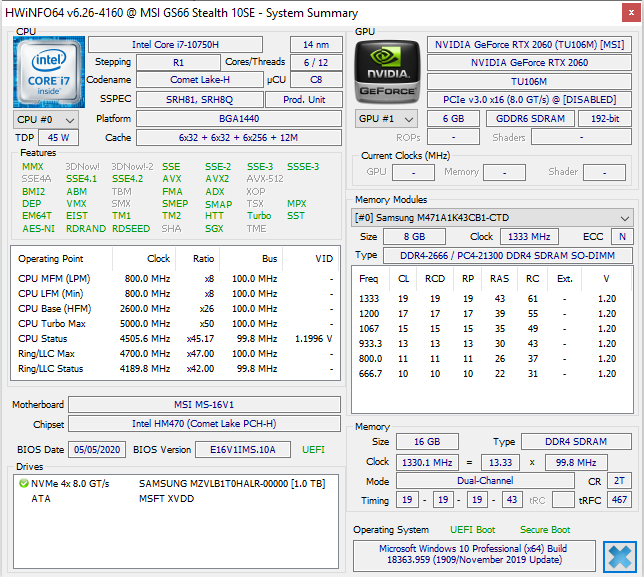
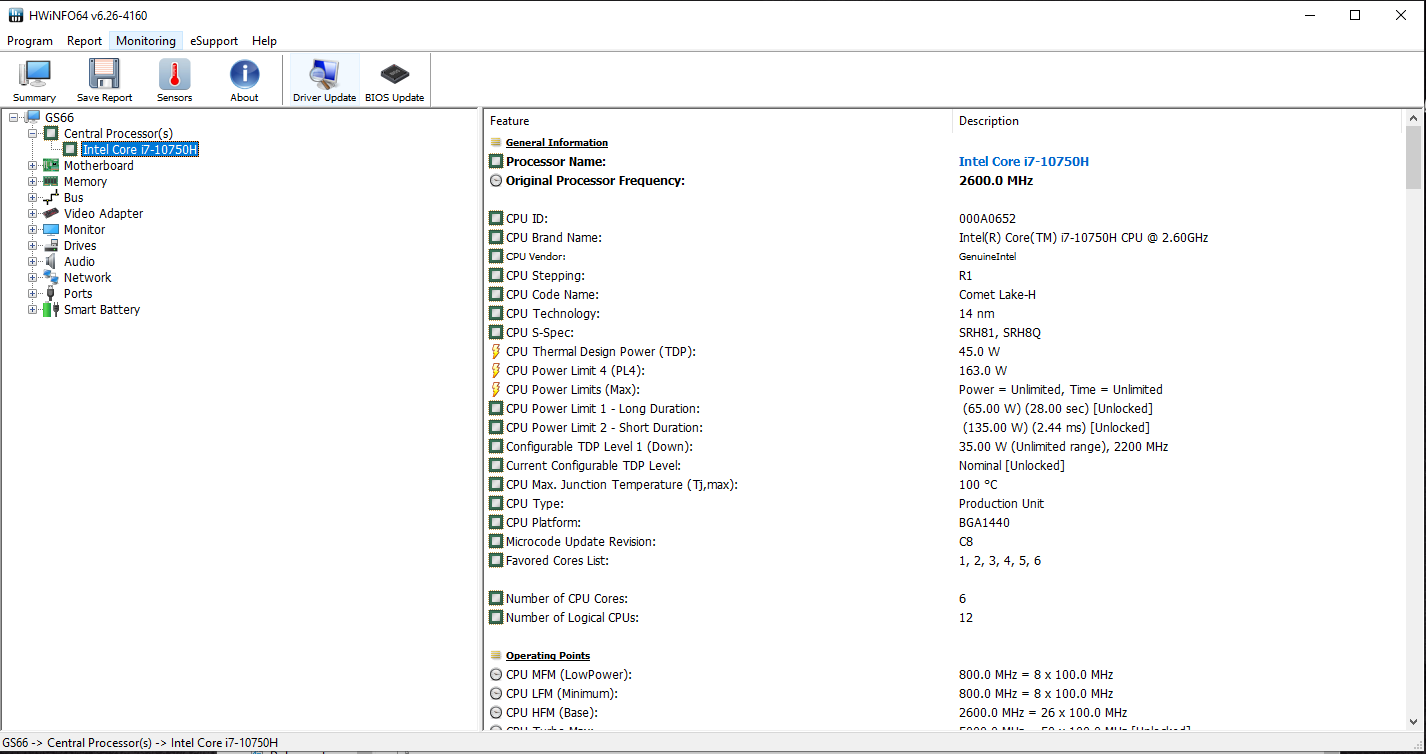
Le MSI GS66 arbore un châssis compact élégant en métal, sensible aux traces de doigts. Sous le capot, on retrouve un processeur Core i7-10750H et une carte graphique GeForce RTX 2060, qui permettent de faire tourner fluidement tous les jeux récents sur la dalle matte Full HD. Des réglages élevés ou maximaux peuvent toujours être choisis.
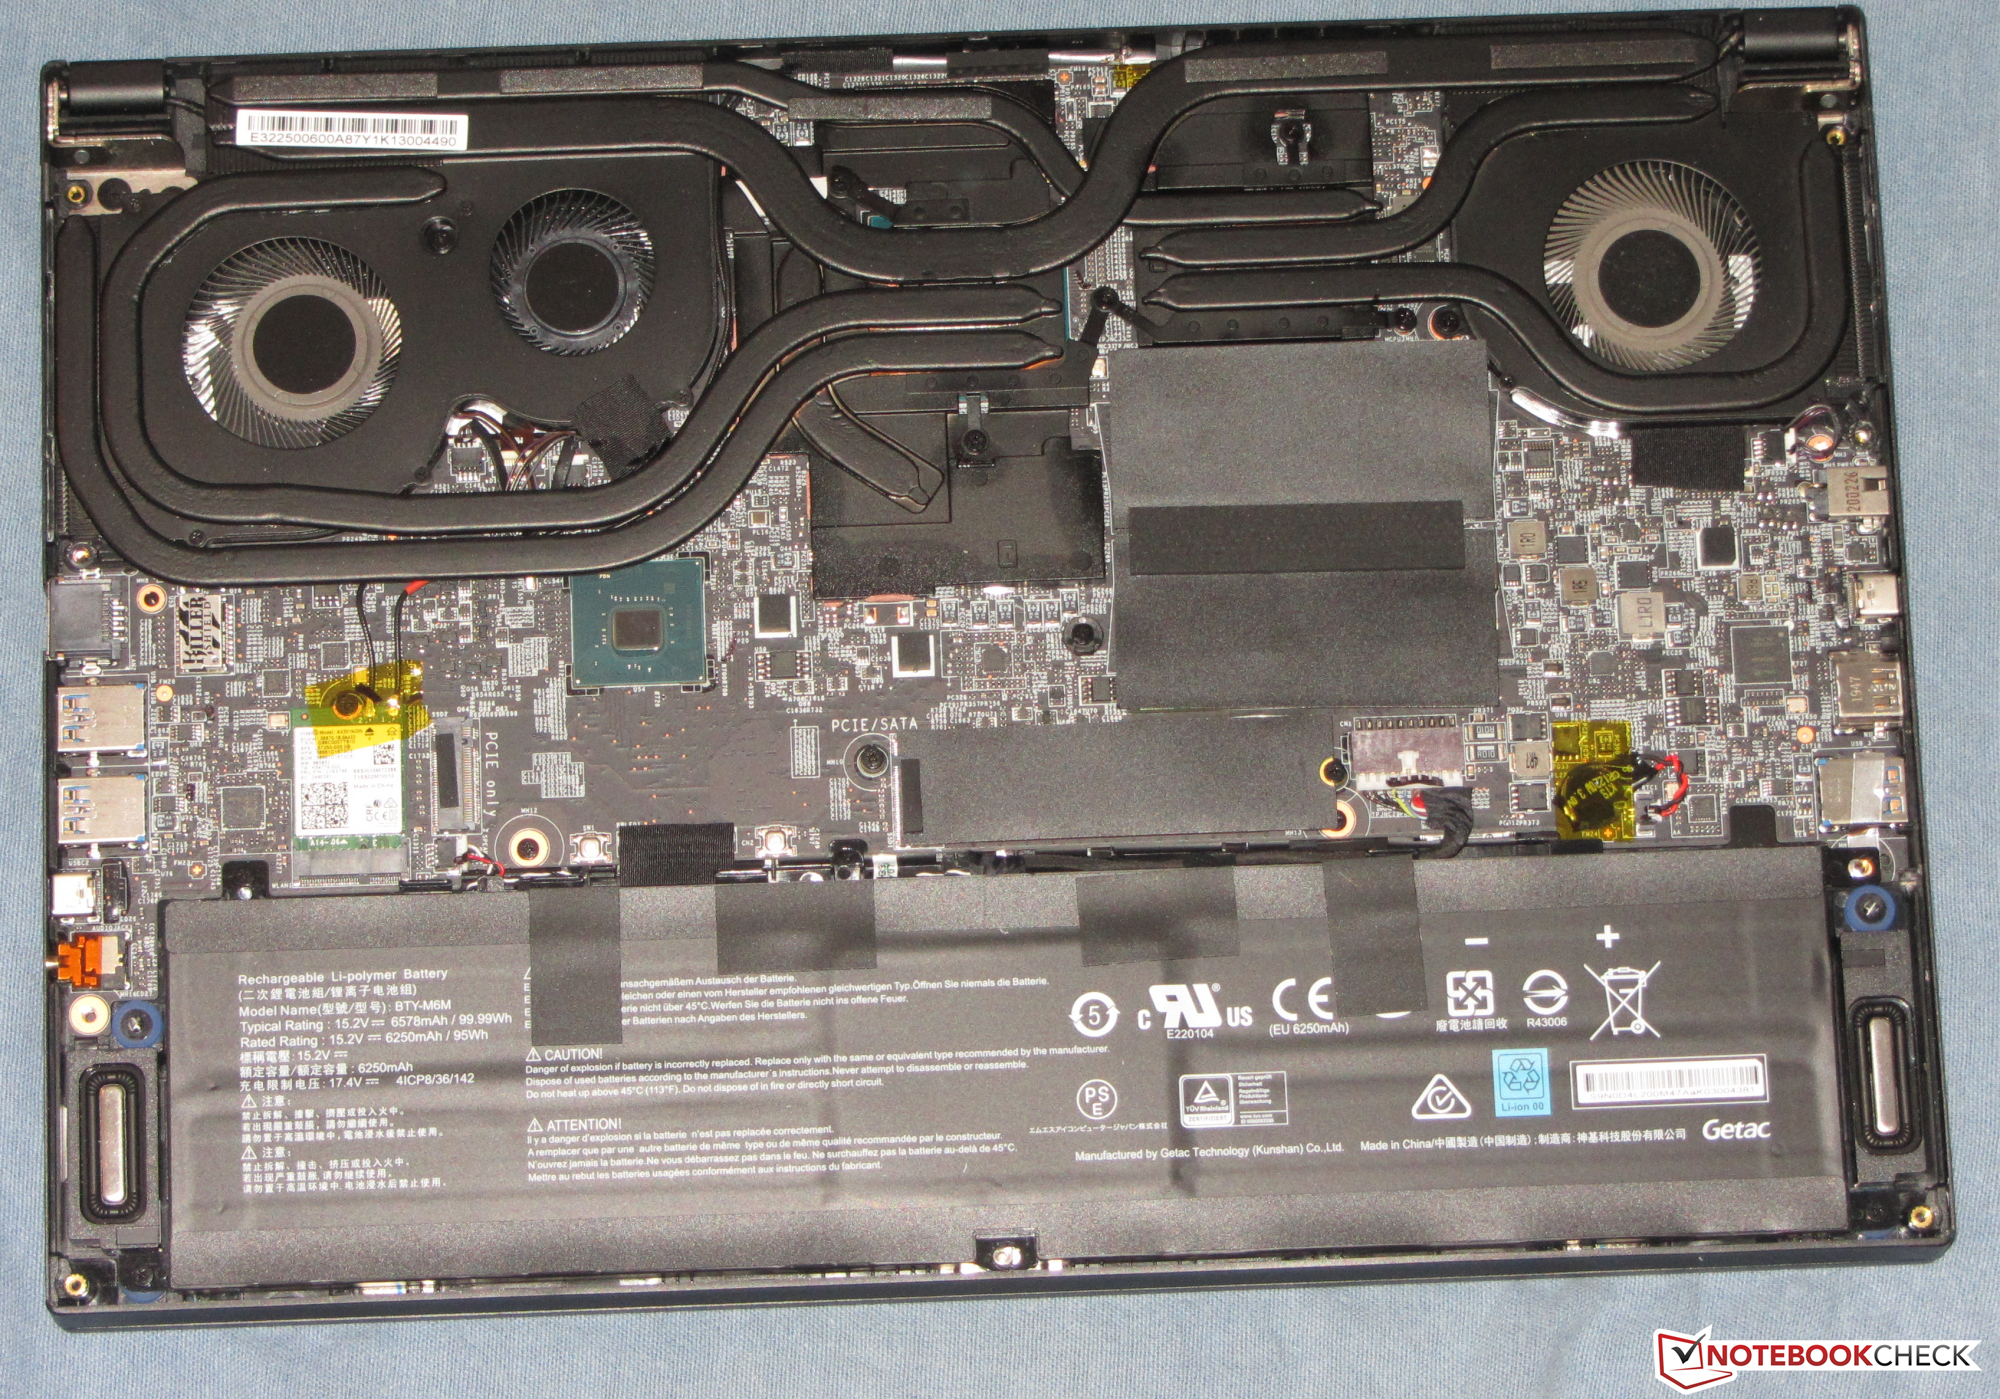
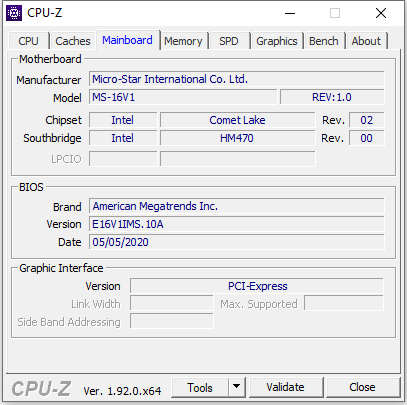
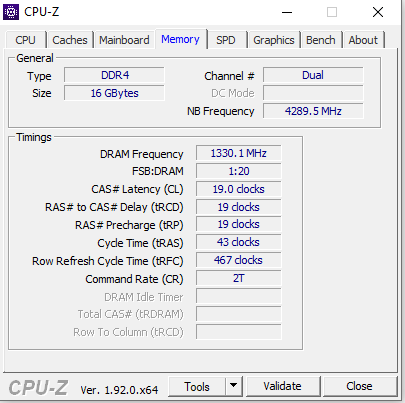
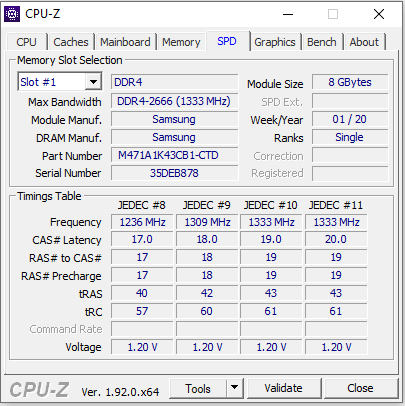
Les composants ont accès à 16 Go de RAM (double-canal), et il est possible de mettre jusqu'à 64 Go. Un SSD NVMe rapide de 1 To fournit le stockage nécessaire. Et si celui-ci ne suffit pas, un deuxième SSD NVMe peut être ajouté. La maintenance ou les mises à niveau nécessite de retirer la coque inférieure.
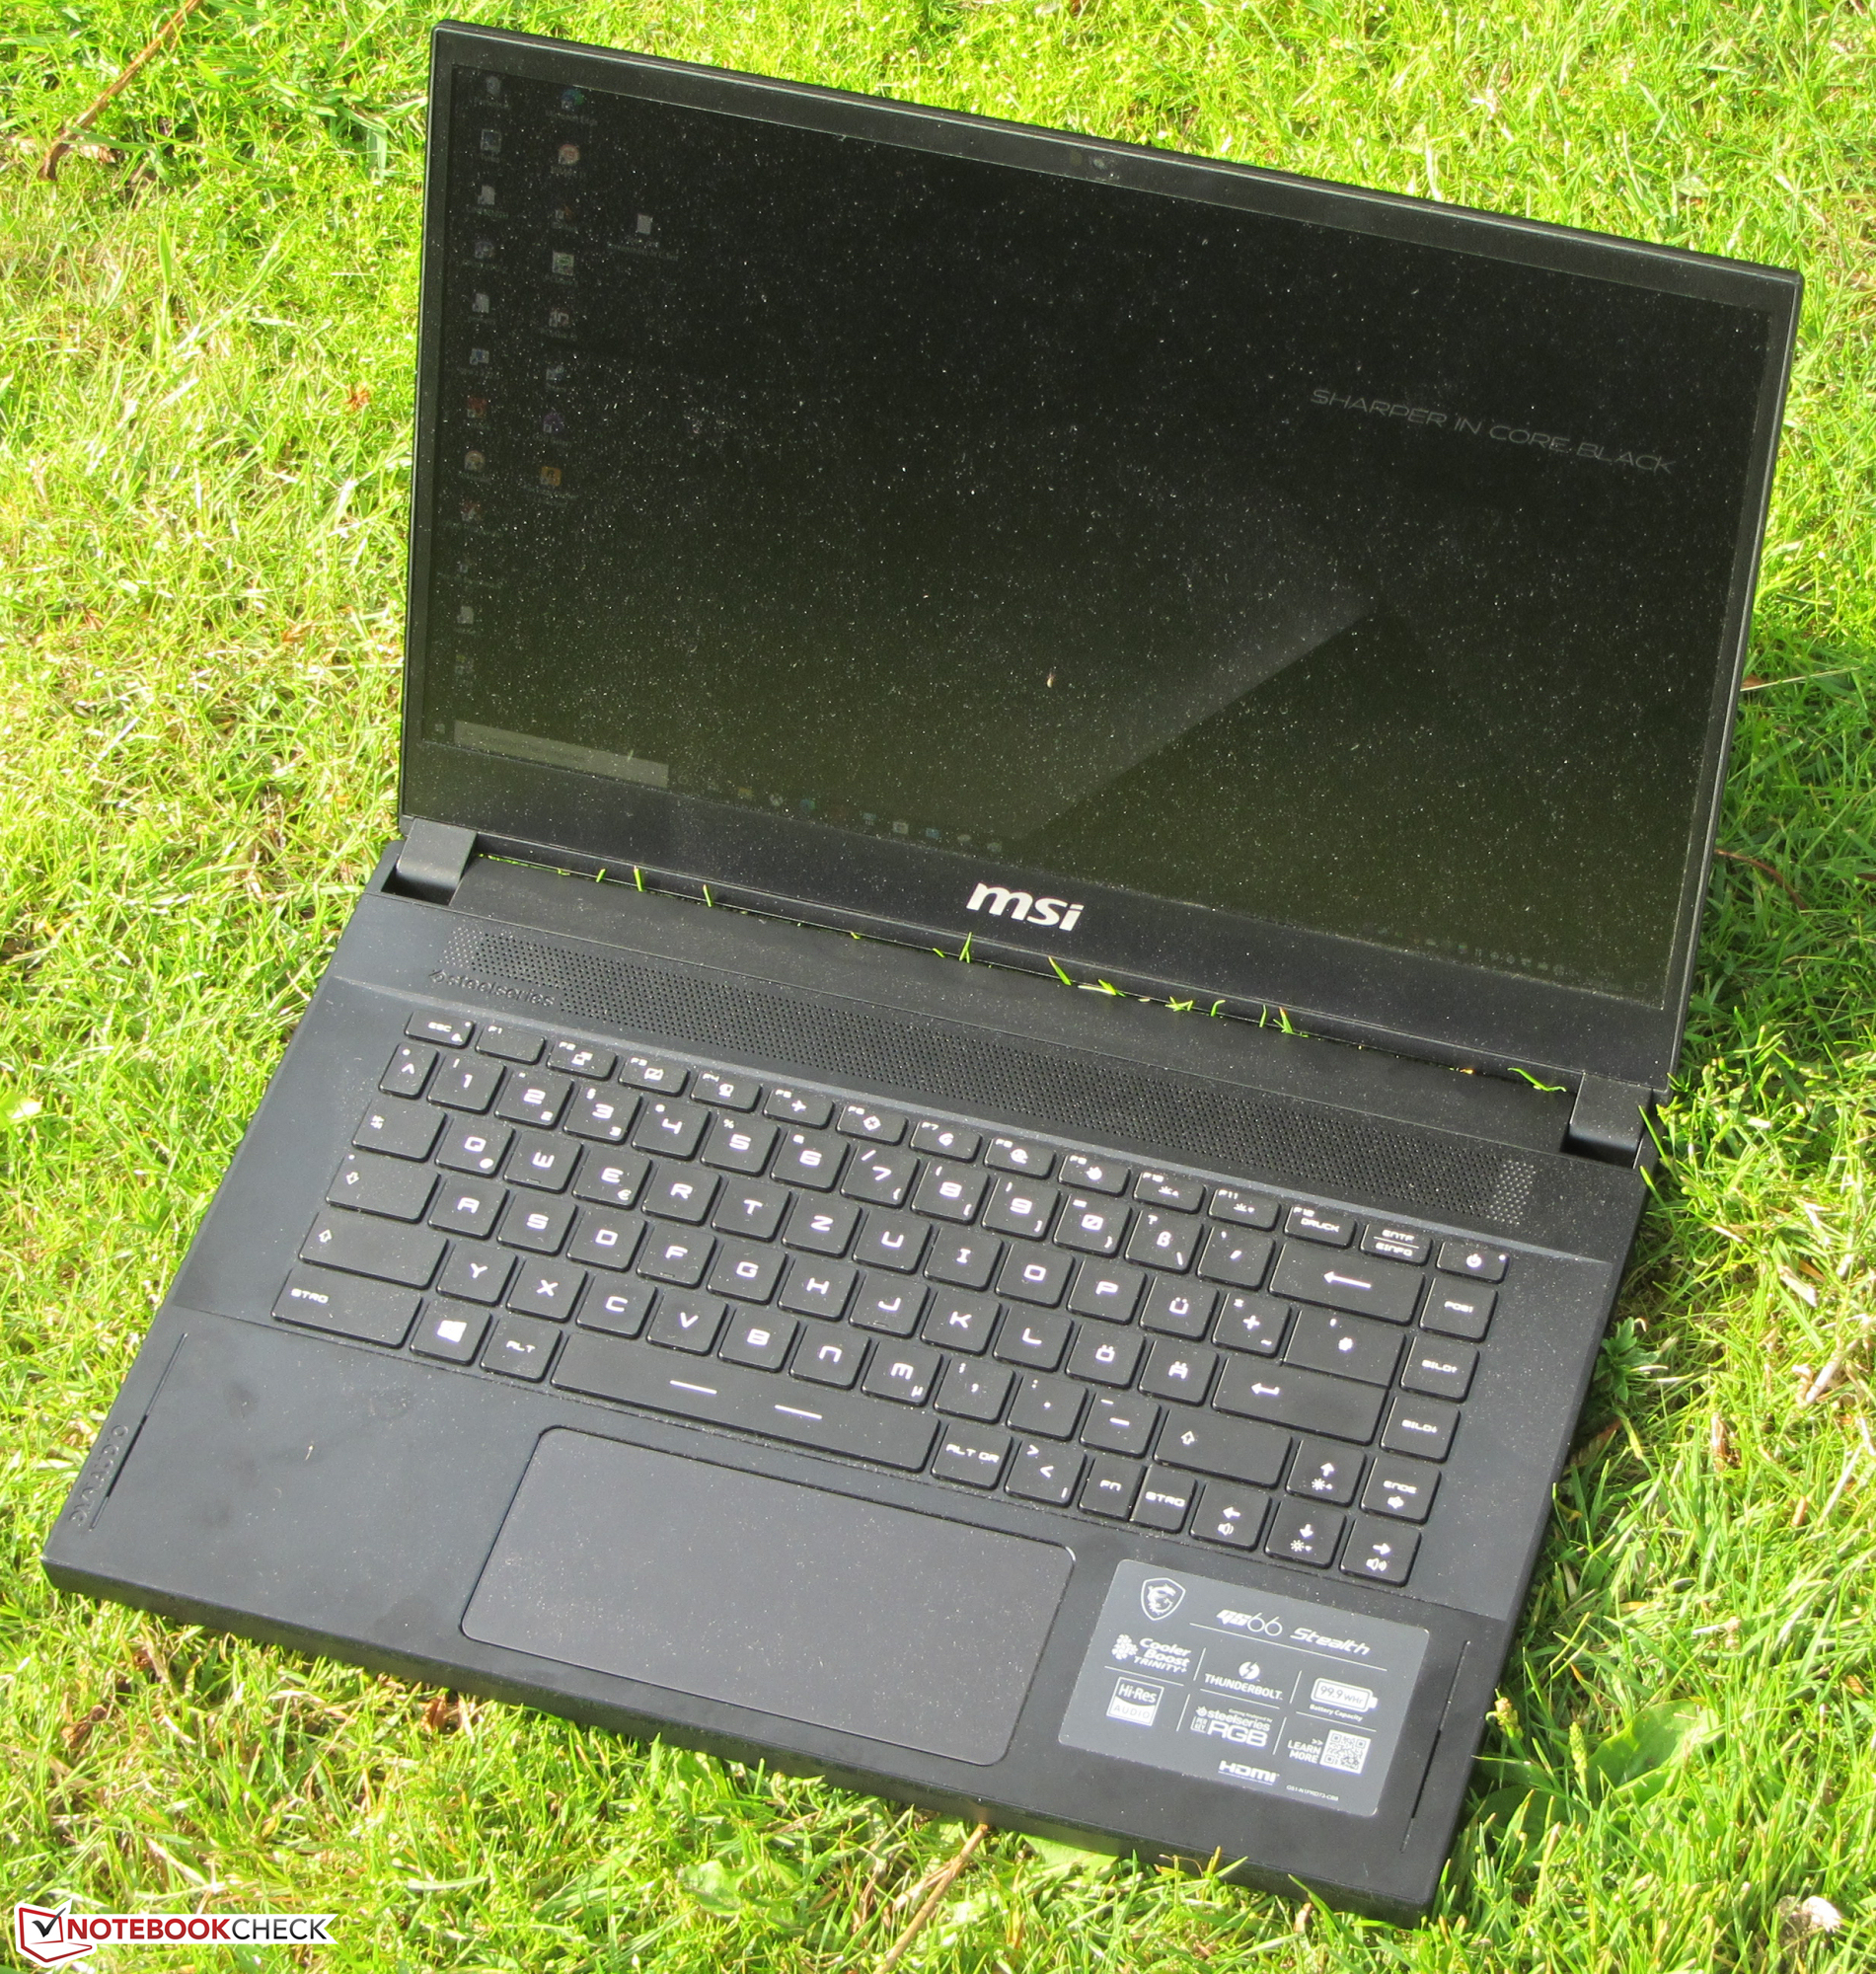
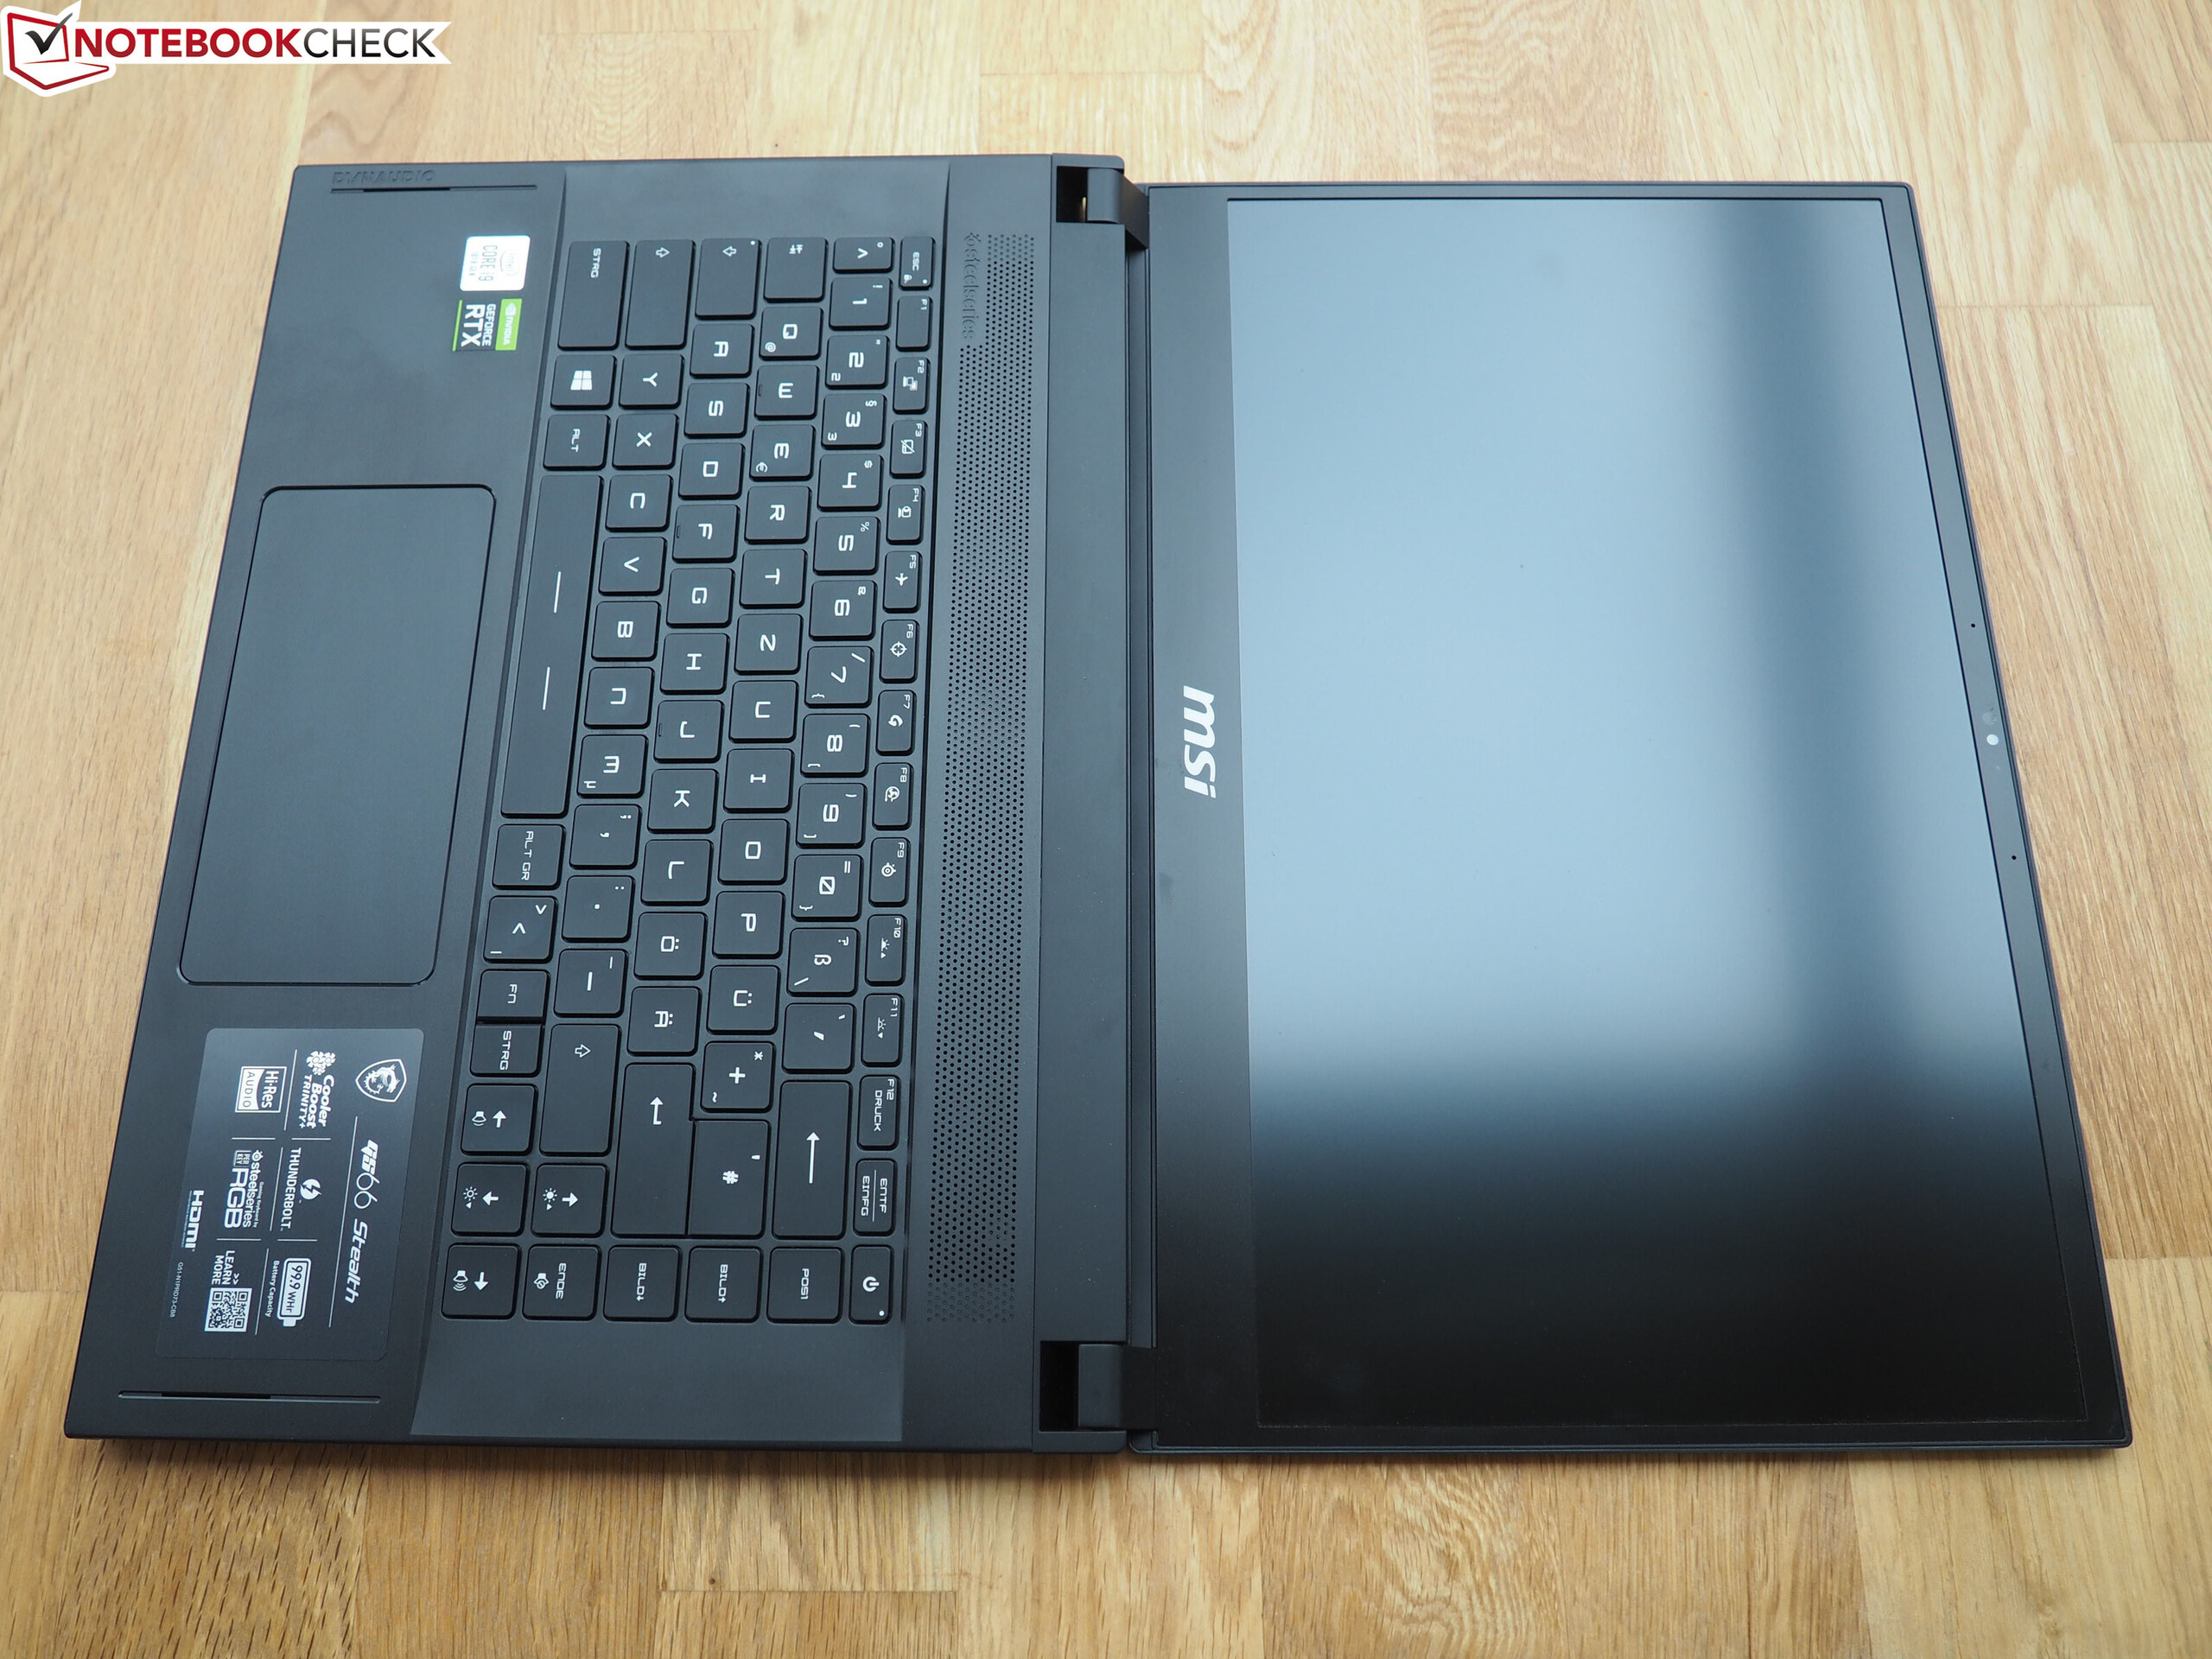
Le poids fort du PC portables est son écran IPS 240 Hz.
L'écran marque des points avec ses temps de réponse, ses angles de vision, son contraste et ses couleurs fidèles. Mais la luminosité maximale n'est pas suffisante : à ce prix, on devrait avoir mieux.
En principe, l'autonomie est plus que suffisante pour un PC portable de jeu. Mais si on relie cela à la capacité de la batterie (99,9 Wh), on voit les choses autrement. Les concurrents font aussi bien, voire mieux, avec des batteries qui font la moitié. La consommation élevée au ralenti ou en cas de faibles sollicitations est bien visible.
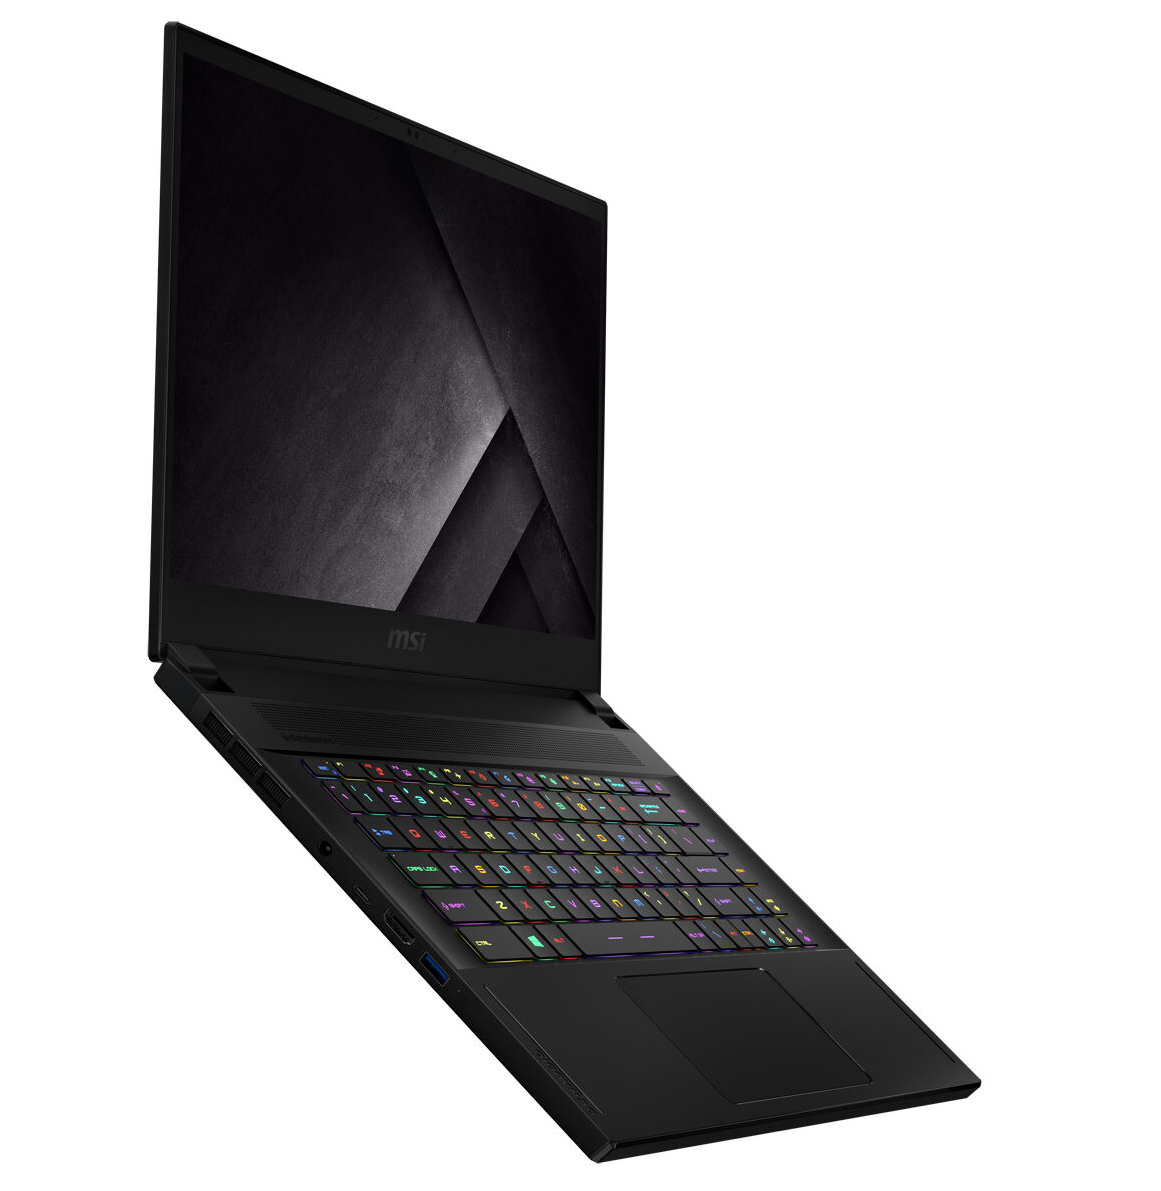
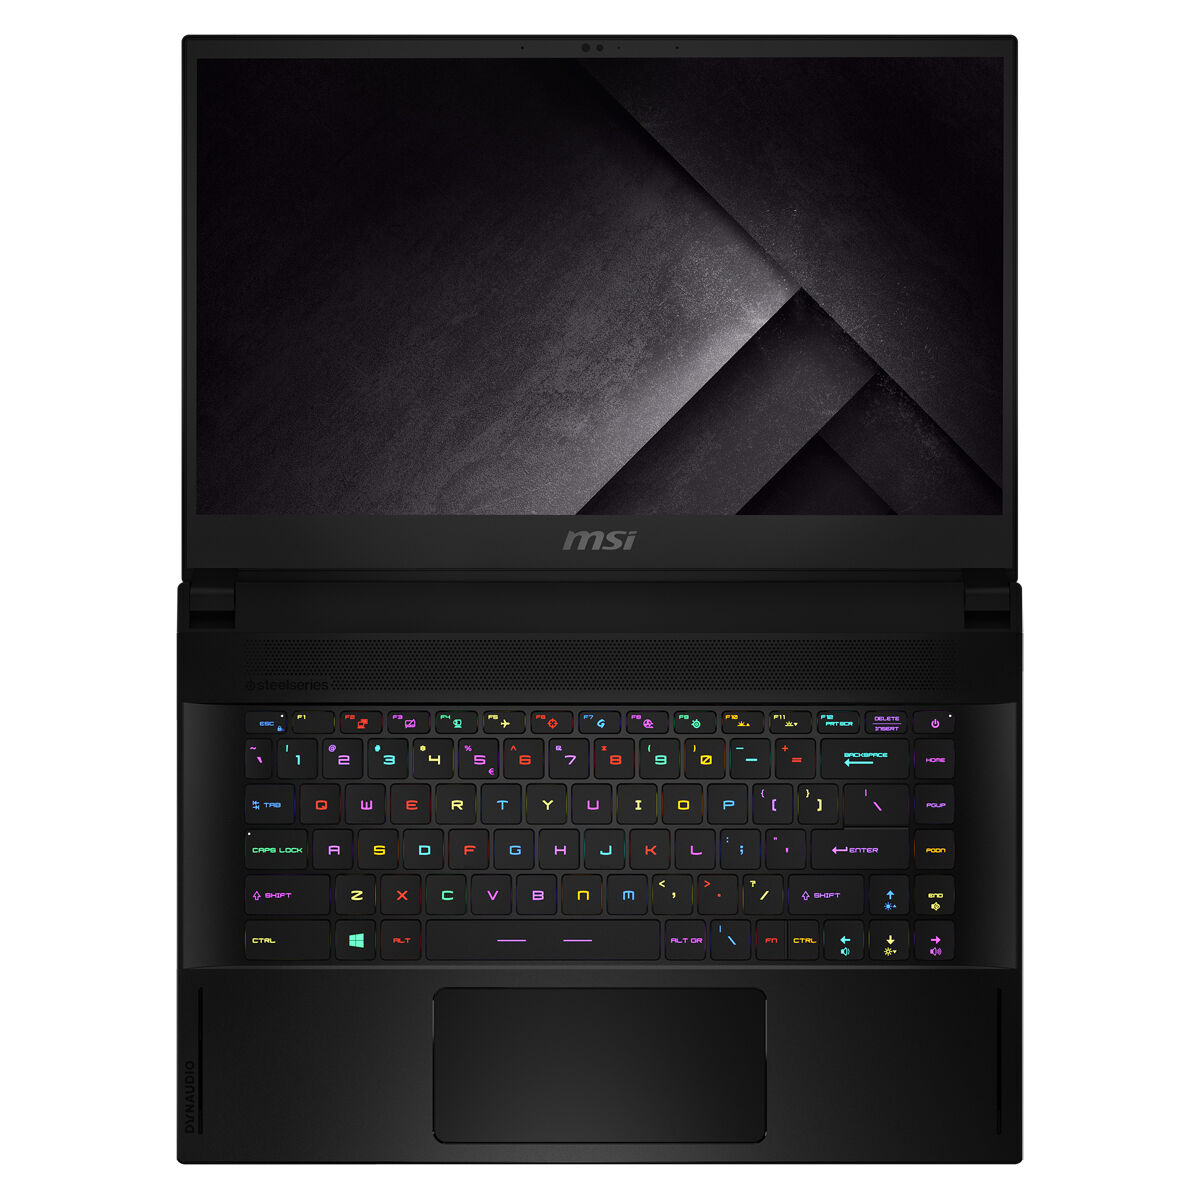
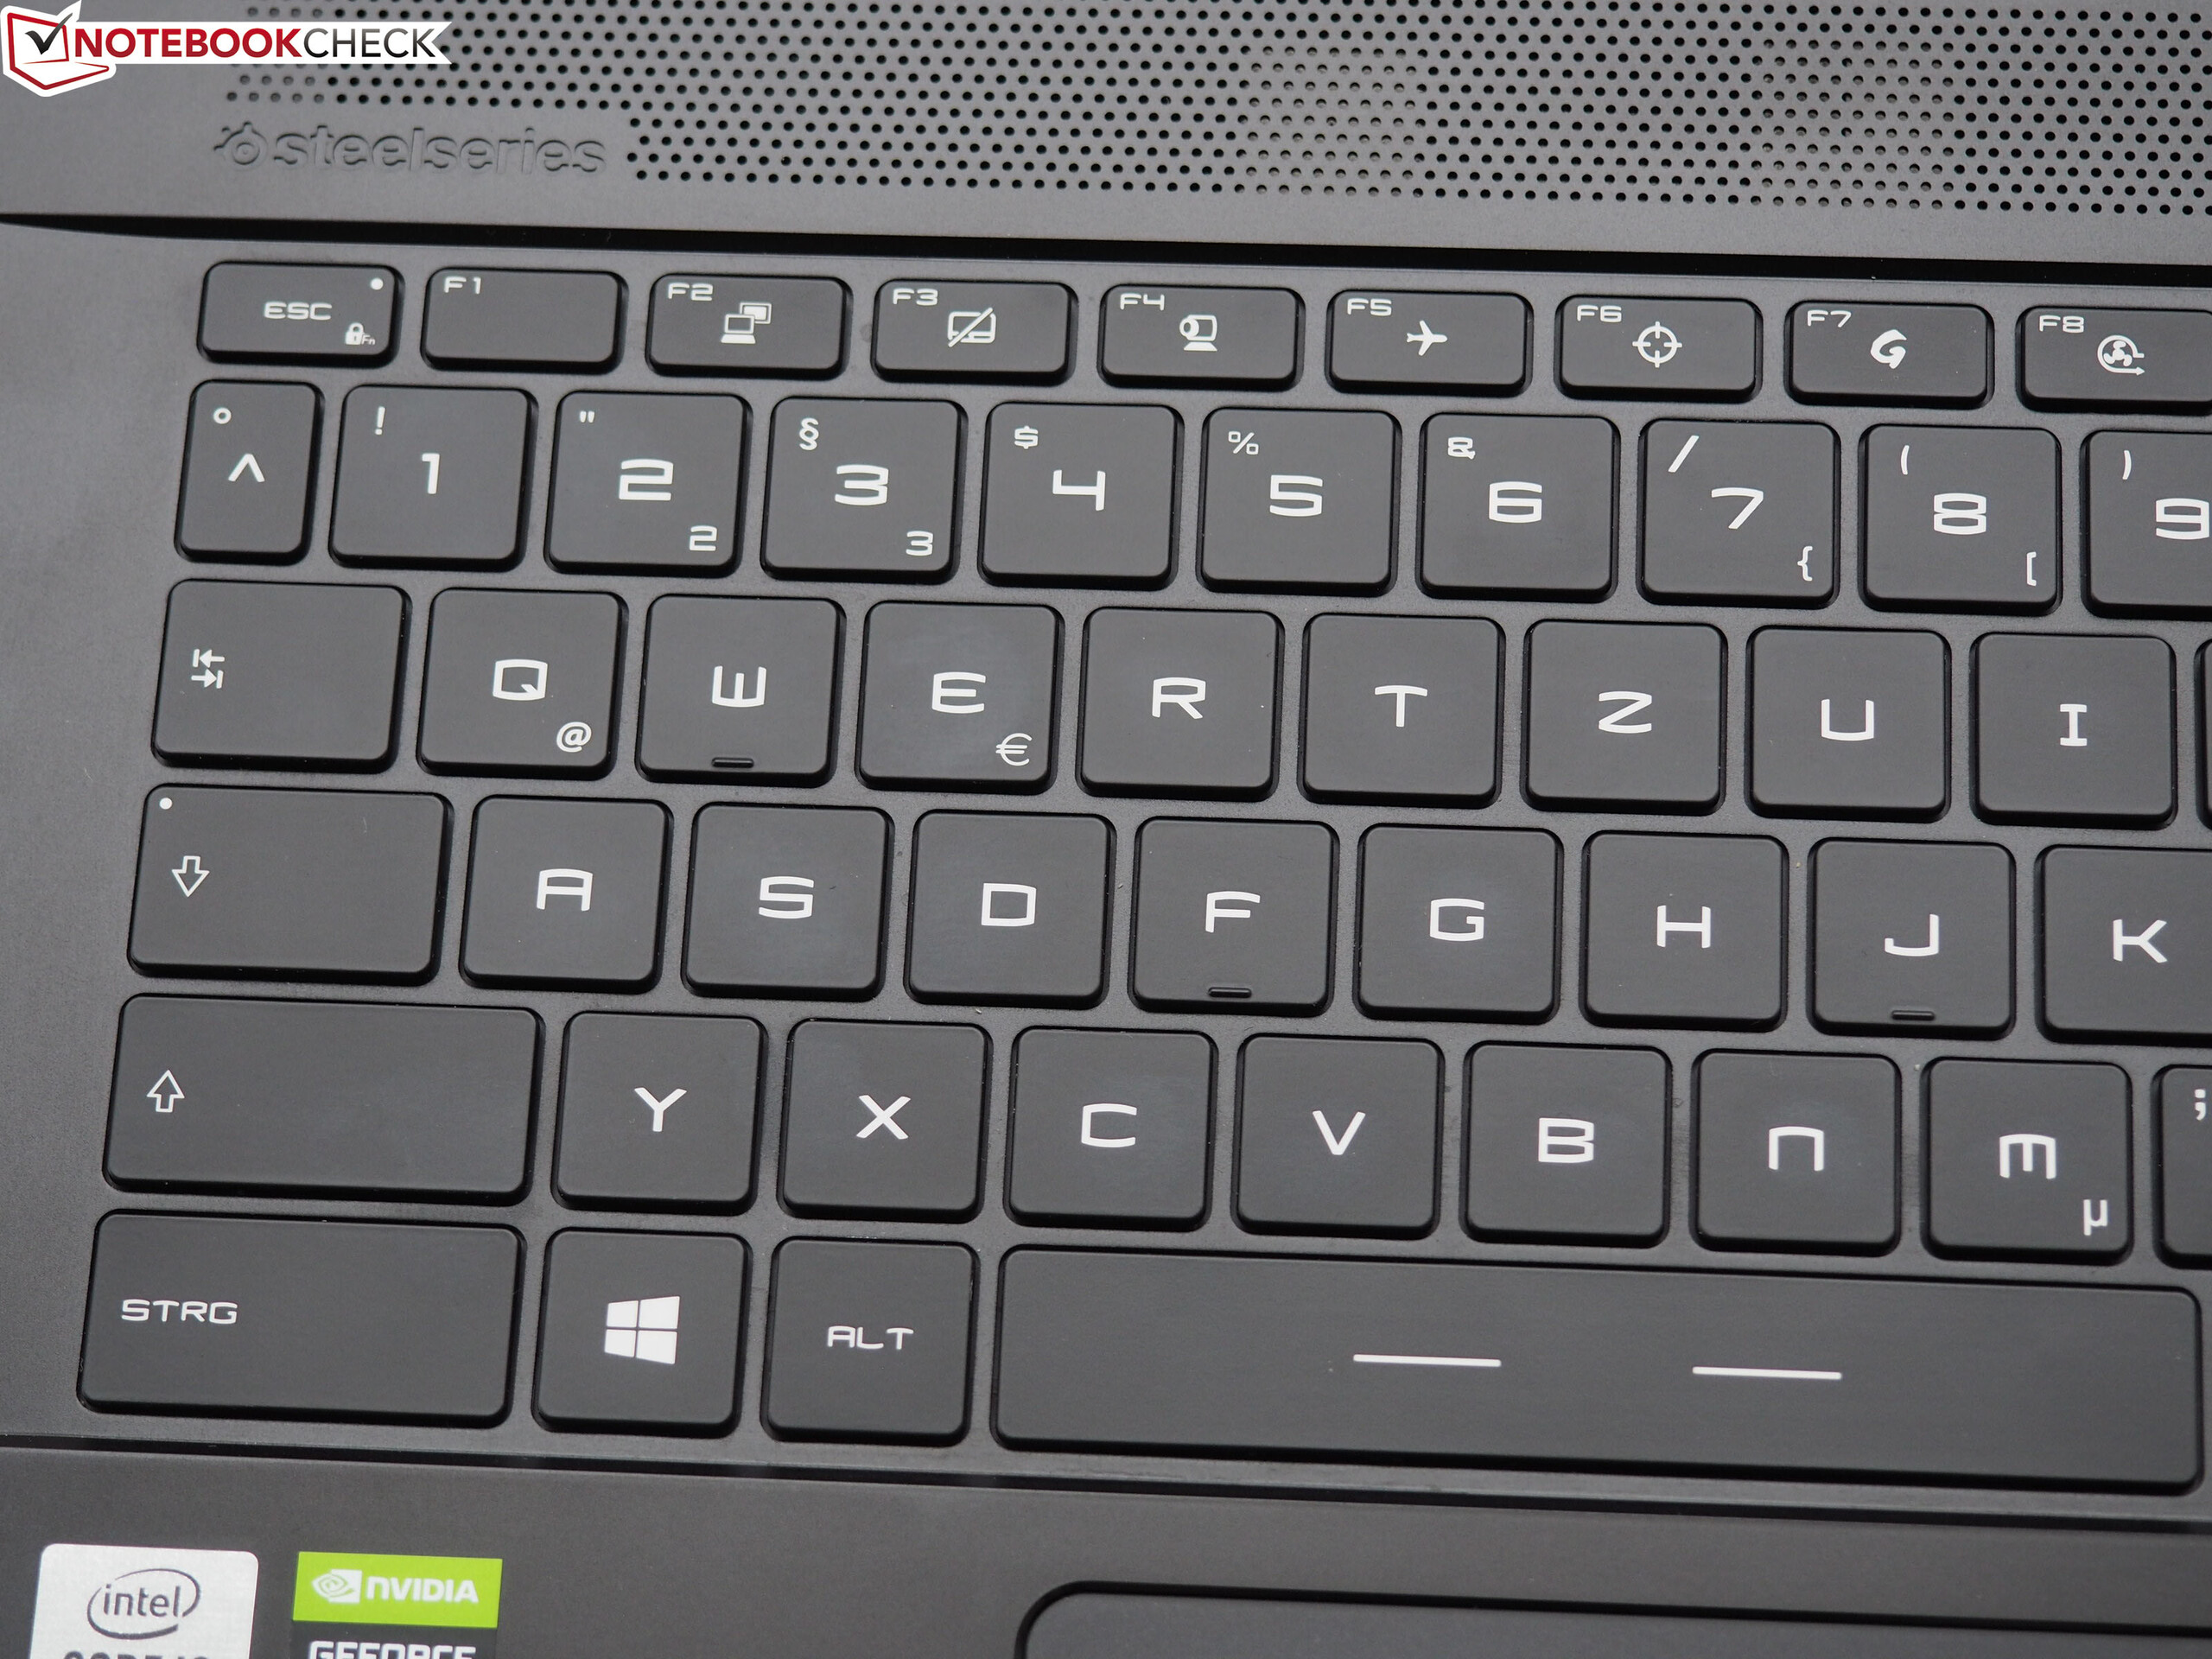
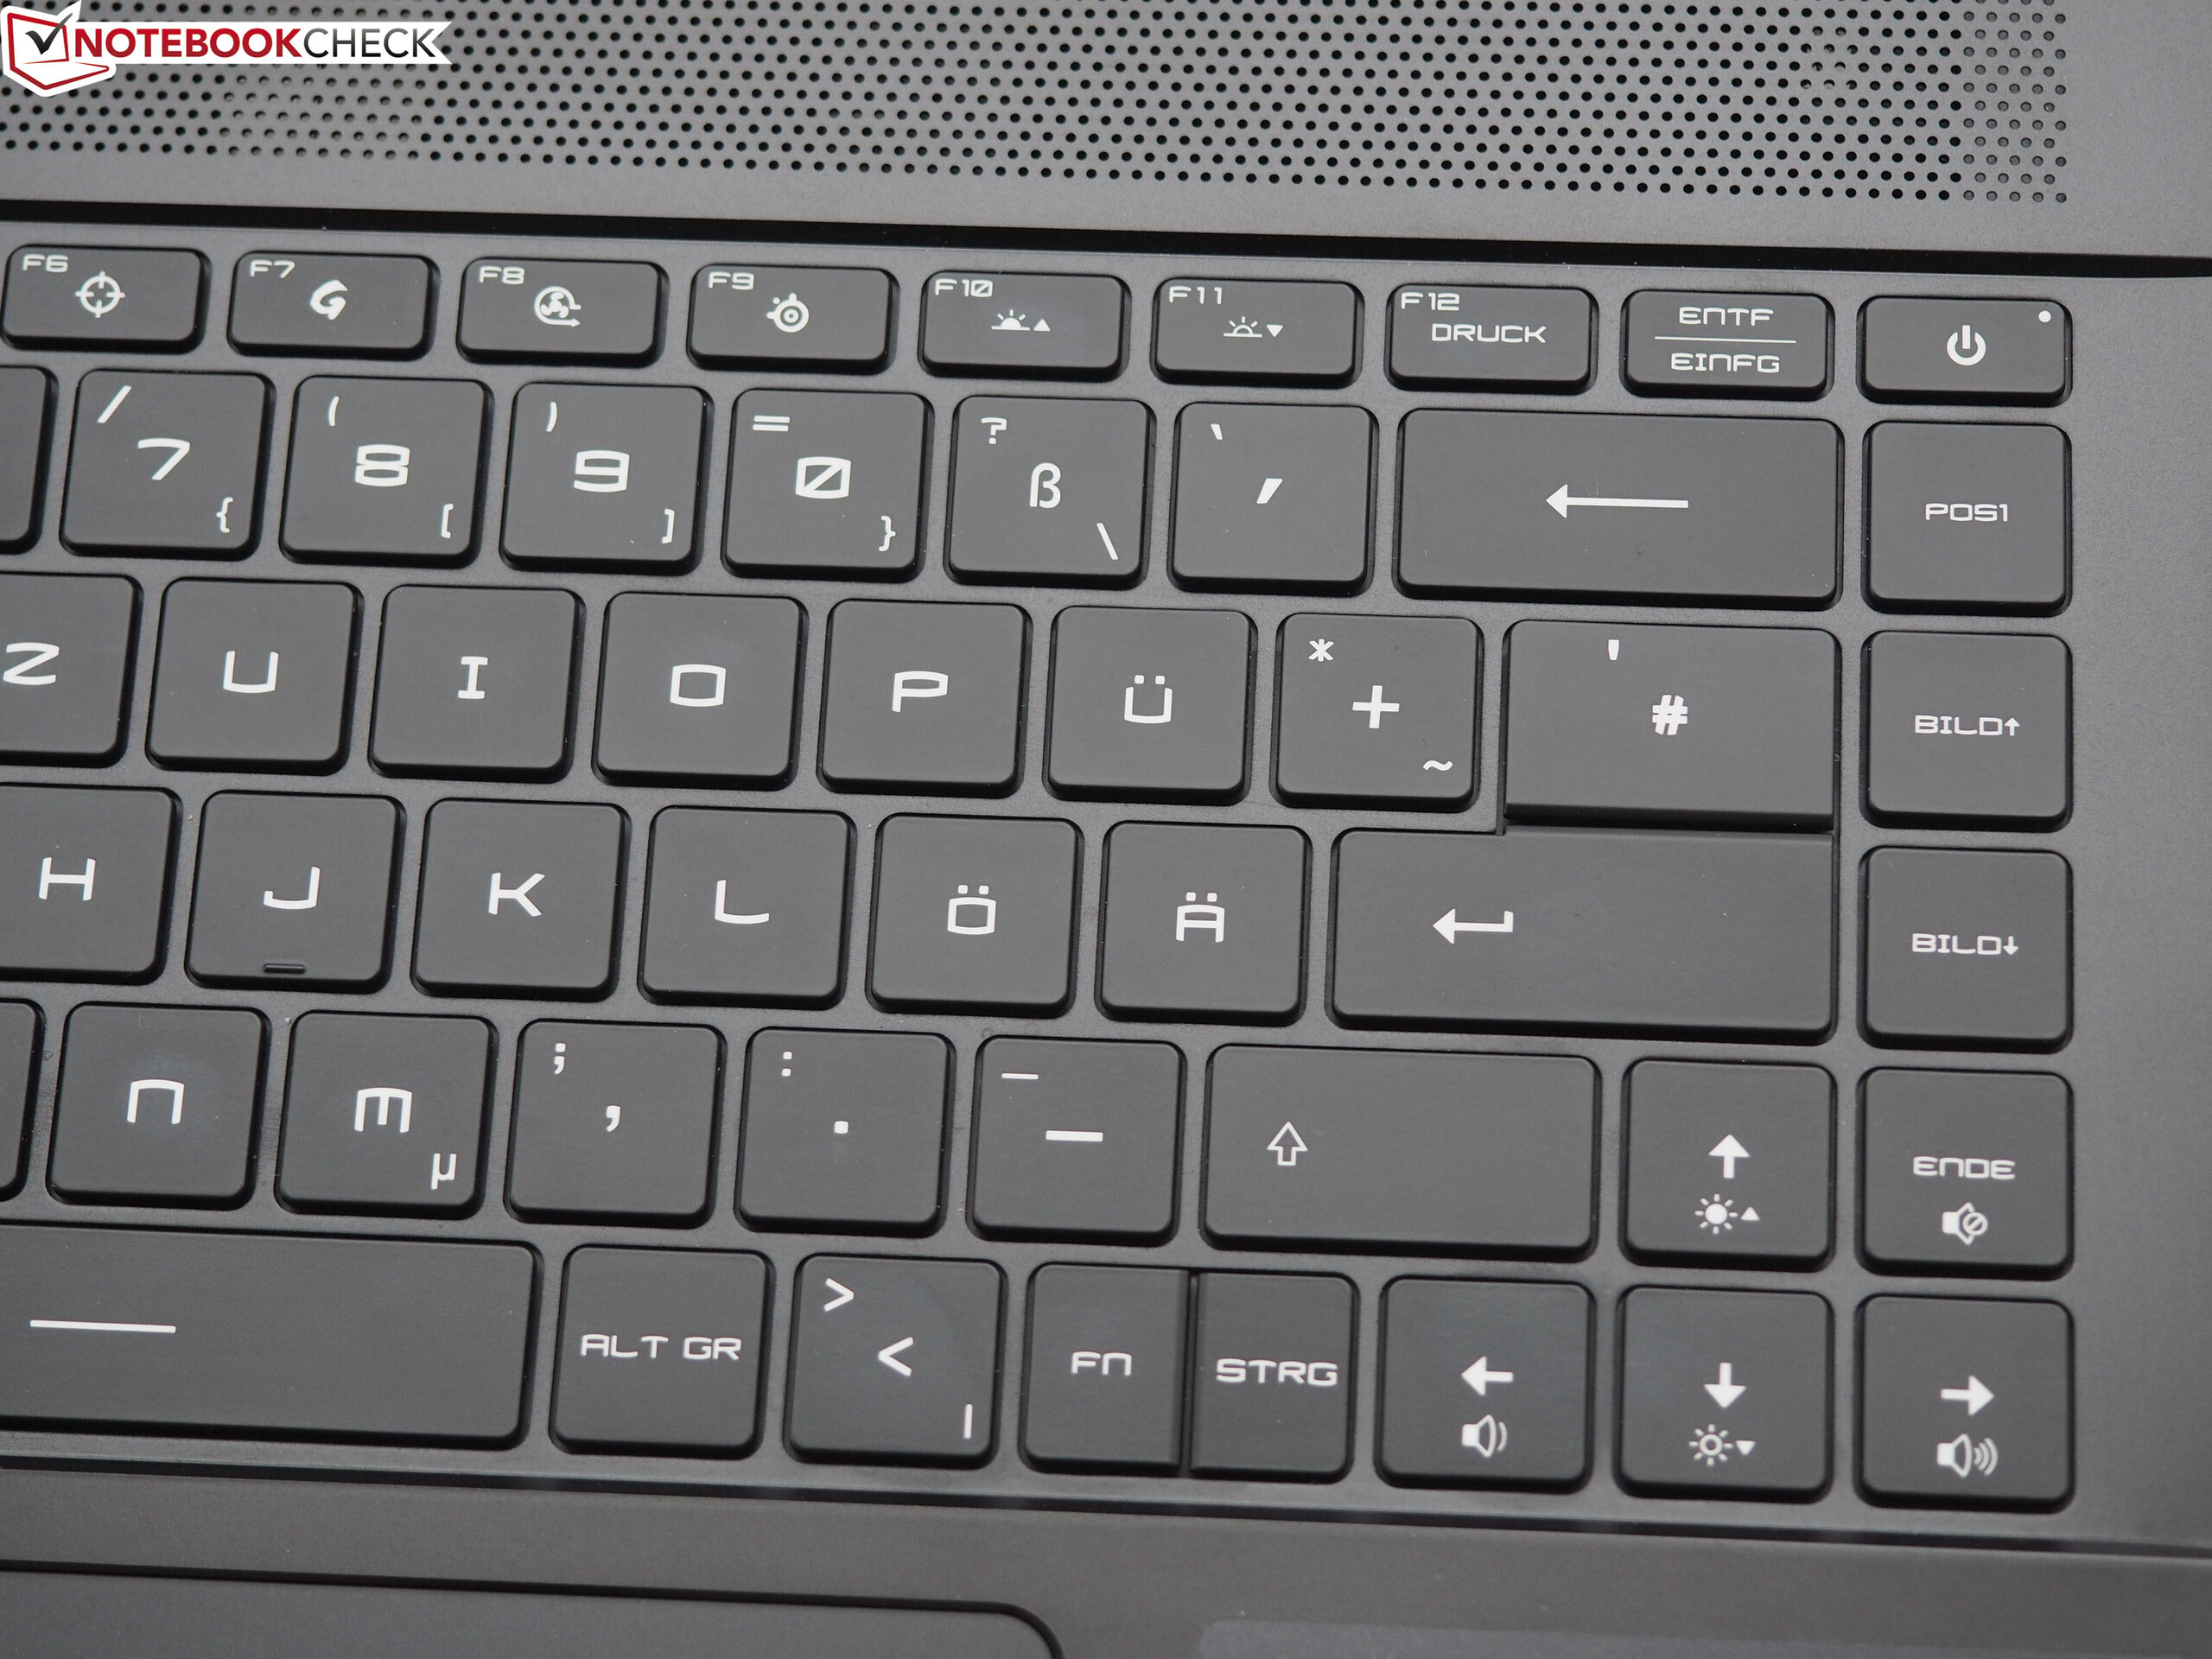
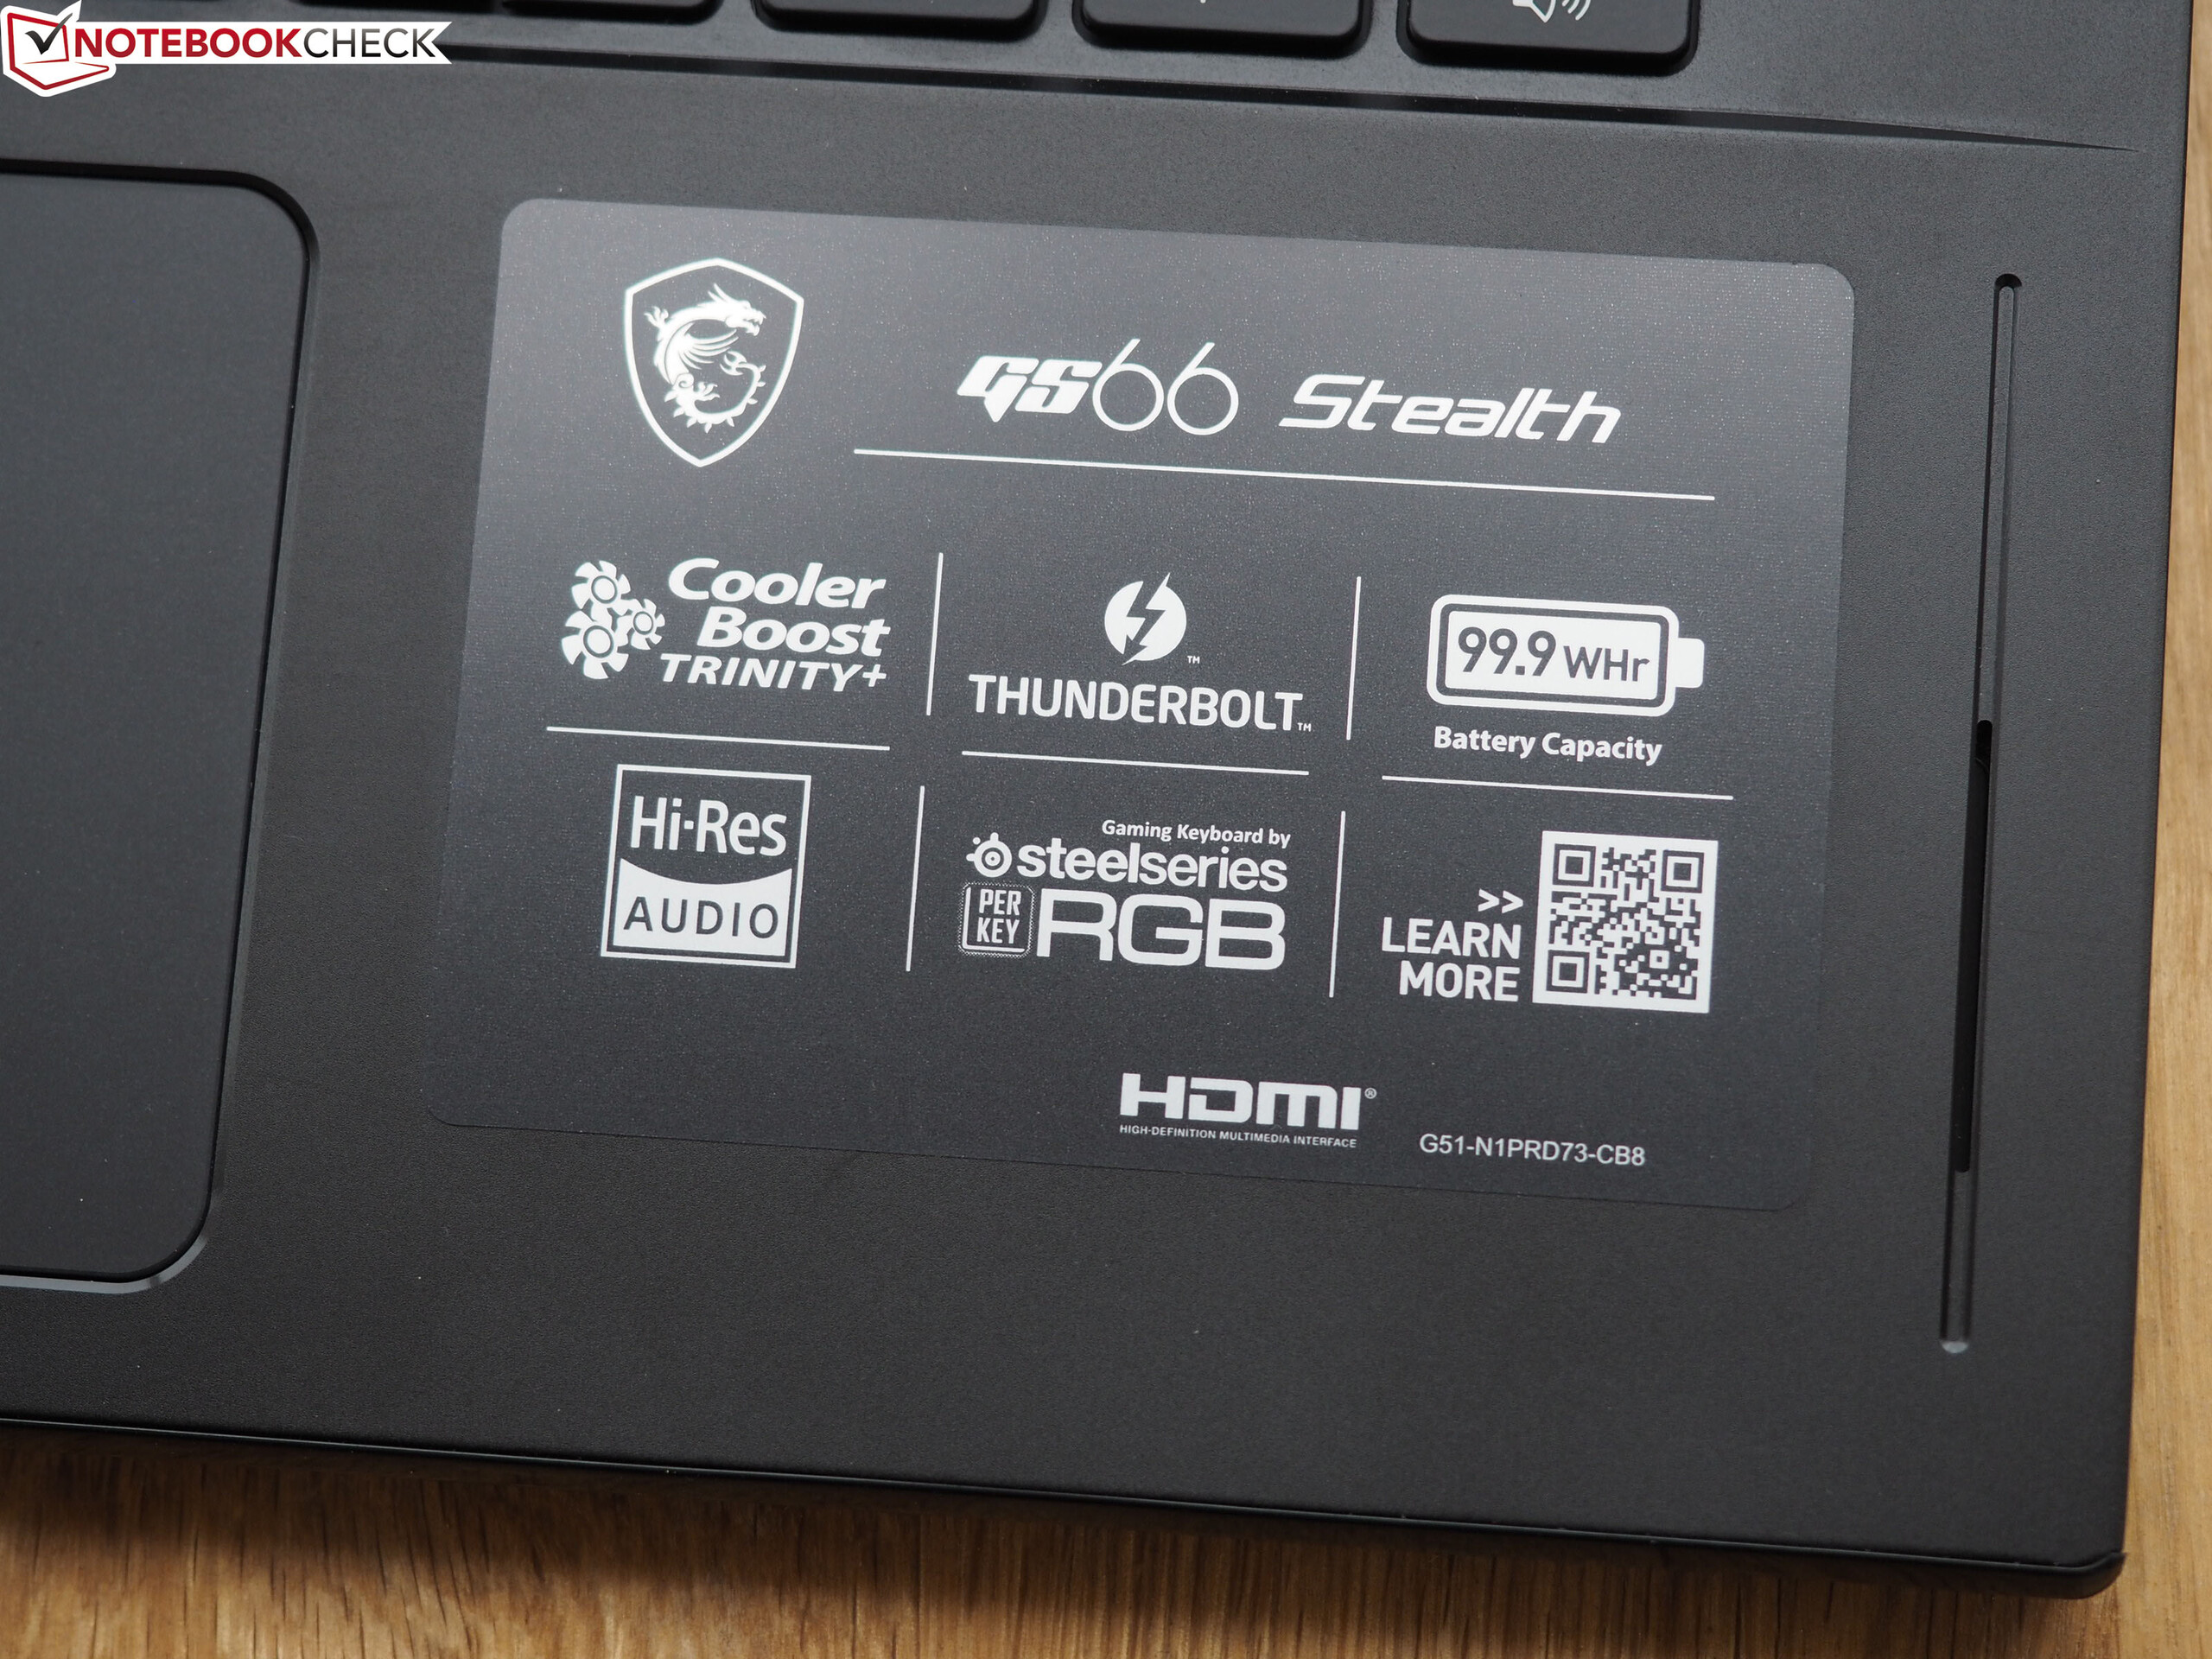
Le clavier chiclet (RVB) s'avère adapté à un usage régulier. De plus, la configuration des ports est complète, avec entre autre un port Thunderbolt 3 qui permet la connexion de solutions de docking supplémentaires ou d'une carte graphique externe. Mais la batterie ne peut être chargée via ce port Thunderbolt 3, ni par les ports USB C 3.3 Gen 2 - nous avons essayé avec un adaptateur de 45 W.
L’intégralité de cette critique est disponible en anglais en suivant ce lien.
MSI GS66 Stealth 10SE-045
- 08/05/2020 v7 (old)
Sascha Mölck
Price comparison
