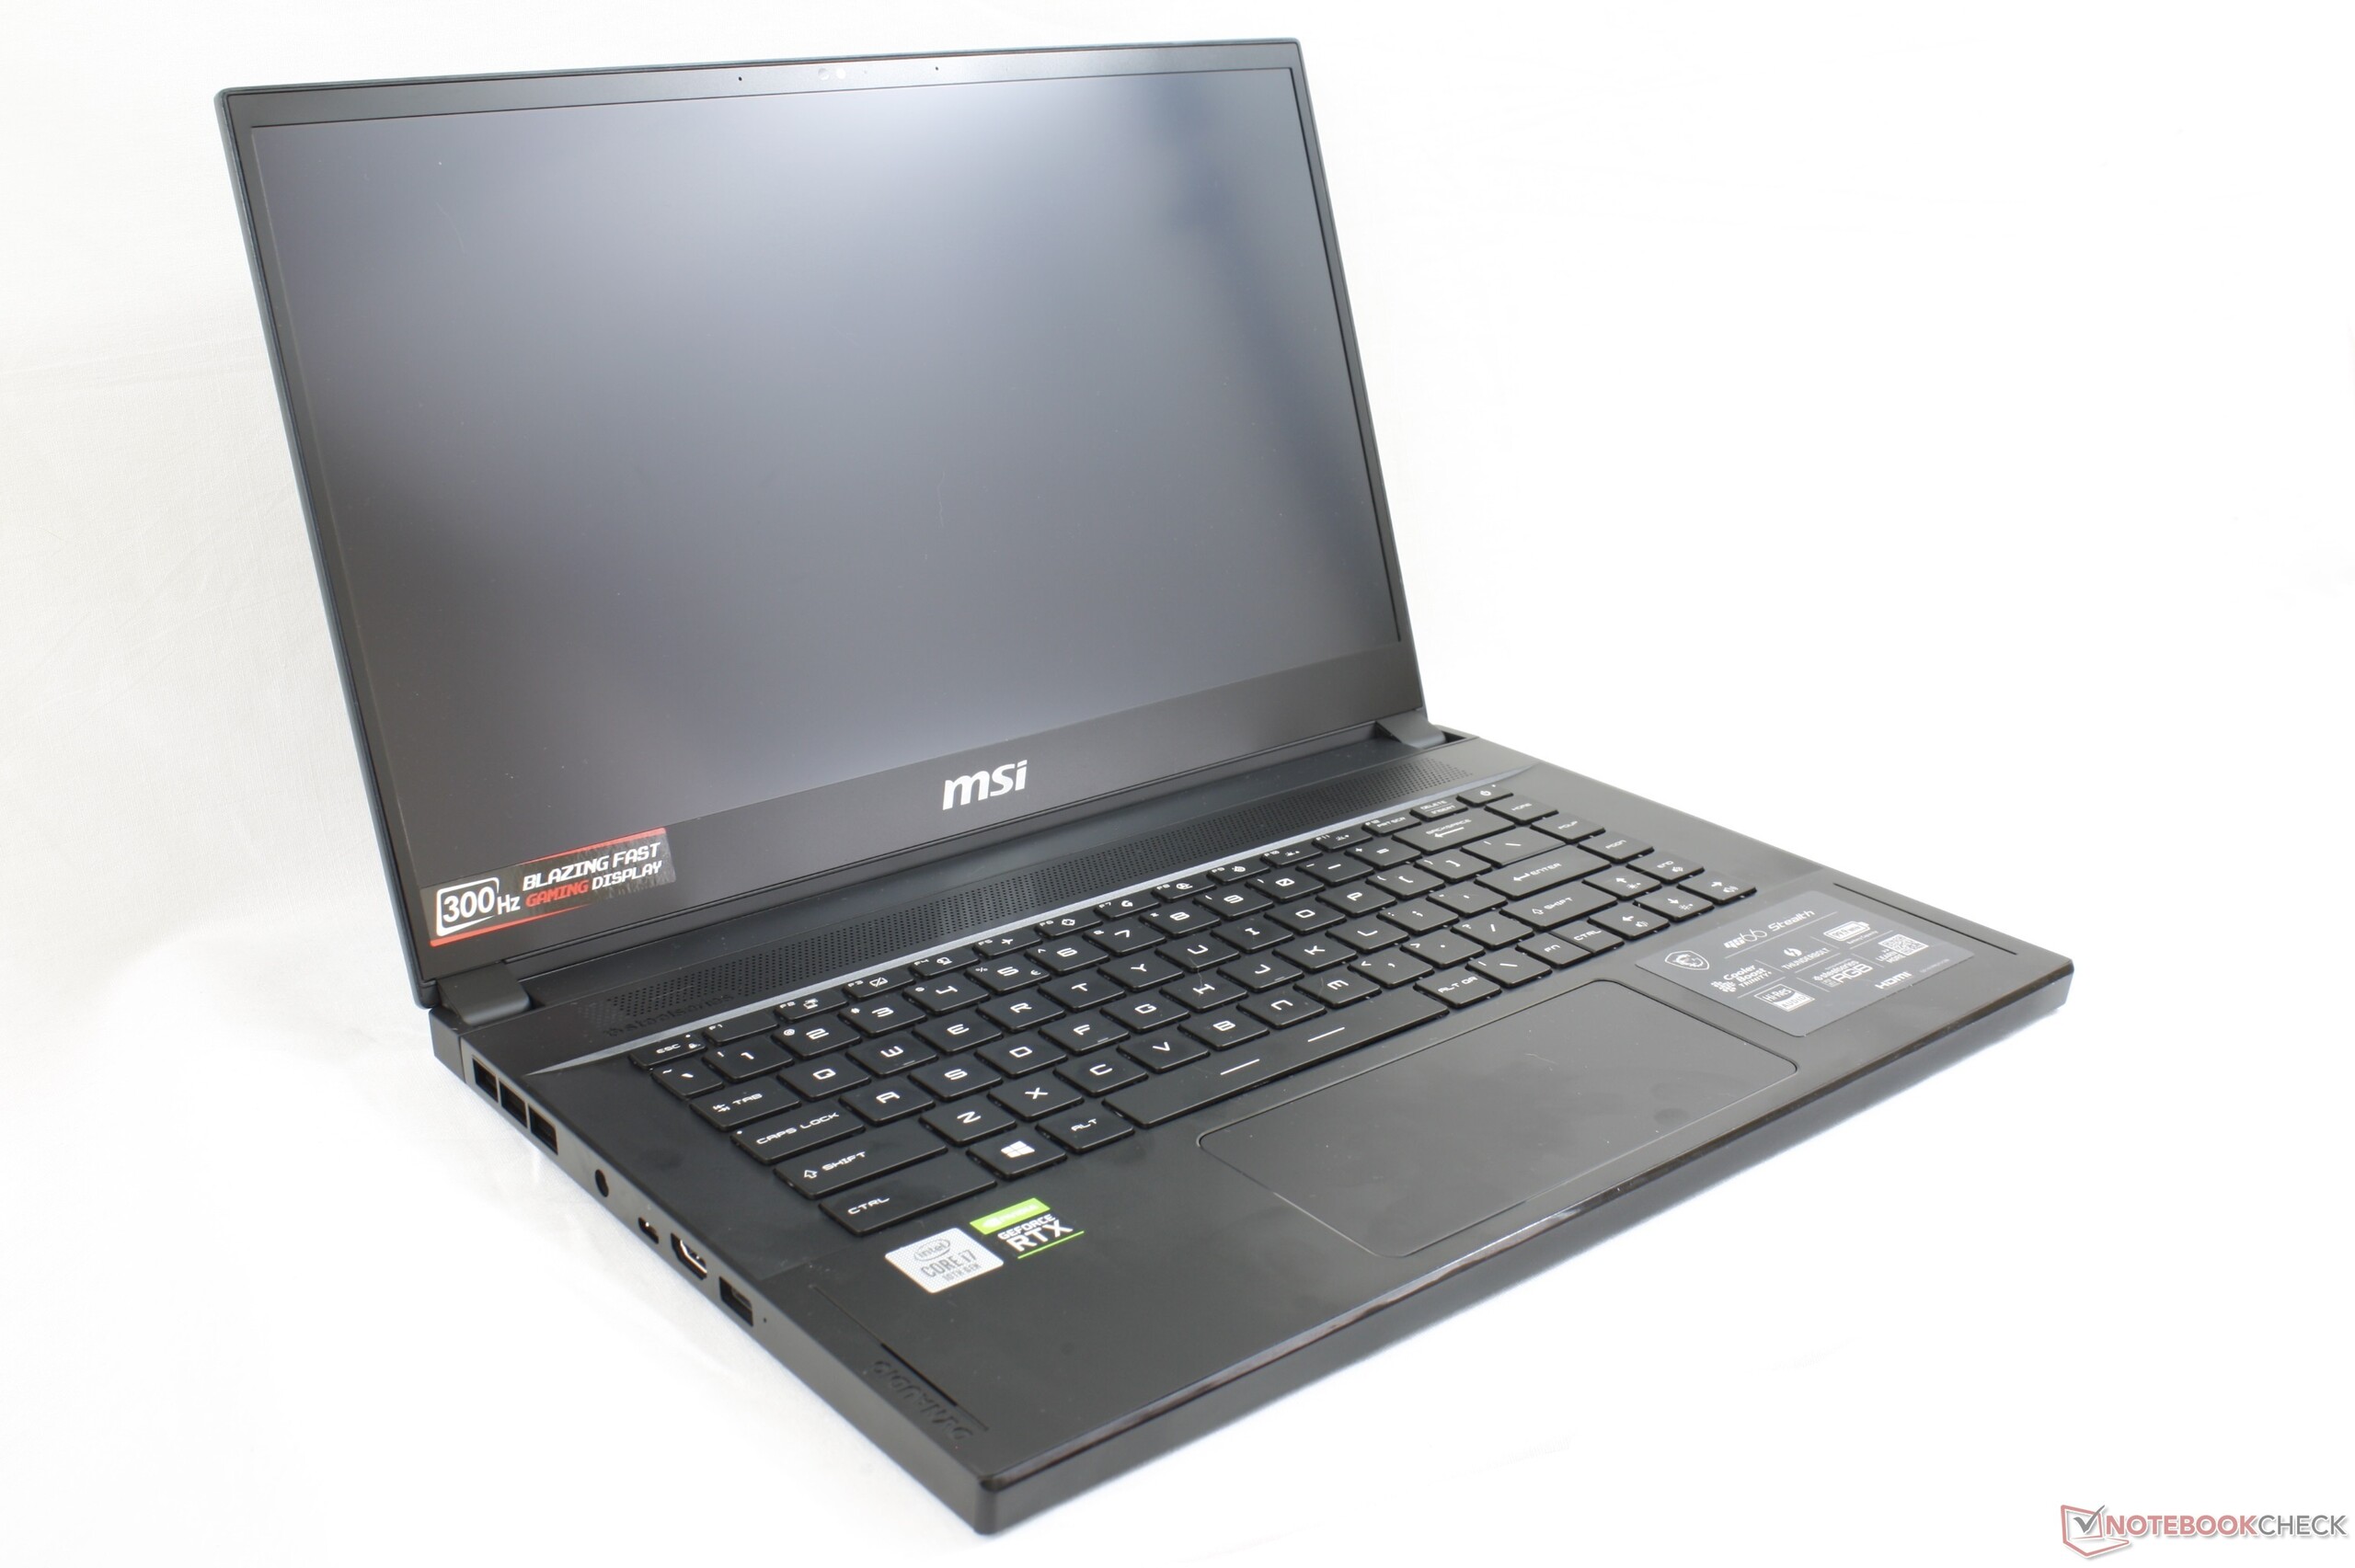
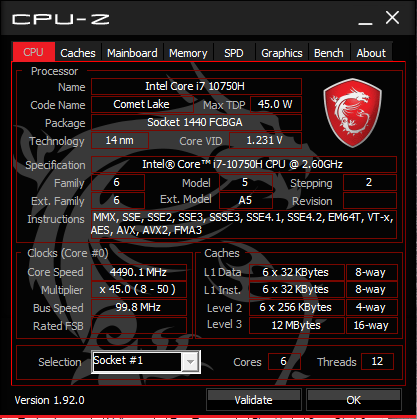
Test du MSI GS66 Stealth 10SGS (i7-10750H, RTX 2080 Super Max-Q, FHD, 300 Hz) : Core i7 ou Core i9 ?
Note | Date | Modèle | Poids | Épaisseur | Taille | Résolution | Prix |
|---|---|---|---|---|---|---|---|
| 84 % v7 (old) | 06/20 | MSI GS66 10SGS i7-10750H, GeForce RTX 2080 Super Max-Q | 2.2 kg | 20 mm | 15.60" | 1920x1080 | |
| 81.3 % v7 (old) | 06/19 | Asus Zephyrus S GX502GW i7-9750H, GeForce RTX 2070 Mobile | 2.1 kg | 19 mm | 15.60" | 1920x1080 | |
| 88.8 % v6 (old) | 06/19 | Razer Blade 15 RTX 2080 Max-Q i7-9750H, GeForce RTX 2080 Max-Q | 2.2 kg | 17.8 mm | 15.60" | 1920x1080 | |
| 84.8 % v7 (old) | 10/19 | Lenovo Legion Y740-15ICHg i7-9750H, GeForce RTX 2070 Max-Q | 2.3 kg | 25 mm | 15.60" | 1920x1080 | |
| 83.3 % v7 (old) | 03/20 | Schenker XMG Pro 15 i7-9750H, GeForce RTX 2070 Mobile | 2.5 kg | 30 mm | 15.60" | 1920x1080 |
| Networking | |
| iperf3 transmit AX12 | |
| Asus ZenBook Duo UX481FL | |
| MSI GP65 10SFK-047US | |
| MSI GS66 Stealth 10SFS | |
| MSI GS66 10SGS | |
| MSI GF75 Thin 10SCXR | |
| iperf3 receive AX12 | |
| Asus ZenBook Duo UX481FL | |
| MSI GS66 10SGS | |
| MSI GS66 Stealth 10SFS | |
| MSI GP65 10SFK-047US | |
| MSI GF75 Thin 10SCXR | |


| |||||||||||||||||||||||||
Homogénéité de la luminosité: 92 %
Valeur mesurée au centre, sur batterie: 339.4 cd/m²
Contraste: 1414:1 (Valeurs des noirs: 0.24 cd/m²)
ΔE ColorChecker Calman: 1.58 | ∀{0.5-29.43 Ø4.72}
calibrated: 1.47
ΔE Greyscale Calman: 2.3 | ∀{0.09-98 Ø4.97}
99.4% sRGB (Argyll 1.6.3 3D)
64.8% AdobeRGB 1998 (Argyll 1.6.3 3D)
71.1% AdobeRGB 1998 (Argyll 3D)
99.1% sRGB (Argyll 3D)
69.9% Display P3 (Argyll 3D)
Gamma: 2.24
CCT: 6952 K
| MSI GS66 10SGS AU Optronics B156HAN12.0, IPS, 15.6", 1920x1080 | MSI GS65 Stealth 9SG Sharp LQ156M1JW03 (SHP14C5), IPS, 15.6", 1920x1080 | Asus Zephyrus S GX502GW AU Optronics B156HAN08.2 (AUO82ED), IPS, 15.6", 1920x1080 | Razer Blade 15 RTX 2080 Max-Q Sharp LQ156M1JW03 (SHP14C5), IPS, 15.6", 1920x1080 | HP Omen X 2S 15-dg0075cl AU Optronics AUO82ED, IPS, 15.6", 1920x1080 | Lenovo Legion Y740-15ICHg BOE NV156FHM-N4J, IPS, 15.6", 1920x1080 | |
|---|---|---|---|---|---|---|
| Display | -3% | -7% | -3% | -6% | -6% | |
| Display P3 Coverage (%) | 69.9 | 67.6 -3% | 64.9 -7% | 66.9 -4% | 66.2 -5% | 67.7 -3% |
| sRGB Coverage (%) | 99.1 | 97.5 -2% | 91 -8% | 98.1 -1% | 92.3 -7% | 91.6 -8% |
| AdobeRGB 1998 Coverage (%) | 71.1 | 68.9 -3% | 65.9 -7% | 68.5 -4% | 67.2 -5% | 67.1 -6% |
| Response Times | -21% | 24% | -9% | -22% | -35% | |
| Response Time Grey 50% / Grey 80% * (ms) | 11.2 ? | 13.6 ? -21% | 7.2 ? 36% | 12.8 ? -14% | 15.2 ? -36% | 19 ? -70% |
| Response Time Black / White * (ms) | 10 ? | 12 ? -20% | 8.8 ? 12% | 10.4 ? -4% | 10.8 ? -8% | 10 ? -0% |
| PWM Frequency (Hz) | 23260 ? | 23810 ? | ||||
| Screen | -0% | -23% | -6% | -58% | -18% | |
| Brightness middle (cd/m²) | 339.4 | 282.3 -17% | 286 -16% | 293 -14% | 324.8 -4% | 477 41% |
| Brightness (cd/m²) | 331 | 269 -19% | 275 -17% | 270 -18% | 316 -5% | 431 30% |
| Brightness Distribution (%) | 92 | 90 -2% | 90 -2% | 87 -5% | 84 -9% | 84 -9% |
| Black Level * (cd/m²) | 0.24 | 0.32 -33% | 0.37 -54% | 0.29 -21% | 0.26 -8% | 0.175 27% |
| Contrast (:1) | 1414 | 882 -38% | 773 -45% | 1010 -29% | 1249 -12% | 2726 93% |
| Colorchecker dE 2000 * | 1.58 | 1.17 26% | 2.19 -39% | 1.69 -7% | 4.96 -214% | 4.17 -164% |
| Colorchecker dE 2000 max. * | 3.8 | 3.29 13% | 4.4 -16% | 3.37 11% | 8.95 -136% | 6.97 -83% |
| Colorchecker dE 2000 calibrated * | 1.47 | 1.06 28% | 2.27 -54% | 1.24 16% | 3.23 -120% | 2.51 -71% |
| Greyscale dE 2000 * | 2.3 | 1.3 43% | 2.2 4% | 2.3 -0% | 5 -117% | 3.49 -52% |
| Gamma | 2.24 98% | 2.2 100% | 2.41 91% | 2.3 96% | 2.21 100% | 2.5 88% |
| CCT | 6952 93% | 6643 98% | 6405 101% | 6758 96% | 7742 84% | 7076 92% |
| Color Space (Percent of AdobeRGB 1998) (%) | 64.8 | 63.8 -2% | 59 -9% | 63 -3% | 59.8 -8% | 60 -7% |
| Color Space (Percent of sRGB) (%) | 99.4 | 97.5 -2% | 91 -8% | 98.5 -1% | 91.8 -8% | 91 -8% |
| Moyenne finale (programmes/paramètres) | -8% /
-3% | -2% /
-14% | -6% /
-6% | -29% /
-44% | -20% /
-18% |
* ... Moindre est la valeur, meilleures sont les performances
Temps de réponse de l'écran
| ↔ Temps de réponse noir à blanc | ||
|---|---|---|
| 10 ms ... hausse ↗ et chute ↘ combinées | ↗ 5.2 ms hausse | 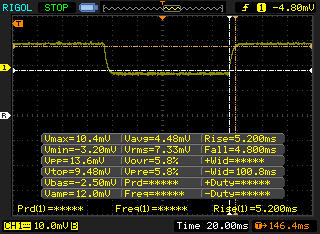 |
| ↘ 4.8 ms chute | ||
| L'écran montre de bons temps de réponse, mais insuffisant pour du jeu compétitif. En comparaison, tous les appareils testés affichent entre 0.1 (minimum) et 240 (maximum) ms. » 27 % des appareils testés affichent de meilleures performances. Cela signifie que les latences relevées sont meilleures que la moyenne (19.8 ms) de tous les appareils testés. | ||
| ↔ Temps de réponse gris 50% à gris 80% | ||
| 11.2 ms ... hausse ↗ et chute ↘ combinées | ↗ 6 ms hausse | 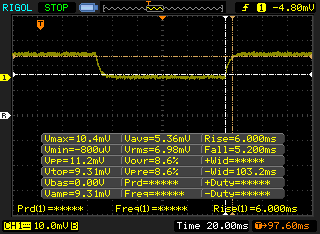 |
| ↘ 5.2 ms chute | ||
| L'écran montre de bons temps de réponse, mais insuffisant pour du jeu compétitif. En comparaison, tous les appareils testés affichent entre 0.165 (minimum) et 636 (maximum) ms. » 25 % des appareils testés affichent de meilleures performances. Cela signifie que les latences relevées sont meilleures que la moyenne (31 ms) de tous les appareils testés. | ||
Scintillement / MLI (Modulation de largeur d'impulsion)
| Scintillement / MLI (Modulation de largeur d'impulsion) non décelé | 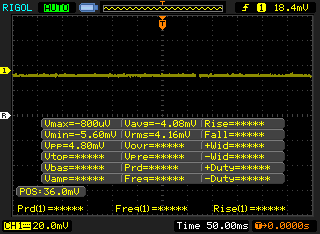 | ||
En comparaison, 52 % des appareils testés n'emploient pas MDI pour assombrir leur écran. Nous avons relevé une moyenne à 7781 (minimum : 5 - maximum : 343500) Hz dans le cas où une MDI était active. | |||
Cinebench R15: CPU Multi 64Bit | CPU Single 64Bit
Blender: v2.79 BMW27 CPU
7-Zip 18.03: 7z b 4 -mmt1 | 7z b 4
Geekbench 5.5: Single-Core | Multi-Core
HWBOT x265 Benchmark v2.2: 4k Preset
LibreOffice : 20 Documents To PDF
R Benchmark 2.5: Overall mean
| Cinebench R20 / CPU (Multi Core) | |
| Asus Zephyrus G14 GA401IV | |
| Gigabyte Aero 15 OLED XB-8DE51B0SP | |
| MSI GS66 Stealth 10SFS | |
| MSI GE65 Raider 9SF-049US | |
| MSI GS66 10SGS | |
| Medion Erazer X15805 | |
| Moyenne Intel Core i7-10750H (1749 - 3325, n=43) | |
| Moyenne Intel Core i7-9750H (2017 - 3133, n=55) | |
| Schenker XMG Pro 15 | |
| MSI GE63 Raider 8SG | |
| MSI GF75 Thin 10SCXR | |
| MSI GF63 Thin 9SC | |
| Cinebench R20 / CPU (Single Core) | |
| Gigabyte Aero 15 OLED XB-8DE51B0SP | |
| Medion Erazer X15805 | |
| Asus Zephyrus G14 GA401IV | |
| MSI GS66 Stealth 10SFS | |
| MSI GE65 Raider 9SF-049US | |
| Moyenne Intel Core i7-10750H (431 - 504, n=43) | |
| MSI GS66 10SGS | |
| Moyenne Intel Core i7-9750H (416 - 486, n=55) | |
| MSI GF75 Thin 10SCXR | |
| Schenker XMG Pro 15 | |
| MSI GF63 Thin 9SC | |
| MSI GE63 Raider 8SG | |
| Cinebench R15 / CPU Multi 64Bit | |
| Asus Zephyrus G14 GA401IV | |
| Gigabyte Aero 15 OLED XB-8DE51B0SP | |
| MSI GS66 Stealth 10SFS | |
| MSI GE65 Raider 9SF-049US | |
| MSI GS66 10SGS | |
| Moyenne Intel Core i7-10750H (804 - 1418, n=50) | |
| Medion Erazer X15805 | |
| Moyenne Intel Core i7-9750H (952 - 1306, n=85) | |
| Schenker XMG Pro 15 | |
| MSI GE63 Raider 8SG | |
| MSI GF75 Thin 10SCXR | |
| MSI GF63 Thin 9SC | |
| Cinebench R15 / CPU Single 64Bit | |
| Gigabyte Aero 15 OLED XB-8DE51B0SP | |
| Medion Erazer X15805 | |
| MSI GS66 Stealth 10SFS | |
| MSI GE65 Raider 9SF-049US | |
| Moyenne Intel Core i7-10750H (184 - 213, n=45) | |
| Asus Zephyrus G14 GA401IV | |
| MSI GS66 10SGS | |
| Moyenne Intel Core i7-9750H (170 - 194, n=82) | |
| MSI GF75 Thin 10SCXR | |
| Schenker XMG Pro 15 | |
| MSI GF63 Thin 9SC | |
| MSI GE63 Raider 8SG | |
| Blender / v2.79 BMW27 CPU | |
| MSI GF75 Thin 10SCXR | |
| Schenker XMG Pro 15 | |
| Moyenne Intel Core i7-9750H (342 - 495, n=21) | |
| Moyenne Intel Core i7-10750H (322 - 587, n=43) | |
| MSI GS66 10SGS | |
| Asus Zephyrus G14 GA401IV | |
| MSI GS66 Stealth 10SFS | |
| Gigabyte Aero 15 OLED XB-8DE51B0SP | |
| 7-Zip 18.03 / 7z b 4 -mmt1 | |
| Gigabyte Aero 15 OLED XB-8DE51B0SP | |
| MSI GS66 Stealth 10SFS | |
| Moyenne Intel Core i7-10750H (4504 - 5470, n=43) | |
| MSI GS66 10SGS | |
| Moyenne Intel Core i7-9750H (4580 - 5090, n=21) | |
| MSI GF75 Thin 10SCXR | |
| Asus Zephyrus G14 GA401IV | |
| Schenker XMG Pro 15 | |
| 7-Zip 18.03 / 7z b 4 | |
| Asus Zephyrus G14 GA401IV | |
| Gigabyte Aero 15 OLED XB-8DE51B0SP | |
| MSI GS66 Stealth 10SFS | |
| MSI GS66 10SGS | |
| Moyenne Intel Core i7-10750H (26040 - 37345, n=43) | |
| Schenker XMG Pro 15 | |
| Moyenne Intel Core i7-9750H (28512 - 35174, n=21) | |
| MSI GF75 Thin 10SCXR | |
| Geekbench 5.5 / Single-Core | |
| Gigabyte Aero 15 OLED XB-8DE51B0SP | |
| MSI GS66 Stealth 10SFS | |
| Moyenne Intel Core i7-10750H (1114 - 1333, n=43) | |
| Asus Zephyrus G14 GA401IV | |
| MSI GS66 10SGS | |
| Moyenne Intel Core i7-9750H (1117 - 1251, n=13) | |
| MSI GF75 Thin 10SCXR | |
| Schenker XMG Pro 15 | |
| Geekbench 5.5 / Multi-Core | |
| Gigabyte Aero 15 OLED XB-8DE51B0SP | |
| Asus Zephyrus G14 GA401IV | |
| MSI GS66 Stealth 10SFS | |
| MSI GS66 10SGS | |
| Moyenne Intel Core i7-10750H (4443 - 6674, n=43) | |
| Schenker XMG Pro 15 | |
| Moyenne Intel Core i7-9750H (4859 - 6262, n=13) | |
| MSI GF75 Thin 10SCXR | |
| HWBOT x265 Benchmark v2.2 / 4k Preset | |
| Gigabyte Aero 15 OLED XB-8DE51B0SP | |
| MSI GS66 Stealth 10SFS | |
| Asus Zephyrus G14 GA401IV | |
| MSI GS66 10SGS | |
| Moyenne Intel Core i7-10750H (5.54 - 11.6, n=43) | |
| Schenker XMG Pro 15 | |
| Moyenne Intel Core i7-9750H (7.1 - 10.7, n=21) | |
| MSI GF75 Thin 10SCXR | |
| LibreOffice / 20 Documents To PDF | |
| Moyenne Intel Core i7-9750H (54.5 - 64.7, n=9) | |
| MSI GF75 Thin 10SCXR | |
| MSI GS66 10SGS | |
| Moyenne Intel Core i7-10750H (43.1 - 99.2, n=43) | |
| MSI GS66 Stealth 10SFS | |
| Gigabyte Aero 15 OLED XB-8DE51B0SP | |
| R Benchmark 2.5 / Overall mean | |
| MSI GF75 Thin 10SCXR | |
| Schenker XMG Pro 15 | |
| Moyenne Intel Core i7-9750H (0.608 - 0.695, n=14) | |
| MSI GS66 10SGS | |
| Moyenne Intel Core i7-10750H (0.578 - 0.708, n=42) | |
| MSI GS66 Stealth 10SFS | |
| Gigabyte Aero 15 OLED XB-8DE51B0SP | |
* ... Moindre est la valeur, meilleures sont les performances
| PCMark 8 | |
| Home Score Accelerated v2 | |
| Lenovo Legion Y740-15ICHg | |
| MSI GS66 10SGS | |
| MSI GS65 Stealth 9SG | |
| Razer Blade 15 RTX 2080 Max-Q | |
| Work Score Accelerated v2 | |
| MSI GS66 10SGS | |
| Lenovo Legion Y740-15ICHg | |
| MSI GS65 Stealth 9SG | |
| Razer Blade 15 RTX 2080 Max-Q | |
| PCMark 8 Home Score Accelerated v2 | 4579 points | |
| PCMark 8 Work Score Accelerated v2 | 6219 points | |
| PCMark 10 Score | 6154 points | |
Aide | ||
| DPC Latencies / LatencyMon - interrupt to process latency (max), Web, Youtube, Prime95 | |
| MSI GS66 10SGS | |
* ... Moindre est la valeur, meilleures sont les performances
| MSI GS66 10SGS Samsung SSD PM981 MZVLB512HAJQ | MSI GS65 Stealth 9SG Samsung SSD PM981 MZVLB512HAJQ | Asus Zephyrus S GX502GW 2x Intel SSD 660p SSDPEKNW512G8 (RAID 0) | Razer Blade 15 RTX 2080 Max-Q Samsung SSD PM981 MZVLB512HAJQ | Lenovo Legion Y740-15ICHg WDC PC SN520 SDAPMUW-128G | MSI GS66 Stealth 10SFS Samsung SSD PM981 MZVLB1T0HALR | |
|---|---|---|---|---|---|---|
| AS SSD | 9% | -6% | 3% | -49% | 9% | |
| Seq Read (MB/s) | 1086 | 2005 85% | 2506 131% | 1832 69% | 1372 26% | 1065 -2% |
| Seq Write (MB/s) | 1901 | 1580 -17% | 1712 -10% | 1864 -2% | 746 -61% | 2360 24% |
| 4K Read (MB/s) | 51 | 49.33 -3% | 48.32 -5% | 52.1 2% | 35.42 -31% | 48.09 -6% |
| 4K Write (MB/s) | 117.3 | 103.8 -12% | 103.6 -12% | 108.3 -8% | 99.9 -15% | 110.7 -6% |
| 4K-64 Read (MB/s) | 1503 | 1241 -17% | 624 -58% | 1159 -23% | 302.1 -80% | 1635 9% |
| 4K-64 Write (MB/s) | 1721 | 1730 1% | 1253 -27% | 1807 5% | 191.4 -89% | 1829 6% |
| Access Time Read * (ms) | 0.059 | 0.054 8% | 0.08 -36% | 0.05 15% | 0.132 -124% | 0.071 -20% |
| Access Time Write * (ms) | 0.1 | 0.036 64% | 0.04 60% | 0.034 66% | 0.037 63% | 0.034 66% |
| Score Read (Points) | 1662 | 1490 -10% | 923 -44% | 1394 -16% | 475 -71% | 1790 8% |
| Score Write (Points) | 2029 | 1991 -2% | 1528 -25% | 2102 4% | 366 -82% | 2176 7% |
| Score Total (Points) | 4588 | 4230 -8% | 2896 -37% | 4221 -8% | 1065 -77% | 4950 8% |
| Copy ISO MB/s (MB/s) | 2155 | 3025 40% | 2083 -3% | 1062 -51% | ||
| Copy Program MB/s (MB/s) | 715 | 713 0% | 496.5 -31% | 426 -40% | ||
| Copy Game MB/s (MB/s) | 1506 | 1554 3% | 977 -35% | 650 -57% | ||
| CrystalDiskMark 5.2 / 6 | -7% | -4% | -3% | -41% | 6% | |
| Write 4K (MB/s) | 132.5 | 91.3 -31% | 97 -27% | 137.2 4% | 134.2 1% | 131.3 -1% |
| Read 4K (MB/s) | 45.03 | 40.73 -10% | 49.58 10% | 46.82 4% | 37.72 -16% | 45.84 2% |
| Write Seq (MB/s) | 1987 | 1915 -4% | 1838 -7% | 1221 -39% | 389.2 -80% | 2370 19% |
| Read Seq (MB/s) | 1434 | 2051 43% | 2421 69% | 1217 -15% | 1030 -28% | 1509 5% |
| Write 4K Q32T1 (MB/s) | 467.5 | 308.3 -34% | 326.9 -30% | 527 13% | 238.9 -49% | 481.5 3% |
| Read 4K Q32T1 (MB/s) | 536 | 417.4 -22% | 372.9 -30% | 614 15% | 343.9 -36% | 560 4% |
| Write Seq Q32T1 (MB/s) | 2003 | 1922 -4% | 1894 -5% | 1986 -1% | 789 -61% | 2392 19% |
| Read Seq Q32T1 (MB/s) | 3306 | 3395 3% | 2828 -14% | 3234 -2% | 1502 -55% | 3232 -2% |
| Write 4K Q8T8 (MB/s) | 293.4 | |||||
| Read 4K Q8T8 (MB/s) | 405.8 | |||||
| Moyenne finale (programmes/paramètres) | 1% /
3% | -5% /
-5% | 0% /
1% | -45% /
-46% | 8% /
8% |
* ... Moindre est la valeur, meilleures sont les performances

Disk Throttling: DiskSpd Read Loop, Queue Depth 8
| 3DMark 11 Performance | 21793 points | |
| 3DMark Cloud Gate Standard Score | 39597 points | |
| 3DMark Fire Strike Score | 17585 points | |
| 3DMark Time Spy Score | 7475 points | |
Aide | ||
| The Witcher 3 | |
| 1920x1080 Ultra Graphics & Postprocessing (HBAO+) | |
| Nvidia GeForce RTX 2080 Super | |
| MSI GE75 9SG | |
| Moyenne NVIDIA GeForce RTX 2080 Super Max-Q (74.3 - 96, n=11) | |
| MSI GP65 10SFK-047US | |
| Alienware m17 R2 P41E | |
| MSI GS66 10SGS | |
| Aorus 17G XB | |
| MSI GS66 Stealth 10SFS | |
| Walmart EVOO Gaming 17 | |
| Asus Zephyrus G14 GA401IV | |
| 1920x1080 High Graphics & Postprocessing (Nvidia HairWorks Off) | |
| Nvidia GeForce RTX 2080 Super | |
| MSI GE75 9SG | |
| MSI GP65 10SFK-047US | |
| Alienware m17 R2 P41E | |
| Moyenne NVIDIA GeForce RTX 2080 Super Max-Q (138 - 160, n=7) | |
| MSI GS66 10SGS | |
| Aorus 17G XB | |
| Walmart EVOO Gaming 17 | |
| MSI GS66 Stealth 10SFS | |
| Asus Zephyrus G14 GA401IV | |
| Borderlands 3 | |
| 1920x1080 Badass Overall Quality (DX11) | |
| Moyenne NVIDIA GeForce RTX 2080 Super Max-Q (62.5 - 71.6, n=4) | |
| MSI GS66 10SGS | |
| MSI GS66 Stealth 10SFS | |
| Aorus 17G XB | |
| Asus Zephyrus G14 GA401IV | |
| 1920x1080 High Overall Quality (DX11) | |
| MSI GS66 10SGS | |
| Moyenne NVIDIA GeForce RTX 2080 Super Max-Q (78.2 - 84.3, n=4) | |
| Aorus 17G XB | |
| MSI GS66 Stealth 10SFS | |
| Asus Zephyrus G14 GA401IV | |
| Bas | Moyen | Élevé | Ultra | |
|---|---|---|---|---|
| The Witcher 3 (2015) | 310.3 | 239.5 | 142.7 | 74.3 |
| Dota 2 Reborn (2015) | 147 | 132 | 122 | 116 |
| X-Plane 11.11 (2018) | 102 | 90.9 | 76.8 | |
| Shadow of the Tomb Raider (2018) | 138 | 109 | 104 | 96 |
| Assassin´s Creed Odyssey (2018) | 102 | 87 | 75 | 54 |
| Apex Legends (2019) | 299 | 196 | 148.8 | 147.6 |
| Metro Exodus (2019) | 143.3 | 96.2 | 74.4 | 59 |
| Dirt Rally 2.0 (2019) | 252 | 168.4 | 158.5 | 90 |
| The Division 2 (2019) | 165 | 117 | 96 | 73 |
| Anno 1800 (2019) | 159 | 98.2 | 76.7 | 44.4 |
| Total War: Three Kingdoms (2019) | 233 | 127.8 | 88.5 | 64.1 |
| F1 2019 (2019) | 205 | 168 | 147 | 142 |
| Borderlands 3 (2019) | 132.5 | 105.7 | 81.1 | 63.5 |
| Ghost Recon Breakpoint (2019) | 117 | 96 | 86 | 65 |
| GRID 2019 (2019) | 174.8 | 125 | 111 | 74 |
| Need for Speed Heat (2019) | 101.9 | 92 | 84 | 76.9 |
| Escape from Tarkov (2020) | 121 | 121 | 120 | 120 |
| Hunt Showdown (2020) | 207.4 | 121.4 | 102 | |
| Doom Eternal (2020) | 256 | 167.6 | 147.1 | 140 |
| MSI GS66 10SGS GeForce RTX 2080 Super Max-Q, i7-10750H, Samsung SSD PM981 MZVLB512HAJQ | MSI GS65 Stealth 9SG GeForce RTX 2080 Max-Q, i7-9750H, Samsung SSD PM981 MZVLB512HAJQ | Asus Zephyrus S GX502GW GeForce RTX 2070 Mobile, i7-9750H, 2x Intel SSD 660p SSDPEKNW512G8 (RAID 0) | Razer Blade 15 RTX 2080 Max-Q GeForce RTX 2080 Max-Q, i7-9750H, Samsung SSD PM981 MZVLB512HAJQ | HP Omen X 2S 15-dg0075cl GeForce RTX 2070 Max-Q, i7-9750H, WDC PC SN720 SDAPNTW-1T00 | Lenovo Legion Y740-15ICHg GeForce RTX 2070 Max-Q, i7-9750H, WDC PC SN520 SDAPMUW-128G | MSI GS66 Stealth 10SFS GeForce RTX 2070 Super Max-Q, i9-10980HK, Samsung SSD PM981 MZVLB1T0HALR | |
|---|---|---|---|---|---|---|---|
| Noise | 2% | -10% | 9% | -1% | 2% | -11% | |
| arrêt / environnement * (dB) | 28.5 | 28.3 1% | 30 -5% | 28.3 1% | 29 -2% | 30 -5% | 30 -5% |
| Idle Minimum * (dB) | 30 | 30.4 -1% | 31 -3% | 28.8 4% | 30.5 -2% | 31.3 -4% | 32 -7% |
| Idle Average * (dB) | 30 | 30.5 -2% | 33 -10% | 28.8 4% | 31.5 -5% | 31.3 -4% | 34 -13% |
| Idle Maximum * (dB) | 30.9 | 30.6 1% | 38 -23% | 29 6% | 31.5 -2% | 31.3 -1% | 39 -26% |
| Load Average * (dB) | 39.5 | 37.6 5% | 50 -27% | 33.5 15% | 40.6 -3% | 42 -6% | 53 -34% |
| Witcher 3 ultra * (dB) | 48 | 46 4% | 53 -10% | 45 6% | 49.5 -3% | 42.1 12% | 48 -0% |
| Load Maximum * (dB) | 59.4 | 55.1 7% | 56 6% | 45.2 24% | 53.4 10% | 46.5 22% | 53 11% |
* ... Moindre est la valeur, meilleures sont les performances
Degré de la nuisance sonore
| Au repos |
| 30 / 30 / 30.9 dB(A) |
| Fortement sollicité |
| 39.5 / 59.4 dB(A) |
 | ||
30 dB silencieux 40 dB(A) audible 50 dB(A) bruyant |
||
min: | ||
(-) La température maximale du côté supérieur est de 47.8 °C / 118 F, par rapport à la moyenne de 40.4 °C / 105 F, allant de 21.2 à 68.8 °C pour la classe Gaming.
(-) Le fond chauffe jusqu'à un maximum de 54.4 °C / 130 F, contre une moyenne de 43.2 °C / 110 F
(+) En utilisation inactive, la température moyenne du côté supérieur est de 25.9 °C / 79 F, par rapport à la moyenne du dispositif de 33.9 °C / 93 F.
(±) En jouant à The Witcher 3, la température moyenne du côté supérieur est de 33.3 °C / 92 F, alors que la moyenne de l'appareil est de 33.9 °C / 93 F.
(+) Les repose-poignets et le pavé tactile sont plus froids que la température de la peau avec un maximum de 28.6 °C / 83.5 F et sont donc froids au toucher.
(±) La température moyenne de la zone de l'appui-paume de dispositifs similaires était de 28.8 °C / 83.8 F (+0.2 °C / #0.3 F).
MSI GS66 10SGS analyse audio
(+) | les haut-parleurs peuvent jouer relativement fort (92.3# dB)
Basses 100 - 315 Hz
(-) | presque aucune basse - en moyenne 29.8% plus bas que la médiane
(±) | la linéarité des basses est moyenne (7.5% delta à la fréquence précédente)
Médiums 400 - 2000 Hz
(±) | médiane supérieure - en moyenne 9.3% supérieure à la médiane
(±) | la linéarité des médiums est moyenne (9.2% delta à la fréquence précédente)
Aiguës 2 - 16 kHz
(±) | sommets réduits - en moyenne 6.1% plus bas que la médiane
(±) | la linéarité des aigus est moyenne (7.5% delta à la fréquence précédente)
Globalement 100 - 16 000 Hz
(±) | la linéarité du son global est moyenne (29.4% de différence avec la médiane)
Par rapport à la même classe
» 95% de tous les appareils testés de cette catégorie étaient meilleurs, 2% similaires, 3% pires
» Le meilleur avait un delta de 6%, la moyenne était de 18%, le pire était de 132%.
Par rapport à tous les appareils testés
» 87% de tous les appareils testés étaient meilleurs, 2% similaires, 10% pires
» Le meilleur avait un delta de 4%, la moyenne était de 24%, le pire était de 134%.
Apple MacBook 12 (Early 2016) 1.1 GHz analyse audio
(+) | les haut-parleurs peuvent jouer relativement fort (83.6# dB)
Basses 100 - 315 Hz
(±) | basse réduite - en moyenne 11.3% inférieure à la médiane
(±) | la linéarité des basses est moyenne (14.2% delta à la fréquence précédente)
Médiums 400 - 2000 Hz
(+) | médiane équilibrée - seulement 2.4% de la médiane
(+) | les médiums sont linéaires (5.5% delta à la fréquence précédente)
Aiguës 2 - 16 kHz
(+) | des sommets équilibrés - à seulement 2% de la médiane
(+) | les aigus sont linéaires (4.5% delta à la fréquence précédente)
Globalement 100 - 16 000 Hz
(+) | le son global est linéaire (10.2% différence à la médiane)
Par rapport à la même classe
» 7% de tous les appareils testés de cette catégorie étaient meilleurs, 2% similaires, 91% pires
» Le meilleur avait un delta de 5%, la moyenne était de 18%, le pire était de 53%.
Par rapport à tous les appareils testés
» 5% de tous les appareils testés étaient meilleurs, 1% similaires, 94% pires
» Le meilleur avait un delta de 4%, la moyenne était de 24%, le pire était de 134%.
| Éteint/en veille | |
| Au repos | |
| Fortement sollicité |
|
Légende:
min: | |
| MSI GS66 10SGS i7-10750H, GeForce RTX 2080 Super Max-Q, Samsung SSD PM981 MZVLB512HAJQ, IPS, 1920x1080, 15.6" | MSI GS65 Stealth 9SG i7-9750H, GeForce RTX 2080 Max-Q, Samsung SSD PM981 MZVLB512HAJQ, IPS, 1920x1080, 15.6" | Asus Zephyrus S GX502GW i7-9750H, GeForce RTX 2070 Mobile, 2x Intel SSD 660p SSDPEKNW512G8 (RAID 0), IPS, 1920x1080, 15.6" | Razer Blade 15 RTX 2080 Max-Q i7-9750H, GeForce RTX 2080 Max-Q, Samsung SSD PM981 MZVLB512HAJQ, IPS, 1920x1080, 15.6" | HP Omen X 2S 15-dg0075cl i7-9750H, GeForce RTX 2070 Max-Q, WDC PC SN720 SDAPNTW-1T00, IPS, 1920x1080, 15.6" | Lenovo Legion Y740-15ICHg i7-9750H, GeForce RTX 2070 Max-Q, WDC PC SN520 SDAPMUW-128G, IPS, 1920x1080, 15.6" | MSI GS66 Stealth 10SFS i9-10980HK, GeForce RTX 2070 Super Max-Q, Samsung SSD PM981 MZVLB1T0HALR, IPS, 1920x1080, 15.6" | |
|---|---|---|---|---|---|---|---|
| Power Consumption | -8% | -31% | 9% | -97% | -15% | -1% | |
| Idle Minimum * (Watt) | 14.9 | 18.3 -23% | 24 -61% | 12.5 16% | 46 -209% | 22.2 -49% | 13 13% |
| Idle Average * (Watt) | 17.5 | 22 -26% | 27 -54% | 15.3 13% | 59 -237% | 24.9 -42% | 16 9% |
| Idle Maximum * (Watt) | 29.5 | 28.8 2% | 33 -12% | 20.7 30% | 65.5 -122% | 30.6 -4% | 27 8% |
| Load Average * (Watt) | 94.8 | 93 2% | 129 -36% | 90.2 5% | 99.8 -5% | 101 -7% | 109 -15% |
| Witcher 3 ultra * (Watt) | 146.1 | 142.6 2% | 176 -20% | 162 -11% | 154.1 -5% | 143 2% | 155 -6% |
| Load Maximum * (Watt) | 210.9 | 215.9 -2% | 216 -2% | 209.3 1% | 222.7 -6% | 186 12% | 236 -12% |
* ... Moindre est la valeur, meilleures sont les performances
| MSI GS66 10SGS i7-10750H, GeForce RTX 2080 Super Max-Q, 99.99 Wh | MSI GS65 Stealth 9SG i7-9750H, GeForce RTX 2080 Max-Q, 82 Wh | Asus Zephyrus S GX502GW i7-9750H, GeForce RTX 2070 Mobile, 76 Wh | Razer Blade 15 RTX 2080 Max-Q i7-9750H, GeForce RTX 2080 Max-Q, 80 Wh | Lenovo Legion Y740-15ICHg i7-9750H, GeForce RTX 2070 Max-Q, 57 Wh | MSI GS66 Stealth 10SFS i9-10980HK, GeForce RTX 2070 Super Max-Q, 99.99 Wh | |
|---|---|---|---|---|---|---|
| Autonomie de la batterie | -13% | -42% | 19% | -57% | -8% | |
| Reader / Idle (h) | 10.2 | 5.9 -42% | 15.9 56% | 8.4 -18% | ||
| WiFi v1.3 (h) | 6.9 | 6 -13% | 3.7 -46% | 6.6 -4% | 3 -57% | 6.1 -12% |
| Load (h) | 1.6 | 1 -37% | 1.7 6% | 1.7 6% |
Points positifs
Points négatifs
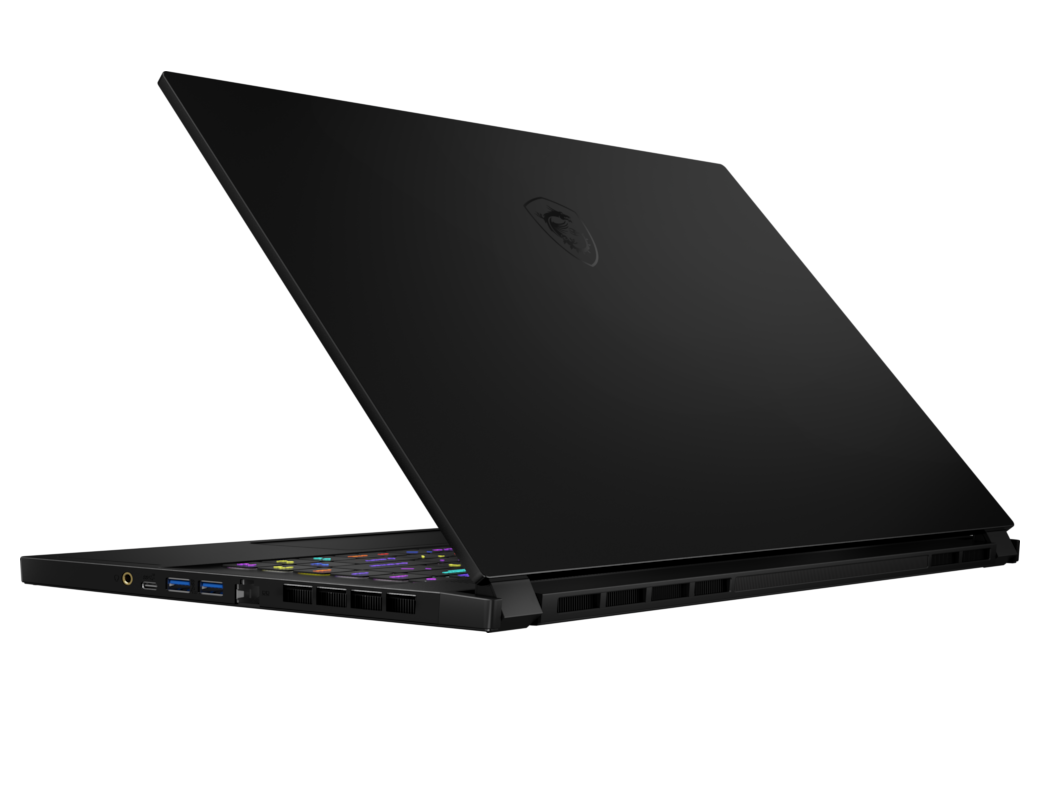

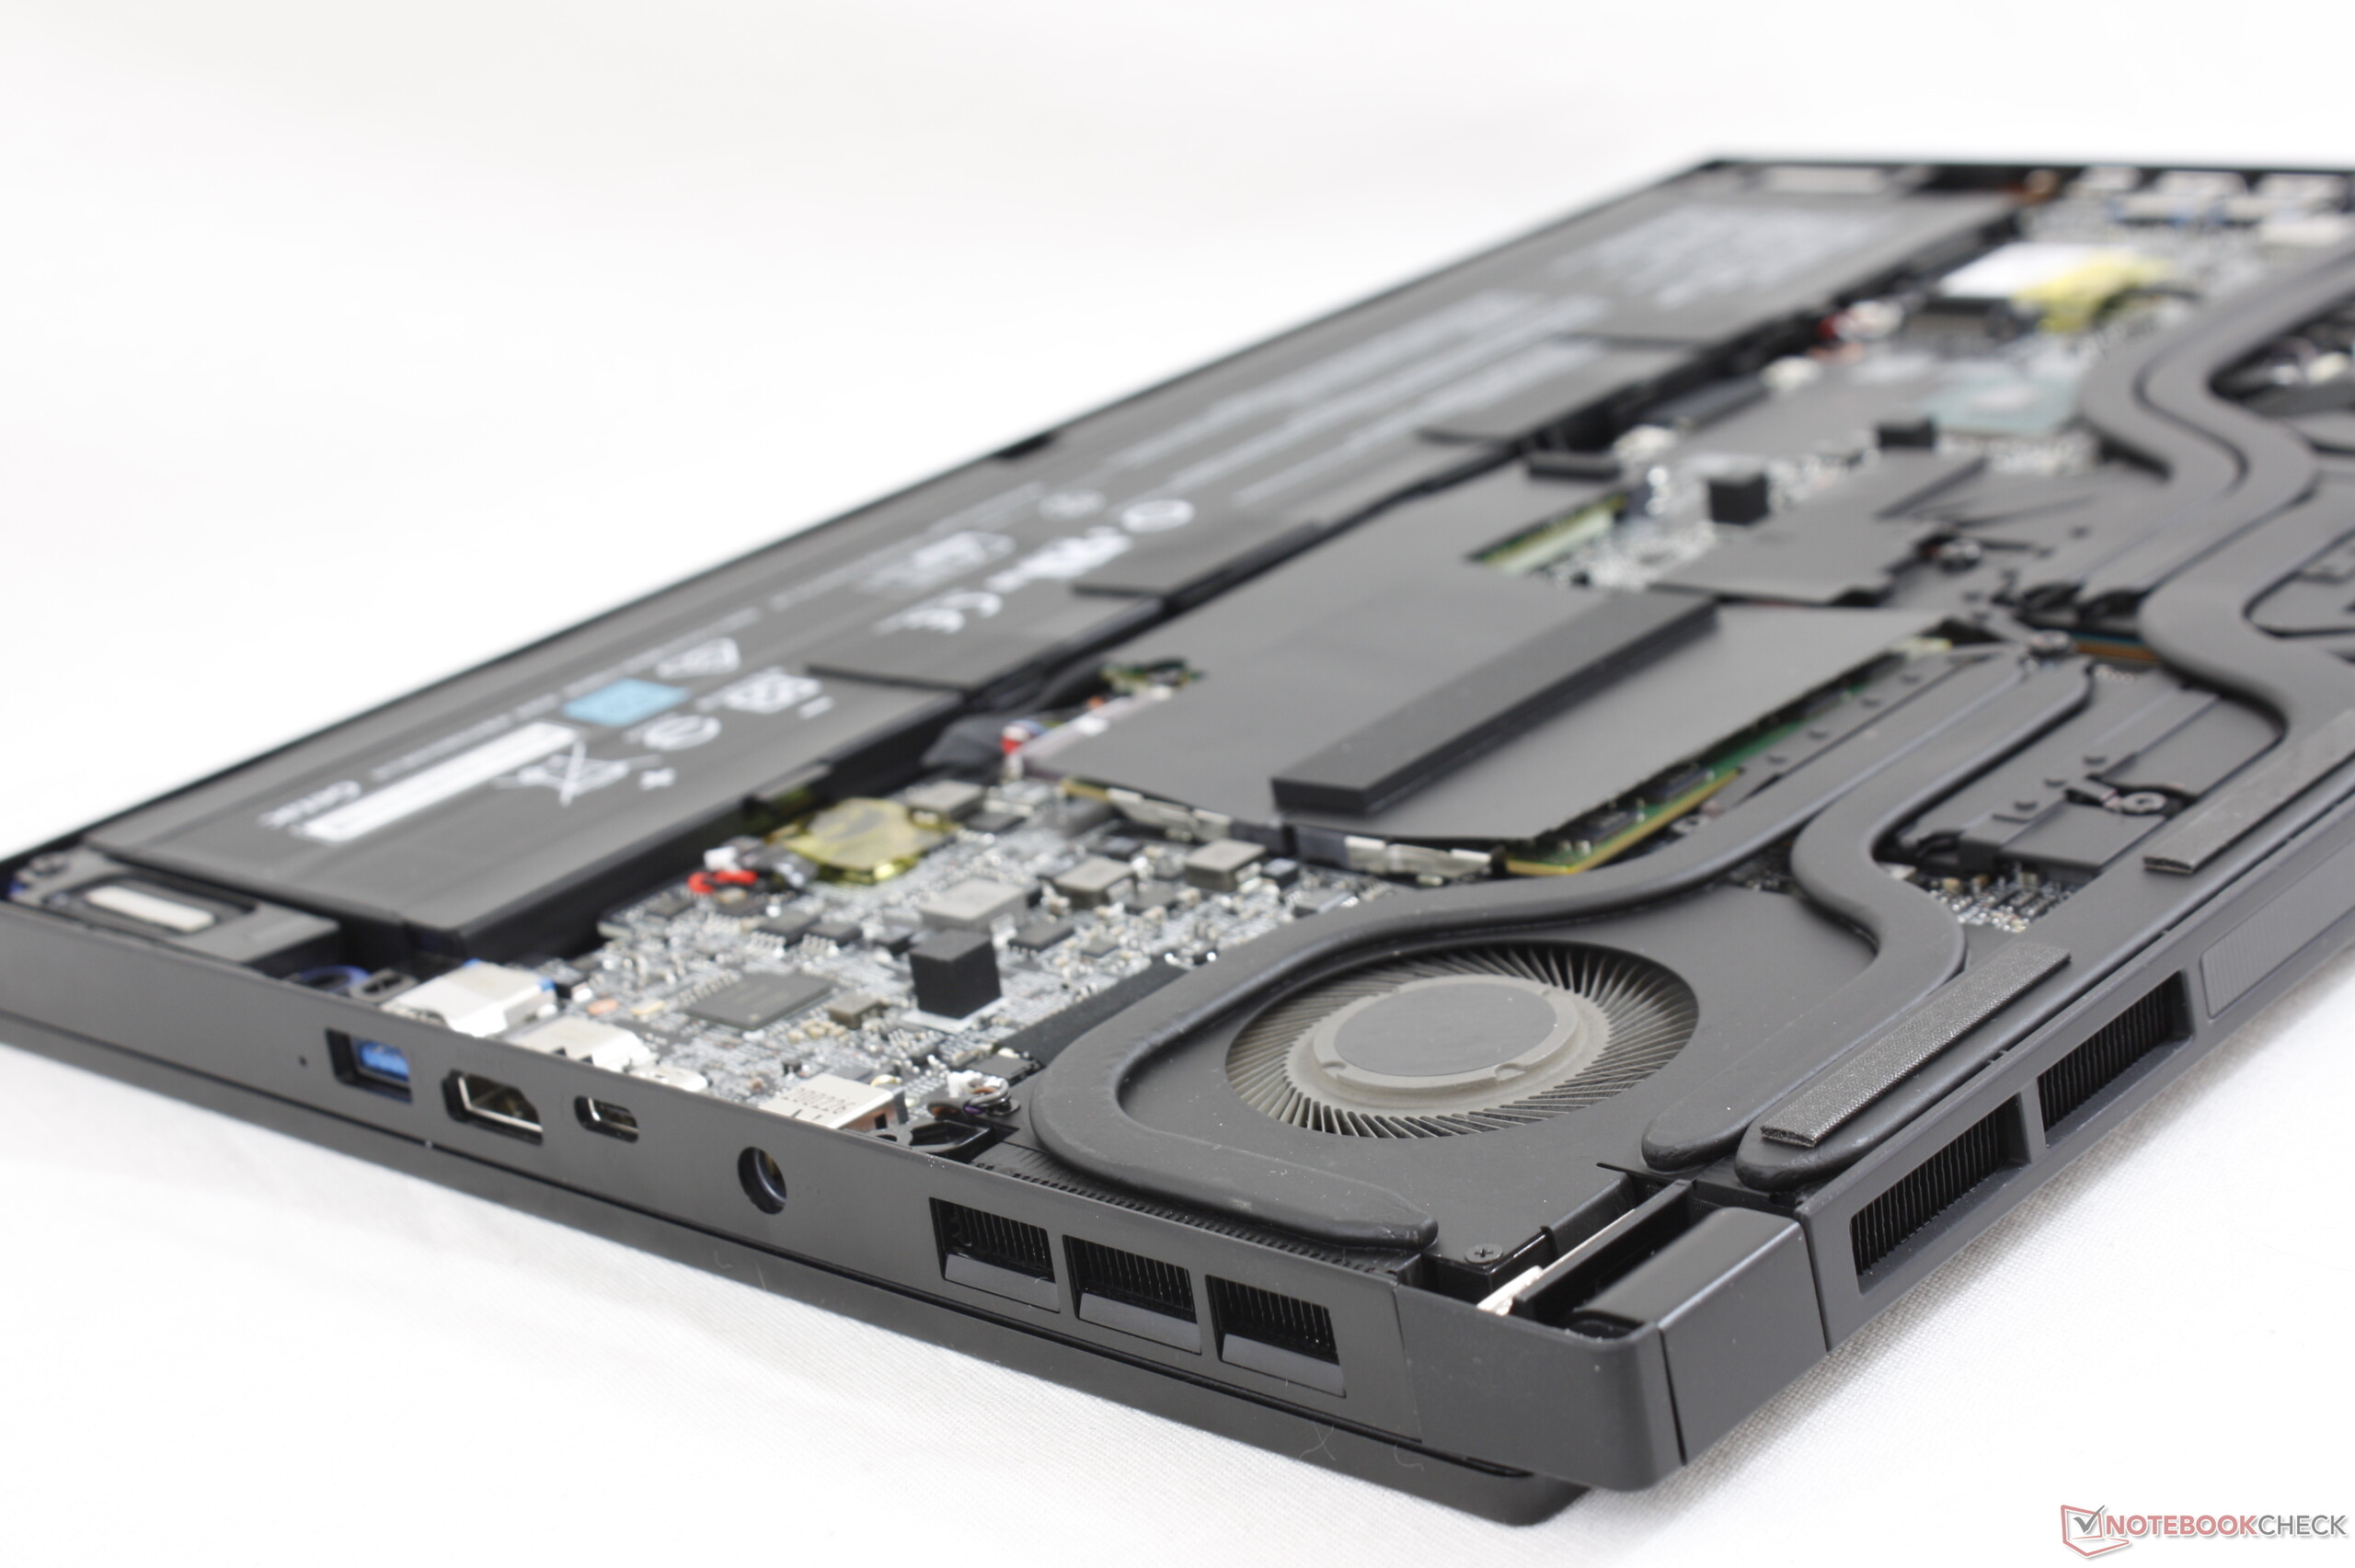
Le MSI GS66 est proposé dans de nombreuses versions, avec deux possibilités de processeurs (Intel Core i7-10750H ou Core i9-10980HK) et trois cartes graphiques (GeForce RTX 2060, RTX 2070 Super Max-Q, RTX 2080 Super Max-Q). Les deux versions que nous avons testé jusqu'à maintenant sont les GS66 10SGS (Core i7-10750H, RTX 2080 Super Max-Q) et GS66 10SFS (Core i9-10980HK, RTX 2070 Super Max-Q). Si nous avions à choisir entre un processeur plus puissant et une carte graphique moins puissante et l'inverse pour le jeu, c'est vraiment ce dernier choix que nous ferions, les jeux tournant toujours un peu mieux dans cette configuration.
Ceux qui visent d'utiliser le GS66 pour des tâches exigeantes pour le processeur autre que le jeu, alors la version octocœur Core i9 est plus logique, grâce à sa supériorité de 25 à 35 % sur le Core i7 hexacœur. Pour le jeu, les différences seront trop réduites, le GPU plus puissant prenant le plus souvent la pôle position. Ceux qui voudraient le meilleur des deux mondes peuvent toujours choisir le GS66 10SGS-031 ultra haut de gamme.
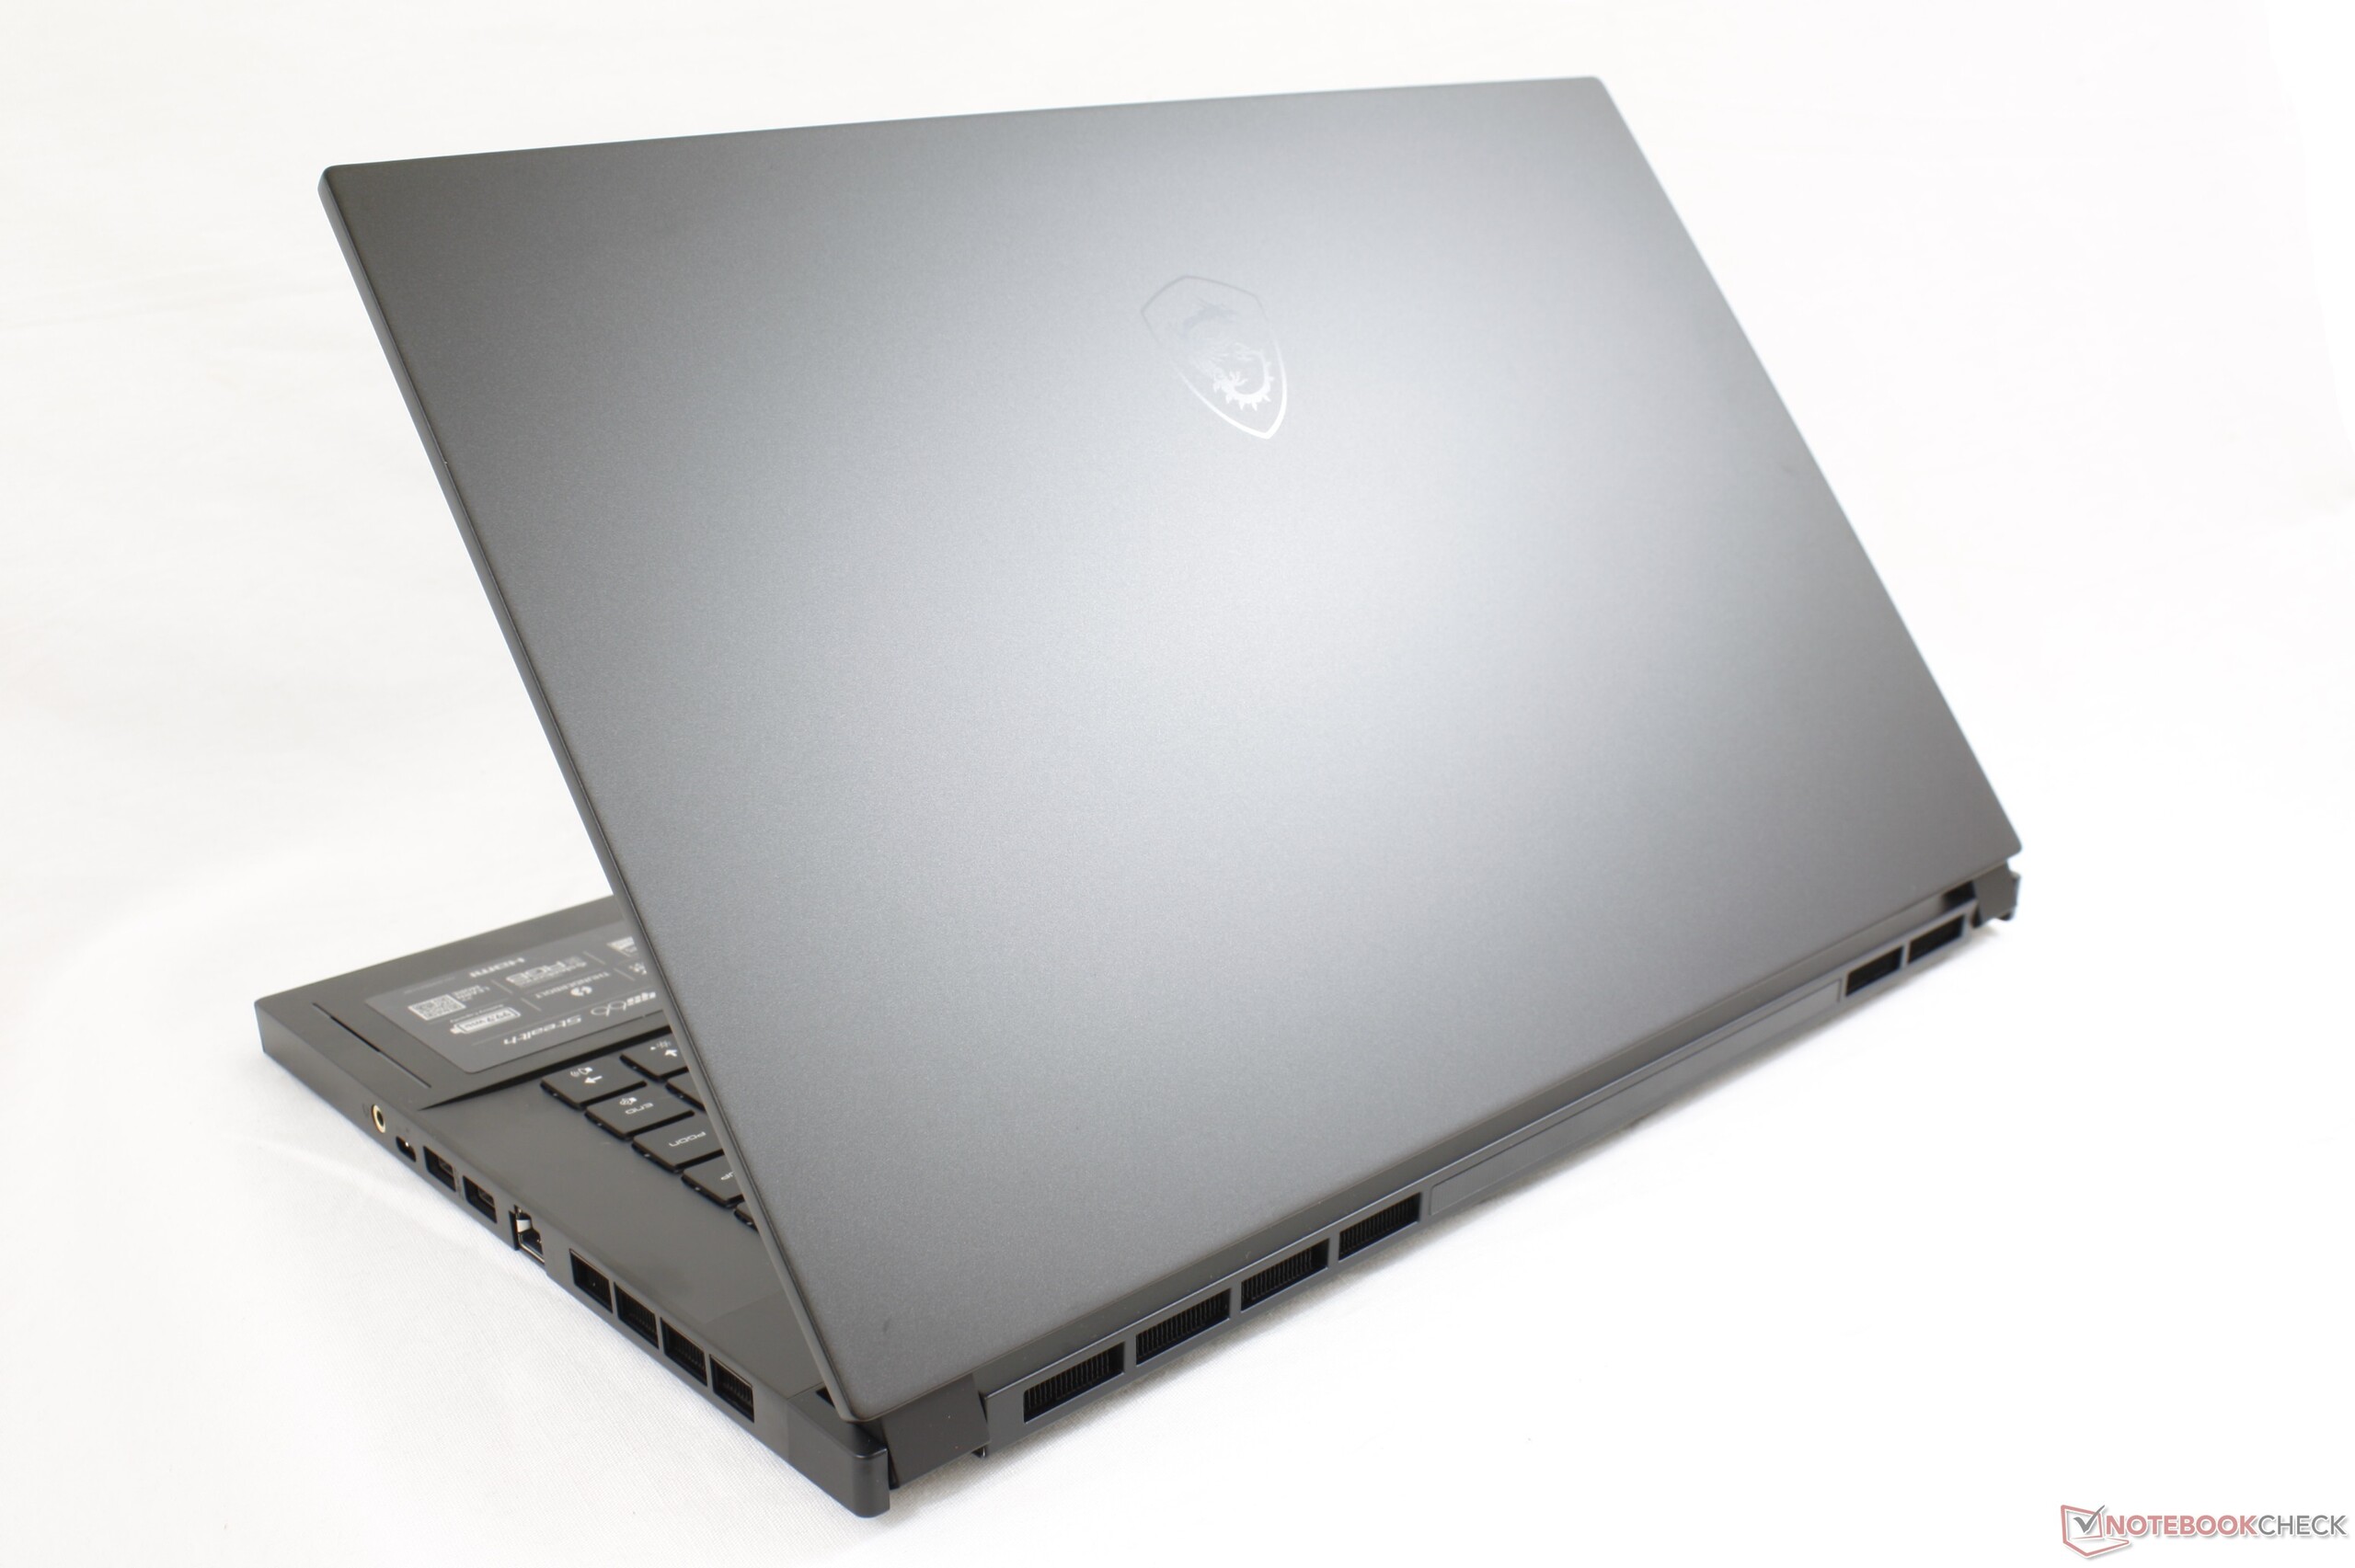
Nouveau châssis impressionnant, avec des mises à jour pas si impressionnantes pour le jeu. La GeForce RTX 2080 Super max-Q du GS66 fait seulement de 5 à 10 % mieux que le GS65 avec la RTX 2080 Max-Q. Les meilleurs de choisir le GS66 plutôt qu'un GS65 se résument à un châssis plus robuste et à une évolutivité plus élevée, plutôt qu'à un gain de performances en jeu, qui est très réduit.
L’intégralité de cette critique est disponible en anglais en suivant ce lien.
MSI GS66 10SGS
- 05/17/2020 v7 (old)
Allen Ngo
Price comparison
