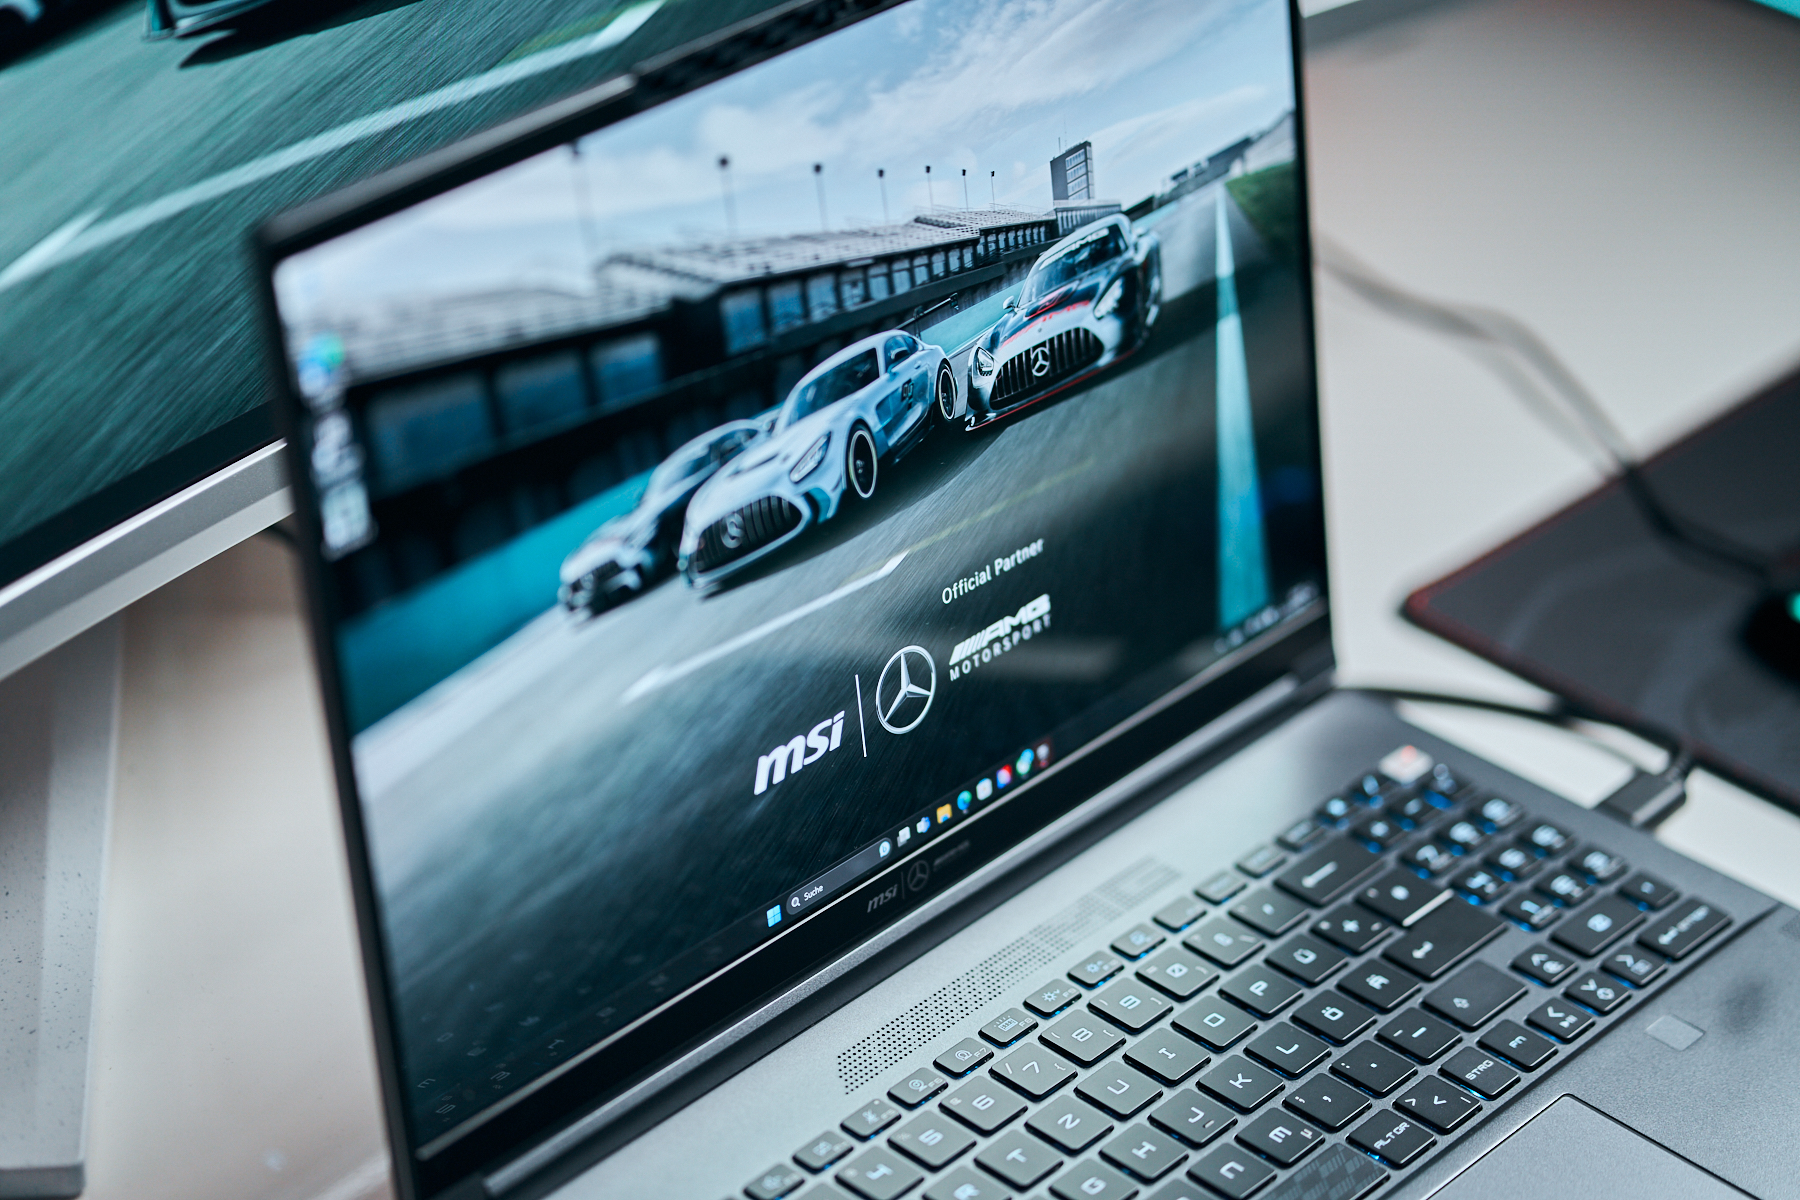
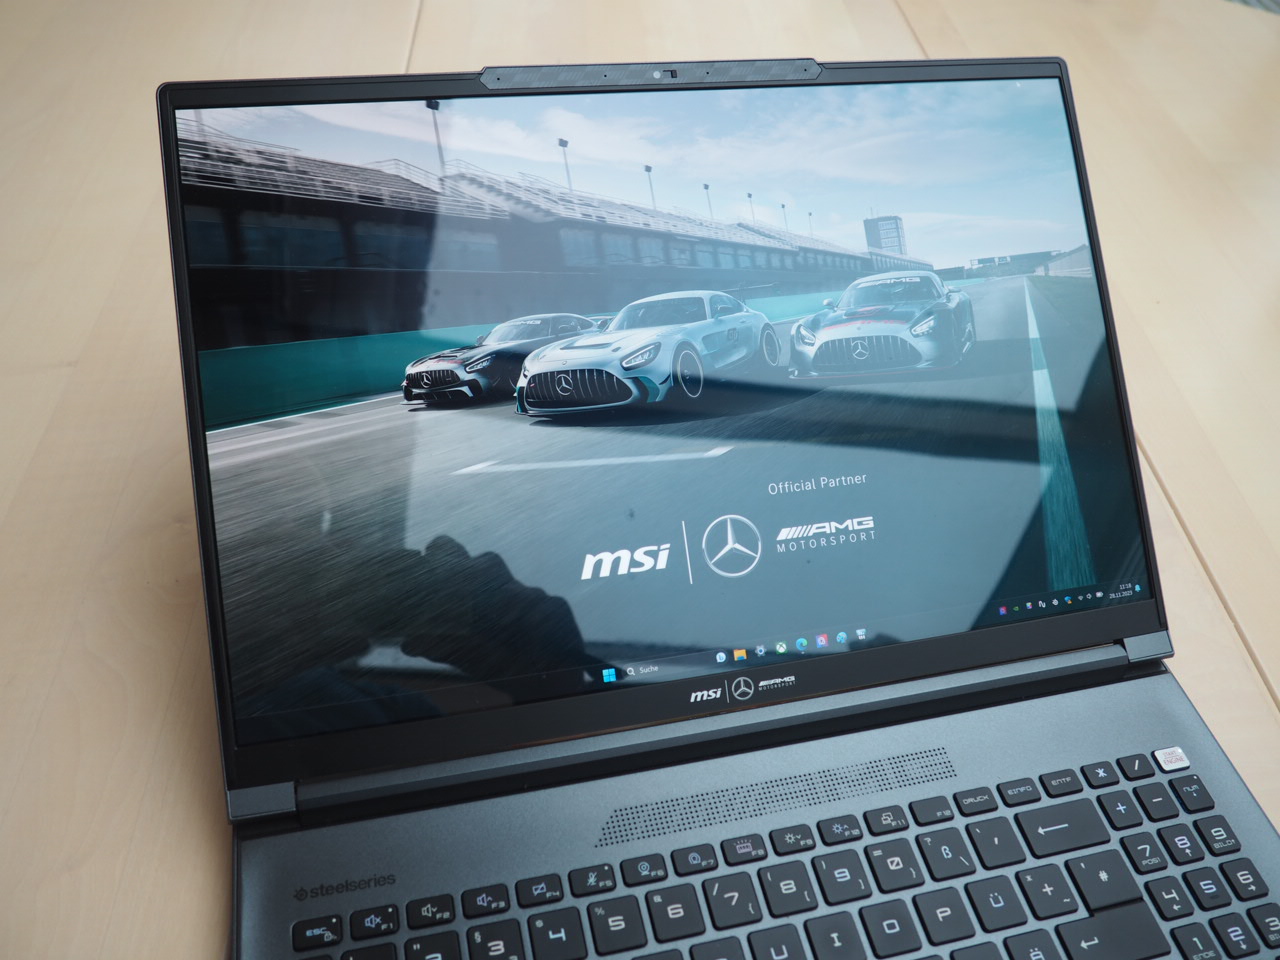
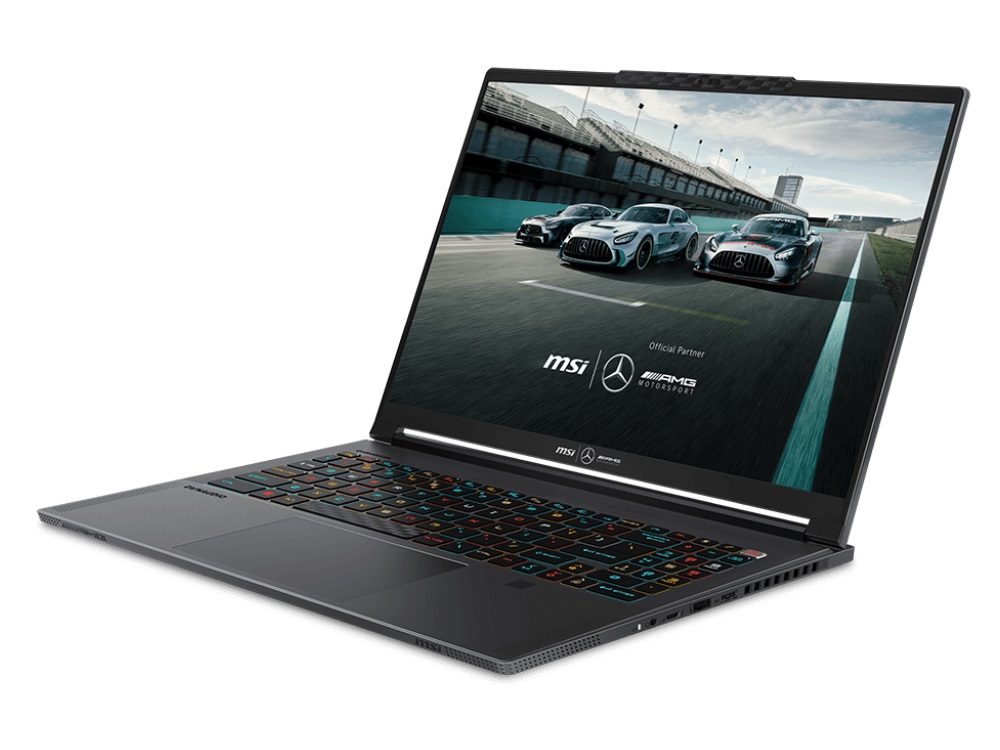
Test du MSI Stealth 16 Mercedes-AMG Motorsport : voiture de course mobile avec écran OLED

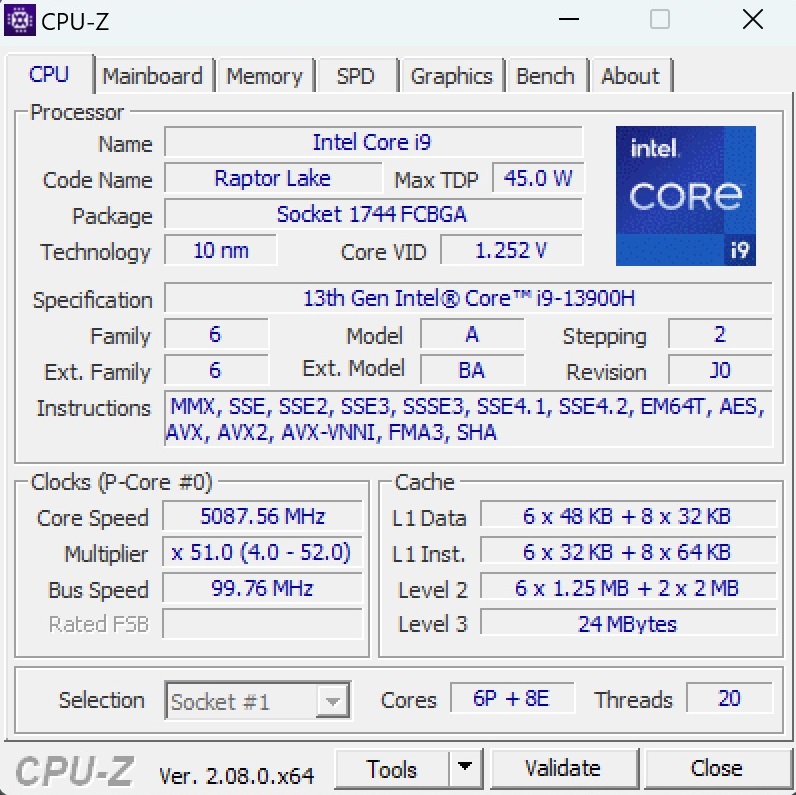
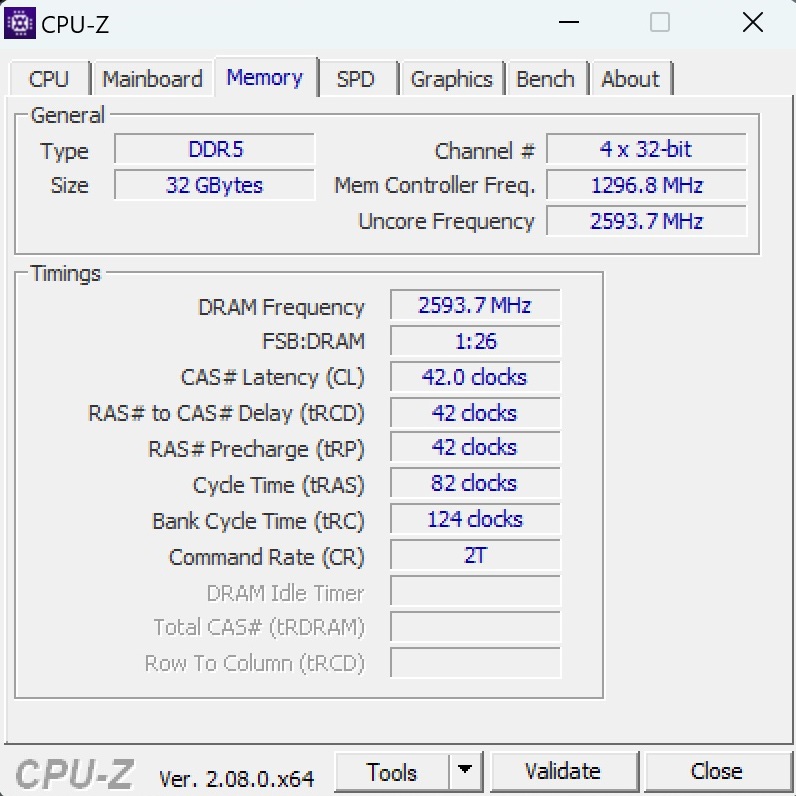
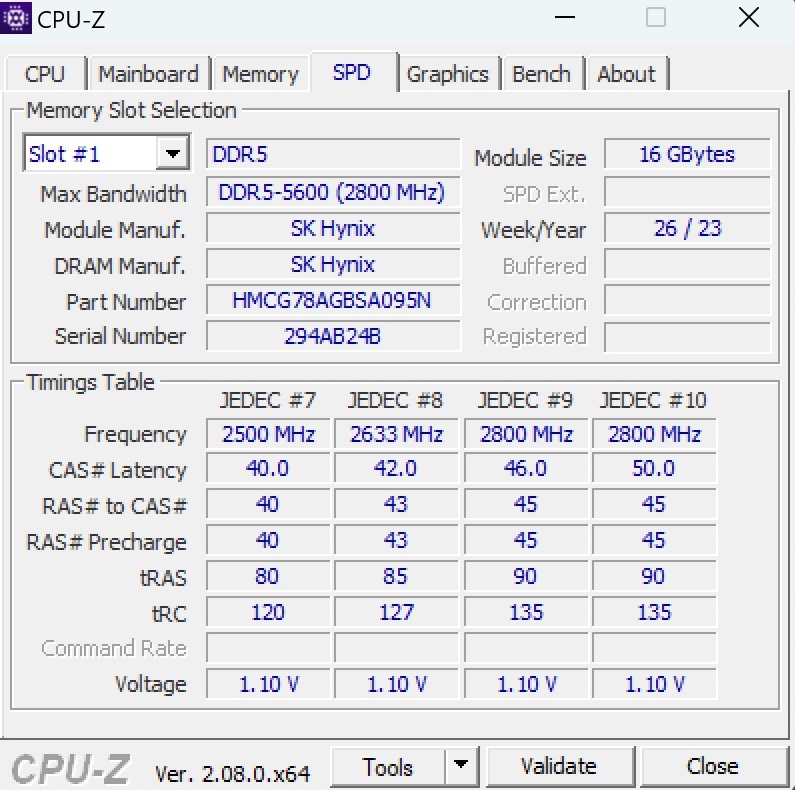
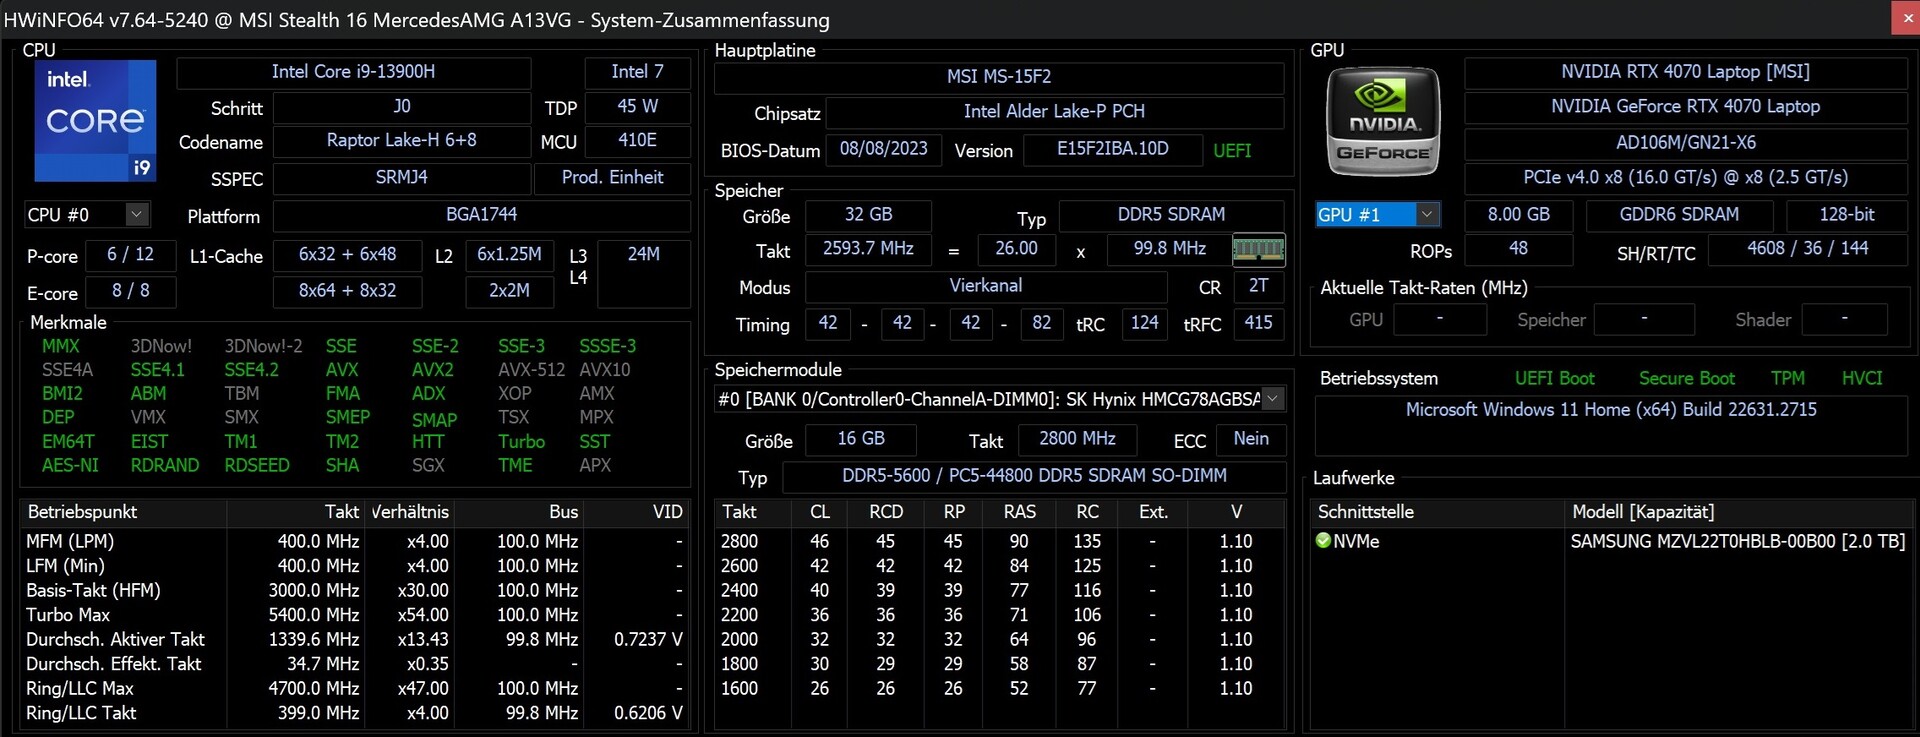
Alors que le Stealth 16 "standard" est équipé d'un Core i7-13700Hle modèle Mercedes-AMG Motorsport est équipé d'un Core i9-13900H légèrement plus rapide Core i9-13900H. Au lieu de l'écran IPS QHD+ mat fonctionnant à 240 Hz, l'édition Motorsport dispose d'un écran OLED UHD+ brillant avec un taux de rafraîchissement de 60 Hz. La carte graphique (RTX 4070), la mémoire vive (2 x 16 Go DDR5) et la capacité du disque dur (2 To) sont identiques à celles du modèle supérieur. Étant donné que le boîtier, les périphériques d'entrée et les connexions sont identiques et que seuls quelques détails optiques les distinguent, nous ne reviendrons pas sur des catégories spécifiques dans cet article. Vous pouvez vous référer aux informations pertinentes dans l'article sur le Stealth 16 Studio. La Motorsport Edition est actuellement proposée au prix de 2 899 $, un investissement notable pour un ordinateur portable RTX 4070.
Les concurrents du Stealth 16 comprennent d'autres ordinateurs portables de jeu de 16 pouces équipés de la RTX 4070, tels que le HP Omen Transcend 16le Lenovo Legion Pro 5 16ARX8et les ordinateurs portables Schenker XMG Pro 16 Studio et XMG Core 16. Ces modèles sont répertoriés dans les tableaux à des fins de comparaison
Comparaison avec les concurrents potentiels
Note | Date | Modèle | Poids | Épaisseur | Taille | Résolution | Prix |
|---|---|---|---|---|---|---|---|
| 89.1 % v7 (old) | 11/23 | MSI Stealth 16 Mercedes-AMG Motorsport A13VG i9-13900H, GeForce RTX 4070 Laptop GPU | 1.9 kg | 20 mm | 16.00" | 3840x2400 | |
| 88.8 % v7 (old) | 07/23 | MSI Stealth 16 Studio A13VG i7-13700H, GeForce RTX 4070 Laptop GPU | 2 kg | 19.95 mm | 16.00" | 2560x1600 | |
| 87.9 % v7 (old) | 10/23 | Schenker XMG Pro 16 Studio (Mid 23) i9-13900H, GeForce RTX 4070 Laptop GPU | 2.6 kg | 19.9 mm | 16.00" | 2560x1600 | |
| 87.9 % v7 (old) | 08/23 | HP Omen Transcend 16 i9-13900HX, GeForce RTX 4070 Laptop GPU | 2.3 kg | 19.8 mm | 16.00" | 2560x1600 | |
| 88.4 % v7 (old) | 05/23 | Lenovo Legion Pro 5 16ARX8 R7 7745HX, GeForce RTX 4070 Laptop GPU | 2.5 kg | 26.8 mm | 16.00" | 2560x1600 | |
| 89.2 % v7 (old) | 10/23 | Schenker XMG CORE 16 (L23) R7 7840HS, GeForce RTX 4070 Laptop GPU | 2.4 kg | 26.1 mm | 16.00" | 2560x1600 |
Cas
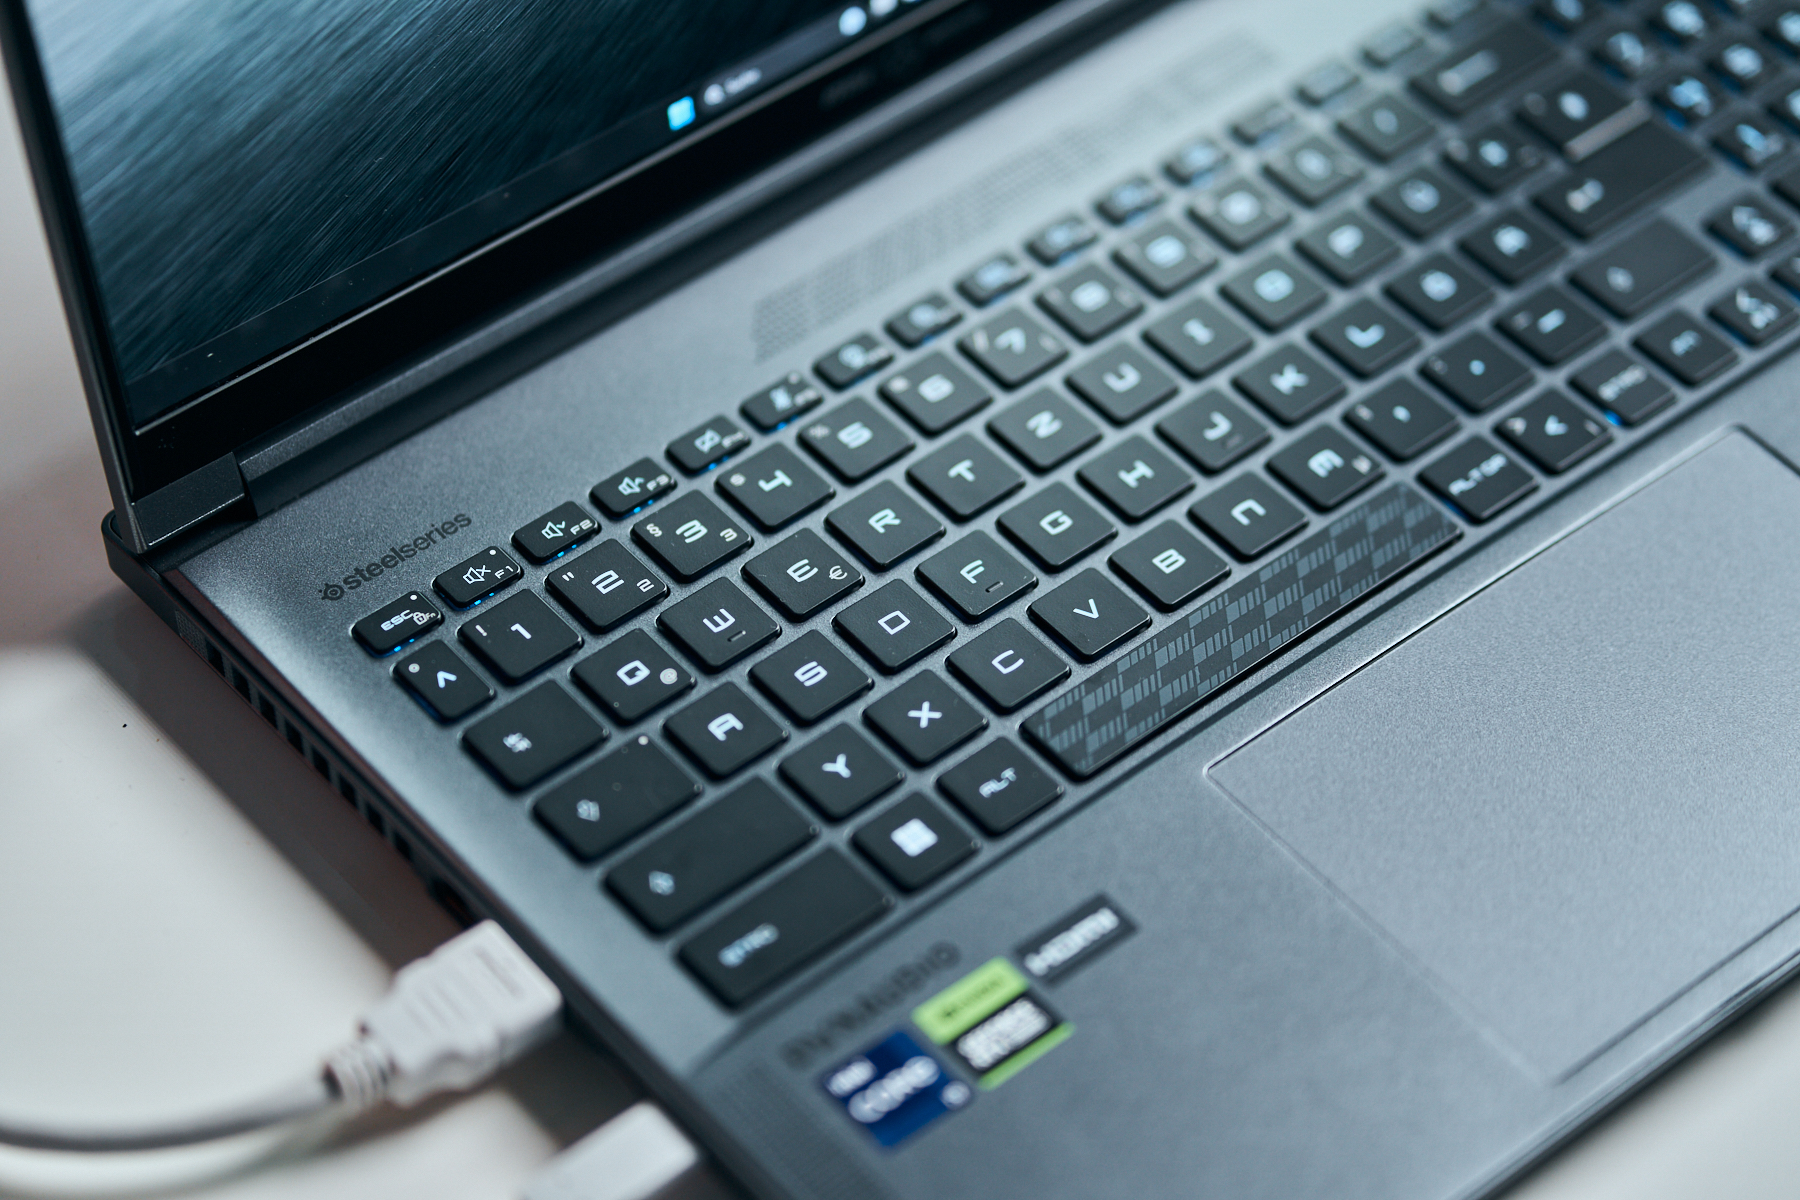
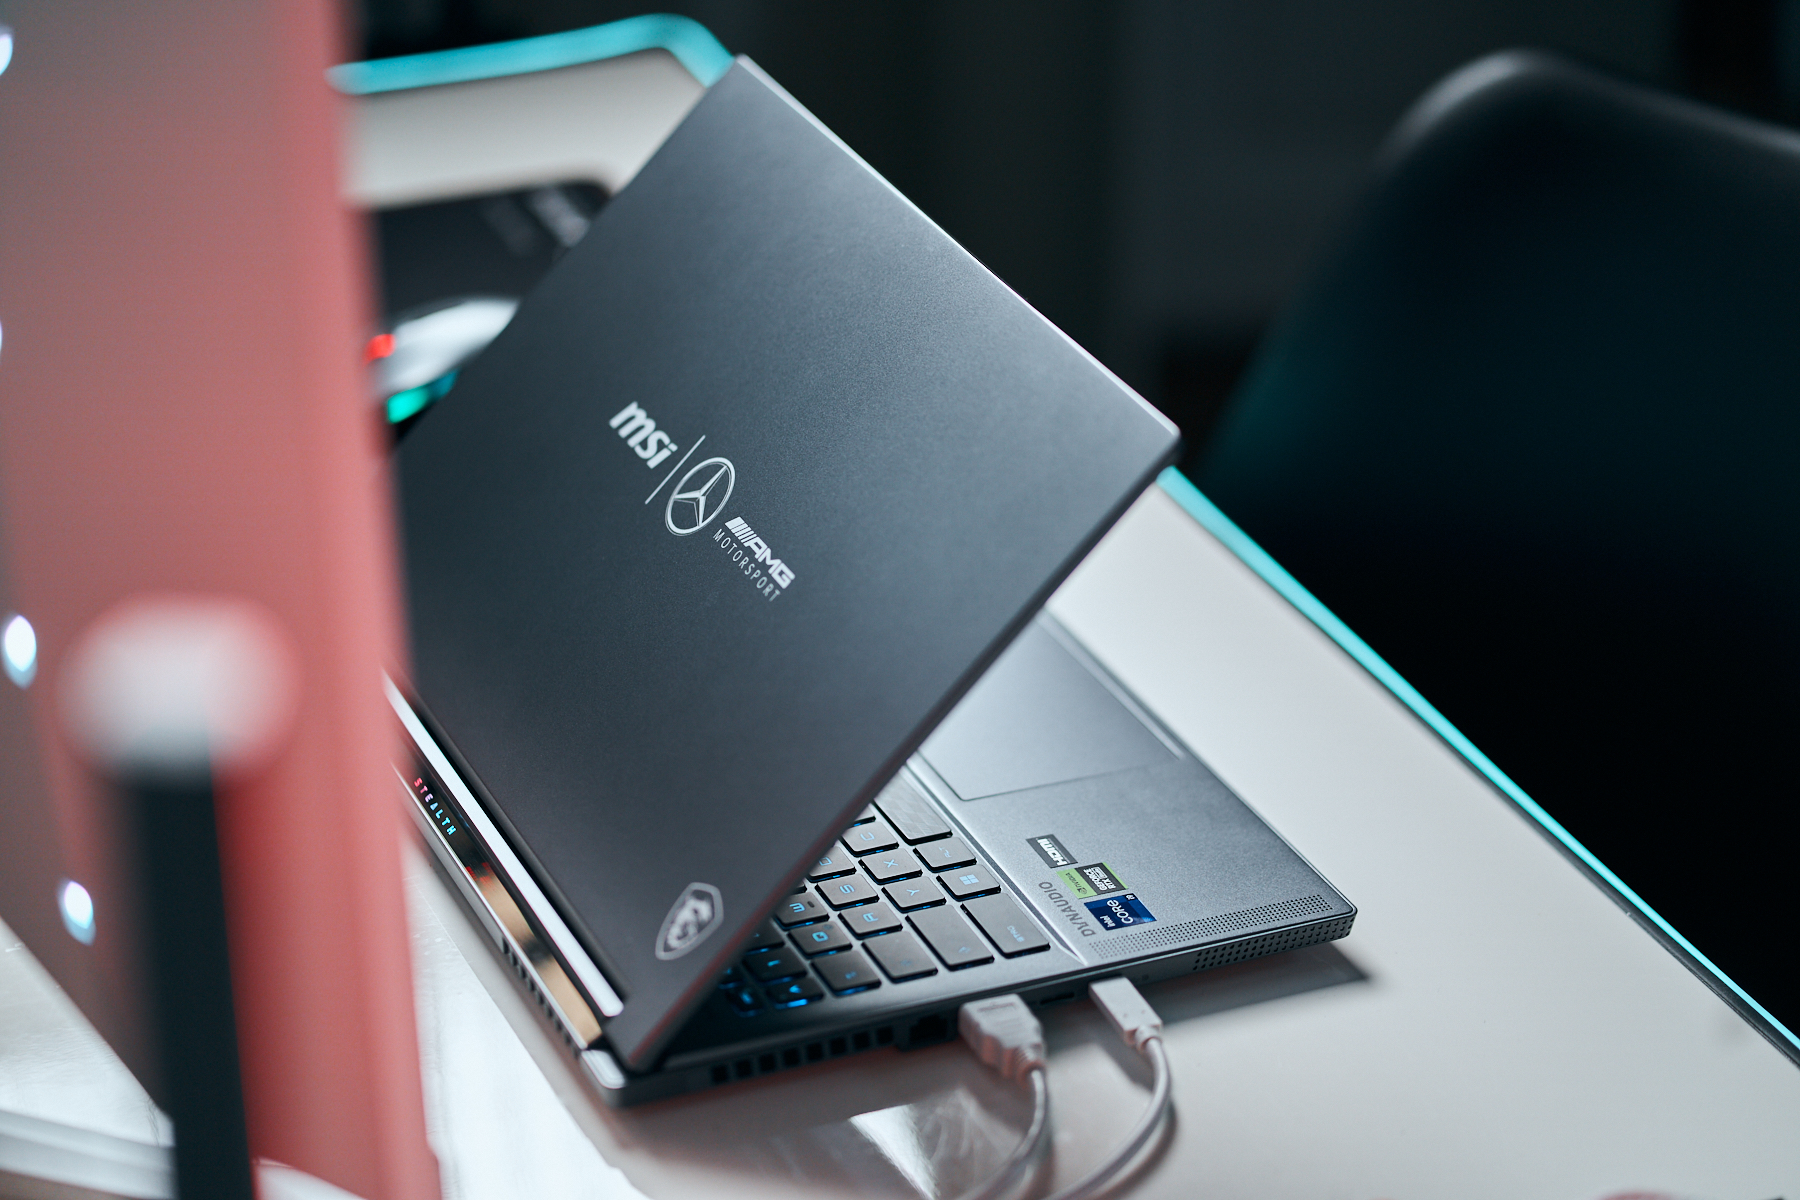
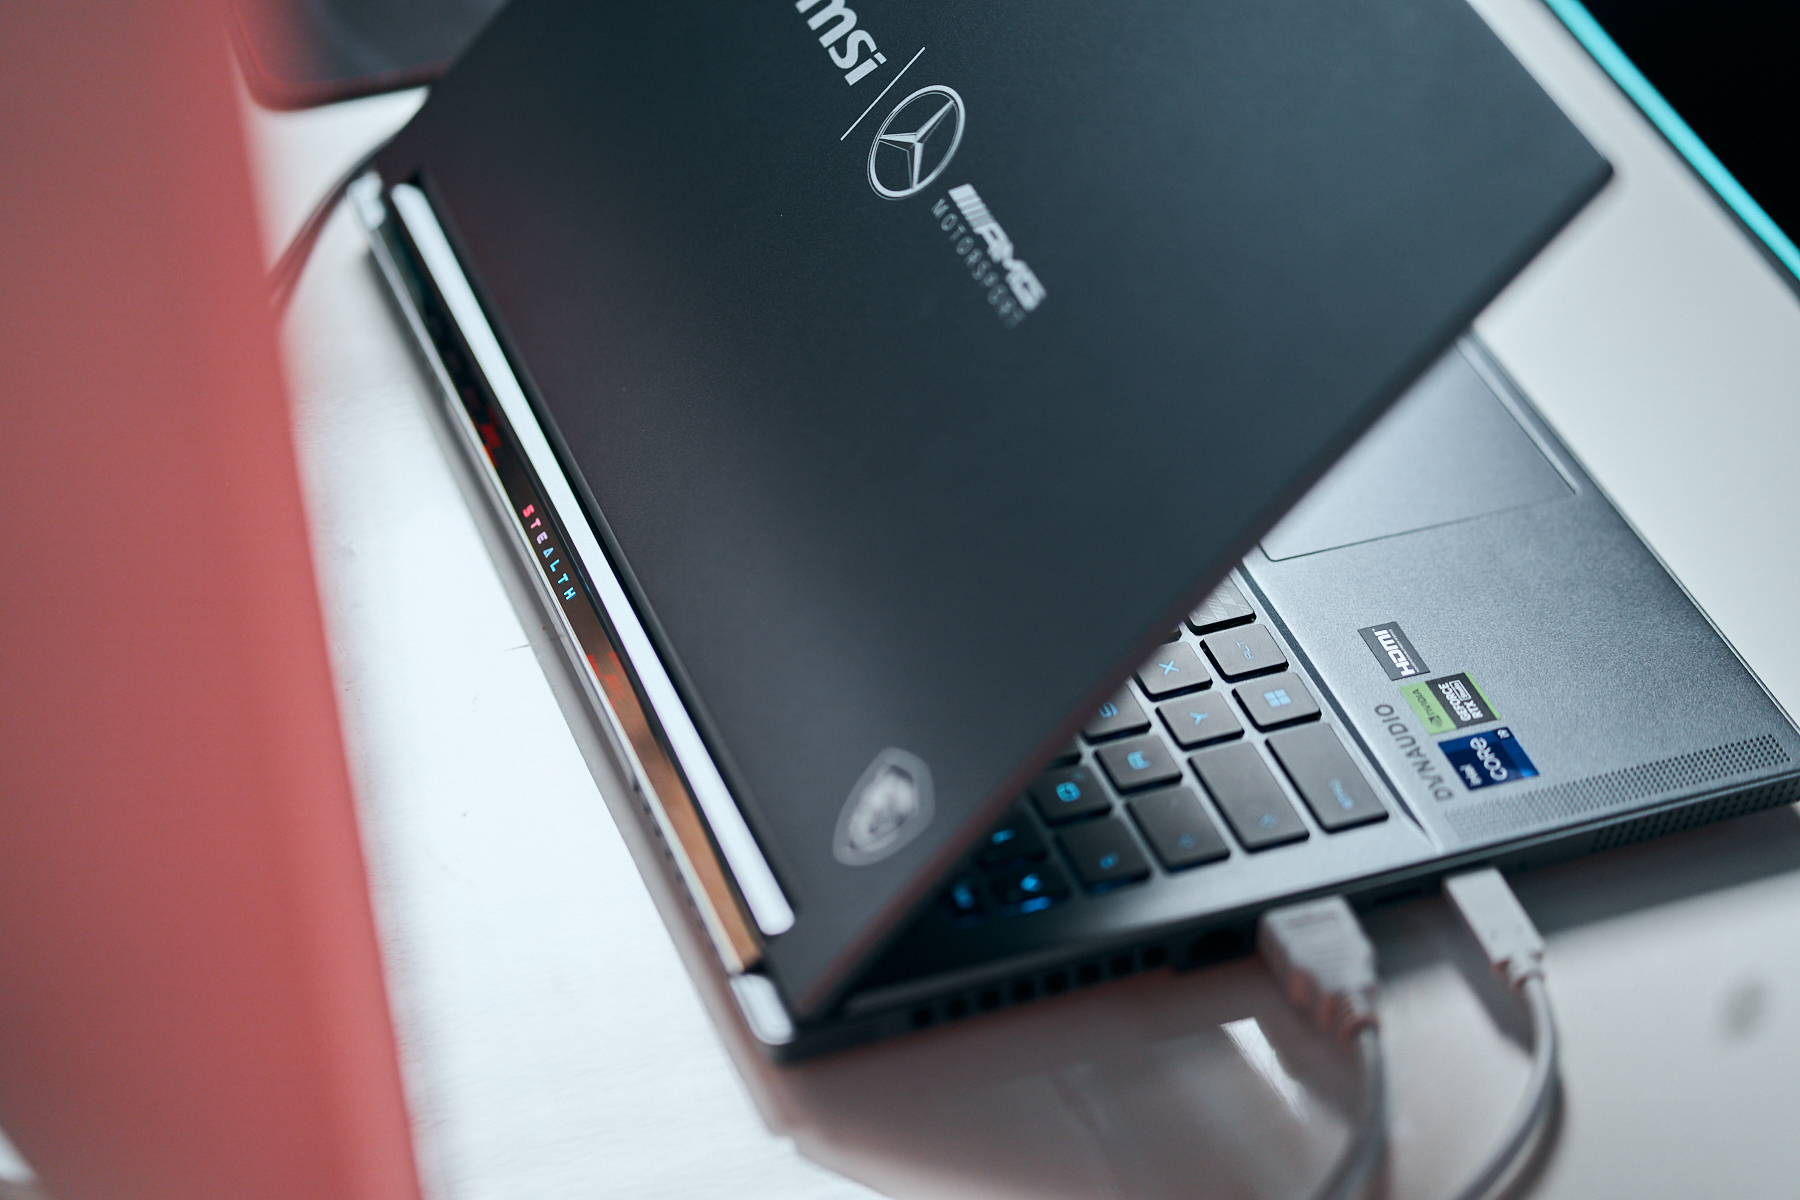
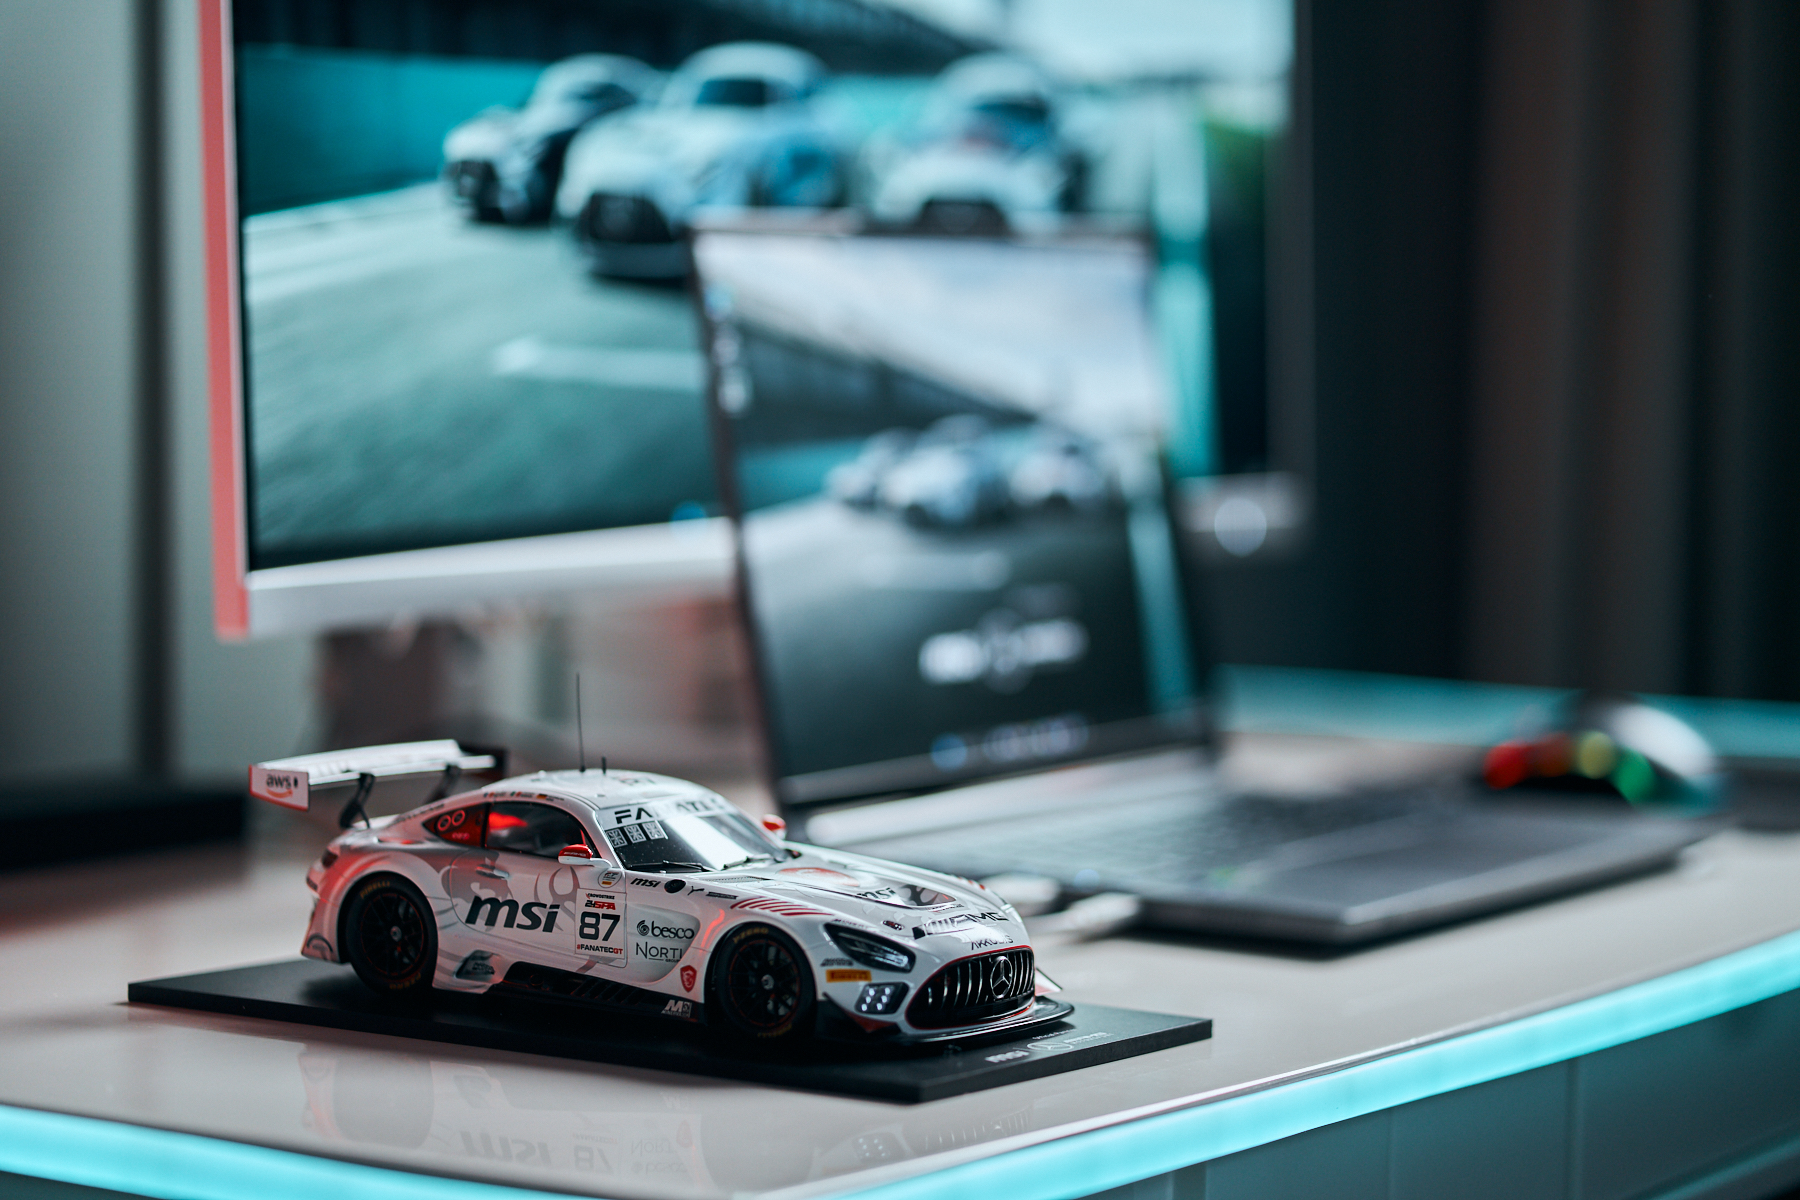
MSI a investi des efforts considérables dans la conception visuelle de cette édition spéciale, en incorporant des références au constructeur automobile dans l'ensemble du boîtier. Il s'agit notamment des différents emplacements du lettrage AMG (couvercle, façade, cadre d'affichage, grille d'aération, base), ainsi que d'autres éléments de conception rappelant le sport automobile. Par exemple, la barre de la webcam, la touche espace et les pieds en caoutchouc sont ornés d'un motif en forme de drapeau, tandis que le bouton d'alimentation affiche le texte "Start Engine".


Connectivité
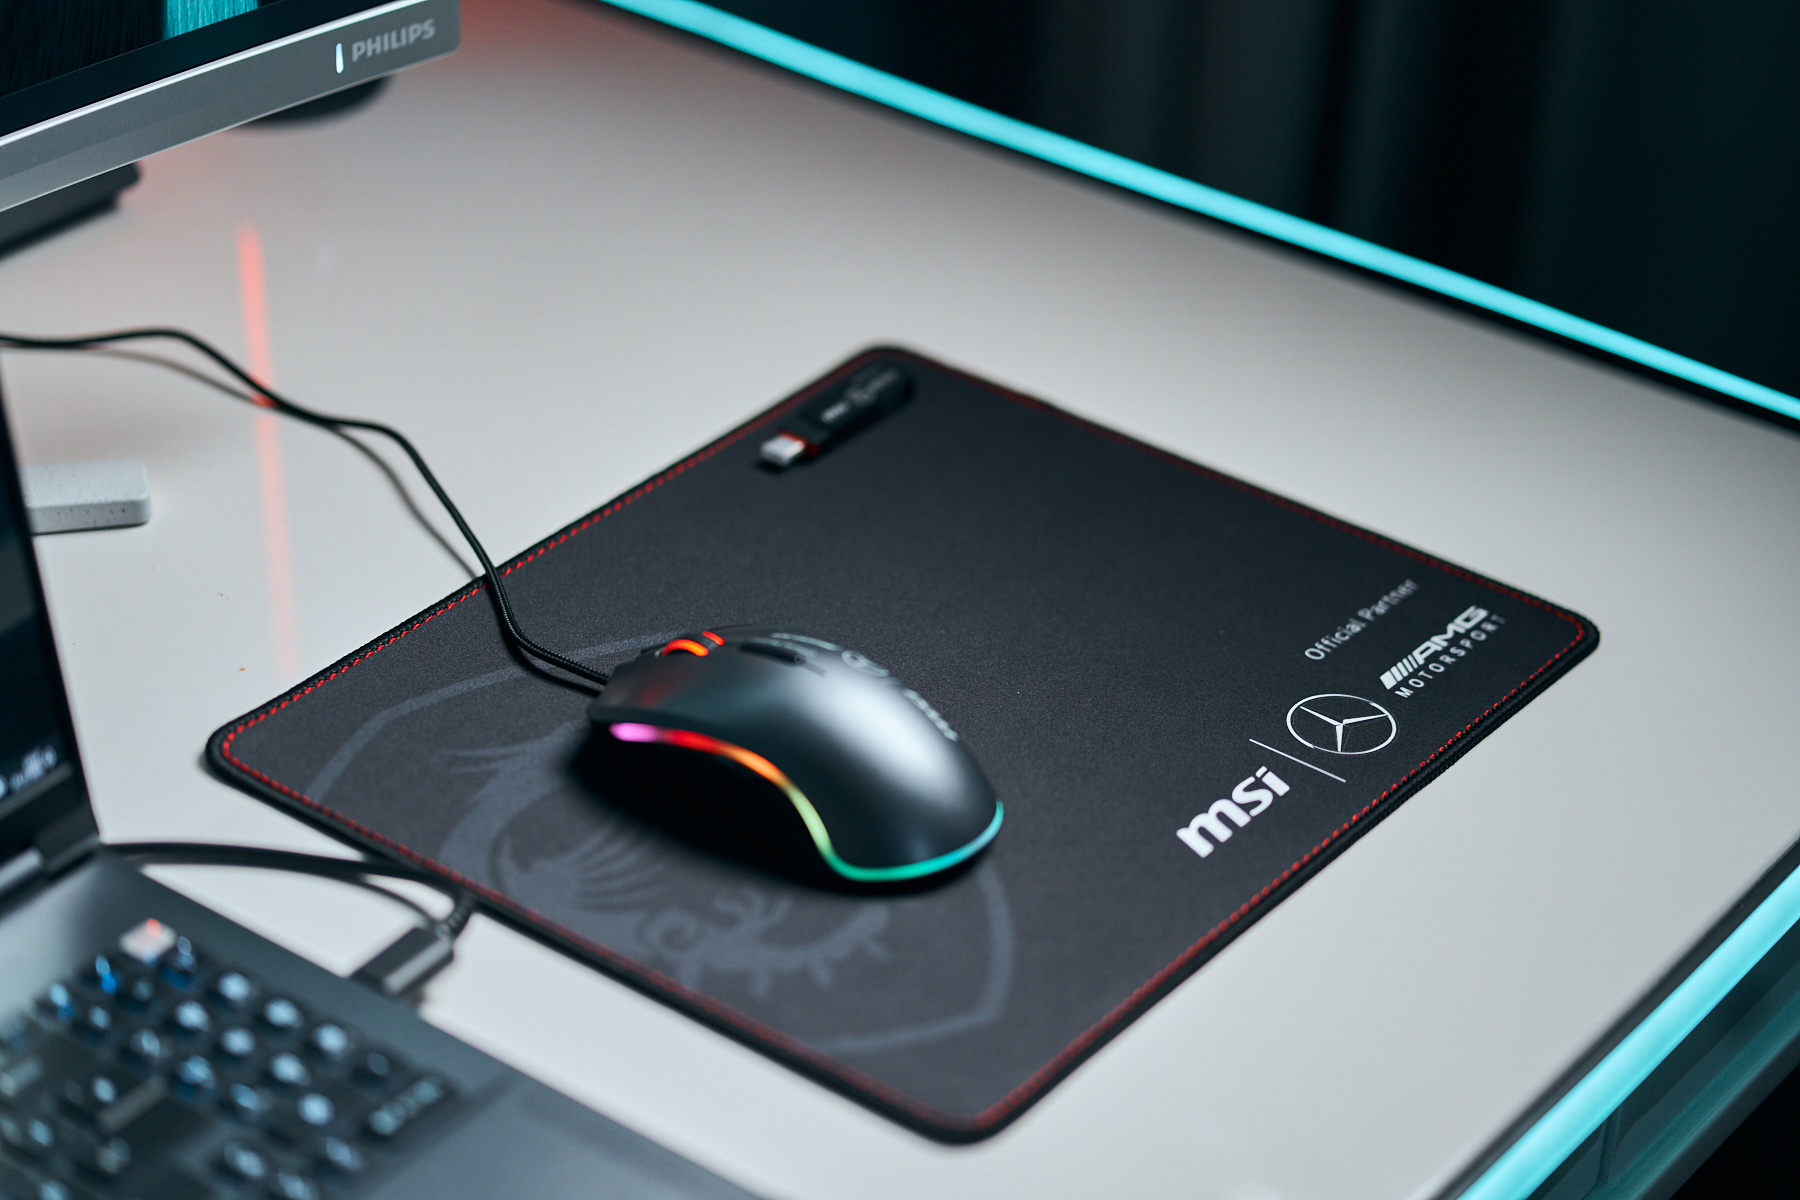
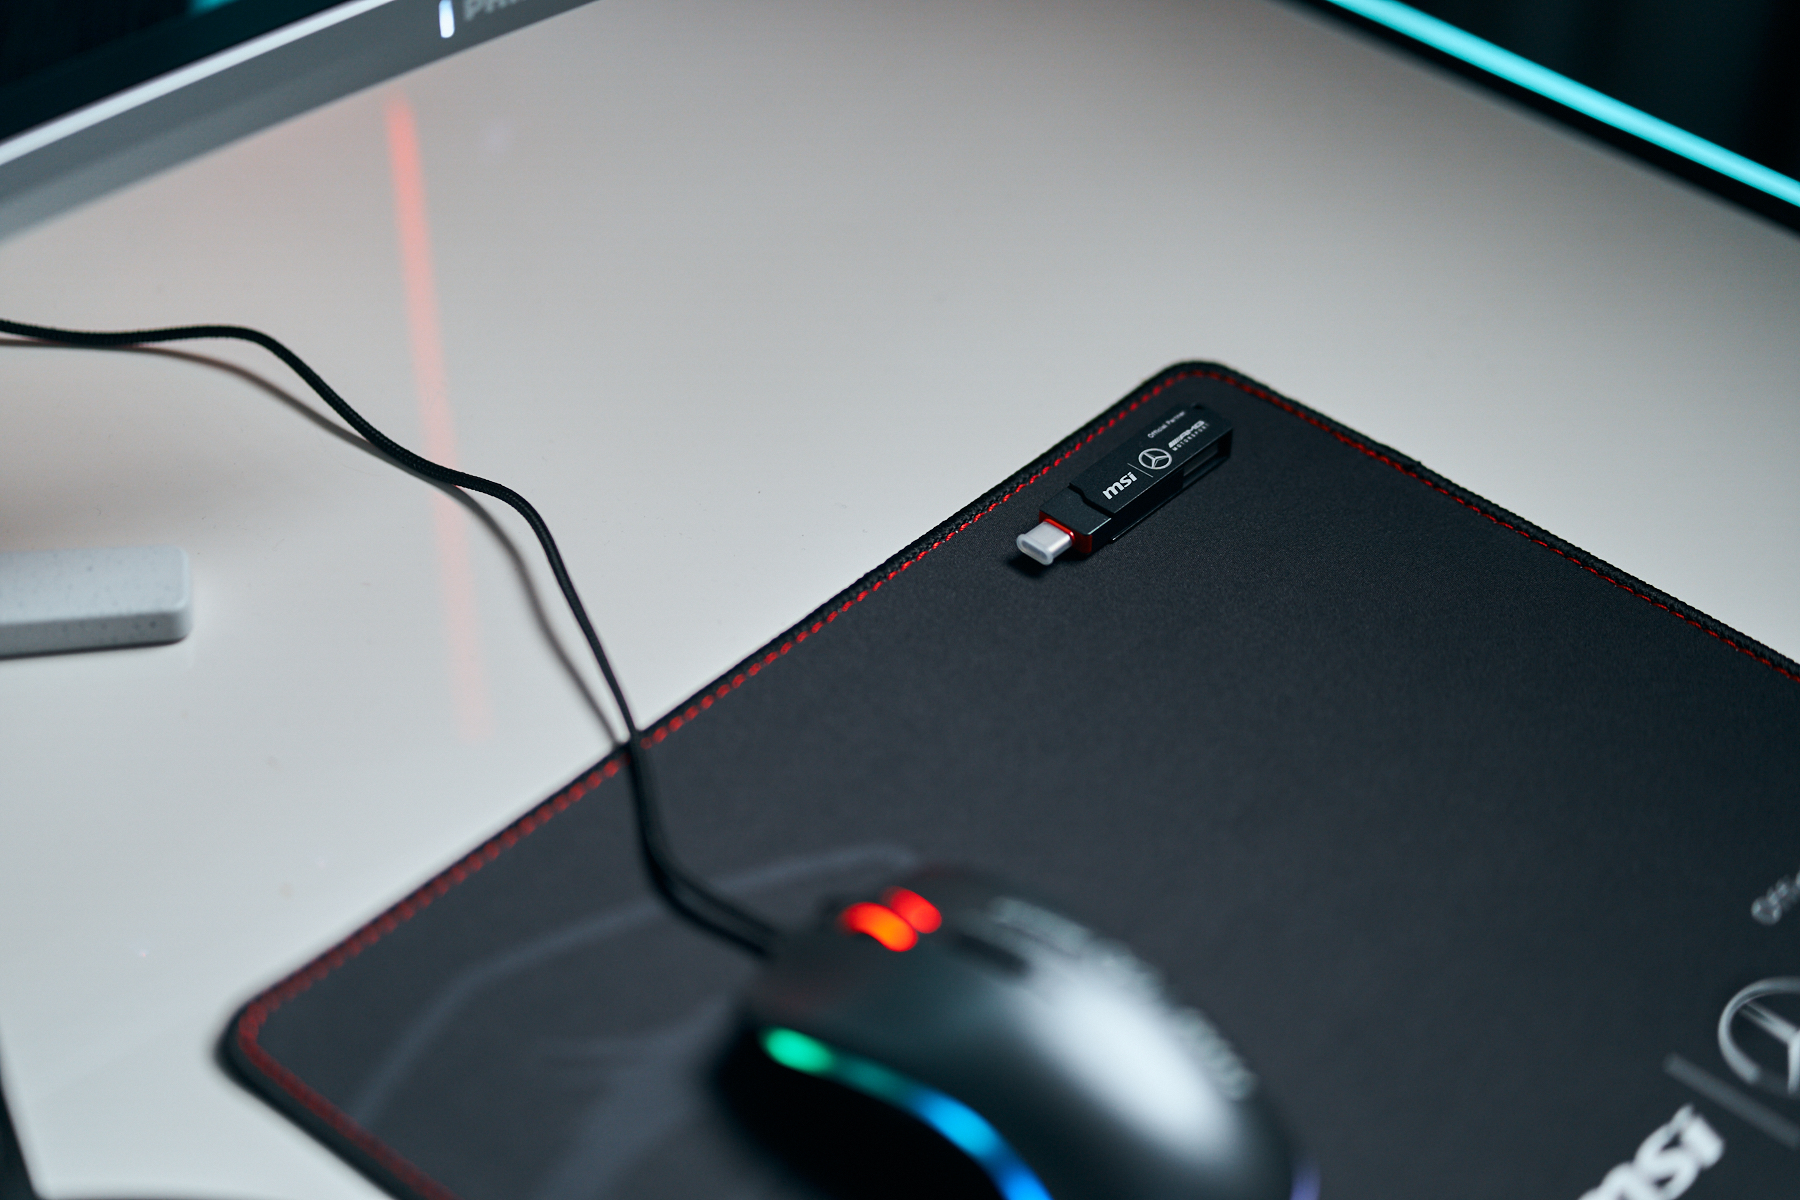
En ce qui concerne l'équipement, l'étendue de la livraison est particulièrement remarquable. Outre l'ordinateur portable et le bloc d'alimentation de 240 watts, la version Mercedes comprend une souris, un tapis de souris, une clé USB et une pochette d'accessoires.
Lecteur de carte SD
| SD Card Reader | |
| average JPG Copy Test (av. of 3 runs) | |
| MSI Stealth 16 Mercedes-AMG Motorsport A13VG (AV PRO microSD 128 GB V60) | |
| MSI Stealth 16 Studio A13VG | |
| Moyenne de la classe Gaming (20.9 - 210, n=54, 2 dernières années) | |
| Schenker XMG Pro 16 Studio (Mid 23) (AV PRO microSD 128 GB V60) | |
| Schenker XMG CORE 16 (L23) | |
| maximum AS SSD Seq Read Test (1GB) | |
| MSI Stealth 16 Mercedes-AMG Motorsport A13VG (AV PRO microSD 128 GB V60) | |
| MSI Stealth 16 Studio A13VG | |
| Moyenne de la classe Gaming (25.5 - 261, n=51, 2 dernières années) | |
| Schenker XMG Pro 16 Studio (Mid 23) (AV PRO microSD 128 GB V60) | |
| Schenker XMG CORE 16 (L23) | |
Communication
Webcam


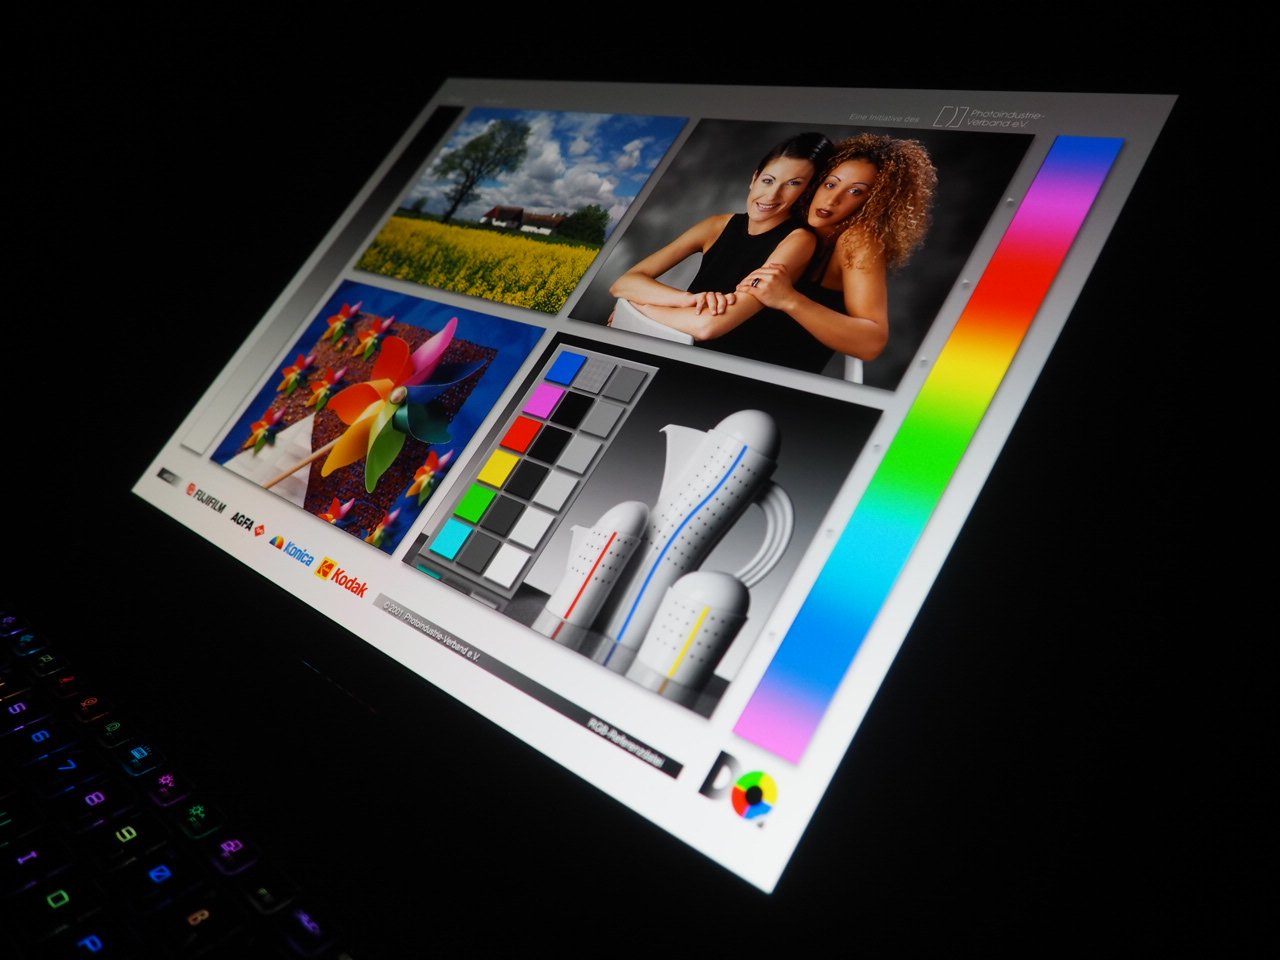
Affichage
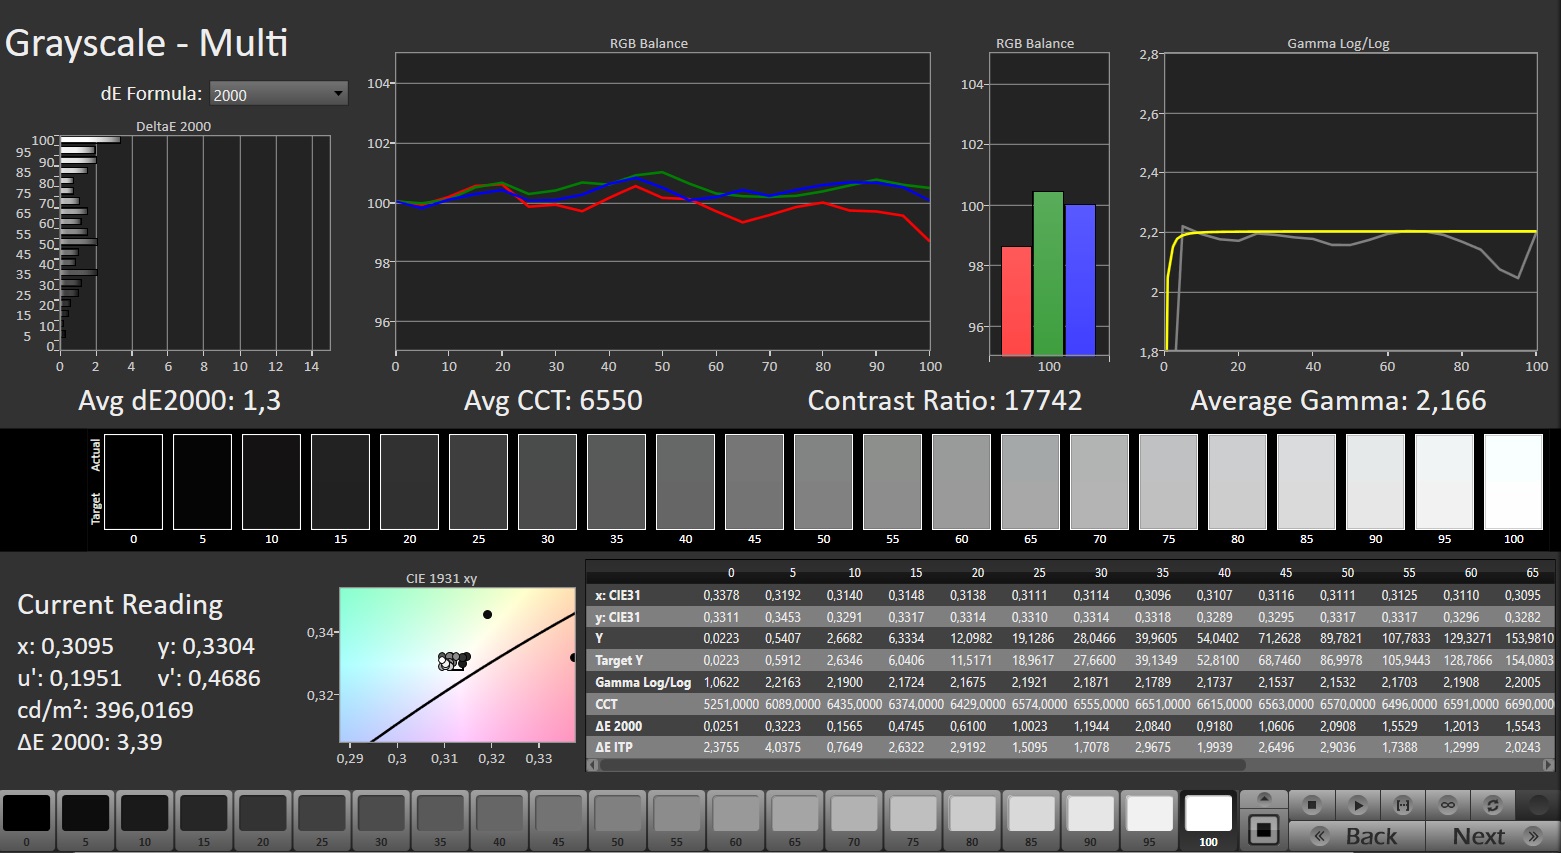
Comme indiqué précédemment, l'édition spéciale est équipée d'un panneau OLED qui offre une image extrêmement nette, grâce à sa haute résolution de 3 840 x 2 400 pixels au format 16:10.
| |||||||||||||||||||||||||
Homogénéité de la luminosité: 96 %
Valeur mesurée au centre, sur batterie: 382 cd/m²
Contraste: ∞:1 (Valeurs des noirs: 0 cd/m²)
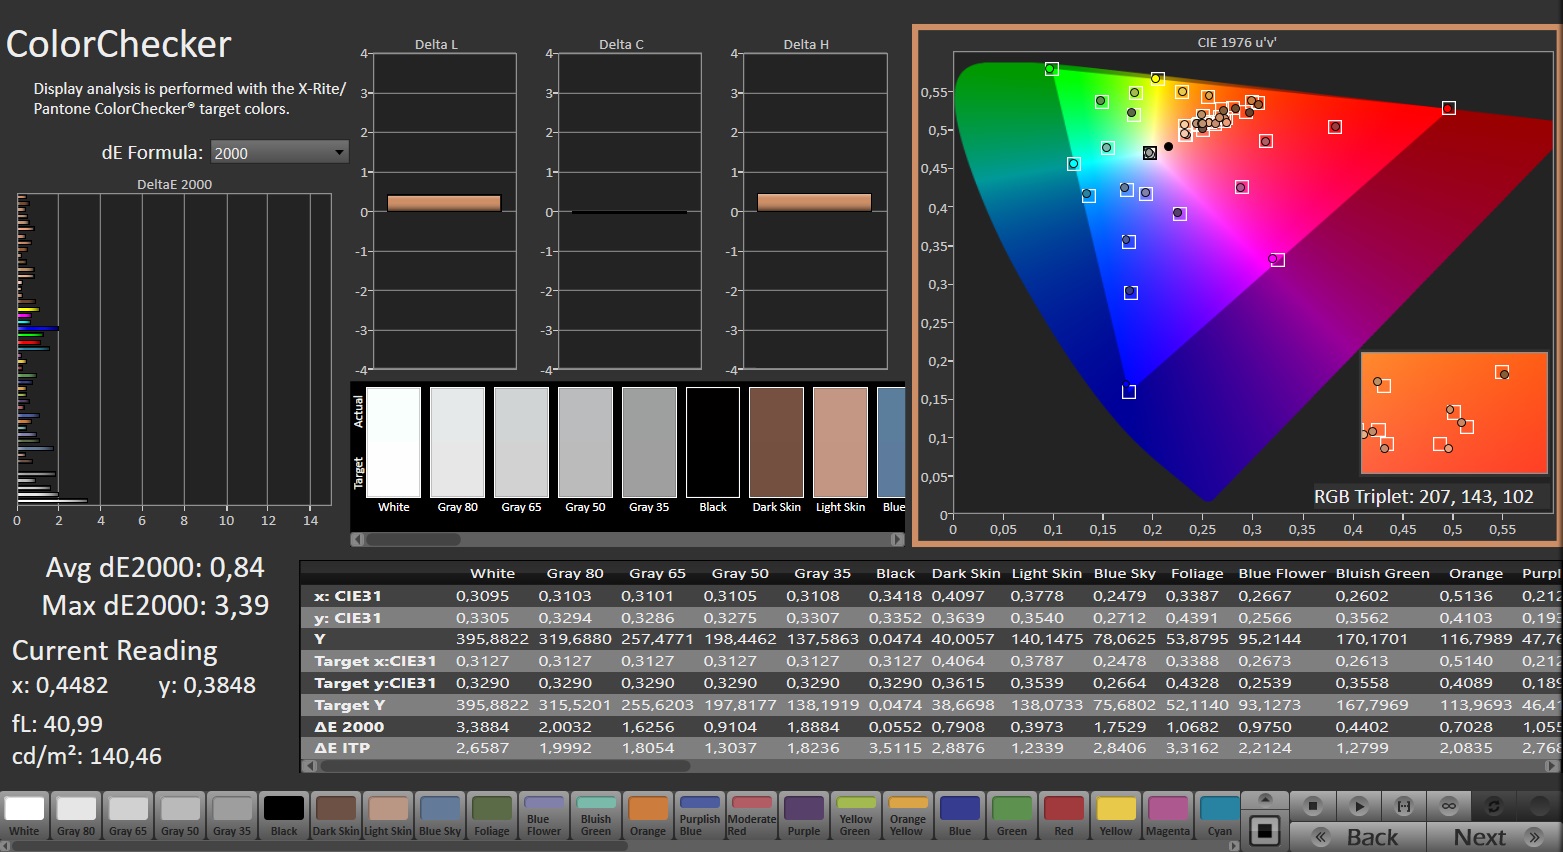
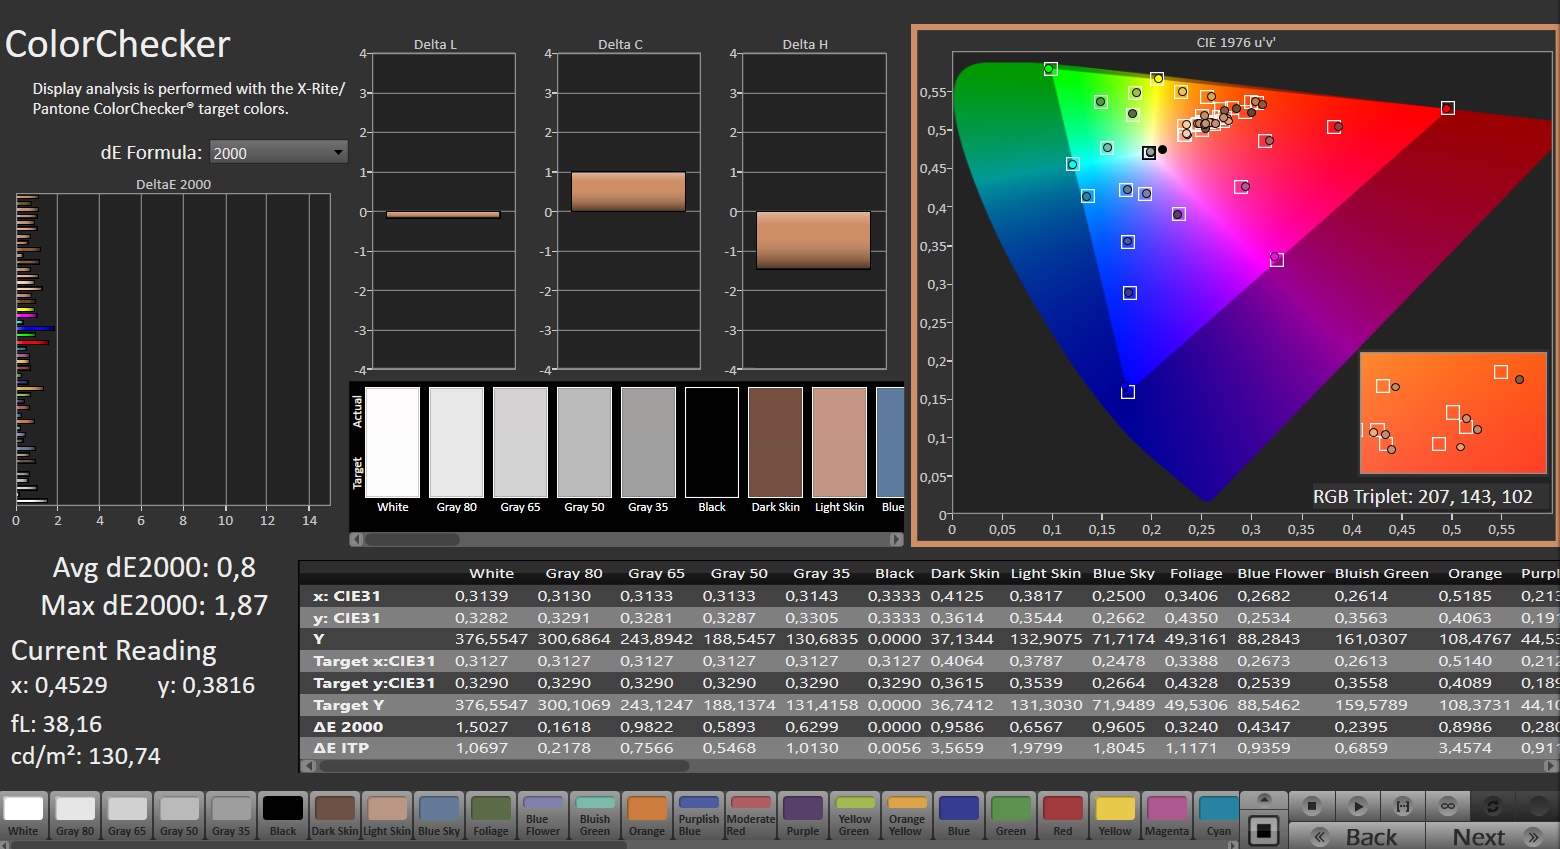
ΔE ColorChecker Calman: 0.84 | ∀{0.5-29.43 Ø4.72}
calibrated: 0.8
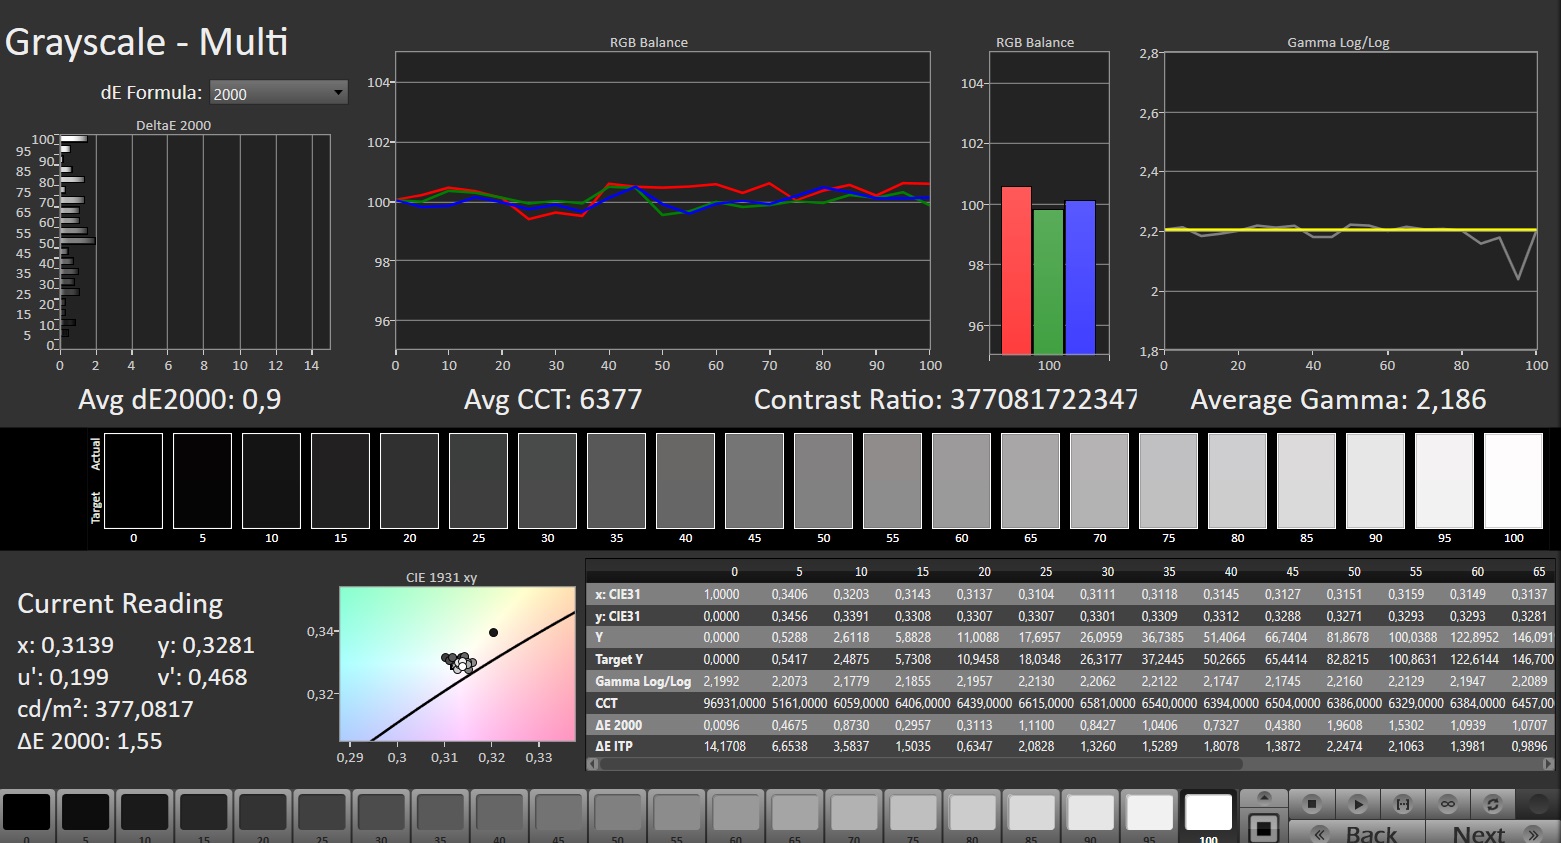
ΔE Greyscale Calman: 1.3 | ∀{0.09-98 Ø4.97}
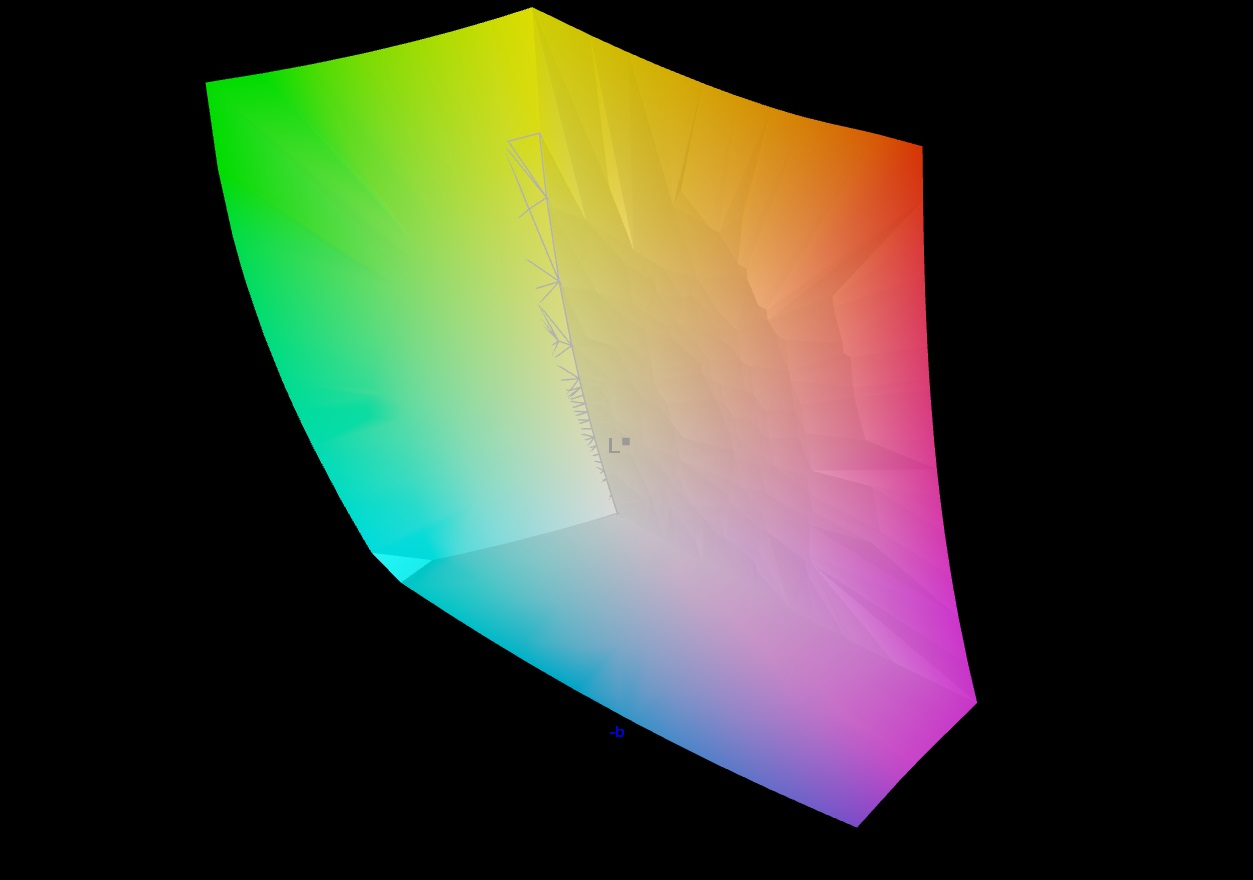
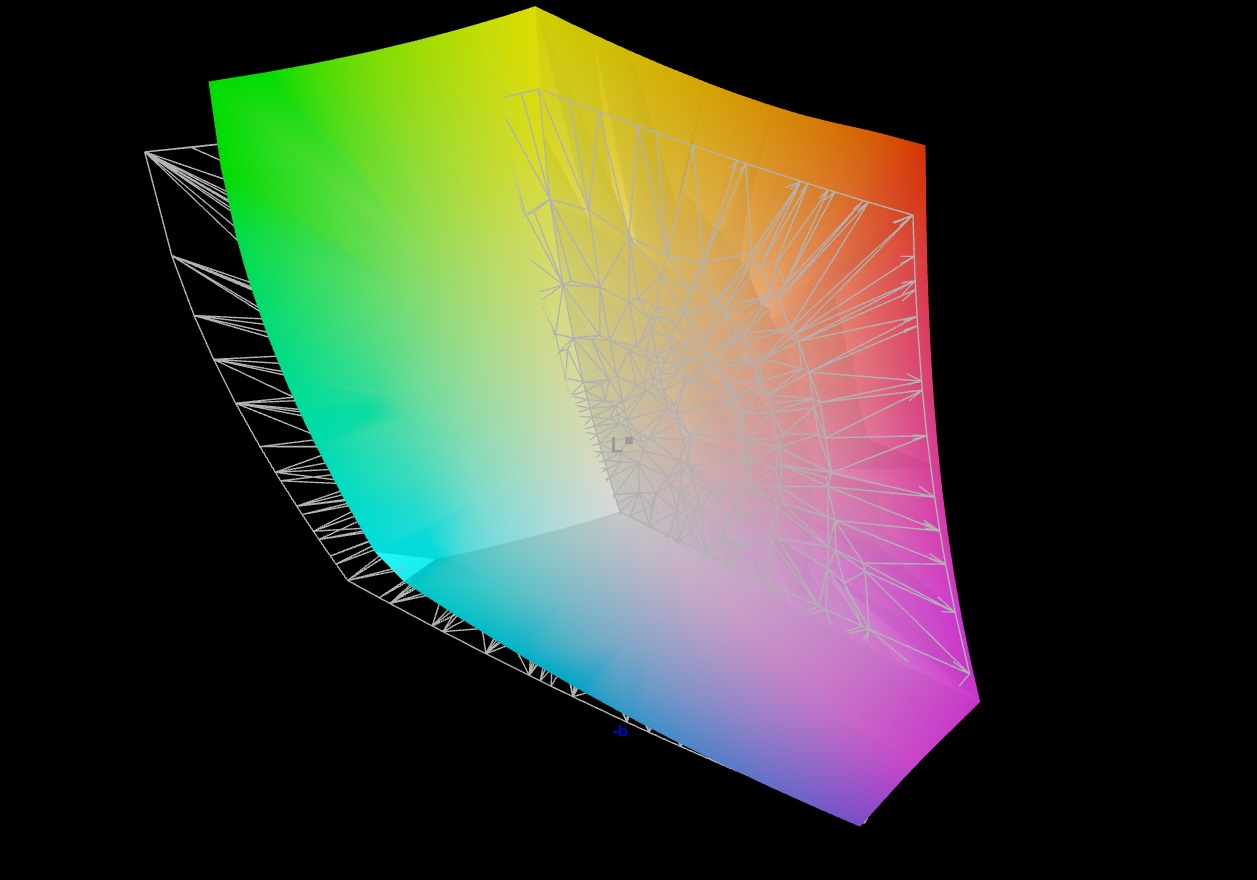
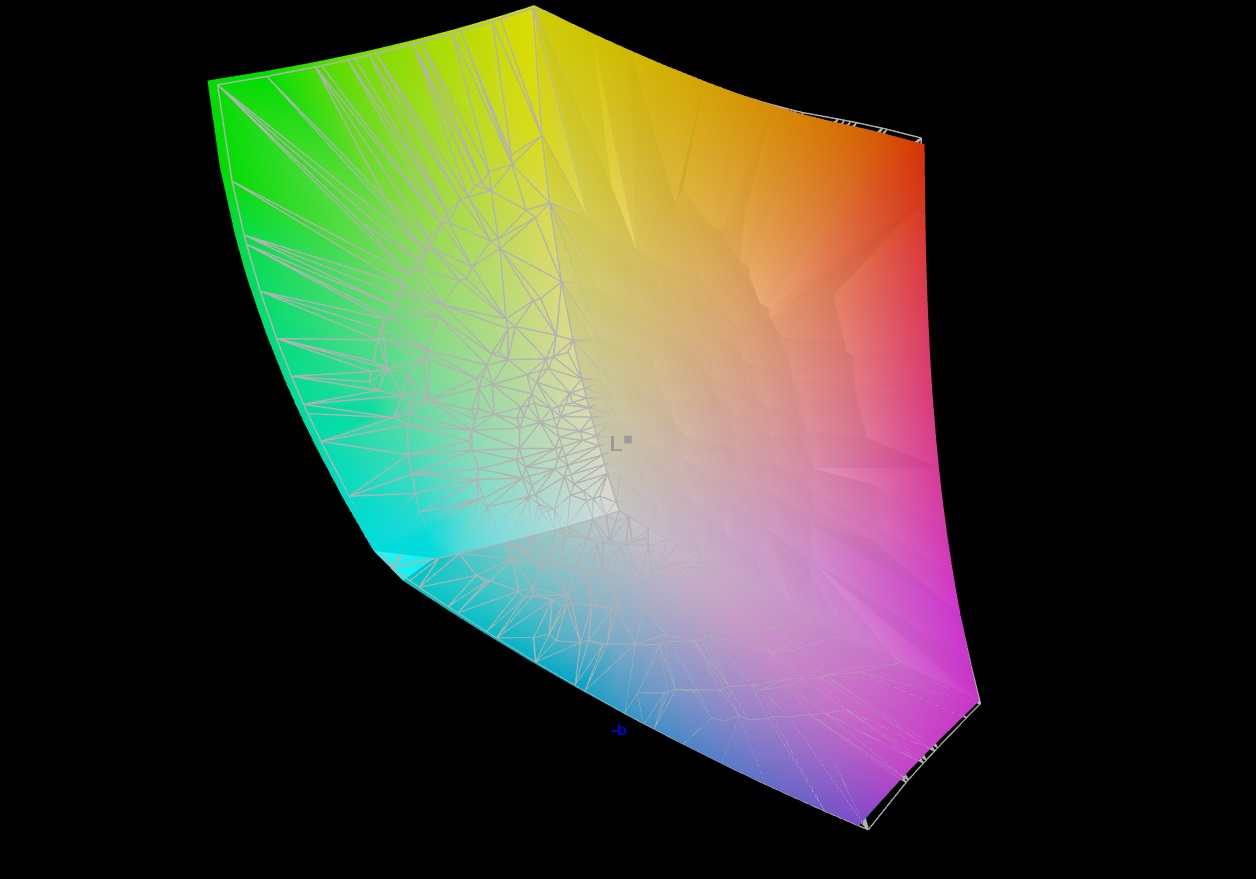
88.4% AdobeRGB 1998 (Argyll 3D)
99.9% sRGB (Argyll 3D)
99.2% Display P3 (Argyll 3D)
Gamma: 2.166
CCT: 6550 K
| MSI Stealth 16 Mercedes-AMG Motorsport A13VG ATNA60YV09-0 (SDC4191), OLED, 3840x2400, 16" | MSI Stealth 16 Studio A13VG AUO26A9, IPS, 2560x1600, 16" | Schenker XMG Pro 16 Studio (Mid 23) BOE CQ NE160QDM-NZ1, IPS, 2560x1600, 16" | HP Omen Transcend 16 AUOA3A6, Mini-LED, 2560x1600, 16" | Lenovo Legion Pro 5 16ARX8 CSOT T3 MNG007DA1-Q, IPS, 2560x1600, 16" | Schenker XMG CORE 16 (L23) BOE0AF0 (), IPS, 2560x1600, 16" | |
|---|---|---|---|---|---|---|
| Display | -2% | -18% | -0% | -16% | -18% | |
| Display P3 Coverage (%) | 99.2 | 96.4 -3% | 69.4 -30% | 99.2 0% | 70.4 -29% | 68.3 -31% |
| sRGB Coverage (%) | 99.9 | 99.7 0% | 98.2 -2% | 100 0% | 99.6 0% | 98.6 -1% |
| AdobeRGB 1998 Coverage (%) | 88.4 | 84.8 -4% | 70.1 -21% | 87.6 -1% | 72.6 -18% | 69.6 -21% |
| Response Times | -280% | -628% | -1955% | -513% | -615% | |
| Response Time Grey 50% / Grey 80% * (ms) | 1.5 ? | 4.4 ? -193% | 12.2 ? -713% | 26.4 ? -1660% | 7 ? -367% | 13.2 ? -780% |
| Response Time Black / White * (ms) | 1.2 ? | 5.6 ? -367% | 7.7 ? -542% | 28.2 ? -2250% | 9.1 ? -658% | 6.6 ? -450% |
| PWM Frequency (Hz) | 60 ? | 3506 ? | ||||
| Screen | -127% | -74% | -120% | 2% | -75% | |
| Brightness middle (cd/m²) | 382 | 424 11% | 349 -9% | 791.1 107% | 355.3 -7% | 376 -2% |
| Brightness (cd/m²) | 383 | 411 7% | 348 -9% | 800 109% | 340 -11% | 358 -7% |
| Brightness Distribution (%) | 96 | 88 -8% | 93 -3% | 95 -1% | 91 -5% | 88 -8% |
| Black Level * (cd/m²) | 0.37 | 0.32 | 0.04 | 0.32 | 0.33 | |
| Colorchecker dE 2000 * | 0.84 | 3.04 -262% | 1.98 -136% | 4.37 -420% | 1.13 -35% | 2.74 -226% |
| Colorchecker dE 2000 max. * | 3.39 | 7.5 -121% | 7.56 -123% | 10.39 -206% | 2.78 18% | 6.78 -100% |
| Colorchecker dE 2000 calibrated * | 0.8 | 3.04 -280% | 1.45 -81% | 1.04 -30% | 0.32 60% | 0.88 -10% |
| Greyscale dE 2000 * | 1.3 | 4.34 -234% | 3.3 -154% | 6.5 -400% | 1.4 -8% | 3.57 -175% |
| Gamma | 2.166 102% | 2.32 95% | 2.137 103% | 2.28 96% | 2.24 98% | 2.4 92% |
| CCT | 6550 99% | 6952 93% | 6672 97% | 6000 108% | 6372 102% | 7246 90% |
| Contrast (:1) | 1146 | 1091 | 19778 | 1110 | 1139 | |
| Moyenne finale (programmes/paramètres) | -136% /
-121% | -240% /
-152% | -692% /
-396% | -176% /
-88% | -236% /
-151% |
* ... Moindre est la valeur, meilleures sont les performances
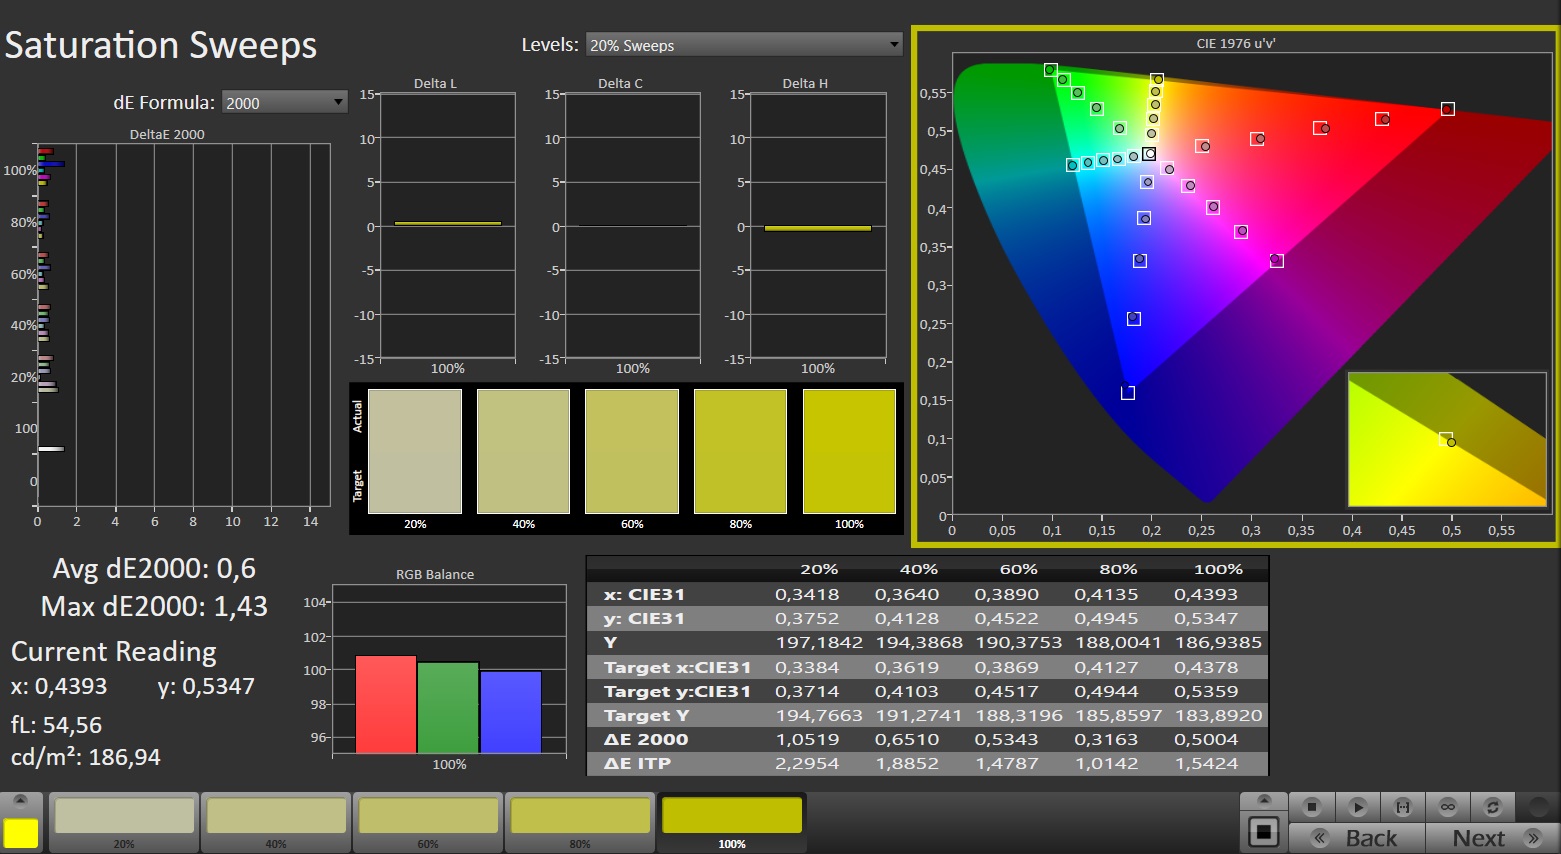
L'écran offre également de bonnes, voire de très bonnes performances à divers égards. Avec une couverture de près de 100 % de sRGB ou DCI-P3 et de 88 % d'AdobeRGB, il excelle dans l'espace colorimétrique. En outre, la précision des couleurs est de premier ordre, ce qui élimine le besoin d'étalonnage, contrairement à certains concurrents. Le niveau de noir exceptionnel de l'écran, proche de 0,0 cd/m², contribue à un contraste impressionnant caractéristique des OLED, surpassant les panneaux IPS traditionnels. La même supériorité s'étend à la stabilité de l'angle de vision et au temps de réponse, faisant des ordinateurs portables OLED la référence actuelle dans ces domaines.

Néanmoins, les acheteurs doivent faire face aux inconvénients habituels, notamment la basse fréquence et le scintillement. L'écran scintille à 60 Hz en dessous de 90 % de luminosité et à 240 Hz en dessous de 50 %. Ces valeurs peuvent poser des problèmes aux personnes sensibles à ces facteurs.
La surface brillante, qui provoque parfois des reflets importants, peut poser problème à de nombreux utilisateurs dans le cadre d'une utilisation quotidienne. Malgré une luminosité moyenne respectable de 383 cd/m², le Stealth 16 ne convient guère aux environnements extérieurs ou bien éclairés.
Temps de réponse de l'écran
| ↔ Temps de réponse noir à blanc | ||
|---|---|---|
| 1.2 ms ... hausse ↗ et chute ↘ combinées | ↗ 0.6 ms hausse | 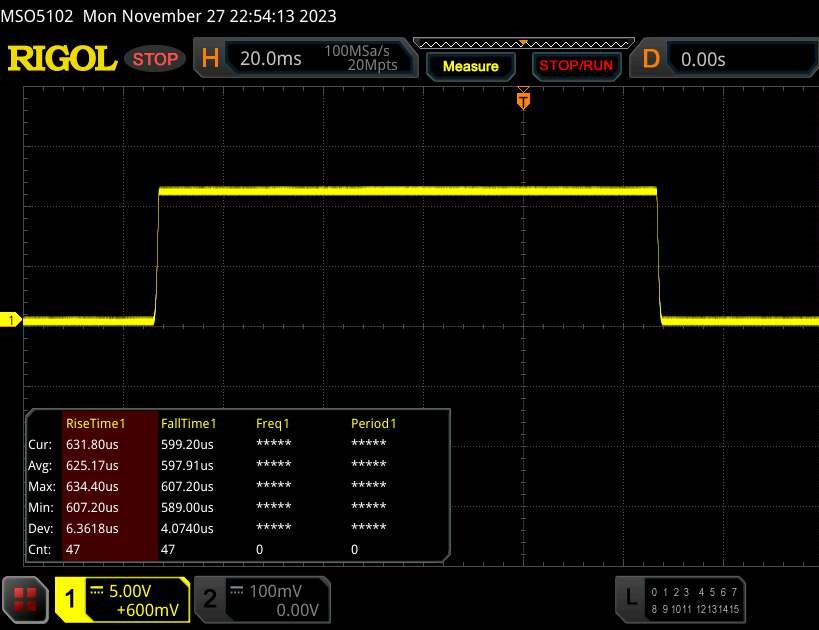 |
| ↘ 0.6 ms chute | ||
| L'écran montre de très faibles temps de réponse, parfait pour le jeu. En comparaison, tous les appareils testés affichent entre 0.1 (minimum) et 240 (maximum) ms. » 6 % des appareils testés affichent de meilleures performances. Cela signifie que les latences relevées sont meilleures que la moyenne (19.8 ms) de tous les appareils testés. | ||
| ↔ Temps de réponse gris 50% à gris 80% | ||
| 1.5 ms ... hausse ↗ et chute ↘ combinées | ↗ 0.8 ms hausse | 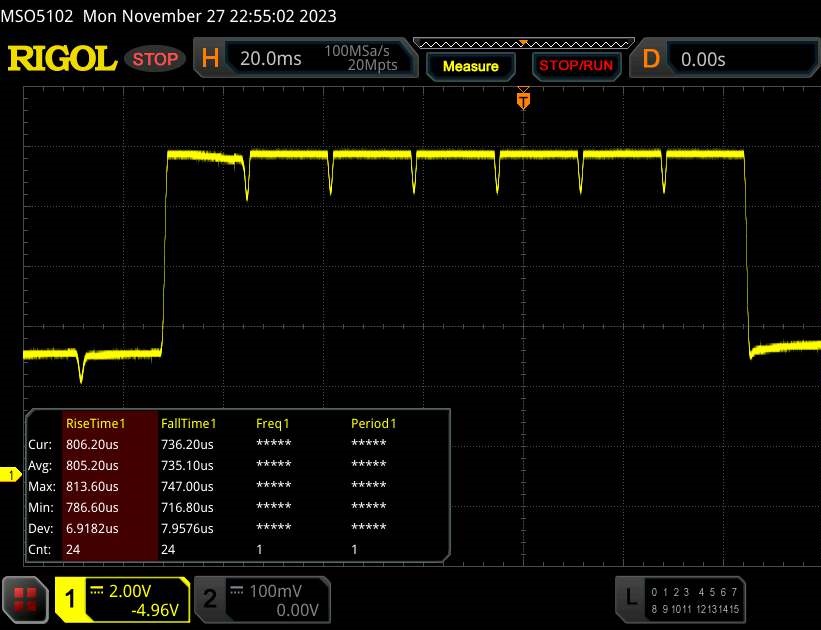 |
| ↘ 0.7 ms chute | ||
| L'écran montre de très faibles temps de réponse, parfait pour le jeu. En comparaison, tous les appareils testés affichent entre 0.165 (minimum) et 636 (maximum) ms. » 7 % des appareils testés affichent de meilleures performances. Cela signifie que les latences relevées sont meilleures que la moyenne (31 ms) de tous les appareils testés. | ||
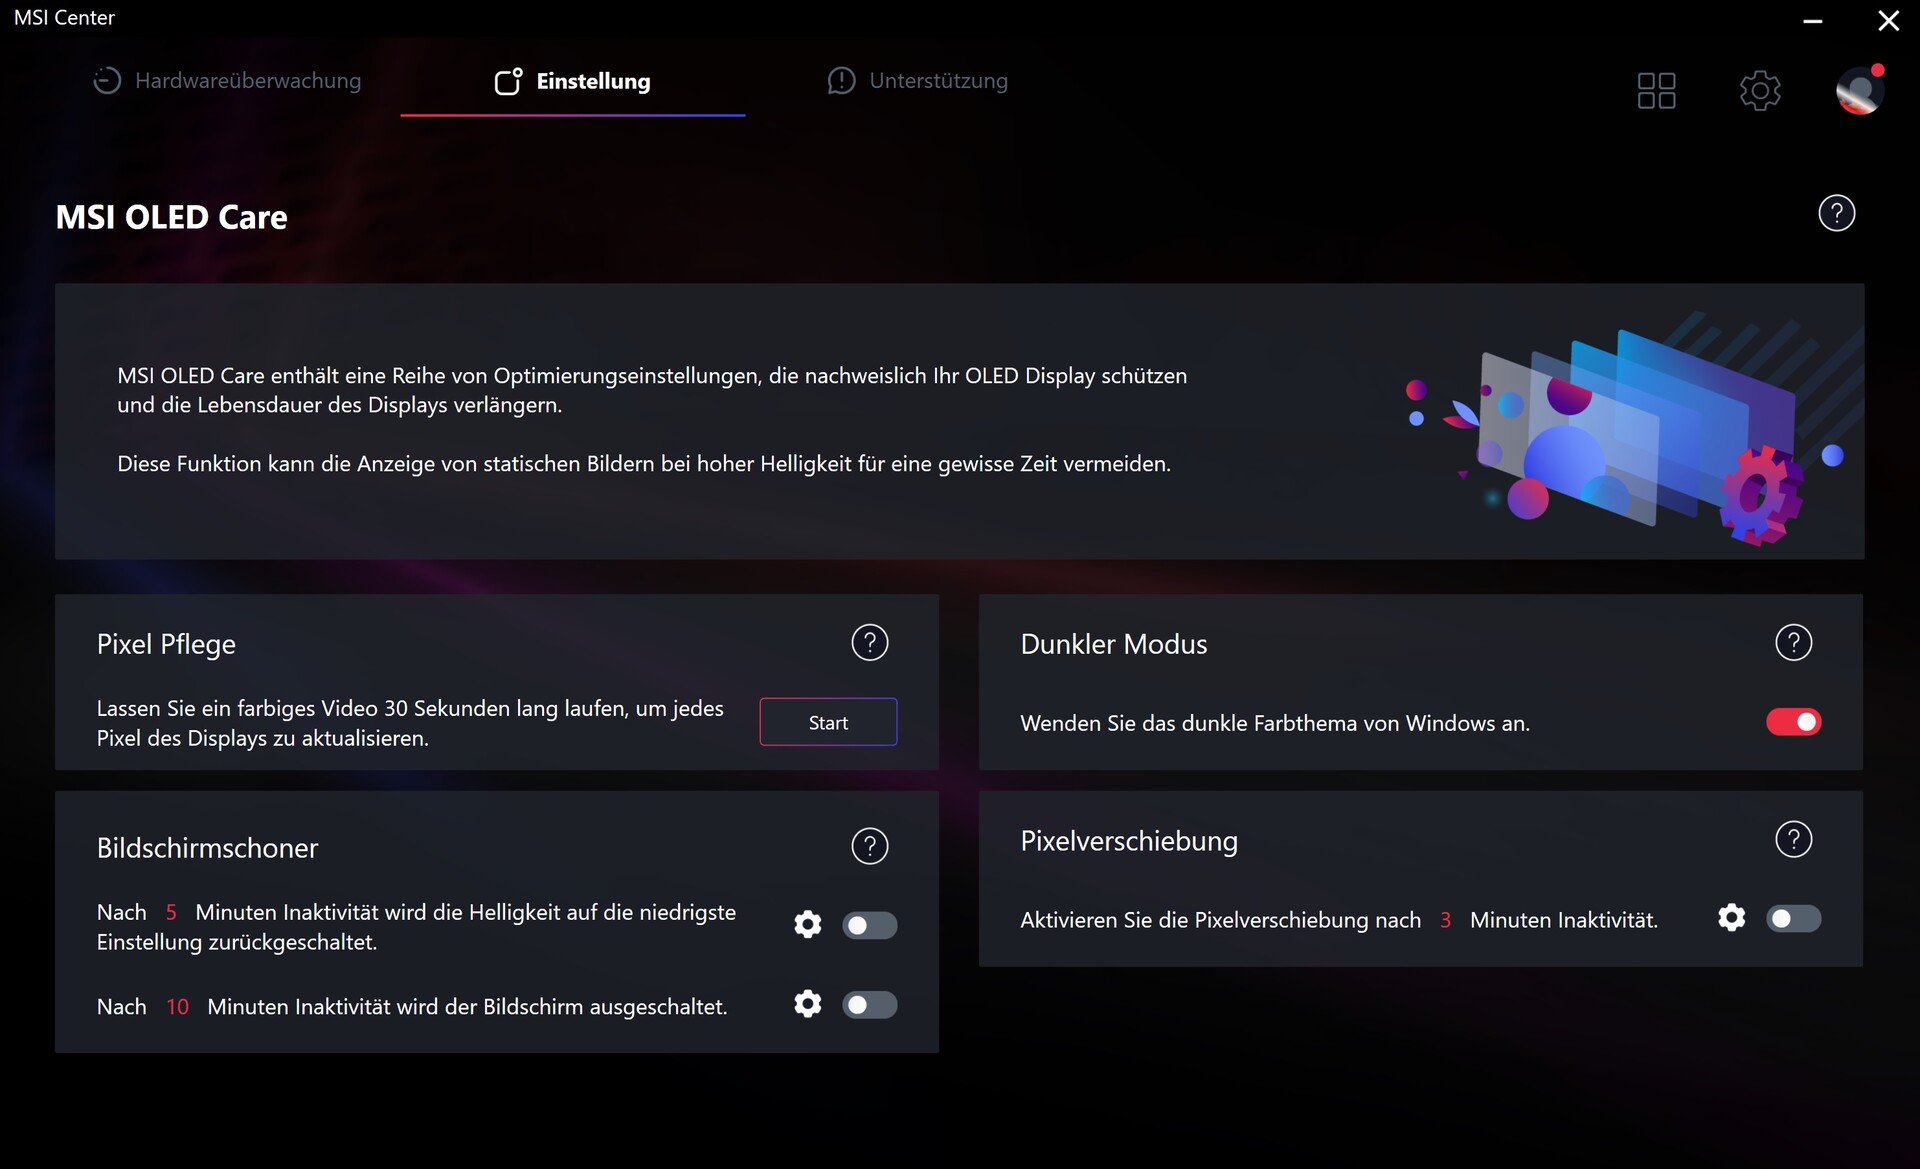
Scintillement / MLI (Modulation de largeur d'impulsion)
| Scintillement / MLI (Modulation de largeur d'impulsion) décelé | 60 Hz | ≤ 90 Niveau de luminosité | 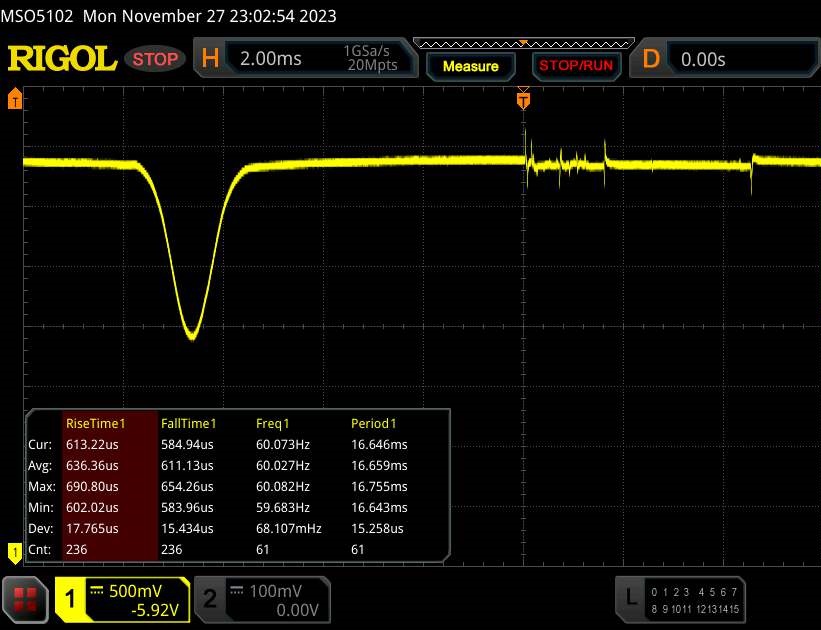 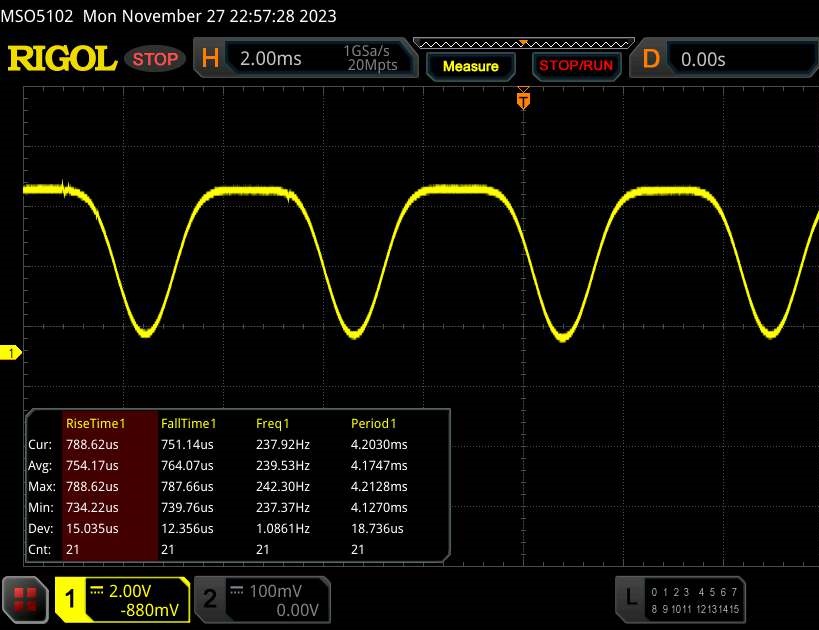 |
Le rétroéclairage de l'écran scintille à la fréquence de 60 Hz (certainement du fait de l'utilisation d'une MDI - Modulation de largeur d'impulsion) à un niveau de luminosité inférieur ou égal à 90 % . Aucun scintillement ne devrait être perceptible au-dessus de cette valeur. La fréquence de rafraîchissement de 60 Hz est extrêmement faible, de grands risques de fatigue oculaire accrue et de maux de tête en cas d'utilisation prolongée. En comparaison, 52 % des appareils testés n'emploient pas MDI pour assombrir leur écran. Nous avons relevé une moyenne à 7772 (minimum : 5 - maximum : 343500) Hz dans le cas où une MDI était active. | |||
Performance
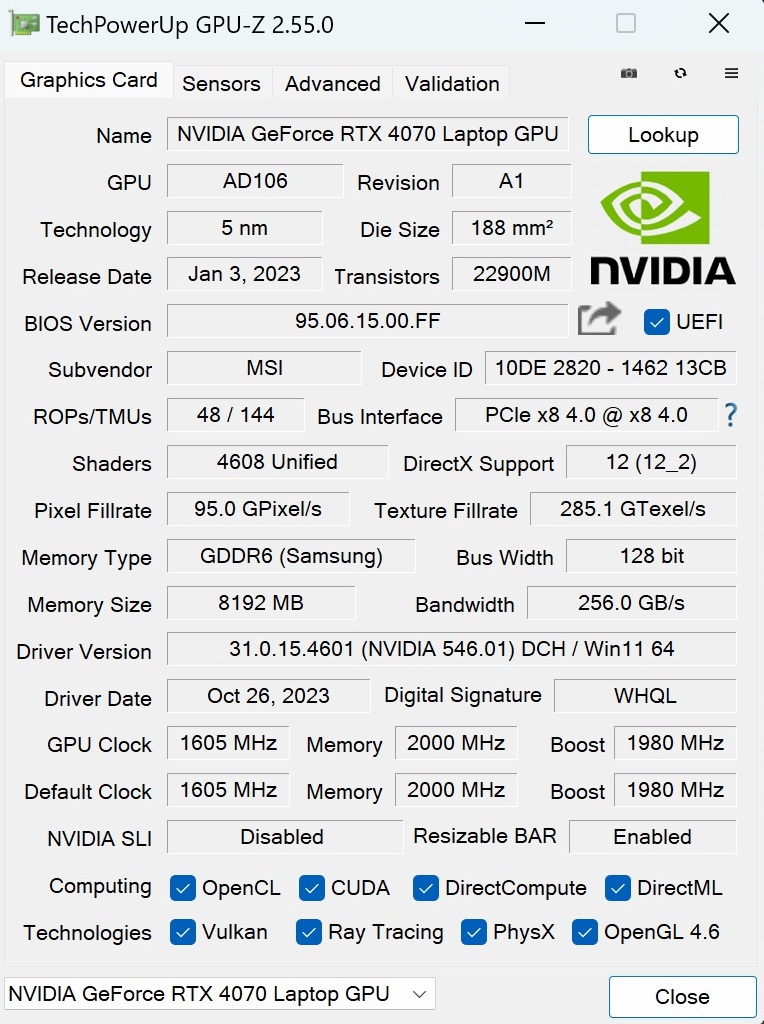
Avec seulement 8 Go de VRAM pour la GeForce RTX 4070, qui était considérée comme dépassée dans ce segment de prix lors de sa sortie, le 16-incher se situe dans le milieu de gamme supérieur, en particulier en termes de performances GPU. Les performances de son processeur sont de haut niveau, le Stealth 16 est juste au sommet, et la configuration de la RAM et du SSD devrait offrir des réserves suffisantes pour la plupart des utilisateurs.
Conditions d'essai
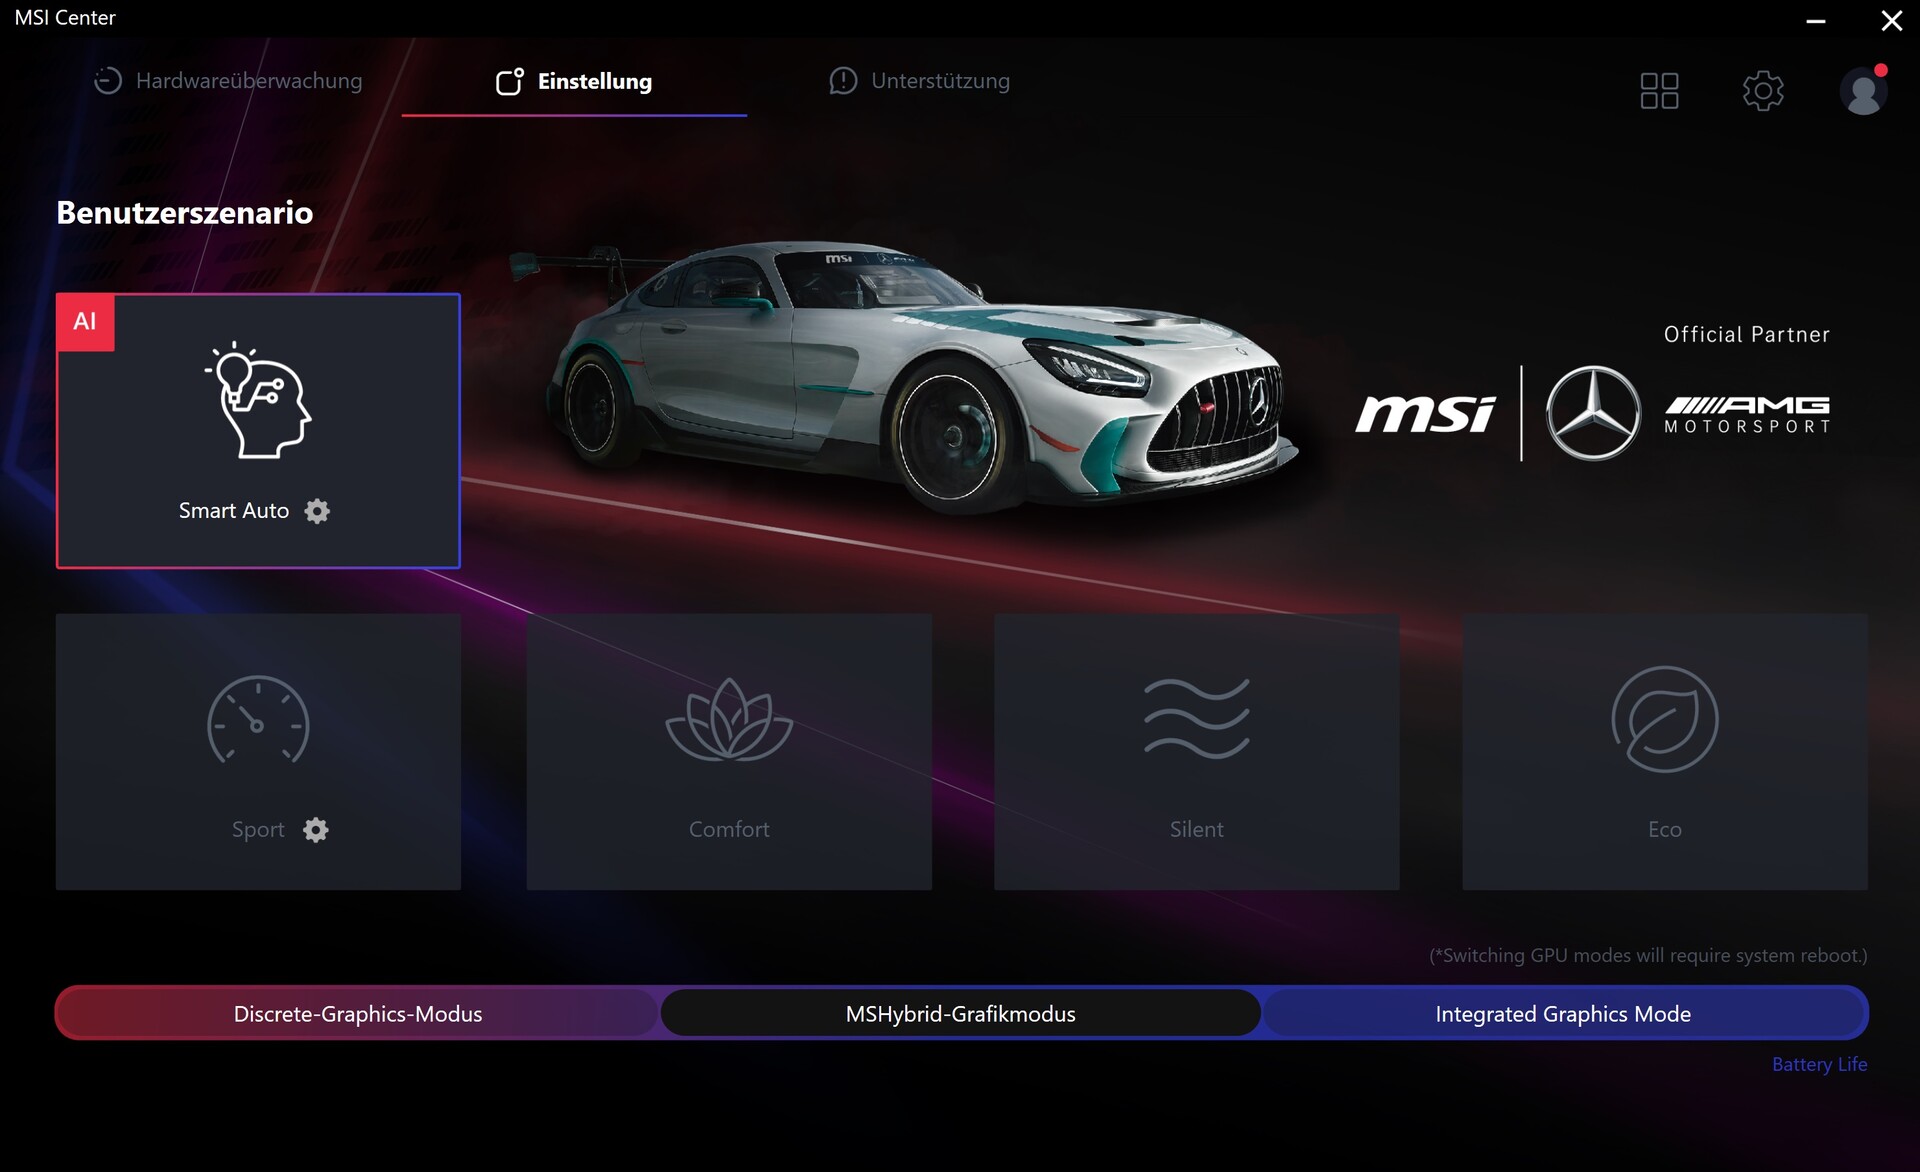
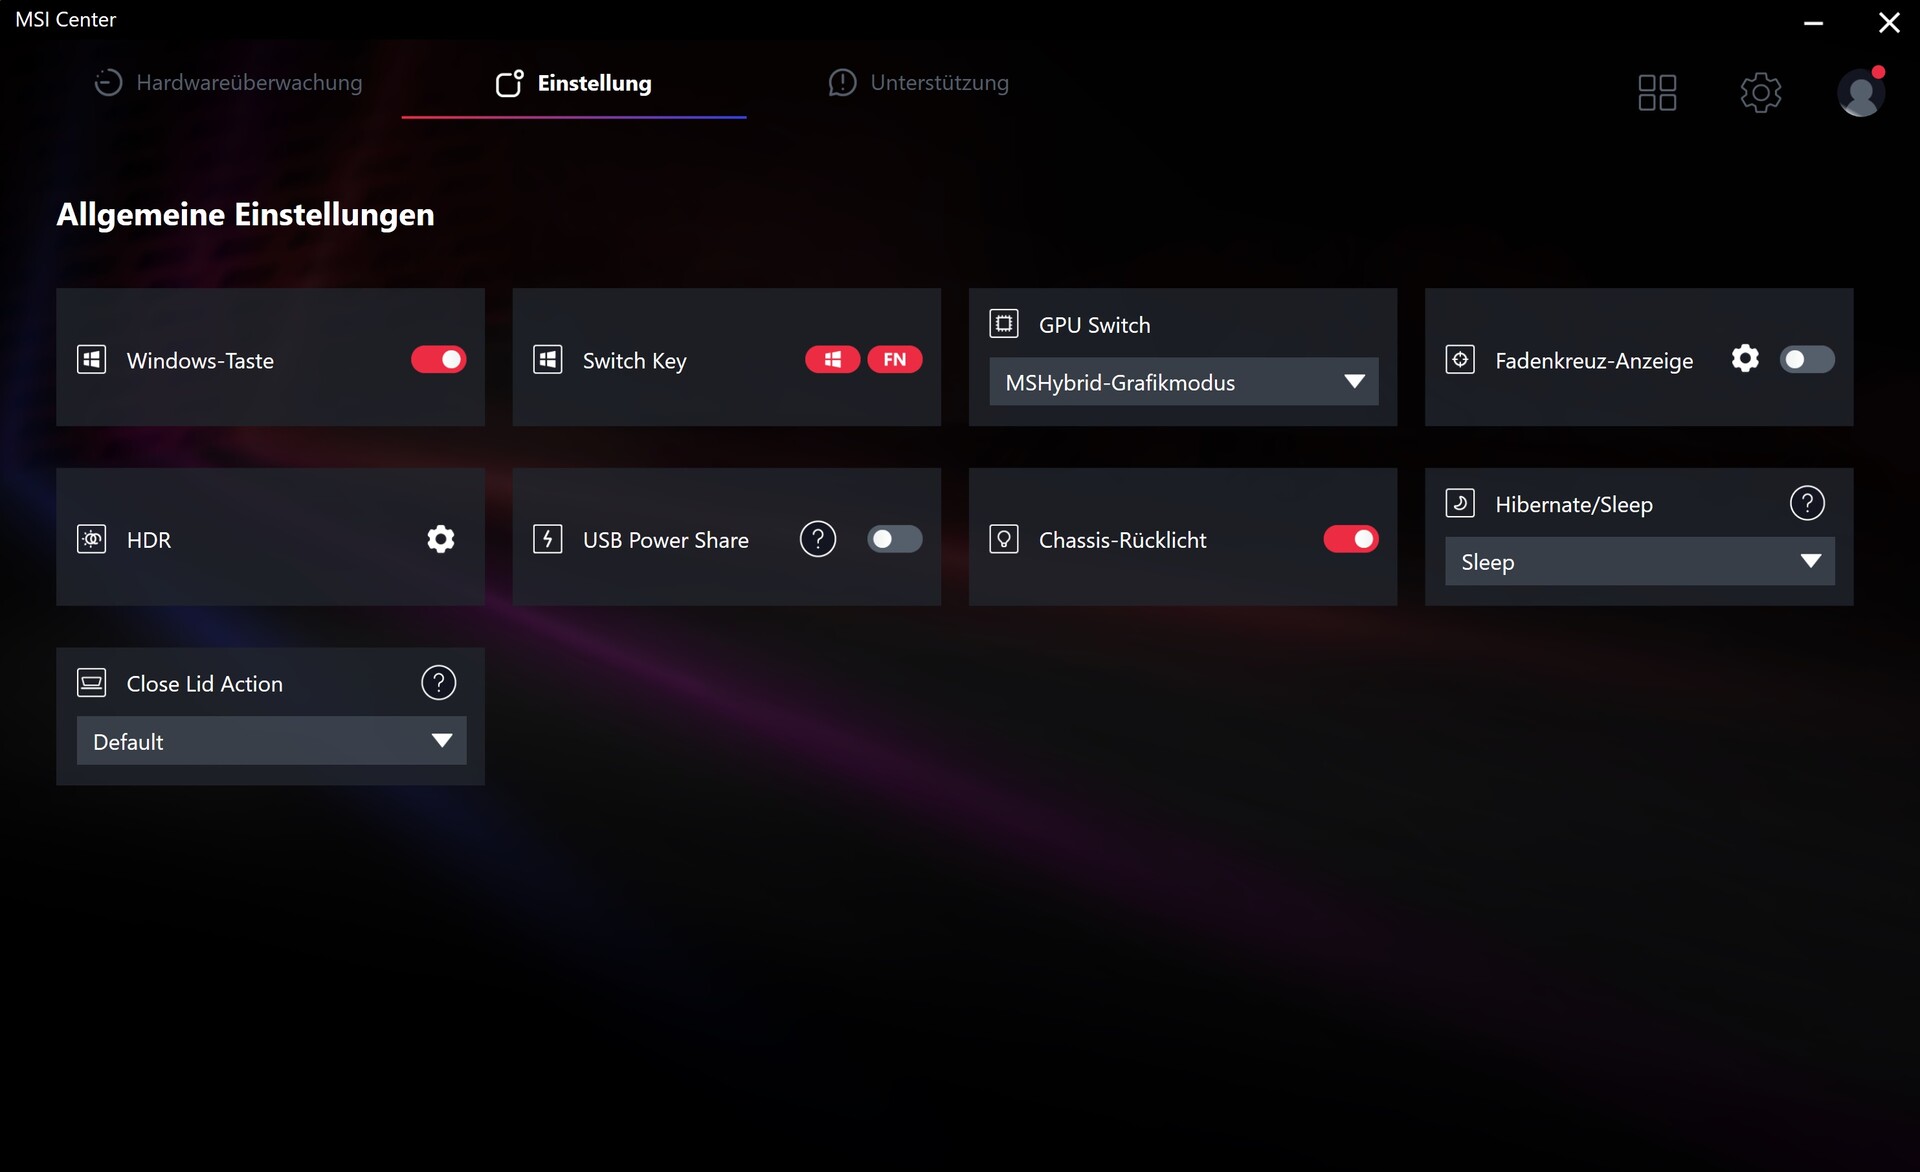
Le MSI Center préinstallé propose différents modes de fonctionnement, allant d'Eco à Sport. Toutes les mesures ont été effectuées en mode Smart Auto, dans lequel le système ajuste automatiquement les paramètres. La commutation graphique (MSHybrid) était activée par défaut.
| Sport | Confort | Silencieux | Eco | |
|---|---|---|---|---|
| Performance (Witcher 3, FHD/Ultra) | 120 fps | 110 fps | 90 fps | 90 fps |
| Bruit (Witcher 3, FHD/Ultra) | 49 dB(A) | 45 dB(A) | 36 dB(A) | 34 dB(A) |
| Limite de puissance 1 (HWInfo) | 100 w | 45 w | 25 w | 15 w |
| Limite de puissance 2 (HWInfo) | 160 w | 45 w | 45 w | 15 w |
Processeur
La mise à niveau de l'i7-13700H vers l'i9-13900H dans nos tests de CPU a montré une amélioration marginale des performances. Les résultats des benchmarks sont restés similaires à ceux de la version standard. Lors de la boucle Cinebench, deux baisses temporaires ont été observées, contrairement à la concurrence. Le Core i9-13900H est un processeur haut de gamme puissant mais gourmand en énergie, doté de 6 cœurs de performance avec Hyper-Threading et de 8 cœurs d'efficacité sans HT (20 threads au total).
Cinebench R15 Multi Loop
* ... Moindre est la valeur, meilleures sont les performances
AIDA64: FP32 Ray-Trace | FPU Julia | CPU SHA3 | CPU Queen | FPU SinJulia | FPU Mandel | CPU AES | CPU ZLib | FP64 Ray-Trace | CPU PhotoWorxx
| Performance rating | |
| Moyenne de la classe Gaming | |
| HP Omen Transcend 16 | |
| Lenovo Legion Pro 5 16ARX8 | |
| Schenker XMG CORE 16 (L23) | |
| MSI Stealth 16 Mercedes-AMG Motorsport A13VG | |
| Schenker XMG Pro 16 Studio (Mid 23) | |
| MSI Stealth 16 Studio A13VG | |
| Moyenne Intel Core i9-13900H | |
| AIDA64 / FP32 Ray-Trace | |
| Moyenne de la classe Gaming (10227 - 85542, n=108, 2 dernières années) | |
| Lenovo Legion Pro 5 16ARX8 | |
| Schenker XMG CORE 16 (L23) | |
| HP Omen Transcend 16 | |
| MSI Stealth 16 Mercedes-AMG Motorsport A13VG | |
| MSI Stealth 16 Studio A13VG | |
| Schenker XMG Pro 16 Studio (Mid 23) | |
| Moyenne Intel Core i9-13900H (6788 - 19557, n=25) | |
| AIDA64 / FPU Julia | |
| Moyenne de la classe Gaming (51376 - 238426, n=108, 2 dernières années) | |
| Lenovo Legion Pro 5 16ARX8 | |
| Schenker XMG CORE 16 (L23) | |
| HP Omen Transcend 16 | |
| MSI Stealth 16 Mercedes-AMG Motorsport A13VG | |
| Schenker XMG Pro 16 Studio (Mid 23) | |
| MSI Stealth 16 Studio A13VG | |
| Moyenne Intel Core i9-13900H (22551 - 95579, n=25) | |
| AIDA64 / CPU SHA3 | |
| Moyenne de la classe Gaming (2180 - 9817, n=108, 2 dernières années) | |
| HP Omen Transcend 16 | |
| Lenovo Legion Pro 5 16ARX8 | |
| Schenker XMG CORE 16 (L23) | |
| MSI Stealth 16 Mercedes-AMG Motorsport A13VG | |
| MSI Stealth 16 Studio A13VG | |
| Schenker XMG Pro 16 Studio (Mid 23) | |
| Moyenne Intel Core i9-13900H (2491 - 4270, n=25) | |
| AIDA64 / CPU Queen | |
| Lenovo Legion Pro 5 16ARX8 | |
| HP Omen Transcend 16 | |
| Moyenne de la classe Gaming (49785 - 173351, n=96, 2 dernières années) | |
| MSI Stealth 16 Mercedes-AMG Motorsport A13VG | |
| MSI Stealth 16 Studio A13VG | |
| Moyenne Intel Core i9-13900H (65121 - 120936, n=25) | |
| Schenker XMG CORE 16 (L23) | |
| Schenker XMG Pro 16 Studio (Mid 23) | |
| AIDA64 / FPU SinJulia | |
| Lenovo Legion Pro 5 16ARX8 | |
| Schenker XMG CORE 16 (L23) | |
| Moyenne de la classe Gaming (4424 - 33636, n=108, 2 dernières années) | |
| HP Omen Transcend 16 | |
| MSI Stealth 16 Mercedes-AMG Motorsport A13VG | |
| MSI Stealth 16 Studio A13VG | |
| Schenker XMG Pro 16 Studio (Mid 23) | |
| Moyenne Intel Core i9-13900H (6108 - 11631, n=25) | |
| AIDA64 / FPU Mandel | |
| Moyenne de la classe Gaming (25115 - 128721, n=108, 2 dernières années) | |
| Lenovo Legion Pro 5 16ARX8 | |
| Schenker XMG CORE 16 (L23) | |
| HP Omen Transcend 16 | |
| MSI Stealth 16 Mercedes-AMG Motorsport A13VG | |
| MSI Stealth 16 Studio A13VG | |
| Schenker XMG Pro 16 Studio (Mid 23) | |
| Moyenne Intel Core i9-13900H (11283 - 48474, n=25) | |
| AIDA64 / CPU AES | |
| Schenker XMG Pro 16 Studio (Mid 23) | |
| HP Omen Transcend 16 | |
| Moyenne de la classe Gaming (39258 - 247074, n=108, 2 dernières années) | |
| Schenker XMG CORE 16 (L23) | |
| Moyenne Intel Core i9-13900H (3691 - 149377, n=25) | |
| MSI Stealth 16 Mercedes-AMG Motorsport A13VG | |
| MSI Stealth 16 Studio A13VG | |
| Lenovo Legion Pro 5 16ARX8 | |
| AIDA64 / CPU ZLib | |
| HP Omen Transcend 16 | |
| Moyenne de la classe Gaming (574 - 2531, n=108, 2 dernières années) | |
| MSI Stealth 16 Mercedes-AMG Motorsport A13VG | |
| Lenovo Legion Pro 5 16ARX8 | |
| Schenker XMG CORE 16 (L23) | |
| Schenker XMG Pro 16 Studio (Mid 23) | |
| Moyenne Intel Core i9-13900H (789 - 1254, n=25) | |
| MSI Stealth 16 Studio A13VG | |
| AIDA64 / FP64 Ray-Trace | |
| Moyenne de la classe Gaming (5509 - 45446, n=108, 2 dernières années) | |
| Lenovo Legion Pro 5 16ARX8 | |
| Schenker XMG CORE 16 (L23) | |
| HP Omen Transcend 16 | |
| MSI Stealth 16 Mercedes-AMG Motorsport A13VG | |
| MSI Stealth 16 Studio A13VG | |
| Schenker XMG Pro 16 Studio (Mid 23) | |
| Moyenne Intel Core i9-13900H (3655 - 10716, n=25) | |
| AIDA64 / CPU PhotoWorxx | |
| HP Omen Transcend 16 | |
| Schenker XMG Pro 16 Studio (Mid 23) | |
| MSI Stealth 16 Mercedes-AMG Motorsport A13VG | |
| MSI Stealth 16 Studio A13VG | |
| Moyenne de la classe Gaming (12271 - 89891, n=108, 2 dernières années) | |
| Schenker XMG CORE 16 (L23) | |
| Moyenne Intel Core i9-13900H (10871 - 50488, n=25) | |
| Lenovo Legion Pro 5 16ARX8 | |
Performance du système
Malgré des composants très rapides, les performances système du Stealth 16 se classent à l'avant-dernière place de la comparaison, juste devant la version Studio standard. Les différences sont mineures et, dans la pratique, il est peu probable que les utilisateurs remarquent des différences significatives.
CrossMark: Overall | Productivity | Creativity | Responsiveness
| PCMark 10 / Score | |
| Moyenne de la classe Gaming (5828 - 11574, n=96, 2 dernières années) | |
| Lenovo Legion Pro 5 16ARX8 | |
| Schenker XMG CORE 16 (L23) | |
| HP Omen Transcend 16 | |
| Schenker XMG Pro 16 Studio (Mid 23) | |
| Moyenne Intel Core i9-13900H, NVIDIA GeForce RTX 4070 Laptop GPU (5855 - 8538, n=8) | |
| MSI Stealth 16 Mercedes-AMG Motorsport A13VG | |
| MSI Stealth 16 Studio A13VG | |
| PCMark 10 / Essentials | |
| Schenker XMG Pro 16 Studio (Mid 23) | |
| HP Omen Transcend 16 | |
| Lenovo Legion Pro 5 16ARX8 | |
| Schenker XMG CORE 16 (L23) | |
| MSI Stealth 16 Mercedes-AMG Motorsport A13VG | |
| Moyenne Intel Core i9-13900H, NVIDIA GeForce RTX 4070 Laptop GPU (8835 - 11940, n=8) | |
| Moyenne de la classe Gaming (8810 - 12600, n=100, 2 dernières années) | |
| MSI Stealth 16 Studio A13VG | |
| PCMark 10 / Productivity | |
| Moyenne de la classe Gaming (6845 - 21327, n=98, 2 dernières années) | |
| Schenker XMG CORE 16 (L23) | |
| Schenker XMG Pro 16 Studio (Mid 23) | |
| Lenovo Legion Pro 5 16ARX8 | |
| Moyenne Intel Core i9-13900H, NVIDIA GeForce RTX 4070 Laptop GPU (7967 - 10991, n=8) | |
| HP Omen Transcend 16 | |
| MSI Stealth 16 Mercedes-AMG Motorsport A13VG | |
| MSI Stealth 16 Studio A13VG | |
| PCMark 10 / Digital Content Creation | |
| Moyenne de la classe Gaming (7602 - 19657, n=98, 2 dernières années) | |
| HP Omen Transcend 16 | |
| Lenovo Legion Pro 5 16ARX8 | |
| Schenker XMG CORE 16 (L23) | |
| Moyenne Intel Core i9-13900H, NVIDIA GeForce RTX 4070 Laptop GPU (7738 - 13575, n=8) | |
| Schenker XMG Pro 16 Studio (Mid 23) | |
| MSI Stealth 16 Studio A13VG | |
| MSI Stealth 16 Mercedes-AMG Motorsport A13VG | |
| CrossMark / Overall | |
| Lenovo Legion Pro 5 16ARX8 | |
| Moyenne de la classe Gaming (1366 - 2409, n=96, 2 dernières années) | |
| HP Omen Transcend 16 | |
| Schenker XMG Pro 16 Studio (Mid 23) | |
| Moyenne Intel Core i9-13900H, NVIDIA GeForce RTX 4070 Laptop GPU (1104 - 1974, n=7) | |
| MSI Stealth 16 Studio A13VG | |
| Schenker XMG CORE 16 (L23) | |
| CrossMark / Productivity | |
| Lenovo Legion Pro 5 16ARX8 | |
| Schenker XMG Pro 16 Studio (Mid 23) | |
| Moyenne de la classe Gaming (1386 - 2254, n=96, 2 dernières années) | |
| HP Omen Transcend 16 | |
| Moyenne Intel Core i9-13900H, NVIDIA GeForce RTX 4070 Laptop GPU (1058 - 1914, n=7) | |
| MSI Stealth 16 Studio A13VG | |
| Schenker XMG CORE 16 (L23) | |
| CrossMark / Creativity | |
| HP Omen Transcend 16 | |
| Moyenne de la classe Gaming (1343 - 2729, n=96, 2 dernières années) | |
| Lenovo Legion Pro 5 16ARX8 | |
| Schenker XMG Pro 16 Studio (Mid 23) | |
| Moyenne Intel Core i9-13900H, NVIDIA GeForce RTX 4070 Laptop GPU (1178 - 2254, n=7) | |
| MSI Stealth 16 Studio A13VG | |
| Schenker XMG CORE 16 (L23) | |
| CrossMark / Responsiveness | |
| Schenker XMG Pro 16 Studio (Mid 23) | |
| Lenovo Legion Pro 5 16ARX8 | |
| Moyenne de la classe Gaming (1226 - 2334, n=96, 2 dernières années) | |
| Moyenne Intel Core i9-13900H, NVIDIA GeForce RTX 4070 Laptop GPU (1037 - 1952, n=7) | |
| MSI Stealth 16 Studio A13VG | |
| HP Omen Transcend 16 | |
| Schenker XMG CORE 16 (L23) | |
| PCMark 10 Score | 7334 points | |
Aide | ||
| AIDA64 / Memory Copy | |
| HP Omen Transcend 16 | |
| Moyenne de la classe Gaming (21750 - 129946, n=108, 2 dernières années) | |
| Schenker XMG Pro 16 Studio (Mid 23) | |
| MSI Stealth 16 Studio A13VG | |
| MSI Stealth 16 Mercedes-AMG Motorsport A13VG | |
| Schenker XMG CORE 16 (L23) | |
| Moyenne Intel Core i9-13900H (37448 - 74486, n=25) | |
| Lenovo Legion Pro 5 16ARX8 | |
| AIDA64 / Memory Read | |
| HP Omen Transcend 16 | |
| Schenker XMG Pro 16 Studio (Mid 23) | |
| MSI Stealth 16 Studio A13VG | |
| MSI Stealth 16 Mercedes-AMG Motorsport A13VG | |
| Moyenne de la classe Gaming (22956 - 118858, n=108, 2 dernières années) | |
| Moyenne Intel Core i9-13900H (41599 - 75433, n=25) | |
| Schenker XMG CORE 16 (L23) | |
| Lenovo Legion Pro 5 16ARX8 | |
| AIDA64 / Memory Write | |
| Schenker XMG CORE 16 (L23) | |
| HP Omen Transcend 16 | |
| Moyenne de la classe Gaming (22297 - 135096, n=108, 2 dernières années) | |
| MSI Stealth 16 Mercedes-AMG Motorsport A13VG | |
| Schenker XMG Pro 16 Studio (Mid 23) | |
| MSI Stealth 16 Studio A13VG | |
| Moyenne Intel Core i9-13900H (36152 - 88505, n=25) | |
| Lenovo Legion Pro 5 16ARX8 | |
| AIDA64 / Memory Latency | |
| Moyenne de la classe Gaming (75.3 - 259, n=108, 2 dernières années) | |
| Moyenne Intel Core i9-13900H (75.8 - 102.3, n=25) | |
| MSI Stealth 16 Mercedes-AMG Motorsport A13VG | |
| Schenker XMG CORE 16 (L23) | |
| HP Omen Transcend 16 | |
| MSI Stealth 16 Studio A13VG | |
| Schenker XMG Pro 16 Studio (Mid 23) | |
| Lenovo Legion Pro 5 16ARX8 | |
* ... Moindre est la valeur, meilleures sont les performances
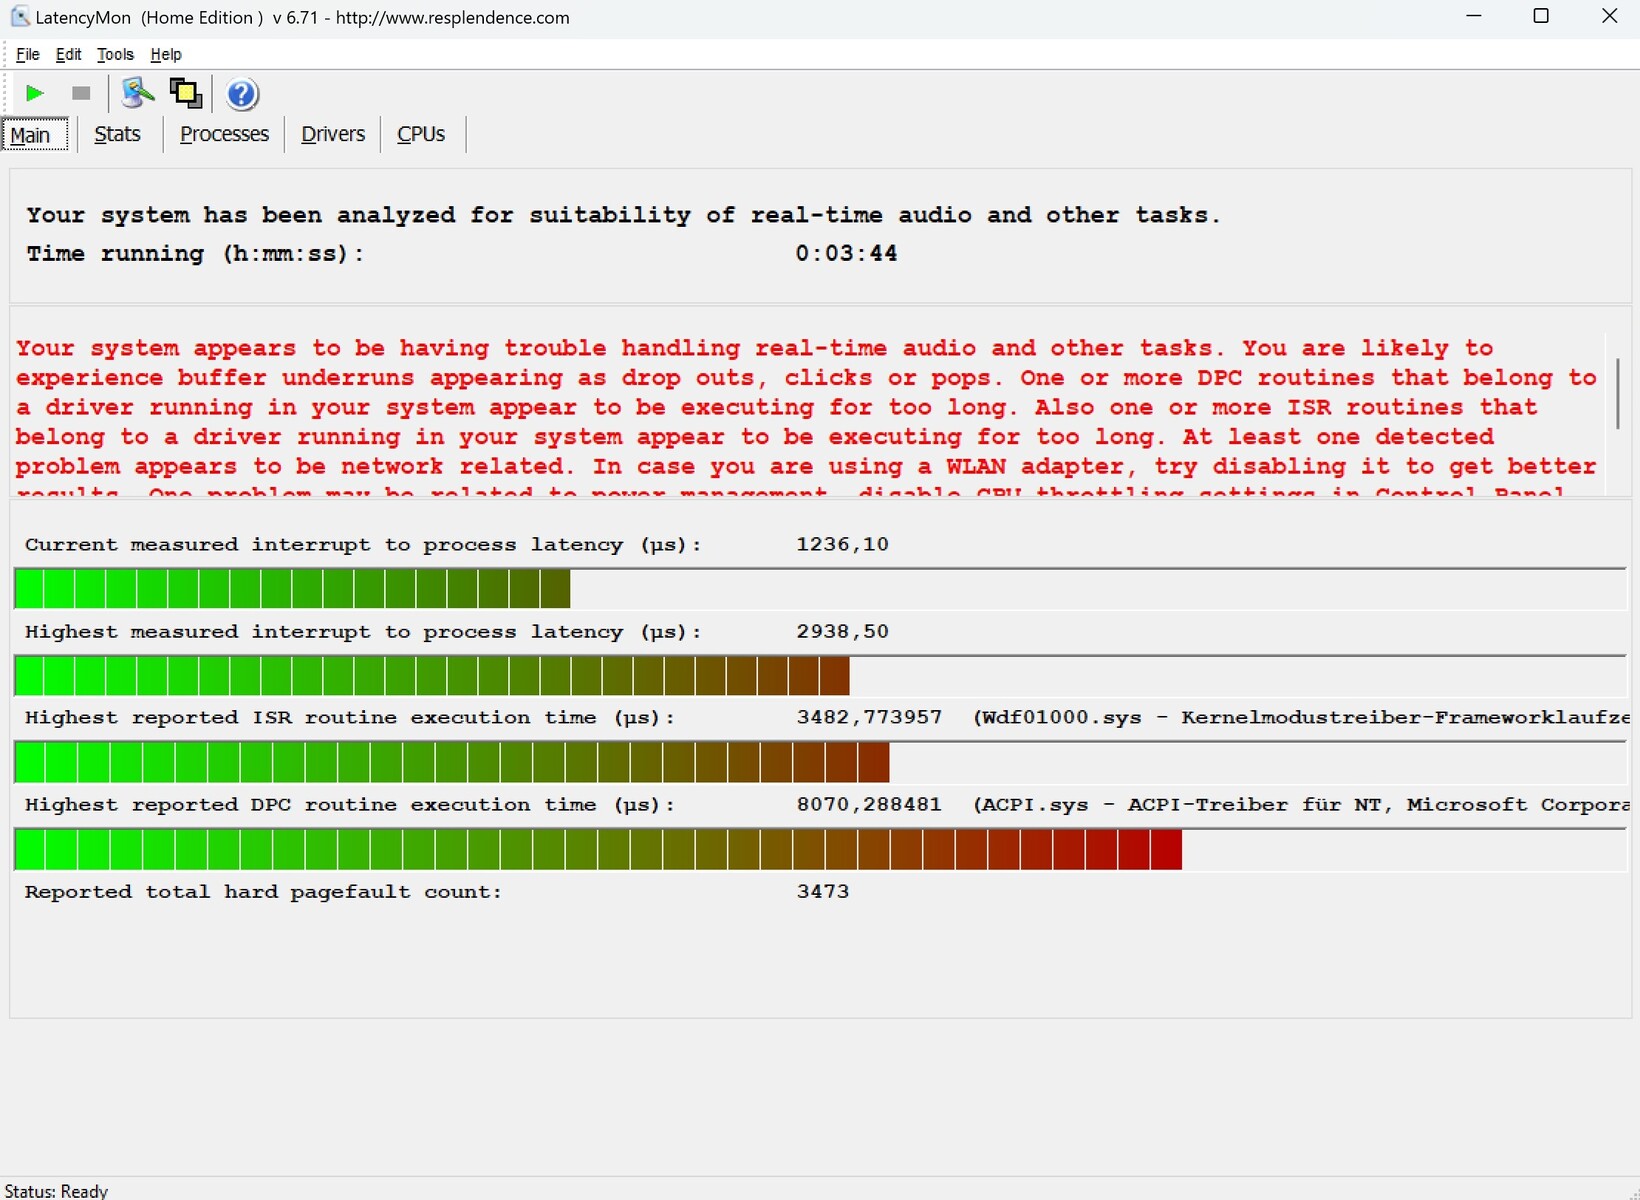
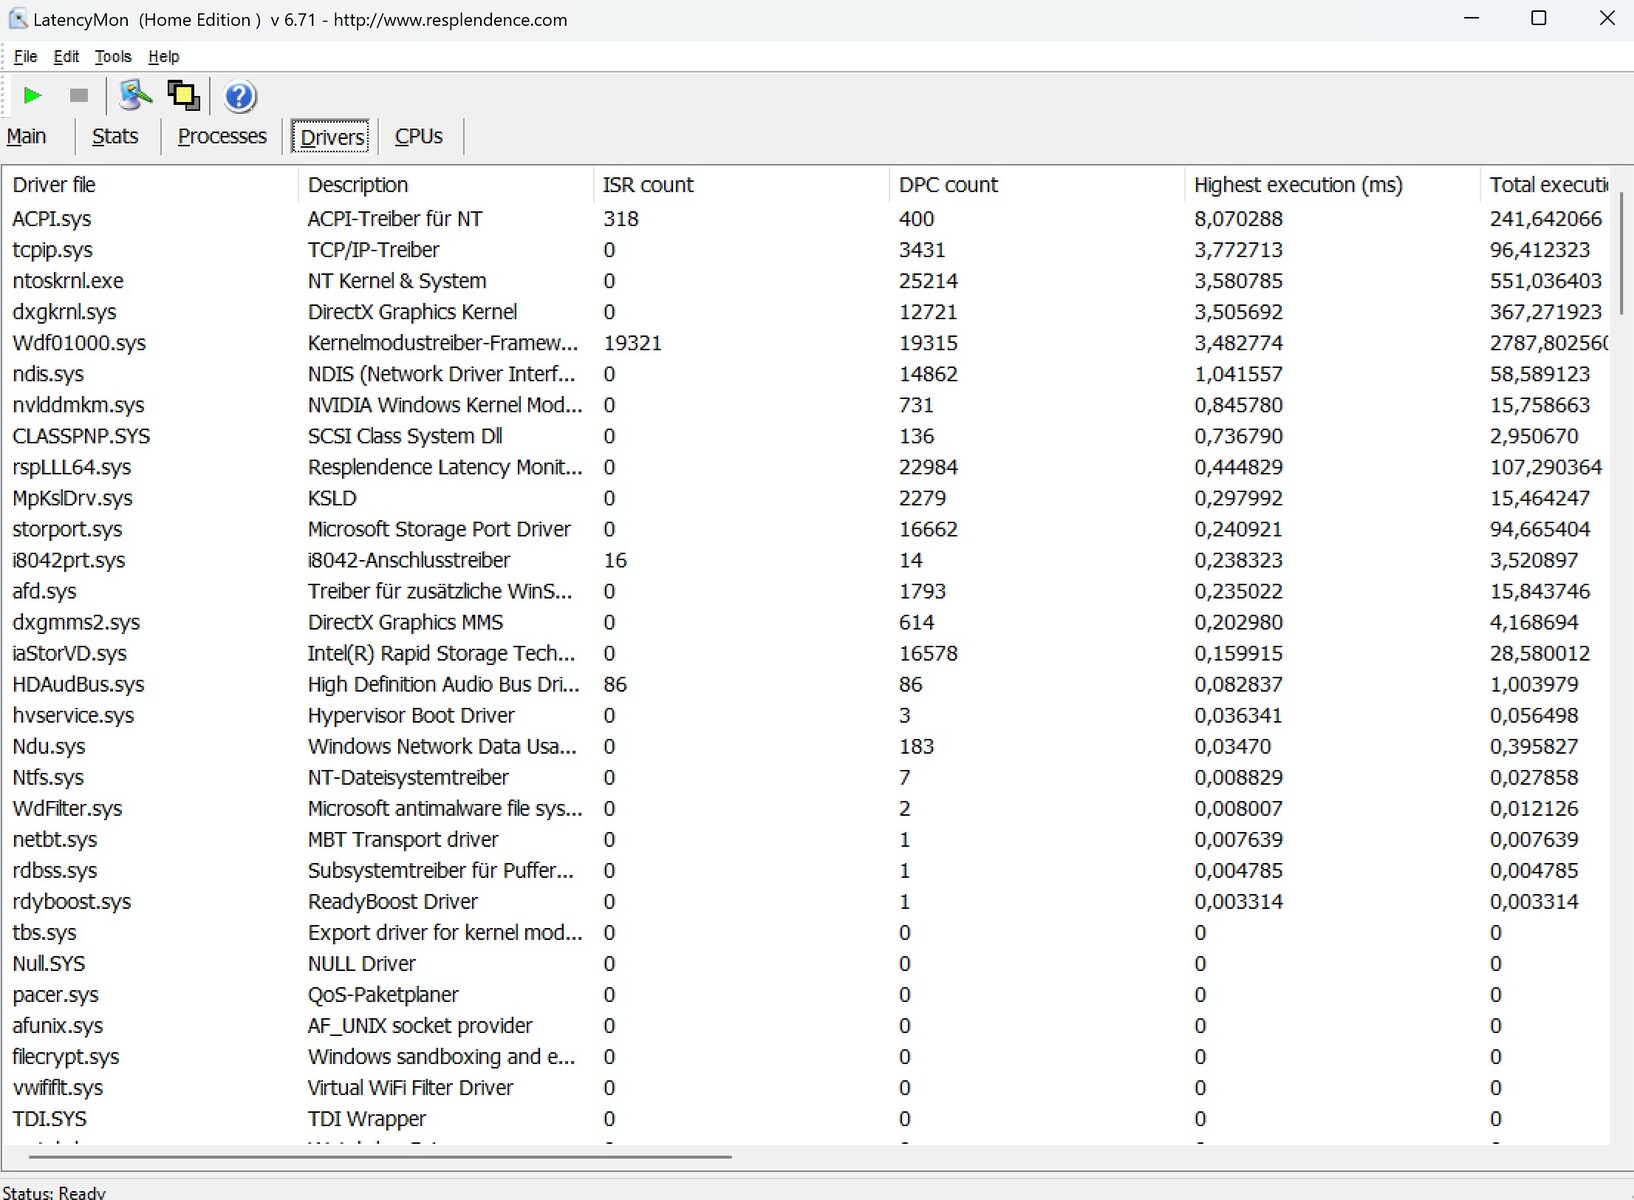
Latence DPC
MSI pourrait améliorer la latence du Stealth 16. Tel qu'il est livré, le LatencyMon indique des perturbations potentielles dans le traitement audio et vidéo en temps réel. Ce phénomène touche cependant de nombreux ordinateurs portables.
| DPC Latencies / LatencyMon - interrupt to process latency (max), Web, Youtube, Prime95 | |
| MSI Stealth 16 Studio A13VG | |
| MSI Stealth 16 Mercedes-AMG Motorsport A13VG | |
| Schenker XMG Pro 16 Studio (Mid 23) | |
| HP Omen Transcend 16 | |
| Schenker XMG CORE 16 (L23) | |
| Lenovo Legion Pro 5 16ARX8 | |
* ... Moindre est la valeur, meilleures sont les performances
Dispositifs de stockage
Le SSD Samsung de 2 To (modèle PM9A1) de l'appareil de test s'est d'abord bien comporté, mais a connu de graves baisses de performances, ou un étranglement, en cas de charge prolongée. Malheureusement, MSI n'a pas encore résolu ce problème, comme pour le Stealth 16 standard. La plupart des concurrents sont plus performants à cet égard, à l'exception du Lenovo Legion Pro 5.

* ... Moindre est la valeur, meilleures sont les performances
Continuous power read: DiskSpd Read Loop, Queue Depth 8
Carte graphique
Malgré le TGP de 105 watts du GPU, les performances de la RTX 4070 dans la Stealth 16 s'alignent sur la moyenne de cette carte graphique.
| 3DMark Ice Storm Standard Score | 99001 points | |
| 3DMark Cloud Gate Standard Score | 52847 points | |
| 3DMark Fire Strike Score | 22419 points | |
| 3DMark Time Spy Score | 11694 points | |
Aide | ||
* ... Moindre est la valeur, meilleures sont les performances
Performances des jeux
Comme l'écran OLED ne supporte pas la résolution UHD classique (3.840 x 2.160 pixels), nous avons utilisé un maximum de 2.560 x 1.440 pixels pour les benchmarks de jeu. Une résolution plus élevée surcharge souvent la RTX 4070, en particulier à des réglages plus élevés, comme le montre laPage GPU. Néanmoins, la Stealth 16 fonctionne admirablement en QHD, utilisant pleinement la capacité de 60 Hz du panneau OLED dans la plupart des titres, à l'exception des titres les plus exigeants et les moins optimisés comme Alan Wake 2.
| Counter-Strike 2 - 2560x1440 Very High Preset | |
| Moyenne de la classe Gaming (15.7 - 224, n=5, 2 dernières années) | |
| XMG Pro 15 E23 | |
| Moyenne NVIDIA GeForce RTX 4070 Laptop GPU (87.9 - 100.6, n=2) | |
| MSI Stealth 16 Mercedes-AMG Motorsport A13VG | |
| Alan Wake 2 - 2560x1440 High Preset | |
| Moyenne de la classe Gaming (31.2 - 93.1, n=33, 2 dernières années) | |
| Moyenne NVIDIA GeForce RTX 4070 Laptop GPU (40.2 - 44.5, n=7) | |
| MSI Stealth 16 Mercedes-AMG Motorsport A13VG | |
| XMG Pro 15 E23 | |
| EA Sports WRC - 2560x1440 Ultra Preset AA:Epic AF:16x | |
| XMG Pro 15 E23 | |
| Moyenne NVIDIA GeForce RTX 4070 Laptop GPU (59.6 - 68.8, n=3) | |
| MSI Stealth 16 Mercedes-AMG Motorsport A13VG | |
Au cours d'un test de 60 minutes de The Witcher 3 en mode FHD/Ultra, il n'y a pas eu de baisse de la fréquence d'images, mais la vitesse a chuté de près de 10 % au cours du test.
Witcher 3 FPS chart
| Bas | Moyen | Élevé | Ultra | QHD | |
|---|---|---|---|---|---|
| GTA V (2015) | 176 | 164.9 | 100.3 | 87.6 | |
| The Witcher 3 (2015) | 317 | 205 | 110 | 77.7 | |
| Dota 2 Reborn (2015) | 178.3 | 144.5 | 135.9 | 126.9 | |
| Final Fantasy XV Benchmark (2018) | 138 | 101.4 | 74.1 | ||
| X-Plane 11.11 (2018) | 144.7 | 118.1 | 98 | ||
| Strange Brigade (2018) | 276 | 220 | 190.6 | 126.3 | |
| Counter-Strike 2 (2023) | 160.2 | 151.5 | 121.5 | 87.9 | |
| Alan Wake 2 (2023) | 66.9 | 65.1 | 42.3 | ||
| EA Sports WRC (2023) | 90.6 | 85 | 77.1 | 59.6 |
Émissions
Bruit du système
Alors que le niveau sonore à vide est similaire à celui de la Stealth 16 standard, la Motorsport Edition est légèrement plus bruyante en charge. Cependant, par rapport à la concurrence, les valeurs mesurées restent dans des limites raisonnables, le HP Omen Transcend 16 étant plus perceptible en mode 3D.
Degré de la nuisance sonore
| Au repos |
| 25 / 26 / 27 dB(A) |
| Fortement sollicité |
| 39 / 51 dB(A) |
 | ||
30 dB silencieux 40 dB(A) audible 50 dB(A) bruyant |
||
min: | ||
| MSI Stealth 16 Mercedes-AMG Motorsport A13VG i9-13900H, GeForce RTX 4070 Laptop GPU | MSI Stealth 16 Studio A13VG i7-13700H, GeForce RTX 4070 Laptop GPU | Schenker XMG Pro 16 Studio (Mid 23) i9-13900H, GeForce RTX 4070 Laptop GPU | HP Omen Transcend 16 i9-13900HX, GeForce RTX 4070 Laptop GPU | Lenovo Legion Pro 5 16ARX8 R7 7745HX, GeForce RTX 4070 Laptop GPU | Schenker XMG CORE 16 (L23) R7 7840HS, GeForce RTX 4070 Laptop GPU | |
|---|---|---|---|---|---|---|
| Noise | 6% | -8% | -10% | 5% | -0% | |
| arrêt / environnement * (dB) | 25 | 24 4% | 25 -0% | 22.9 8% | 23.2 7% | 23 8% |
| Idle Minimum * (dB) | 25 | 24 4% | 26 -4% | 29.1 -16% | 23.2 7% | 23 8% |
| Idle Average * (dB) | 26 | 24 8% | 29 -12% | 29.1 -12% | 23.2 11% | 28.48 -10% |
| Idle Maximum * (dB) | 27 | 24 11% | 34 -26% | 29.1 -8% | 26.2 3% | 28.48 -5% |
| Load Average * (dB) | 39 | 34.81 11% | 43 -10% | 45.7 -17% | 31.4 19% | 30 23% |
| Witcher 3 ultra * (dB) | 45 | 44.05 2% | 48 -7% | 54.3 -21% | 48.4 -8% | 54.12 -20% |
| Load Maximum * (dB) | 51 | 51.57 -1% | 48 6% | 54.3 -6% | 53.8 -5% | 54.12 -6% |
* ... Moindre est la valeur, meilleures sont les performances
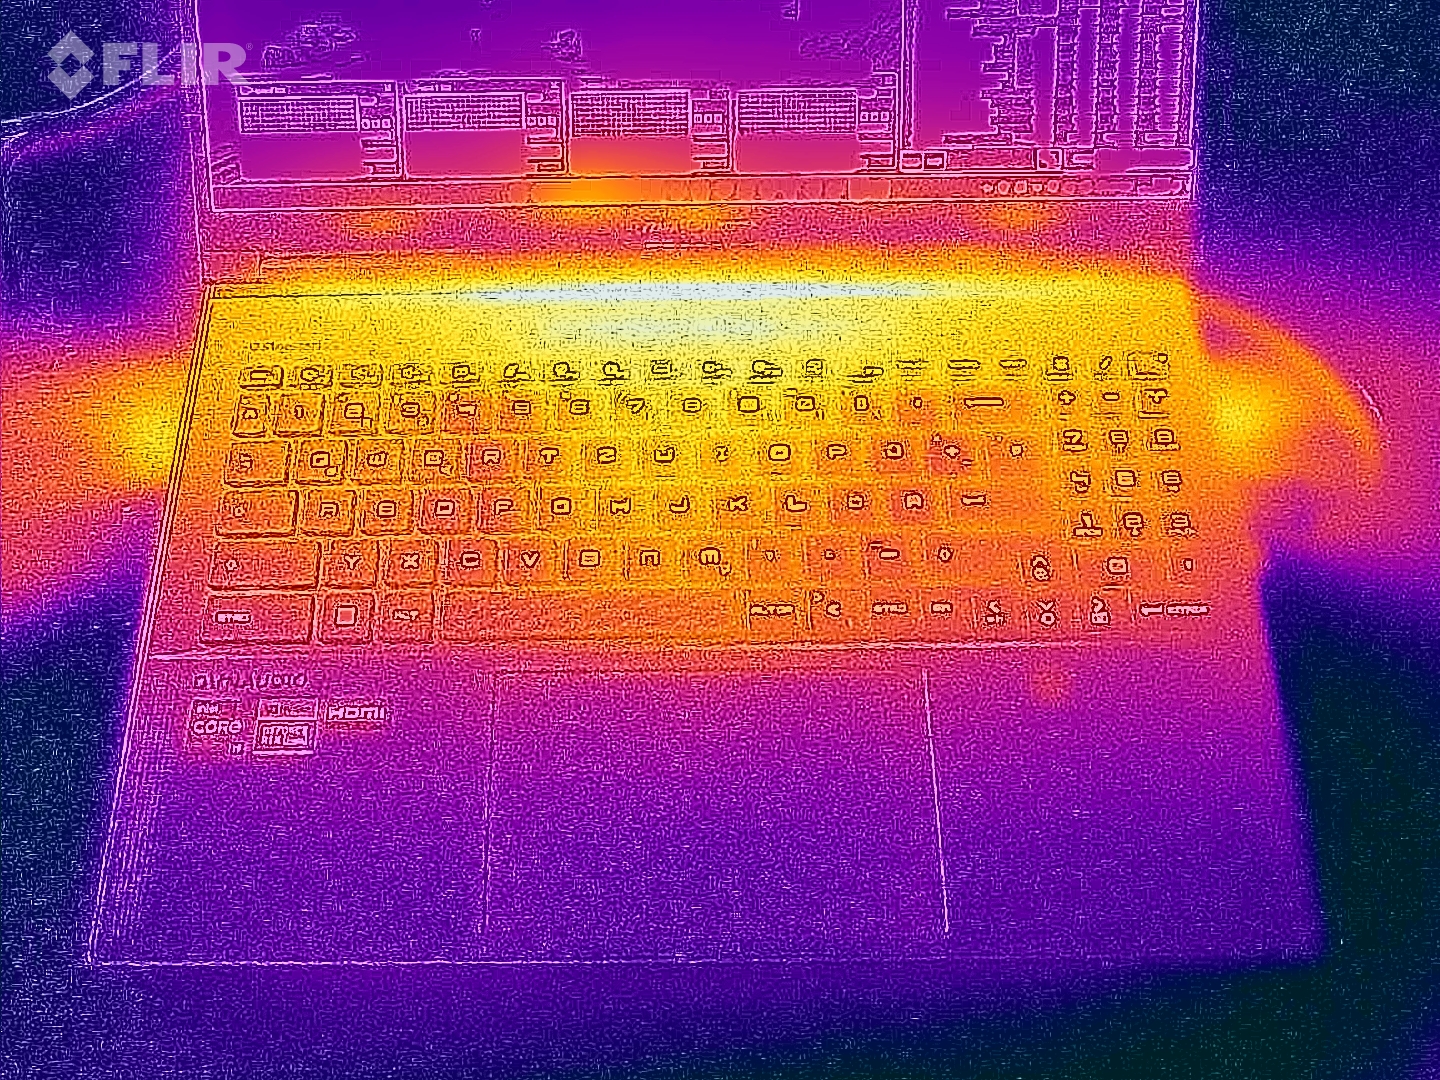
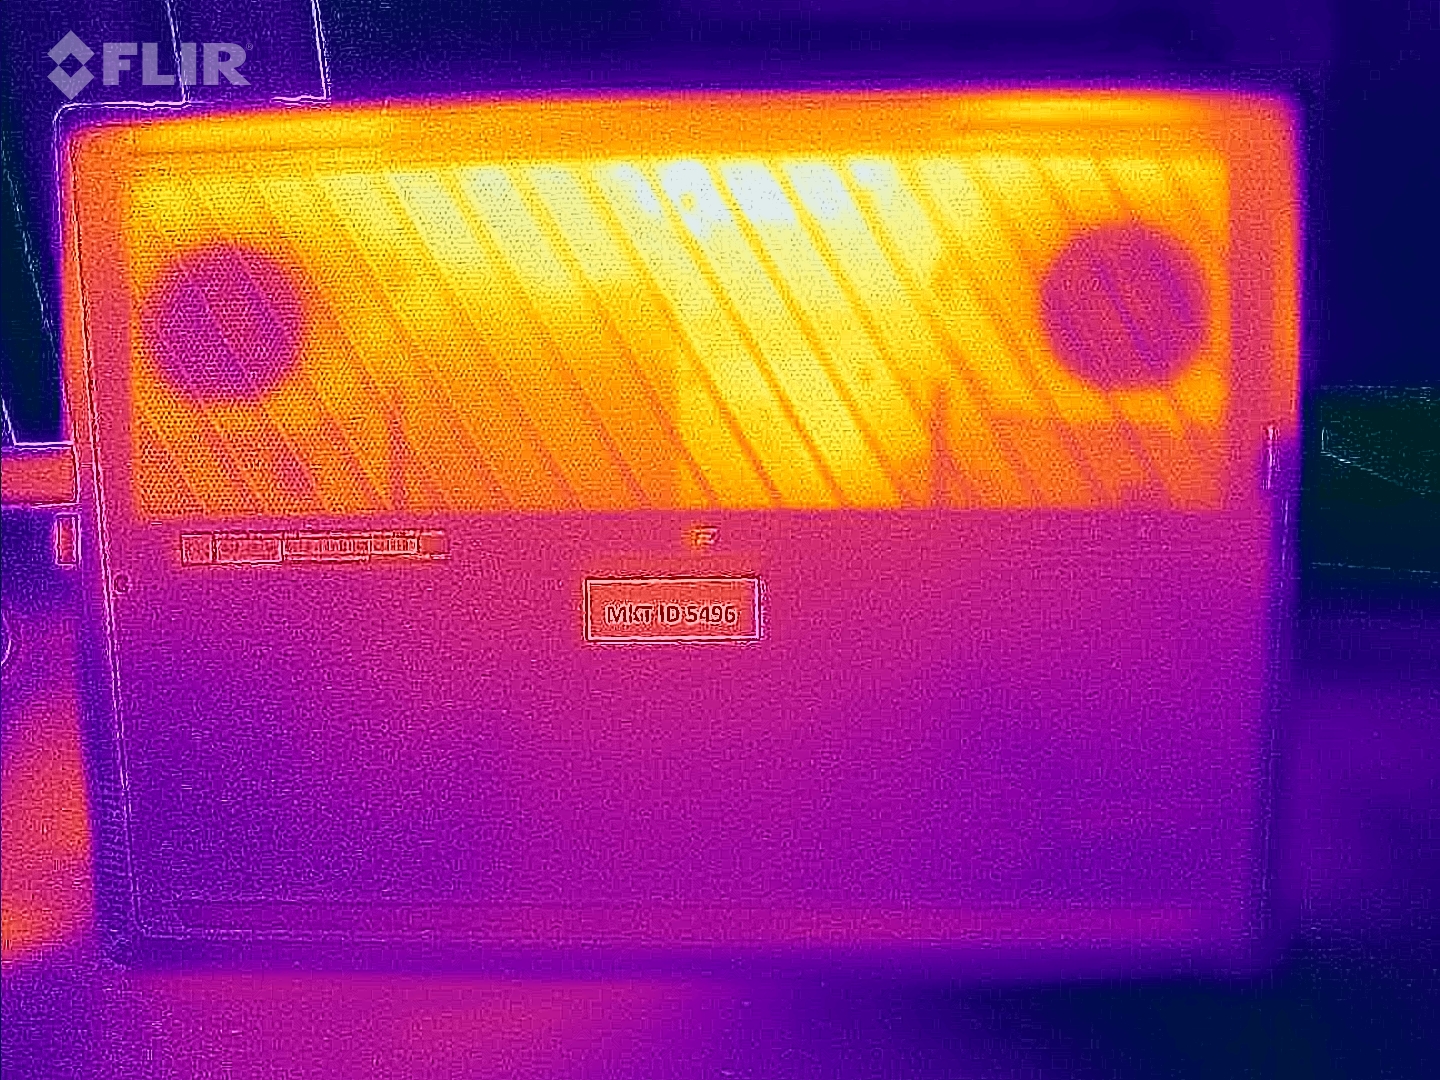
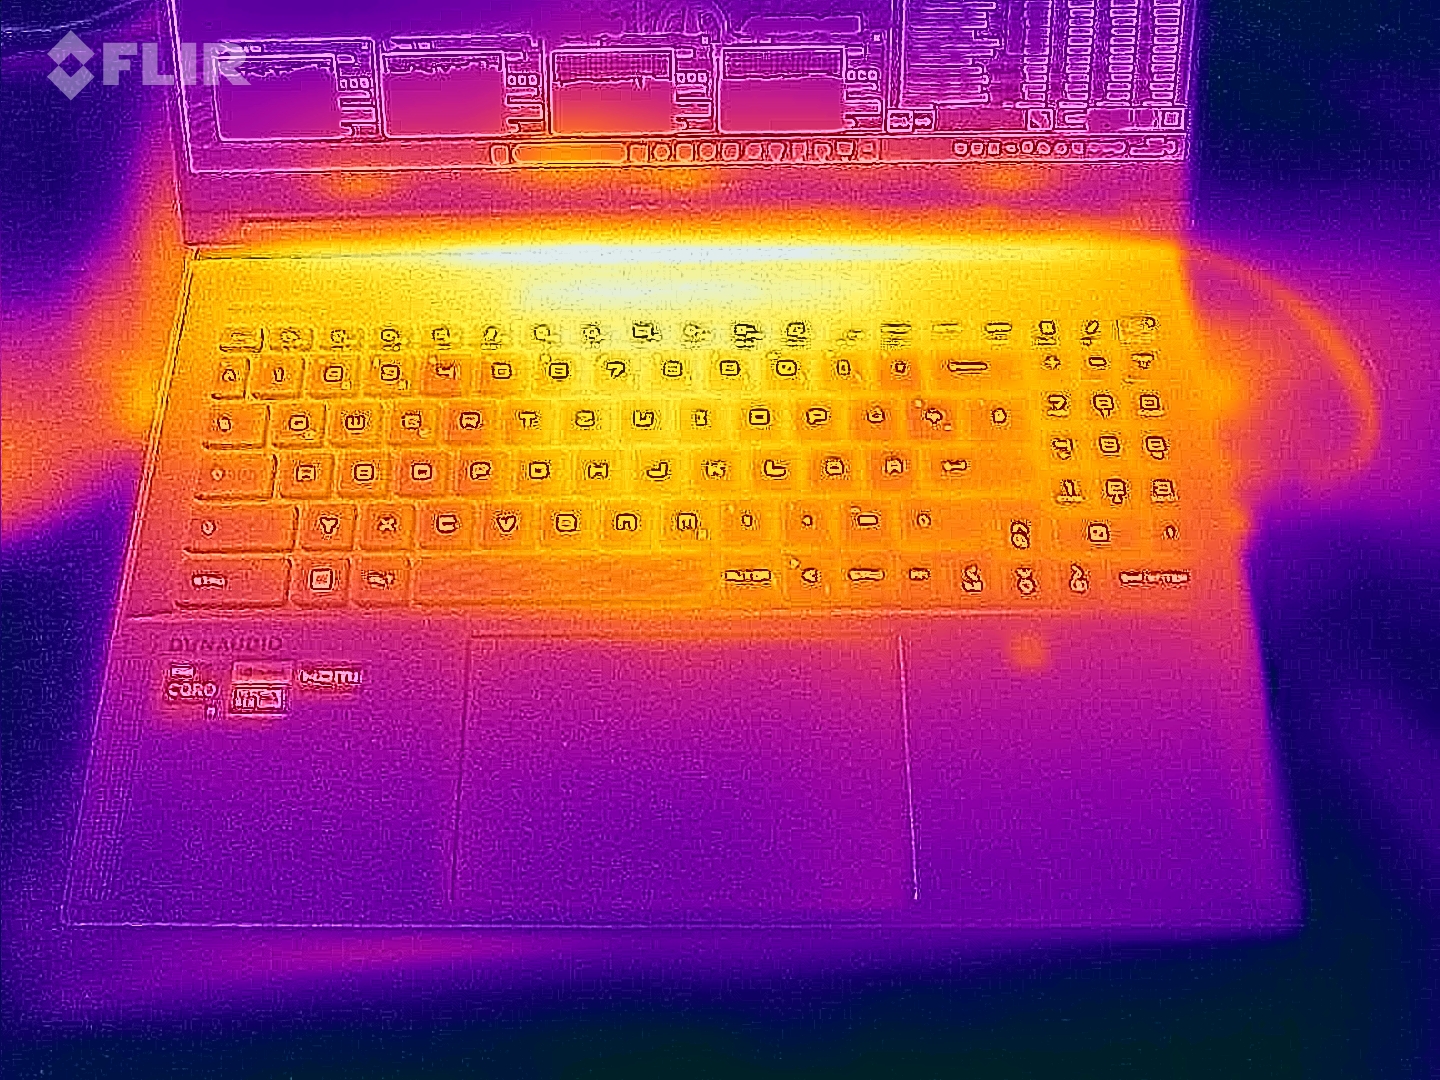
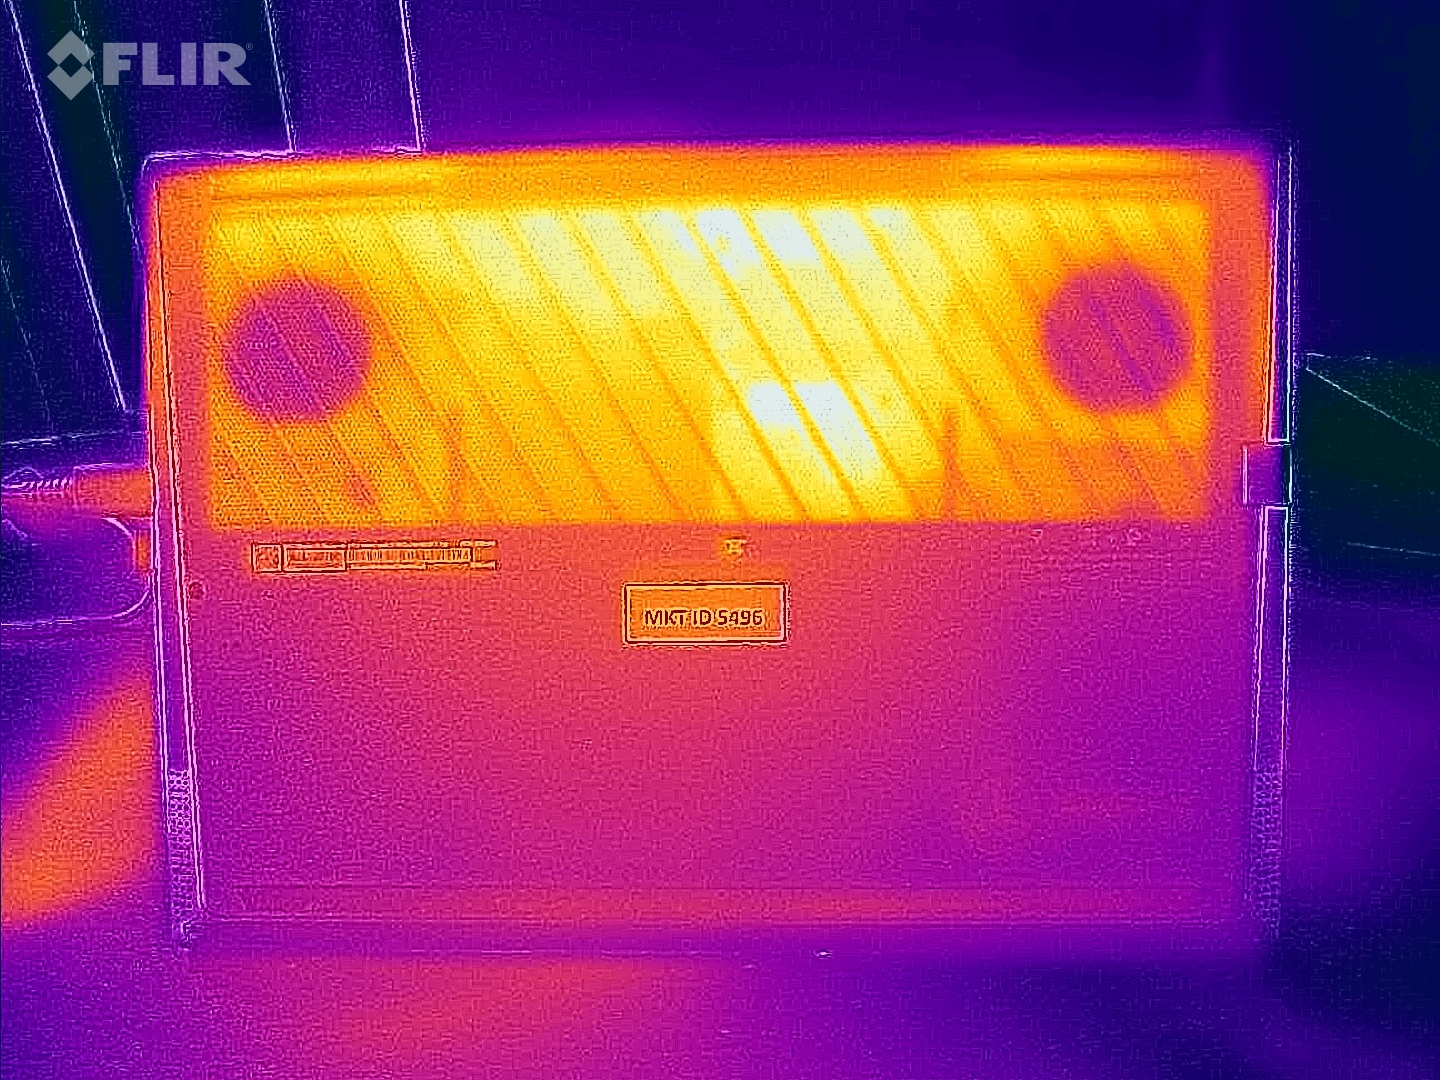
Température
Les températures se situent dans la moyenne, avec un maximum de 120,2 °F sur le dessus et de 125,6 °F sur le dessous. Bien que ces températures ne soient pas basses, elles restent raisonnablement acceptables pour le matériel installé, d'autant plus que la zone de la paume de la main reste agréablement fraîche.
(-) La température maximale du côté supérieur est de 49 °C / 120 F, par rapport à la moyenne de 40.4 °C / 105 F, allant de 21.2 à 68.8 °C pour la classe Gaming.
(-) Le fond chauffe jusqu'à un maximum de 52 °C / 126 F, contre une moyenne de 43.2 °C / 110 F
(+) En utilisation inactive, la température moyenne du côté supérieur est de 29.1 °C / 84 F, par rapport à la moyenne du dispositif de 33.9 °C / 93 F.
(-) En jouant à The Witcher 3, la température moyenne du côté supérieur est de 40 °C / 104 F, alors que la moyenne de l'appareil est de 33.9 °C / 93 F.
(+) Les repose-poignets et le pavé tactile atteignent la température maximale de la peau (32 °C / 89.6 F) et ne sont donc pas chauds.
(-) La température moyenne de la zone de l'appui-paume de dispositifs similaires était de 28.8 °C / 83.8 F (-3.2 °C / #-5.8 F).
| MSI Stealth 16 Mercedes-AMG Motorsport A13VG i9-13900H, GeForce RTX 4070 Laptop GPU | MSI Stealth 16 Studio A13VG i7-13700H, GeForce RTX 4070 Laptop GPU | Schenker XMG Pro 16 Studio (Mid 23) i9-13900H, GeForce RTX 4070 Laptop GPU | HP Omen Transcend 16 i9-13900HX, GeForce RTX 4070 Laptop GPU | Lenovo Legion Pro 5 16ARX8 R7 7745HX, GeForce RTX 4070 Laptop GPU | Schenker XMG CORE 16 (L23) R7 7840HS, GeForce RTX 4070 Laptop GPU | |
|---|---|---|---|---|---|---|
| Heat | -17% | -11% | 6% | 14% | 6% | |
| Maximum Upper Side * (°C) | 49 | 60 -22% | 55 -12% | 47.4 3% | 41.8 15% | 46 6% |
| Maximum Bottom * (°C) | 52 | 61 -17% | 66 -27% | 54.4 -5% | 41.4 20% | 44 15% |
| Idle Upper Side * (°C) | 32 | 38.2 -19% | 33 -3% | 28.4 11% | 29 9% | 32 -0% |
| Idle Bottom * (°C) | 34 | 37.7 -11% | 35 -3% | 29.2 14% | 30.4 11% | 33 3% |
* ... Moindre est la valeur, meilleures sont les performances
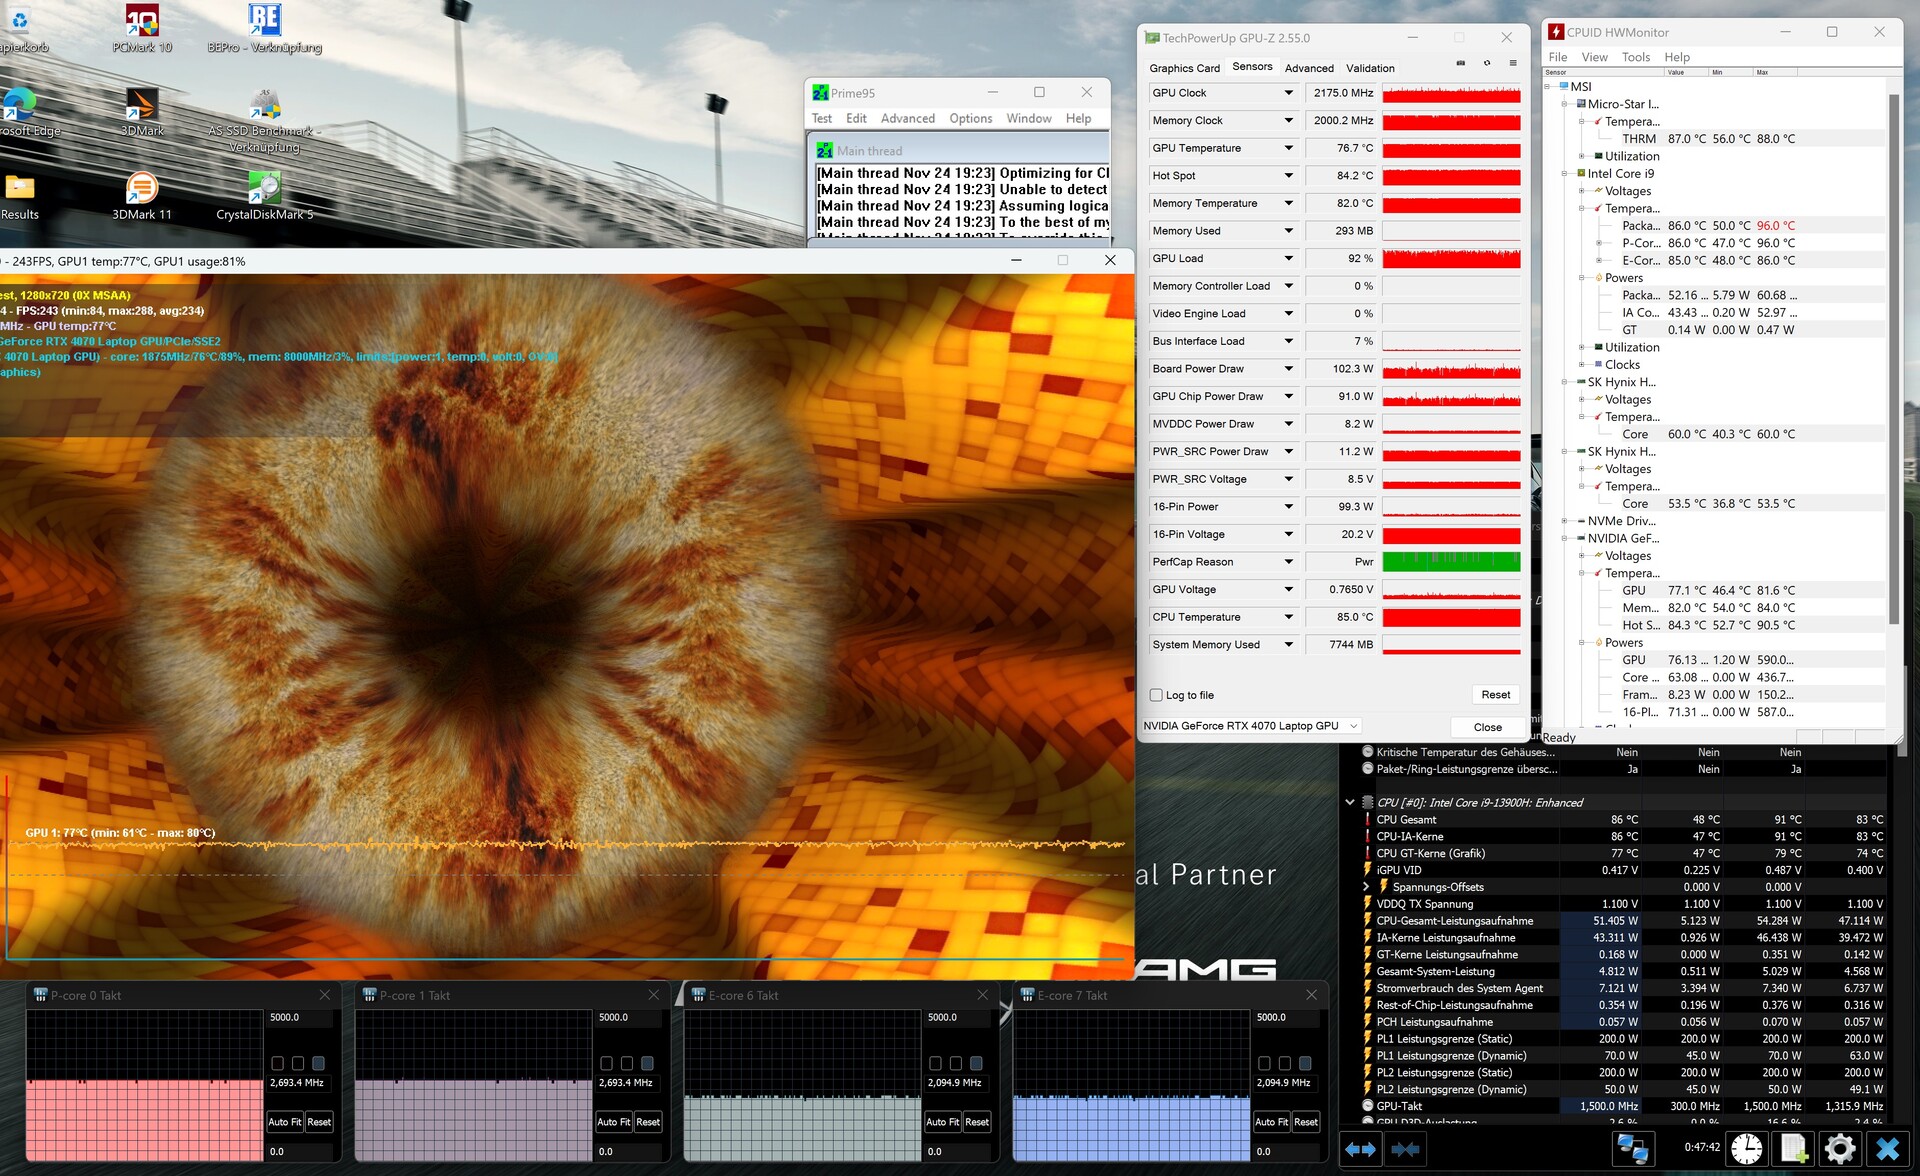
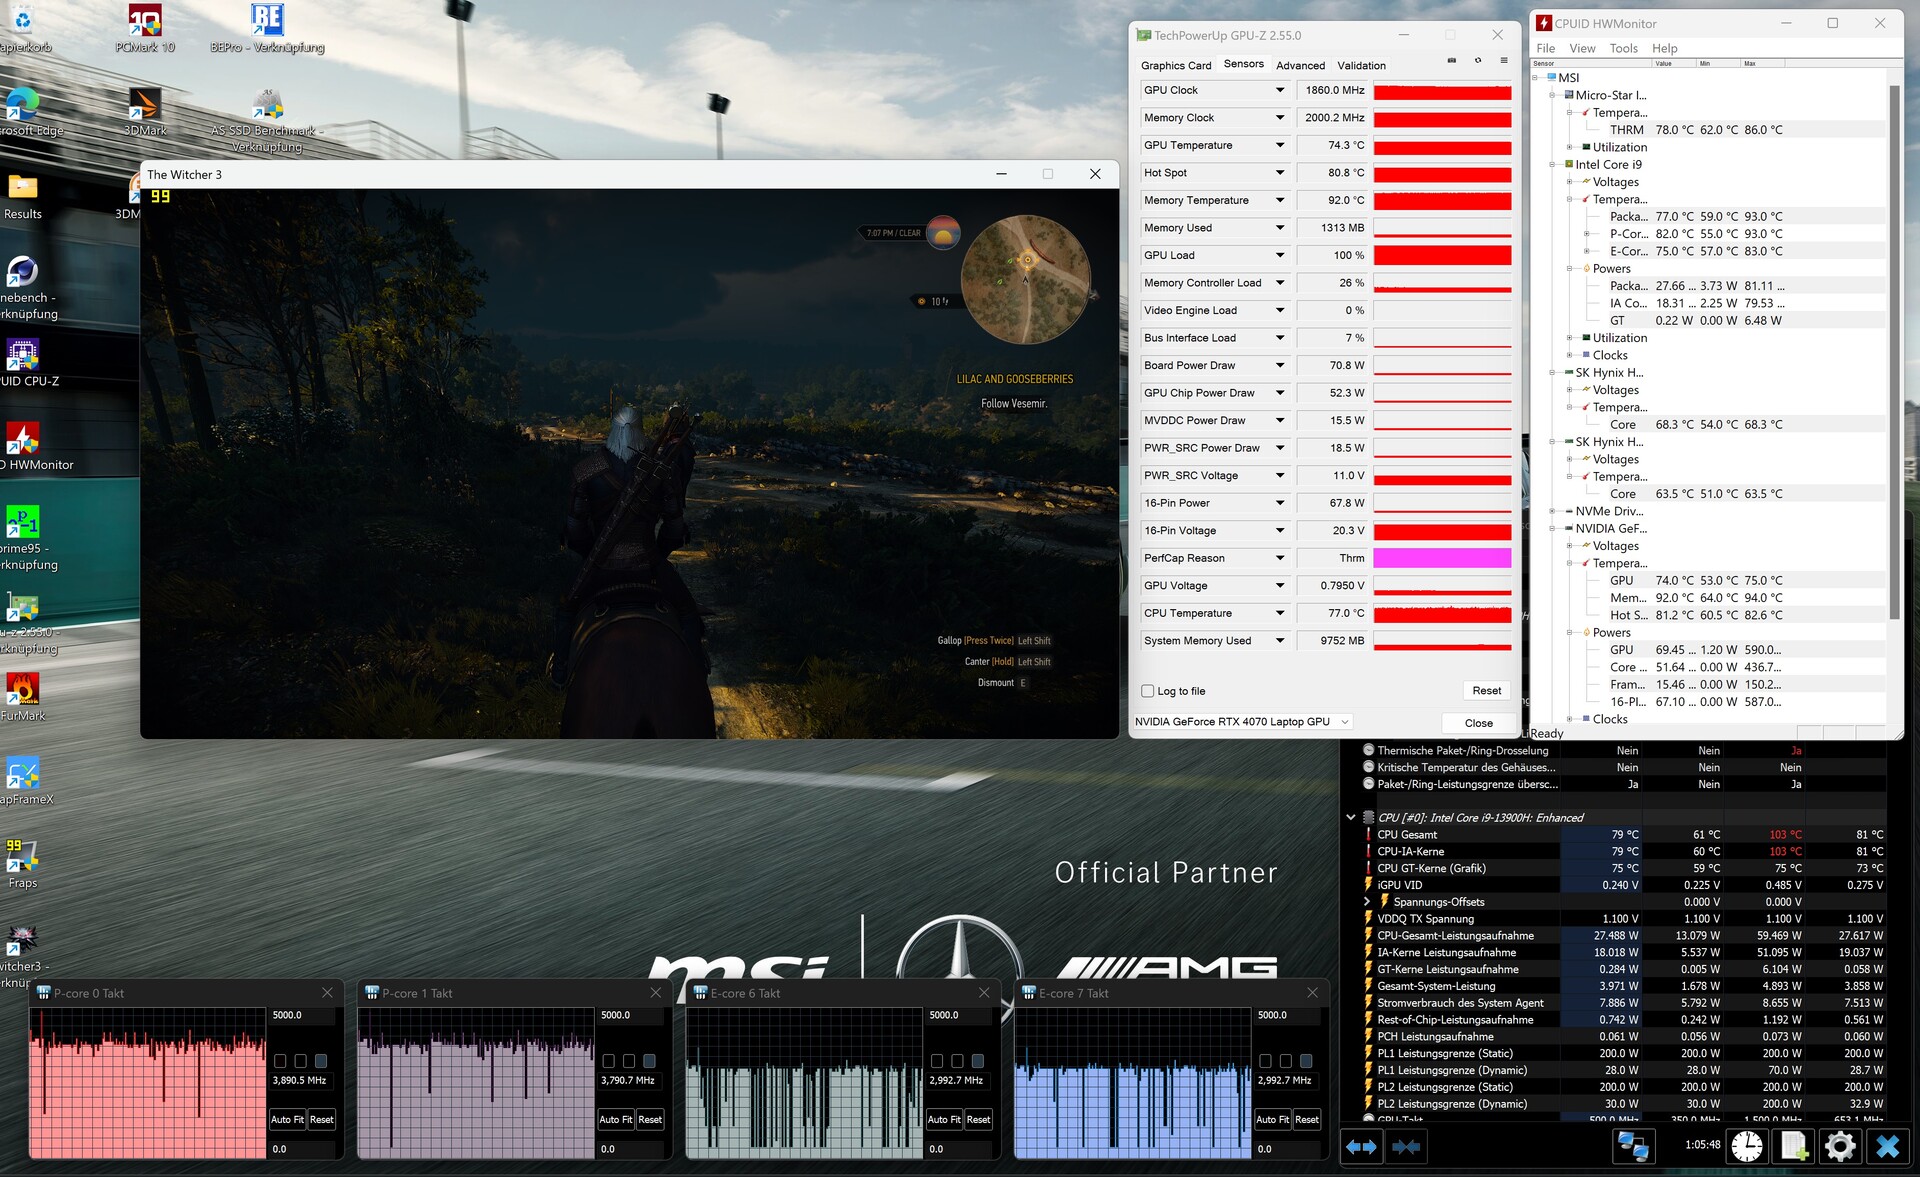
Test de stress
Pendant le test de stress avec Furmark et Prime95, la RTX 4070 a maintenu environ 183,2 °F (horloge GPU ~2 175 MHz), et le Core i9-13900H a atteint environ 186,8 °F (cœurs P ~2,7 GHz, cœurs E ~2,1 GHz), ce qui est acceptable dans les deux cas.
Intervenants
MSI Stealth 16 Mercedes-AMG Motorsport A13VG analyse audio
(+) | les haut-parleurs peuvent jouer relativement fort (91# dB)
Basses 100 - 315 Hz
(-) | presque aucune basse - en moyenne 18.1% plus bas que la médiane
(±) | la linéarité des basses est moyenne (7.3% delta à la fréquence précédente)
Médiums 400 - 2000 Hz
(+) | médiane équilibrée - seulement 1.6% de la médiane
(+) | les médiums sont linéaires (3.7% delta à la fréquence précédente)
Aiguës 2 - 16 kHz
(+) | des sommets équilibrés - à seulement 3.2% de la médiane
(+) | les aigus sont linéaires (2.6% delta à la fréquence précédente)
Globalement 100 - 16 000 Hz
(+) | le son global est linéaire (11.8% différence à la médiane)
Par rapport à la même classe
» 11% de tous les appareils testés de cette catégorie étaient meilleurs, 4% similaires, 85% pires
» Le meilleur avait un delta de 6%, la moyenne était de 18%, le pire était de 132%.
Par rapport à tous les appareils testés
» 8% de tous les appareils testés étaient meilleurs, 3% similaires, 89% pires
» Le meilleur avait un delta de 4%, la moyenne était de 24%, le pire était de 134%.
HP Omen Transcend 16 analyse audio
(+) | les haut-parleurs peuvent jouer relativement fort (82.3# dB)
Basses 100 - 315 Hz
(-) | presque aucune basse - en moyenne 20% plus bas que la médiane
(±) | la linéarité des basses est moyenne (14.3% delta à la fréquence précédente)
Médiums 400 - 2000 Hz
(±) | médiane supérieure - en moyenne 5.2% supérieure à la médiane
(+) | les médiums sont linéaires (3.7% delta à la fréquence précédente)
Aiguës 2 - 16 kHz
(+) | des sommets équilibrés - à seulement 2% de la médiane
(+) | les aigus sont linéaires (6.7% delta à la fréquence précédente)
Globalement 100 - 16 000 Hz
(±) | la linéarité du son global est moyenne (17% de différence avec la médiane)
Par rapport à la même classe
» 45% de tous les appareils testés de cette catégorie étaient meilleurs, 12% similaires, 43% pires
» Le meilleur avait un delta de 6%, la moyenne était de 18%, le pire était de 132%.
Par rapport à tous les appareils testés
» 30% de tous les appareils testés étaient meilleurs, 8% similaires, 62% pires
» Le meilleur avait un delta de 4%, la moyenne était de 24%, le pire était de 134%.
Gestion de l'énergie
Consommation électrique
Grâce à la commutation graphique, l'appareil de 16 pouces fonctionne efficacement en mode veille, consommant entre 11 et 28 watts (14 watts en moyenne), ce qui est conforme à la plupart des concurrents. En charge, l'édition AMG consomme entre 83 watts (valeur moyenne dans 3DMark 06) et 204 watts (valeur maximale dans le test de stress). L'alimentation de 240 watts fournie, ornée d'un logo de sport automobile, est bien dimensionnée pour ces exigences.
| Éteint/en veille | |
| Au repos | |
| Fortement sollicité |
|
Légende:
min: | |
| MSI Stealth 16 Mercedes-AMG Motorsport A13VG i9-13900H, GeForce RTX 4070 Laptop GPU | MSI Stealth 16 Studio A13VG i7-13700H, GeForce RTX 4070 Laptop GPU | Schenker XMG Pro 16 Studio (Mid 23) i9-13900H, GeForce RTX 4070 Laptop GPU | HP Omen Transcend 16 i9-13900HX, GeForce RTX 4070 Laptop GPU | Lenovo Legion Pro 5 16ARX8 R7 7745HX, GeForce RTX 4070 Laptop GPU | Schenker XMG CORE 16 (L23) R7 7840HS, GeForce RTX 4070 Laptop GPU | Moyenne de la classe Gaming | |
|---|---|---|---|---|---|---|---|
| Power Consumption | -2% | 2% | -63% | -16% | -1% | -19% | |
| Idle Minimum * (Watt) | 11 | 11 -0% | 8 27% | 19.2 -75% | 8.1 26% | 11 -0% | 13.1 ? -19% |
| Idle Average * (Watt) | 14 | 18 -29% | 12 14% | 22.7 -62% | 15.9 -14% | 15.2 -9% | 18.8 ? -34% |
| Idle Maximum * (Watt) | 28 | 19 32% | 23 18% | 55.4 -98% | 37.2 -33% | 16 43% | 24.4 ? 13% |
| Load Average * (Watt) | 83 | 91 -10% | 94 -13% | 128.4 -55% | 90.9 -10% | 64 23% | 108.5 ? -31% |
| Witcher 3 ultra * (Watt) | 140 | 130 7% | 181.5 -30% | 206 -47% | 189.6 -35% | 179 -28% | |
| Load Maximum * (Watt) | 204 | 228 -12% | 215 -5% | 292 -43% | 263.5 -29% | 280 -37% | 254 ? -25% |
* ... Moindre est la valeur, meilleures sont les performances
Power consumption Witcher 3 / stress test
Power consumption with external monitor
Autonomie de la batterie
En raison du Core i9-13900H et de la dalle OLED, l'autonomie du Motorsport Edition est légèrement inférieure à celle de la version standard. Avec une luminosité réduite à 150 cd/m², l'autonomie d'un peu moins de 6,5 heures de surf sur internet est tout de même plus que convenable pour un ordinateur portable de jeu. La batterie, de taille généreuse (99 Wh), contribue à ces chiffres respectables.
| MSI Stealth 16 Mercedes-AMG Motorsport A13VG i9-13900H, GeForce RTX 4070 Laptop GPU, 99.99 Wh | MSI Stealth 16 Studio A13VG i7-13700H, GeForce RTX 4070 Laptop GPU, 99.9 Wh | Schenker XMG Pro 16 Studio (Mid 23) i9-13900H, GeForce RTX 4070 Laptop GPU, 73 Wh | HP Omen Transcend 16 i9-13900HX, GeForce RTX 4070 Laptop GPU, 97 Wh | Lenovo Legion Pro 5 16ARX8 R7 7745HX, GeForce RTX 4070 Laptop GPU, 80 Wh | Schenker XMG CORE 16 (L23) R7 7840HS, GeForce RTX 4070 Laptop GPU, 99 Wh | Moyenne de la classe Gaming | |
|---|---|---|---|---|---|---|---|
| Autonomie de la batterie | 20% | 5% | -35% | -38% | 29% | 7% | |
| WiFi v1.3 (h) | 6.5 | 7.8 20% | 6.8 5% | 4.2 -35% | 4 -38% | 8.4 29% | 6.98 ? 7% |
| Reader / Idle (h) | 11 | 6.3 | 6.5 | 8.71 ? | |||
| H.264 (h) | 7.7 | 10.2 | 8.26 ? | ||||
| Load (h) | 2.4 | 1.2 | 1 | 2.4 | 1.47 ? |
Points positifs
Points négatifs
Verdict
Au-delà des éléments de design réussis, l'édition Mercedes-AMG Motorsport de la Stealth 16 partage pratiquement les mêmes forces et faiblesses que la version standard (voir l'essai complet). Heureusement, les points positifs l'emportent sur les points négatifs.
Du côté positif, l'ordinateur portable présente un boîtier agréablement léger et compact, mais robuste, un son puissant et des périphériques d'entrée relativement bons. Les déductions viennent principalement sous la forme d'une note B en raison de l'étranglement du SSD au fil du temps et de la connectivité USB quelque peu limitée (seulement un port de type A).
Le choix entre l'écran OLED de la version Motorsport et l'écran IPS dépend des préférences personnelles.
Si l'écran OLED offre des valeurs d'image exceptionnelles (niveau de noir, contraste, espace colorimétrique, angle de vision, temps de réponse), il se caractérise par une surface réfléchissante, une fréquence modeste (60 Hz) et un risque de scintillement.
Dans l'ensemble, il mérite tout de même la mention "très bien". Parmi les alternatives, on trouve les ordinateurs portables équipés de processeurs Intel, comme les HP Omen Transcend 16 et Schenker XMG Pro 16 mentionnés dans l'article. Pour les amateurs d'AMD, le Lenovo Legion Pro 5 et le Schenker XMG Core 16, qui obtiennent tous deux la mention "très bien", méritent d'être pris en considération.
Prix et disponibilité
La MSI Stealth 16 Mercedes-AMG Motorsport A13VG est vendue au prix de 2 899 USD et peut être achetée directement sur le site MSI.
MSI Stealth 16 Mercedes-AMG Motorsport A13VG
- 11/28/2023 v7 (old)
Florian Glaser
Transparency
La sélection des appareils à examiner est effectuée par notre équipe éditoriale. L'échantillon de test a été prêté à l'auteur par le fabricant ou le détaillant pour les besoins de cet examen. Le prêteur n'a pas eu d'influence sur cette évaluation et le fabricant n'a pas reçu de copie de cette évaluation avant sa publication. Il n'y avait aucune obligation de publier cet article. En tant que média indépendant, Notebookcheck n'est pas soumis à l'autorité des fabricants, des détaillants ou des éditeurs.
Voici comment Notebookcheck teste
Chaque année, Notebookcheck examine de manière indépendante des centaines d'ordinateurs portables et de smartphones en utilisant des procédures standardisées afin de garantir que tous les résultats sont comparables. Nous avons continuellement développé nos méthodes de test depuis environ 20 ans et avons établi des normes industrielles dans le processus. Dans nos laboratoires de test, des équipements de mesure de haute qualité sont utilisés par des techniciens et des rédacteurs expérimentés. Ces tests impliquent un processus de validation en plusieurs étapes. Notre système d'évaluation complexe repose sur des centaines de mesures et de points de référence bien fondés, ce qui garantit l'objectivité.Price comparison

