Test du Lenovo Legion Pro 5 16 Gen 8 : les débuts du Ryzen 7 7745HX

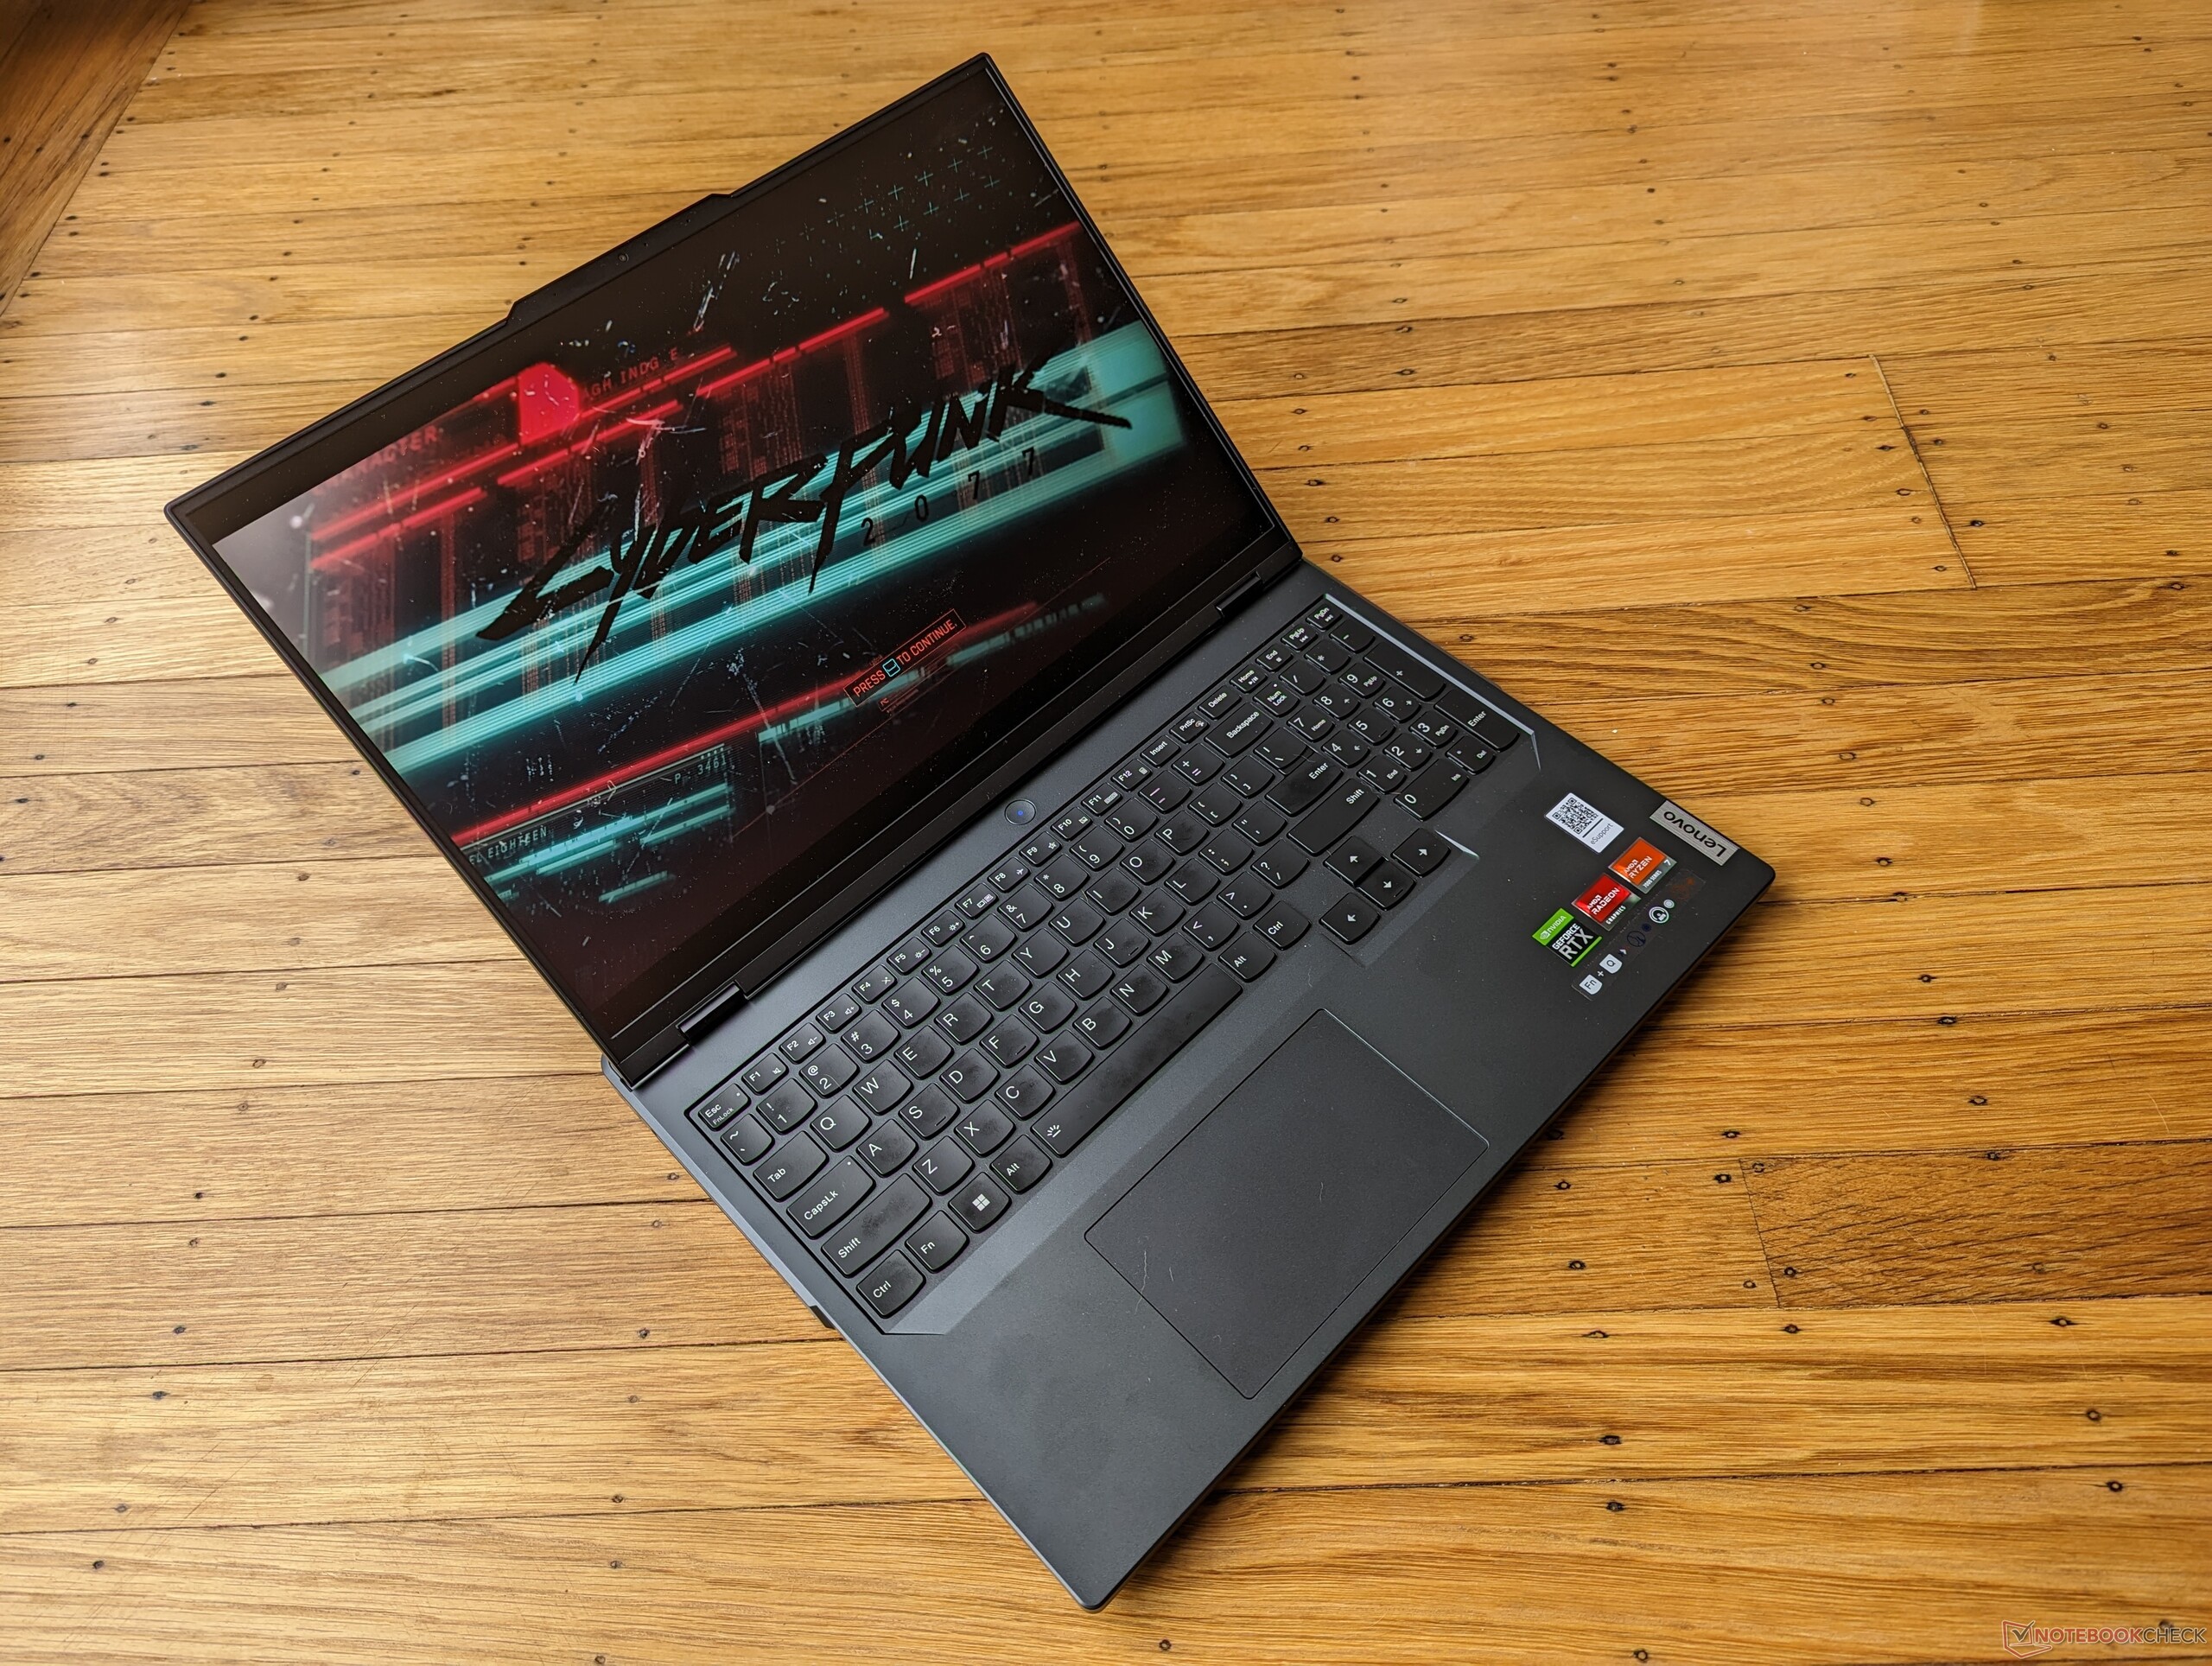
Le Lenovo Legion Pro 5 16ARX8 est la version AMD du Intel Legion Pro 5 16IRX8. Les deux modèles utilisent le même châssis Legion Pro 5 16 Gen 8 et sont par ailleurs visuellement identiques. Nous vous recommandons de consulter notre article sur le Legion Pro 5 16IRX8 pour en savoir plus sur les caractéristiques physiques du modèle, car la plupart de nos commentaires s'appliquent également au Legion Pro 5 16ARX8.
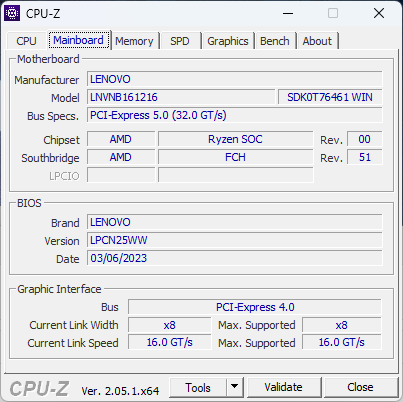
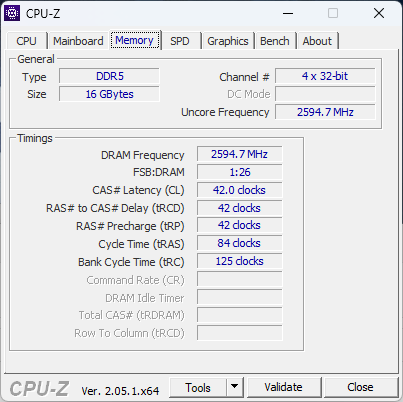
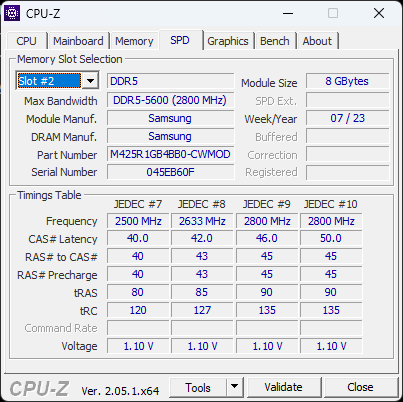
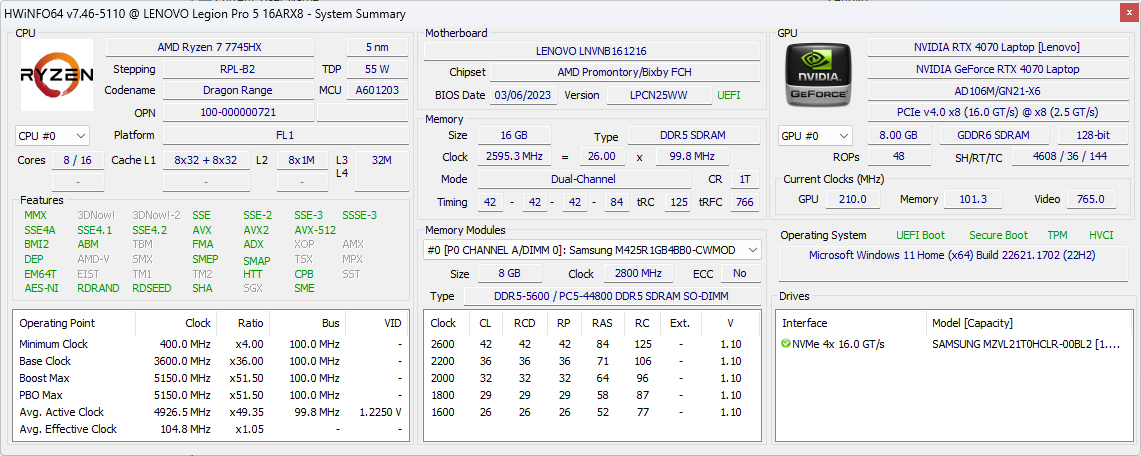
Notre unité de test est une configuration haut de gamme avec le processeur Zen 4 Ryzen 7 7745HX, le GPU 140 W GeForce RTX 4070, et l'écran IPS 165 Hz 1600p au prix de détail d'environ $1600 USD. D'autres SKU peuvent inclure le Ryzen 5 7645HX, GeForce RTX 4050, ou un écran IPS 240 Hz. Ce modèle particulier est l'un des premiers à être livré avec le Ryzen 7 7745HX de milieu de gamme, alors que les ordinateurs portables Zen 4 précédents n'étaient disponibles qu'avec le Ryzen 9 7945HX, plus onéreux.
Les concurrents dans ce domaine comprennent d'autres ordinateurs portables de jeu de milieu et de haut de gamme comme le Asus ROG Strix G16, Razer Blade 16, Uniwill GM6PX7Xou MSI Pulse GL76. La série Legion 7 est un cran au-dessus de notre Legion Pro 5 avec des options de CPU et de GPU beaucoup plus rapides.
Plus d'avis sur Lenovo :
Comparaison avec les concurrents potentiels
Note | Date | Modèle | Poids | Épaisseur | Taille | Résolution | Prix |
|---|---|---|---|---|---|---|---|
| 88.4 % v7 (old) | 05/23 | Lenovo Legion Pro 5 16ARX8 R7 7745HX, GeForce RTX 4070 Laptop GPU | 2.5 kg | 26.8 mm | 16.00" | 2560x1600 | |
| 87.9 % v7 (old) | 05/23 | Lenovo Legion Pro 5 16IRX8 i7-13700HX, GeForce RTX 4060 Laptop GPU | 2.5 kg | 26.8 mm | 16.00" | 2560x1600 | |
| 88.2 % v7 (old) | 03/23 | Uniwill GM6PX7X RTX 4070 i7-13700HX, GeForce RTX 4070 Laptop GPU | 2.2 kg | 22 mm | 16.00" | 2560x1600 | |
| 87.7 % v7 (old) | 04/23 | Schenker XMG Neo 16 E23 i9-13900HX, GeForce RTX 4090 Laptop GPU | 2.5 kg | 29.9 mm | 16.00" | 2560x1600 | |
| 88.4 % v7 (old) | 03/23 | Asus ROG Strix G16 G614JZ i9-13980HX, GeForce RTX 4080 Laptop GPU | 2.4 kg | 30.4 mm | 16.00" | 2560x1600 | |
| 88 % v7 (old) | 04/23 | Asus Zephyrus Duo 16 GX650PY-NM006W R9 7945HX, GeForce RTX 4090 Laptop GPU | 2.7 kg | 29.7 mm | 16.00" | 2560x1600 |
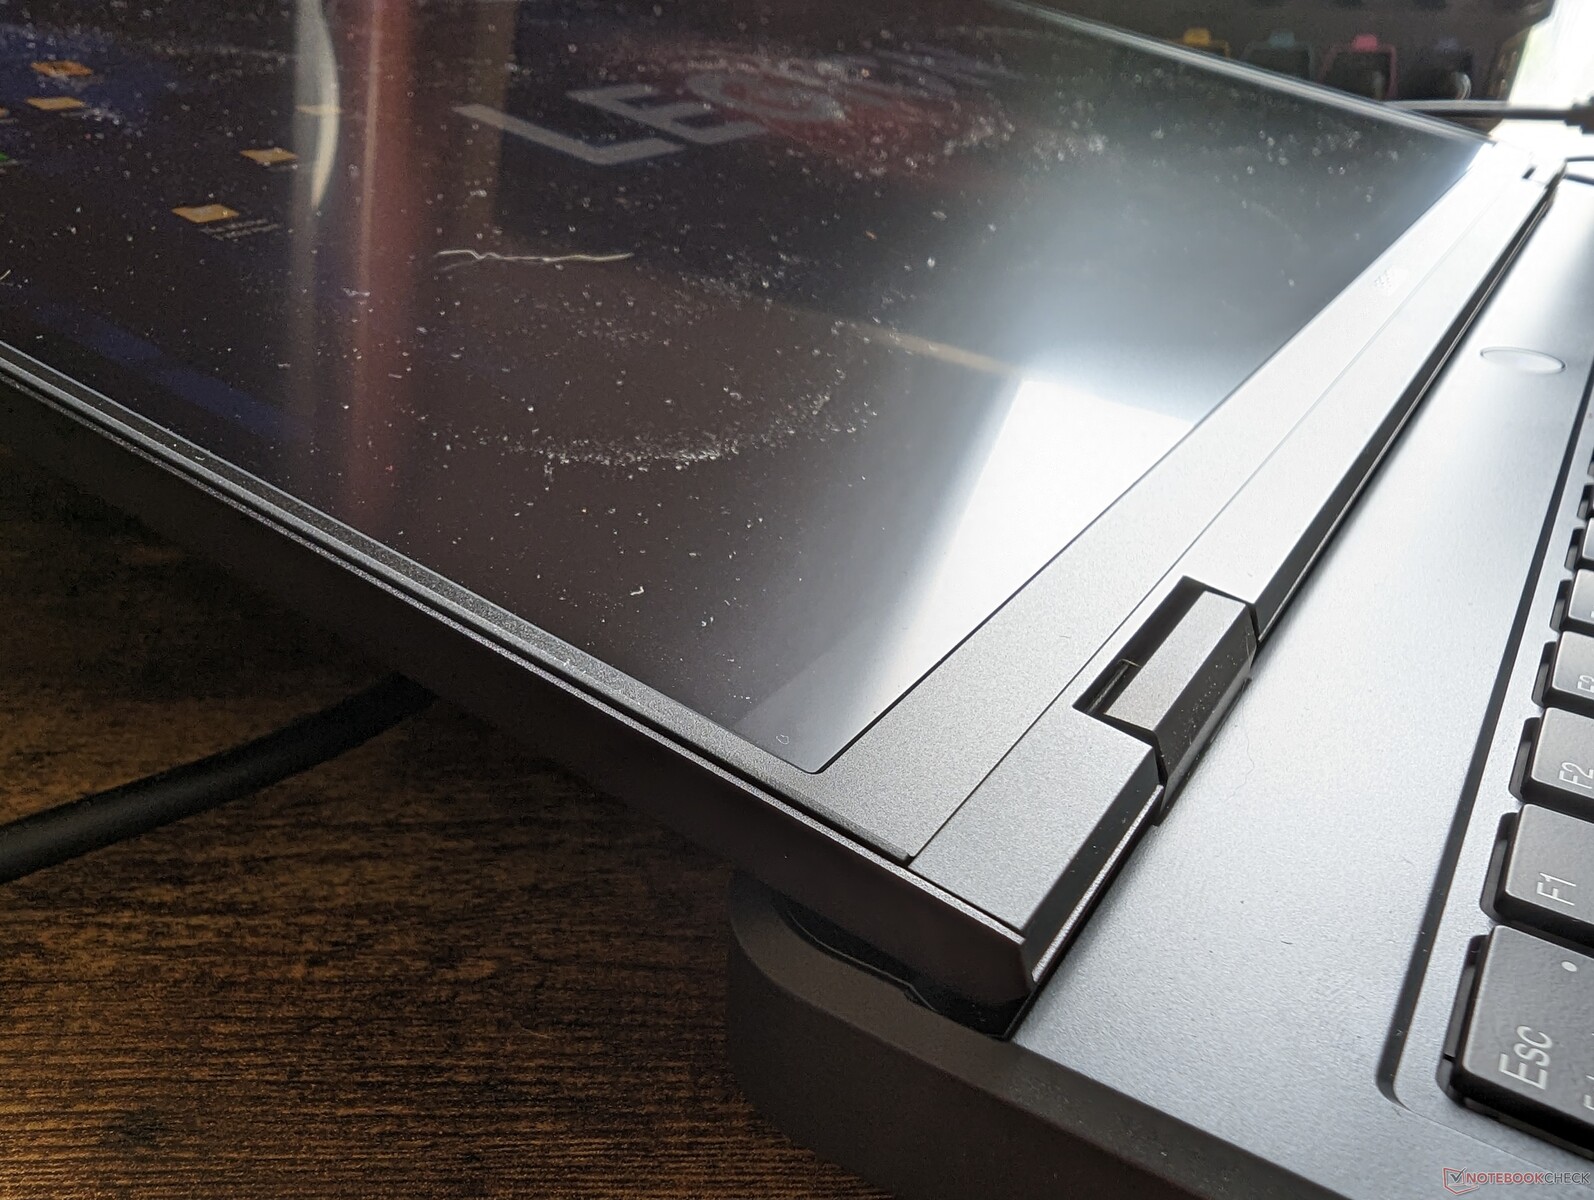
Cas - Même apparence avec des ports identiques
L'AMD Legion Pro 5 16ARX8 partage le même châssis que l'Intel Legion Pro 5 16IRX8. Alors qu'il existe généralement quelques différences de port entre la plupart des variantes AMD et Intel, il n'y en a en fait aucune entre ces deux modèles puisque Lenovo a choisi d'exclure le support USB 4 et Thunderbolt sur toutes les UGS Legion 5 Pro, quelle que soit l'option du processeur. Cette décision peut être considérée comme un moyen de forcer les utilisateurs à opter pour la série Legion 7, plus onéreuse, qui inclut par défaut la prise en charge de Thunderbolt.
Communication
Le modèle AMD remplace l'Intel AX211 courant par le MediaTek MT7922 moins courant. Les performances sont par ailleurs stables et fiables lorsqu'il est couplé à notre réseau 6 GHz.
| Networking | |
| iperf3 transmit AXE11000 | |
| Schenker XMG Neo 16 E23 | |
| Asus ROG Strix G16 G614JZ | |
| Lenovo Legion Pro 5 16ARX8 | |
| Uniwill GM6PX7X RTX 4070 | |
| Lenovo Legion Pro 5 16IRX8 | |
| iperf3 receive AXE11000 | |
| Schenker XMG Neo 16 E23 | |
| Asus ROG Strix G16 G614JZ | |
| Lenovo Legion Pro 5 16ARX8 | |
| Uniwill GM6PX7X RTX 4070 | |
| Lenovo Legion Pro 5 16IRX8 | |
| iperf3 transmit AXE11000 6GHz | |
| Asus Zephyrus Duo 16 GX650PY-NM006W | |
| Lenovo Legion Pro 5 16ARX8 | |
| Lenovo Legion Pro 5 16IRX8 | |
| iperf3 receive AXE11000 6GHz | |
| Asus Zephyrus Duo 16 GX650PY-NM006W | |
| Lenovo Legion Pro 5 16ARX8 | |
| Lenovo Legion Pro 5 16IRX8 | |
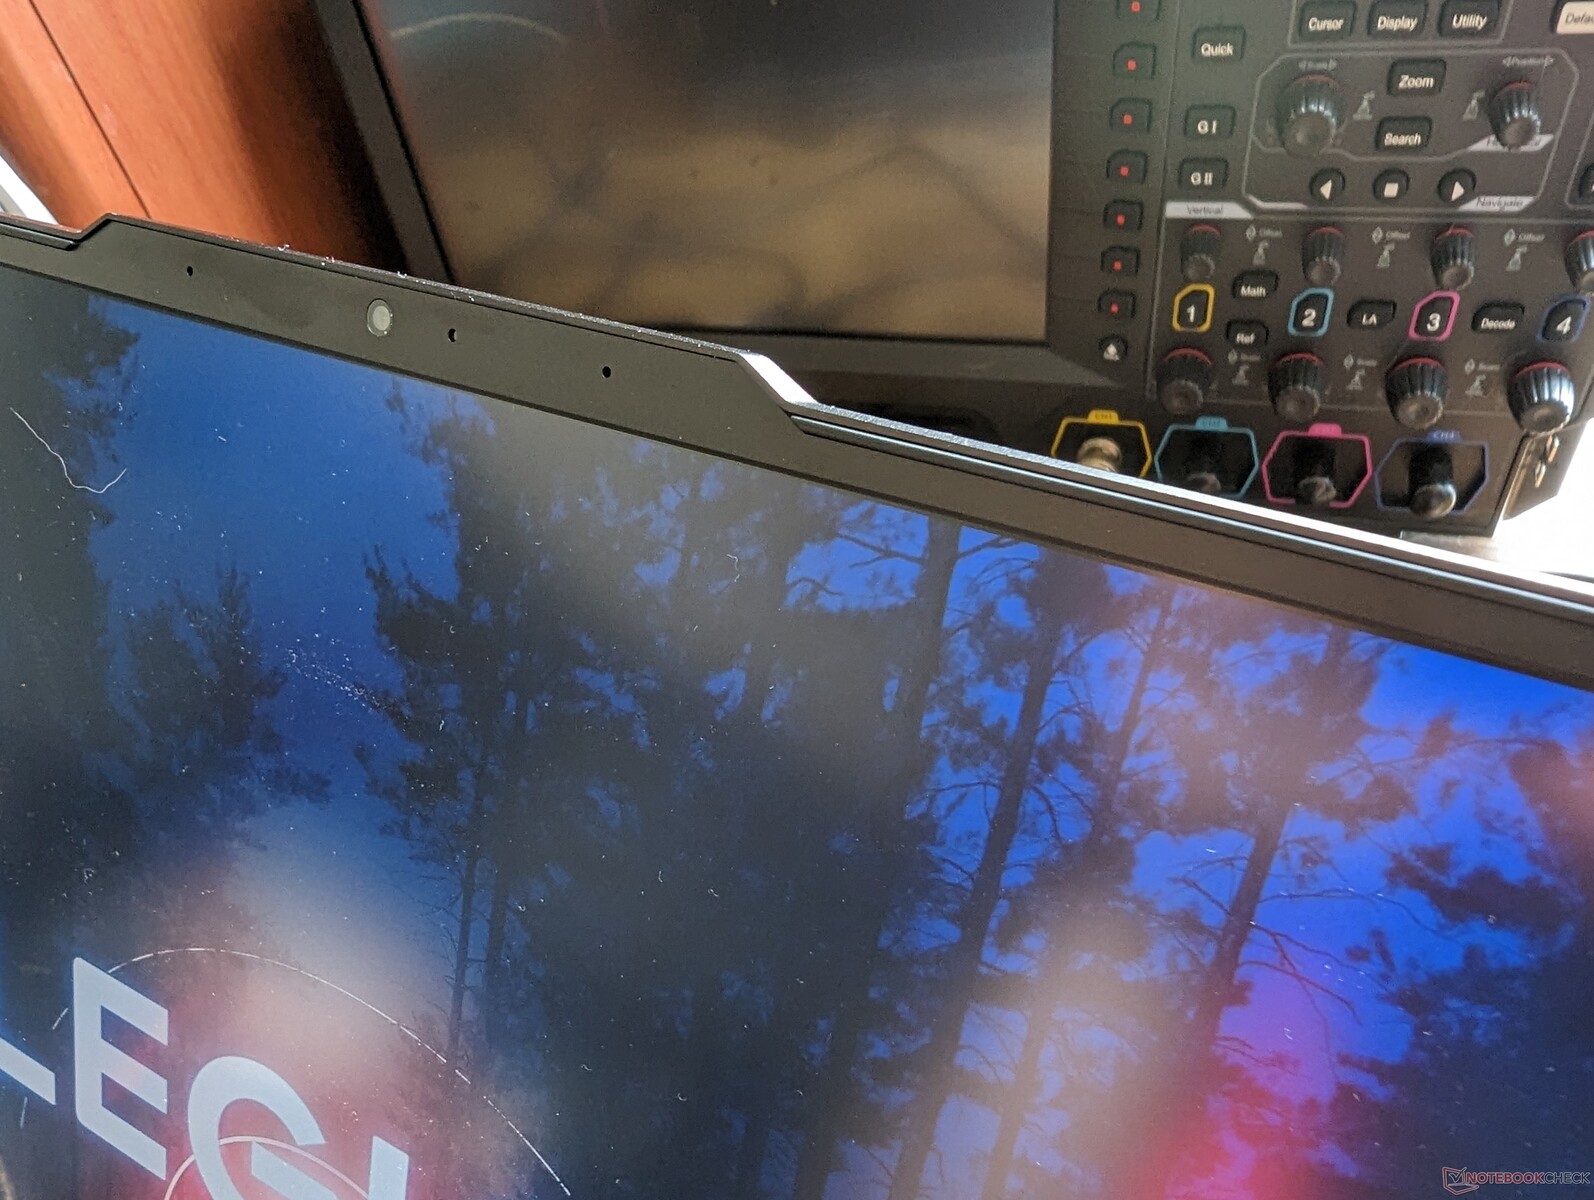
Webcam


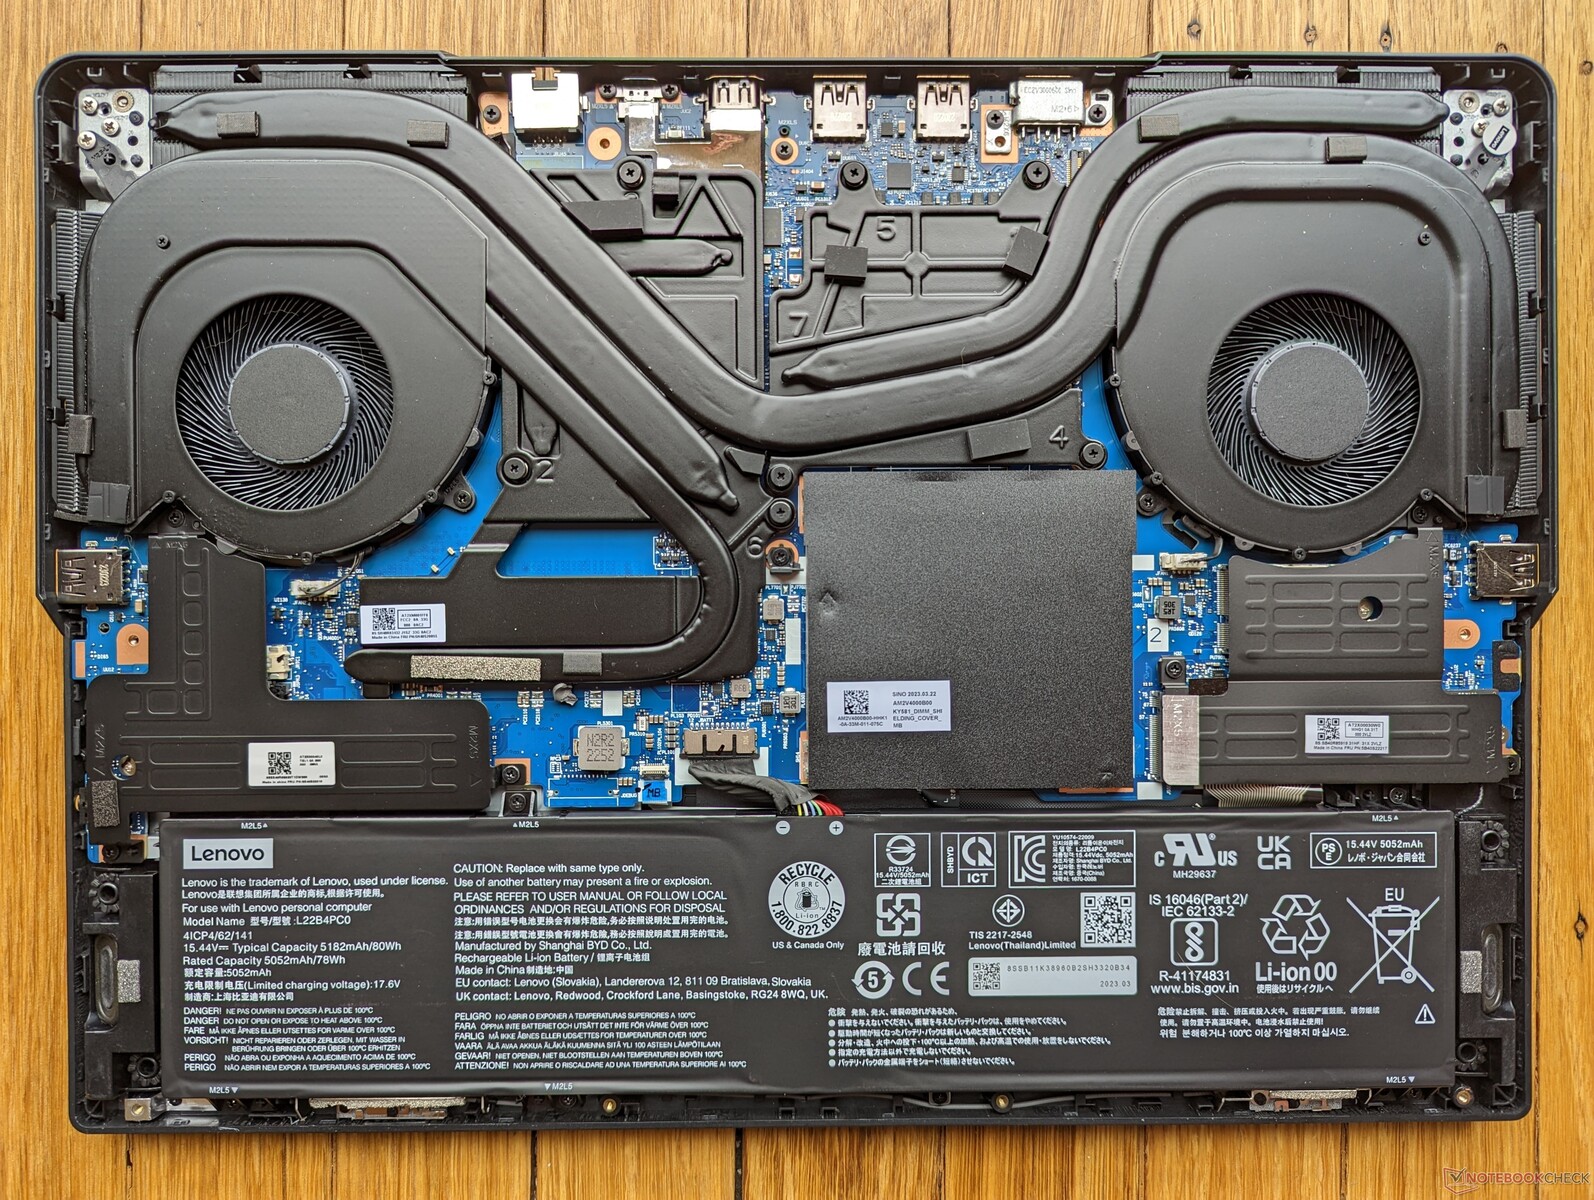
Maintenance
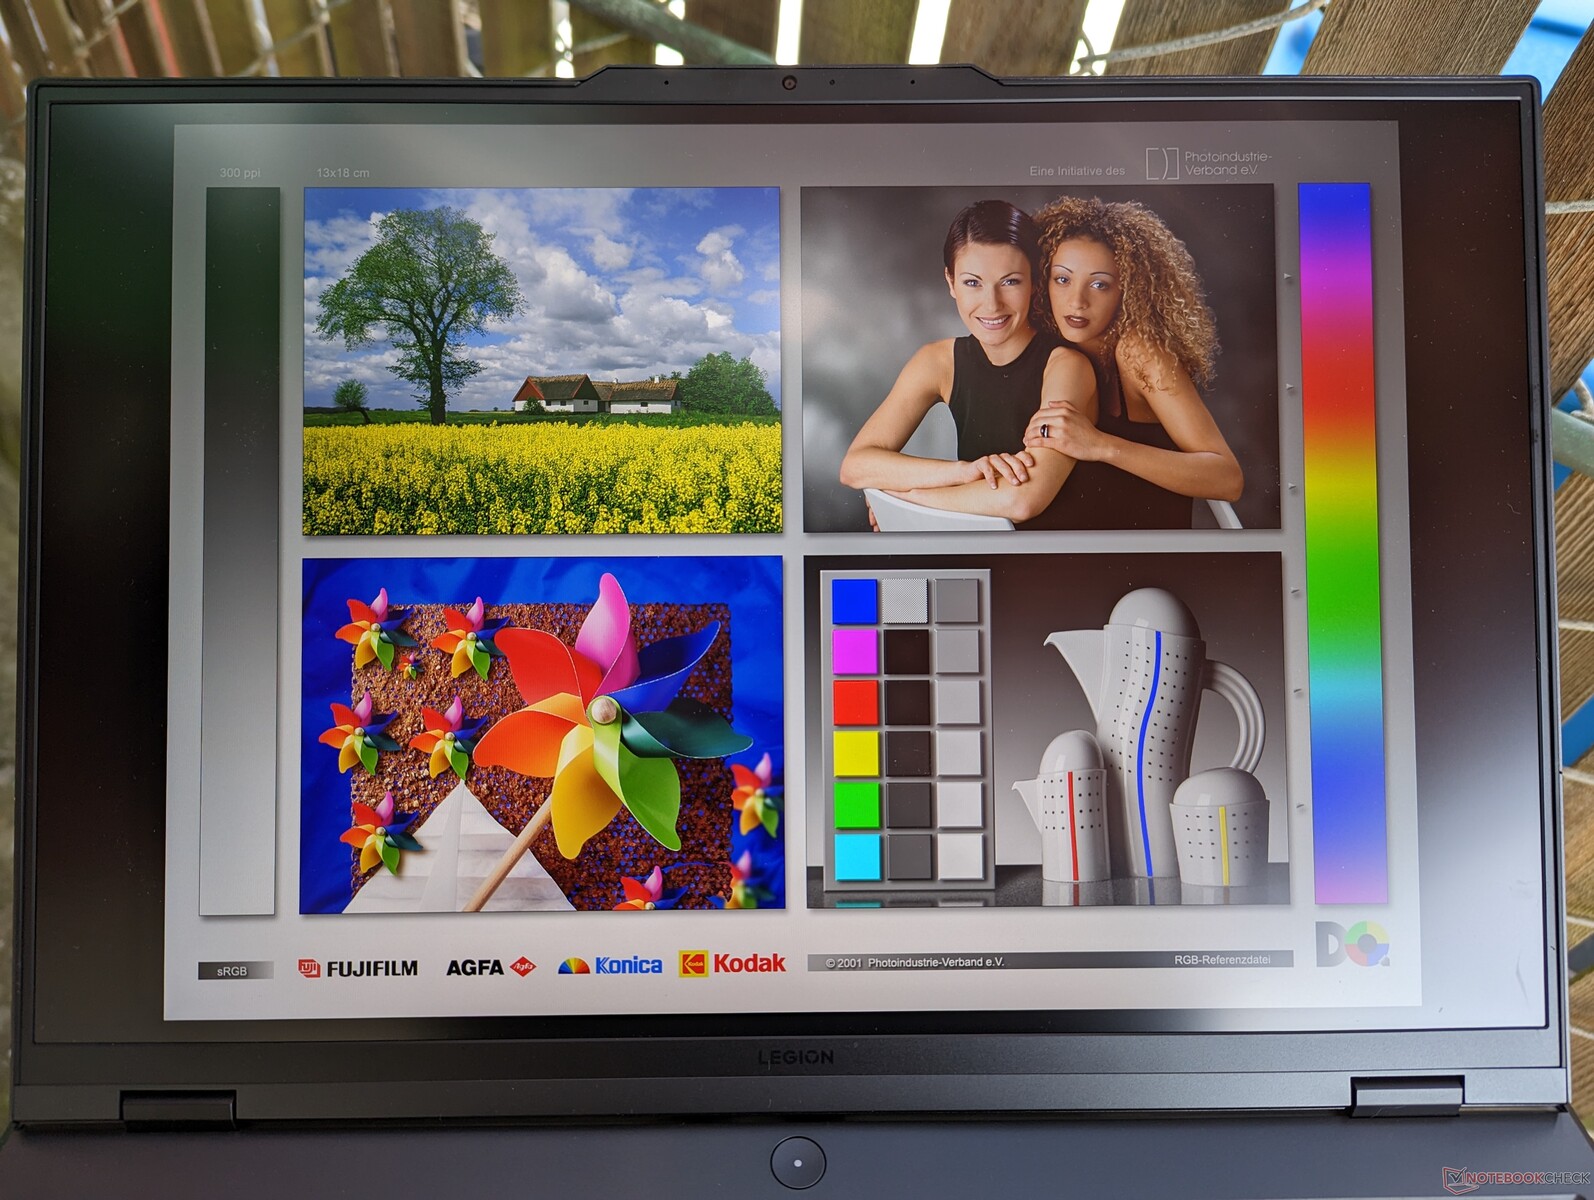
Affichage - 165 Hz, 1600p et Full sRGB
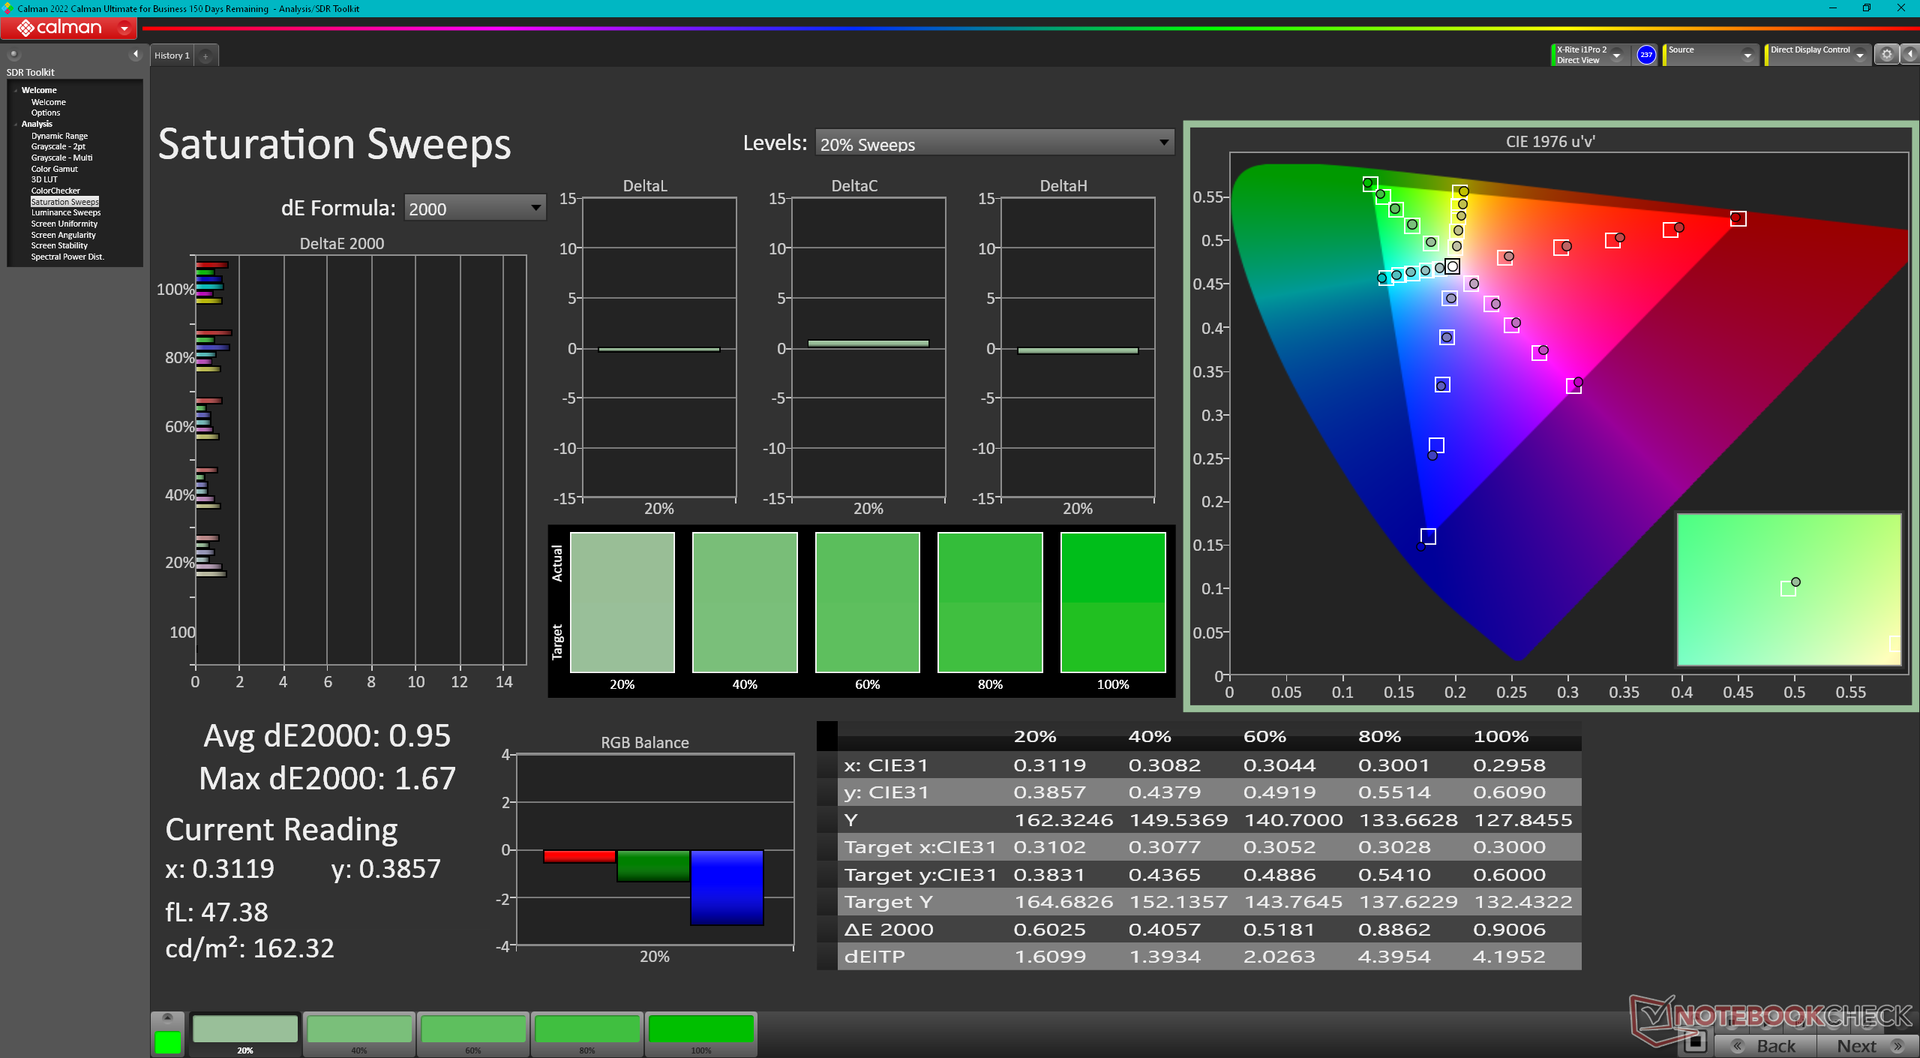
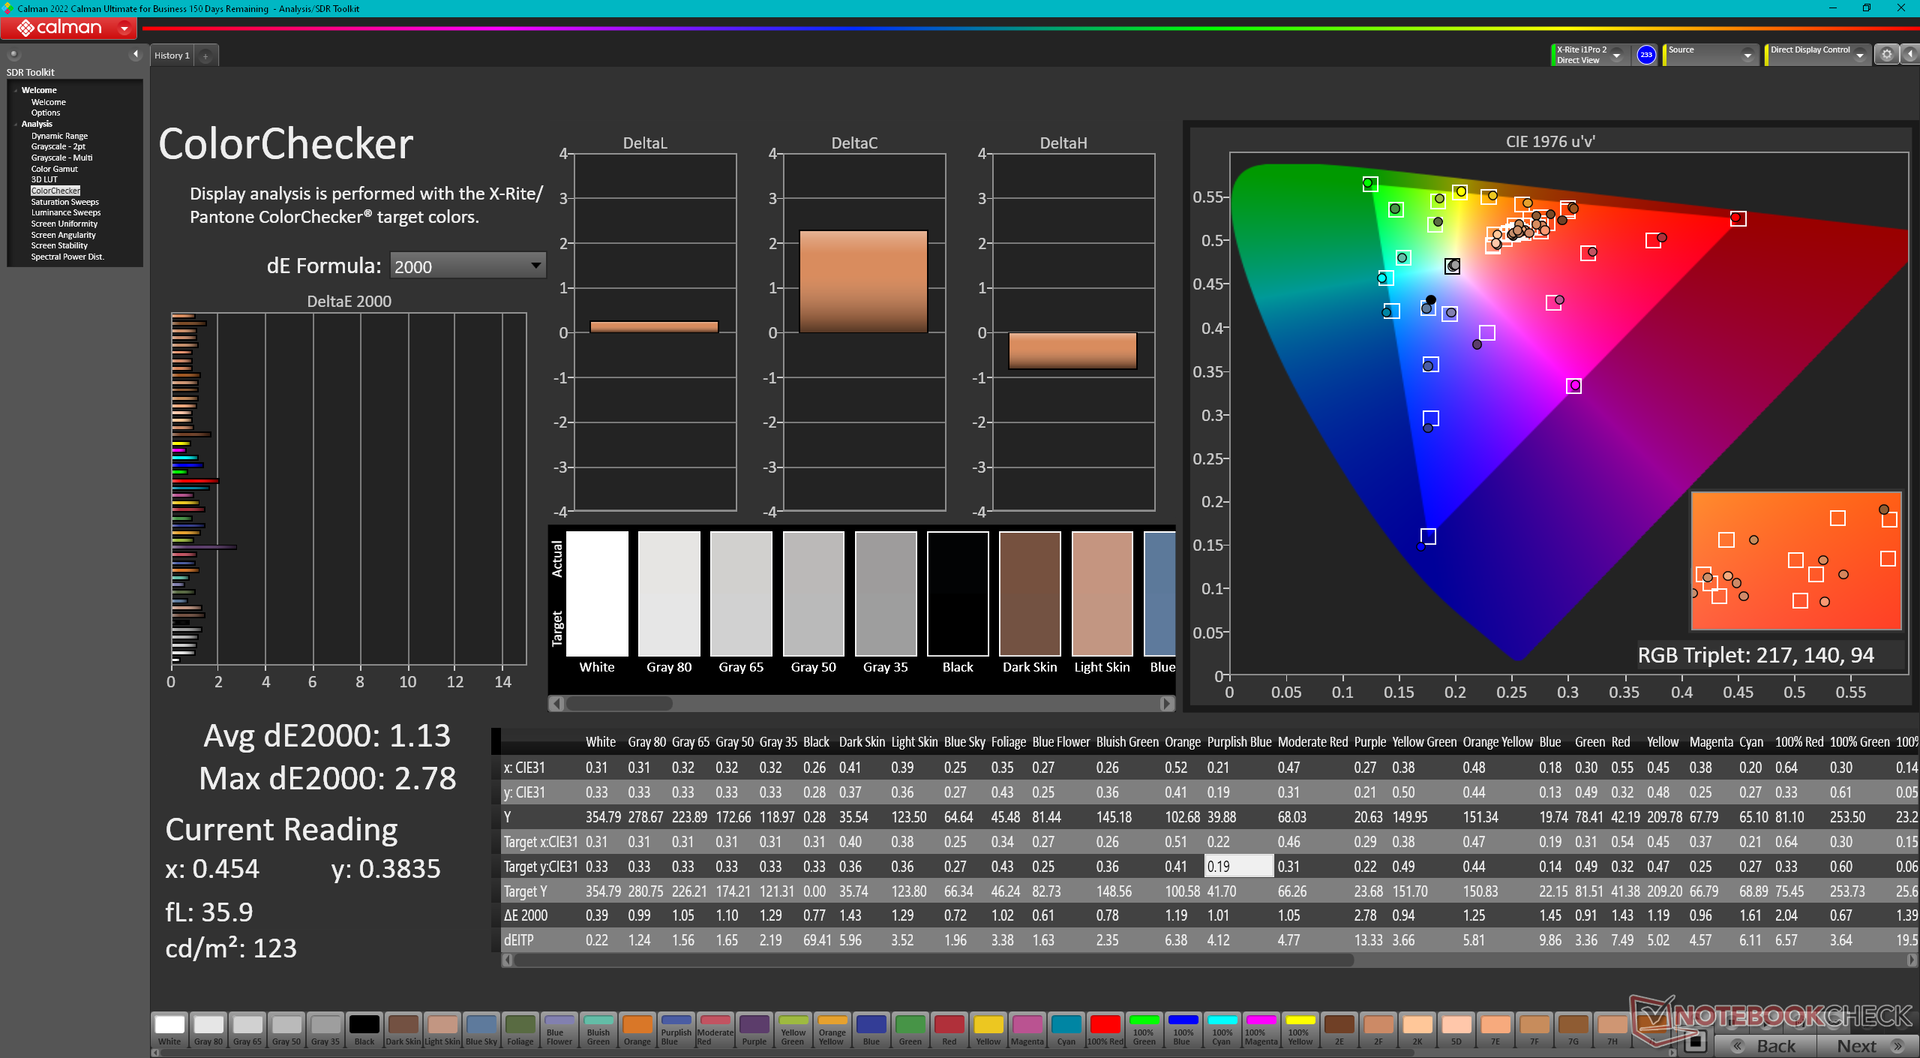
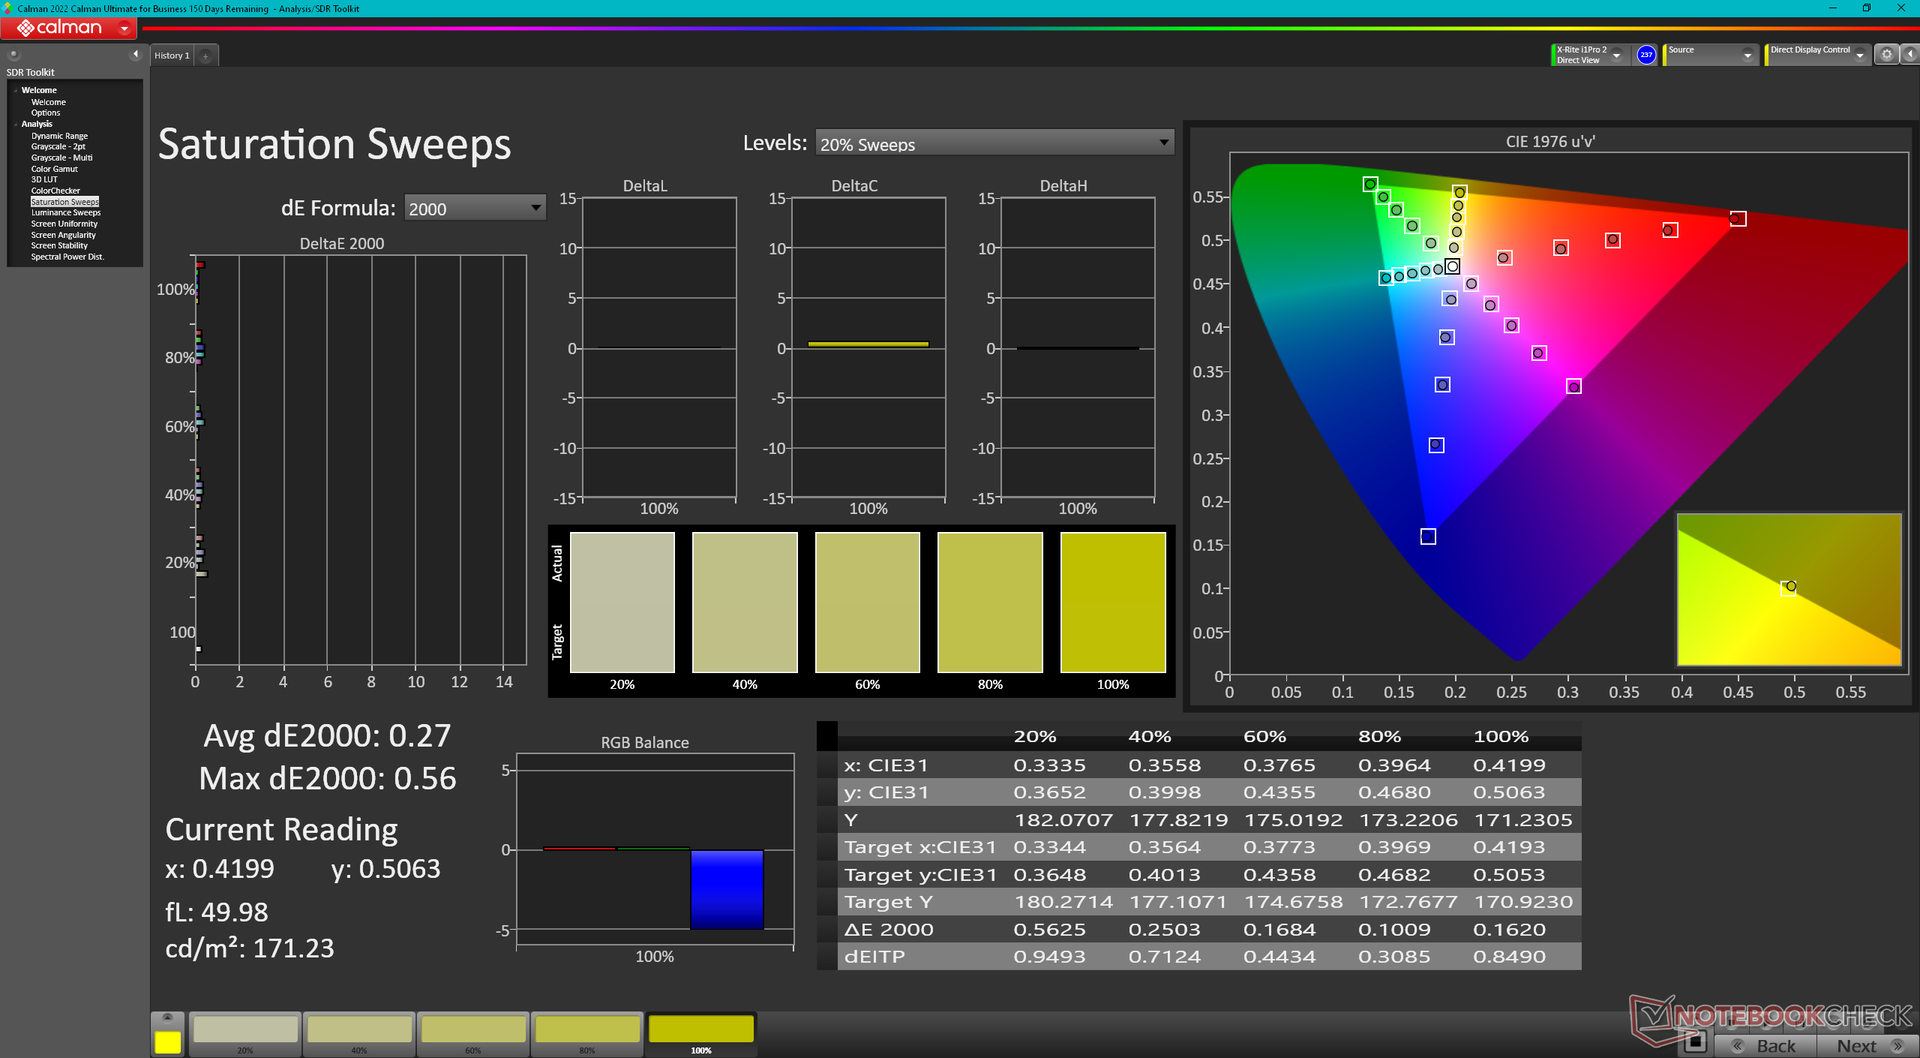
Il est intéressant de noter que notre Legion Pro 5 16ARX8 alimenté par AMD utilise un panneau IPS différent de celui du Legion Pro 5 16IRX8 alimenté par Intel (CSOT MNG007DA1-Q vs. AU Optronics B160QAN03.1) même si les deux panneaux ont un taux de rafraîchissement natif similaire de 165 Hz, une résolution native de 1600p, un rapport de contraste de ~1000:1 et une couverture sRGB complète de 100 %. Le panneau CSOT a des temps de réponse noir-blanc et gris-gris légèrement plus rapides, mais les différences sont au mieux marginales pour une expérience visuelle essentiellement identique.
Une seconde dalle est disponible et promet un rétroéclairage encore plus lumineux de 500 nits et un taux de rafraîchissement plus rapide de 240 Hz. Nos mesures ci-dessous ne tiennent compte que de la dalle de base à 165 Hz.

| |||||||||||||||||||||||||
Homogénéité de la luminosité: 91 %
Valeur mesurée au centre, sur batterie: 355.3 cd/m²
Contraste: 1110:1 (Valeurs des noirs: 0.32 cd/m²)
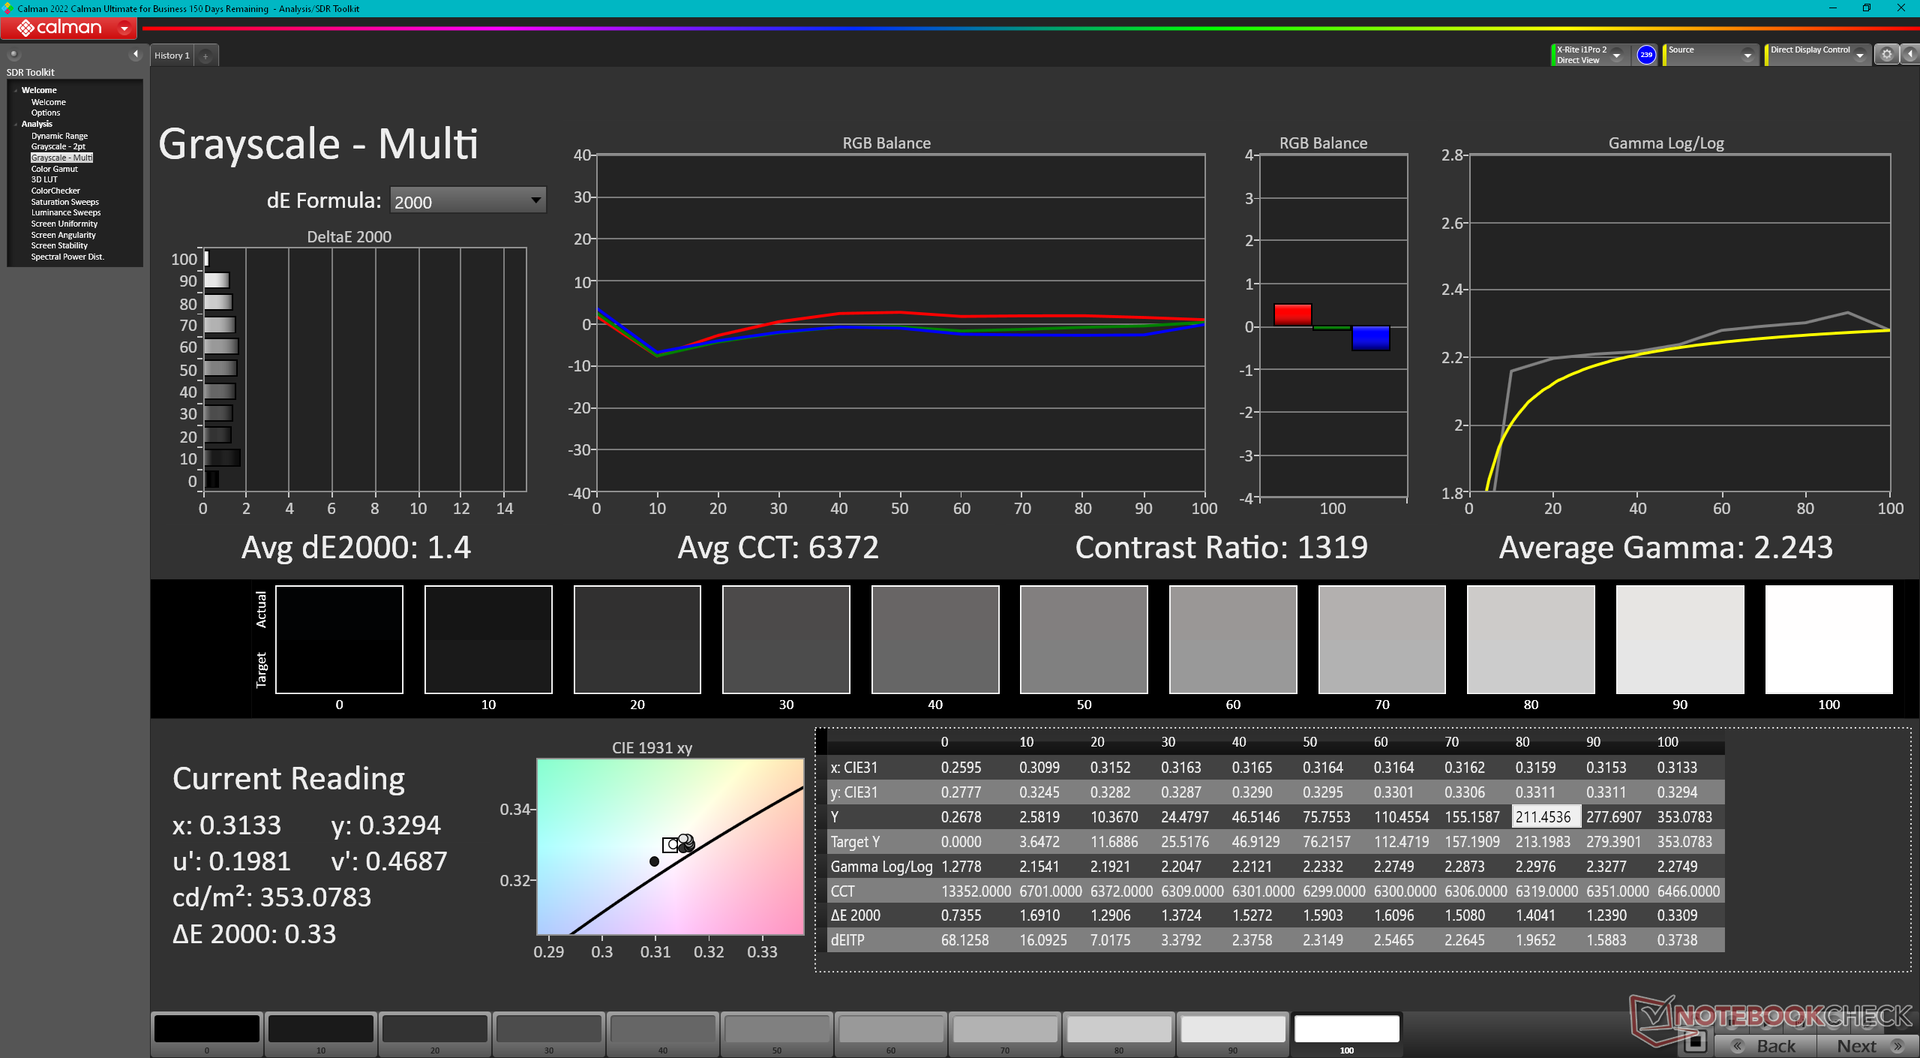
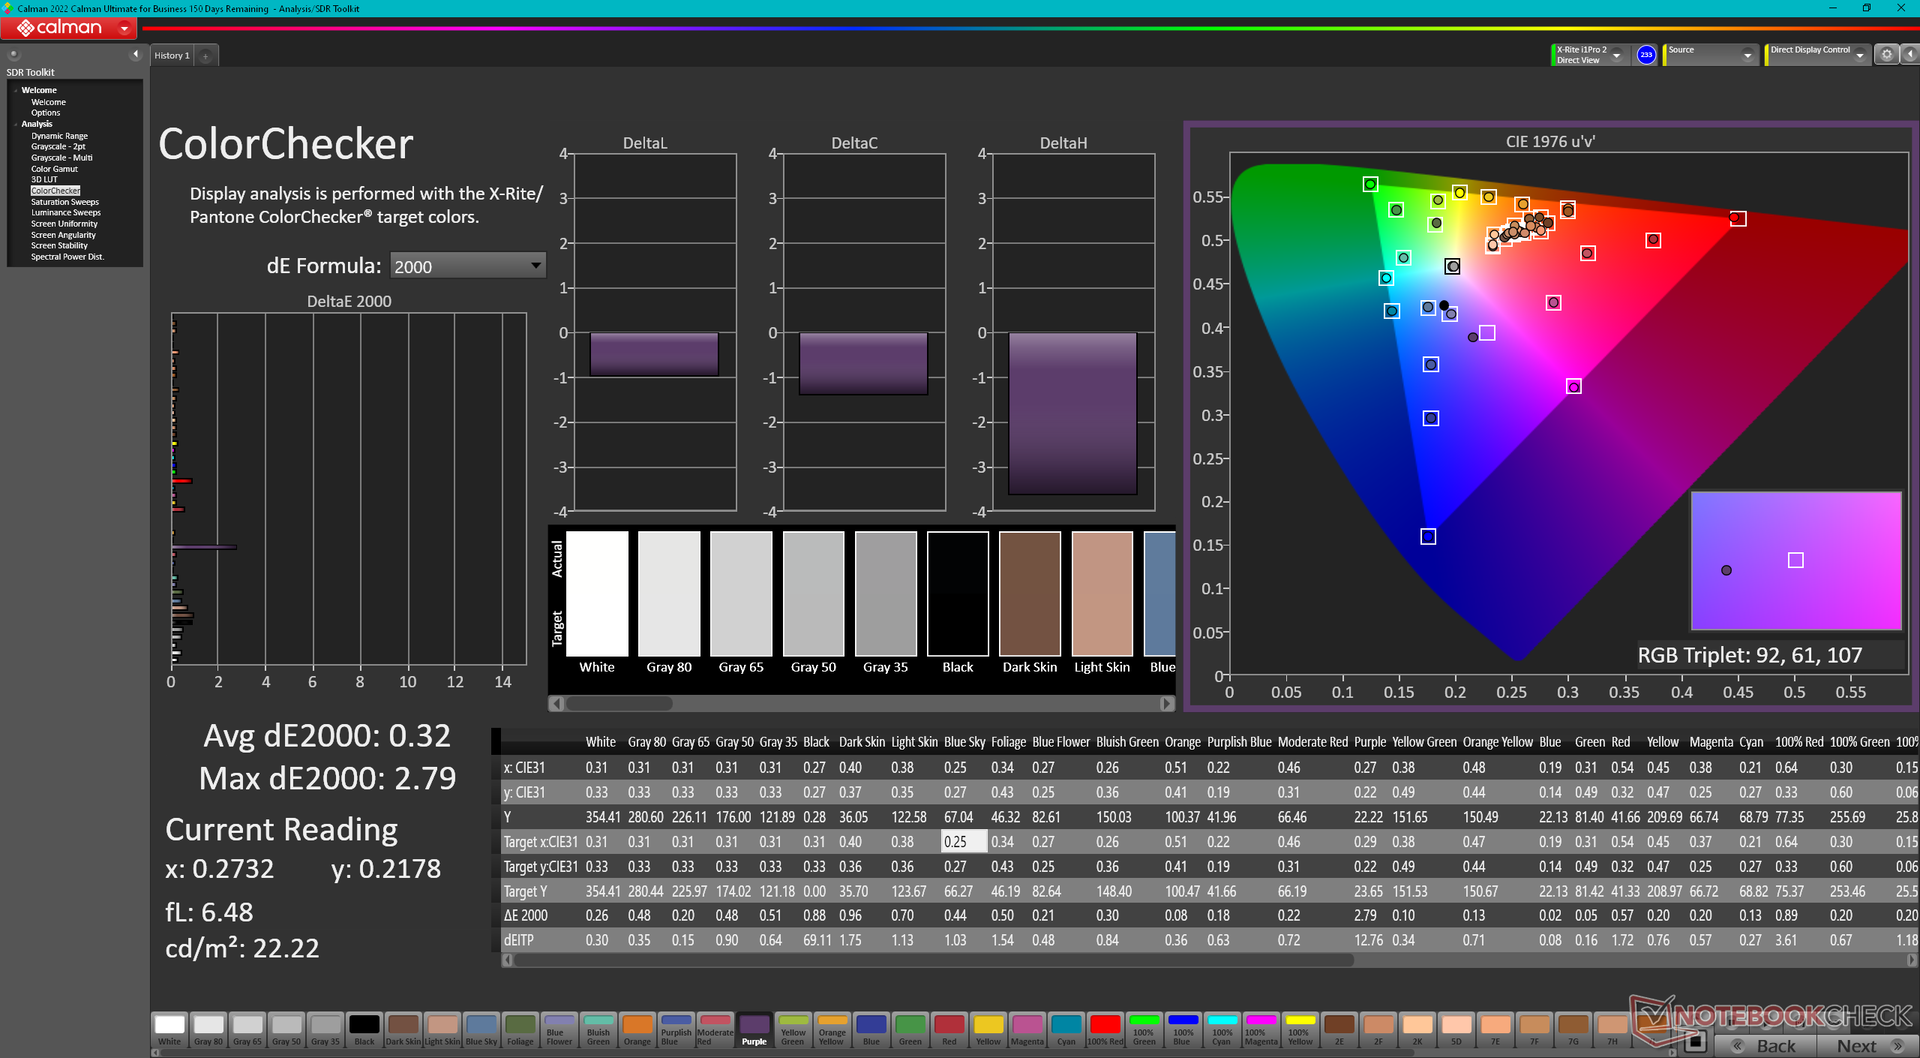
ΔE ColorChecker Calman: 1.13 | ∀{0.5-29.43 Ø4.71}
calibrated: 0.32
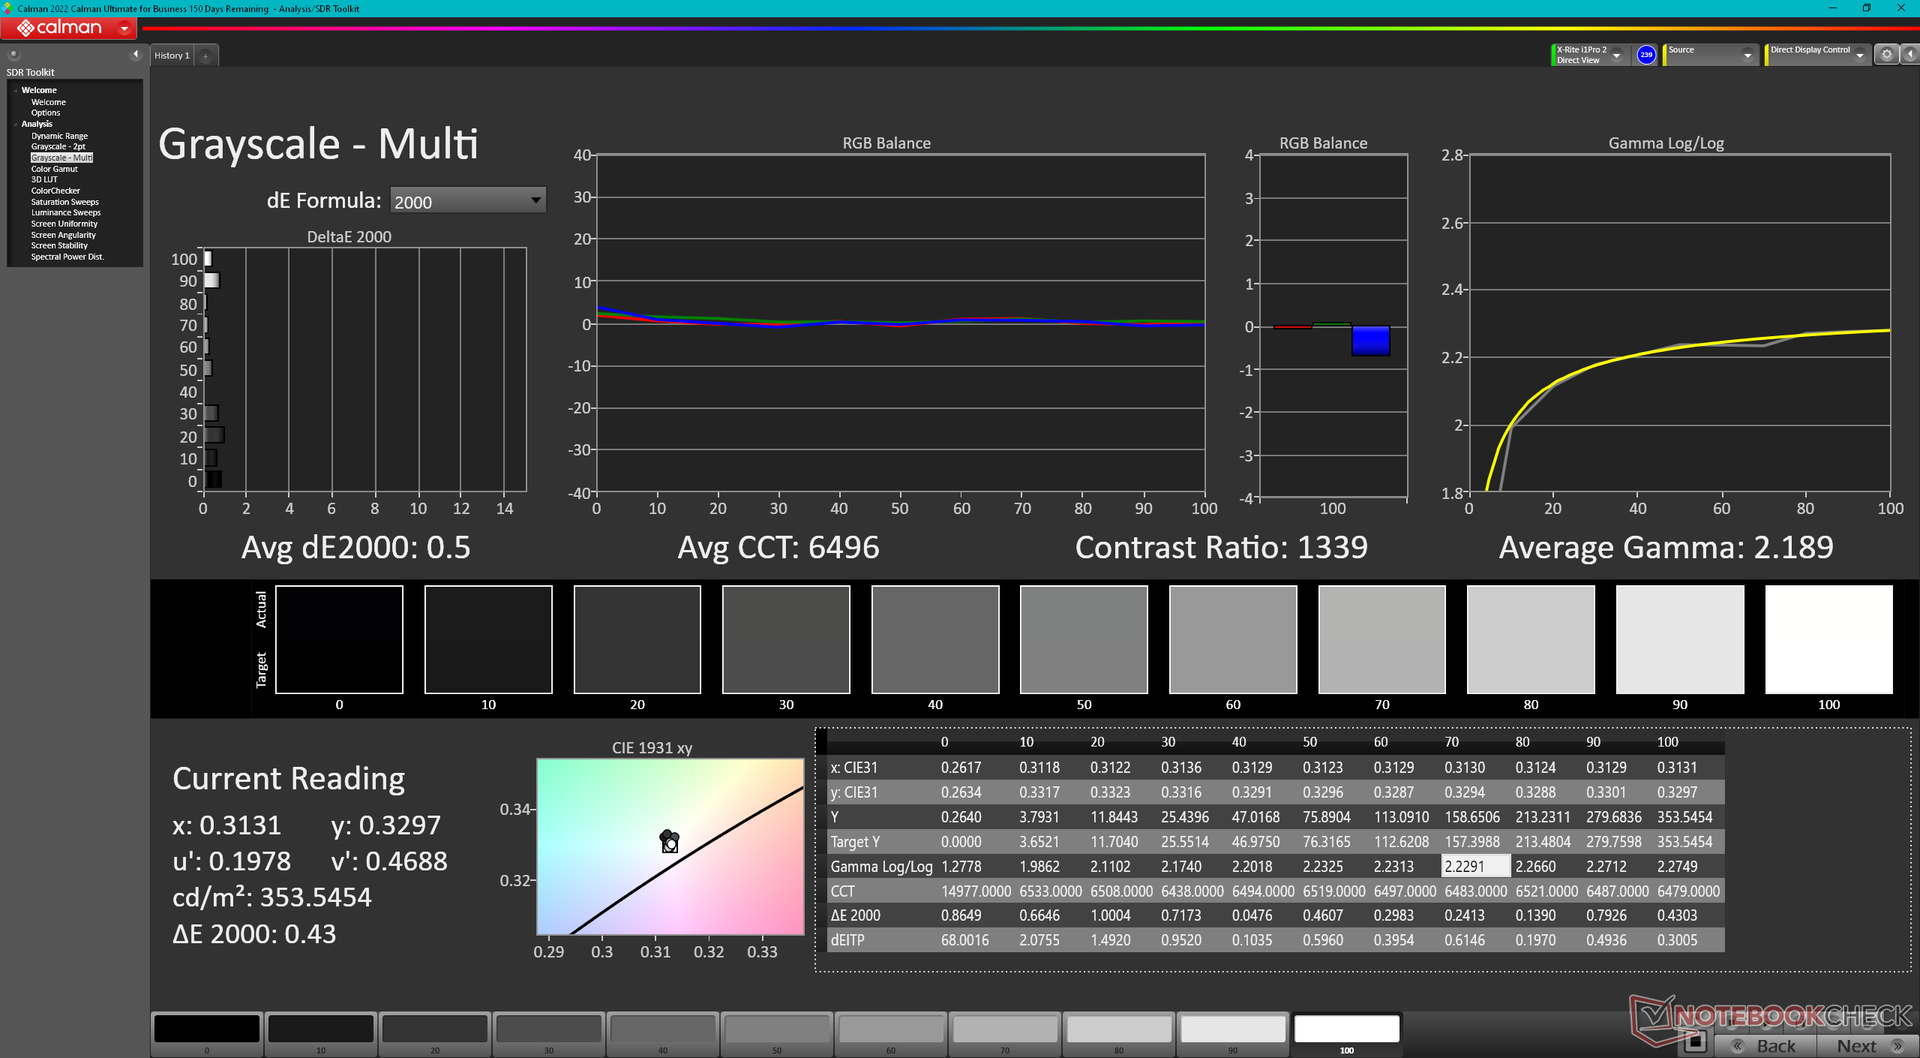
ΔE Greyscale Calman: 1.4 | ∀{0.09-98 Ø4.96}
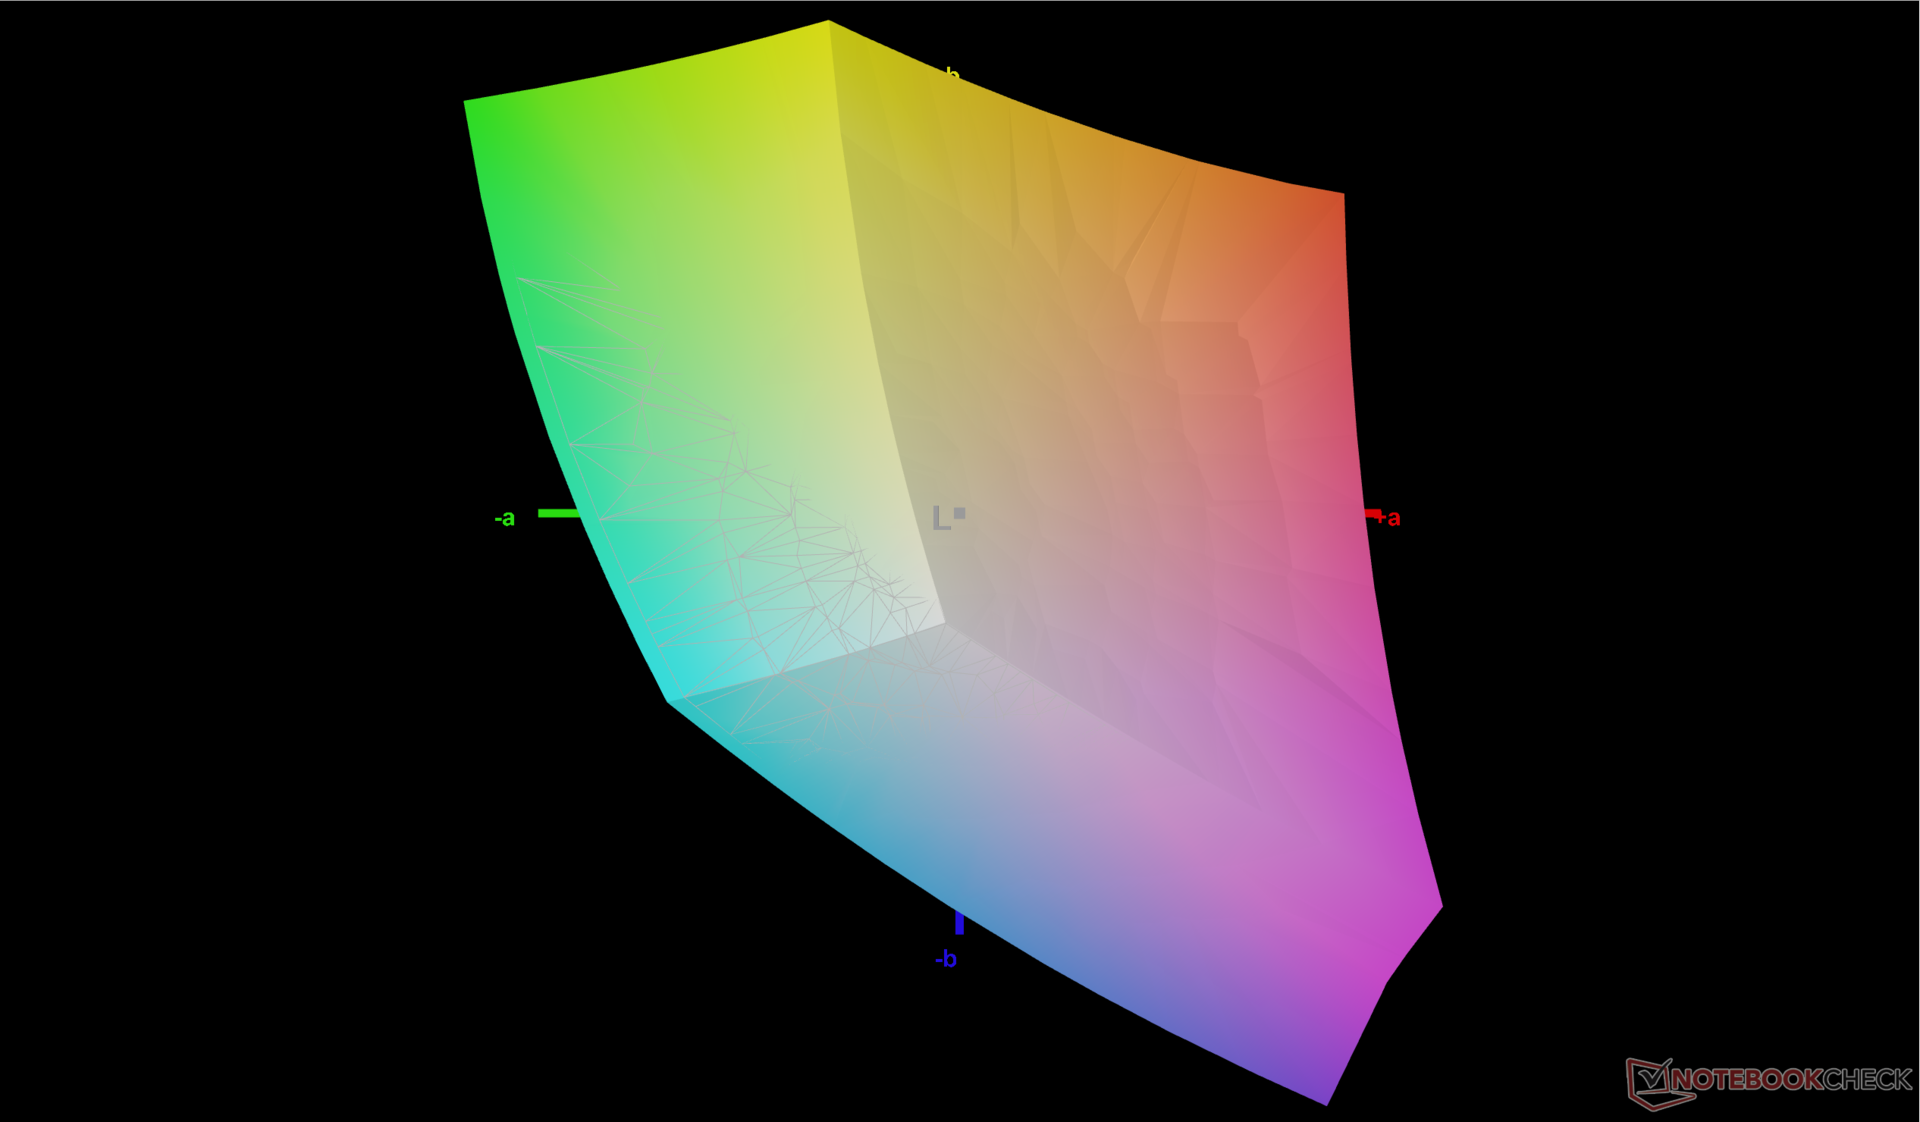
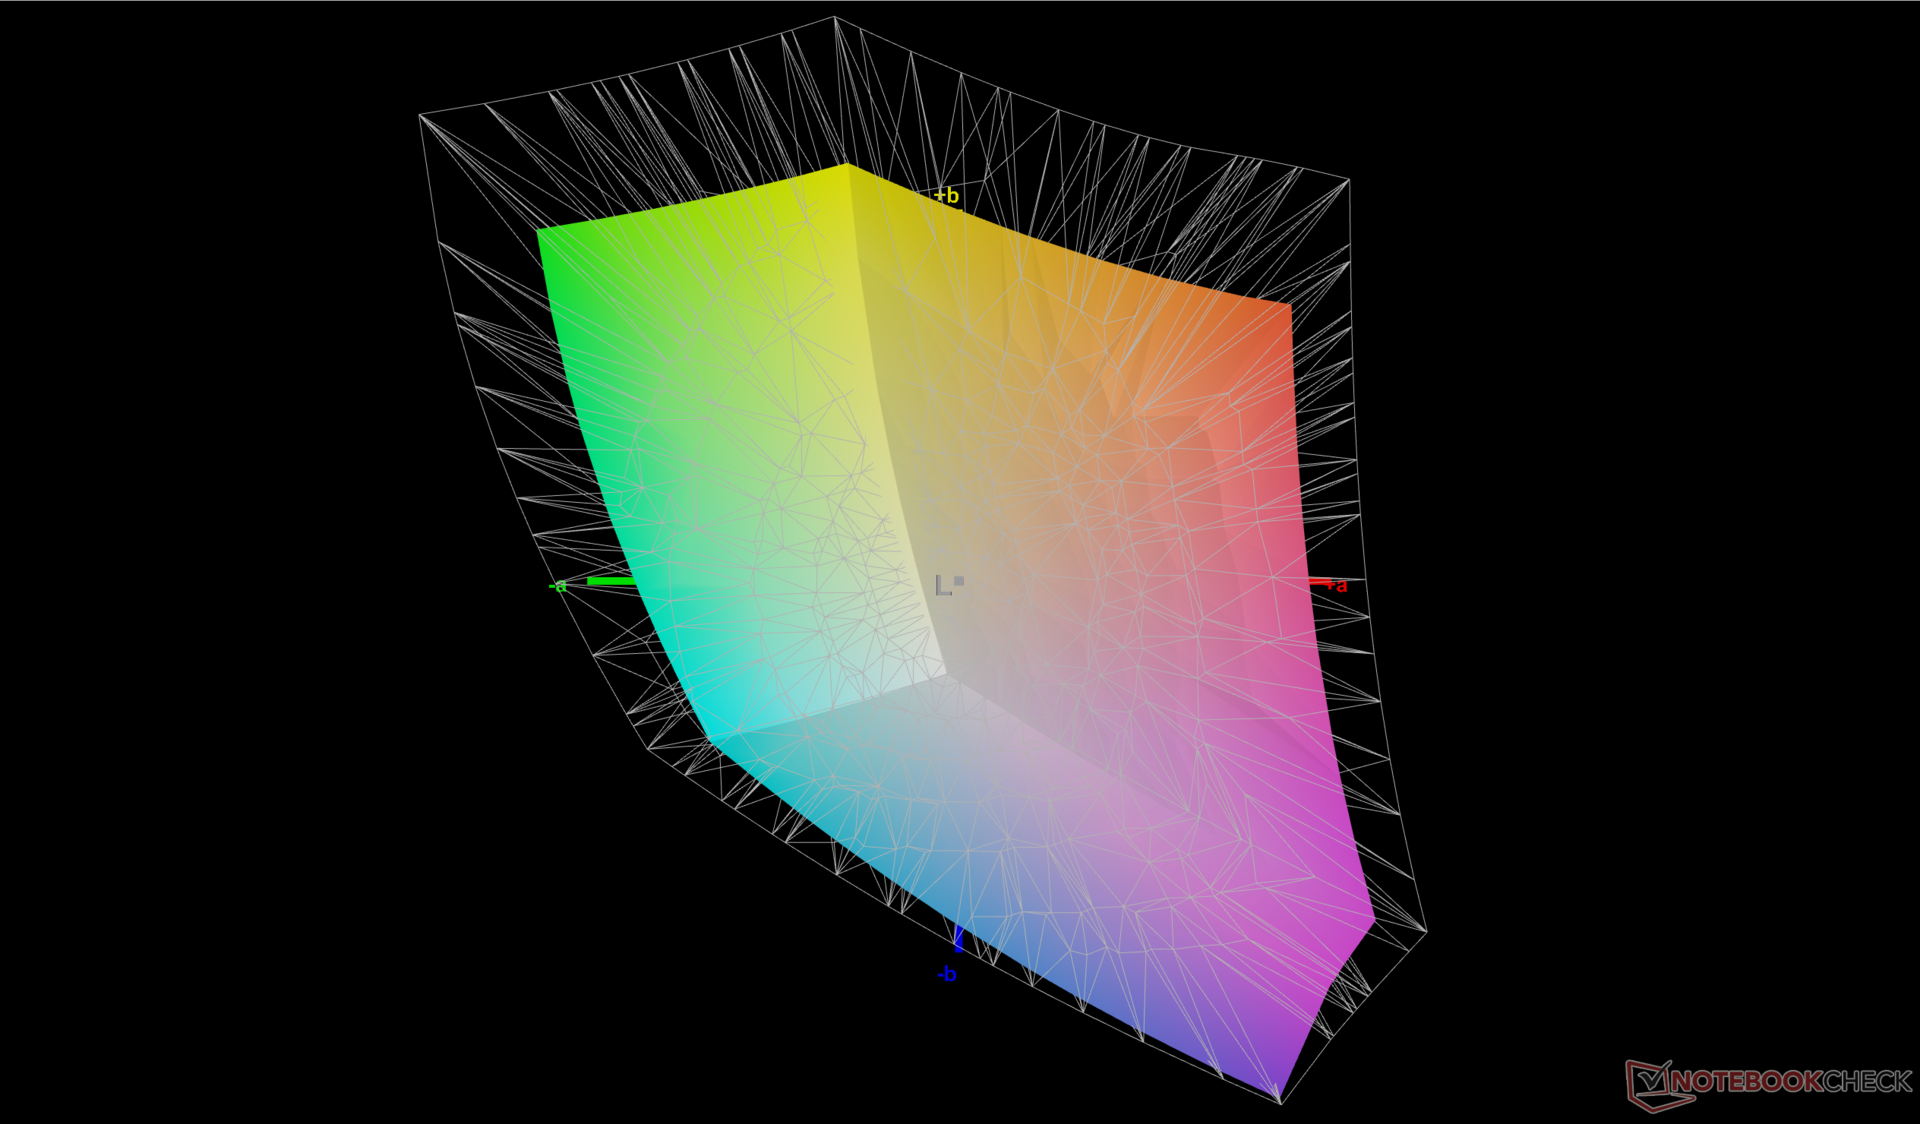
72.6% AdobeRGB 1998 (Argyll 3D)
99.6% sRGB (Argyll 3D)
70.4% Display P3 (Argyll 3D)
Gamma: 2.24
CCT: 6372 K
| Lenovo Legion Pro 5 16ARX8 CSOT T3 MNG007DA1-Q, IPS, 2560x1600, 16" | Lenovo Legion Pro 5 16IRX8 AU Optronics B160QAN03.1, IPS, 2560x1600, 16" | Uniwill GM6PX7X RTX 4070 BOE CQ NE160QDM-NZ1, IPS, 2560x1600, 16" | Schenker XMG Neo 16 E23 BOE0AF0 NE160QDM-NZ1, IPS, 2560x1600, 16" | Asus ROG Strix G16 G614JZ TL160ADMP03-0, IPS, 2560x1600, 16" | Asus Zephyrus Duo 16 GX650PY-NM006W NE160QDM-NM4, MiniLED, 2560x1600, 16" | |
|---|---|---|---|---|---|---|
| Display | 0% | -4% | -4% | 18% | 22% | |
| Display P3 Coverage (%) | 70.4 | 71.2 1% | 67.5 -4% | 67.3 -4% | 97 38% | 99.4 41% |
| sRGB Coverage (%) | 99.6 | 98.8 -1% | 96.4 -3% | 96.7 -3% | 99.9 0% | 100 0% |
| AdobeRGB 1998 Coverage (%) | 72.6 | 73.3 1% | 68.6 -6% | 68.9 -5% | 84.9 17% | 90.8 25% |
| Response Times | -61% | -44% | -51% | 27% | -113% | |
| Response Time Grey 50% / Grey 80% * (ms) | 7 ? | 14.5 ? -107% | 12.6 ? -80% | 14.5 ? -107% | 5.1 ? 27% | 15.2 ? -117% |
| Response Time Black / White * (ms) | 9.1 ? | 10.4 ? -14% | 9.8 ? -8% | 8.6 ? 5% | 6.6 ? 27% | 19 ? -109% |
| PWM Frequency (Hz) | 12000 ? | |||||
| Screen | -17% | -69% | -54% | -39% | 71% | |
| Brightness middle (cd/m²) | 355.3 | 405.7 14% | 338.6 -5% | 372 5% | 470 32% | 712 100% |
| Brightness (cd/m²) | 340 | 368 8% | 328 -4% | 349 3% | 459 35% | 703 107% |
| Brightness Distribution (%) | 91 | 87 -4% | 89 -2% | 88 -3% | 93 2% | 95 4% |
| Black Level * (cd/m²) | 0.32 | 0.38 -19% | 0.32 -0% | 0.32 -0% | 0.42 -31% | 0.07 78% |
| Contrast (:1) | 1110 | 1068 -4% | 1058 -5% | 1163 5% | 1119 1% | 10171 816% |
| Colorchecker dE 2000 * | 1.13 | 1.65 -46% | 2.18 -93% | 2.06 -82% | 1.86 -65% | 1.7 -50% |
| Colorchecker dE 2000 max. * | 2.78 | 4.2 -51% | 7.14 -157% | 3 -8% | 3.87 -39% | 4 -44% |
| Colorchecker dE 2000 calibrated * | 0.32 | 0.53 -66% | 0.93 -191% | 1.5 -369% | 0.93 -191% | 1.2 -275% |
| Greyscale dE 2000 * | 1.4 | 1.2 14% | 3.7 -164% | 1.9 -36% | 2.7 -93% | 2.8 -100% |
| Gamma | 2.24 98% | 2.3 96% | 2.18 101% | 2.312 95% | 2.246 98% | 2.21 100% |
| CCT | 6372 102% | 6453 101% | 7245 90% | 6747 96% | 6711 97% | 6978 93% |
| Moyenne finale (programmes/paramètres) | -26% /
-20% | -39% /
-52% | -36% /
-43% | 2% /
-17% | -7% /
34% |
* ... Moindre est la valeur, meilleures sont les performances
L'écran est livré pré-calibré avec d'excellentes valeurs moyennes de DeltaE en niveaux de gris et en couleurs, respectivement de 1,4 et 1,13. En essayant de calibrer davantage l'écran à l'aide de notre colorimètre X-Rite, les valeurs de deltaE en niveaux de gris et en couleurs seraient en fait inférieures à 0,5 chacune. Néanmoins, un étalonnage par l'utilisateur final n'est généralement pas nécessaire si les valeurs deltaE sont déjà inférieures à 2.
Temps de réponse de l'écran
| ↔ Temps de réponse noir à blanc | ||
|---|---|---|
| 9.1 ms ... hausse ↗ et chute ↘ combinées | ↗ 4.9 ms hausse | 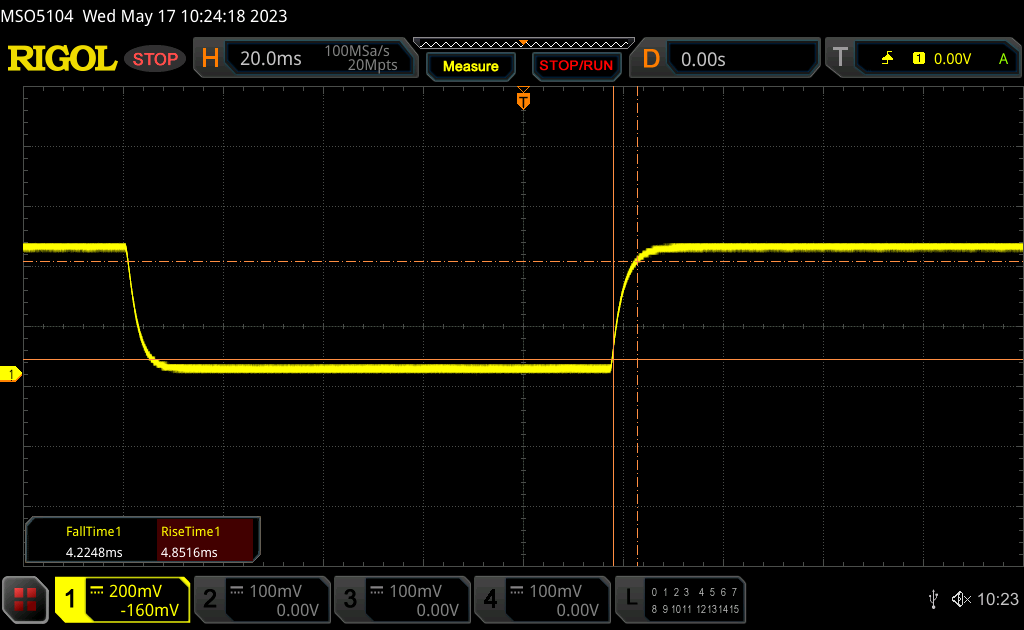 |
| ↘ 4.2 ms chute | ||
| L'écran montre de faibles temps de réponse, un bon écran pour jouer. En comparaison, tous les appareils testés affichent entre 0.1 (minimum) et 240 (maximum) ms. » 26 % des appareils testés affichent de meilleures performances. Cela signifie que les latences relevées sont meilleures que la moyenne (19.8 ms) de tous les appareils testés. | ||
| ↔ Temps de réponse gris 50% à gris 80% | ||
| 7 ms ... hausse ↗ et chute ↘ combinées | ↗ 3.2 ms hausse | 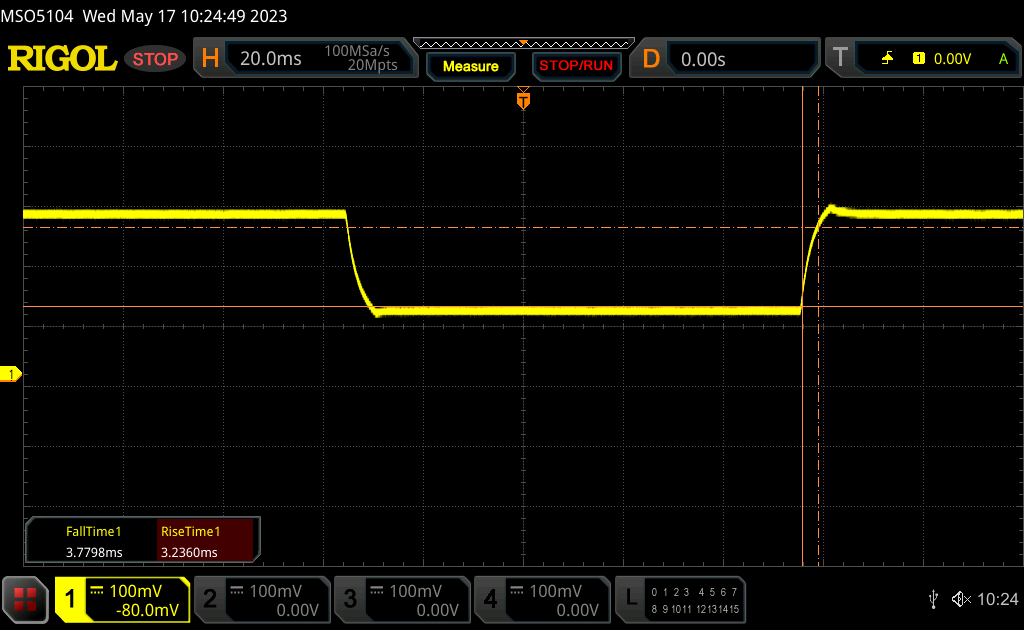 |
| ↘ 3.8 ms chute | ||
| L'écran montre de très faibles temps de réponse, parfait pour le jeu. En comparaison, tous les appareils testés affichent entre 0.165 (minimum) et 636 (maximum) ms. » 20 % des appareils testés affichent de meilleures performances. Cela signifie que les latences relevées sont meilleures que la moyenne (30.9 ms) de tous les appareils testés. | ||
Scintillement / MLI (Modulation de largeur d'impulsion)
| Scintillement / MLI (Modulation de largeur d'impulsion) non décelé | 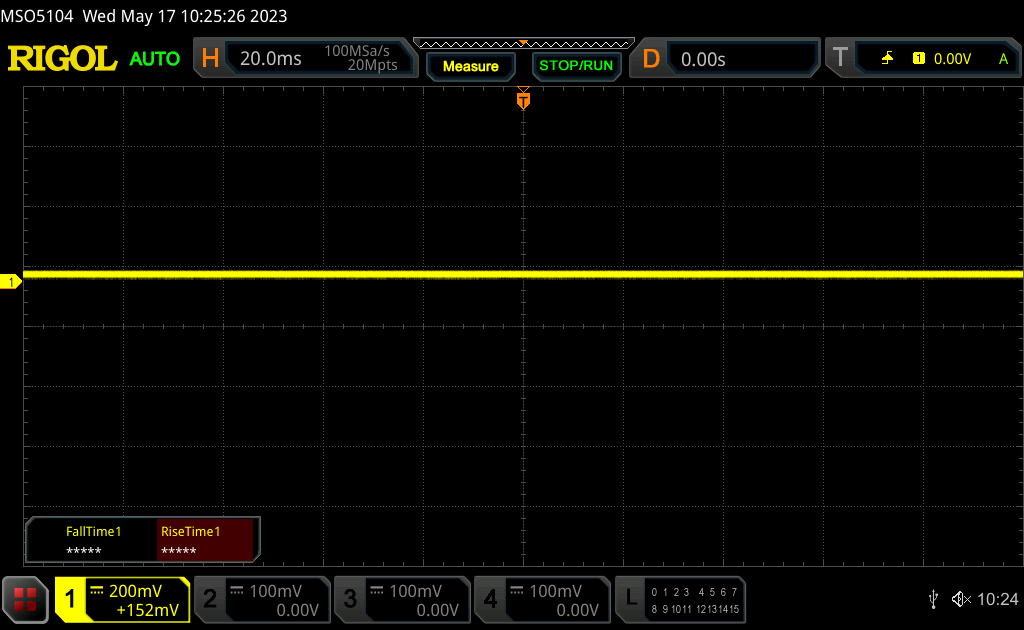 | ||
En comparaison, 52 % des appareils testés n'emploient pas MDI pour assombrir leur écran. Nous avons relevé une moyenne à 7741 (minimum : 5 - maximum : 343500) Hz dans le cas où une MDI était active. | |||
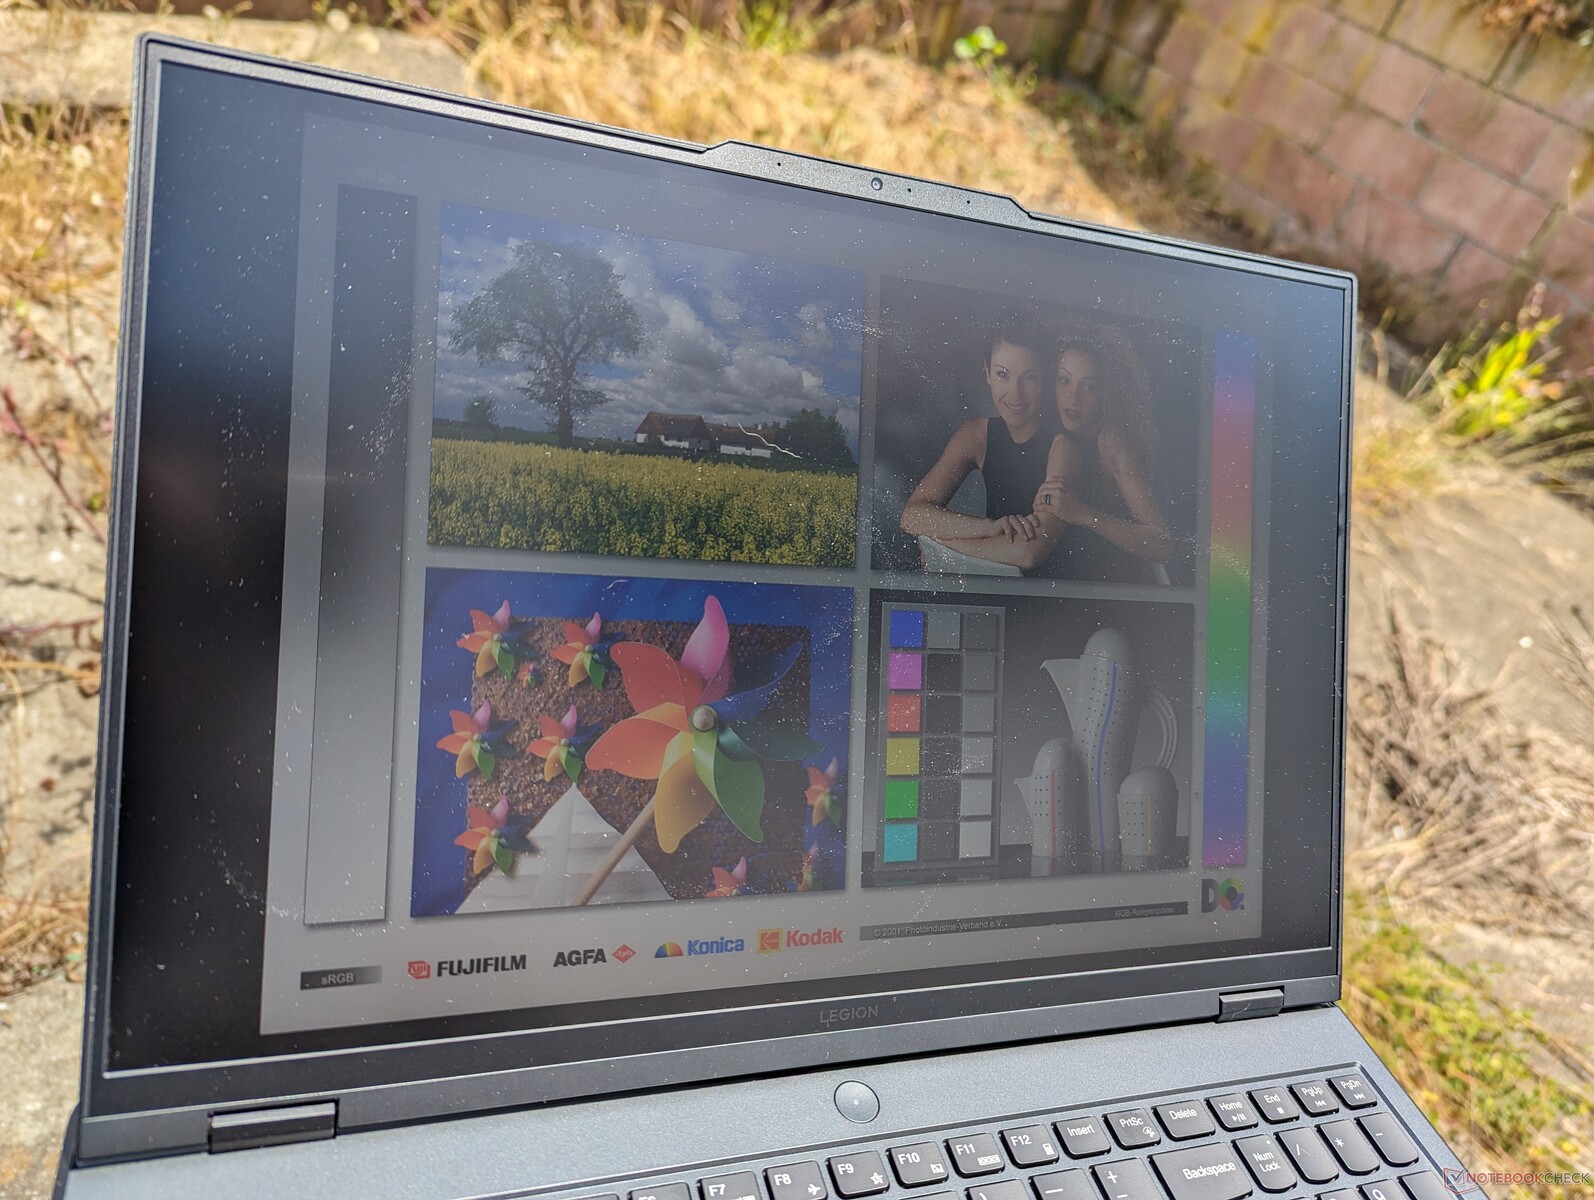
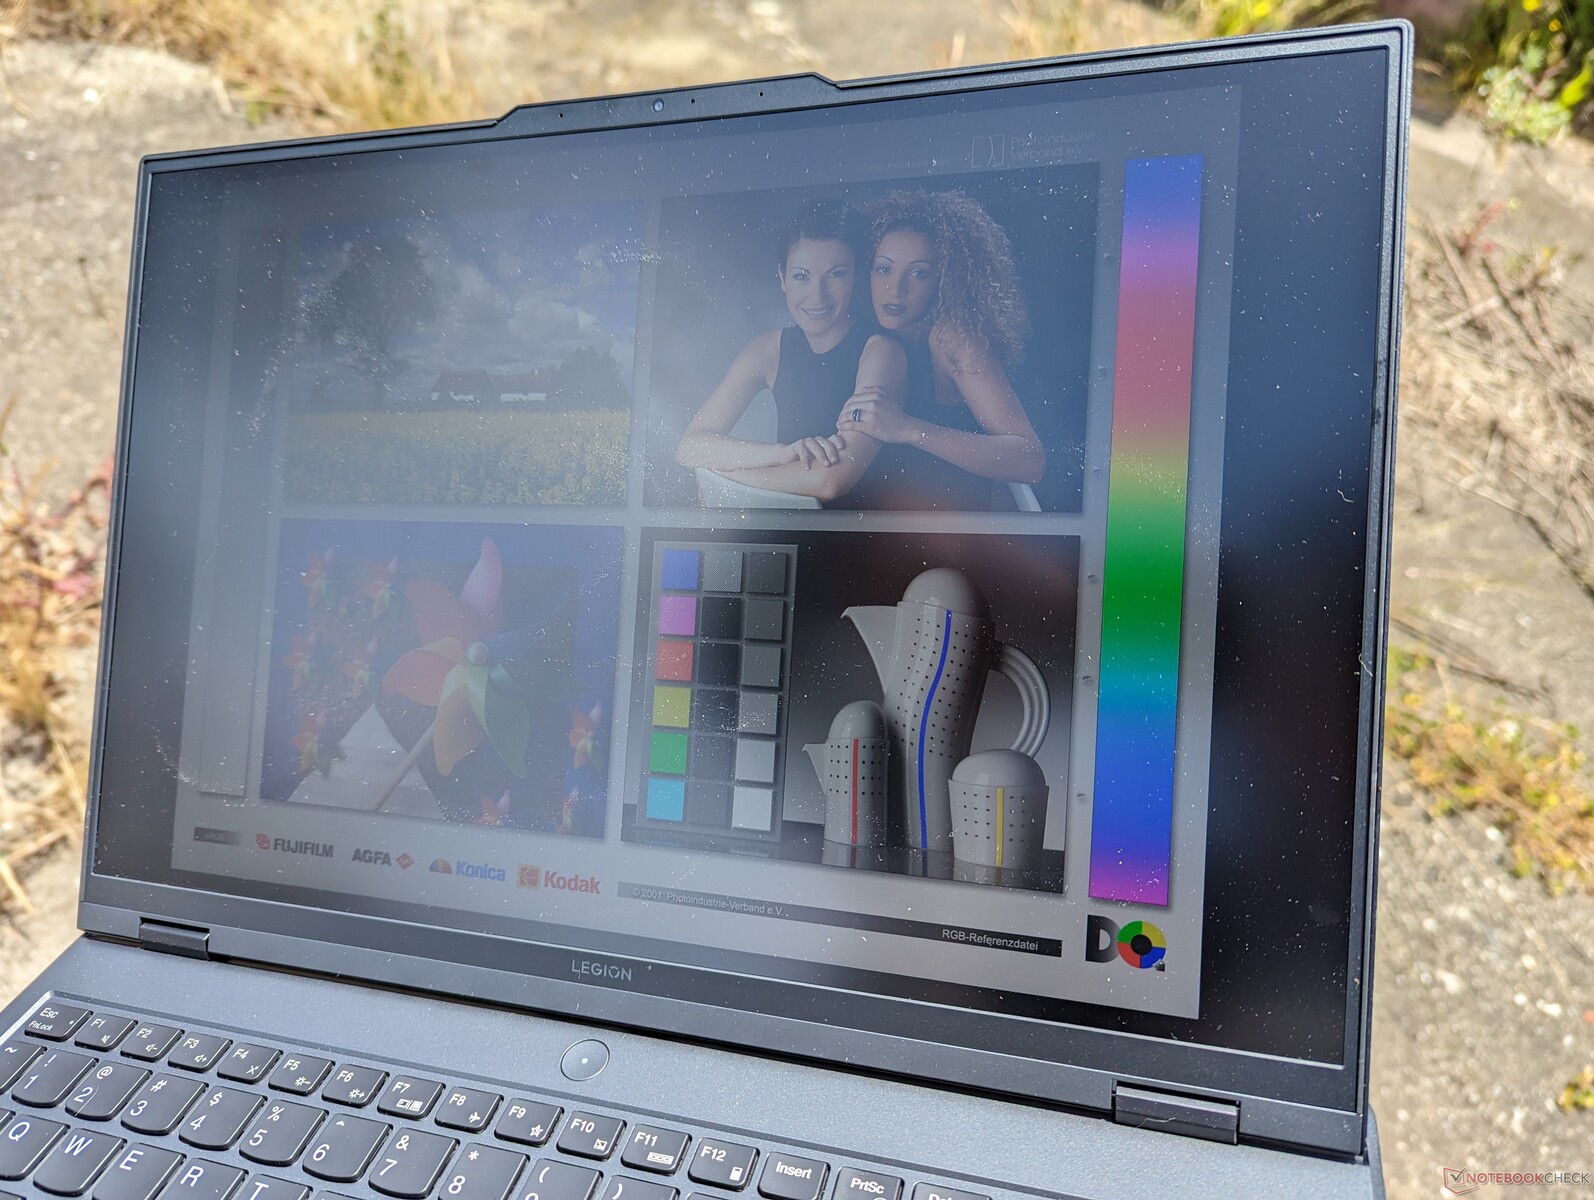
La visibilité extérieure est moyenne pour la catégorie car les écrans de la plupart des ordinateurs portables de jeu se situent généralement entre 300 et 400 nits. L'option 240 Hz promet une luminosité de 500 nits, soit environ 200 nits de plus que notre écran 165 Hz, ce qui devrait améliorer la visibilité à l'extérieur si elle est un problème. Quoi qu'il en soit, il est préférable de travailler à l'ombre dans la mesure du possible afin de minimiser les reflets et de préserver les couleurs.

Performances - Milieu de gamme Zen 4 Ryzen 7
Conditions d'essai
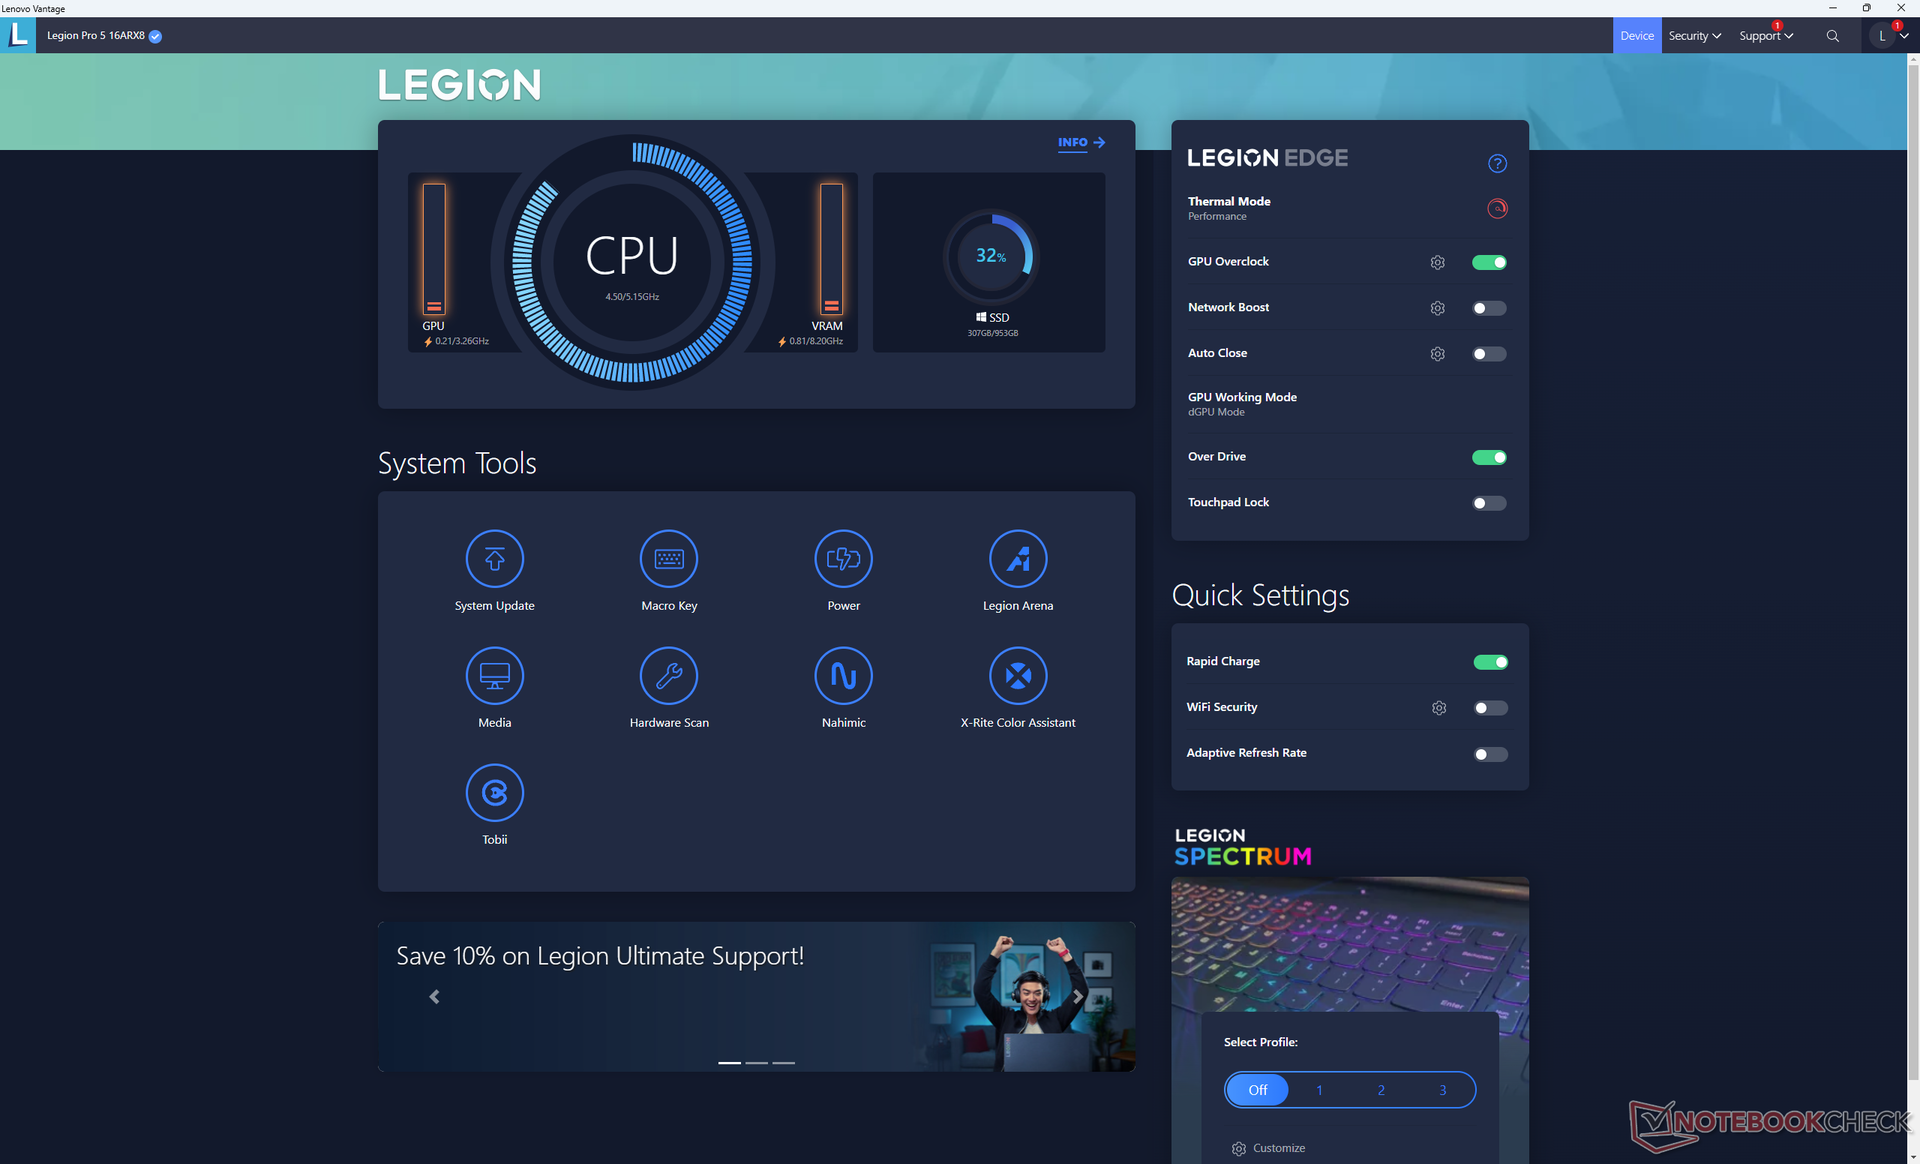
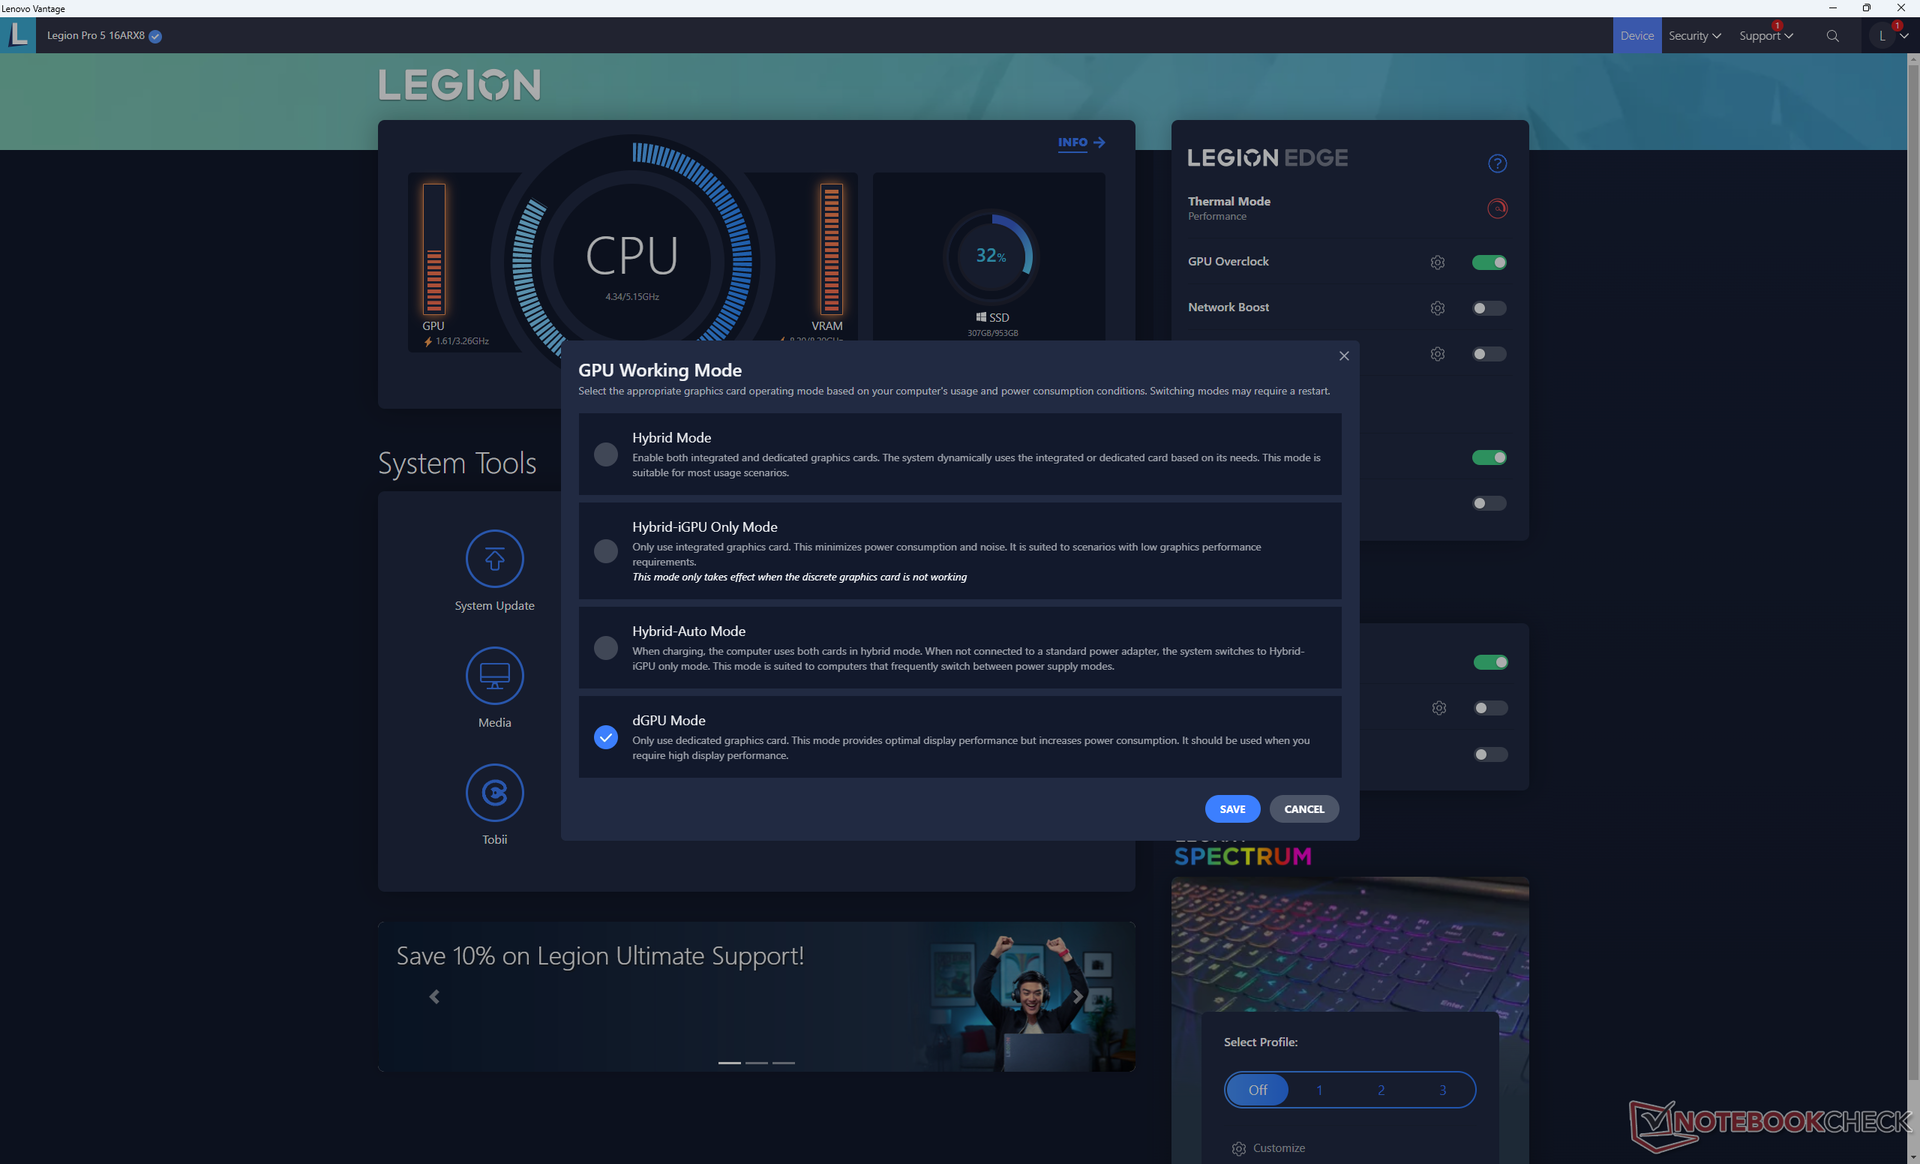
Nous avons réglé notre appareil en mode Performance via Windows et le logiciel Lenovo Vantage avant d'effectuer les tests ci-dessous. Nous avons également veillé à régler la carte graphique en mode dGPU et à activer la fonction d'overclockage du GPU. Il est recommandé de se familiariser avec Vantage, car il s'agit de l'interface principale pour contrôler les fonctions d'éclairage du clavier, les mises à jour spécifiques à Lenovo, le comportement du GPU, etc.
MUX est pris en charge pour basculer entre Optimus (iGPU + dGPU) ou dGPU uniquement. G-Sync est pris en charge sur l'écran interne uniquement en mode dGPU. Un redémarrage est nécessaire pour passer du mode Optimus au mode dGPU, car le mode Optimus avancé n'est pas pris en charge. Il est regrettable que le processus de redémarrage lors du passage d'un mode graphique à l'autre soit beaucoup plus long qu'un redémarrage normal.
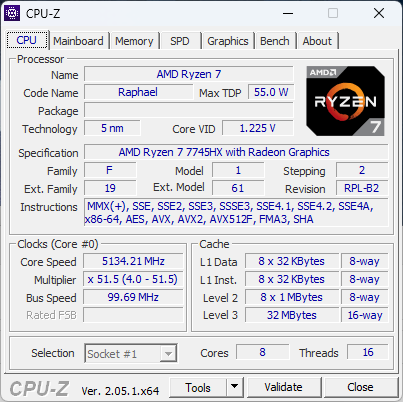
Processeur
Après avoir expérimenté l'incroyable Zen 4Ryzen 9 7945HX et avoir été déçus par la décevante Zen 3Ryzen 7 7735HSnous ne savions pas trop à quoi nous attendre avec le Zen 4Ryzen 7 7745HX. Heureusement, les résultats sont excellents pour un processeur de milieu de gamme, avec des performances mono et multithread respectivement supérieures de 15 % et 30 % à celles du Ryzen 7 7735HS. La Ryzen 7 7745HX est donc à la portée des processeurs concurrents Core i7-13700HX de seulement 5 à 15 % dans la plupart des benchmarks, y compris LibreOffice et HWBOT x265 4K. Il s'agit d'une mise à niveau raisonnable par rapport auRyzen 7 6800H ou Ryzen 9 6900HX par rapport au Ryzen 7 7735HX.
Lenovo propose une option Ryzen 5 7645HX plus lente avec moins de cœurs que le Ryzen 7 7745HX (6 contre 8). Cependant, nous n'avons pas encore testé personnellement le Ryzen 5 7645HX à l'heure où nous écrivons ces lignes et les différences de performances entre les deux options sont donc inconnues pour l'instant.
Cinebench R15 Multi Loop
Cinebench R23: Multi Core | Single Core
Cinebench R20: CPU (Multi Core) | CPU (Single Core)
Cinebench R15: CPU Multi 64Bit | CPU Single 64Bit
Blender: v2.79 BMW27 CPU
7-Zip 18.03: 7z b 4 | 7z b 4 -mmt1
Geekbench 5.5: Multi-Core | Single-Core
HWBOT x265 Benchmark v2.2: 4k Preset
LibreOffice : 20 Documents To PDF
R Benchmark 2.5: Overall mean
| CPU Performance rating | |
| Schenker XMG SECTOR, i9 13900K, RTX 4090 | |
| Alienware m18 R1 | |
| Schenker XMG Neo 16 E23 | |
| Moyenne AMD Ryzen 7 7745HX | |
| Lenovo Legion Pro 5 16ARX8 | |
| MSI GE67 HX 12UGS | |
| Lenovo Legion Pro 5 16IRX8 | |
| MSI Pulse GL76 12UGK | |
| Asus TUF Gaming A16 FA617 | |
| Schenker XMG Core 15 (M22) | |
| Asus ROG Strix G15 G513RW | |
| MSI Alpha 15 B5EEK-008 | |
| Cinebench R23 / Multi Core | |
| Schenker XMG SECTOR, i9 13900K, RTX 4090 | |
| Alienware m18 R1 | |
| Schenker XMG Neo 16 E23 | |
| MSI GE67 HX 12UGS | |
| Lenovo Legion Pro 5 16IRX8 | |
| Moyenne AMD Ryzen 7 7745HX (18060 - 18845, n=2) | |
| Lenovo Legion Pro 5 16ARX8 | |
| MSI Pulse GL76 12UGK | |
| Schenker XMG Core 15 (M22) | |
| Asus TUF Gaming A16 FA617 | |
| Asus ROG Strix G15 G513RW | |
| MSI Alpha 15 B5EEK-008 | |
| Cinebench R23 / Single Core | |
| Schenker XMG SECTOR, i9 13900K, RTX 4090 | |
| Alienware m18 R1 | |
| Schenker XMG Neo 16 E23 | |
| Moyenne AMD Ryzen 7 7745HX (1846 - 1854, n=2) | |
| Lenovo Legion Pro 5 16ARX8 | |
| MSI GE67 HX 12UGS | |
| MSI Pulse GL76 12UGK | |
| Lenovo Legion Pro 5 16IRX8 | |
| Asus TUF Gaming A16 FA617 | |
| Schenker XMG Core 15 (M22) | |
| Asus ROG Strix G15 G513RW | |
| MSI Alpha 15 B5EEK-008 | |
| Cinebench R20 / CPU (Multi Core) | |
| Schenker XMG SECTOR, i9 13900K, RTX 4090 | |
| Alienware m18 R1 | |
| Schenker XMG Neo 16 E23 | |
| MSI GE67 HX 12UGS | |
| Moyenne AMD Ryzen 7 7745HX (7072 - 7399, n=2) | |
| Lenovo Legion Pro 5 16ARX8 | |
| Lenovo Legion Pro 5 16IRX8 | |
| MSI Pulse GL76 12UGK | |
| Schenker XMG Core 15 (M22) | |
| Asus TUF Gaming A16 FA617 | |
| Asus ROG Strix G15 G513RW | |
| MSI Alpha 15 B5EEK-008 | |
| Cinebench R20 / CPU (Single Core) | |
| Schenker XMG SECTOR, i9 13900K, RTX 4090 | |
| Alienware m18 R1 | |
| Schenker XMG Neo 16 E23 | |
| Moyenne AMD Ryzen 7 7745HX (717 - 719, n=2) | |
| Lenovo Legion Pro 5 16ARX8 | |
| MSI GE67 HX 12UGS | |
| MSI Pulse GL76 12UGK | |
| Lenovo Legion Pro 5 16IRX8 | |
| Asus TUF Gaming A16 FA617 | |
| Schenker XMG Core 15 (M22) | |
| Asus ROG Strix G15 G513RW | |
| MSI Alpha 15 B5EEK-008 | |
| Cinebench R15 / CPU Multi 64Bit | |
| Schenker XMG SECTOR, i9 13900K, RTX 4090 | |
| Alienware m18 R1 | |
| Schenker XMG Neo 16 E23 | |
| MSI GE67 HX 12UGS | |
| Lenovo Legion Pro 5 16IRX8 | |
| Moyenne AMD Ryzen 7 7745HX (2978 - 2994, n=2) | |
| Lenovo Legion Pro 5 16ARX8 | |
| MSI Pulse GL76 12UGK | |
| Schenker XMG Core 15 (M22) | |
| Asus TUF Gaming A16 FA617 | |
| Asus ROG Strix G15 G513RW | |
| MSI Alpha 15 B5EEK-008 | |
| Cinebench R15 / CPU Single 64Bit | |
| Schenker XMG SECTOR, i9 13900K, RTX 4090 | |
| Alienware m18 R1 | |
| Schenker XMG Neo 16 E23 | |
| Moyenne AMD Ryzen 7 7745HX (294 - 295, n=2) | |
| Lenovo Legion Pro 5 16ARX8 | |
| Lenovo Legion Pro 5 16IRX8 | |
| MSI GE67 HX 12UGS | |
| MSI Pulse GL76 12UGK | |
| Schenker XMG Core 15 (M22) | |
| Asus TUF Gaming A16 FA617 | |
| Asus ROG Strix G15 G513RW | |
| MSI Alpha 15 B5EEK-008 | |
| Blender / v2.79 BMW27 CPU | |
| MSI Alpha 15 B5EEK-008 | |
| Asus ROG Strix G15 G513RW | |
| Asus TUF Gaming A16 FA617 | |
| Schenker XMG Core 15 (M22) | |
| MSI Pulse GL76 12UGK | |
| Lenovo Legion Pro 5 16ARX8 | |
| Moyenne AMD Ryzen 7 7745HX (169 - 174, n=2) | |
| MSI GE67 HX 12UGS | |
| Lenovo Legion Pro 5 16IRX8 | |
| Schenker XMG Neo 16 E23 | |
| Alienware m18 R1 | |
| Schenker XMG SECTOR, i9 13900K, RTX 4090 | |
| 7-Zip 18.03 / 7z b 4 | |
| Schenker XMG SECTOR, i9 13900K, RTX 4090 | |
| Alienware m18 R1 | |
| Schenker XMG Neo 16 E23 | |
| Moyenne AMD Ryzen 7 7745HX (75557 - 83268, n=2) | |
| Lenovo Legion Pro 5 16IRX8 | |
| MSI GE67 HX 12UGS | |
| Lenovo Legion Pro 5 16ARX8 | |
| MSI Pulse GL76 12UGK | |
| Schenker XMG Core 15 (M22) | |
| Asus TUF Gaming A16 FA617 | |
| Asus ROG Strix G15 G513RW | |
| MSI Alpha 15 B5EEK-008 | |
| 7-Zip 18.03 / 7z b 4 -mmt1 | |
| Moyenne AMD Ryzen 7 7745HX (7244 - 7275, n=2) | |
| Lenovo Legion Pro 5 16ARX8 | |
| Schenker XMG SECTOR, i9 13900K, RTX 4090 | |
| Schenker XMG Neo 16 E23 | |
| Alienware m18 R1 | |
| Asus ROG Strix G15 G513RW | |
| Schenker XMG Core 15 (M22) | |
| Asus TUF Gaming A16 FA617 | |
| Lenovo Legion Pro 5 16IRX8 | |
| MSI Pulse GL76 12UGK | |
| MSI GE67 HX 12UGS | |
| MSI Alpha 15 B5EEK-008 | |
| Geekbench 5.5 / Multi-Core | |
| Schenker XMG SECTOR, i9 13900K, RTX 4090 | |
| Alienware m18 R1 | |
| Schenker XMG Neo 16 E23 | |
| MSI GE67 HX 12UGS | |
| Lenovo Legion Pro 5 16IRX8 | |
| Moyenne AMD Ryzen 7 7745HX (12378 - 13462, n=2) | |
| Lenovo Legion Pro 5 16ARX8 | |
| MSI Pulse GL76 12UGK | |
| Schenker XMG Core 15 (M22) | |
| Asus TUF Gaming A16 FA617 | |
| Asus ROG Strix G15 G513RW | |
| MSI Alpha 15 B5EEK-008 | |
| Geekbench 5.5 / Single-Core | |
| Schenker XMG SECTOR, i9 13900K, RTX 4090 | |
| Alienware m18 R1 | |
| Moyenne AMD Ryzen 7 7745HX (2040 - 2067, n=2) | |
| Schenker XMG Neo 16 E23 | |
| Lenovo Legion Pro 5 16ARX8 | |
| Lenovo Legion Pro 5 16IRX8 | |
| MSI GE67 HX 12UGS | |
| MSI Pulse GL76 12UGK | |
| Asus ROG Strix G15 G513RW | |
| Asus TUF Gaming A16 FA617 | |
| Schenker XMG Core 15 (M22) | |
| MSI Alpha 15 B5EEK-008 | |
| HWBOT x265 Benchmark v2.2 / 4k Preset | |
| Schenker XMG SECTOR, i9 13900K, RTX 4090 | |
| Alienware m18 R1 | |
| Schenker XMG Neo 16 E23 | |
| MSI GE67 HX 12UGS | |
| Lenovo Legion Pro 5 16IRX8 | |
| Moyenne AMD Ryzen 7 7745HX (23.2 - 24.1, n=2) | |
| Lenovo Legion Pro 5 16ARX8 | |
| MSI Pulse GL76 12UGK | |
| Schenker XMG Core 15 (M22) | |
| Asus TUF Gaming A16 FA617 | |
| Asus ROG Strix G15 G513RW | |
| MSI Alpha 15 B5EEK-008 | |
| LibreOffice / 20 Documents To PDF | |
| Schenker XMG Core 15 (M22) | |
| Asus ROG Strix G15 G513RW | |
| Asus TUF Gaming A16 FA617 | |
| MSI Alpha 15 B5EEK-008 | |
| Alienware m18 R1 | |
| MSI Pulse GL76 12UGK | |
| MSI GE67 HX 12UGS | |
| Moyenne AMD Ryzen 7 7745HX (37.9 - 41.4, n=2) | |
| Lenovo Legion Pro 5 16ARX8 | |
| Schenker XMG Neo 16 E23 | |
| Schenker XMG SECTOR, i9 13900K, RTX 4090 | |
| Lenovo Legion Pro 5 16IRX8 | |
| R Benchmark 2.5 / Overall mean | |
| MSI Alpha 15 B5EEK-008 | |
| Asus TUF Gaming A16 FA617 | |
| Asus ROG Strix G15 G513RW | |
| Schenker XMG Core 15 (M22) | |
| Lenovo Legion Pro 5 16IRX8 | |
| MSI Pulse GL76 12UGK | |
| MSI GE67 HX 12UGS | |
| Lenovo Legion Pro 5 16ARX8 | |
| Moyenne AMD Ryzen 7 7745HX (0.4141 - 0.421, n=2) | |
| Alienware m18 R1 | |
| Schenker XMG Neo 16 E23 | |
| Schenker XMG SECTOR, i9 13900K, RTX 4090 | |
* ... Moindre est la valeur, meilleures sont les performances
AIDA64: FP32 Ray-Trace | FPU Julia | CPU SHA3 | CPU Queen | FPU SinJulia | FPU Mandel | CPU AES | CPU ZLib | FP64 Ray-Trace | CPU PhotoWorxx
| Performance rating | |
| Asus ROG Strix G16 G614JZ | |
| Schenker XMG Neo 16 E23 | |
| Moyenne AMD Ryzen 7 7745HX | |
| Lenovo Legion Pro 5 16ARX8 | |
| Uniwill GM6PX7X RTX 4070 | |
| Lenovo Legion Pro 5 16IRX8 | |
| AIDA64 / FP32 Ray-Trace | |
| Lenovo Legion Pro 5 16ARX8 | |
| Moyenne AMD Ryzen 7 7745HX (29066 - 29656, n=2) | |
| Asus ROG Strix G16 G614JZ | |
| Schenker XMG Neo 16 E23 | |
| Uniwill GM6PX7X RTX 4070 | |
| Lenovo Legion Pro 5 16IRX8 | |
| AIDA64 / FPU Julia | |
| Asus ROG Strix G16 G614JZ | |
| Moyenne AMD Ryzen 7 7745HX (120974 - 123689, n=2) | |
| Lenovo Legion Pro 5 16ARX8 | |
| Schenker XMG Neo 16 E23 | |
| Uniwill GM6PX7X RTX 4070 | |
| Lenovo Legion Pro 5 16IRX8 | |
| AIDA64 / CPU SHA3 | |
| Asus ROG Strix G16 G614JZ | |
| Schenker XMG Neo 16 E23 | |
| Moyenne AMD Ryzen 7 7745HX (4974 - 5204, n=2) | |
| Lenovo Legion Pro 5 16ARX8 | |
| Uniwill GM6PX7X RTX 4070 | |
| Lenovo Legion Pro 5 16IRX8 | |
| AIDA64 / CPU Queen | |
| Asus ROG Strix G16 G614JZ | |
| Schenker XMG Neo 16 E23 | |
| Moyenne AMD Ryzen 7 7745HX (126954 - 128143, n=2) | |
| Lenovo Legion Pro 5 16ARX8 | |
| Lenovo Legion Pro 5 16IRX8 | |
| Uniwill GM6PX7X RTX 4070 | |
| AIDA64 / FPU SinJulia | |
| Asus ROG Strix G16 G614JZ | |
| Moyenne AMD Ryzen 7 7745HX (15887 - 16221, n=2) | |
| Lenovo Legion Pro 5 16ARX8 | |
| Schenker XMG Neo 16 E23 | |
| Lenovo Legion Pro 5 16IRX8 | |
| Uniwill GM6PX7X RTX 4070 | |
| AIDA64 / FPU Mandel | |
| Asus ROG Strix G16 G614JZ | |
| Moyenne AMD Ryzen 7 7745HX (64255 - 64969, n=2) | |
| Lenovo Legion Pro 5 16ARX8 | |
| Schenker XMG Neo 16 E23 | |
| Uniwill GM6PX7X RTX 4070 | |
| Lenovo Legion Pro 5 16IRX8 | |
| AIDA64 / CPU AES | |
| Schenker XMG Neo 16 E23 | |
| Uniwill GM6PX7X RTX 4070 | |
| Asus ROG Strix G16 G614JZ | |
| Lenovo Legion Pro 5 16IRX8 | |
| Moyenne AMD Ryzen 7 7745HX (71191 - 95481, n=2) | |
| Lenovo Legion Pro 5 16ARX8 | |
| AIDA64 / CPU ZLib | |
| Asus ROG Strix G16 G614JZ | |
| Schenker XMG Neo 16 E23 | |
| Uniwill GM6PX7X RTX 4070 | |
| Lenovo Legion Pro 5 16IRX8 | |
| Moyenne AMD Ryzen 7 7745HX (1147 - 1176, n=2) | |
| Lenovo Legion Pro 5 16ARX8 | |
| AIDA64 / FP64 Ray-Trace | |
| Moyenne AMD Ryzen 7 7745HX (15975 - 16358, n=2) | |
| Lenovo Legion Pro 5 16ARX8 | |
| Asus ROG Strix G16 G614JZ | |
| Schenker XMG Neo 16 E23 | |
| Lenovo Legion Pro 5 16IRX8 | |
| Uniwill GM6PX7X RTX 4070 | |
| AIDA64 / CPU PhotoWorxx | |
| Schenker XMG Neo 16 E23 | |
| Uniwill GM6PX7X RTX 4070 | |
| Asus ROG Strix G16 G614JZ | |
| Lenovo Legion Pro 5 16IRX8 | |
| Moyenne AMD Ryzen 7 7745HX (28499 - 33304, n=2) | |
| Lenovo Legion Pro 5 16ARX8 | |
Performance du système
CrossMark: Overall | Productivity | Creativity | Responsiveness
| PCMark 10 / Score | |
| Asus Zephyrus Duo 16 GX650PY-NM006W | |
| Uniwill GM6PX7X RTX 4070 | |
| Schenker XMG Neo 16 E23 | |
| Lenovo Legion Pro 5 16ARX8 | |
| Lenovo Legion Pro 5 16IRX8 | |
| Asus ROG Strix G16 G614JZ | |
| PCMark 10 / Essentials | |
| Asus Zephyrus Duo 16 GX650PY-NM006W | |
| Asus ROG Strix G16 G614JZ | |
| Uniwill GM6PX7X RTX 4070 | |
| Lenovo Legion Pro 5 16ARX8 | |
| Schenker XMG Neo 16 E23 | |
| Lenovo Legion Pro 5 16IRX8 | |
| PCMark 10 / Productivity | |
| Asus Zephyrus Duo 16 GX650PY-NM006W | |
| Uniwill GM6PX7X RTX 4070 | |
| Lenovo Legion Pro 5 16ARX8 | |
| Schenker XMG Neo 16 E23 | |
| Lenovo Legion Pro 5 16IRX8 | |
| Asus ROG Strix G16 G614JZ | |
| PCMark 10 / Digital Content Creation | |
| Schenker XMG Neo 16 E23 | |
| Asus Zephyrus Duo 16 GX650PY-NM006W | |
| Uniwill GM6PX7X RTX 4070 | |
| Lenovo Legion Pro 5 16ARX8 | |
| Lenovo Legion Pro 5 16IRX8 | |
| Asus ROG Strix G16 G614JZ | |
| CrossMark / Overall | |
| Asus ROG Strix G16 G614JZ | |
| Schenker XMG Neo 16 E23 | |
| Asus Zephyrus Duo 16 GX650PY-NM006W | |
| Lenovo Legion Pro 5 16ARX8 | |
| Uniwill GM6PX7X RTX 4070 | |
| Lenovo Legion Pro 5 16IRX8 | |
| CrossMark / Productivity | |
| Asus ROG Strix G16 G614JZ | |
| Schenker XMG Neo 16 E23 | |
| Asus Zephyrus Duo 16 GX650PY-NM006W | |
| Lenovo Legion Pro 5 16ARX8 | |
| Uniwill GM6PX7X RTX 4070 | |
| Lenovo Legion Pro 5 16IRX8 | |
| CrossMark / Creativity | |
| Schenker XMG Neo 16 E23 | |
| Asus ROG Strix G16 G614JZ | |
| Asus Zephyrus Duo 16 GX650PY-NM006W | |
| Lenovo Legion Pro 5 16ARX8 | |
| Uniwill GM6PX7X RTX 4070 | |
| Lenovo Legion Pro 5 16IRX8 | |
| CrossMark / Responsiveness | |
| Asus ROG Strix G16 G614JZ | |
| Lenovo Legion Pro 5 16ARX8 | |
| Uniwill GM6PX7X RTX 4070 | |
| Schenker XMG Neo 16 E23 | |
| Asus Zephyrus Duo 16 GX650PY-NM006W | |
| Lenovo Legion Pro 5 16IRX8 | |
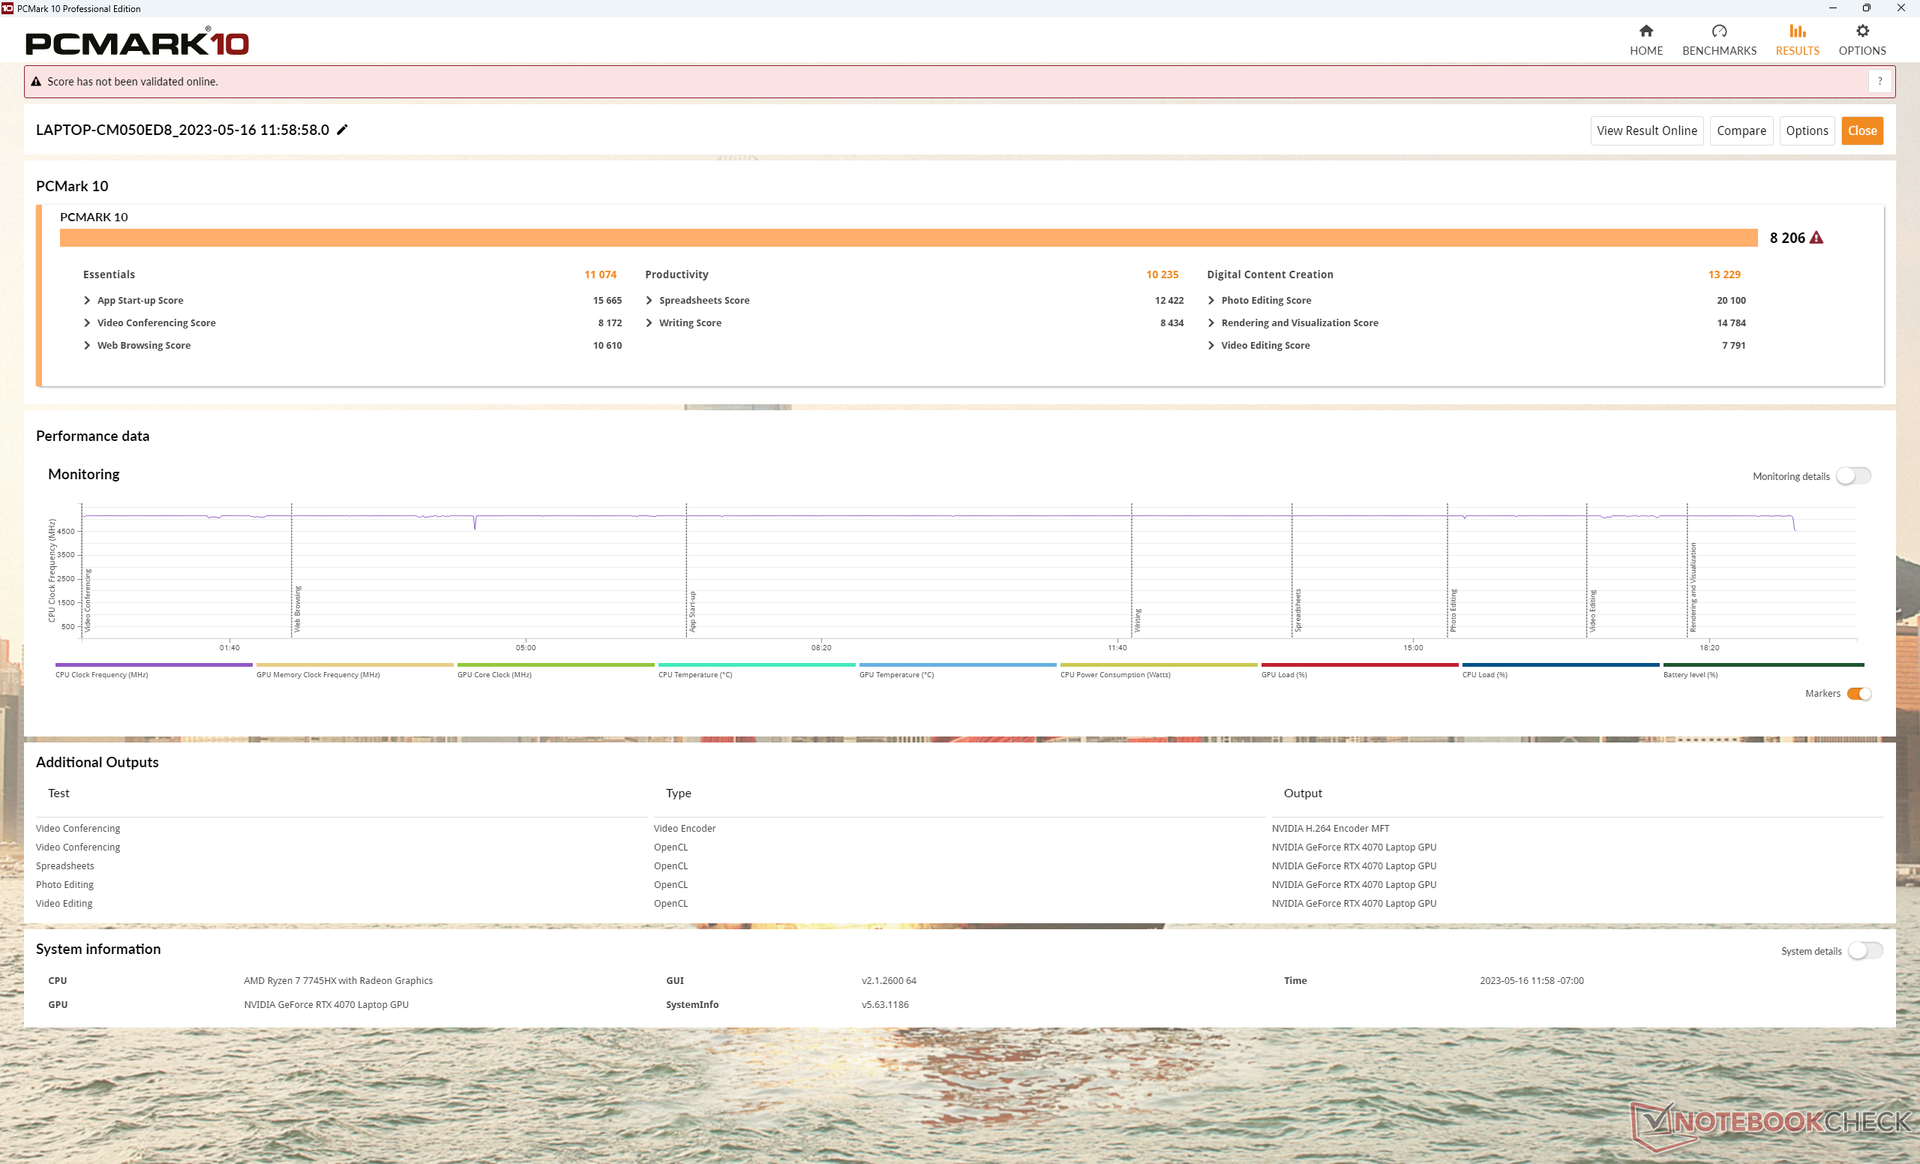
| PCMark 10 Score | 8206 points | |
Aide | ||
| AIDA64 / Memory Copy | |
| Schenker XMG Neo 16 E23 | |
| Uniwill GM6PX7X RTX 4070 | |
| Asus ROG Strix G16 G614JZ | |
| Lenovo Legion Pro 5 16IRX8 | |
| Moyenne AMD Ryzen 7 7745HX (50007 - 53867, n=2) | |
| Lenovo Legion Pro 5 16ARX8 | |
| AIDA64 / Memory Read | |
| Schenker XMG Neo 16 E23 | |
| Asus ROG Strix G16 G614JZ | |
| Uniwill GM6PX7X RTX 4070 | |
| Lenovo Legion Pro 5 16IRX8 | |
| Moyenne AMD Ryzen 7 7745HX (50703 - 54278, n=2) | |
| Lenovo Legion Pro 5 16ARX8 | |
| AIDA64 / Memory Write | |
| Schenker XMG Neo 16 E23 | |
| Lenovo Legion Pro 5 16IRX8 | |
| Uniwill GM6PX7X RTX 4070 | |
| Moyenne AMD Ryzen 7 7745HX (54587 - 70803, n=2) | |
| Asus ROG Strix G16 G614JZ | |
| Lenovo Legion Pro 5 16ARX8 | |
| AIDA64 / Memory Latency | |
| Asus ROG Strix G16 G614JZ | |
| Uniwill GM6PX7X RTX 4070 | |
| Lenovo Legion Pro 5 16ARX8 | |
| Schenker XMG Neo 16 E23 | |
| Moyenne AMD Ryzen 7 7745HX (80.7 - 86.5, n=2) | |
| Lenovo Legion Pro 5 16IRX8 | |
* ... Moindre est la valeur, meilleures sont les performances
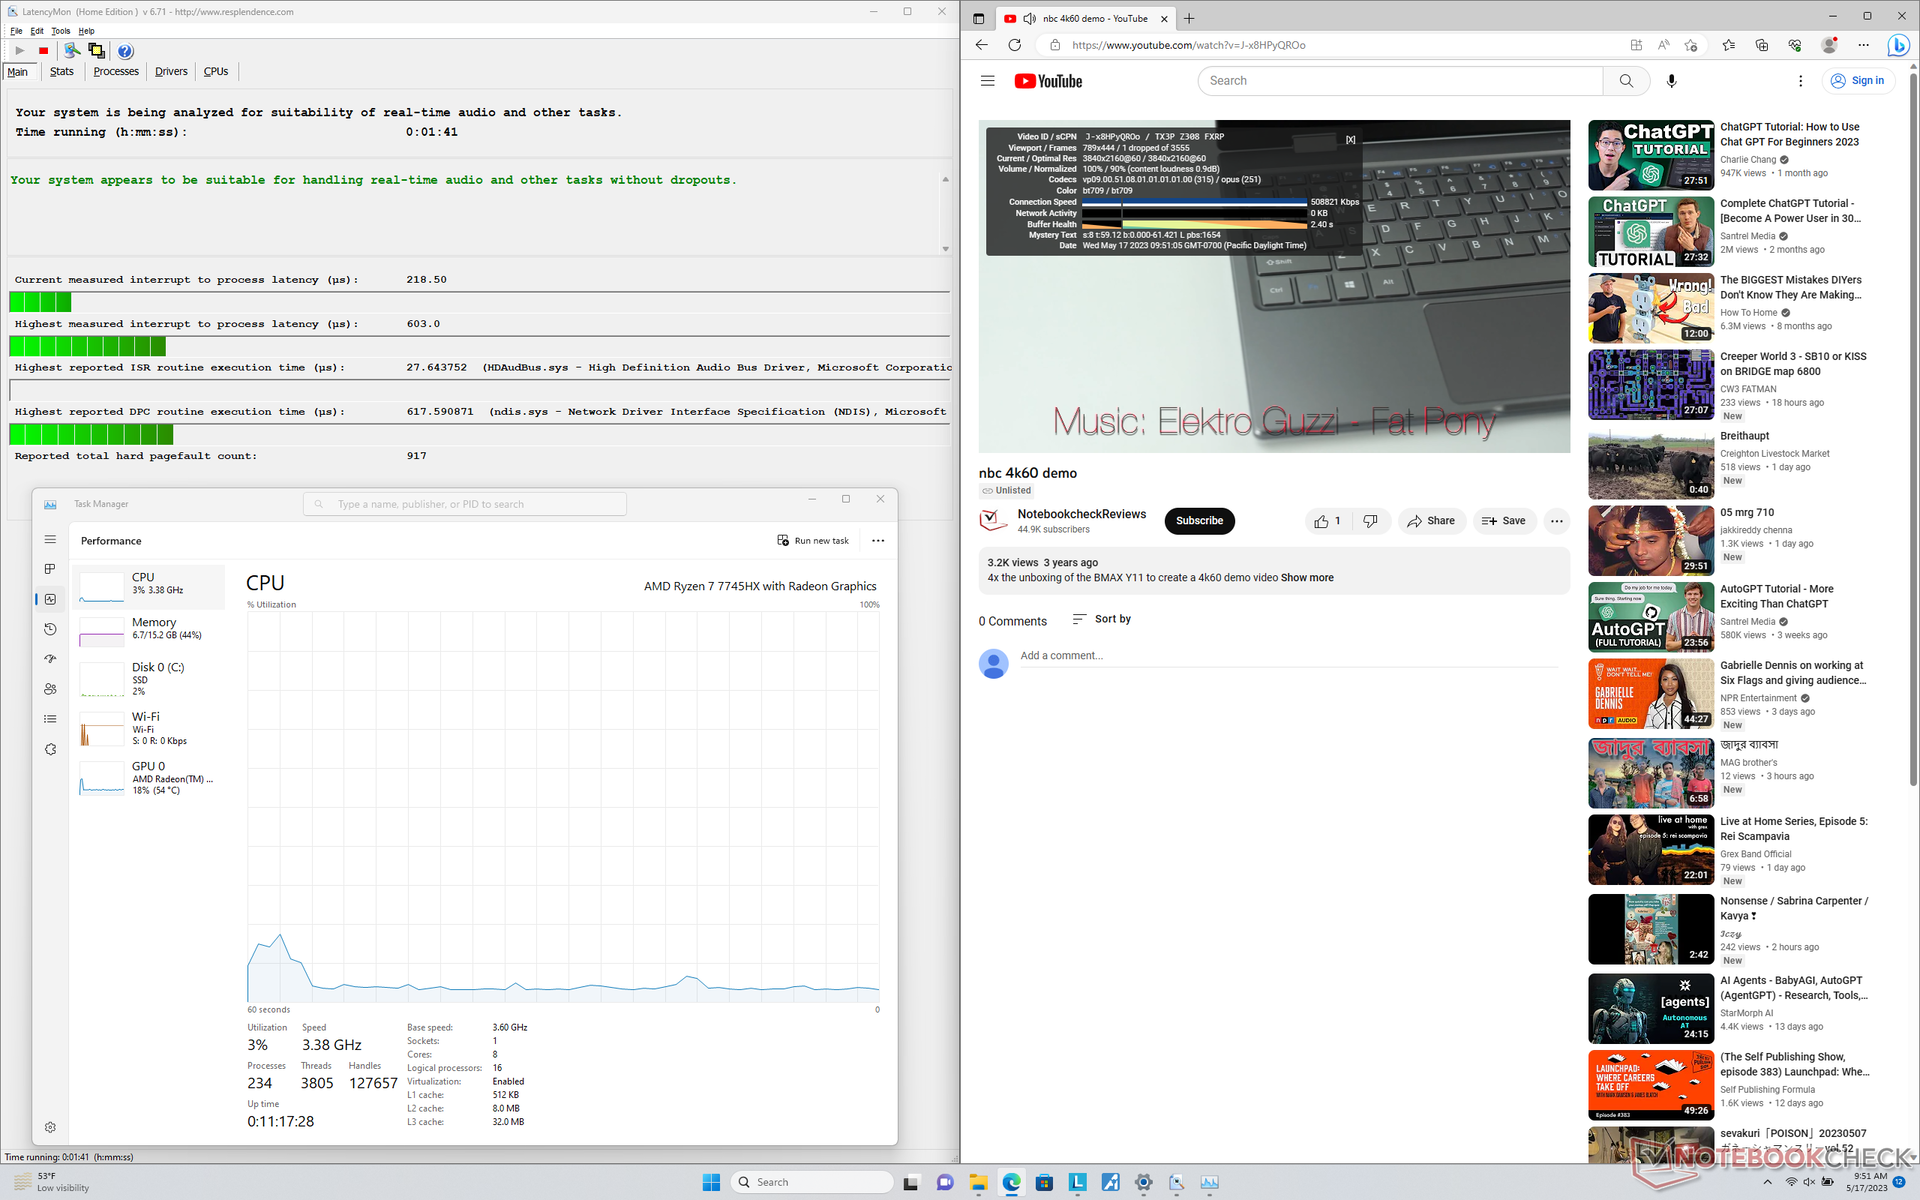
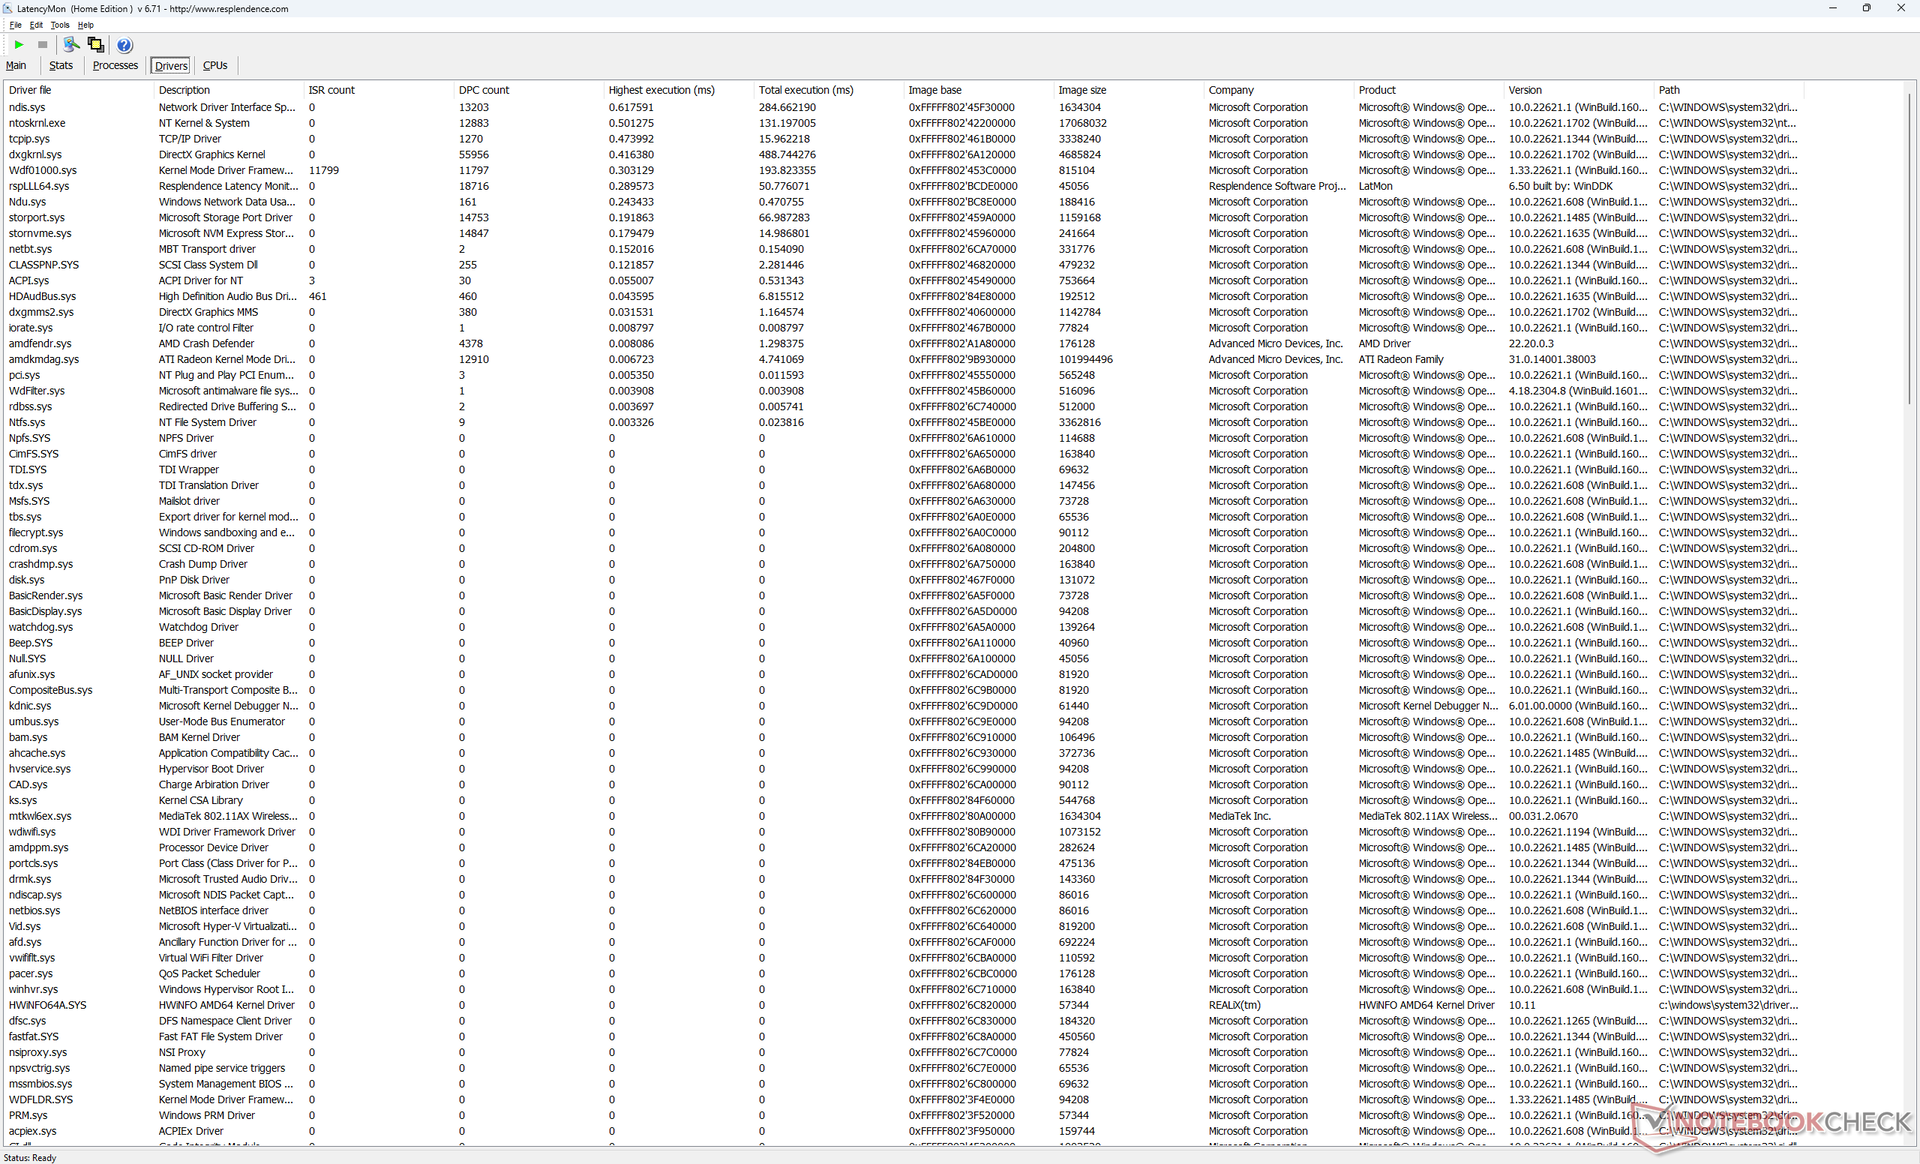
Latence DPC
LatencyMon ne révèle aucun problème majeur de DPC lors de l'ouverture de plusieurs onglets de notre page d'accueil ou lors de l'exécution du stress Prime95. la lecture de vidéos 4K à 60 FPS est excellente, avec une seule image perdue lors de notre test vidéo.
| DPC Latencies / LatencyMon - interrupt to process latency (max), Web, Youtube, Prime95 | |
| Asus Zephyrus Duo 16 GX650PY-NM006W | |
| Schenker XMG Neo 16 E23 | |
| Asus ROG Strix G16 G614JZ | |
| Uniwill GM6PX7X RTX 4070 | |
| Lenovo Legion Pro 5 16IRX8 | |
| Lenovo Legion Pro 5 16ARX8 | |
* ... Moindre est la valeur, meilleures sont les performances
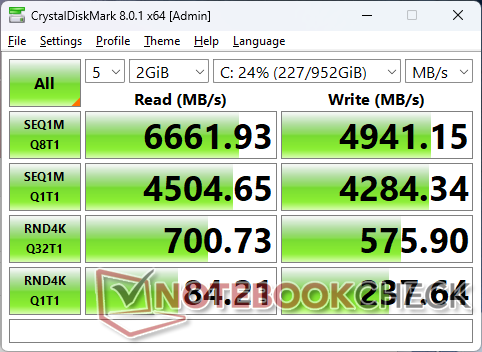
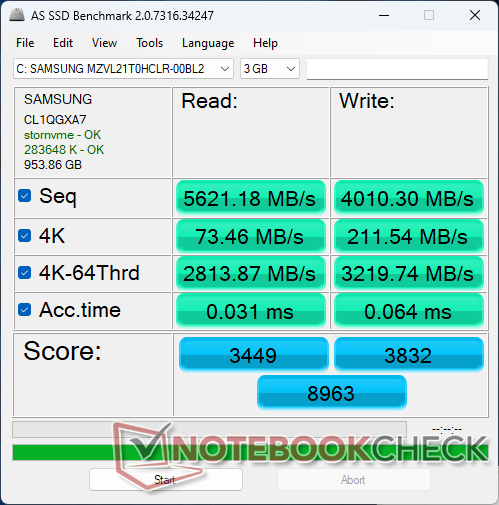
Périphériques de stockage - Jusqu'à deux lecteurs PCIe4 x4
Notre unité est livrée avec un disque dur de 1 TB Samsung PM9A1 NVMe de Samsung, qui est l'un des disques durs PCIe4 x4 les plus rapides du marché. Les taux de transfert atteignent environ 6600 Mo/s, mais les performances chutent à 3300 Mo/s après seulement quelques minutes de notre test de stress, comme le montre le graphique ci-dessous. Les résultats suggèrent que le SSD du Lenovo n'est pas correctement refroidi par rapport au même SSD dans d'autres ordinateurs portables comme le Uniwill GM6PX7X peut supporter des taux de transfert plus élevés pendant des périodes beaucoup plus longues.

| Drive Performance rating - Percent | |
| Lenovo Legion Pro 5 16ARX8 | |
| Lenovo Legion Pro 5 16IRX8 | |
| Uniwill GM6PX7X RTX 4070 | |
| Asus Zephyrus Duo 16 GX650PY-NM006W | |
| Asus ROG Strix G16 G614JZ | |
| Schenker XMG Neo 16 E23 | |
* ... Moindre est la valeur, meilleures sont les performances
Disk Throttling: DiskSpd Read Loop, Queue Depth 8
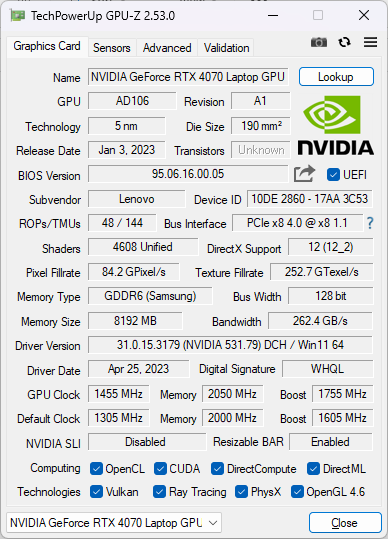
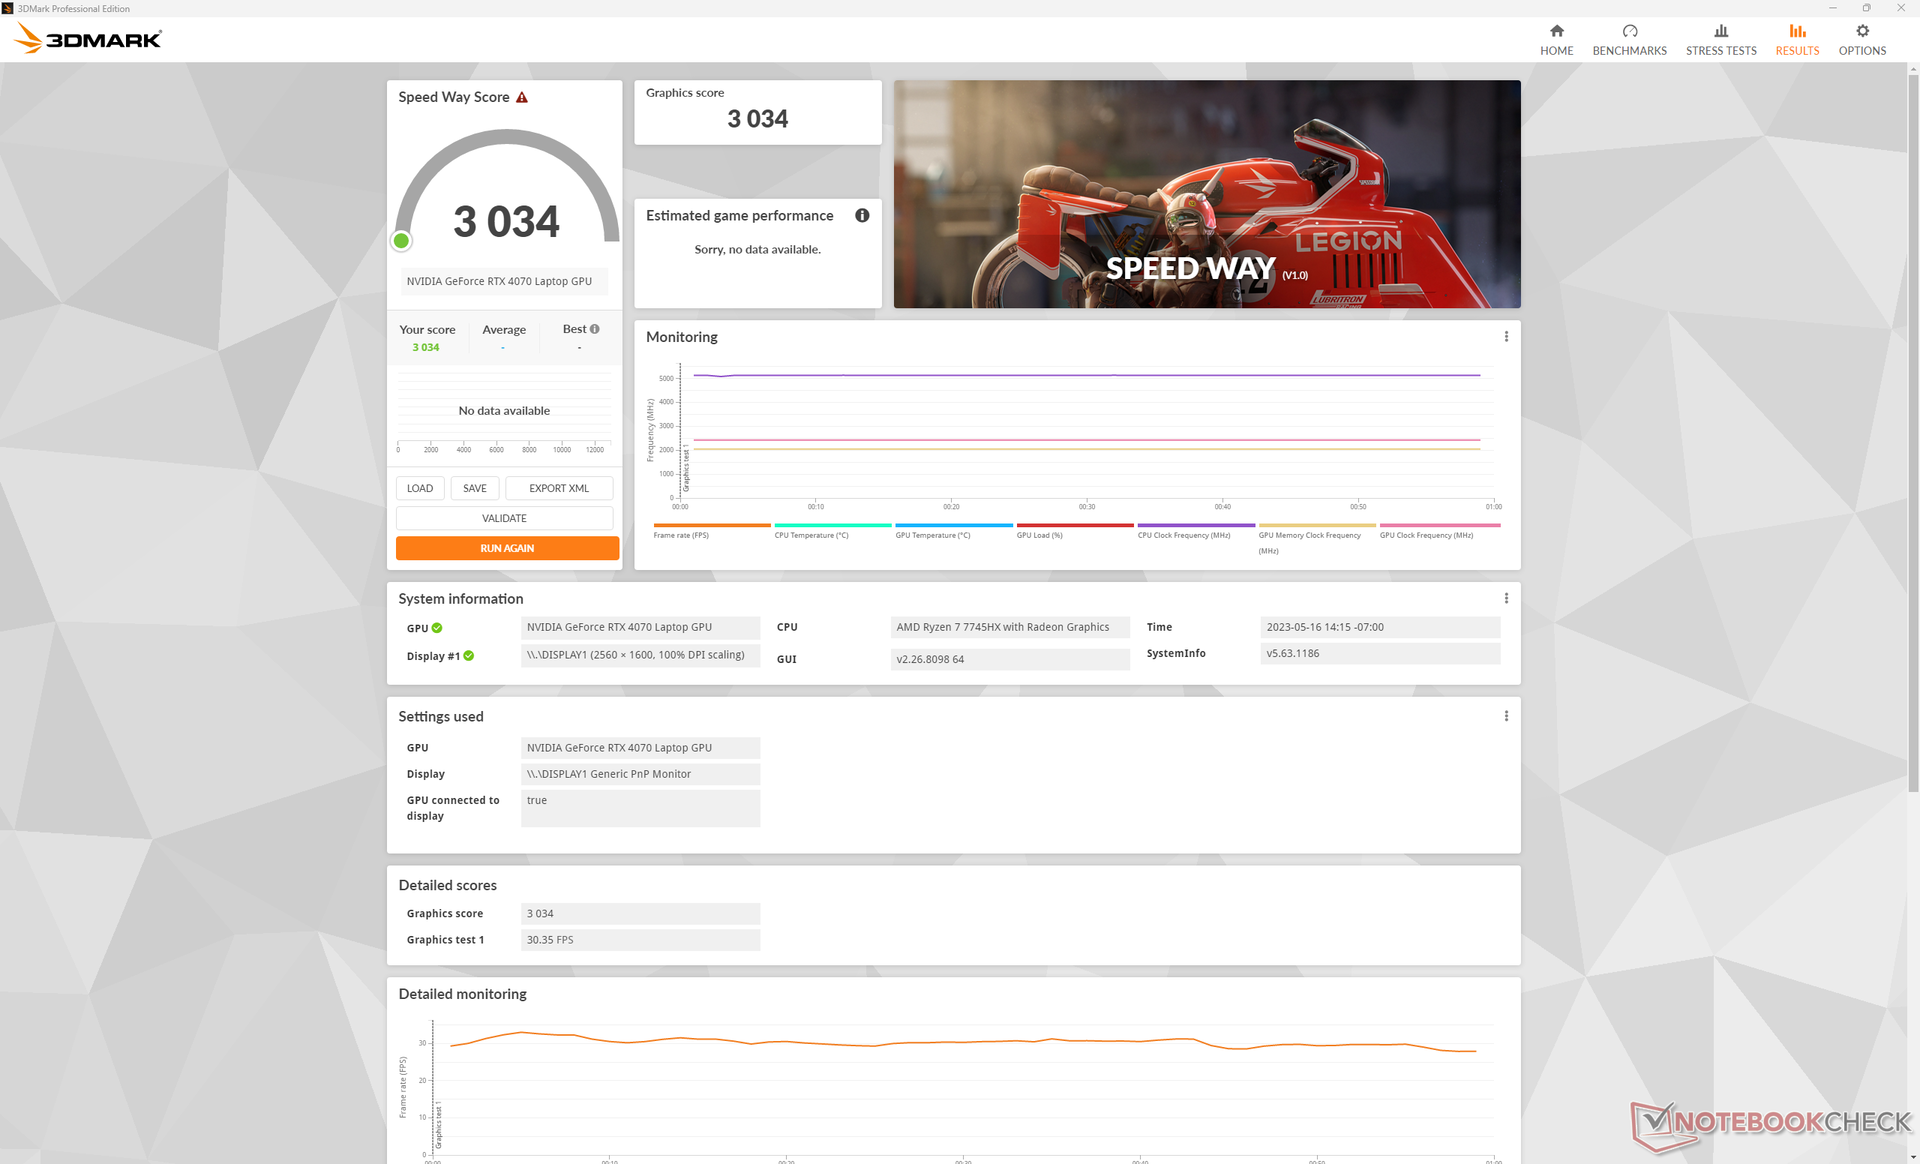
Performances du GPU - Une carte graphique de milieu de gamme supérieure
Les performances graphiques brutes sont comparables à celles de l'eForce RTX 3070 Ti de l'année dernière eForce RTX 3070 Ti. La cible TGP de 140 W permet à la RTX 4070 mobile du Lenovo d'être légèrement plus performante que la plupart des autres ordinateurs portables équipés du même GPU.
La rétrogradation vers la rTX 4060 ou rTX 4050 Devrait réduire les performances de 15 % et 20 %, respectivement. Il n'y a malheureusement pas de rTX 4080 mobile qui aurait augmenté les performances de 40 à 50 % par rapport à notre RTX 4070 mobile. De telles options de GPU haut de gamme sont réservées à la série haut de gamme Legion 7 de Lenovo.
L'exécution du dGPU sur le profil d'alimentation équilibré sans overclocking diminuerait les performances graphiques d'environ 13 % selon 3DMark Time Spy.
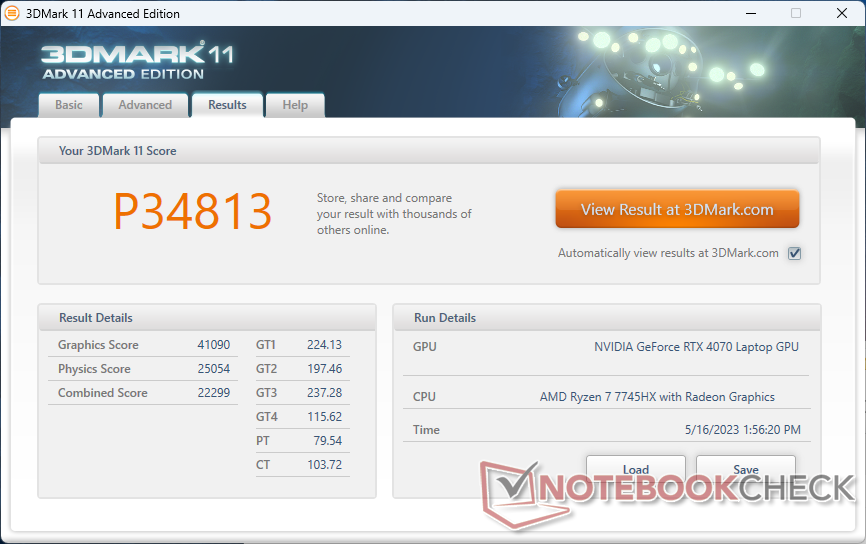
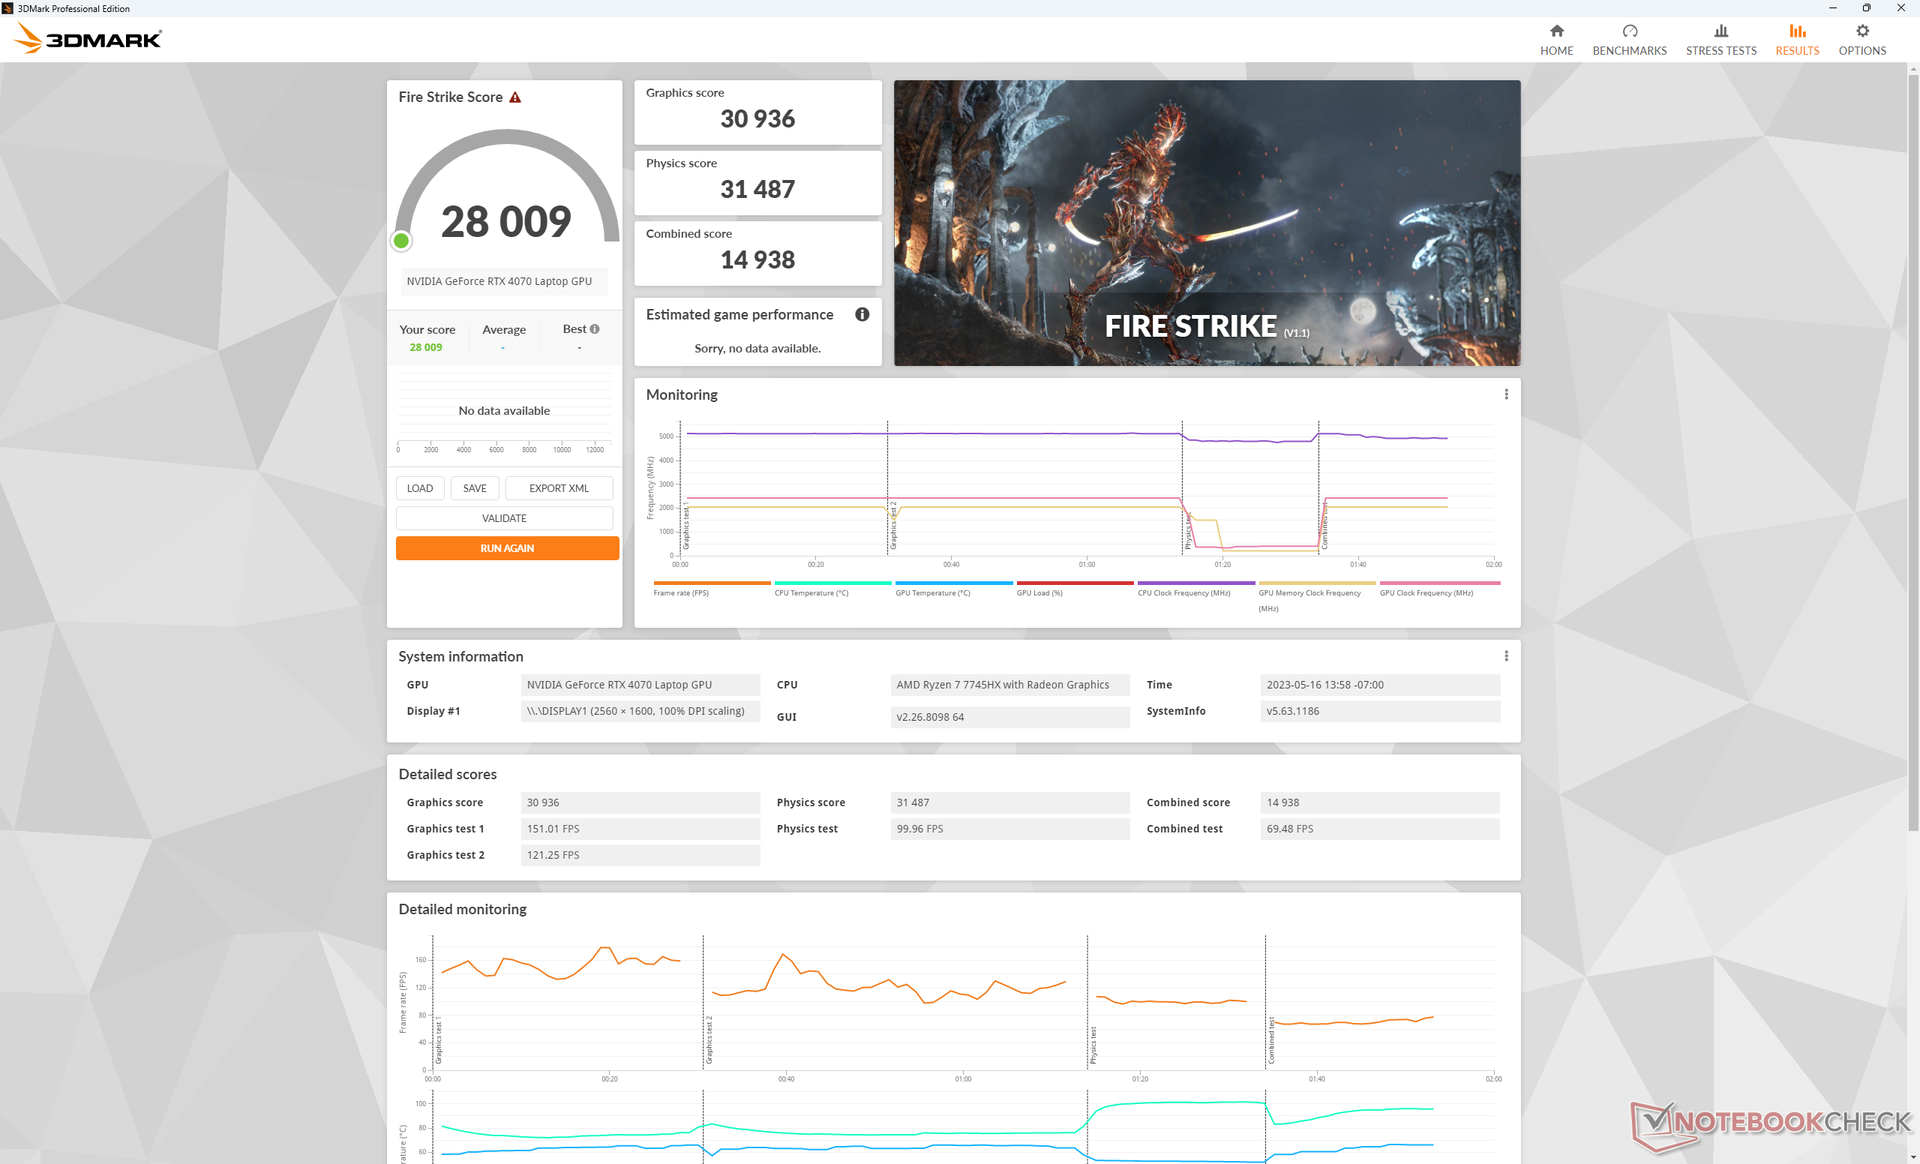
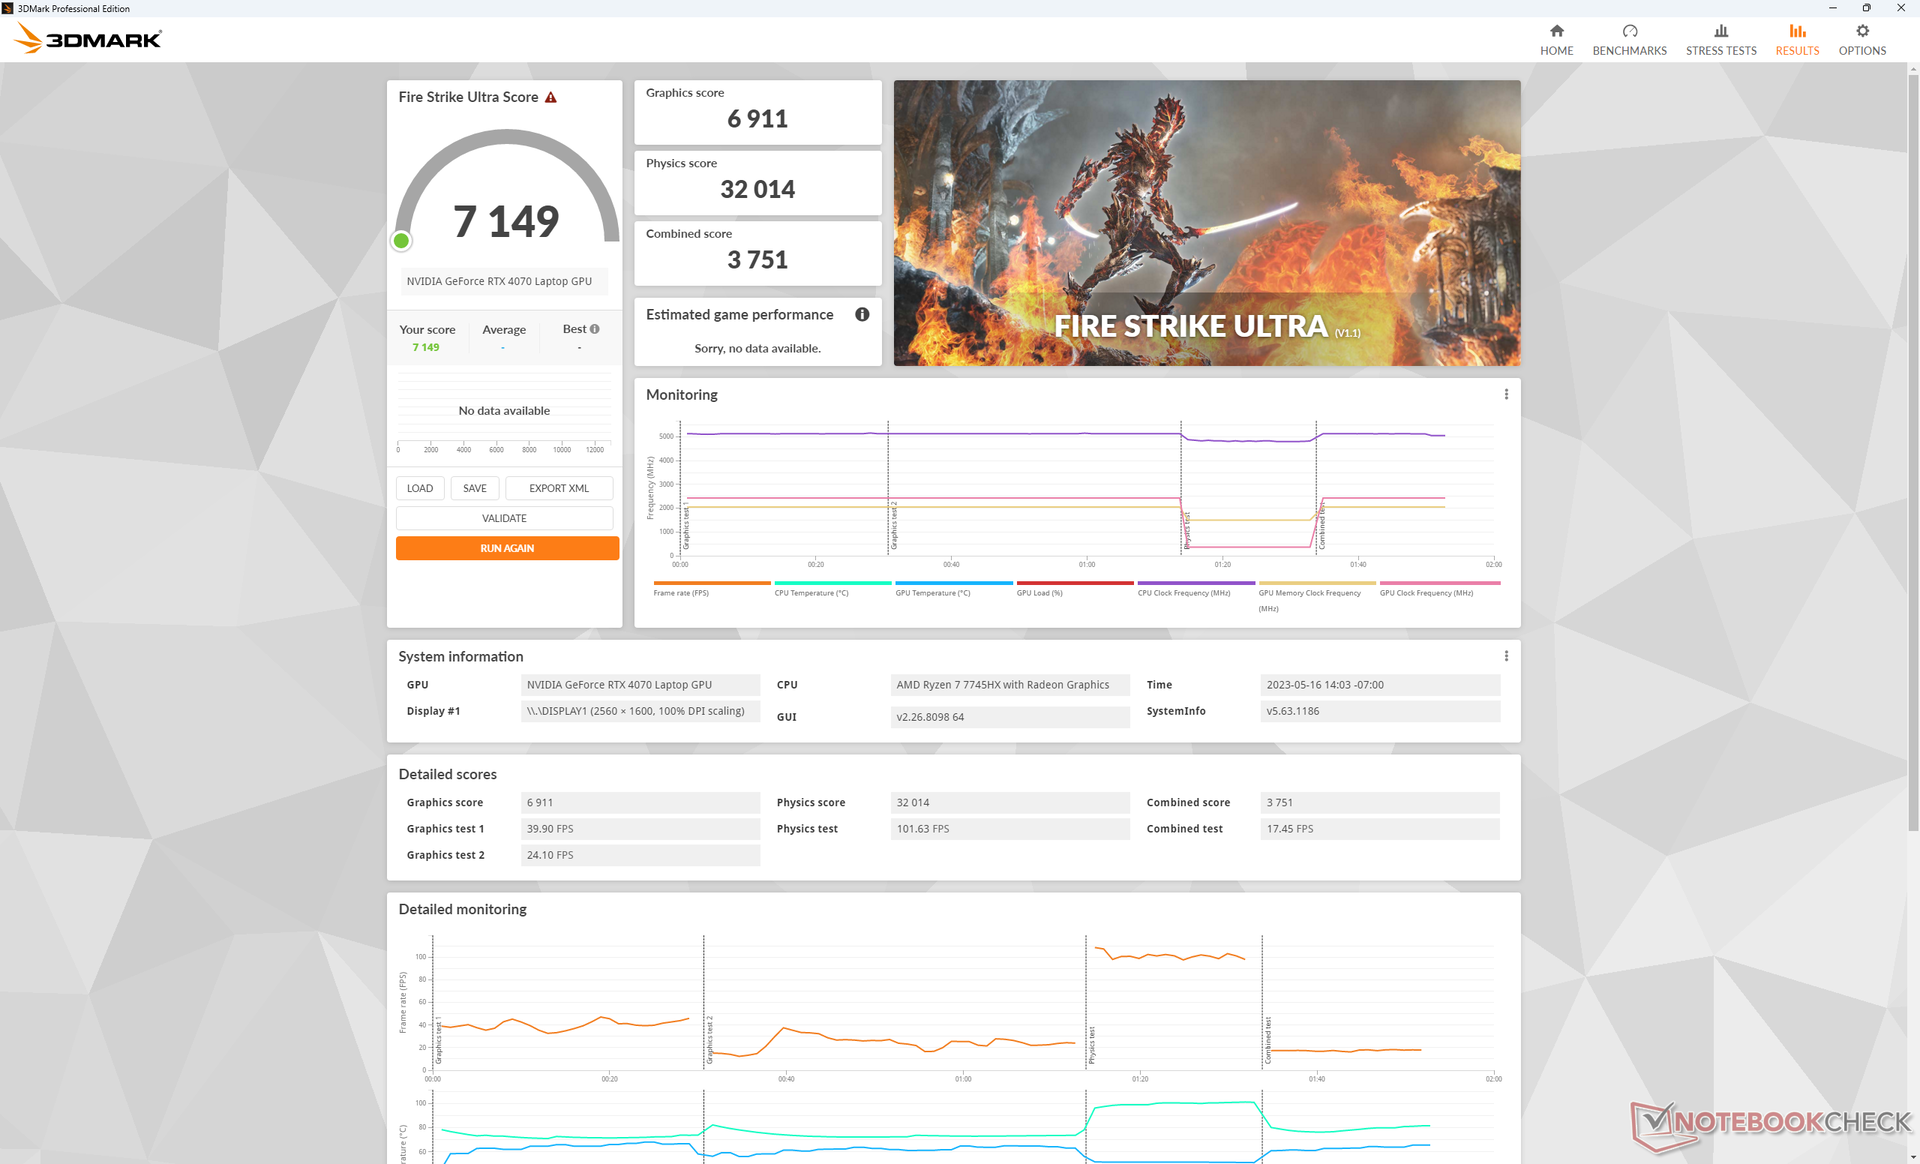
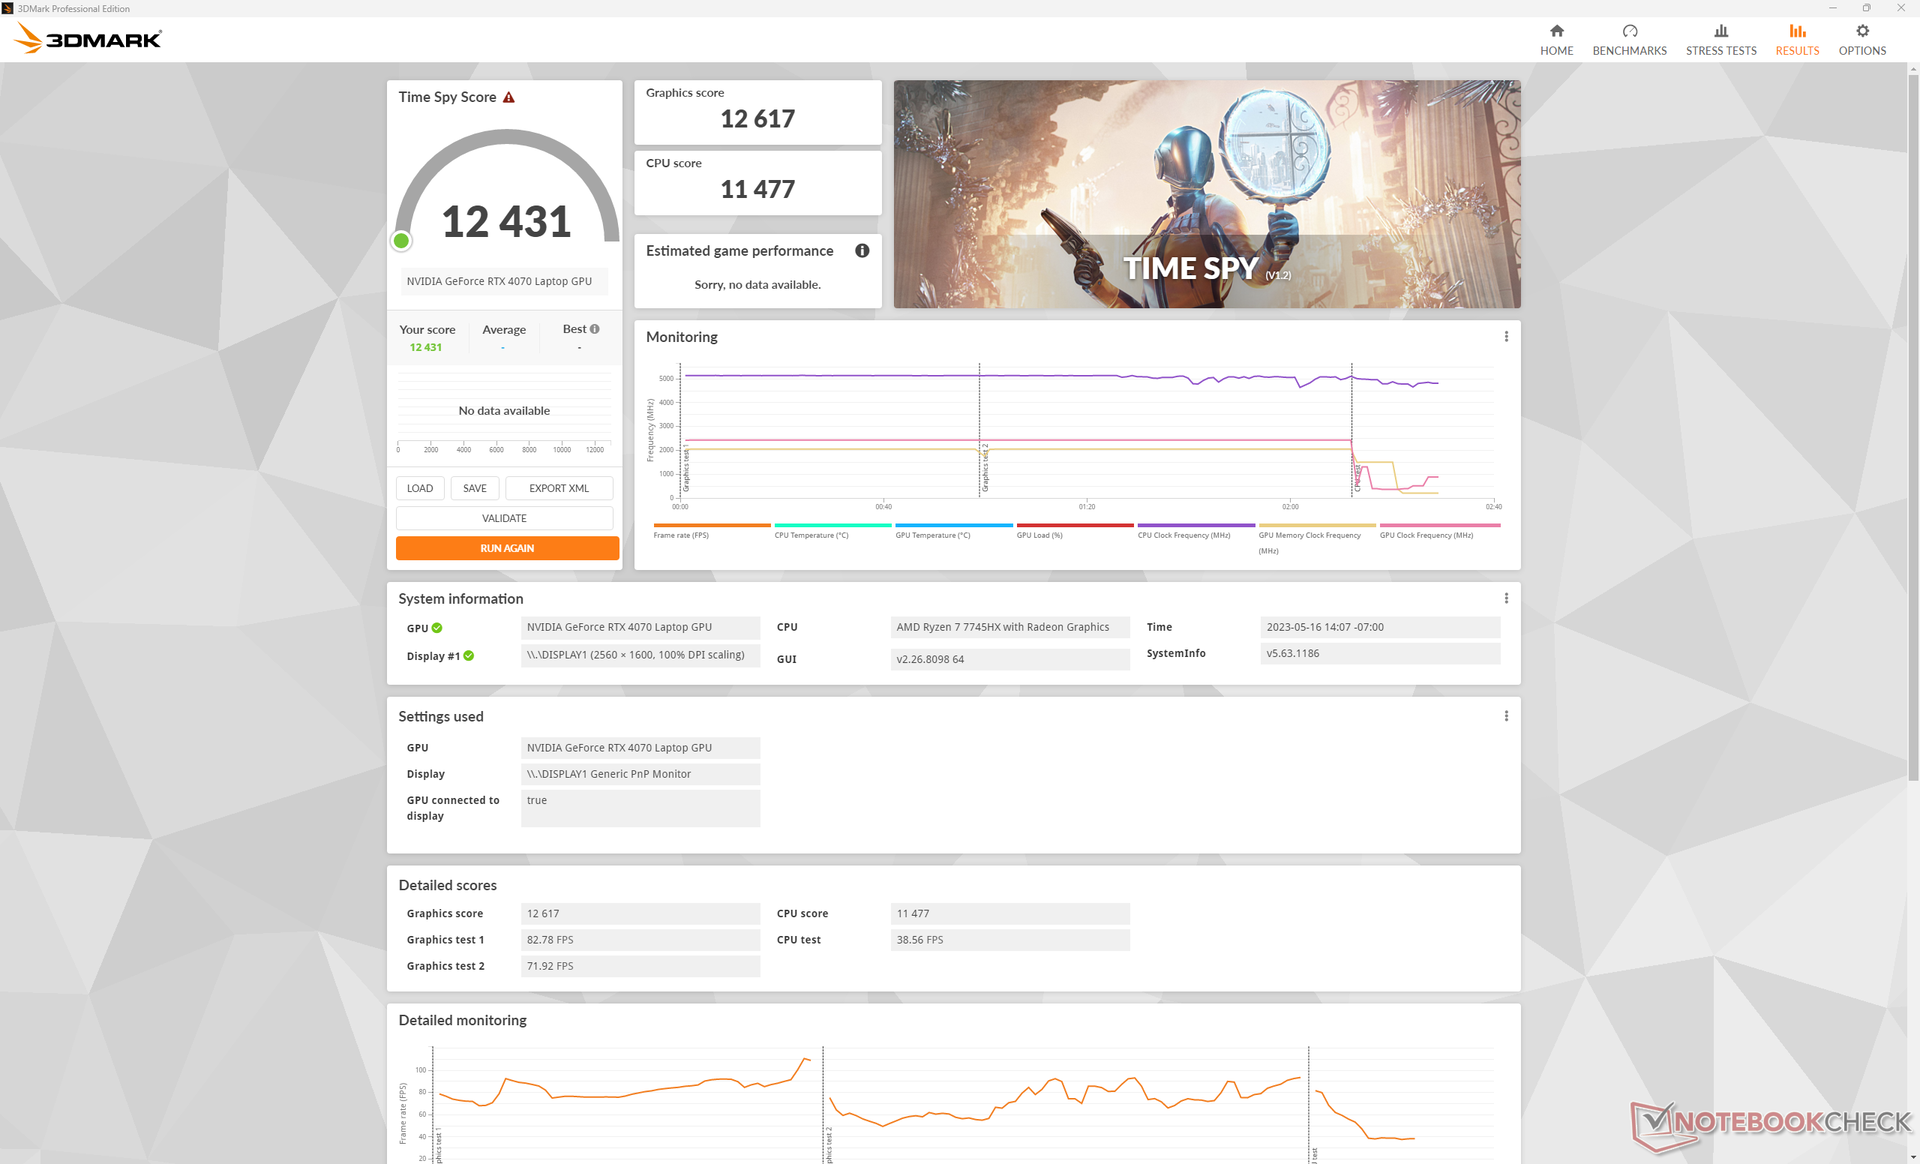
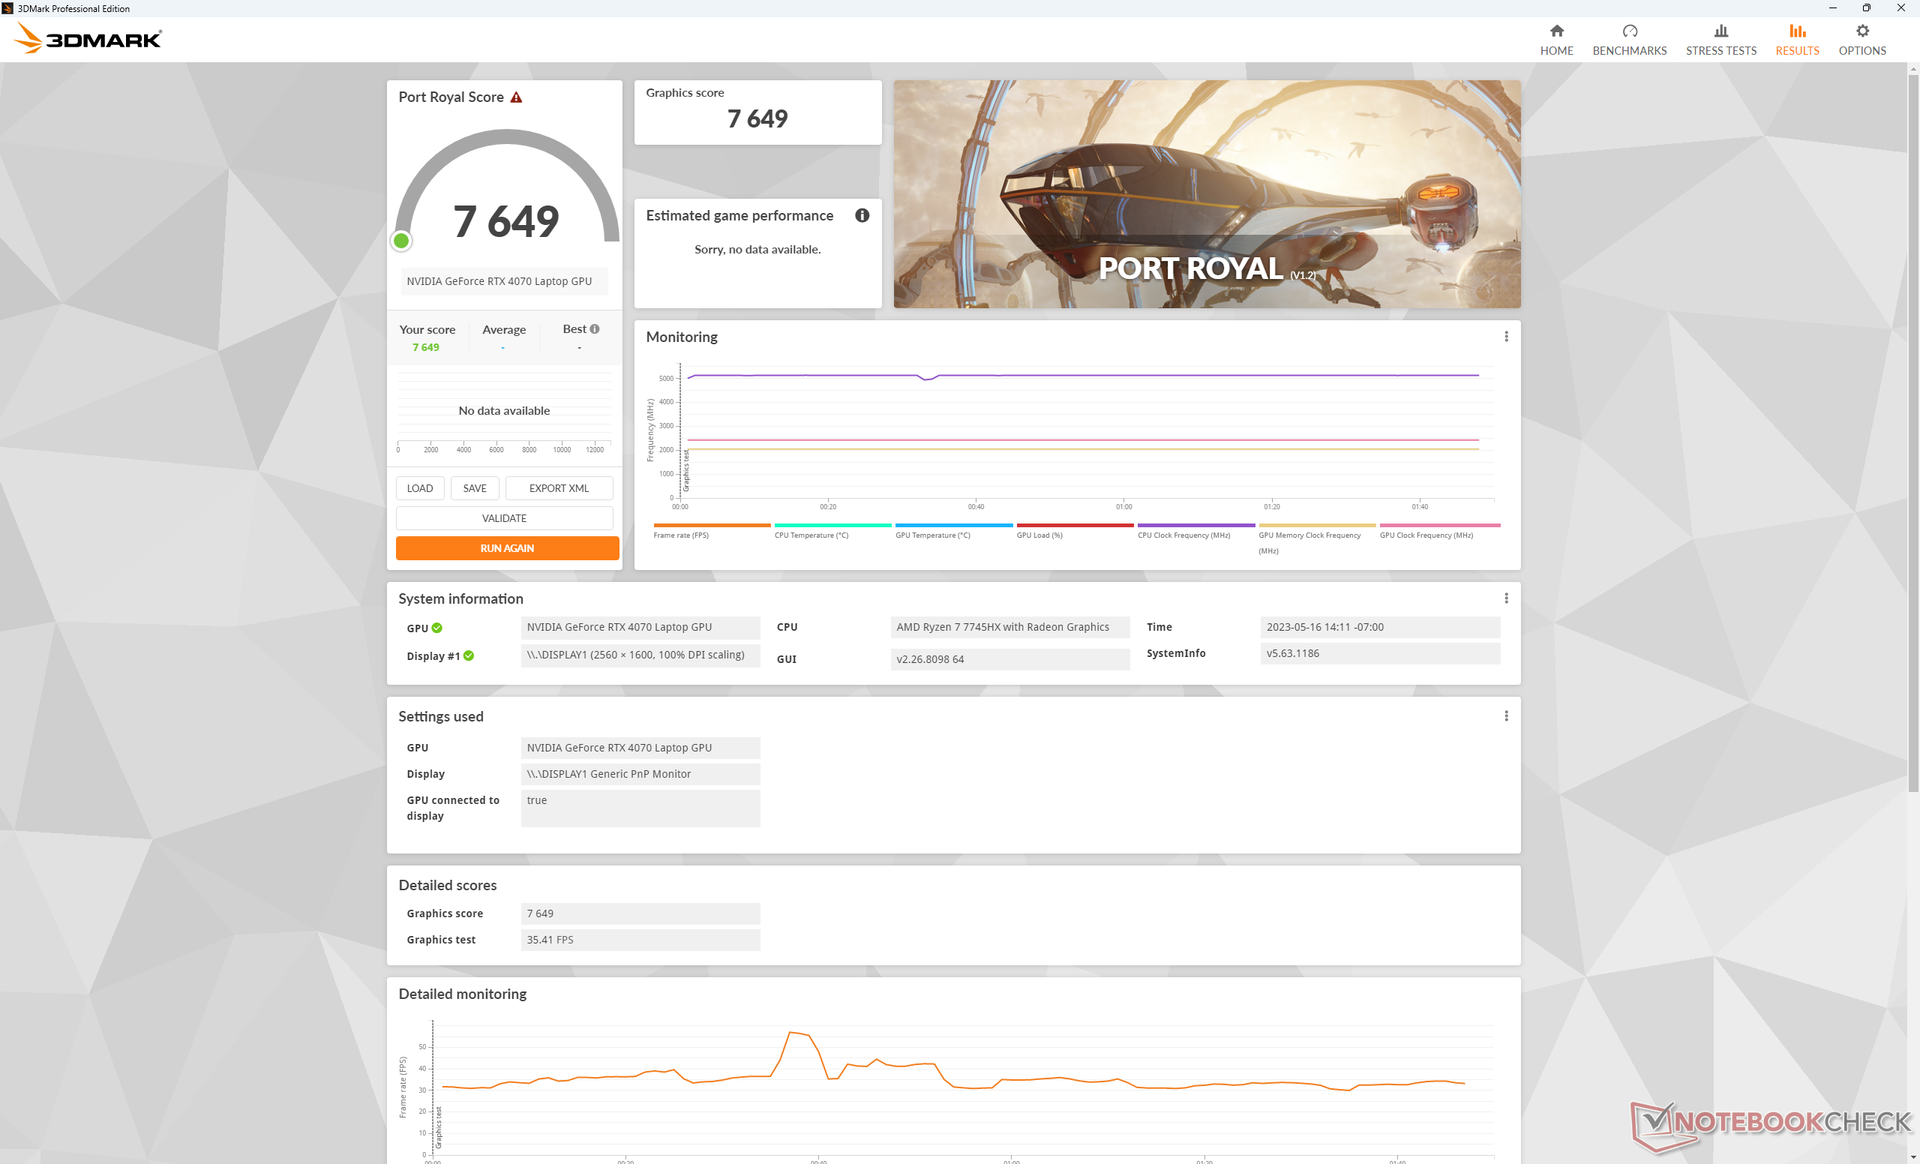
| 3DMark 11 Performance | 34813 points | |
| 3DMark Fire Strike Score | 28009 points | |
| 3DMark Time Spy Score | 12431 points | |
Aide | ||
* ... Moindre est la valeur, meilleures sont les performances
Performance des jeux
Notre modèle RTX 4070 alimenté par AMD serait au pire aussi performant que le modèle RTX 4060 alimenté par Intel, et au mieux jusqu'à 20 % plus rapide. Comme on pouvait s'y attendre, l'écart de performance entre les deux GPU tend à se creuser lorsque l'on joue à des titres plus exigeants à des résolutions et des paramètres plus élevés. Par exemple, F1 22 et Returnal sont 15 à 20 % plus rapides sur notre modèle AMD Legion, tandis que des titres plus anciens comme GTA V affichent des taux de rafraîchissement plus faibles, de l'ordre de 5 à 10 %. Vous devrez donc jouer à des titres plus récents pour mieux exploiter la RTX 4070 mobile.
En général, la RTX 4070 mobile s'associe bien avec l'écran natif d'une résolution de 2560 x 1600, d'autant plus que G-Sync est pris en charge. Bien que la version mobile soit beaucoup plus faible que la version de bureau d'environ 30 %, elle reste suffisamment puissante pour faire tourner les jeux les plus récents à 1600p et 60+ FPS avec les paramètres les plus élevés. Les joueurs qui ne sont pas gênés par les inconvénients de la génération d'images peuvent activer DLSS3 sur les titres pris en charge pour obtenir des taux d'images encore plus élevés.
Witcher 3 FPS Chart
| Bas | Moyen | Élevé | Ultra | QHD | 4K | |
|---|---|---|---|---|---|---|
| GTA V (2015) | 185.8 | 185.1 | 178.6 | 119.9 | 93.2 | 93.7 |
| The Witcher 3 (2015) | 597 | 415.1 | 257.3 | 119.8 | 76.2 | |
| Dota 2 Reborn (2015) | 238 | 203 | 191.8 | 182 | 151.5 | |
| Final Fantasy XV Benchmark (2018) | 229 | 172.5 | 119.9 | 119.9 | 49.2 | |
| X-Plane 11.11 (2018) | 186.3 | 155.2 | 117.8 | 99.5 | ||
| Strange Brigade (2018) | 636 | 334 | 260 | 223 | 146.4 | 76.8 |
| Shadow of the Tomb Raider (2018) | 168 | 110 | 53 | |||
| Far Cry 6 (2021) | 110 | 88 | 43 | |||
| Cyberpunk 2077 1.6 (2022) | 185.8 | 157.6 | 121.3 | 98.9 | 58.1 | 24.7 |
| Tiny Tina's Wonderlands (2022) | 263.6 | 217.3 | 144.5 | 112.1 | 76.9 | 39.7 |
| F1 22 (2022) | 311 | 300 | 235 | 84.1 | 54.8 | 26.4 |
| Call of Duty Modern Warfare 2 2022 (2022) | 108 | 77 | 44 | |||
| Returnal (2023) | 93 | 90 | 85 | 77 | 55 | 29 |
| Star Wars Jedi Survivor (2023) | 77.9 | 50.4 | 24.2 |
Émissions
Bruit du système - Environ 50 dB(A) lors des jeux
Le bruit du ventilateur lors des jeux est à peu près le même entre les modèles AMD et Intel, soit environ 48 dB(A). Cependant, si le processeur est beaucoup plus sollicité, le bruit du ventilateur peut atteindre un maximum de 54 dB(A). La plage de 50 dB(A) est typique de la plupart des ordinateurs portables de jeu, y compris l'Asus ROG Strix G16, l'un des plus grands ordinateurs portables de jeu au monde.Asus ROG Strix G16 ou leRazer Blade 16.
Il est intéressant de noter que le bruit du ventilateur est un peu plus silencieux et avec des pulsations moins fréquentes lors de l'exécution de charges peu exigeantes comme le travail de bureau ou la lecture de vidéos. Le processeur AMD consomme moins d'énergie que le processeur Intel en mode boost, ce qui peut contribuer au bruit plus régulier du ventilateur.
Degré de la nuisance sonore
| Au repos |
| 23.2 / 23.2 / 26.2 dB(A) |
| Fortement sollicité |
| 31.4 / 53.8 dB(A) |
 | ||
30 dB silencieux 40 dB(A) audible 50 dB(A) bruyant |
||
min: | ||
| Lenovo Legion Pro 5 16ARX8 GeForce RTX 4070 Laptop GPU, R7 7745HX, Samsung PM9A1 MZVL21T0HCLR | Lenovo Legion Pro 5 16IRX8 GeForce RTX 4060 Laptop GPU, i7-13700HX, SK hynix PC801 HFS512GEJ9X115N | Uniwill GM6PX7X RTX 4070 GeForce RTX 4070 Laptop GPU, i7-13700HX, Samsung PM9A1 MZVL2512HCJQ | Schenker XMG Neo 16 E23 GeForce RTX 4090 Laptop GPU, i9-13900HX, Crucial P5 Plus 1TB CT1000P5PSSD8 | Asus ROG Strix G16 G614JZ GeForce RTX 4080 Laptop GPU, i9-13980HX, WD PC SN560 SDDPNQE-1T00 | Asus Zephyrus Duo 16 GX650PY-NM006W GeForce RTX 4090 Laptop GPU, R9 7945HX, SK hynix PC801 HFS002TEJ9X101N | |
|---|---|---|---|---|---|---|
| Noise | -2% | -9% | -37% | -15% | -19% | |
| arrêt / environnement * (dB) | 23.2 | 23 1% | 22.4 3% | 25 -8% | 25 -8% | 23.9 -3% |
| Idle Minimum * (dB) | 23.2 | 23.1 -0% | 22.9 1% | 31 -34% | 26 -12% | 23.9 -3% |
| Idle Average * (dB) | 23.2 | 23.1 -0% | 29 -25% | 33 -42% | 28 -21% | 32.9 -42% |
| Idle Maximum * (dB) | 26.2 | 26.6 -2% | 29 -11% | 42 -60% | 30 -15% | 36.5 -39% |
| Load Average * (dB) | 31.4 | 34.7 -11% | 40.2 -28% | 58 -85% | 48 -53% | 42.9 -37% |
| Witcher 3 ultra * (dB) | 48.4 | 47.6 2% | 48.7 -1% | 57 -18% | 49 -1% | 51.2 -6% |
| Load Maximum * (dB) | 53.8 | 54.8 -2% | 55 -2% | 59 -10% | 52 3% | 56 -4% |
* ... Moindre est la valeur, meilleures sont les performances
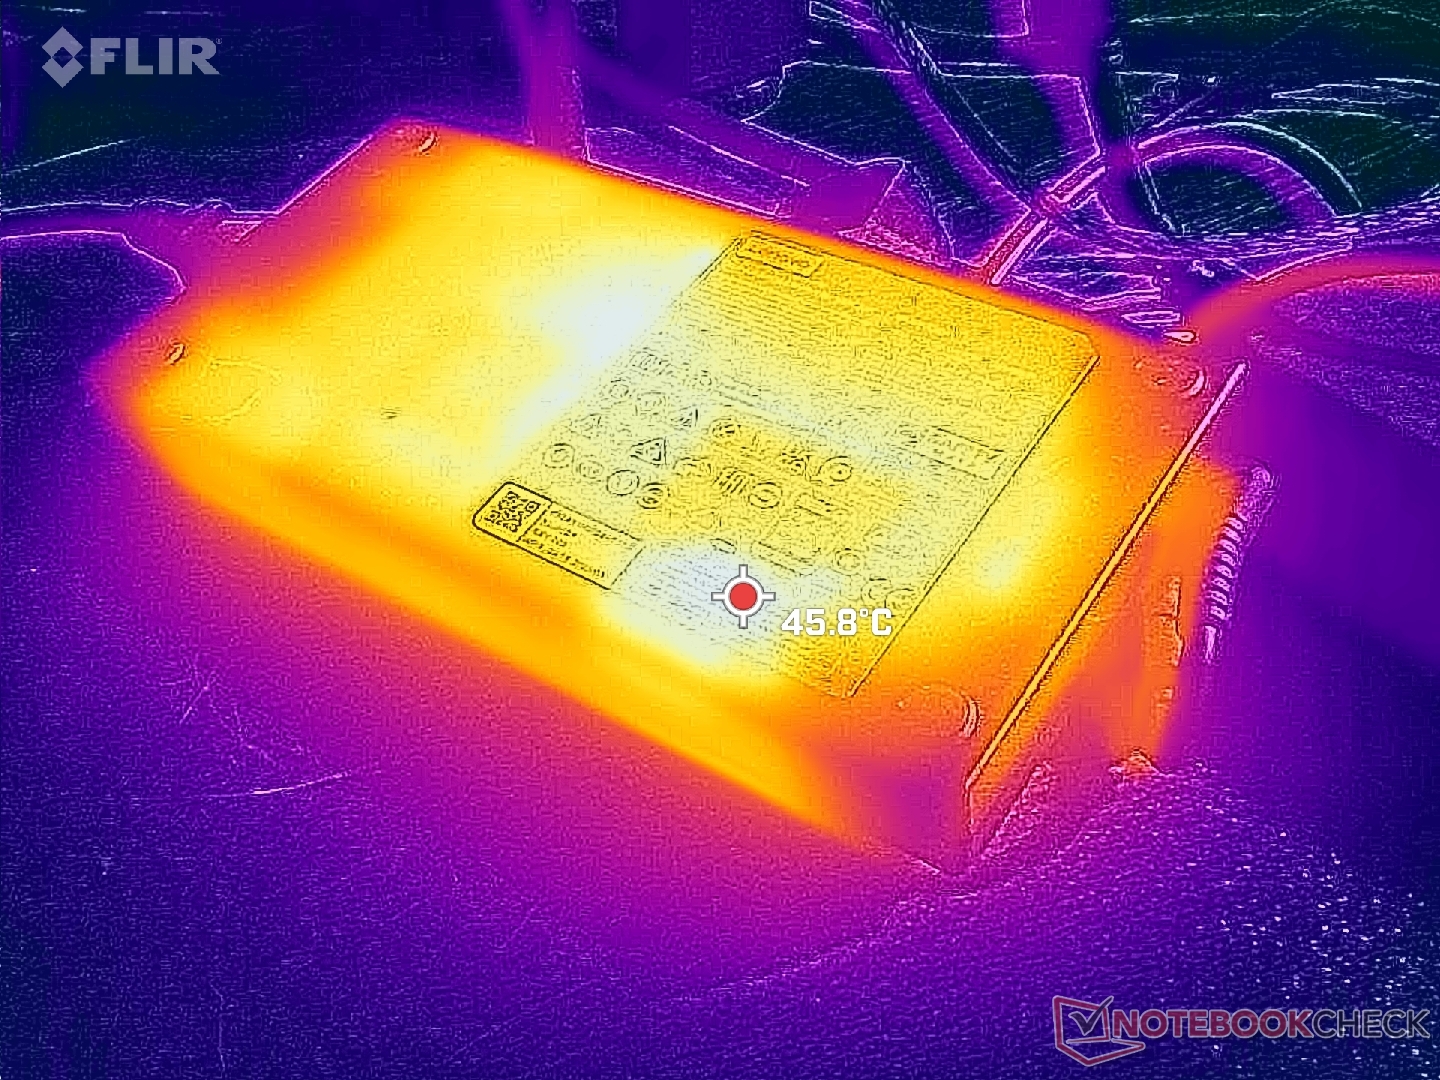
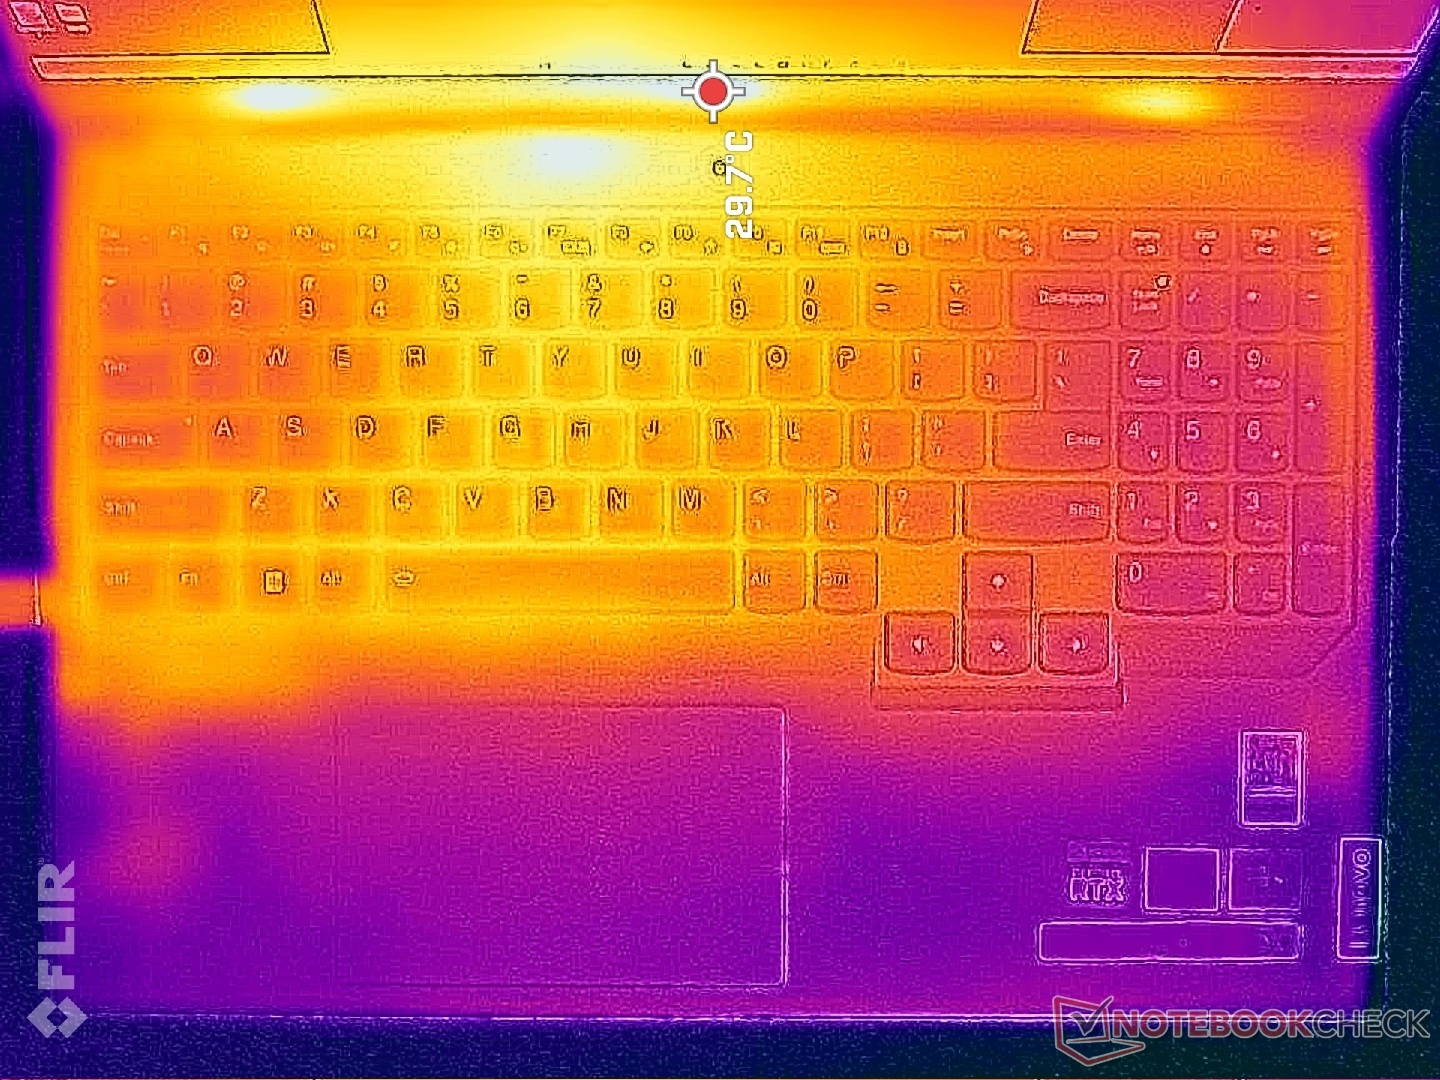
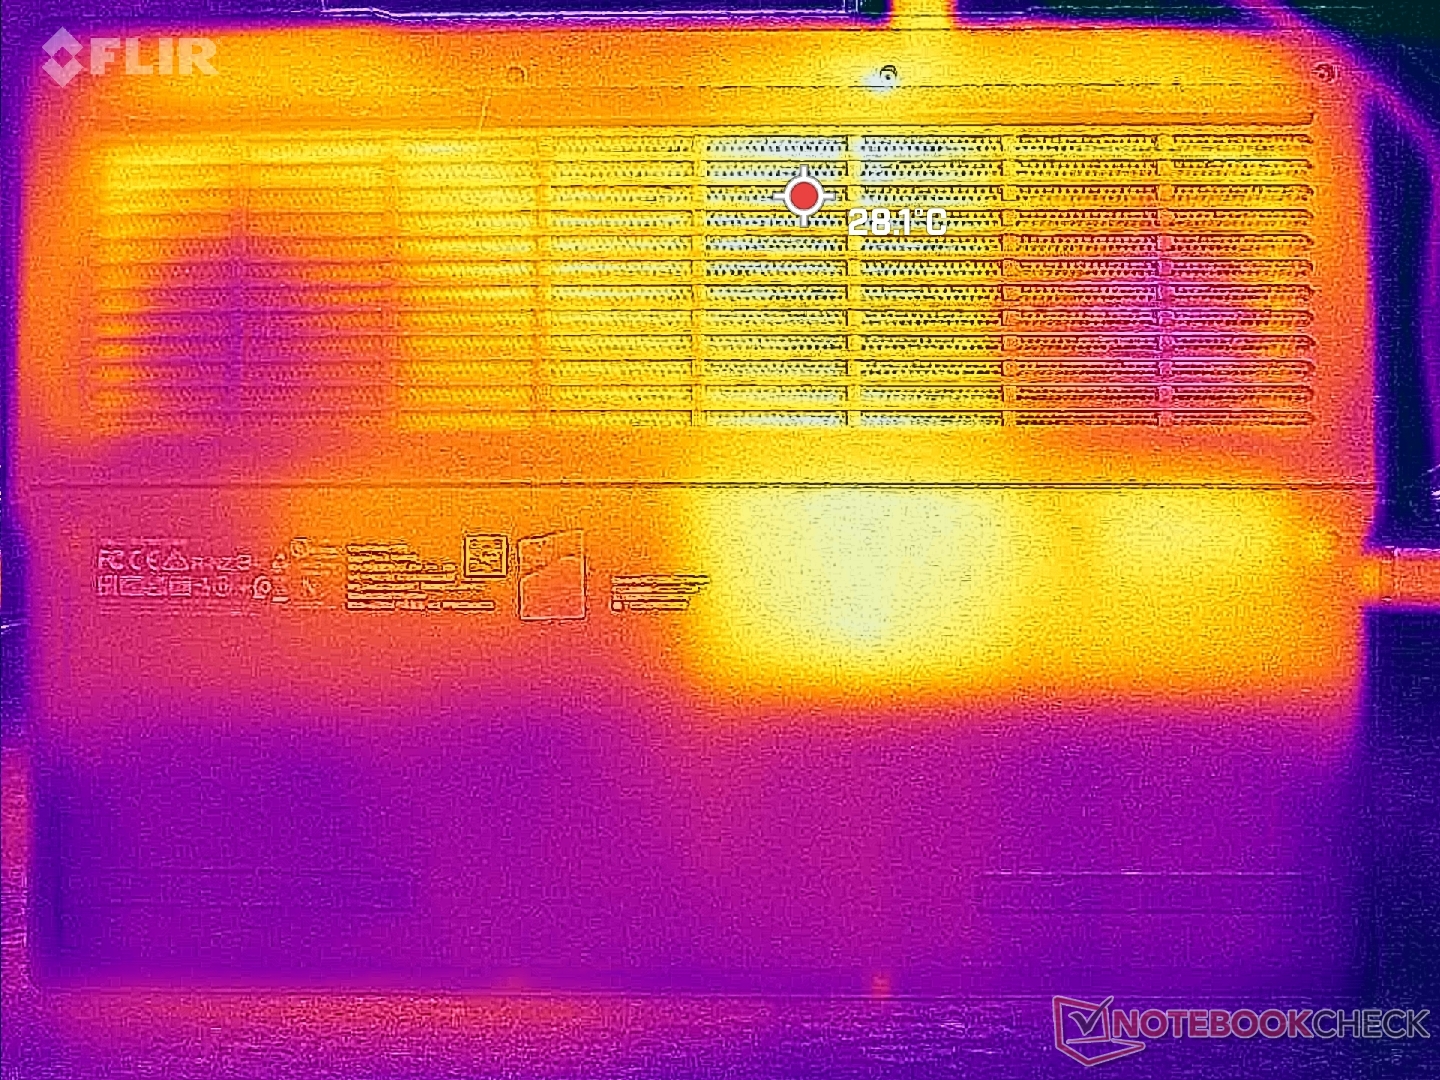
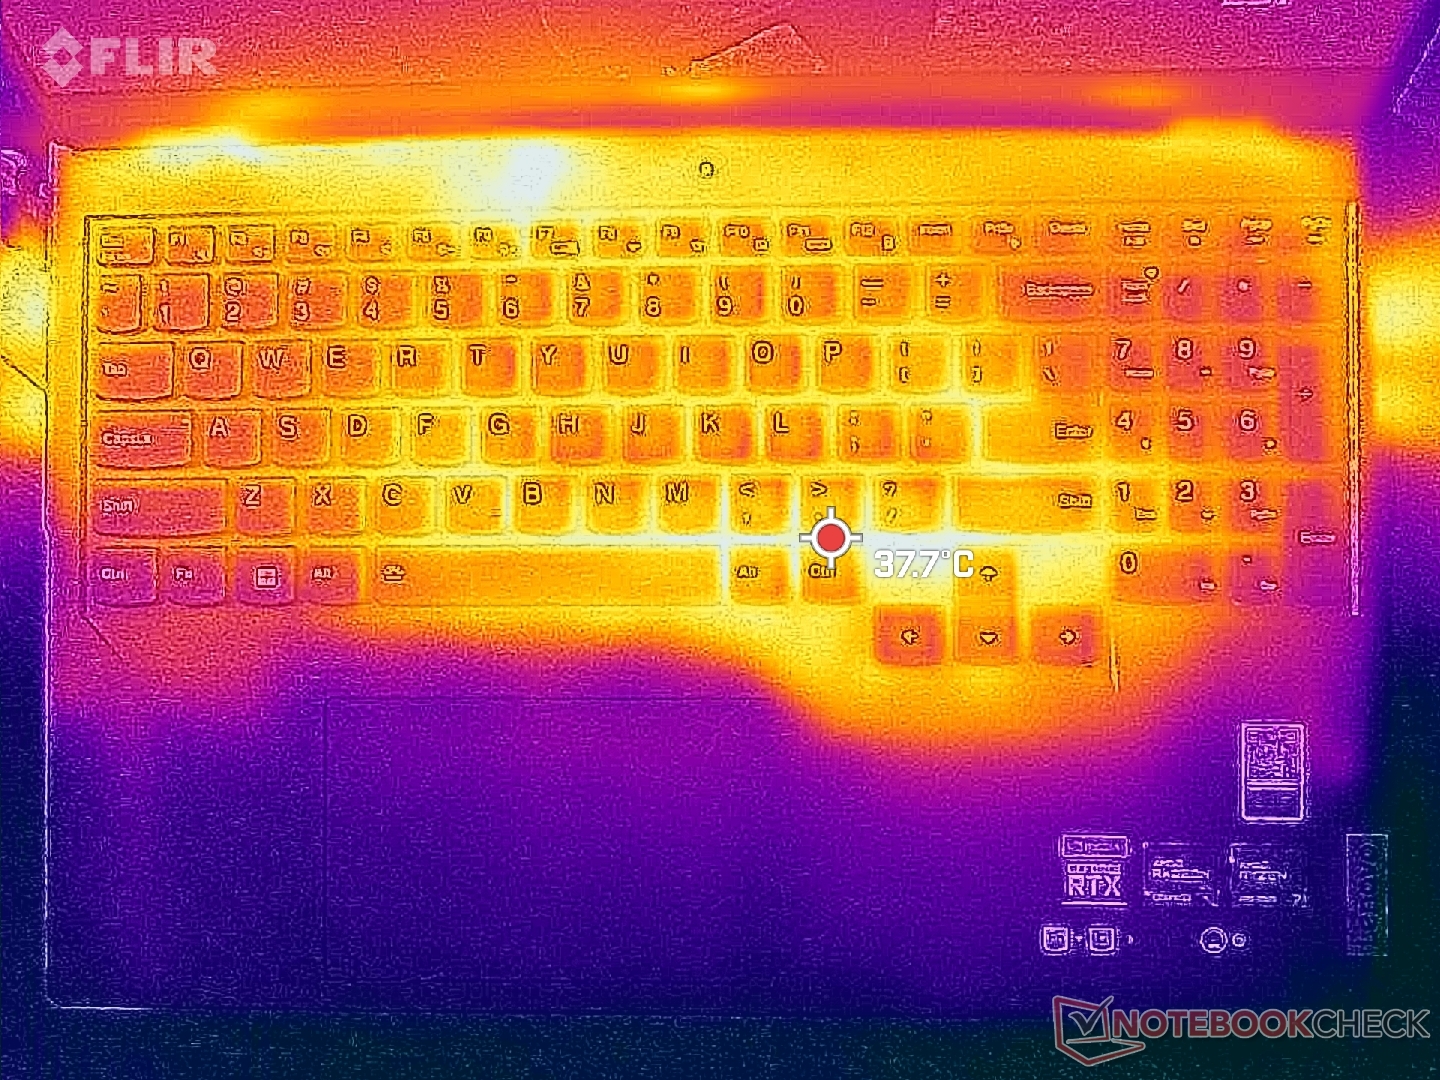
Température
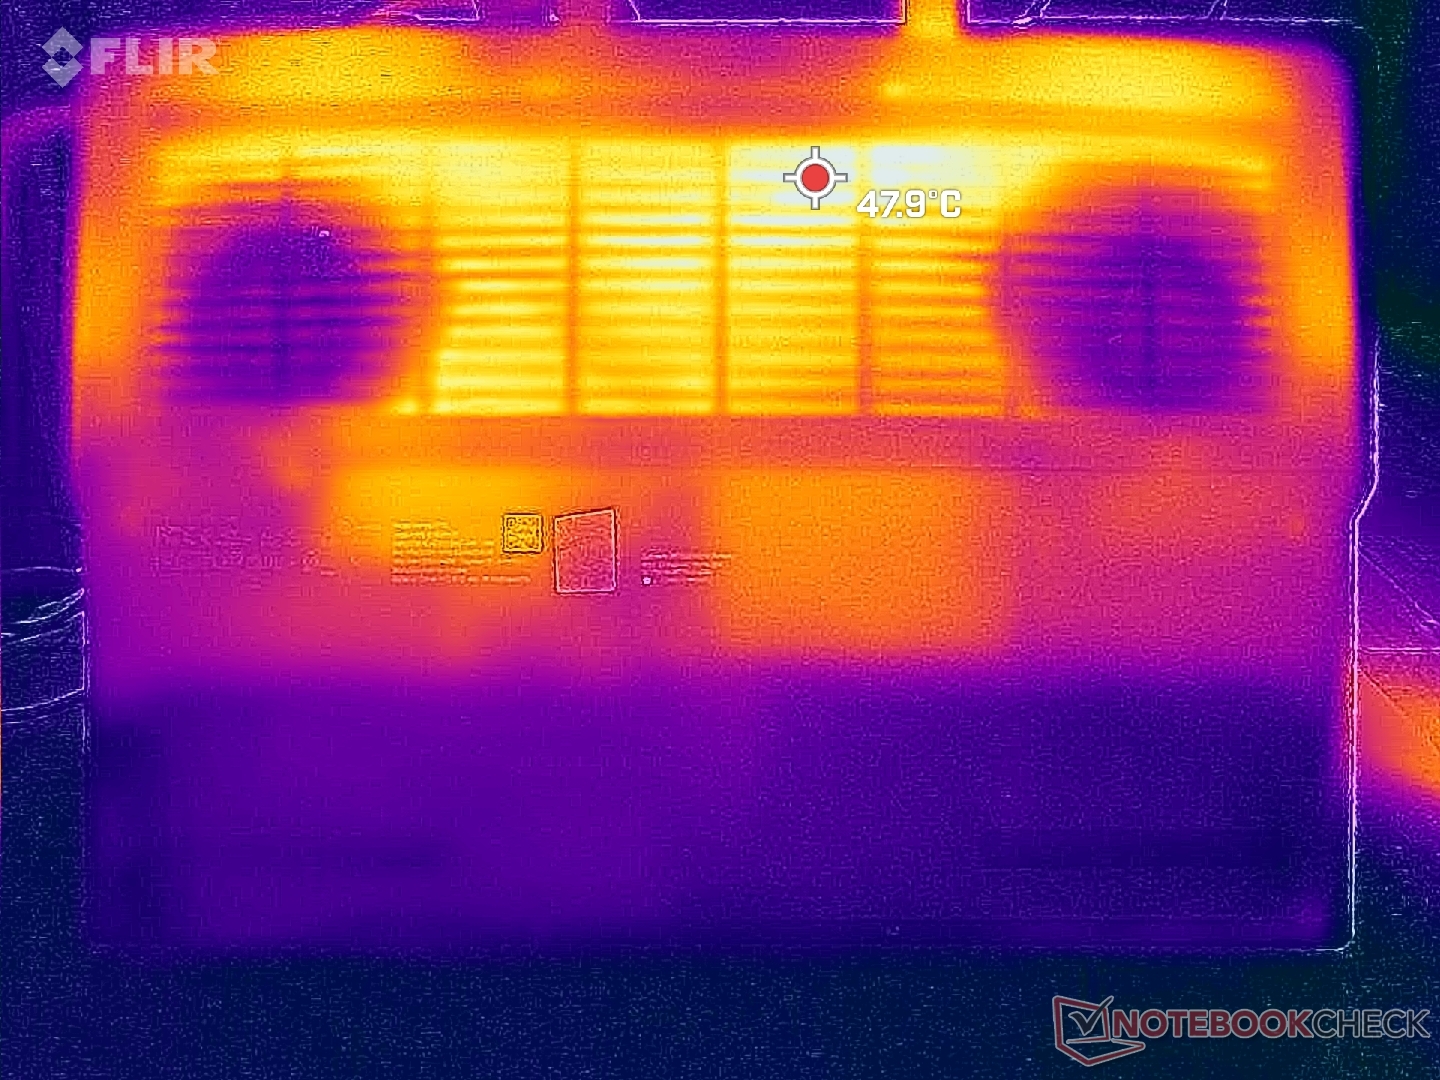
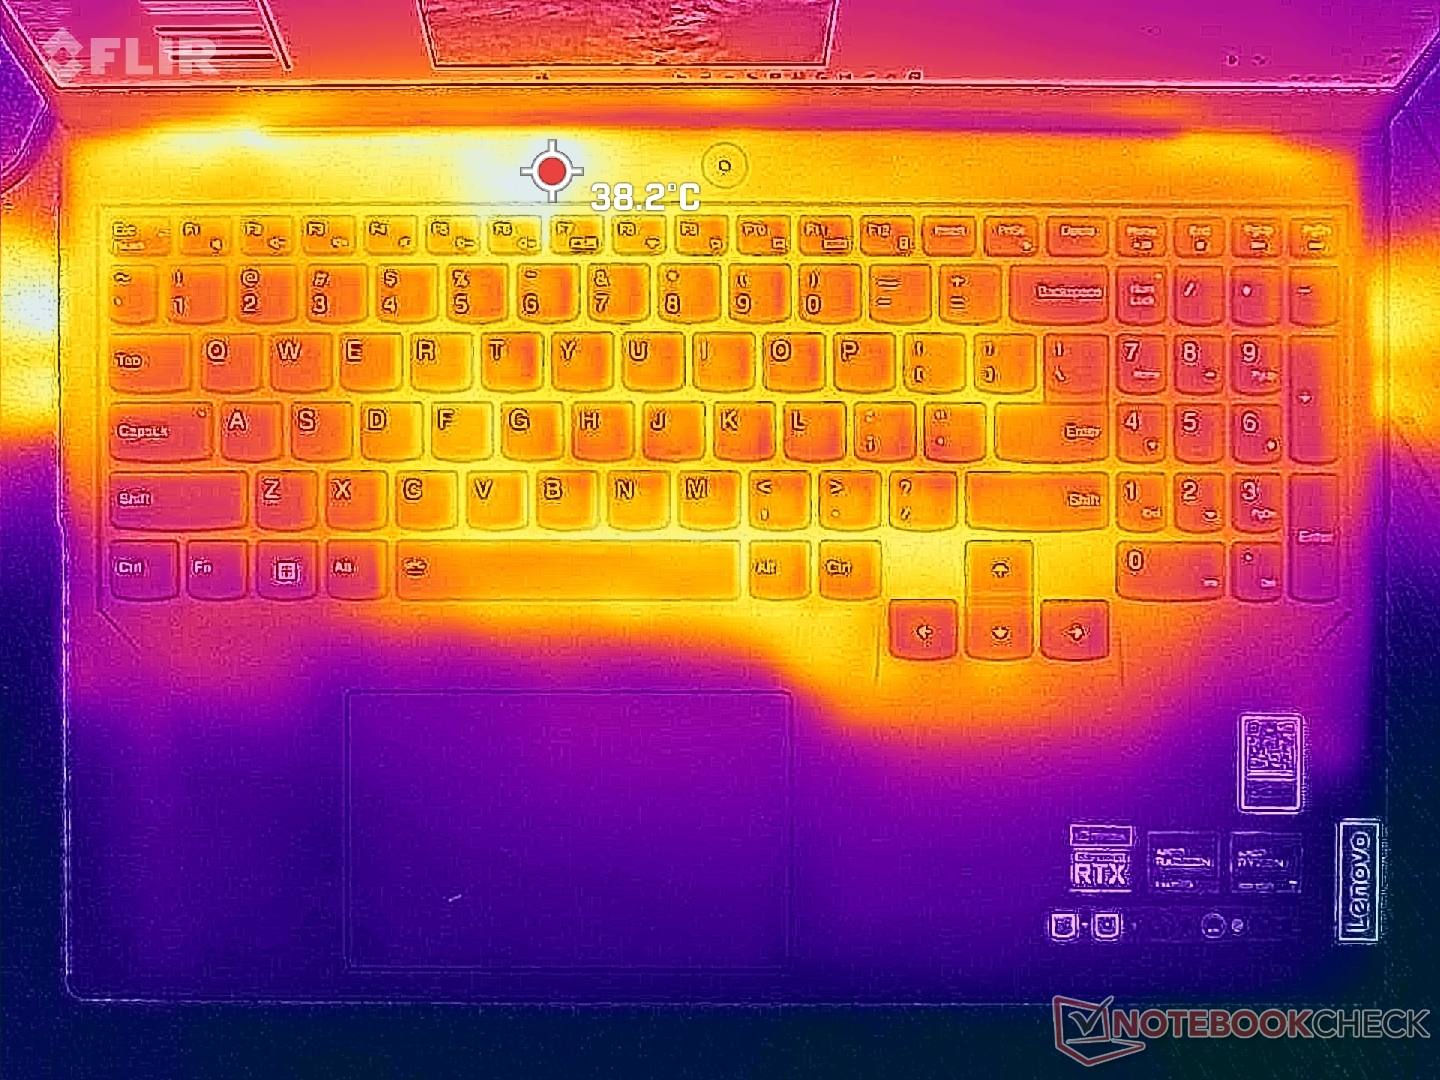
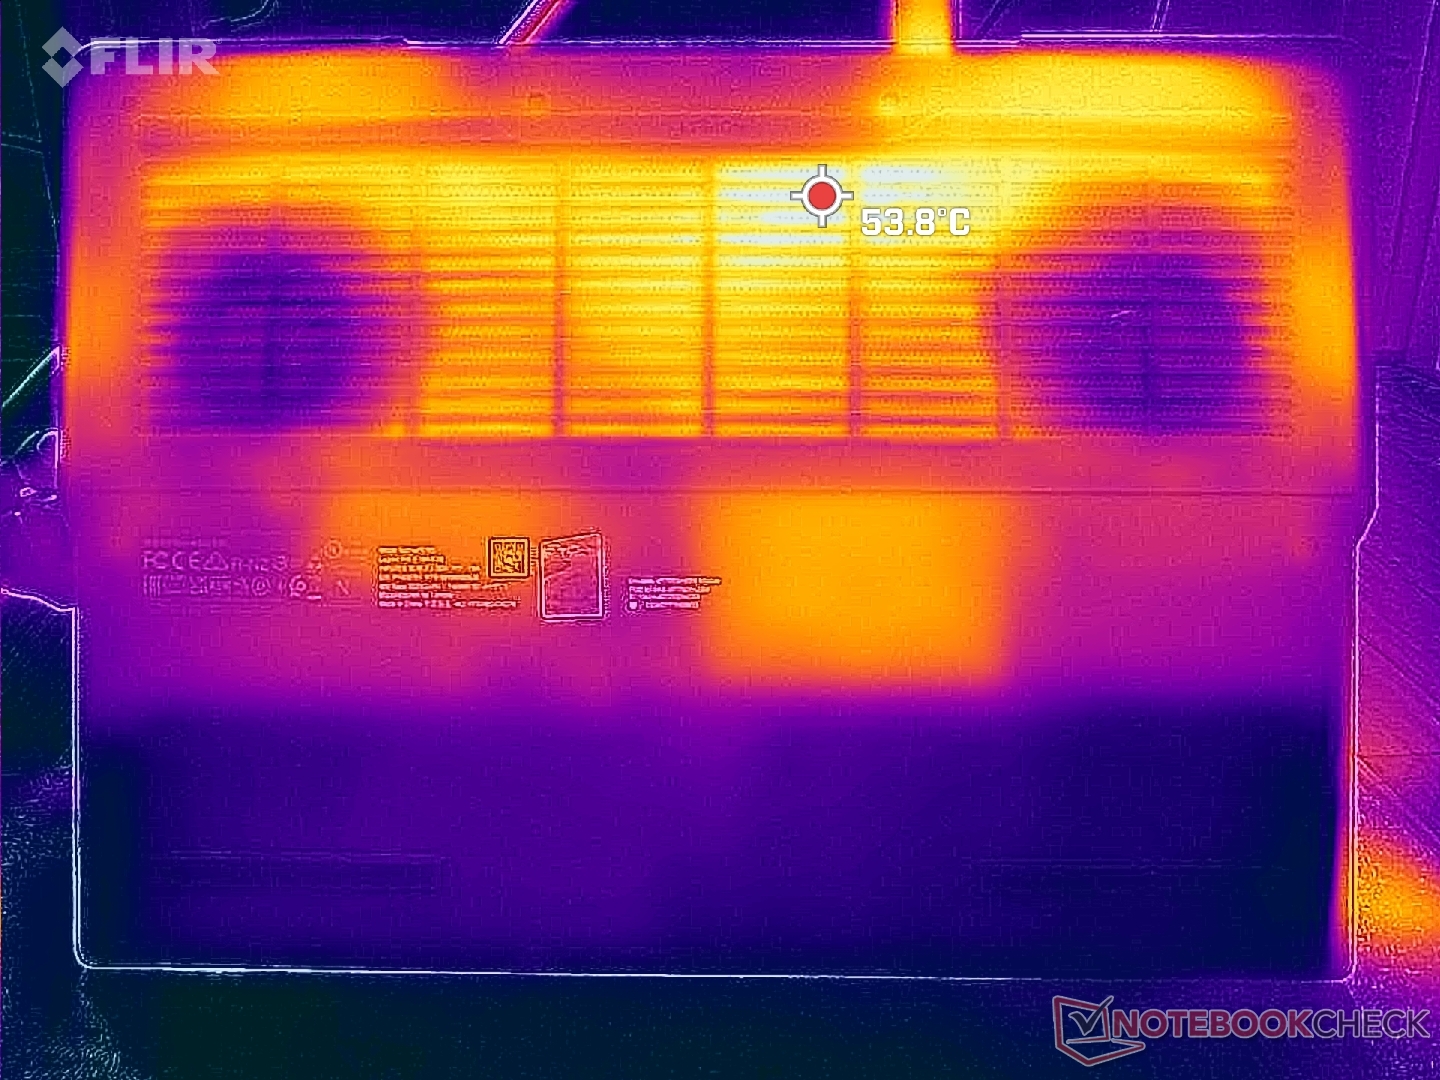
Les températures de surface sont les plus élevées au centre et à l'arrière du châssis, où les points chauds peuvent atteindre un peu plus de 40°C pendant les jeux. Les modèles concurrents comme leAsus ROG Zephyrus M16 sont encore plus chauds, avec une température légèrement supérieure à 50°C dans des conditions de test similaires. Il ne fait aucun doute que les grilles d'aération comparativement plus grandes du design Legion sont en partie responsables des meilleures températures.
Les repose-poignets chauffent à peine, quelle que soit la charge à l'écran, ce qui permet de garder les mains à l'aise pendant les jeux.
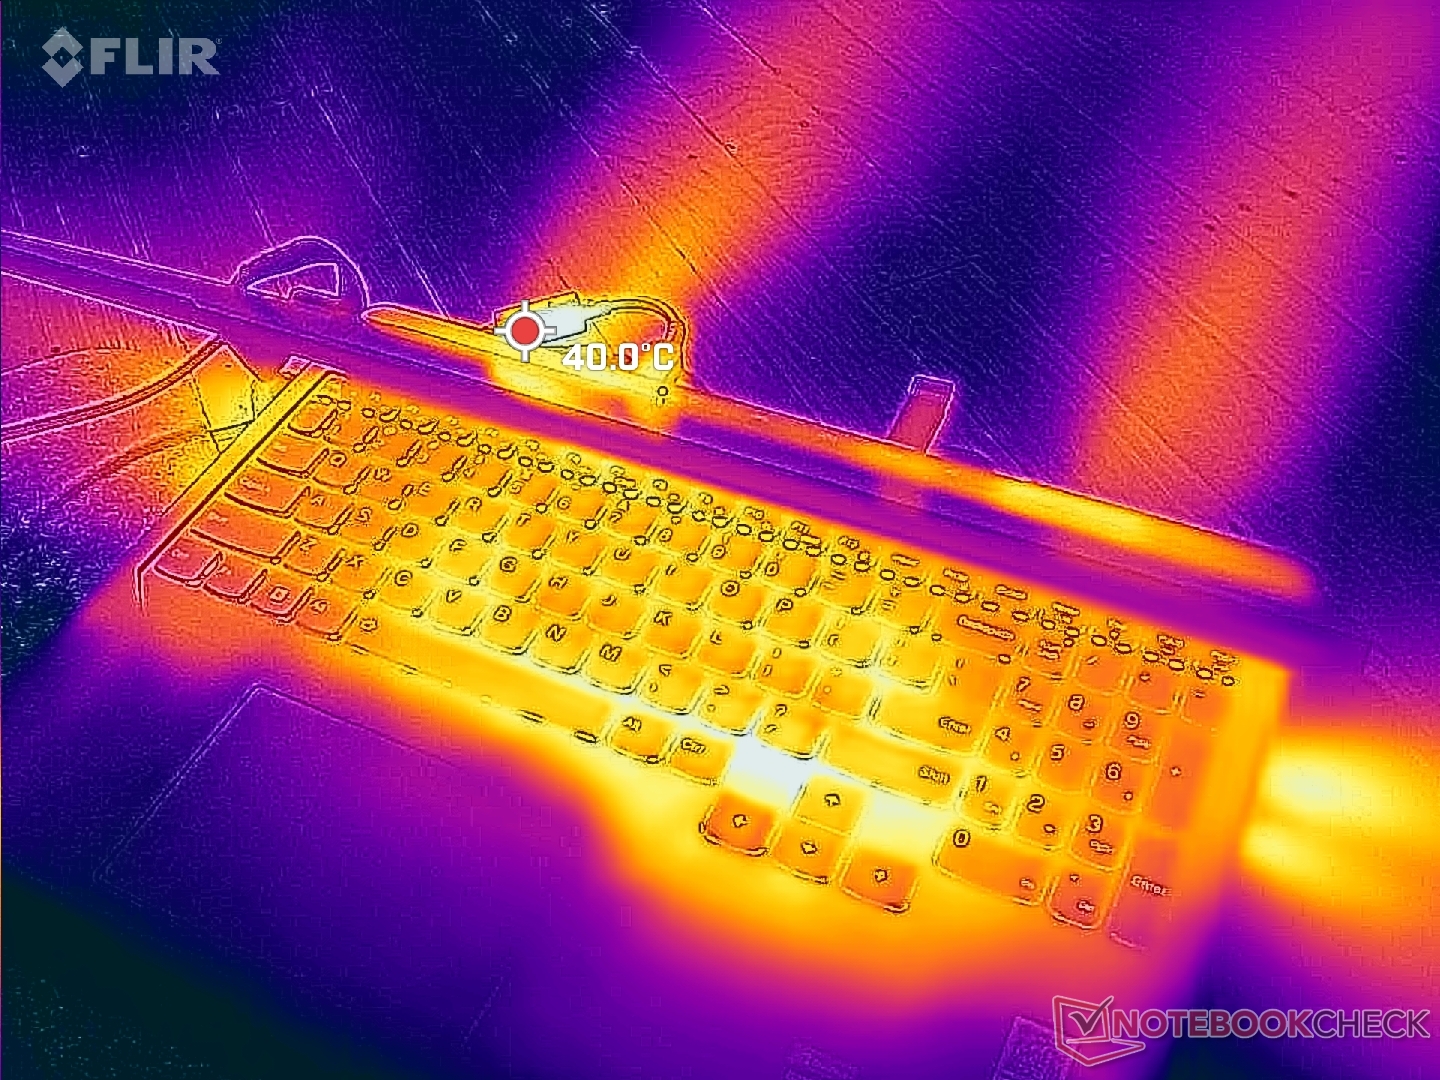
(±) La température maximale du côté supérieur est de 41.8 °C / 107 F, par rapport à la moyenne de 40.4 °C / 105 F, allant de 21.2 à 68.8 °C pour la classe Gaming.
(±) Le fond chauffe jusqu'à un maximum de 41.4 °C / 107 F, contre une moyenne de 43.2 °C / 110 F
(+) En utilisation inactive, la température moyenne du côté supérieur est de 26.2 °C / 79 F, par rapport à la moyenne du dispositif de 33.9 °C / 93 F.
(±) En jouant à The Witcher 3, la température moyenne du côté supérieur est de 34.2 °C / 94 F, alors que la moyenne de l'appareil est de 33.9 °C / 93 F.
(+) Les repose-poignets et le pavé tactile sont plus froids que la température de la peau avec un maximum de 30.4 °C / 86.7 F et sont donc froids au toucher.
(±) La température moyenne de la zone de l'appui-paume de dispositifs similaires était de 28.8 °C / 83.8 F (-1.6 °C / #-2.9 F).
| Lenovo Legion Pro 5 16ARX8 AMD Ryzen 7 7745HX, NVIDIA GeForce RTX 4070 Laptop GPU | Lenovo Legion Pro 5 16IRX8 Intel Core i7-13700HX, NVIDIA GeForce RTX 4060 Laptop GPU | Uniwill GM6PX7X RTX 4070 Intel Core i7-13700HX, NVIDIA GeForce RTX 4070 Laptop GPU | Schenker XMG Neo 16 E23 Intel Core i9-13900HX, NVIDIA GeForce RTX 4090 Laptop GPU | Asus ROG Strix G16 G614JZ Intel Core i9-13980HX, NVIDIA GeForce RTX 4080 Laptop GPU | Asus Zephyrus Duo 16 GX650PY-NM006W AMD Ryzen 9 7945HX, NVIDIA GeForce RTX 4090 Laptop GPU | |
|---|---|---|---|---|---|---|
| Heat | -9% | -12% | -7% | -18% | -5% | |
| Maximum Upper Side * (°C) | 41.8 | 42.8 -2% | 38.2 9% | 50 -20% | 54 -29% | 44.2 -6% |
| Maximum Bottom * (°C) | 41.4 | 50 -21% | 45 -9% | 51 -23% | 55 -33% | 46.8 -13% |
| Idle Upper Side * (°C) | 29 | 29.6 -2% | 33.6 -16% | 28 3% | 29 -0% | 29.2 -1% |
| Idle Bottom * (°C) | 30.4 | 34 -12% | 39.6 -30% | 26 14% | 33 -9% | 30.2 1% |
* ... Moindre est la valeur, meilleures sont les performances
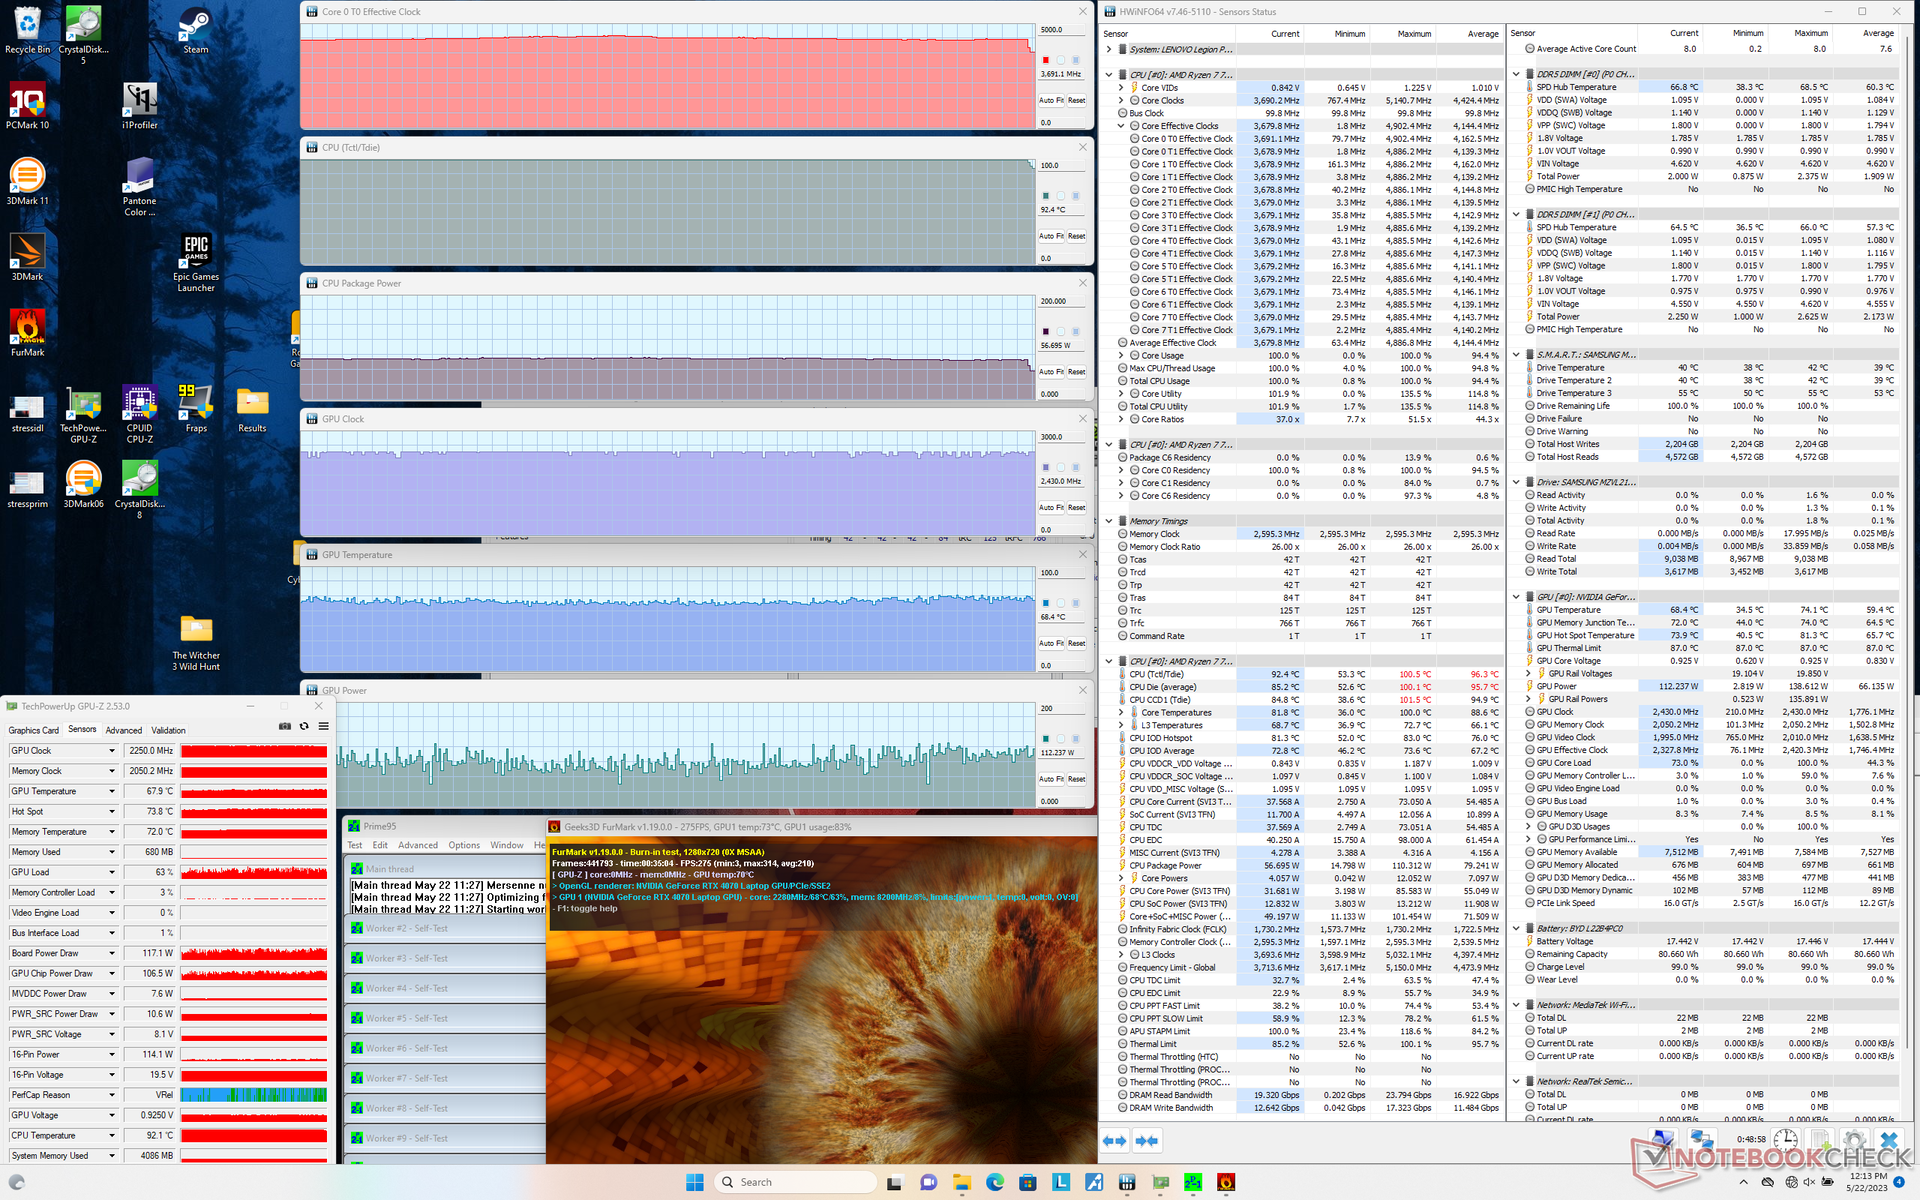
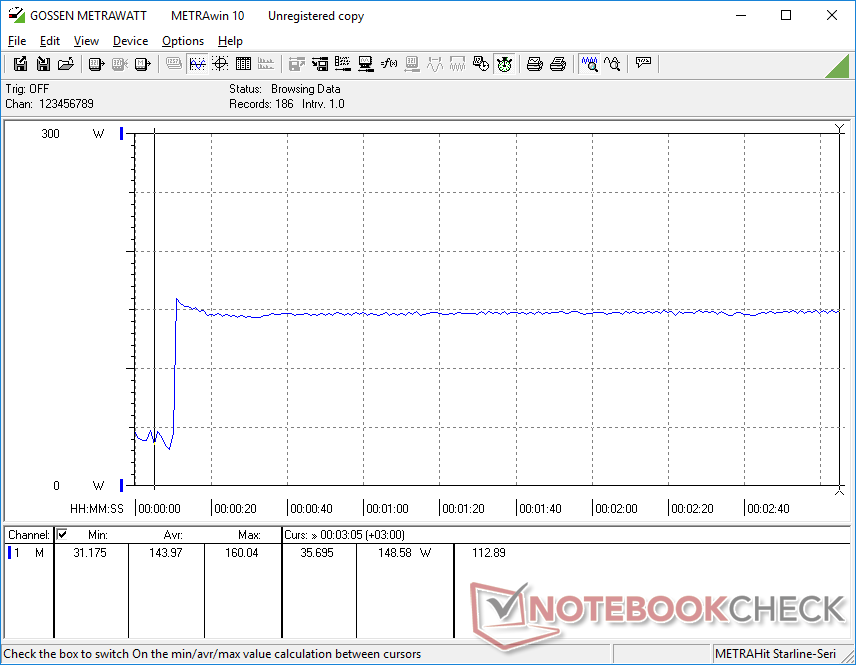
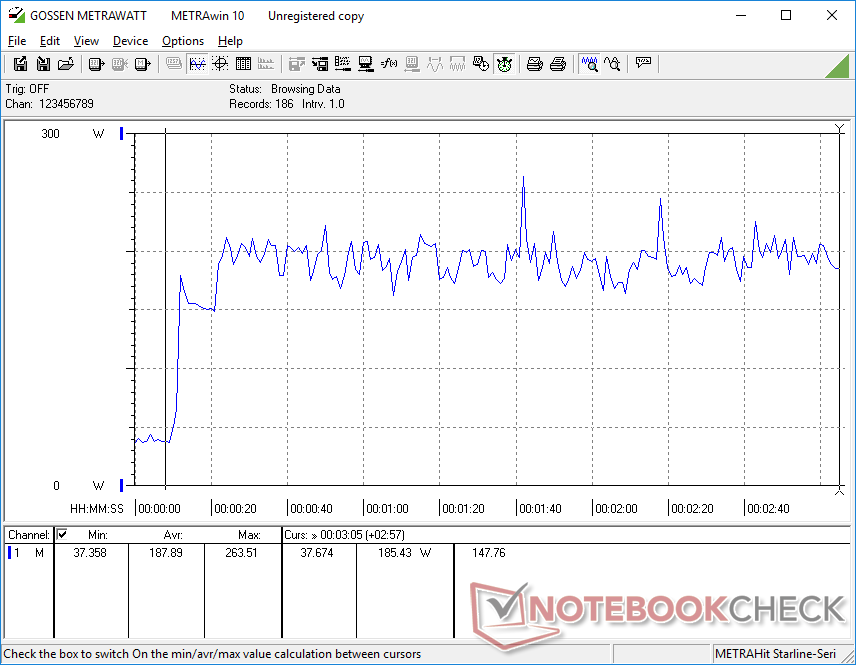
Stress Test - Un processeur en pleine forme
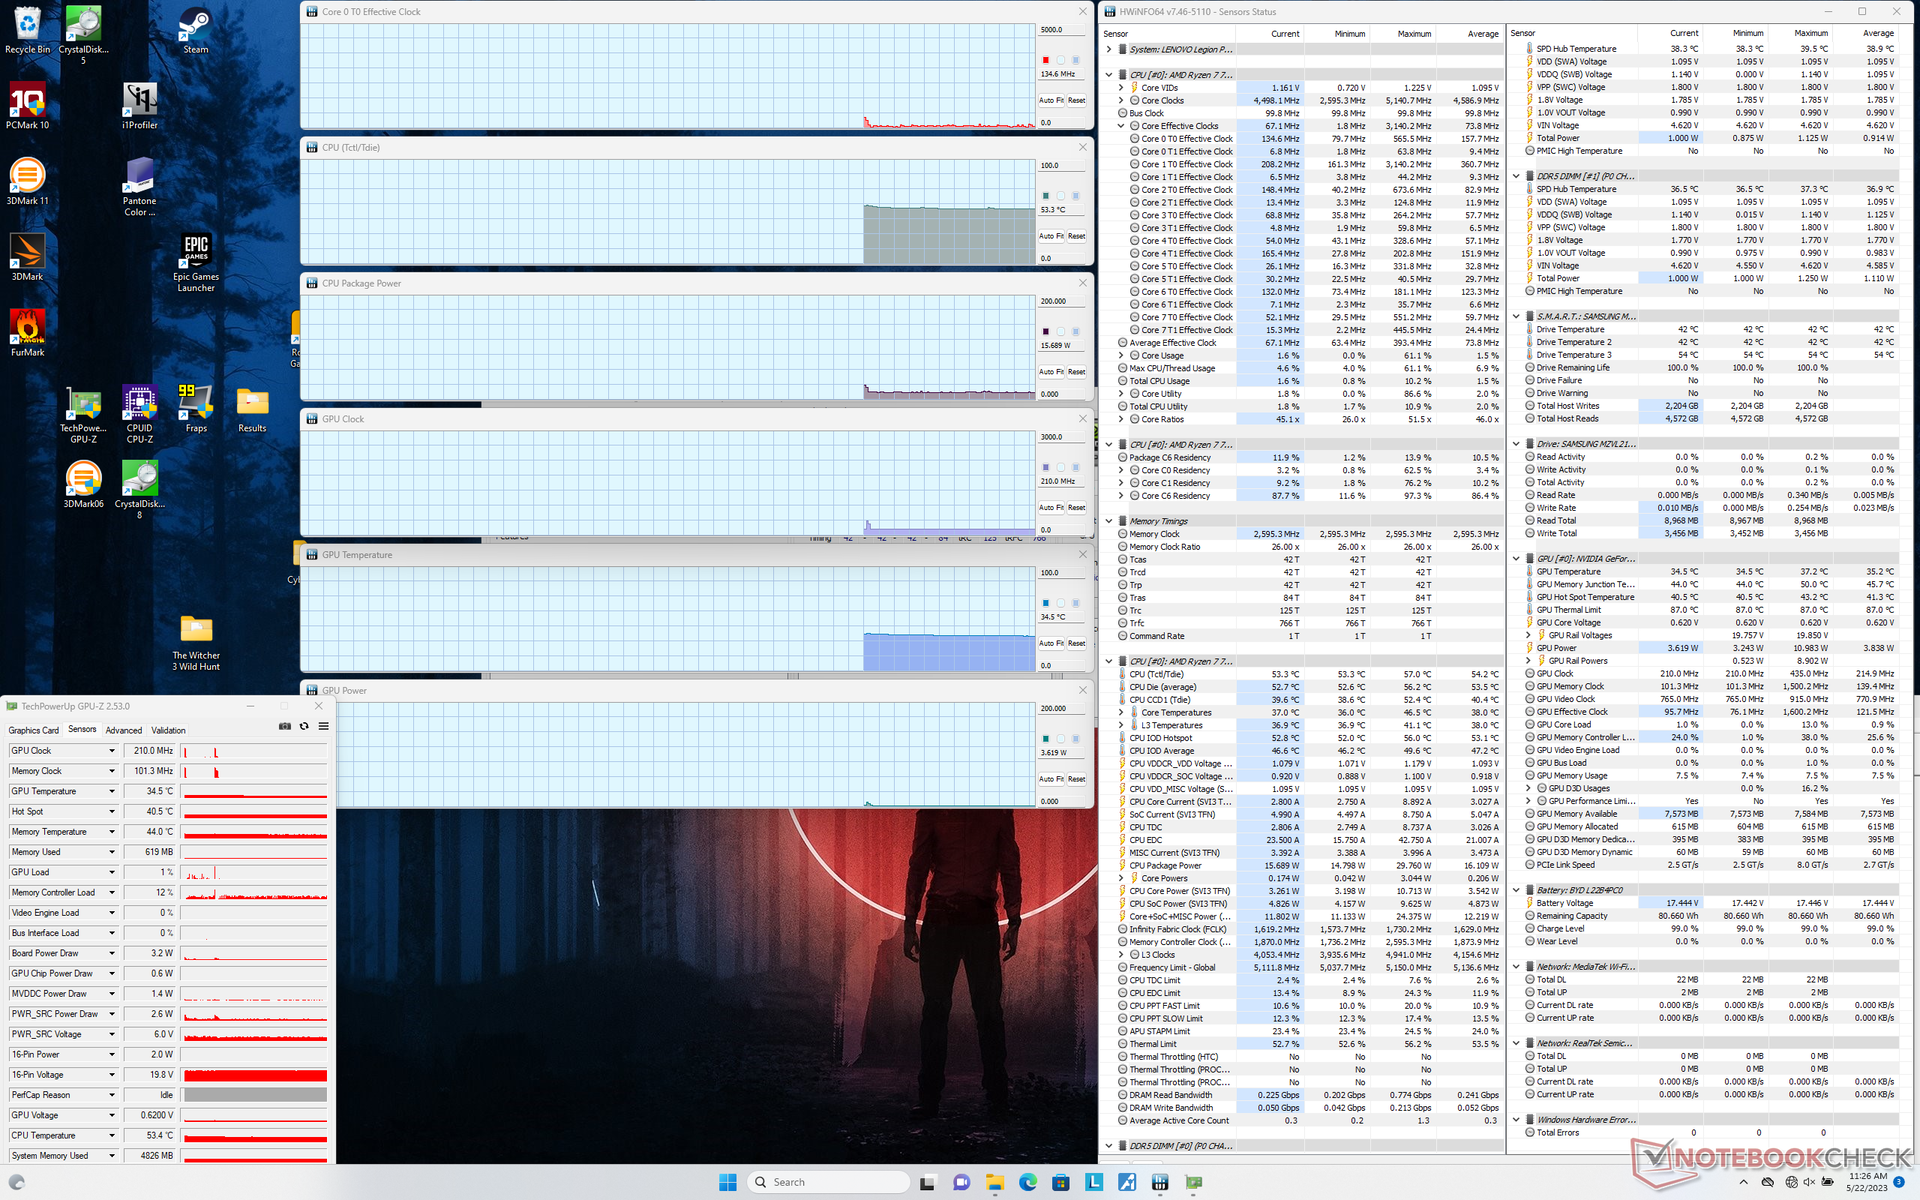
Lors de l'exécution de Prime95 pour stresser le CPU, les fréquences d'horloge et la consommation d'énergie de la carte ont atteint 4,9 GHz et 110 W, respectivement, avant de redescendre rapidement à 4,6 GHz et 90 W quelques secondes plus tard. La température du cœur se stabilise entre 90 °C et 100 °C, soit quelques degrés de plus que le Core i7-13700HX déjà chaud dans le modèle modèle alternatif Intel Legion . Il est clair que le CPU Ryzen 7 repousse les limites de la solution de refroidissement du châssis et qu'une solution Ryzen 9 plus rapide aurait nécessité des compromis.
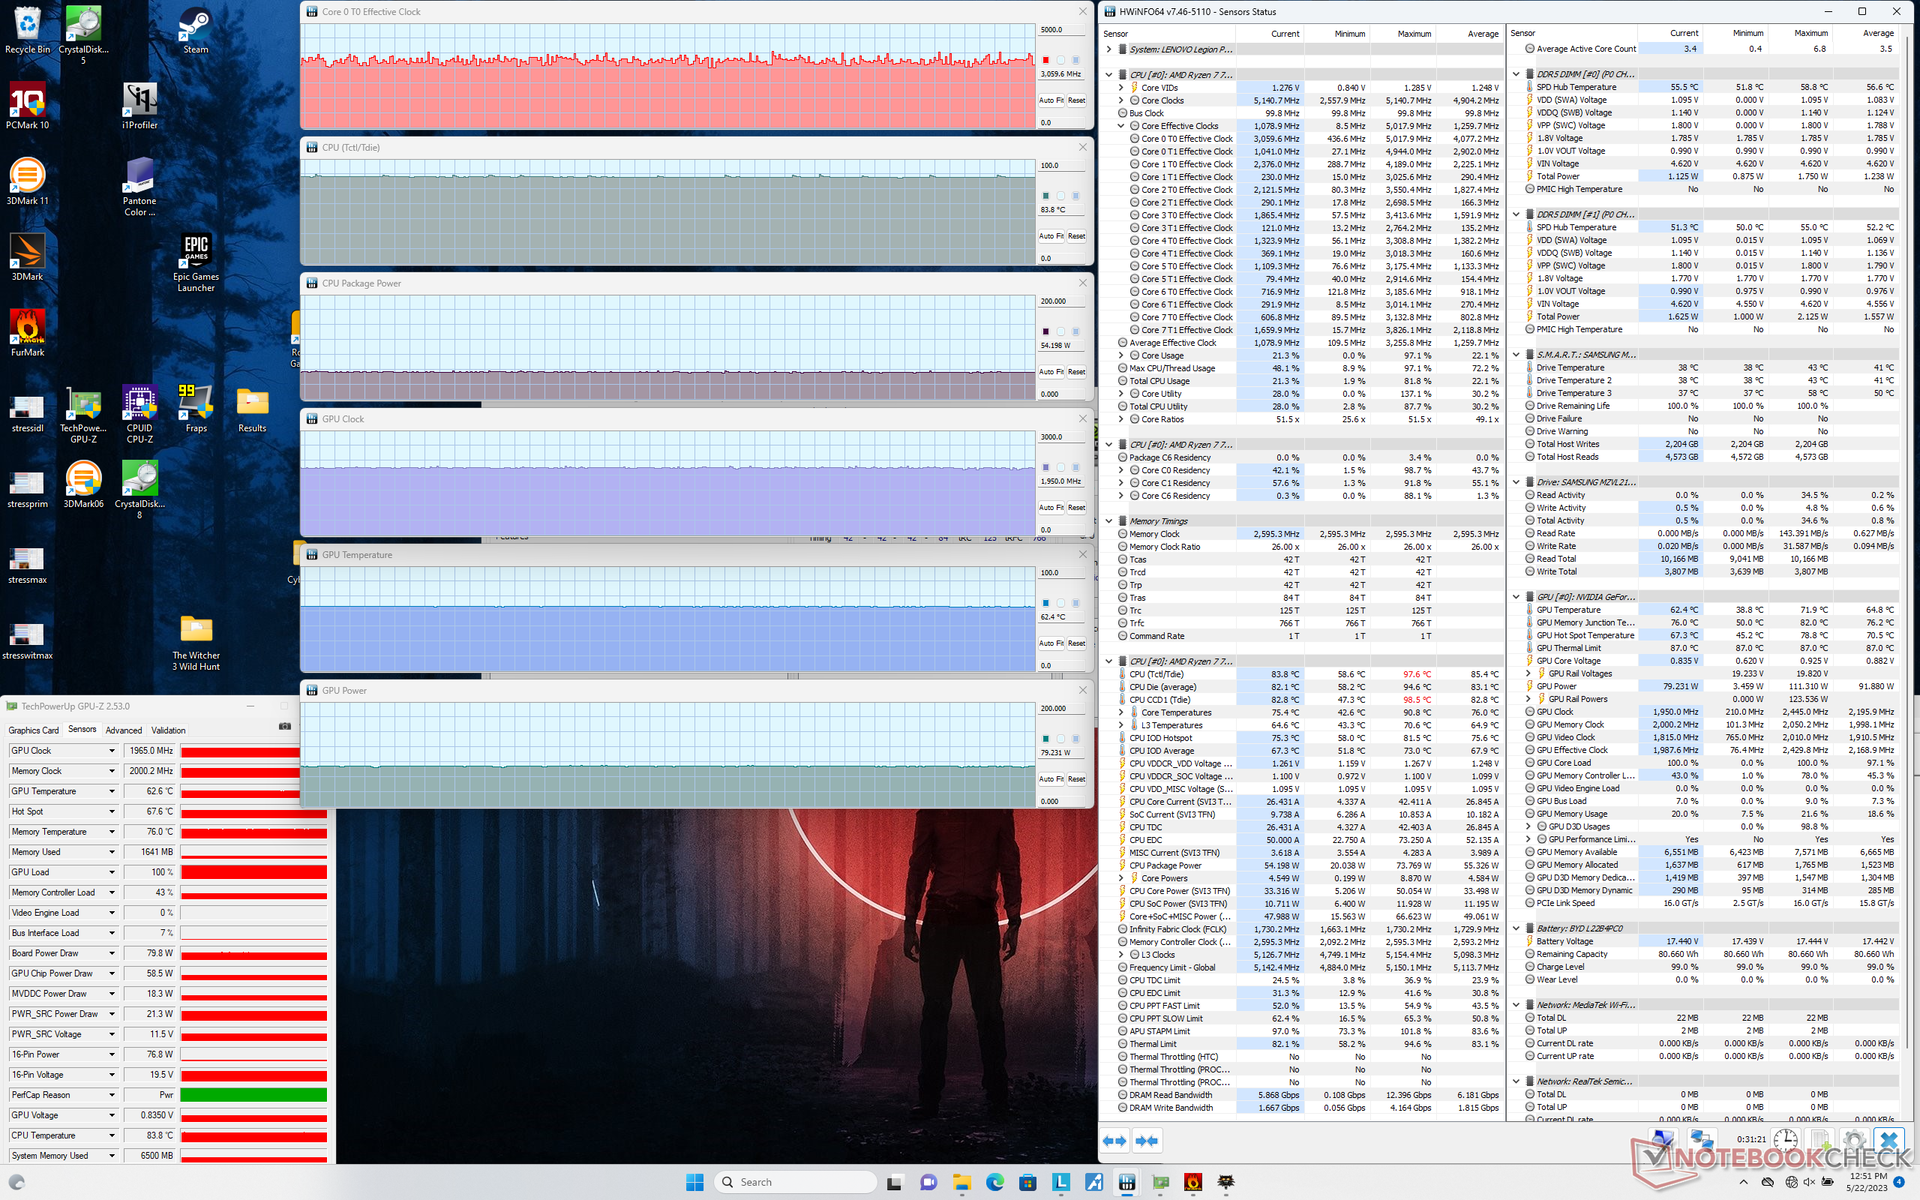
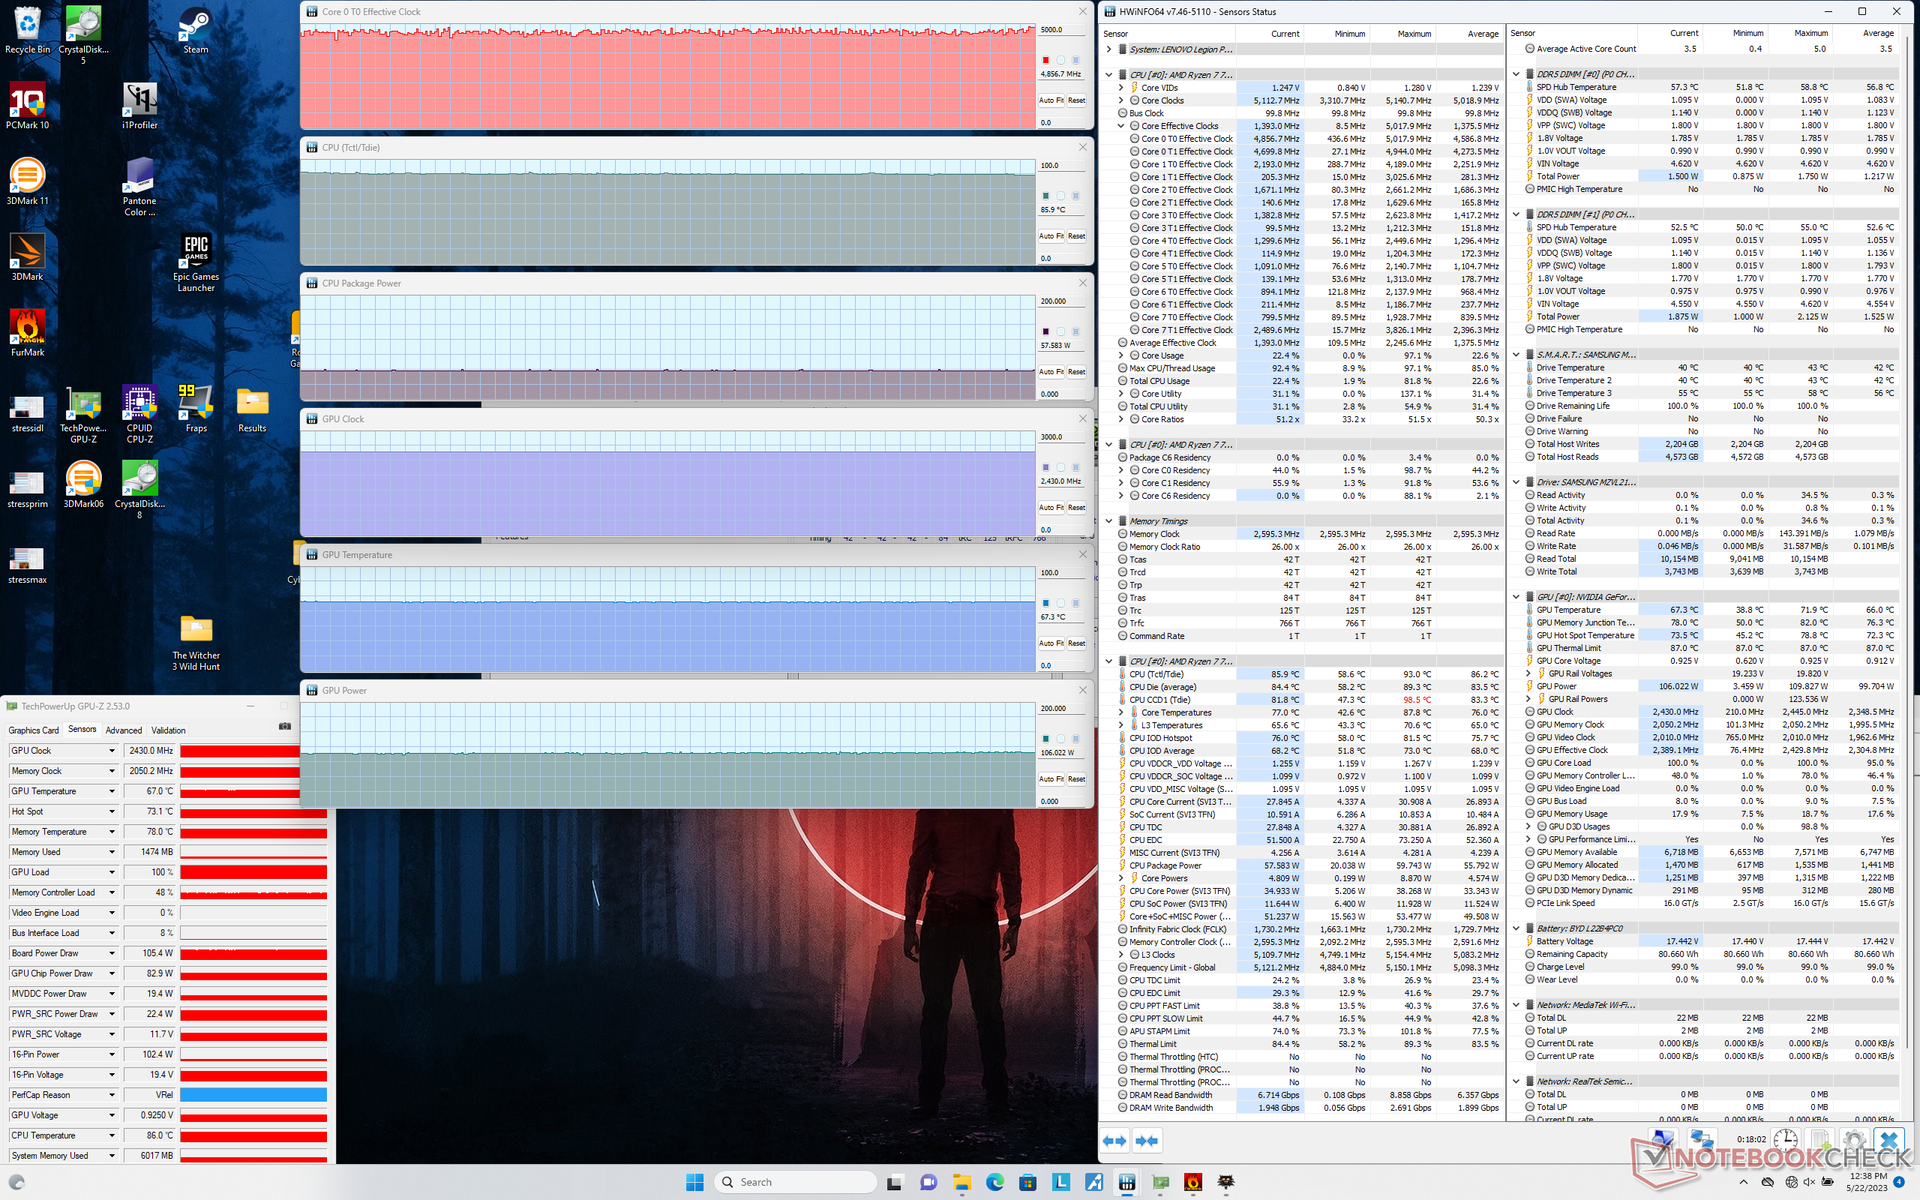
Le dGPU se stabilise à 2430 MHz pour le cœur, 2050 MHz pour la mémoire, 67 C et 105 W pour un TGP cible de 140 W en mode Performance Witcher 3 en mode Performance. La RTX 4060 dans le modèle Intel Legion se stabiliserait également entre 105 W et 110 W puisque les deux GPU sont dans des enveloppes de puissance similaires malgré leurs différences de performance. Jouer en mode Balanced avec la fonction GPU Overclock désactivée se traduirait par une horloge GPU plus lente de 1965 MHz et une consommation d'énergie de la carte beaucoup plus faible de seulement 80 W. Le déficit de performance entre les modes Balanced et Performance est d'environ 10 à 15 pour cent, comme mentionné ci-dessus.
L'utilisation de la batterie réduit les performances. Un test Fire Strike sur batterie donnerait des scores en physique et en graphique de 10865 et 9334 points, respectivement, contre 11477 et 12617 points sur secteur.
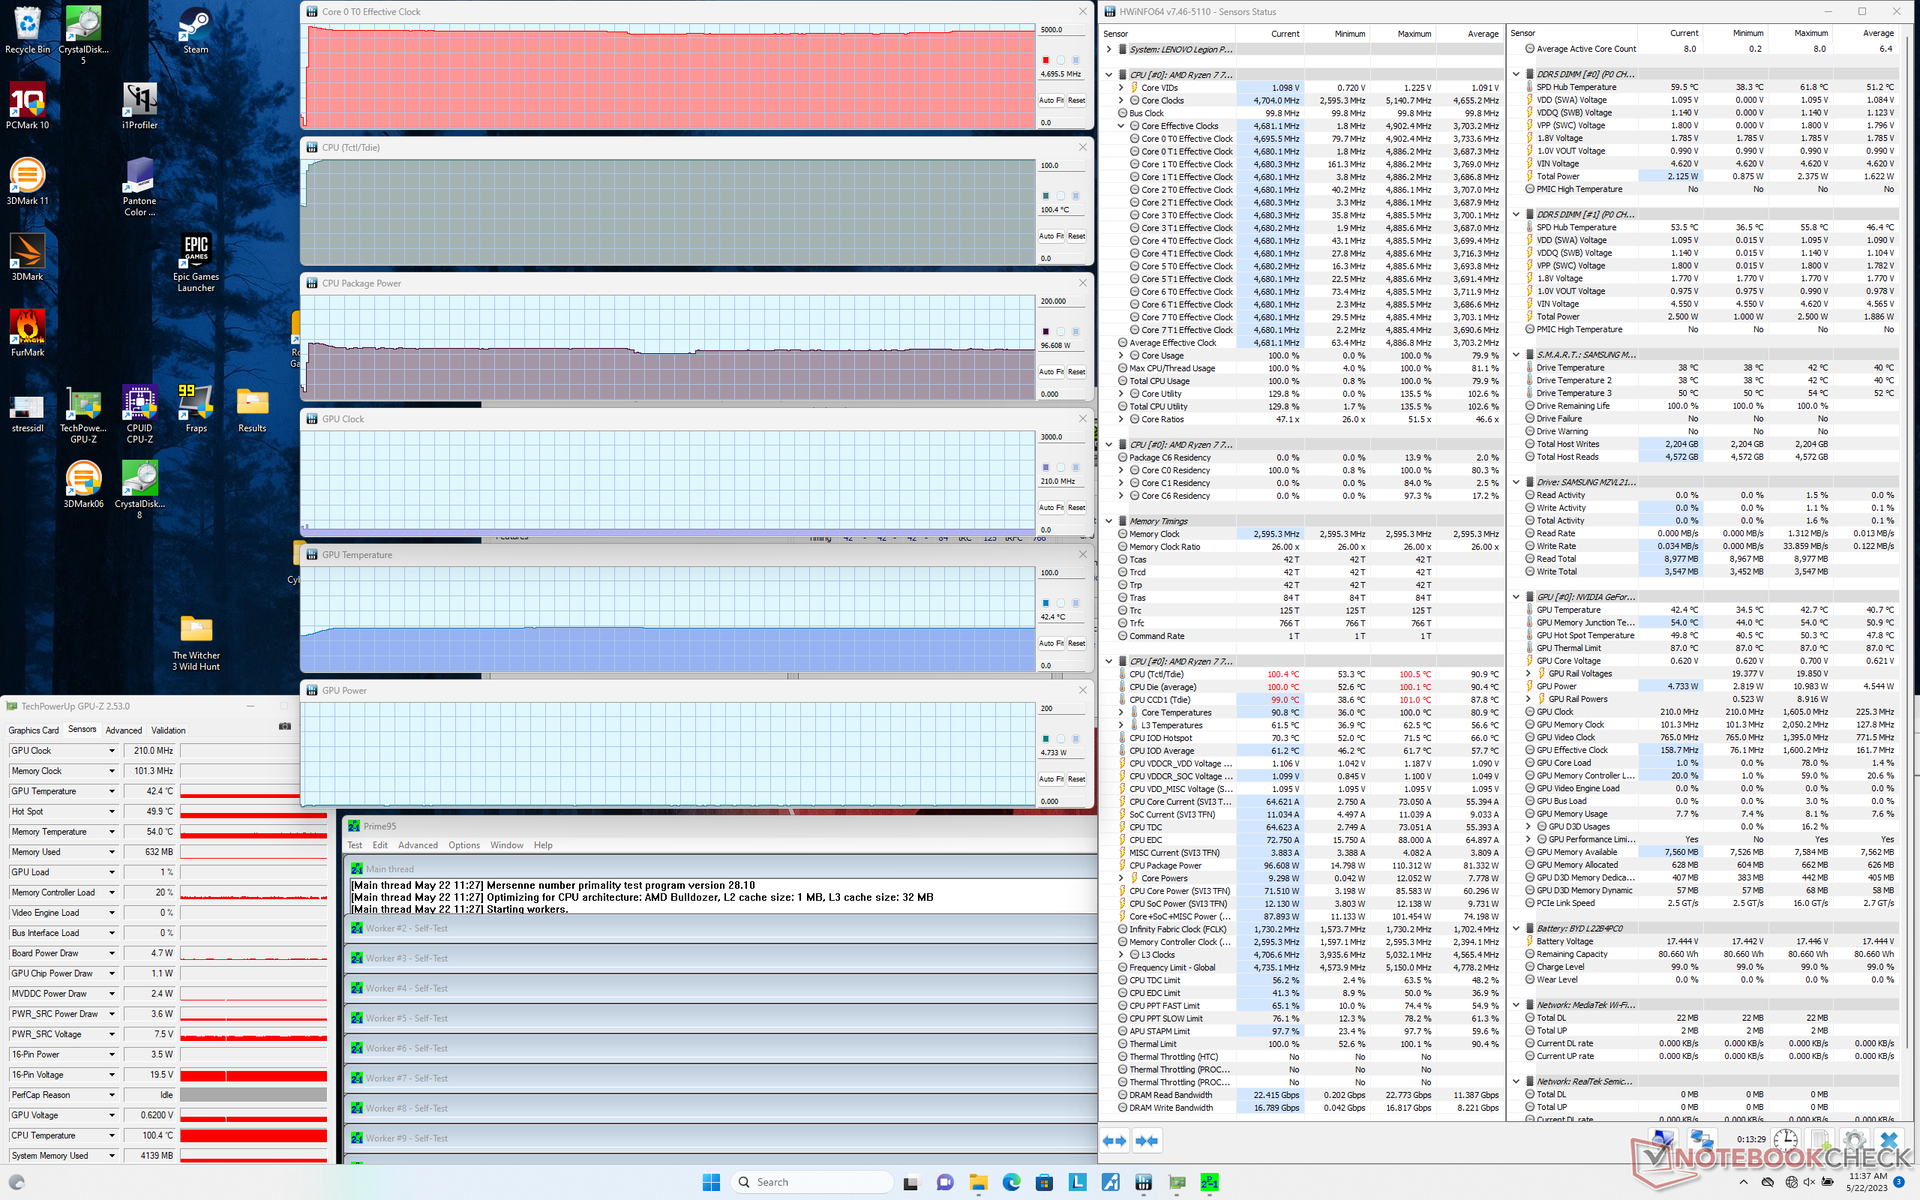
| Horloge du CPU (GHz) | Horloge du GPU (MHz) | Température moyenne du CPU (°C) | Température moyenne du GPU (°C) | |
| Système en veille | -- | -- | 53 | 35 |
| Prime95 Stress | 4.6 - 4.7 | -- | 100 | 42 |
| Prime95 + FurMark Stress | 3.7 - 4.3 | 2250 | 92 - 100 | 69 |
| Witcher 3 Stress(mode Performance) | 4.9 | 2430 | 86 | 67 |
| Witcher 3 Stress (mode équilibré) | 3.1 | 1965 | 84 | 62 |
Intervenants
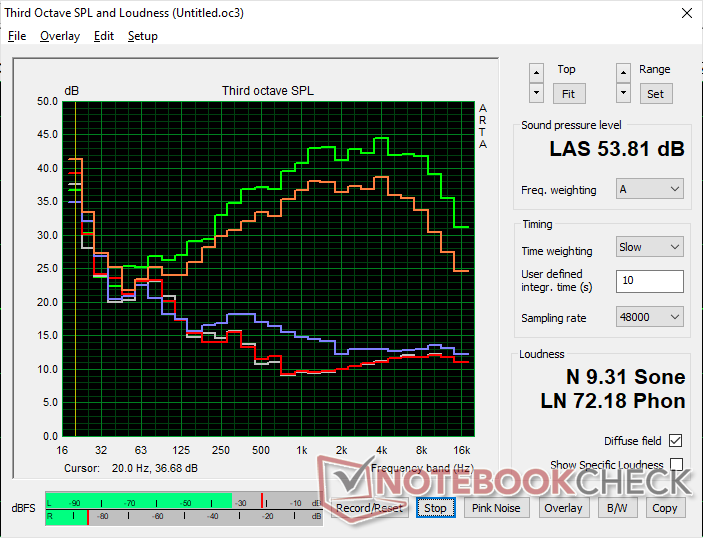
Lenovo Legion Pro 5 16ARX8 analyse audio
(±) | le niveau sonore du haut-parleur est moyen mais bon (80.9# dB)
Basses 100 - 315 Hz
(-) | presque aucune basse - en moyenne 24% plus bas que la médiane
(±) | la linéarité des basses est moyenne (13.4% delta à la fréquence précédente)
Médiums 400 - 2000 Hz
(+) | médiane équilibrée - seulement 4.7% de la médiane
(+) | les médiums sont linéaires (6.2% delta à la fréquence précédente)
Aiguës 2 - 16 kHz
(+) | des sommets équilibrés - à seulement 2.5% de la médiane
(+) | les aigus sont linéaires (6.2% delta à la fréquence précédente)
Globalement 100 - 16 000 Hz
(±) | la linéarité du son global est moyenne (21.9% de différence avec la médiane)
Par rapport à la même classe
» 79% de tous les appareils testés de cette catégorie étaient meilleurs, 6% similaires, 16% pires
» Le meilleur avait un delta de 6%, la moyenne était de 18%, le pire était de 132%.
Par rapport à tous les appareils testés
» 63% de tous les appareils testés étaient meilleurs, 7% similaires, 30% pires
» Le meilleur avait un delta de 4%, la moyenne était de 23%, le pire était de 134%.
Apple MacBook Pro 16 2021 M1 Pro analyse audio
(+) | les haut-parleurs peuvent jouer relativement fort (84.7# dB)
Basses 100 - 315 Hz
(+) | bonne basse - seulement 3.8% loin de la médiane
(+) | les basses sont linéaires (5.2% delta à la fréquence précédente)
Médiums 400 - 2000 Hz
(+) | médiane équilibrée - seulement 1.3% de la médiane
(+) | les médiums sont linéaires (2.1% delta à la fréquence précédente)
Aiguës 2 - 16 kHz
(+) | des sommets équilibrés - à seulement 1.9% de la médiane
(+) | les aigus sont linéaires (2.7% delta à la fréquence précédente)
Globalement 100 - 16 000 Hz
(+) | le son global est linéaire (4.6% différence à la médiane)
Par rapport à la même classe
» 0% de tous les appareils testés de cette catégorie étaient meilleurs, 0% similaires, 100% pires
» Le meilleur avait un delta de 5%, la moyenne était de 17%, le pire était de 45%.
Par rapport à tous les appareils testés
» 0% de tous les appareils testés étaient meilleurs, 0% similaires, 100% pires
» Le meilleur avait un delta de 4%, la moyenne était de 23%, le pire était de 134%.
Gestion de l'énergie
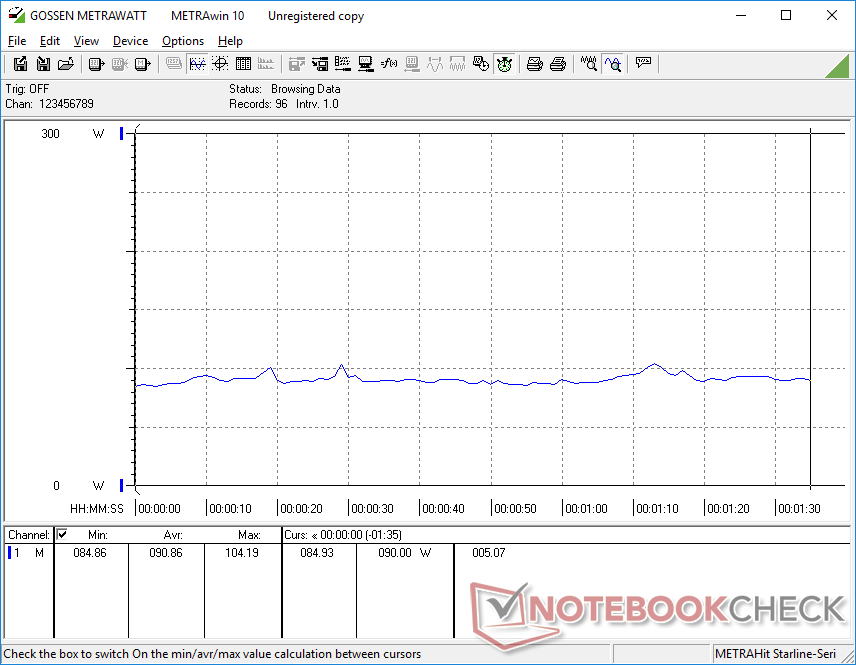
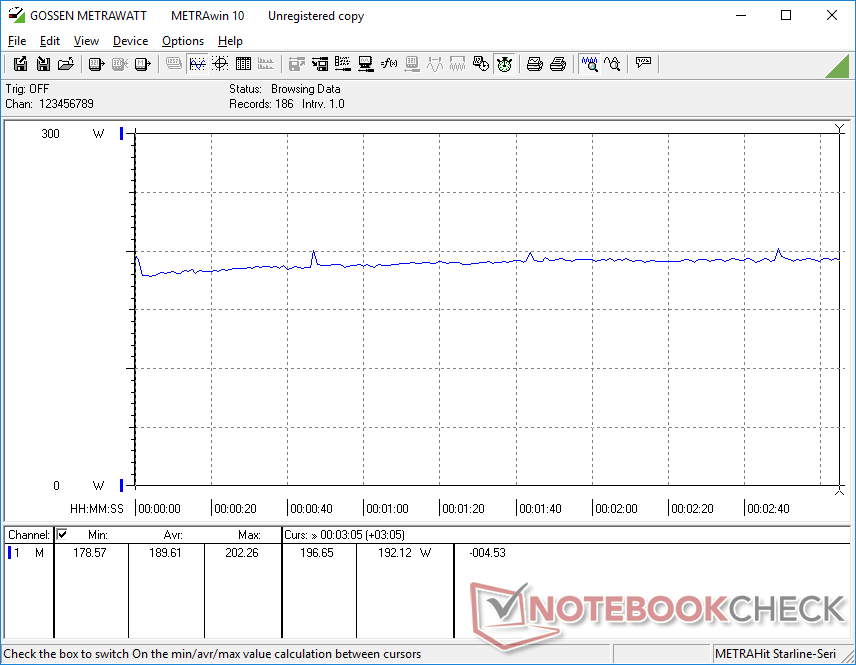
Consommation d'énergie - Boost du processeur inférieur à celui du Core i7-13700HX
Le modèle AMD est plus économe en énergie que le modèle Intel lorsqu'il tourne au ralenti sur l'ordinateur de bureau. Sinon, les deux modèles demandent à peu près la même quantité d'énergie lorsqu'ils fonctionnent à des charges plus élevées, comme les jeux. Les deux modèles sont également livrés avec le même adaptateur secteur de 300 W qui fournit plus qu'assez de marge pour le GPU de ~140 W et le CPU de ~100 W.
Il est intéressant de noter que le Core i7-13700HX du modèle Intel peut atteindre une consommation de 159 W contre 110 W pour notre Ryzen 7 7745HX, ce qui expliquerait en partie son avantage sur le CPU AMD en termes de performances. Cependant, lorsque les taux d'horloge Turbo Boost se calment après quelques minutes de stress, la consommation d'énergie entre les deux modèles devient beaucoup plus proche, comme le montrent les graphiques de comparaison ci-dessous. Par exemple, en exécutant Prime95 pendant quelques minutes, les modèles Intel et AMD se stabilisent à 158 W et 149 W, respectivement, même si le modèle Intel peut atteindre 220 W au début du test.
| Éteint/en veille | |
| Au repos | |
| Fortement sollicité |
|
Légende:
min: | |
| Lenovo Legion Pro 5 16ARX8 R7 7745HX, GeForce RTX 4070 Laptop GPU, Samsung PM9A1 MZVL21T0HCLR, IPS, 2560x1600, 16" | Lenovo Legion Pro 5 16IRX8 i7-13700HX, GeForce RTX 4060 Laptop GPU, SK hynix PC801 HFS512GEJ9X115N, IPS, 2560x1600, 16" | Uniwill GM6PX7X RTX 4070 i7-13700HX, GeForce RTX 4070 Laptop GPU, Samsung PM9A1 MZVL2512HCJQ, IPS, 2560x1600, 16" | Schenker XMG Neo 16 E23 i9-13900HX, GeForce RTX 4090 Laptop GPU, Crucial P5 Plus 1TB CT1000P5PSSD8, IPS, 2560x1600, 16" | Asus ROG Strix G16 G614JZ i9-13980HX, GeForce RTX 4080 Laptop GPU, WD PC SN560 SDDPNQE-1T00, IPS, 2560x1600, 16" | Asus Zephyrus Duo 16 GX650PY-NM006W R9 7945HX, GeForce RTX 4090 Laptop GPU, SK hynix PC801 HFS002TEJ9X101N, MiniLED, 2560x1600, 16" | |
|---|---|---|---|---|---|---|
| Power Consumption | -46% | -13% | -23% | -17% | -51% | |
| Idle Minimum * (Watt) | 8.1 | 24.5 -202% | 12.6 -56% | 8 1% | 10 -23% | 19.2 -137% |
| Idle Average * (Watt) | 15.9 | 29.2 -84% | 17.7 -11% | 18 -13% | 16 -1% | 29.7 -87% |
| Idle Maximum * (Watt) | 37.2 | 34.3 8% | 31.8 15% | 28 25% | 27 27% | 30.8 17% |
| Load Average * (Watt) | 90.9 | 98.7 -9% | 101.4 -12% | 133 -46% | 129 -42% | 126 -39% |
| Witcher 3 ultra * (Watt) | 189.6 | 178.6 6% | 185.3 2% | 294 -55% | 247 -30% | 258 -36% |
| Load Maximum * (Watt) | 263.5 | 249.6 5% | 298 -13% | 399 -51% | 342 -30% | 330 -25% |
* ... Moindre est la valeur, meilleures sont les performances
Power Consumption Witcher 3 / Stresstest
Power Consumption external Monitor
Autonomie de la batterie
L'autonomie du WLAN est légèrement supérieure à celle de la version Intel, d'environ 30 minutes, lorsqu'il est réglé sur le profil d'alimentation équilibré et que l'iGPU est actif. Bien que ce ne soit pas mauvais pour un ordinateur portable de jeu, des alternatives comme le Schenker XMG Neo 16 ou l'Asus ROG Strix G16 sont plus efficaces.Asus ROG Strix G16 ont des batteries de plus grande capacité et des durées d'utilisation plus longues, de plus de deux heures chacune.
La charge de la batterie vide à la batterie pleine avec l'adaptateur secteur inclus est rapide : 1 heure à 1,5 heure. La charge rapide est activée par défaut, contrairement aux anciens modèles Legion ou Yoga où elle peut être désactivée. Le chargement avec des adaptateurs USB-C tiers n'est pris en charge que sur le port USB-C situé à l'arrière.
| Lenovo Legion Pro 5 16ARX8 R7 7745HX, GeForce RTX 4070 Laptop GPU, 80 Wh | Lenovo Legion Pro 5 16IRX8 i7-13700HX, GeForce RTX 4060 Laptop GPU, 80 Wh | Uniwill GM6PX7X RTX 4070 i7-13700HX, GeForce RTX 4070 Laptop GPU, 62 Wh | Schenker XMG Neo 16 E23 i9-13900HX, GeForce RTX 4090 Laptop GPU, 99 Wh | Asus ROG Strix G16 G614JZ i9-13980HX, GeForce RTX 4080 Laptop GPU, 90 Wh | Asus Zephyrus Duo 16 GX650PY-NM006W R9 7945HX, GeForce RTX 4090 Laptop GPU, 90 Wh | |
|---|---|---|---|---|---|---|
| Autonomie de la batterie | -14% | 0% | 68% | 76% | 0% | |
| Reader / Idle (h) | 6.5 | 6.7 3% | ||||
| WiFi v1.3 (h) | 4 | 3.4 -15% | 4 0% | 6.7 68% | 9.7 142% | 4 0% |
| Load (h) | 1 | 0.7 -30% | 1.1 10% | 1 0% | ||
| H.264 (h) | 5.8 | 3.8 | ||||
| Witcher 3 ultra (h) | 1.4 |
Points positifs
Points négatifs
Verdict - AMD est la meilleure option pour les joueurs
Lenovo propose deux options très intéressantes : L'Intel Core i7-13700HX Legion Pro 5 16 avec la carte graphique RTX 4060 pour 1600 USD ou l'AMD Ryzen 7 7745HX Legion Pro 5 16 avec la carte graphique RTX 4070 - également pour 1600 USD. Le premier offre des performances CPU environ 10 % plus rapides au prix de performances GPU 15 % plus lentes, tandis que le second fait l'inverse. Presque tout le reste des deux options est identique puisqu'elles partagent toutes deux le même design de châssis. Ainsi, les utilisateurs qui privilégient les performances du CPU par rapport à celles du GPU préféreront l'option Intel, tandis que ceux qui accordent plus d'importance au GPU opteront pour l'option AMD.
Le Legion Pro 5 16 étant avant tout un ordinateur portable de jeu, la majorité des utilisateurs choisiront l'option AMD pour la carte graphique RTX 4070 plus rapide. Presque tous les jeux les plus récents sont liés au GPU et donc tout avantage supplémentaire au niveau des performances du CPU par rapport au Ryzen 7 7745HX n'aurait qu'un impact minime sur l'expérience de jeu. Dans ce scénario, le prix relativement élevé de 1600$ est mieux justifié car les utilisateurs obtiennent une RTX 4070 au lieu d'une RTX 4060 plus lente.
Prix et disponibilité
Lenovo livre actuellement son Legion Pro 5 16 Gen 8 à partir de $1280 USD pour la configuration Ryzen 5/RTX 4050 de base jusqu'à $1600 pour notre configuration Ryzen 7/RTX 4070. Le modèle n'est pas encore disponible chez les principaux revendeurs comme Best Buy ou Amazon à l'heure où nous écrivons ces lignes.
Lenovo Legion Pro 5 16ARX8
- 05/24/2023 v7 (old)
Allen Ngo
Transparency
La sélection des appareils à examiner est effectuée par notre équipe éditoriale. L'échantillon de test a été prêté à l'auteur par le fabricant ou le détaillant pour les besoins de cet examen. Le prêteur n'a pas eu d'influence sur cette évaluation et le fabricant n'a pas reçu de copie de cette évaluation avant sa publication. Il n'y avait aucune obligation de publier cet article. En tant que média indépendant, Notebookcheck n'est pas soumis à l'autorité des fabricants, des détaillants ou des éditeurs.
Voici comment Notebookcheck teste
Chaque année, Notebookcheck examine de manière indépendante des centaines d'ordinateurs portables et de smartphones en utilisant des procédures standardisées afin de garantir que tous les résultats sont comparables. Nous avons continuellement développé nos méthodes de test depuis environ 20 ans et avons établi des normes industrielles dans le processus. Dans nos laboratoires de test, des équipements de mesure de haute qualité sont utilisés par des techniciens et des rédacteurs expérimentés. Ces tests impliquent un processus de validation en plusieurs étapes. Notre système d'évaluation complexe repose sur des centaines de mesures et de points de référence bien fondés, ce qui garantit l'objectivité.Price comparison

