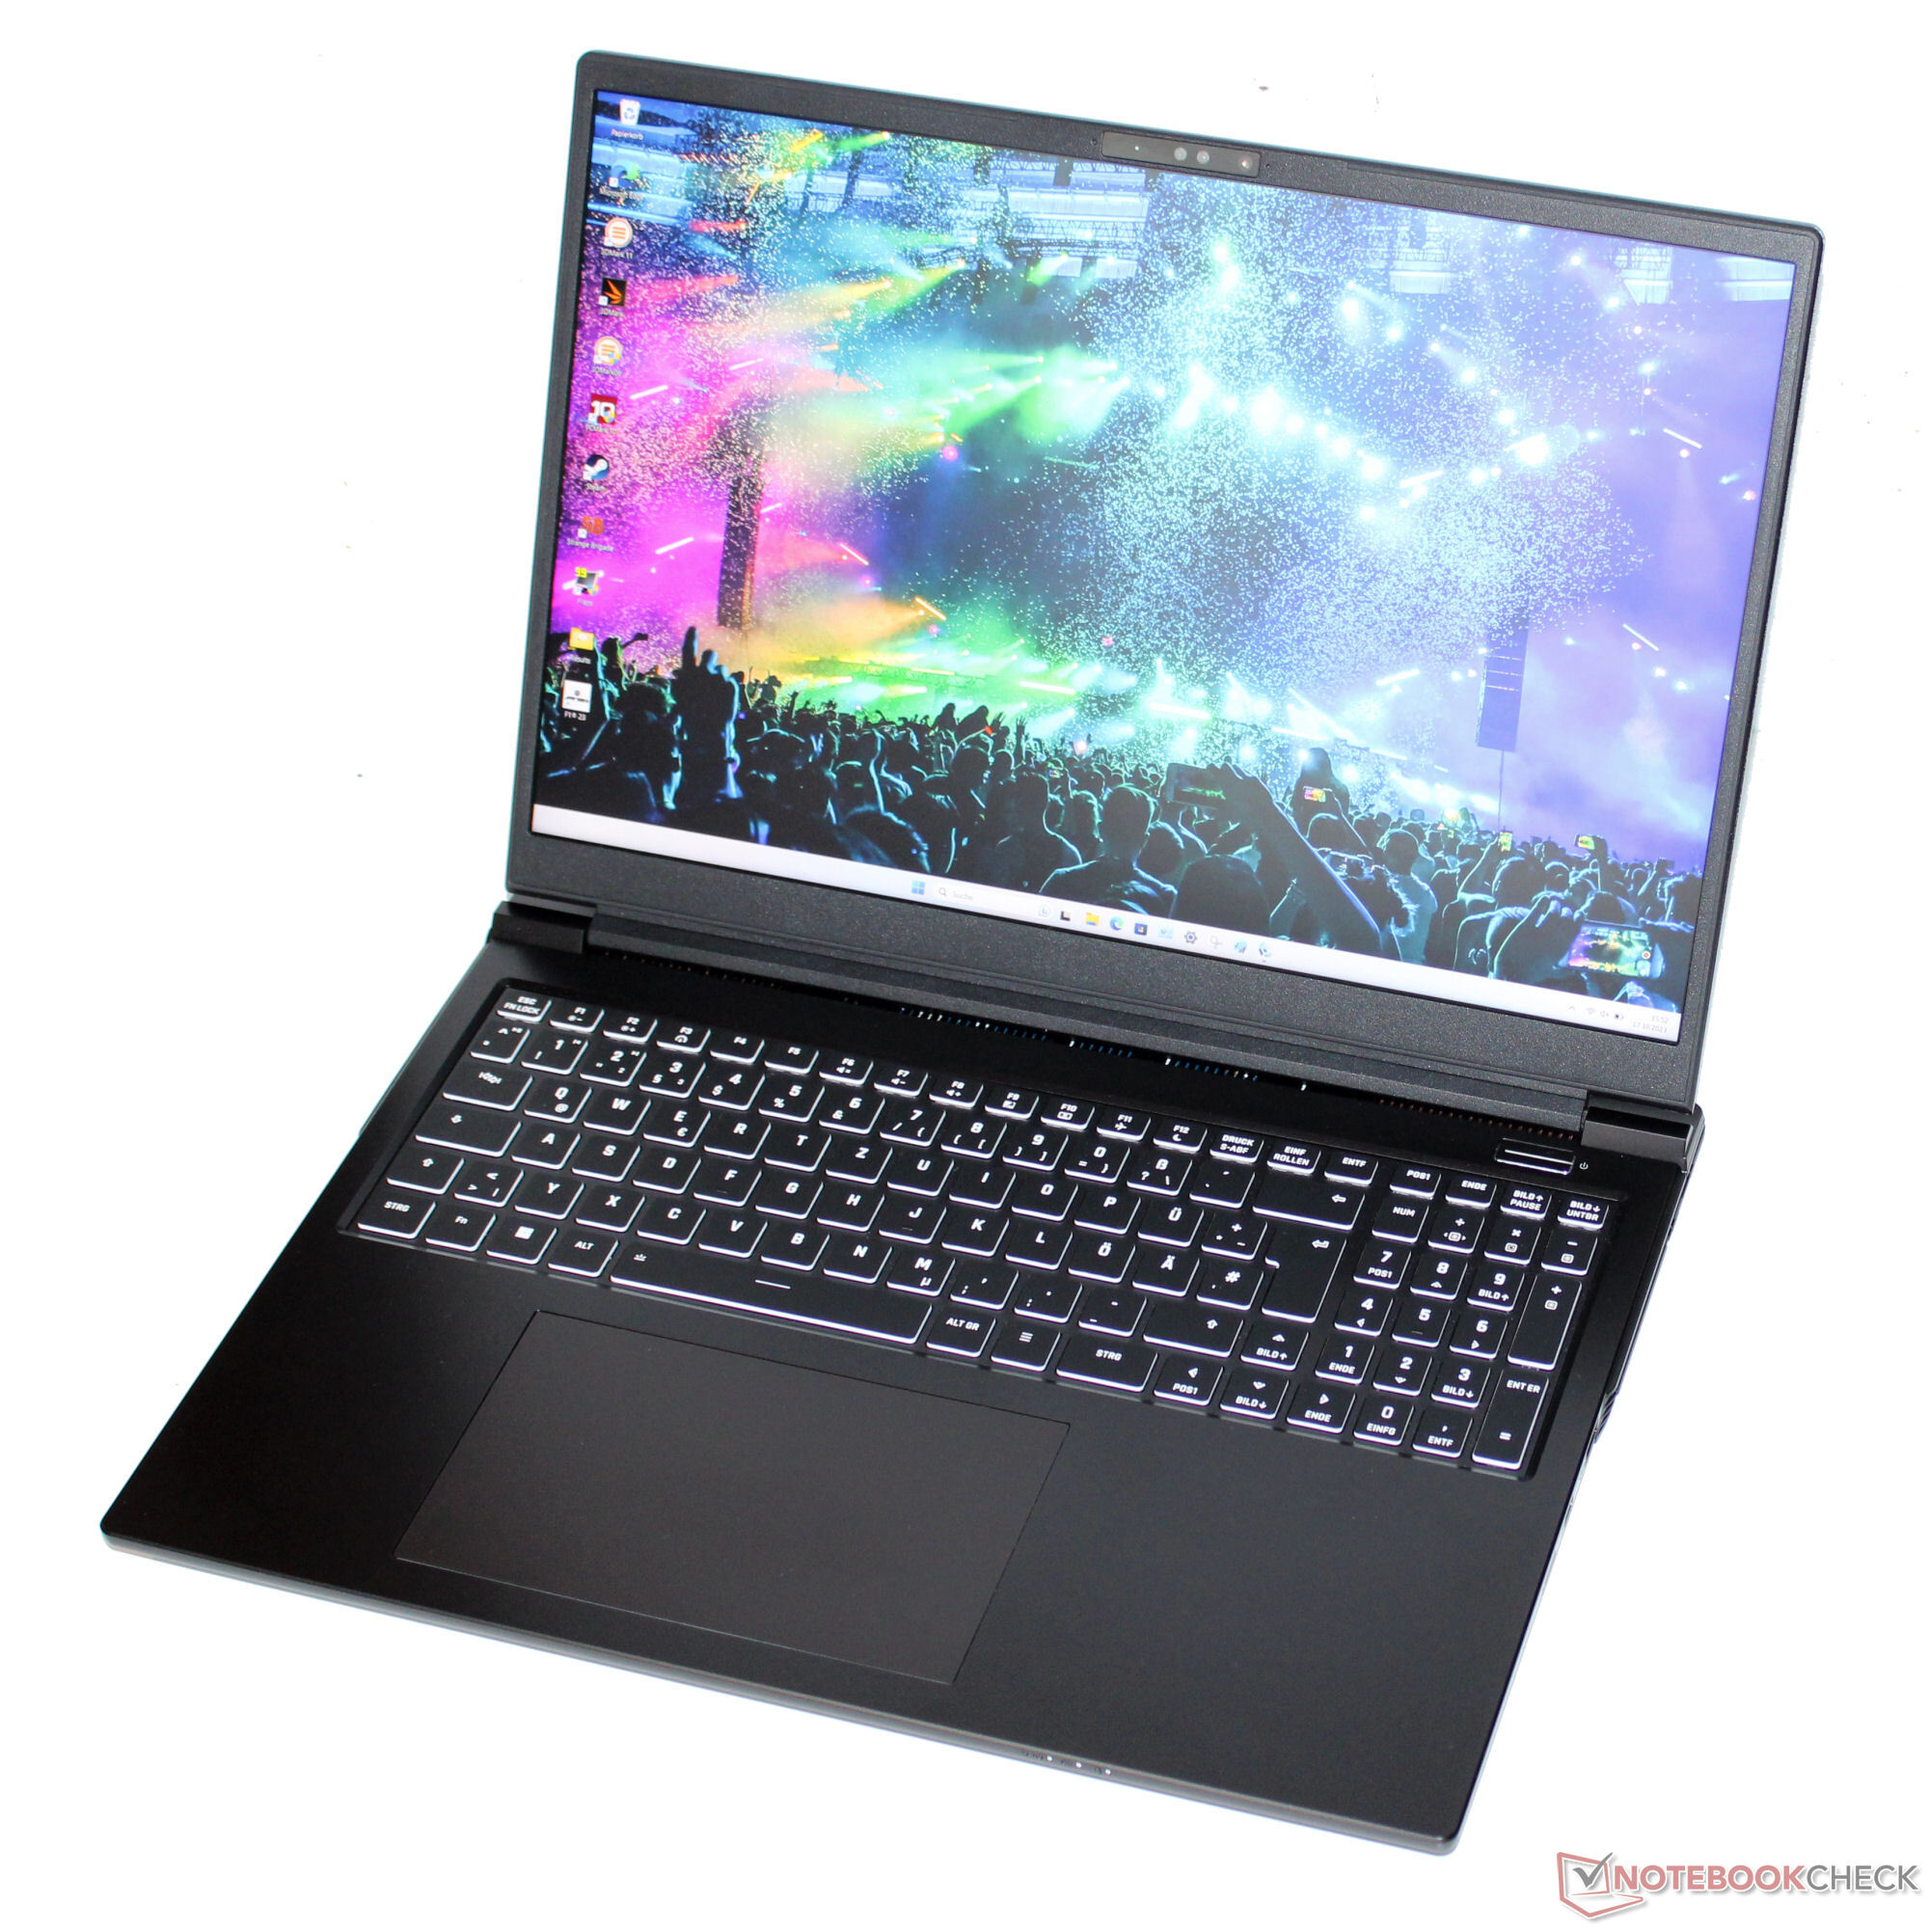
Test du XMG Pro 16 Studio (mi-2023) : PC portable RTX 4070 pour joueurs et créatifs

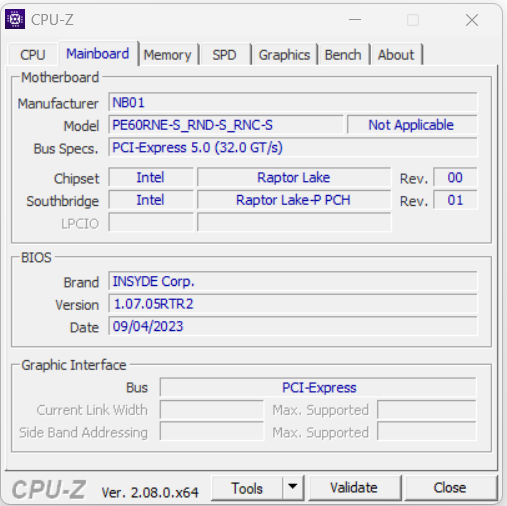
Le XMG Pro 16 Studio (mi 23) - un ordinateur portable de 16 pouces destiné aux joueurs et aux créateurs - est basé sur un barebone (PE60RNE-S) fabriqué par Clevo et la variante actuelle est actuellement disponible pour environ 2 400 dollars. Parmi les concurrents, on trouve leLenovo Legion Slim 7i 16 Gen 8, HP Omen Transcend 16, Asus Vivobook Pro 16X et leMSI Stealth 16 Studio A13VG.
Comparaison avec les concurrents potentiels
Note | Date | Modèle | Poids | Épaisseur | Taille | Résolution | Prix |
|---|---|---|---|---|---|---|---|
| 87.9 % v7 (old) | 10/23 | Schenker XMG Pro 16 Studio (Mid 23) i9-13900H, GeForce RTX 4070 Laptop GPU | 2.6 kg | 19.9 mm | 16.00" | 2560x1600 | |
| 86.2 % v7 (old) | 07/23 | Asus Vivobook Pro 16X K6604JV-MX016W i9-13980HX, GeForce RTX 4060 Laptop GPU | 2.1 kg | 22.8 mm | 16.00" | 3200x2000 | |
| 90 % v7 (old) | 07/23 | Lenovo Legion Slim 7i 16 Gen 8 i9-13900H, GeForce RTX 4070 Laptop GPU | 2.1 kg | 19.9 mm | 16.00" | 2560x1600 | |
| 87.9 % v7 (old) | 08/23 | HP Omen Transcend 16 i9-13900HX, GeForce RTX 4070 Laptop GPU | 2.3 kg | 19.8 mm | 16.00" | 2560x1600 | |
| 88.8 % v7 (old) | 07/23 | MSI Stealth 16 Studio A13VG i7-13700H, GeForce RTX 4070 Laptop GPU | 2 kg | 19.95 mm | 16.00" | 2560x1600 |
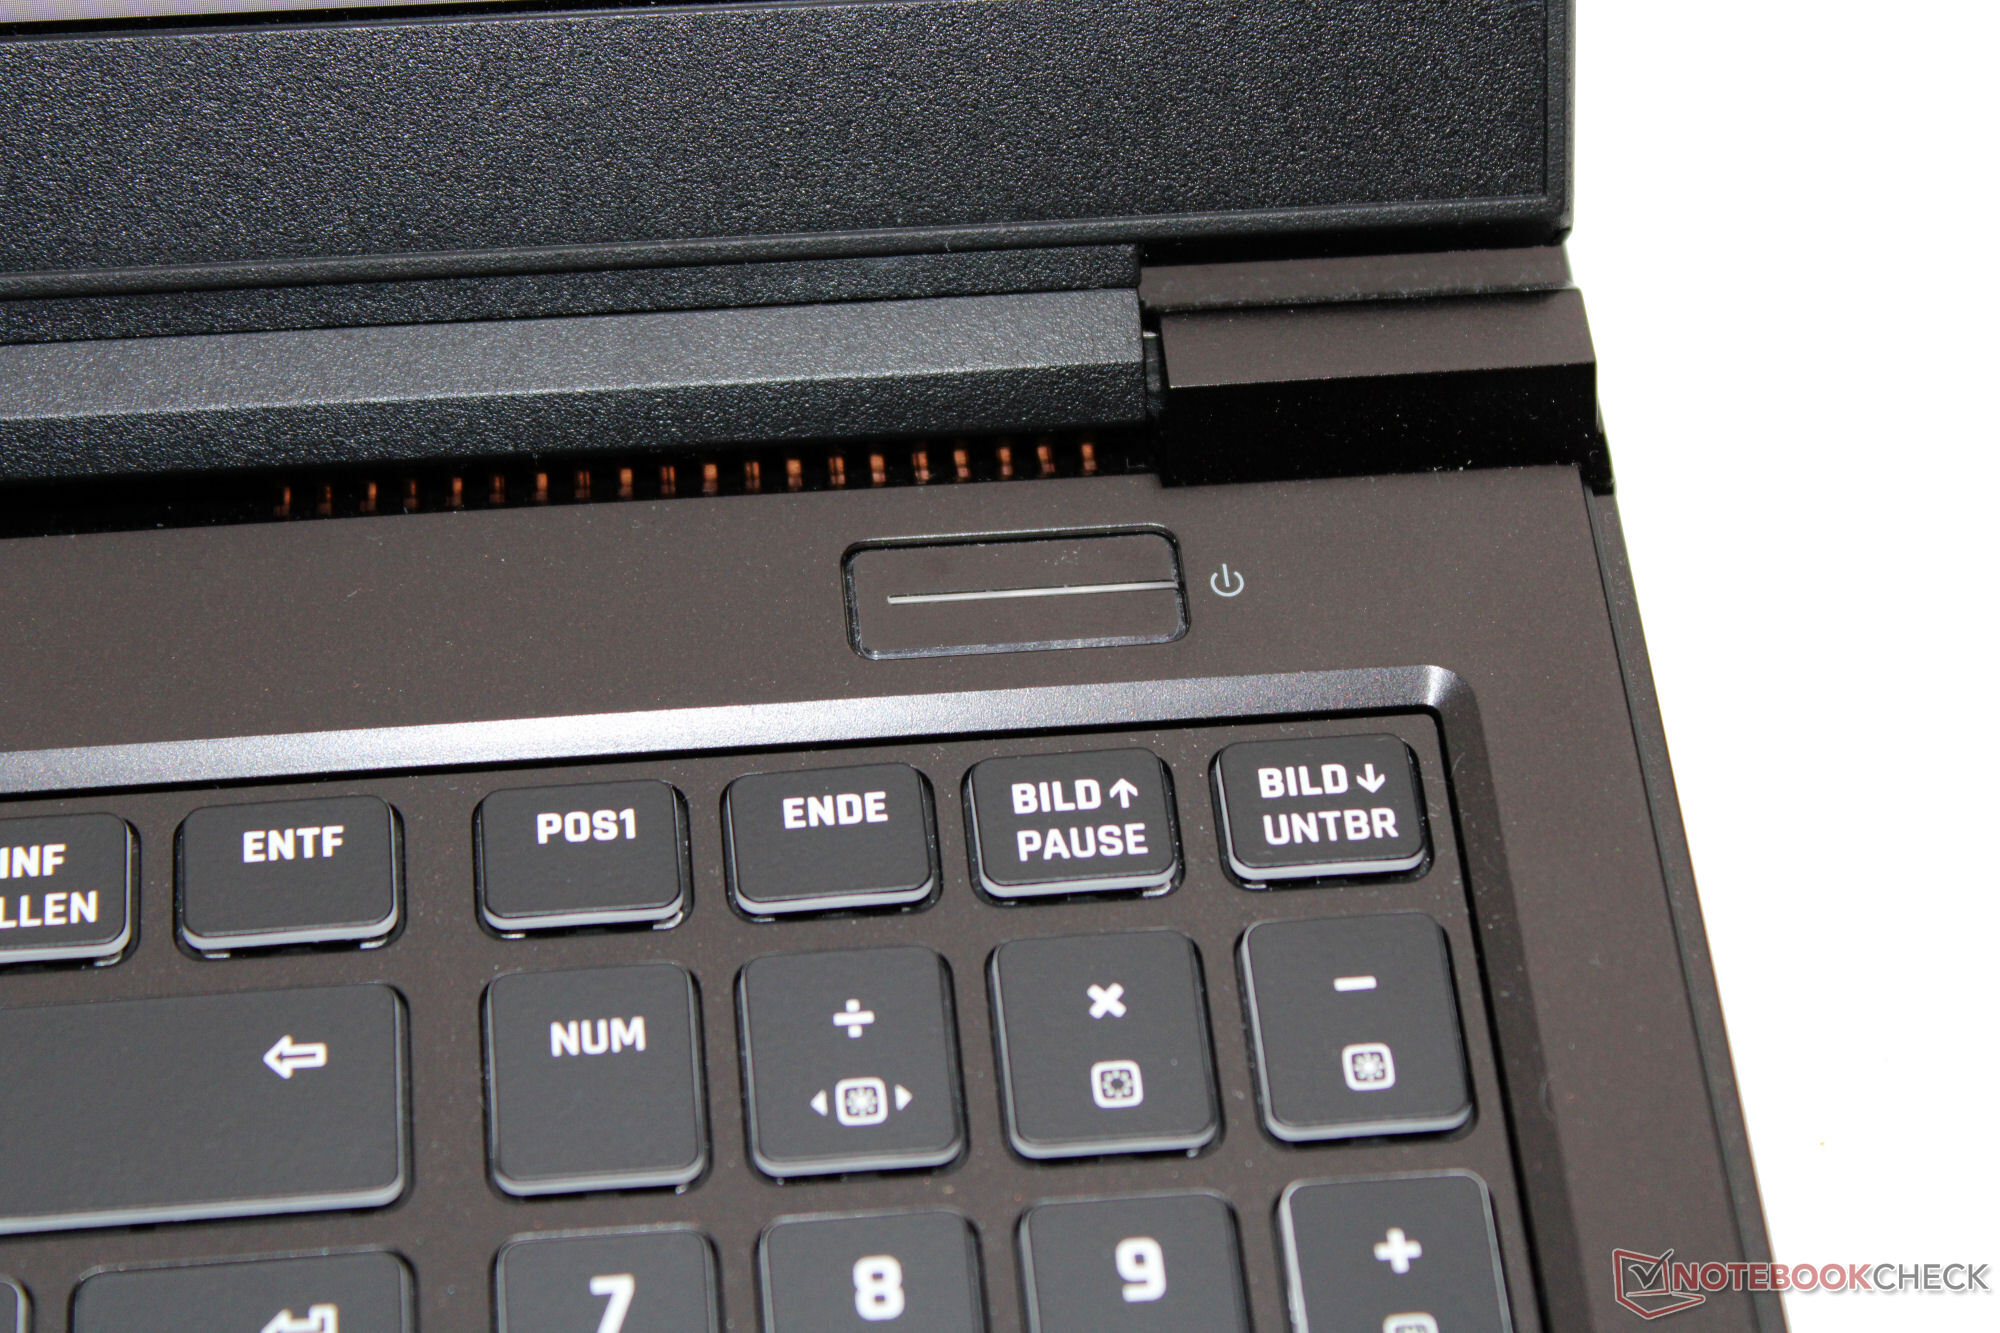
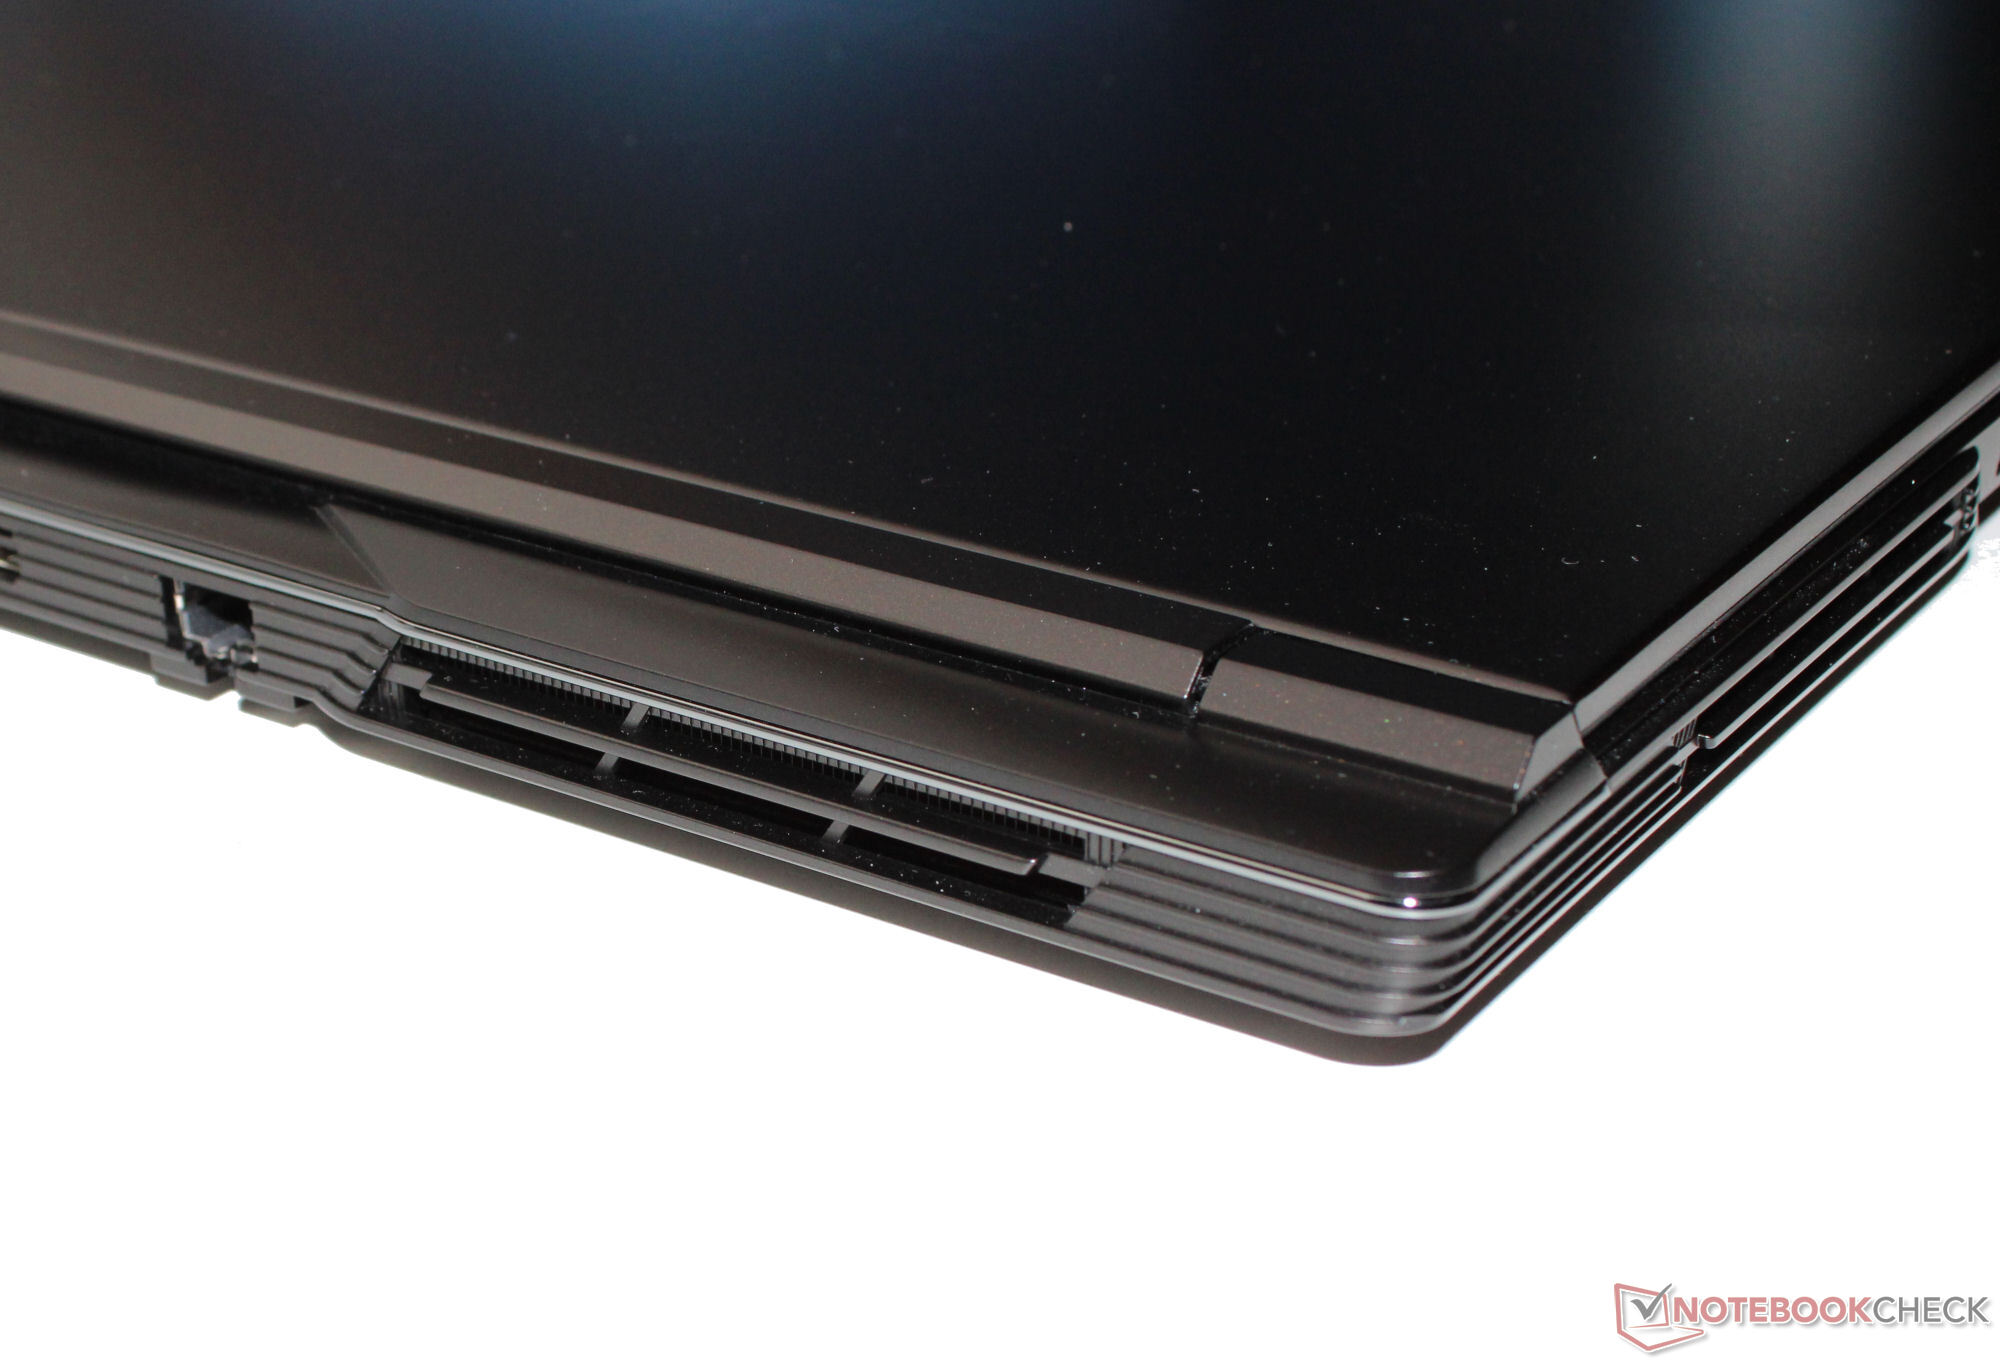
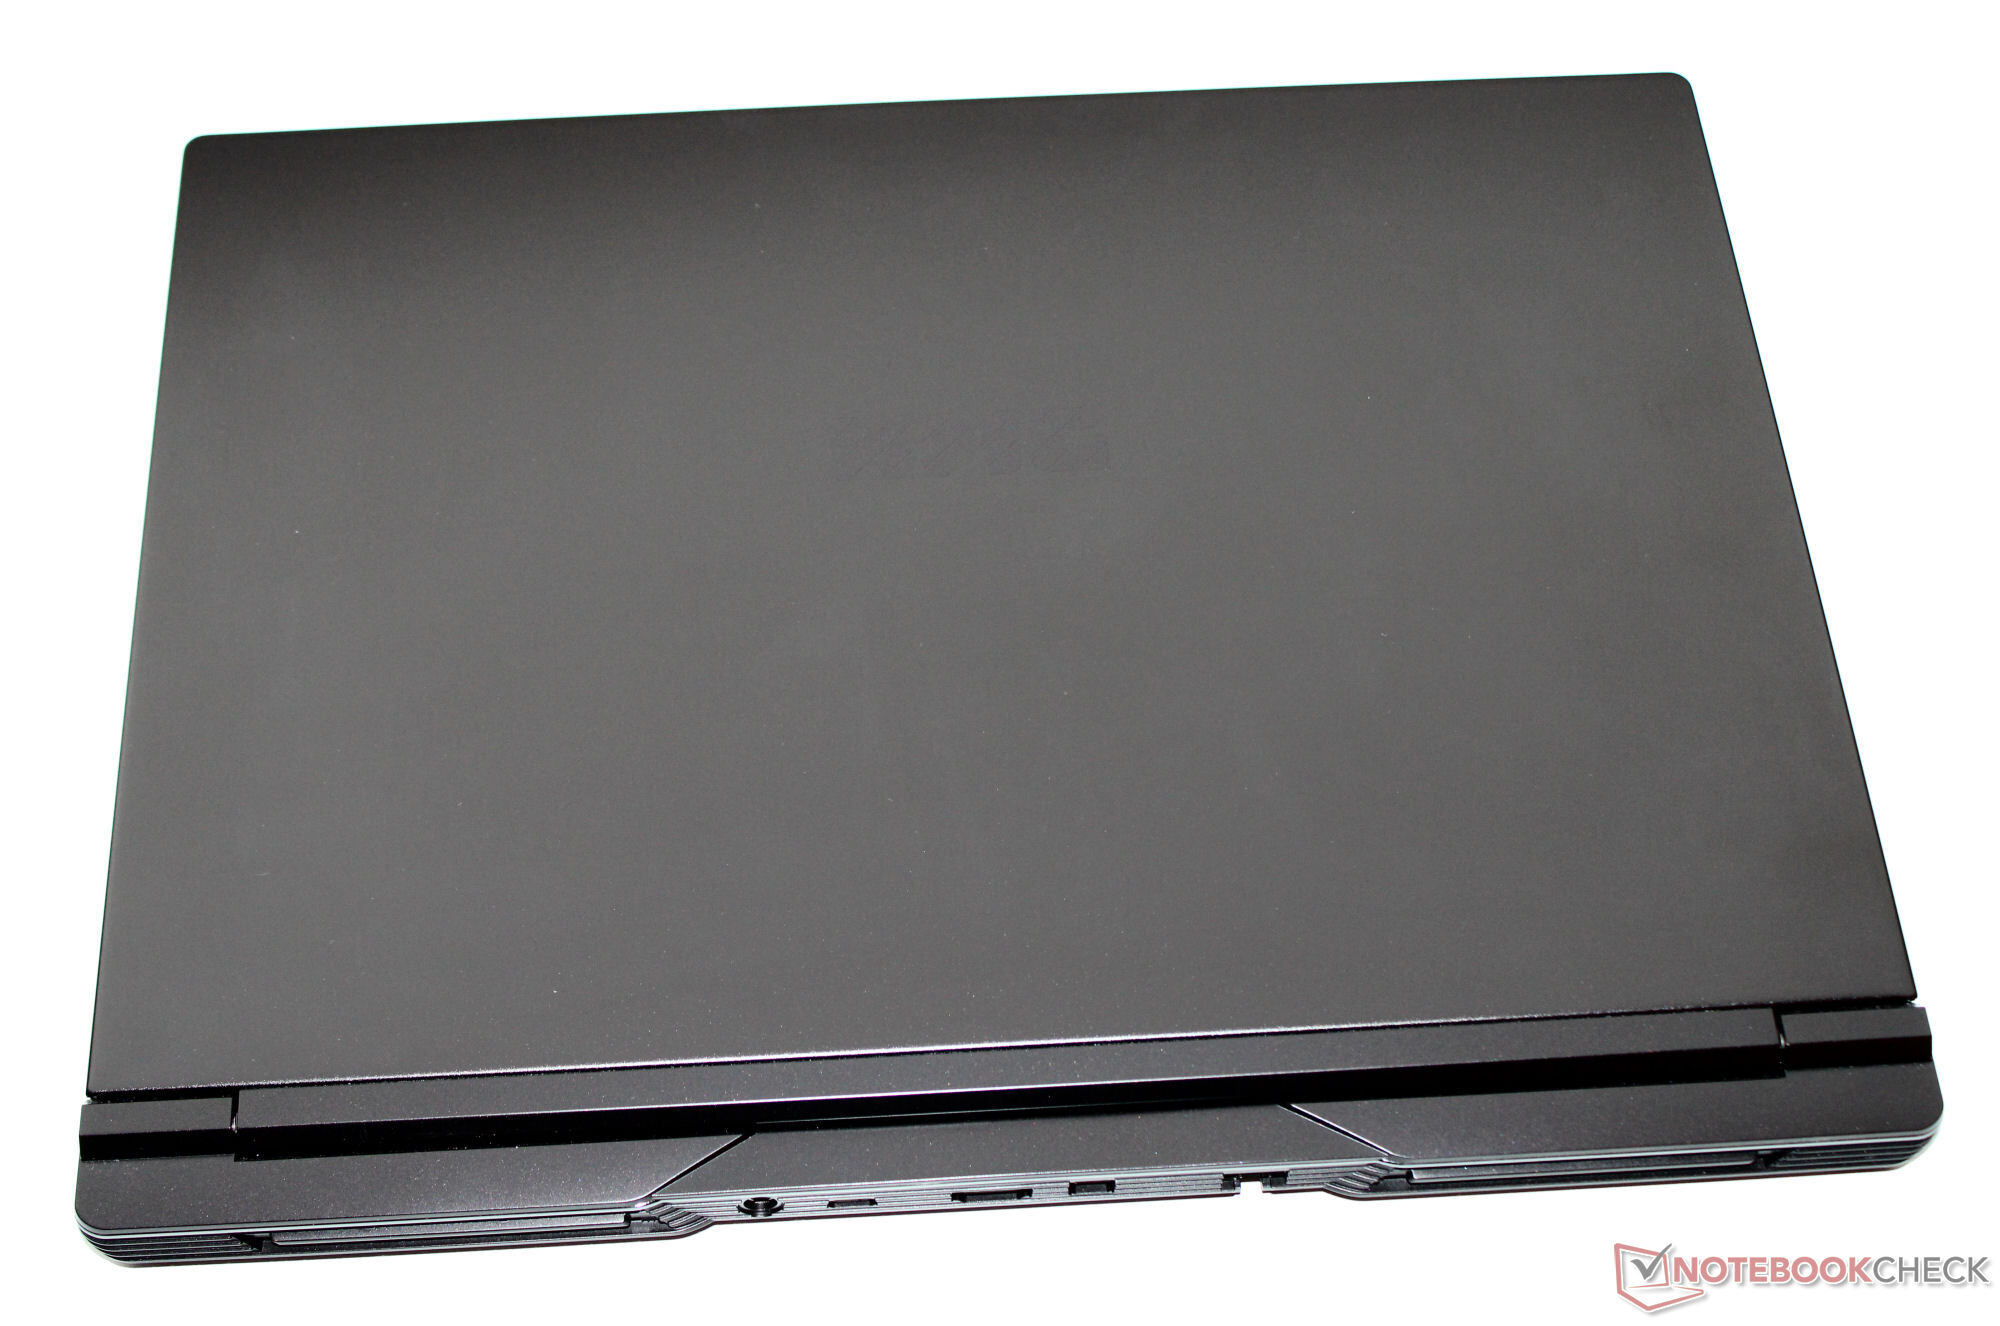
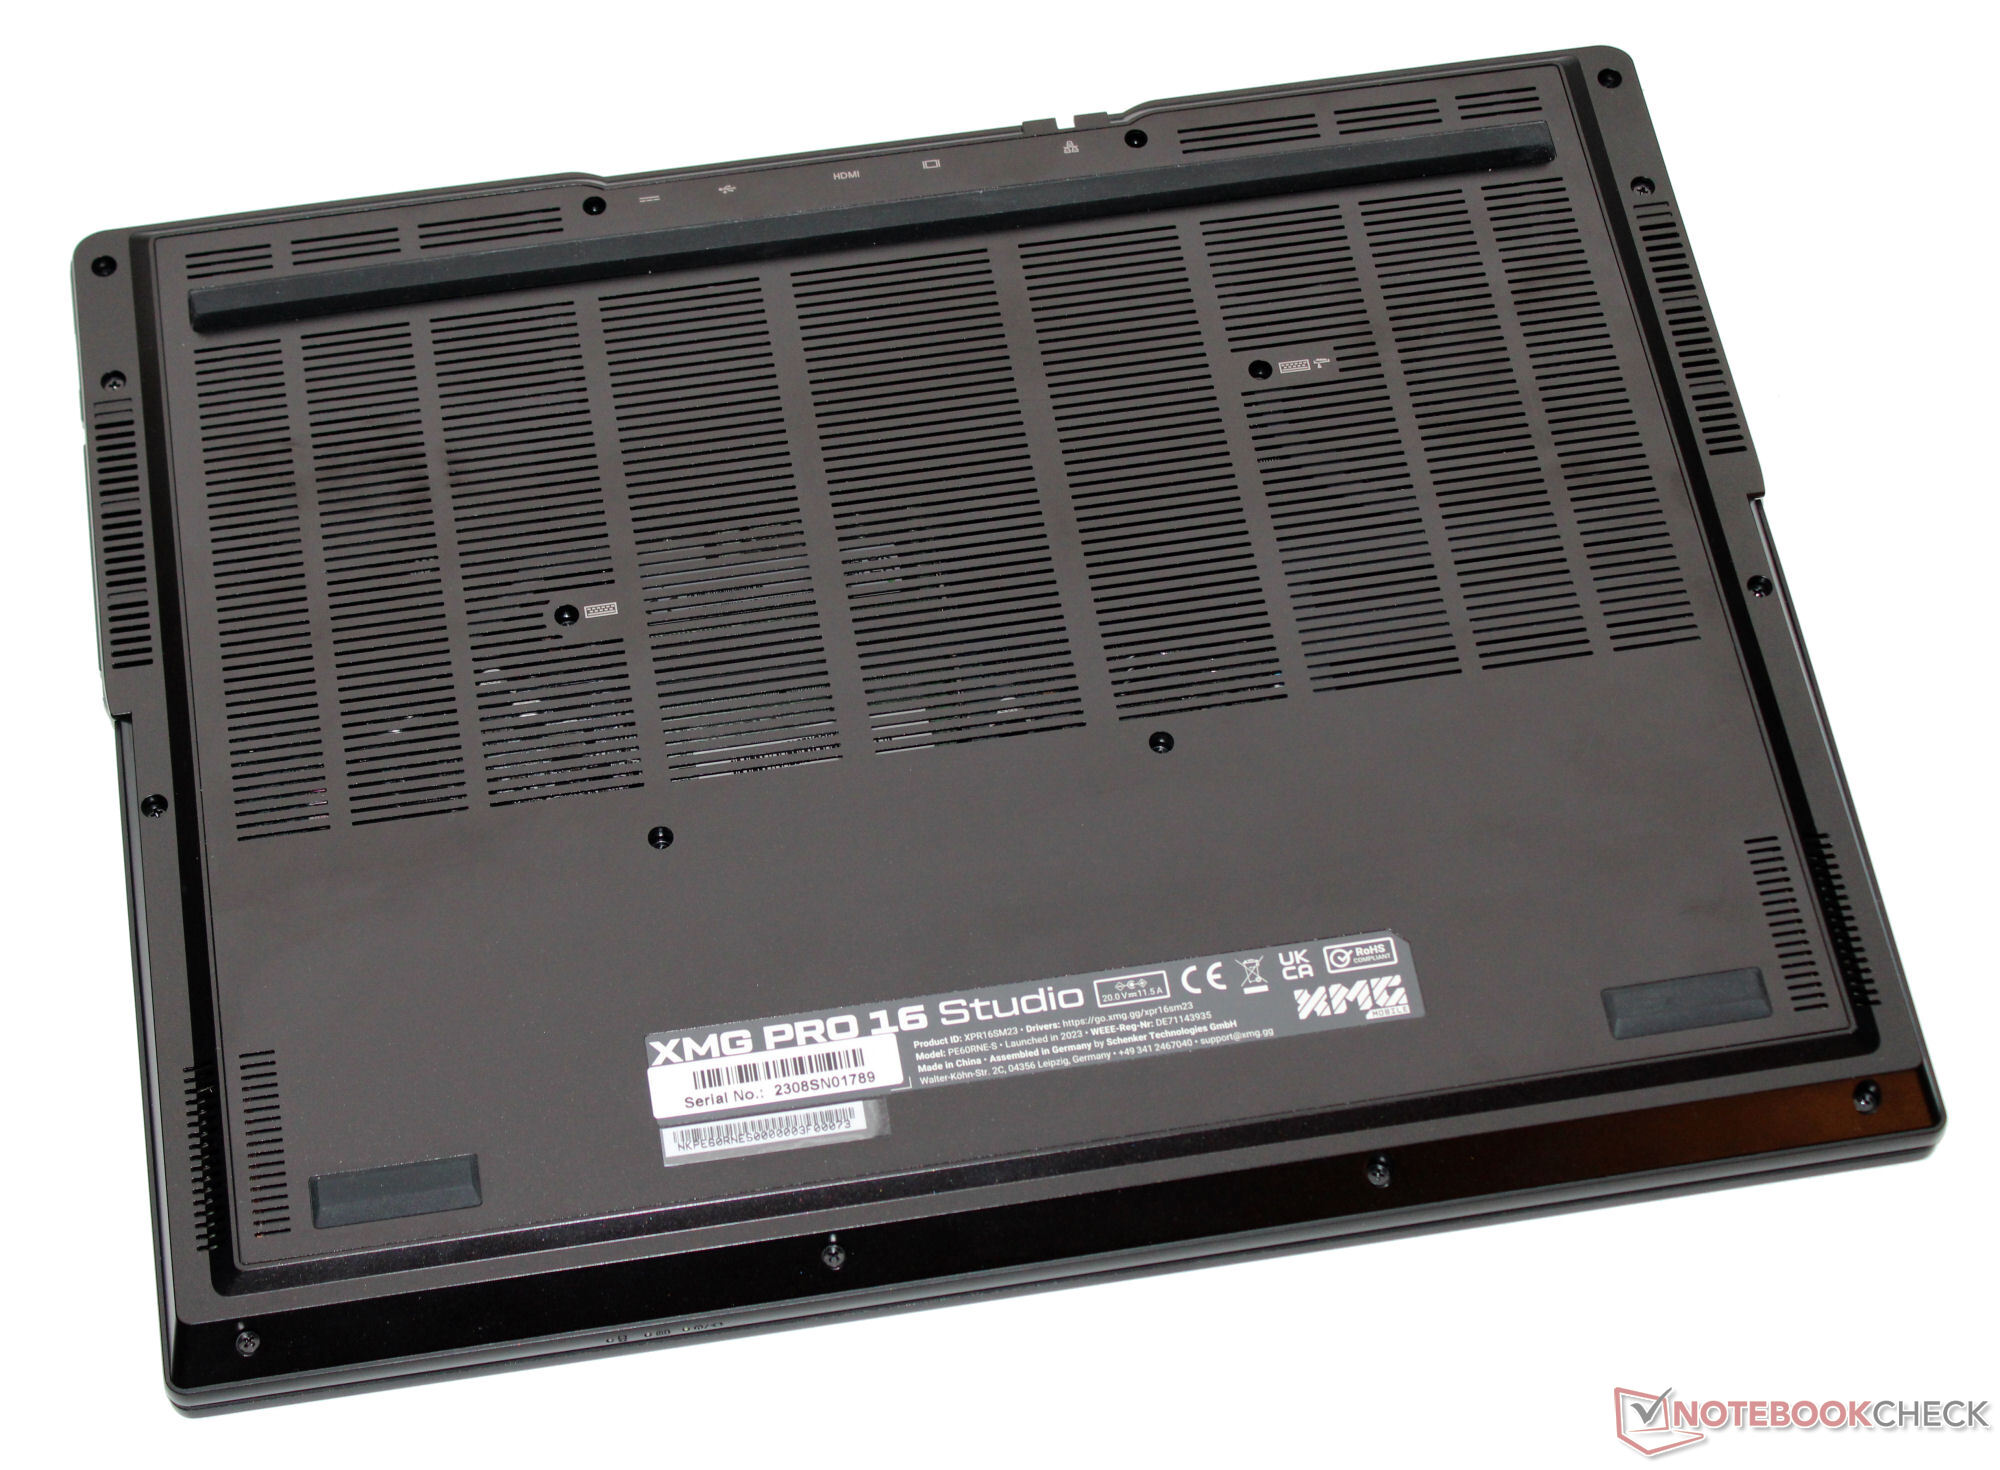
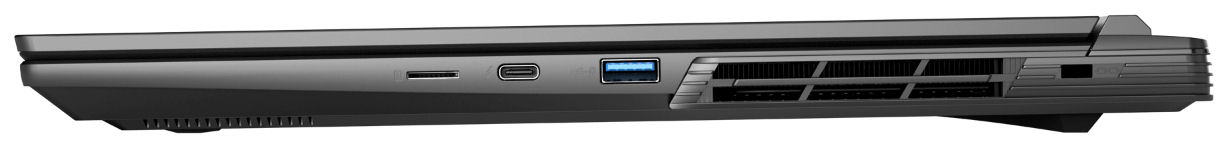
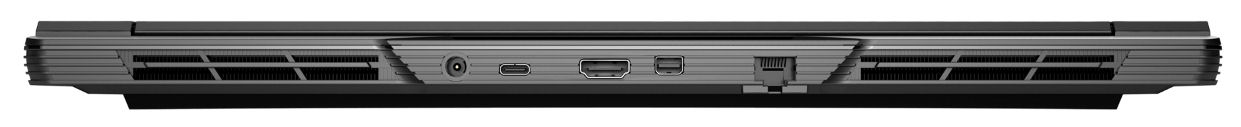
Boîtier et connectivité - Clevo barebone avec Thunderbolt 4
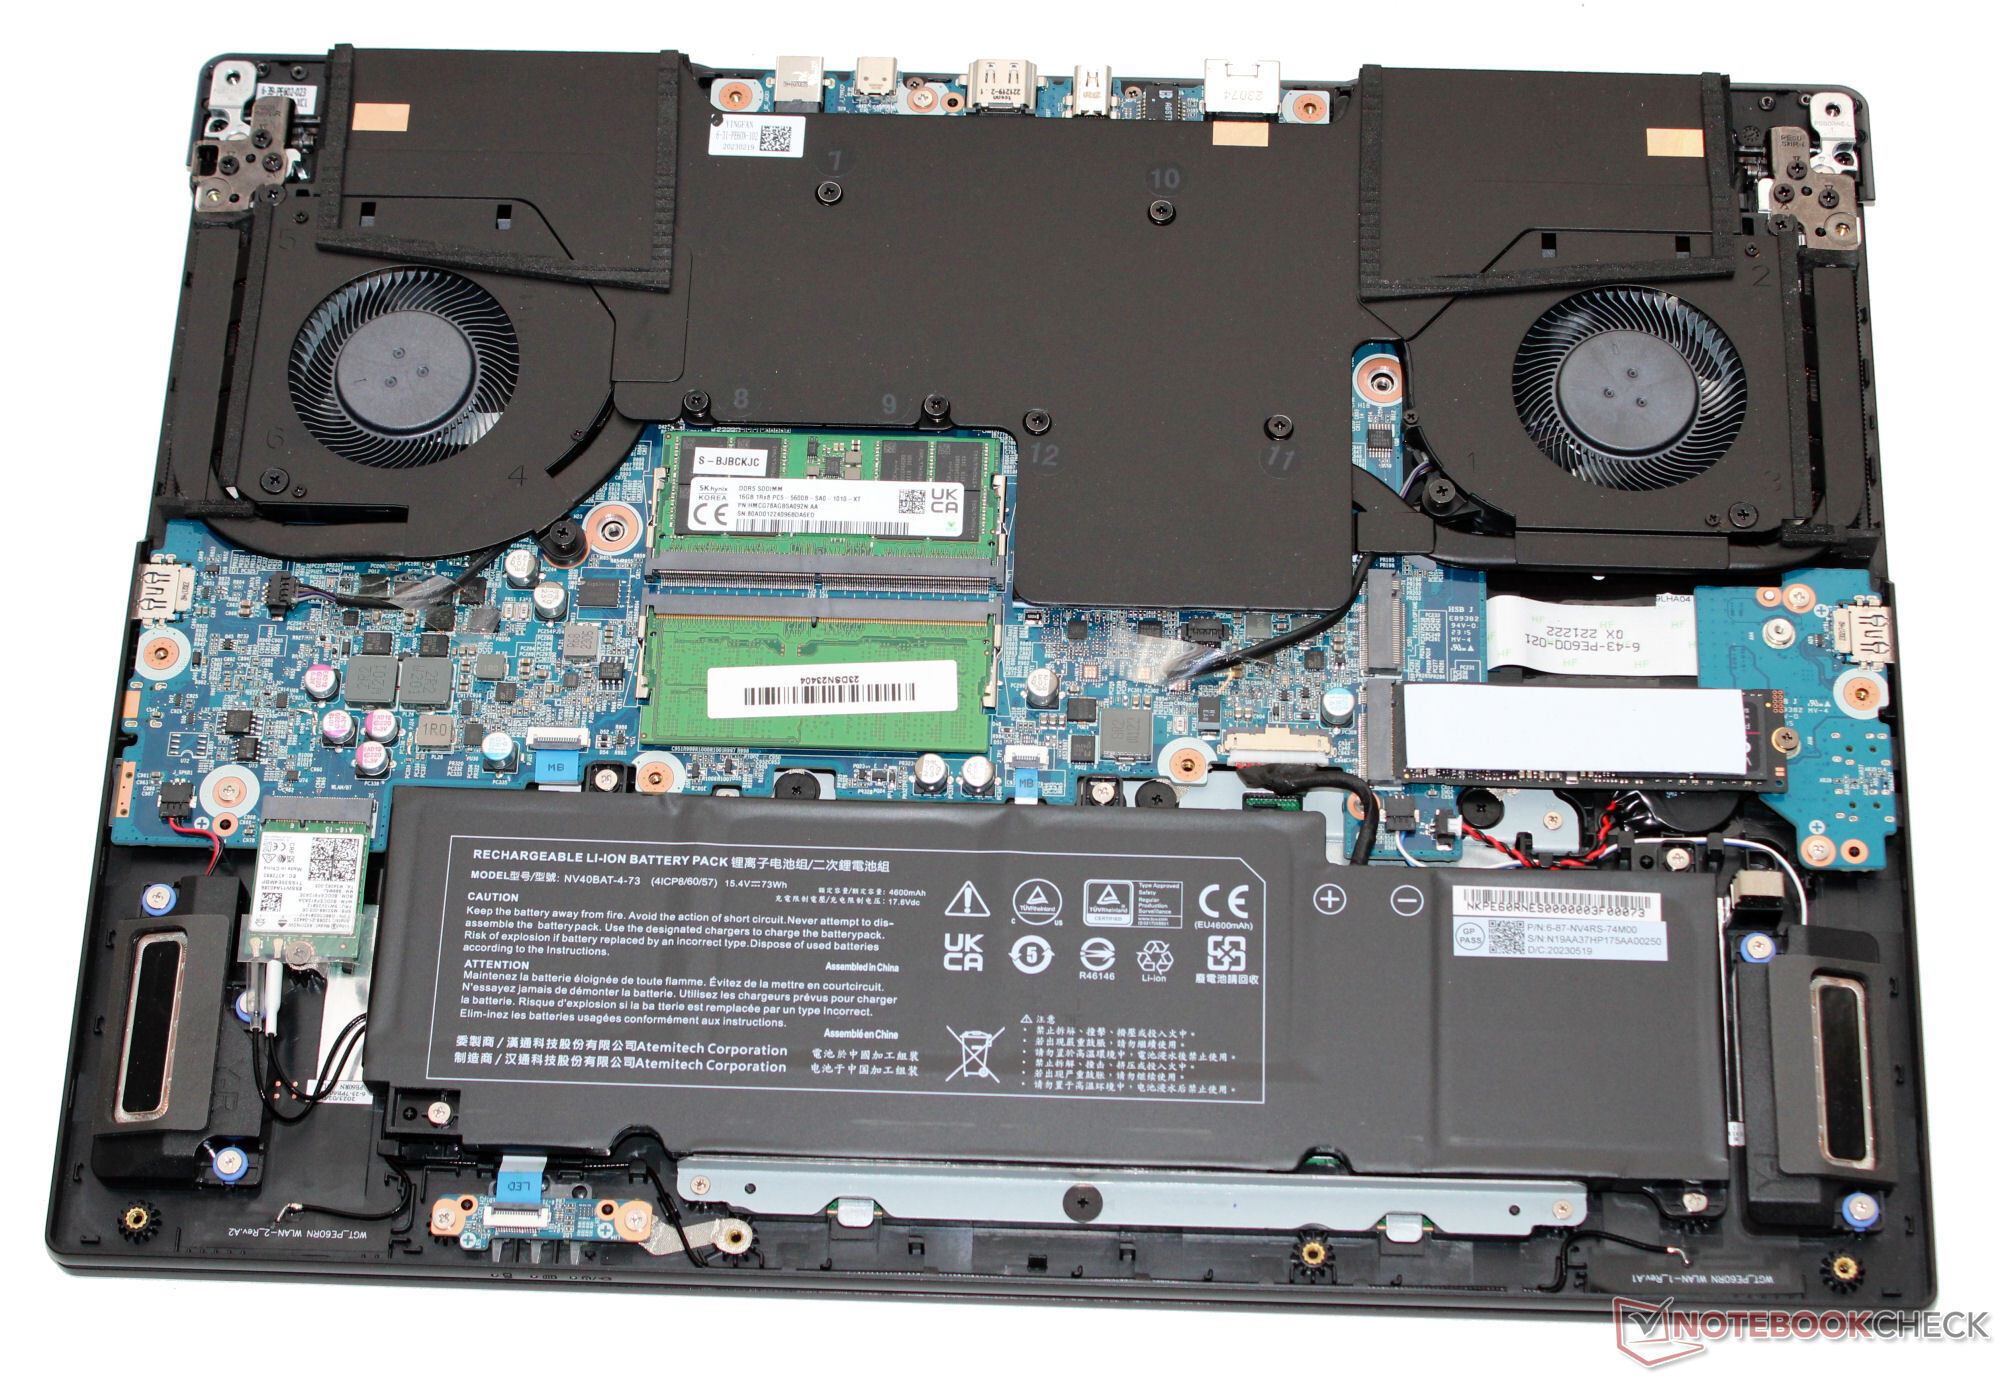
Le couvercle et le fond de l'étui noir mat sont en aluminium et le reste est en plastique. Le boîtier au design subtil est bien construit. L'unité de base et le couvercle peuvent être légèrement tordus, mais il n'y a pas lieu de s'inquiéter. La batterie (vissée et non collée) ainsi que le reste de l'intérieur de l'ordinateur portable sont accessibles une fois que vous avez retiré la plaque inférieure.
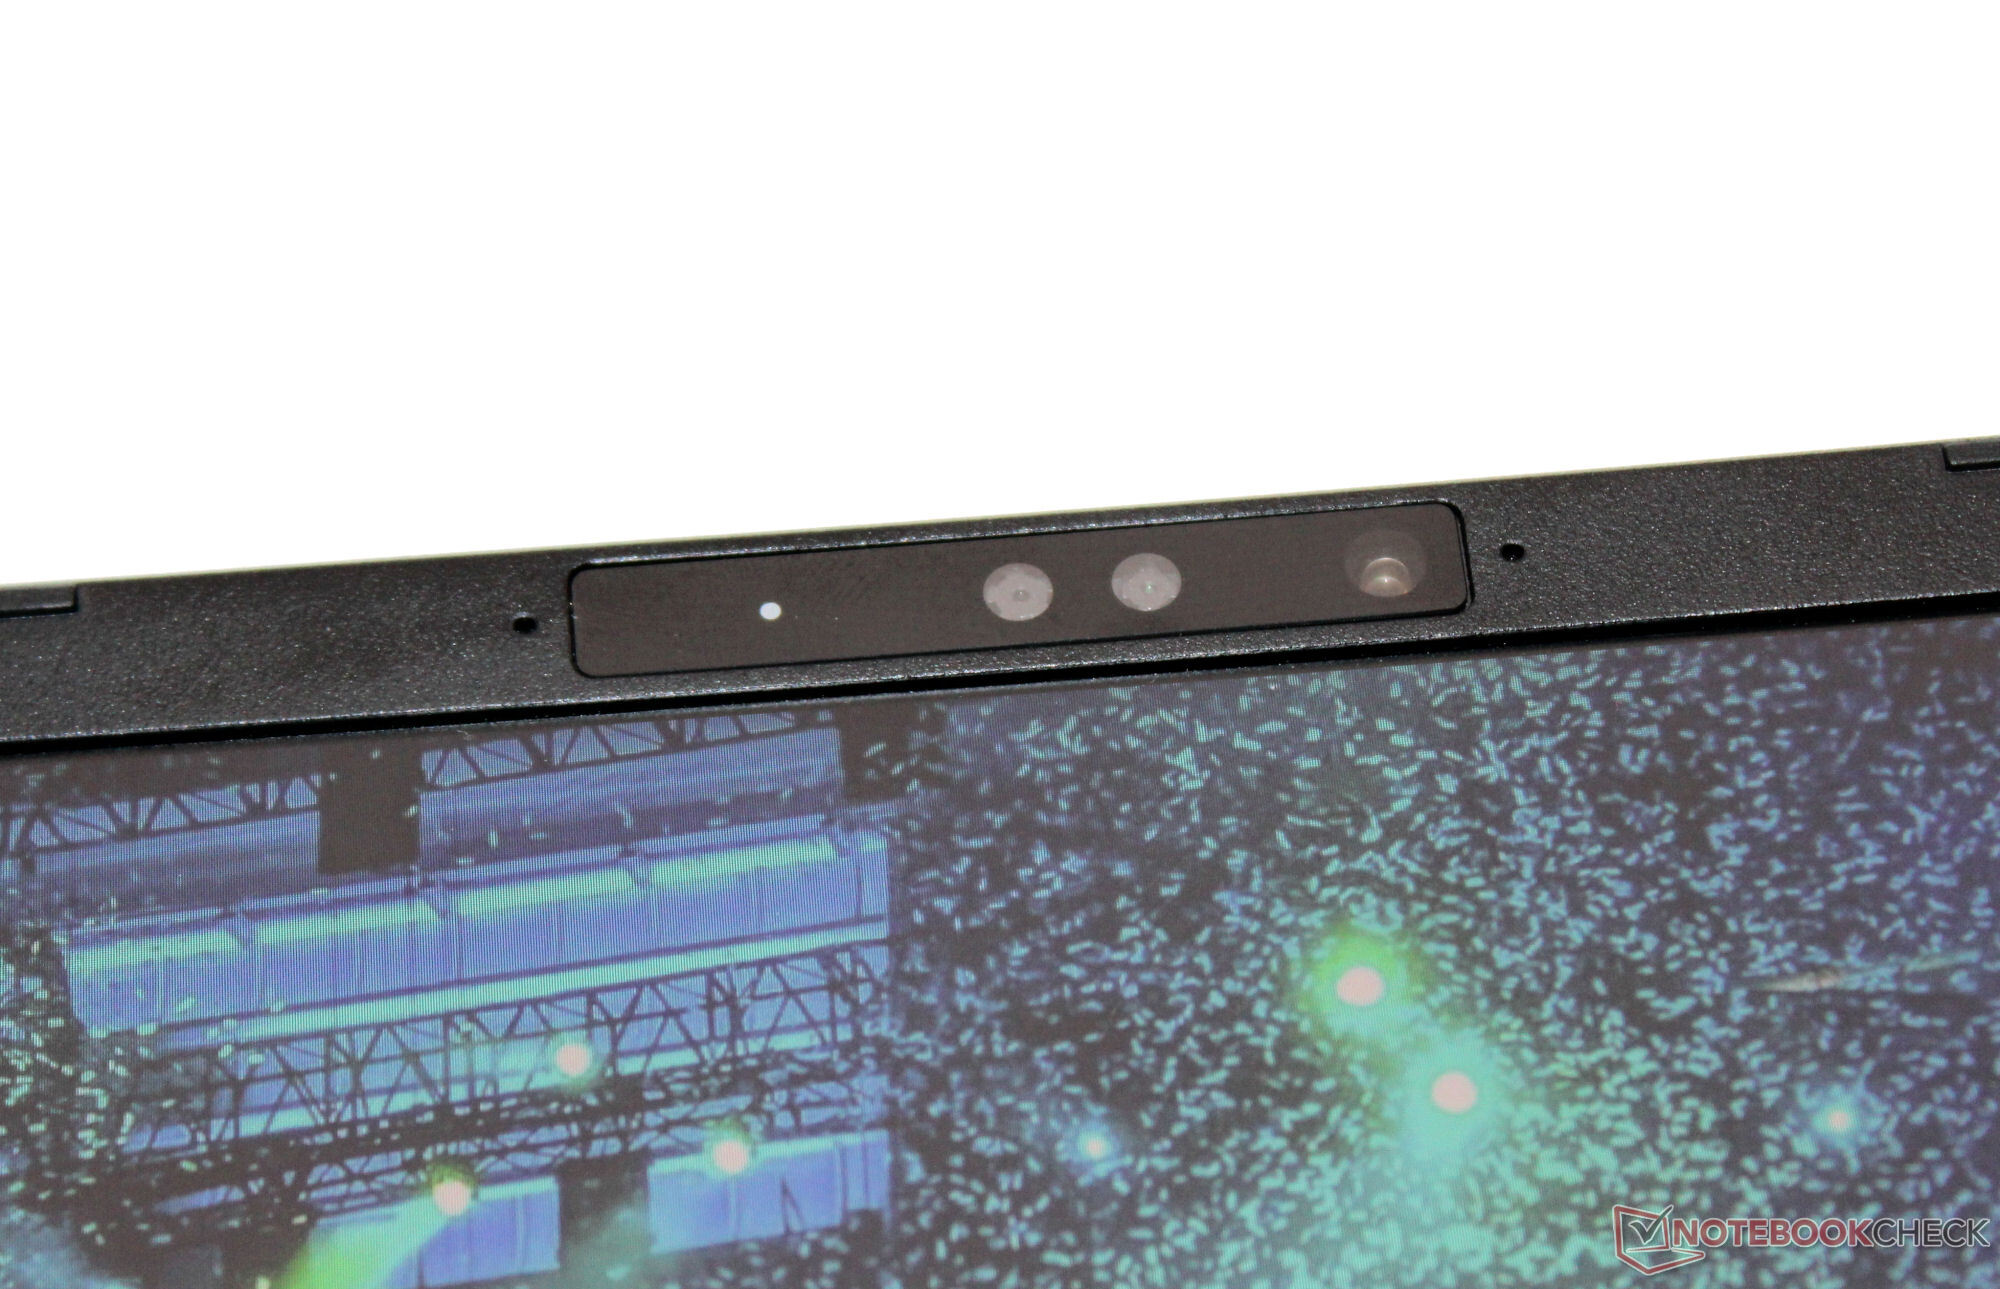
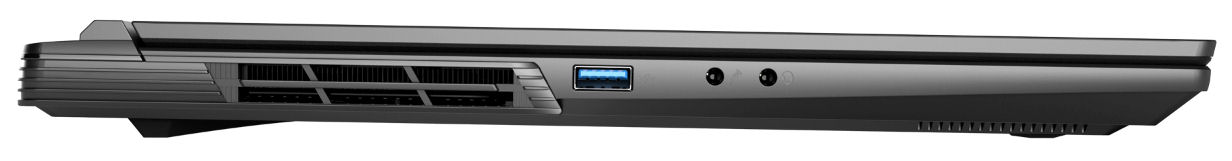
Le Pro dispose de deux ports USB-A (USB 3.2 Gen 1) et de deux ports USB-C (1x USB 3.2 Gen 2, 1x Thunderbolt 4). Le port TB-4 prend en charge Power Delivery et peut émettre un signal DisplayPort. Au total, l'ordinateur portable dispose de trois sorties vidéo (1x HDMI, 2x DP). Son lecteur de carte MicroSD (carte de référence : AV PRO microSD 128 GB V60) peut être considéré comme moyennement rapide. Sa webcam (2,1 MP, max. 1.920 x 1.080 pixels, sans cache) est assez standard.
Dans des conditions optimales (pas d'appareils WiFi à proximité, courte distance entre l'ordinateur portable et le PC serveur), il atteint d'excellents débits de données WiFi. Le portable utilise une puce WiFi 6E (Intel AX211), et les connexions filaires sont prises en charge par un contrôleur Realtek RTL8125 (2,5 GBit/s).
| SD Card Reader | |
| average JPG Copy Test (av. of 3 runs) | |
| MSI Stealth 16 Studio A13VG | |
| Moyenne de la classe Gaming (20.9 - 210, n=54, 2 dernières années) | |
| Asus Vivobook Pro 16X K6604JV-MX016W | |
| Schenker XMG Pro 16 Studio (Mid 23) (AV PRO microSD 128 GB V60) | |
| Lenovo Legion Slim 7i 16 Gen 8 (Toshiba Exceria Pro SDXC 64 GB UHS-II) | |
| maximum AS SSD Seq Read Test (1GB) | |
| MSI Stealth 16 Studio A13VG | |
| Moyenne de la classe Gaming (25.5 - 261, n=51, 2 dernières années) | |
| Asus Vivobook Pro 16X K6604JV-MX016W | |
| Schenker XMG Pro 16 Studio (Mid 23) (AV PRO microSD 128 GB V60) | |
| Lenovo Legion Slim 7i 16 Gen 8 (Toshiba Exceria Pro SDXC 64 GB UHS-II) | |

 GeForce RTX 4070 Laptop GPU, i9-13900H, Samsung 990 Pro 1 TB")
 GeForce RTX 4070 Laptop GPU, i9-13900H, Samsung 990 Pro 1 TB")
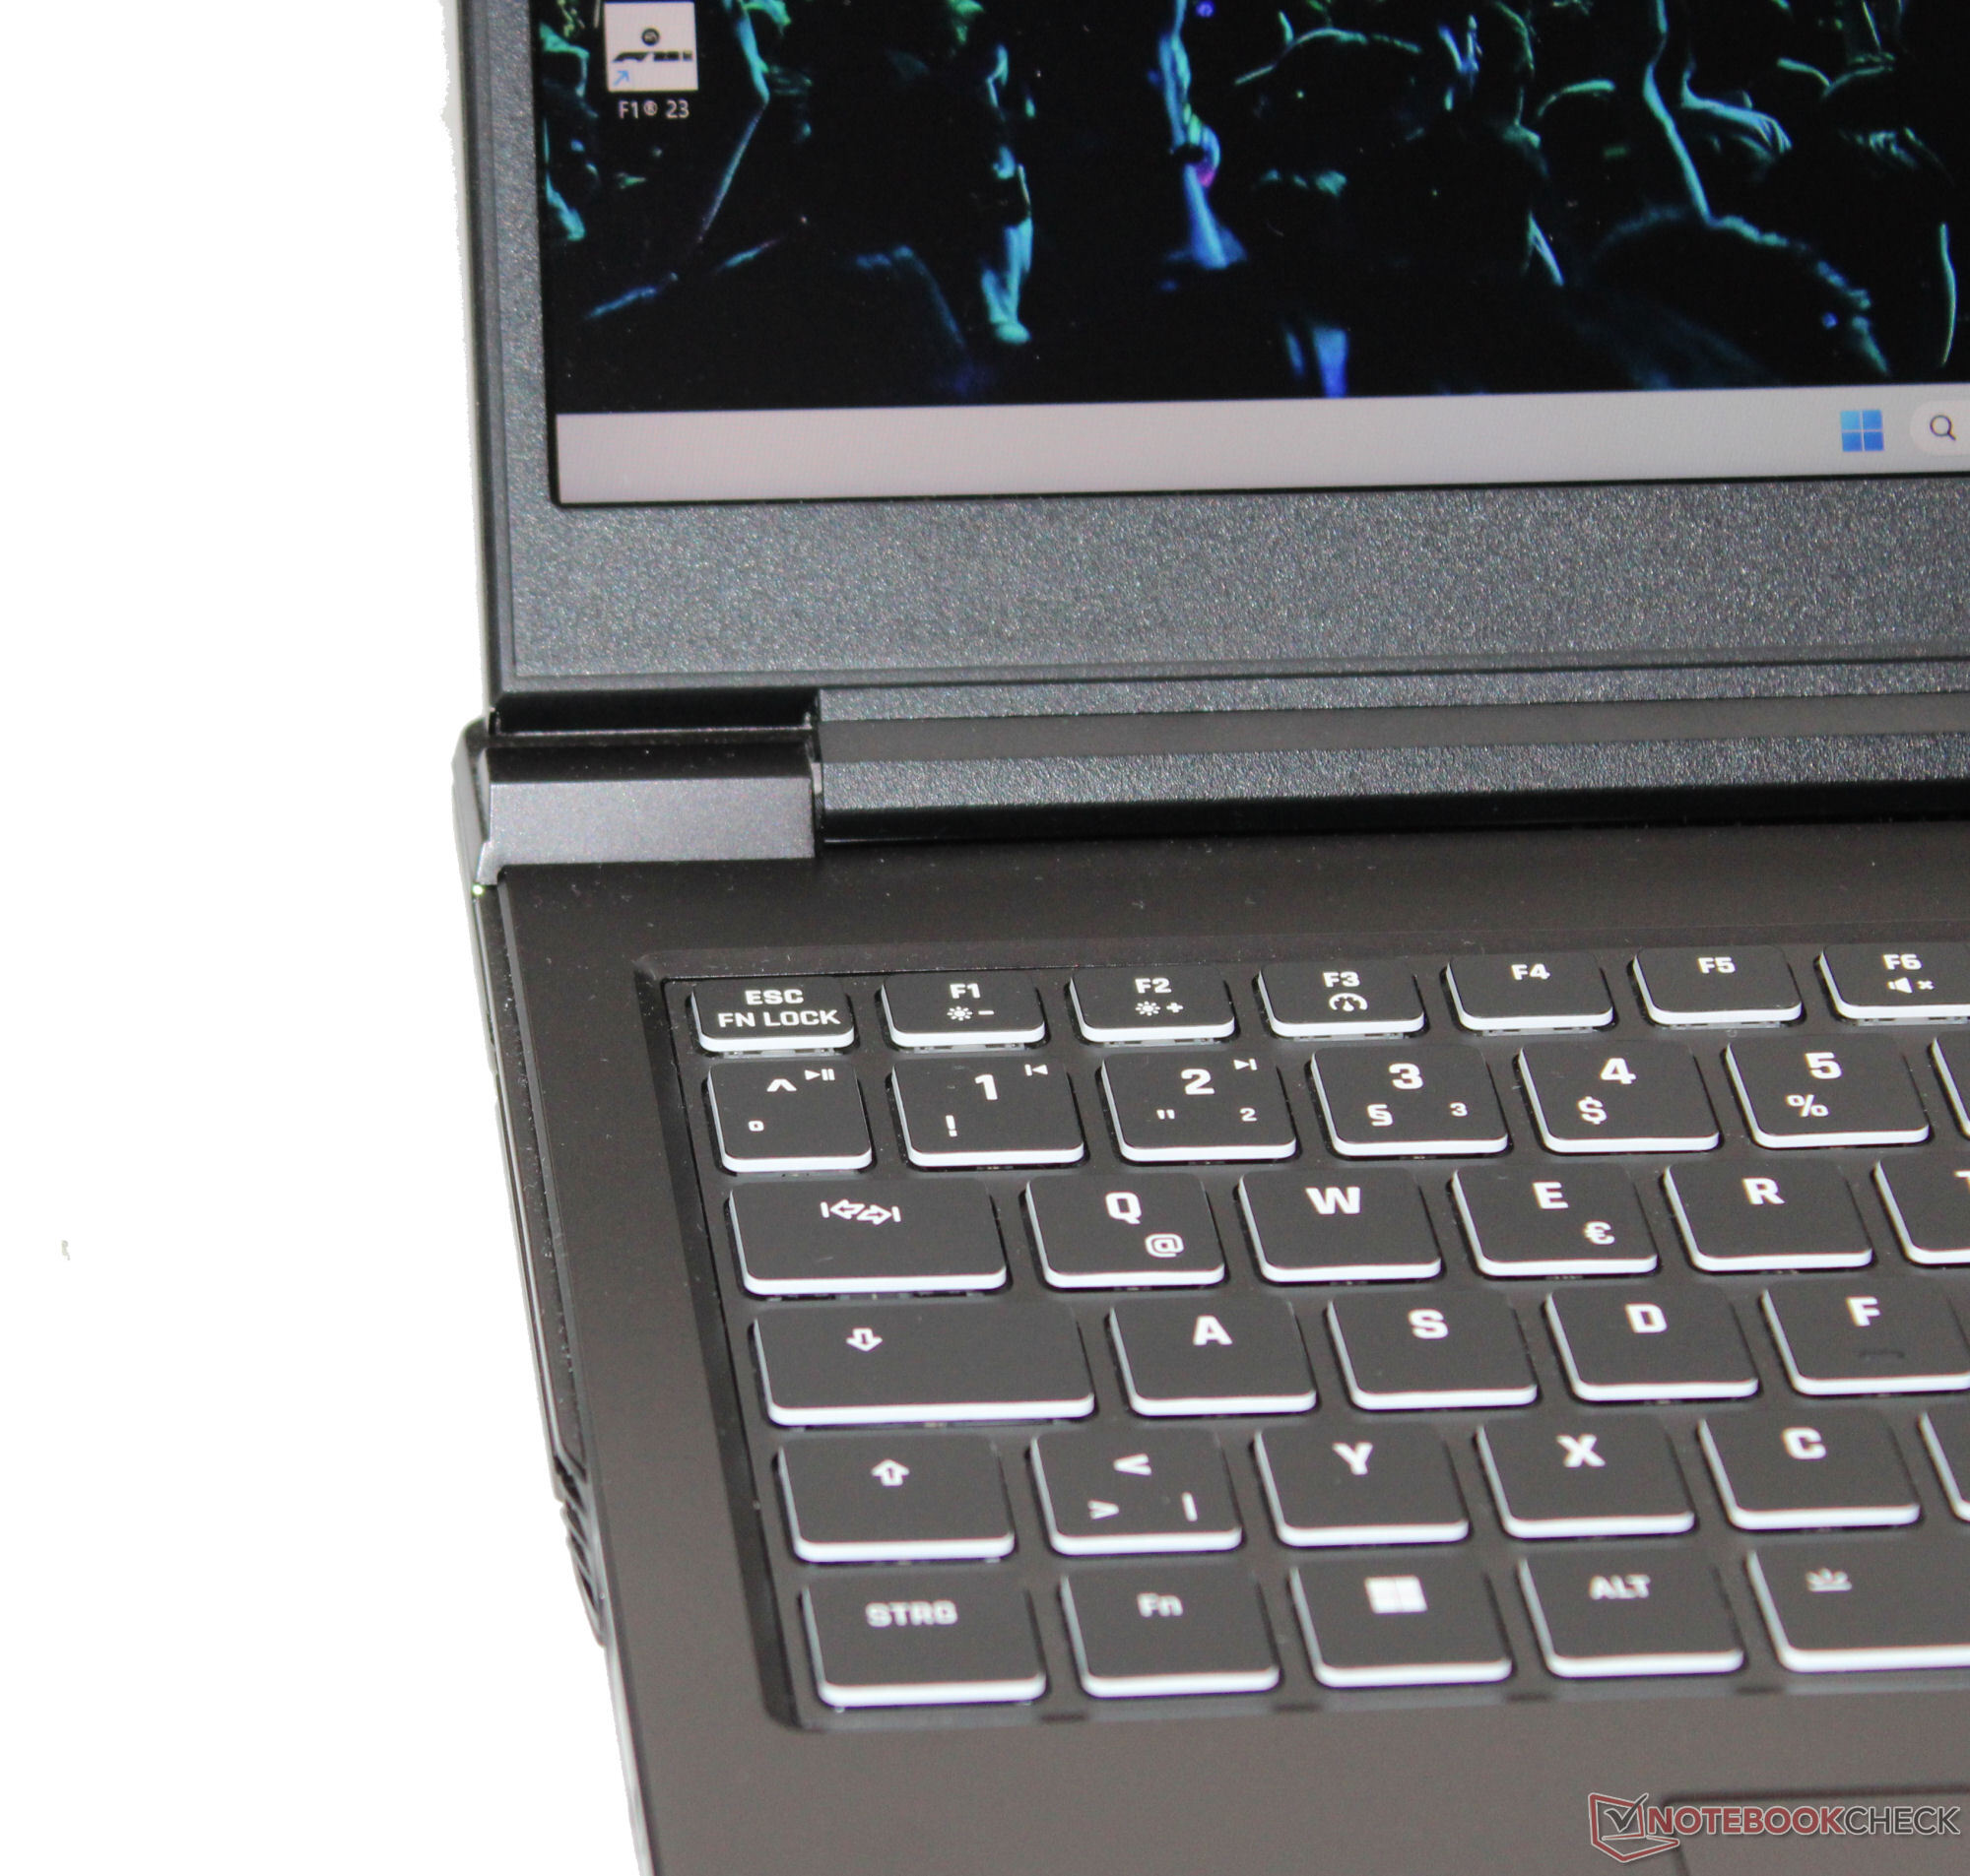
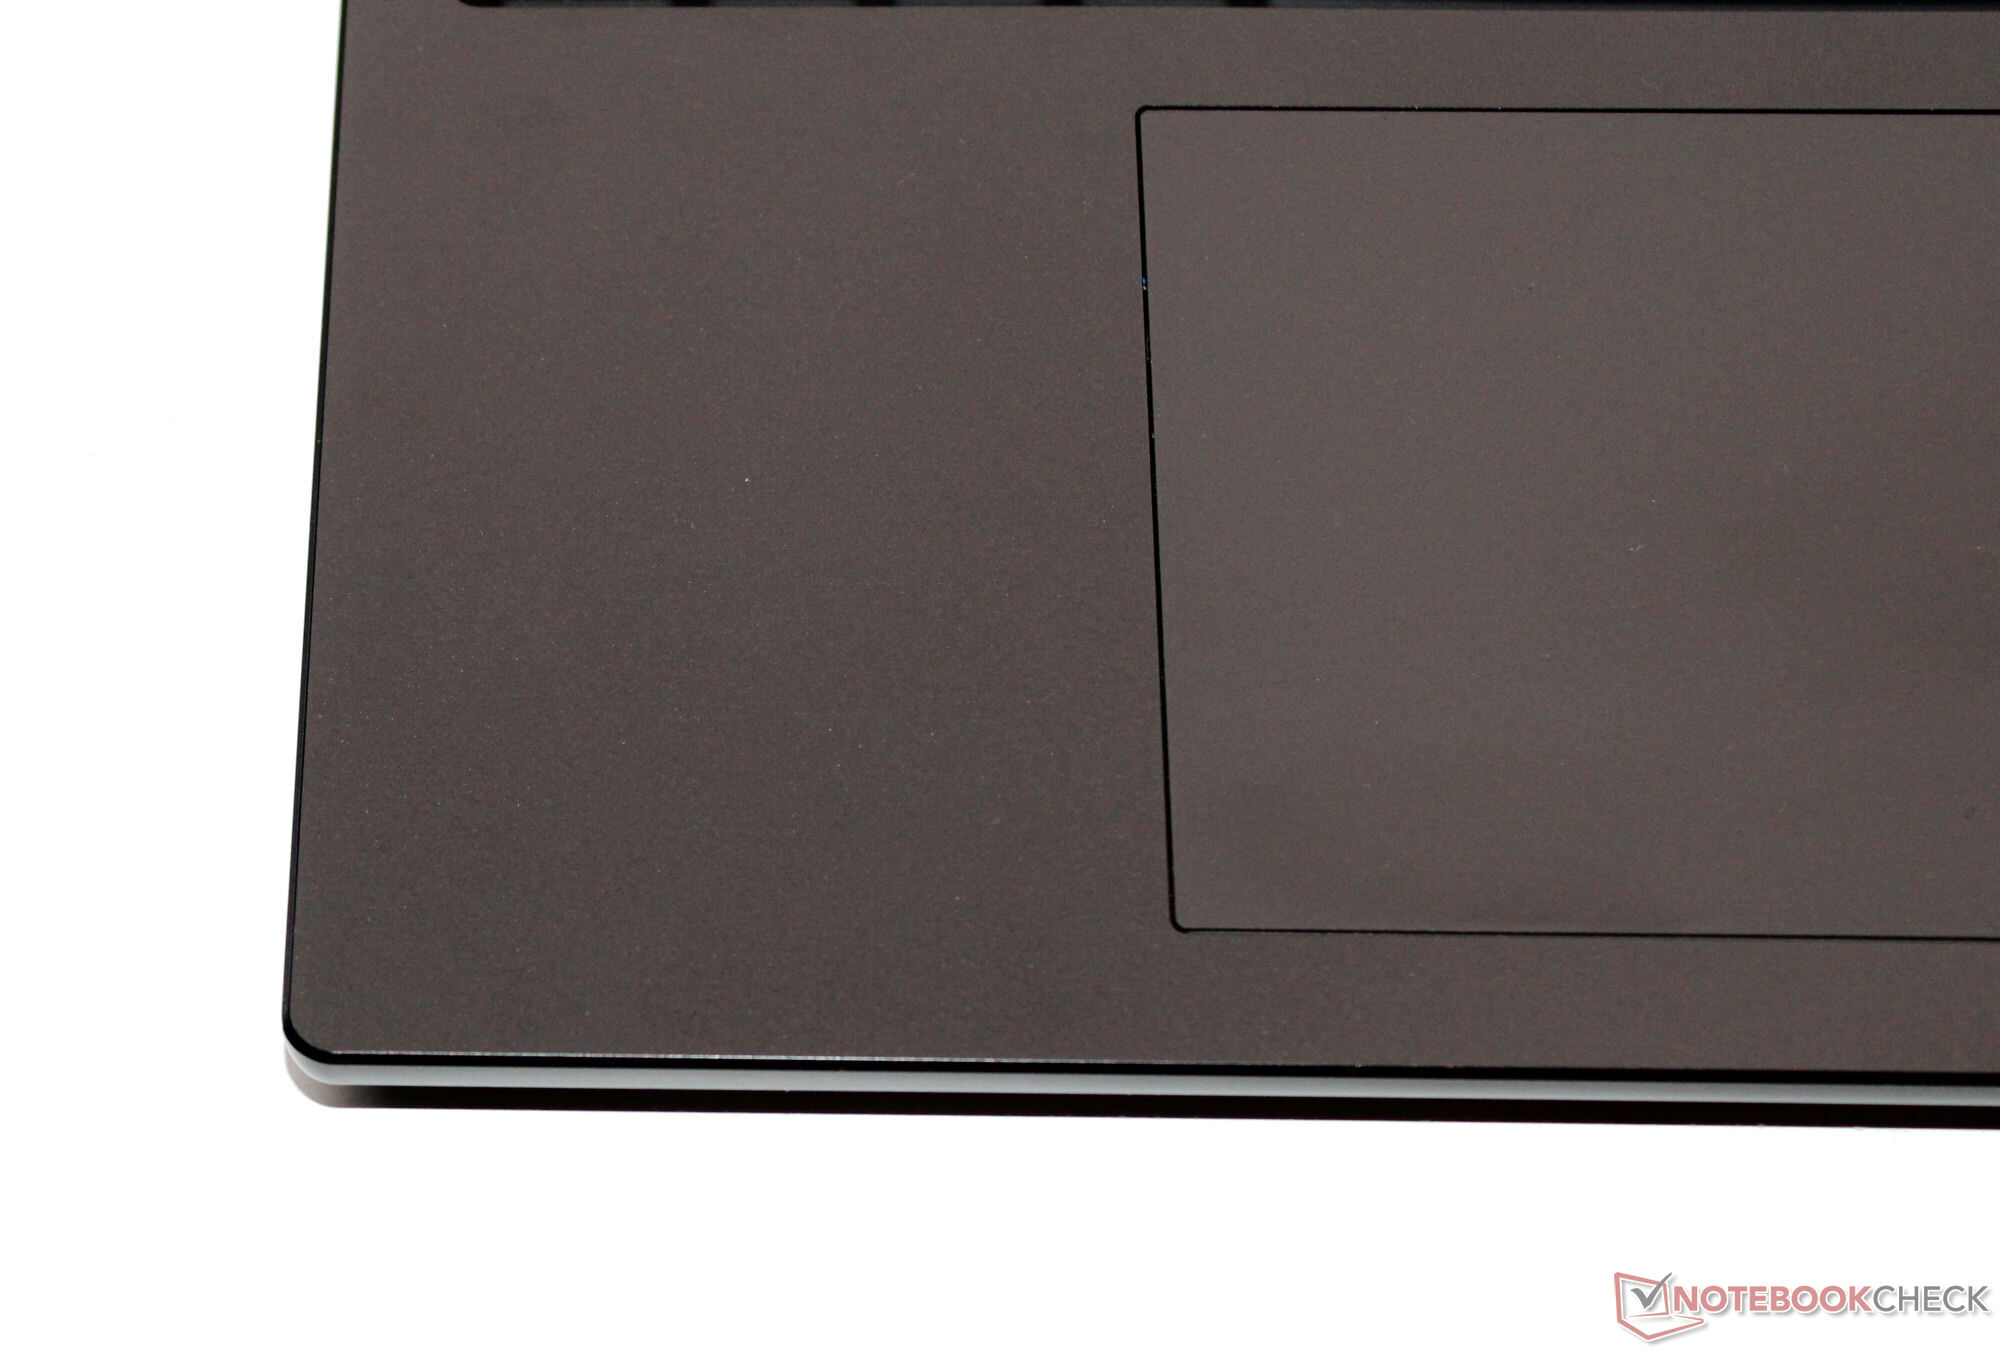
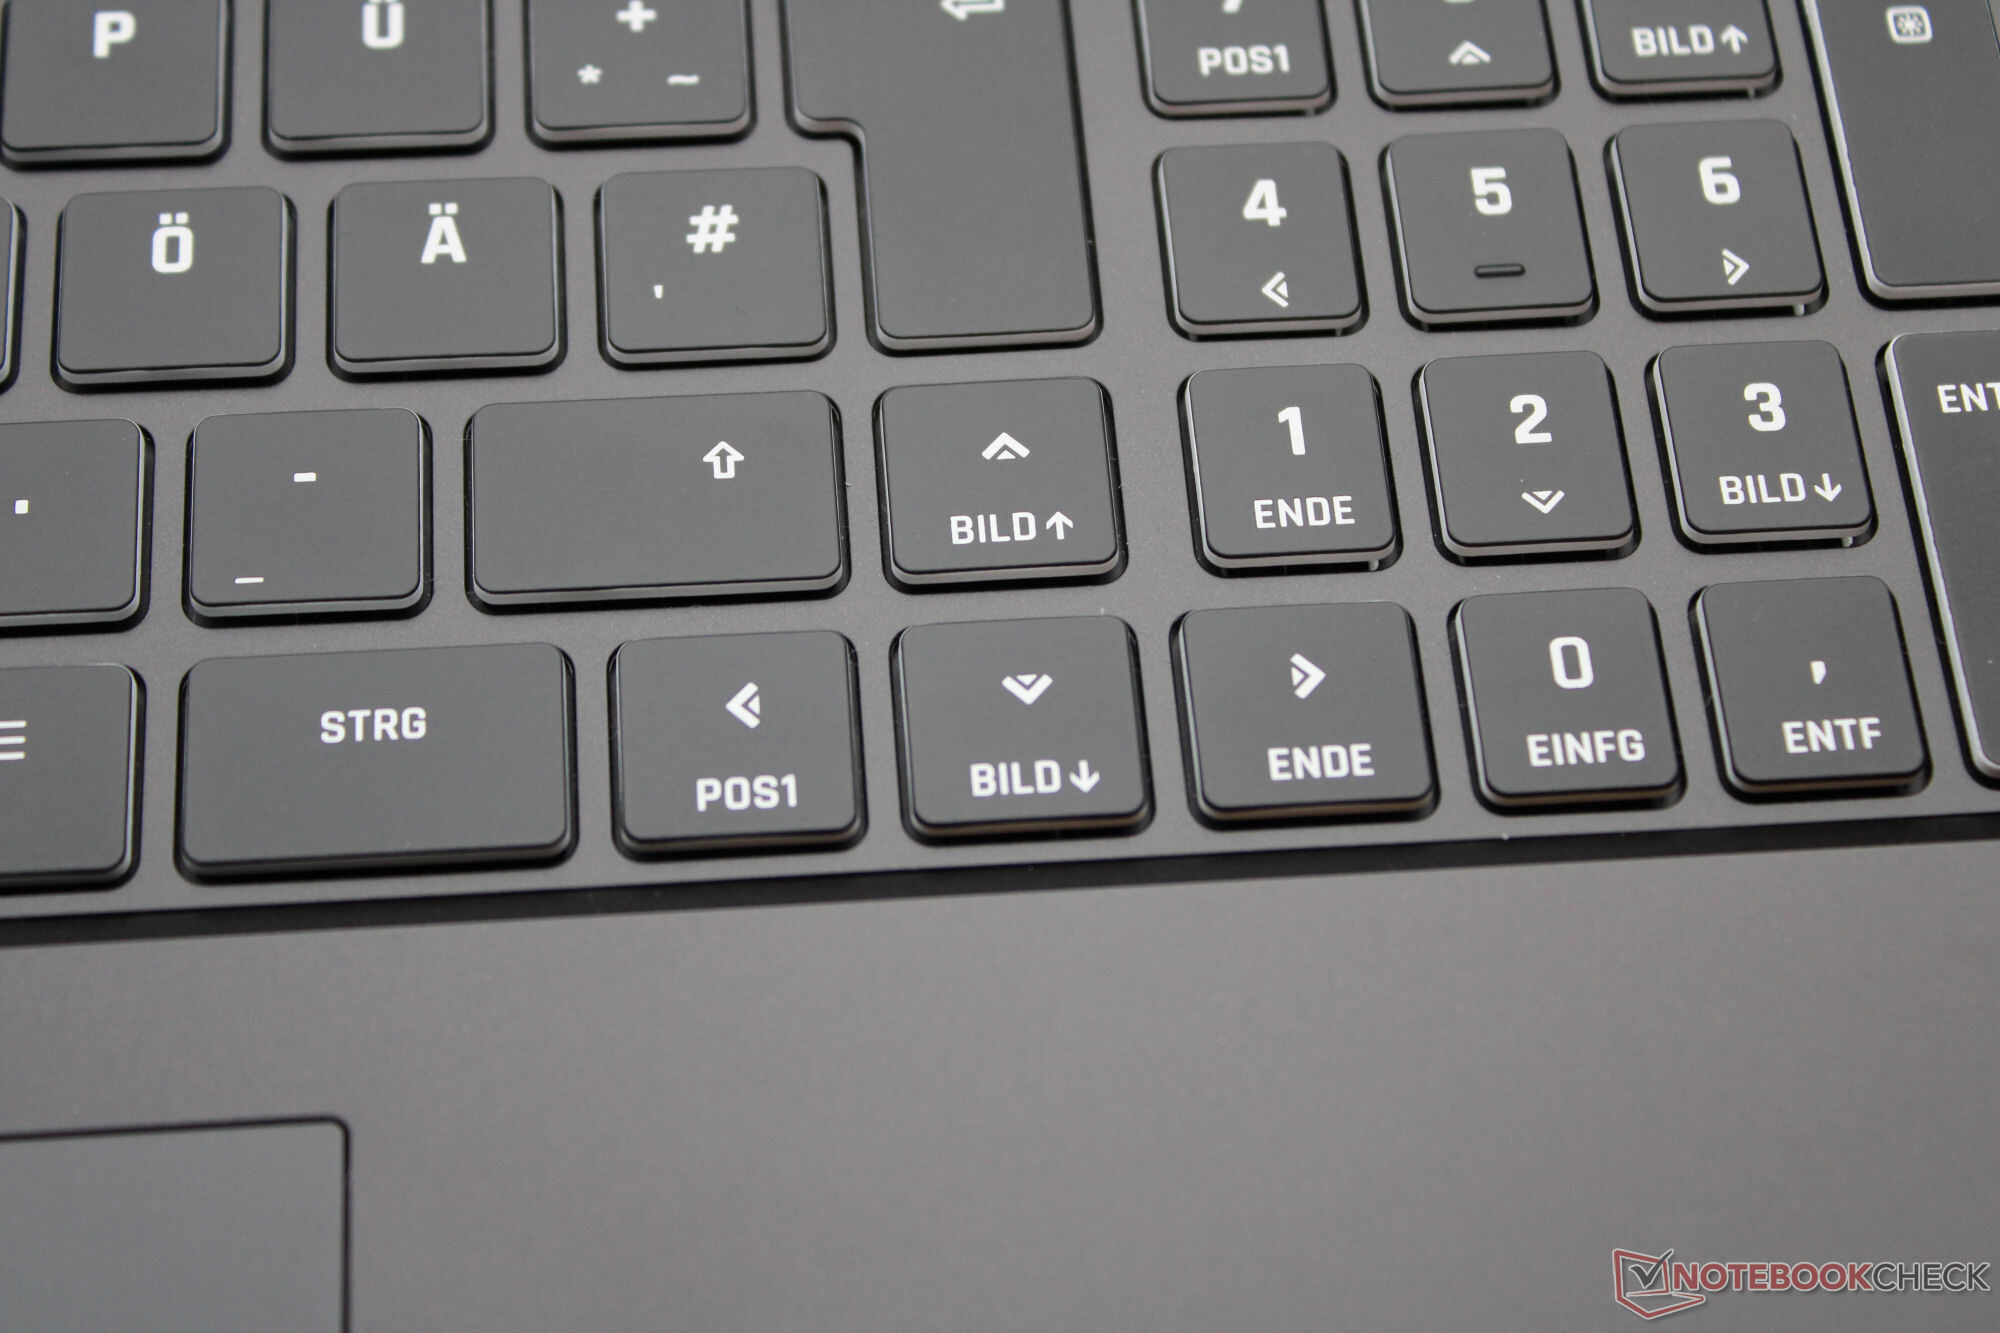
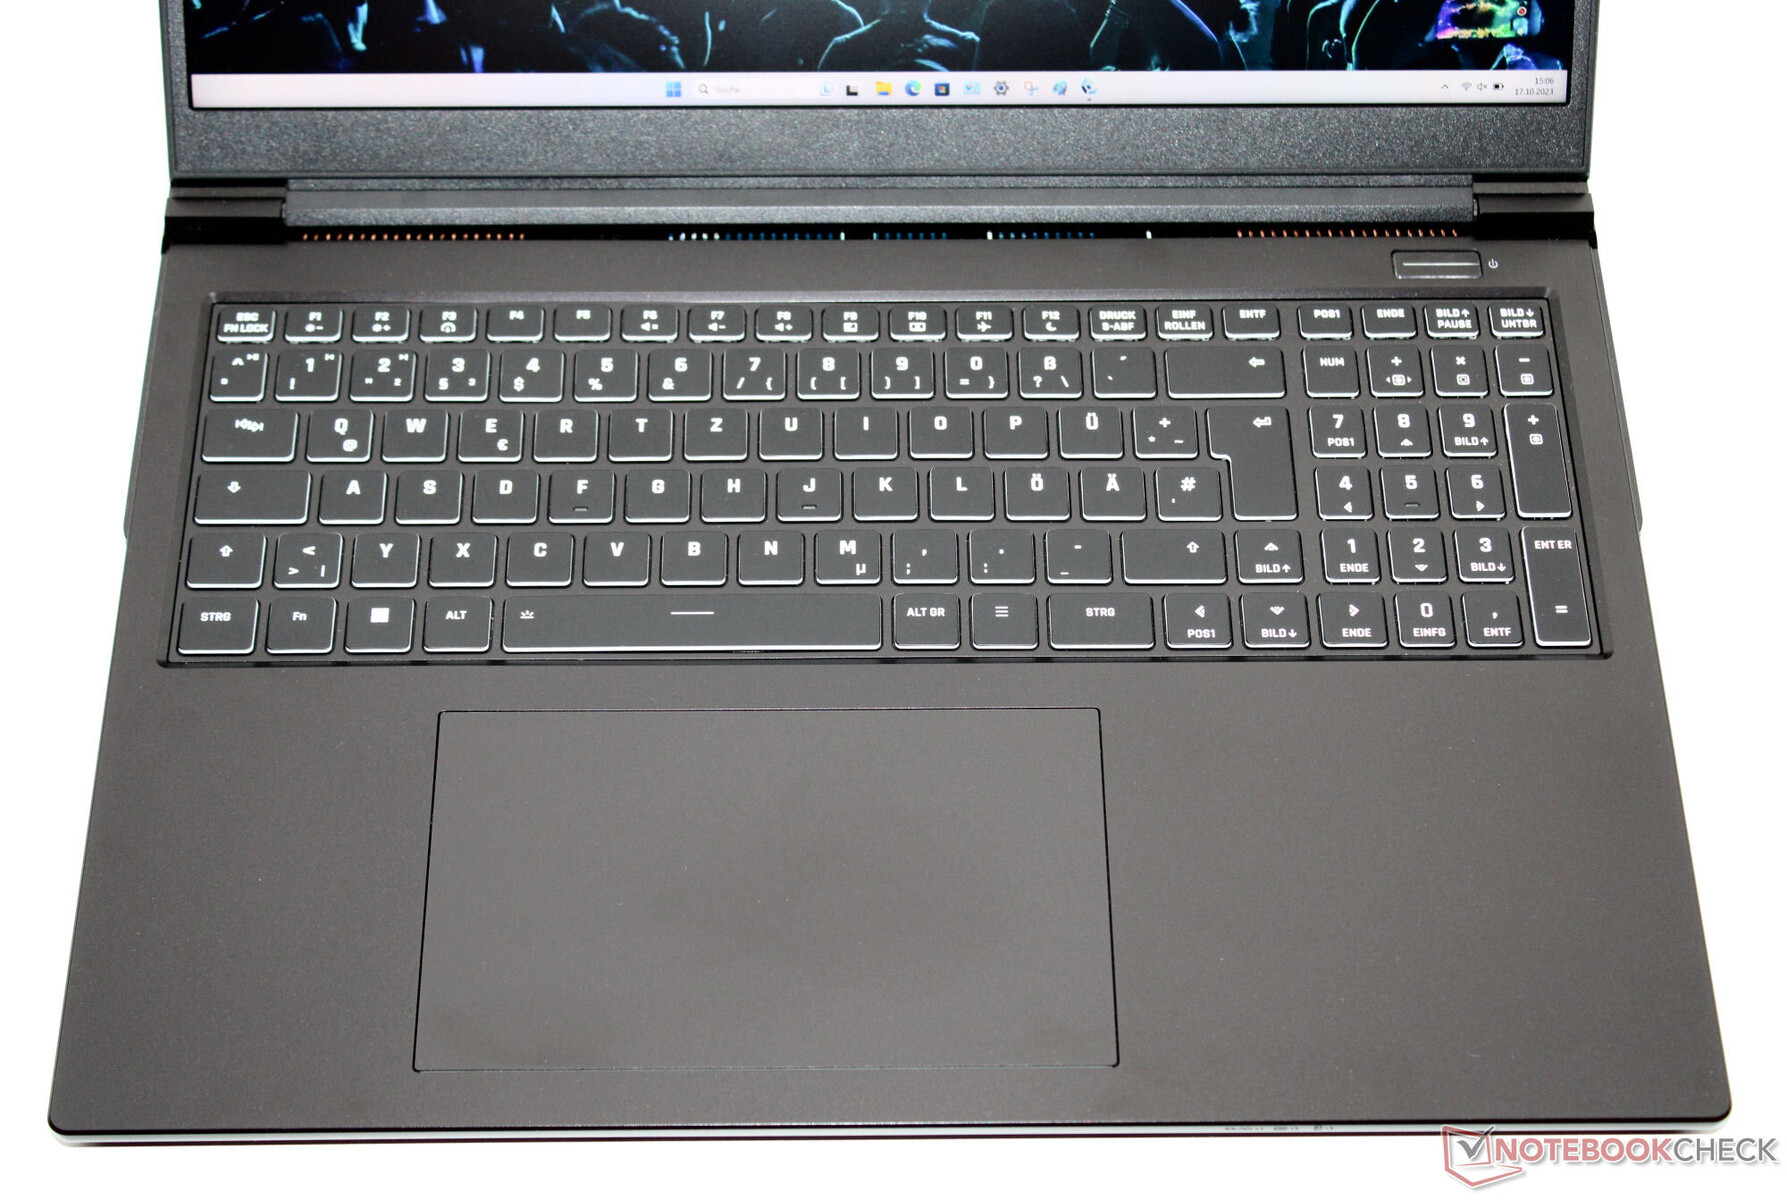
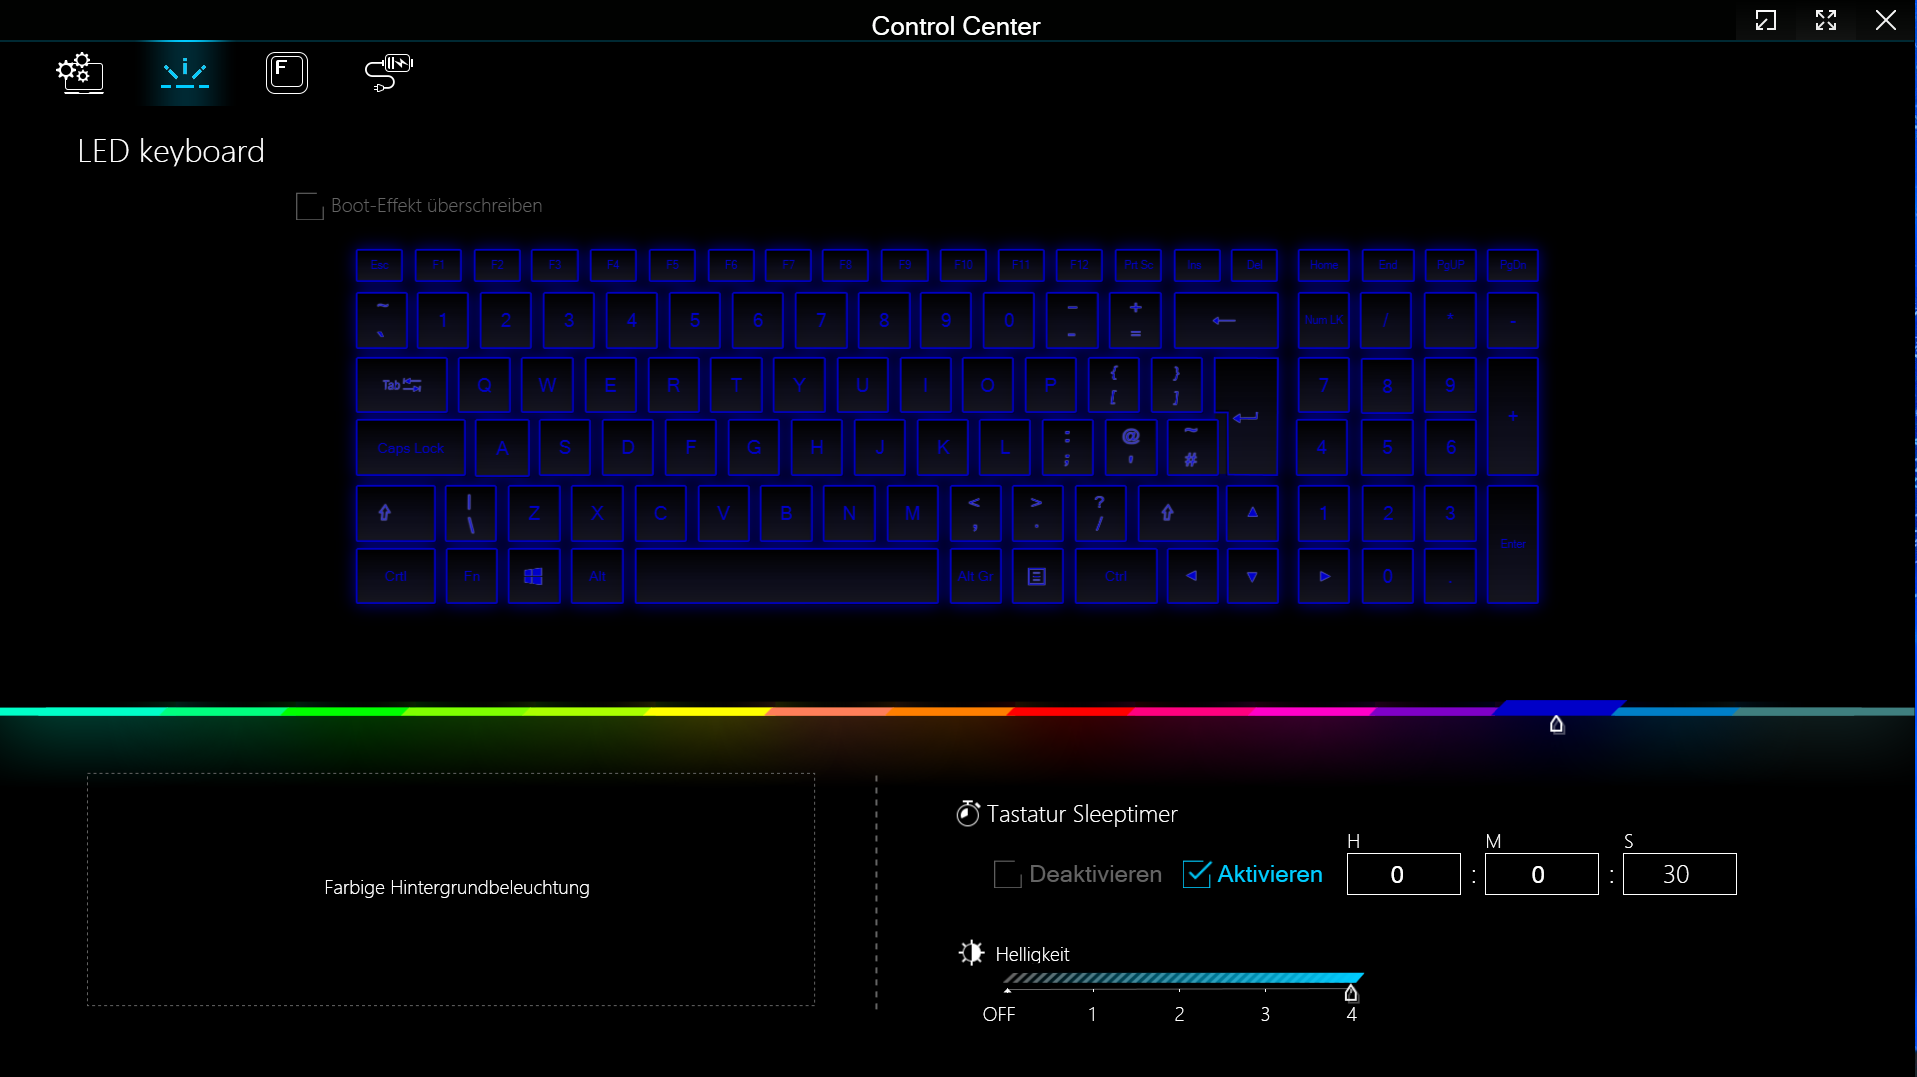
Dispositifs de saisie - L'ordinateur portable XMG est doté de touches lumineuses
Les touches du clavier chiclet (éclairage RGB) sont régulières et lisses, avec une élévation moyenne et un point de pression clair. La résistance des touches pourrait être un peu plus nette. Au total, Schenker a conçu un clavier adapté à un usage quotidien. Un pavé tactile remplace la souris (environ 15,1 x 9,1 cm), qui se caractérise par une levée courte et un point de pression clair.
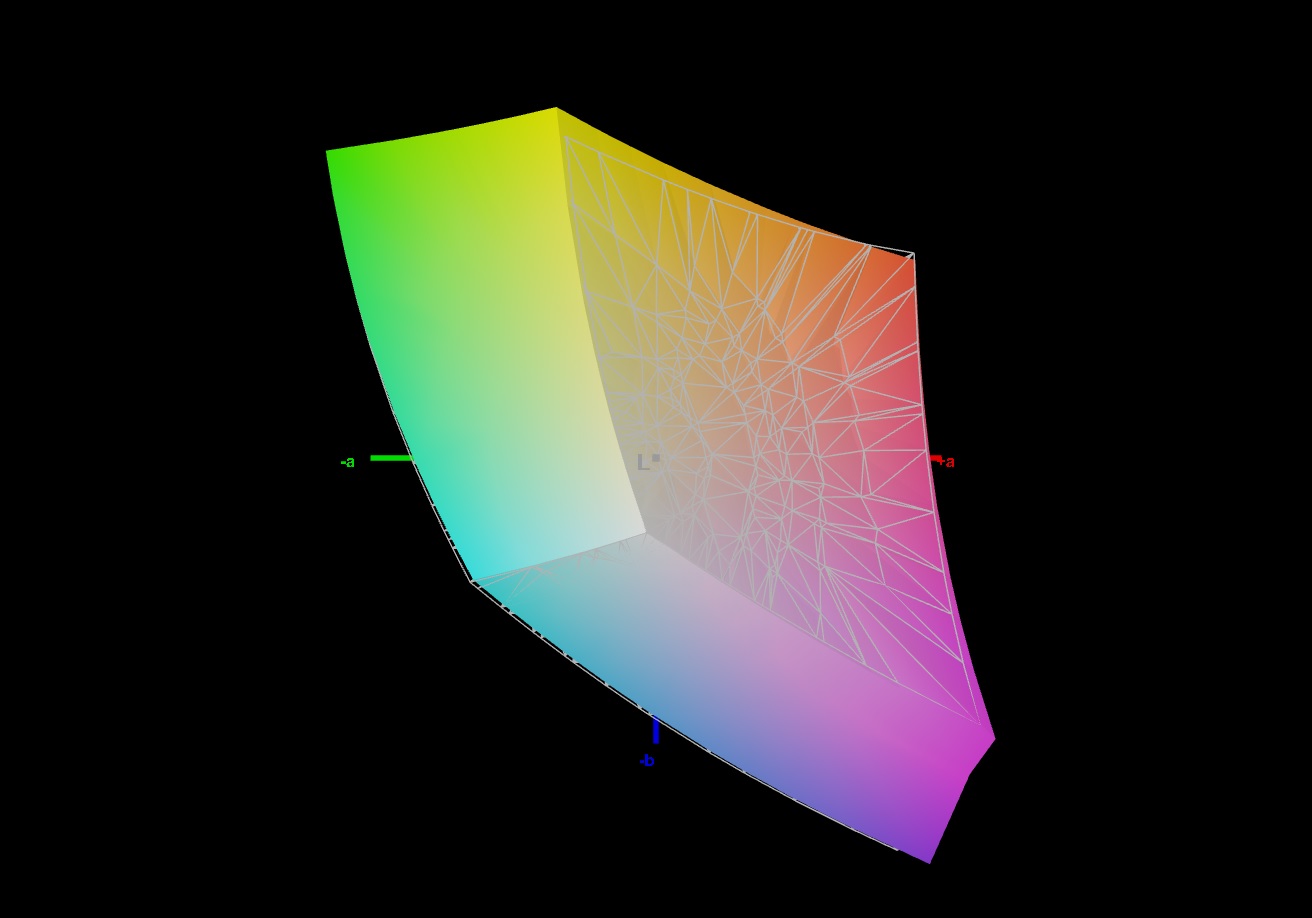
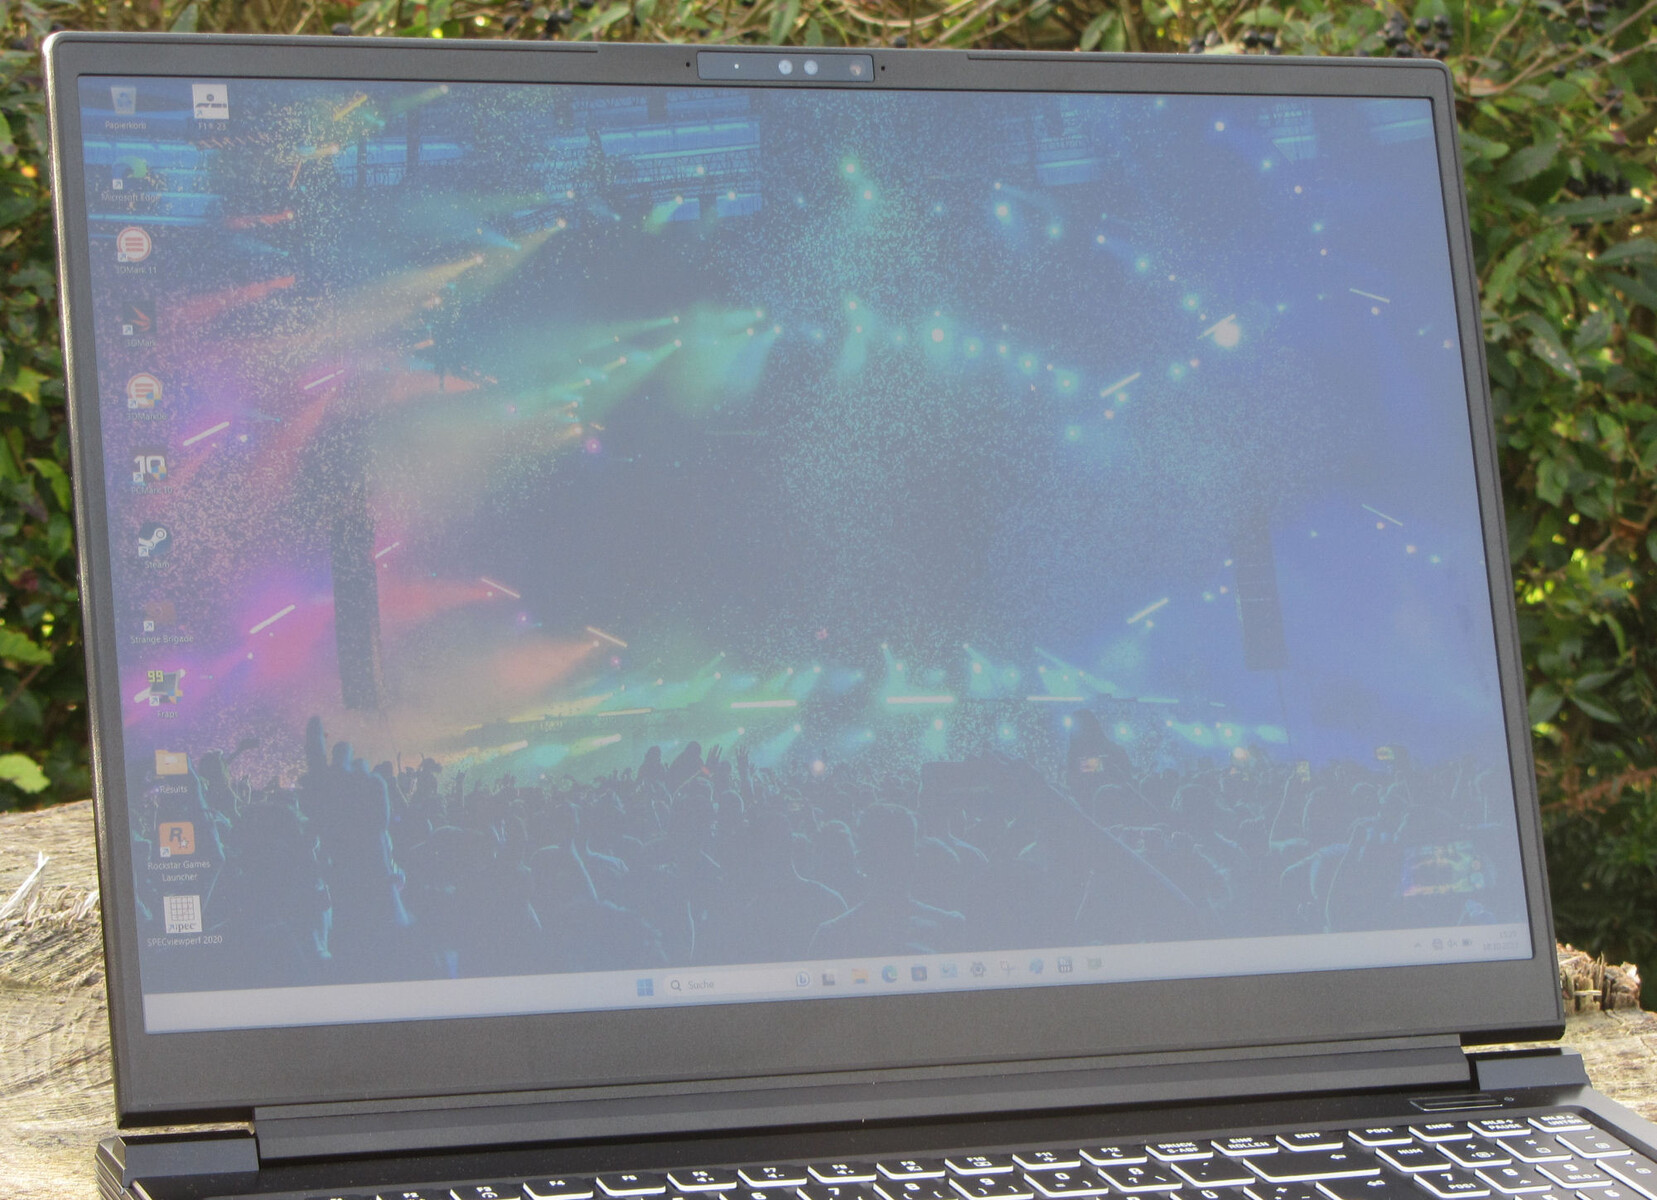
Affichage - Panneau 16:10 avec couverture sRGB
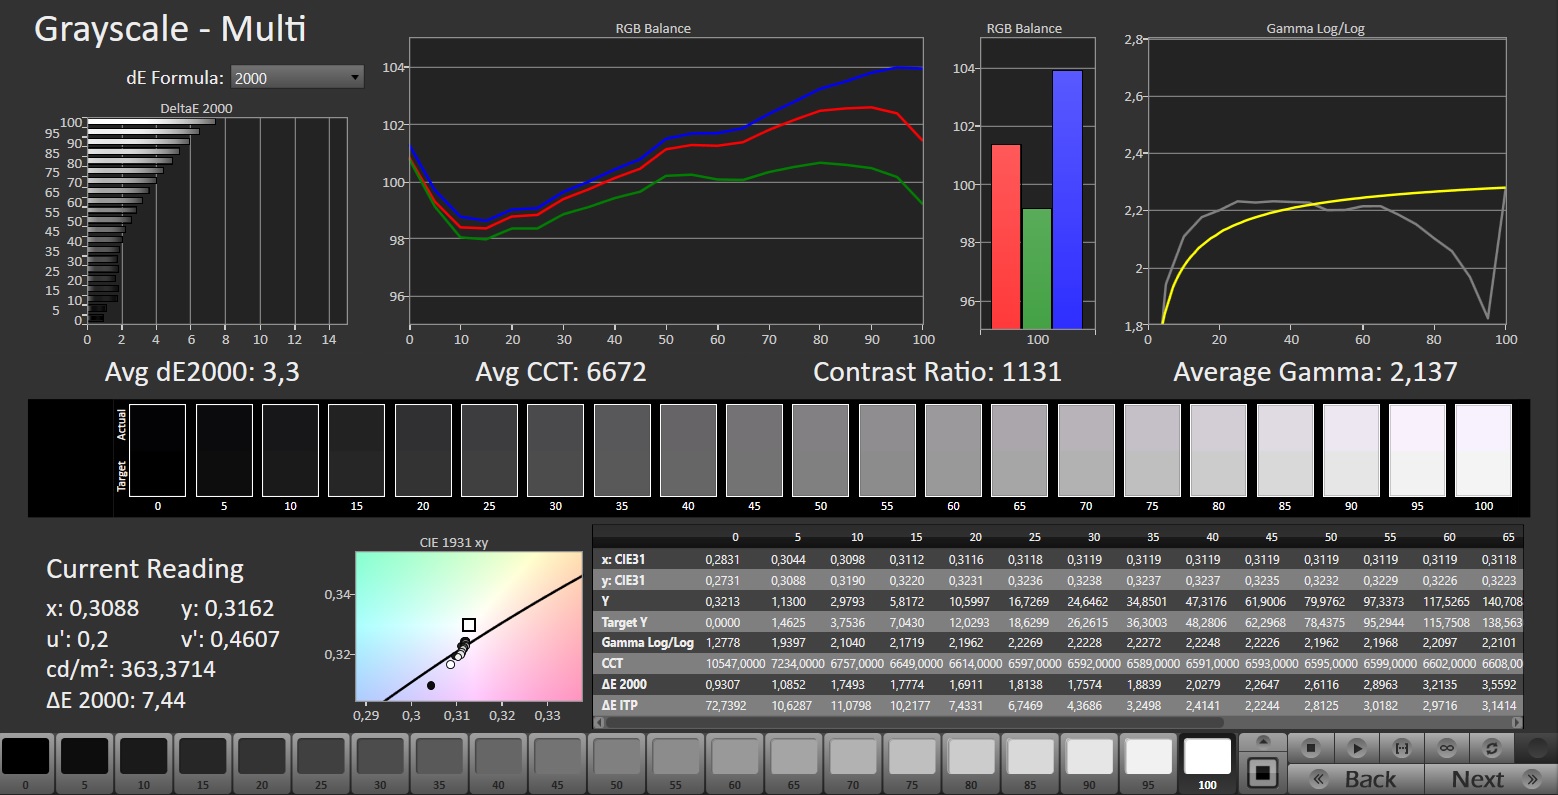
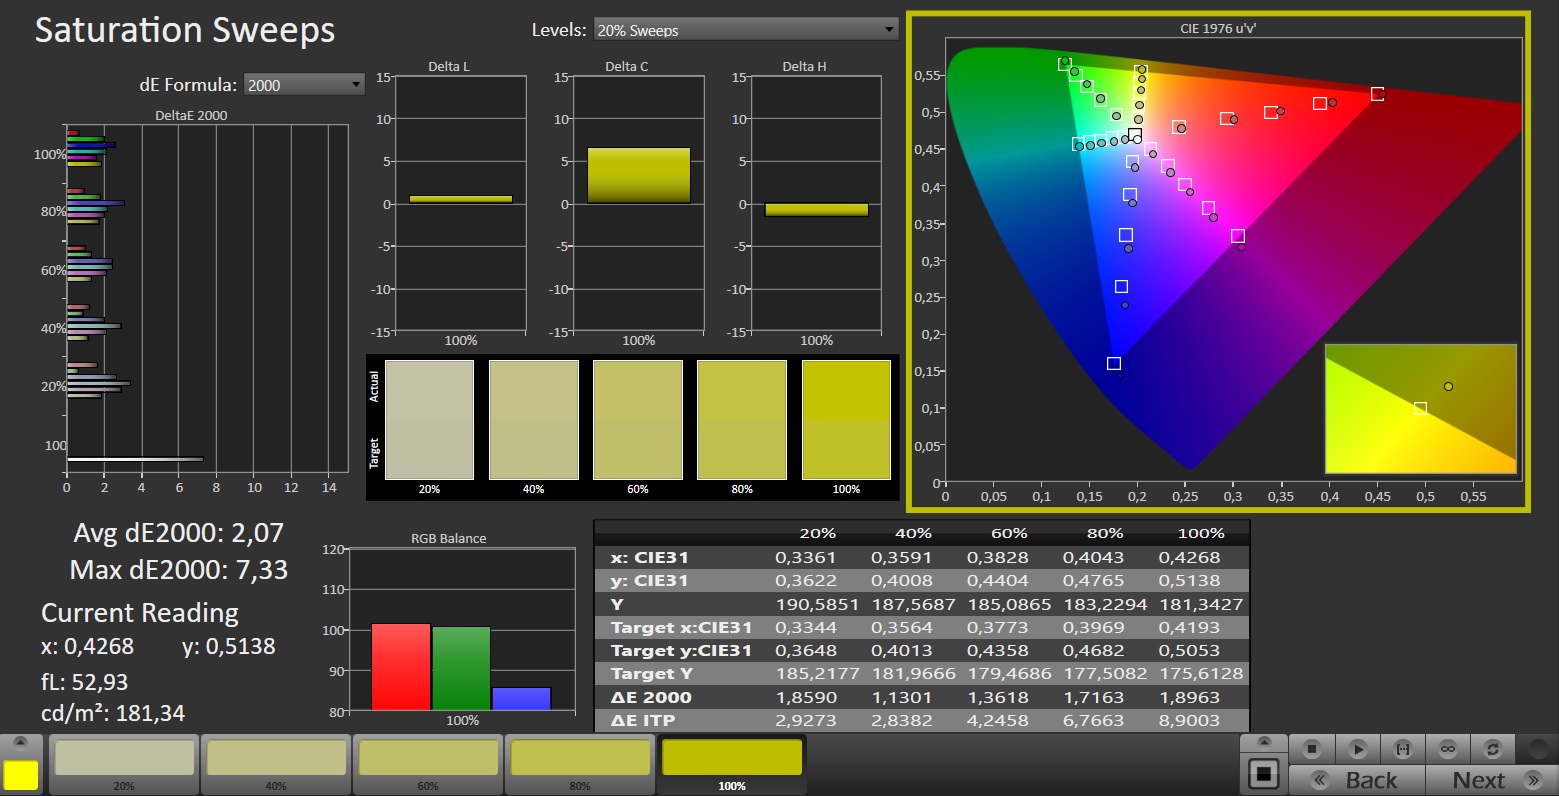
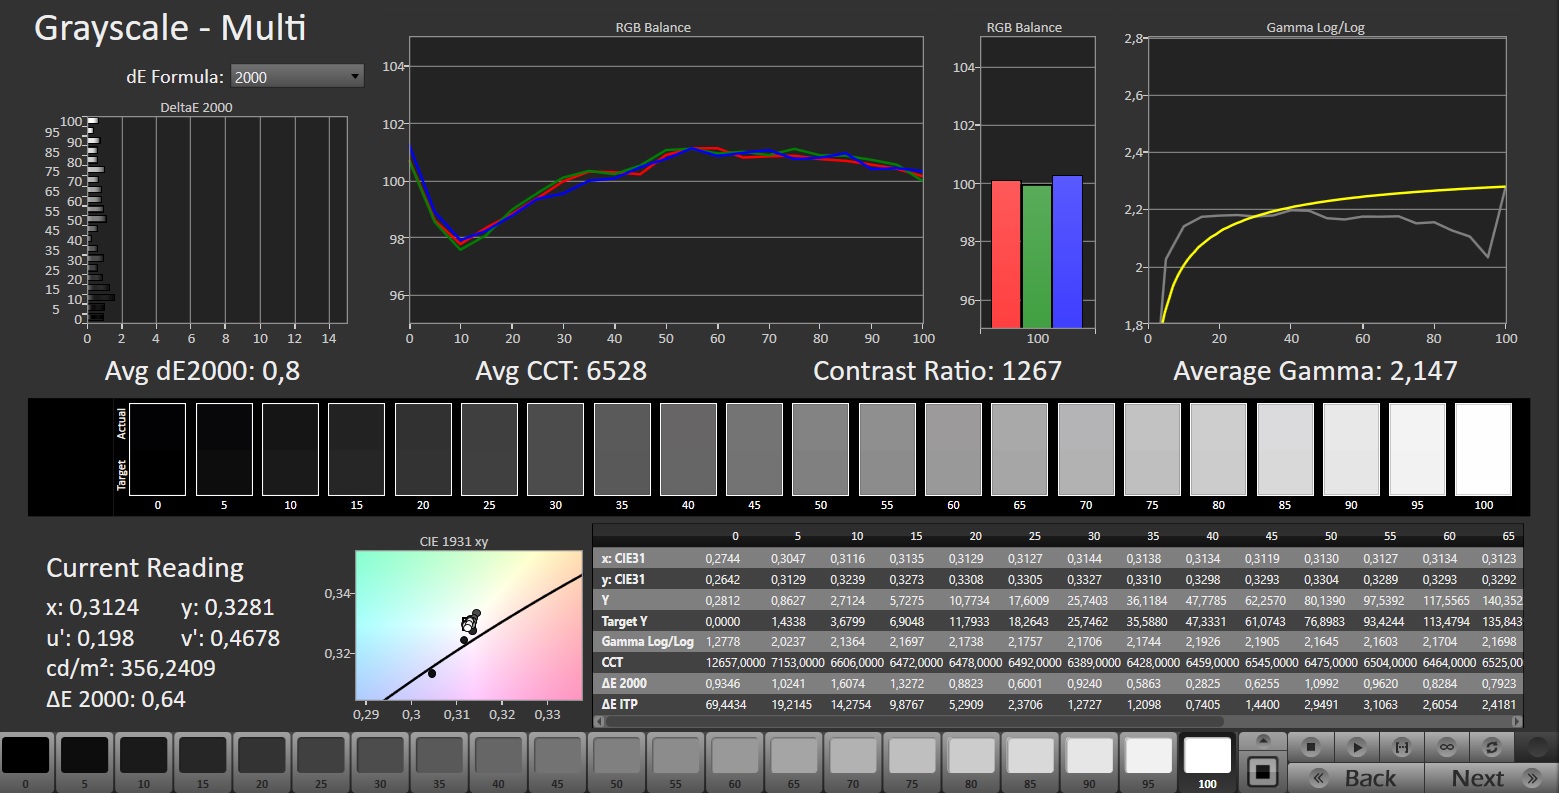
Le panneau 240 Hz à réaction rapide de l'appareil avec un rapport d'aspect de 16:10 ne montre aucun signe de scintillement PWM à n'importe quel niveau de luminosité. La luminosité et le contraste de l'écran mat de 16 pouces (2 560 x 1 600 pixels) atteignent tous deux leurs objectifs respectifs (> 300 cd/m² et 1 000:1). Aucun autre écran n'est disponible.
| |||||||||||||||||||||||||
Homogénéité de la luminosité: 93 %
Valeur mesurée au centre, sur batterie: 349 cd/m²
Contraste: 1091:1 (Valeurs des noirs: 0.32 cd/m²)
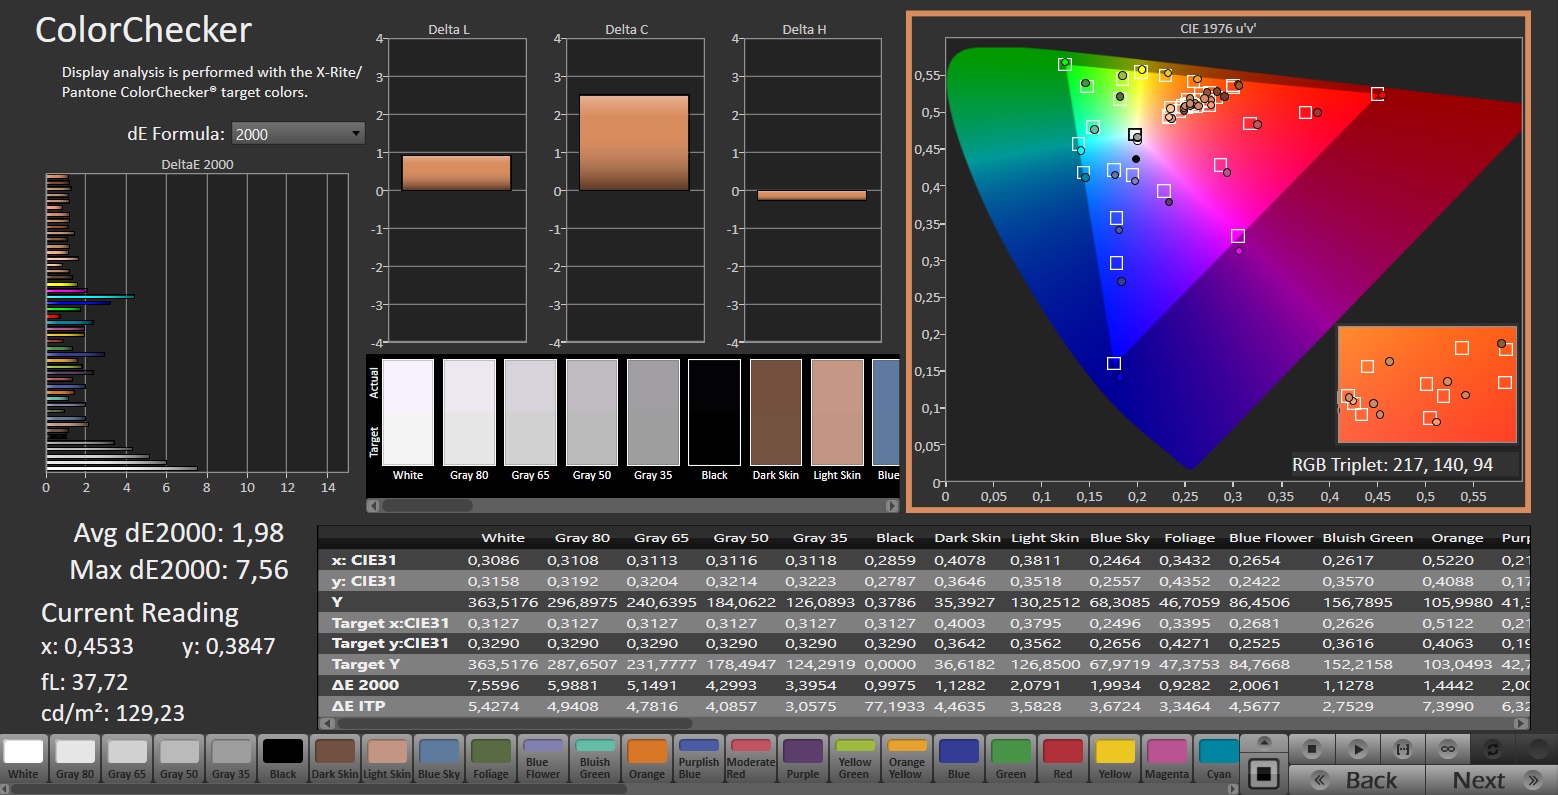
ΔE ColorChecker Calman: 1.98 | ∀{0.5-29.43 Ø4.71}
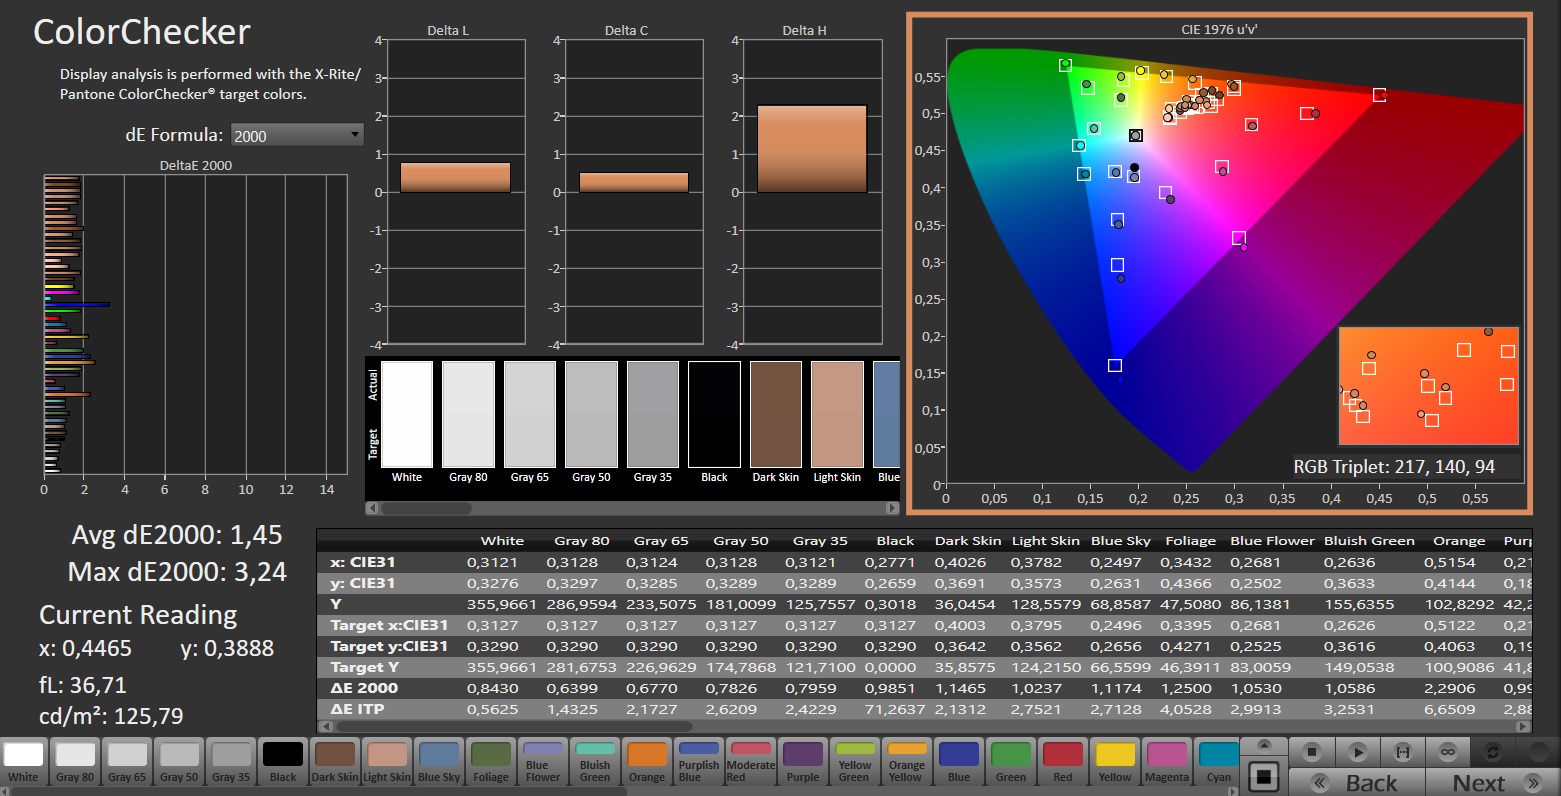
calibrated: 1.45
ΔE Greyscale Calman: 3.3 | ∀{0.09-98 Ø4.96}
70.1% AdobeRGB 1998 (Argyll 3D)
98.2% sRGB (Argyll 3D)
69.4% Display P3 (Argyll 3D)
Gamma: 2.137
CCT: 6672 K
| Schenker XMG Pro 16 Studio (Mid 23) BOE CQ NE160QDM-NZ1, IPS, 2560x1600, 16" | Asus Vivobook Pro 16X K6604JV-MX016W Samsung SDC4178 ATNA60BX01-1, OLED, 3200x2000, 16" | Lenovo Legion Slim 7i 16 Gen 8 CSOT T3 MNG007DA2-3, IPS, 2560x1600, 16" | HP Omen Transcend 16 AUOA3A6, Mini-LED, 2560x1600, 16" | MSI Stealth 16 Studio A13VG AUO26A9, IPS, 2560x1600, 16" | |
|---|---|---|---|---|---|
| Display | 27% | 2% | 23% | 21% | |
| Display P3 Coverage (%) | 69.4 | 98.4 42% | 70.4 1% | 99.2 43% | 96.4 39% |
| sRGB Coverage (%) | 98.2 | 99.7 2% | 99.4 1% | 100 2% | 99.7 2% |
| AdobeRGB 1998 Coverage (%) | 70.1 | 95.8 37% | 72.5 3% | 87.6 25% | 84.8 21% |
| Response Times | 85% | -7% | -191% | 46% | |
| Response Time Grey 50% / Grey 80% * (ms) | 12.2 ? | 1.6 ? 87% | 12 ? 2% | 26.4 ? -116% | 4.4 ? 64% |
| Response Time Black / White * (ms) | 7.7 ? | 1.4 ? 82% | 8.9 ? -16% | 28.2 ? -266% | 5.6 ? 27% |
| PWM Frequency (Hz) | 120 ? | 3506 ? | |||
| Screen | 66% | 17% | 204% | -19% | |
| Brightness middle (cd/m²) | 349 | 347 -1% | 474.6 36% | 791.1 127% | 424 21% |
| Brightness (cd/m²) | 348 | 346 -1% | 445 28% | 800 130% | 411 18% |
| Brightness Distribution (%) | 93 | 97 4% | 86 -8% | 95 2% | 88 -5% |
| Black Level * (cd/m²) | 0.32 | 0.06 81% | 0.39 -22% | 0.04 87% | 0.37 -16% |
| Contrast (:1) | 1091 | 5783 430% | 1217 12% | 19778 1713% | 1146 5% |
| Colorchecker dE 2000 * | 1.98 | 1.89 5% | 2.12 -7% | 4.37 -121% | 3.04 -54% |
| Colorchecker dE 2000 max. * | 7.56 | 3.26 57% | 4.73 37% | 10.39 -37% | 7.5 1% |
| Colorchecker dE 2000 calibrated * | 1.45 | 1.97 -36% | 0.57 61% | 1.04 28% | 3.04 -110% |
| Greyscale dE 2000 * | 3.3 | 1.55 53% | 2.8 15% | 6.5 -97% | 4.34 -32% |
| Gamma | 2.137 103% | 2.39 92% | 2.22 99% | 2.28 96% | 2.32 95% |
| CCT | 6672 97% | 6458 101% | 6542 99% | 6000 108% | 6952 93% |
| Moyenne finale (programmes/paramètres) | 59% /
60% | 4% /
10% | 12% /
109% | 16% /
-1% |
* ... Moindre est la valeur, meilleures sont les performances
Dès sa sortie de la boîte, l'écran montre une représentation des couleurs assez bonne : Avec une déviation d'environ 2, l'objectif (DeltaE < 3) est atteint. L'étalonnage de l'écran permet d'obtenir un écart plus faible de 1,45 et des tons gris plus équilibrés. L'écran peut presque entièrement représenter l'espace colorimétrique sRGB, mais pas AdobeRGB ni DCI P3. Sur ce point, la concurrence a parfois plus à offrir.

Temps de réponse de l'écran
| ↔ Temps de réponse noir à blanc | ||
|---|---|---|
| 7.7 ms ... hausse ↗ et chute ↘ combinées | ↗ 4 ms hausse | 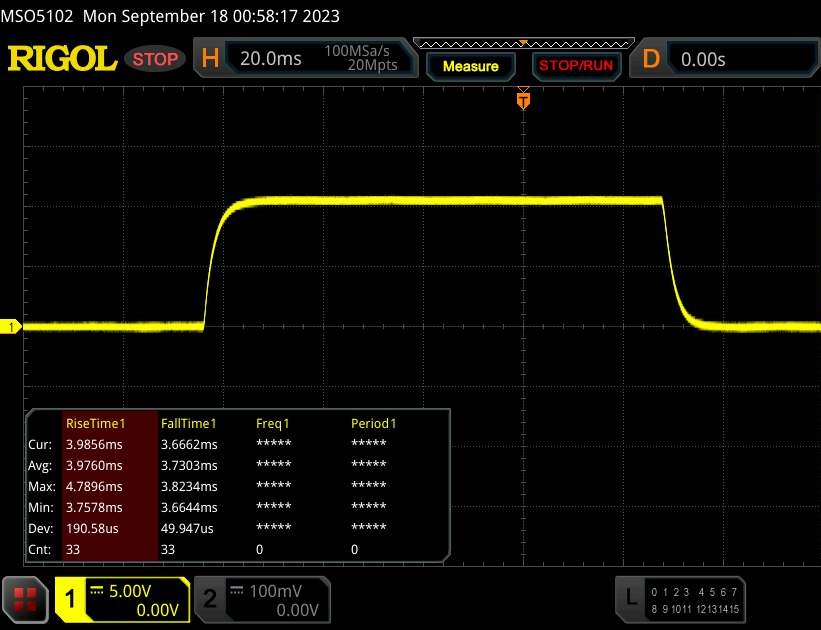 |
| ↘ 3.7 ms chute | ||
| L'écran montre de très faibles temps de réponse, parfait pour le jeu. En comparaison, tous les appareils testés affichent entre 0.1 (minimum) et 240 (maximum) ms. » 22 % des appareils testés affichent de meilleures performances. Cela signifie que les latences relevées sont meilleures que la moyenne (19.8 ms) de tous les appareils testés. | ||
| ↔ Temps de réponse gris 50% à gris 80% | ||
| 12.2 ms ... hausse ↗ et chute ↘ combinées | ↗ 5.9 ms hausse | 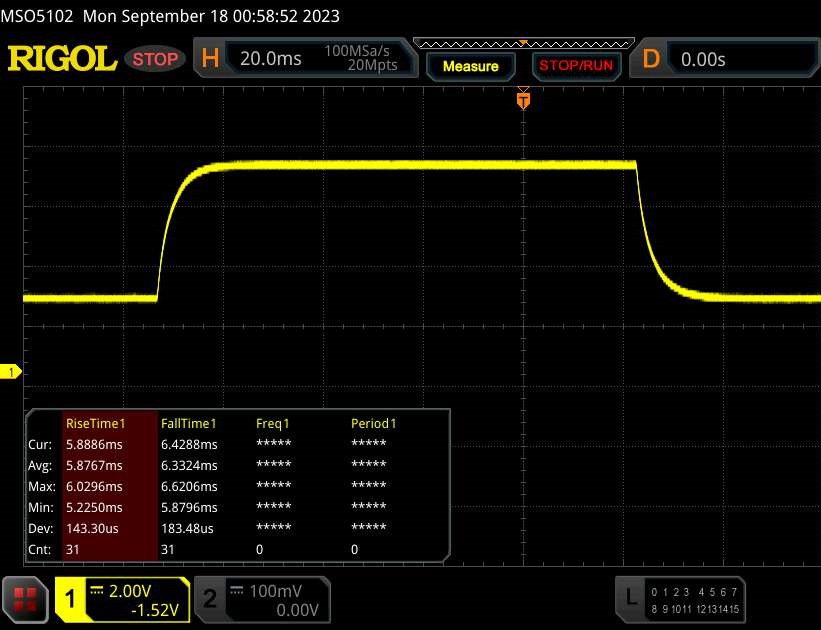 |
| ↘ 6.3 ms chute | ||
| L'écran montre de bons temps de réponse, mais insuffisant pour du jeu compétitif. En comparaison, tous les appareils testés affichent entre 0.165 (minimum) et 636 (maximum) ms. » 26 % des appareils testés affichent de meilleures performances. Cela signifie que les latences relevées sont meilleures que la moyenne (31 ms) de tous les appareils testés. | ||
Scintillement / MLI (Modulation de largeur d'impulsion)
| Scintillement / MLI (Modulation de largeur d'impulsion) non décelé | 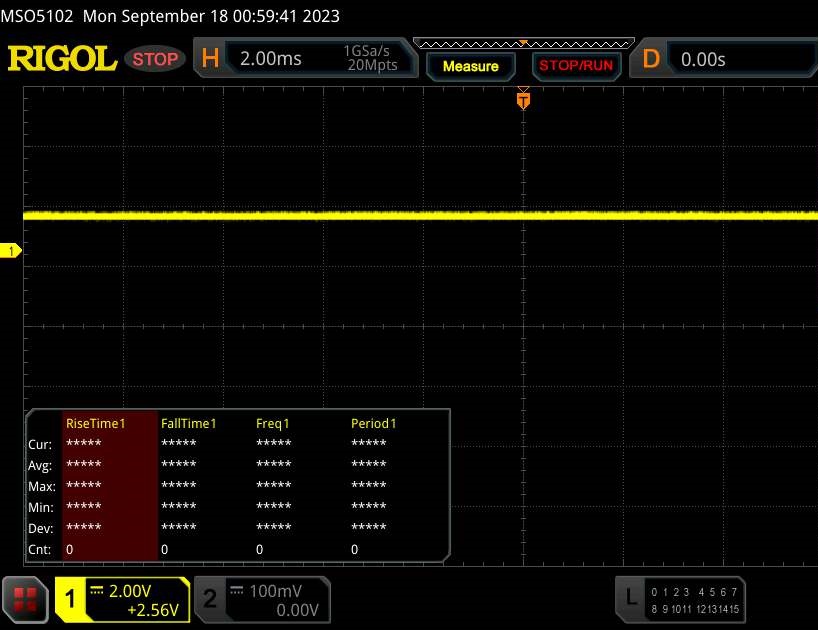 | ||
En comparaison, 52 % des appareils testés n'emploient pas MDI pour assombrir leur écran. Nous avons relevé une moyenne à 7757 (minimum : 5 - maximum : 343500) Hz dans le cas où une MDI était active. | |||
L'écran IPS de l'ordinateur portable reste lisible sous tous les angles. À l'extérieur, vous pouvez lire sur l'écran tant que le soleil ne brille pas trop fort.
Performance - L'ordinateur portable Schenker s'appuie sur Raptor Lake et Ada Lovelace
La XMG Pro 16 Studio, orientée vers les joueurs et les créateurs, s'appuie sur Raptor Lake et Ada Lovelace. La certification GeForce RTX Studio est censée garantir des performances élevées, des pilotes personnalisés, un bon support logiciel et une couverture adéquate de l'espace colorimétrique de l'écran. L'ordinateur portable peut être configuré individuellement via la boutique en ligne de Schenker. La variante actuelle est disponible pour environ 2 400 dollars et les modèles moins chers commencent à partir de 1 900 dollars.
Conditions d'essai
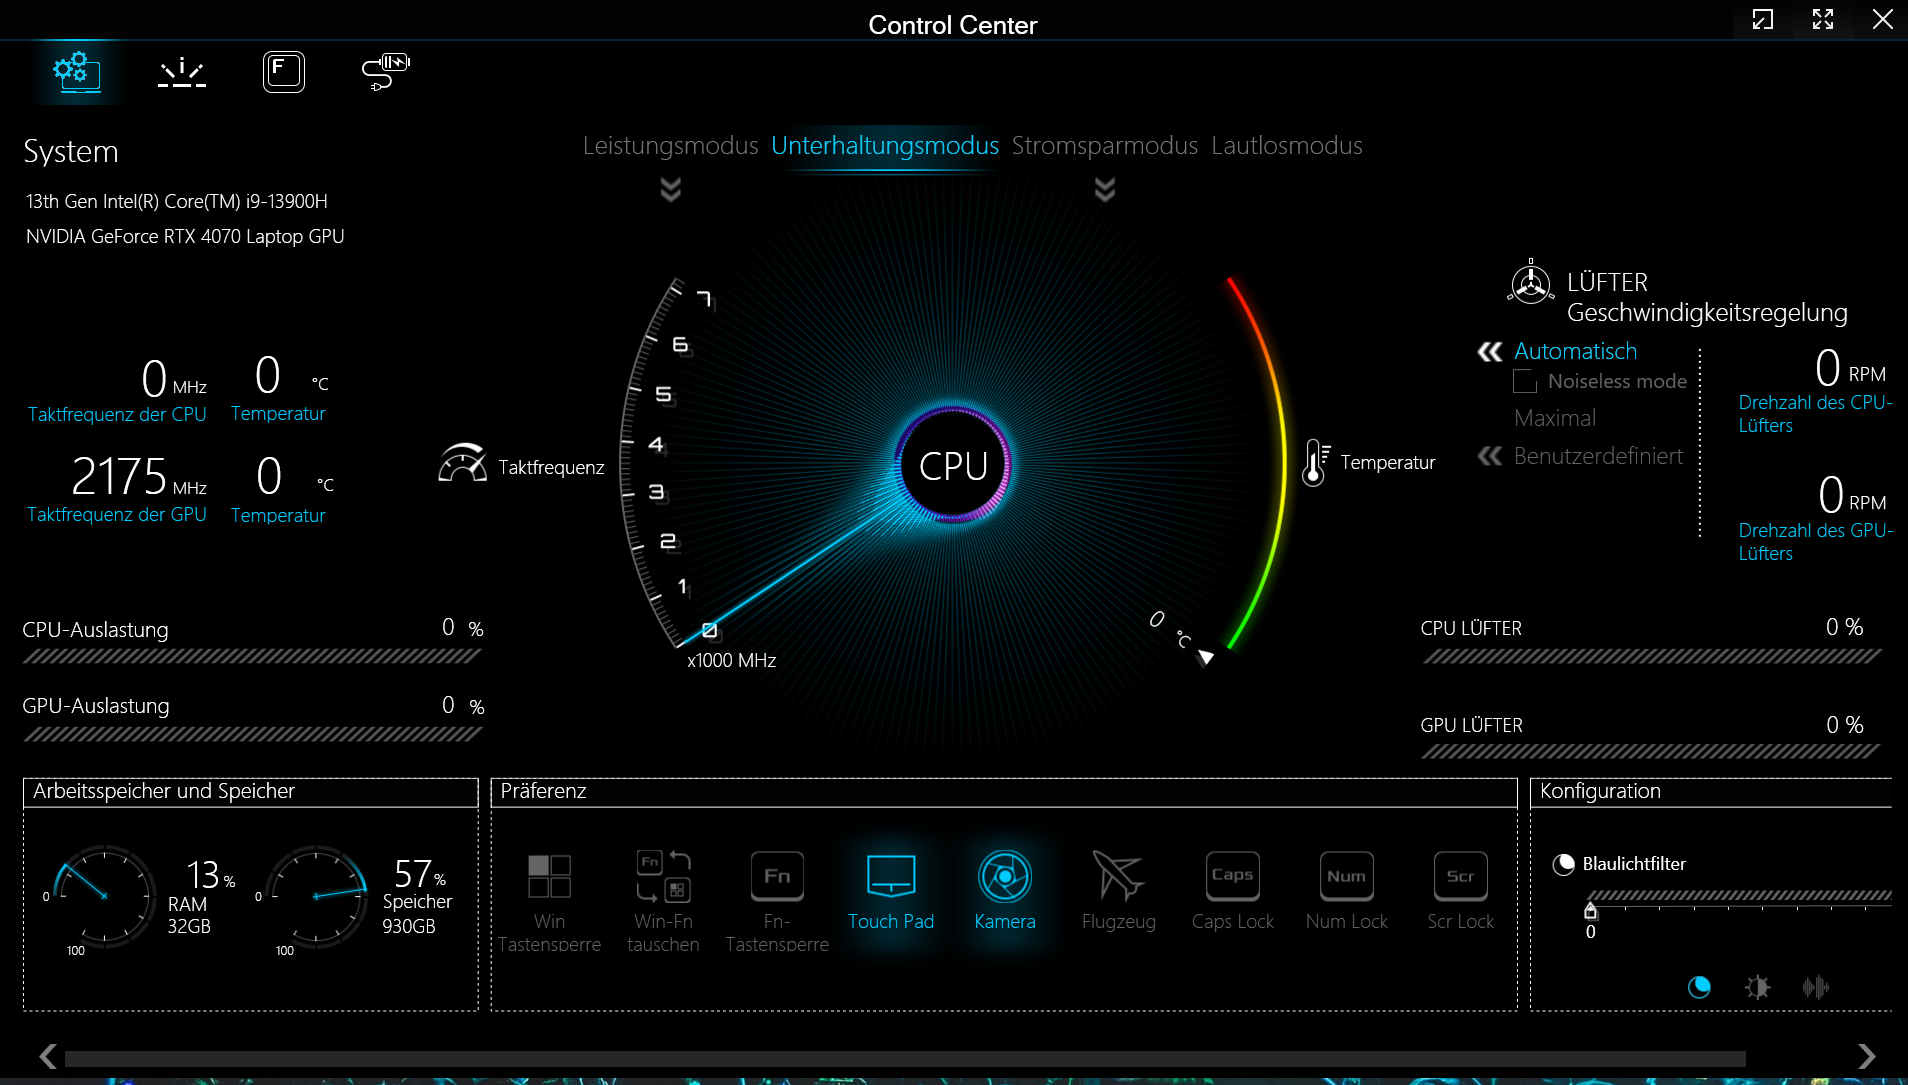
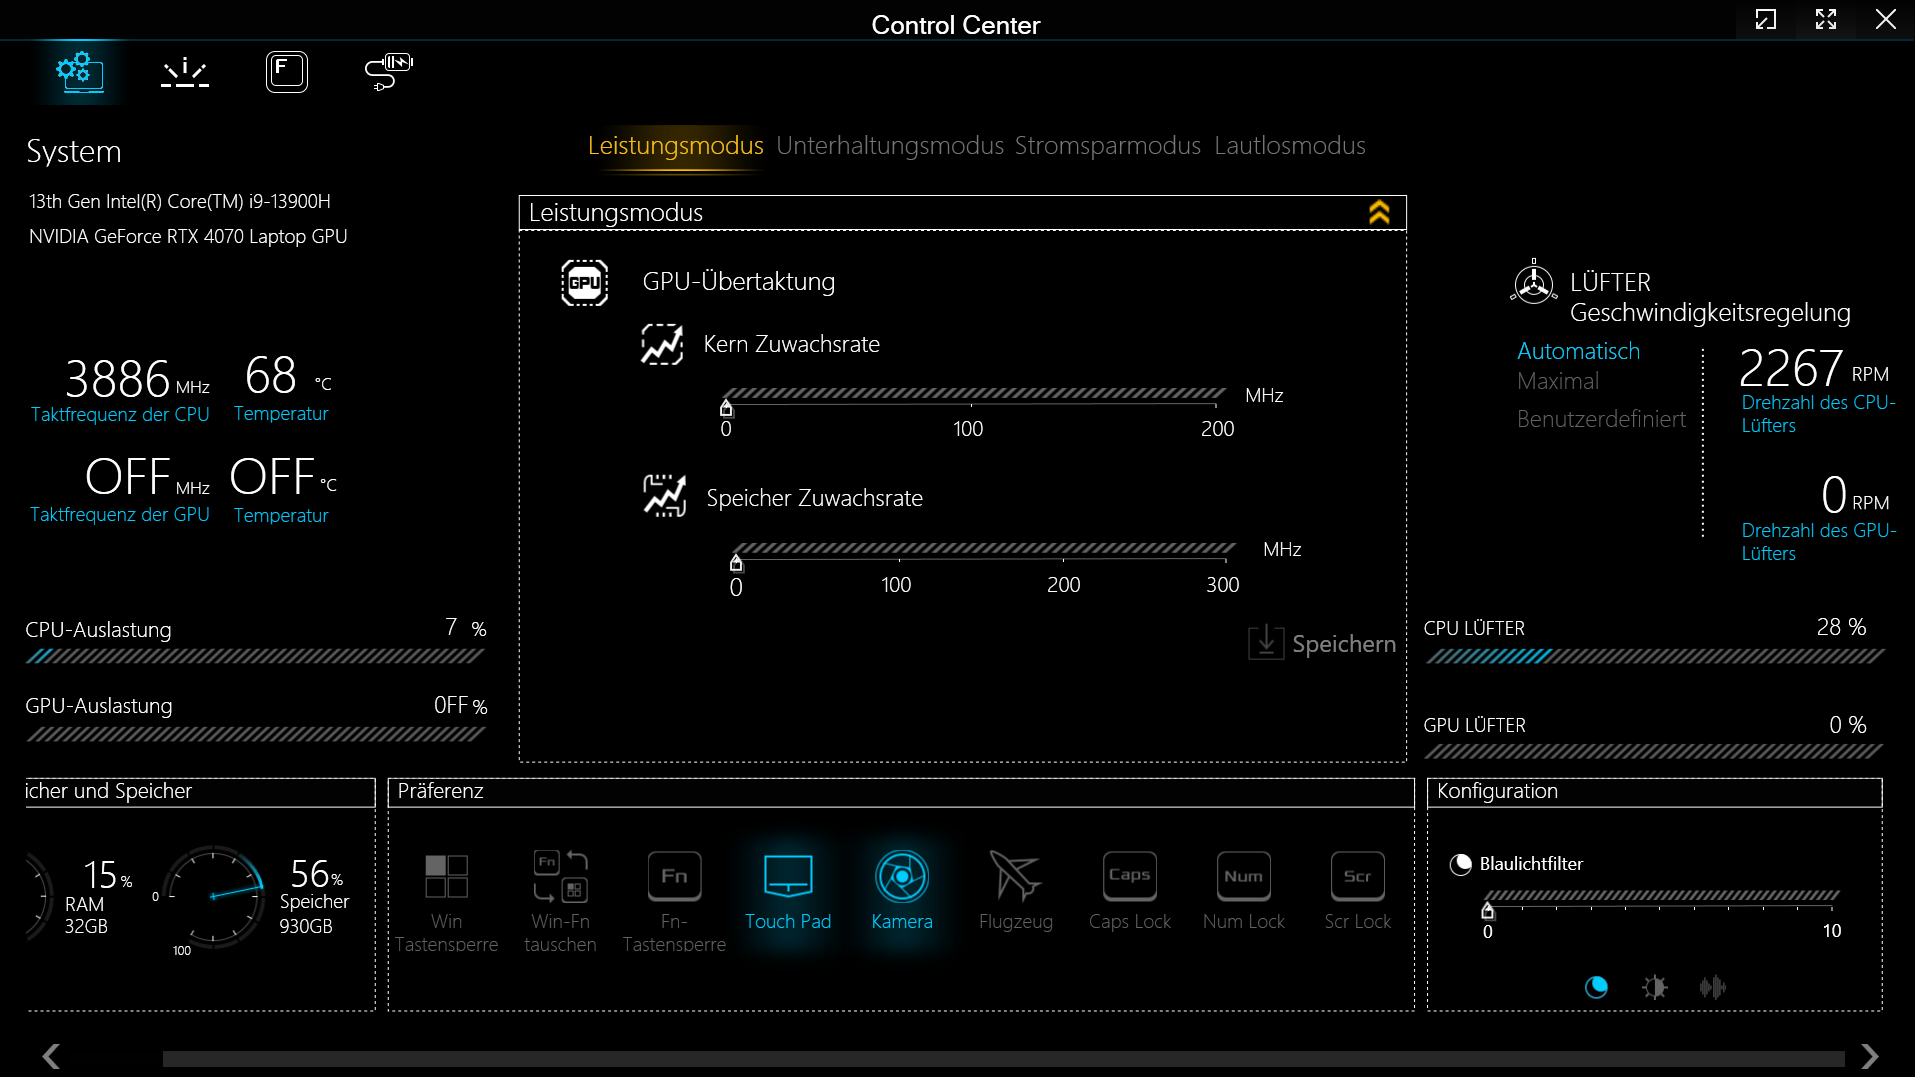
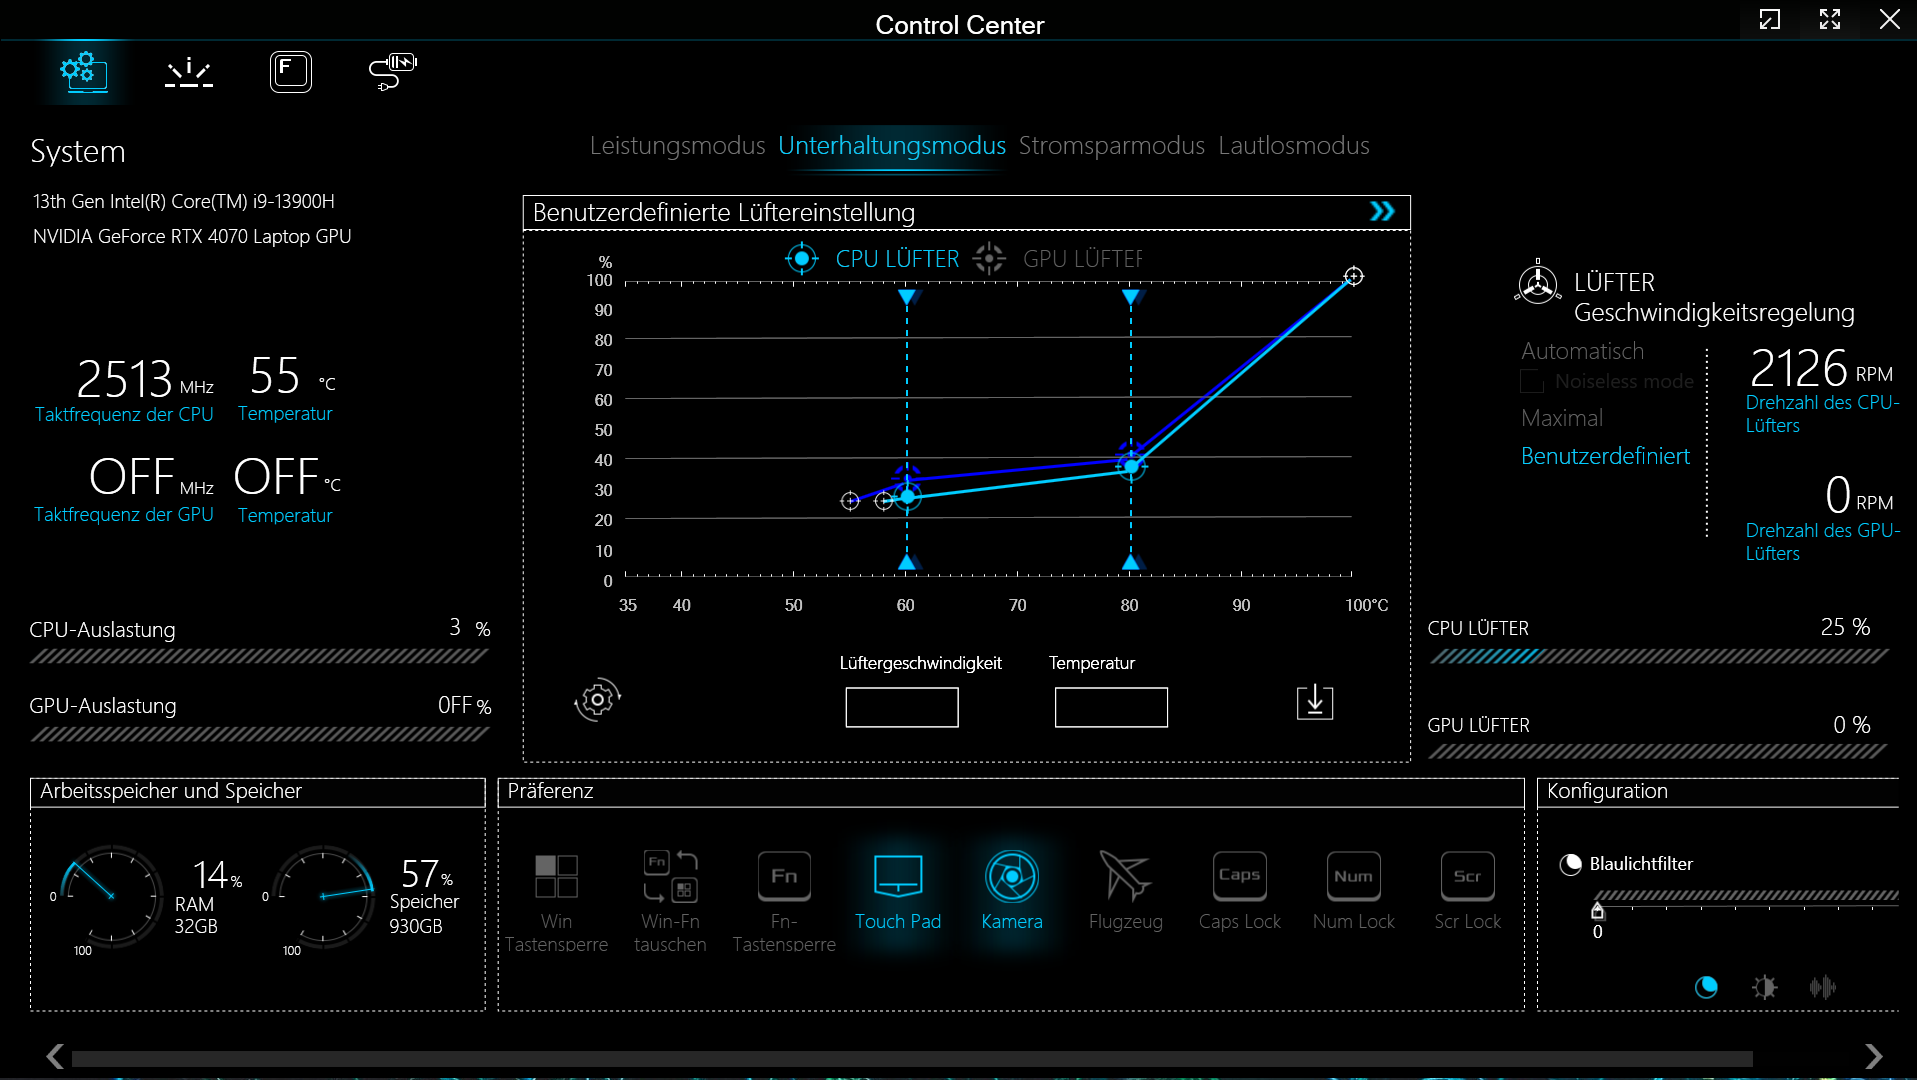
Le Pro offre quatre modes de performance spécifiques au fabricant (voir tableau) entre lesquels il est possible de basculer via le logiciel Control Center (le centre de contrôle de l'ordinateur portable). les modes "Entertainment Mode" (benchmarks) et "Power Saving Mode" (tests de batterie) ont été utilisés. Optimus était actif.
| Mode divertissement | Mode performance | Mode économie d'énergie | Mode silencieux | |
|---|---|---|---|---|
| Limite de puissance 1 (HWInfo) | 70 watts | 100 watts | 15 watts | 15 watts |
| Limite de puissance 2 (HWInfo) | 90 watts | 120 watts | 30 watts | 30 watts |
| Bruit (Witcher 3) | 48 dB(A) | 55 dB (A) | - | 42 dB (A) |
| Performance (Witcher 3) | ~114 fps | ~118 fps | - | ~100-114 fps |
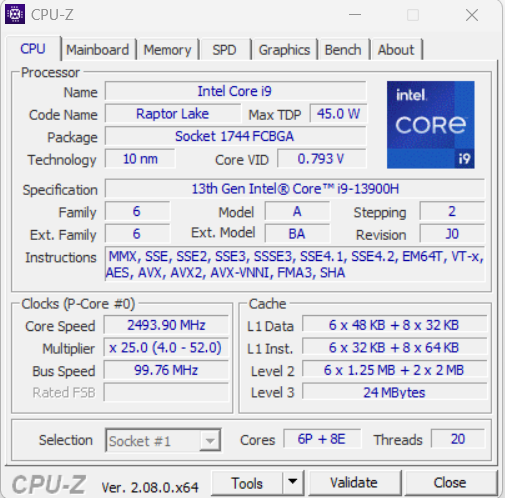
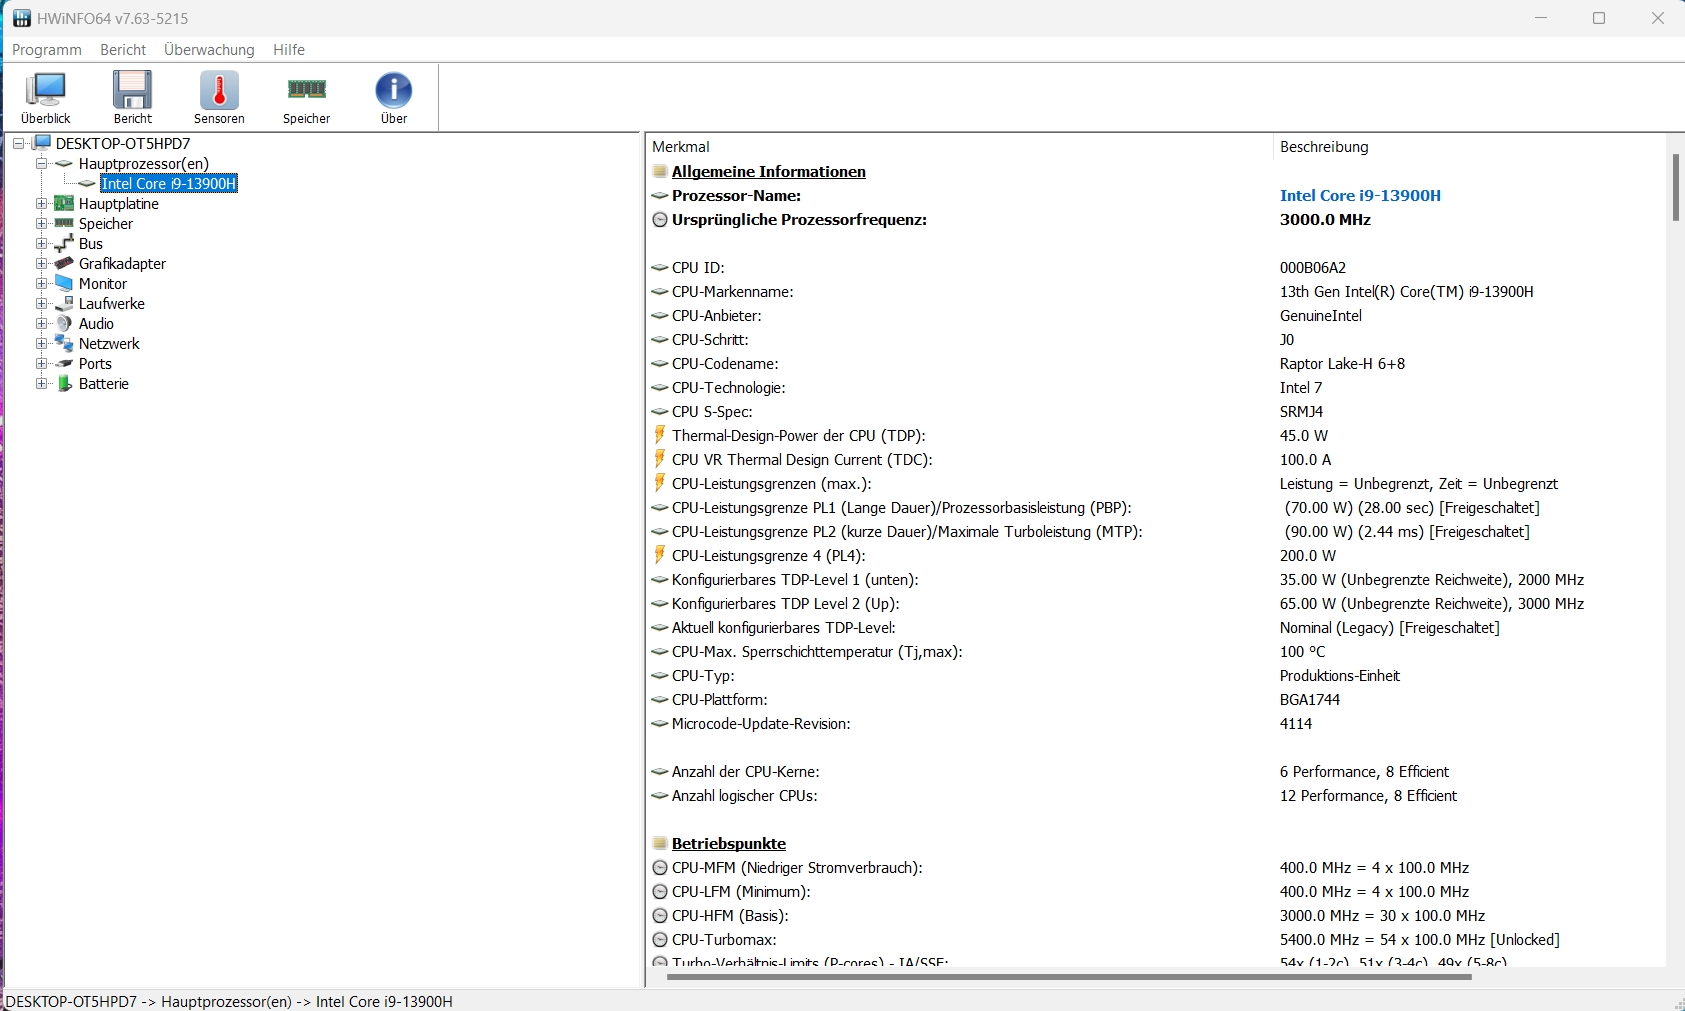
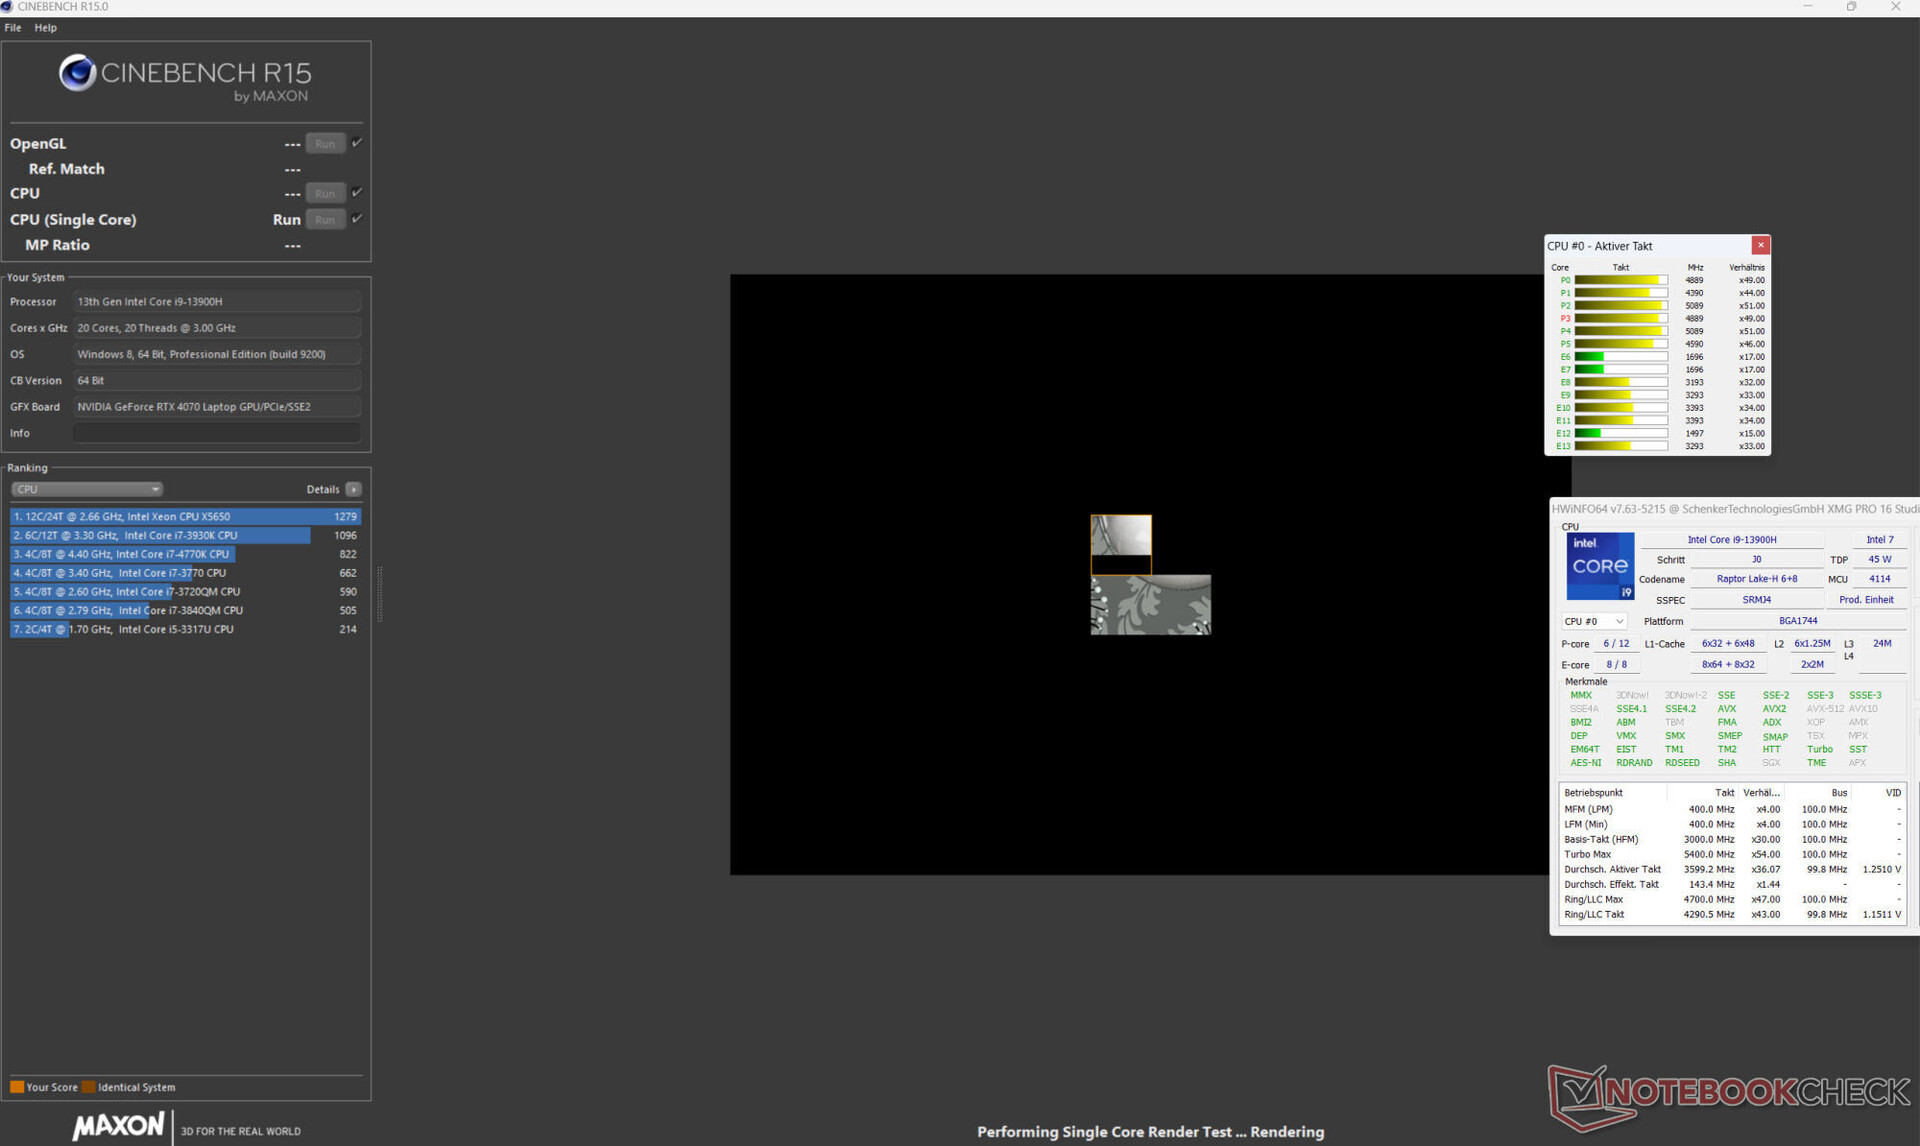
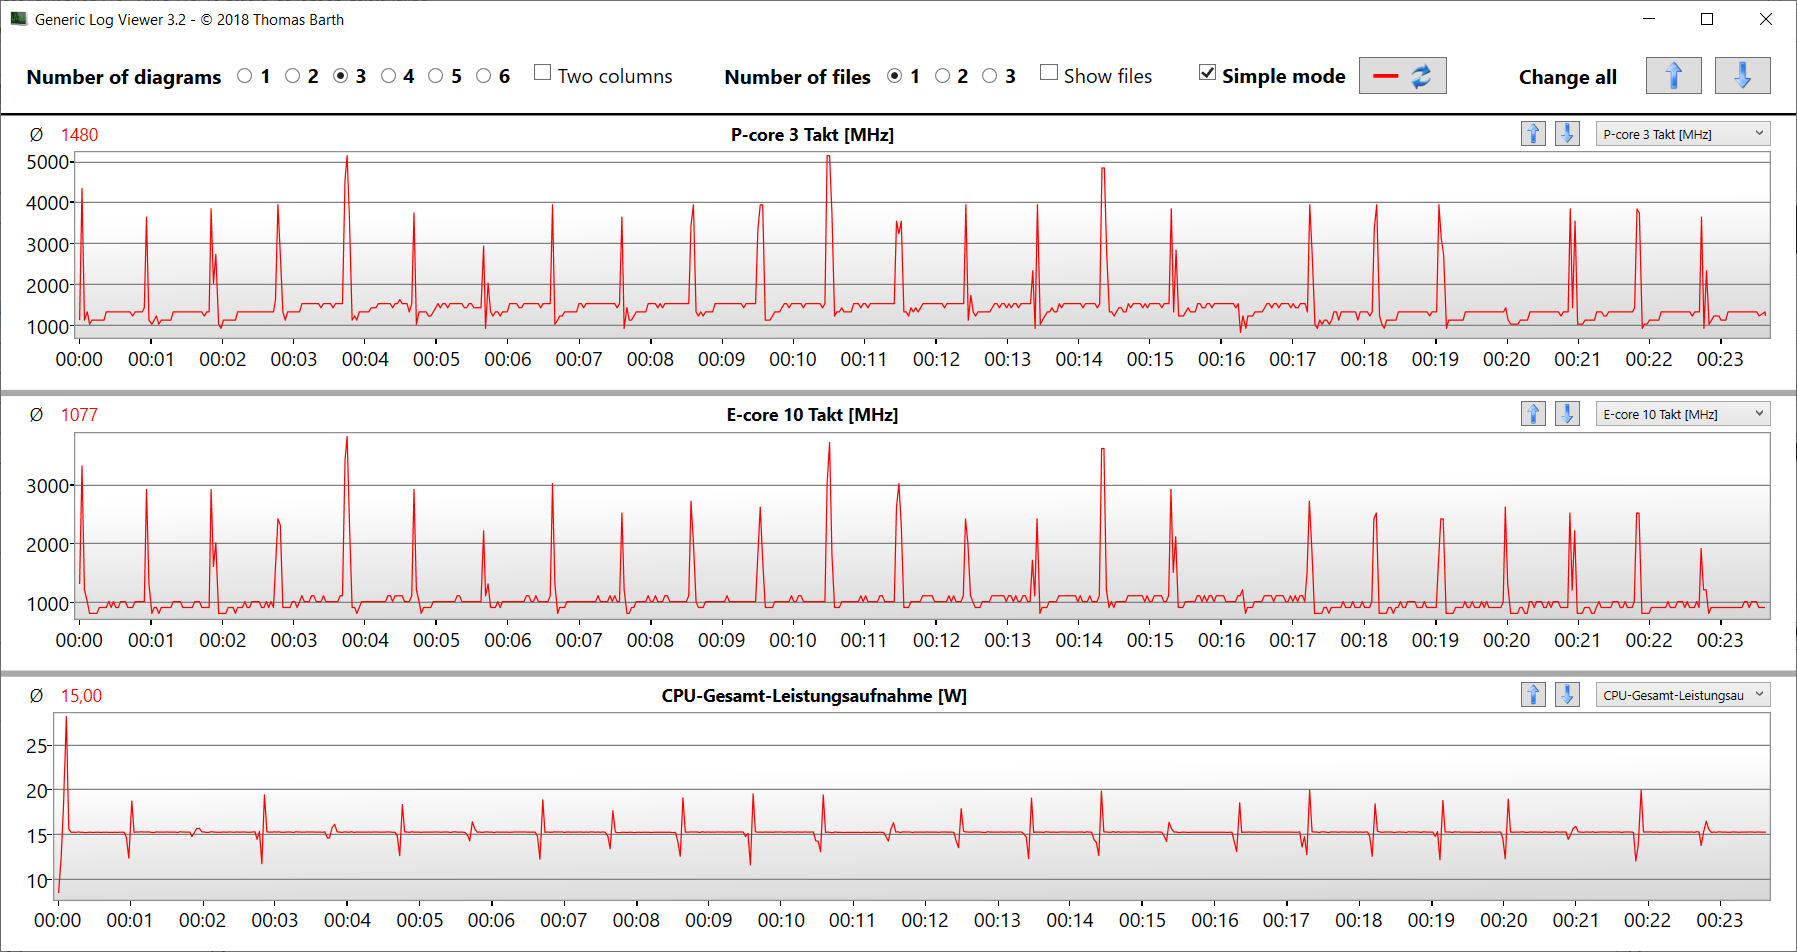
Processeur
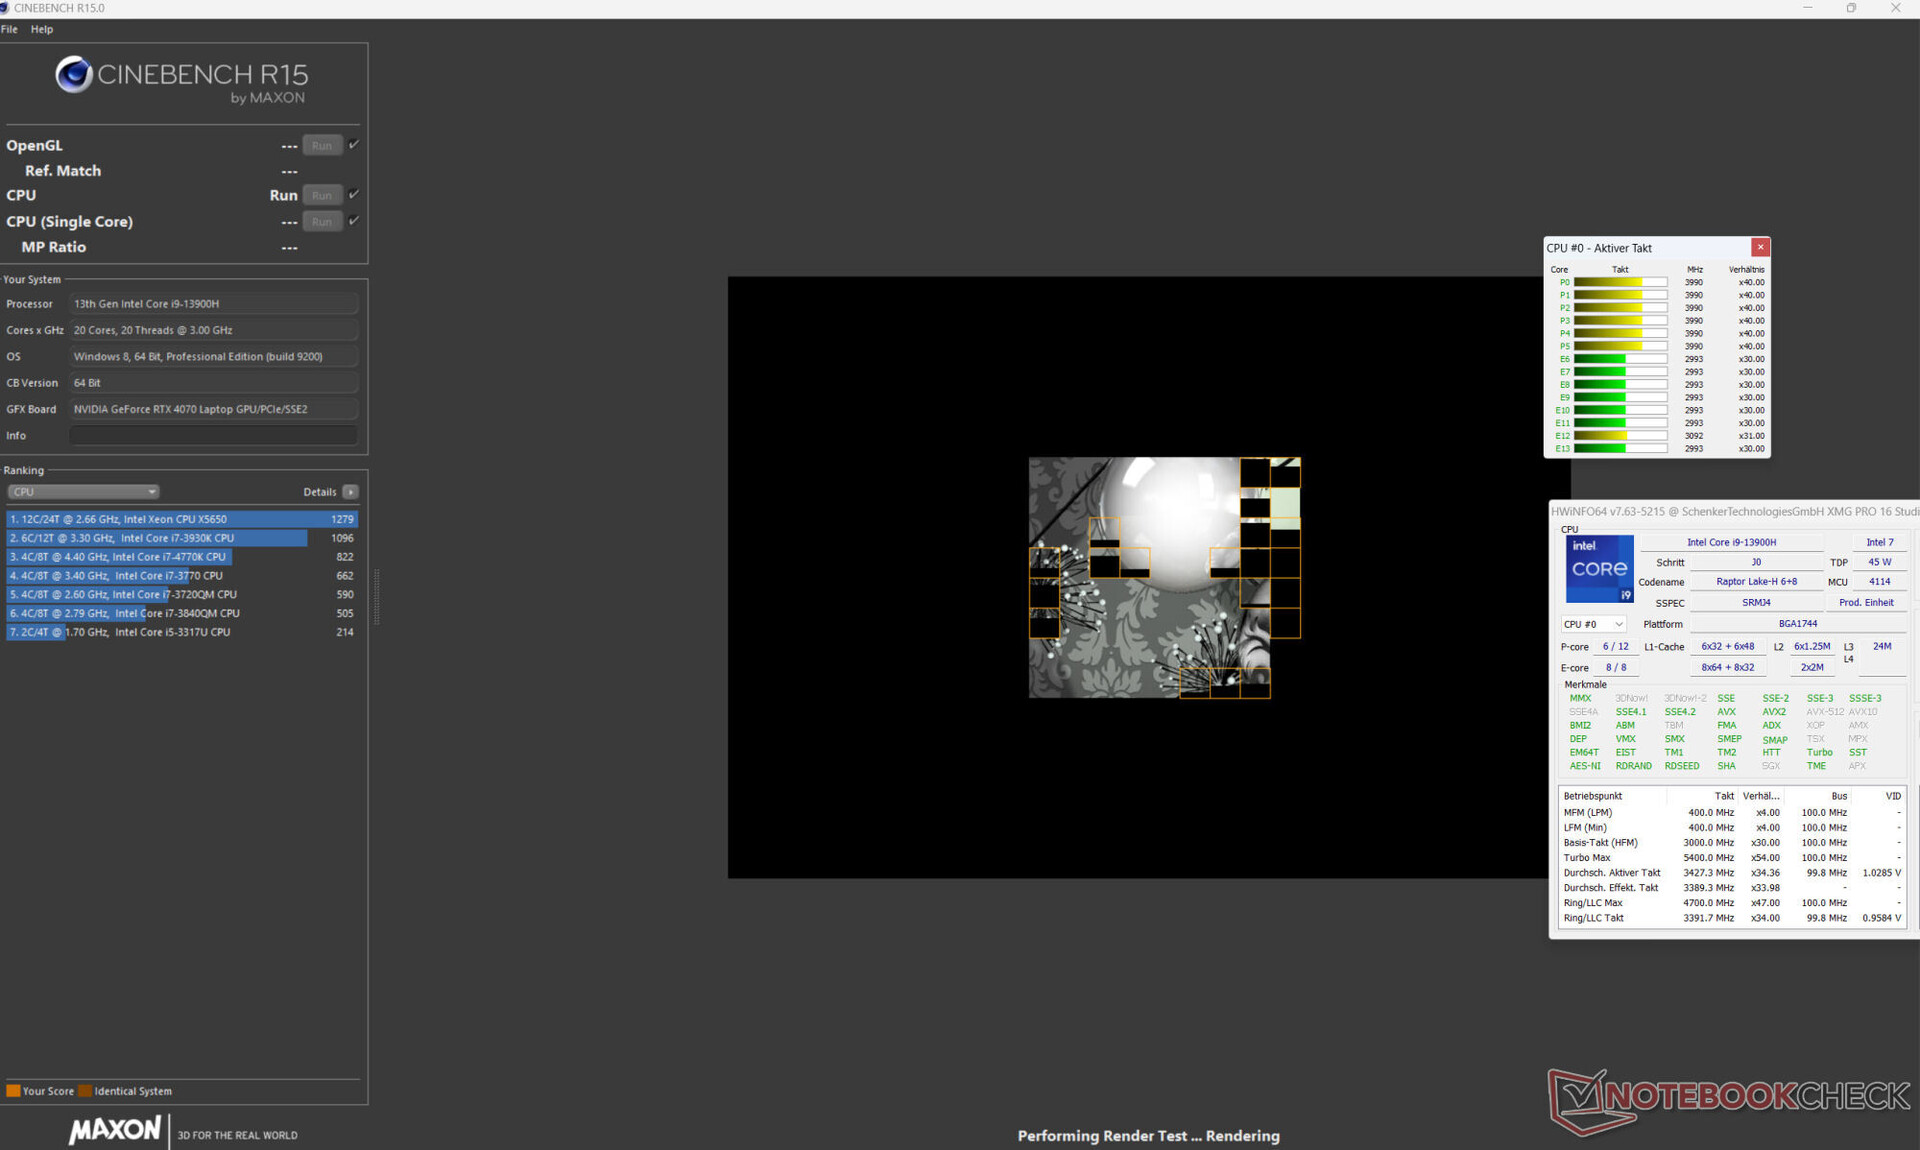
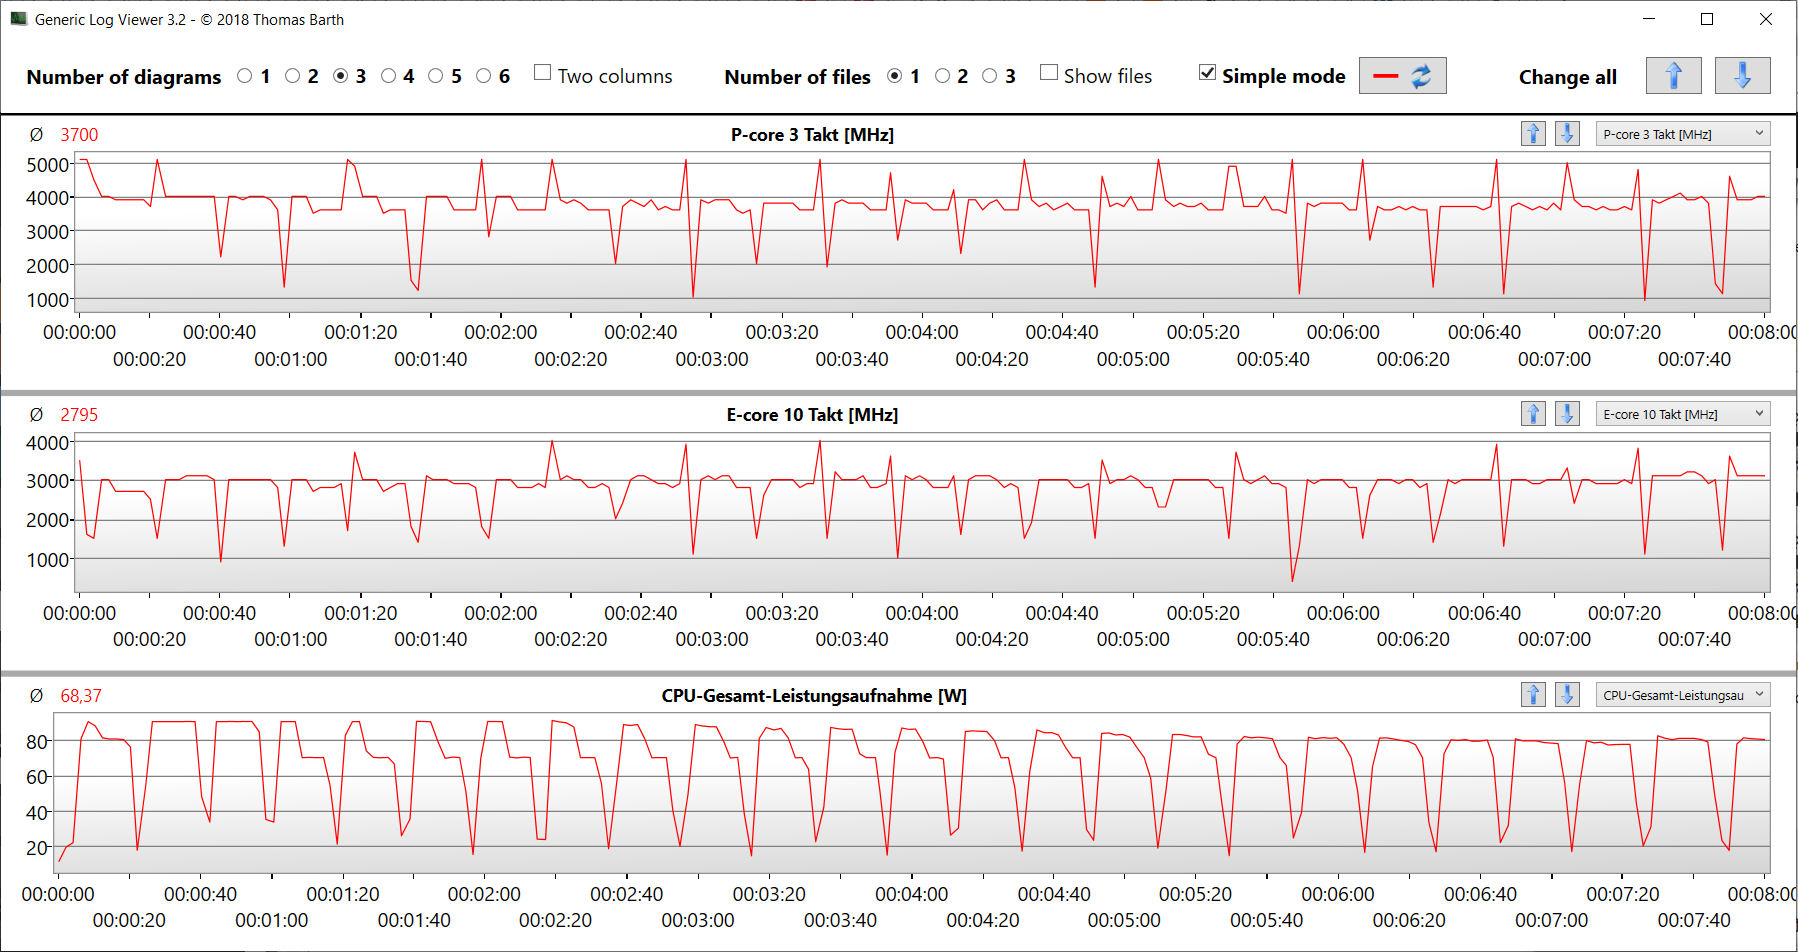
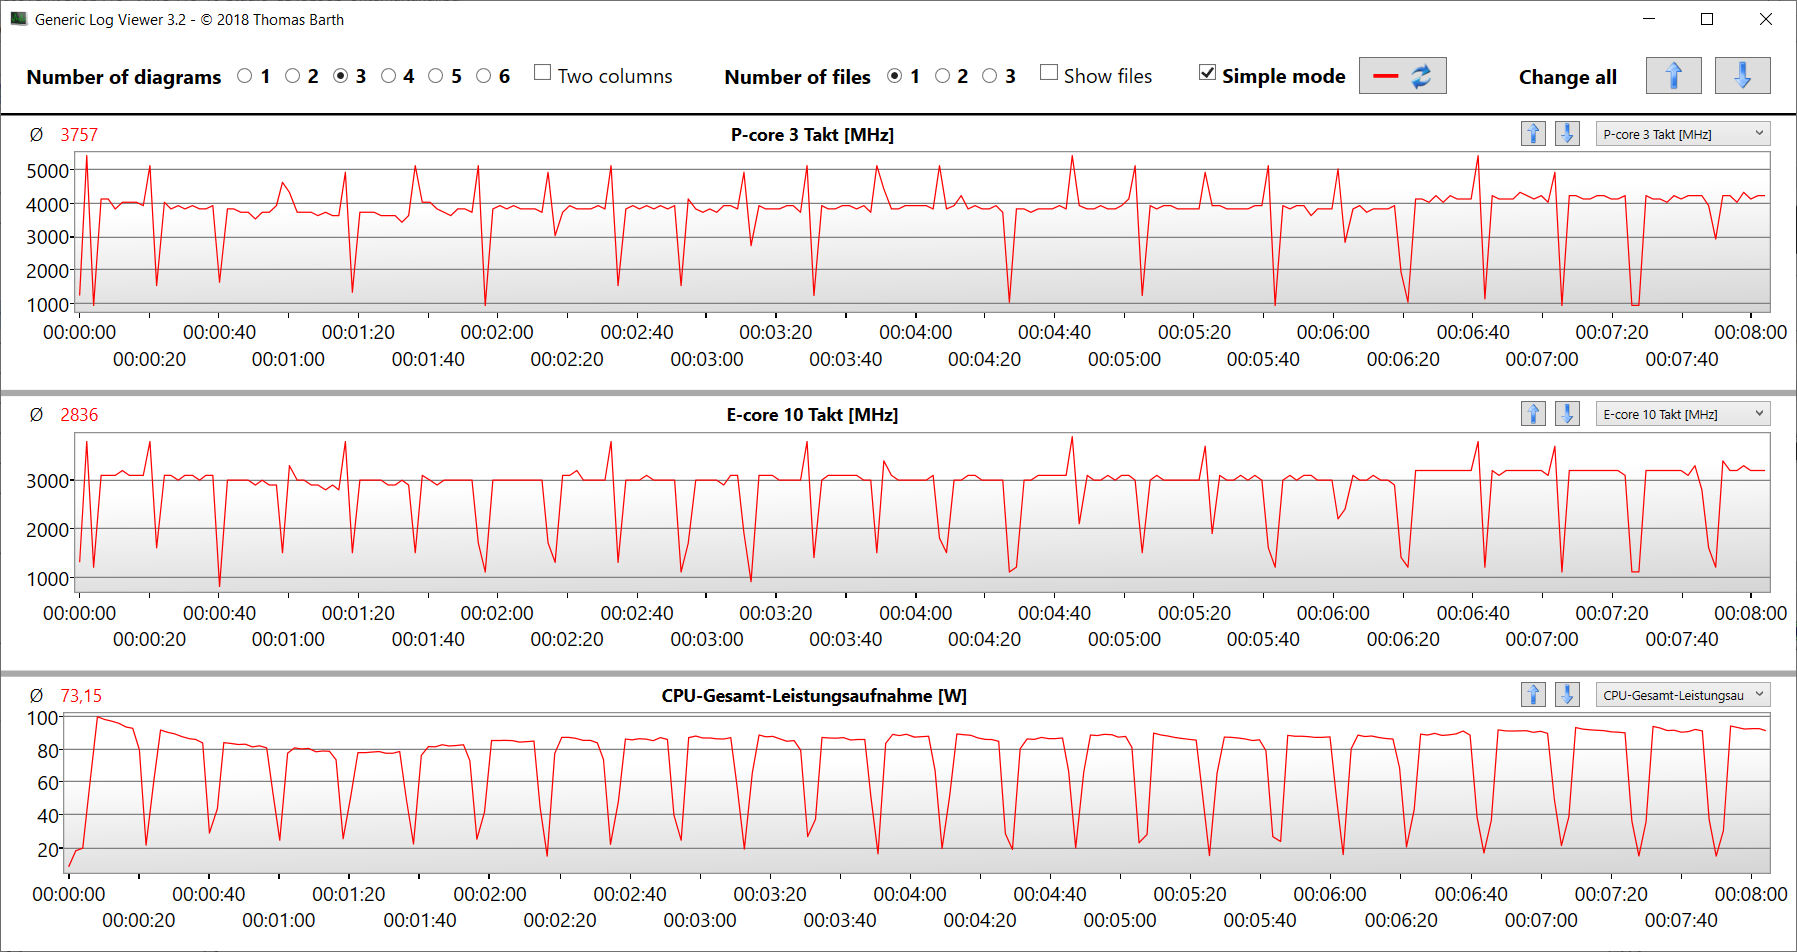
LeCore i9-13900H(6P, 8E) atteignent des fréquences maximales de 5,4 GHz (P) et de 4,1 GHz (E). La charge multithread permanente (boucle CB15) a entraîné une légère baisse de la fréquence d'horloge entre la première et la quatrième exécution. Ensuite, les valeurs sont restées constantes.
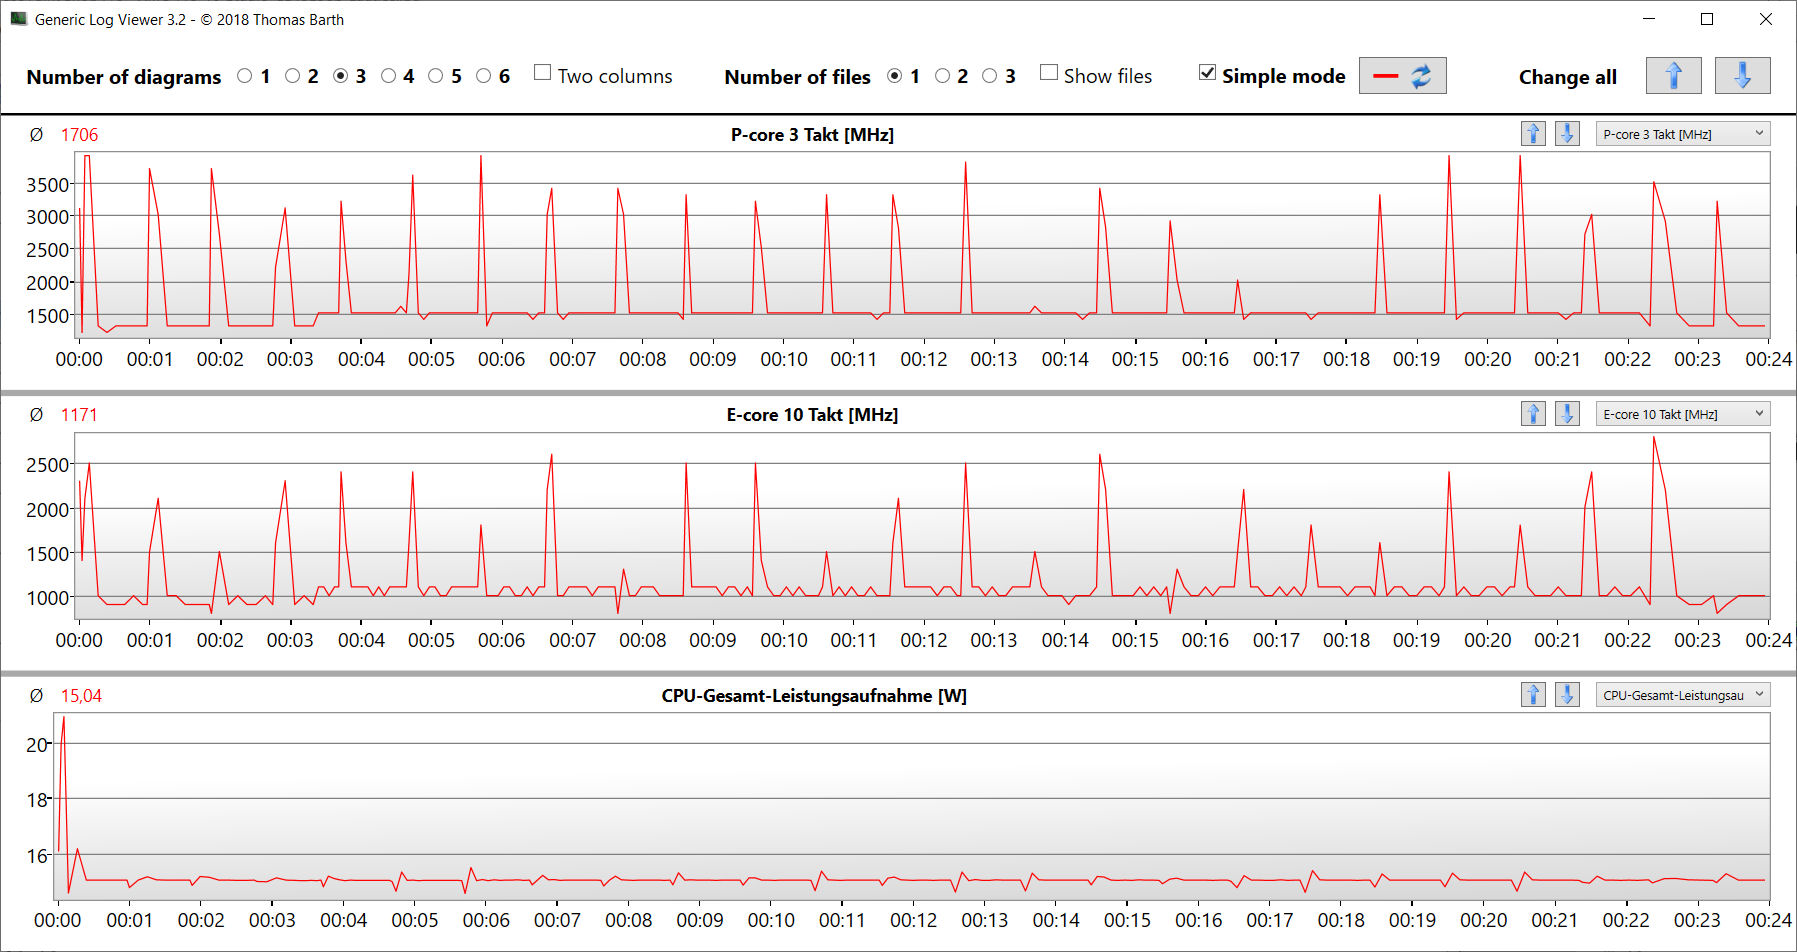
Nous avons mesuré des résultats de référence légèrement supérieurs à la moyenne du processeur déterminée précédemment (connecté au secteur). En mode batterie, les performances les plus pertinentes en mode monotâche (158 points ; CB15) ont chuté davantage que les performances en mode multithread (1 696 points ; CB15).
Cinebench R15 Multi continuous test
* ... Moindre est la valeur, meilleures sont les performances
AIDA64: FP32 Ray-Trace | FPU Julia | CPU SHA3 | CPU Queen | FPU SinJulia | FPU Mandel | CPU AES | CPU ZLib | FP64 Ray-Trace | CPU PhotoWorxx
| Performance rating | |
| Moyenne de la classe Gaming | |
| HP Omen Transcend 16 | |
| Asus Vivobook Pro 16X K6604JV-MX016W | |
| Schenker XMG Pro 16 Studio (Mid 23) | |
| MSI Stealth 16 Studio A13VG | |
| Lenovo Legion Slim 7i 16 Gen 8 | |
| Moyenne Intel Core i9-13900H | |
| AIDA64 / FP32 Ray-Trace | |
| Moyenne de la classe Gaming (10227 - 85542, n=105, 2 dernières années) | |
| HP Omen Transcend 16 | |
| Asus Vivobook Pro 16X K6604JV-MX016W | |
| MSI Stealth 16 Studio A13VG | |
| Lenovo Legion Slim 7i 16 Gen 8 | |
| Schenker XMG Pro 16 Studio (Mid 23) | |
| Moyenne Intel Core i9-13900H (6788 - 19557, n=25) | |
| AIDA64 / FPU Julia | |
| Moyenne de la classe Gaming (51376 - 238426, n=105, 2 dernières années) | |
| HP Omen Transcend 16 | |
| Asus Vivobook Pro 16X K6604JV-MX016W | |
| Lenovo Legion Slim 7i 16 Gen 8 | |
| Schenker XMG Pro 16 Studio (Mid 23) | |
| MSI Stealth 16 Studio A13VG | |
| Moyenne Intel Core i9-13900H (22551 - 95579, n=25) | |
| AIDA64 / CPU SHA3 | |
| Moyenne de la classe Gaming (2180 - 10115, n=105, 2 dernières années) | |
| HP Omen Transcend 16 | |
| Asus Vivobook Pro 16X K6604JV-MX016W | |
| MSI Stealth 16 Studio A13VG | |
| Lenovo Legion Slim 7i 16 Gen 8 | |
| Schenker XMG Pro 16 Studio (Mid 23) | |
| Moyenne Intel Core i9-13900H (2491 - 4270, n=25) | |
| AIDA64 / CPU Queen | |
| Asus Vivobook Pro 16X K6604JV-MX016W | |
| HP Omen Transcend 16 | |
| Lenovo Legion Slim 7i 16 Gen 8 | |
| Moyenne de la classe Gaming (49785 - 173351, n=90, 2 dernières années) | |
| MSI Stealth 16 Studio A13VG | |
| Moyenne Intel Core i9-13900H (65121 - 120936, n=25) | |
| Schenker XMG Pro 16 Studio (Mid 23) | |
| AIDA64 / FPU SinJulia | |
| Moyenne de la classe Gaming (4424 - 33636, n=105, 2 dernières années) | |
| Asus Vivobook Pro 16X K6604JV-MX016W | |
| HP Omen Transcend 16 | |
| Lenovo Legion Slim 7i 16 Gen 8 | |
| MSI Stealth 16 Studio A13VG | |
| Schenker XMG Pro 16 Studio (Mid 23) | |
| Moyenne Intel Core i9-13900H (6108 - 11631, n=25) | |
| AIDA64 / FPU Mandel | |
| Moyenne de la classe Gaming (25115 - 128721, n=105, 2 dernières années) | |
| HP Omen Transcend 16 | |
| Asus Vivobook Pro 16X K6604JV-MX016W | |
| Lenovo Legion Slim 7i 16 Gen 8 | |
| MSI Stealth 16 Studio A13VG | |
| Schenker XMG Pro 16 Studio (Mid 23) | |
| Moyenne Intel Core i9-13900H (11283 - 48474, n=25) | |
| AIDA64 / CPU AES | |
| Schenker XMG Pro 16 Studio (Mid 23) | |
| HP Omen Transcend 16 | |
| Moyenne de la classe Gaming (39258 - 247074, n=105, 2 dernières années) | |
| Asus Vivobook Pro 16X K6604JV-MX016W | |
| Moyenne Intel Core i9-13900H (3691 - 149377, n=25) | |
| MSI Stealth 16 Studio A13VG | |
| Lenovo Legion Slim 7i 16 Gen 8 | |
| AIDA64 / CPU ZLib | |
| HP Omen Transcend 16 | |
| Moyenne de la classe Gaming (574 - 2531, n=105, 2 dernières années) | |
| Asus Vivobook Pro 16X K6604JV-MX016W | |
| Lenovo Legion Slim 7i 16 Gen 8 | |
| Schenker XMG Pro 16 Studio (Mid 23) | |
| Moyenne Intel Core i9-13900H (789 - 1254, n=25) | |
| MSI Stealth 16 Studio A13VG | |
| AIDA64 / FP64 Ray-Trace | |
| Moyenne de la classe Gaming (5509 - 45446, n=105, 2 dernières années) | |
| HP Omen Transcend 16 | |
| Asus Vivobook Pro 16X K6604JV-MX016W | |
| MSI Stealth 16 Studio A13VG | |
| Lenovo Legion Slim 7i 16 Gen 8 | |
| Schenker XMG Pro 16 Studio (Mid 23) | |
| Moyenne Intel Core i9-13900H (3655 - 10716, n=25) | |
| AIDA64 / CPU PhotoWorxx | |
| HP Omen Transcend 16 | |
| Schenker XMG Pro 16 Studio (Mid 23) | |
| MSI Stealth 16 Studio A13VG | |
| Moyenne de la classe Gaming (12271 - 89891, n=105, 2 dernières années) | |
| Asus Vivobook Pro 16X K6604JV-MX016W | |
| Moyenne Intel Core i9-13900H (10871 - 50488, n=25) | |
| Lenovo Legion Slim 7i 16 Gen 8 | |
Performance du système
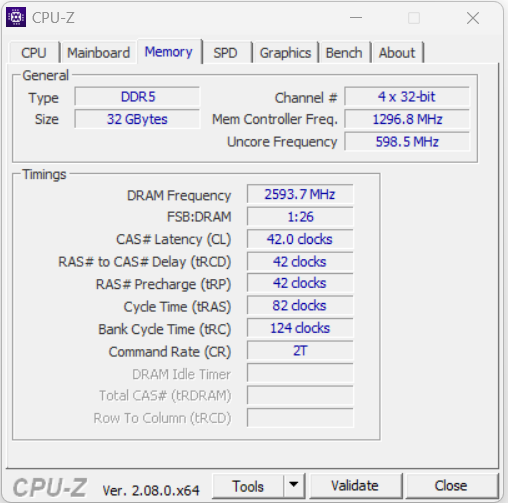
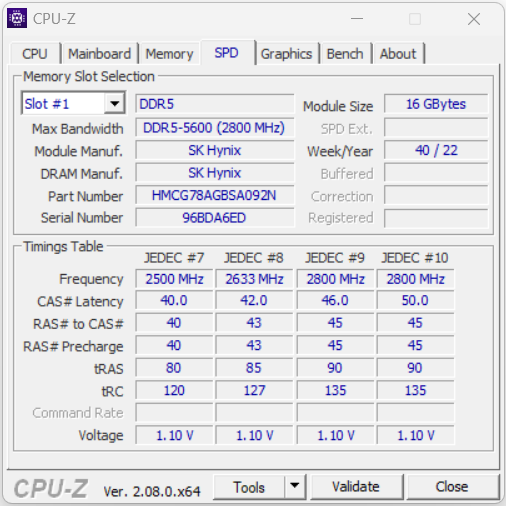
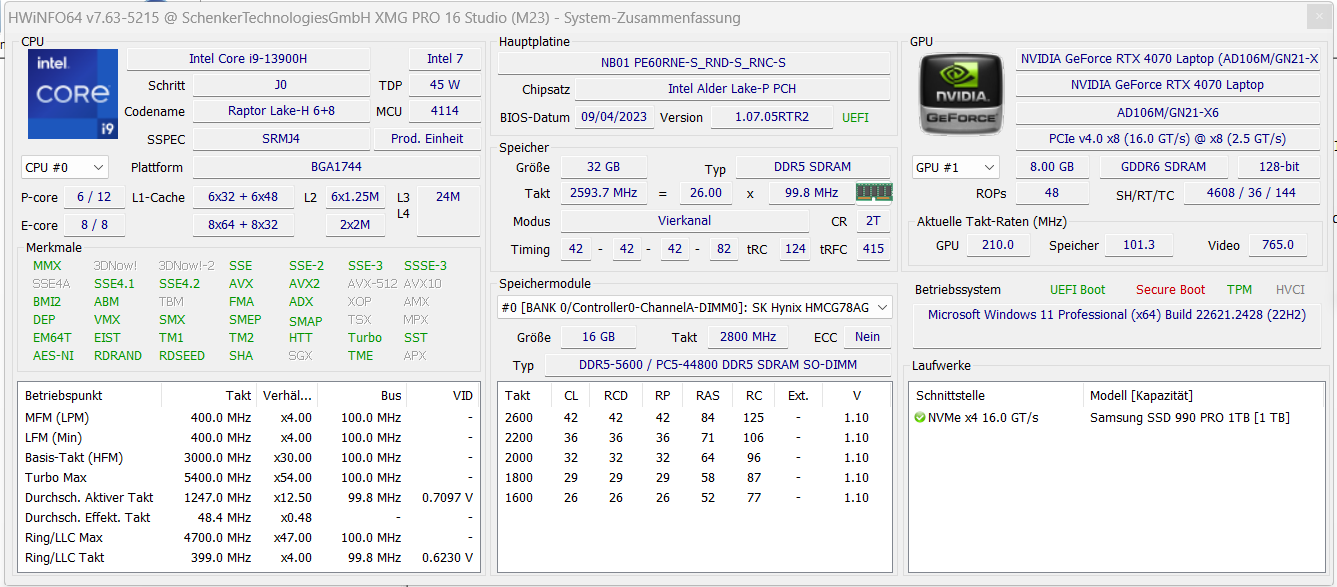
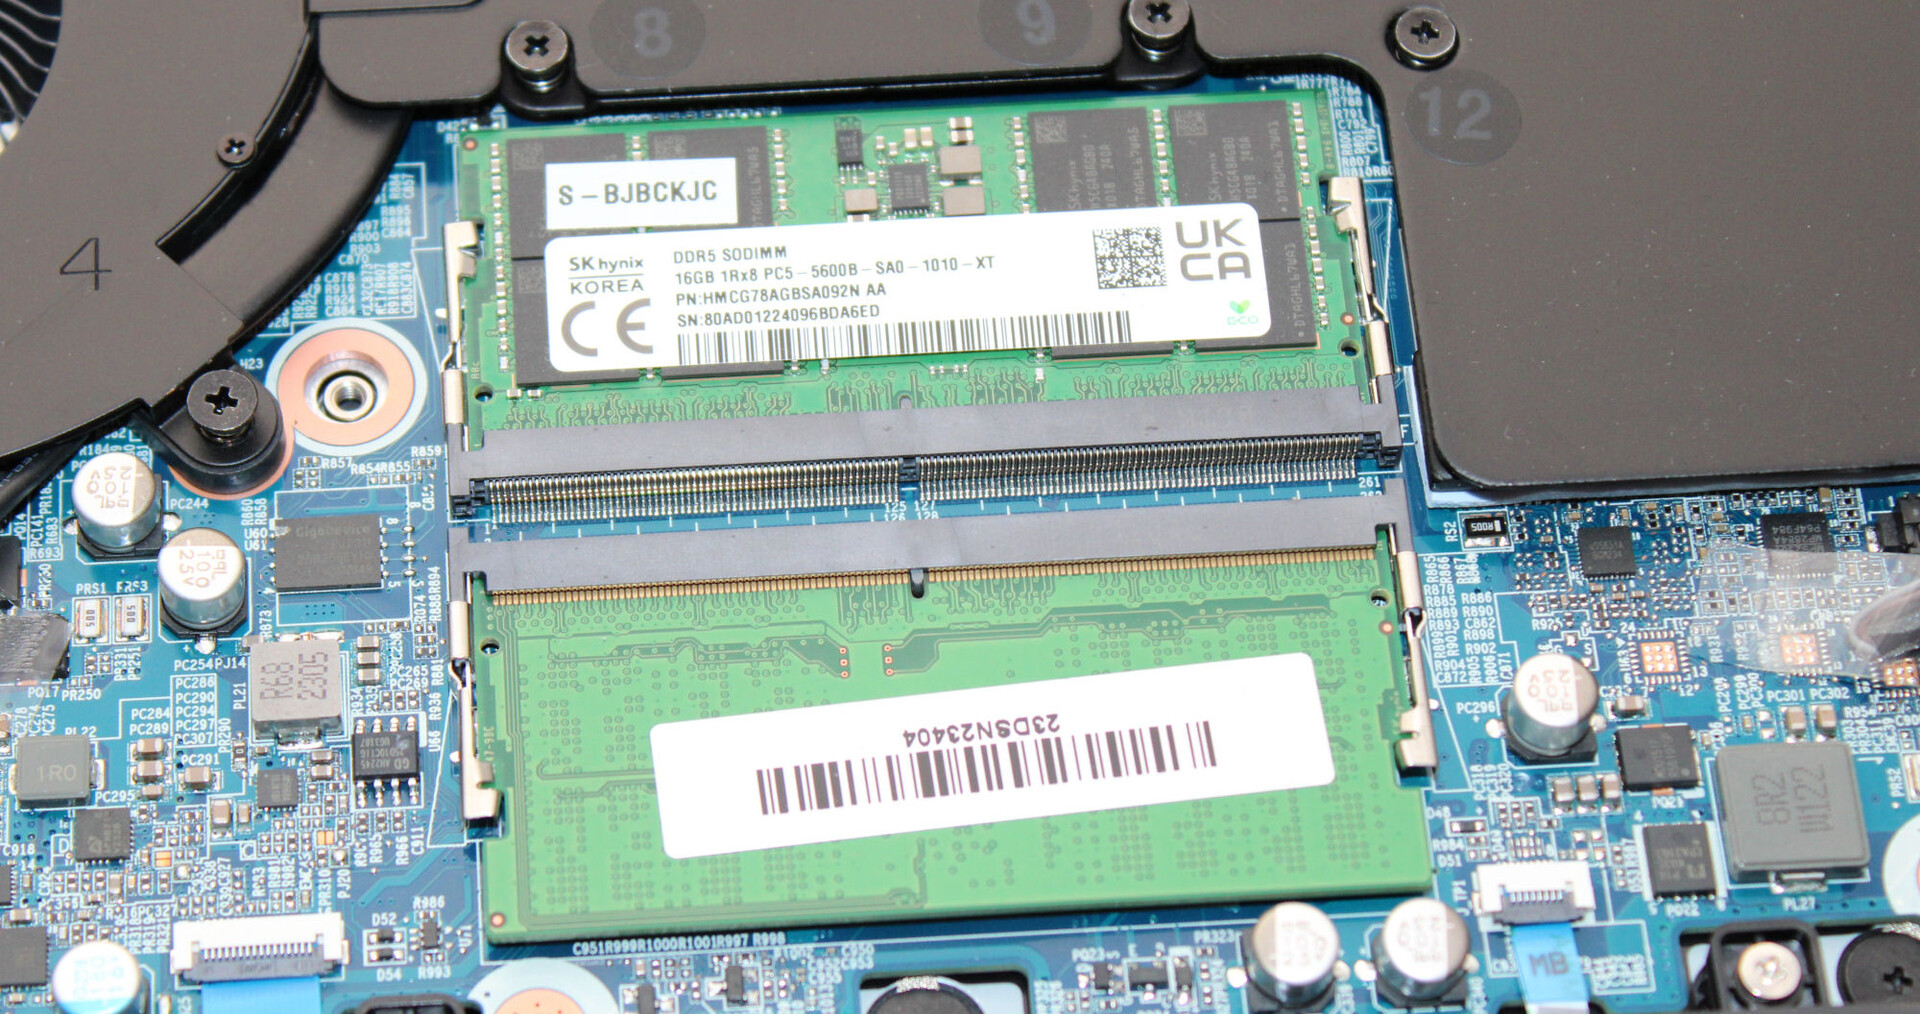
Le système, qui fonctionne parfaitement, ne manque pas de puissance de calcul. Les jeux, le rendu et l'édition vidéo font partie des compétences principales de l'ordinateur. Les taux de transfert de la RAM sont normaux pour une RAM DDR5-5600.
CrossMark: Overall | Productivity | Creativity | Responsiveness
| PCMark 10 / Score | |
| Lenovo Legion Slim 7i 16 Gen 8 | |
| Moyenne de la classe Gaming (5828 - 12414, n=93, 2 dernières années) | |
| HP Omen Transcend 16 | |
| Schenker XMG Pro 16 Studio (Mid 23) | |
| Moyenne Intel Core i9-13900H, NVIDIA GeForce RTX 4070 Laptop GPU (5855 - 8538, n=8) | |
| MSI Stealth 16 Studio A13VG | |
| Asus Vivobook Pro 16X K6604JV-MX016W | |
| PCMark 10 / Essentials | |
| Schenker XMG Pro 16 Studio (Mid 23) | |
| Lenovo Legion Slim 7i 16 Gen 8 | |
| HP Omen Transcend 16 | |
| Moyenne Intel Core i9-13900H, NVIDIA GeForce RTX 4070 Laptop GPU (8835 - 11940, n=8) | |
| Moyenne de la classe Gaming (8810 - 11935, n=97, 2 dernières années) | |
| Asus Vivobook Pro 16X K6604JV-MX016W | |
| MSI Stealth 16 Studio A13VG | |
| PCMark 10 / Productivity | |
| Moyenne de la classe Gaming (6845 - 25323, n=95, 2 dernières années) | |
| Lenovo Legion Slim 7i 16 Gen 8 | |
| Schenker XMG Pro 16 Studio (Mid 23) | |
| Moyenne Intel Core i9-13900H, NVIDIA GeForce RTX 4070 Laptop GPU (7967 - 10991, n=8) | |
| HP Omen Transcend 16 | |
| MSI Stealth 16 Studio A13VG | |
| Asus Vivobook Pro 16X K6604JV-MX016W | |
| PCMark 10 / Digital Content Creation | |
| Moyenne de la classe Gaming (7602 - 19954, n=95, 2 dernières années) | |
| Lenovo Legion Slim 7i 16 Gen 8 | |
| HP Omen Transcend 16 | |
| Moyenne Intel Core i9-13900H, NVIDIA GeForce RTX 4070 Laptop GPU (7738 - 13575, n=8) | |
| Schenker XMG Pro 16 Studio (Mid 23) | |
| MSI Stealth 16 Studio A13VG | |
| Asus Vivobook Pro 16X K6604JV-MX016W | |
| CrossMark / Overall | |
| Asus Vivobook Pro 16X K6604JV-MX016W | |
| Moyenne de la classe Gaming (1366 - 2409, n=94, 2 dernières années) | |
| Lenovo Legion Slim 7i 16 Gen 8 | |
| HP Omen Transcend 16 | |
| Schenker XMG Pro 16 Studio (Mid 23) | |
| Moyenne Intel Core i9-13900H, NVIDIA GeForce RTX 4070 Laptop GPU (1104 - 1974, n=7) | |
| MSI Stealth 16 Studio A13VG | |
| CrossMark / Productivity | |
| Asus Vivobook Pro 16X K6604JV-MX016W | |
| Lenovo Legion Slim 7i 16 Gen 8 | |
| Schenker XMG Pro 16 Studio (Mid 23) | |
| Moyenne de la classe Gaming (1386 - 2254, n=94, 2 dernières années) | |
| HP Omen Transcend 16 | |
| Moyenne Intel Core i9-13900H, NVIDIA GeForce RTX 4070 Laptop GPU (1058 - 1914, n=7) | |
| MSI Stealth 16 Studio A13VG | |
| CrossMark / Creativity | |
| Asus Vivobook Pro 16X K6604JV-MX016W | |
| HP Omen Transcend 16 | |
| Moyenne de la classe Gaming (1343 - 2786, n=94, 2 dernières années) | |
| Lenovo Legion Slim 7i 16 Gen 8 | |
| Schenker XMG Pro 16 Studio (Mid 23) | |
| Moyenne Intel Core i9-13900H, NVIDIA GeForce RTX 4070 Laptop GPU (1178 - 2254, n=7) | |
| MSI Stealth 16 Studio A13VG | |
| CrossMark / Responsiveness | |
| Schenker XMG Pro 16 Studio (Mid 23) | |
| Lenovo Legion Slim 7i 16 Gen 8 | |
| Moyenne de la classe Gaming (1226 - 2334, n=94, 2 dernières années) | |
| Asus Vivobook Pro 16X K6604JV-MX016W | |
| Moyenne Intel Core i9-13900H, NVIDIA GeForce RTX 4070 Laptop GPU (1037 - 1952, n=7) | |
| MSI Stealth 16 Studio A13VG | |
| HP Omen Transcend 16 | |
| PCMark 10 Score | 8010 points | |
Aide | ||
| AIDA64 / Memory Copy | |
| HP Omen Transcend 16 | |
| Moyenne de la classe Gaming (21750 - 129946, n=105, 2 dernières années) | |
| Schenker XMG Pro 16 Studio (Mid 23) | |
| MSI Stealth 16 Studio A13VG | |
| Asus Vivobook Pro 16X K6604JV-MX016W | |
| Moyenne Intel Core i9-13900H (37448 - 74486, n=25) | |
| Lenovo Legion Slim 7i 16 Gen 8 | |
| AIDA64 / Memory Read | |
| HP Omen Transcend 16 | |
| Asus Vivobook Pro 16X K6604JV-MX016W | |
| Schenker XMG Pro 16 Studio (Mid 23) | |
| Moyenne de la classe Gaming (22956 - 118858, n=105, 2 dernières années) | |
| MSI Stealth 16 Studio A13VG | |
| Moyenne Intel Core i9-13900H (41599 - 75433, n=25) | |
| Lenovo Legion Slim 7i 16 Gen 8 | |
| AIDA64 / Memory Write | |
| Moyenne de la classe Gaming (22297 - 135096, n=105, 2 dernières années) | |
| HP Omen Transcend 16 | |
| Schenker XMG Pro 16 Studio (Mid 23) | |
| MSI Stealth 16 Studio A13VG | |
| Asus Vivobook Pro 16X K6604JV-MX016W | |
| Moyenne Intel Core i9-13900H (36152 - 88505, n=25) | |
| Lenovo Legion Slim 7i 16 Gen 8 | |
| AIDA64 / Memory Latency | |
| Moyenne de la classe Gaming (75.3 - 259, n=105, 2 dernières années) | |
| Asus Vivobook Pro 16X K6604JV-MX016W | |
| Moyenne Intel Core i9-13900H (75.8 - 102.3, n=25) | |
| HP Omen Transcend 16 | |
| MSI Stealth 16 Studio A13VG | |
| Schenker XMG Pro 16 Studio (Mid 23) | |
| Lenovo Legion Slim 7i 16 Gen 8 | |
* ... Moindre est la valeur, meilleures sont les performances
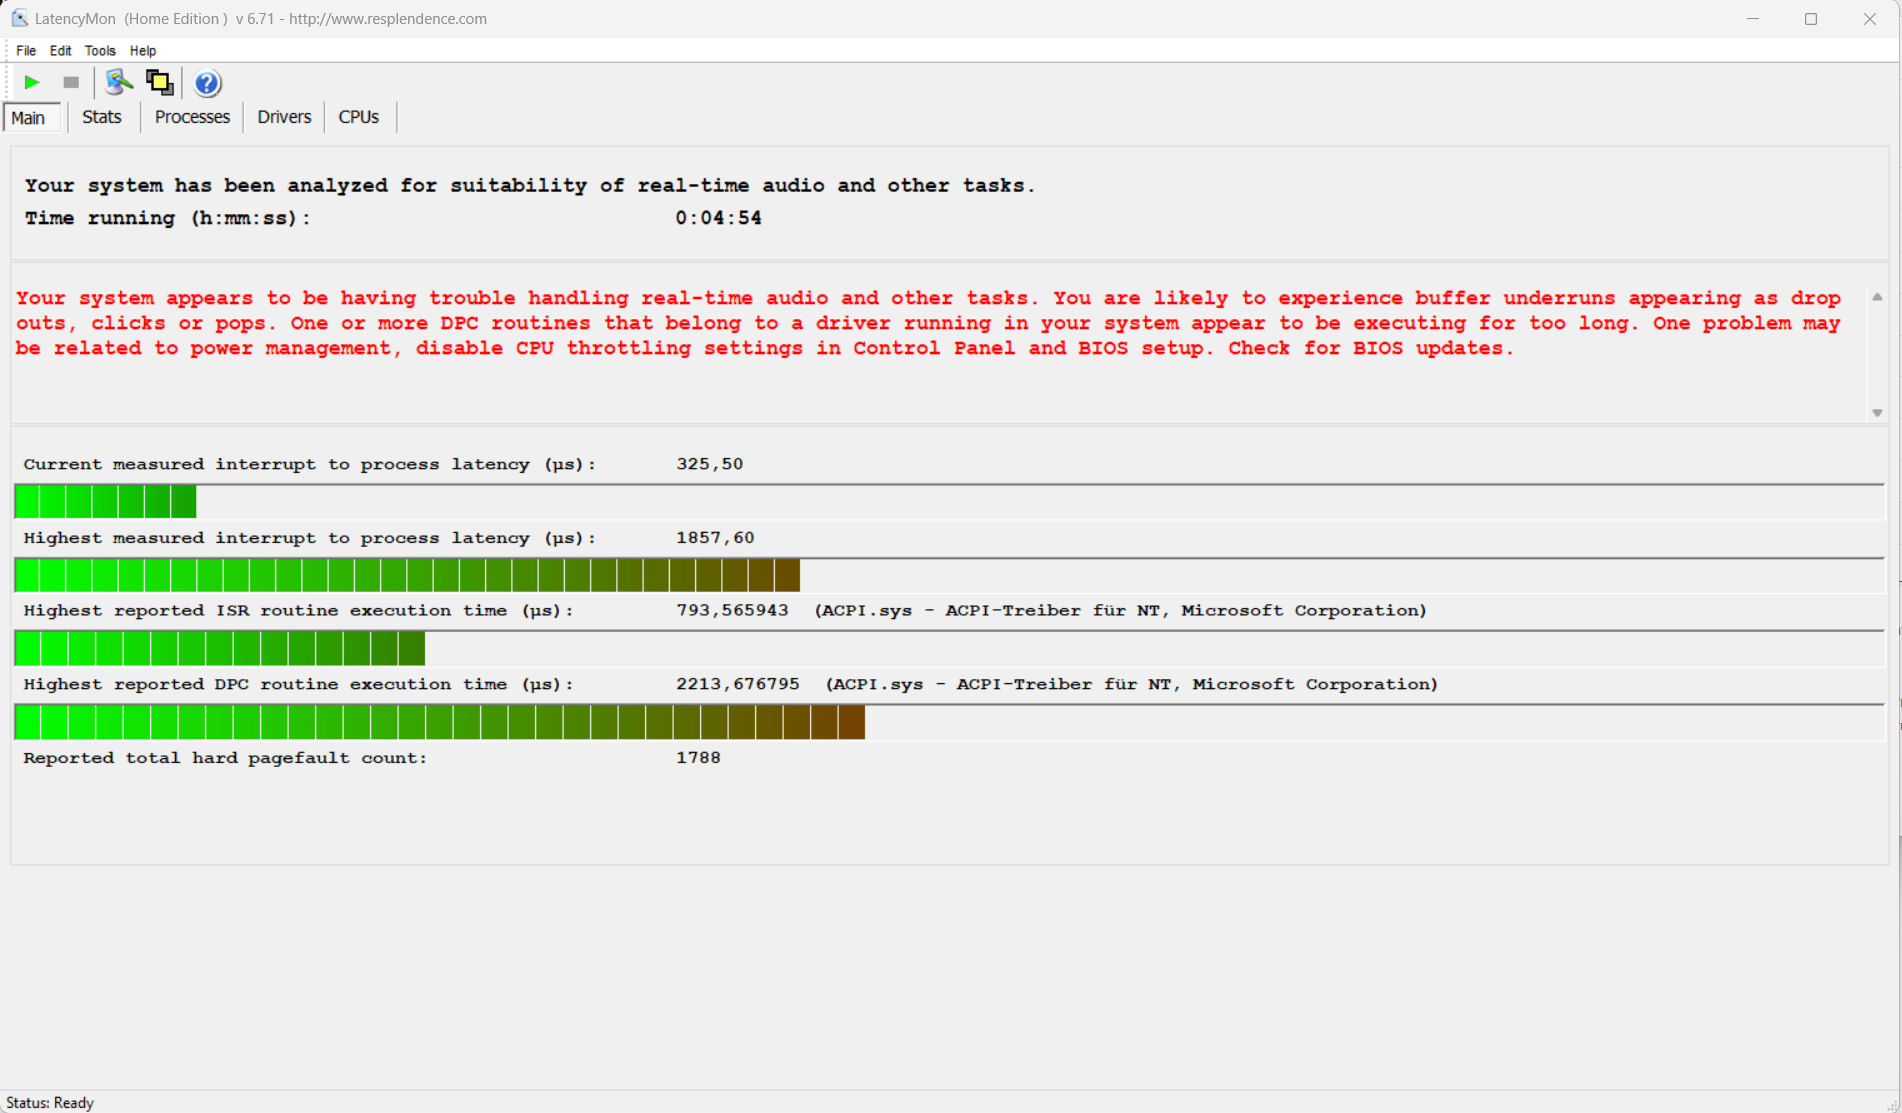
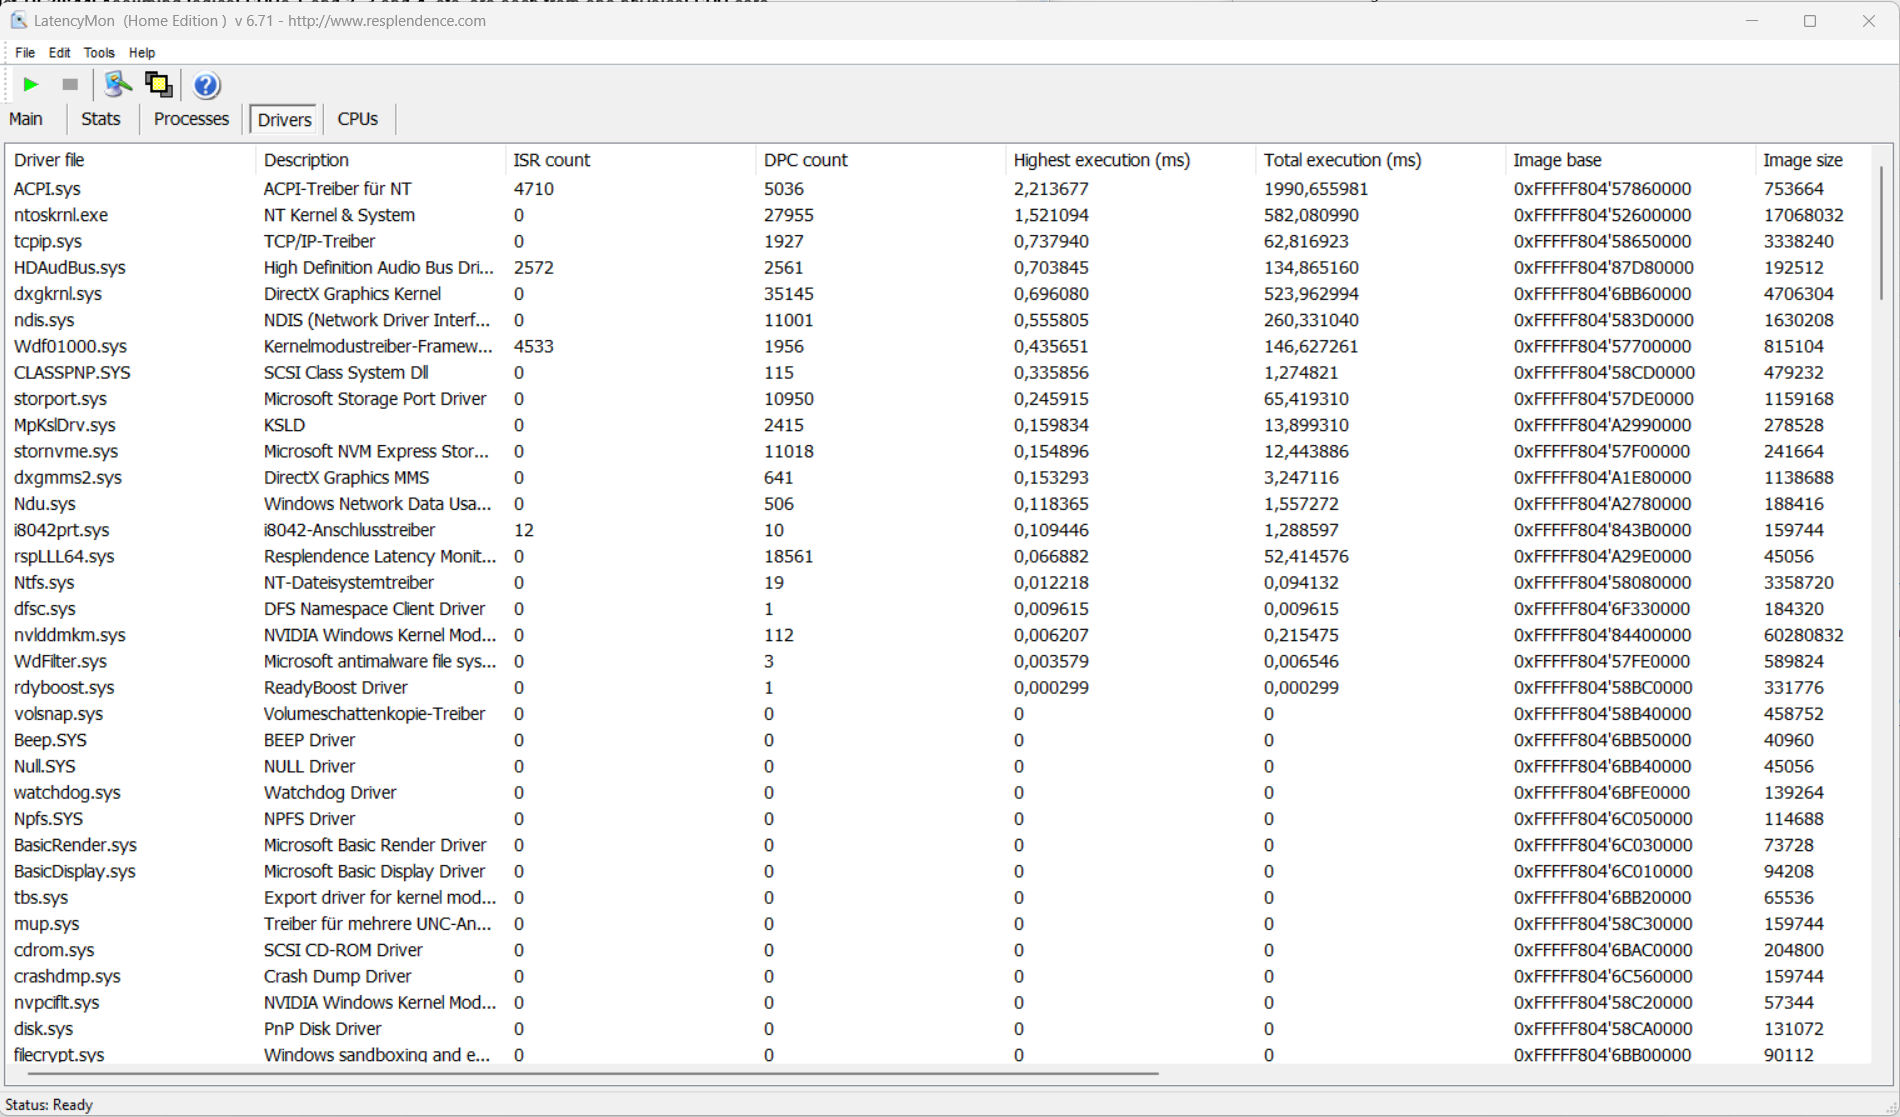
Latence DPC
Le test standardisé du moniteur de latence (surf sur le web, lecture de vidéos 4k, Prime95 highload) a révélé quelques anomalies. Le système ne semble pas adapté à l'édition vidéo et audio en temps réel. De futures mises à jour logicielles pourraient apporter des améliorations, voire des dégradations.
| DPC Latencies / LatencyMon - interrupt to process latency (max), Web, Youtube, Prime95 | |
| MSI Stealth 16 Studio A13VG | |
| Lenovo Legion Slim 7i 16 Gen 8 | |
| Asus Vivobook Pro 16X K6604JV-MX016W | |
| Schenker XMG Pro 16 Studio (Mid 23) | |
| HP Omen Transcend 16 | |
* ... Moindre est la valeur, meilleures sont les performances
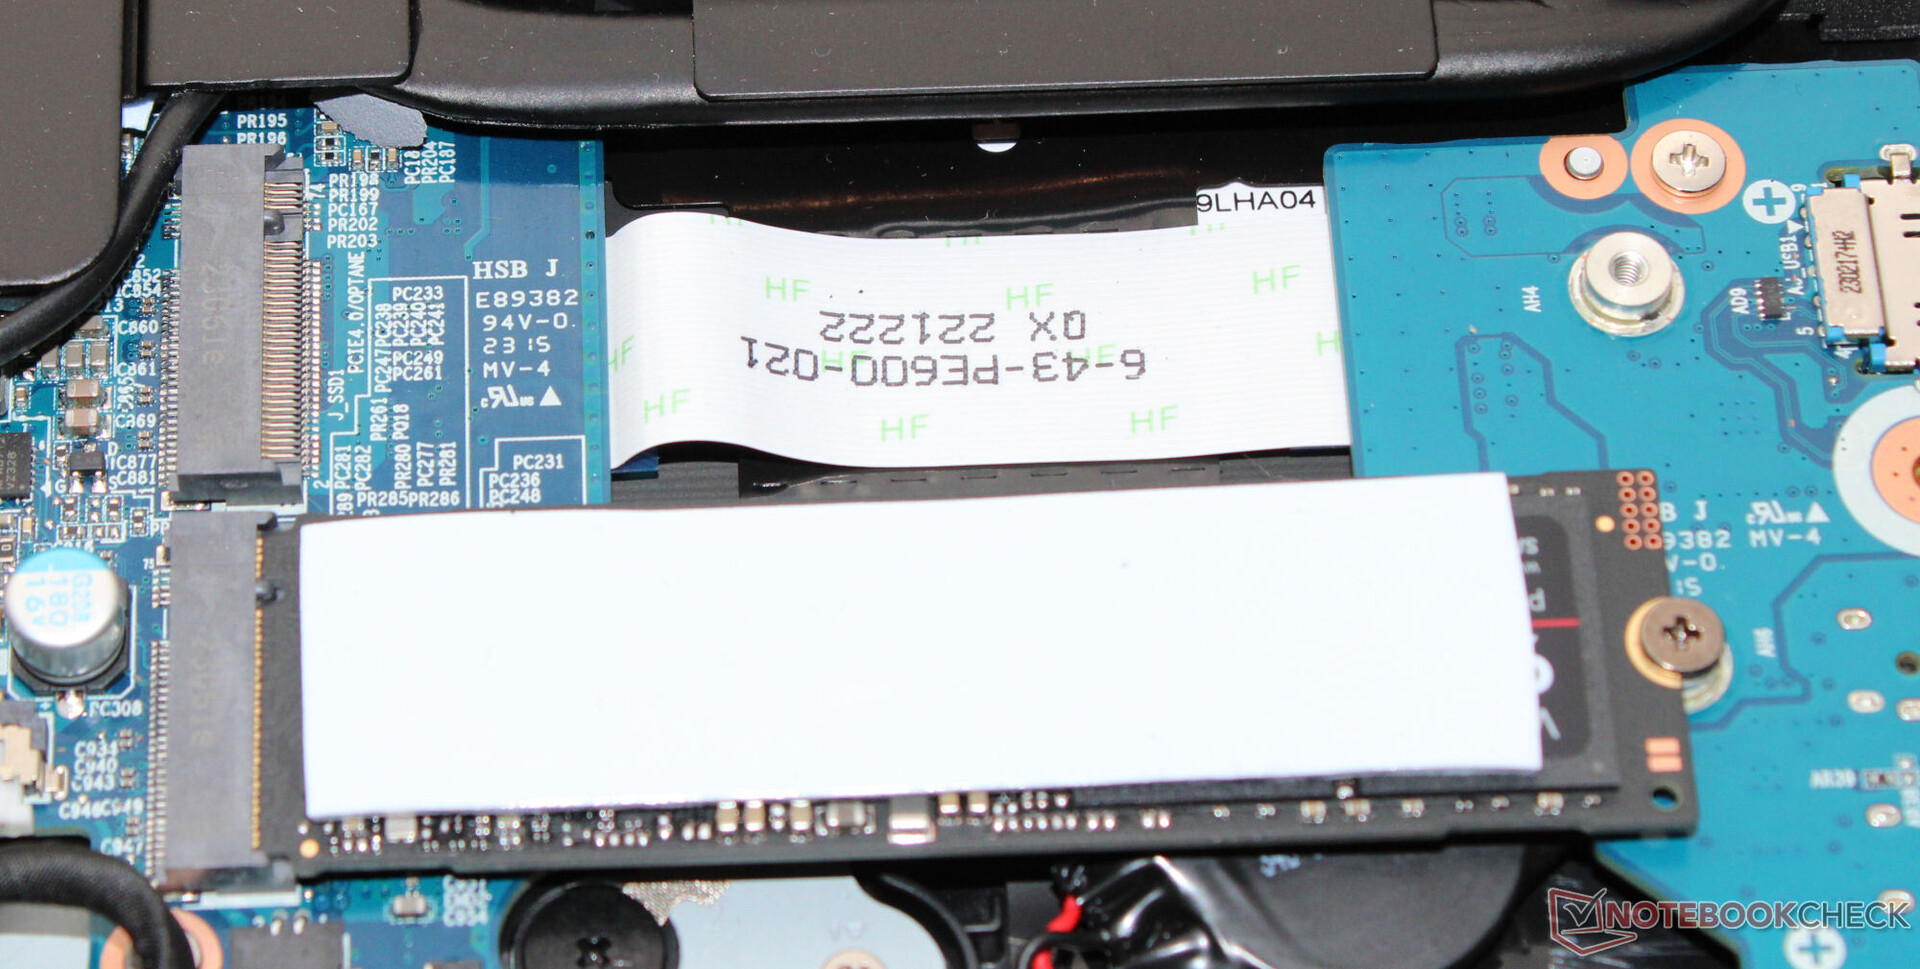
Dispositifs de stockage
Le Pro 16 peut accueillir un total de deux SSD PCIe 4 au format M.2-2280. Le RAID-0/1 est pris en charge. Le SSD Samsung (1 To, PCIe 4, M.2-2280) de notre appareil de test a fourni d'excellents taux de transfert. Points positifs : Il n'y a pas eu d'étranglement thermique.

* ... Moindre est la valeur, meilleures sont les performances
Reading continuous performance: DiskSpd Read Loop, Queue Depth 8
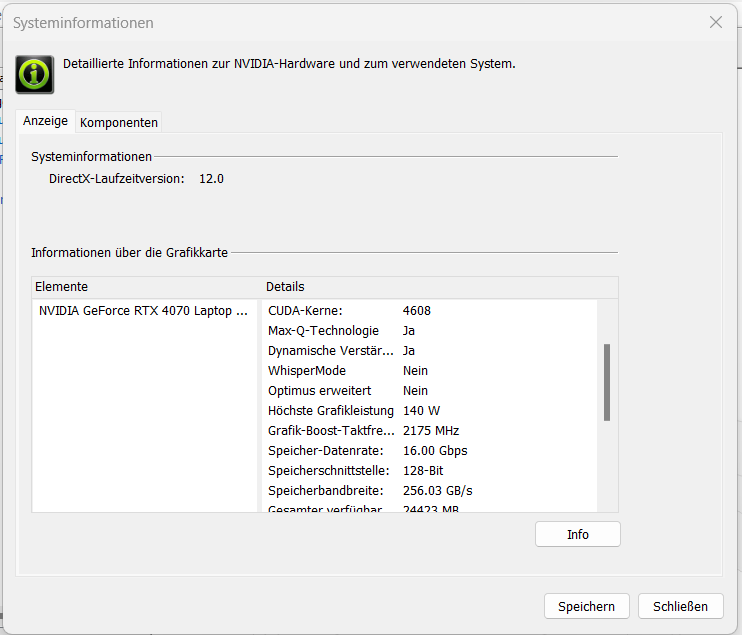
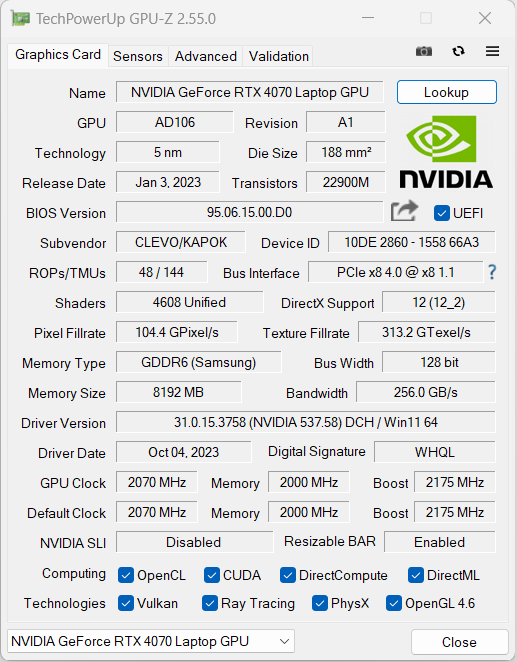
Carte graphique
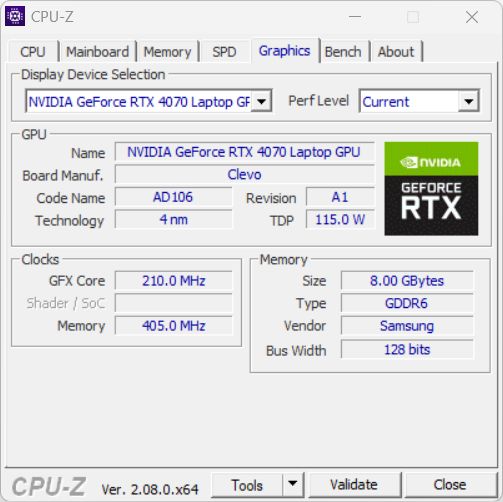
LaGeForce RTX 4070 offre 4 608 shaders, un bus large de 128 bits et une RAM GDDR6 rapide (8 192 Mo). Schenker a fixé son TGP maximum à 140 watts (115 watts + 25 watts Dynamic Boost) - il n'est pas possible d'aller plus loin.
Le cœur graphique permet de jouer en QHD avec des paramètres élevés à maximaux. Ce faisant, il atteint des taux de rafraîchissement supérieurs à la moyenne de la RTX 4070 déterminée précédemment. L'utilisation du mode dGPU (activé via le BIOS) entraîne une légère augmentation des performances. Le cœur graphique et la mémoire peuvent être overclockés via le Control Center (Performance Mode -> cliquez sur les flèches pointant vers le bas). Advanced Optimus n'est pas pris en charge.
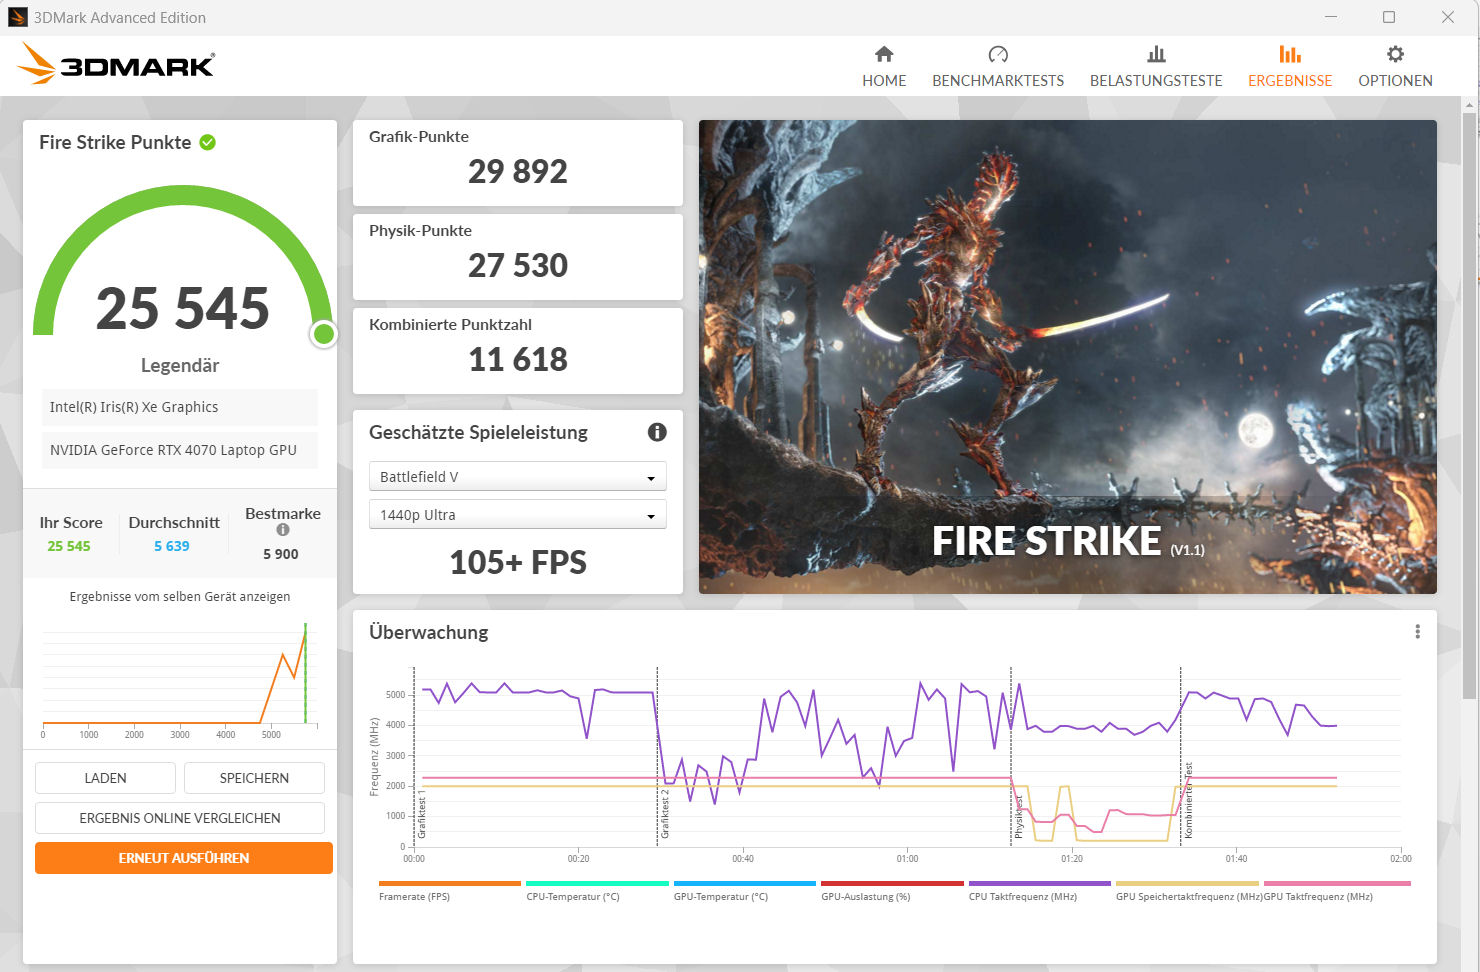
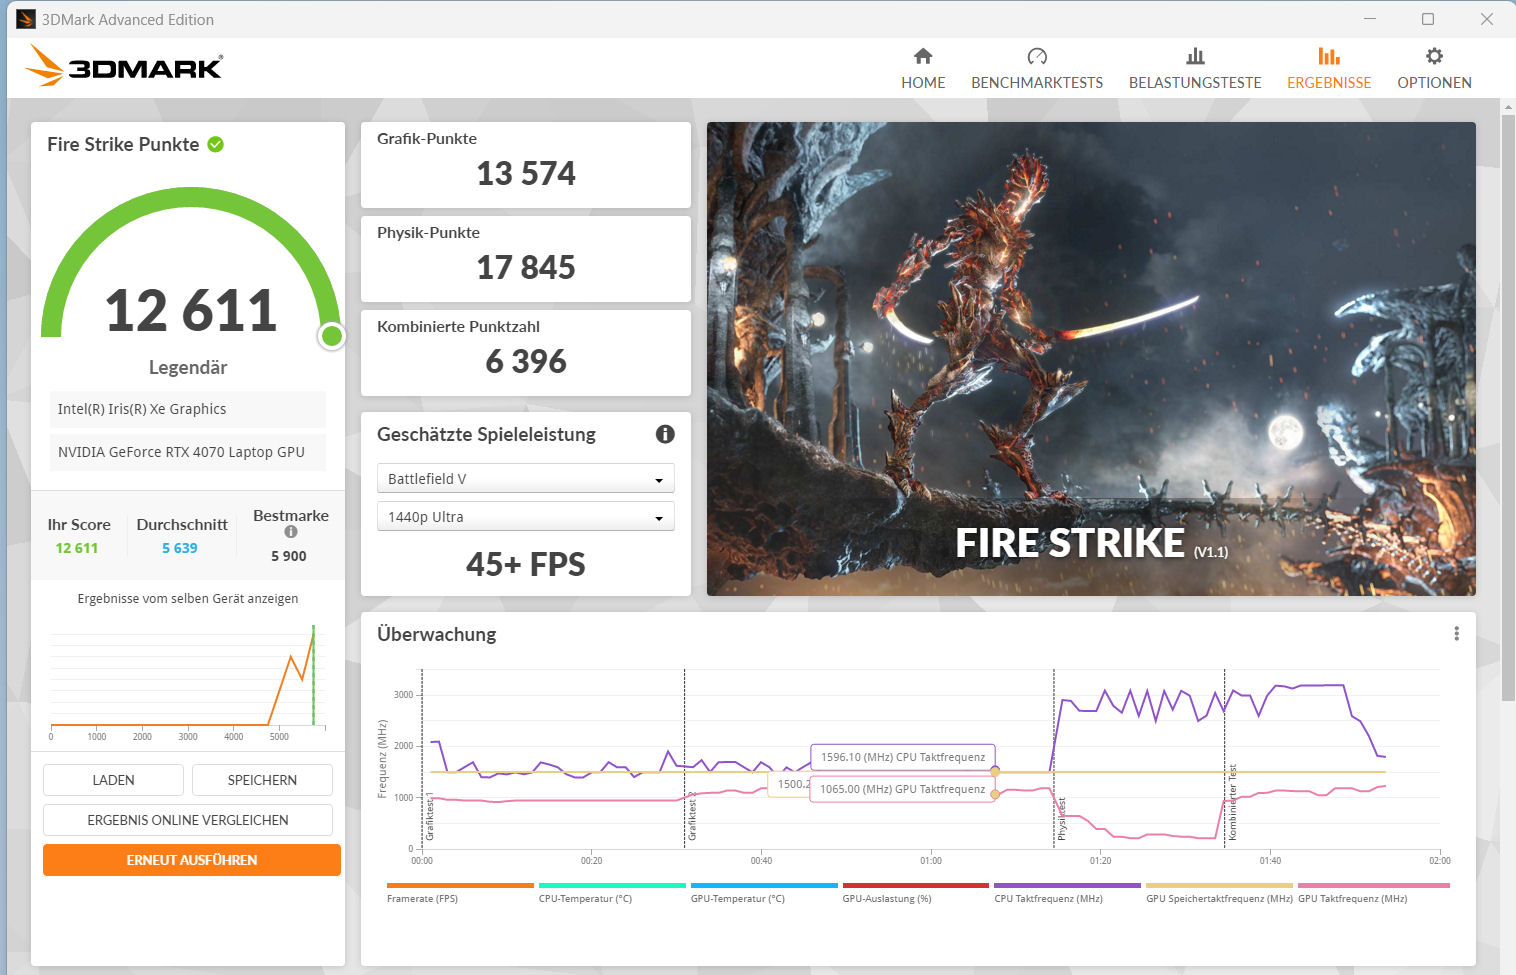
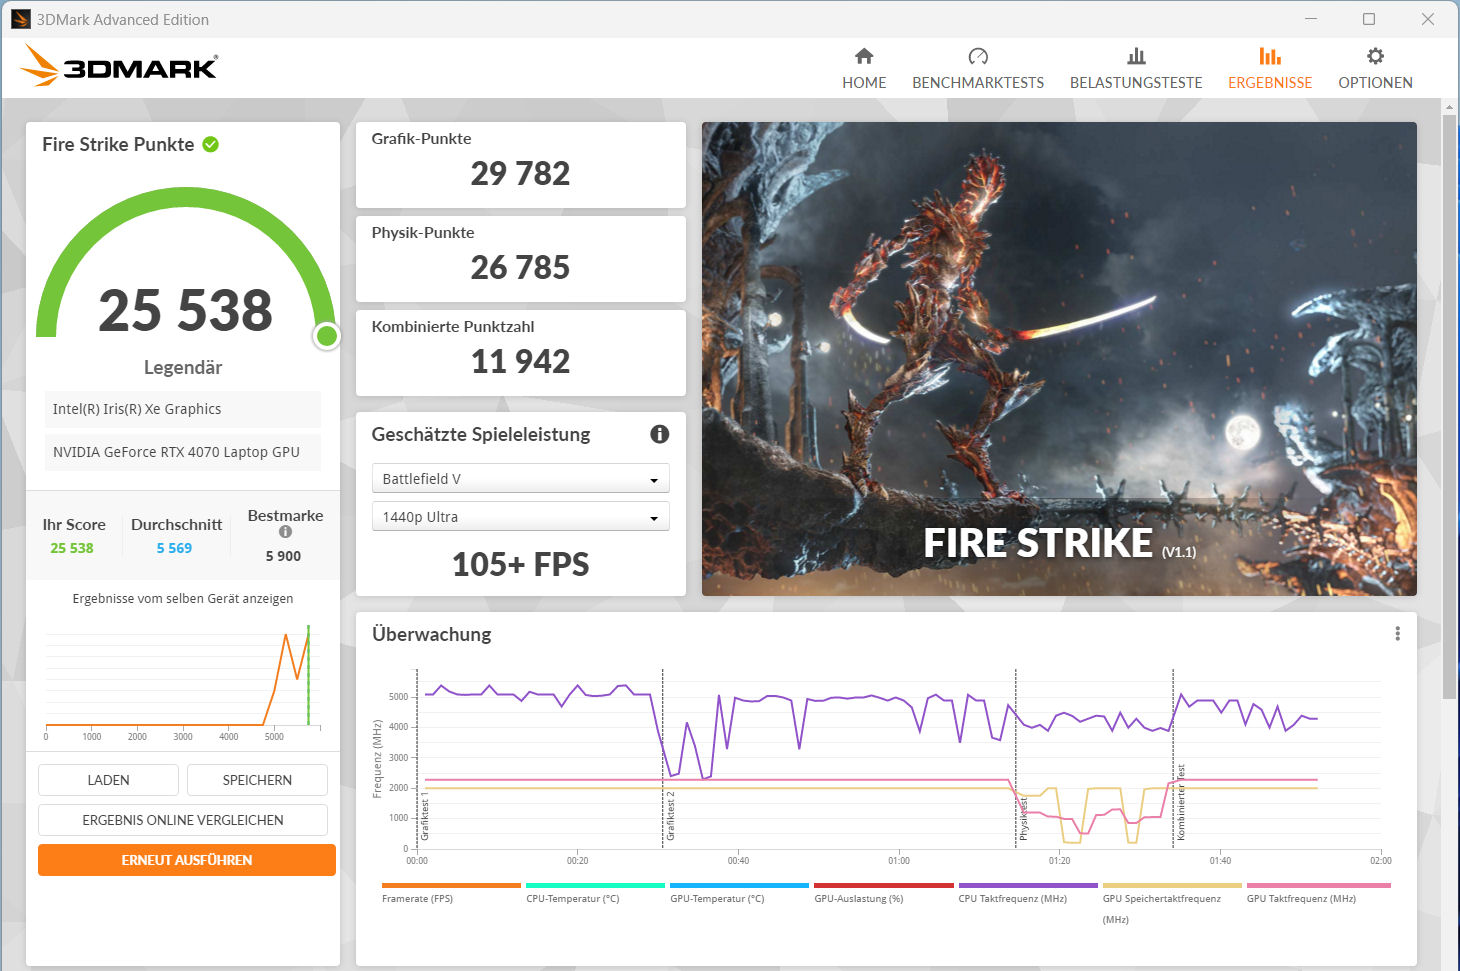
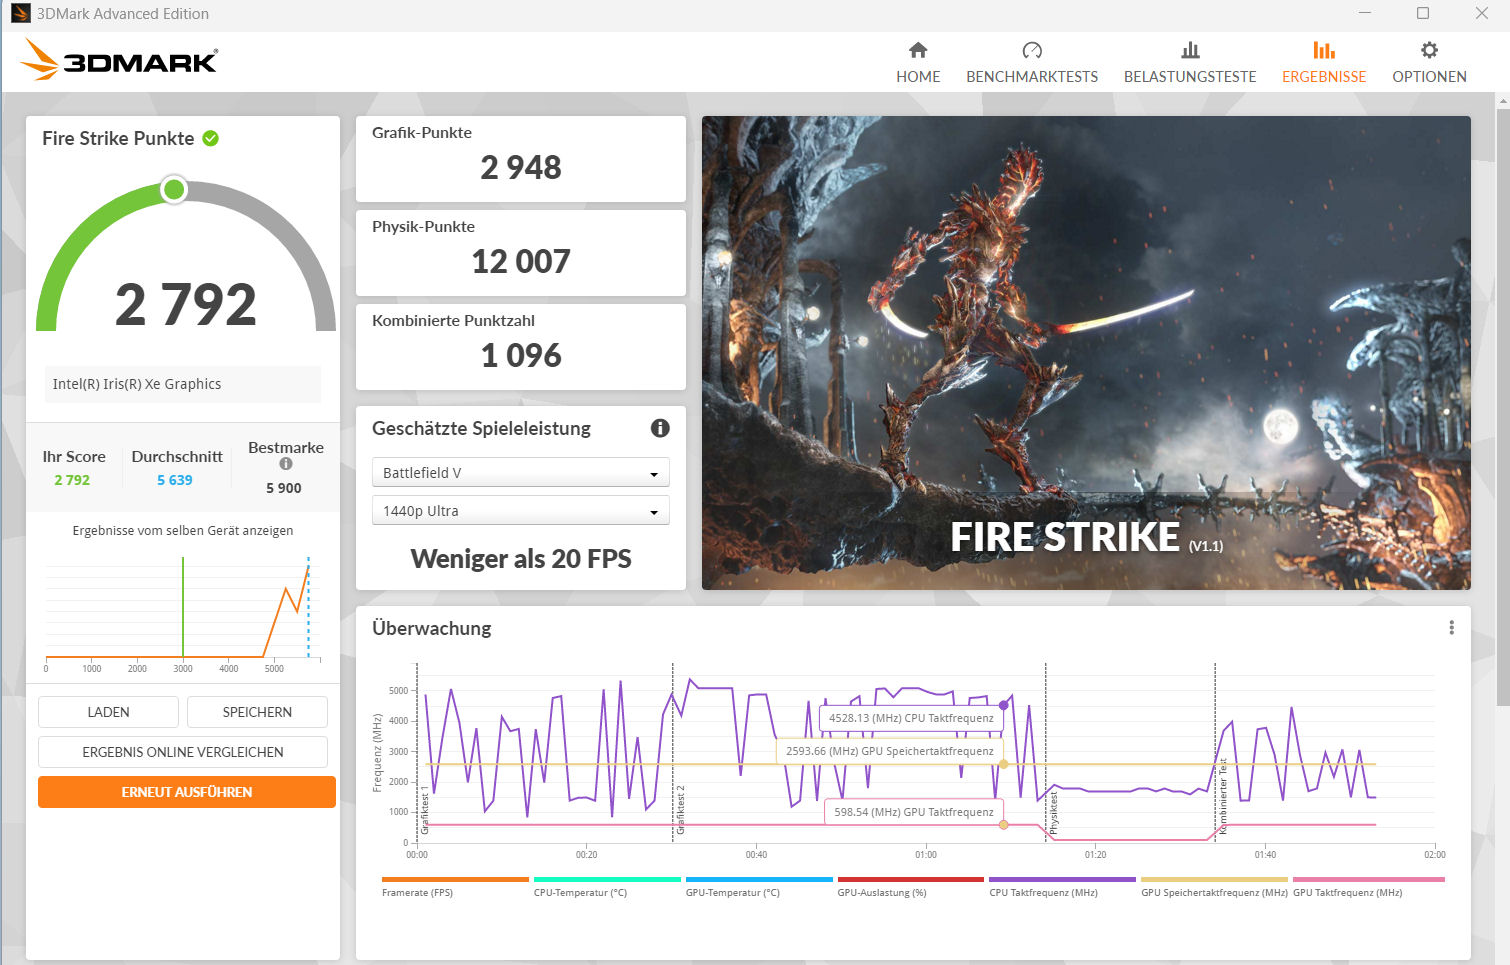
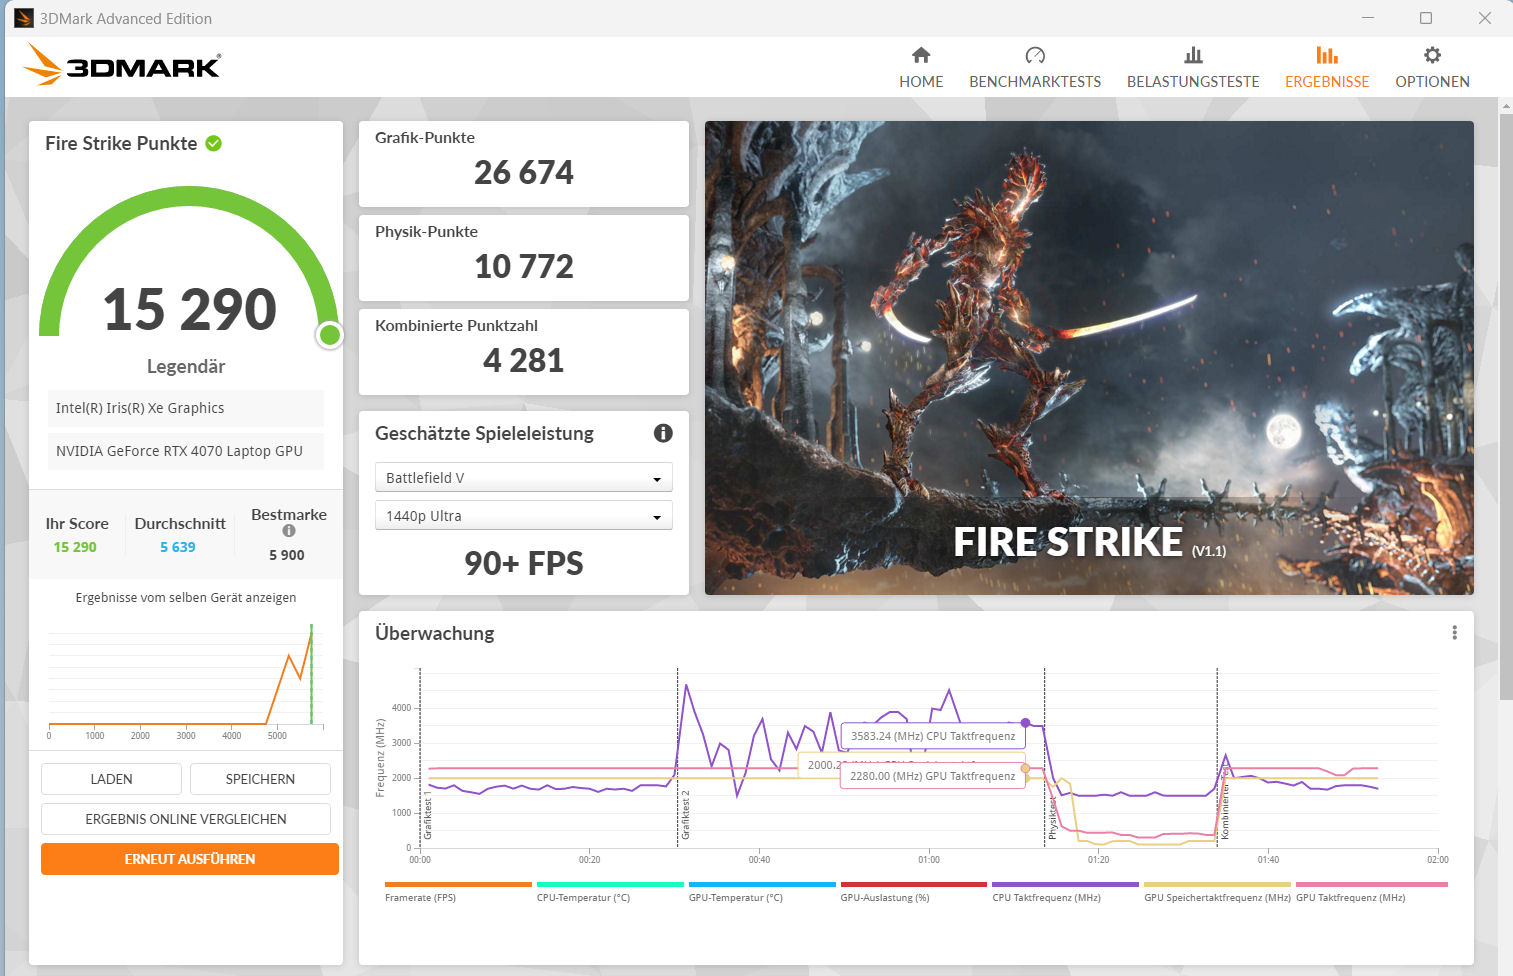
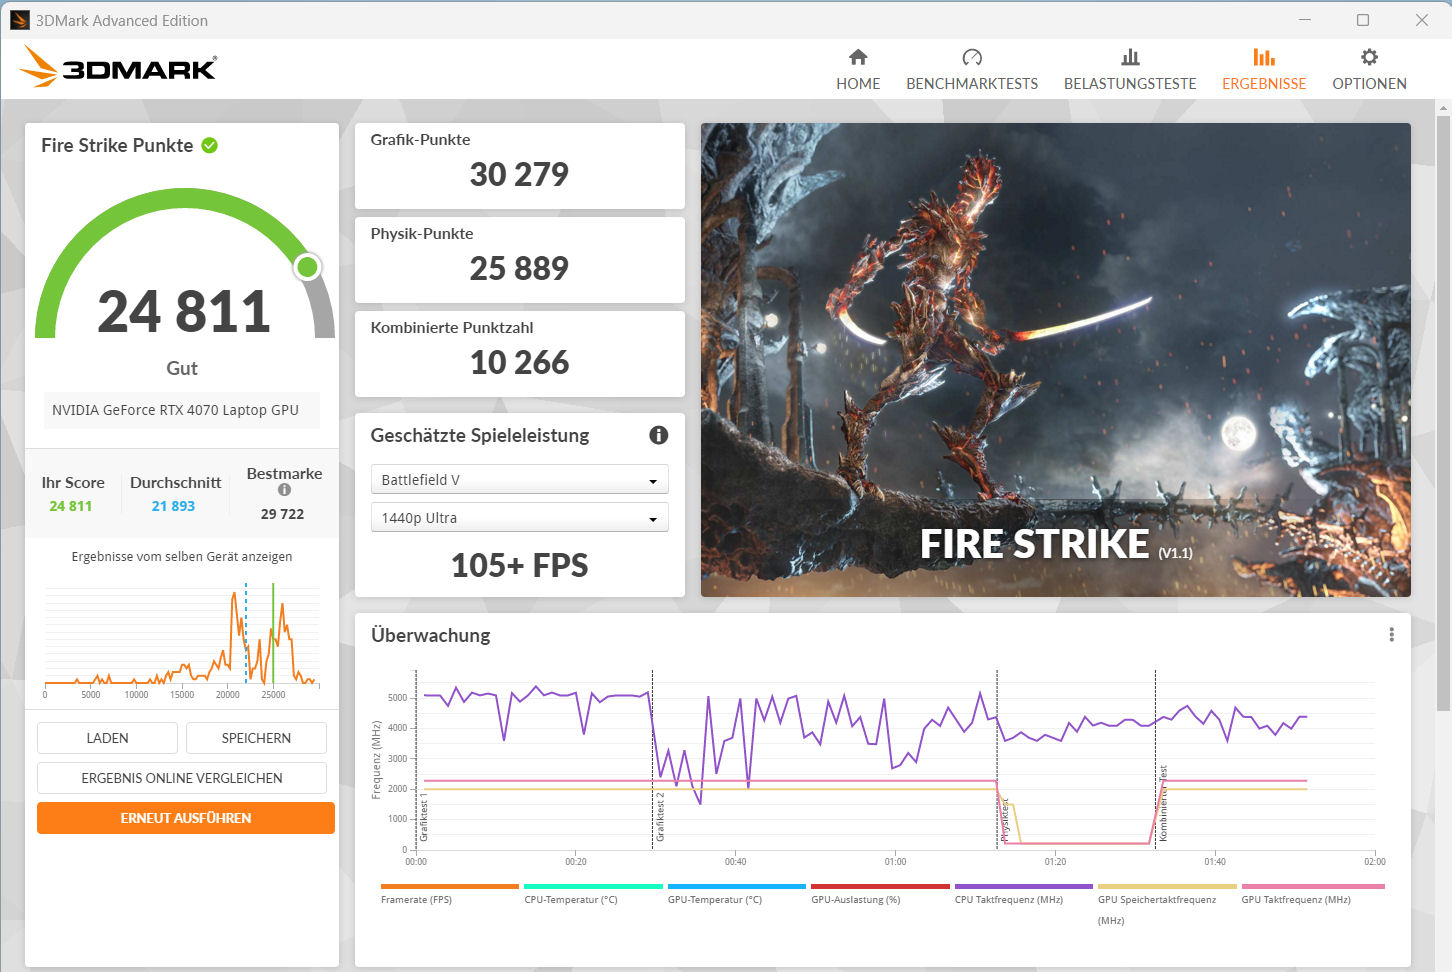
| 3DMark 06 Standard Score | 54913 points | |
| 3DMark 11 Performance | 34302 points | |
| 3DMark Cloud Gate Standard Score | 62061 points | |
| 3DMark Fire Strike Score | 25545 points | |
| 3DMark Time Spy Score | 12134 points | |
Aide | ||
* ... Moindre est la valeur, meilleures sont les performances
| The Witcher 3 - 1920x1080 Ultra Graphics & Postprocessing (HBAO+) | |
| Moyenne de la classe Gaming (104.7 - 240, n=7, 2 dernières années) | |
| MSI Stealth 16 Studio A13VG | |
| Schenker XMG Pro 16 Studio (Mid 23) | |
| Lenovo Legion Slim 7i 16 Gen 8 | |
| Moyenne NVIDIA GeForce RTX 4070 Laptop GPU (69.8 - 133.7, n=57) | |
| HP Omen Transcend 16 | |
| Asus Vivobook Pro 16X K6604JV-MX016W | |
| Lies of P | |
| 1920x1080 Best Preset | |
| Moyenne NVIDIA GeForce RTX 4070 Laptop GPU (137.4 - 148.1, n=4) | |
| Schenker XMG Pro 16 Studio (Mid 23) | |
| 2560x1440 Best Preset | |
| Moyenne NVIDIA GeForce RTX 4070 Laptop GPU (97.2 - 98.8, n=4) | |
| Schenker XMG Pro 16 Studio (Mid 23) | |
| Assassin's Creed Mirage | |
| 1920x1080 Ultra High Preset (Adaptive Quality Off) | |
| Schenker XMG Pro 16 Studio (Mid 23) | |
| Moyenne NVIDIA GeForce RTX 4070 Laptop GPU (91 - 99, n=6) | |
| 2560x1440 Ultra High Preset (Adaptive Quality Off) | |
| Moyenne NVIDIA GeForce RTX 4070 Laptop GPU (73 - 80, n=6) | |
| Schenker XMG Pro 16 Studio (Mid 23) | |
| Lords of the Fallen | |
| 1920x1080 Ultra Preset | |
| Moyenne NVIDIA GeForce RTX 4070 Laptop GPU (44.3 - 67.7, n=4) | |
| Schenker XMG Pro 16 Studio (Mid 23) | |
| 2560x1440 Ultra Preset | |
| Moyenne NVIDIA GeForce RTX 4070 Laptop GPU (29.1 - 47.1, n=4) | |
| Schenker XMG Pro 16 Studio (Mid 23) | |
| F1 23 | |
| 1920x1080 Ultra High Preset AA:T AF:16x | |
| MSI Stealth 16 Studio A13VG | |
| Moyenne NVIDIA GeForce RTX 4070 Laptop GPU (49.5 - 100, n=14) | |
| Schenker XMG Pro 16 Studio (Mid 23) | |
| Asus Vivobook Pro 16X K6604JV-MX016W | |
| 2560x1440 Ultra High Preset AA:T AF:16x | |
| Schenker XMG Pro 16 Studio (Mid 23) | |
| MSI Stealth 16 Studio A13VG | |
| Moyenne NVIDIA GeForce RTX 4070 Laptop GPU (35.2 - 49, n=13) | |
| Asus Vivobook Pro 16X K6604JV-MX016W | |
Witcher 3 FPS diagram
| Bas | Moyen | Élevé | Ultra | QHD | |
|---|---|---|---|---|---|
| GTA V (2015) | 186.8 | 185.9 | 181.3 | 125.4 | 93.2 |
| The Witcher 3 (2015) | 474.9 | 365.4 | 231.4 | 118.4 | 86.9 |
| Dota 2 Reborn (2015) | 210 | 187.5 | 176.5 | 162.8 | |
| Final Fantasy XV Benchmark (2018) | 219 | 159.8 | 115.5 | 84.1 | |
| X-Plane 11.11 (2018) | 166.7 | 146.4 | 119.5 | ||
| Strange Brigade (2018) | 544 | 280 | 232 | 202 | 132.8 |
| Cyberpunk 2077 1.6 (2022) | 147 | 115 | 95.3 | 86.7 | 55.4 |
| Returnal (2023) | 115 | 112 | 101 | 85 | 63 |
| F1 23 (2023) | 279 | 261 | 198.2 | 67.6 | 45.6 |
| Lies of P (2023) | 206 | 182 | 159.8 | 140.1 | 97.3 |
| Cyberpunk 2077 (2023) | 131.7 | 113.2 | 98.3 | 87.9 | 57.1 |
| Assassin's Creed Mirage (2023) | 143 | 132 | 125 | 99 | 75 |
| Total War Pharaoh (2023) | 385.9 | 239.5 | 146.2 | 113.3 | 87.2 |
| Lords of the Fallen (2023) | 96.9 | 84.1 | 63.4 | 45.9 | 29.1 |
Émissions et puissance - La Pro 16 offre de bonnes durées de fonctionnement
Émissions sonores
Lorsque vous jouez, les émissions sonores peuvent atteindre 55 dB(A) (mode performance). le mode "Divertissement", que nous avons utilisé, produit des émissions sonores modérées de 48 dB(A). Il pourrait être plus silencieux : En mode silencieux, vous pouvez obtenir des émissions de 42 dB(A), au détriment de certaines performances de jeu. En mode inactif et en utilisation quotidienne (bureau, internet), l'un des deux ventilateurs est souvent utilisé et parfois, ils restent tous les deux éteints.
Degré de la nuisance sonore
| Au repos |
| 26 / 29 / 34 dB(A) |
| Fortement sollicité |
| 43 / 48 dB(A) |
 | ||
30 dB silencieux 40 dB(A) audible 50 dB(A) bruyant |
||
min: | ||
| Schenker XMG Pro 16 Studio (Mid 23) i9-13900H, GeForce RTX 4070 Laptop GPU | Asus Vivobook Pro 16X K6604JV-MX016W i9-13980HX, GeForce RTX 4060 Laptop GPU | Lenovo Legion Slim 7i 16 Gen 8 i9-13900H, GeForce RTX 4070 Laptop GPU | HP Omen Transcend 16 i9-13900HX, GeForce RTX 4070 Laptop GPU | MSI Stealth 16 Studio A13VG i7-13700H, GeForce RTX 4070 Laptop GPU | |
|---|---|---|---|---|---|
| Noise | -4% | 10% | -3% | 11% | |
| arrêt / environnement * (dB) | 25 | 25.2 -1% | 22.8 9% | 22.9 8% | 24 4% |
| Idle Minimum * (dB) | 26 | 26.6 -2% | 23.6 9% | 29.1 -12% | 24 8% |
| Idle Average * (dB) | 29 | 26.6 8% | 23.6 19% | 29.1 -0% | 24 17% |
| Idle Maximum * (dB) | 34 | 29.2 14% | 25.7 24% | 29.1 14% | 24 29% |
| Load Average * (dB) | 43 | 53.4 -24% | 27.6 36% | 45.7 -6% | 34.81 19% |
| Witcher 3 ultra * (dB) | 48 | 54.4 -13% | 54.3 -13% | 44.05 8% | |
| Load Maximum * (dB) | 48 | 56.9 -19% | 54.4 -13% | 54.3 -13% | 51.57 -7% |
* ... Moindre est la valeur, meilleures sont les performances
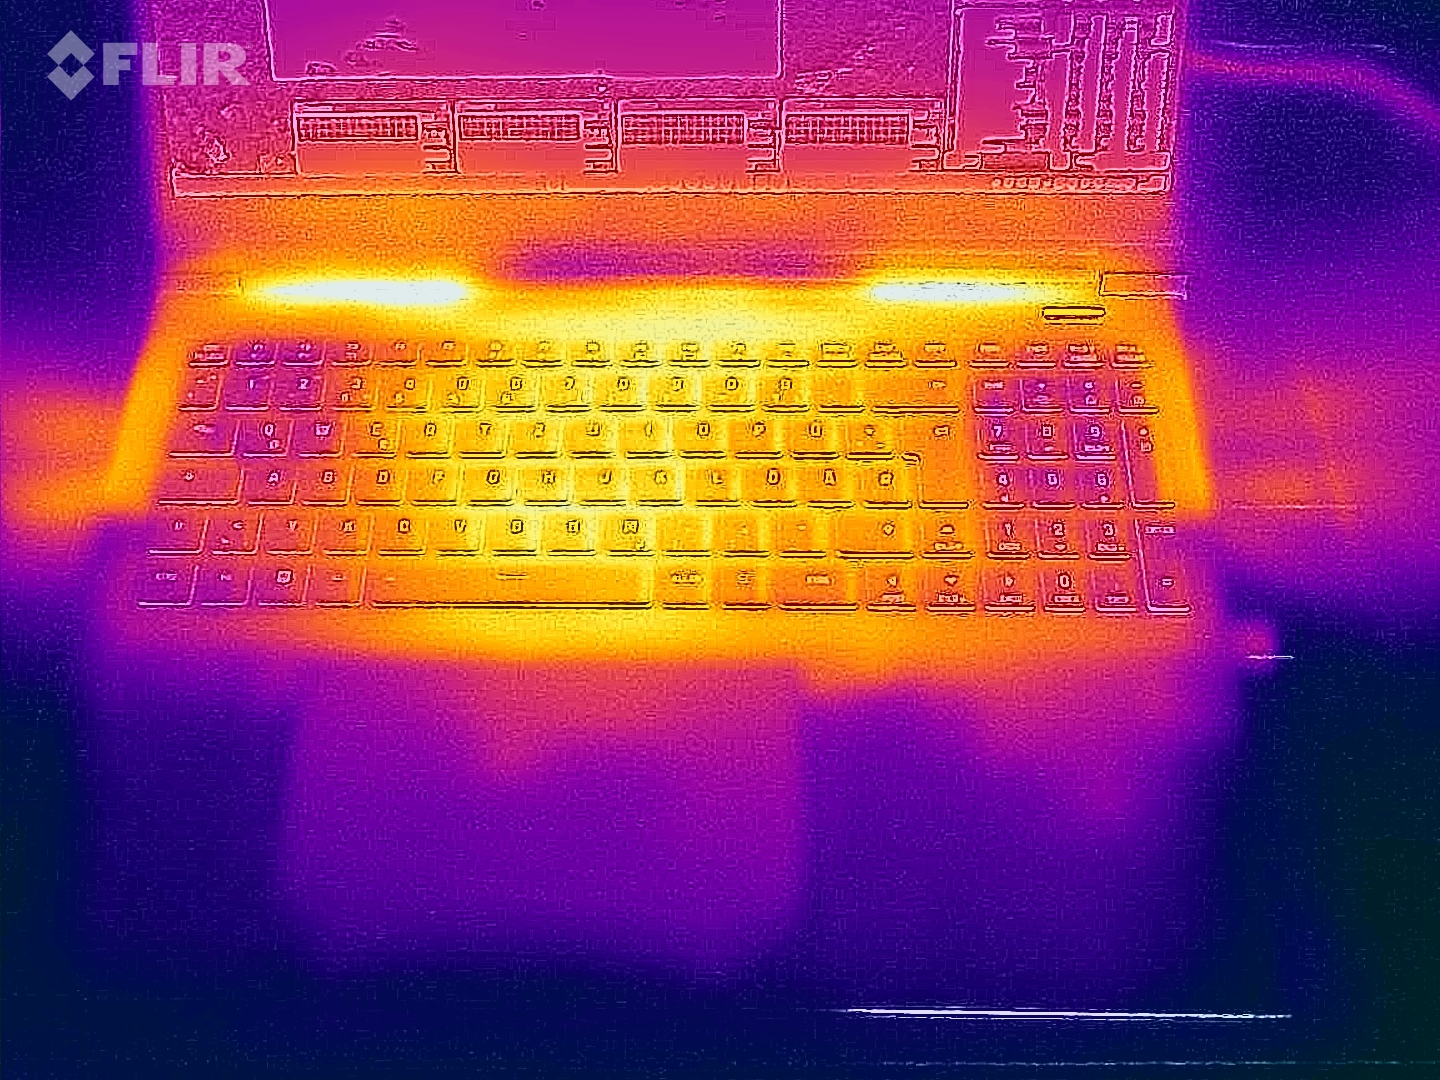
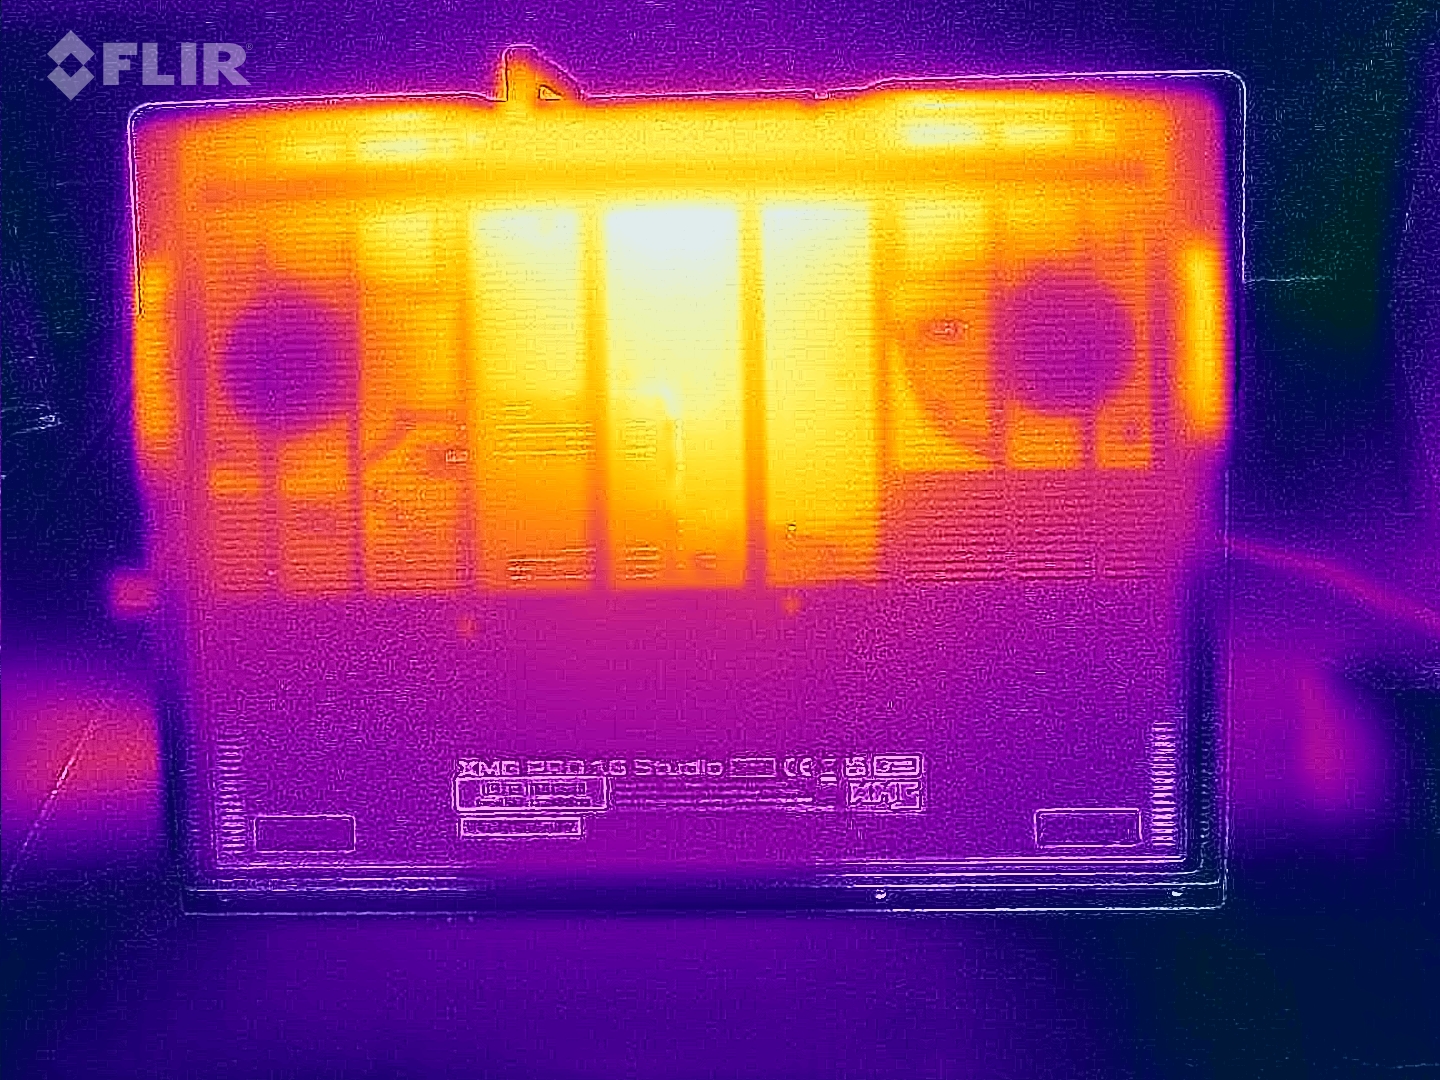
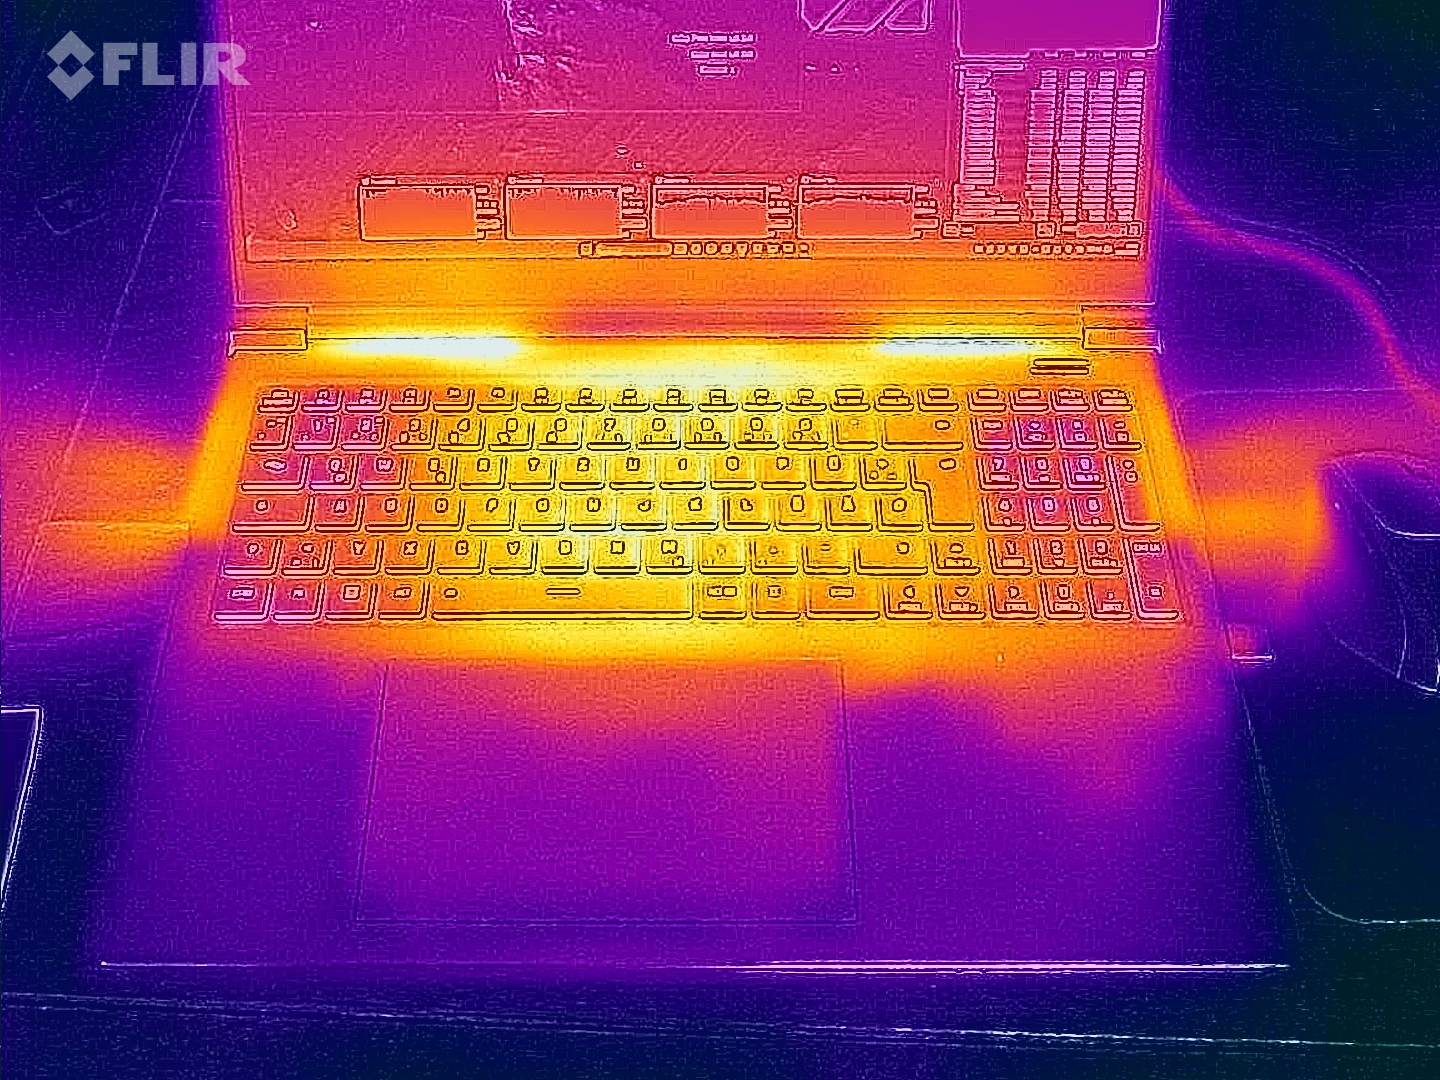
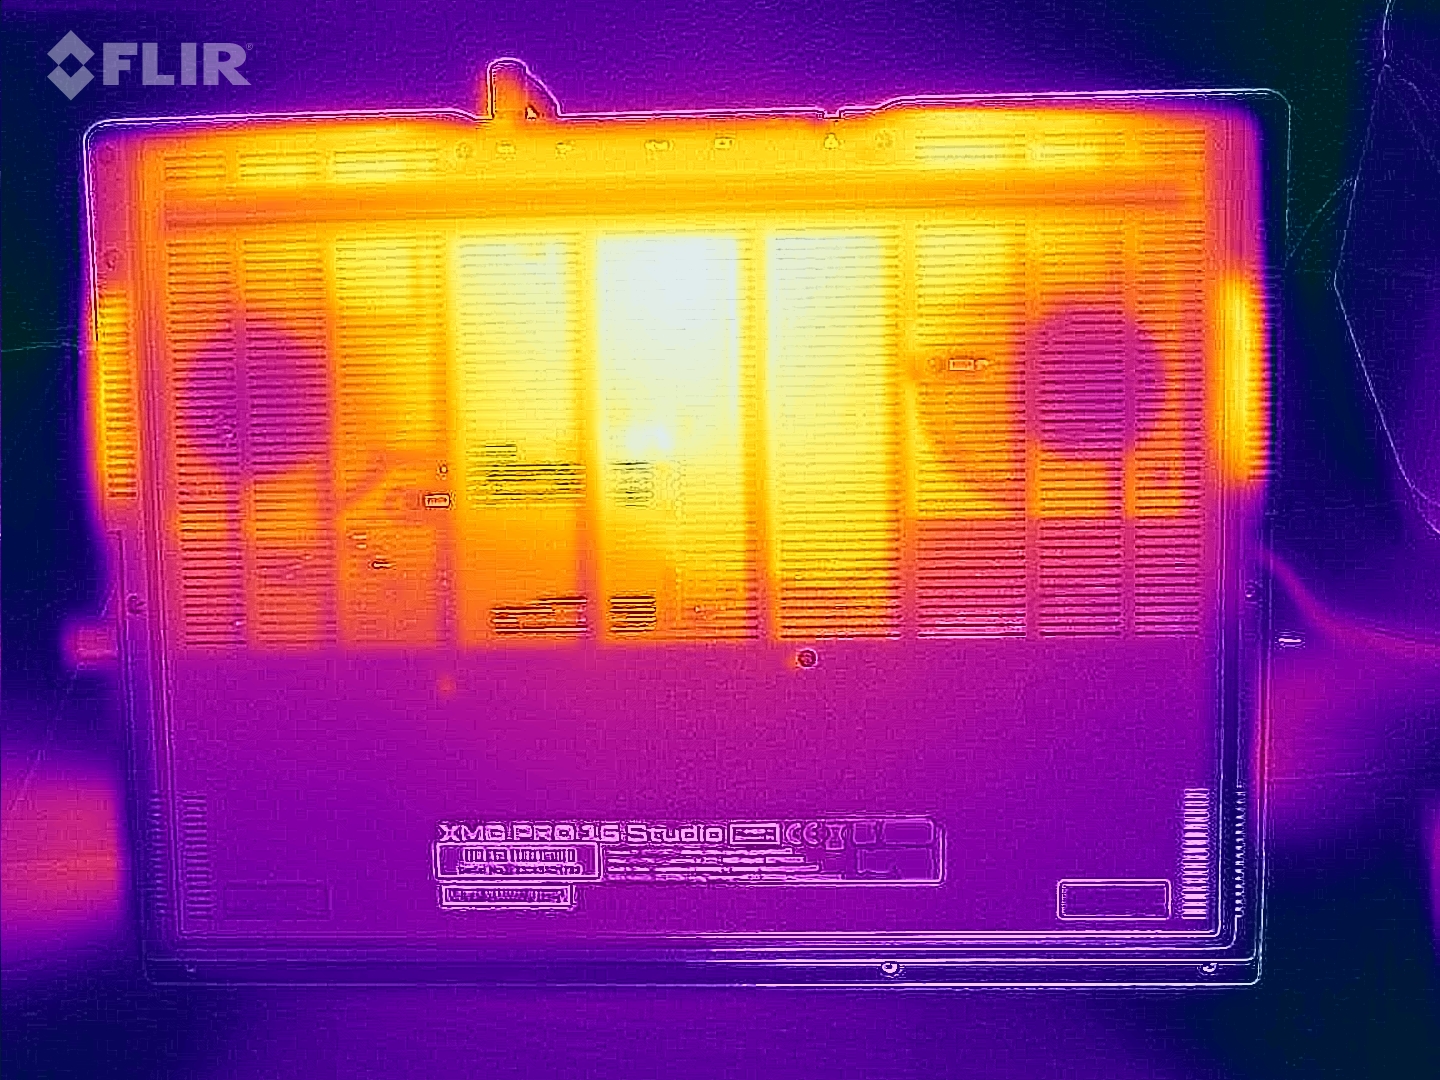
Température
Le test de stress et le test Witcher 3 ont fait grimper la température de l'ordinateur portable de manière significative. Dans certaines zones, nous avons mesuré des températures supérieures à 60 degrés Celsius. En utilisation quotidienne (bureau, internet), ces valeurs restent généralement dans la zone verte - mais à un niveau plus élevé que des concurrents tels que leLenovo Legion Slim 7i 16 Gen 8.
(-) La température maximale du côté supérieur est de 55 °C / 131 F, par rapport à la moyenne de 40.4 °C / 105 F, allant de 21.2 à 68.8 °C pour la classe Gaming.
(-) Le fond chauffe jusqu'à un maximum de 66 °C / 151 F, contre une moyenne de 43.2 °C / 110 F
(+) En utilisation inactive, la température moyenne du côté supérieur est de 30.1 °C / 86 F, par rapport à la moyenne du dispositif de 33.9 °C / 93 F.
(-) En jouant à The Witcher 3, la température moyenne du côté supérieur est de 43.9 °C / 111 F, alors que la moyenne de l'appareil est de 33.9 °C / 93 F.
(+) Les repose-poignets et le pavé tactile atteignent la température maximale de la peau (33 °C / 91.4 F) et ne sont donc pas chauds.
(-) La température moyenne de la zone de l'appui-paume de dispositifs similaires était de 28.8 °C / 83.8 F (-4.2 °C / #-7.6 F).
| Schenker XMG Pro 16 Studio (Mid 23) Intel Core i9-13900H, NVIDIA GeForce RTX 4070 Laptop GPU | Asus Vivobook Pro 16X K6604JV-MX016W Intel Core i9-13980HX, NVIDIA GeForce RTX 4060 Laptop GPU | Lenovo Legion Slim 7i 16 Gen 8 Intel Core i9-13900H, NVIDIA GeForce RTX 4070 Laptop GPU | HP Omen Transcend 16 Intel Core i9-13900HX, NVIDIA GeForce RTX 4070 Laptop GPU | MSI Stealth 16 Studio A13VG Intel Core i7-13700H, NVIDIA GeForce RTX 4070 Laptop GPU | |
|---|---|---|---|---|---|
| Heat | 11% | 15% | 16% | -6% | |
| Maximum Upper Side * (°C) | 55 | 39.7 28% | 49.8 9% | 47.4 14% | 60 -9% |
| Maximum Bottom * (°C) | 66 | 60 9% | 48.8 26% | 54.4 18% | 61 8% |
| Idle Upper Side * (°C) | 33 | 30.9 6% | 29.4 11% | 28.4 14% | 38.2 -16% |
| Idle Bottom * (°C) | 35 | 34.7 1% | 30 14% | 29.2 17% | 37.7 -8% |
* ... Moindre est la valeur, meilleures sont les performances
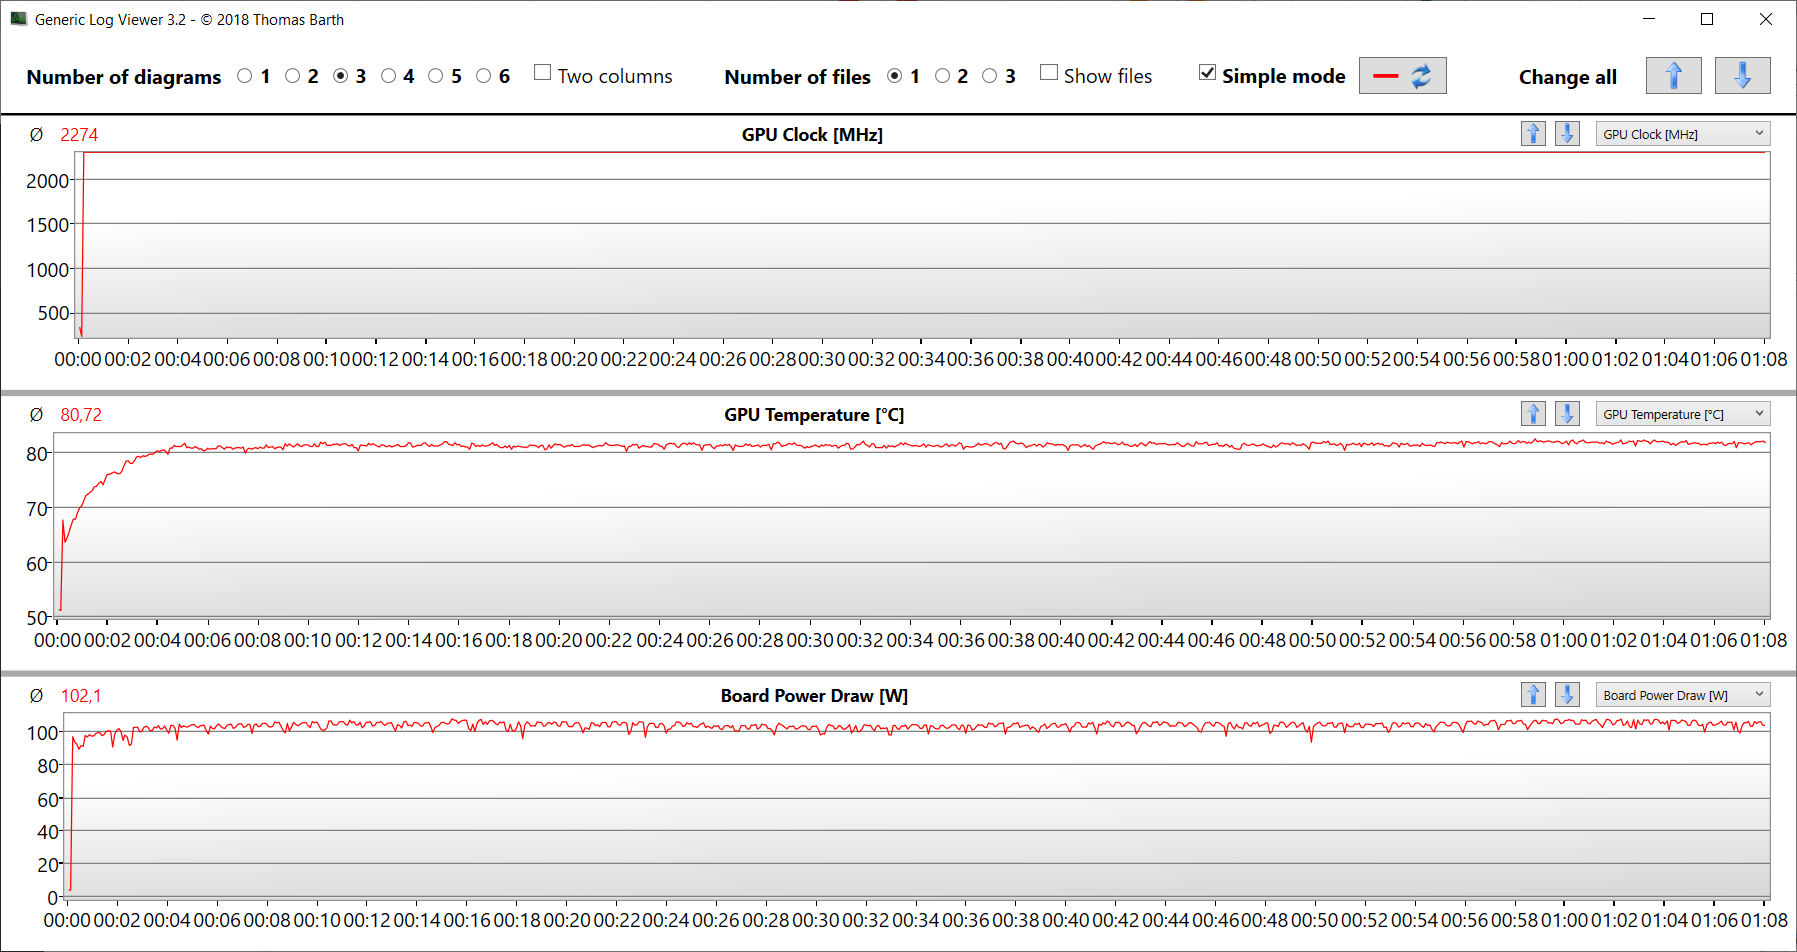
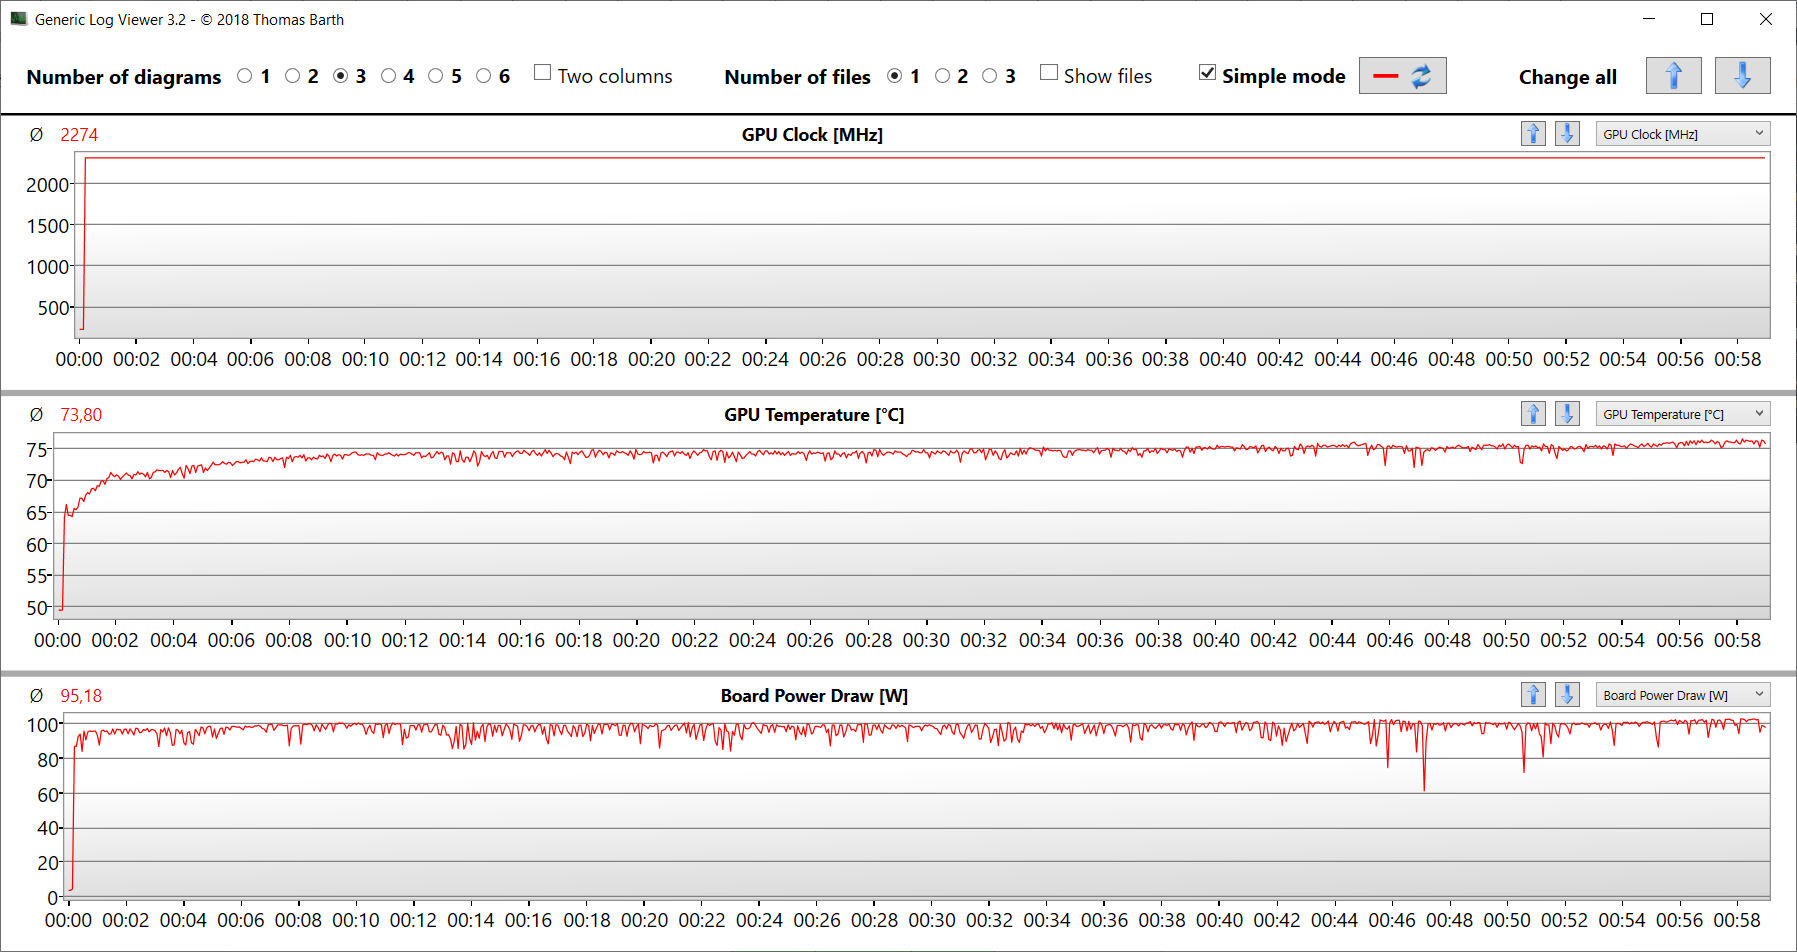
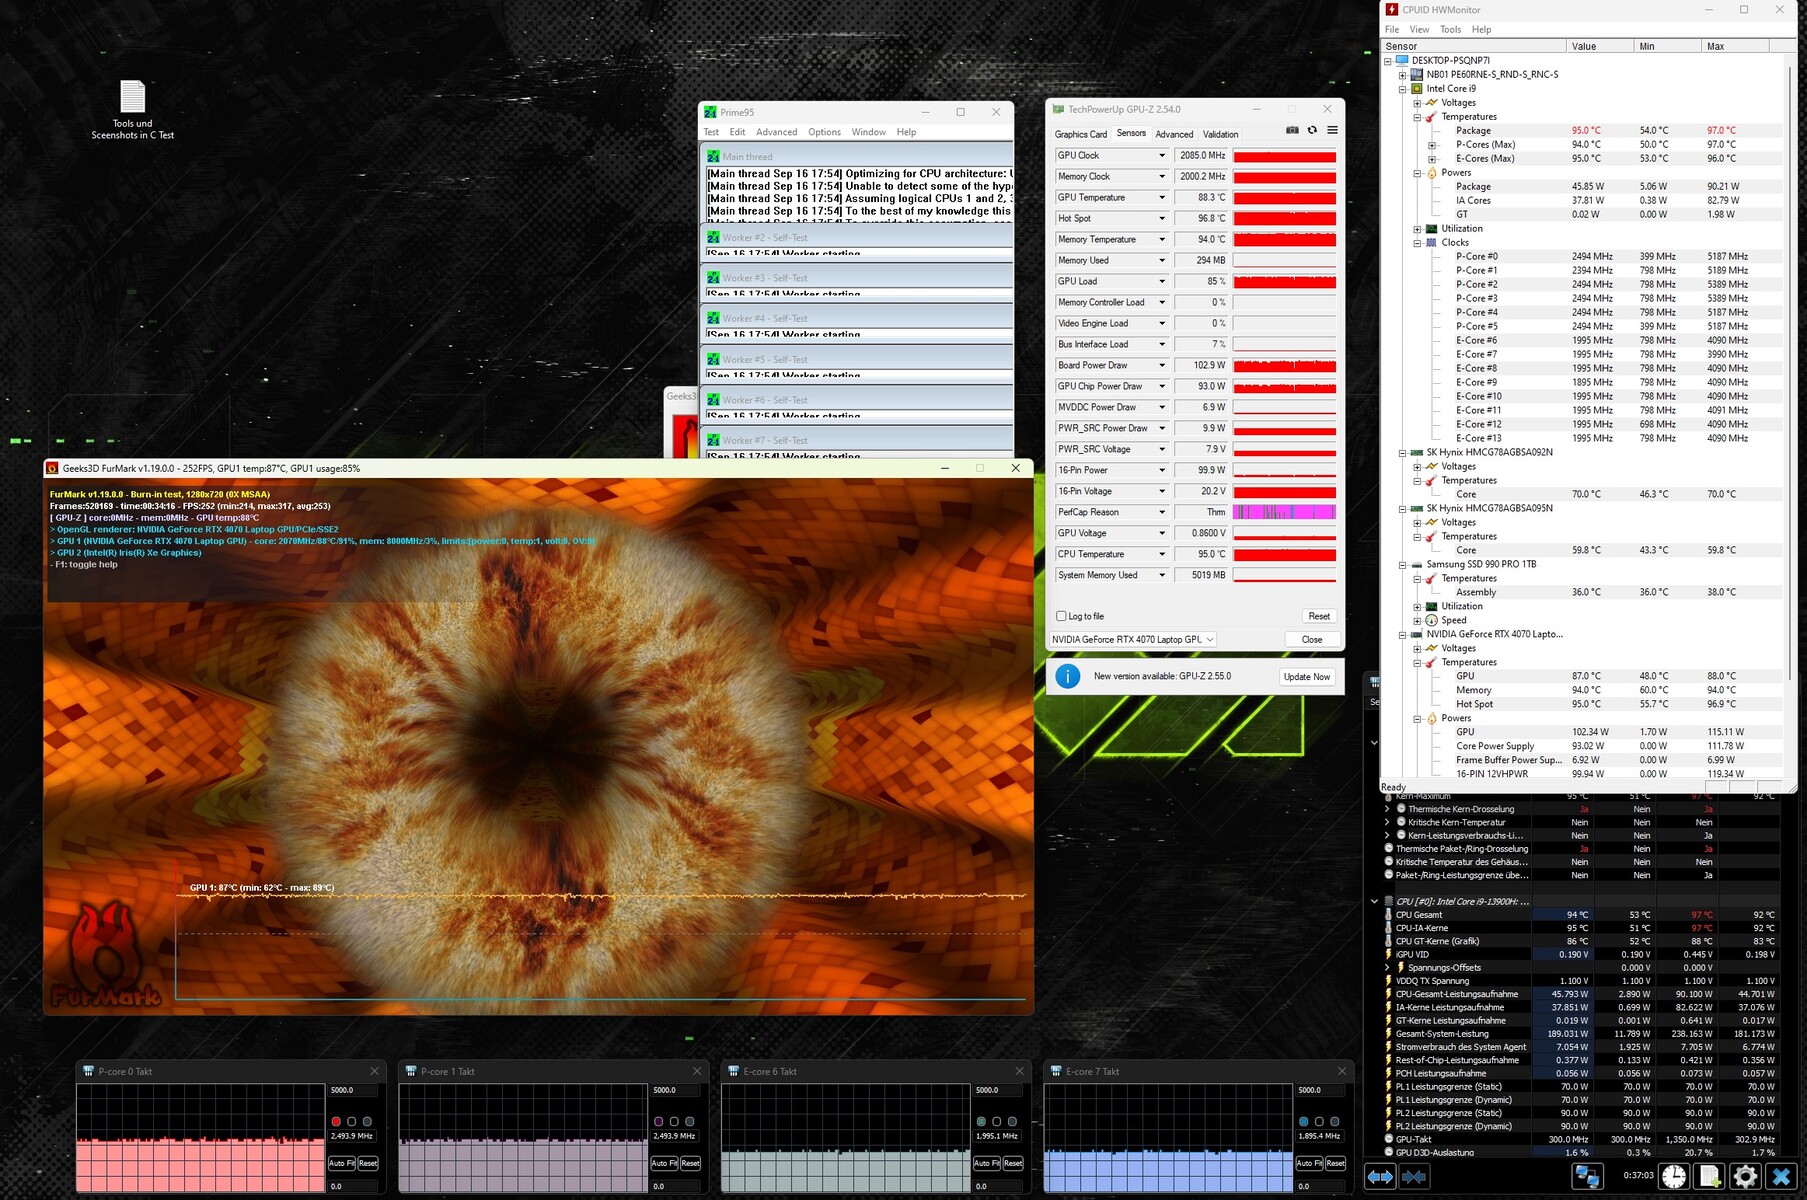
Épreuve d'effort
Le test de stress (Prime95 et Furmark en utilisation continue) simule un scénario extrême pour tester la stabilité du système à pleine charge. L'unité centrale (P : 3,8 à 3,9 GHz, E : 2,7 GHz) a commencé le test avec des fréquences d'horloge élevées. Au fil du temps, ces valeurs ont baissé jusqu'à atteindre le niveau de l'horloge de base. Le GPU a fonctionné presque à pleine puissance.
Haut-parleurs
Les haut-parleurs stéréo produisent un son très correct dans l'ensemble. Les basses pourraient être plus puissantes.
Schenker XMG Pro 16 Studio (Mid 23) analyse audio
(±) | le niveau sonore du haut-parleur est moyen mais bon (80# dB)
Basses 100 - 315 Hz
(±) | basse réduite - en moyenne 12.7% inférieure à la médiane
(+) | les basses sont linéaires (6.1% delta à la fréquence précédente)
Médiums 400 - 2000 Hz
(+) | médiane équilibrée - seulement 2.3% de la médiane
(+) | les médiums sont linéaires (4.8% delta à la fréquence précédente)
Aiguës 2 - 16 kHz
(+) | des sommets équilibrés - à seulement 2.6% de la médiane
(+) | les aigus sont linéaires (6% delta à la fréquence précédente)
Globalement 100 - 16 000 Hz
(+) | le son global est linéaire (10.9% différence à la médiane)
Par rapport à la même classe
» 7% de tous les appareils testés de cette catégorie étaient meilleurs, 3% similaires, 90% pires
» Le meilleur avait un delta de 6%, la moyenne était de 18%, le pire était de 132%.
Par rapport à tous les appareils testés
» 6% de tous les appareils testés étaient meilleurs, 2% similaires, 92% pires
» Le meilleur avait un delta de 4%, la moyenne était de 23%, le pire était de 134%.
Lenovo Legion Slim 7i 16 Gen 8 analyse audio
(+) | les haut-parleurs peuvent jouer relativement fort (84.8# dB)
Basses 100 - 315 Hz
(±) | basse réduite - en moyenne 12.1% inférieure à la médiane
(±) | la linéarité des basses est moyenne (9% delta à la fréquence précédente)
Médiums 400 - 2000 Hz
(+) | médiane équilibrée - seulement 1.4% de la médiane
(+) | les médiums sont linéaires (3.3% delta à la fréquence précédente)
Aiguës 2 - 16 kHz
(+) | des sommets équilibrés - à seulement 4.4% de la médiane
(+) | les aigus sont linéaires (5.6% delta à la fréquence précédente)
Globalement 100 - 16 000 Hz
(+) | le son global est linéaire (10.5% différence à la médiane)
Par rapport à la même classe
» 6% de tous les appareils testés de cette catégorie étaient meilleurs, 2% similaires, 92% pires
» Le meilleur avait un delta de 6%, la moyenne était de 18%, le pire était de 132%.
Par rapport à tous les appareils testés
» 5% de tous les appareils testés étaient meilleurs, 1% similaires, 93% pires
» Le meilleur avait un delta de 4%, la moyenne était de 23%, le pire était de 134%.
Consommation électrique
Le Pro 16 n'a pas montré de valeurs de consommation d'énergie remarquables. Les taux sont à un niveau normal pour le matériel installé. Les tests Witcher 3 test et le test de stress ont été exécutés avec une consommation d'énergie légèrement en baisse. Le bloc d'alimentation (230 watts) est suffisamment puissant. Louable : Dans le champ de comparaison, l'ordinateur portable XMG a la consommation d'énergie globale la plus faible.
| Éteint/en veille | |
| Au repos | |
| Fortement sollicité |
|
Légende:
min: | |
| Schenker XMG Pro 16 Studio (Mid 23) i9-13900H, GeForce RTX 4070 Laptop GPU | Asus Vivobook Pro 16X K6604JV-MX016W i9-13980HX, GeForce RTX 4060 Laptop GPU | Lenovo Legion Slim 7i 16 Gen 8 i9-13900H, GeForce RTX 4070 Laptop GPU | HP Omen Transcend 16 i9-13900HX, GeForce RTX 4070 Laptop GPU | MSI Stealth 16 Studio A13VG i7-13700H, GeForce RTX 4070 Laptop GPU | Moyenne de la classe Gaming | |
|---|---|---|---|---|---|---|
| Power Consumption | -23% | -65% | -76% | -8% | -33% | |
| Idle Minimum * (Watt) | 8 | 13.8 -73% | 22 -175% | 19.2 -140% | 11 -38% | 13 ? -63% |
| Idle Average * (Watt) | 12 | 16 -33% | 29 -142% | 22.7 -89% | 18 -50% | 19 ? -58% |
| Idle Maximum * (Watt) | 23 | 19 17% | 39.5 -72% | 55.4 -141% | 19 17% | 24.6 ? -7% |
| Load Average * (Watt) | 94 | 147 -56% | 98.7 -5% | 128.4 -37% | 91 3% | 110.7 ? -18% |
| Witcher 3 ultra * (Watt) | 181.5 | 147.8 19% | 171.8 5% | 206 -13% | 130 28% | |
| Load Maximum * (Watt) | 215 | 244 -13% | 213.2 1% | 292 -36% | 228 -6% | 259 ? -20% |
* ... Moindre est la valeur, meilleures sont les performances
Power consumption Witcher 3 / stress test
Power consumption with external monitor
Délais d'exécution
Dans notre test WLAN réaliste (représentant la charge lors de l'appel de sites Web à l'aide d'un script), l'ordinateur portable de 16 pouces a atteint des durées d'exécution de 6:45 h - un bon résultat dans l'ensemble. Dans le champ de comparaison, le Pro 16 dispose de la plus petite capacité de batterie (73 Wh), mais il offre les meilleures durées d'utilisation par Wh.
Points positifs
Points négatifs
Verdict - Une puissance harmonieuse
L'édition de vidéos et d'images, la diffusion en continu, le rendu et les jeux font tous partie de l'expertise de cet ordinateur portable. La puissance nécessaire est fournie par un processeurCore i9-13900Het uneGeForce RTX 4070à un niveau constamment élevé. Il est possible de trouver un bon compromis entre les performances et les émissions sonores.
Le XMG Pro 16 Studio (Mid 23) de Schenker s'avère être un outil puissant pour les joueurs et les créateurs.
Son écran QHD+ (16 pouces, 2 560 x 1 600 pixels, sRGB, IPS, 240 Hz) avec un rapport d'aspect 16:10 convivial nous a laissé une bonne impression. Malgré tout : L'écran d'un ordinateur portable de création devrait être capable de représenter l'espace colorimétrique DCI P3. Deux emplacements SSD (PCIe 4) incluant la prise en charge RAID-0/1 garantissent beaucoup de stockage et des temps de chargement courts.
Ses ports USB-C (1x USB 3.2 Gen 2, 1x Thunderbolt 4) facilitent l'intégration de l'ordinateur portable dans les configurations d'espace de travail existantes et ouvrent d'autres options d'extension (GPU externe, docking). Son port TB-4 peut émettre un signal DisplayPort et prend en charge Power Delivery. A cela s'ajoutent des durées d'exécution relativement bonnes.
Une alternative pourrait être leLenovo Legion Slim 7i 16 Gen 8: Il dispose du même processeur et du même GPU, mais offre une puissance de calcul légèrement supérieure. Les points faibles de l'ordinateur portable : Consommation d'énergie plus élevée, mémoire vive soudée, ralentissement du SSD.
Prix et disponibilité
Le XMG Pro 16 Studio peut être configuré individuellement et commandé via la boutique en ligne Schenker. Notre appareil de test est disponible pour environ 2 400 dollars.
Schenker XMG Pro 16 Studio (Mid 23)
- 10/22/2023 v7 (old)
Sascha Mölck
Transparency
La sélection des appareils à examiner est effectuée par notre équipe éditoriale. L'échantillon de test a été prêté à l'auteur par le fabricant ou le détaillant pour les besoins de cet examen. Le prêteur n'a pas eu d'influence sur cette évaluation et le fabricant n'a pas reçu de copie de cette évaluation avant sa publication. Il n'y avait aucune obligation de publier cet article. En tant que média indépendant, Notebookcheck n'est pas soumis à l'autorité des fabricants, des détaillants ou des éditeurs.
Voici comment Notebookcheck teste
Chaque année, Notebookcheck examine de manière indépendante des centaines d'ordinateurs portables et de smartphones en utilisant des procédures standardisées afin de garantir que tous les résultats sont comparables. Nous avons continuellement développé nos méthodes de test depuis environ 20 ans et avons établi des normes industrielles dans le processus. Dans nos laboratoires de test, des équipements de mesure de haute qualité sont utilisés par des techniciens et des rédacteurs expérimentés. Ces tests impliquent un processus de validation en plusieurs étapes. Notre système d'évaluation complexe repose sur des centaines de mesures et de points de référence bien fondés, ce qui garantit l'objectivité.Price comparison

