Intel Core i9-13900H

L'Intel Core i9-13900H est un processeur mobile haut de gamme pour ordinateurs portables basé sur la série Raptor Lake-H (architecture Alder Lake). Il a été annoncé au début de l'année 2023 et offre 6 cœurs de performance (cœurs P, architecture Golden Cove) et 8 cœurs efficaces (cœurs E, architecture Gracemont). Les cœurs P prennent en charge l'Hyper-Threading, ce qui porte à 20 le nombre de threads pris en charge lorsqu'ils sont combinés aux cœurs E. La fréquence d'horloge varie de 2,6 à 5,4 GHz (cœur unique turbo, tous les cœurs 4,9 GHz) sur le cluster de performance et de 1,9 à 4,1 GHz sur le cluster d'efficacité. Les performances des cœurs E devraient être similaires à celles des anciens cœurs Skylake (comparez avec les cœurs Core i7-6920HQ). Tous les cœurs peuvent utiliser jusqu'à 24 Mo de cache L3. Par rapport au Core i9-13900HK similaire, le 13900H ne supporte pas de multiplicateur ouvert pour l'overclocking, mais par contre l'ensemble des fonctions de gestion vPro.
Performances
Le 13900H moyen de notre base de données se situe dans la même ligue que le Core i5-13500HX, Core i7-13705H, Core i9-12900HK, Core i9-13905H ainsi que les Ryzen 9 7940HSen ce qui concerne les résultats des tests multithread, le Ryzen 9 7940HS est plus performant que le Core Core i9-1329HH.
Grâce à sa solution de refroidissement décente et à la limitation à long terme de la puissance du processeur à 115 W, le Stealth 17 Studio A13VH-014 est l'un des ordinateurs portables les plus rapides construits autour du 13900H que nous connaissons. Il peut être environ 50% plus rapide dans les charges de travail liées au CPU que le système le plus lent équipé de la même puce dans notre base de données, en date d'août 2023.
Caractéristiques
Le contrôleur de mémoire intégré prend en charge différents types de mémoire jusqu'à DDR5-5200 (contre 4800 MHz pour la 12e génération). Le Thread Director (matériel) peut aider le système d'exploitation à décider quel thread utiliser sur les cœurs les plus performants ou les plus efficaces pour obtenir les meilleures performances. Pour les tâches d'intelligence artificielle, le processeur intègre également GNA 3.0 et DL Boost (via AVX2). Quick Sync dans la version 8 est le même que dans les CPU Rocket Lake et prend en charge le décodage MPEG-2, AVC, VC-1, JPEG, le décodage VP8, VP9, HEVC et AV1 dans le matériel. Le processeur prend désormais en charge PCIe 5.0 x8 pour un GPU et deux PCIe 4.0 x4 pour des disques SSD.
La carte graphique intégrée est basée sur l'architecture Xe et offre 96 EU (Execution Units).
Le CPU a une puissance de base de 45 W (115 W PL2), mais la plupart des ordinateurs portables utilisent un PL1 d'environ 60 W. Le SoC est fabriqué dans un processus de 10nm chez Intel, connu sous le nom d'Intel 7 (amélioré par rapport à la 12e génération).
| Nom de code | Raptor Lake-H | ||||||||||||||||||||||||||||||||||||||||||||
| Gamme | Intel Raptor Lake-H | ||||||||||||||||||||||||||||||||||||||||||||
Gamme: Raptor Lake-H Raptor Lake-H
| |||||||||||||||||||||||||||||||||||||||||||||
| Fréquence | 1900 - 5400 MHz | ||||||||||||||||||||||||||||||||||||||||||||
| Cache de Niveau 1 (L1) | 1.2 MB | ||||||||||||||||||||||||||||||||||||||||||||
| Cache de Niveau 2 (L2) | 11.5 MB | ||||||||||||||||||||||||||||||||||||||||||||
| Cache de Niveau 3 (L3) | 24 MB | ||||||||||||||||||||||||||||||||||||||||||||
| Nombres de cœurs/threads simultanés supportés | 14 / 20 6 x 5.4 GHz Intel Golden Cove P-Core 8 x 4.1 GHz Intel Gracemont E-Core | ||||||||||||||||||||||||||||||||||||||||||||
| Consommation énergétique maximale (TDP) | 45 Watt(s) | ||||||||||||||||||||||||||||||||||||||||||||
| Lithographie (procédé de fabrication) | 10 nm | ||||||||||||||||||||||||||||||||||||||||||||
| Température maximale | 100 °C | ||||||||||||||||||||||||||||||||||||||||||||
| Socket | BGA1744 | ||||||||||||||||||||||||||||||||||||||||||||
| Fonctionnalités | DDR4-3200/LPDDR4x-4266/DDR5-5200/LPDDR5-6400/LPDDR5x-6400 RAM, PCIe 5, Thr. Dir., DL B., GNA, vPro Ent., RPE, MMX, SSE, SSE2, SSE3, SSSE3, SSE4.1, SSE4.2, AES, AVX, AVX2, FMA3, SHA | ||||||||||||||||||||||||||||||||||||||||||||
| Carte graphique | Intel Iris Xe Graphics G7 96EUs ( - 1500 MHz) | ||||||||||||||||||||||||||||||||||||||||||||
| 64 Bit | Prend en charge les instructions 64 Bit | ||||||||||||||||||||||||||||||||||||||||||||
| Architecture | x86 | ||||||||||||||||||||||||||||||||||||||||||||
| Date de présentation | 01/04/2023 | ||||||||||||||||||||||||||||||||||||||||||||
| Lien redirigeant vers une page externe du produit | ark.intel.com | ||||||||||||||||||||||||||||||||||||||||||||
Benchmarks
* Plus les chiffres sont petits, plus les performances sont élevées
Critiques du Intel Core i9-13900H processeur


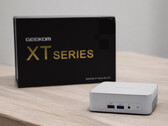
Test du Geekom GT13 Pro : alternative élégante au NUC, avec i9-13900H, RAM DDR4 32 Go et SSD 2 To

Test du Minisforum MS-01 : Core i9-13900H, mais pas de carte graphique dédiée

Test de l'Asus VivoBook S15 BAPE : OLED ultra puissant ? Edition spéciale en déclin ?

Test du Huawei MateBook D 16 2024 : PC portable multimédia désormais avec Core i9-13900H
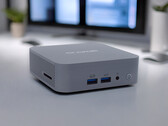
Geekom Mini IT13: Intel Iris Xe Graphics G7 96EUs, 0.7 kg
Critique » Test du Geekom Mini IT13 : mini PC de bureau avec un Core i9 surpuissant
MSI Stealth 16 Mercedes-AMG Motorsport A13VG: NVIDIA GeForce RTX 4070 Laptop GPU, 16.00", 1.9 kg
Critique » Test du MSI Stealth 16 Mercedes-AMG Motorsport : voiture de course mobile avec écran OLED
Asus VivoBook Pro 16 K6602VU: NVIDIA GeForce RTX 4050 Laptop GPU, 16.00", 1.9 kg
Critique » Test de l'Asus VivoBook Pro 16 (2023) : i9-13900H, RTX 4050, et OLED 3.2K pour les créatifs amateurs
Schenker XMG Pro 16 Studio (Mid 23): NVIDIA GeForce RTX 4070 Laptop GPU, 16.00", 2.6 kg
Critique » Test du XMG Pro 16 Studio (mi-2023) : PC portable RTX 4070 pour joueurs et créatifs
Lenovo ThinkPad P1 G6-21FV000DGE: NVIDIA RTX 2000 Ada Generation Laptop, 16.00", 1.9 kg
Critique » Test du Lenovo ThinkPad P1 G6 : station de travail mobile à la place du ThinkPad X1 Extreme
Dell Precision 5480: NVIDIA RTX 3000 Ada Generation Laptop, 14.00", 1.6 kg
Critique » Test du Dell Precision 5480 : la station de travail inaugure la Nvidia RTX 3000 Ada
Dell Precision 5000 5680: NVIDIA RTX 5000 Ada Generation Laptop, 16.00", 2.3 kg
Critique » Test du Dell Precision 5680 : Ada Lovelace domine les stations de travail
Lenovo Legion Slim 7i 16 Gen 8: NVIDIA GeForce RTX 4070 Laptop GPU, 16.00", 2.1 kg
Critique » Test du Lenovo Legion Slim 7i 16 Gen 8 : plus fin que le Razer Blade 16
Asus ZenBook 14X UX3404VC: Intel Iris Xe Graphics G7 96EUs, 14.50", 1.6 kg
Critique » Test de l'Asus ZenBook 14X (2023) : l'ultrabook OLED à la limite de ses capacités
Asus ROG Flow X16 GV601V: NVIDIA GeForce RTX 4060 Laptop GPU, 16.00", 2.1 kg
Critique » Test de l'Asus ROG Flow X16 : puissante station de travail 2-en-1 de 16 pouces pour le jeu
Huawei MateBook 16s i9: Intel Iris Xe Graphics G7 96EUs, 16.00", 2 kg
Critique » Test du Huawei MateBook 16s 2023 : PC portable multimédia avec écran 3:2 plus lumineux
Asus Zenbook Pro 14 OLED UX6404VI: NVIDIA GeForce RTX 4070 Laptop GPU, 14.50", 1.7 kg
Critique » Test de l'Asus Zenbook Pro 14 OLED : LE rival du MacBook Pro avec un écran OLED 120 Hz
Asus ZenBook Pro 14 Duo UX8402VV-P1021W: NVIDIA GeForce RTX 4060 Laptop GPU, 14.50", 1.8 kg
Critique » Test de l'Asus ZenBook Pro 14 Duo pour les créatifs : productivité accrue avec le 2e écran
Samsung Galaxy Book3 Ultra 16, i9-13900H RTX 4070: NVIDIA GeForce RTX 4070 Laptop GPU, 16.00", 1.8 kg
Critique » Test du Samsung Galaxy Book3 Ultra 16 RTX 4070 : performances graphiques dans un portable pro
Asus ROG Flow Z13 GZ301V: NVIDIA GeForce RTX 4060 Laptop GPU, 13.40", 1.6 kg
Critique » Test de l'Asus ROG Flow Z13 : la folie RTX 4060 dans une tablette de jeu impressionnante
MSI Stealth 17 Studio A13VH-014: NVIDIA GeForce RTX 4080 Laptop GPU, 17.30", 3 kg
Critique » Test du MSI Stealth 17 Studio : PC portable avec RTX 4080 silencieuse pour tous usages
Asus ROG Flow Z13 ACRNM: NVIDIA GeForce RTX 4070 Laptop GPU, 13.40", 1.7 kg
Critique » Test de l'Asus ROG Flow Z13 ACRNM : PC portable gaming convertible avec RTX 4070
Asus ROG Zephyrus M16 GU604VY-NM042X: NVIDIA GeForce RTX 4090 Laptop GPU, 16.00", 2.3 kg
Critique » Test de l'Asus ROG Zephyrus M16 (2023) : RTX 4090 avec un écran Mini-LED ultra lumineux
Gigabyte AERO 16 OLED BSF: NVIDIA GeForce RTX 4070 Laptop GPU, 16.00", 2.1 kg
Critique » Test du Slim Gigabyte AERO 16 OLED : la RTX 4070 efficace pour les joueurs et les créatifs
MSI Modern 14 H D13MG: Intel Iris Xe Graphics G7 96EUs, 14.00", 1.6 kg
Autres tests » MSI Modern 14 H D13MG
Acer Nitro V 15 ANV15-51, i9-13900H: NVIDIA GeForce RTX 4060 Laptop GPU, 15.60", 2.1 kg
Autres tests » Acer Nitro V 15 ANV15-51, i9-13900H
Infinix GT Book 16: NVIDIA GeForce RTX 4060 Laptop GPU, 16.00", 2 kg
Autres tests » Infinix GT Book 16
Asus Vivobook S 14 Flip TP3402VA, i9-13900H: Intel Iris Xe Graphics G7 96EUs, 14.00", 1.5 kg
Autres tests » Asus Vivobook S 14 Flip TP3402VA, i9-13900H
Lenovo Legion Slim 7 16IRH8, i9-13900H RTX 4070: NVIDIA GeForce RTX 4070 Laptop GPU, 16.00", 2 kg
Autres tests » Lenovo Legion Slim 7 16IRH8, i9-13900H RTX 4070
Huawei MateBook D 16 2024: Intel Iris Xe Graphics G7 96EUs, 16.00", 1.7 kg
Autres tests » Huawei MateBook D 16 2024
MSI Modern 15 H B13M: Intel Iris Xe Graphics G7 96EUs, 15.60", 1.9 kg
Autres tests » MSI Modern 15 H B13M
Dell XPS 17 9730, i9-13900H: NVIDIA GeForce RTX 4070 Laptop GPU, 17.00", 2.4 kg
Autres tests » Dell XPS 17 9730, i9-13900H
Lenovo ThinkPad P1 G6-21FV000DGE: NVIDIA RTX 2000 Ada Generation Laptop, 16.00", 1.9 kg
Autres tests » Lenovo ThinkPad P1 G6-21FV000DGE
Asus Vivobook S 14 OLED K5404VA: Intel Iris Xe Graphics G7 96EUs, 14.50", 1.5 kg
Autres tests » Asus Vivobook S 14 OLED K5404VA
Asus VivoBook Pro 16 OLED K6602V: NVIDIA GeForce RTX 4050 Laptop GPU, 16.00", 1.9 kg
Autres tests » Asus VivoBook Pro 16 OLED K6602V
Dell Precision 5480: NVIDIA RTX 3000 Ada Generation Laptop, 14.00", 1.6 kg
Autres tests » Dell Precision 5480
Asus TUF Gaming F17 FX707VV: NVIDIA GeForce RTX 4060 Laptop GPU, 17.30", 2.6 kg
Autres tests » Asus TUF Gaming F17 FX707VV
Asus VivoBook S15 OLED K5504, i9-13900H: Intel Iris Xe Graphics G7 96EUs, 15.60", 1.8 kg
Autres tests » Asus VivoBook S15 OLED K5504, i9-13900H
MSI Stealth 16 Studio A13VF, i9-13900H: NVIDIA GeForce RTX 4060 Laptop GPU, 16.00", 2 kg
Autres tests » MSI Stealth 16 Studio A13VF, i9-13900H
Asus ZenBook 14X OLED UX3404VA, i9-13900H: Intel Iris Xe Graphics G7 96EUs, 14.50", 1.6 kg
Autres tests » Asus ZenBook 14X OLED UX3404VA, i9-13900H
HP Zbook Power G10: NVIDIA RTX 3000 Ada Generation Laptop, 15.60", 2 kg
Autres tests » HP Zbook Power G10
Asus VivoBook 16X OLED K3605VV: NVIDIA GeForce RTX 4060 Laptop GPU, 16.00", 1.8 kg
Autres tests » Asus VivoBook 16X OLED K3605VV
Asus Vivobook 17X K3704VA: Intel Iris Xe Graphics G7 96EUs, 17.30", 2.1 kg
Autres tests » Asus Vivobook 17X K3704VA
Asus ZenBook Pro 16X OLED UX7602BZ: NVIDIA GeForce RTX 4080 Laptop GPU, 16.00", 2.2 kg
Autres tests » Asus ZenBook Pro 16X OLED UX7602BZ
Dell Precision 5000 5680: NVIDIA RTX 5000 Ada Generation Laptop, 16.00", 2.3 kg
Autres tests » Dell Precision 5000 5680
MSI Stealth 17 Studio A13VI, i9-13900H: NVIDIA GeForce RTX 4090 Laptop GPU, 17.30", 2.8 kg
Autres tests » MSI Stealth 17 Studio A13VI, i9-13900H
Asus ZenBook Pro 14 Duo UX8402VV-P1021W: NVIDIA GeForce RTX 4060 Laptop GPU, 14.50", 1.8 kg
Autres tests » Asus ZenBook Pro 14 Duo UX8402VV-P1021W
HP Envy 16-h1000: NVIDIA GeForce RTX 4060 Laptop GPU, 16.00", 2.7 kg
Autres tests » HP Envy 16-h1000
Origin PC EON14-S 2023: NVIDIA GeForce RTX 4070 Laptop GPU, 14.00", 1.8 kg
Autres tests » Origin PC EON14-S 2023
Asus Vivobook 15 OLED L1201W: Intel Iris Xe Graphics G7 96EUs, 15.60", 1.7 kg
Autres tests » Asus Vivobook 15 OLED L1201W
Huawei MateBook D 16 2023: Intel Iris Xe Graphics G7 96EUs, 16.00", 1.7 kg
Autres tests » Huawei MateBook D 16 2023
Lenovo Legion Slim 7i 16 Gen 8: NVIDIA GeForce RTX 4070 Laptop GPU, 16.00", 2.1 kg
Autres tests » Lenovo Legion Slim 7i 16 Gen 8
Hyperbook SL606, i9-13900H RTX 4070: NVIDIA GeForce RTX 4070 Laptop GPU, 16.00", 2.7 kg
Autres tests » Hyperbook SL606, i9-13900H RTX 4070
Asus ROG Flow Z13 GZ301VU: NVIDIA GeForce RTX 4050 Laptop GPU, 13.40", 1.2 kg
Autres tests » Asus ROG Flow Z13 GZ301VU
Asus VivoBook Pro 15 OLED K6502VU: NVIDIA GeForce RTX 4050 Laptop GPU, 15.60", 1.8 kg
Autres tests » Asus VivoBook Pro 15 OLED K6502VU
Asus Vivobook 14X K3405VC: NVIDIA GeForce RTX 3050 4GB Laptop GPU, 14.00", 1.4 kg
Autres tests » Asus Vivobook 14X K3405VC
Asus ZenBook Pro 14 Duo UX8402VU: NVIDIA GeForce RTX 4050 Laptop GPU, 14.50", 1.8 kg
Autres tests » Asus ZenBook Pro 14 Duo UX8402VU
Asus VivoBook Pro 16 OLED K6602VV: NVIDIA GeForce RTX 4060 Laptop GPU, 16.00", 1.9 kg
Autres tests » Asus VivoBook Pro 16 OLED K6602VV
Asus Zenbook Pro 14 OLED UX6404VV: NVIDIA GeForce RTX 4060 Laptop GPU, 14.50", 1.6 kg
Autres tests » Asus Zenbook Pro 14 OLED UX6404VV
Origin PC EVO16-S 2023: NVIDIA GeForce RTX 4070 Laptop GPU, 16.10", 2.5 kg
Autres tests » Origin PC EVO16-S 2023
Asus ROG Zephyrus M16 GU604VY-NM001W: NVIDIA GeForce RTX 4090 Laptop GPU, 16.00", 2.3 kg
Autres tests » Asus ROG Zephyrus M16 GU604VY-NM001W
Asus ROG Zephyrus M16 GU604VZ: NVIDIA GeForce RTX 4080 Laptop GPU, 16.00", 2.3 kg
Autres tests » Asus ROG Zephyrus M16 GU604VZ
Asus ROG Zephyrus M16 GU604VI: NVIDIA GeForce RTX 4070 Laptop GPU, 16.00", 2.3 kg
Autres tests » Asus ROG Zephyrus M16 GU604VI
Asus Zenbook Pro 14 OLED UX6404VI: NVIDIA GeForce RTX 4070 Laptop GPU, 14.50", 1.7 kg
Autres tests » Asus Zenbook Pro 14 OLED UX6404VI
Asus VivoBook 14X S3405: Intel Iris Xe Graphics G7 96EUs, 14.00", 1.4 kg
Autres tests » Asus VivoBook 14X S3405
MSI Pulse 15 B13VFK: NVIDIA GeForce RTX 4060 Laptop GPU, 15.60", 2.3 kg
Autres tests » MSI Pulse 15 B13VFK
Asus ROG Flow X16 GV601V: NVIDIA GeForce RTX 4060 Laptop GPU, 16.00", 2.1 kg
Autres tests » Asus ROG Flow X16 GV601V
Asus ROG Flow X16 GV601VI: NVIDIA GeForce RTX 4070 Laptop GPU, 16.00", 2.2 kg
Autres tests » Asus ROG Flow X16 GV601VI
MSI Stealth 17 Studio A13VH-053US: NVIDIA GeForce RTX 4080 Laptop GPU, 17.30", 2.8 kg
Autres tests » MSI Stealth 17 Studio A13VH-053US
Asus ROG Flow Z13 GZ301V: NVIDIA GeForce RTX 4060 Laptop GPU, 13.40", 1.6 kg
Autres tests » Asus ROG Flow Z13 GZ301V
Gigabyte AERO 16 OLED BSF: NVIDIA GeForce RTX 4070 Laptop GPU, 16.00", 2.1 kg
Autres tests » Gigabyte AERO 16 OLED BSF
Asus ROG Flow Z13 ACRNM: NVIDIA GeForce RTX 4070 Laptop GPU, 13.40", 1.7 kg
Autres tests » Asus ROG Flow Z13 ACRNM
Asus ROG Zephyrus G16 GU603VV-N4007W: NVIDIA GeForce RTX 4060 Laptop GPU, 16.00", 2 kg
Autres tests » Asus ROG Zephyrus G16 2023 GU603VV-N4007W
Asus Zenbook 14X UX3404VC-M3145X: NVIDIA GeForce RTX 3050 4GB Laptop GPU, 14.50", 1.6 kg
Autres tests » Asus Zenbook 14X UX3404VC-M3145X
Asus ZenBook 14X UX3404VC: Intel Iris Xe Graphics G7 96EUs, 14.50", 1.6 kg
Autres tests » Asus ZenBook 14X UX3404VC
Asus ROG Zephyrus M16 GU604VY-NM042X: NVIDIA GeForce RTX 4090 Laptop GPU, 16.00", 2.3 kg
Autres tests » Asus ROG Zephyrus M16 GU604VY-NM042X
Samsung Galaxy Book3 Ultra 16, i9-13900H RTX 4070: NVIDIA GeForce RTX 4070 Laptop GPU, 16.00", 1.8 kg
Autres tests » Samsung Galaxy Book3 Ultra 16, i9-13900H RTX 4070
Huawei MateBook 16s i9: Intel Iris Xe Graphics G7 96EUs, 16.00", 2 kg
Autres tests » Huawei MateBook 16s i9
Minisforum MS-01: Intel Iris Xe Graphics G7 96EUs, 1.5 kg
» Minisforum MS-A1 est un mini PC haut de gamme alimenté par AMD avec jusqu'à 96 Go de mémoire, support OCuLink
Lenovo Legion Slim 7i 16 Gen 8: NVIDIA GeForce RTX 4070 Laptop GPU, 16.00", 2.1 kg
» Une petite attention aux détails sur le Lenovo Legion Slim Gen 8 résout un problème gênant sur l'Alienware x16 r1


