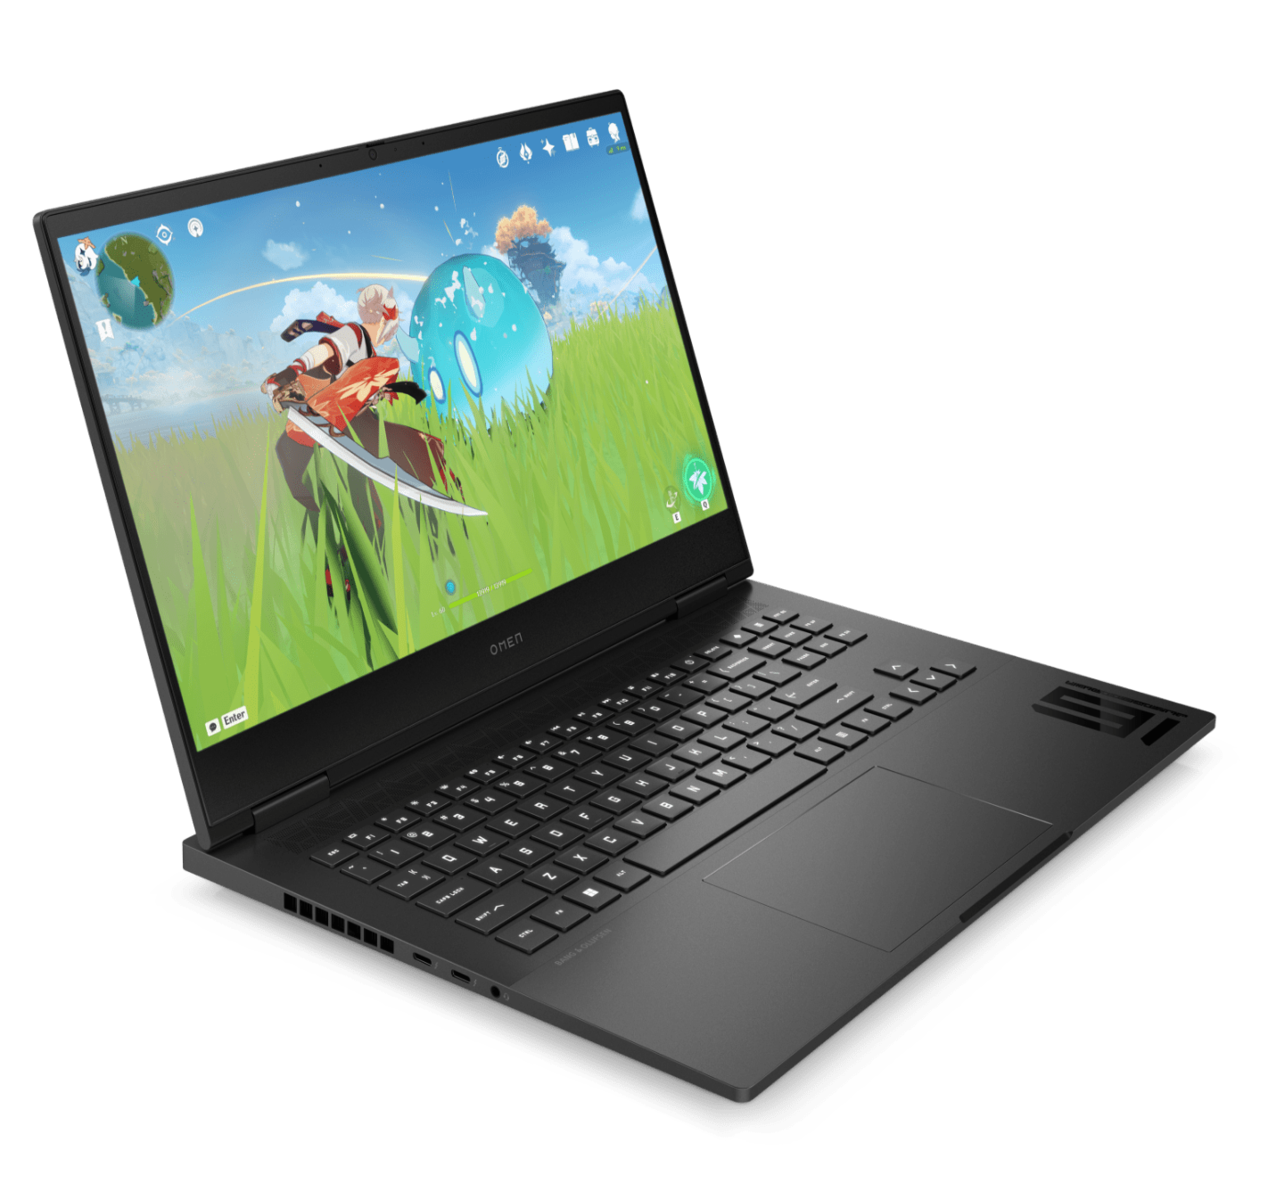
Test du HP Omen Transcend 16 : plus qu'une simple différence de nom

L'Omen Transcend 16 est une variante de l'Omen 16 standard Test du HP Omen 16 2023 : la GeForce RTX 4080 à 145 W . Bien qu'ils utilisent des designs de châssis et des matériaux similaires, l'Omen Transcend 16 présente plusieurs différences importantes que les acheteurs potentiels doivent connaître.
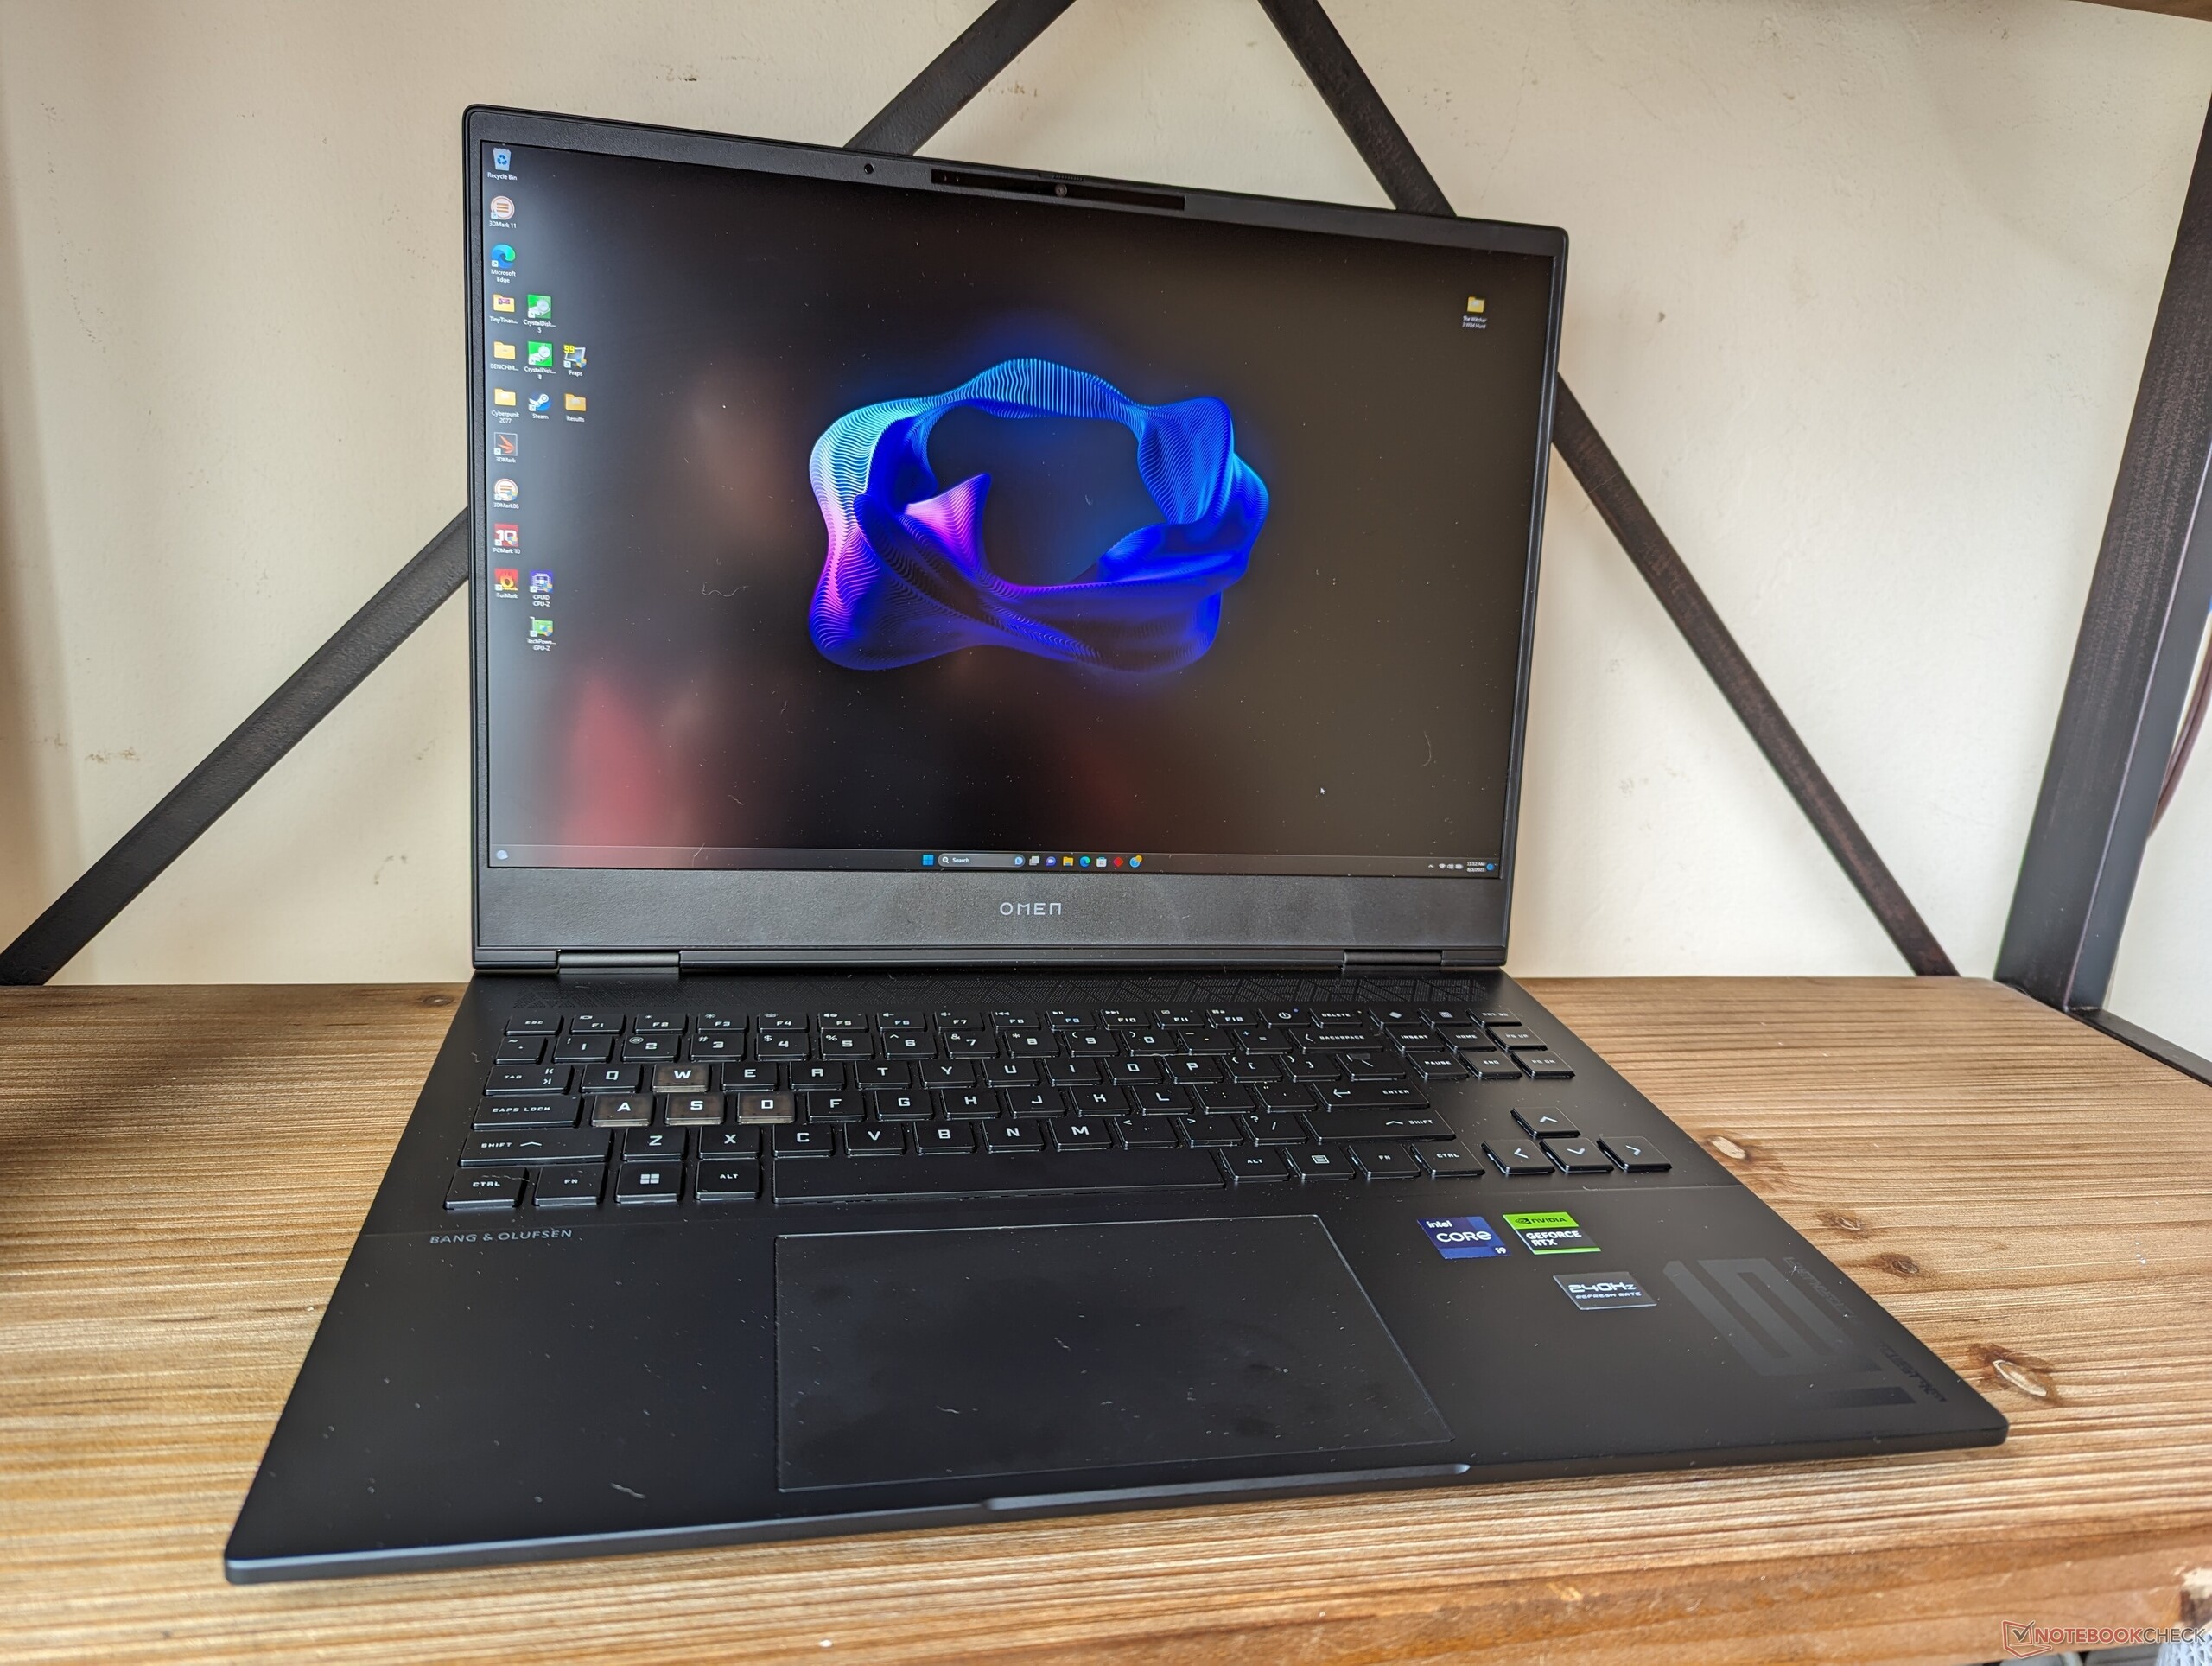
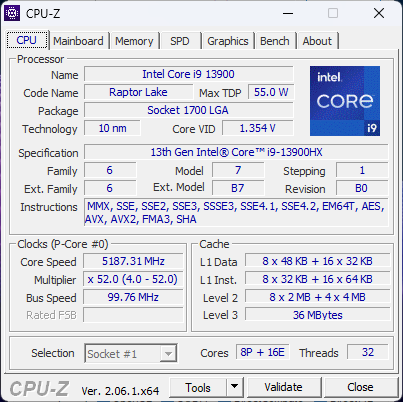
Notre unité d'évaluation spécifique est la configuration la plus élevée disponible avec le CPU Raptor Lake Core i9-13900HX de 13ème génération, le GPU RTX 4070 de 130 W GeForce et un écran mini-LED QHD+ (2560 x 1600) 240 Hz avec toutes les couleurs DCI-P3 pour un prix de détail d'environ $2500 USD. Des modèles moins chers sont disponibles avec le Core i7-13700HX, le GPU RTX 4050 et un écran IPS 1200p de 165 Hz pour environ 1250 USD.
Les concurrents dans ce domaine comprennent d'autres ordinateurs portables de jeu haut de gamme de 16 pouces comme le Lenovo Legion Slim 7i 16 G8, Acer Nitro 16, Alienware x16 R1, ou le Asus ROG Zephyrus M16.
Plus de commentaires sur HP :
Comparaison avec les concurrents potentiels
Note | Date | Modèle | Poids | Épaisseur | Taille | Résolution | Prix |
|---|---|---|---|---|---|---|---|
| 87.9 % v7 (old) | 08/23 | HP Omen Transcend 16 i9-13900HX, GeForce RTX 4070 Laptop GPU | 2.3 kg | 19.8 mm | 16.00" | 2560x1600 | |
| 90 % v7 (old) | 07/23 | Lenovo Legion Slim 7i 16 Gen 8 i9-13900H, GeForce RTX 4070 Laptop GPU | 2.1 kg | 19.9 mm | 16.00" | 2560x1600 | |
| 87.4 % v7 (old) | 07/23 | HP Omen 16-wf000 i7-13700HX, GeForce RTX 4080 Laptop GPU | 2.4 kg | 23.6 mm | 16.10" | 2560x1440 | |
| 88.4 % v7 (old) | 06/23 | Alienware x16 R1 i9-13900HK, GeForce RTX 4080 Laptop GPU | 2.6 kg | 18.57 mm | 16.00" | 2560x1600 | |
| 88.1 % v7 (old) | 06/23 | Acer Nitro 16 AN16-41 R7 7735HS, GeForce RTX 4070 Laptop GPU | 2.7 kg | 27.9 mm | 16.00" | 2560x1600 | |
| 87.8 % v7 (old) | 02/23 | Asus ROG Zephyrus M16 GU603Z i9-12900H, GeForce RTX 3070 Ti Laptop GPU | 2.1 kg | 19.9 mm | 16.00" | 2560x1600 |
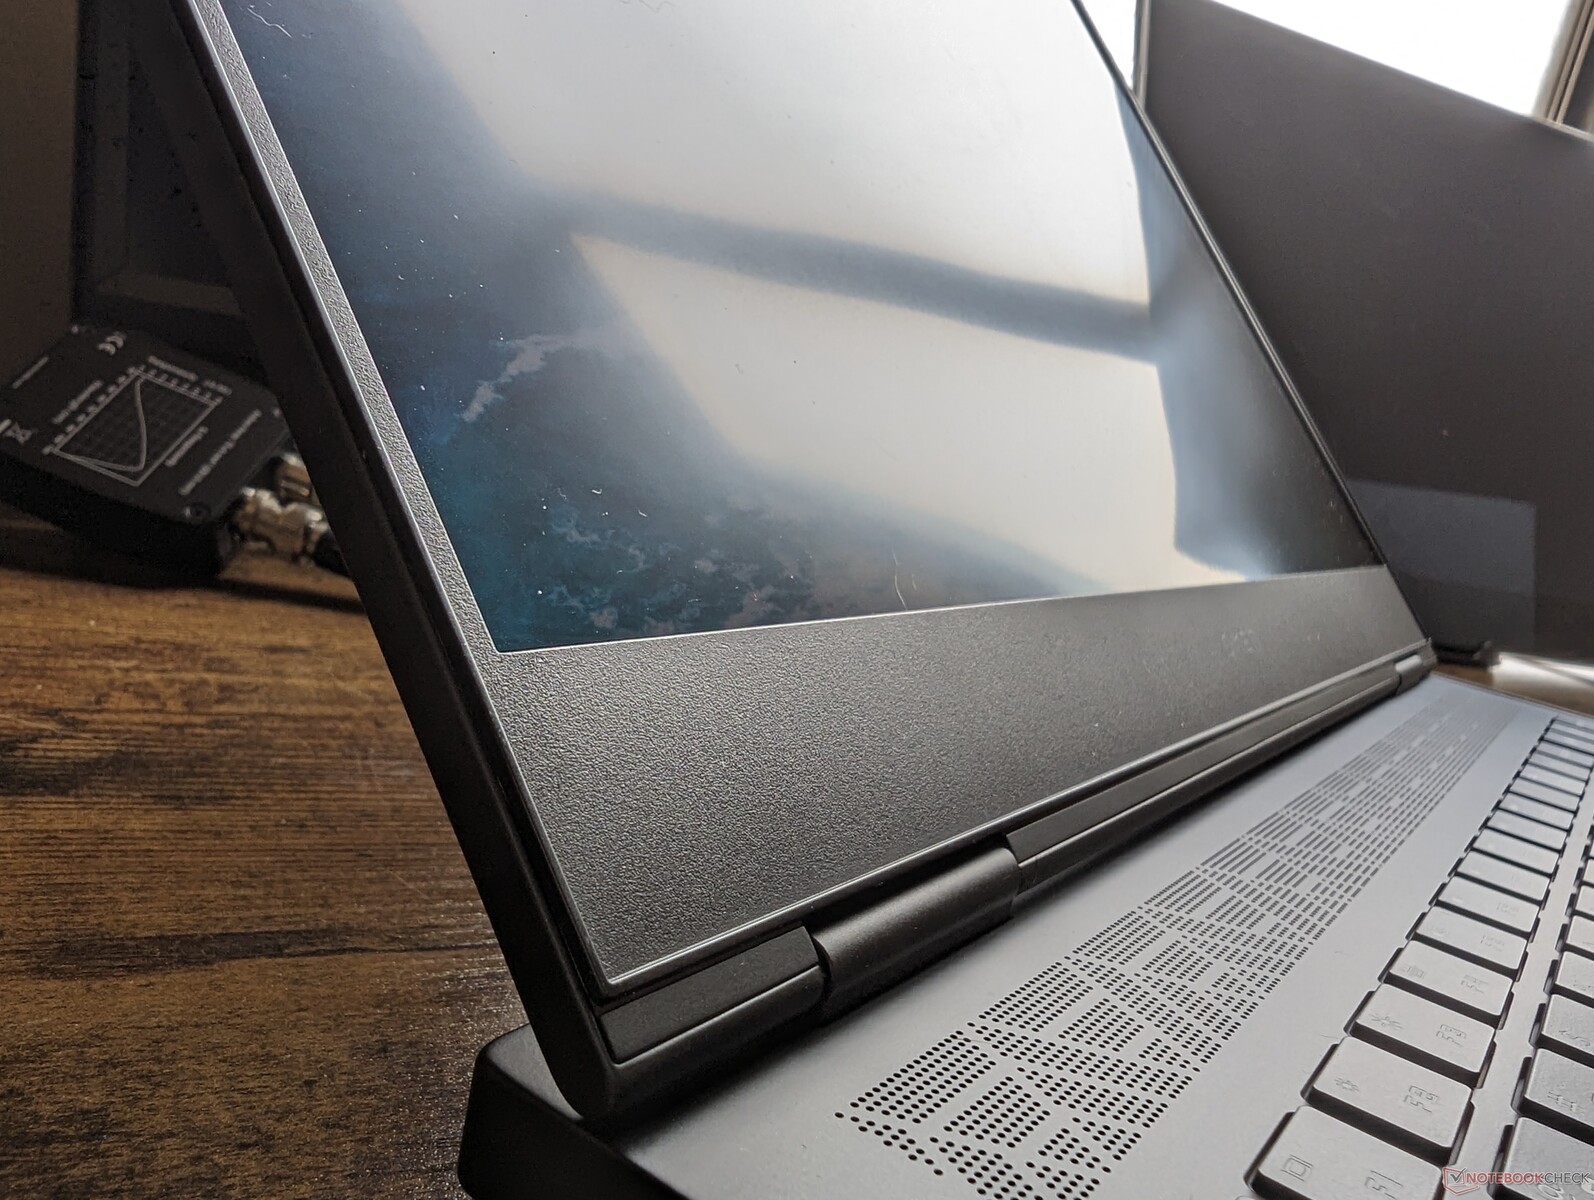
Cas - Mêmes matériaux, dimensions différentes
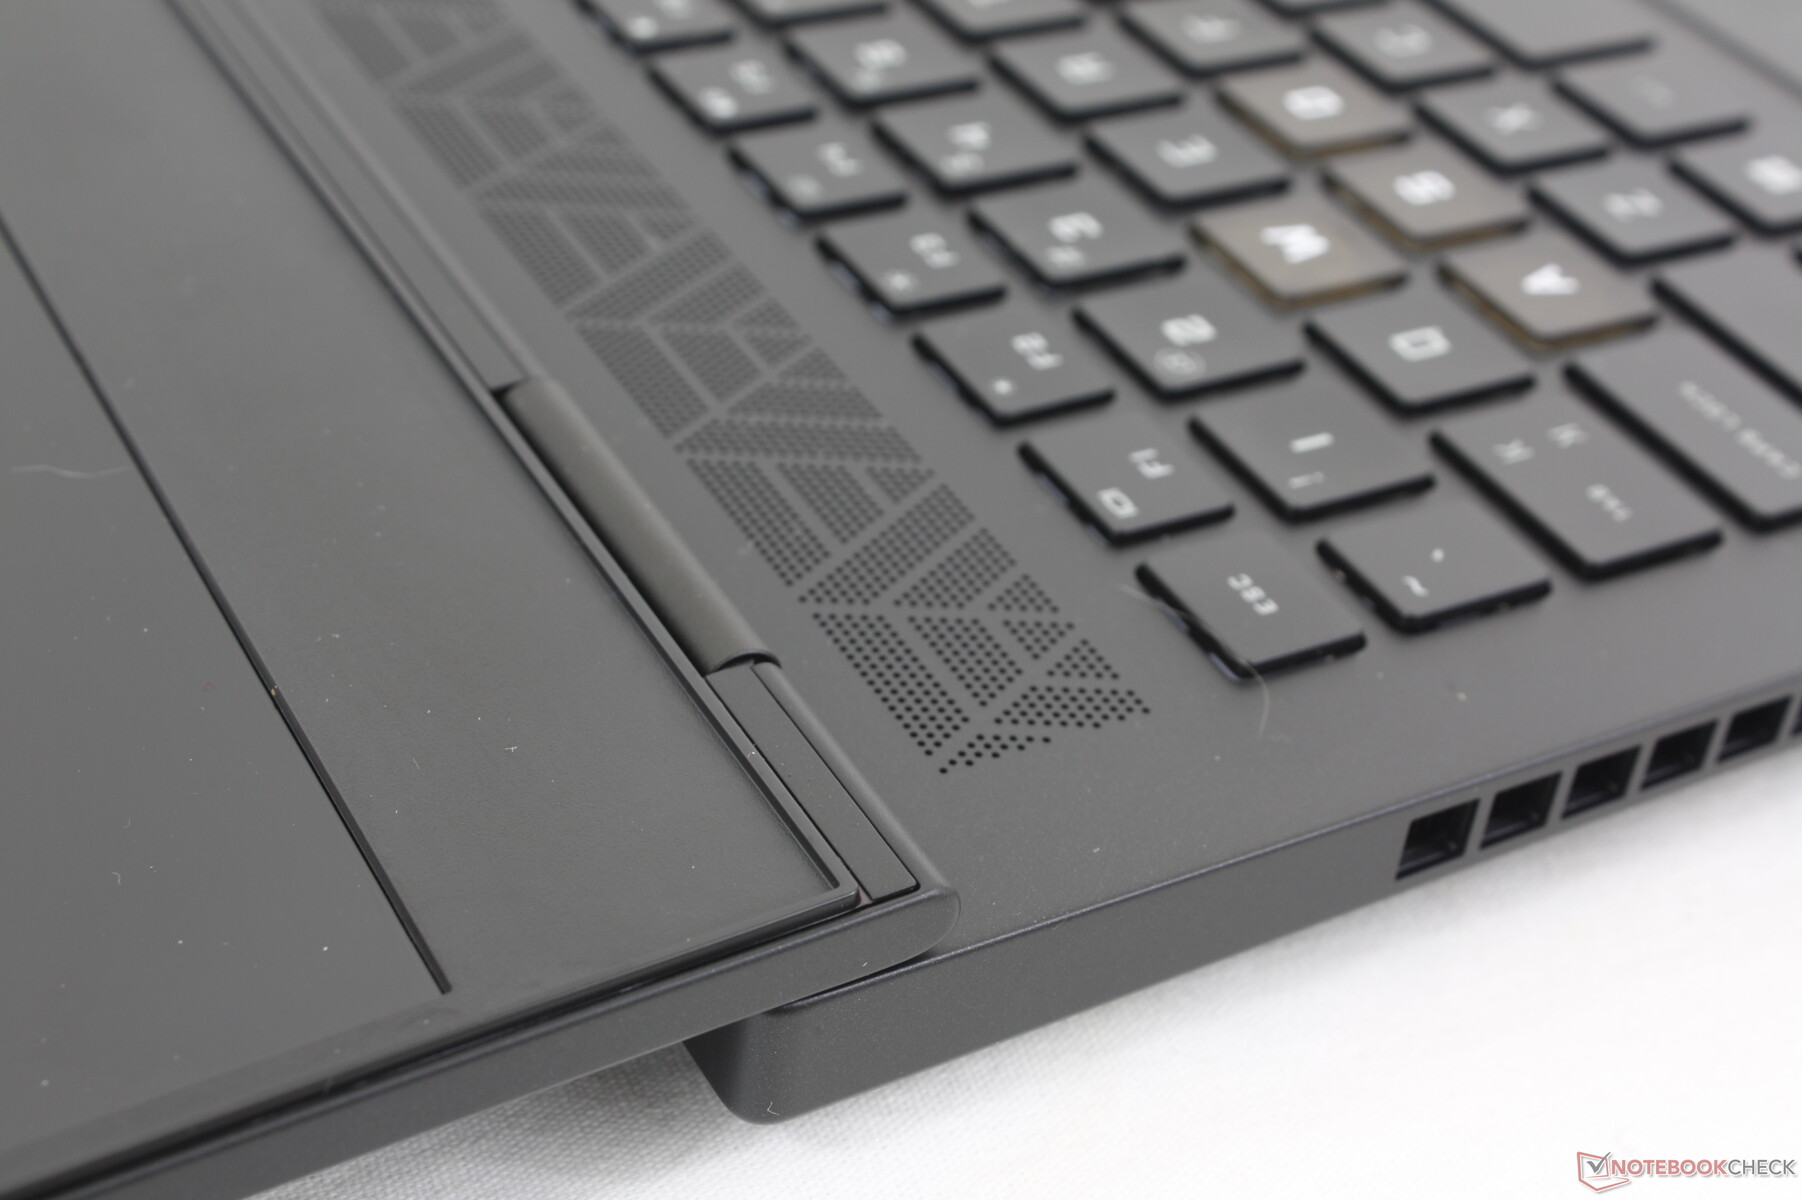
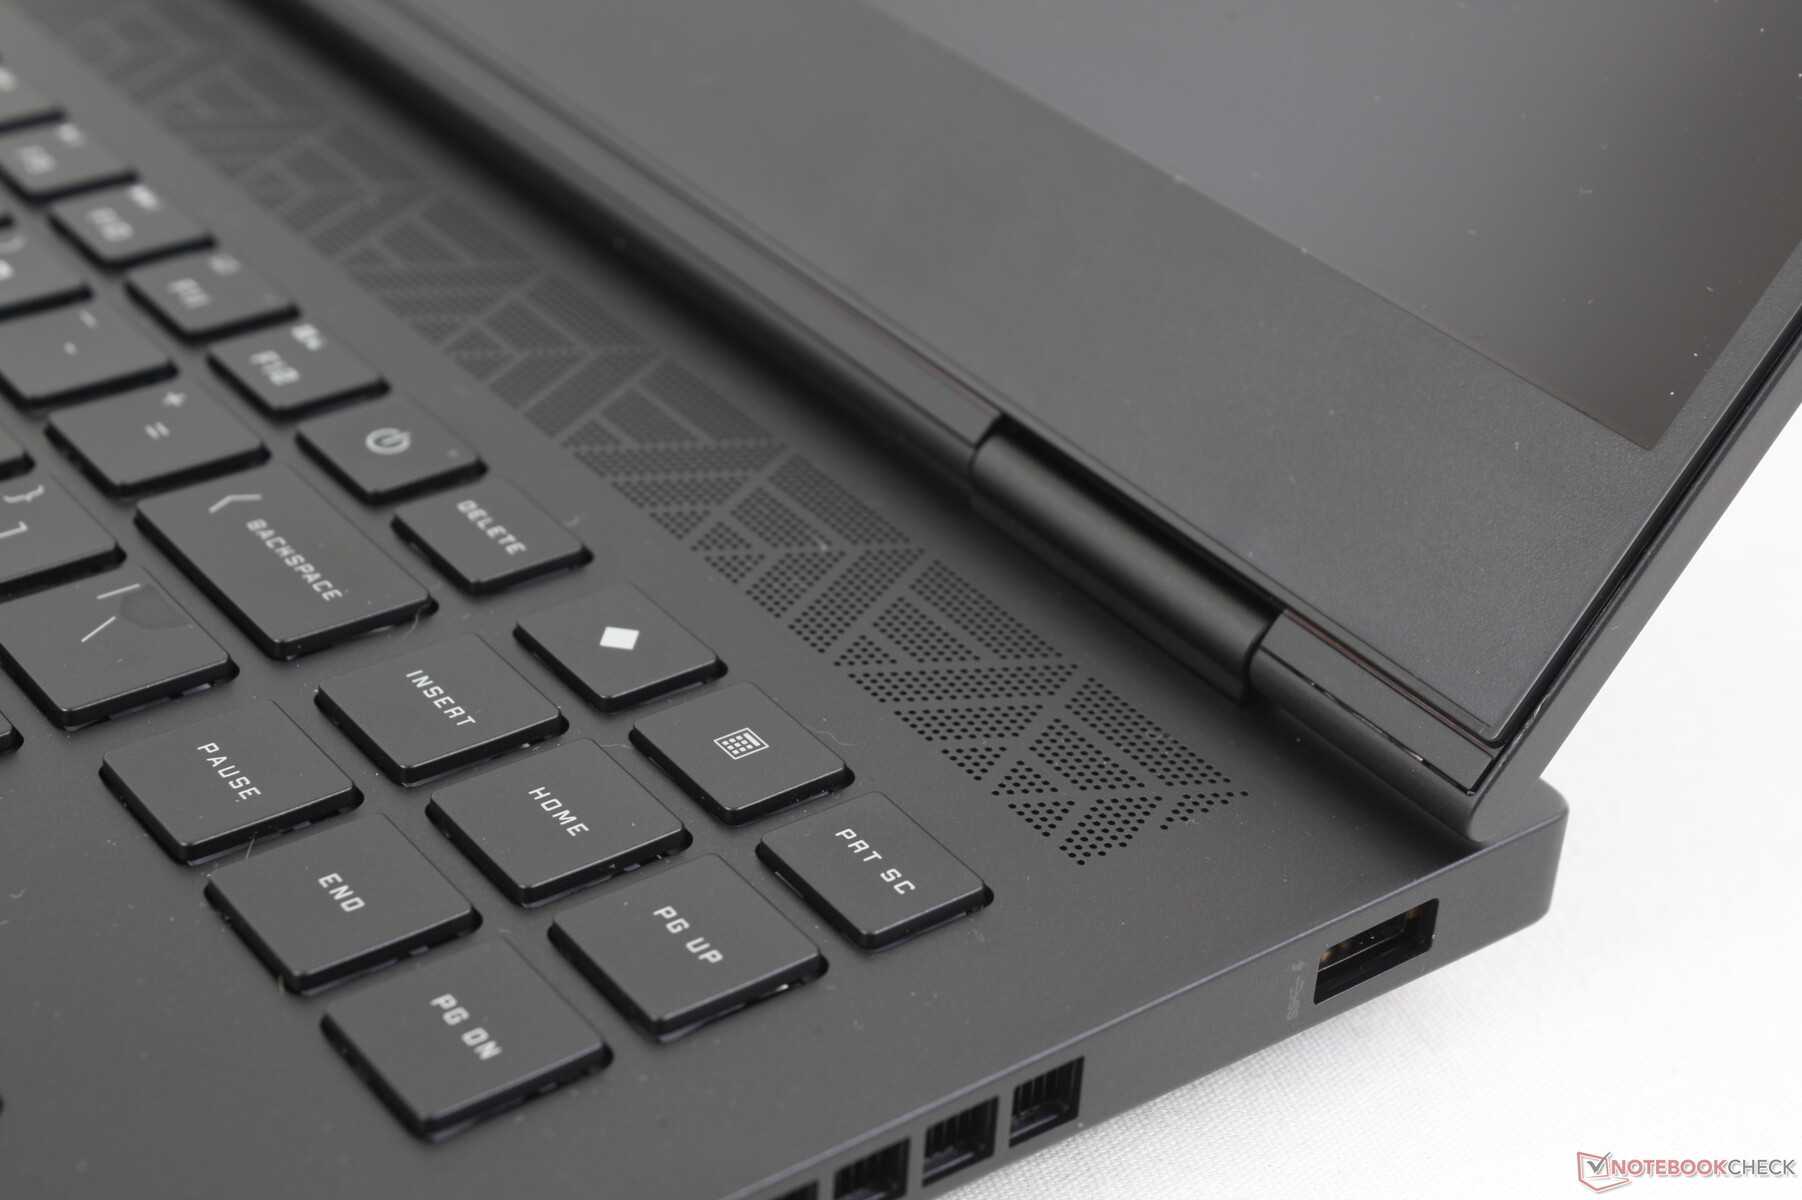
L'une des principales différences externes entre l'Omen 16 et l'Omen Transcend 16 est le passage du 16:9 au 16:10, ce qui explique que leur empreinte au sol soit légèrement différente. Pour le reste, les deux modèles partagent des matériaux métalliques et une texture similaires. Il est intéressant de noter que le bord inférieur de l'écran n'est pas plus étroit que celui de l'Omen 16, malgré le changement de format.
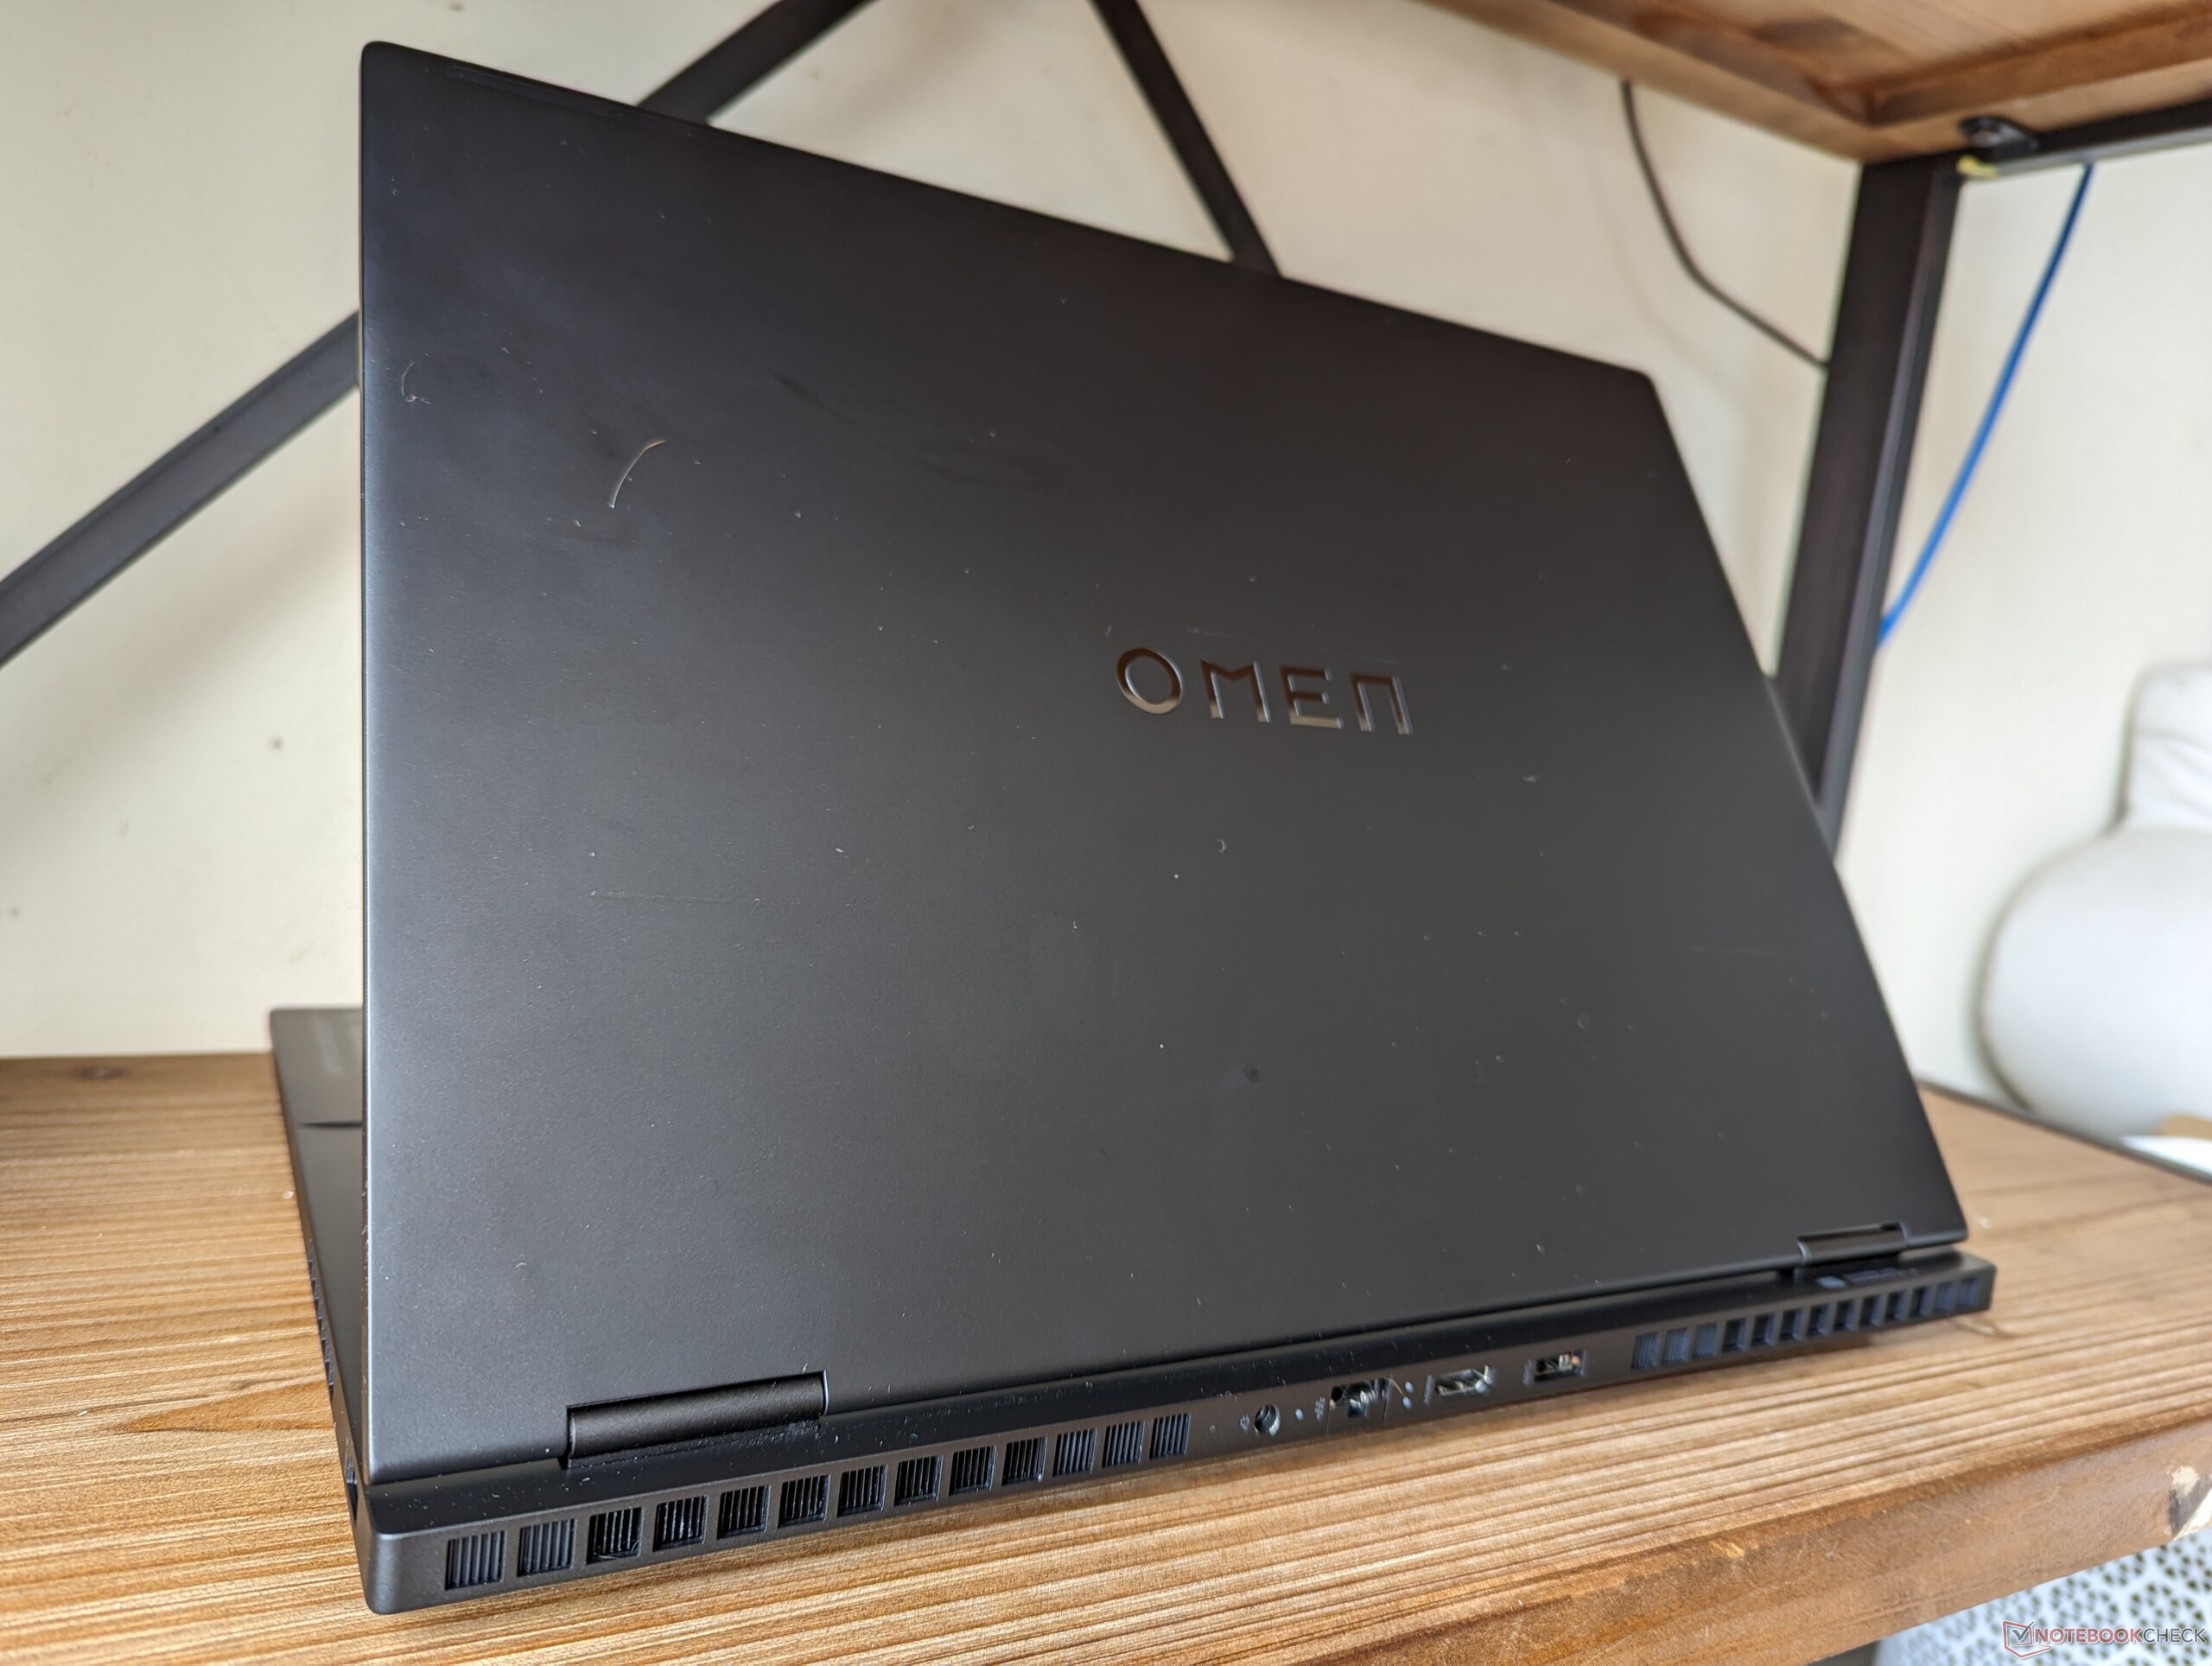
Le nouveau format 16:10 rend l'Omen Transcend 16 plus carré que l'Omen 16 normal, mais avec un profil général plus fin de près de 4 mm. Il est donc un peu plus léger, mais il est encore loin d'être aussi léger que l'Omen Transcend 16 d'Asus Asus ROG Zephyrus M16 ouLenovo Legion Slim 7i 16 G8.
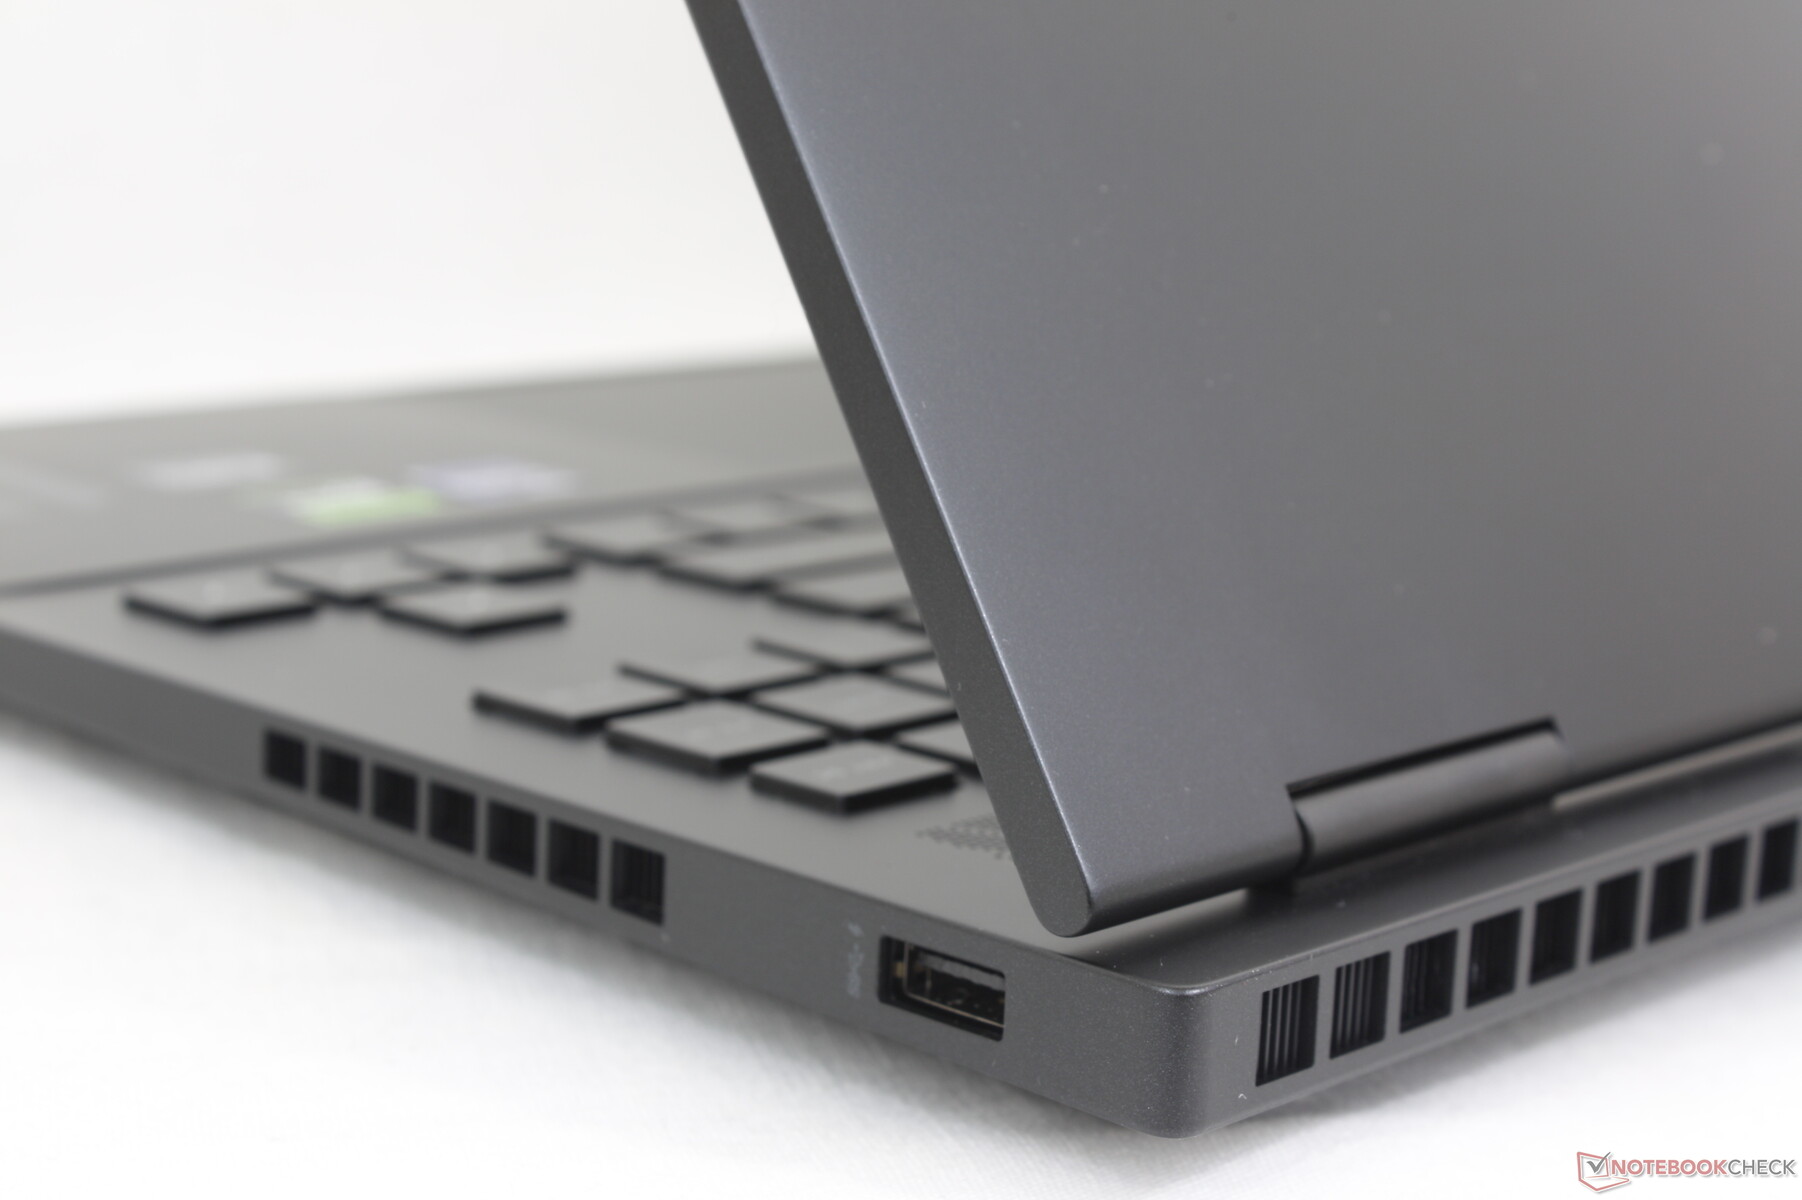
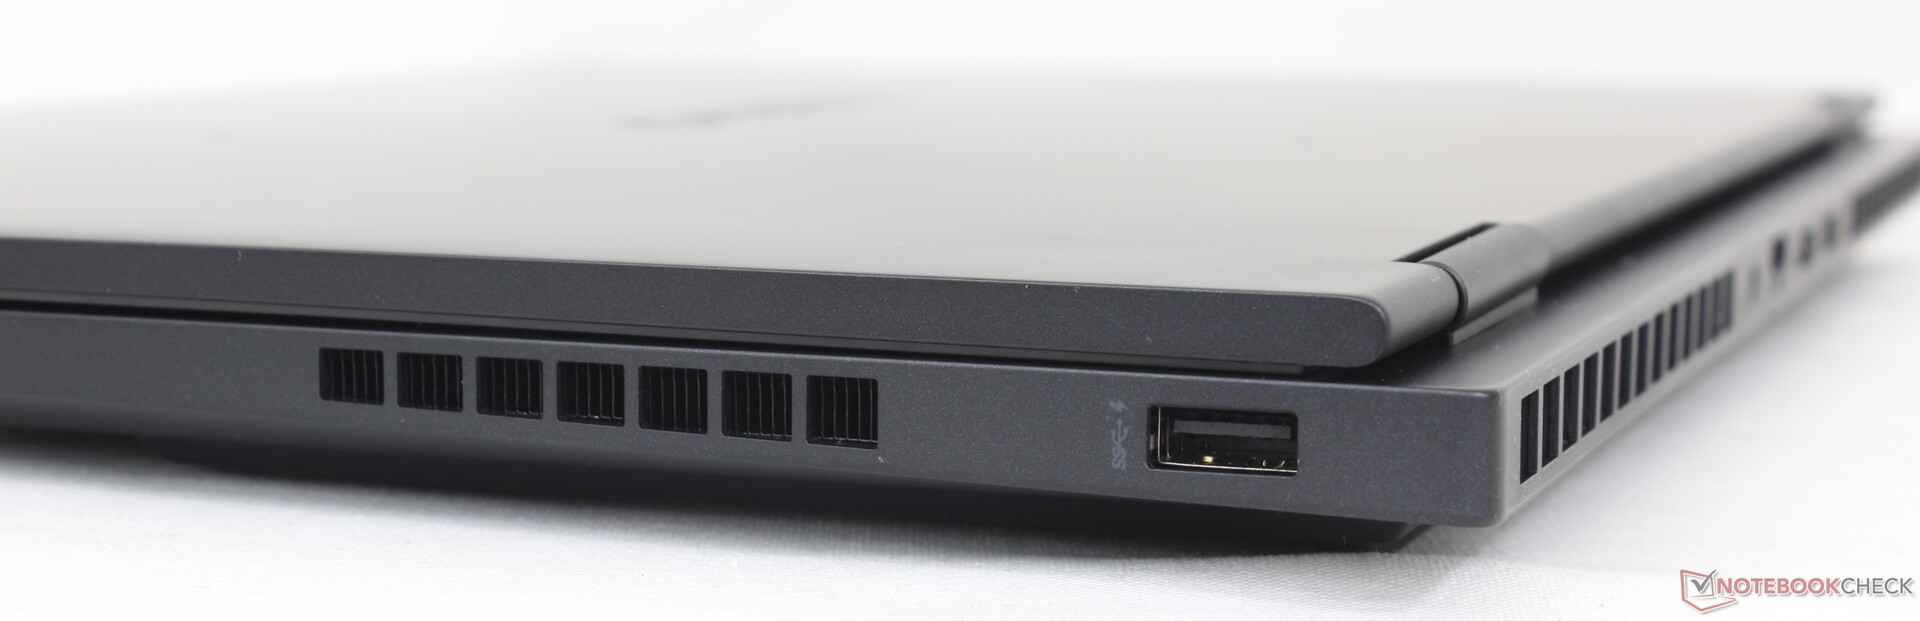
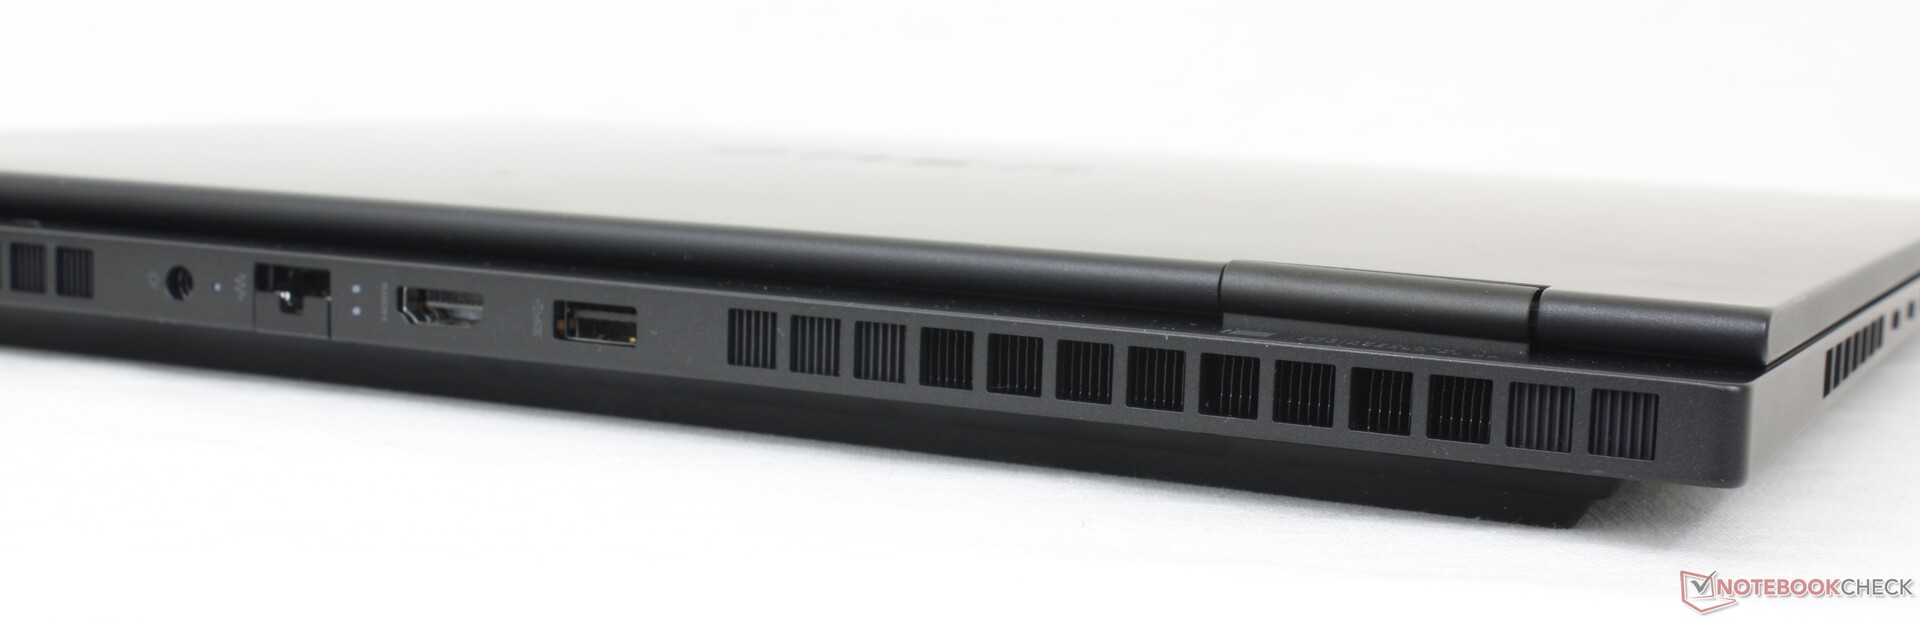
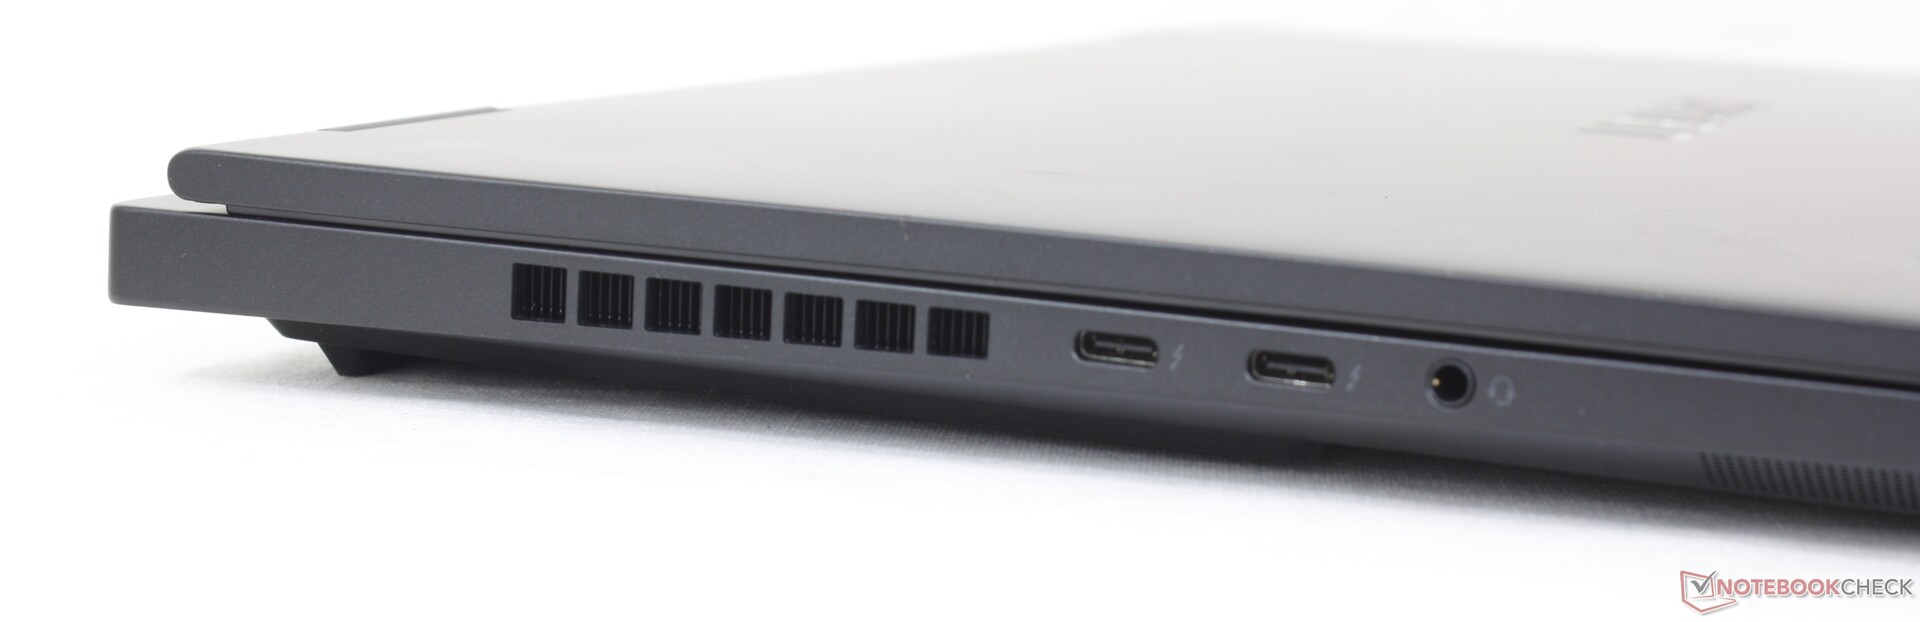
Connectivité
Les options de port restent identiques à celles de l'Omen 16 malgré les changements physiques mentionnés ci-dessus. Néanmoins, il aurait été agréable de voir une mise à niveau de 1 Gbps RJ-45 à 2,5 Gbps.

Communication
Un Intel AX211 est fourni en standard pour la connectivité Wi-Fi 6E et Bluetooth 5.3. Nous avons constaté des taux de transfert réguliers et fiables lorsque nous l'avons couplé à notre réseau Asus AXE11000 6GHz.
Webcam
L'infrarouge est inclus pour la prise en charge de Hello, alors qu'il est absent sur l'Omen 16 normal. La webcam de 2 mégapixels et l'obturateur de confidentialité sont identiques entre les deux modèles Omen.


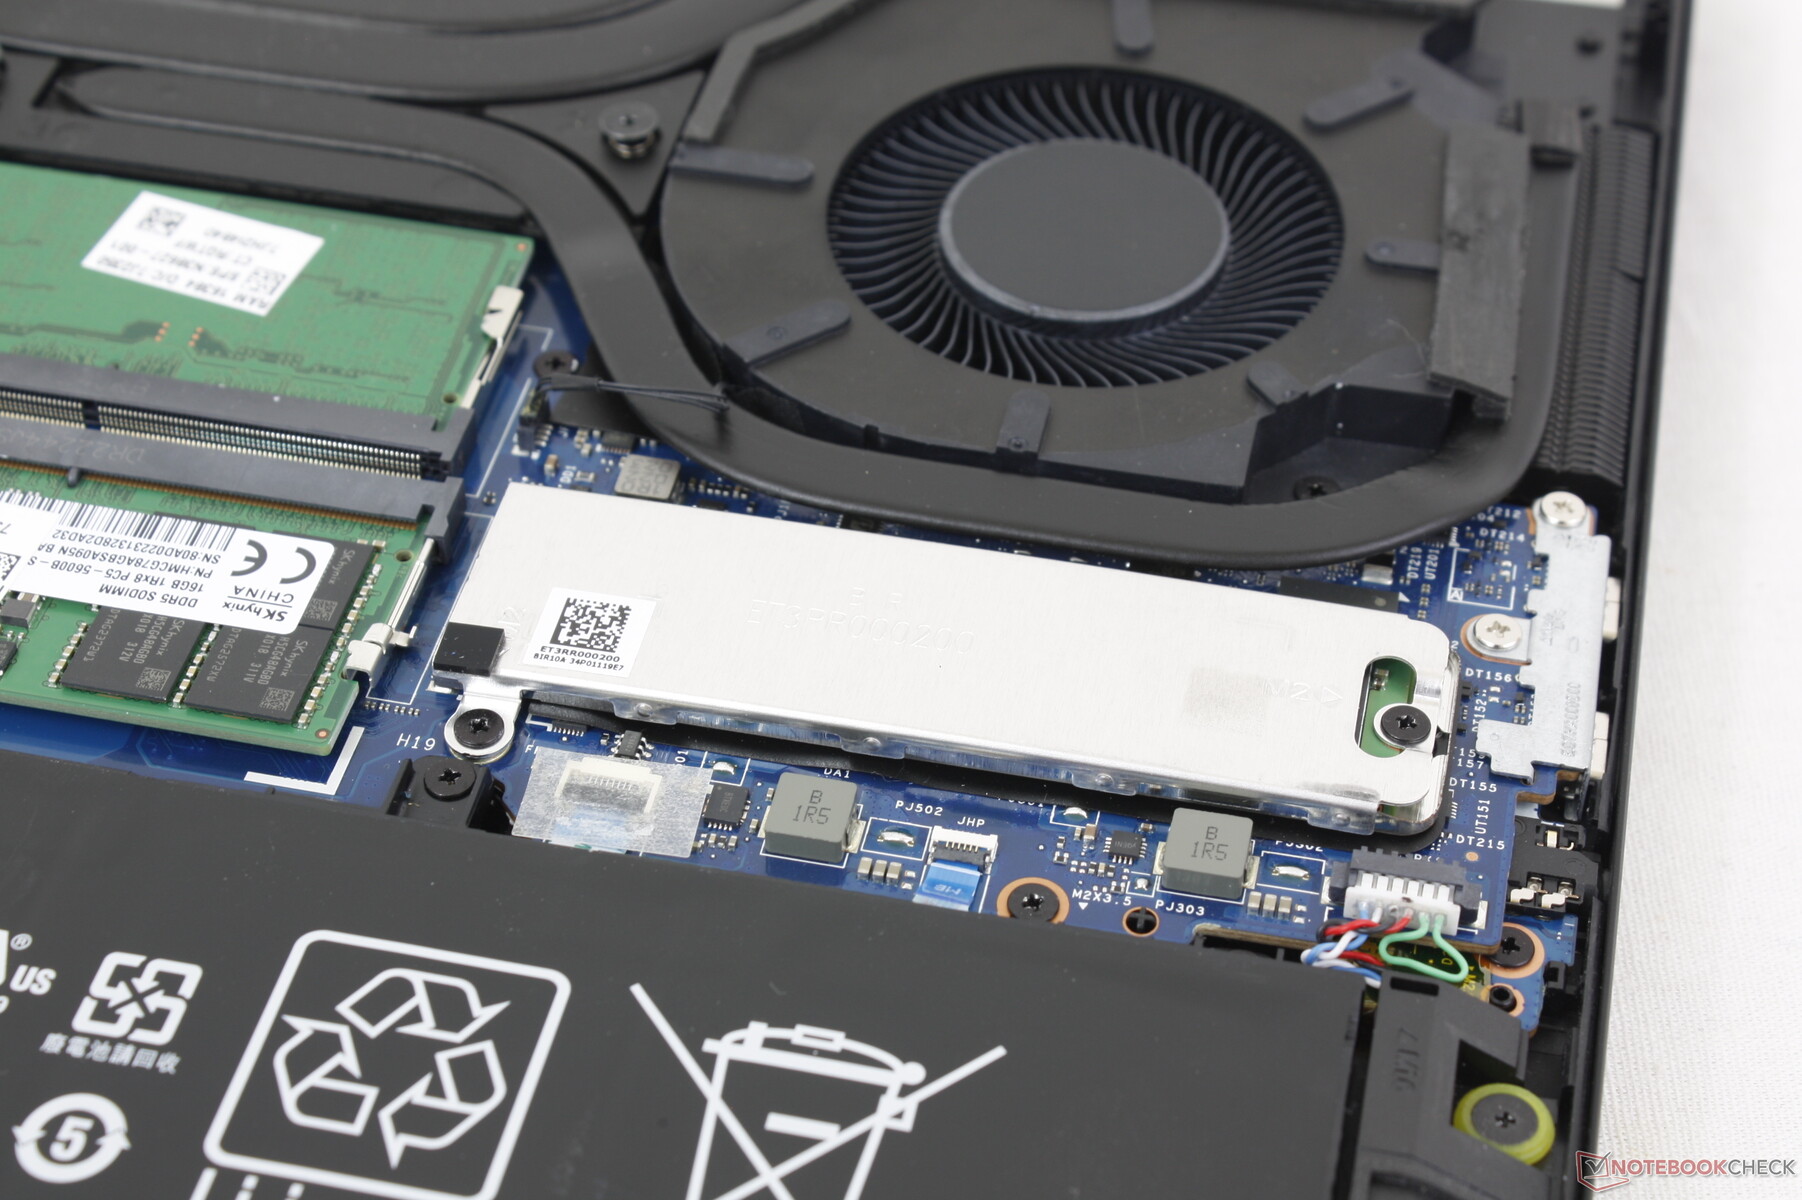
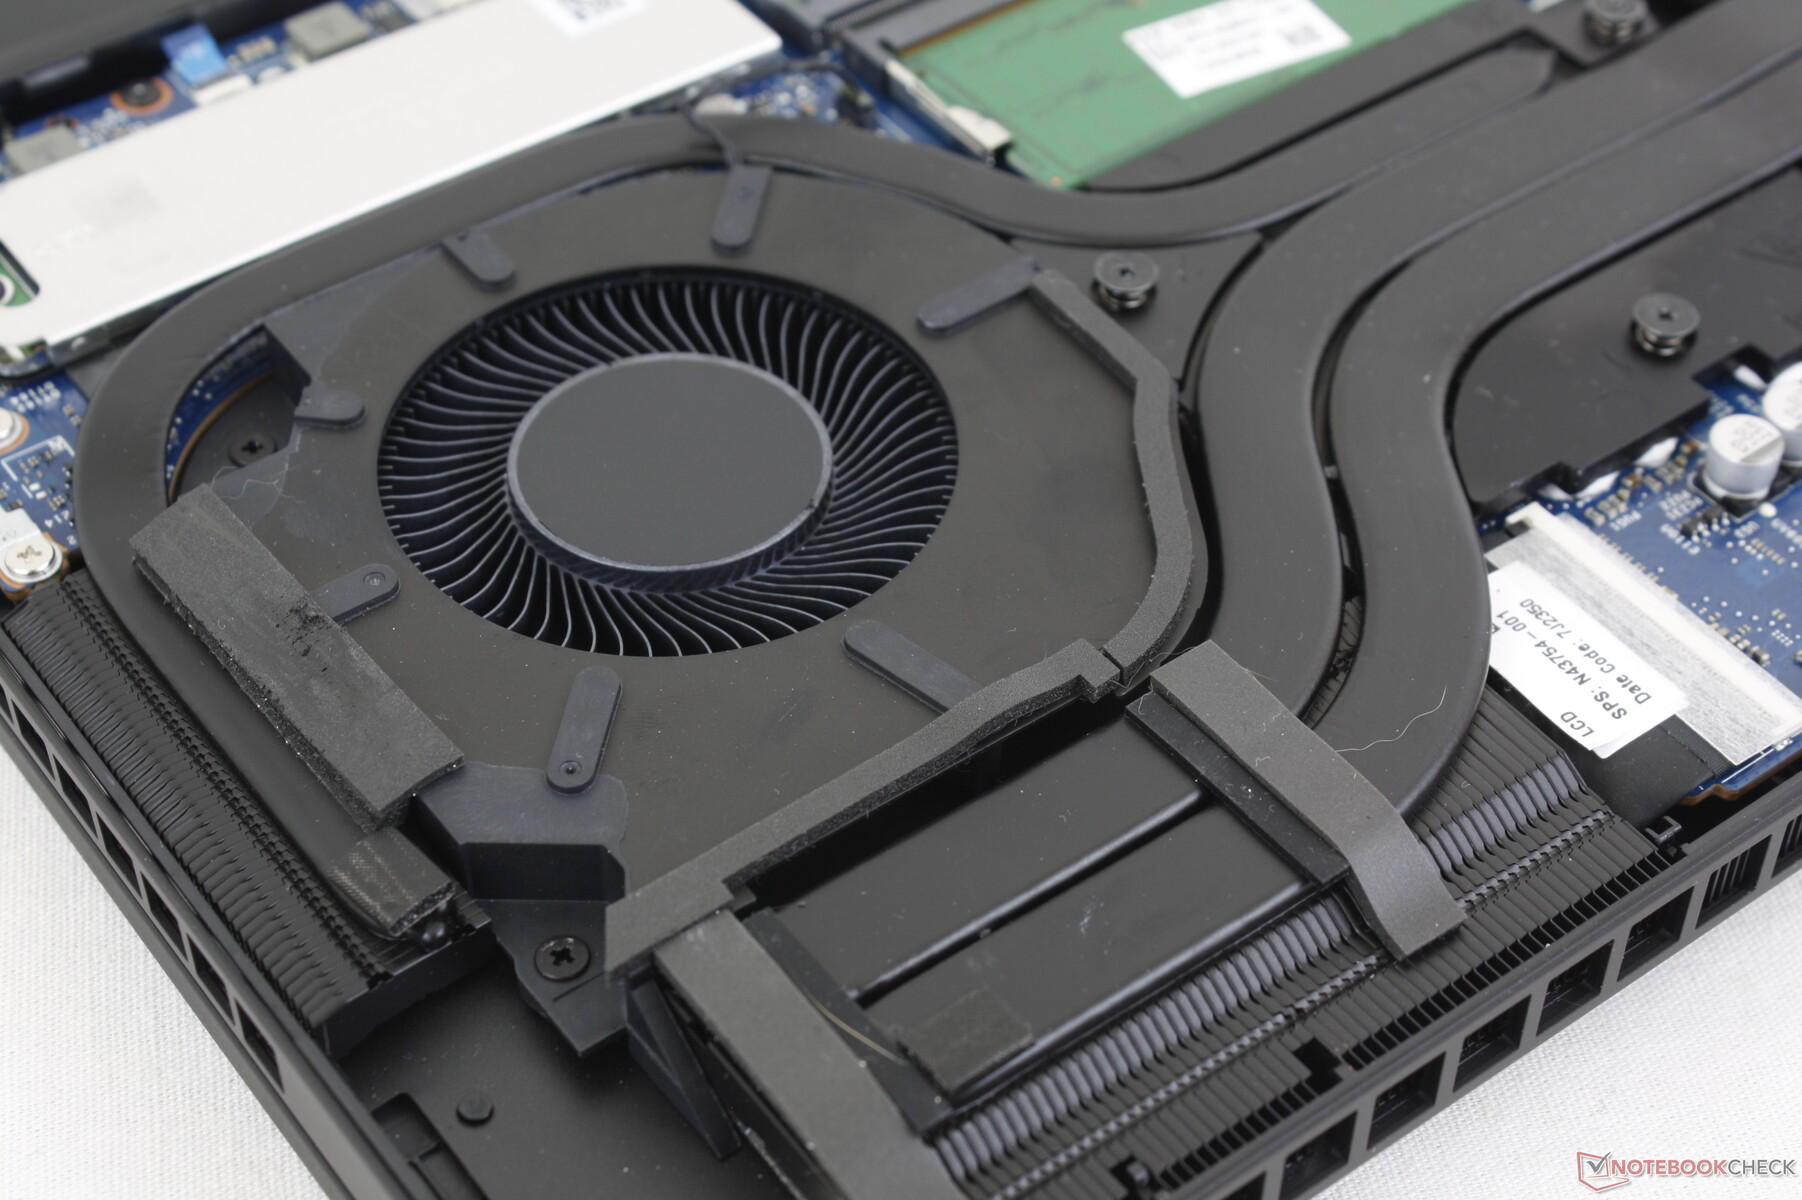
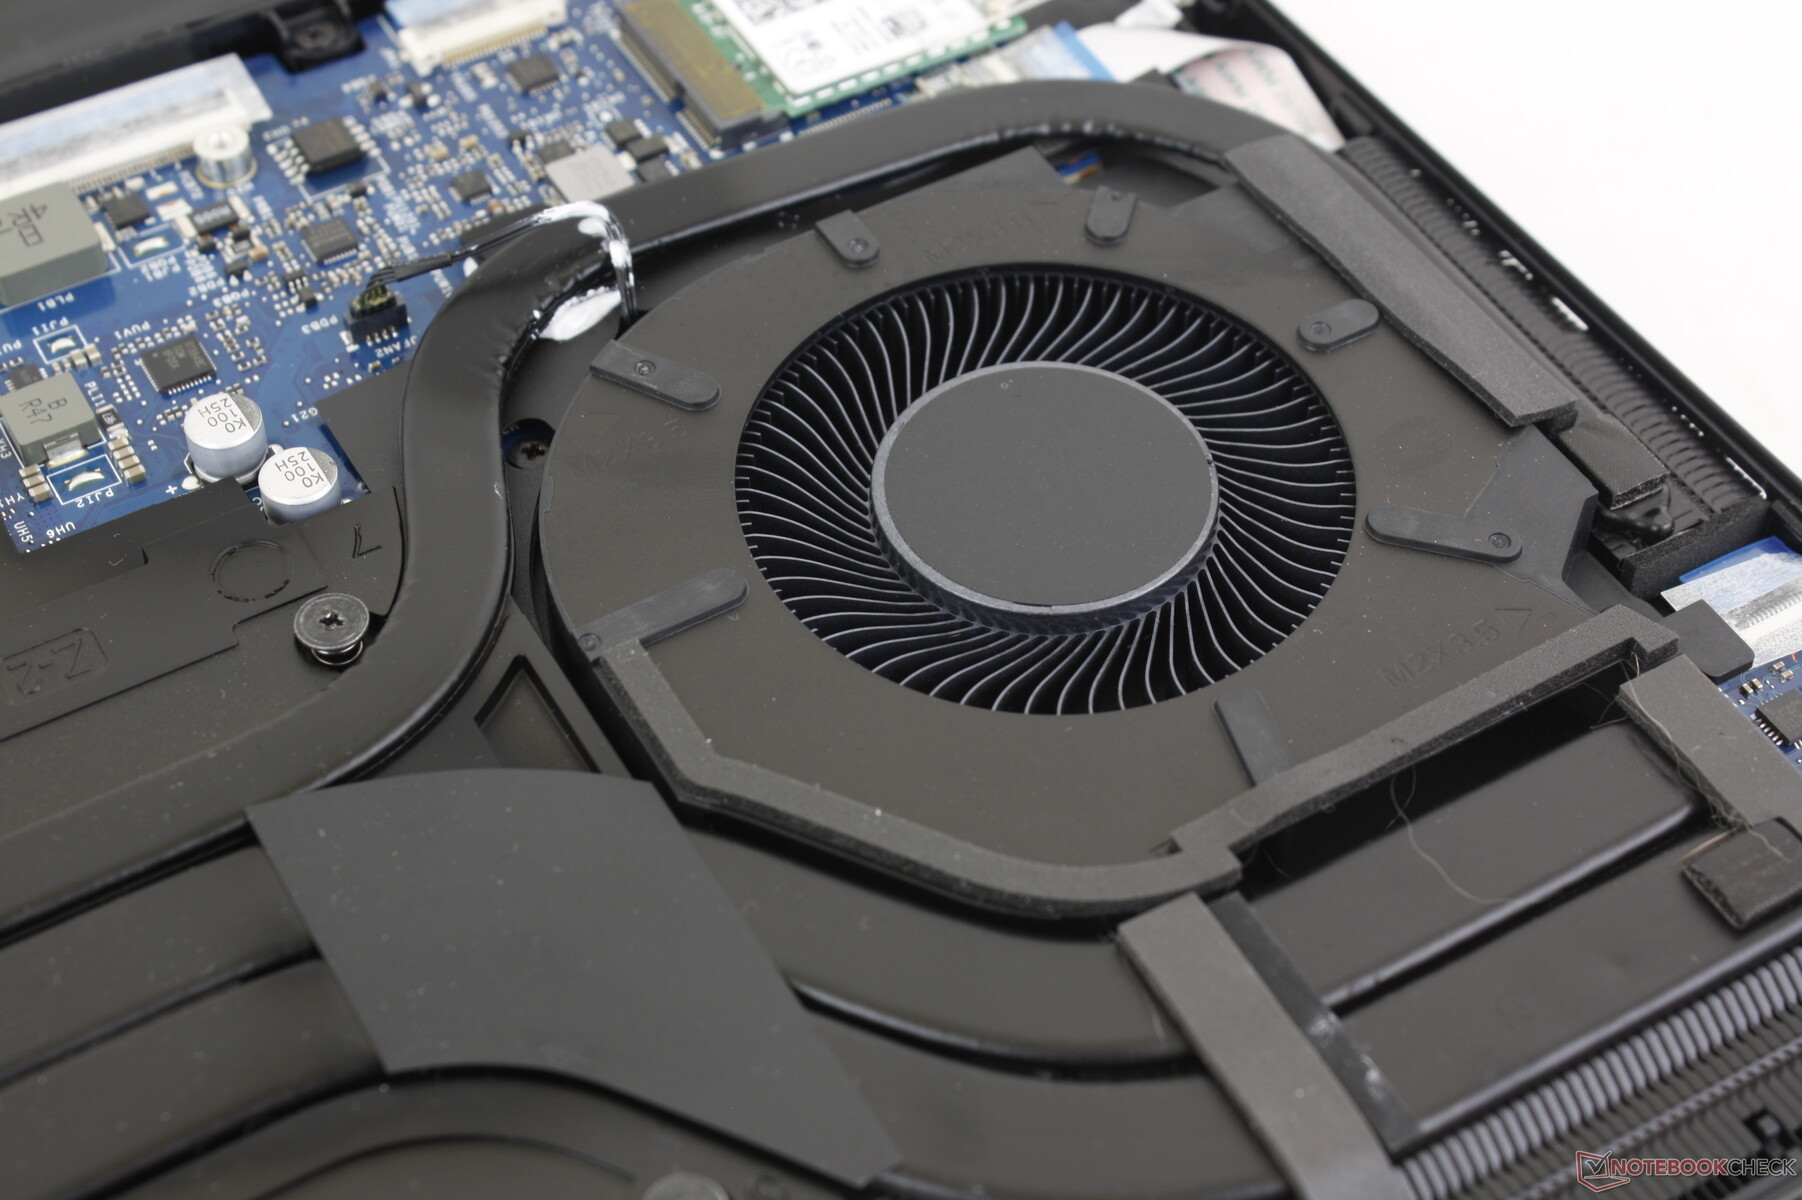
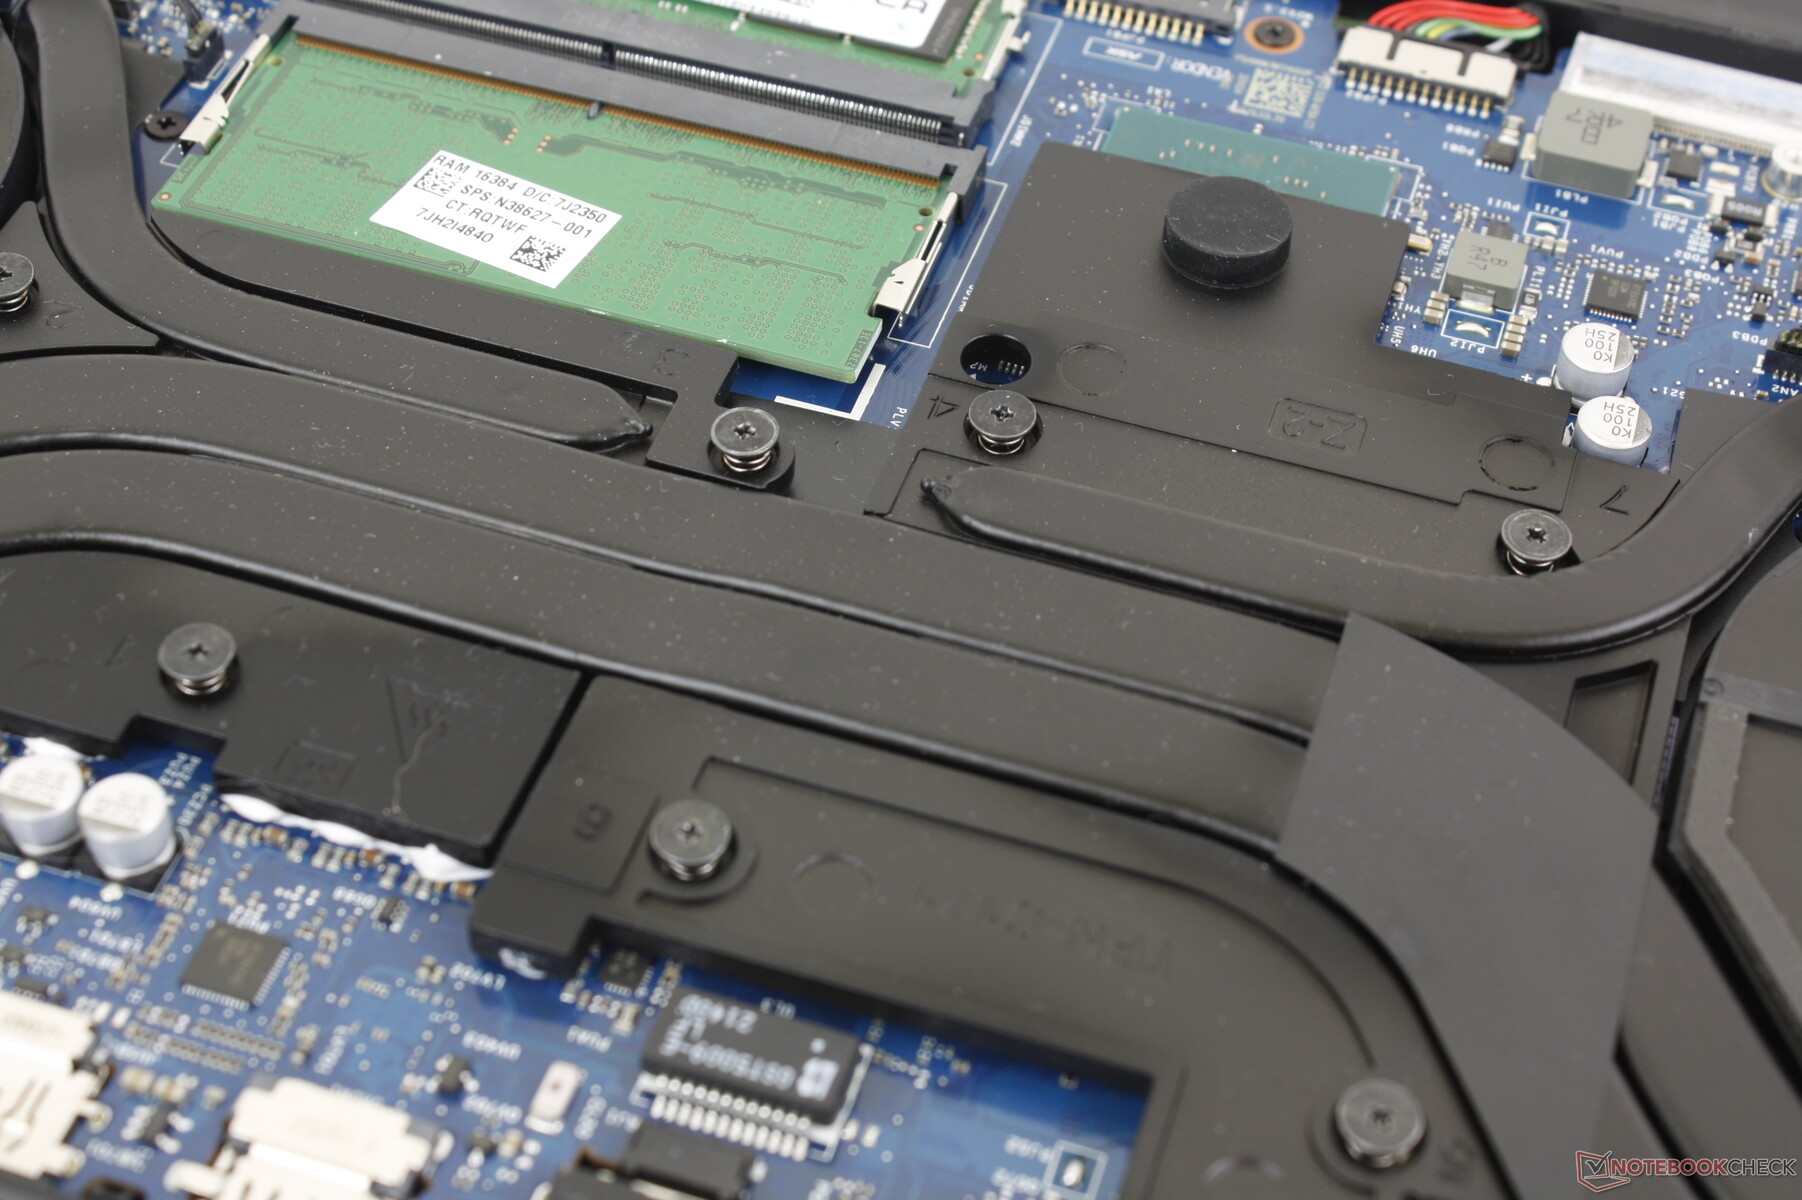
Maintenance
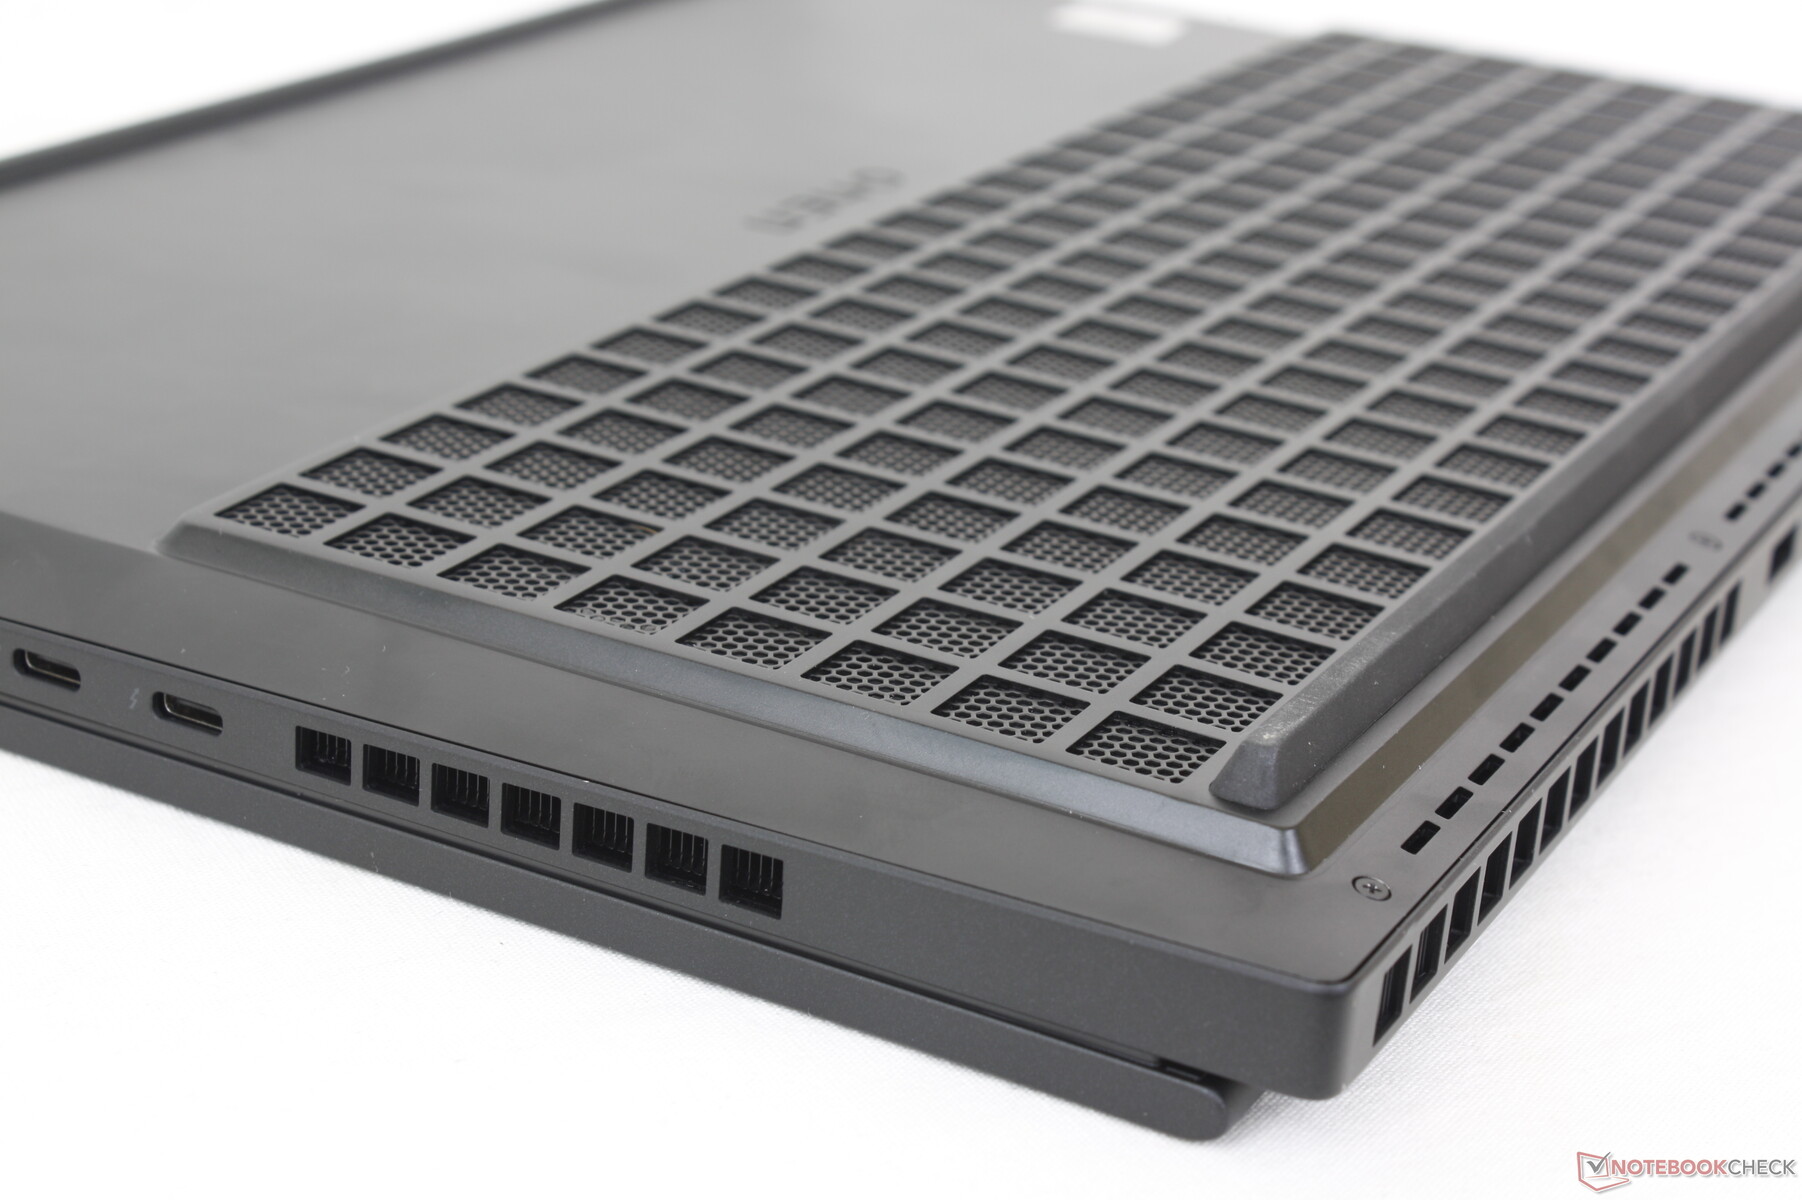
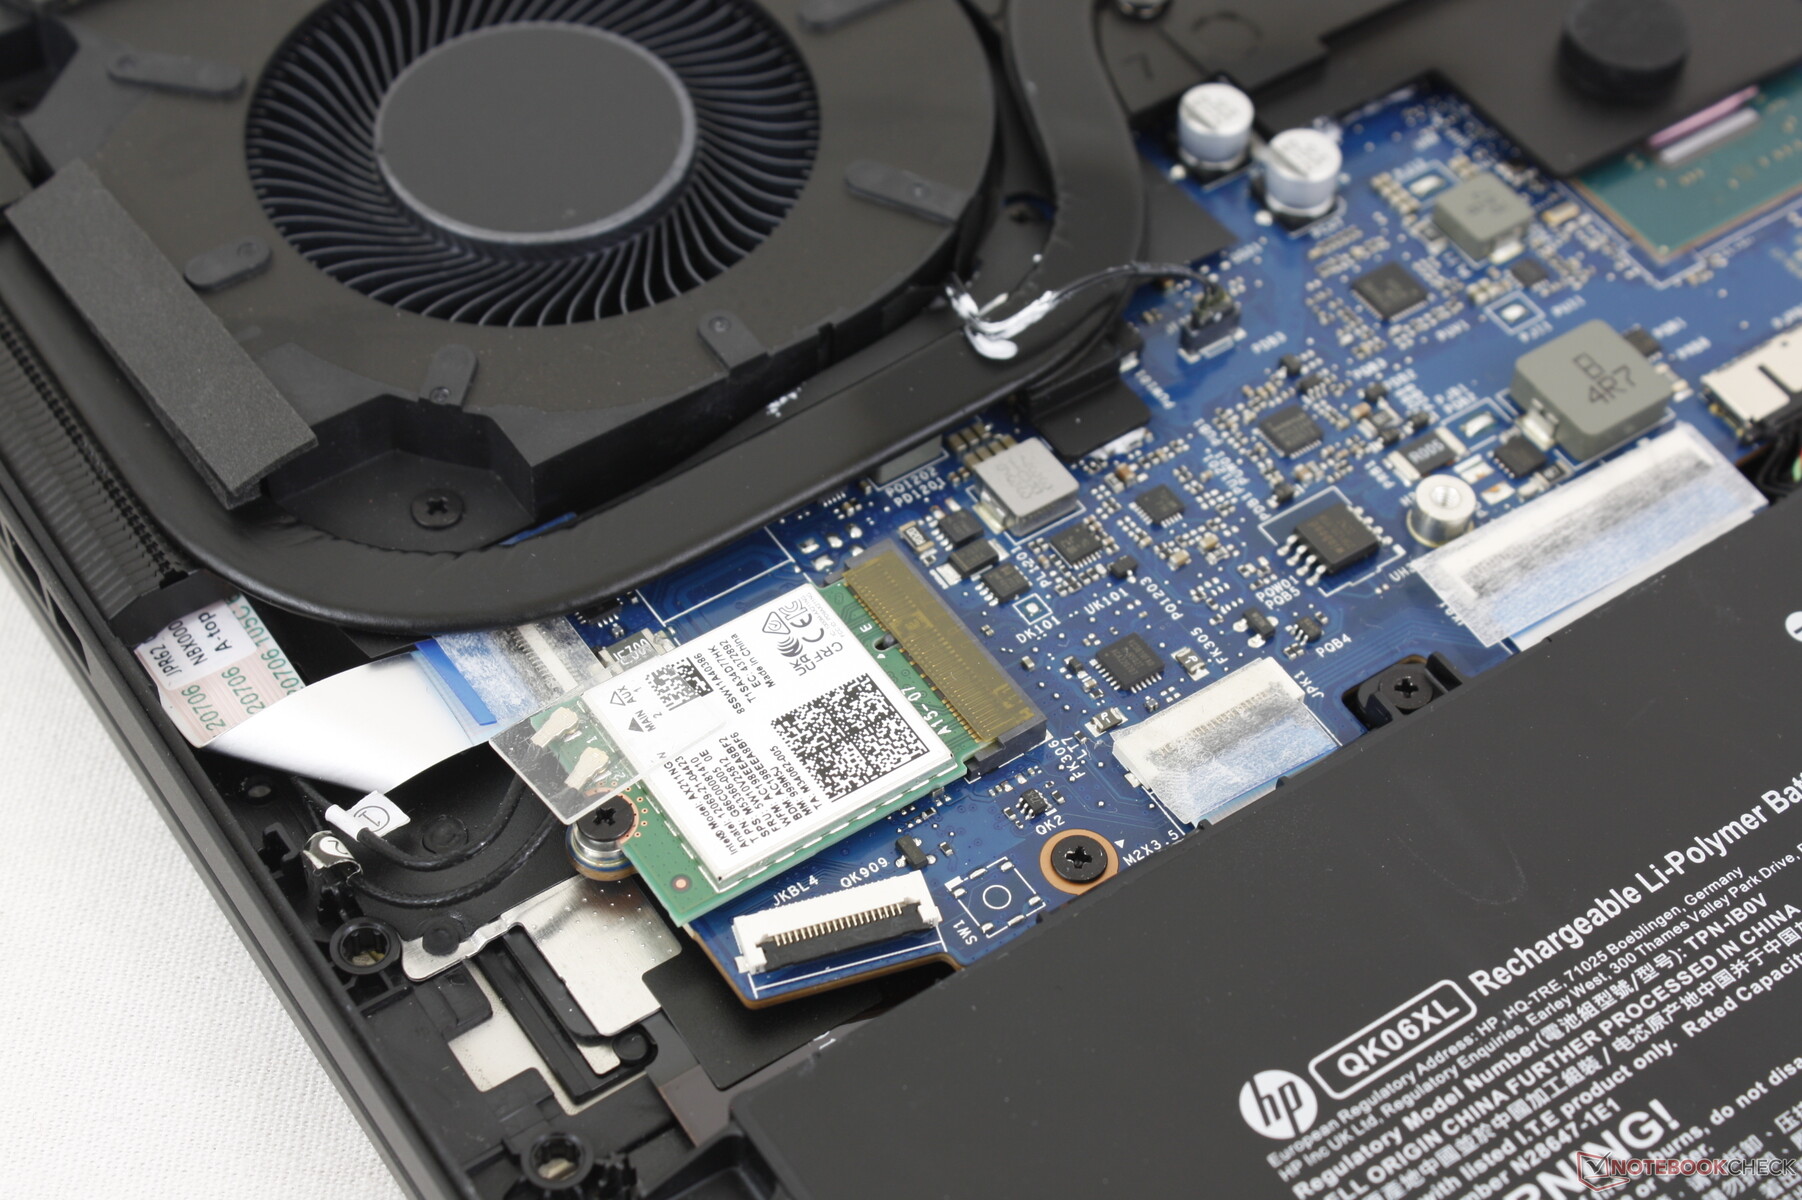
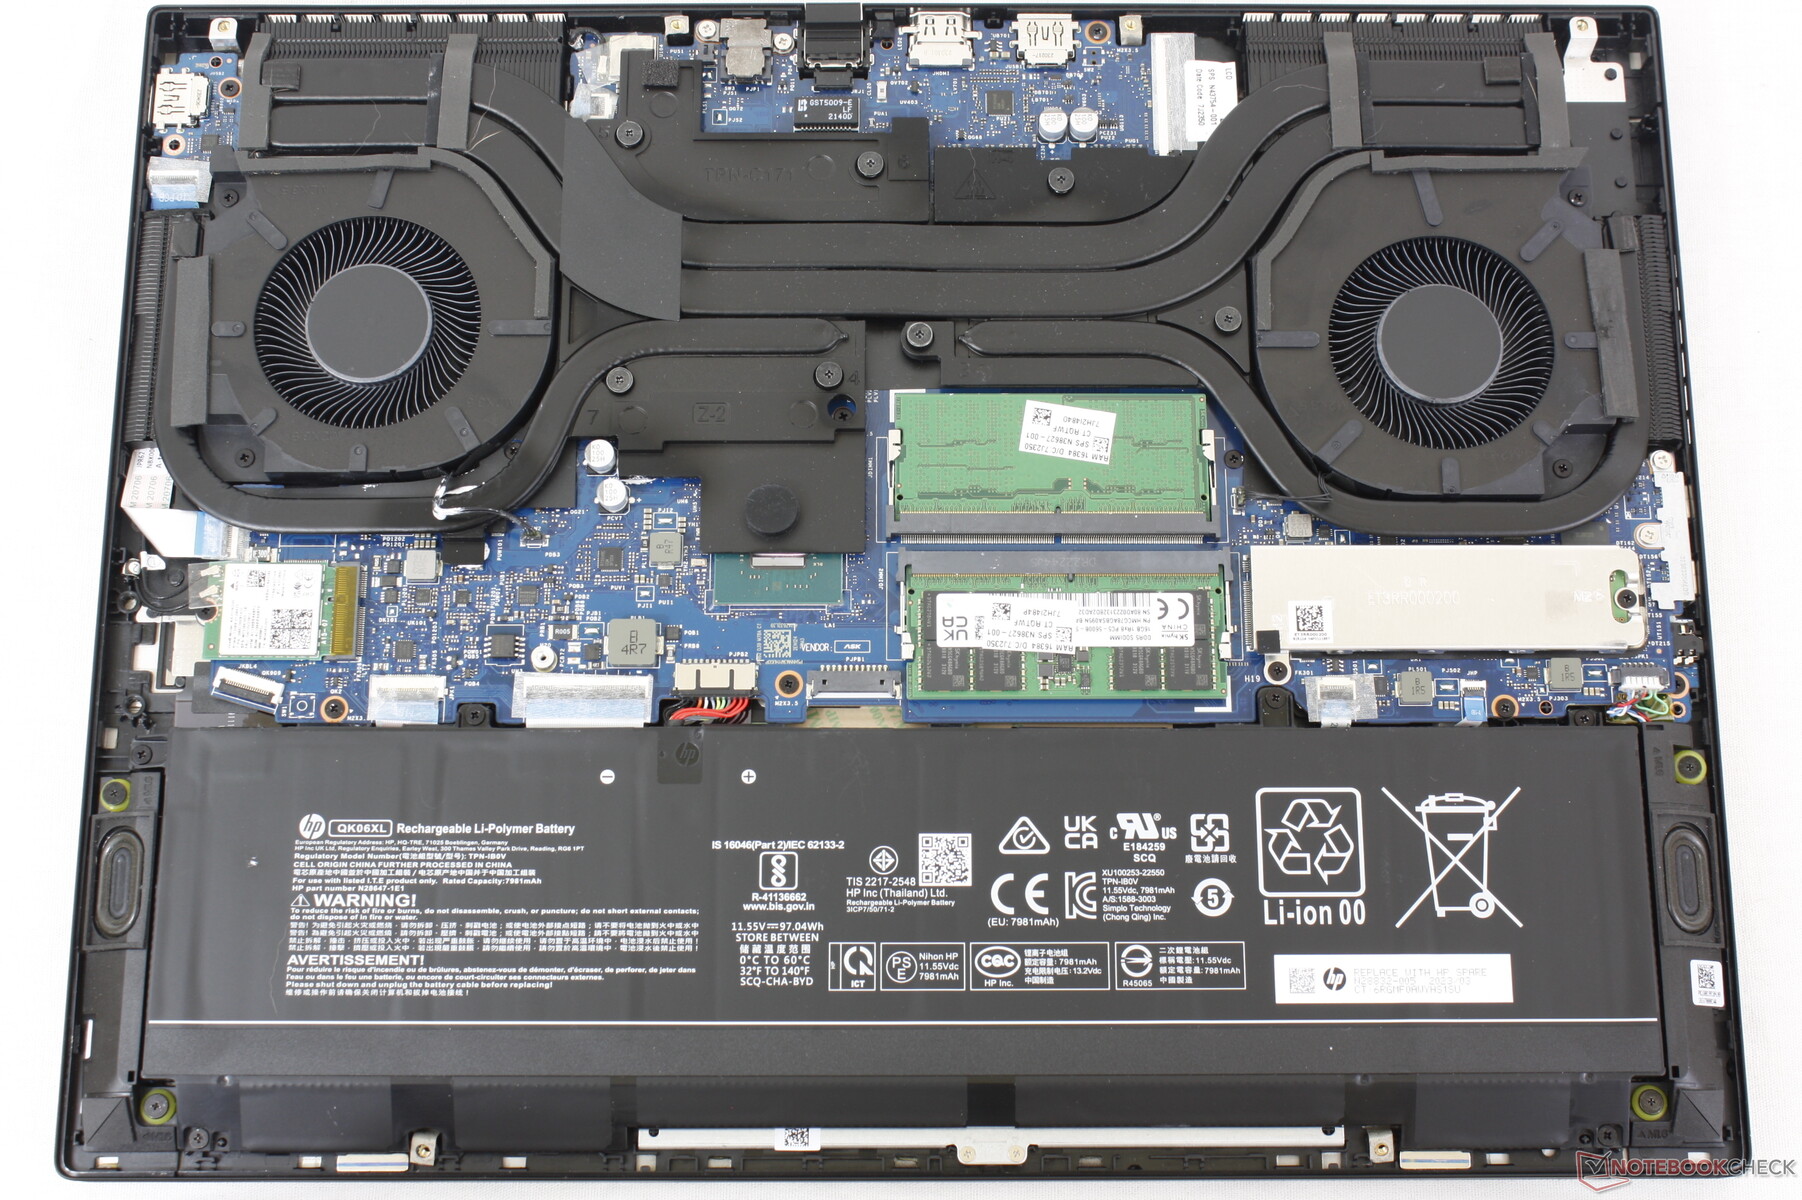
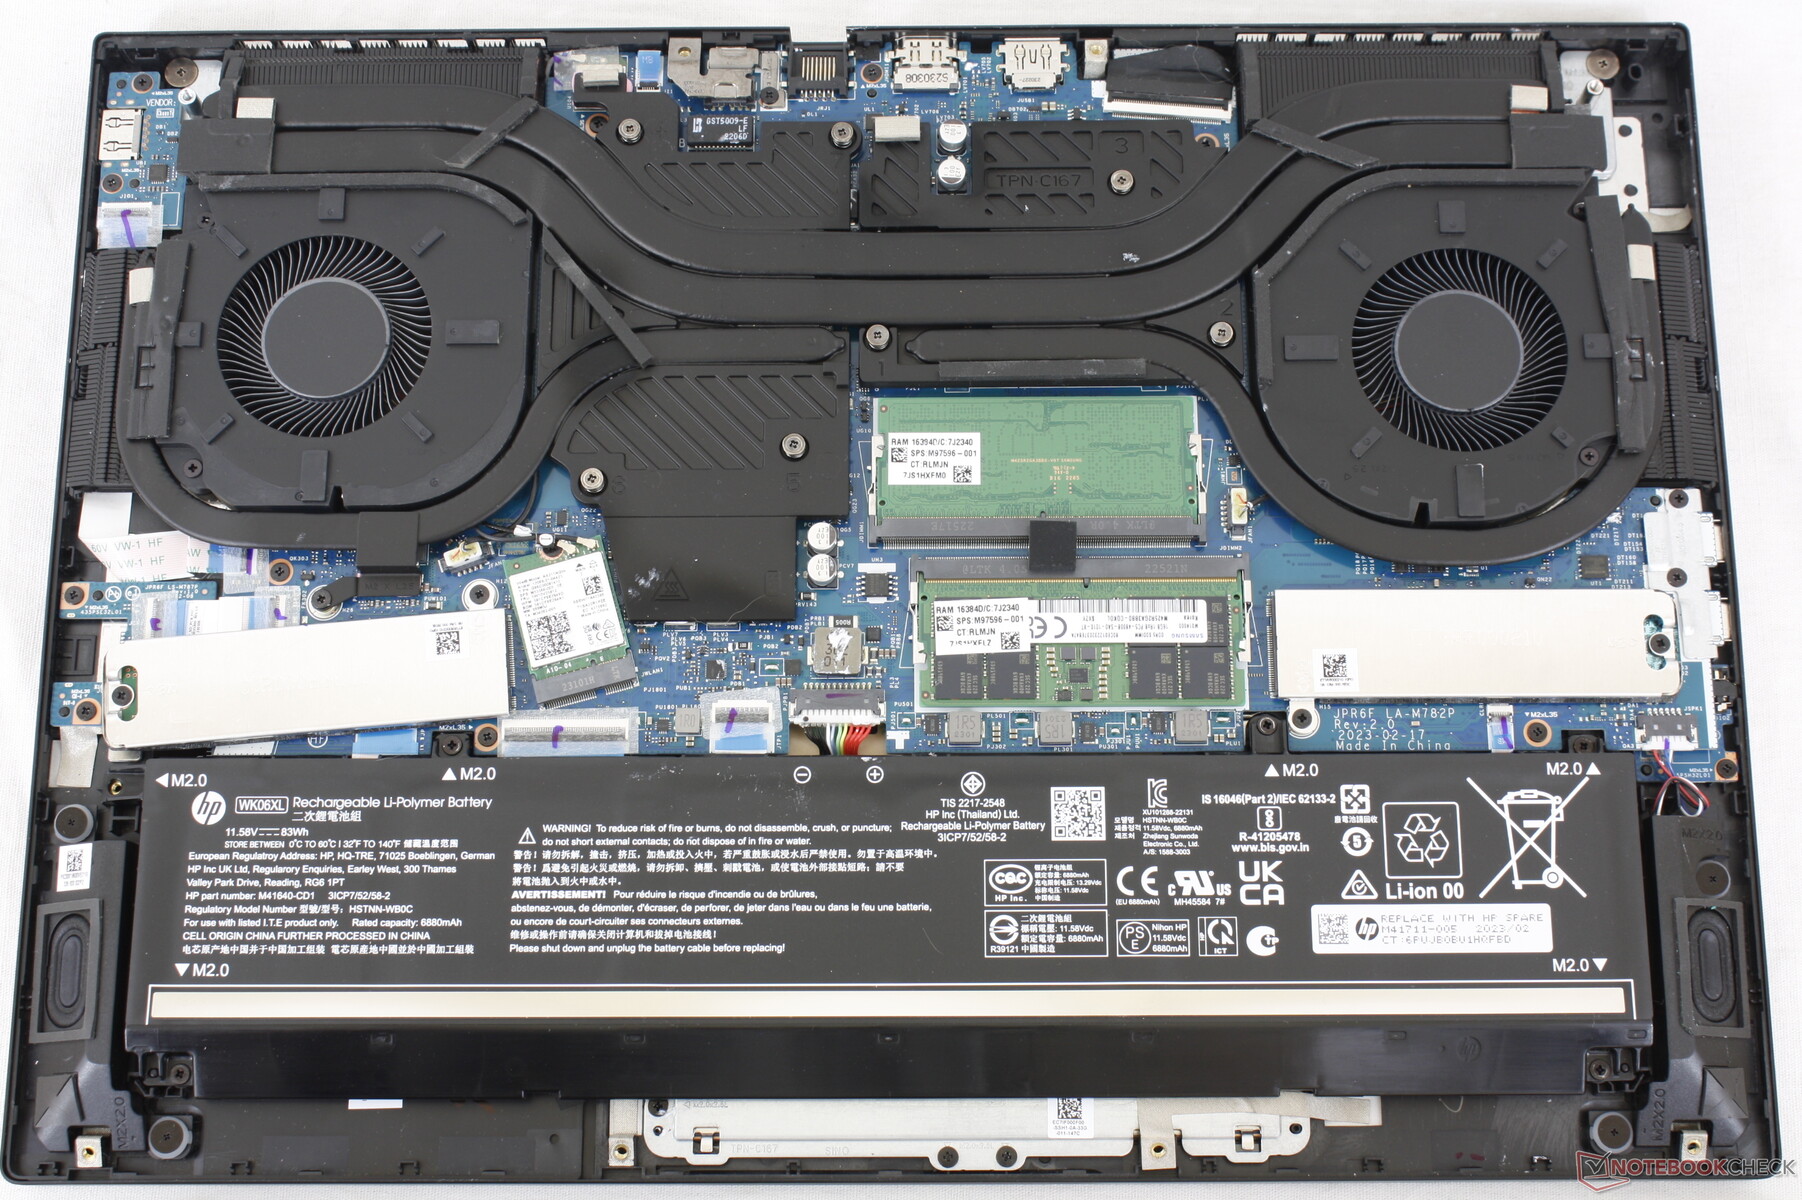
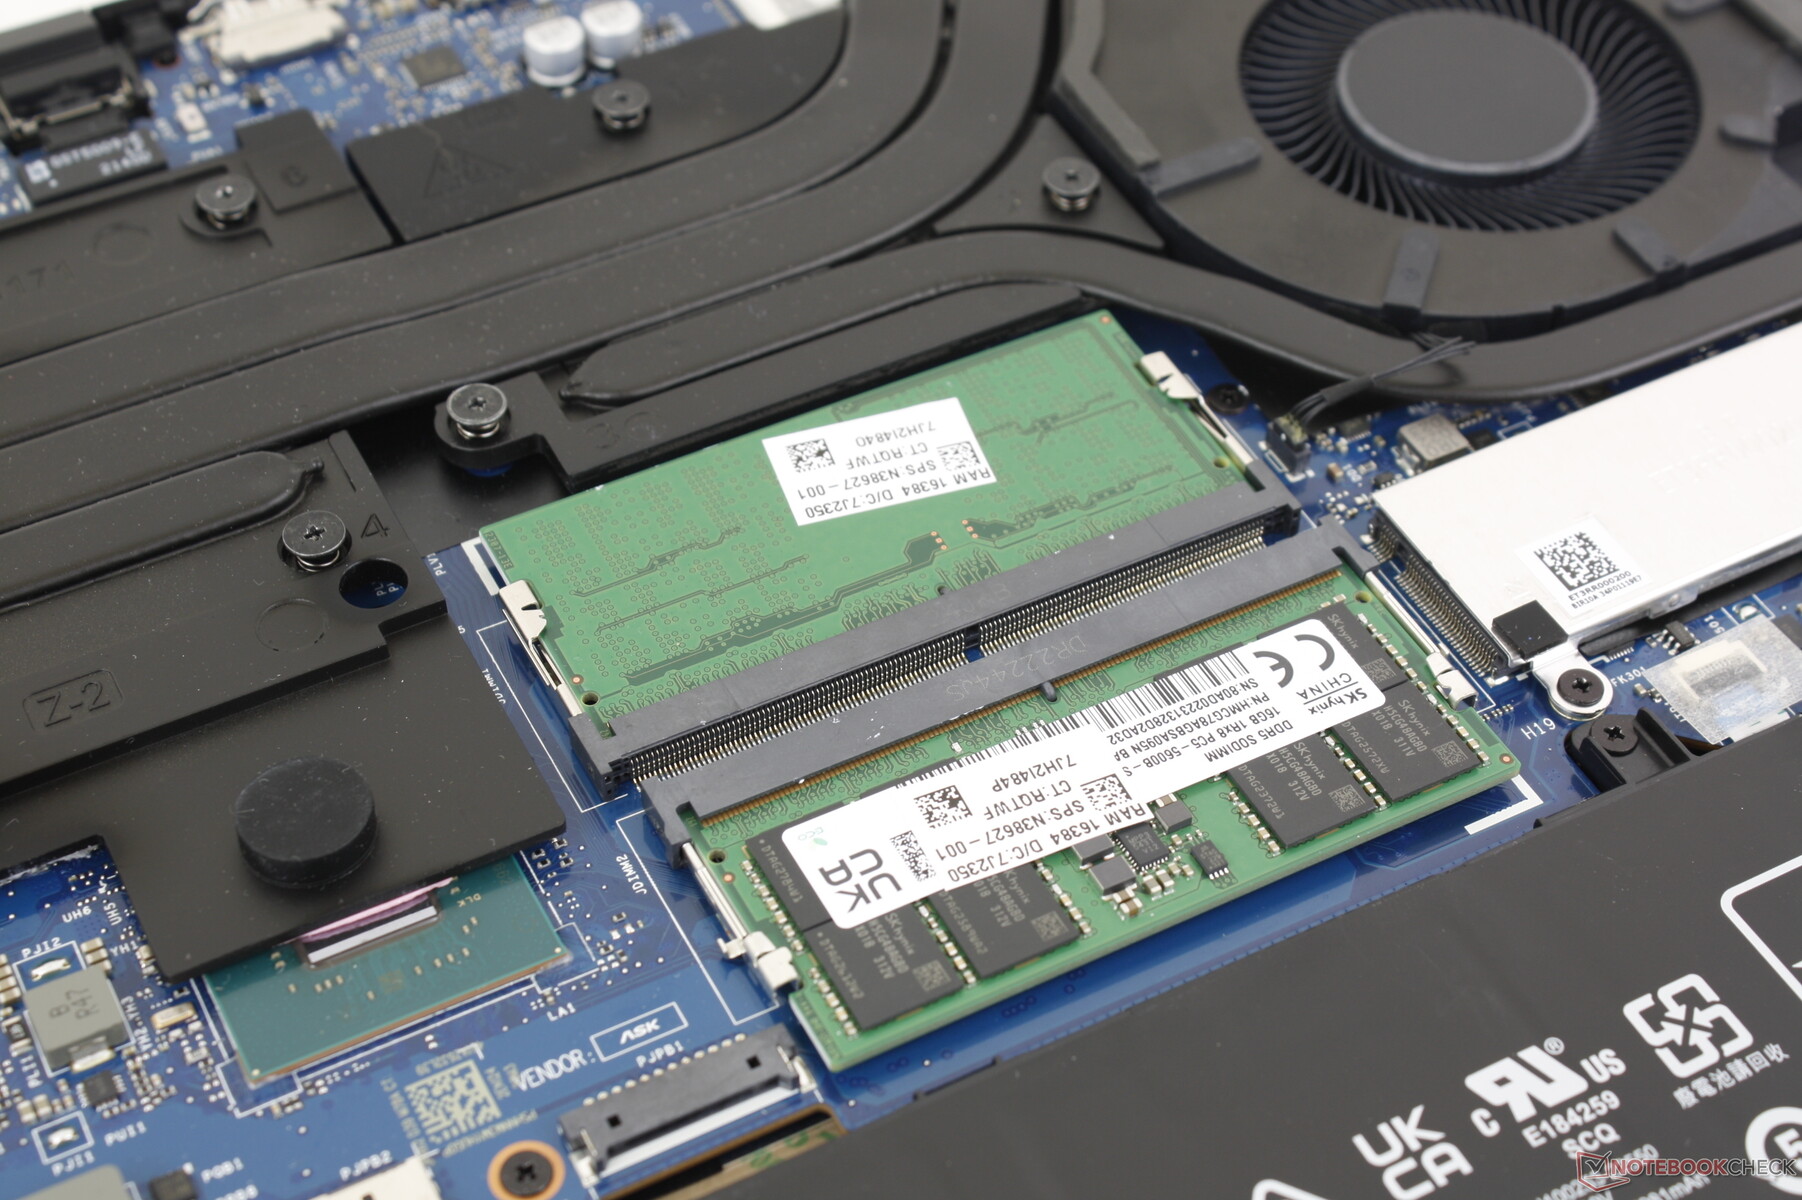
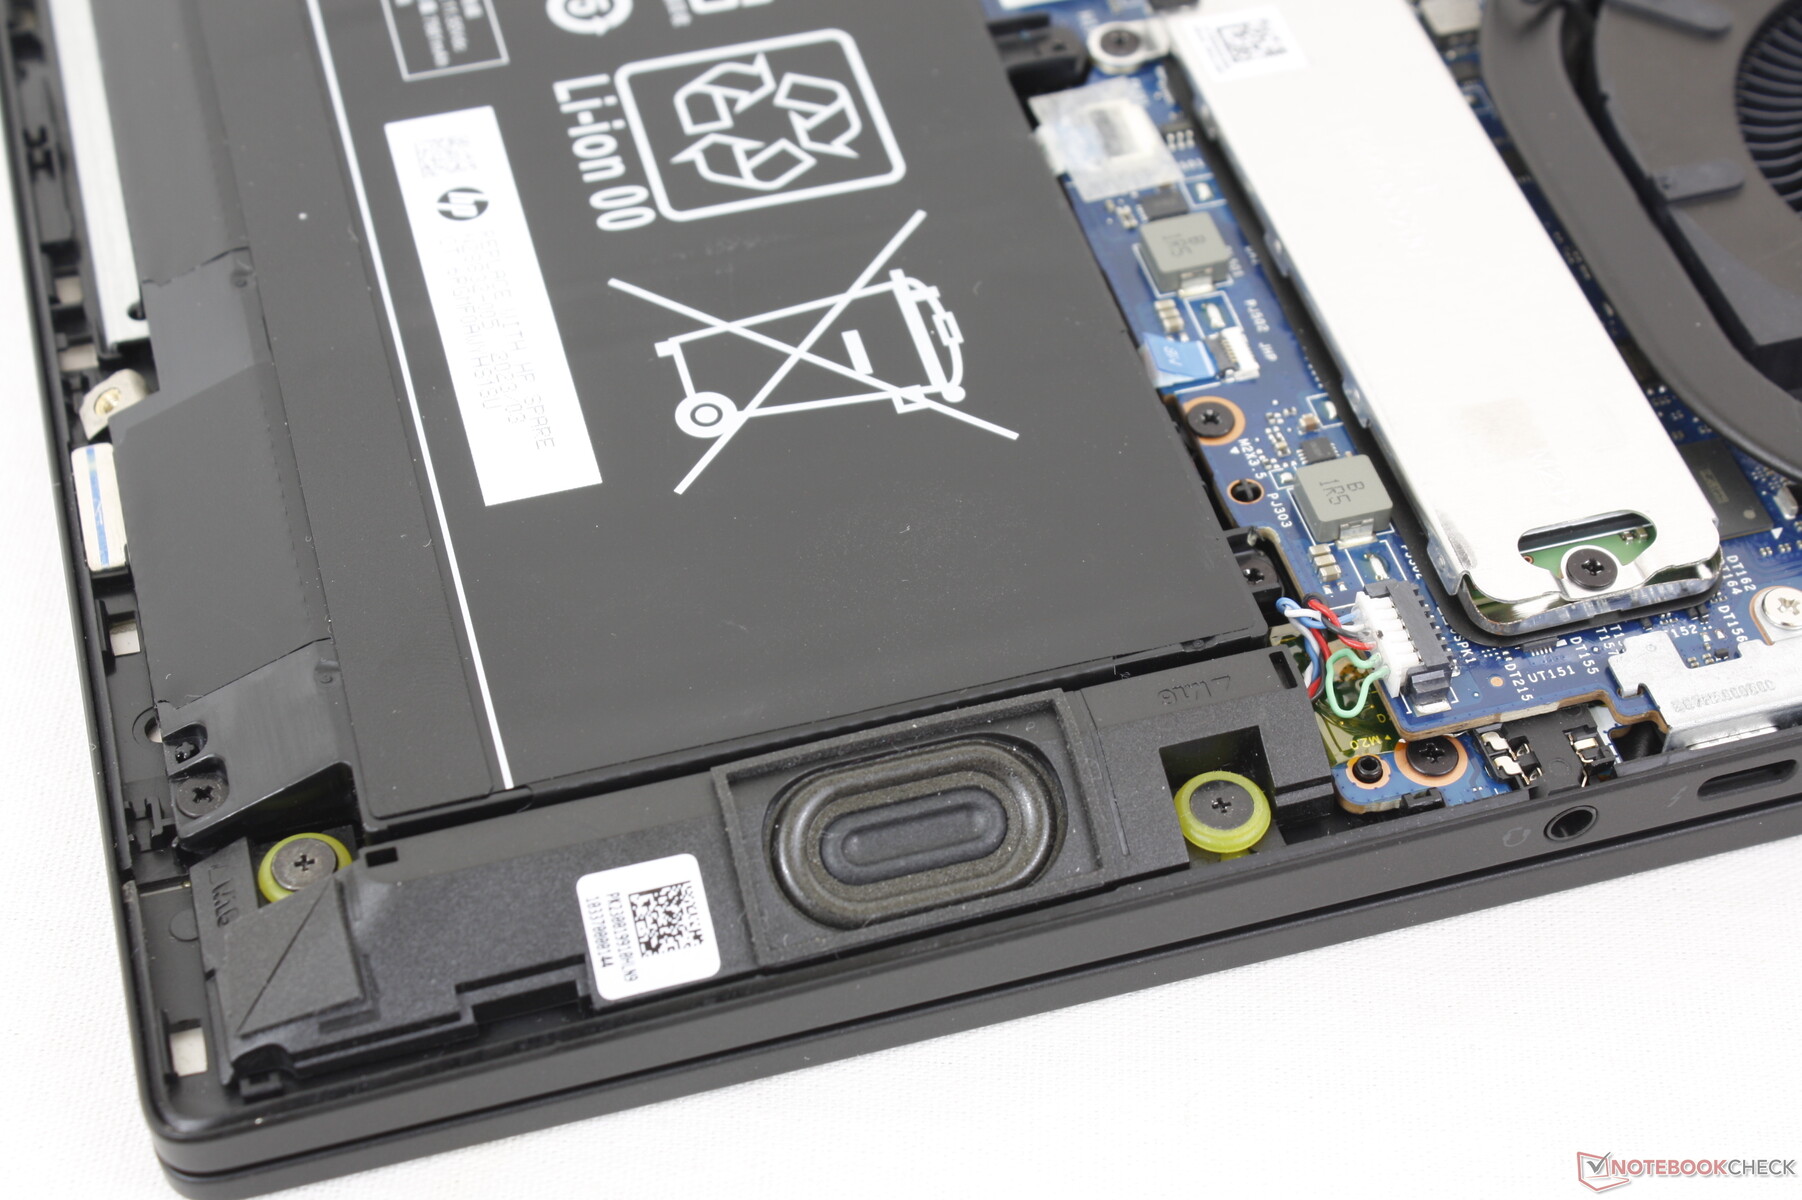
Le panneau inférieur est fixé par seulement six vis Phillips pour un accès facile. Un changement notable par rapport à l'Omen 16, cependant, est la suppression du deuxième emplacement SSD M.2 en raison du repositionnement de l'emplacement WLAN M.2, comme le montrent les images de comparaison ci-dessous. Ainsi, l'Omen Transcend 16 ne peut supporter qu'un seul SSD interne au lieu de deux. D'autres ajustements mineurs ont également été apportés aux haut-parleurs et à la solution de refroidissement.
Accessoires et garantie
Certaines configurations incluent gratuitement un casque sans fil HyperX Cloud II Core. Sinon, la boîte de vente au détail ne comprend que l'adaptateur secteur standard et la documentation.
La garantie limitée standard d'un an du fabricant s'applique.
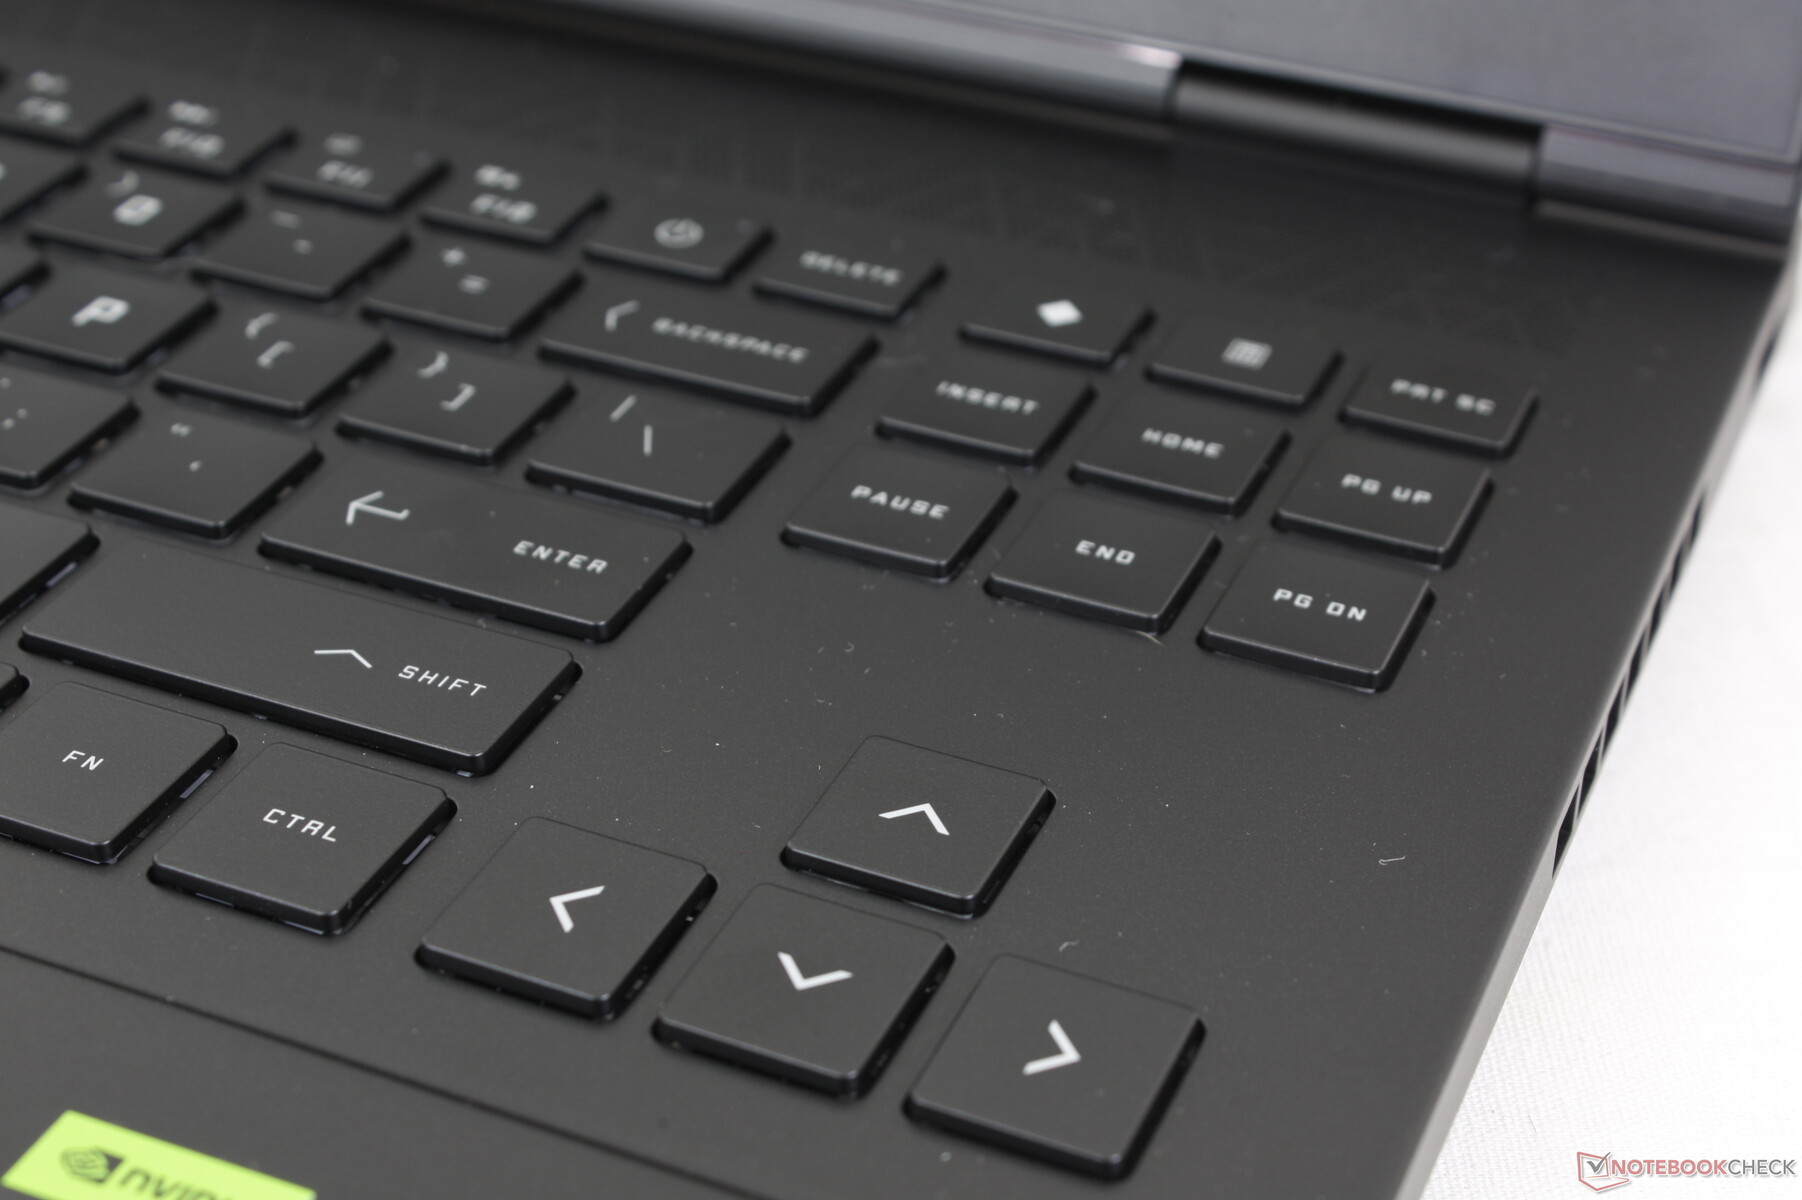
Dispositifs d'entrée - aspect et sensation familiers d'Omen
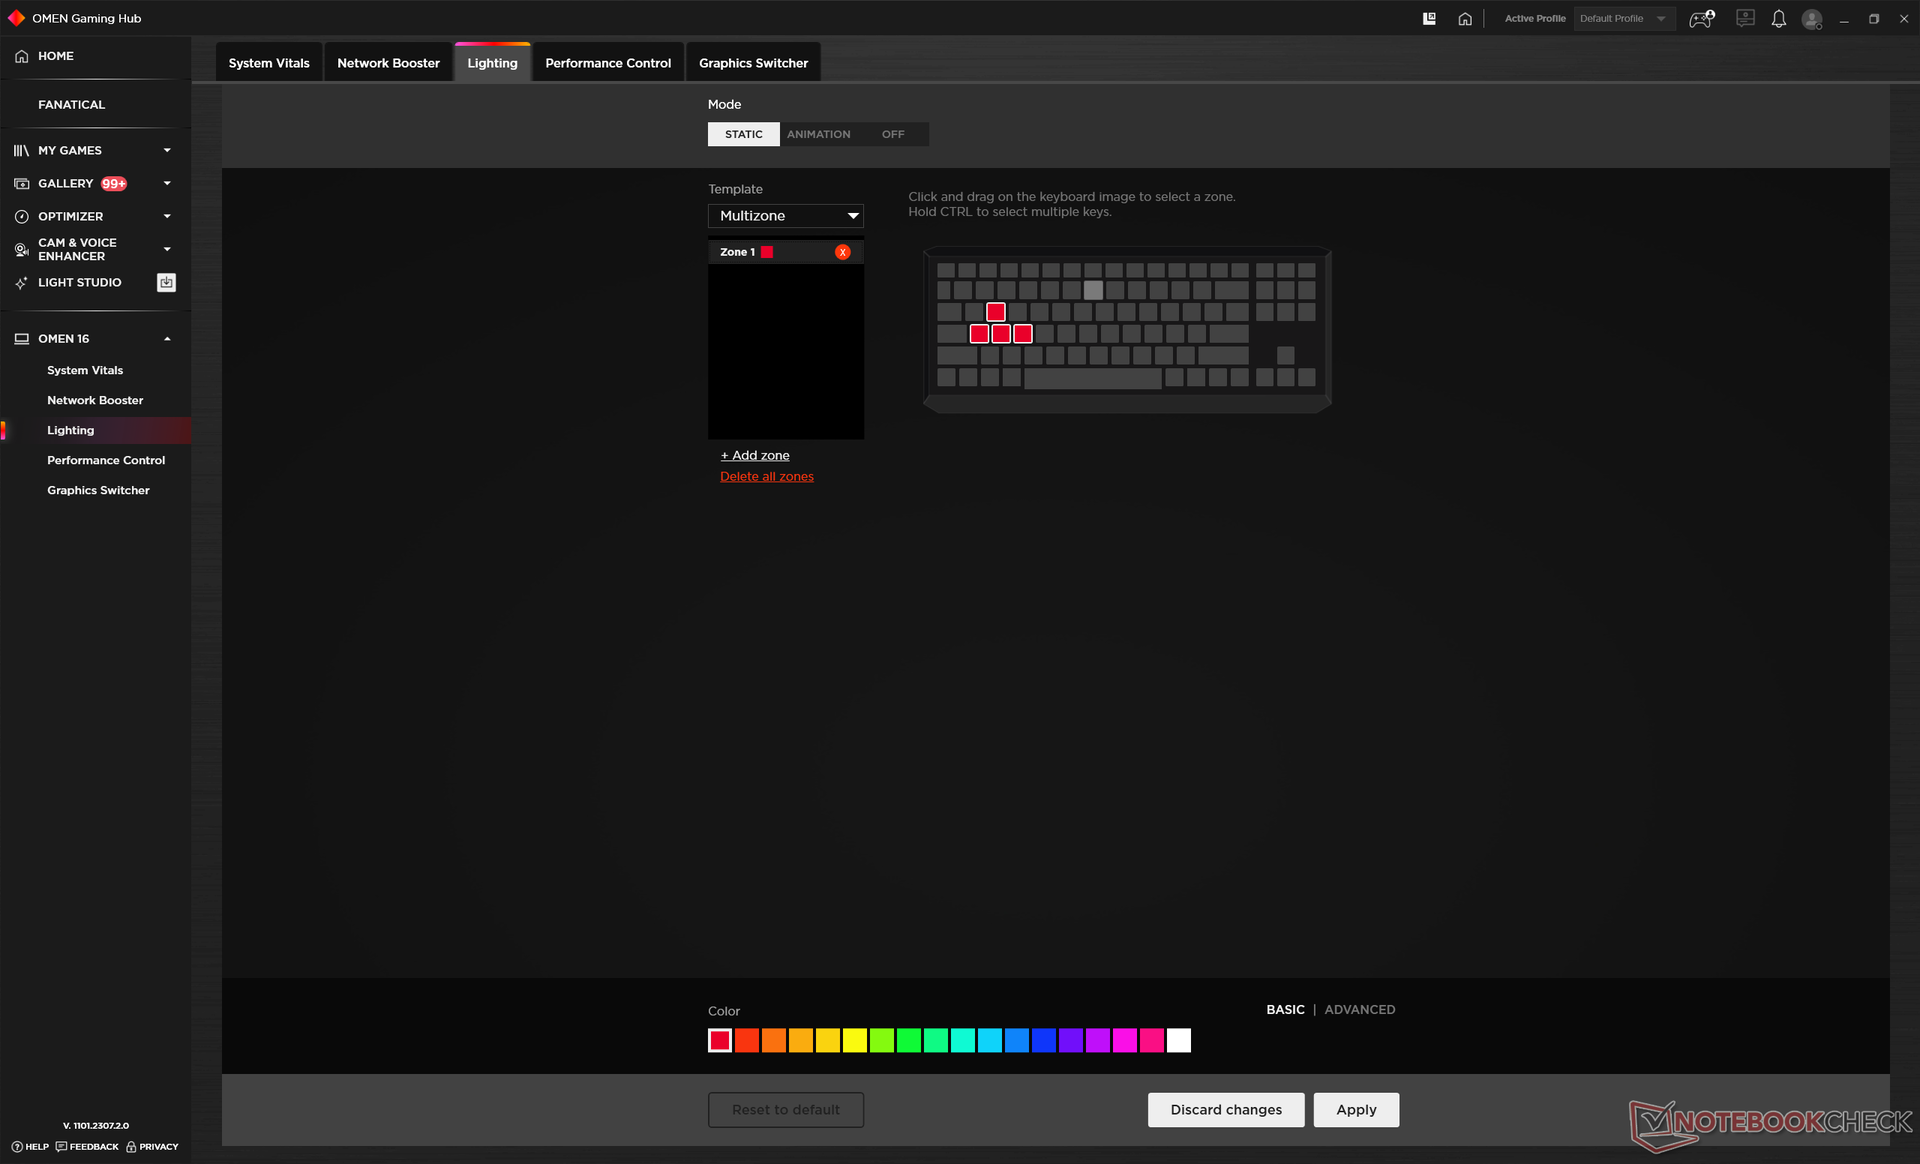
Clavier
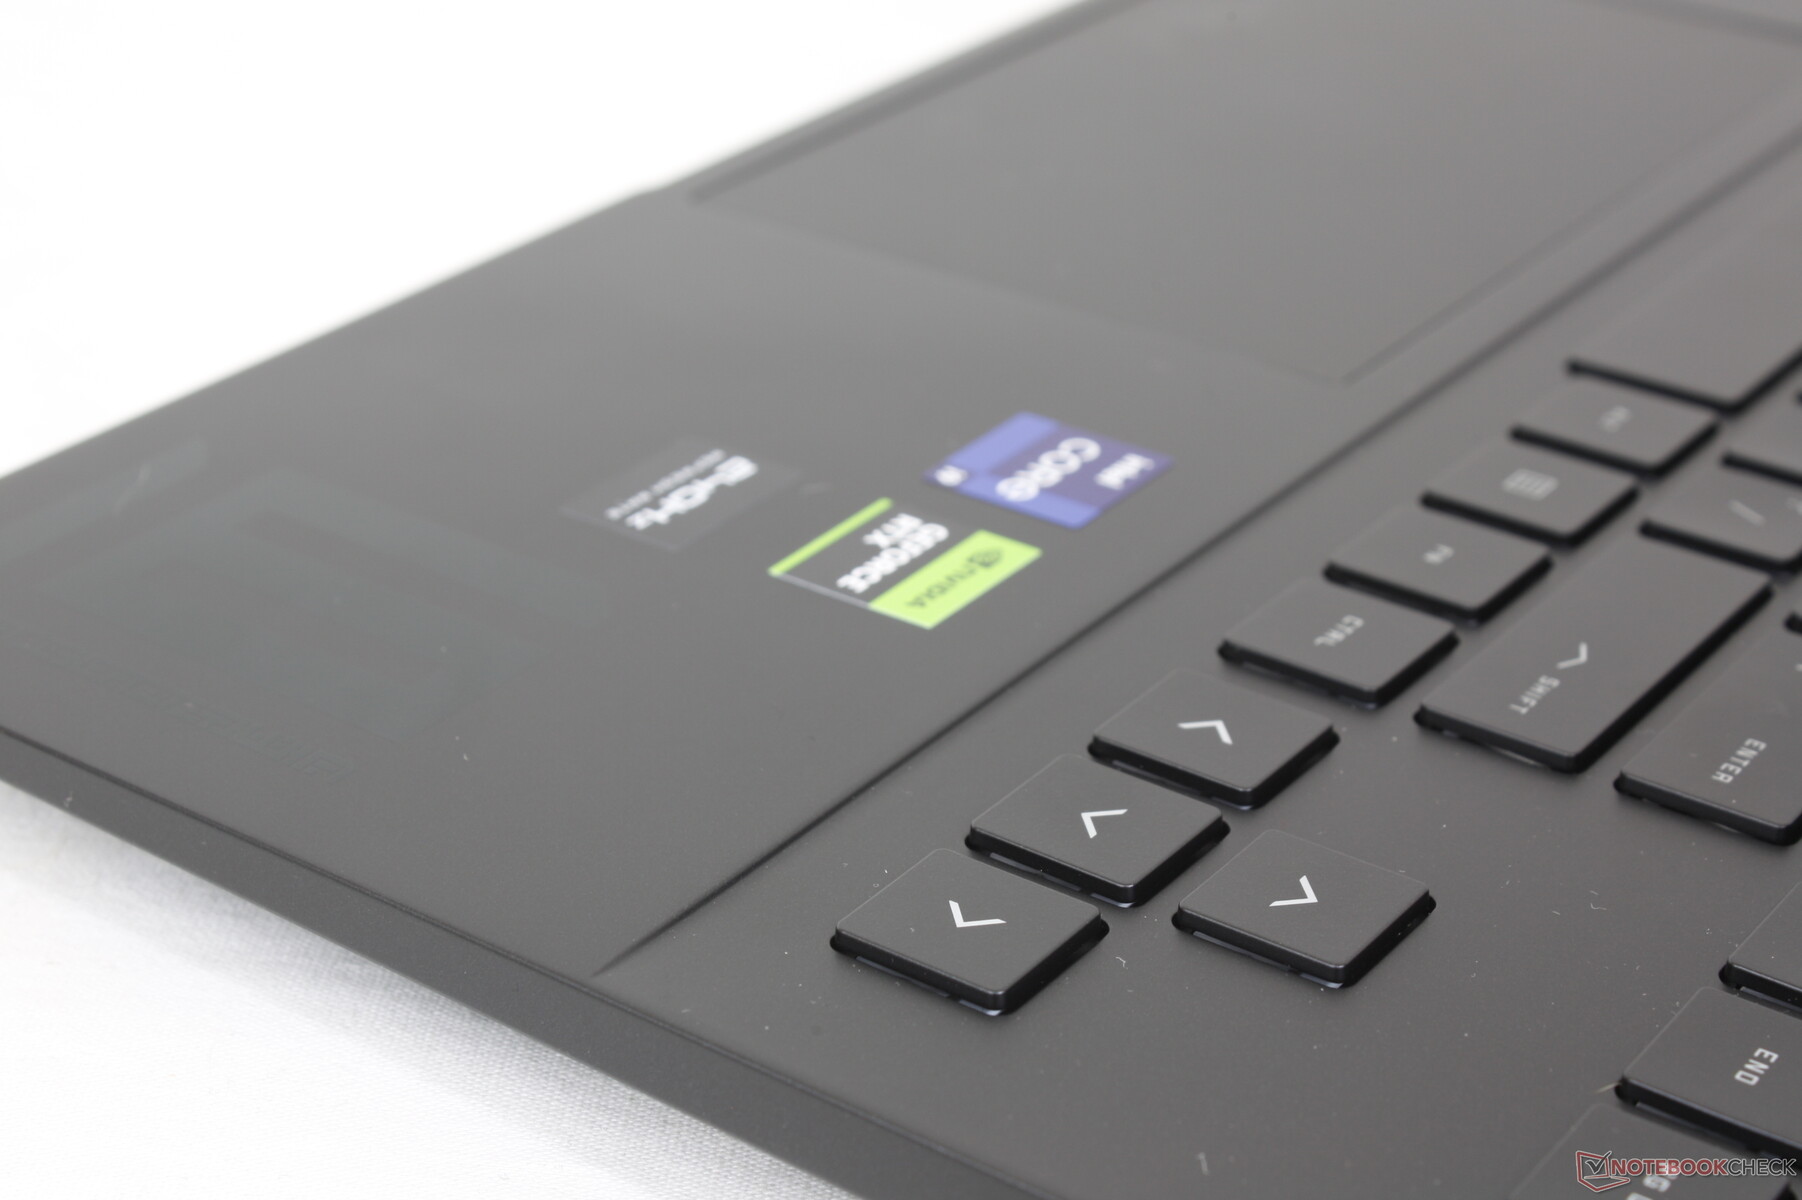
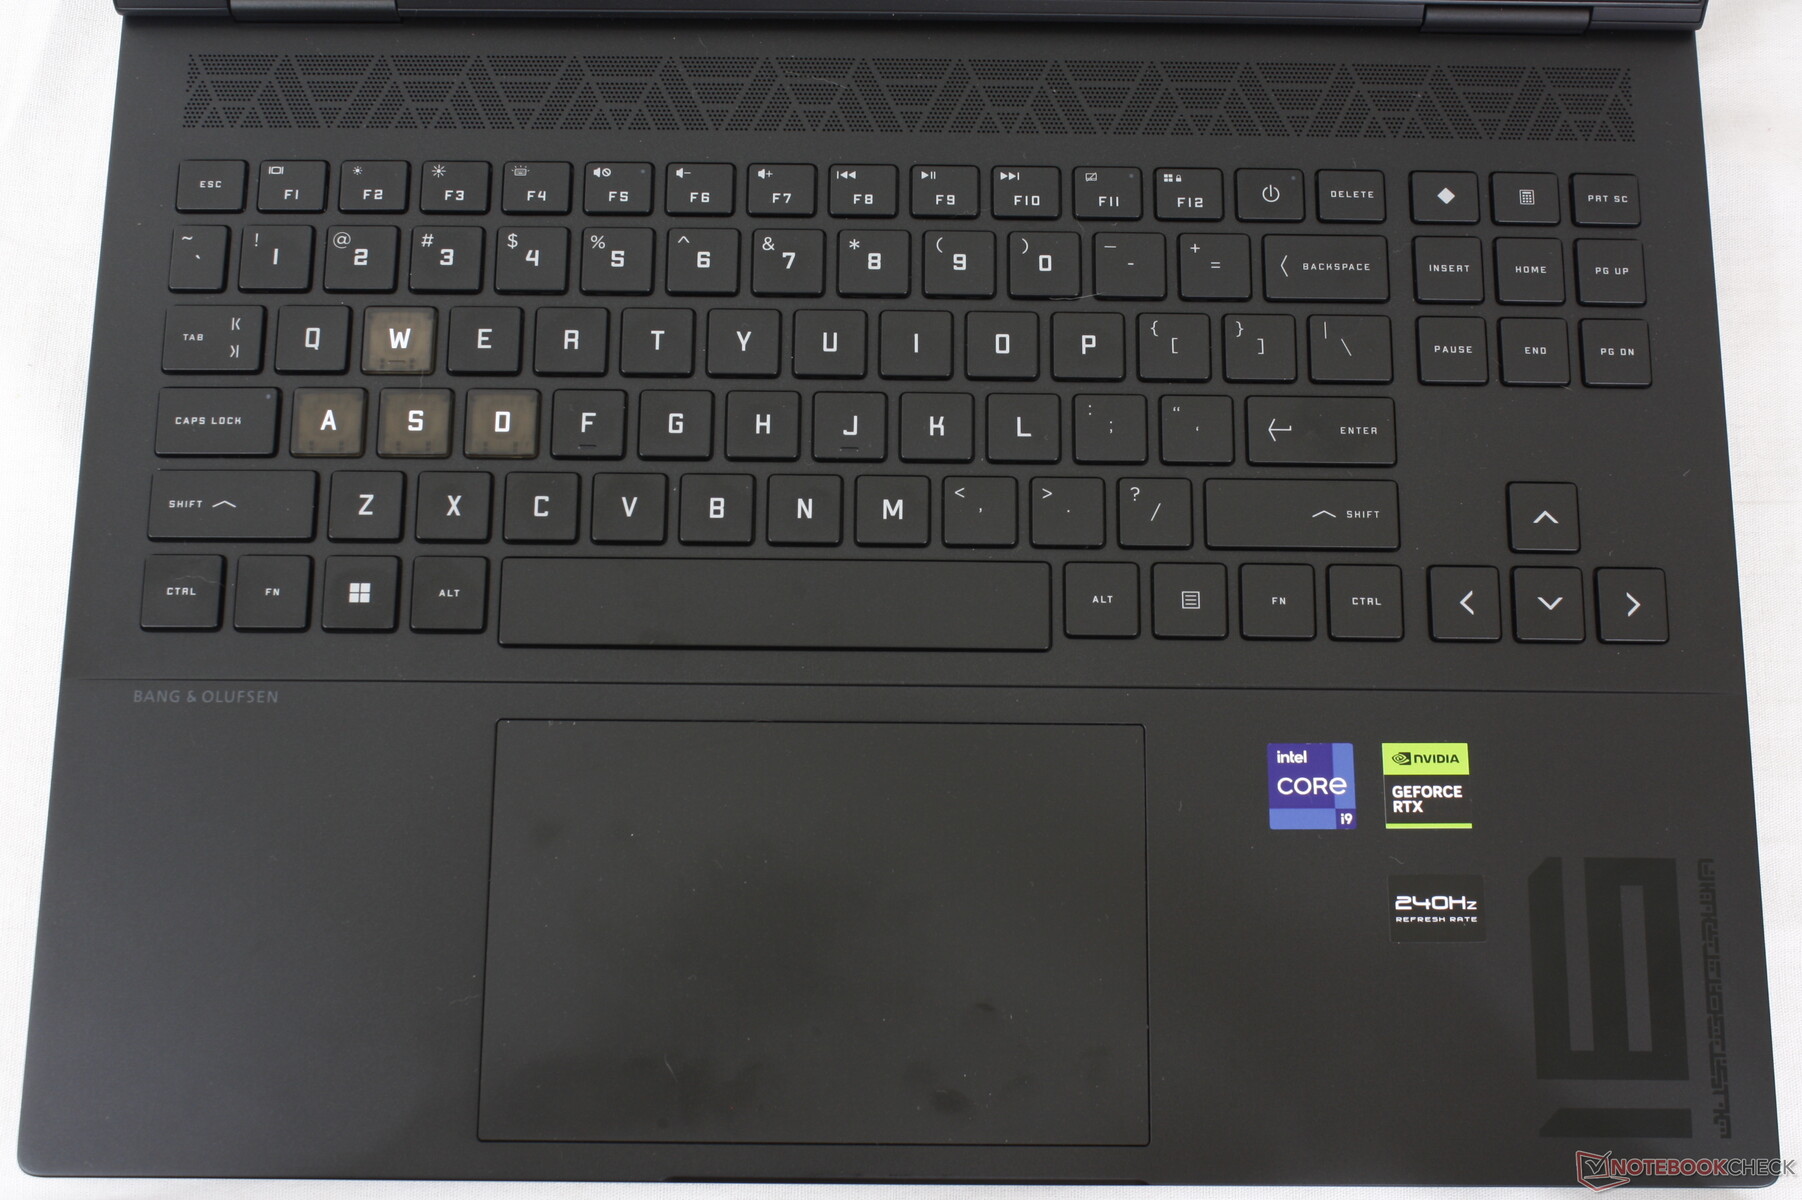
Les touches WASD sont désormais stylisées avec des capuchons translucides pour une esthétique plus gamer. Tous nos commentaires sur le clavier de l'Omen 16 s'appliquent également à l'Omen Transcend 16.
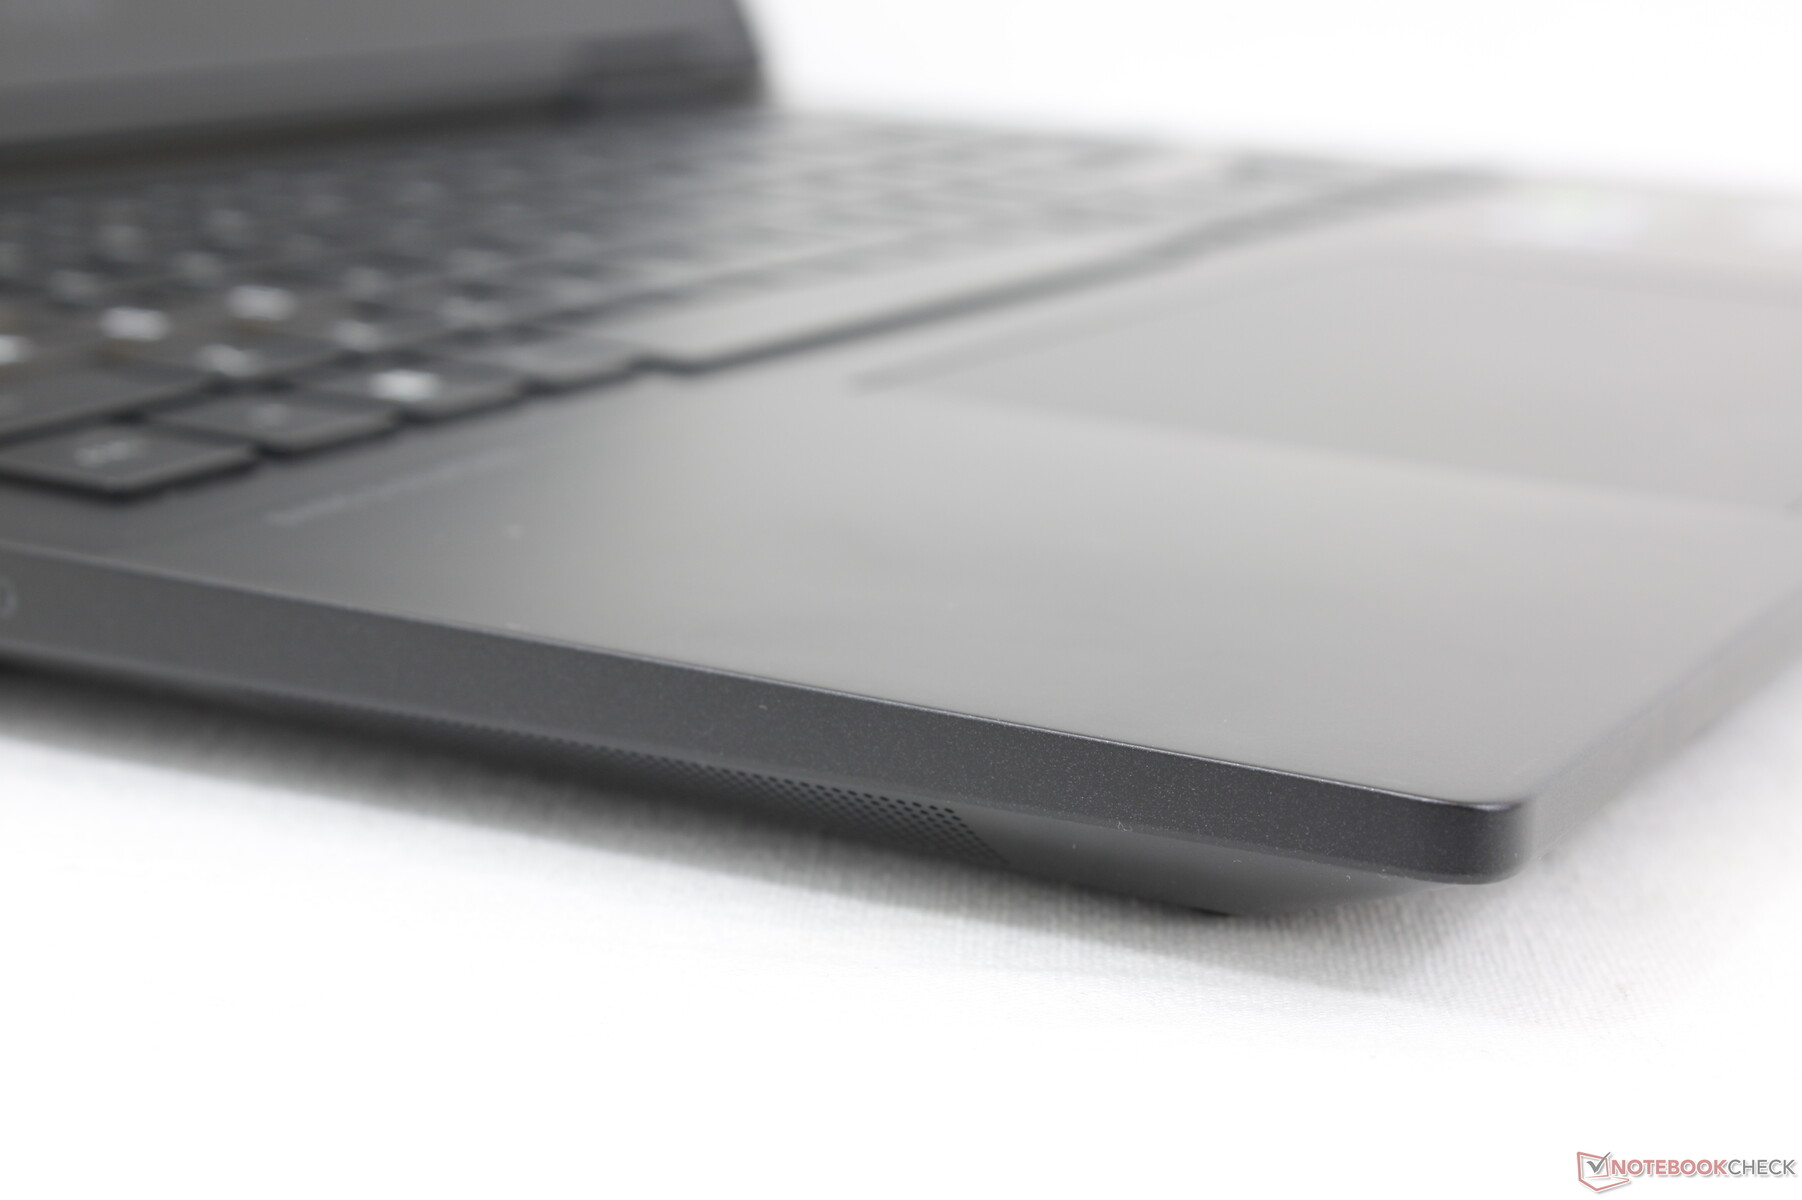
Pavé tactile
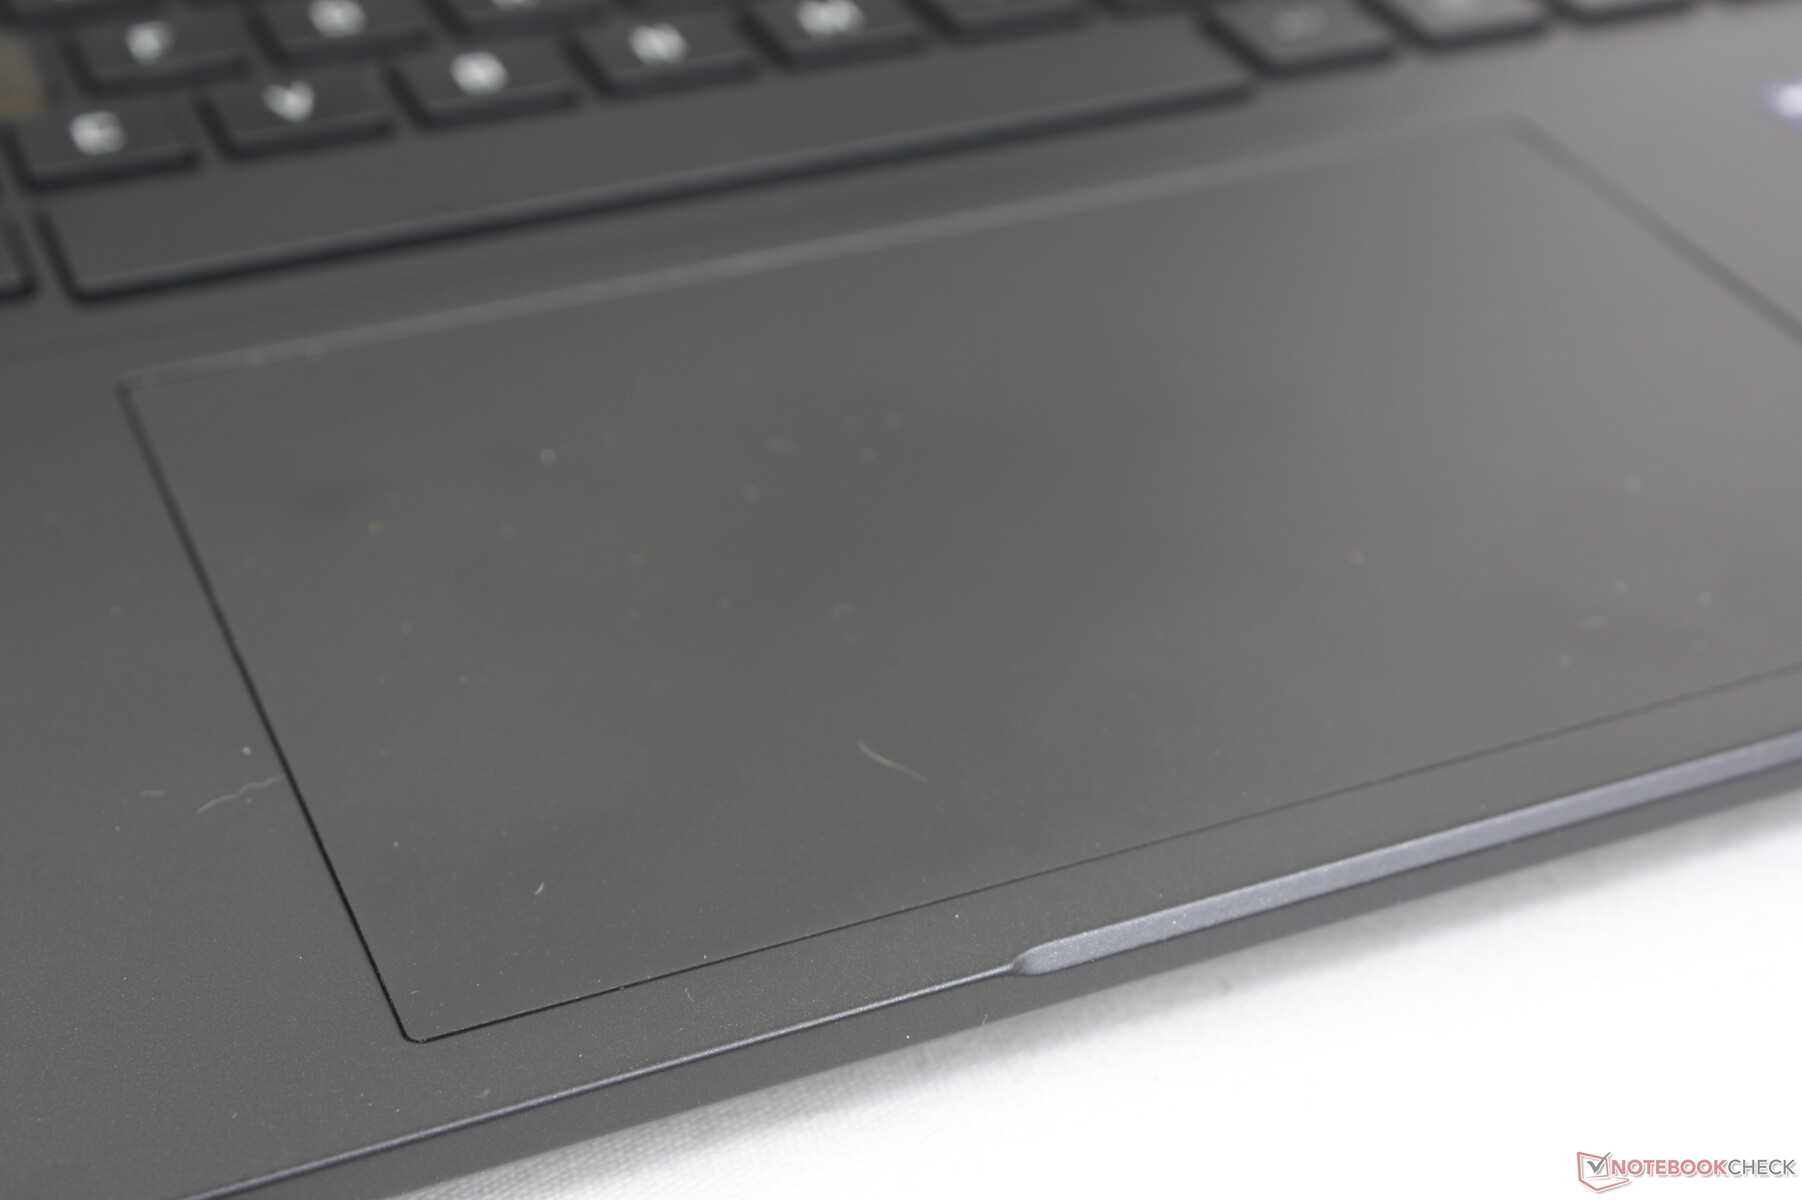
La taille du pavé numérique est passée de 12,5 x 8 cm sur le récent Omen 16 à 13,5 x 8,6 cm sur l'Omen Transcend 16. Bien que réactif et très spacieux pour le défilement, le retour d'information lors du clic est superficiel et aurait pu être plus ferme pour un clic plus satisfaisant.

Écran - Mini-LED, 240 Hz, 1600p, 16:10, 1180 nits, 100 % des couleurs P3

Un autre facteur de différenciation majeur entre l'Omen Transcend 16 et l'Omen 16 est la nouvelle option de panneau mini-LED. Le mini-LED combine les avantages de l'IPS (taux de rafraîchissement rapide et prix relativement abordable) avec les avantages de l'OLED (niveaux de luminosité plus élevés et niveaux de noir plus profonds) pour constituer une bonne option intermédiaire entre les trois technologies d'affichage. Les 1000 zones éclairées individuellement derrière le panneau offrent une expérience visuelle proche des pixels éclairés individuellement de l'OLED.
HP annonce une luminosité maximale de 1180 nits. Nos mesures indépendantes utilisant le test de luminosité HDR https://www.youtube.com/watch?v=NlAsAuBtmps&enregistreraient un maximum de 1233 nits pour confirmer les affirmations de HP. Notez que ce maximum n'est disponible que dans certaines conditions HDR similaires à celles de l'Asus VivoBook Asus VivoBook car la luminosité maximale est autrement limitée à ~800 nits lorsque l'écran est entièrement blanc et sans noir. Malgré cela, 800 nits est presque 2 fois plus lumineux que la plupart des autres ordinateurs portables IPS.
Comparé à l'écran mini-LED des ordinateurs portables concurrents, leLenovo Slim Pro 9 16notre écran HP a une résolution native plus faible (2560 x 1600 contre 3200 x 2000) mais un taux de rafraîchissement plus élevé (240 Hz contre 165 Hz).


| |||||||||||||||||||||||||
Homogénéité de la luminosité: 95 %
Valeur mesurée au centre, sur batterie: 791.1 cd/m²
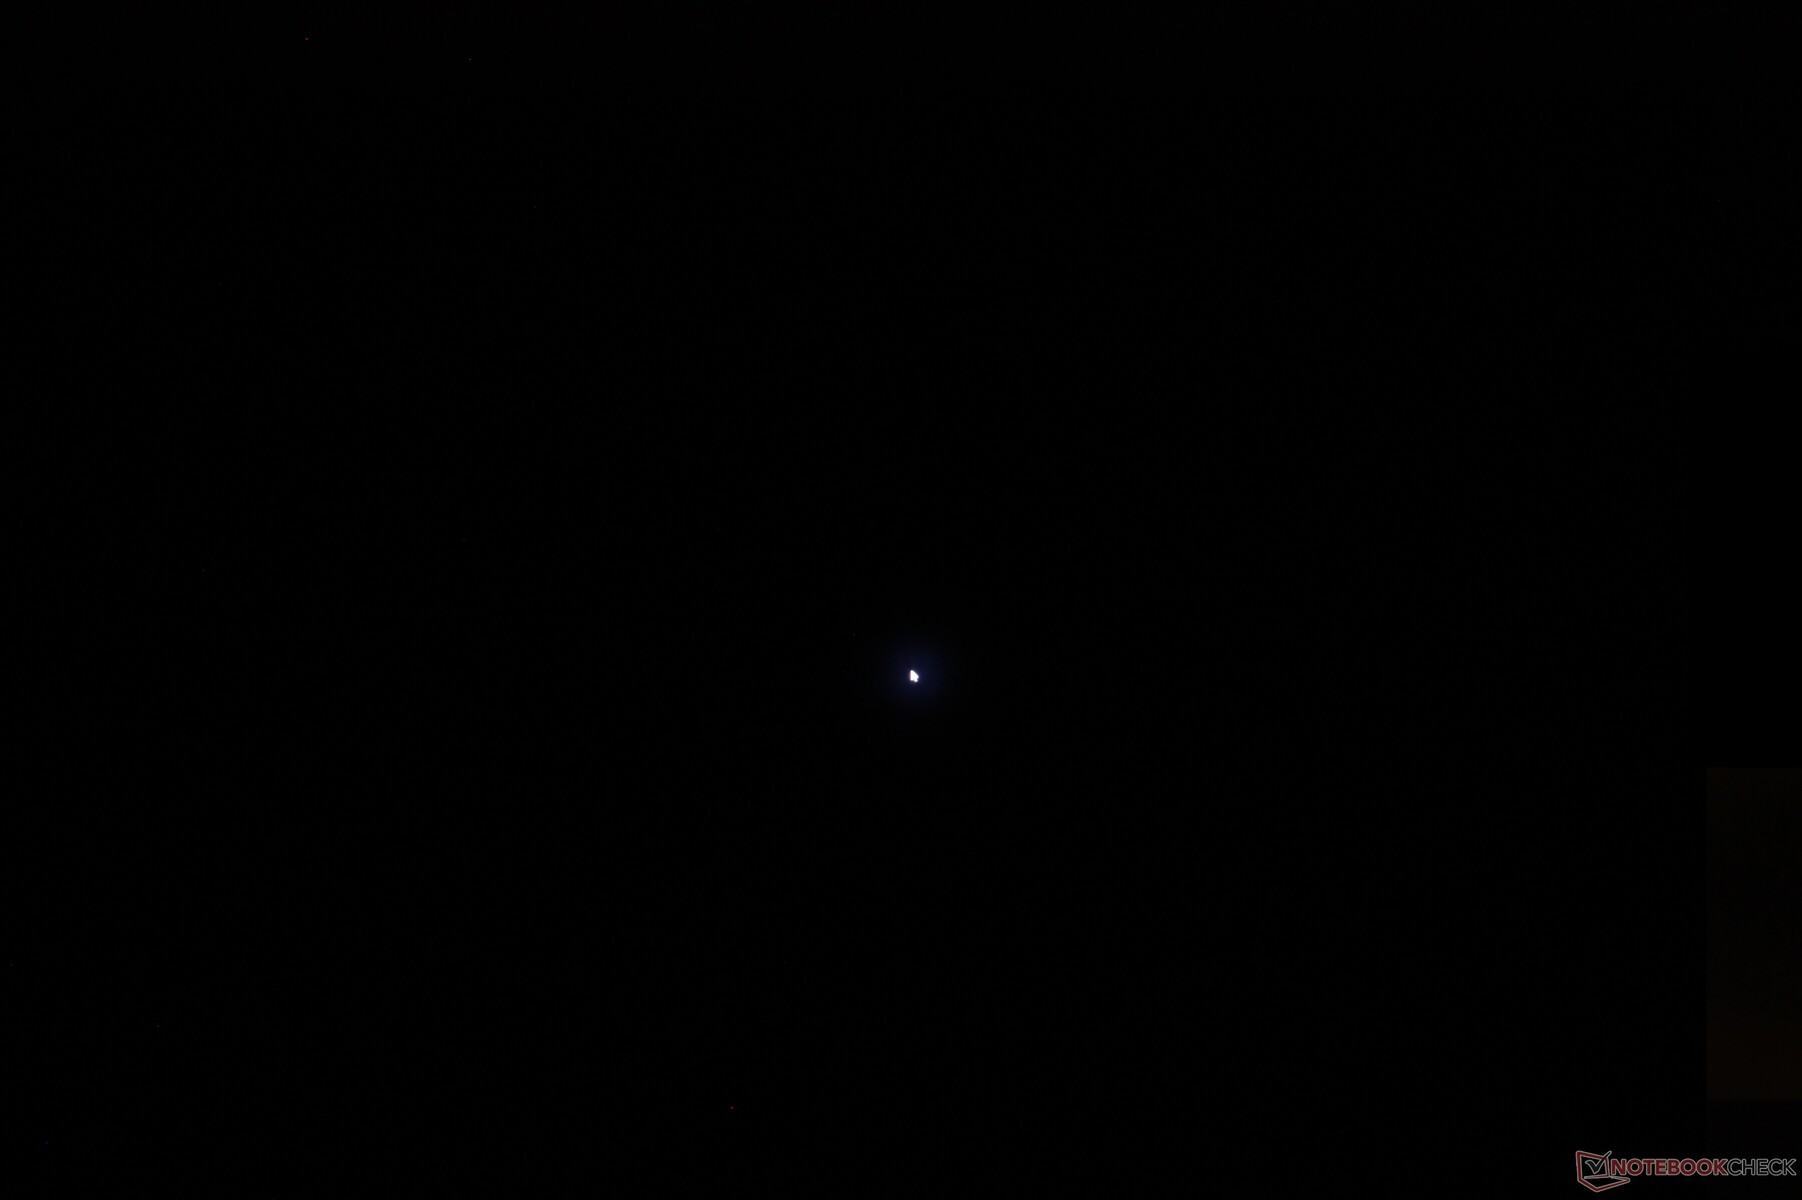
Contraste: 19778:1 (Valeurs des noirs: 0.04 cd/m²)
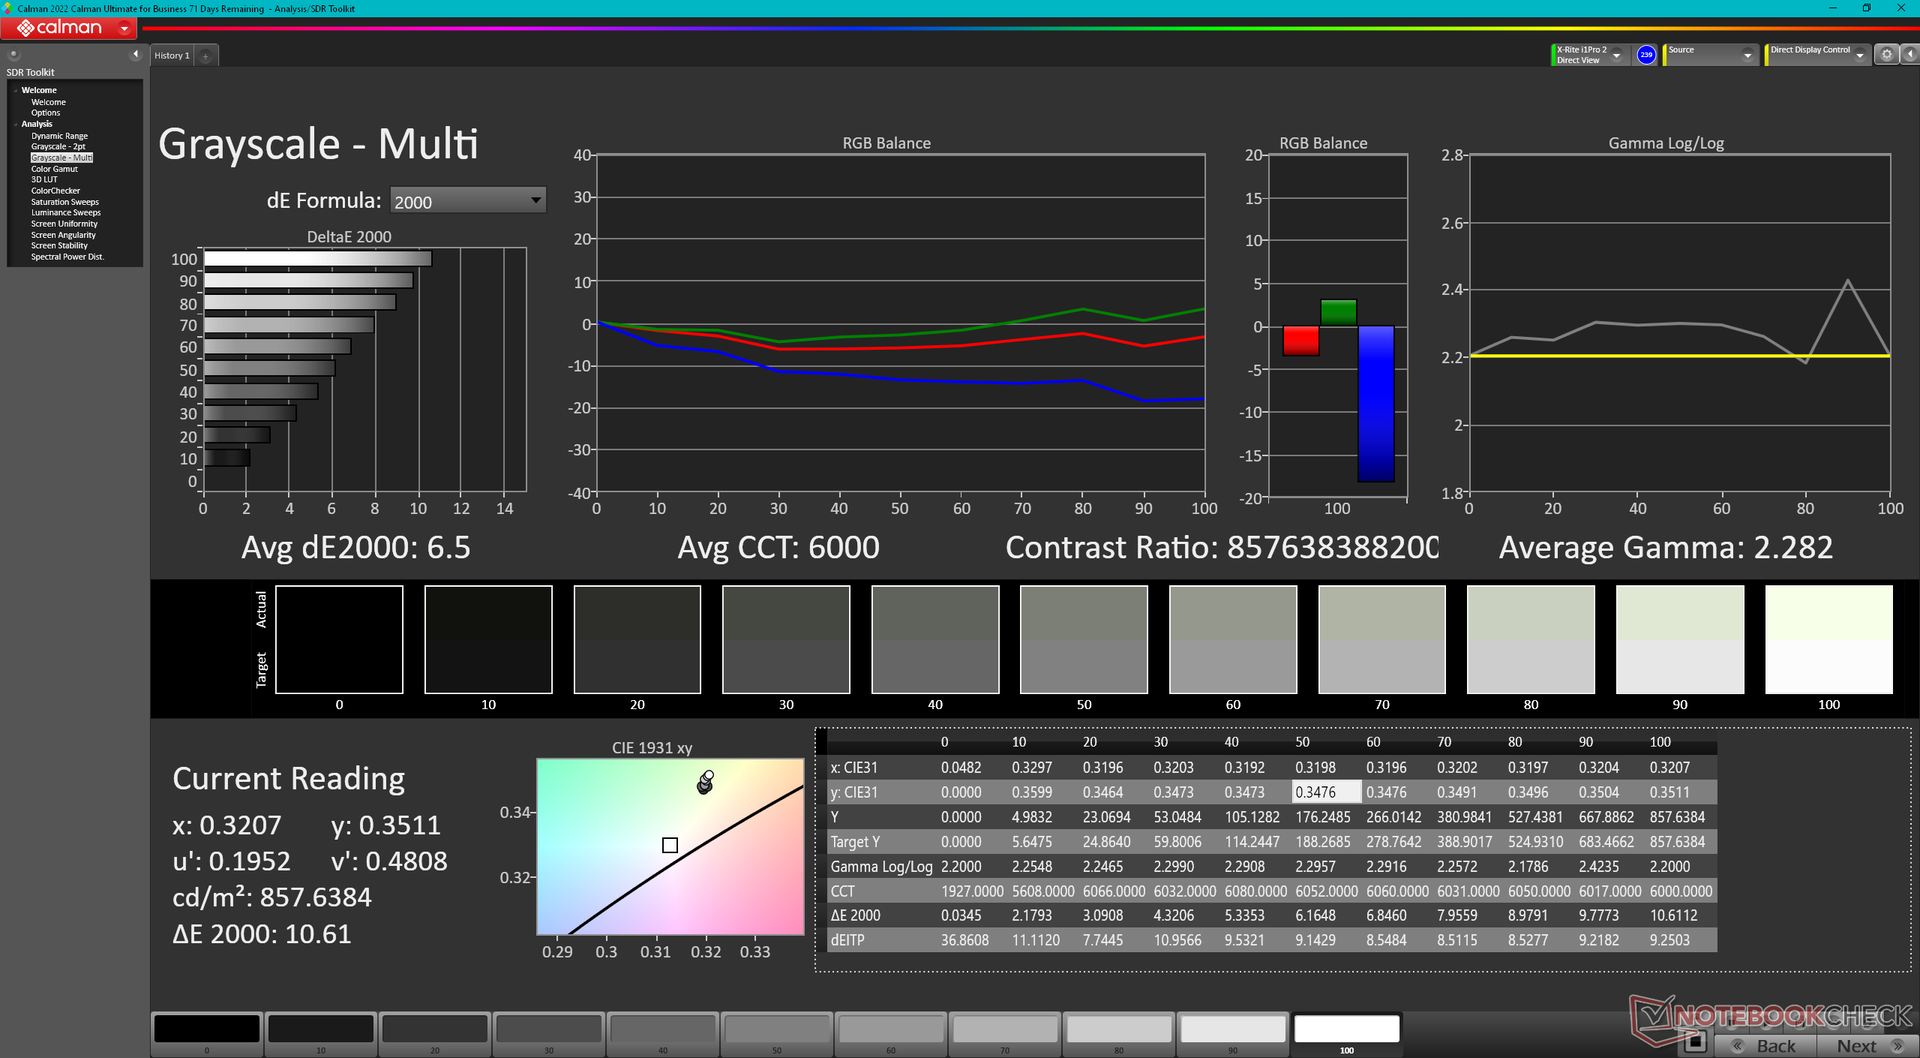
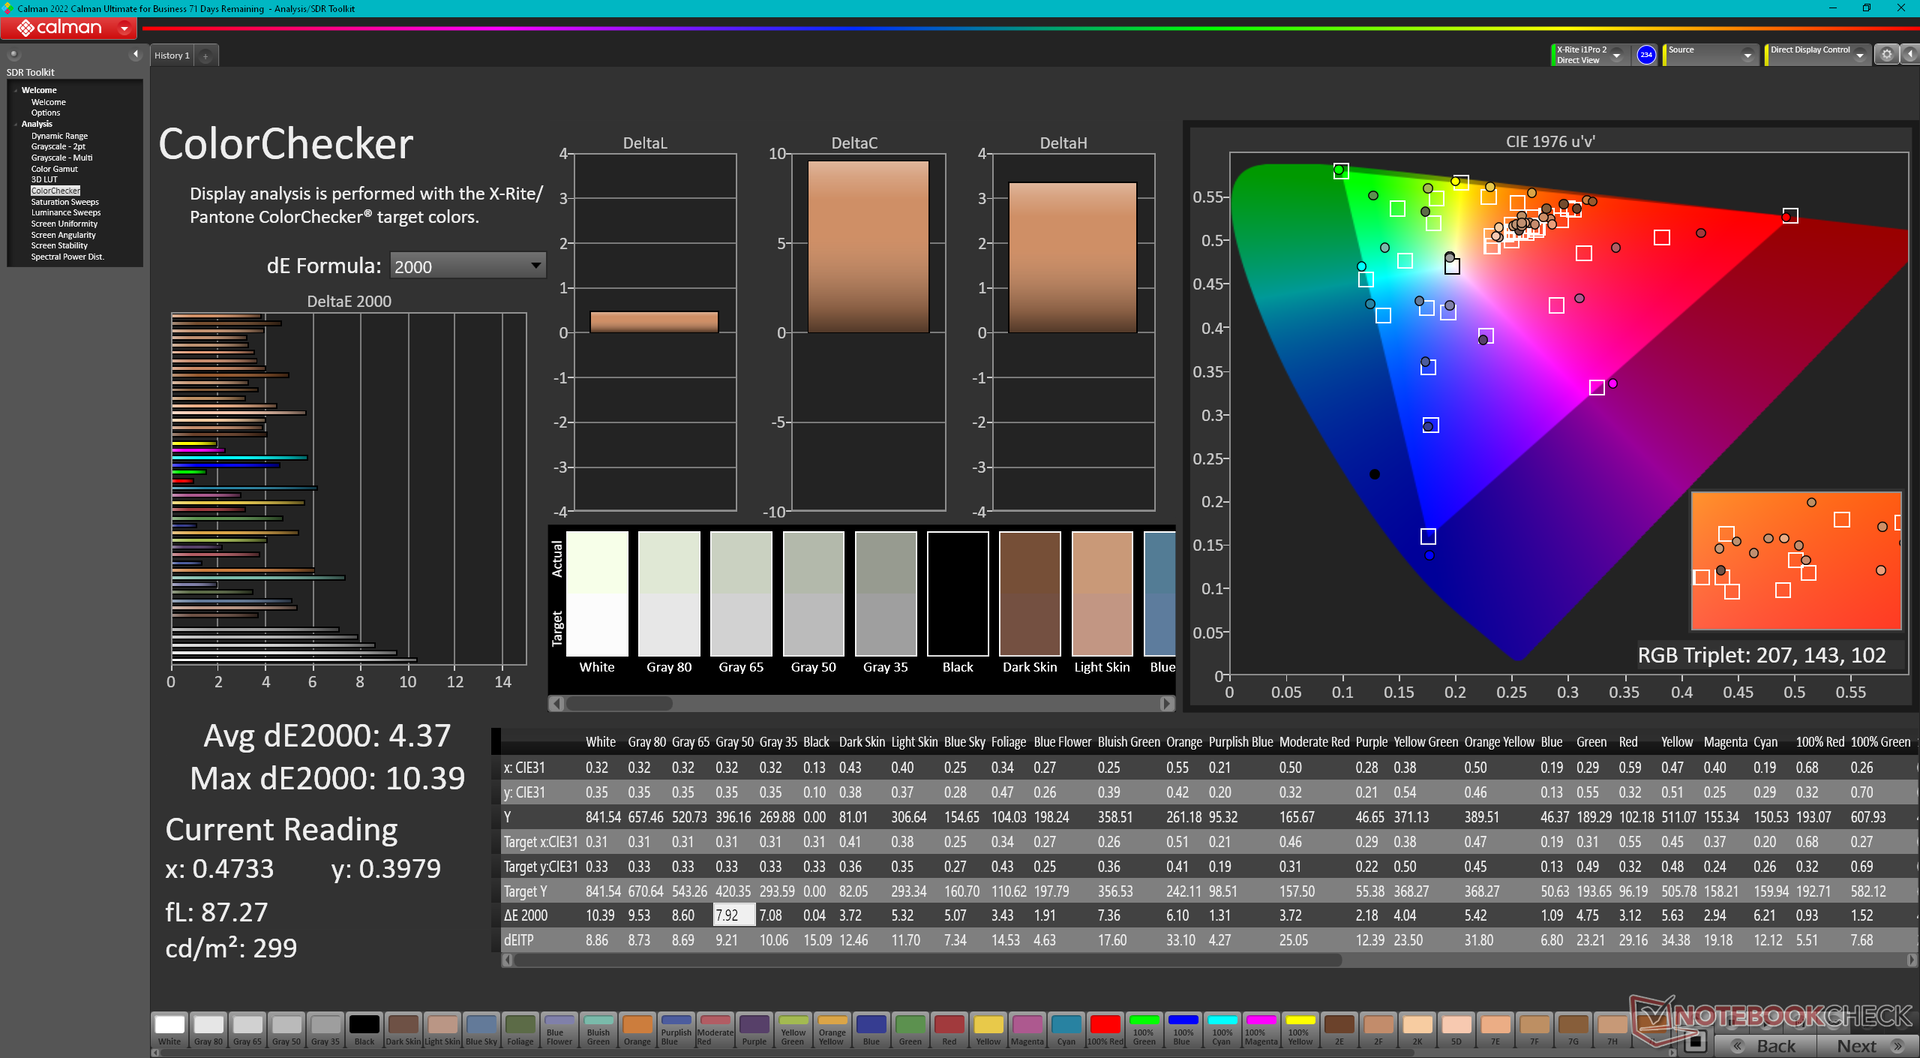
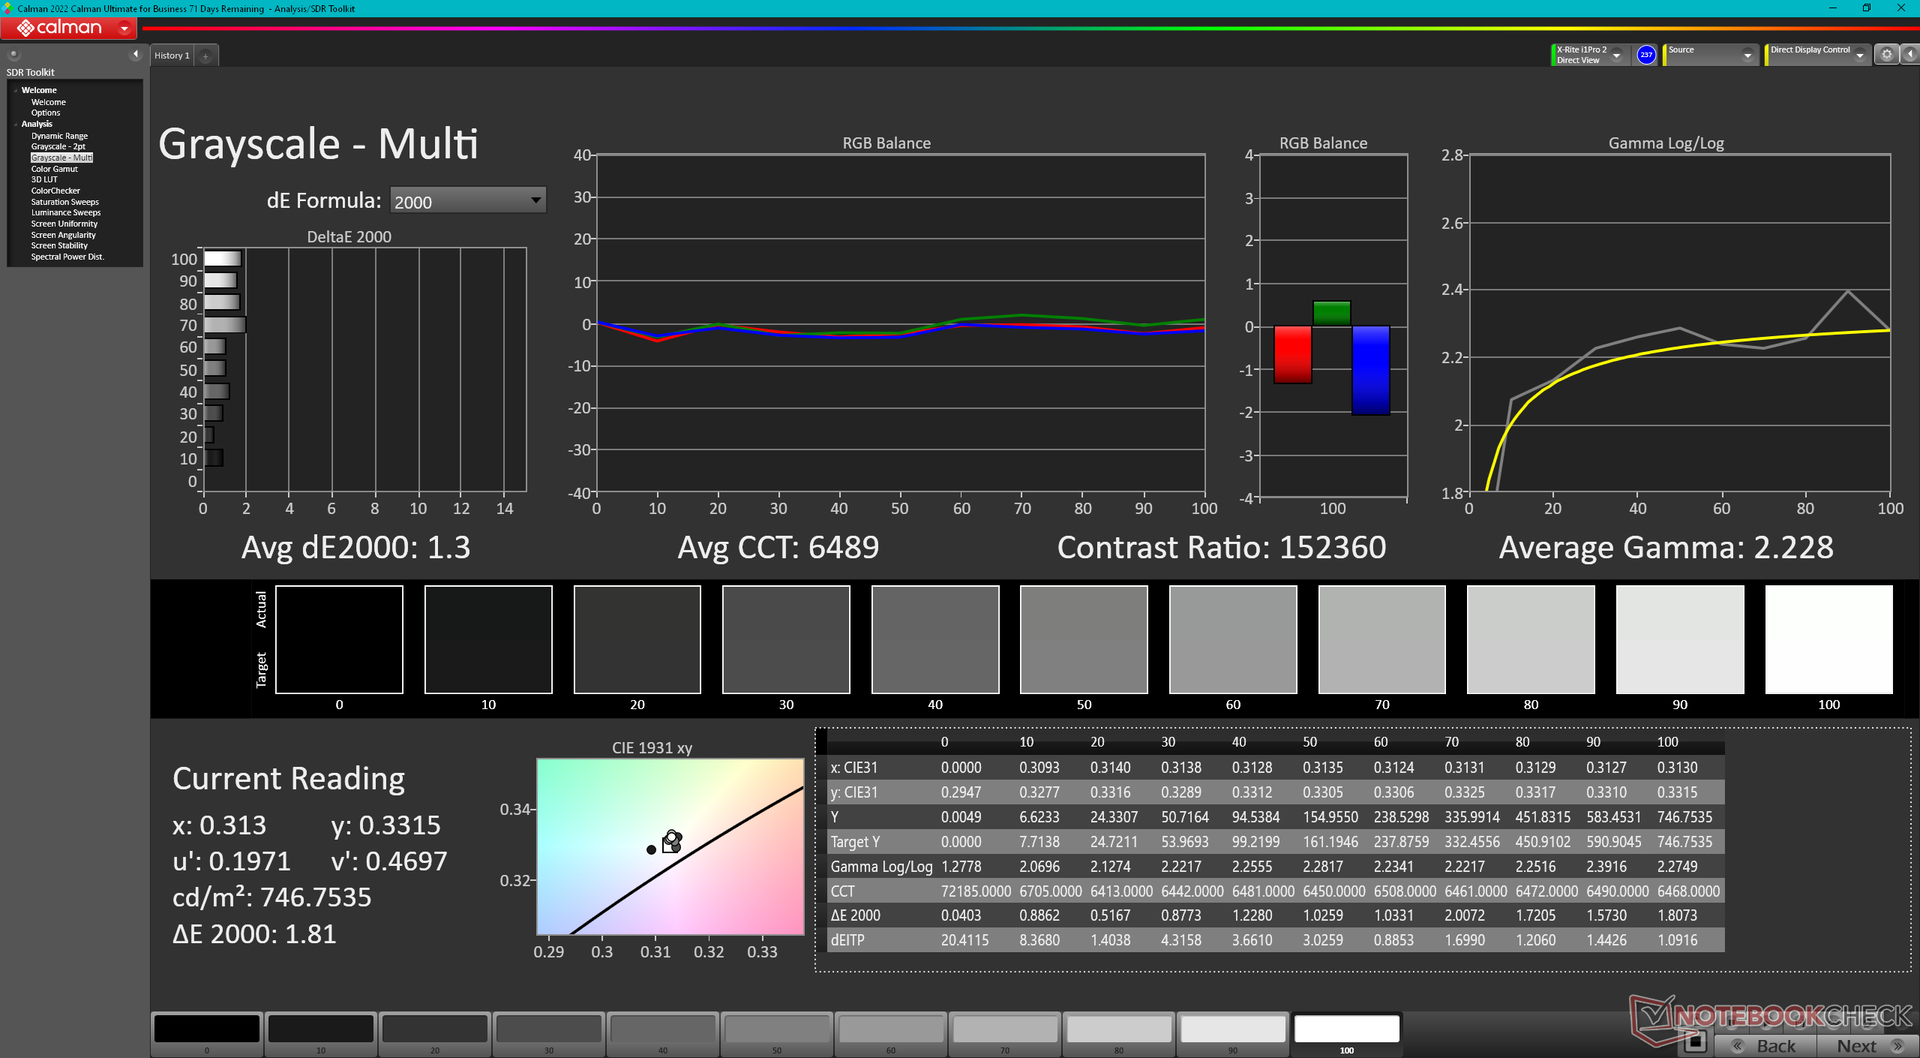
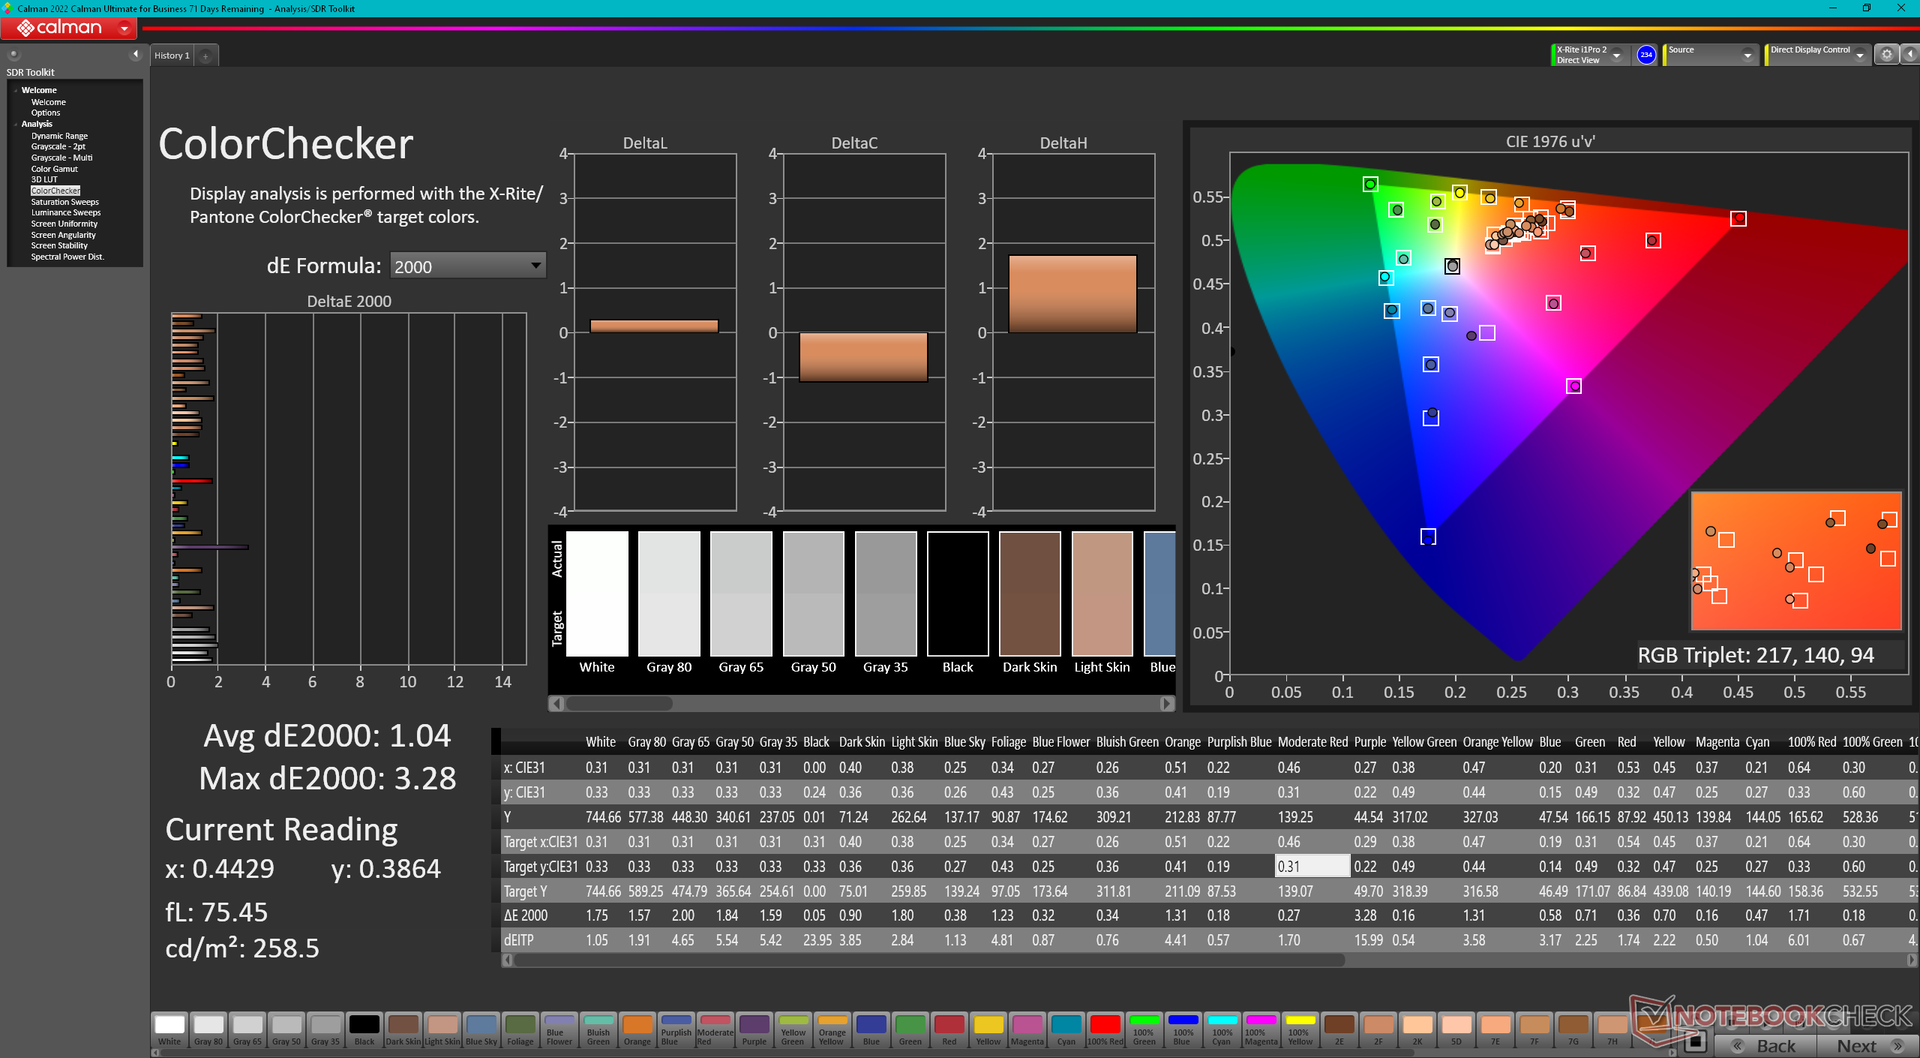
ΔE ColorChecker Calman: 4.37 | ∀{0.5-29.43 Ø4.71}
calibrated: 1.04
ΔE Greyscale Calman: 6.5 | ∀{0.09-98 Ø4.96}
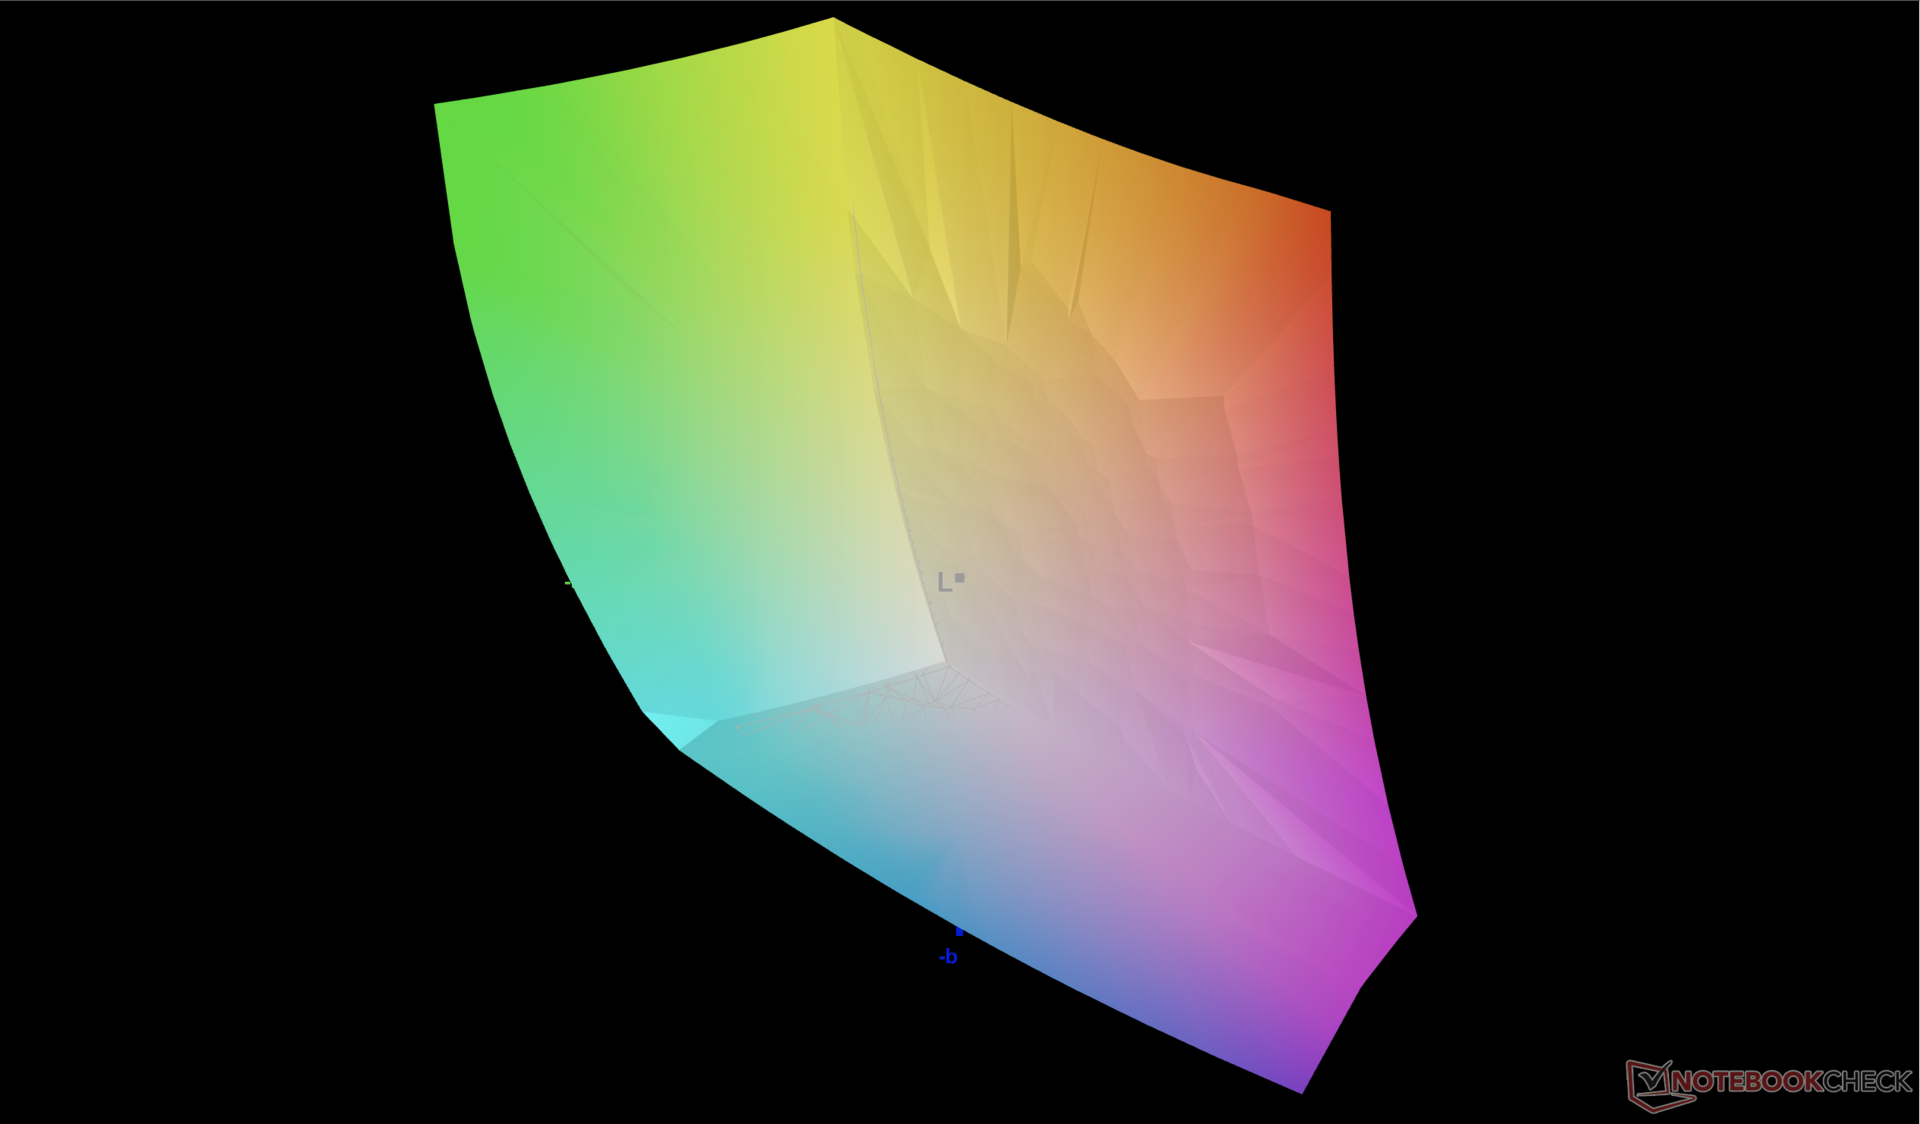
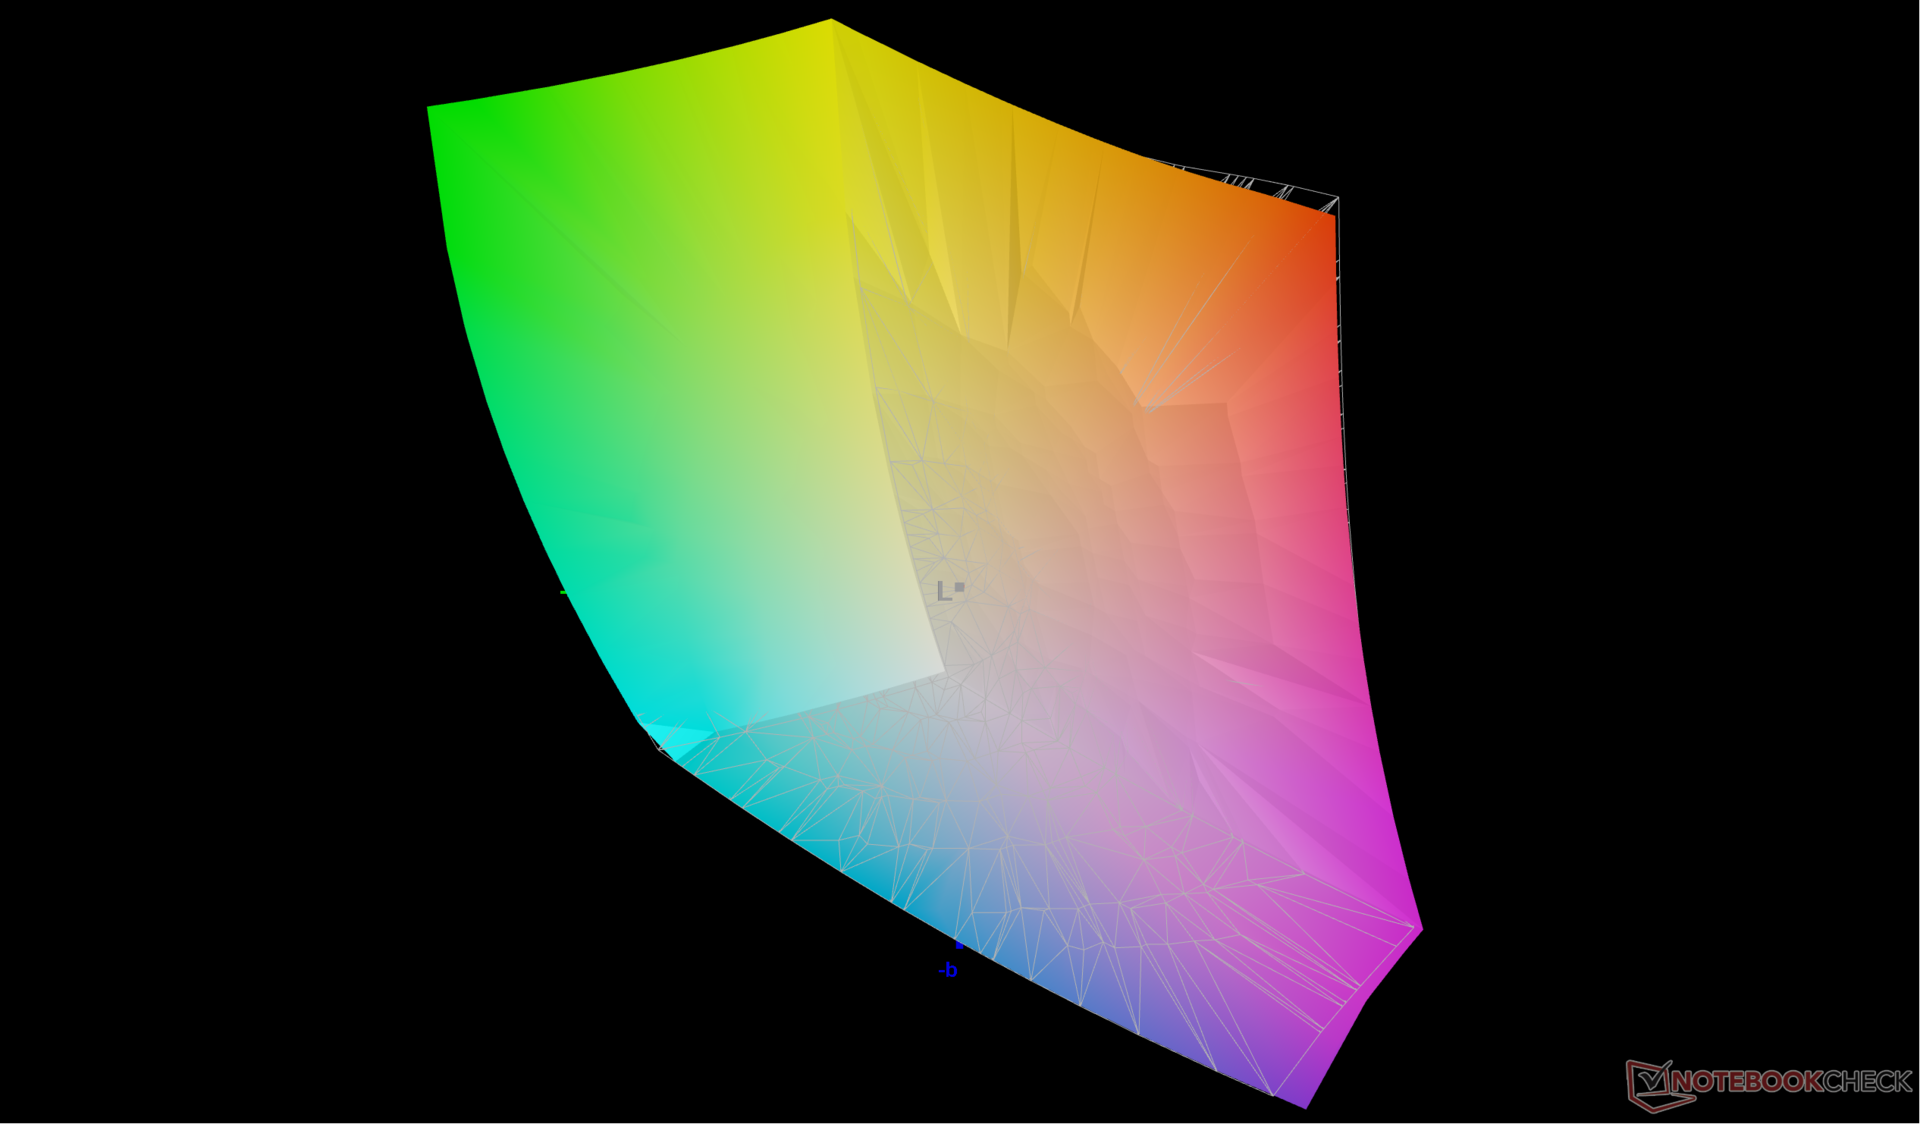
87.6% AdobeRGB 1998 (Argyll 3D)
100% sRGB (Argyll 3D)
99.2% Display P3 (Argyll 3D)
Gamma: 2.28
CCT: 6000 K
| HP Omen Transcend 16 AUOA3A6, Mini-LED, 2560x1600, 16" | Lenovo Legion Slim 7i 16 Gen 8 CSOT T3 MNG007DA2-3, IPS, 2560x1600, 16" | HP Omen 16-wf000 BOE0B7D, IPS, 2560x1440, 16.1" | Alienware x16 R1 BOE NE16NZ4, IPS, 2560x1600, 16" | Acer Nitro 16 AN16-41 BOE CQ NE16QDM-NY1, IPS, 2560x1600, 16" | Asus ROG Zephyrus M16 GU603Z BOE0A0B (BOE CQ NE160QDM-NY3), IPS, 2560x1600, 16" | |
|---|---|---|---|---|---|---|
| Display | -16% | -17% | 0% | -18% | -4% | |
| Display P3 Coverage (%) | 99.2 | 70.4 -29% | 69 -30% | 99.2 0% | 67.9 -32% | 92.8 -6% |
| sRGB Coverage (%) | 100 | 99.4 -1% | 99.2 -1% | 100 0% | 99.1 -1% | 98.5 -1% |
| AdobeRGB 1998 Coverage (%) | 87.6 | 72.5 -17% | 71.2 -19% | 88.6 1% | 69.9 -20% | 83.1 -5% |
| Response Times | 62% | 75% | 72% | 70% | 68% | |
| Response Time Grey 50% / Grey 80% * (ms) | 26.4 ? | 12 ? 55% | 4.6 ? 83% | 5.1 ? 81% | 11 ? 58% | 7.6 ? 71% |
| Response Time Black / White * (ms) | 28.2 ? | 8.9 ? 68% | 9.7 ? 66% | 10.3 ? 63% | 5 ? 82% | 10 ? 65% |
| PWM Frequency (Hz) | 3506 ? | |||||
| Screen | -95% | -86% | -67% | -95% | -79% | |
| Brightness middle (cd/m²) | 791.1 | 474.6 -40% | 310.9 -61% | 302.2 -62% | 520 -34% | 497 -37% |
| Brightness (cd/m²) | 800 | 445 -44% | 296 -63% | 285 -64% | 494 -38% | 481 -40% |
| Brightness Distribution (%) | 95 | 86 -9% | 91 -4% | 89 -6% | 91 -4% | 82 -14% |
| Black Level * (cd/m²) | 0.04 | 0.39 -875% | 0.35 -775% | 0.26 -550% | 0.39 -875% | 0.21 -425% |
| Contrast (:1) | 19778 | 1217 -94% | 888 -96% | 1162 -94% | 1333 -93% | 2367 -88% |
| Colorchecker dE 2000 * | 4.37 | 2.12 51% | 2.18 50% | 1.63 63% | 1.94 56% | 3.53 19% |
| Colorchecker dE 2000 max. * | 10.39 | 4.73 54% | 3.58 66% | 4.13 60% | 5.62 46% | 6.15 41% |
| Colorchecker dE 2000 calibrated * | 1.04 | 0.57 45% | 0.52 50% | 1.17 -13% | 0.74 29% | 3.53 -239% |
| Greyscale dE 2000 * | 6.5 | 2.8 57% | 2.8 57% | 2.5 62% | 2.94 55% | 1.74 73% |
| Gamma | 2.28 96% | 2.22 99% | 2.18 101% | 2.23 99% | 2.37 93% | 2.2 100% |
| CCT | 6000 108% | 6542 99% | 6002 108% | 6590 99% | 6443 101% | 6418 101% |
| Moyenne finale (programmes/paramètres) | -16% /
-56% | -9% /
-48% | 2% /
-33% | -14% /
-55% | -5% /
-42% |
* ... Moindre est la valeur, meilleures sont les performances
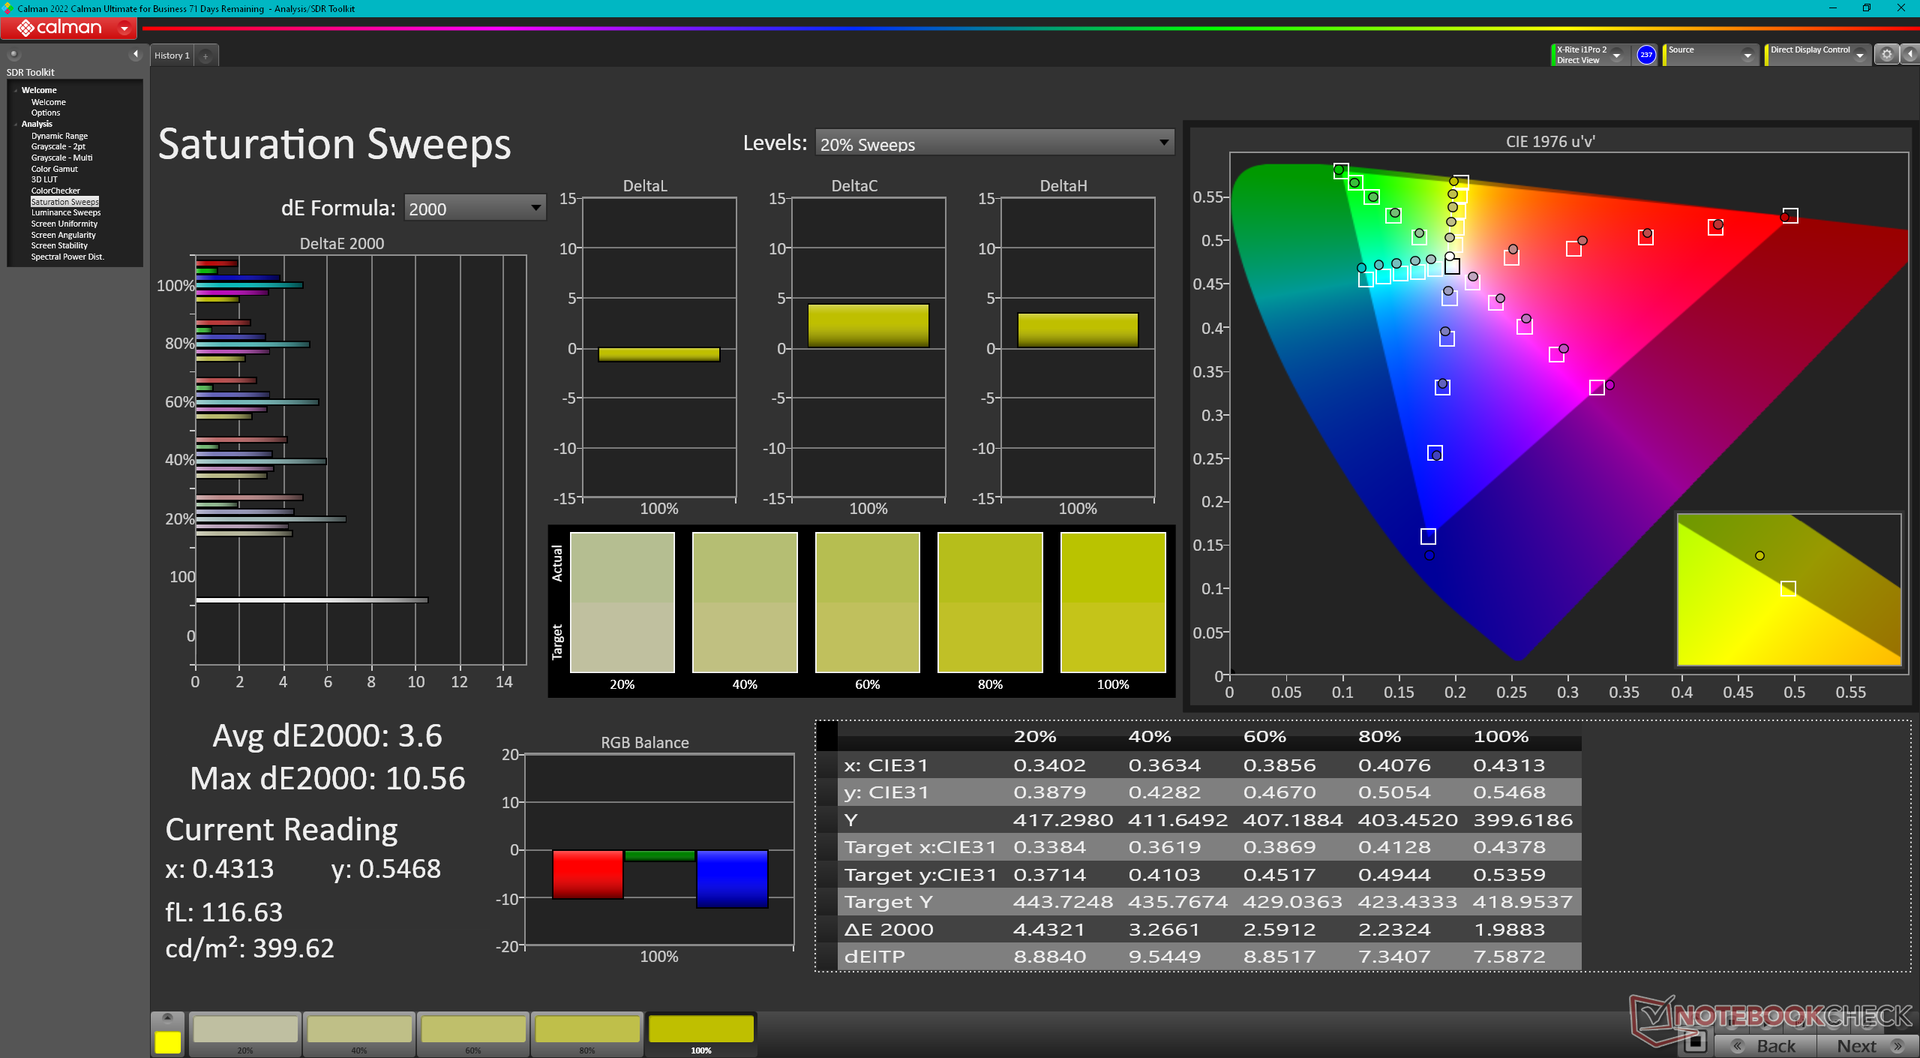
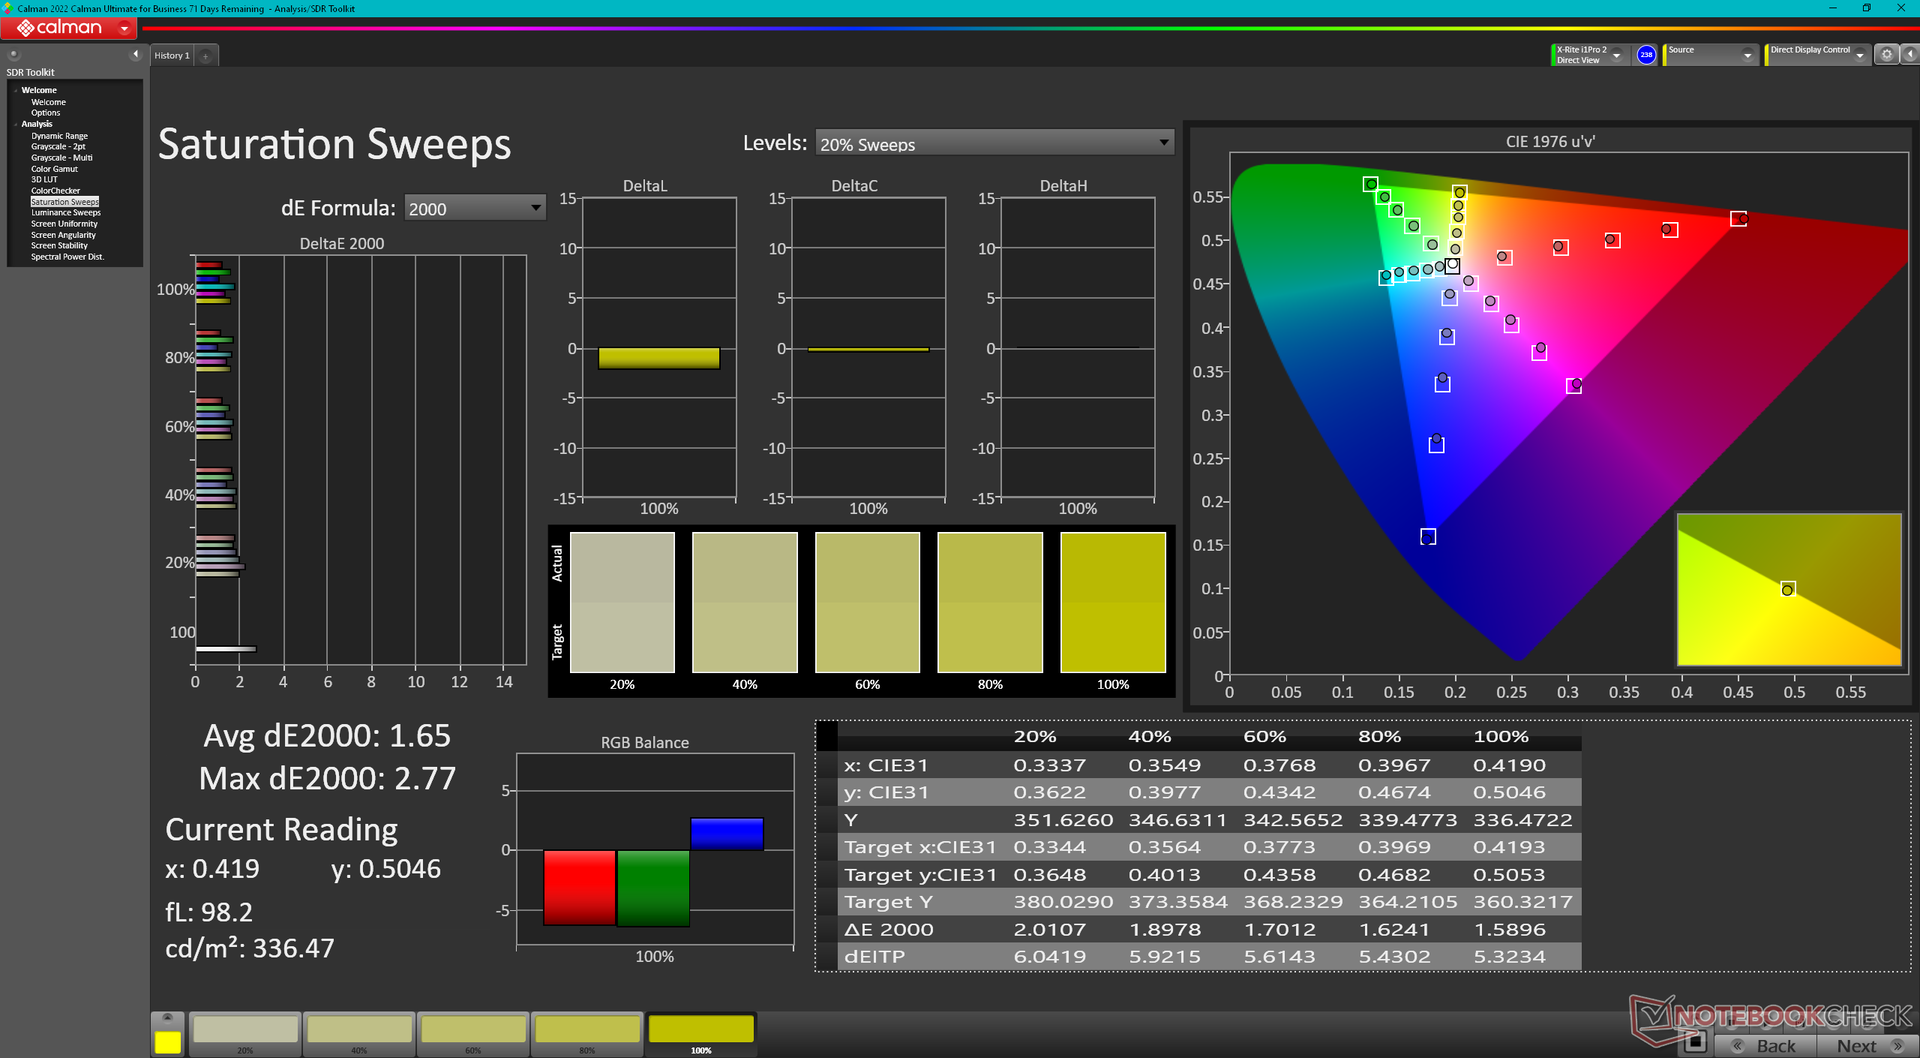
Le panneau n'est pas calibré en usine. La température de couleur est plus chaude que prévu à 6000K et les couleurs aux niveaux de saturation inférieurs ne sont pas aussi précises qu'elles pourraient l'être. L'étalonnage du panneau à l'aide de notre colorimètre X-Rite permettrait d'augmenter la température des couleurs à la valeur standard de 6500K pour obtenir des couleurs plus stables à tous les niveaux de saturation.
Temps de réponse de l'écran
| ↔ Temps de réponse noir à blanc | ||
|---|---|---|
| 28.2 ms ... hausse ↗ et chute ↘ combinées | ↗ 21.6 ms hausse | 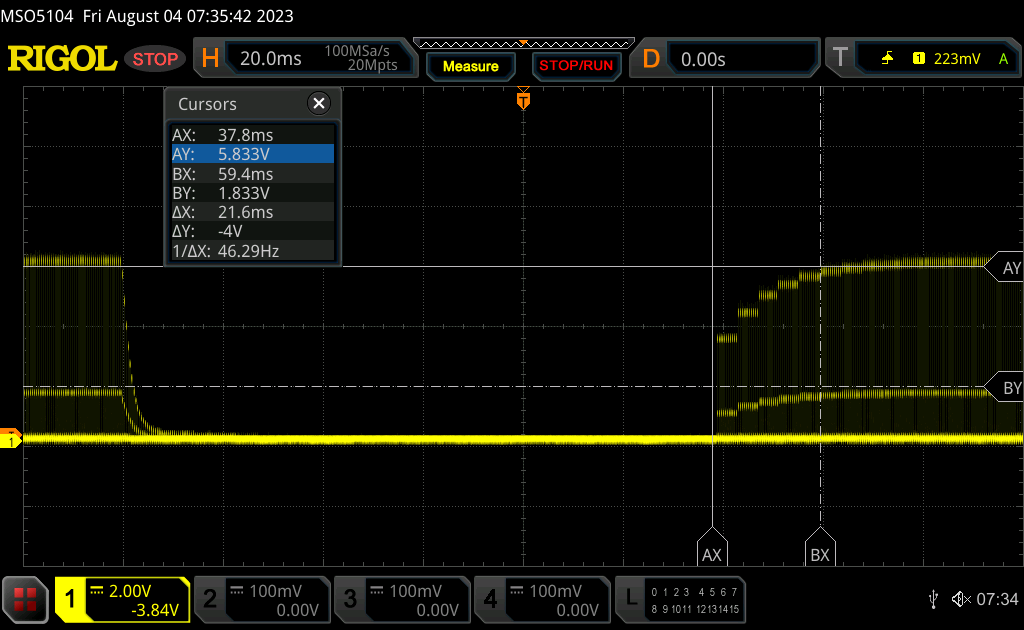 |
| ↘ 6.6 ms chute | ||
| L'écran souffre de latences relativement élevées, insuffisant pour le jeu. En comparaison, tous les appareils testés affichent entre 0.1 (minimum) et 240 (maximum) ms. » 75 % des appareils testés affichent de meilleures performances. Cela signifie que les latences relevées sont moins bonnes que la moyenne (19.8 ms) de tous les appareils testés. | ||
| ↔ Temps de réponse gris 50% à gris 80% | ||
| 26.4 ms ... hausse ↗ et chute ↘ combinées | ↗ 15 ms hausse | 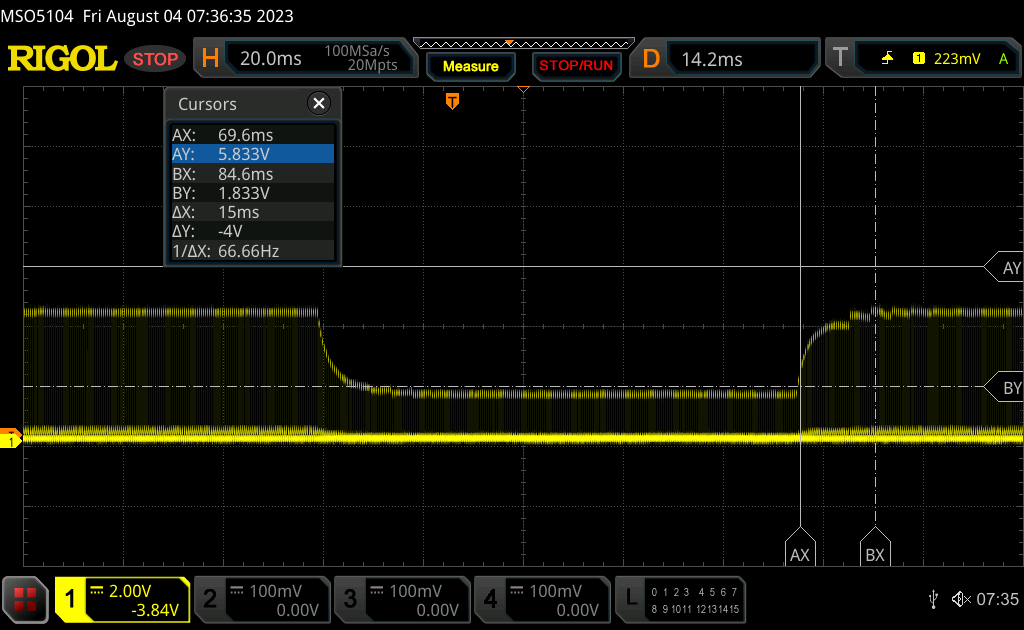 |
| ↘ 11.4 ms chute | ||
| L'écran souffre de latences relativement élevées, insuffisant pour le jeu. En comparaison, tous les appareils testés affichent entre 0.165 (minimum) et 636 (maximum) ms. » 36 % des appareils testés affichent de meilleures performances. Cela signifie que les latences relevées sont meilleures que la moyenne (31 ms) de tous les appareils testés. | ||
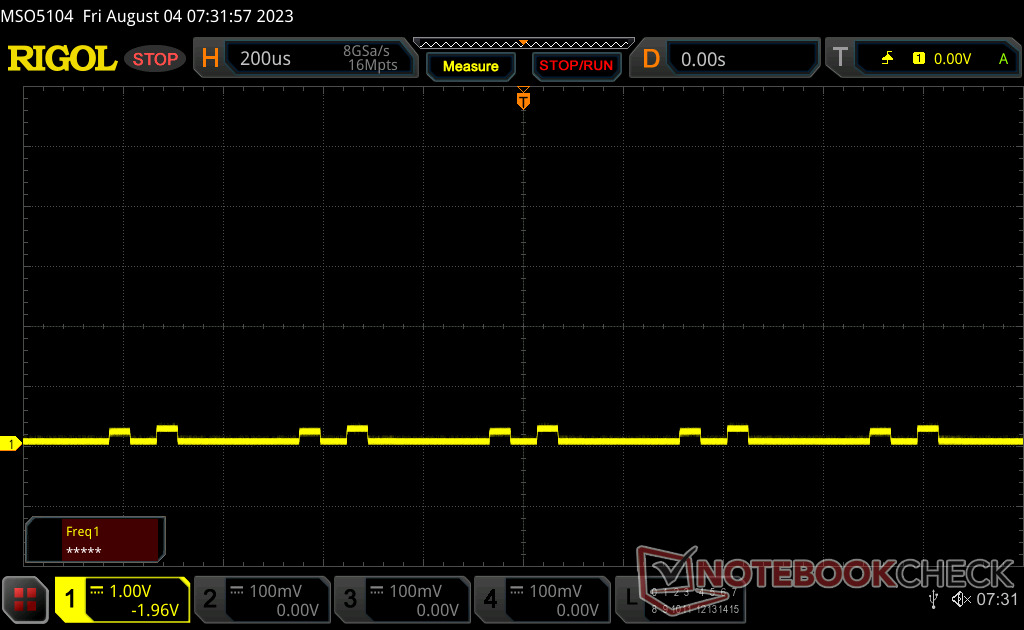
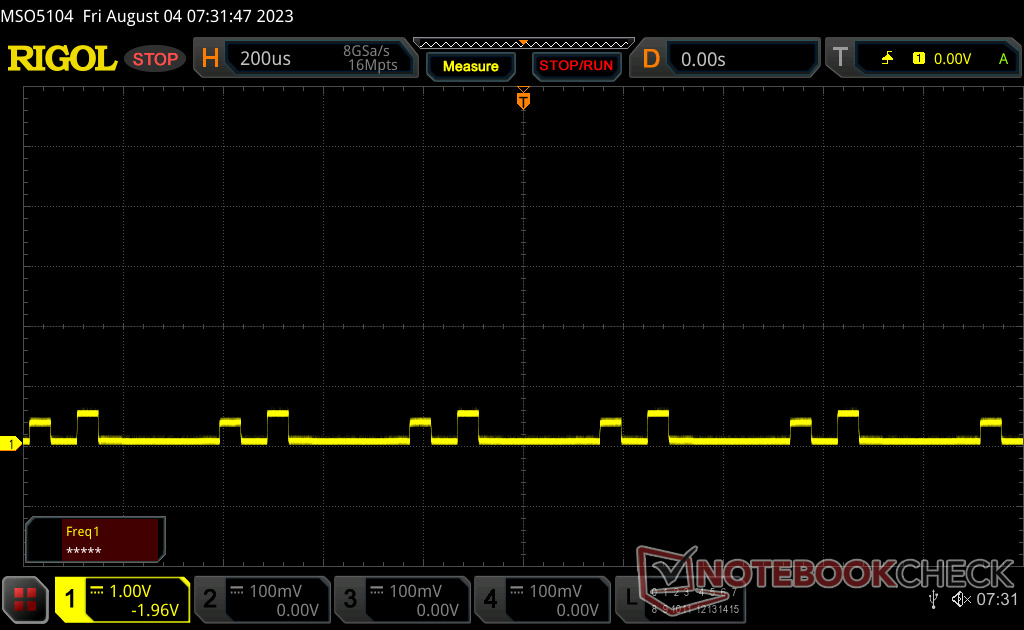
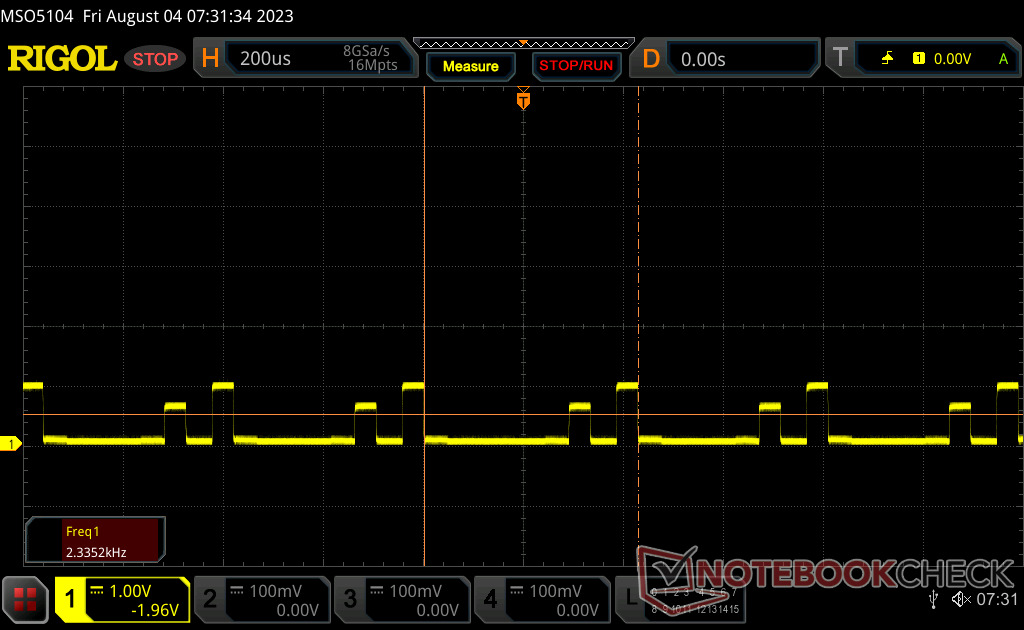
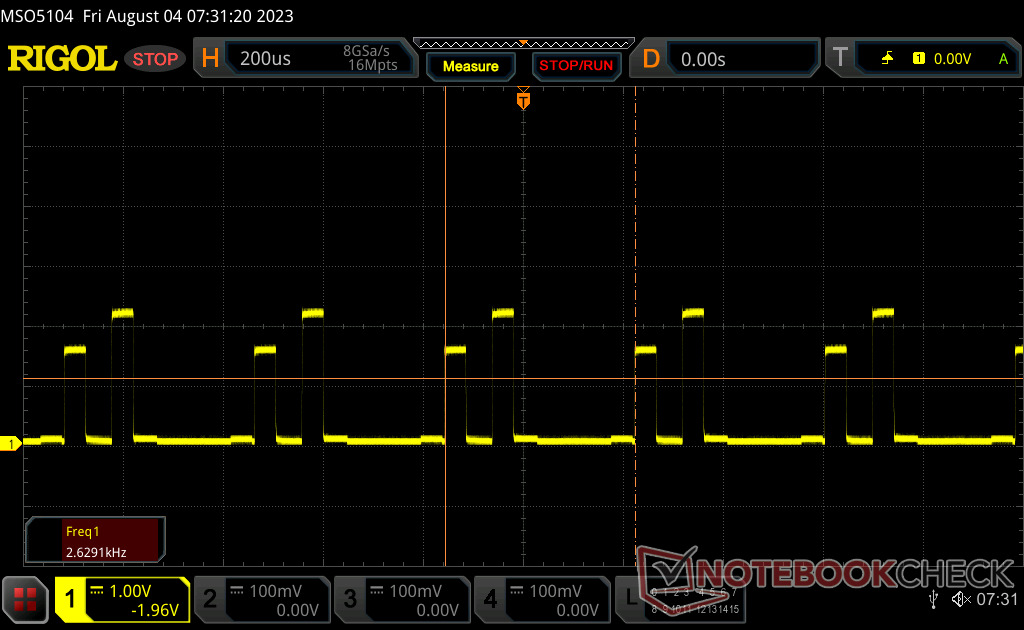
Scintillement / MLI (Modulation de largeur d'impulsion)
| Scintillement / MLI (Modulation de largeur d'impulsion) décelé | 3506 Hz | ≤ 100 Niveau de luminosité | 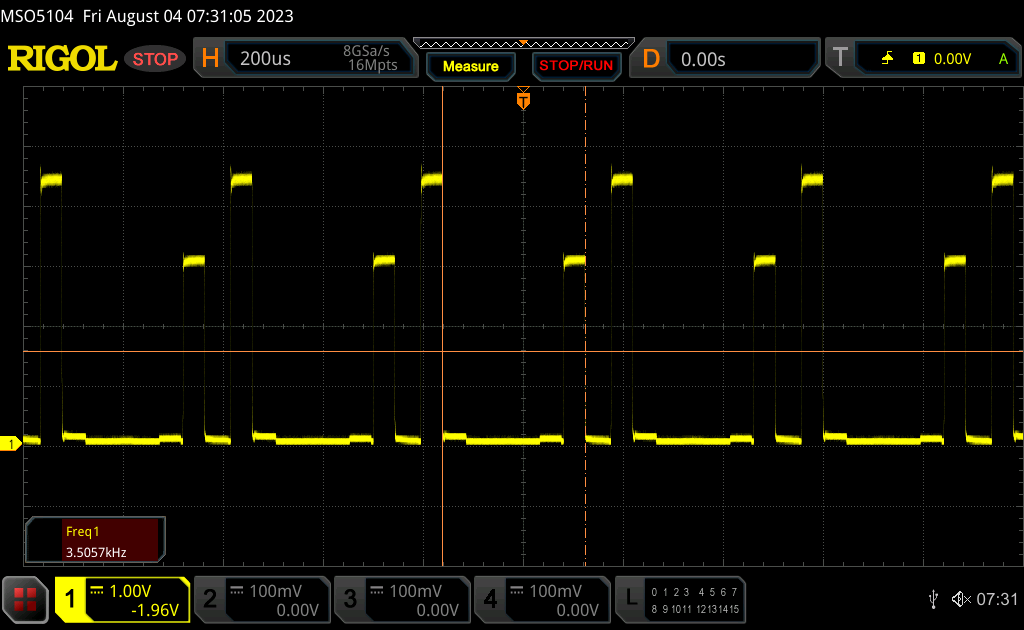 |
Le rétroéclairage de l'écran scintille à la fréquence de 3506 Hz (certainement du fait de l'utilisation d'une MDI - Modulation de largeur d'impulsion) à un niveau de luminosité inférieur ou égal à 100 % . Aucun scintillement ne devrait être perceptible au-dessus de cette valeur. La fréquence de rafraîchissement de 3506 Hz est élevée, la grande majorité des utilisateurs ne devrait pas percevoir de scintillements et être sujette à une fatigue oculaire accrue. En comparaison, 52 % des appareils testés n'emploient pas MDI pour assombrir leur écran. Nous avons relevé une moyenne à 7754 (minimum : 5 - maximum : 343500) Hz dans le cas où une MDI était active. | |||
Le scintillement est présent à tous les niveaux de luminosité. Toutefois, la fréquence relativement élevée de 3506 Hz ne devrait pas poser de problème à la plupart des utilisateurs. Le scintillement a également pour conséquence malheureuse de rendre les temps de réponse plus difficiles à mesurer avec précision.
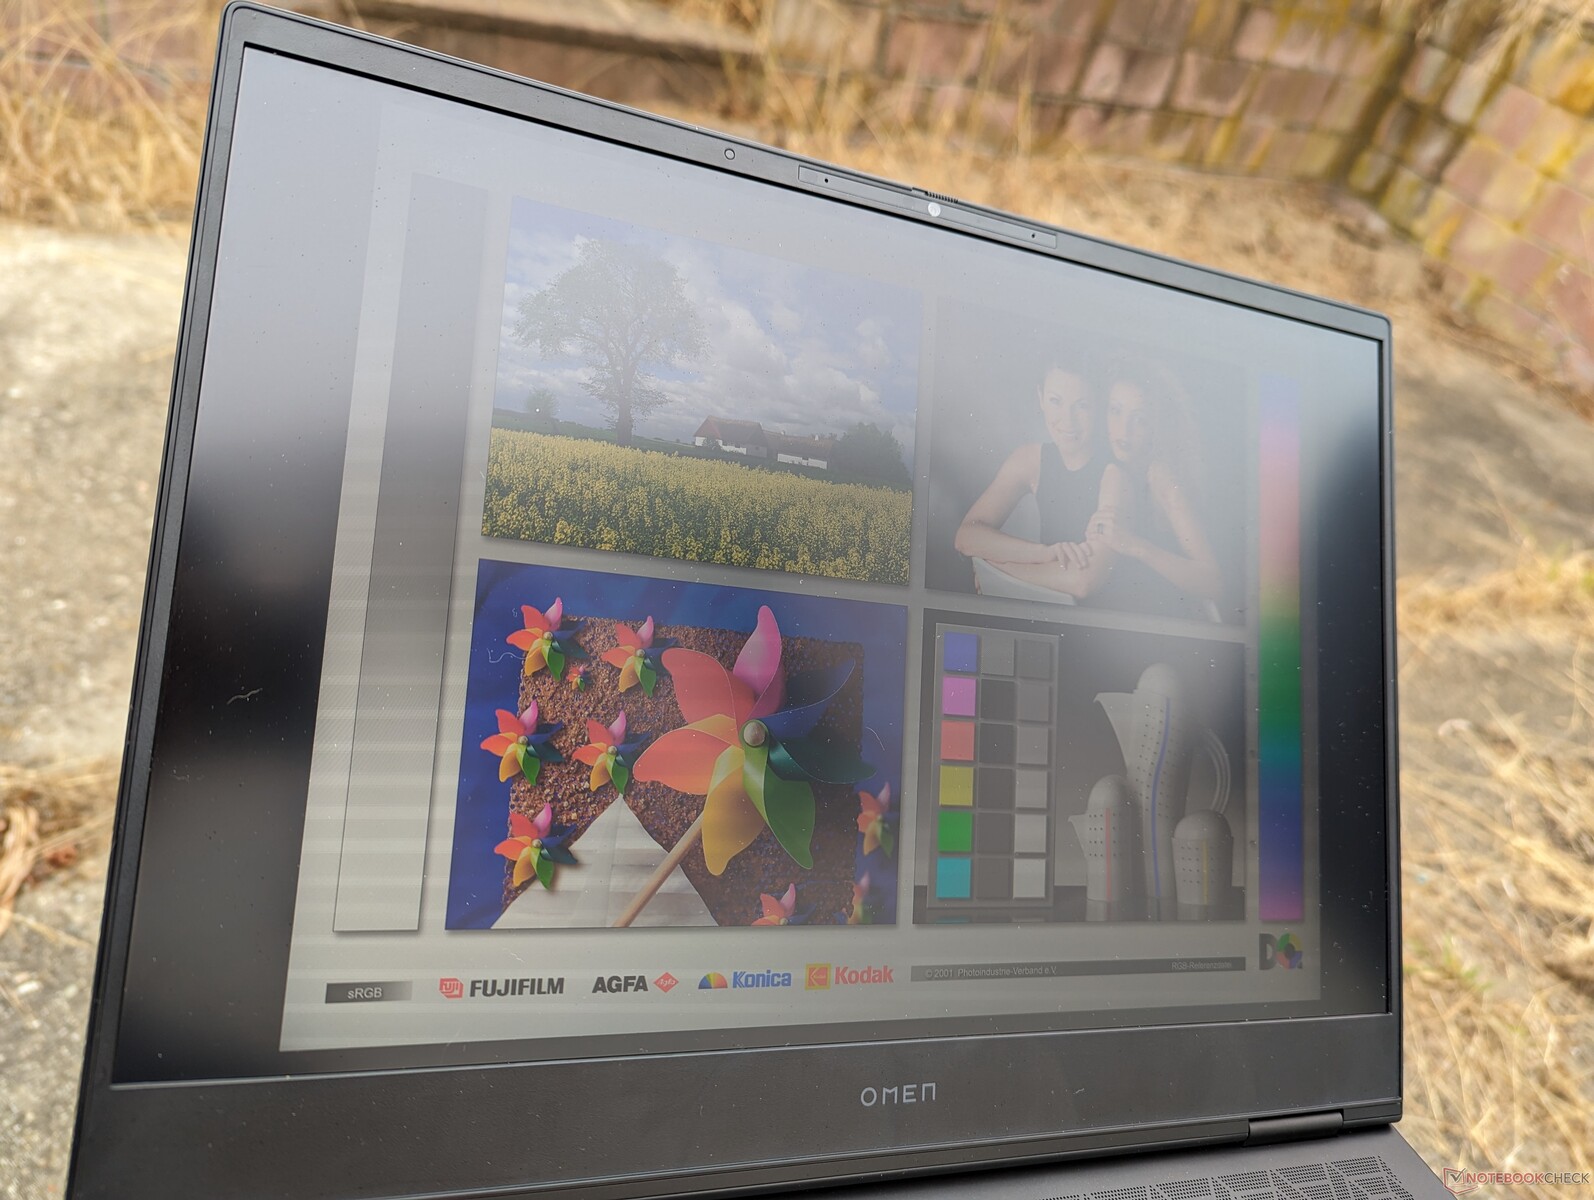
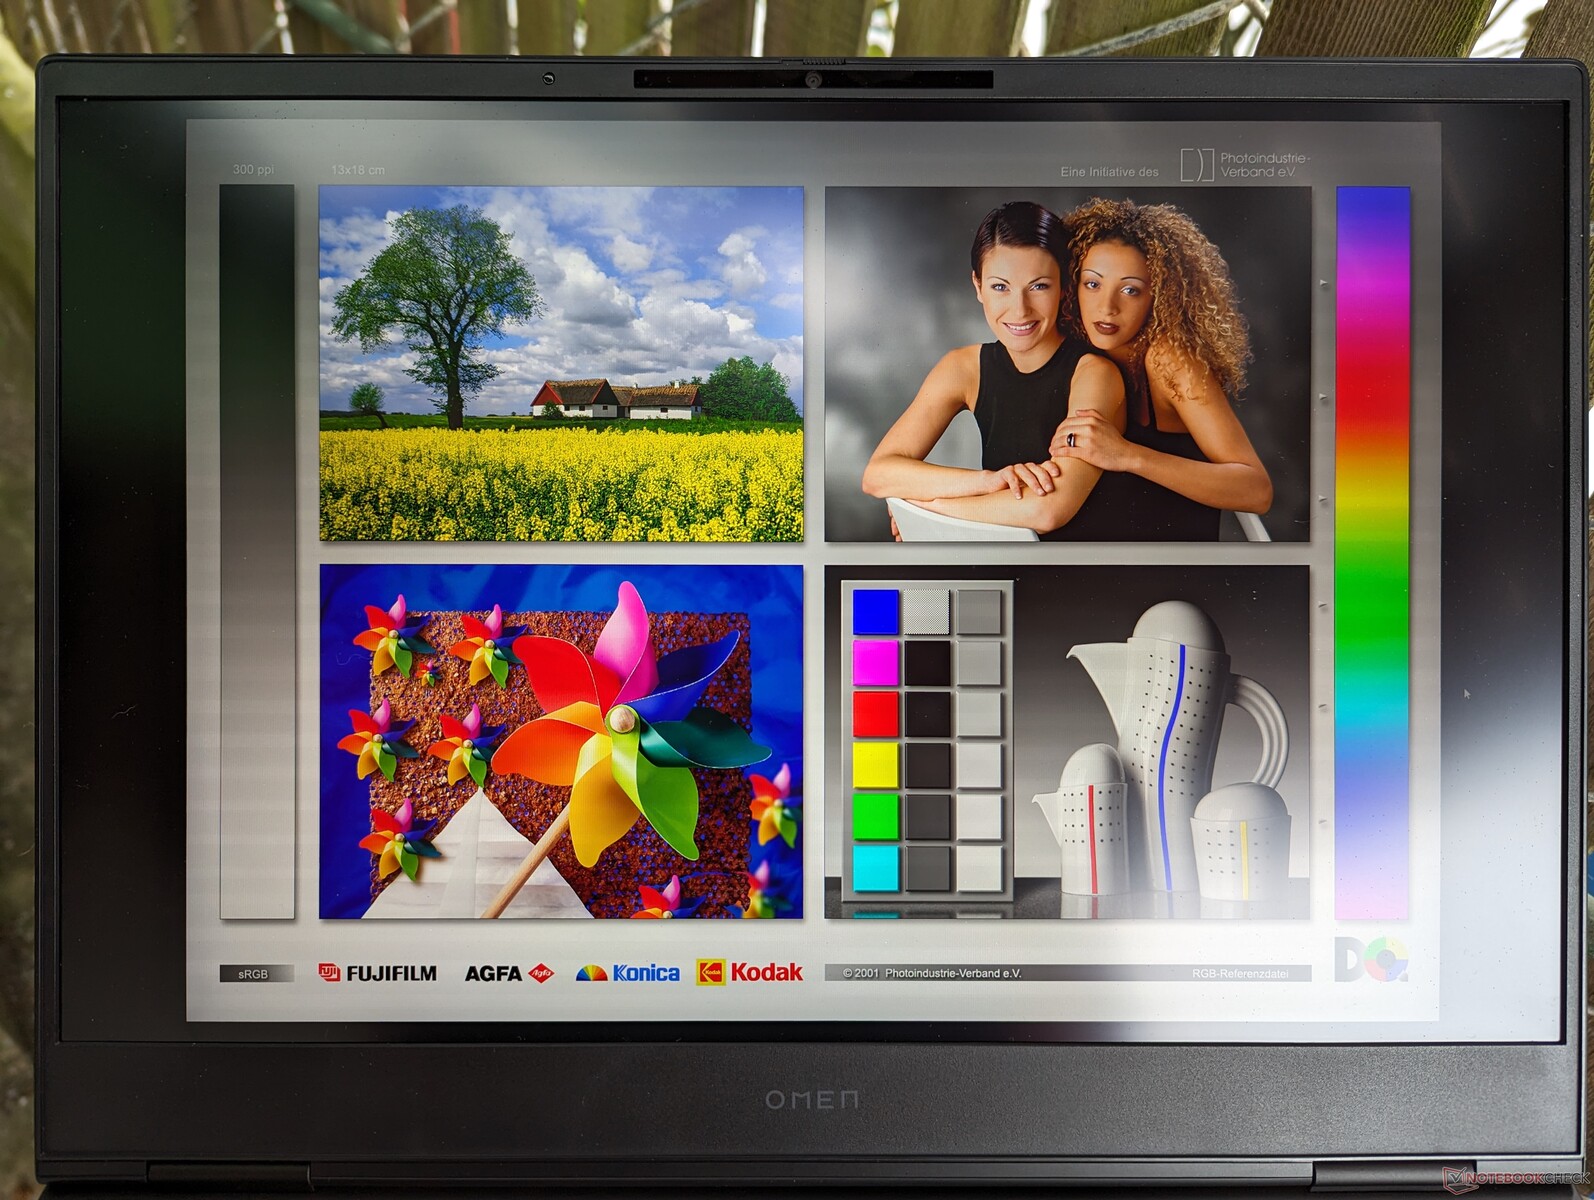
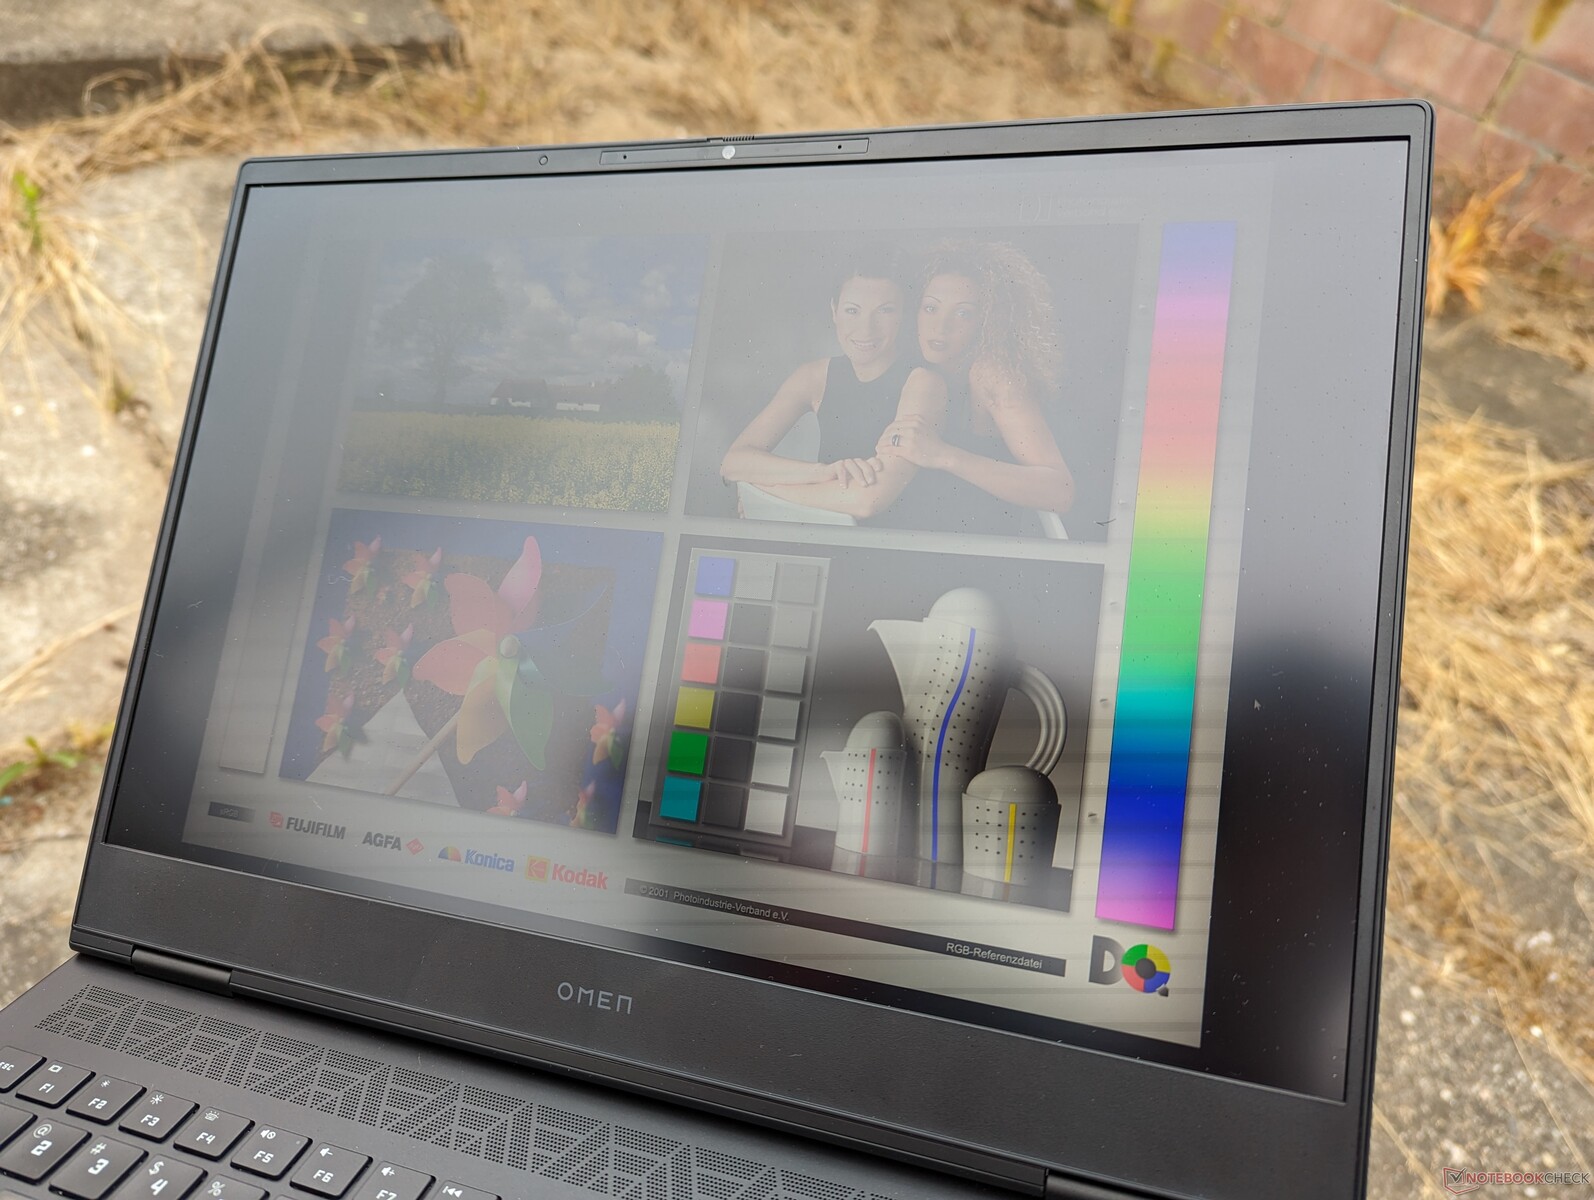
La visibilité extérieure est bonne à l'ombre, mais les couleurs sont délavées dans des conditions plus lumineuses ou en plein soleil. La luminosité maximale d'environ 800 nits peut être maintenue grâce à la batterie.
Performance - Intel Raptor Lake-HX 13e génération
Conditions d'essai
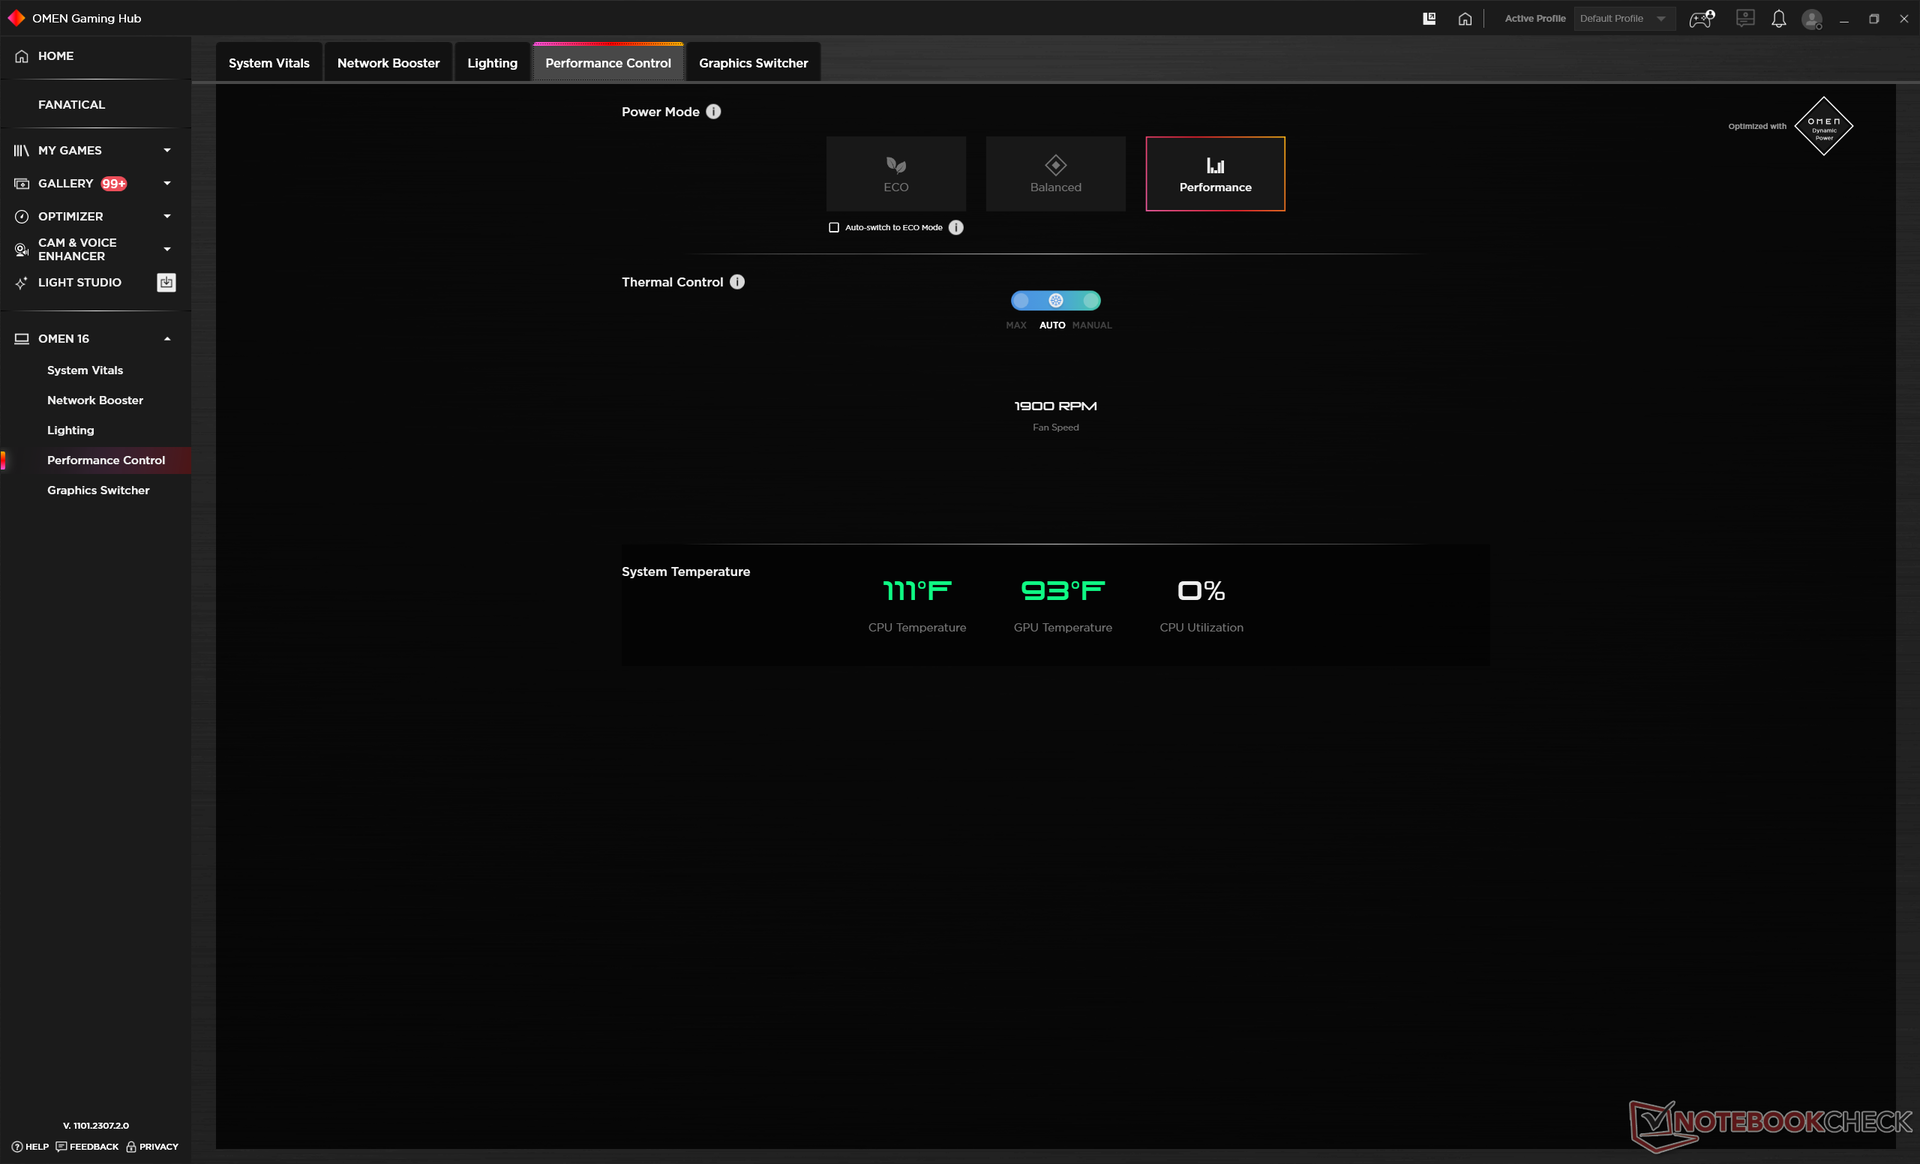
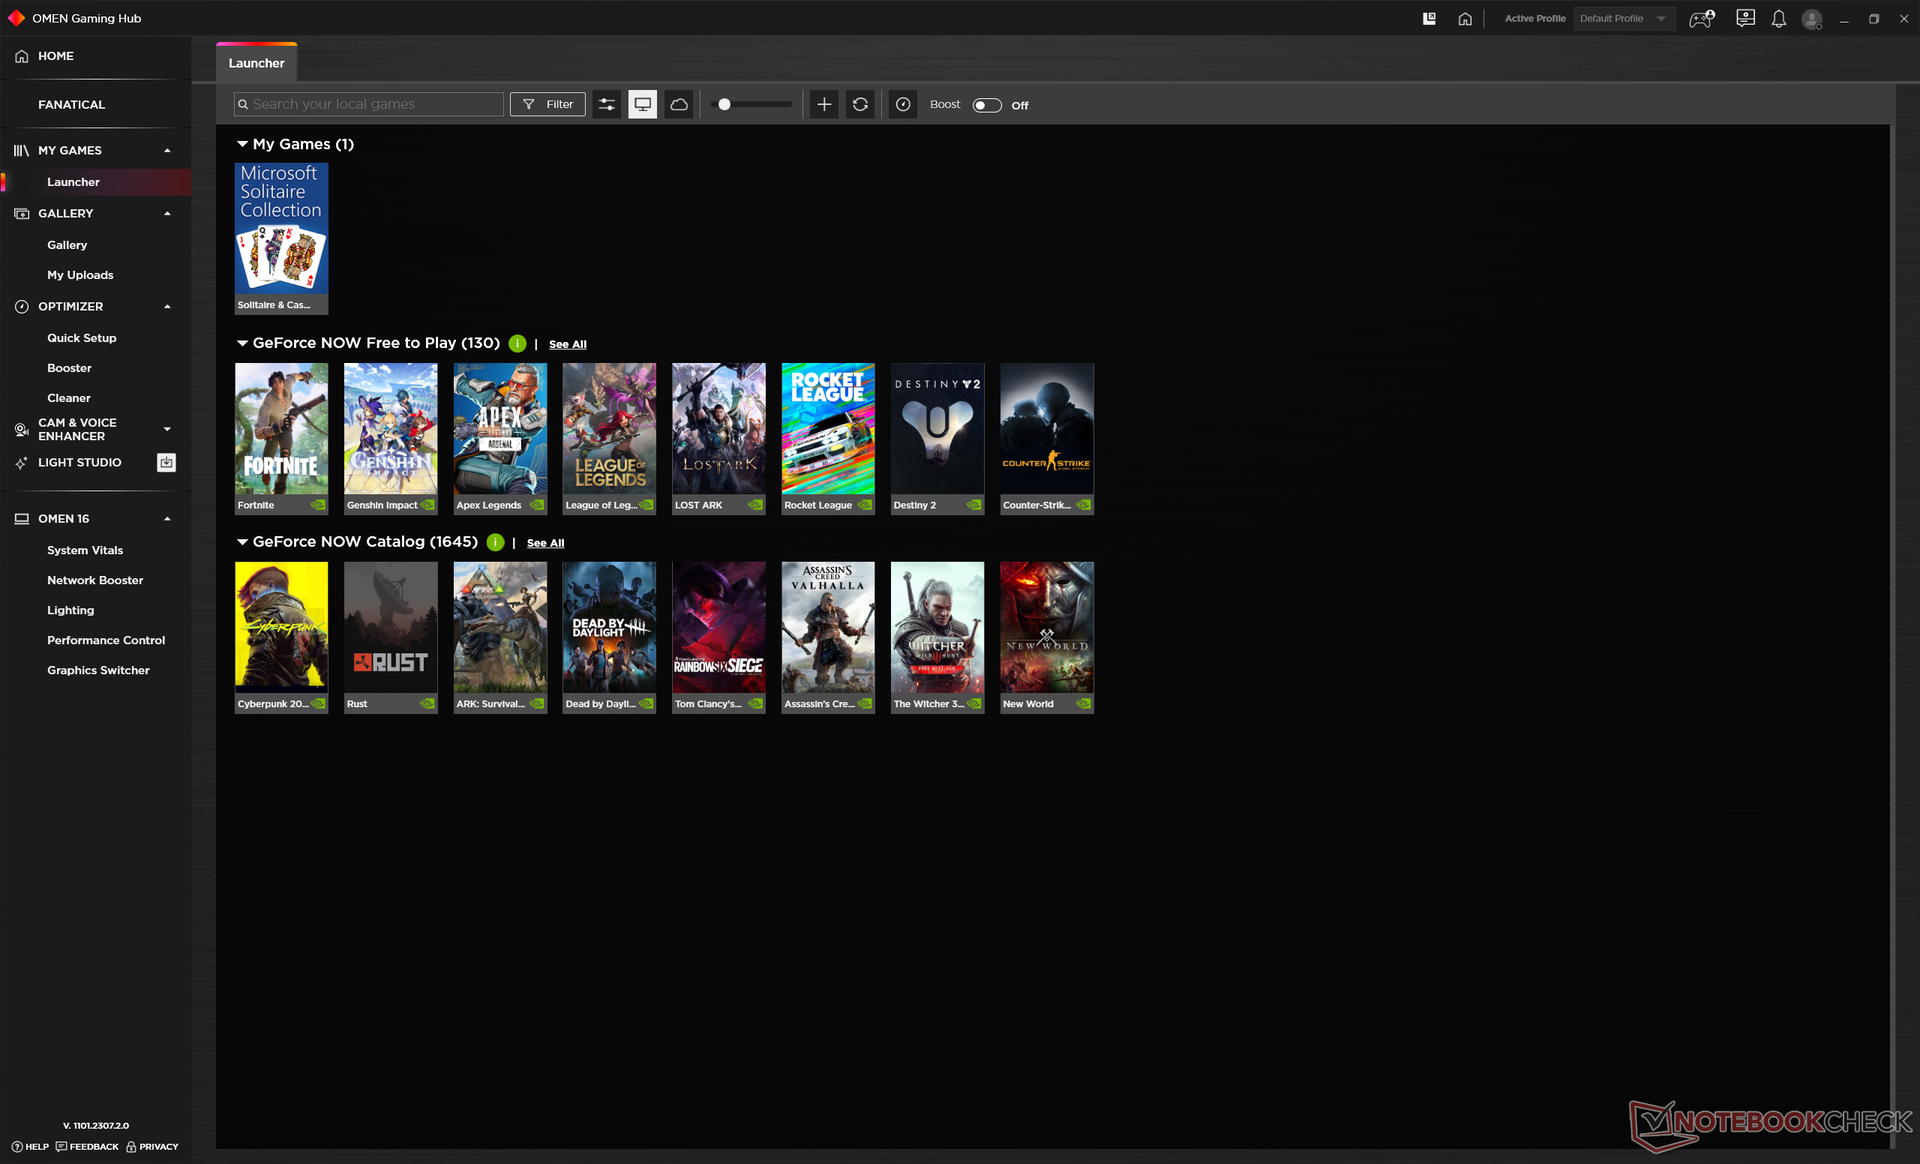
Nous avons réglé notre unité en mode Performance via Windows et à nouveau en mode Performance via le logiciel Omen Gaming Hub avant d'effectuer les tests de référence ci-dessous. Il est ennuyeux de constater que le réglage d'un profil d'alimentation n'entraîne pas automatiquement le réglage de l'autre.
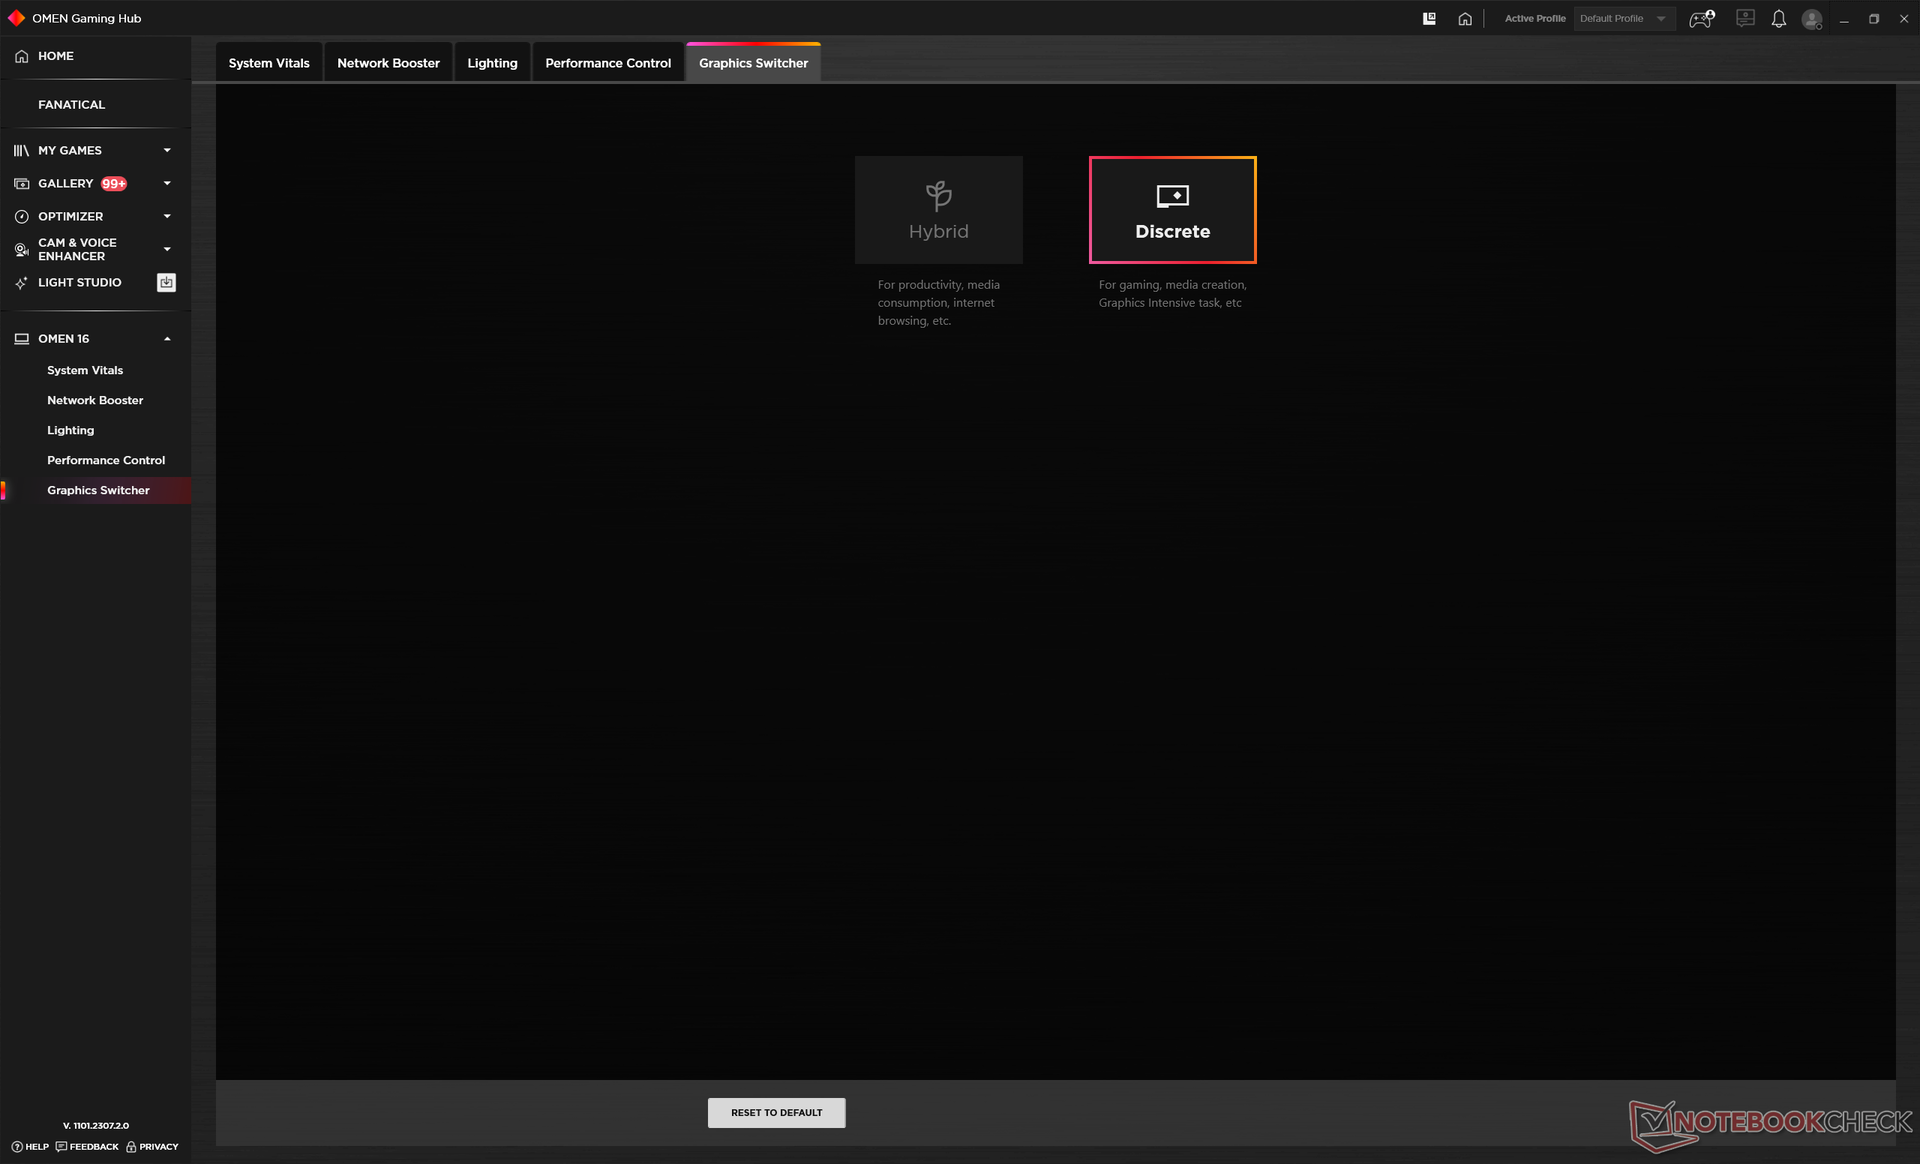
Le commutateur MUX est accessible via Omen Gaming Hub, comme le montrent les captures d'écran ci-dessous. Il est donc fortement recommandé aux propriétaires de se familiariser avec le logiciel, car c'est ici que des fonctions clés sont activées. Les profils de performance sont enfouis dans plusieurs sous-menus, ce qui est un autre aspect ennuyeux du logiciel.
Advanced Optimus ou Optimus 2.0 n'est pas pris en charge. Un redémarrage en douceur est donc nécessaire pour passer de l'iGPU au dGPU. G-Sync est supporté sur l'écran interne.

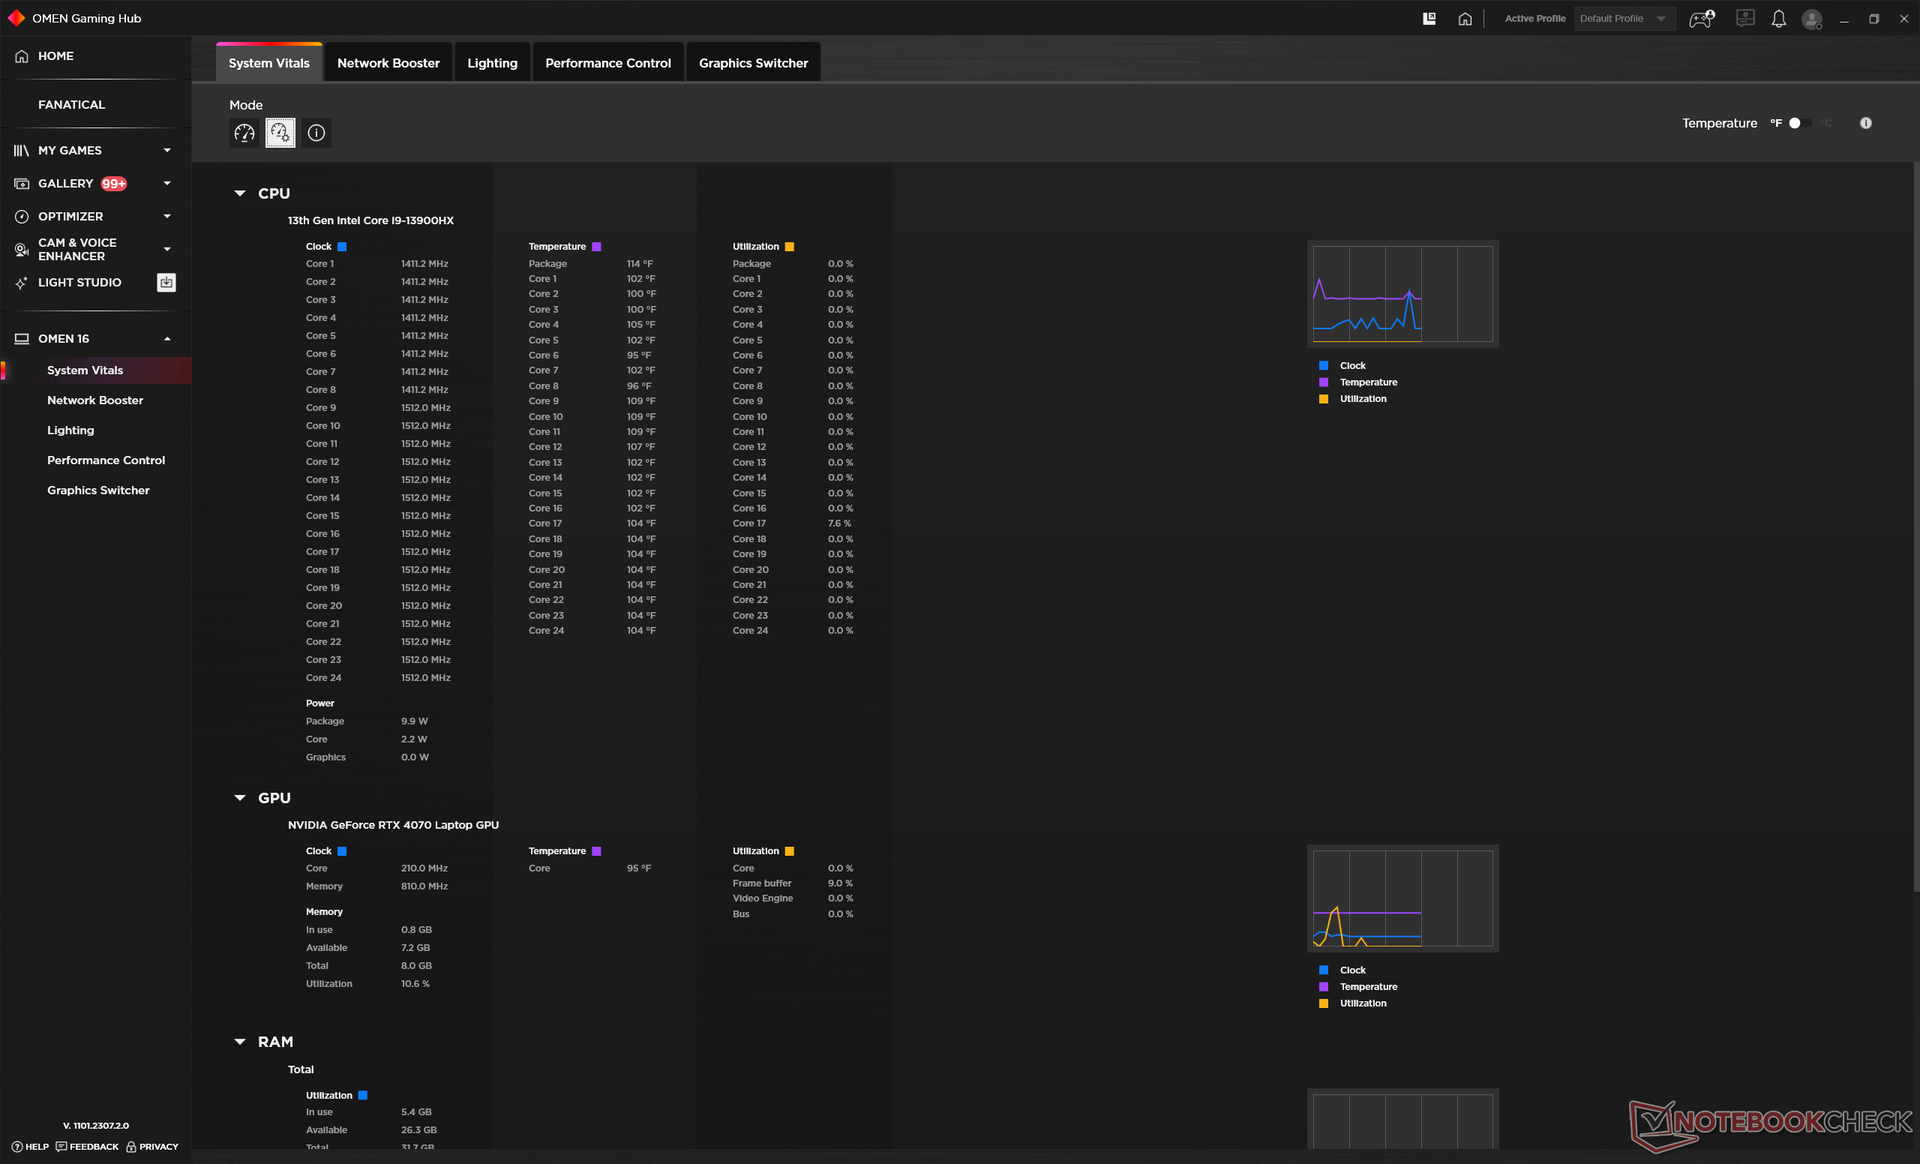
Processeur
LeCore i9-13900HX de l'Omen Transcend 16 est 5 à 10 % plus lent que la moyenne des ordinateurs portables de notre base de données équipés du même processeur. Un exemple extrême est le Lenovo Legion Pro 7 qui peut être jusqu'à 20 % plus rapide que notre HP bien qu'ils soient tous deux équipés du Core i9-13900HX. Notre Omen Transcend 16 reste l'un des ordinateurs portables de jeu les plus rapides du marché, mais les performances du processeur auraient certainement pu être un peu plus rapides si l'on se réfère à notre expérience avec d'autres modèles de jeu haut de gamme.
La stabilité des performances est par ailleurs excellente, sans problème majeur d'étranglement lors de l'exécution en boucle de CineBench R15 xT.
Cinebench R15 Multi Loop
Cinebench R23: Multi Core | Single Core
Cinebench R20: CPU (Multi Core) | CPU (Single Core)
Cinebench R15: CPU Multi 64Bit | CPU Single 64Bit
Blender: v2.79 BMW27 CPU
7-Zip 18.03: 7z b 4 | 7z b 4 -mmt1
Geekbench 5.5: Multi-Core | Single-Core
HWBOT x265 Benchmark v2.2: 4k Preset
LibreOffice : 20 Documents To PDF
R Benchmark 2.5: Overall mean
| CPU Performance rating | |
| Asus Zephyrus Duo 16 GX650PY-NM006W | |
| Moyenne Intel Core i9-13900HX | |
| HP Omen Transcend 16 | |
| Lenovo Legion Slim 7i 16 Gen 8 -1! | |
| Alienware x16 R1 -1! | |
| Lenovo Legion Pro 5 16ARX8 | |
| HP Omen 16-wf000 -1! | |
| Asus ROG Zephyrus M16 GU603Z | |
| Lenovo Legion S7 16ARHA7 | |
| Acer Nitro 16 AN16-41 | |
| HP Omen 16-n0033dx | |
| Dell Inspiron 16 Plus 7610-MHJ8F | |
| Blender / v2.79 BMW27 CPU | |
| Dell Inspiron 16 Plus 7610-MHJ8F | |
| HP Omen 16-n0033dx | |
| Acer Nitro 16 AN16-41 | |
| Lenovo Legion S7 16ARHA7 | |
| Asus ROG Zephyrus M16 GU603Z | |
| Lenovo Legion Pro 5 16ARX8 | |
| HP Omen Transcend 16 | |
| Moyenne Intel Core i9-13900HX (101 - 153, n=22) | |
| Asus Zephyrus Duo 16 GX650PY-NM006W | |
* ... Moindre est la valeur, meilleures sont les performances
AIDA64: FP32 Ray-Trace | FPU Julia | CPU SHA3 | CPU Queen | FPU SinJulia | FPU Mandel | CPU AES | CPU ZLib | FP64 Ray-Trace | CPU PhotoWorxx
| Performance rating | |
| Moyenne Intel Core i9-13900HX | |
| HP Omen Transcend 16 | |
| Alienware x16 R1 | |
| HP Omen 16-wf000 | |
| Lenovo Legion Slim 7i 16 Gen 8 | |
| Acer Nitro 16 AN16-41 | |
| Asus ROG Zephyrus M16 GU603Z | |
| AIDA64 / FP32 Ray-Trace | |
| Moyenne Intel Core i9-13900HX (17589 - 27615, n=22) | |
| HP Omen Transcend 16 | |
| HP Omen 16-wf000 | |
| Alienware x16 R1 | |
| Lenovo Legion Slim 7i 16 Gen 8 | |
| Acer Nitro 16 AN16-41 | |
| Asus ROG Zephyrus M16 GU603Z | |
| AIDA64 / FPU Julia | |
| Moyenne Intel Core i9-13900HX (88686 - 137015, n=22) | |
| HP Omen Transcend 16 | |
| Acer Nitro 16 AN16-41 | |
| HP Omen 16-wf000 | |
| Alienware x16 R1 | |
| Lenovo Legion Slim 7i 16 Gen 8 | |
| Asus ROG Zephyrus M16 GU603Z | |
| AIDA64 / CPU SHA3 | |
| Moyenne Intel Core i9-13900HX (4362 - 7029, n=22) | |
| HP Omen Transcend 16 | |
| HP Omen 16-wf000 | |
| Alienware x16 R1 | |
| Lenovo Legion Slim 7i 16 Gen 8 | |
| Asus ROG Zephyrus M16 GU603Z | |
| Acer Nitro 16 AN16-41 | |
| AIDA64 / CPU Queen | |
| Moyenne Intel Core i9-13900HX (125644 - 141385, n=22) | |
| HP Omen Transcend 16 | |
| Lenovo Legion Slim 7i 16 Gen 8 | |
| Alienware x16 R1 | |
| Acer Nitro 16 AN16-41 | |
| Asus ROG Zephyrus M16 GU603Z | |
| HP Omen 16-wf000 | |
| AIDA64 / FPU SinJulia | |
| Moyenne Intel Core i9-13900HX (12334 - 17179, n=22) | |
| HP Omen Transcend 16 | |
| Acer Nitro 16 AN16-41 | |
| HP Omen 16-wf000 | |
| Alienware x16 R1 | |
| Lenovo Legion Slim 7i 16 Gen 8 | |
| Asus ROG Zephyrus M16 GU603Z | |
| AIDA64 / FPU Mandel | |
| Moyenne Intel Core i9-13900HX (43850 - 69202, n=22) | |
| HP Omen Transcend 16 | |
| Acer Nitro 16 AN16-41 | |
| HP Omen 16-wf000 | |
| Alienware x16 R1 | |
| Lenovo Legion Slim 7i 16 Gen 8 | |
| Asus ROG Zephyrus M16 GU603Z | |
| AIDA64 / CPU AES | |
| Moyenne Intel Core i9-13900HX (89413 - 237881, n=22) | |
| Asus ROG Zephyrus M16 GU603Z | |
| HP Omen Transcend 16 | |
| HP Omen 16-wf000 | |
| Alienware x16 R1 | |
| Lenovo Legion Slim 7i 16 Gen 8 | |
| Acer Nitro 16 AN16-41 | |
| AIDA64 / CPU ZLib | |
| Moyenne Intel Core i9-13900HX (1284 - 1958, n=22) | |
| HP Omen Transcend 16 | |
| HP Omen 16-wf000 | |
| Lenovo Legion Slim 7i 16 Gen 8 | |
| Alienware x16 R1 | |
| Asus ROG Zephyrus M16 GU603Z | |
| Acer Nitro 16 AN16-41 | |
| AIDA64 / FP64 Ray-Trace | |
| Moyenne Intel Core i9-13900HX (9481 - 15279, n=22) | |
| HP Omen Transcend 16 | |
| HP Omen 16-wf000 | |
| Alienware x16 R1 | |
| Lenovo Legion Slim 7i 16 Gen 8 | |
| Acer Nitro 16 AN16-41 | |
| Asus ROG Zephyrus M16 GU603Z | |
| AIDA64 / CPU PhotoWorxx | |
| HP Omen Transcend 16 | |
| Alienware x16 R1 | |
| Moyenne Intel Core i9-13900HX (42994 - 51994, n=22) | |
| Asus ROG Zephyrus M16 GU603Z | |
| HP Omen 16-wf000 | |
| Acer Nitro 16 AN16-41 | |
| Lenovo Legion Slim 7i 16 Gen 8 | |
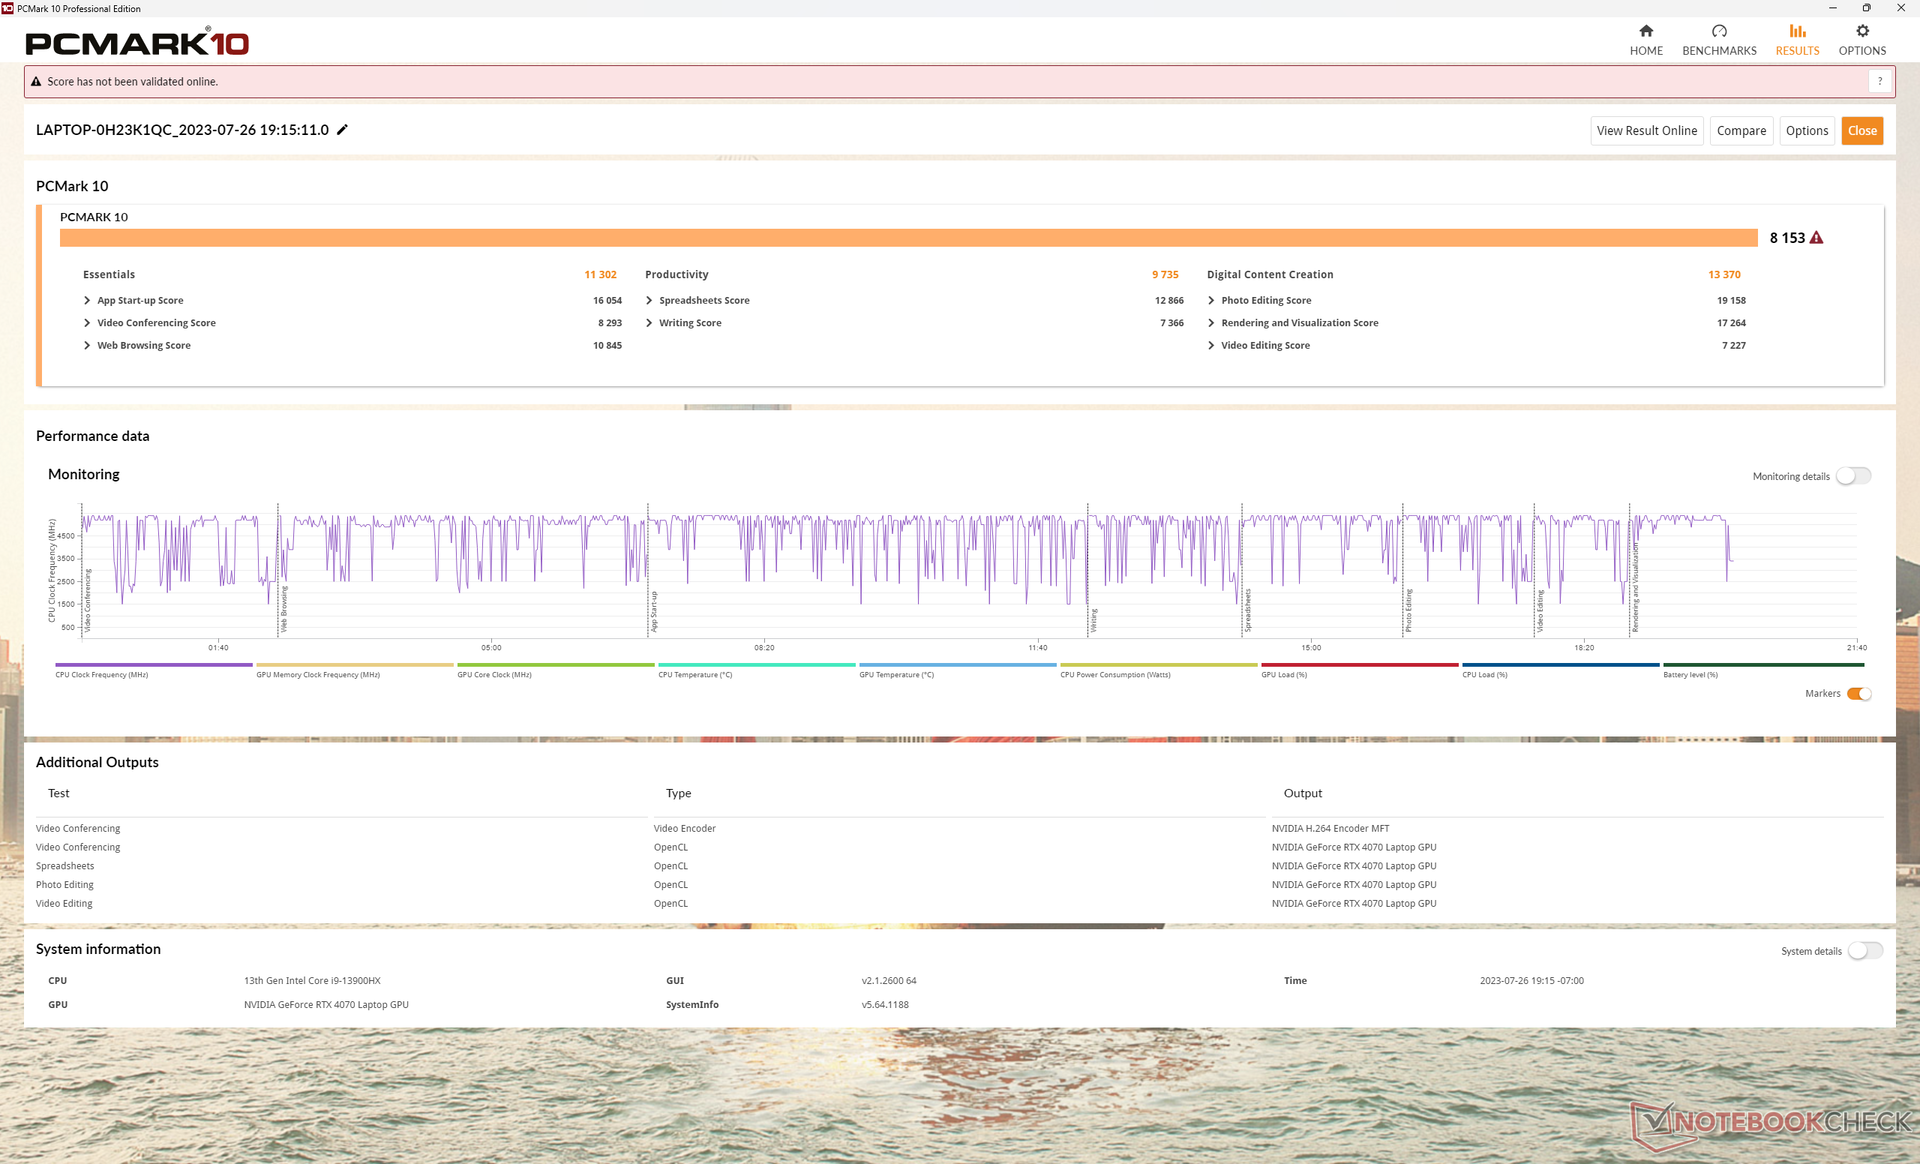
Performance du système
Les résultats de PCMark sont légèrement supérieurs à ceux de l'Omen 16 équipé de la RTX 4080, à l'exception de la création de contenu numérique, en raison de la lenteur de notre RTX 4070. Nous n'avons pas eu de problèmes de réveil ou de BSODs contrairement à notre récente carte de crédit Lenovo Slim Pro 9i 16.
CrossMark: Overall | Productivity | Creativity | Responsiveness
| PCMark 10 / Score | |
| Lenovo Legion Slim 7i 16 Gen 8 | |
| Alienware x16 R1 | |
| HP Omen Transcend 16 | |
| Asus ROG Zephyrus M16 GU603Z | |
| HP Omen 16-wf000 | |
| Moyenne Intel Core i9-13900HX, NVIDIA GeForce RTX 4070 Laptop GPU (6956 - 8153, n=3) | |
| Acer Nitro 16 AN16-41 | |
| PCMark 10 / Essentials | |
| Lenovo Legion Slim 7i 16 Gen 8 | |
| HP Omen Transcend 16 | |
| Alienware x16 R1 | |
| Moyenne Intel Core i9-13900HX, NVIDIA GeForce RTX 4070 Laptop GPU (9865 - 11653, n=3) | |
| Asus ROG Zephyrus M16 GU603Z | |
| Acer Nitro 16 AN16-41 | |
| HP Omen 16-wf000 | |
| PCMark 10 / Productivity | |
| Lenovo Legion Slim 7i 16 Gen 8 | |
| Asus ROG Zephyrus M16 GU603Z | |
| Alienware x16 R1 | |
| HP Omen Transcend 16 | |
| Moyenne Intel Core i9-13900HX, NVIDIA GeForce RTX 4070 Laptop GPU (9470 - 9850, n=3) | |
| Acer Nitro 16 AN16-41 | |
| HP Omen 16-wf000 | |
| PCMark 10 / Digital Content Creation | |
| Alienware x16 R1 | |
| Lenovo Legion Slim 7i 16 Gen 8 | |
| HP Omen 16-wf000 | |
| HP Omen Transcend 16 | |
| Asus ROG Zephyrus M16 GU603Z | |
| Moyenne Intel Core i9-13900HX, NVIDIA GeForce RTX 4070 Laptop GPU (9776 - 13370, n=3) | |
| Acer Nitro 16 AN16-41 | |
| CrossMark / Overall | |
| Lenovo Legion Slim 7i 16 Gen 8 | |
| HP Omen Transcend 16 | |
| Moyenne Intel Core i9-13900HX, NVIDIA GeForce RTX 4070 Laptop GPU (1842 - 2029, n=3) | |
| Alienware x16 R1 | |
| Asus ROG Zephyrus M16 GU603Z | |
| HP Omen 16-wf000 | |
| Acer Nitro 16 AN16-41 | |
| CrossMark / Productivity | |
| Lenovo Legion Slim 7i 16 Gen 8 | |
| Alienware x16 R1 | |
| HP Omen Transcend 16 | |
| Asus ROG Zephyrus M16 GU603Z | |
| Moyenne Intel Core i9-13900HX, NVIDIA GeForce RTX 4070 Laptop GPU (1700 - 1872, n=3) | |
| HP Omen 16-wf000 | |
| Acer Nitro 16 AN16-41 | |
| CrossMark / Creativity | |
| HP Omen Transcend 16 | |
| Moyenne Intel Core i9-13900HX, NVIDIA GeForce RTX 4070 Laptop GPU (2088 - 2316, n=3) | |
| Lenovo Legion Slim 7i 16 Gen 8 | |
| Alienware x16 R1 | |
| Asus ROG Zephyrus M16 GU603Z | |
| HP Omen 16-wf000 | |
| Acer Nitro 16 AN16-41 | |
| CrossMark / Responsiveness | |
| Alienware x16 R1 | |
| Lenovo Legion Slim 7i 16 Gen 8 | |
| Asus ROG Zephyrus M16 GU603Z | |
| Moyenne Intel Core i9-13900HX, NVIDIA GeForce RTX 4070 Laptop GPU (1557 - 1752, n=3) | |
| HP Omen Transcend 16 | |
| HP Omen 16-wf000 | |
| Acer Nitro 16 AN16-41 | |
| PCMark 10 Score | 8153 points | |
Aide | ||
| AIDA64 / Memory Copy | |
| HP Omen Transcend 16 | |
| Moyenne Intel Core i9-13900HX (67716 - 79193, n=22) | |
| Alienware x16 R1 | |
| HP Omen 16-wf000 | |
| Asus ROG Zephyrus M16 GU603Z | |
| Acer Nitro 16 AN16-41 | |
| Lenovo Legion Slim 7i 16 Gen 8 | |
| AIDA64 / Memory Read | |
| HP Omen Transcend 16 | |
| Moyenne Intel Core i9-13900HX (73998 - 88462, n=22) | |
| Alienware x16 R1 | |
| HP Omen 16-wf000 | |
| Asus ROG Zephyrus M16 GU603Z | |
| Acer Nitro 16 AN16-41 | |
| Lenovo Legion Slim 7i 16 Gen 8 | |
| AIDA64 / Memory Write | |
| Alienware x16 R1 | |
| HP Omen Transcend 16 | |
| Moyenne Intel Core i9-13900HX (65472 - 77045, n=22) | |
| HP Omen 16-wf000 | |
| Asus ROG Zephyrus M16 GU603Z | |
| Acer Nitro 16 AN16-41 | |
| Lenovo Legion Slim 7i 16 Gen 8 | |
| AIDA64 / Memory Latency | |
| Alienware x16 R1 | |
| Acer Nitro 16 AN16-41 | |
| Asus ROG Zephyrus M16 GU603Z | |
| HP Omen Transcend 16 | |
| HP Omen 16-wf000 | |
| Moyenne Intel Core i9-13900HX (75.3 - 91.1, n=22) | |
| Lenovo Legion Slim 7i 16 Gen 8 | |
* ... Moindre est la valeur, meilleures sont les performances
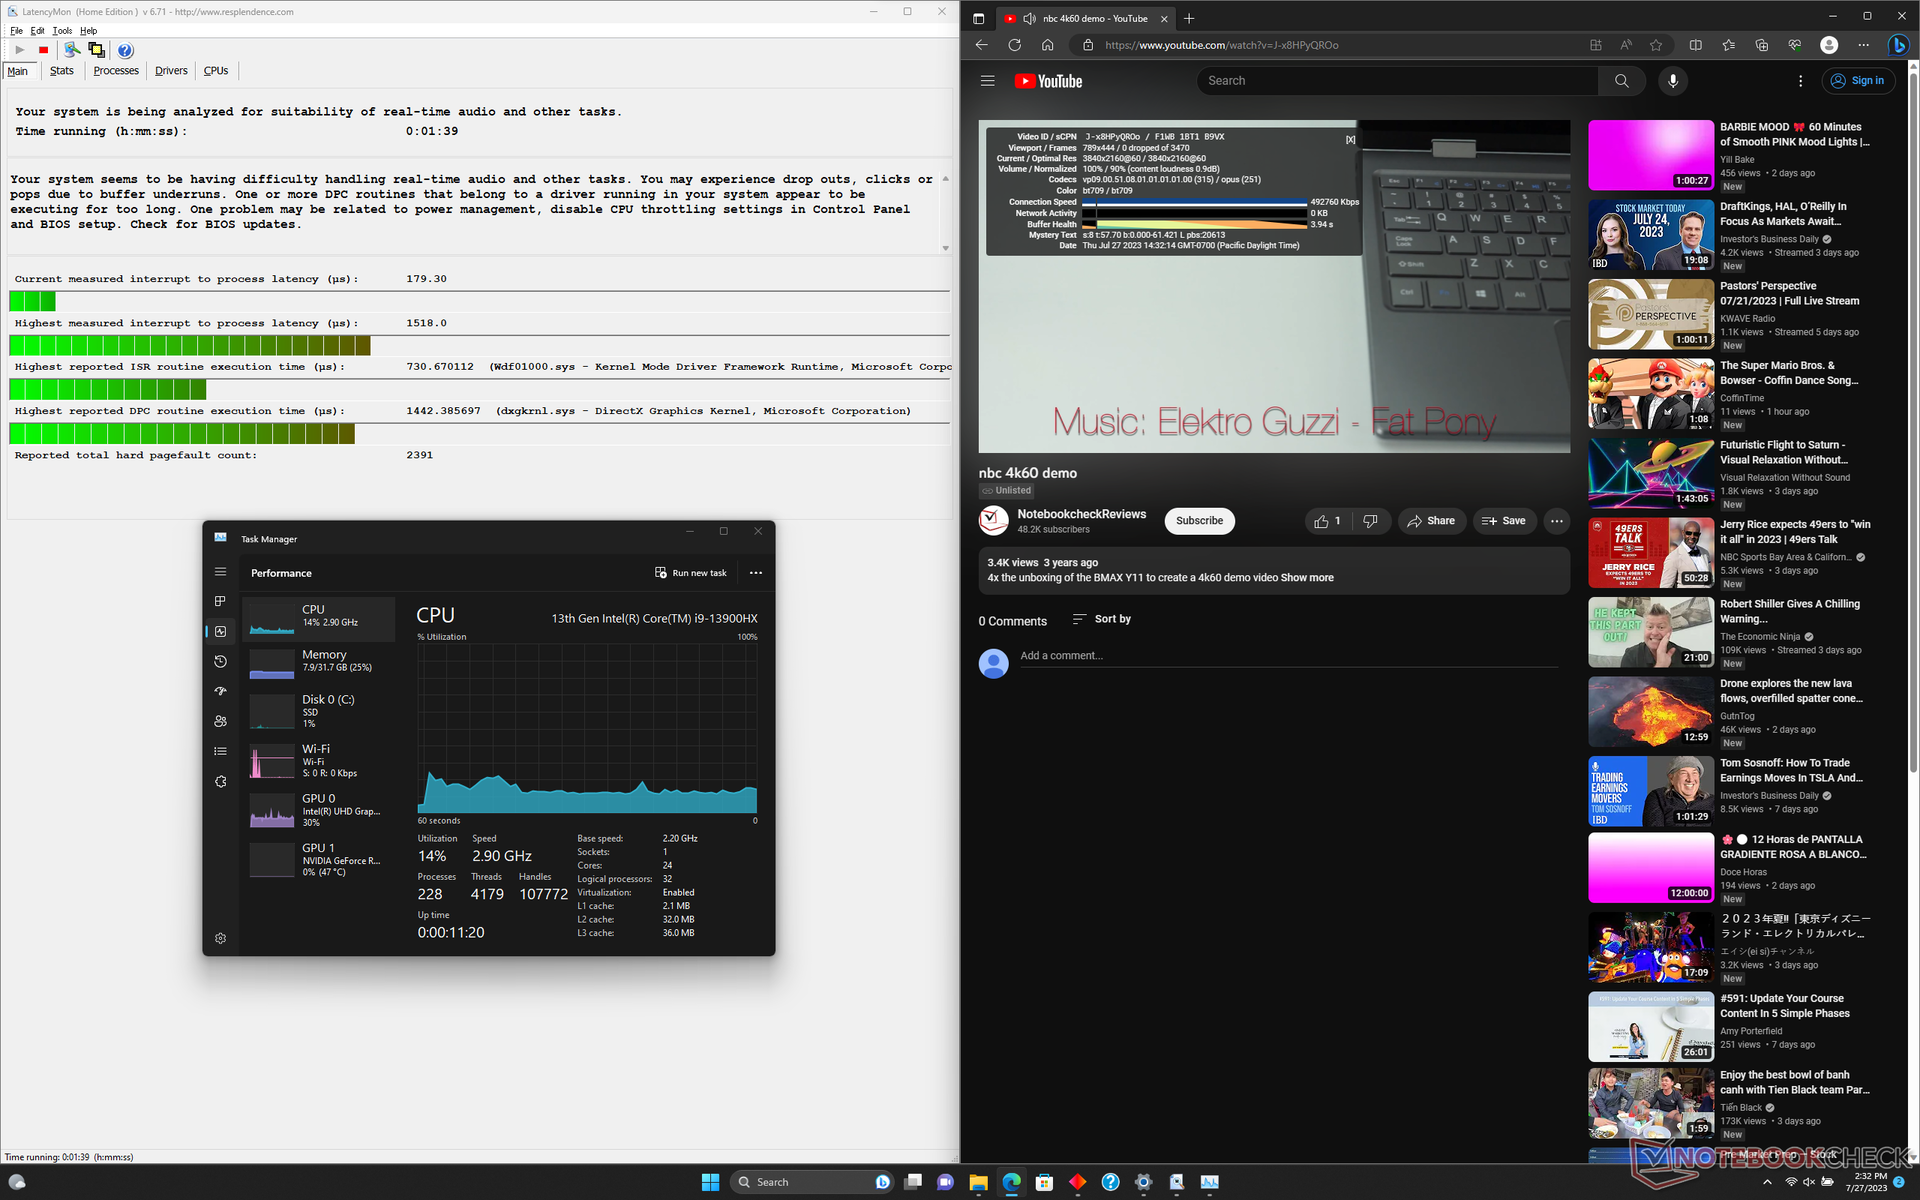
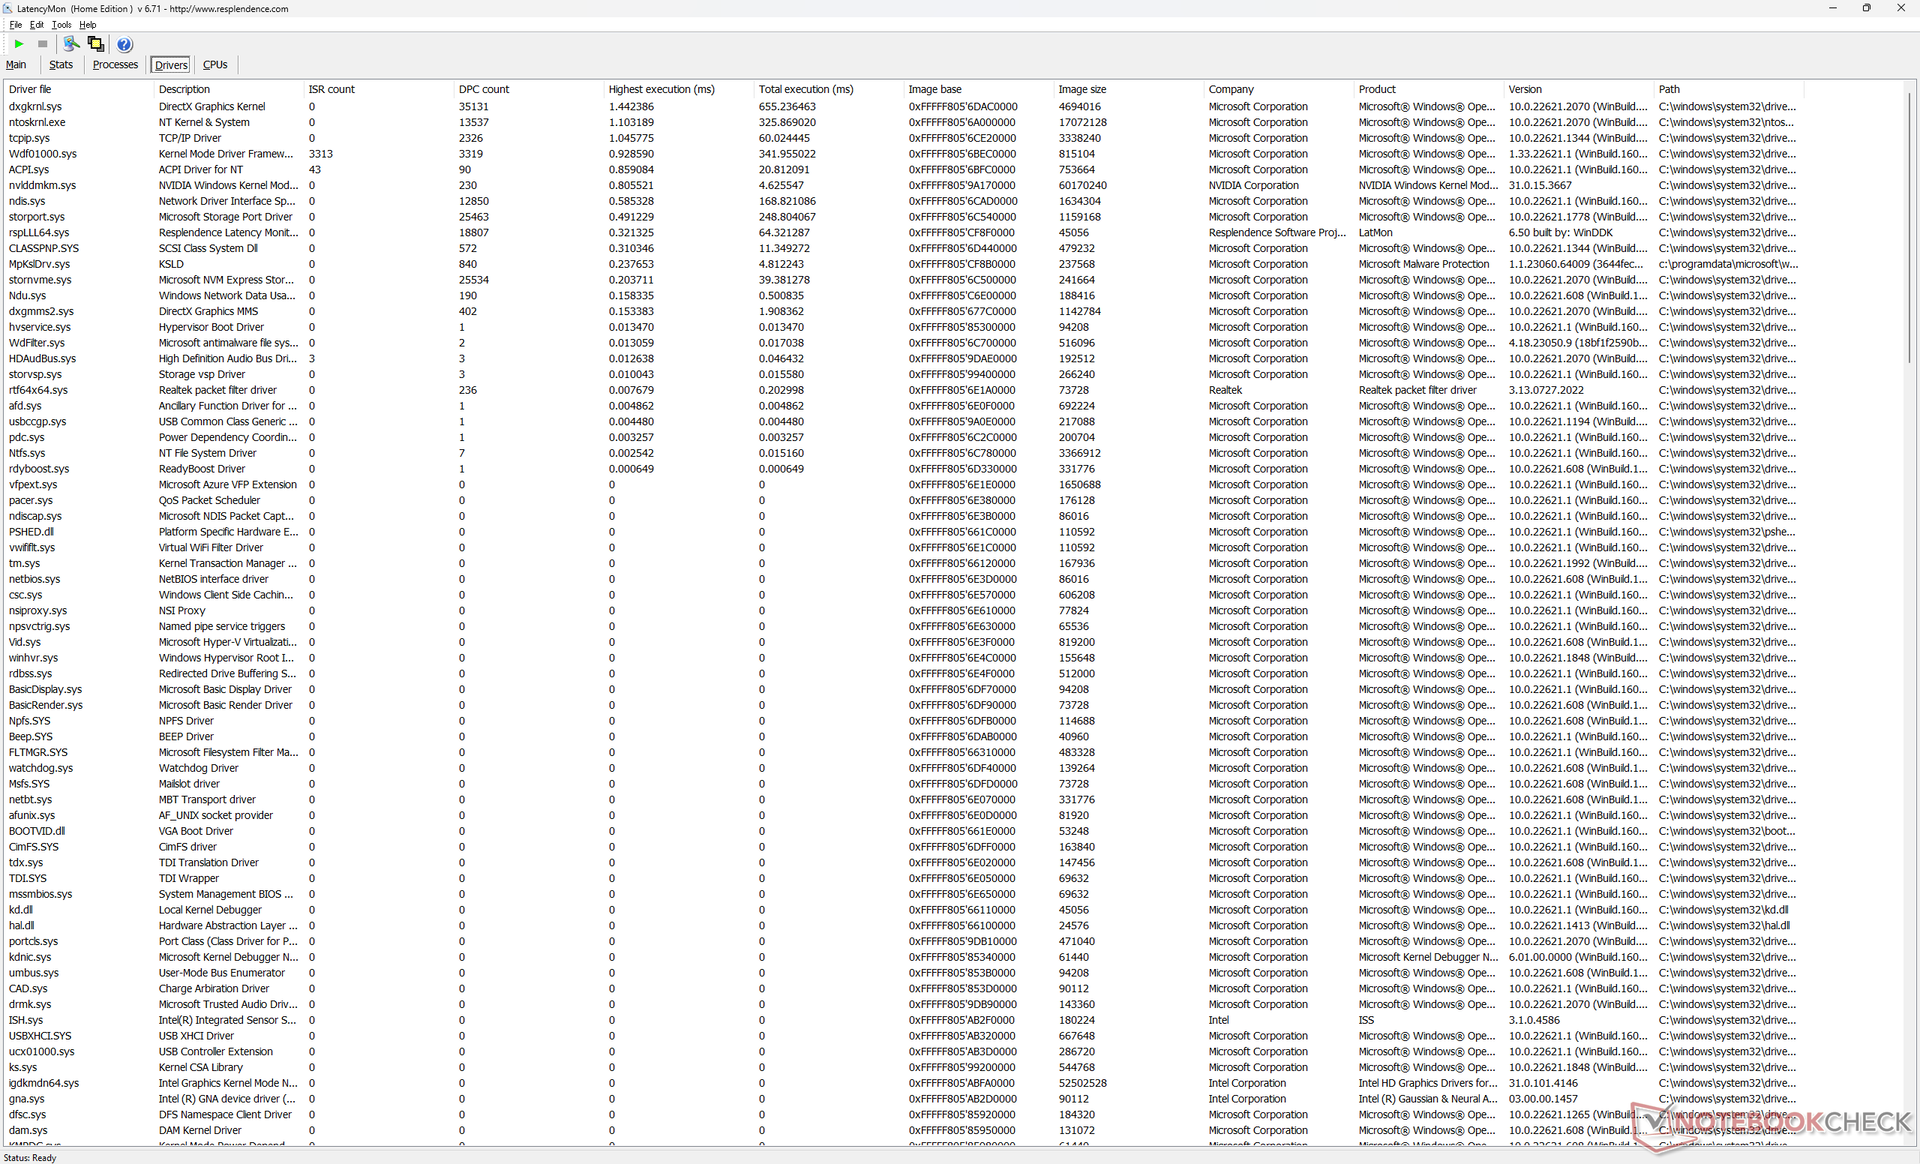
Latence DPC
LatencyMon révèle des problèmes mineurs de DPC lors de l'ouverture de plusieurs onglets de notre page d'accueil. la lecture de vidéos 4K à 60 FPS est par ailleurs parfaite, sans aucune perte d'images.
| DPC Latencies / LatencyMon - interrupt to process latency (max), Web, Youtube, Prime95 | |
| Lenovo Legion Slim 7i 16 Gen 8 | |
| HP Omen 16-wf000 | |
| HP Omen Transcend 16 | |
| Alienware x16 R1 | |
| Acer Nitro 16 AN16-41 | |
| Asus ROG Zephyrus M16 GU603Z | |
* ... Moindre est la valeur, meilleures sont les performances
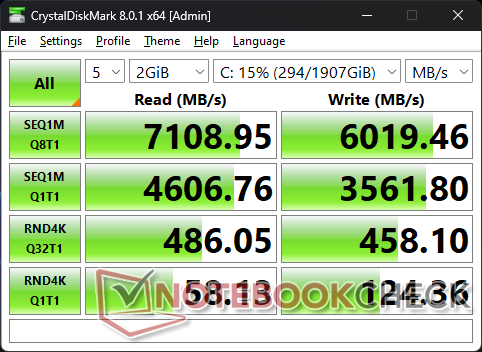
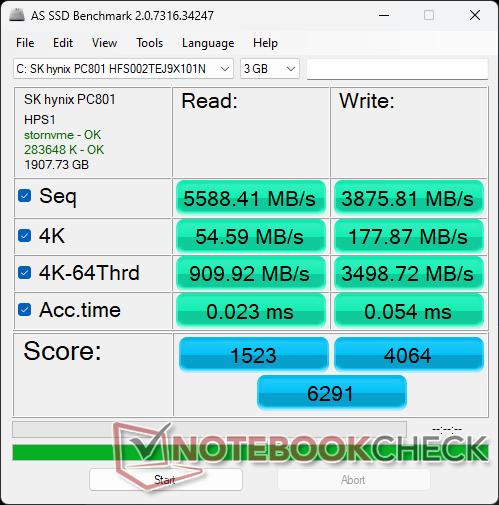
Dispositifs de stockage
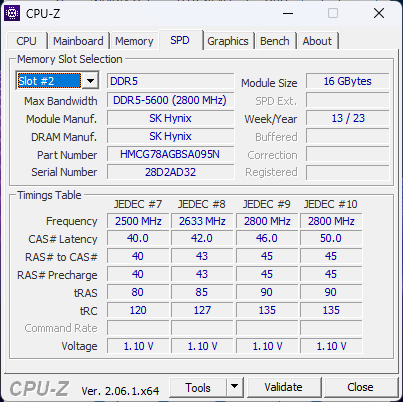
L'Omen Transcend 16 est livré avec la même carte mémoire que l'Omen Transcend SK hynix PC801 Que celui de l'Omen 16. Le disque ne présente aucun problème d'étranglement des performances et il est capable de soutenir un taux de transfert maximal élevé de près de 7000 Mo/s sans aucun problème lors de notre test de stress.

| Drive Performance rating - Percent | |
| Alienware x16 R1 | |
| Lenovo Legion Slim 7i 16 Gen 8 | |
| Asus ROG Zephyrus M16 GU603Z | |
| HP Omen 16-wf000 | |
| Acer Nitro 16 AN16-41 | |
| HP Omen Transcend 16 | |
* ... Moindre est la valeur, meilleures sont les performances
Disk Throttling: DiskSpd Read Loop, Queue Depth 8
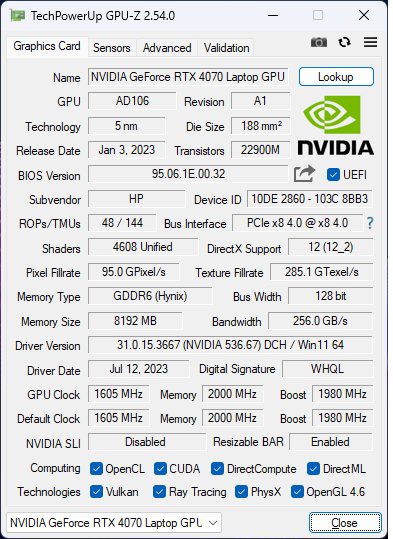
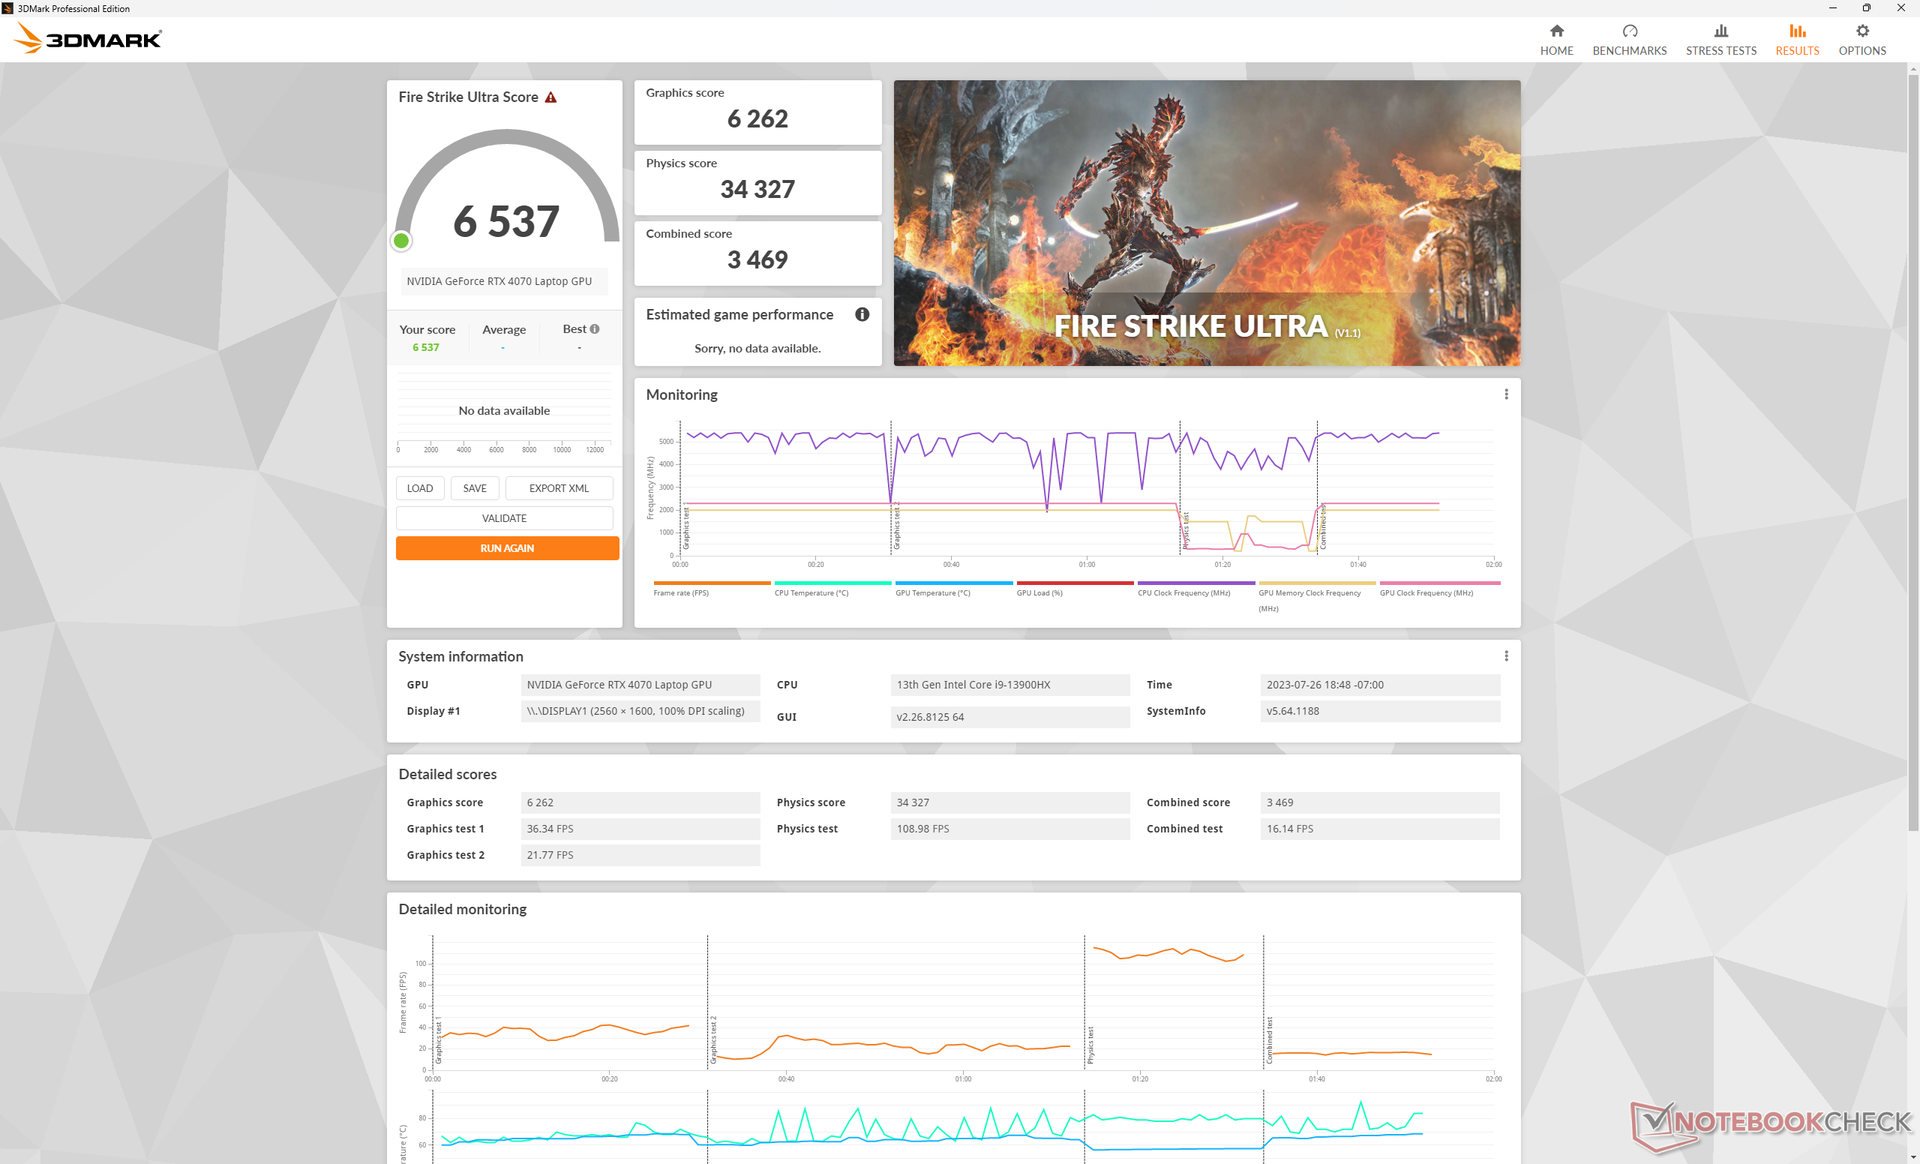
Performances du GPU - GPU TGP 130 W
Les performances graphiques sont comparables à celles d'un ordinateur portable moyen de notre base de données équipé de la même carte RTX 4070 mobile rTX 4070 MOBILE. Néanmoins, leLenovo Legion Slim 7i 16 G8 équipé du même GPU est encore 10 % plus rapide, en partie grâce à son objectif TGP légèrement plus élevé (145 W contre 130 W).
La rétrogradation vers la RTX 4060 Réduirait les performances graphiques d'environ 10 à 20 %. En revanche, la RTX 4080 peut augmenter les performances de 40 à 50 %, mais l'Omen Transcend 16 est limité à la RTX 4070 pour l'instant. En revanche, l'Omen 16 normal peut être configuré avec des options de GPU supérieures à la RTX 4070.
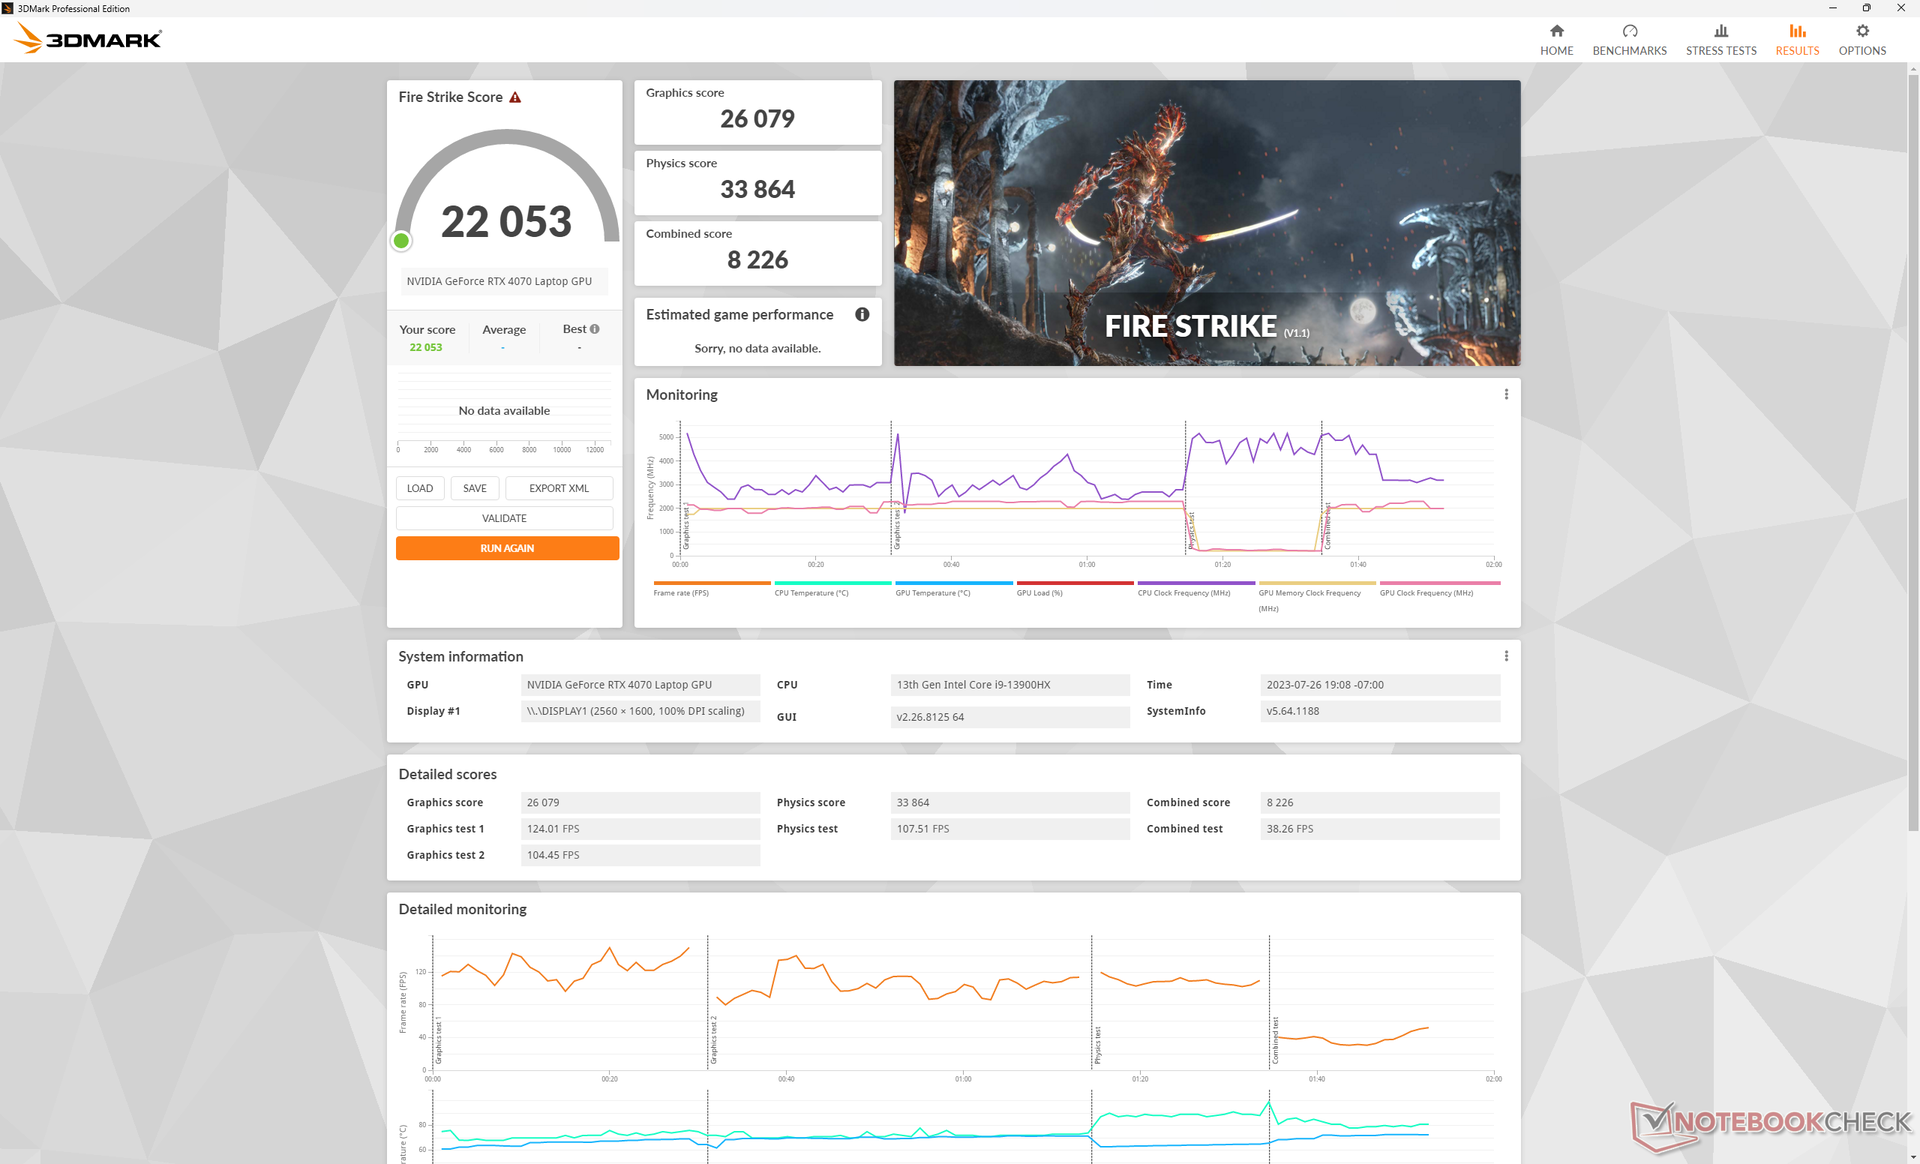
Le fait d'utiliser le mode Balanced au lieu du mode Performance diminuerait légèrement les performances, comme le montre notre tableau Fire Strike ci-dessous. Il est important de noter que les différences de bruit de ventilateur entre les modes Balanced et Performance peuvent être significatives, comme nous le montrerons dans notre section sur le bruit du système.
| Profil de puissance | Score graphique | Score physique | Score combiné |
| Équilibré | 26079 (-5%) | 33864 (-0%) | 8226 (-24%) |
| Performance | 27343 | 33936 | 10832 |
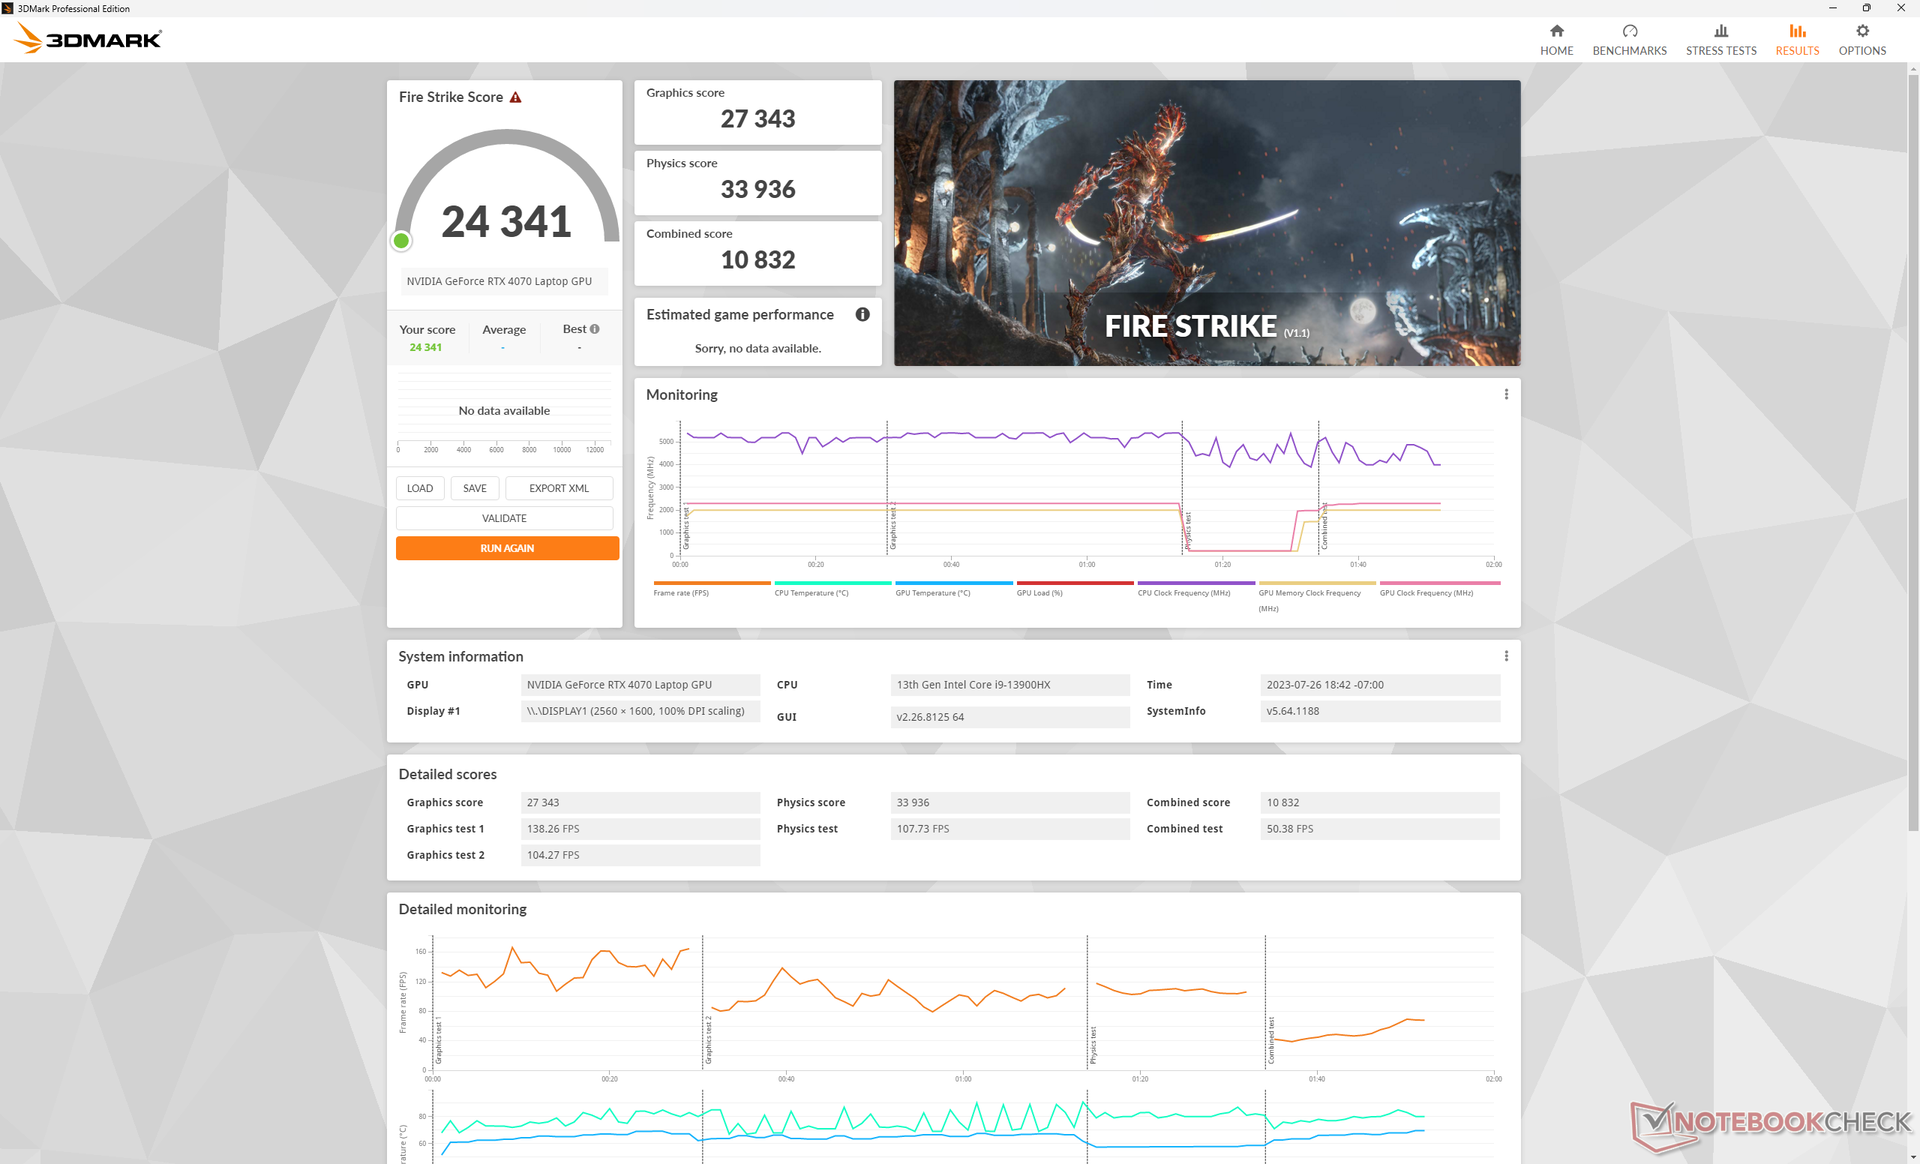
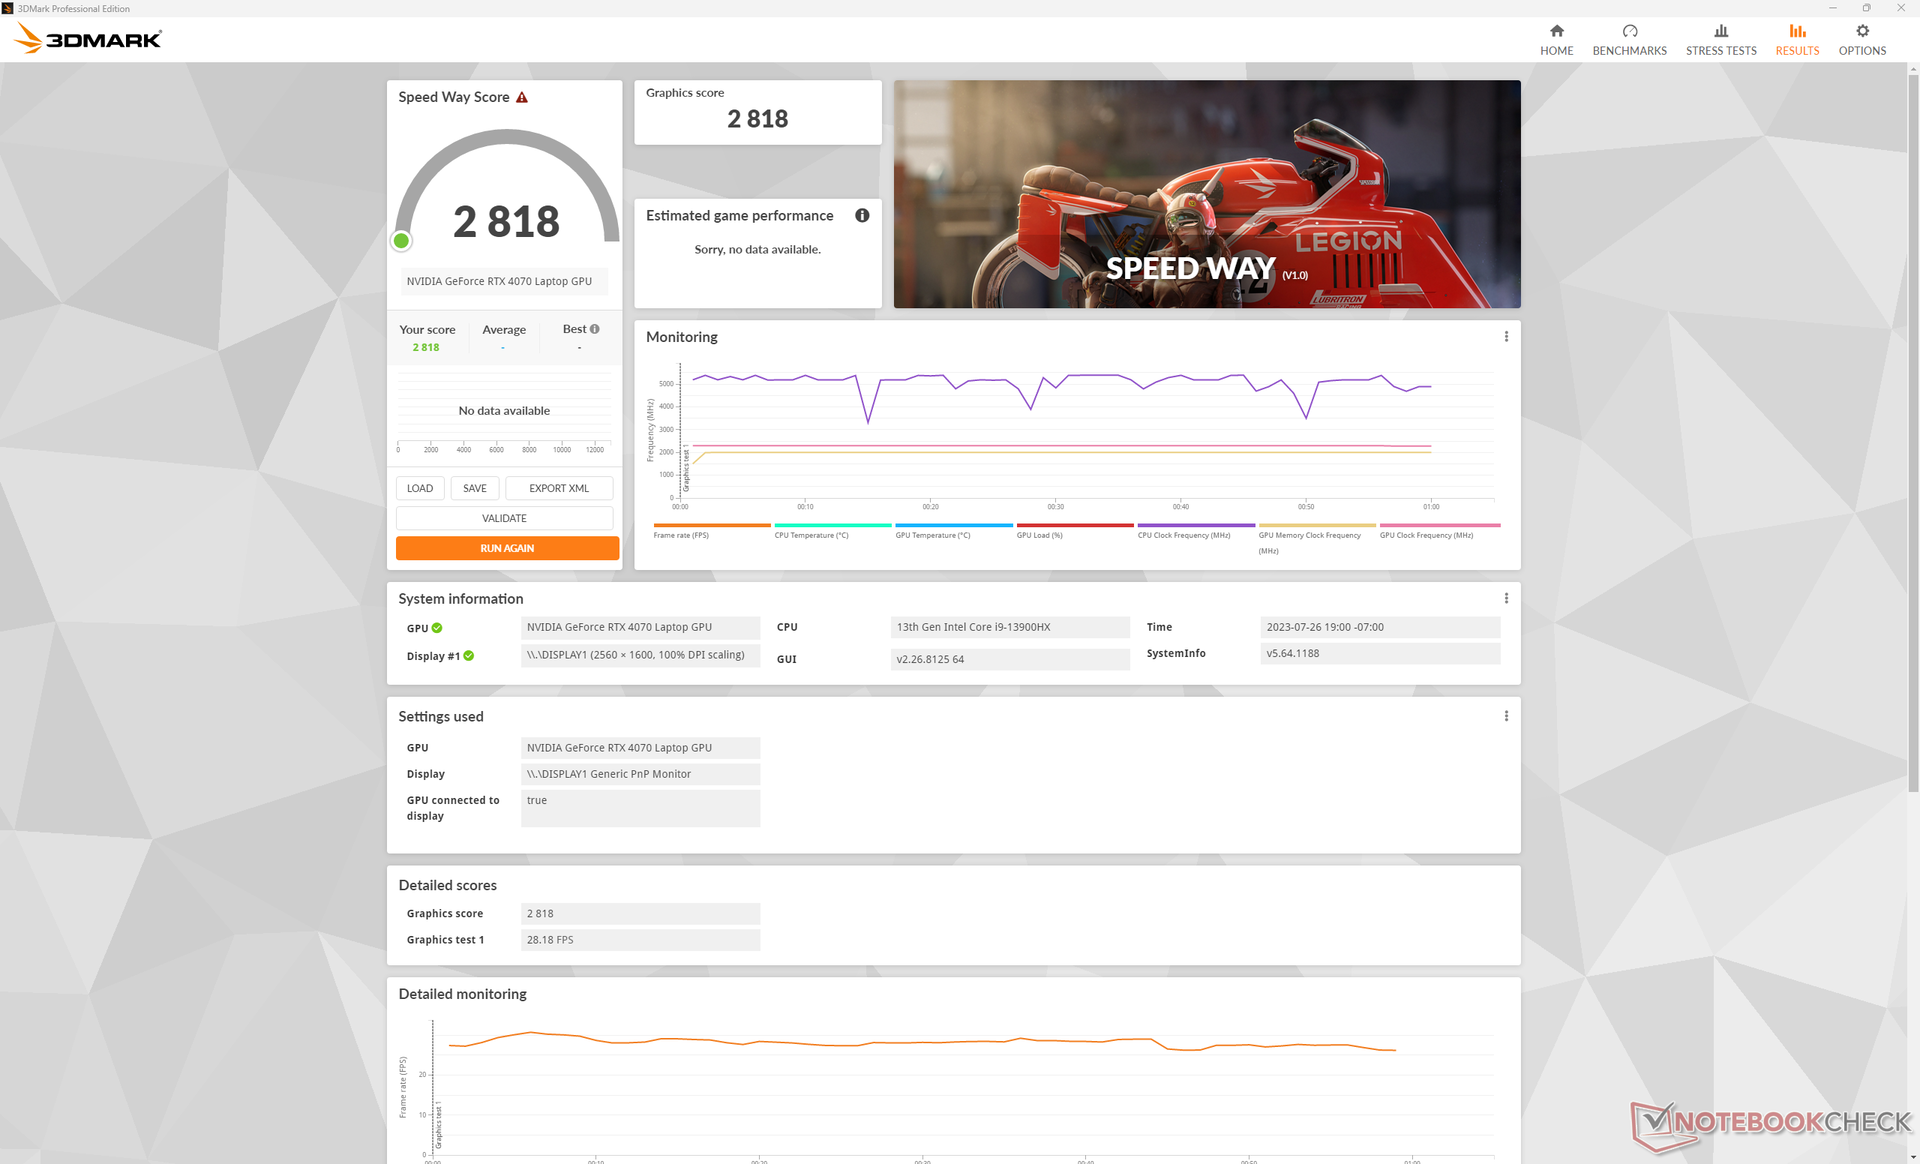
| 3DMark 11 Performance | 32031 points | |
| 3DMark Fire Strike Score | 24341 points | |
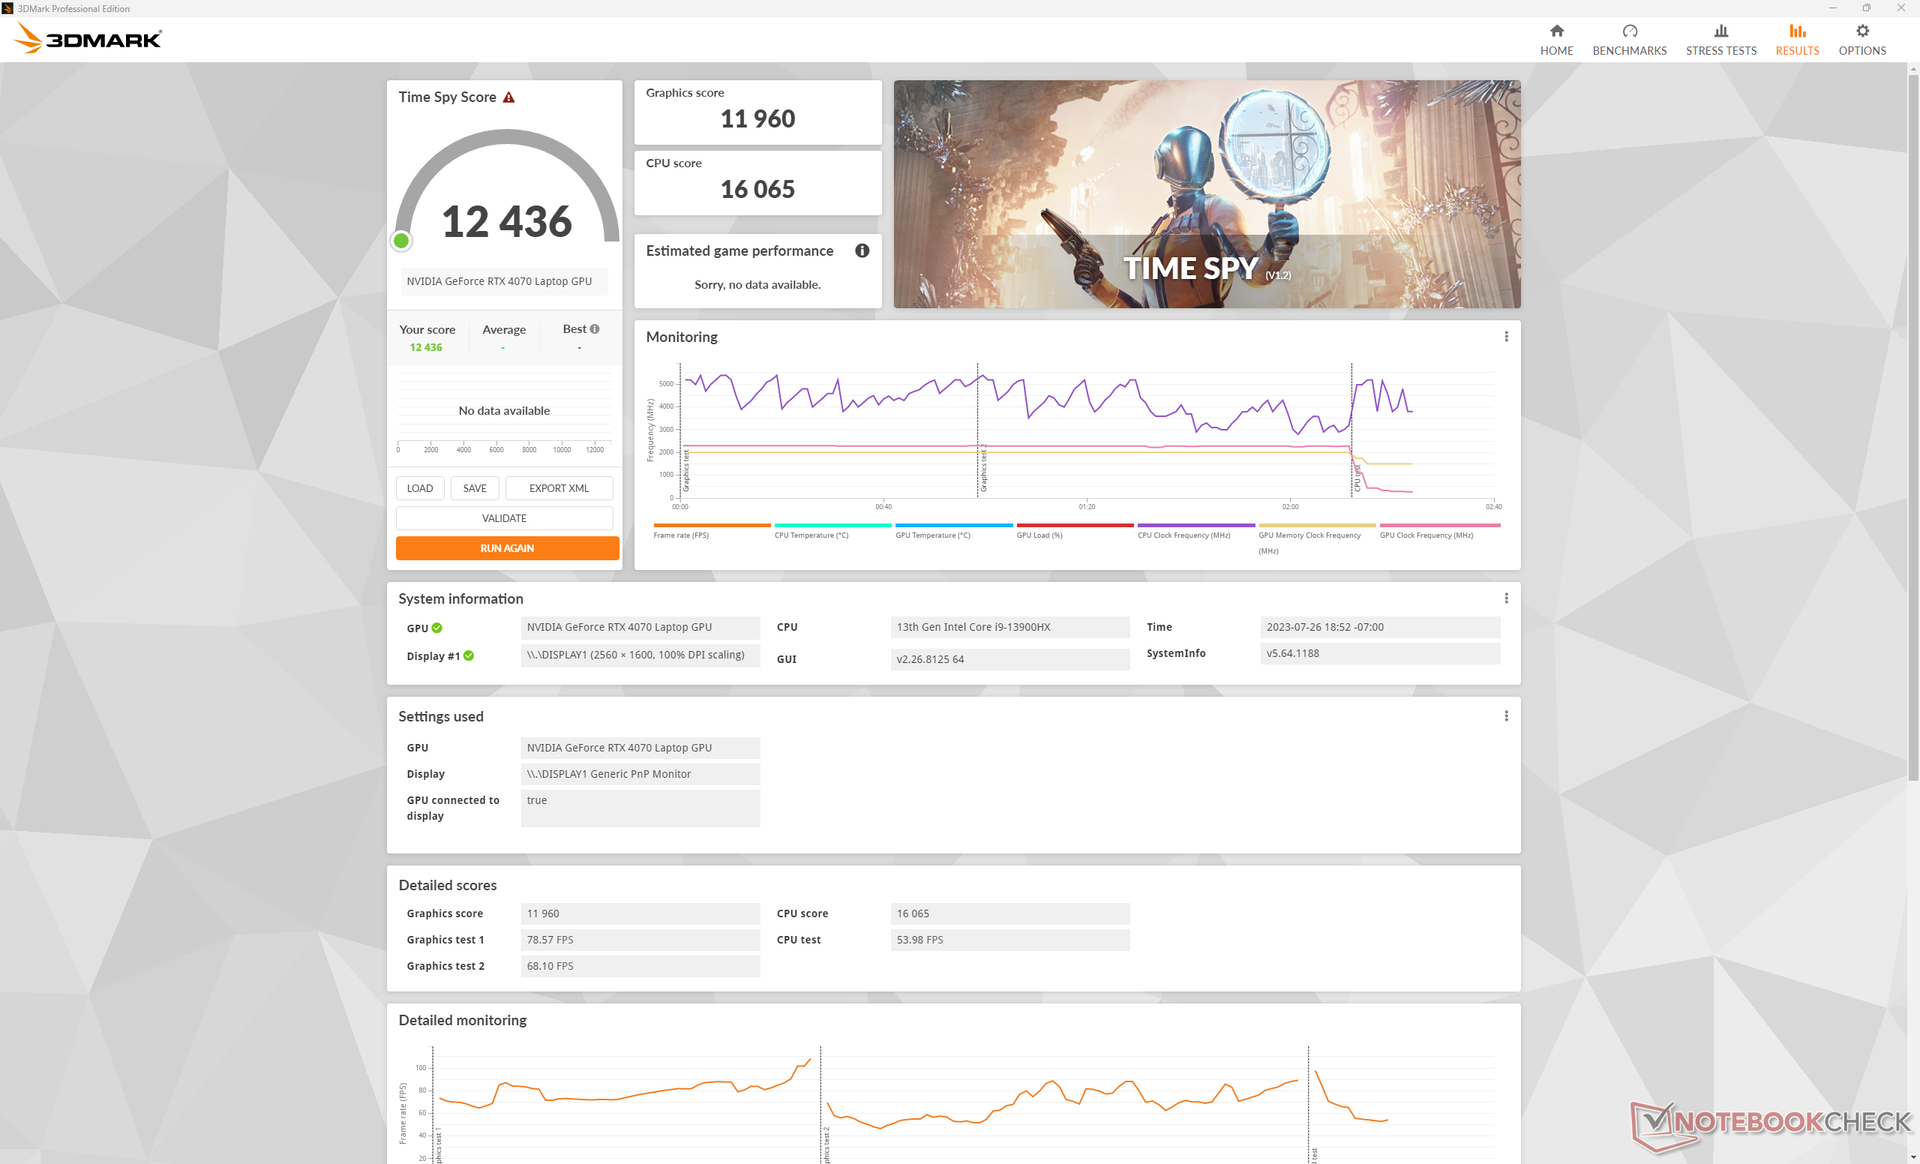
| 3DMark Time Spy Score | 12436 points | |
Aide | ||
* ... Moindre est la valeur, meilleures sont les performances
Performance des jeux
Tous les titres sont jouables avec des paramètres élevés à maximum à la résolution native QHD+, y compris les titres exigeants comme Returnal ou Cyberpunk 2077. DLSS est toujours recommandé si vous activez les fonctions RT ou si vous jouez sur un moniteur 4K externe.
Witcher 3 FPS Chart
| Bas | Moyen | Élevé | Ultra | QHD | 4K | |
|---|---|---|---|---|---|---|
| The Witcher 3 (2015) | 500.9 | 375.9 | 222.7 | 111.8 | 65.7 | |
| Dota 2 Reborn (2015) | 212 | 192 | 188.4 | 168.4 | 142.5 | |
| Final Fantasy XV Benchmark (2018) | 220 | 164.8 | 82.6 | 47.1 | ||
| X-Plane 11.11 (2018) | 191.5 | 169.8 | 132.9 | 114 | ||
| Strange Brigade (2018) | 414 | 310 | 245 | 208 | 133.3 | 71.4 |
| Cyberpunk 2077 1.6 (2022) | 128.5 | 118.1 | 103 | 87.5 | 54.5 | 23.5 |
| Tiny Tina's Wonderlands (2022) | 241.7 | 195.6 | 132.5 | 102 | 70.4 | 33.6 |
| F1 22 (2022) | 301 | 289 | 221 | 79.3 | 50.4 | 24.7 |
| Returnal (2023) | 109 | 115 | 101 | 79 | 64 | 37 |
Émissions
Bruit du système - Grande différence entre le mode équilibré et le mode performance
Dans l'ensemble, le bruit du ventilateur est légèrement plus faible que celui que nous avons constaté sur le modèle Omen 16mais il est important de noter que l'Omen 16 est équipé d'un GPU RTX 4080 plus rapide, ciblant un TGP plus élevé de 145 W par rapport à notre RTX 4070 plus lent de 130 W.
Le bruit du ventilateur en mode Performance peut atteindre 54,3 dB(A) contre 42 dB(A) en mode Équilibré. Vous perdrez un peu de performance comme mentionné ci-dessus, mais la diminution significative du bruit peut faire que le compromis vaut la peine d'être considéré. Sinon, la plage de 50 dB(A) pour les jeux est comparable à des alternatives telles que lAlienware x16 R1.
Degré de la nuisance sonore
| Au repos |
| 29.1 / 29.1 / 29.1 dB(A) |
| Fortement sollicité |
| 45.7 / 54.3 dB(A) |
 | ||
30 dB silencieux 40 dB(A) audible 50 dB(A) bruyant |
||
min: | ||
| HP Omen Transcend 16 GeForce RTX 4070 Laptop GPU, i9-13900HX, SK hynix PC801 HFS002TEJ9X101N | Lenovo Legion Slim 7i 16 Gen 8 GeForce RTX 4070 Laptop GPU, i9-13900H, Samsung PM9A1 MZVL21T0HCLR | HP Omen 16-wf000 GeForce RTX 4080 Laptop GPU, i7-13700HX, SK hynix PC801 HFS002TEJ9X101N | Alienware x16 R1 GeForce RTX 4080 Laptop GPU, i9-13900HK, SK hynix PC801 HFS001TEJ9X101N | Acer Nitro 16 AN16-41 GeForce RTX 4070 Laptop GPU, R7 7735HS, Samsung PM9A1 MZVL21T0HCLR | Asus ROG Zephyrus M16 GU603Z GeForce RTX 3070 Ti Laptop GPU, i9-12900H, Micron 3400 1TB MTFDKBA1T0TFH | |
|---|---|---|---|---|---|---|
| Noise | 13% | 1% | 9% | 6% | -2% | |
| arrêt / environnement * (dB) | 22.9 | 22.8 -0% | 23 -0% | 22.7 1% | 25.7 -12% | 23 -0% |
| Idle Minimum * (dB) | 29.1 | 23.6 19% | 29.6 -2% | 23.1 21% | 25.7 12% | 23 21% |
| Idle Average * (dB) | 29.1 | 23.6 19% | 29.8 -2% | 25.8 11% | 25.7 12% | 24 18% |
| Idle Maximum * (dB) | 29.1 | 25.7 12% | 30.4 -4% | 25.8 11% | 26.3 10% | 47 -62% |
| Load Average * (dB) | 45.7 | 27.6 40% | 33.8 26% | 39.3 14% | 33.9 26% | 47.91 -5% |
| Witcher 3 ultra * (dB) | 54.3 | 54.4 -0% | 57 -5% | 49.9 8% | 48.91 10% | |
| Load Maximum * (dB) | 54.3 | 54.4 -0% | 58.3 -7% | 54.8 -1% | 62 -14% | 50.25 7% |
* ... Moindre est la valeur, meilleures sont les performances
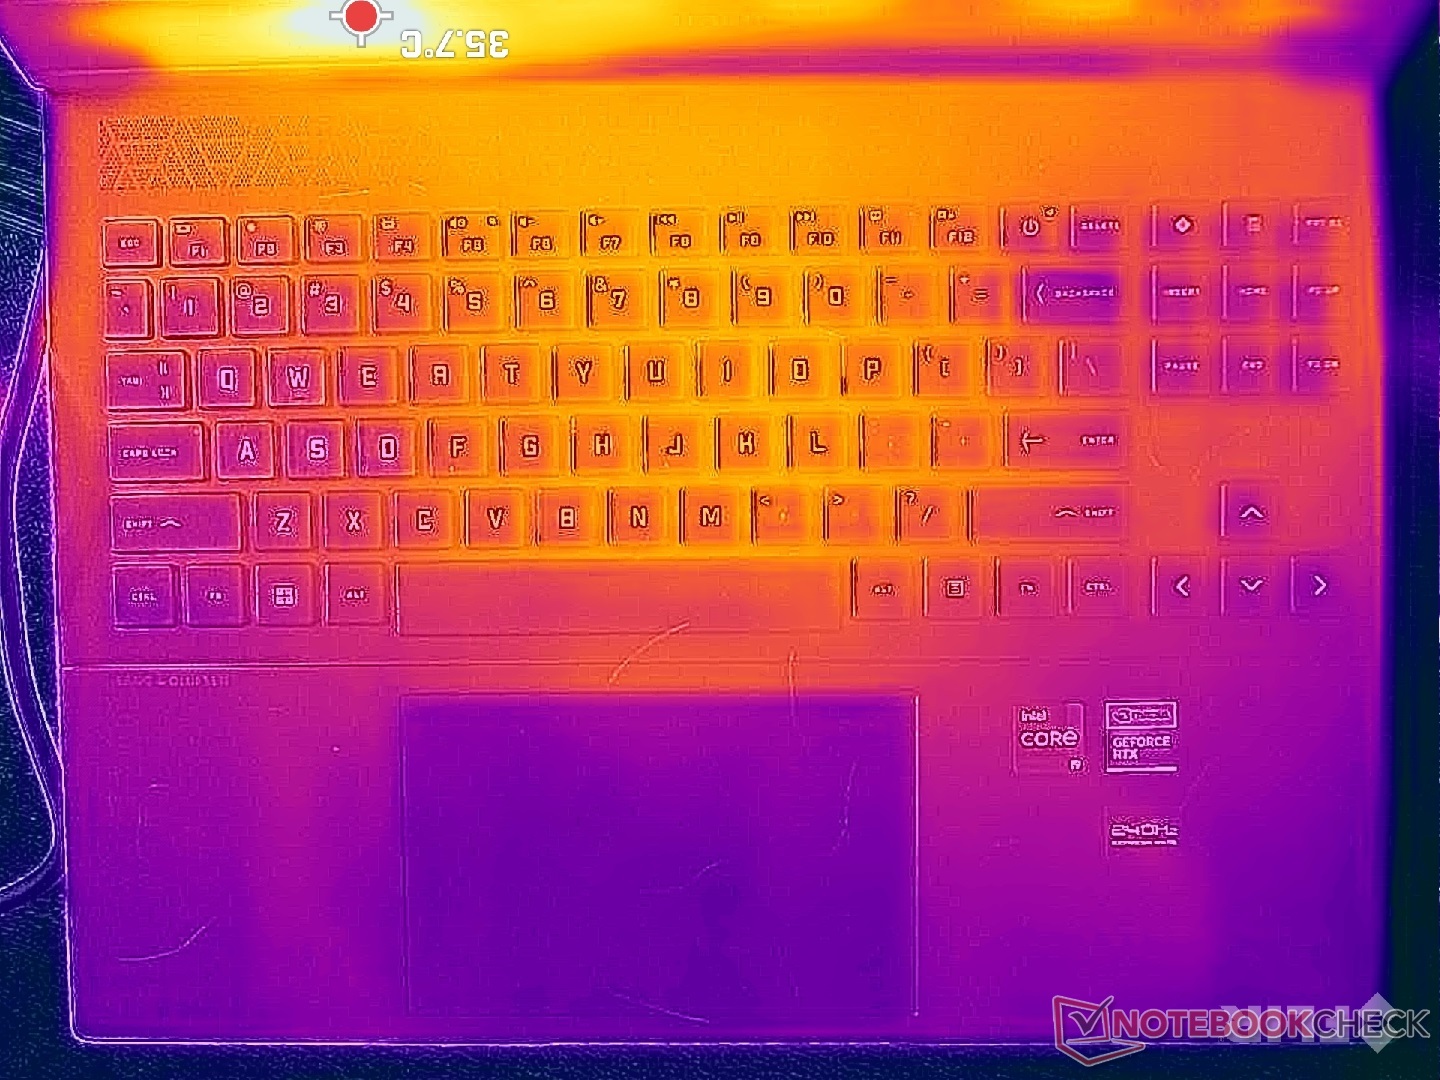
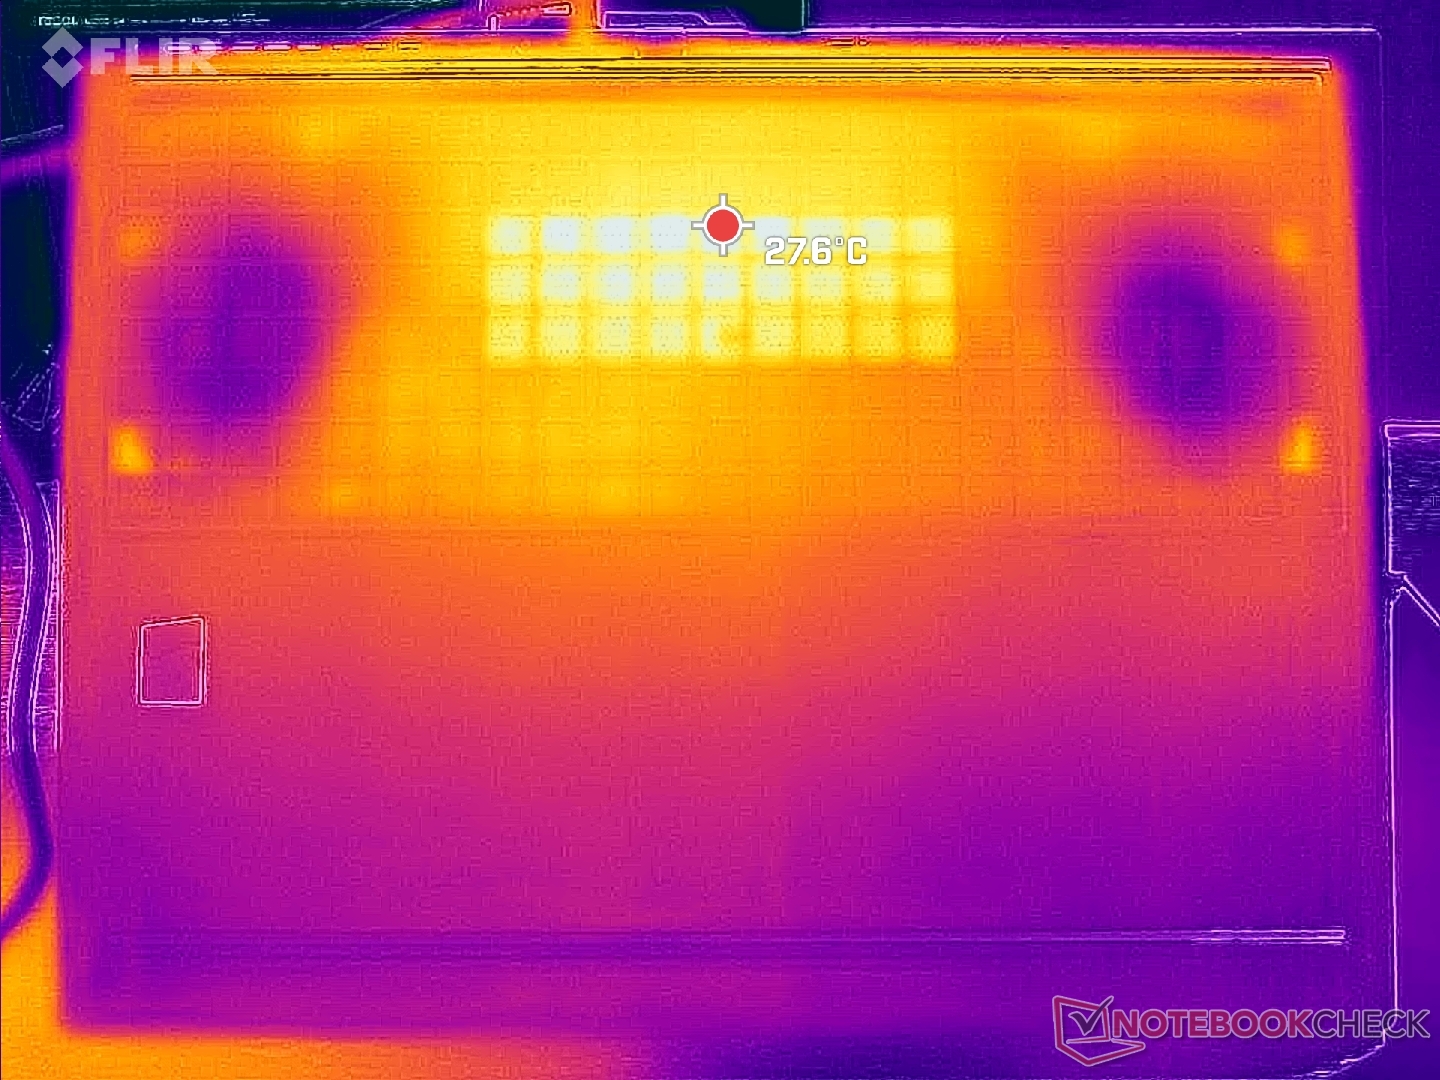
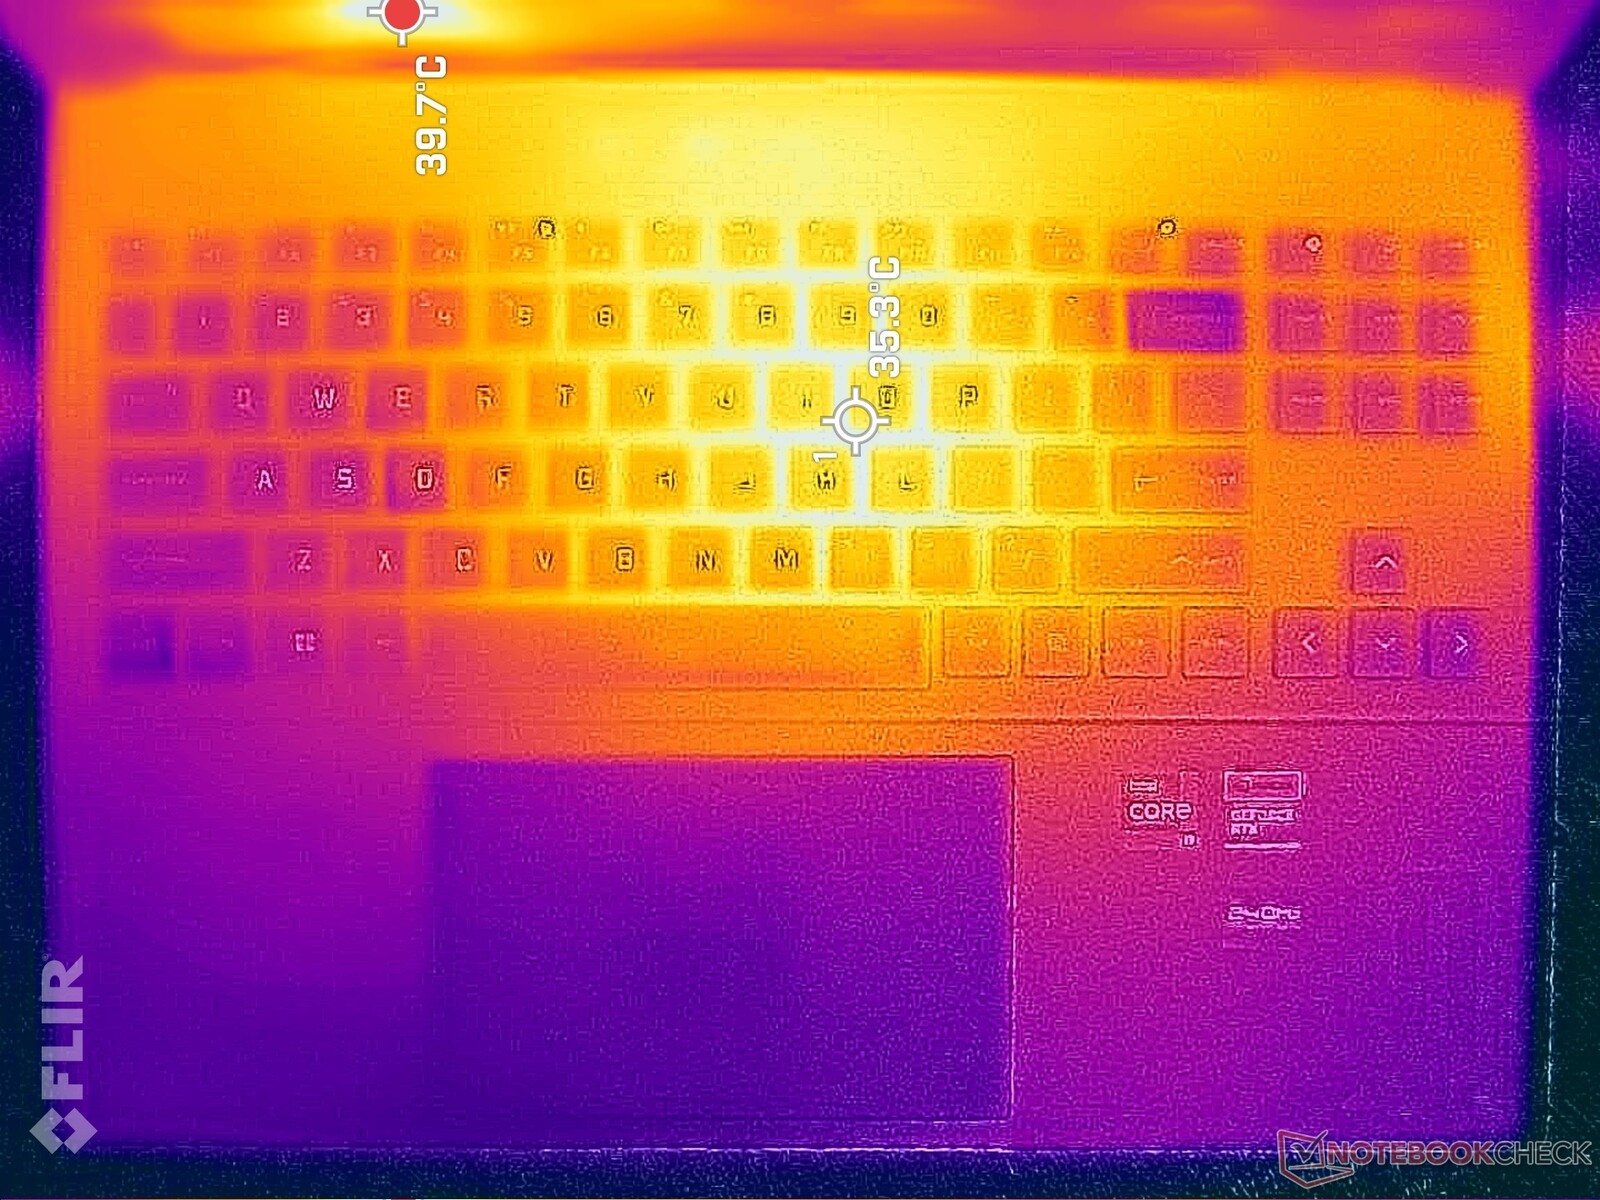
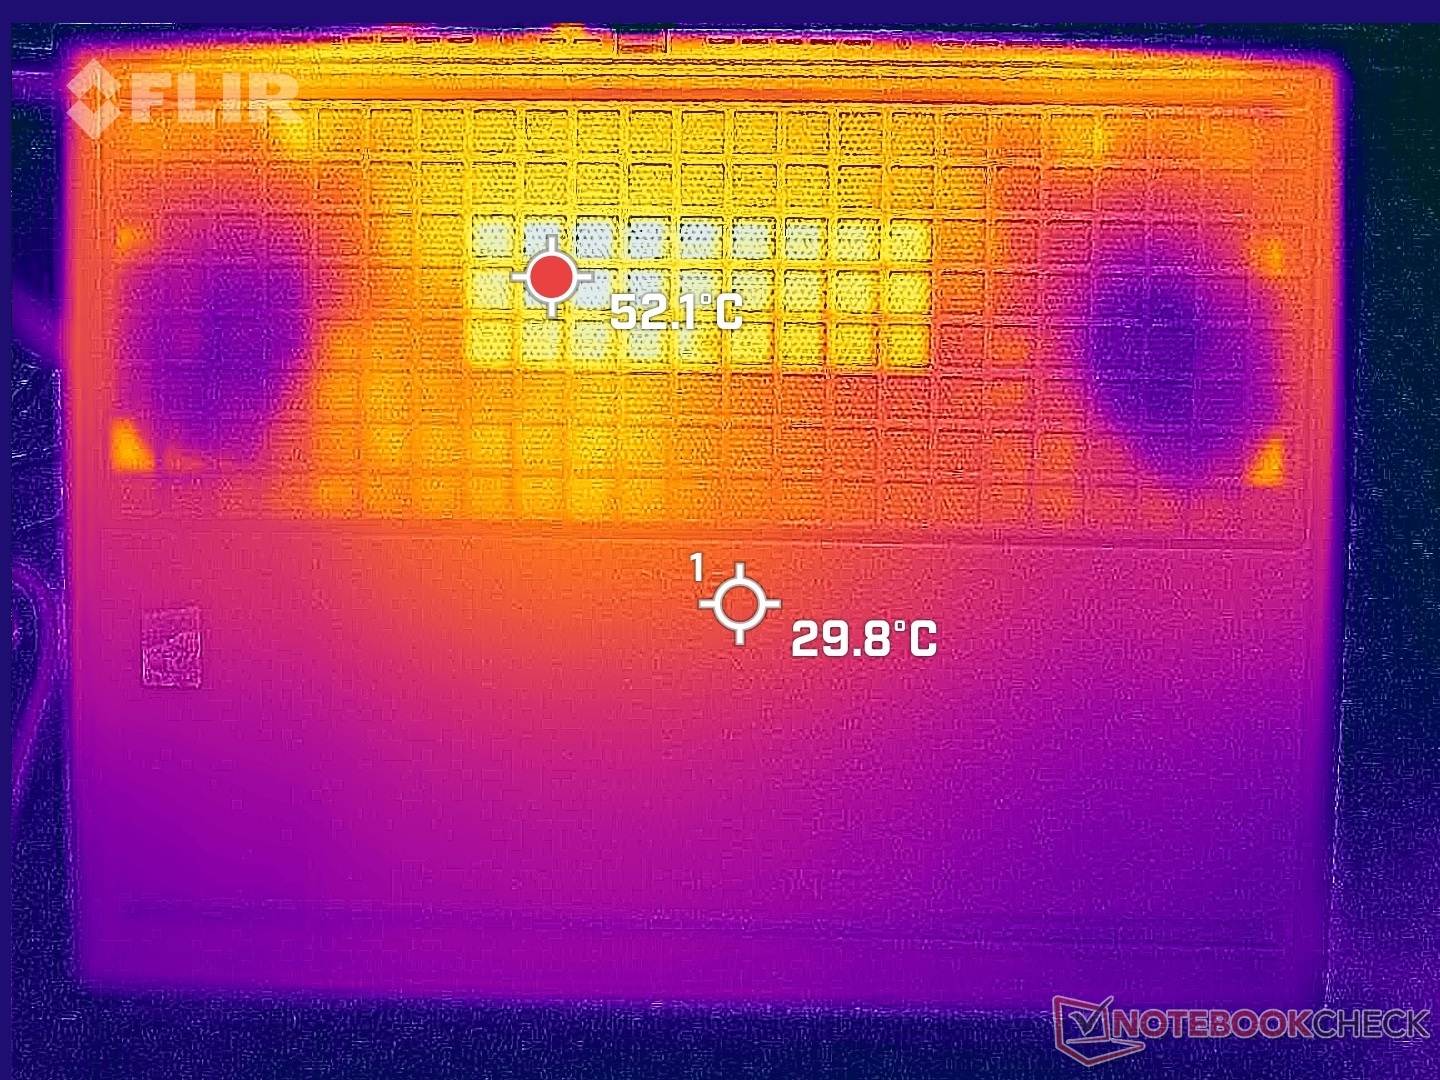
Température
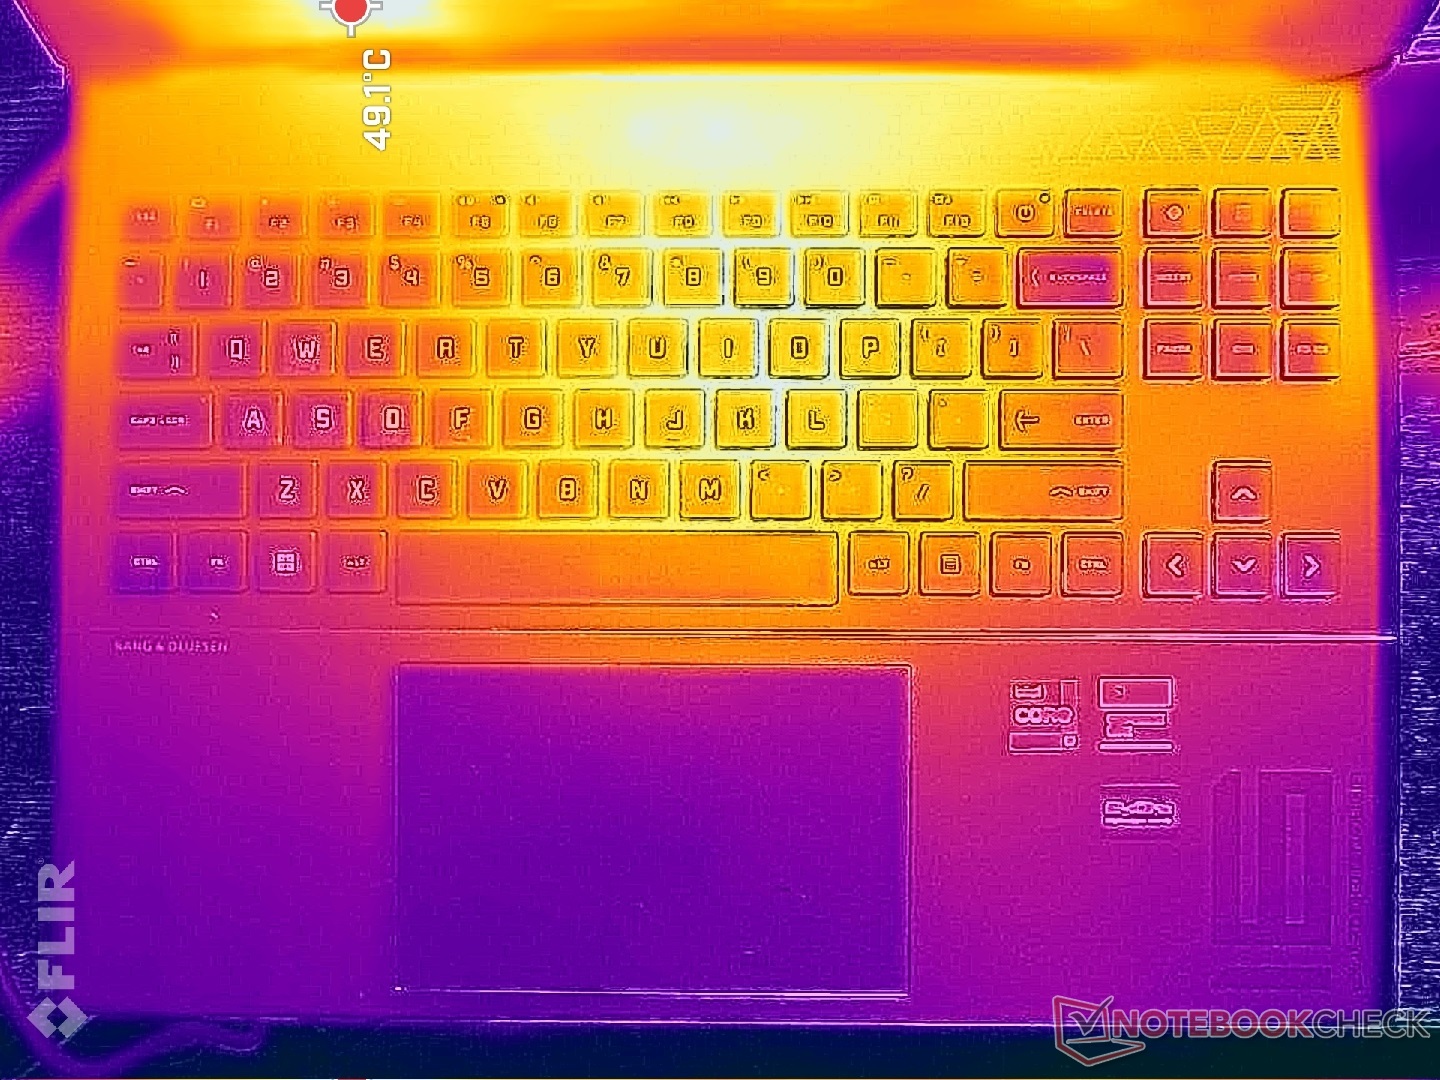
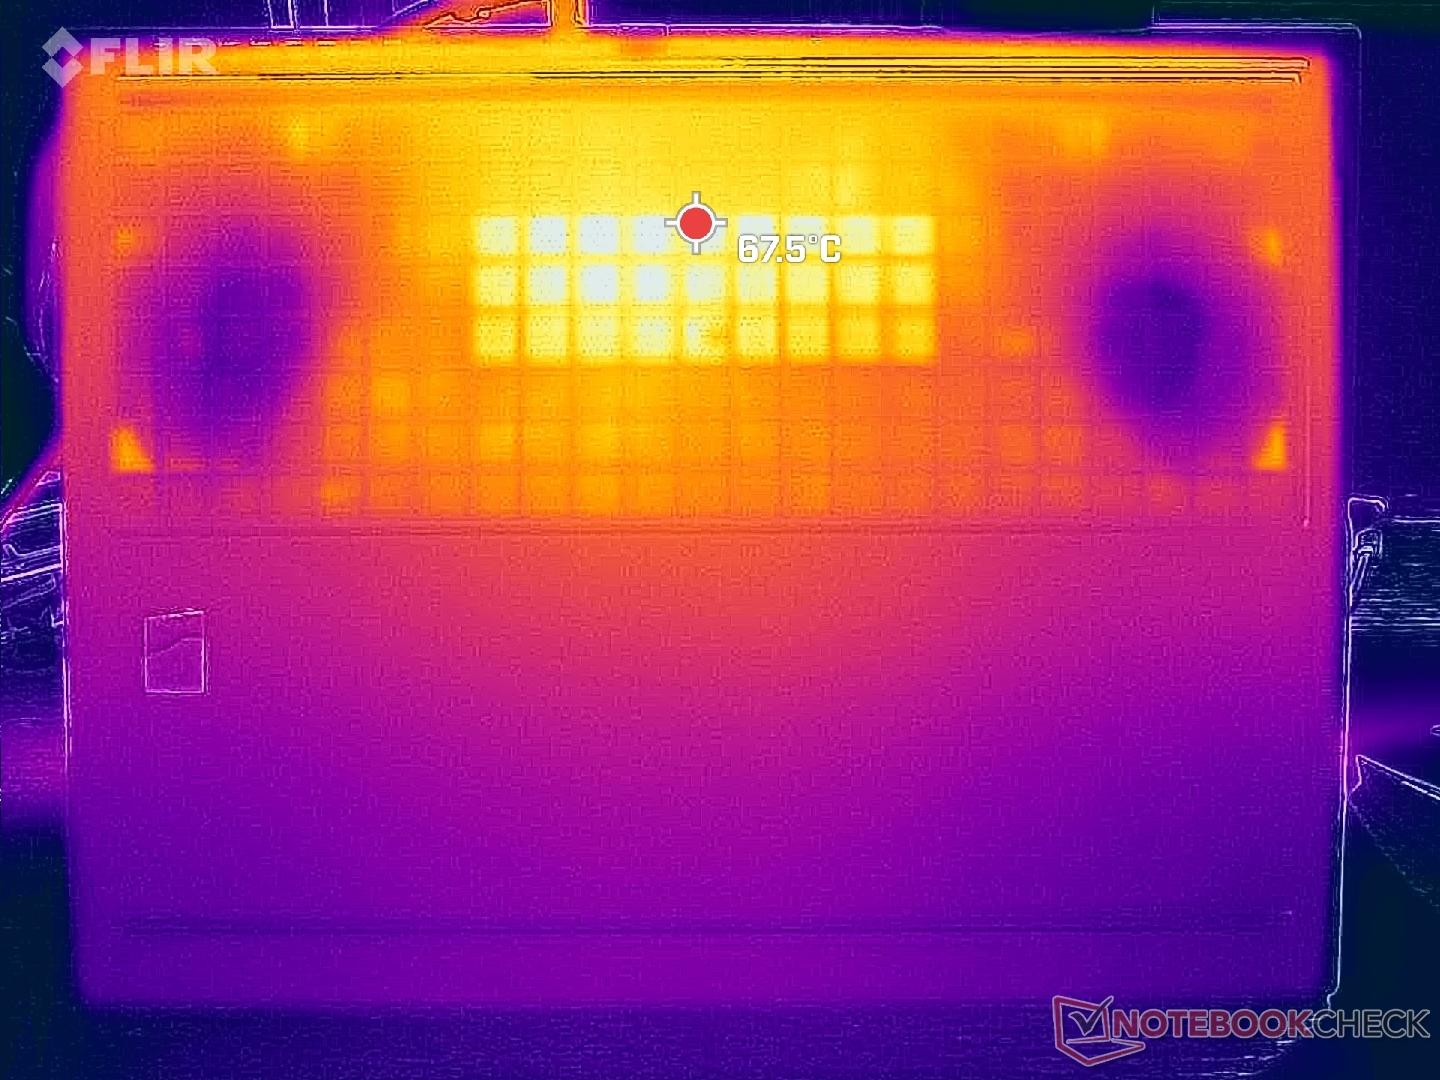
Les températures de surface sont plus chaudes vers le centre en raison de la solution de refroidissement symétrique à l'intérieur. Le centre du clavier peut atteindre 40 à 45°C pendant les jeux et le dessous peut être encore plus chaud. Cependant, cette plage est encore comparable à celle duLegion Slim 7i 16 G8. Le reste de l'ordinateur portable est plus froid, y compris les repose-poignets, les touches WASD et les touches fléchées où la peau est plus souvent en contact avec le jeu.
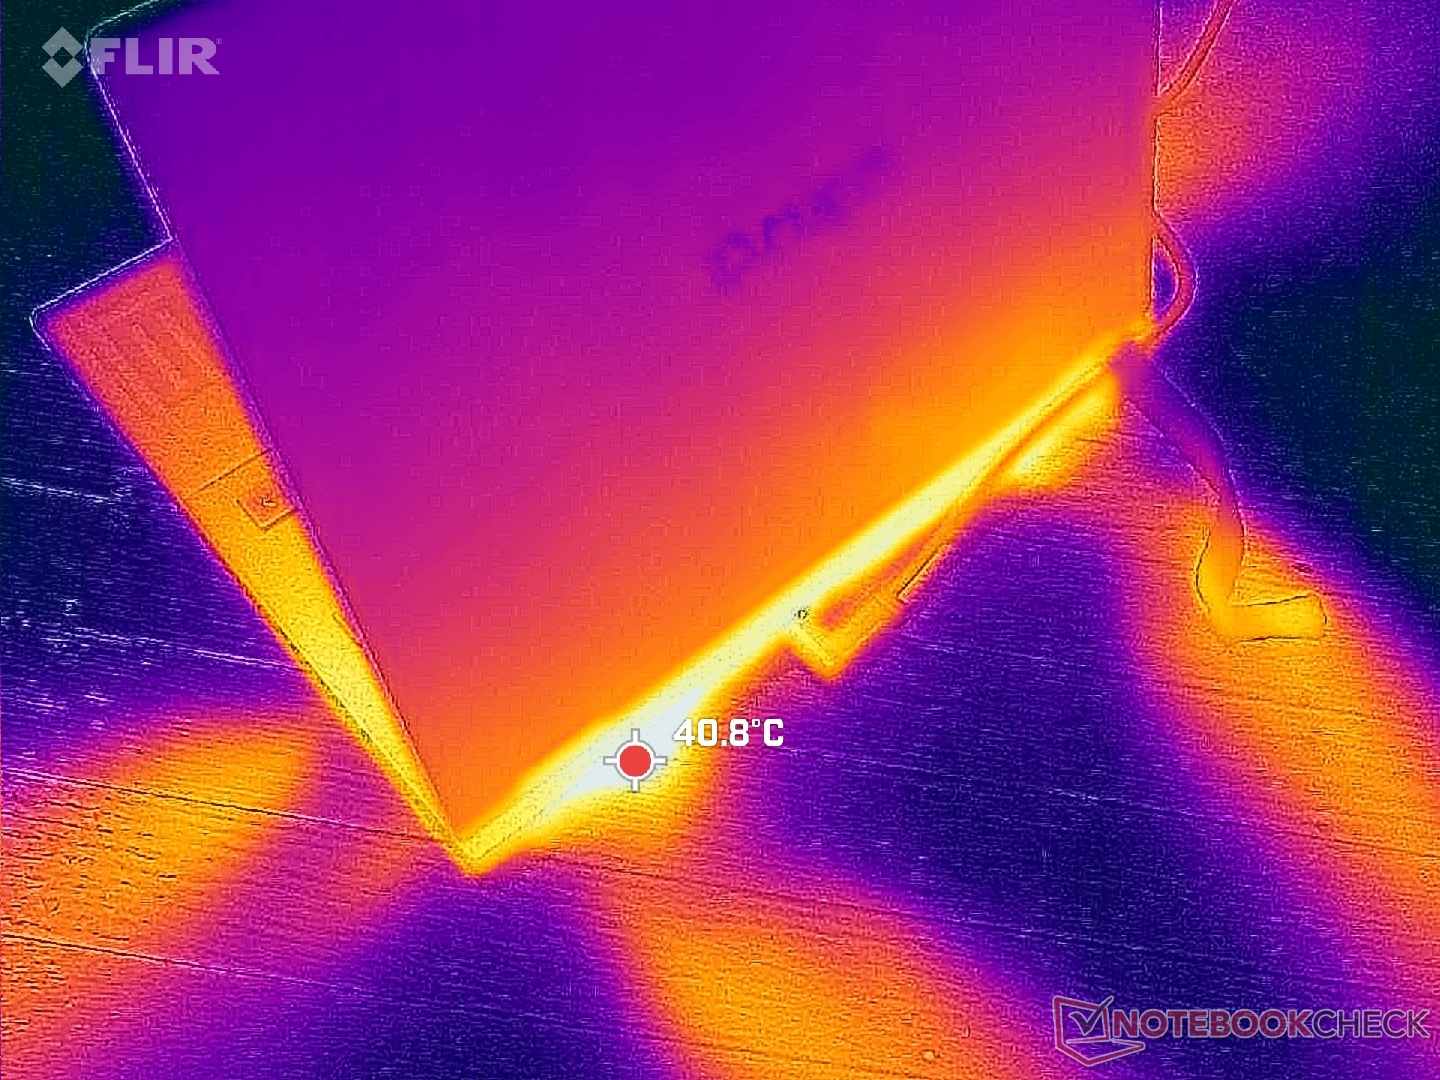
(-) La température maximale du côté supérieur est de 47.4 °C / 117 F, par rapport à la moyenne de 40.4 °C / 105 F, allant de 21.2 à 68.8 °C pour la classe Gaming.
(-) Le fond chauffe jusqu'à un maximum de 54.4 °C / 130 F, contre une moyenne de 43.2 °C / 110 F
(+) En utilisation inactive, la température moyenne du côté supérieur est de 25.4 °C / 78 F, par rapport à la moyenne du dispositif de 33.9 °C / 93 F.
(±) En jouant à The Witcher 3, la température moyenne du côté supérieur est de 32.5 °C / 91 F, alors que la moyenne de l'appareil est de 33.9 °C / 93 F.
(+) Les repose-poignets et le pavé tactile sont plus froids que la température de la peau avec un maximum de 29.6 °C / 85.3 F et sont donc froids au toucher.
(±) La température moyenne de la zone de l'appui-paume de dispositifs similaires était de 28.8 °C / 83.8 F (-0.8 °C / #-1.5 F).
| HP Omen Transcend 16 Intel Core i9-13900HX, NVIDIA GeForce RTX 4070 Laptop GPU | Lenovo Legion Slim 7i 16 Gen 8 Intel Core i9-13900H, NVIDIA GeForce RTX 4070 Laptop GPU | HP Omen 16-wf000 Intel Core i7-13700HX, NVIDIA GeForce RTX 4080 Laptop GPU | Alienware x16 R1 Intel Core i9-13900HK, NVIDIA GeForce RTX 4080 Laptop GPU | Acer Nitro 16 AN16-41 AMD Ryzen 7 7735HS, NVIDIA GeForce RTX 4070 Laptop GPU | Asus ROG Zephyrus M16 GU603Z Intel Core i9-12900H, NVIDIA GeForce RTX 3070 Ti Laptop GPU | |
|---|---|---|---|---|---|---|
| Heat | -1% | 3% | -10% | -3% | -5% | |
| Maximum Upper Side * (°C) | 47.4 | 49.8 -5% | 45 5% | 47.2 -0% | 41.5 12% | 52 -10% |
| Maximum Bottom * (°C) | 54.4 | 48.8 10% | 48.8 10% | 47.8 12% | 51.8 5% | 51 6% |
| Idle Upper Side * (°C) | 28.4 | 29.4 -4% | 29.2 -3% | 36.8 -30% | 31.6 -11% | 29 -2% |
| Idle Bottom * (°C) | 29.2 | 30 -3% | 28.8 1% | 35.8 -23% | 34.5 -18% | 33 -13% |
* ... Moindre est la valeur, meilleures sont les performances
Test de stress
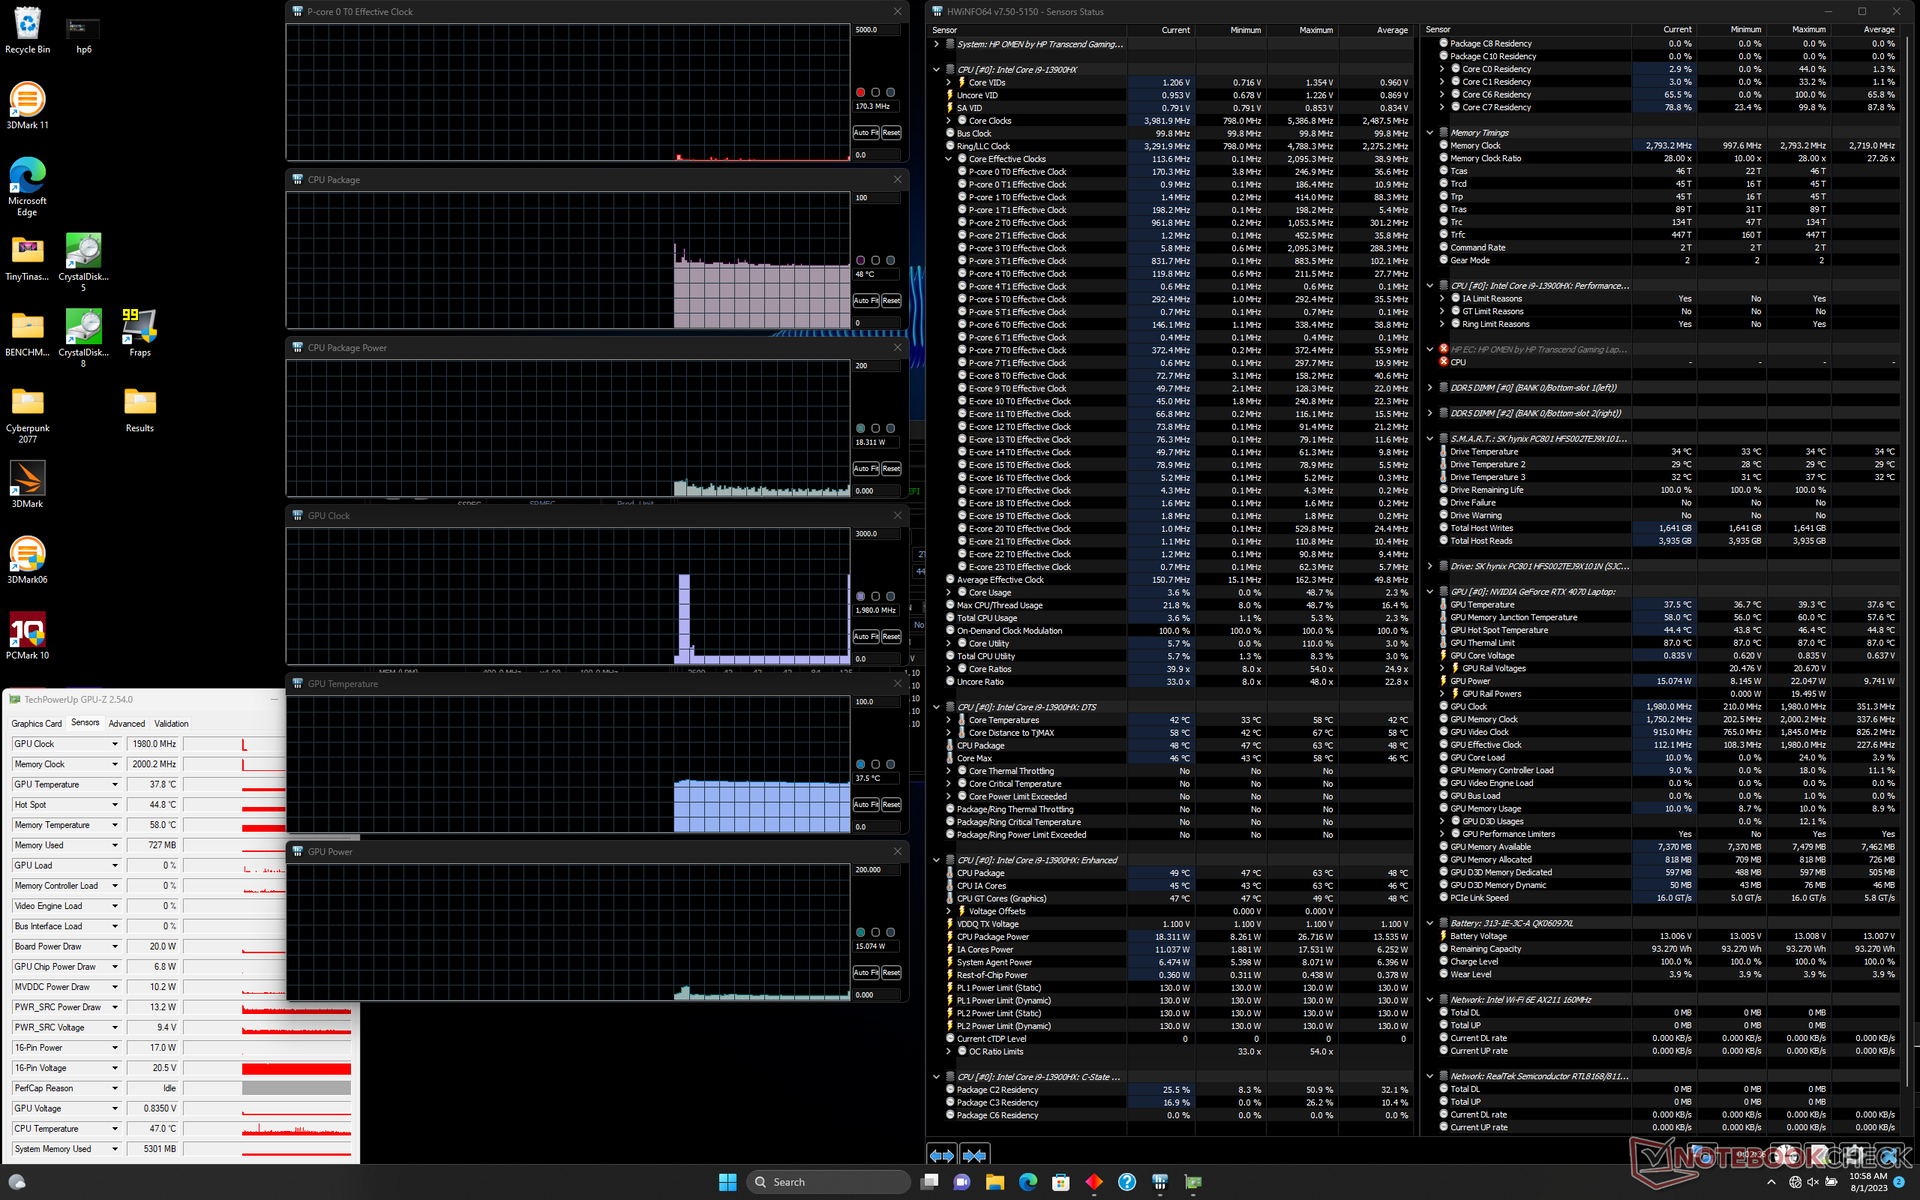
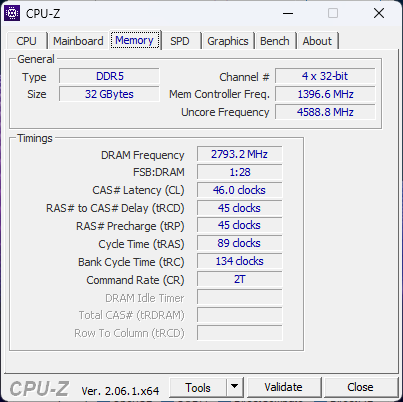
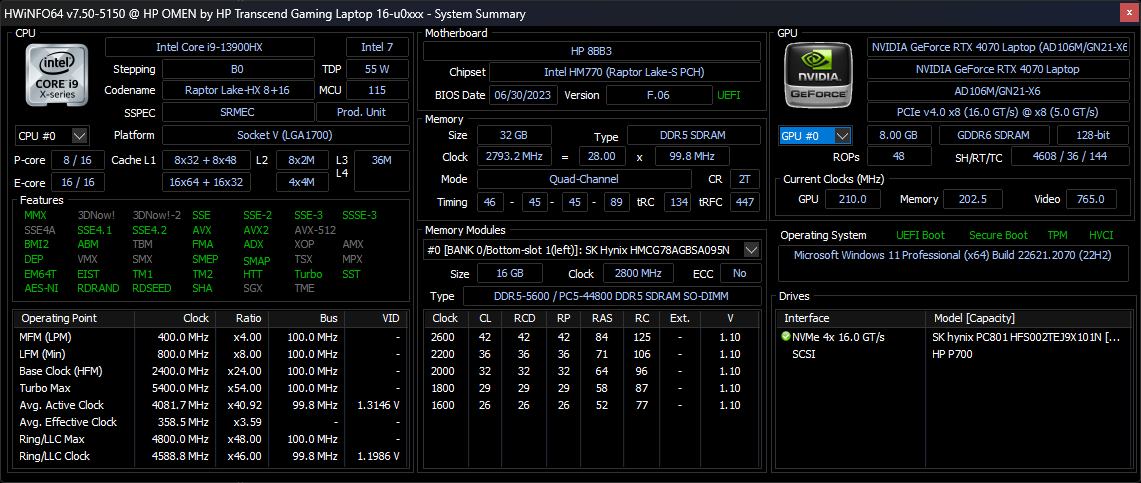
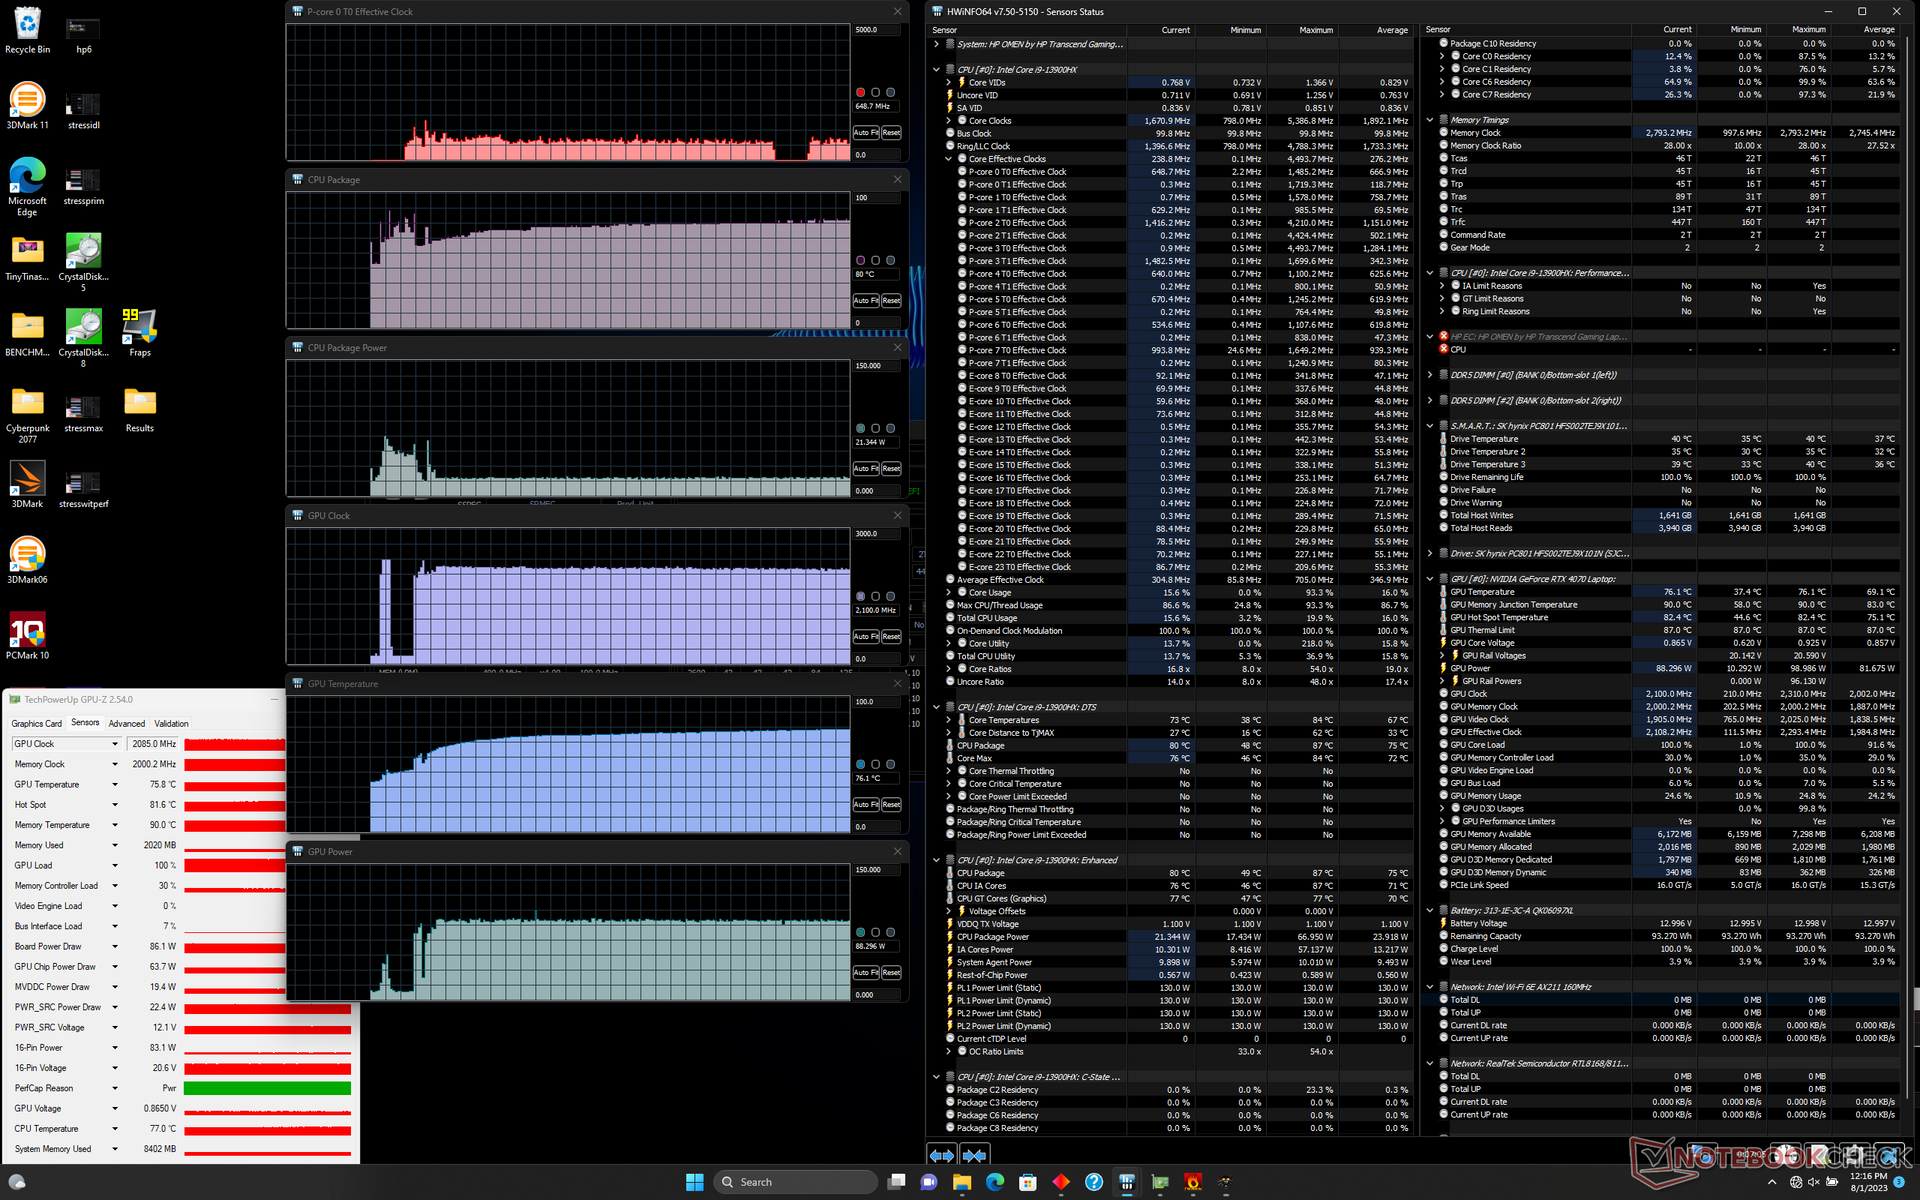
Lors de l'exécution du stress Prime95, le CPU monte jusqu'à 3,1 GHz et 101 W avant de redescendre rapidement et de se stabiliser à environ 2,4 GHz et 84 W afin de maintenir une température raisonnable de 81 C. La température du cœur peut atteindre 97 C si le GPU est également sollicité en même temps, comme le montrent nos captures d'écran ci-dessous.
Le GPU Nvidia se stabilise à 2115 MHz, 86 C et 94 W, respectivement, en mode Performance Witcher 3 en mode Performance. En mode équilibré, le GPU descend à 2085 MHz, 76 C et 86 W. Nous n'avons pu atteindre qu'un pic de puissance GPU de 105 W dans le monde réel par rapport à l'objectif TGP de 130 W.
L'utilisation de la batterie limite les performances. Un test Fire Strike sur batterie donnerait des scores de physique et de graphisme de 21003 et 17627 points, respectivement, contre 33936 et 27343 points sur secteur.
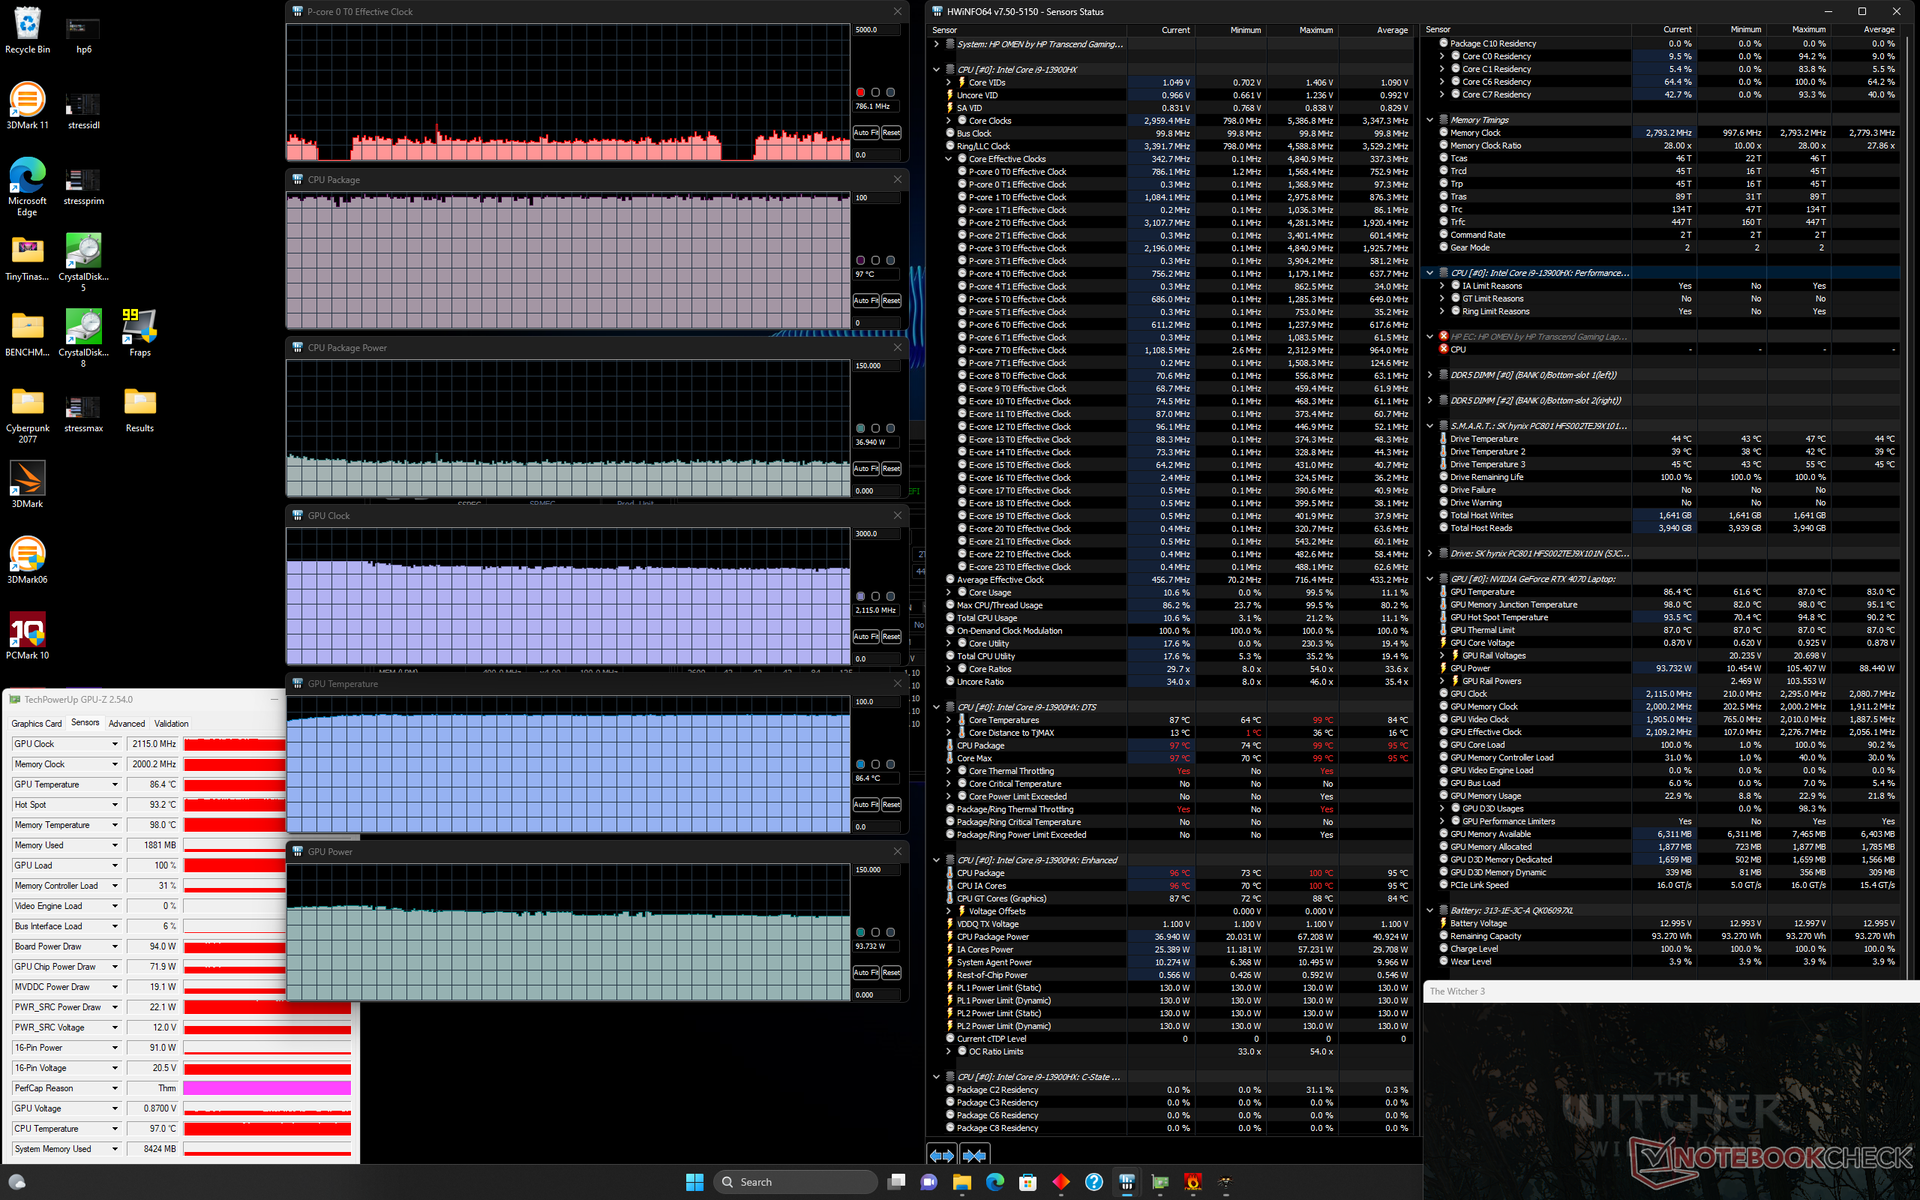
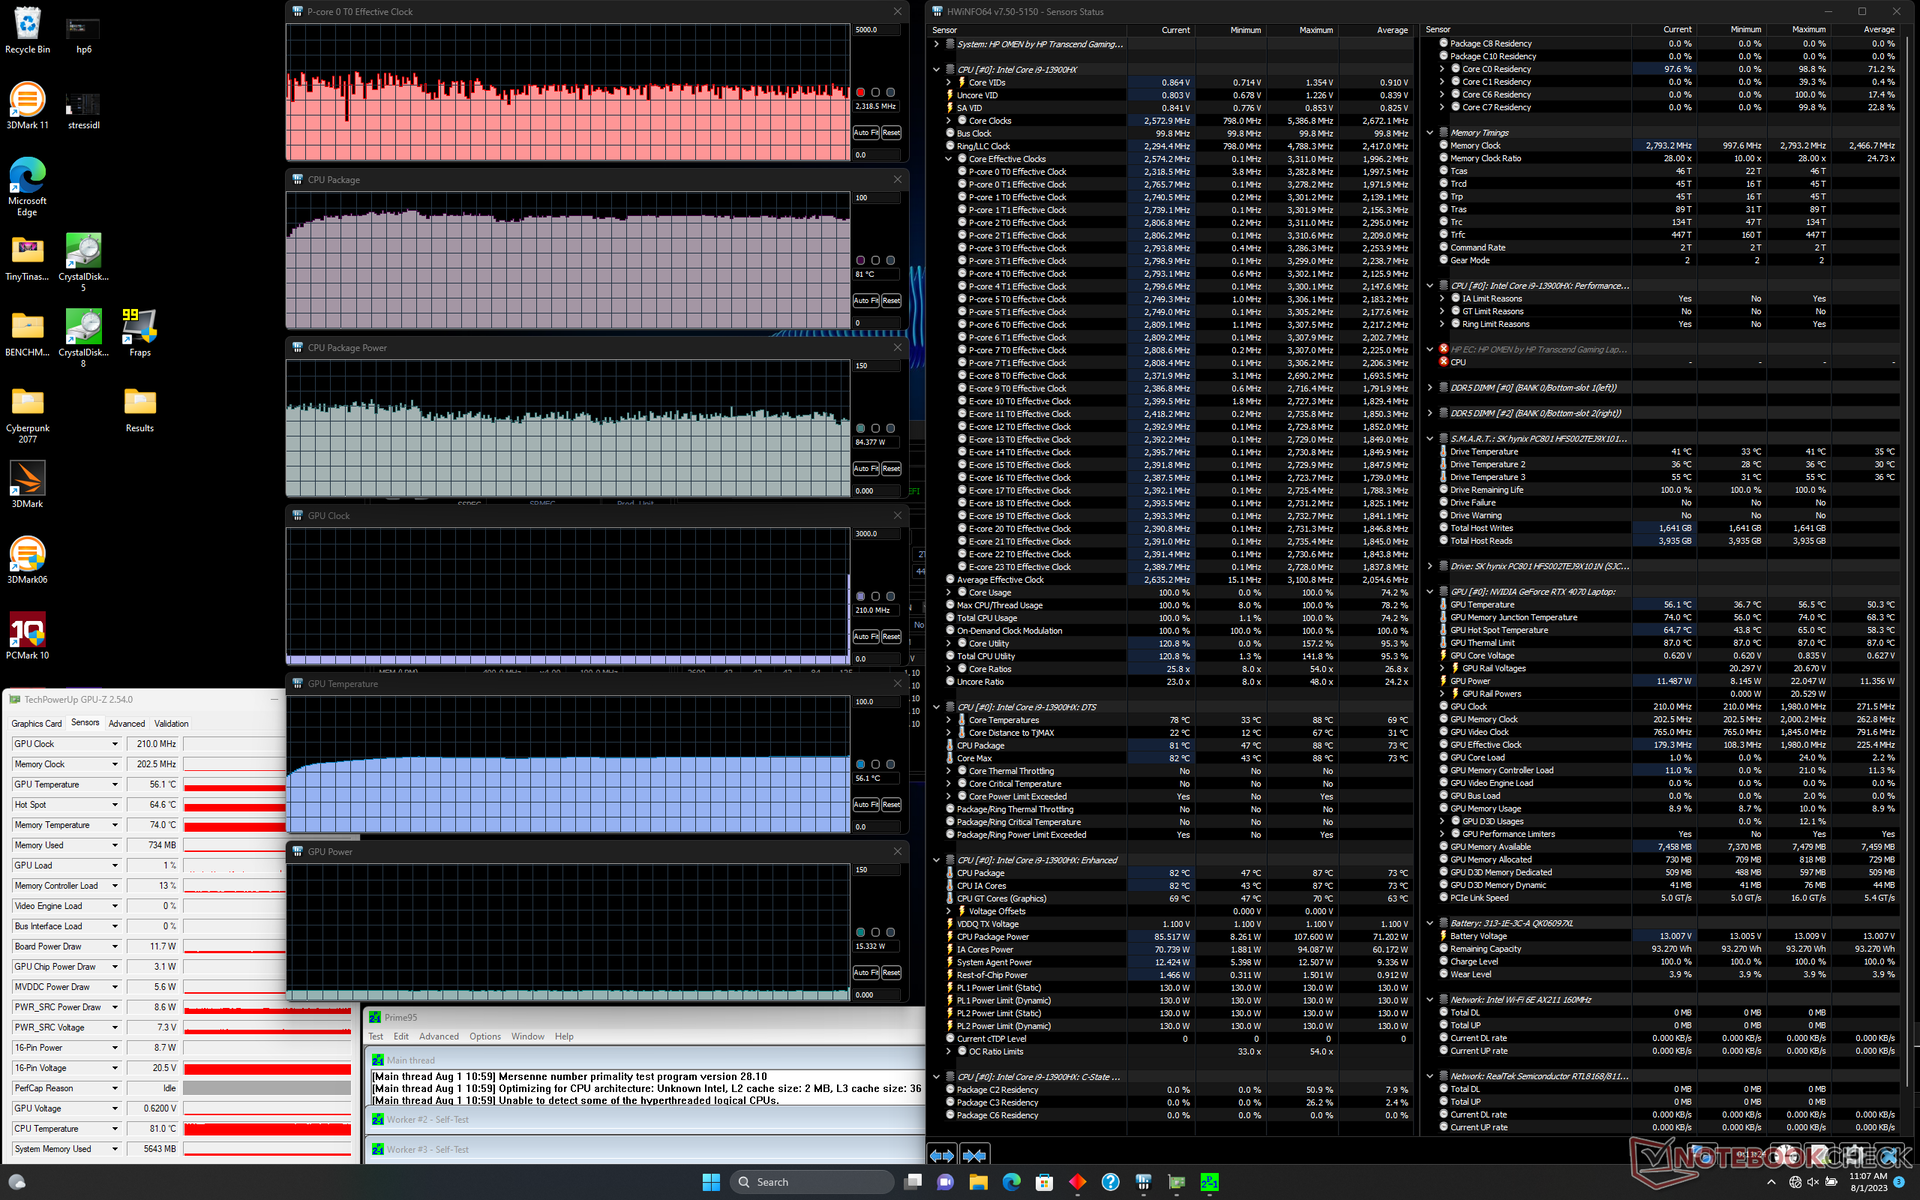
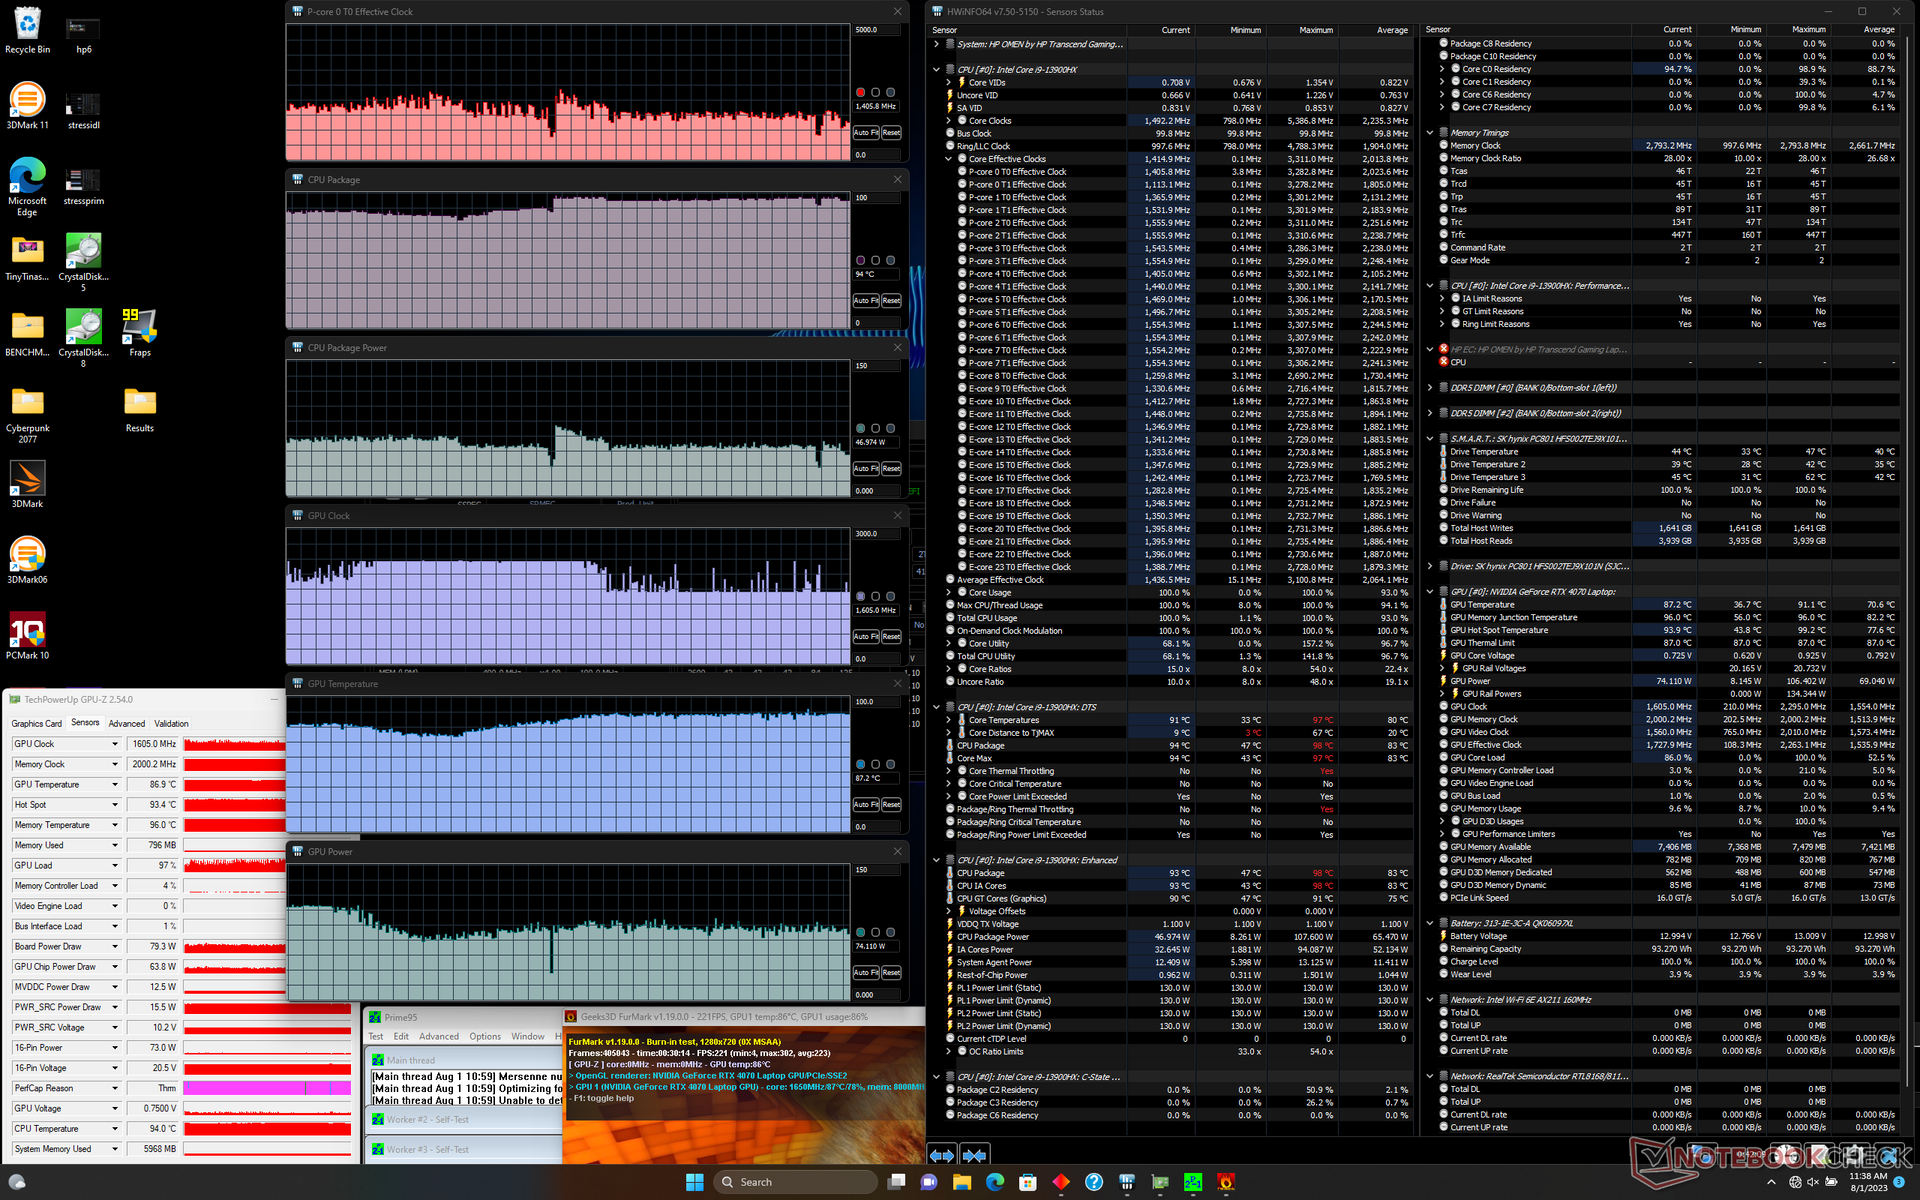
| Horloge du CPU (GHz) | Horloge du GPU (MHz) | Température moyenne du CPU (°C) | Température moyenne du GPU (°C) | |
| Système en veille | -- | -- | 48 | 38 |
| Prime95 Stress | ~2.0 - 2.4 | -- | 81 | 56 |
| Prime95 + FurMark Stress | ~1.5 | 1605 | 94 | 87 |
| Witcher 3 Stress(mode équilibré) | ~0,7 | 2085 | 80 | 77 |
| Witcher 3 Stress (mode Performance) | ~0,7 | 2115 | 97 | 87 |
Intervenants
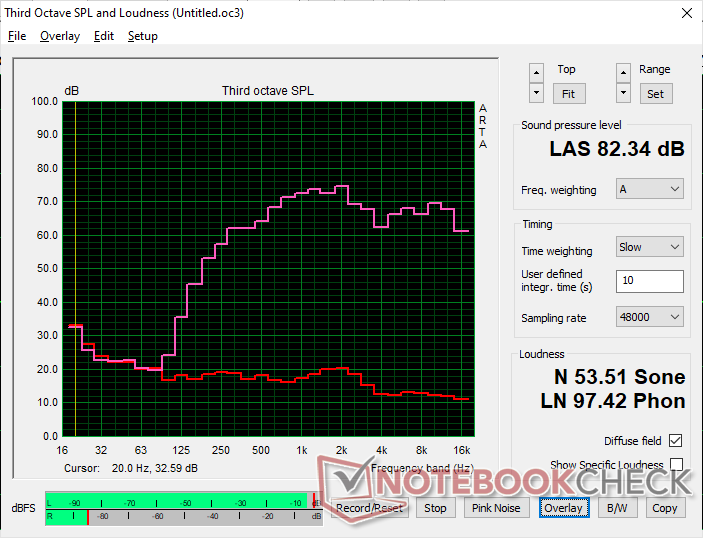
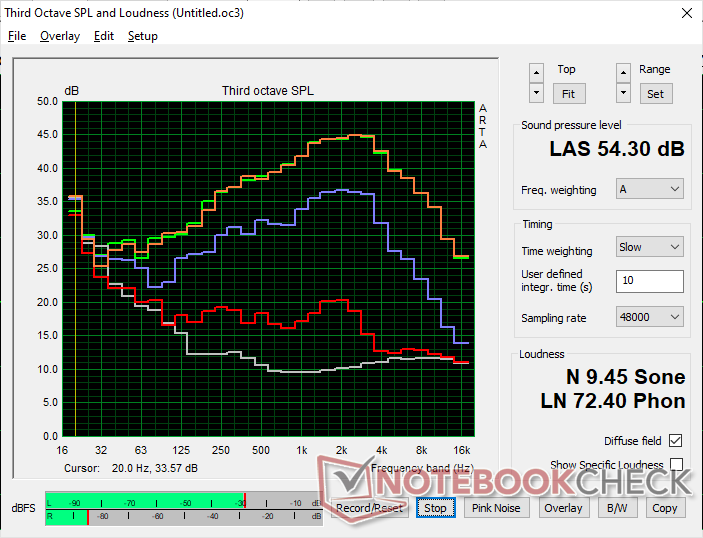
HP Omen Transcend 16 analyse audio
(+) | les haut-parleurs peuvent jouer relativement fort (82.3# dB)
Basses 100 - 315 Hz
(-) | presque aucune basse - en moyenne 20% plus bas que la médiane
(±) | la linéarité des basses est moyenne (14.3% delta à la fréquence précédente)
Médiums 400 - 2000 Hz
(±) | médiane supérieure - en moyenne 5.2% supérieure à la médiane
(+) | les médiums sont linéaires (3.7% delta à la fréquence précédente)
Aiguës 2 - 16 kHz
(+) | des sommets équilibrés - à seulement 2% de la médiane
(+) | les aigus sont linéaires (6.7% delta à la fréquence précédente)
Globalement 100 - 16 000 Hz
(±) | la linéarité du son global est moyenne (17% de différence avec la médiane)
Par rapport à la même classe
» 45% de tous les appareils testés de cette catégorie étaient meilleurs, 12% similaires, 43% pires
» Le meilleur avait un delta de 6%, la moyenne était de 18%, le pire était de 132%.
Par rapport à tous les appareils testés
» 31% de tous les appareils testés étaient meilleurs, 8% similaires, 61% pires
» Le meilleur avait un delta de 4%, la moyenne était de 23%, le pire était de 134%.
Apple MacBook Pro 16 2021 M1 Pro analyse audio
(+) | les haut-parleurs peuvent jouer relativement fort (84.7# dB)
Basses 100 - 315 Hz
(+) | bonne basse - seulement 3.8% loin de la médiane
(+) | les basses sont linéaires (5.2% delta à la fréquence précédente)
Médiums 400 - 2000 Hz
(+) | médiane équilibrée - seulement 1.3% de la médiane
(+) | les médiums sont linéaires (2.1% delta à la fréquence précédente)
Aiguës 2 - 16 kHz
(+) | des sommets équilibrés - à seulement 1.9% de la médiane
(+) | les aigus sont linéaires (2.7% delta à la fréquence précédente)
Globalement 100 - 16 000 Hz
(+) | le son global est linéaire (4.6% différence à la médiane)
Par rapport à la même classe
» 0% de tous les appareils testés de cette catégorie étaient meilleurs, 0% similaires, 100% pires
» Le meilleur avait un delta de 5%, la moyenne était de 17%, le pire était de 45%.
Par rapport à tous les appareils testés
» 0% de tous les appareils testés étaient meilleurs, 0% similaires, 100% pires
» Le meilleur avait un delta de 4%, la moyenne était de 23%, le pire était de 134%.
Gestion de l'énergie
Consommation d'énergie - Chiffres élevés au ralenti
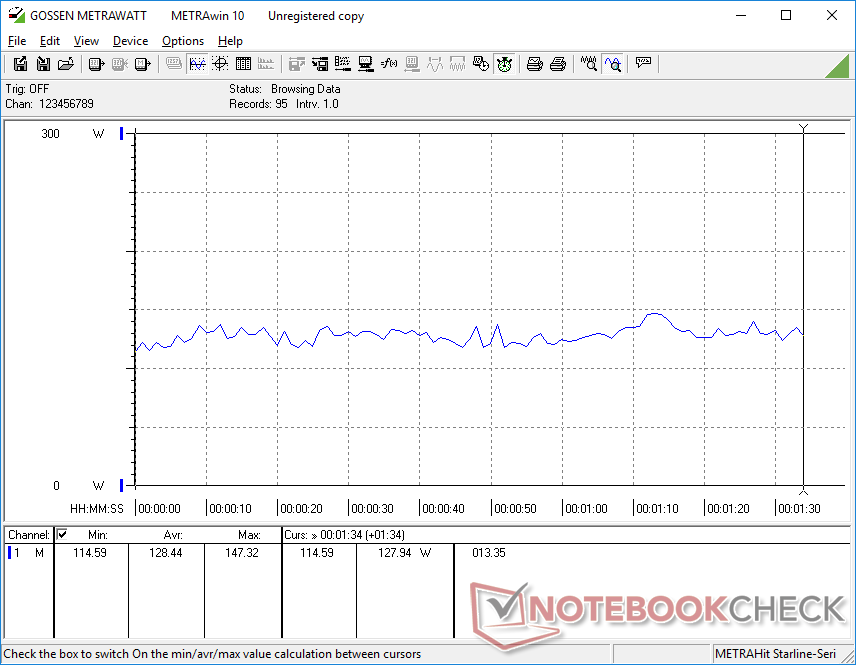
Notre Omen Transcend 16 est équipé d'un CPU plus rapide mais d'un GPU plus lent que l'Omen 16 et la consommation moyenne d'énergie est donc à peu près la même entre les deux. Les différences sont plus marquées lorsque l'on sollicite uniquement le CPU ou le GPU. Par exemple, notre Omen Transcend 16 consommerait environ 15 à 20 W de plus en exécutant Prime95, alors qu'il consommerait environ 15 W de moins en exécutant FurMark.
La marche au ralenti sur l'ordinateur de bureau peut consommer jusqu'à 55 W avec le profil Performance. L'écran Mini-LED est connu pour être généralement plus exigeant qu'un écran IPS standard.
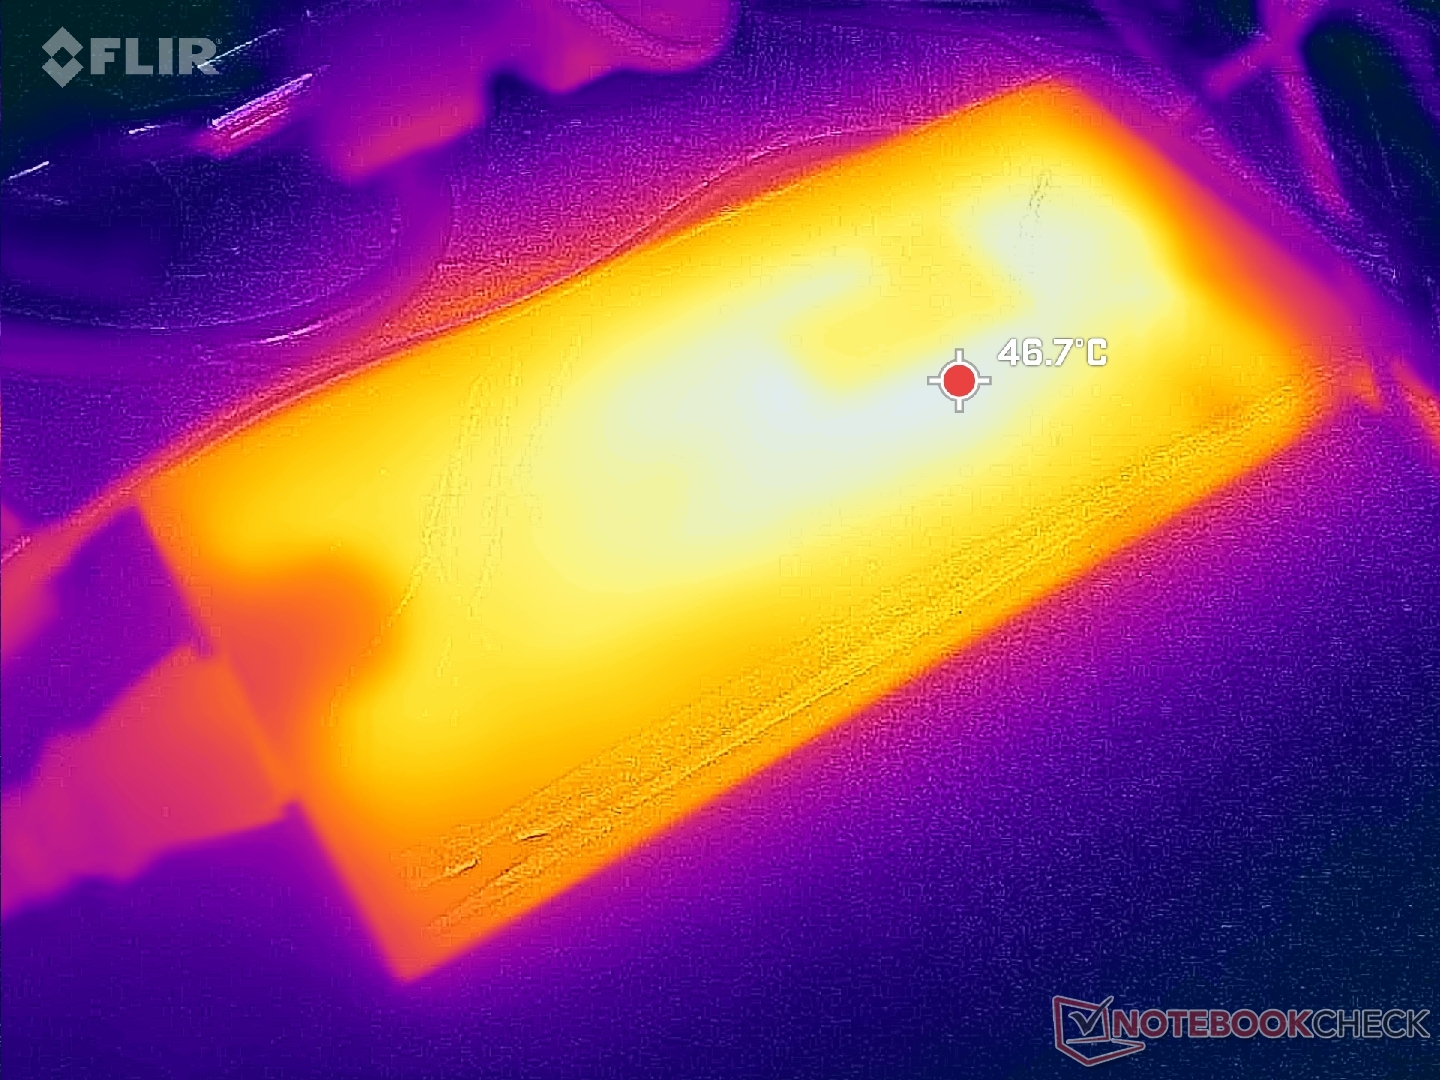
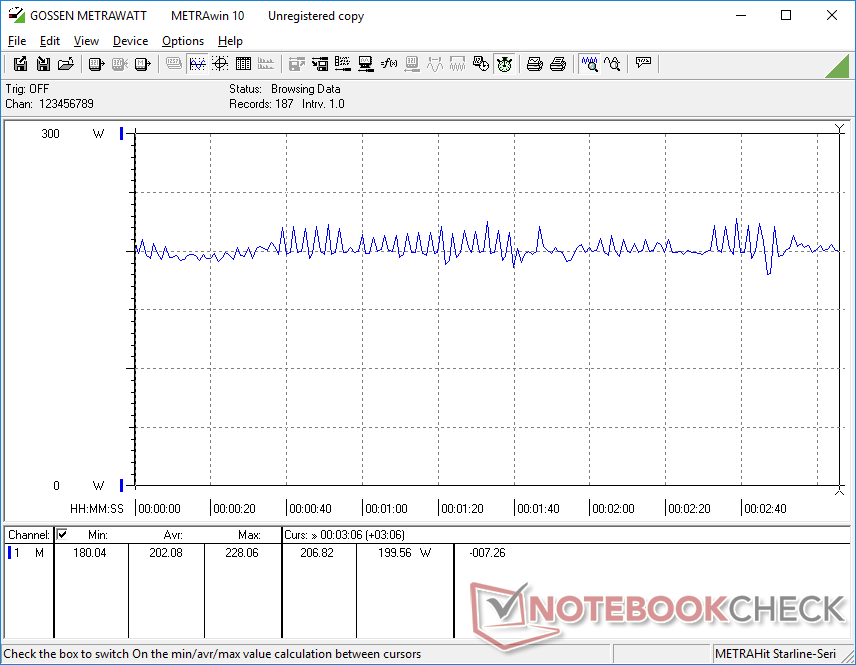
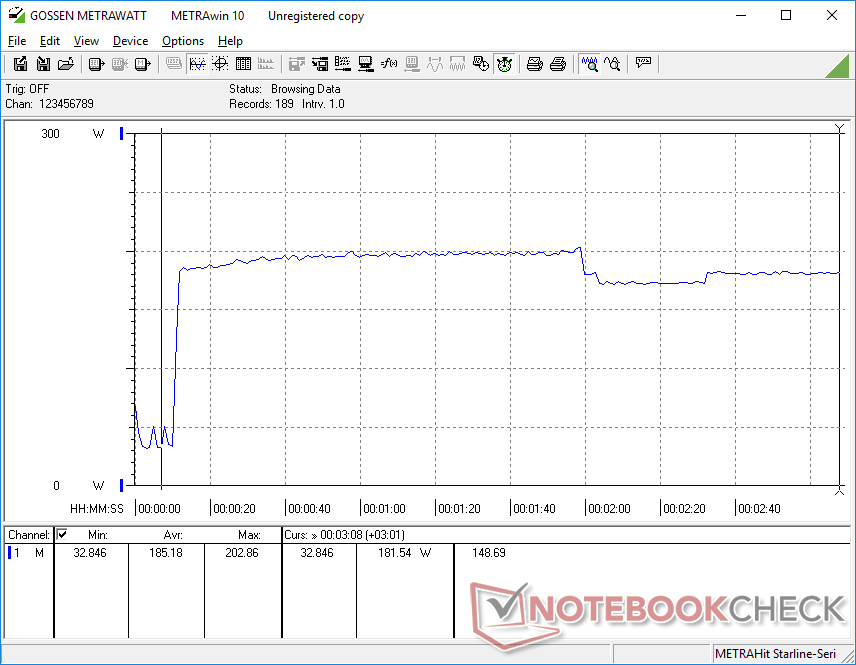
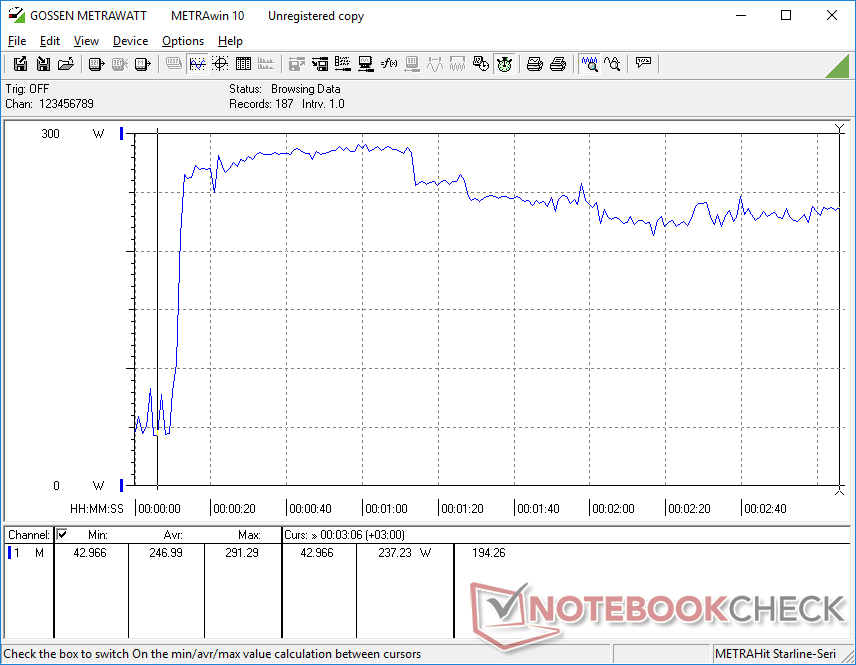
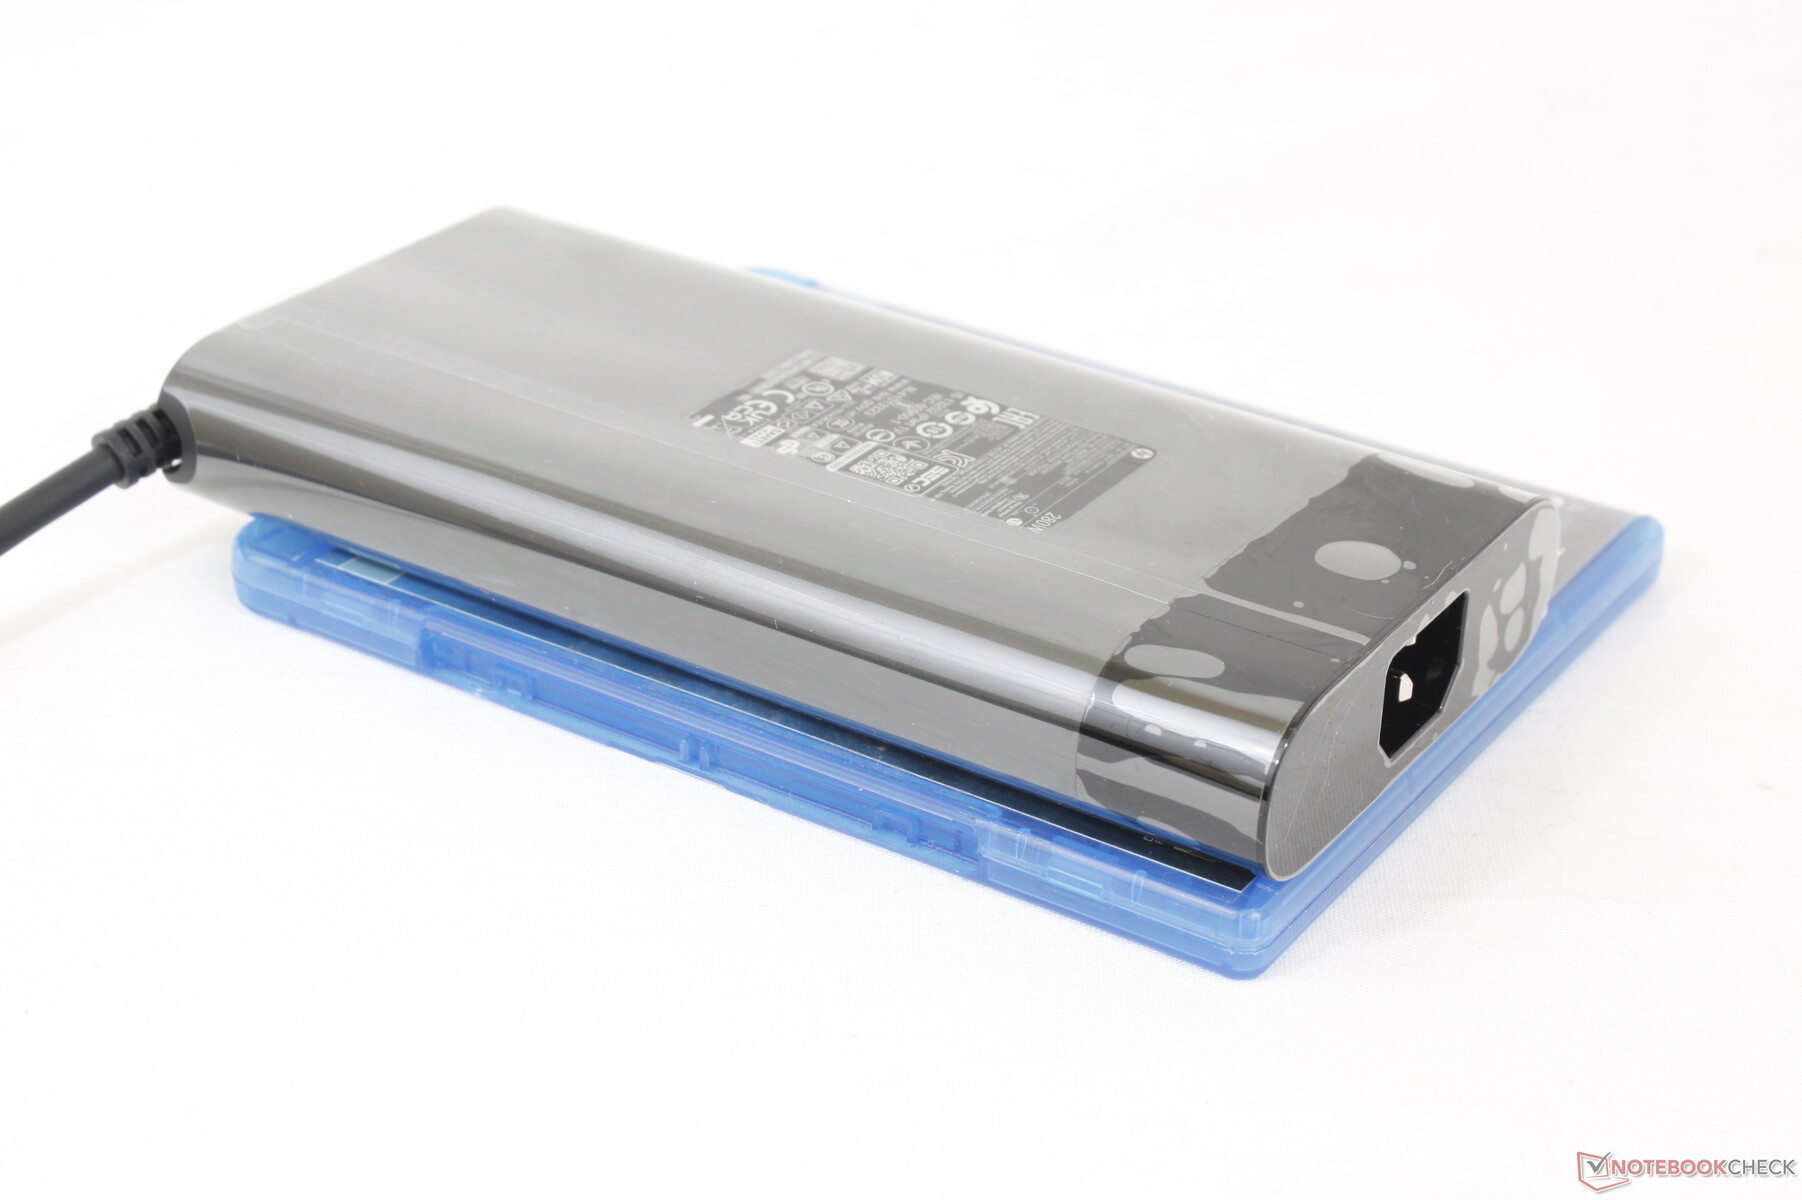
Nous avons pu enregistrer une consommation maximale de 292 W avec l'adaptateur secteur 280 W de taille moyenne (~18 x 8,7 x 2,6 cm) lorsque le CPU et le GPU sont tous deux utilisés à 100 %. La consommation se stabilise autour de 240 W après environ une minute de sollicitation maximale.
| Éteint/en veille | |
| Au repos | |
| Fortement sollicité |
|
Légende:
min: | |
| HP Omen Transcend 16 i9-13900HX, GeForce RTX 4070 Laptop GPU, SK hynix PC801 HFS002TEJ9X101N, Mini-LED, 2560x1600, 16" | Lenovo Legion Slim 7i 16 Gen 8 i9-13900H, GeForce RTX 4070 Laptop GPU, Samsung PM9A1 MZVL21T0HCLR, IPS, 2560x1600, 16" | HP Omen 16-wf000 i7-13700HX, GeForce RTX 4080 Laptop GPU, SK hynix PC801 HFS002TEJ9X101N, IPS, 2560x1440, 16.1" | Alienware x16 R1 i9-13900HK, GeForce RTX 4080 Laptop GPU, SK hynix PC801 HFS001TEJ9X101N, IPS, 2560x1600, 16" | Acer Nitro 16 AN16-41 R7 7735HS, GeForce RTX 4070 Laptop GPU, Samsung PM9A1 MZVL21T0HCLR, IPS, 2560x1600, 16" | Asus ROG Zephyrus M16 GU603Z i9-12900H, GeForce RTX 3070 Ti Laptop GPU, Micron 3400 1TB MTFDKBA1T0TFH, IPS, 2560x1600, 16" | |
|---|---|---|---|---|---|---|
| Power Consumption | 9% | 3% | -12% | 29% | 34% | |
| Idle Minimum * (Watt) | 19.2 | 22 -15% | 21.8 -14% | 25.2 -31% | 11.6 40% | 10.8 44% |
| Idle Average * (Watt) | 22.7 | 29 -28% | 26 -15% | 29.9 -32% | 15.6 31% | 17 25% |
| Idle Maximum * (Watt) | 55.4 | 39.5 29% | 36 35% | 49.8 10% | 16.5 70% | 17.8 68% |
| Load Average * (Watt) | 128.4 | 98.7 23% | 115.5 10% | 105.4 18% | 155 -21% | 116 10% |
| Witcher 3 ultra * (Watt) | 206 | 171.8 17% | 214 -4% | 263 -28% | 154.8 25% | 144 30% |
| Load Maximum * (Watt) | 292 | 213.2 27% | 269.7 8% | 313.8 -7% | 205 30% | 220 25% |
* ... Moindre est la valeur, meilleures sont les performances
Power Consumption Witcher 3 / Stresstest
Power Consumption external Monitor
Autonomie de la batterie
La capacité de la batterie est passée de 83 Wh sur l'Omen 16 à 97 Wh sur notre Omen Transcend 16. Néanmoins, la durée de vie de la batterie est toujours plus courte en raison du panneau mini-LED plus exigeant. Nous avons pu enregistrer un peu plus de 4 heures de navigation WLAN dans le monde réel avec le profil d'alimentation équilibré et l'iGPU actif, alors que l'Omen 16 peut approcher les 5 heures avec des paramètres similaires.
Le chargement de la batterie vide à sa pleine capacité avec l'adaptateur secteur fourni prend environ 90 minutes. Le système peut également être rechargé via USB-C, mais les adaptateurs de moindre capacité risquent de ne pas fonctionner. Notre adaptateur secteur USB-C de 65 W, par exemple, générerait un message d'erreur de compatibilité alors que notre adaptateur USB-C de 135 W se chargerait sans problème.
| HP Omen Transcend 16 i9-13900HX, GeForce RTX 4070 Laptop GPU, 97 Wh | Lenovo Legion Slim 7i 16 Gen 8 i9-13900H, GeForce RTX 4070 Laptop GPU, 99.9 Wh | HP Omen 16-wf000 i7-13700HX, GeForce RTX 4080 Laptop GPU, 83 Wh | Alienware x16 R1 i9-13900HK, GeForce RTX 4080 Laptop GPU, 90 Wh | Acer Nitro 16 AN16-41 R7 7735HS, GeForce RTX 4070 Laptop GPU, 90 Wh | Asus ROG Zephyrus M16 GU603Z i9-12900H, GeForce RTX 3070 Ti Laptop GPU, 90 Wh | |
|---|---|---|---|---|---|---|
| Autonomie de la batterie | -13% | 0% | -22% | 86% | 47% | |
| Reader / Idle (h) | 6.3 | 5.1 -19% | 5.5 -13% | 7.3 16% | 12.2 94% | |
| WiFi v1.3 (h) | 4.2 | 4.4 5% | 5.1 21% | 2.5 -40% | 9 114% | 7.4 76% |
| Load (h) | 1.2 | 0.9 -25% | 1.1 -8% | 0.7 -42% | 1.8 50% | 1.4 17% |
| H.264 (h) | 10.2 | 7.3 |
Points positifs
Points négatifs
Verdict - Un superbe design et un écran mini-LED unique, mais où est la RTX 4080 de GeForce?
L'Omen Transcend 16 offre plusieurs améliorations par rapport à l'Omen 16 standard, notamment un capteur IR, un format 16:10, une batterie de plus grande capacité et une option mini-LED. Cette dernière option est peut-être la plus unique car ce modèle est l'un des premiers à proposer un écran mini-LED QHD+ 240 Hz pour une expérience visuelle différente de celle de la plupart des autres ordinateurs portables de jeu où l'IPS et l'OLED sont encore monnaie courante. Les utilisateurs qui apprécient la luminosité et les fonctions HDR1000 apprécieront particulièrement les avantages du mini-LED.
L'Omen Transcend 16 abandonne les options de GPU supérieur au profit d'un CPU plus rapide et d'un profil plus fin et plus léger. En même temps, son écran Mini-LED est extraordinairement lumineux pour le contenu HDR le plus vibrant sur n'importe quel ordinateur portable de jeu.
Le dernier modèle n'est pas nécessairement meilleur que l'Omen 16 normal, car il omet quelques caractéristiques importantes. Tout d'abord, l'Omen Transcend 16 ne prend en charge qu'un seul SSD interne, alors que l'Omen 16 peut en prendre en charge deux. Deuxièmement, et peut-être plus important encore, l'Omen Transcend 16 plafonne au GPU RTX 4070 de 130 W GeForce alors que l'Omen 16 peut être configuré avec la RTX 4080 de 145 W GeForce. Cette limitation du GPU pourrait être due au profil plus fin et à l'option CPU Core i9-13900HX plus élevée de l'Omen Transcend 16. Par conséquent, les utilisateurs qui préfèrent des performances GPU plus rapides peuvent envisager le modèle omen 16 normal tandis que ceux qui préfèrent une performance CPU plus rapide peuvent considérer l'Omen Transcend 16.
Prix et disponibilité
HP livre maintenant son Omen Transcend 16 à partir de $1250 USD pour la configuration de base Core i7-13700HX et RTX 4050 jusqu'à $2500 pour notre configuration d'évaluation.
HP Omen Transcend 16
- 08/04/2023 v7 (old)
Allen Ngo
Transparency
La sélection des appareils à examiner est effectuée par notre équipe éditoriale. L'échantillon de test a été prêté à l'auteur par le fabricant ou le détaillant pour les besoins de cet examen. Le prêteur n'a pas eu d'influence sur cette évaluation et le fabricant n'a pas reçu de copie de cette évaluation avant sa publication. Il n'y avait aucune obligation de publier cet article. En tant que média indépendant, Notebookcheck n'est pas soumis à l'autorité des fabricants, des détaillants ou des éditeurs.
Voici comment Notebookcheck teste
Chaque année, Notebookcheck examine de manière indépendante des centaines d'ordinateurs portables et de smartphones en utilisant des procédures standardisées afin de garantir que tous les résultats sont comparables. Nous avons continuellement développé nos méthodes de test depuis environ 20 ans et avons établi des normes industrielles dans le processus. Dans nos laboratoires de test, des équipements de mesure de haute qualité sont utilisés par des techniciens et des rédacteurs expérimentés. Ces tests impliquent un processus de validation en plusieurs étapes. Notre système d'évaluation complexe repose sur des centaines de mesures et de points de référence bien fondés, ce qui garantit l'objectivité.Price comparison

