Test du HP ZBook Studio 15 G8 : plus d'options que jamais
Comme son nom l'indique, le HP ZBook Studio 15 G8 est le successeur du ZBook Studio 15 G7 avec des processeurs mis à jour et de nouvelles fonctionnalités non disponibles sur les modèles précédents. Le nouveau modèle remplace également le ZBook Create G7 qui était essentiellement le même ordinateur portable que le ZBook Studio G7, mais avec GeForce au lieu des graphiques Quadro. Ainsi, le ZBook Studio G8 a consolidé et hérité de toutes les configurations des deux anciens modèles G7 pour une longue liste d'options configurables allant des CPU vPro à non-vPro Tiger Lake-H et des GPU Quadro et GeForce.
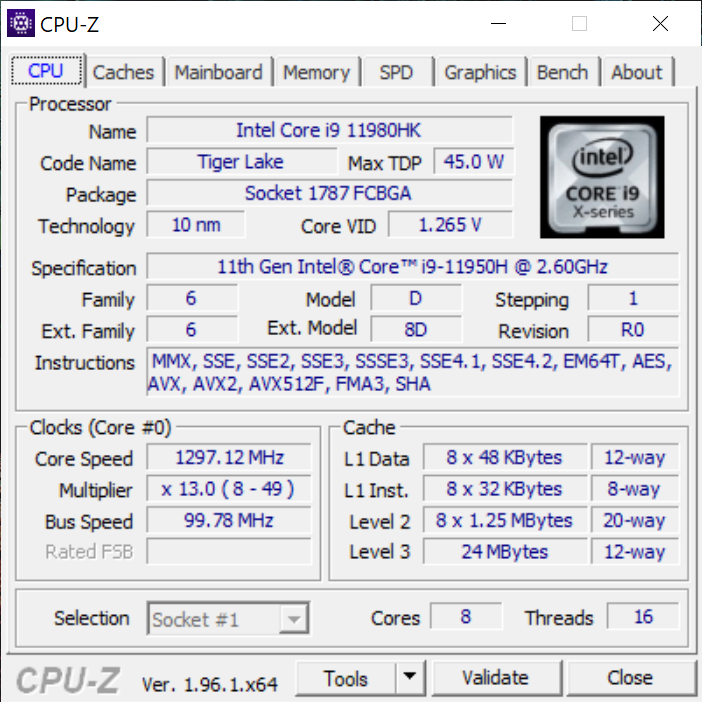
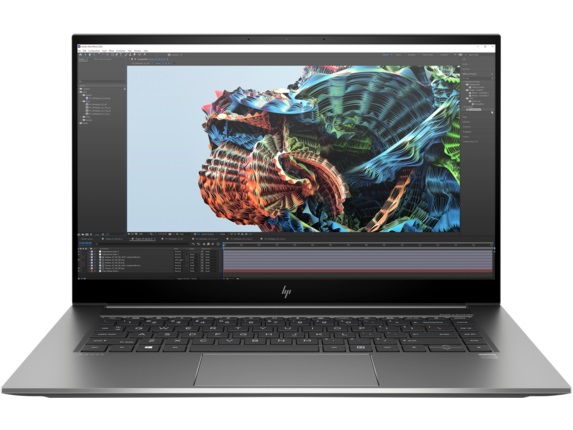
Notre unité de test est une configuration haut de gamme équipée d'un CPU Core i9-11950H compatible vPro, d'un GPU RTX 3070 et d'un écran tactile OLED 4K pour un prix de détail d'environ 4200 $ US. Des SKU plus modestes équipés du Core i7-11800H, de la carte graphique Iris Xe intégrée uniquement, d'un écran FHD ou de la carte graphique Quadro T1200 sont disponibles pour un prix nettement inférieur. Il n'y a pas d'options Xeon, cependant.
Parmi les concurrents directs, on trouve d'autres stations de travail mobiles ultrafines alimentées par un Core-H, comme le MSI WS66, Le studio Razer Blade 15, Asus ProArtou les Lenovo ThinkPad P15s.
Plus de commentaires sur HP :
potential competitors in comparison
Note | Date | Modèle | Poids | Épaisseur | Taille | Résolution | Prix |
|---|---|---|---|---|---|---|---|
| 87.8 % v7 (old) | 08/21 | HP ZBook Studio 15 G8 i9-11950H, GeForce RTX 3070 Laptop GPU | 1.9 kg | 18 mm | 15.60" | 3840x2160 | |
| 83.8 % v7 (old) | 04/21 | HP ZBook Firefly 15 G8 2C9R7EA i7-1165G7, T500 Laptop GPU | 1.8 kg | 19.2 mm | 15.60" | 1920x1080 | |
| 90.6 % v7 (old) | 03/21 | HP ZBook Studio G7 i9-10885H, Quadro RTX 3000 Max-Q | 2 kg | 18 mm | 15.60" | 3840x2160 | |
| 87.8 % v7 (old) | 09/20 | Dell Precision 7550 W-10885M, Quadro RTX 5000 Max-Q | 2.8 kg | 27.36 mm | 15.60" | 3840x2160 | |
| 85.3 % v7 (old) | 06/21 | Lenovo ThinkPad P15s Gen2-20W6000GGE i7-1165G7, T500 Laptop GPU | 1.9 kg | 19.1 mm | 15.60" | 3840x2160 | |
| 83.1 % v7 (old) | 11/20 | Asus ProArt StudioBook Pro 15 W500G5T i7-9750H, Quadro RTX 5000 Max-Q | 2 kg | 18.9 mm | 15.60" | 3840x2160 |
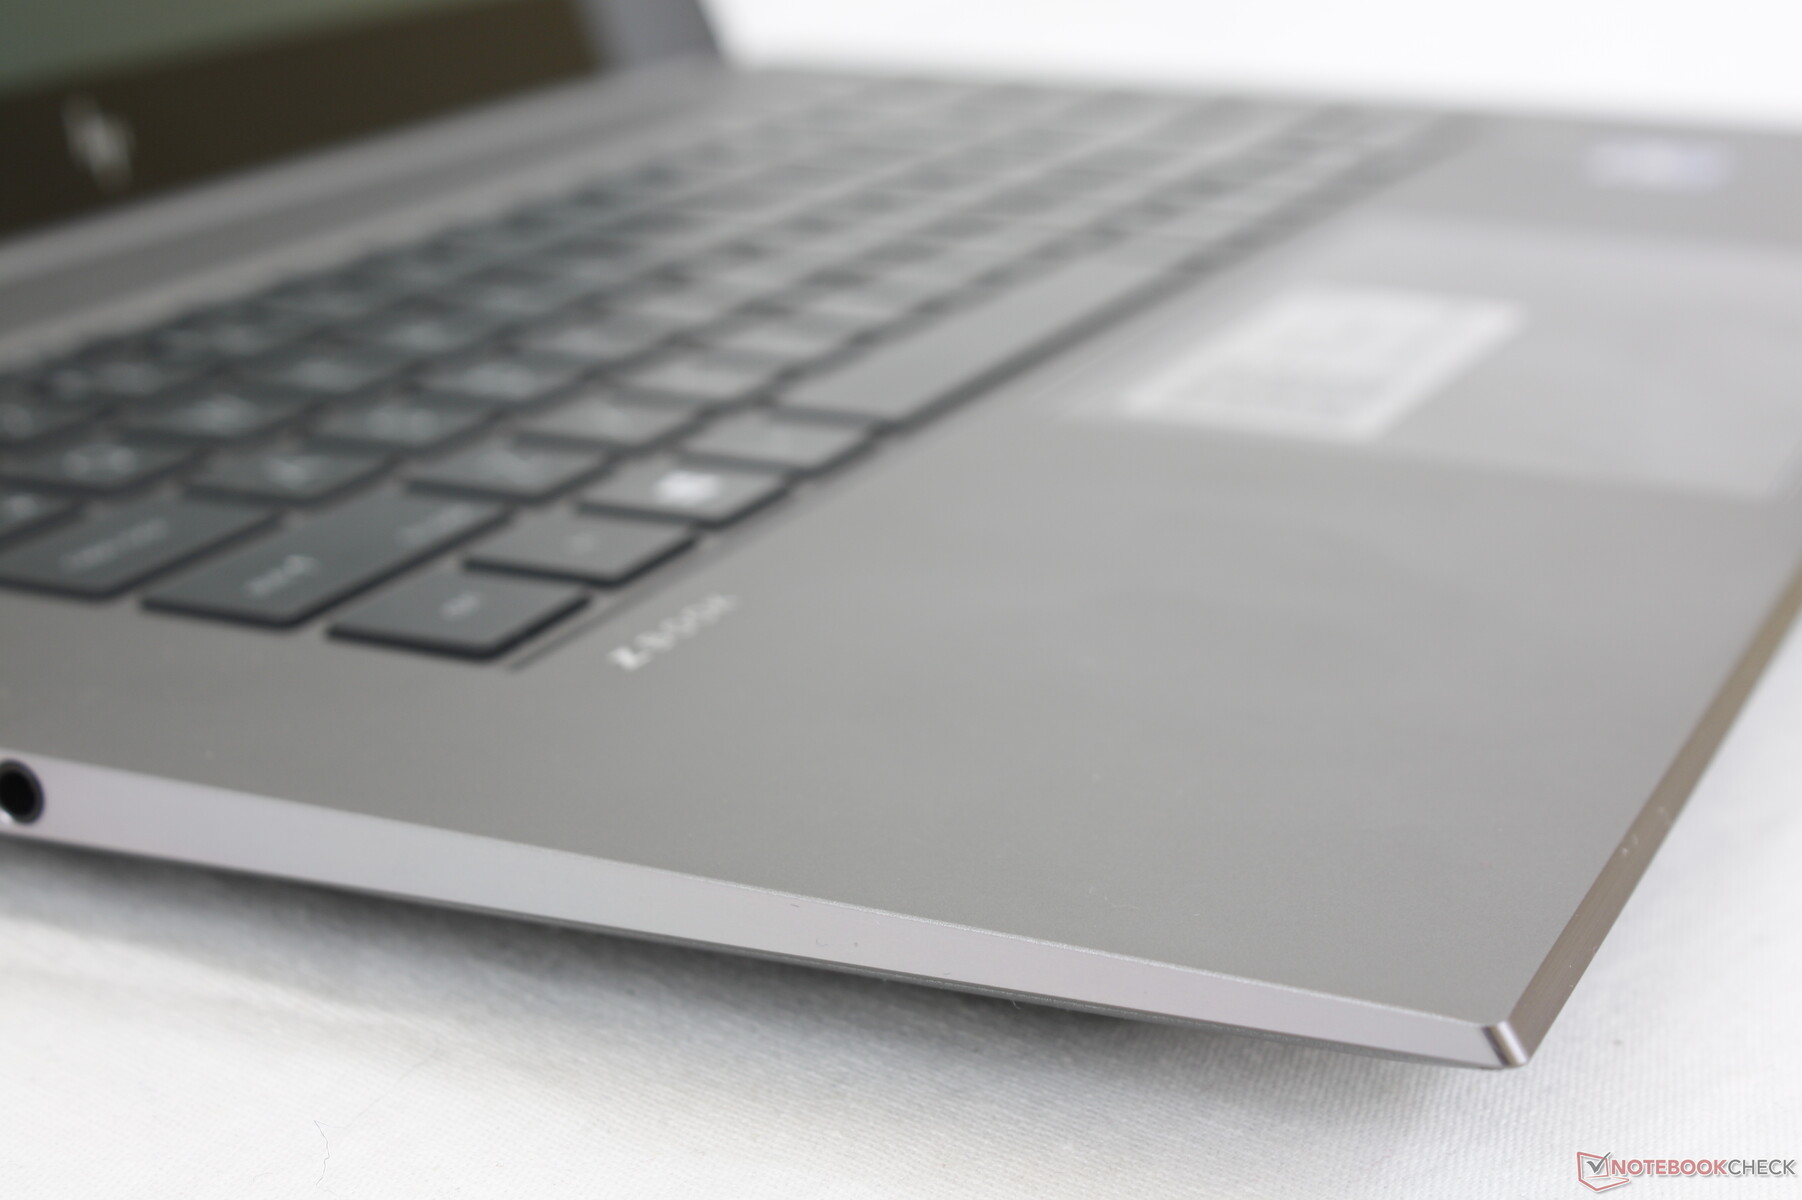
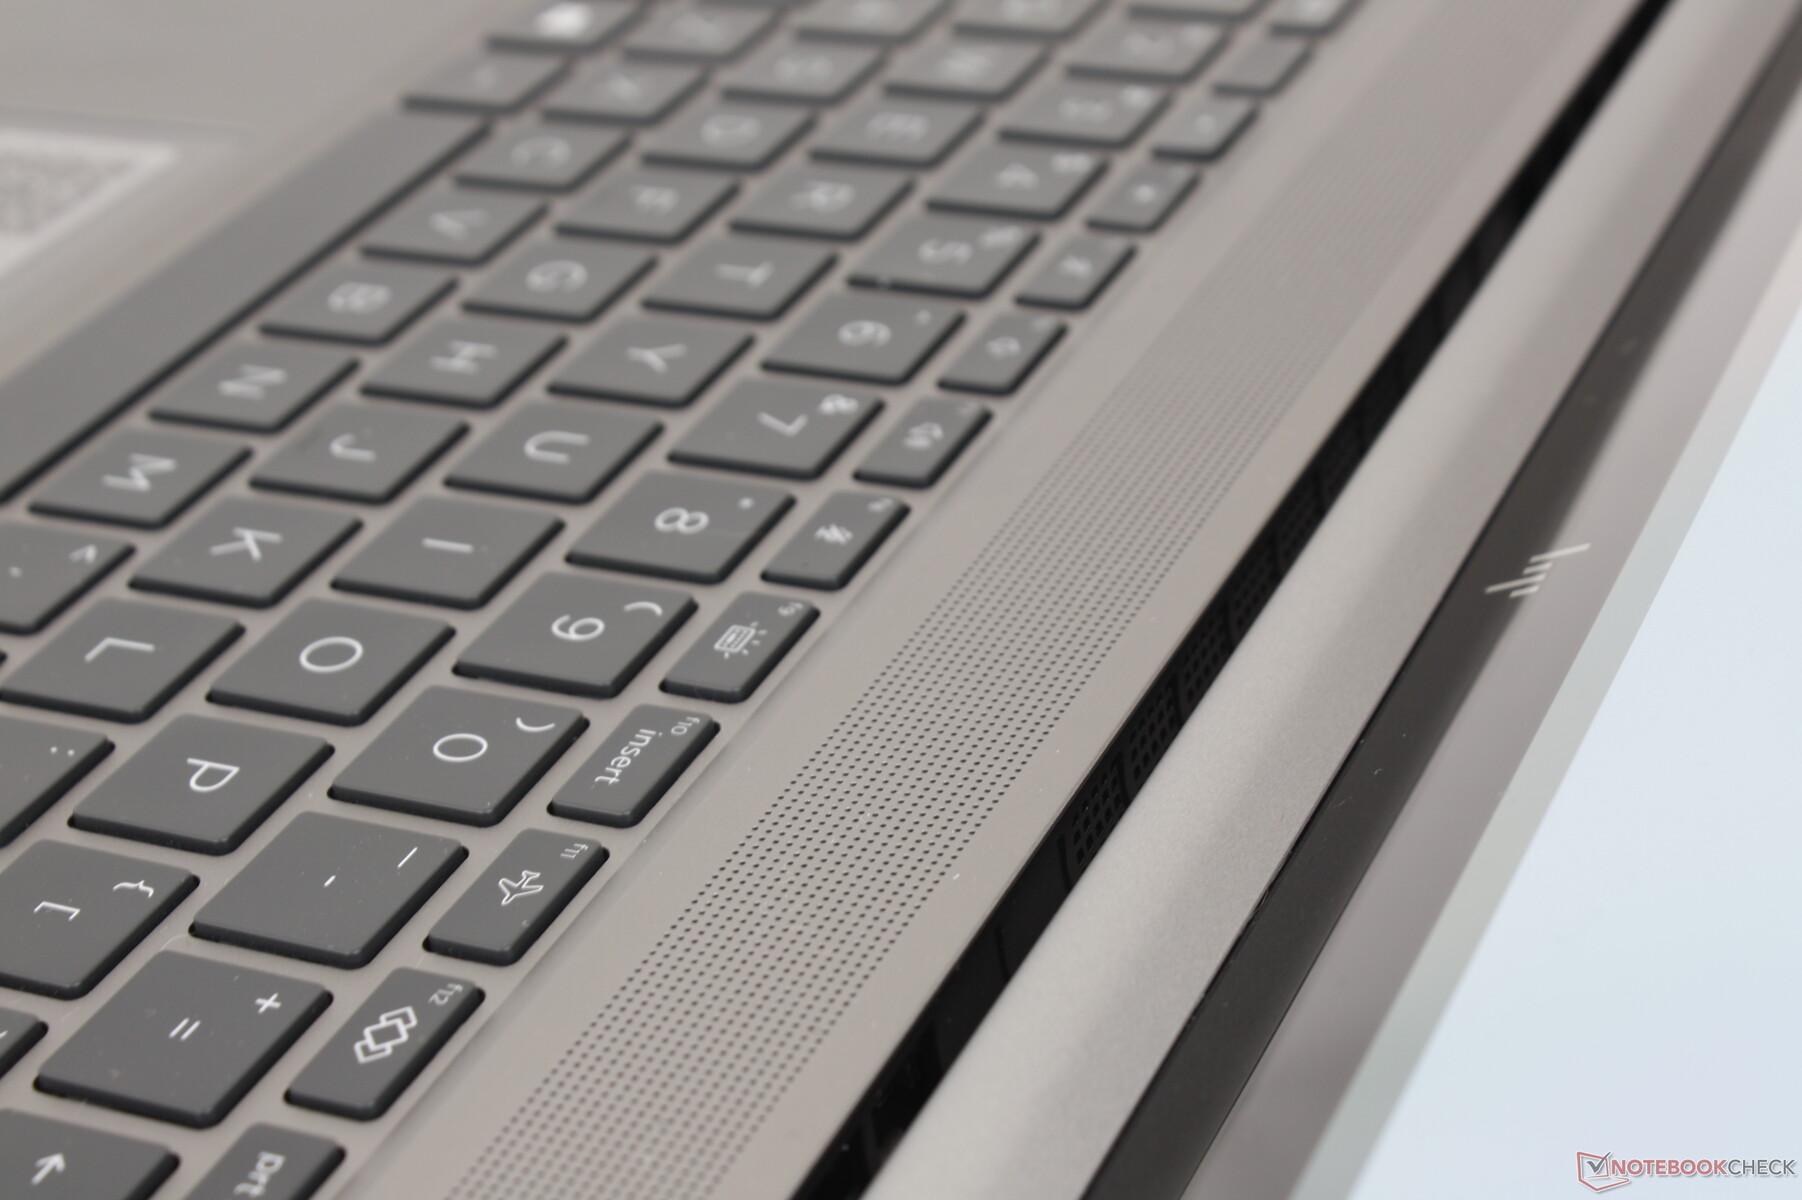
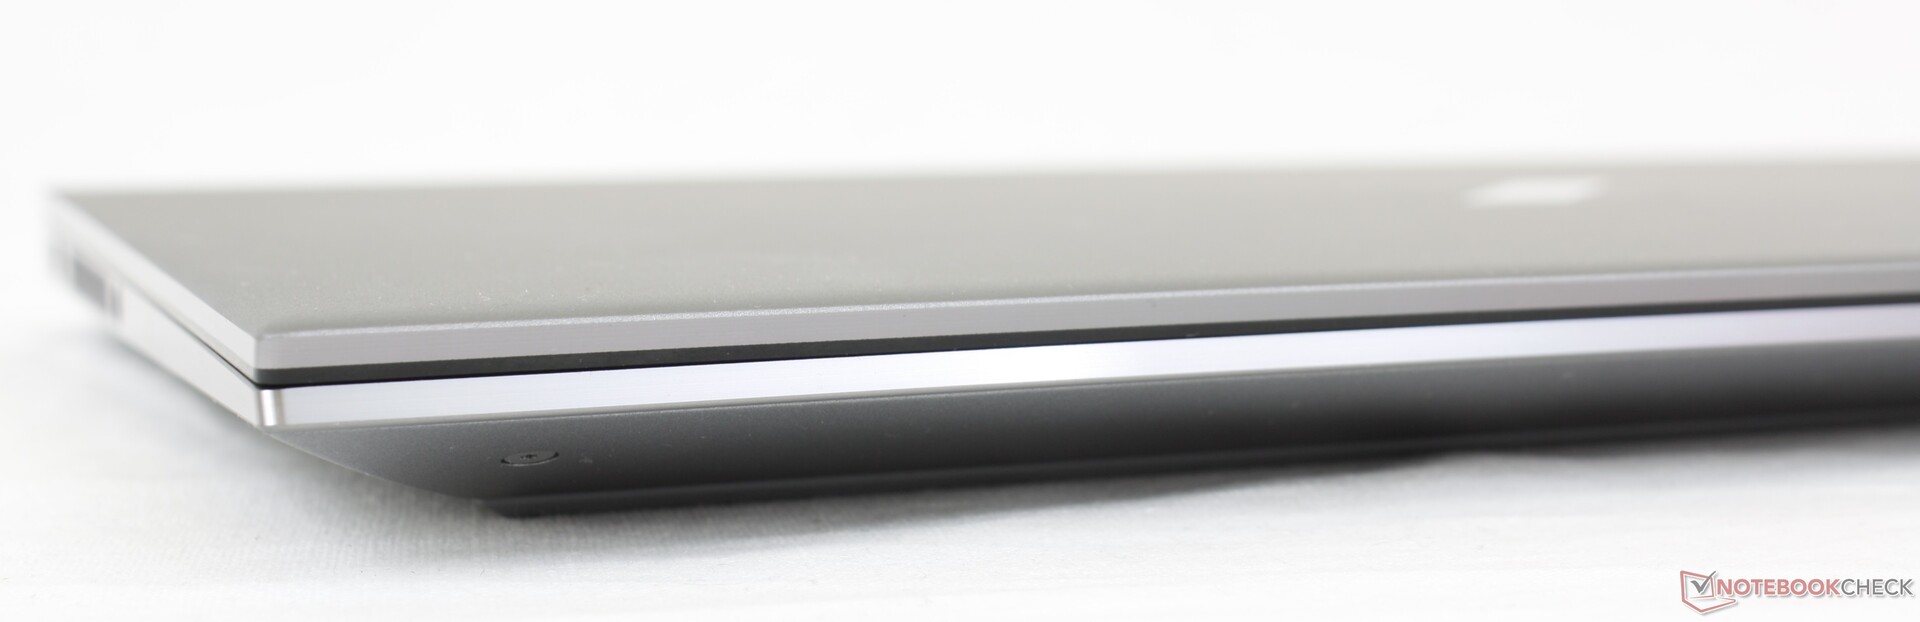
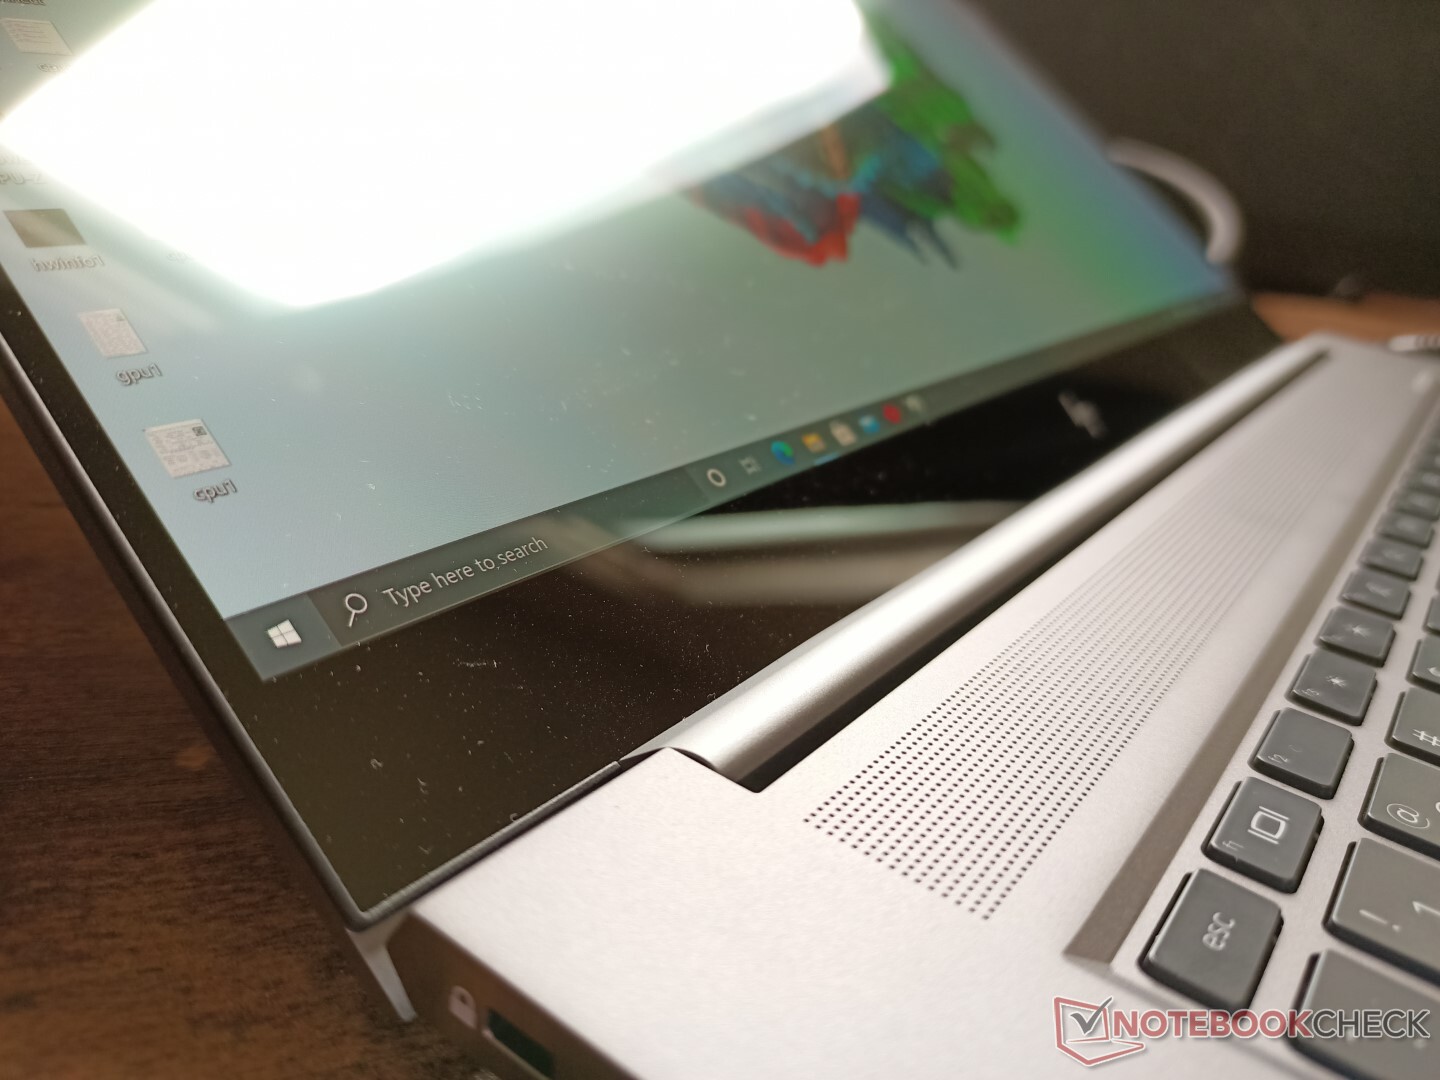
Boîtier - Visuellement identique au ZBook 15 G7
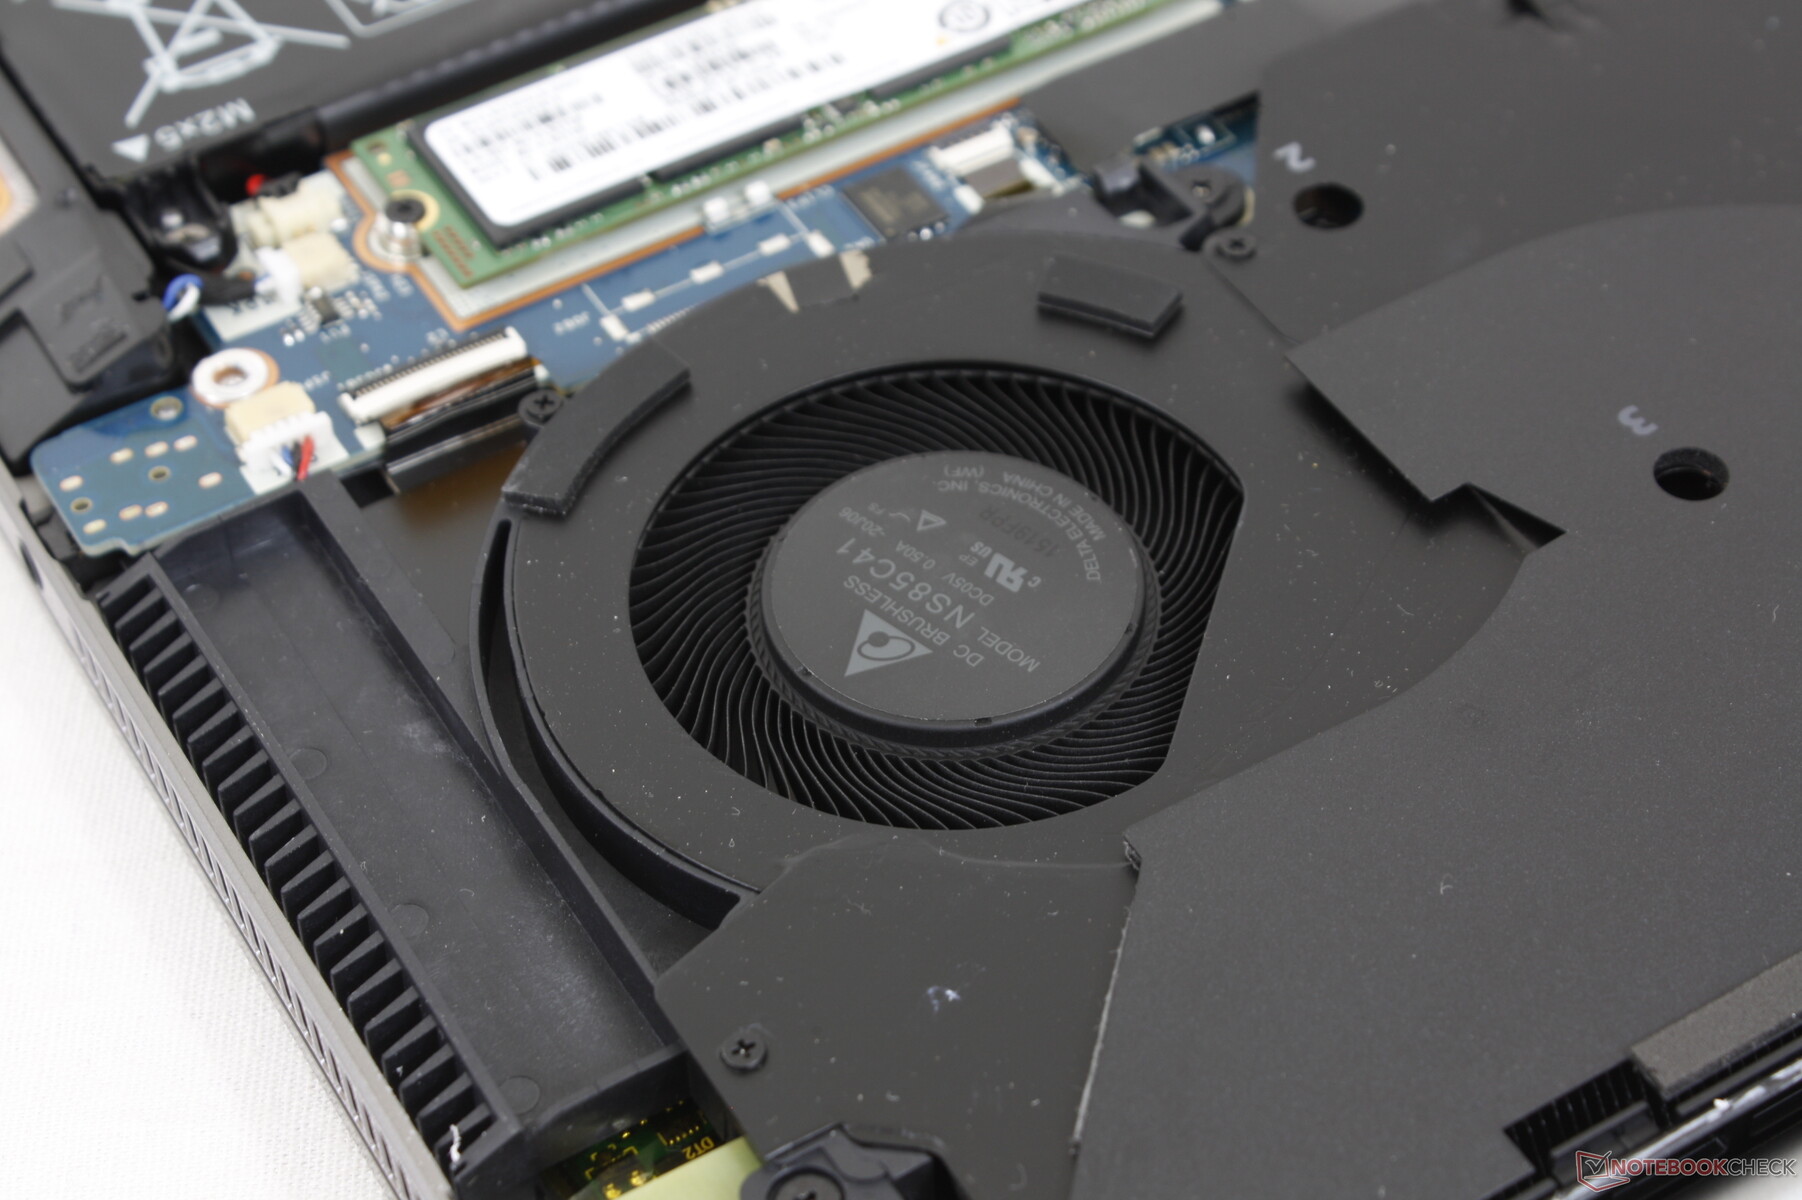
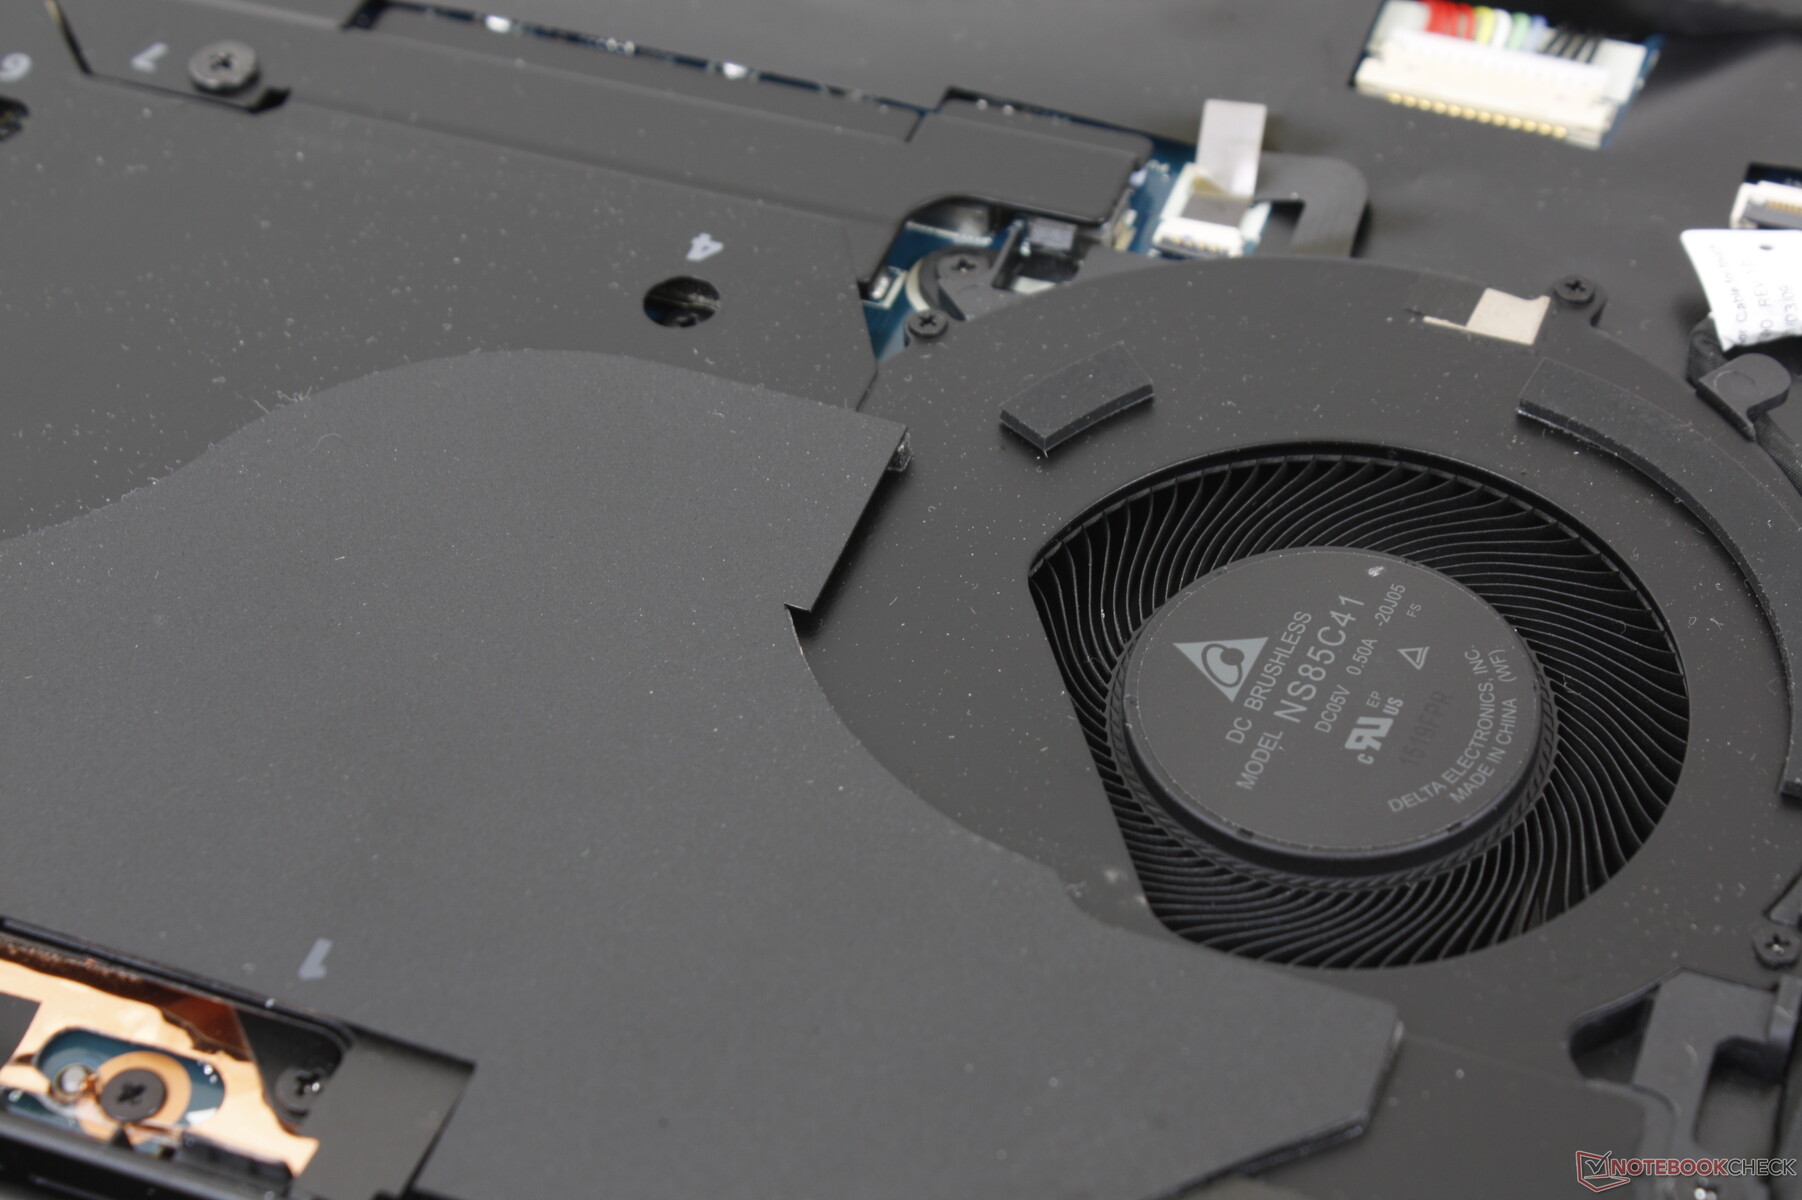
HP n'a pas changé la conception du châssis externe et donc nos commentaires originaux sur le ZBook Studio 15 G7 s'appliquent également ici. Au lieu de cela, les changements sont internes, y compris l'éclairage RVB optionnel par touche et une solution de refroidissement révisée pour aspirer plus d'air que sur le modèle de l'année dernière.
Ce modèle continue d'être l'une des plus petites stations de travail de 15,6 pouces disponibles avec des processeurs de la série Core-H et des graphiques de niveau GeForce/Quadro, malgré son "ancien" design de châssis. Il est même plus petit que le ZBook Firefly G8 qui vient avec des internes plus lents que notre ZBook Studio G8.
Il convient de noter que les modèles à écran tactile sont légèrement plus épais que les modèles sans écran tactile, d'un centième de pouce (0,70" contre 0,69").
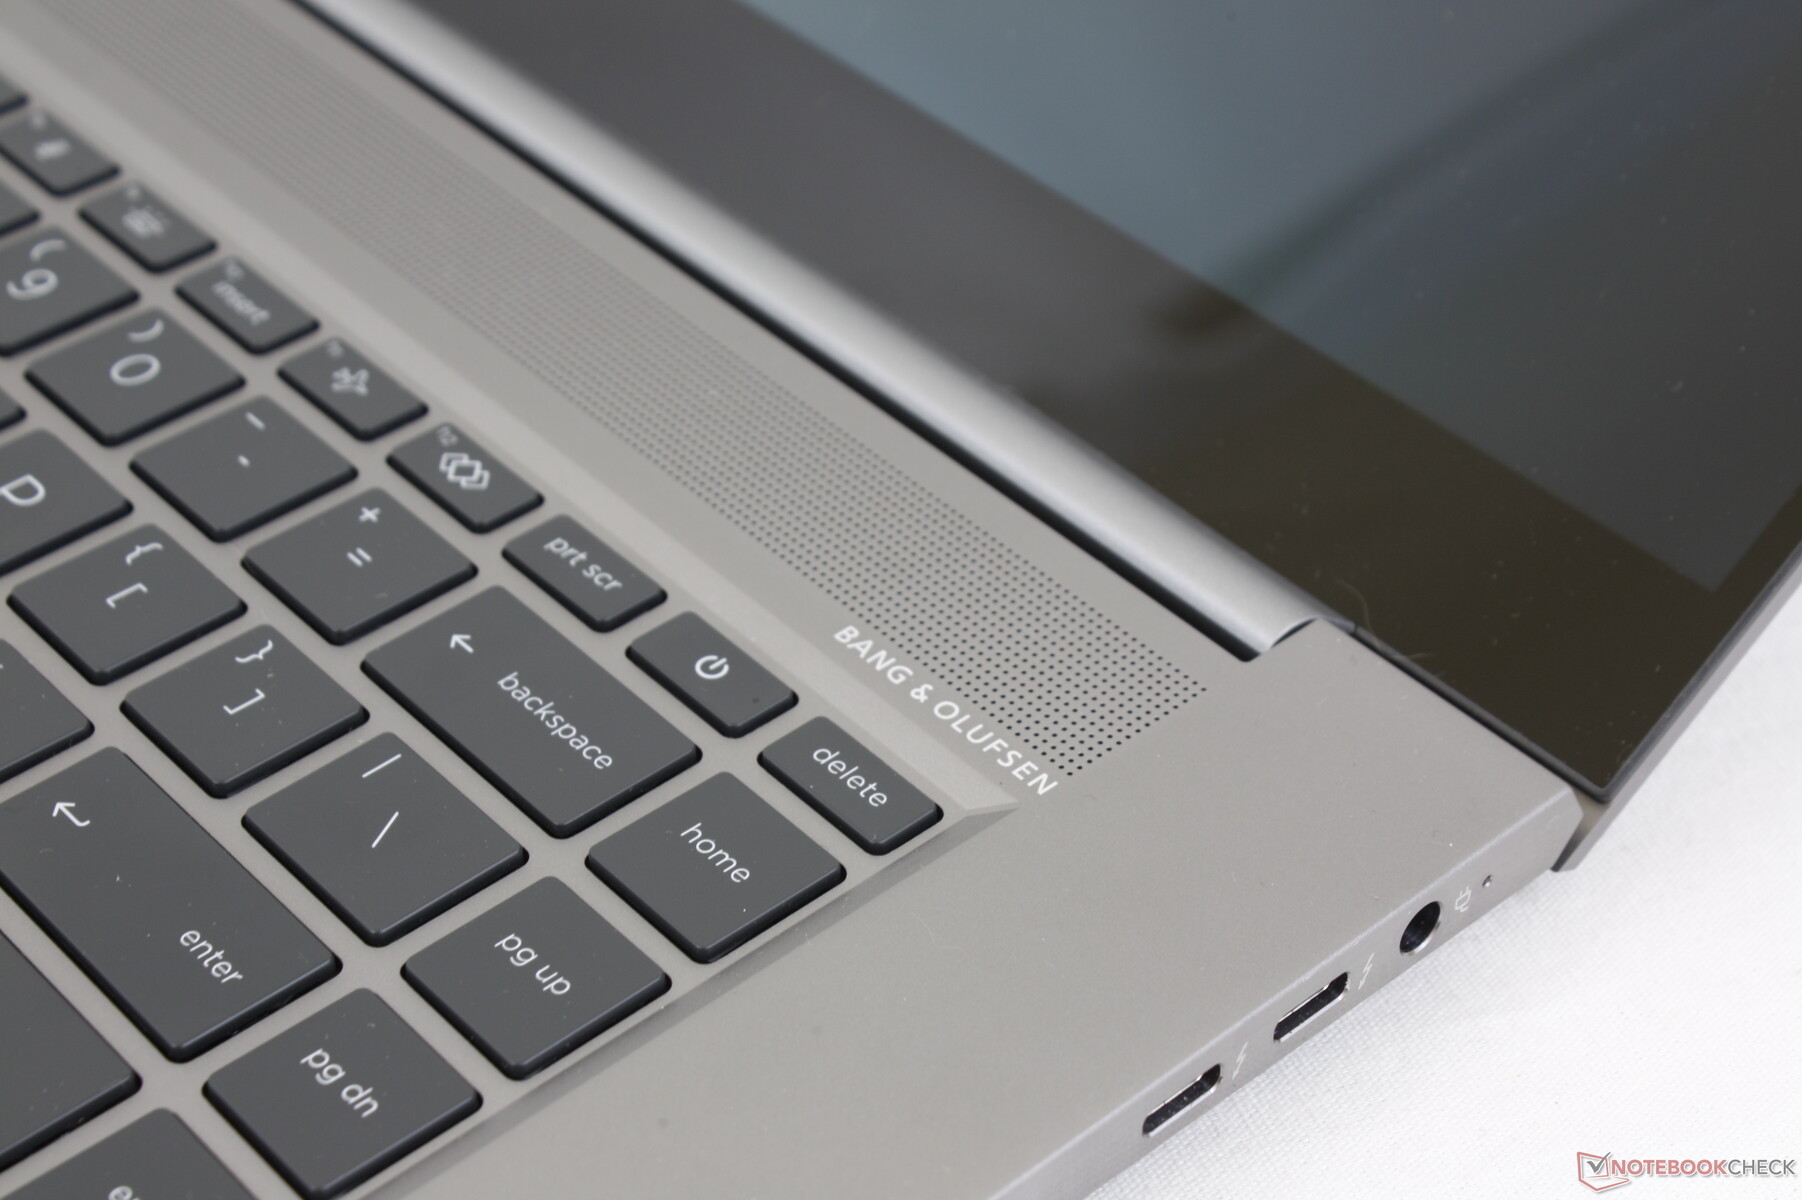
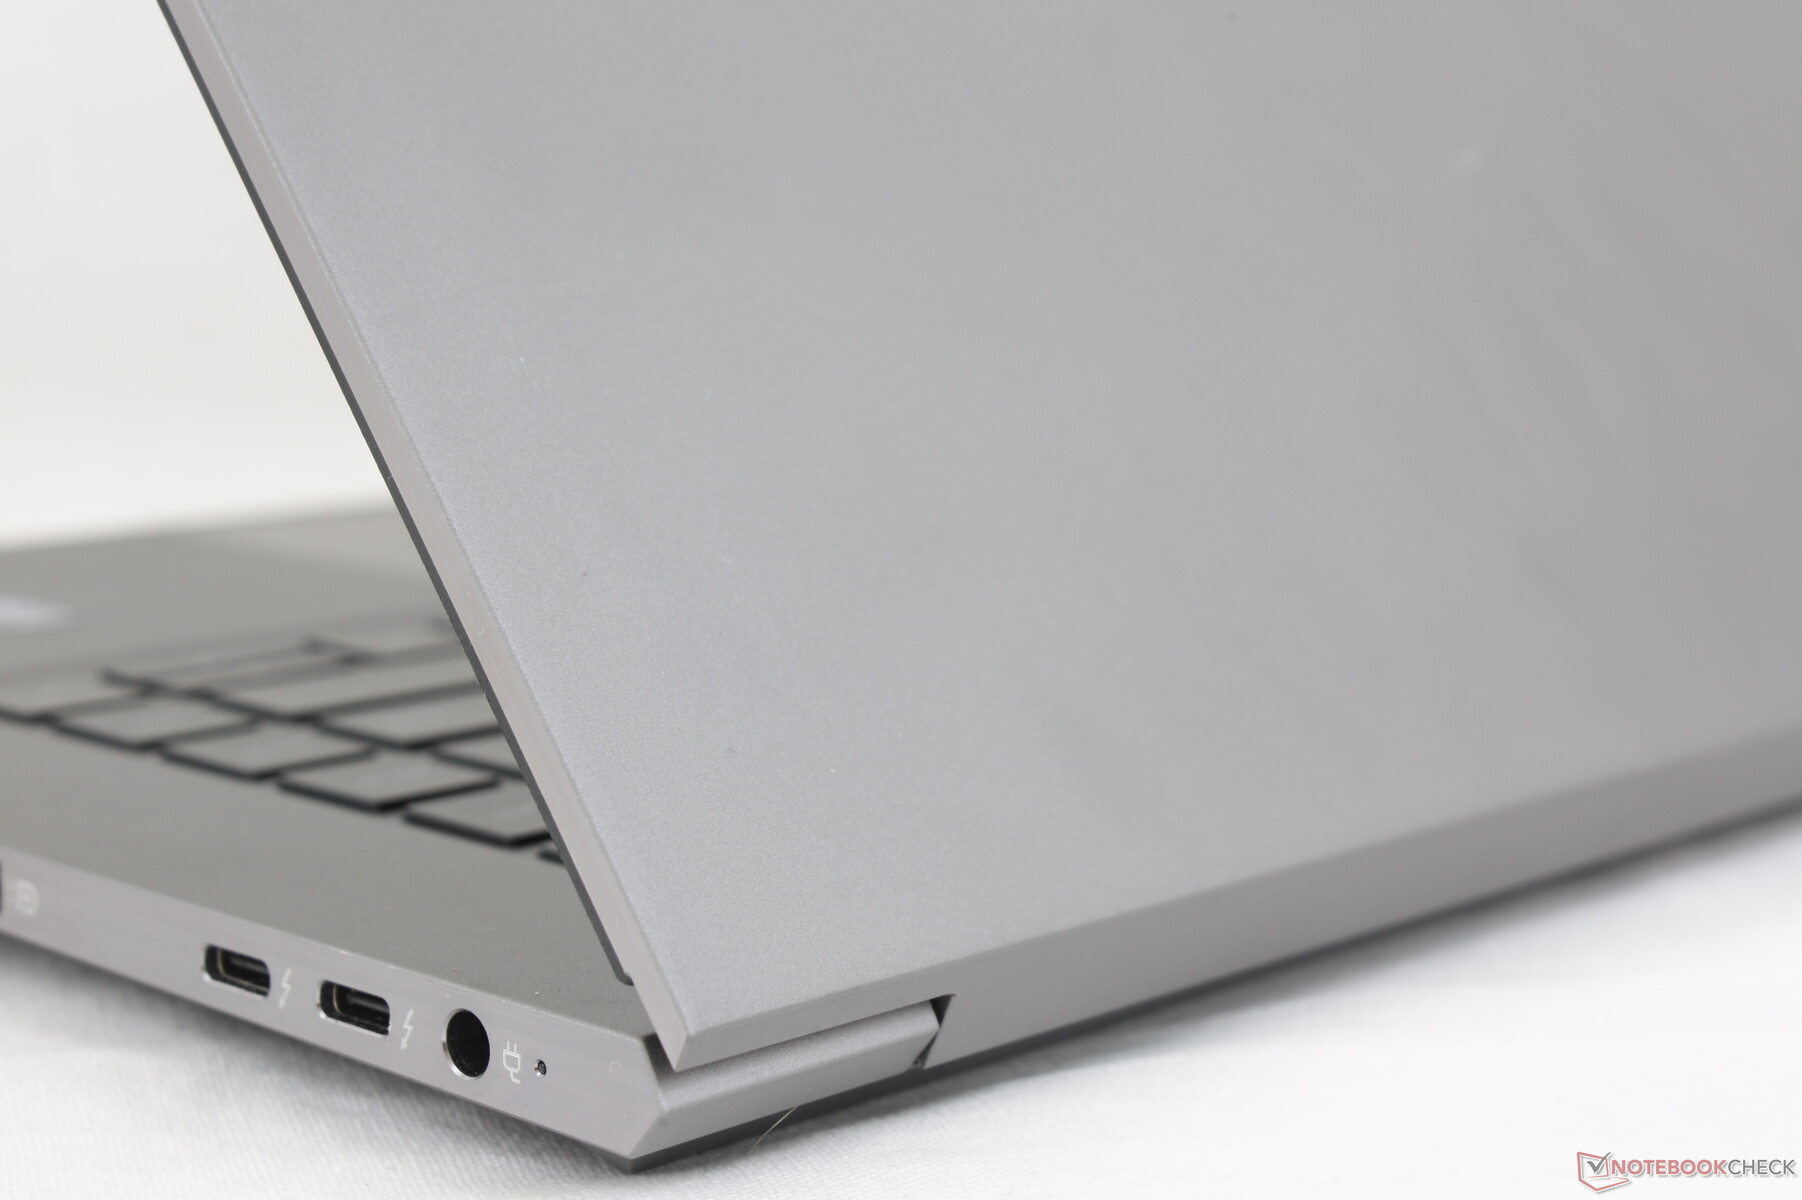
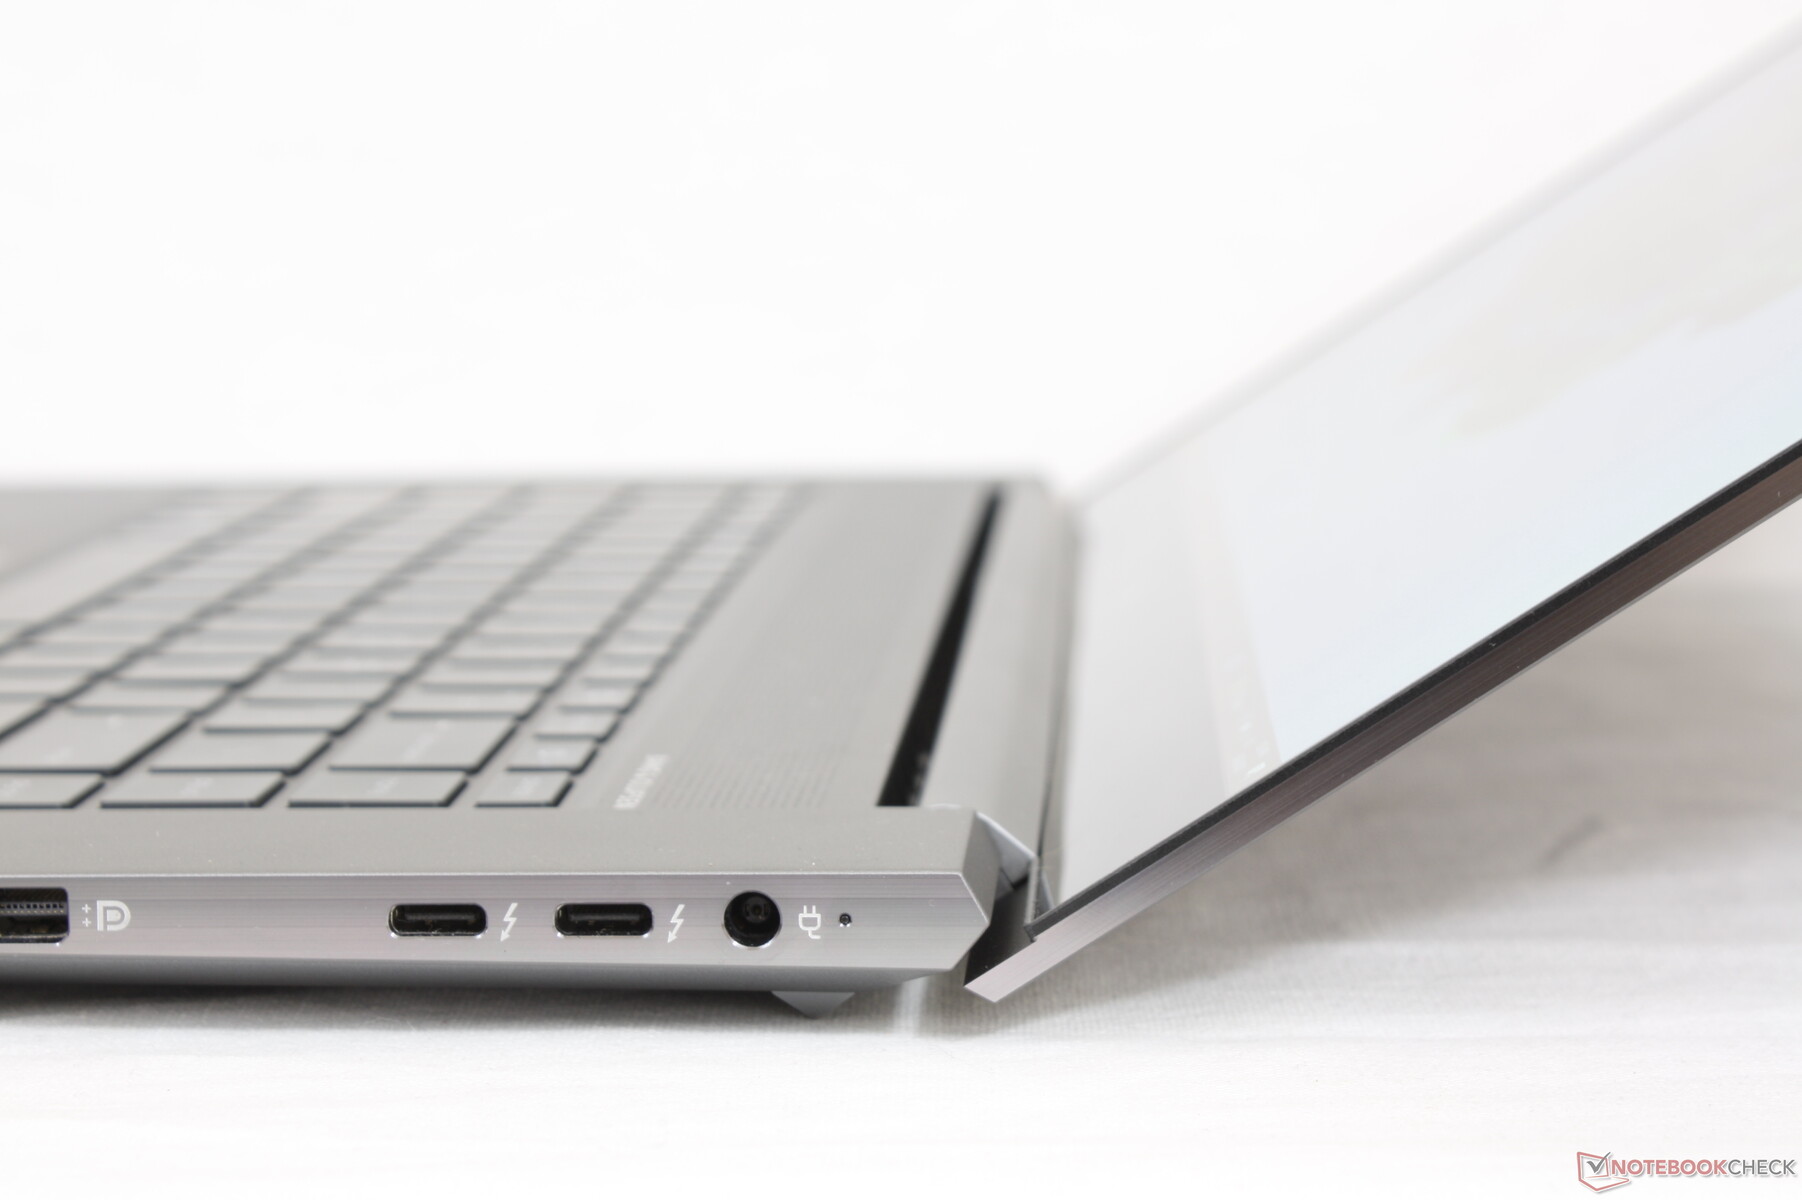
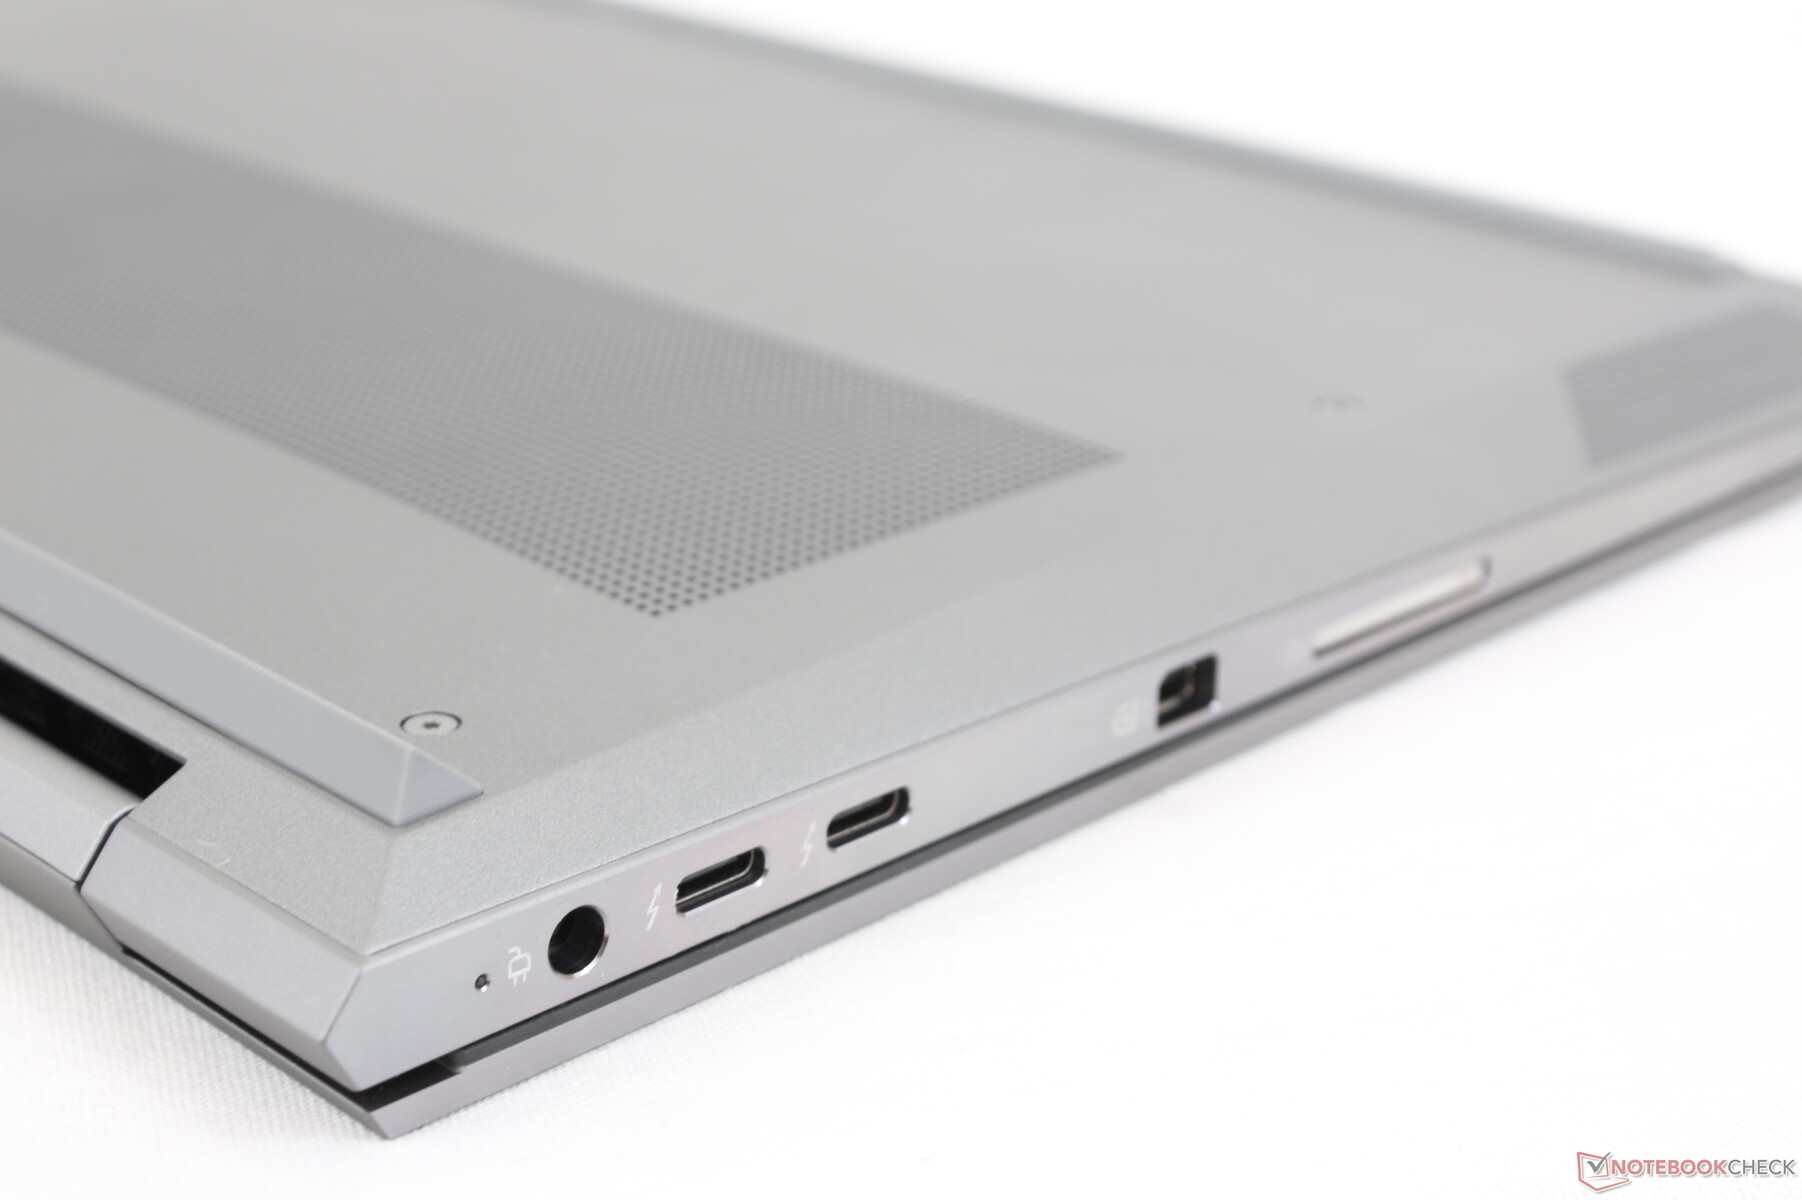
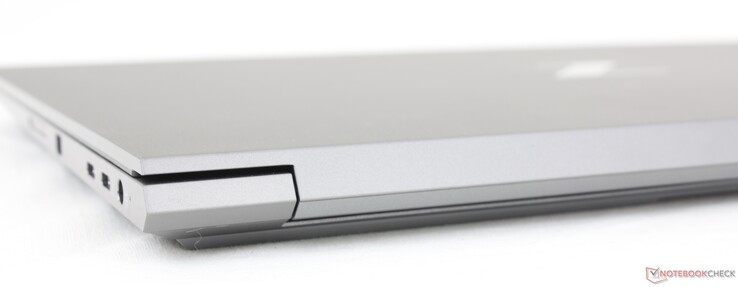
Connectivité - Maintenant avec Thunderbolt 4
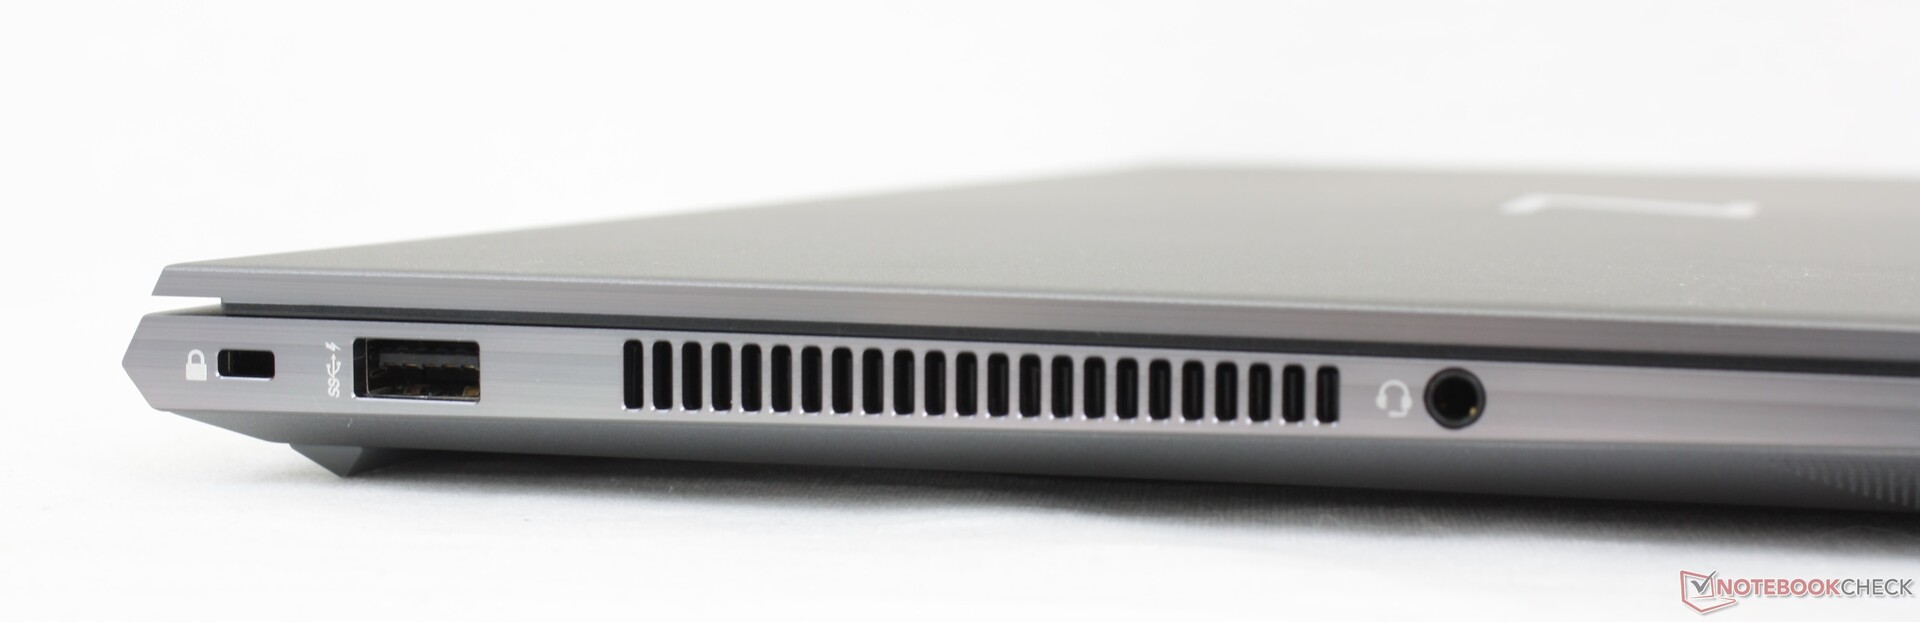
Les options de port sont moins nombreuses que sur leDell Precision 7550 car ce dernier intègre tout ce qui se trouve sur le ZBook Studio G8, plus le gigabit RJ-45, le HDMI et un port USB-A supplémentaire. Les utilisateurs devront profiter des deux ports Thunderbolt 4 intégrés pour exploiter pleinement les capacités d'accueil du système HP.
Le positionnement des ports est un peu serré entre le port propriétaire en forme de barillet de l'adaptateur secteur et les deux ports USB-C le long du bord droit. Les câbles plus épais ou les périphériques USB-C peuvent bloquer l'accès aux ports adjacents.
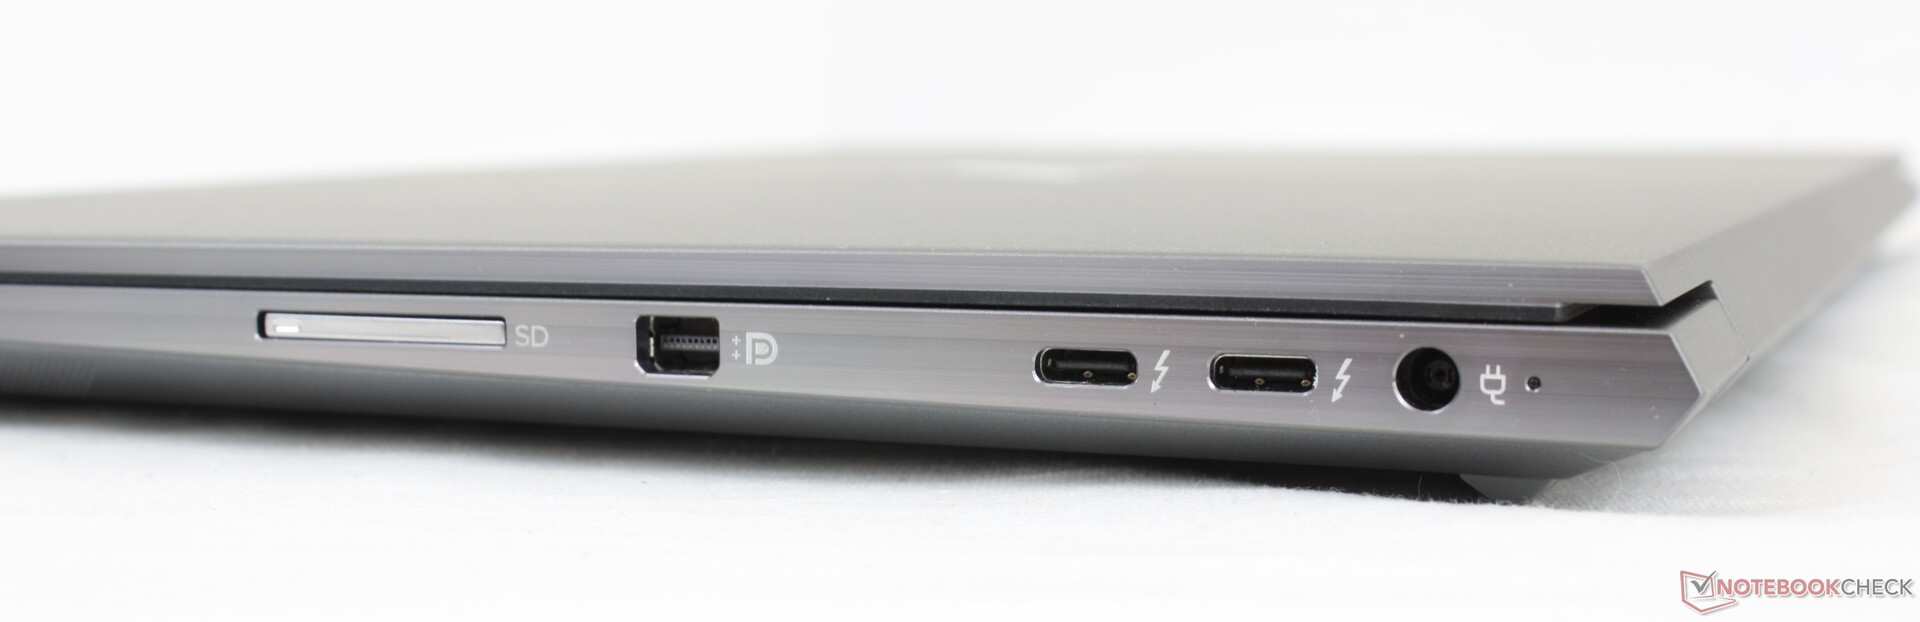

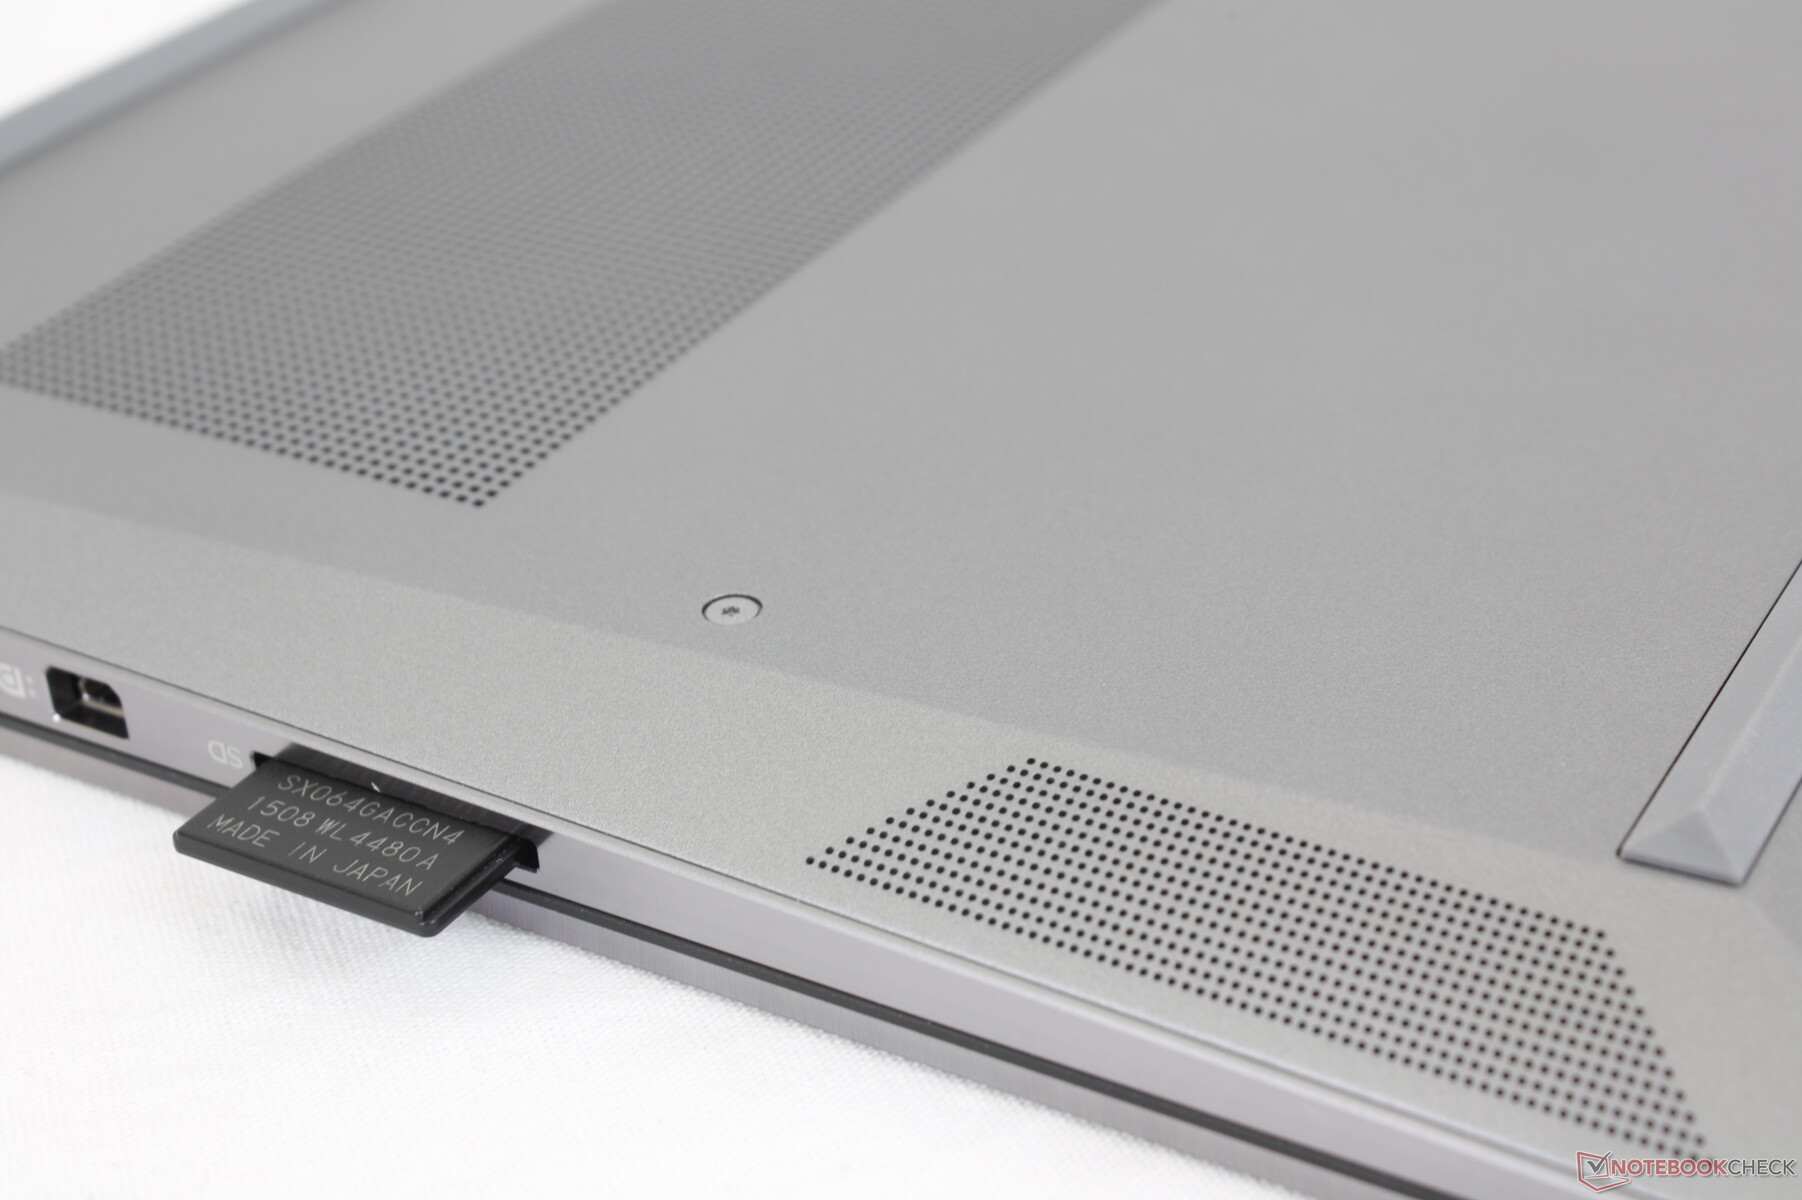
Lecteur de carte SD
HP a en fait déclassé le lecteur de carte SD cette année. Déplacer 1 Go d'images de notre carte de test UHS-II vers le bureau prend environ 14 secondes, contre moins de la moitié sur le ZBook Studio G7. Nous ne sommes pas sûrs de la raison pour laquelle HP a fait cela, mais c'est tout de même décevant, surtout pour les créateurs de contenu qui comptent sur le lecteur de cartes.
| SD Card Reader | |
| average JPG Copy Test (av. of 3 runs) | |
| Dell Precision 7550 (Toshiba Exceria Pro SDXC 64 GB UHS-II) | |
| HP ZBook Studio G7 (AV Pro V60) | |
| HP ZBook Studio 15 G8 (AV Pro V60) | |
| Lenovo ThinkPad P15s Gen2-20W6000GGE (AV Pro V60) | |
| maximum AS SSD Seq Read Test (1GB) | |
| Dell Precision 7550 (Toshiba Exceria Pro SDXC 64 GB UHS-II) | |
| HP ZBook Studio G7 (AV Pro V60) | |
| Lenovo ThinkPad P15s Gen2-20W6000GGE (AV Pro V60) | |
| HP ZBook Studio 15 G8 (AV Pro V60) | |
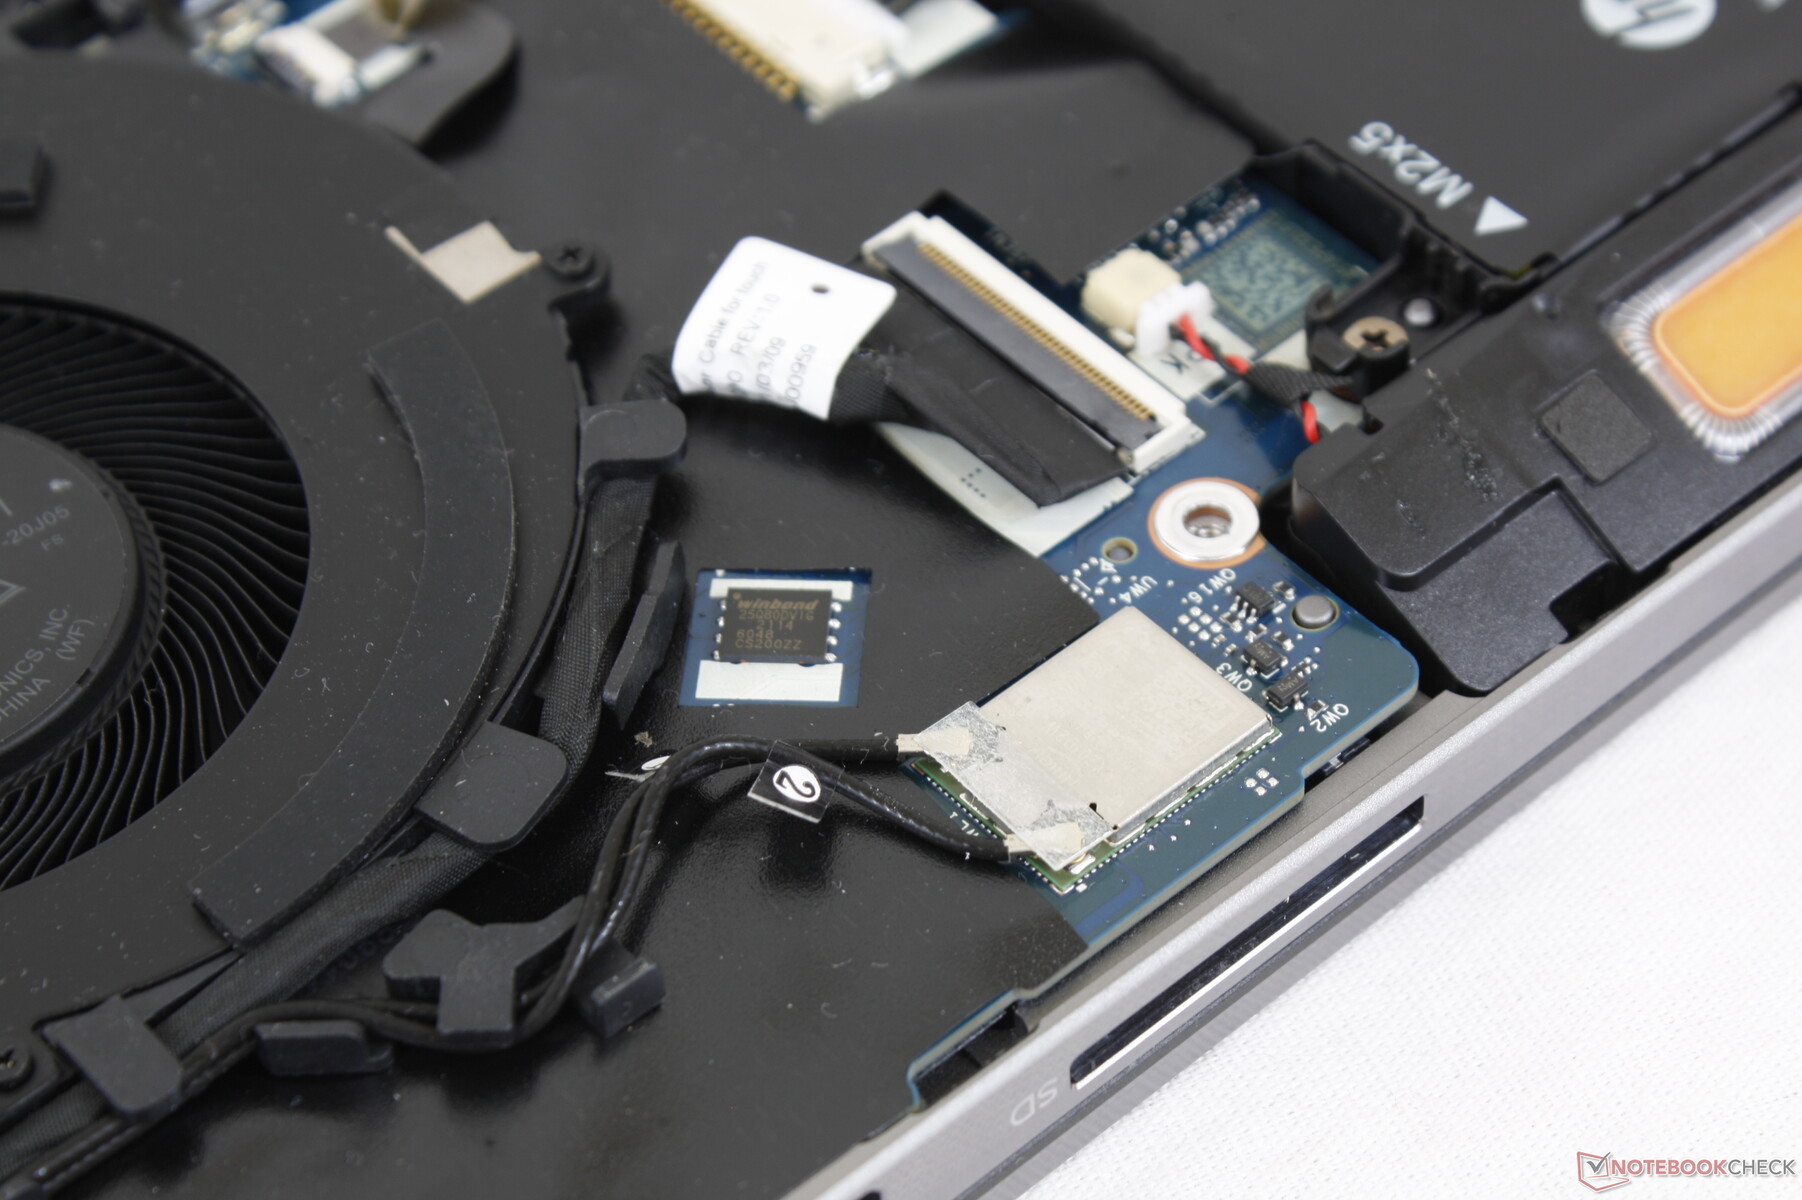
Communication
L'Intel AX201 est équipé en standard de la connectivité Wi-Fi 6 et Bluetooth 5.2. Les taux de transfert sont stables à environ 1400 Mbps dans les deux sens lorsqu'il est couplé à notre routeur de test Netgear RAX200.
Webcam


Sécurité
HP propose une suite complète de logiciels et de mesures de protection de bas niveau, dont Sure Click, Secure Erase, BIOSphere, Sure Start, Sure Run, Tamper Lock, Sure View en option, et bien d'autres, en plus du lecteur d'empreintes digitales et du TPM habituels. L'absence d'un simple obturateur de webcam est flagrante, cependant, ce qui nous semble être un oubli massif de la part de HP.
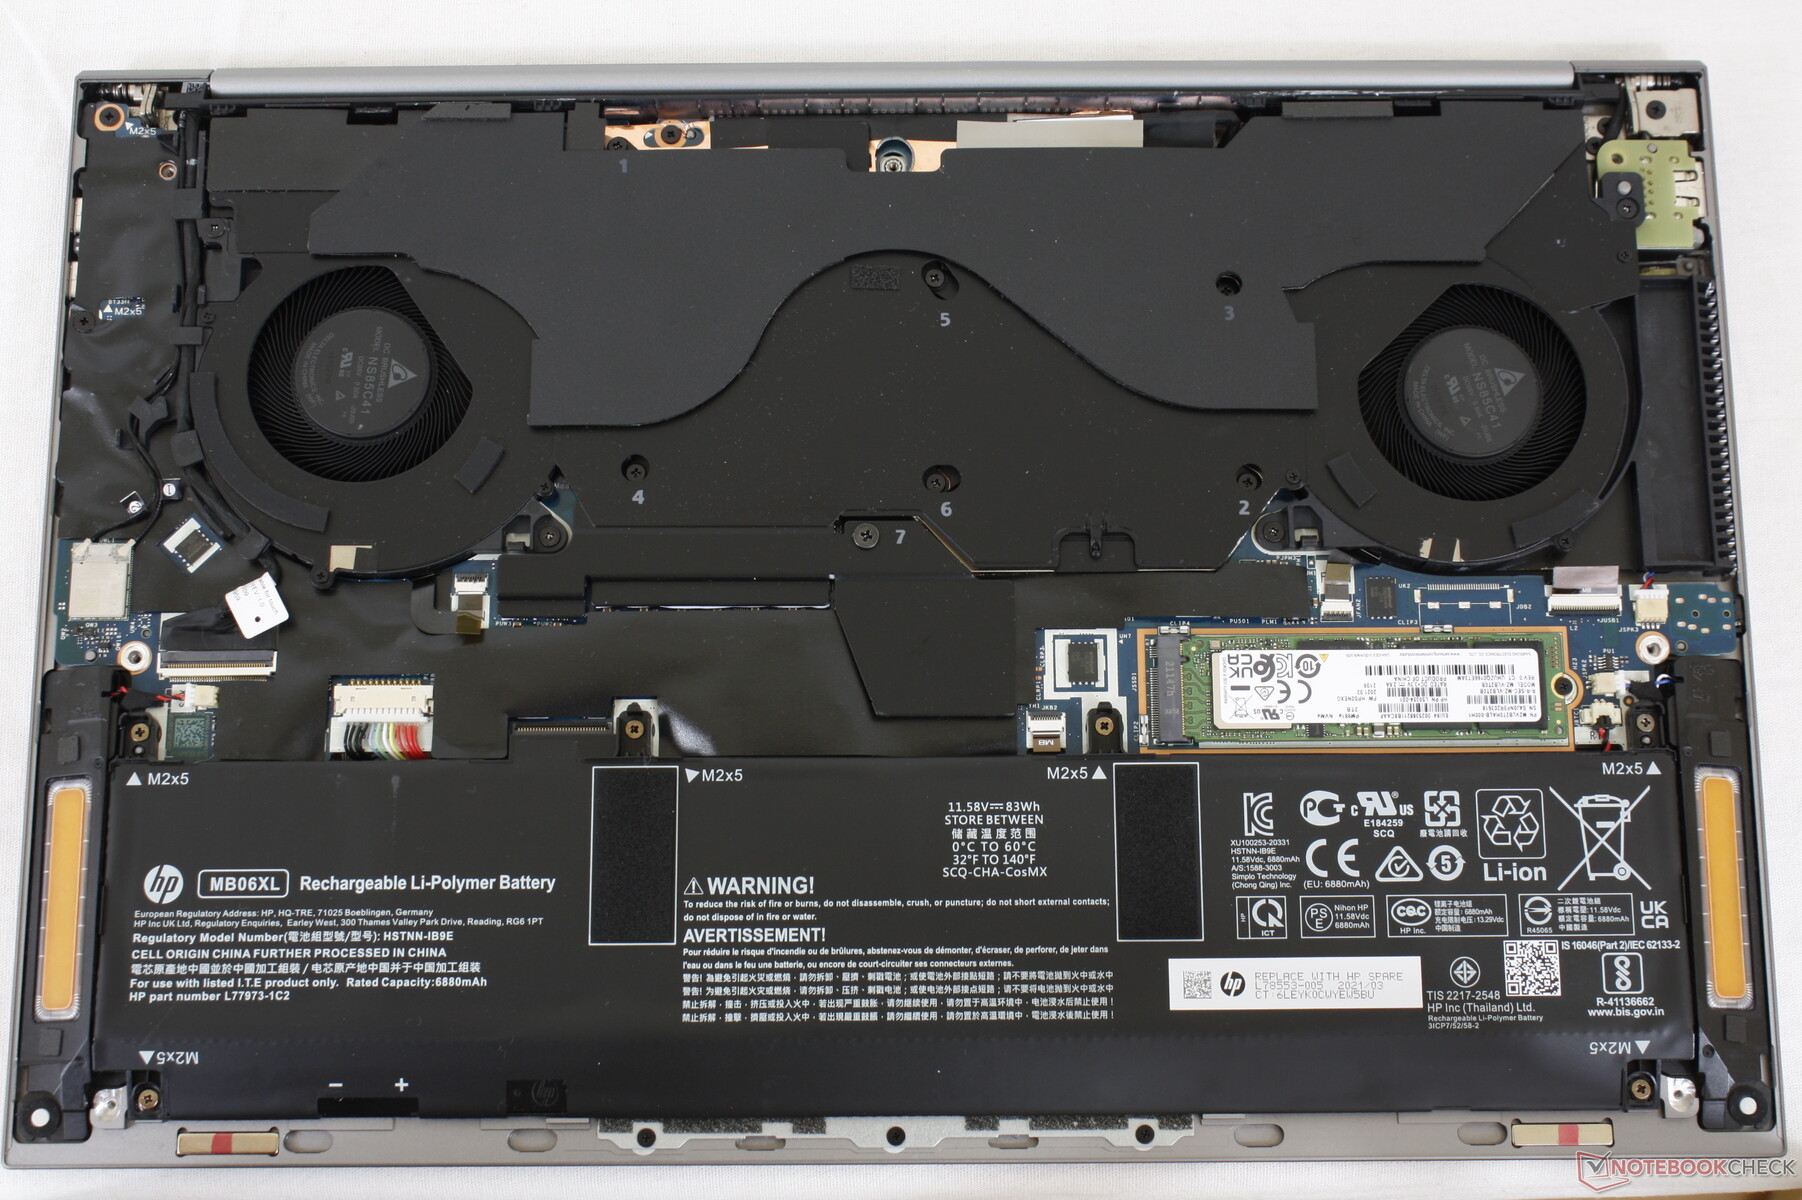
Maintenance
Le panneau inférieur doit être ouvert à l'aide d'un tournevis Philips et d'un bord tranchant. Il n'y a pas grand-chose à améliorer une fois à l'intérieur, car les modules RAM et WLAN sont soudés.
Accessoires et garantie
La boîte de vente au détail ne contient rien d'autre que l'adaptateur secteur et les documents administratifs. Une garantie de base d'un an est fournie en standard au lieu de la garantie de deux ou trois ans que les stations de travail haut de gamme ont tendance à offrir sans frais supplémentaires.
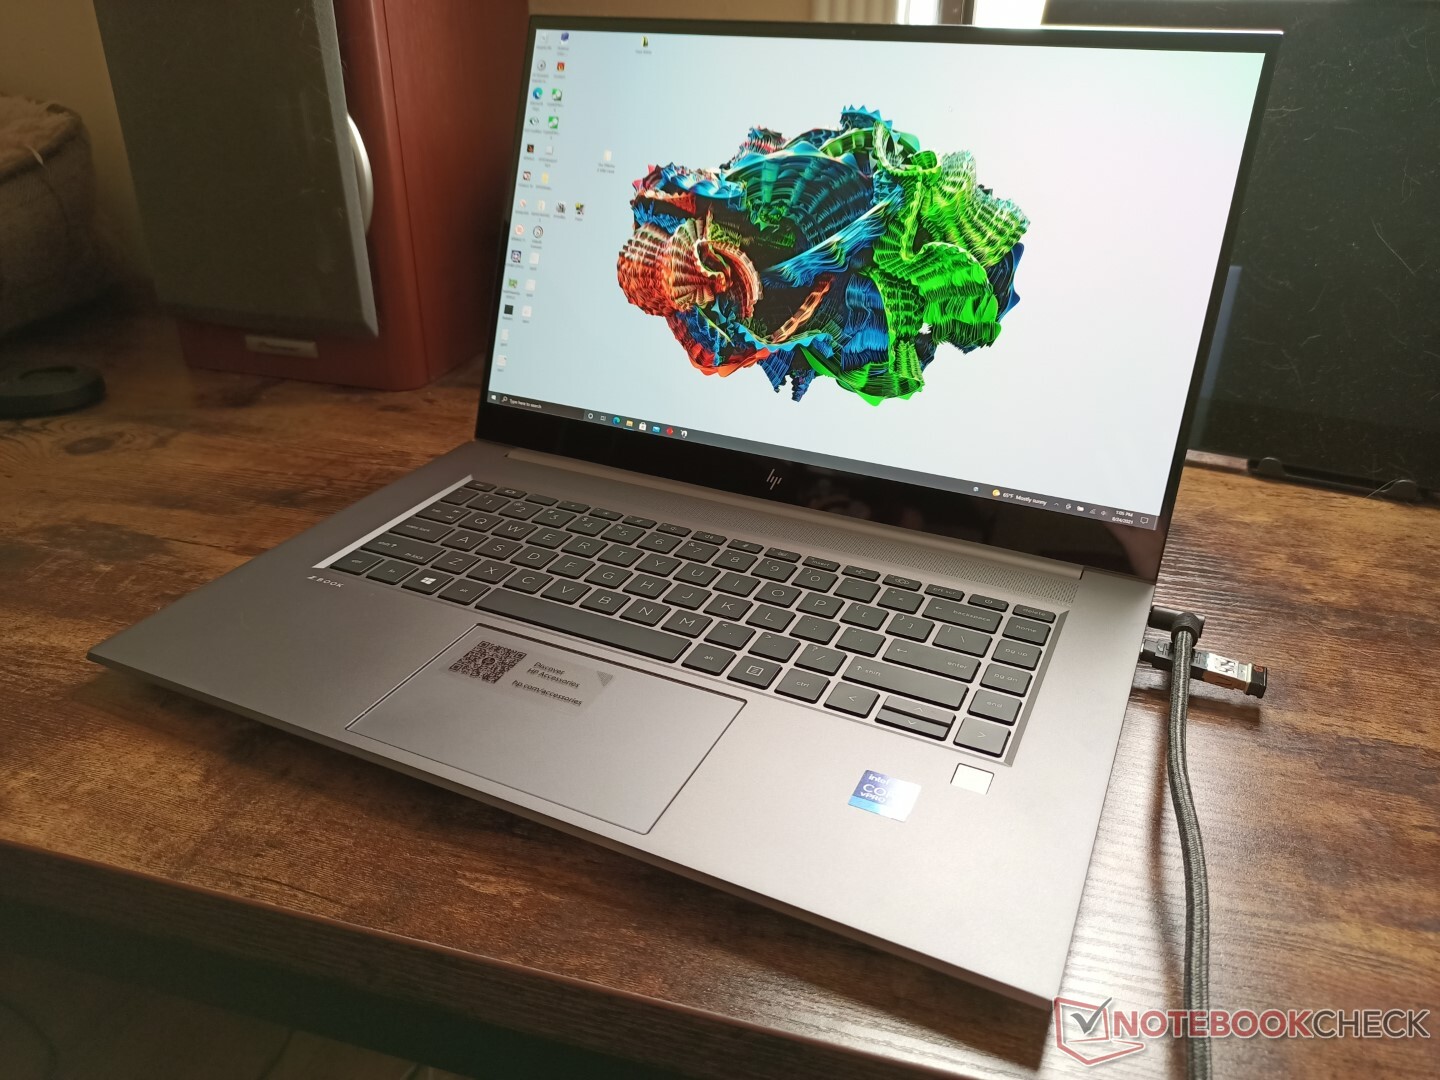
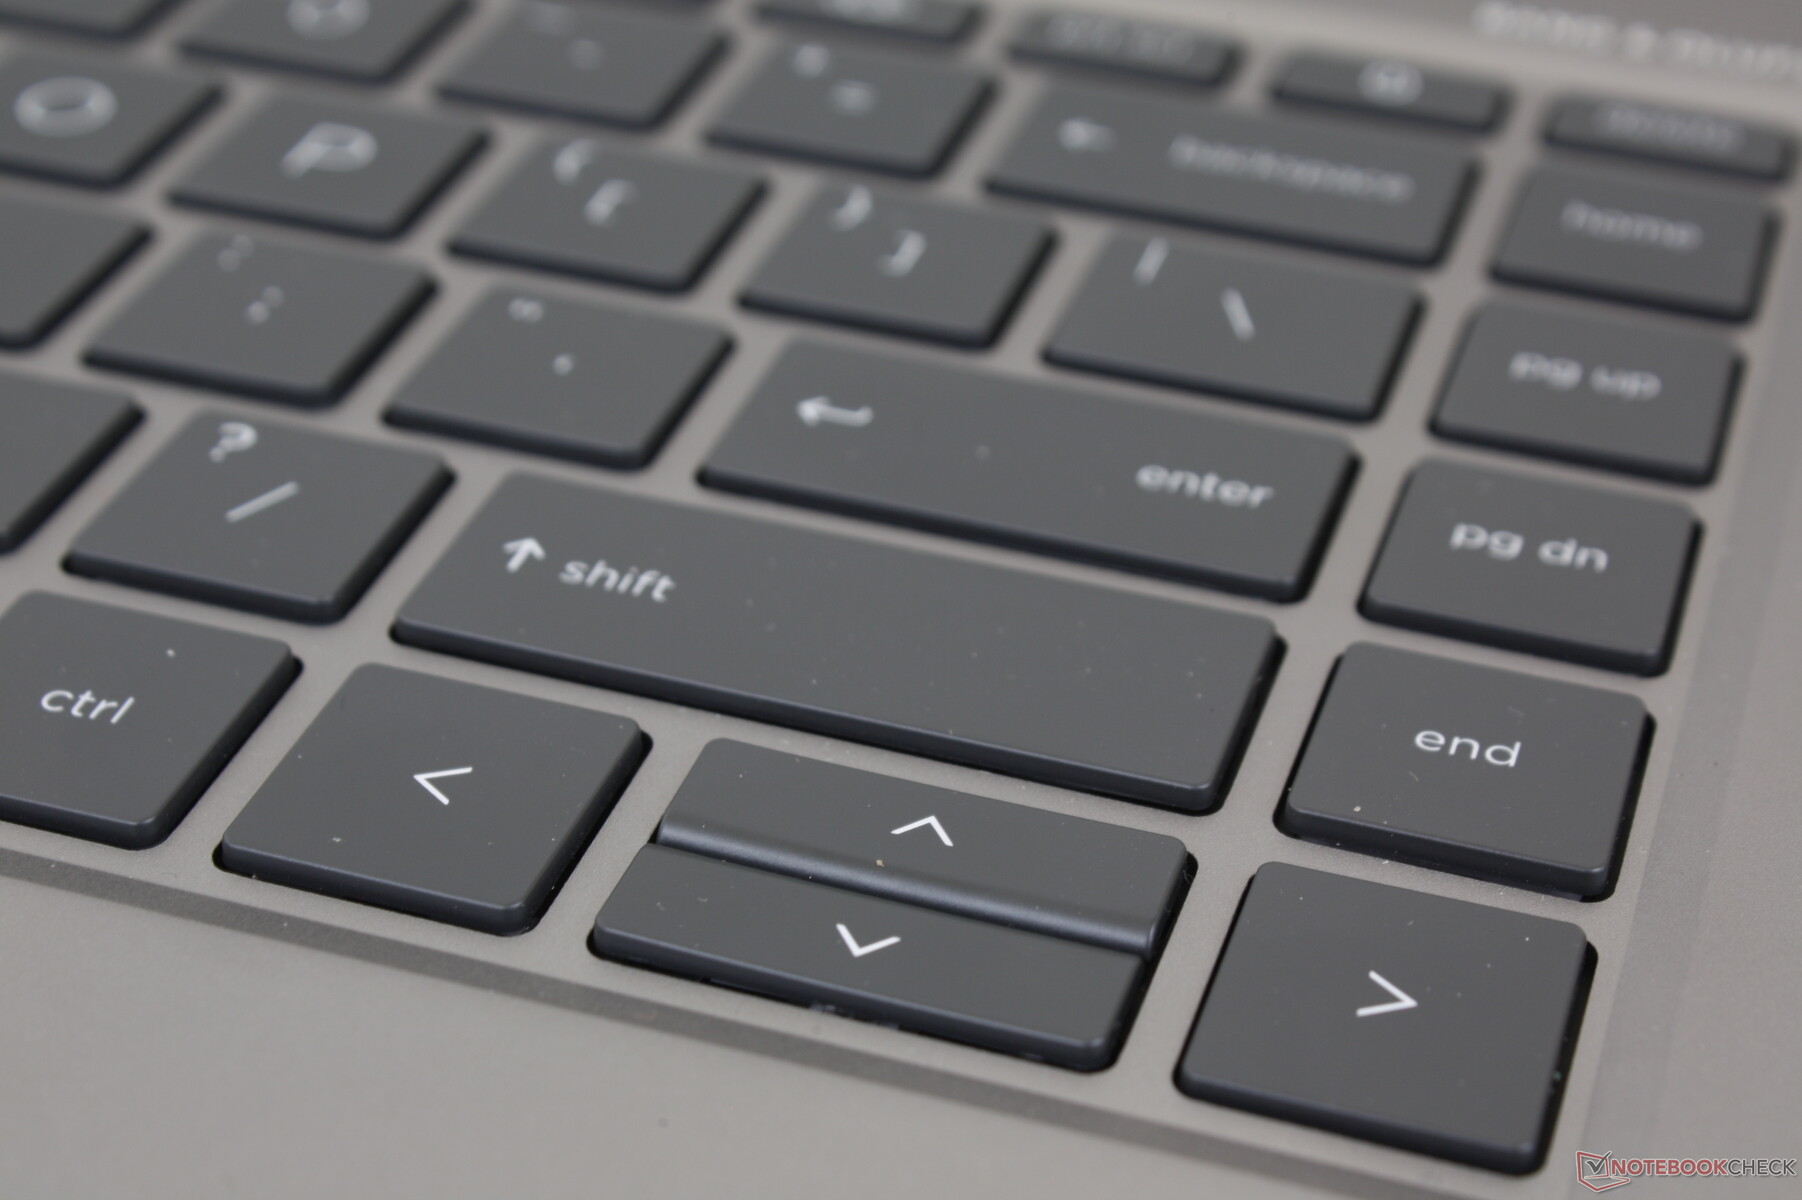
Périphériques d'entrée - Les touches dédiées de la souris et le TrackPoint nous manquent
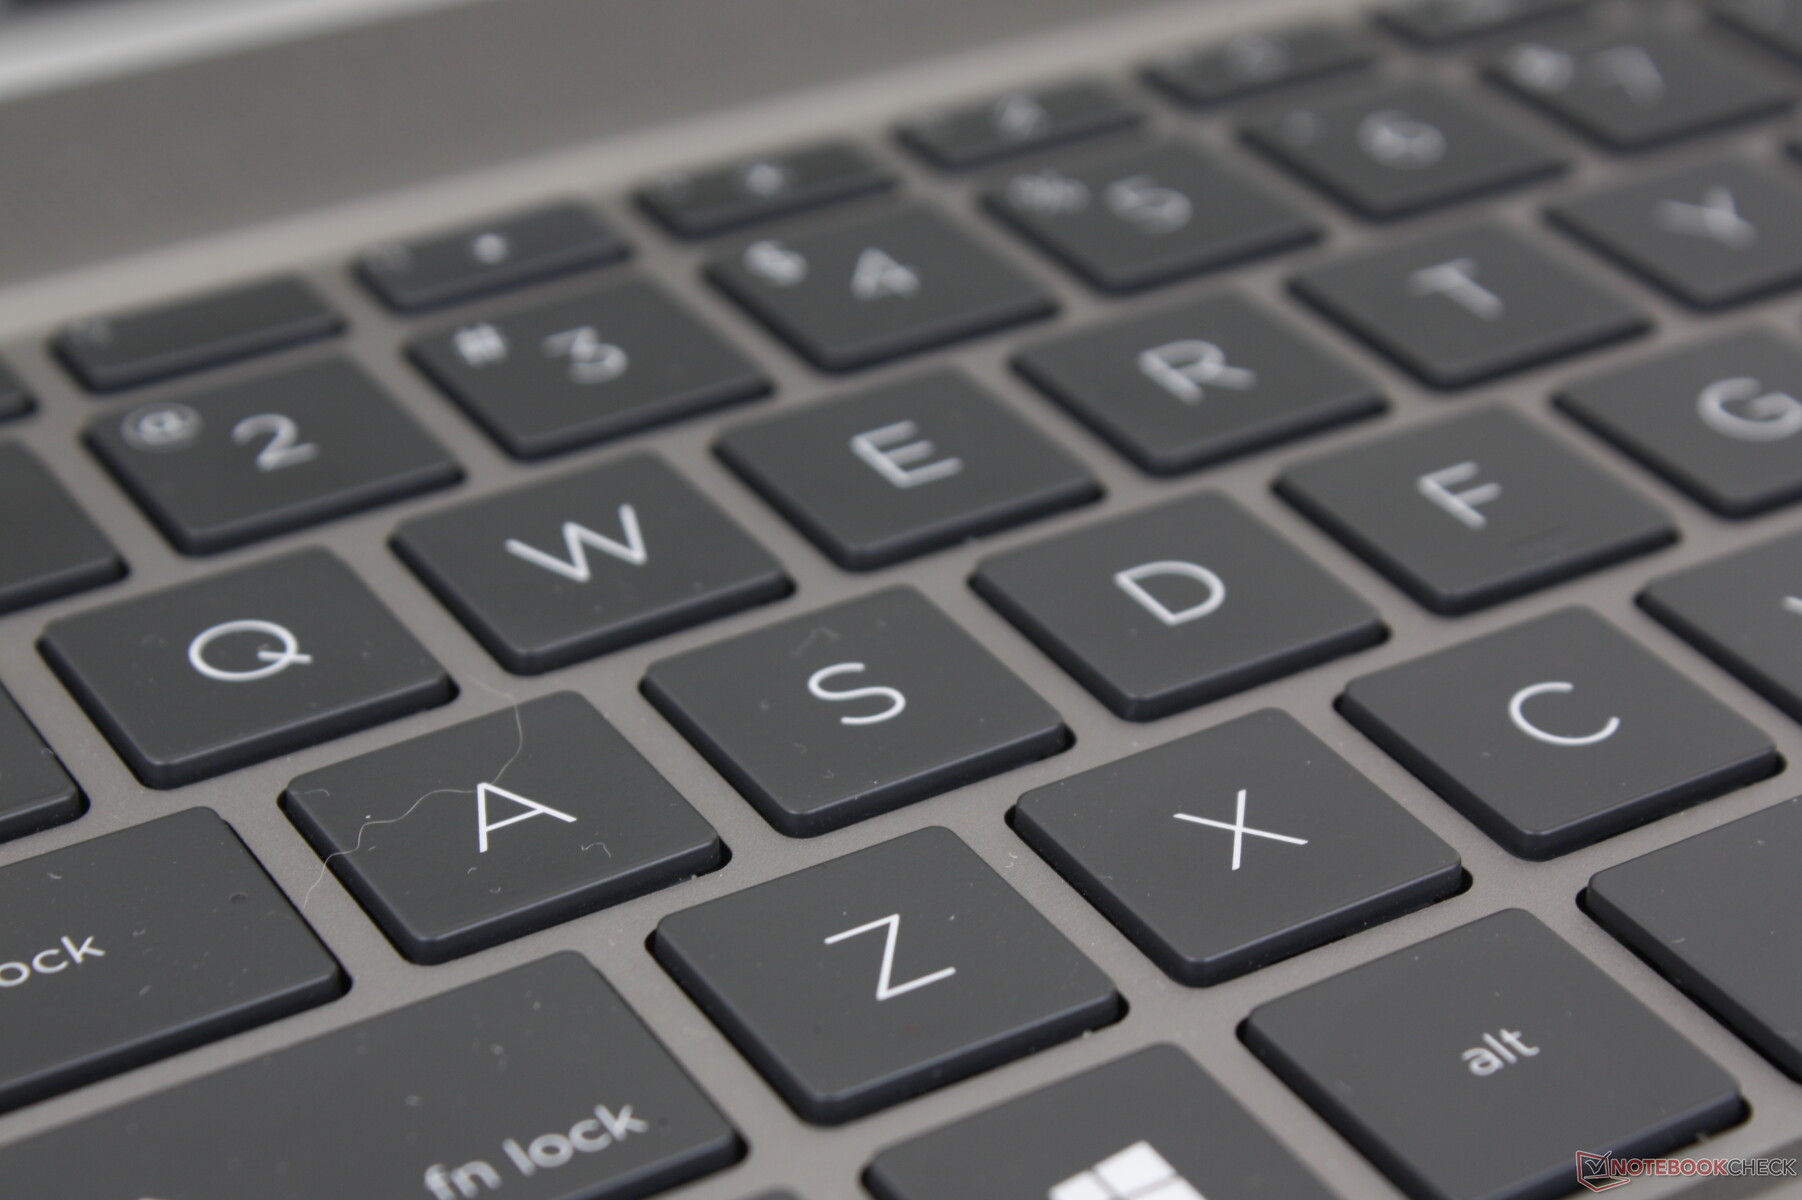
Clavier
Les modèles HP haut de gamme comme le Envy, le Spectre, l'EliteBook ou le ZBook possèdent certains des meilleurs claviers du marché des ordinateurs portables. Leurs touches ont tendance à être plus nettes et plus profondes pour un meilleur retour d'information et une expérience de frappe plus satisfaisante. Le principal inconvénient est le claquement plus fort des touches par rapport aux touches plus douces et plus silencieuses du MSI WS66 ou du Razer Blade Studio
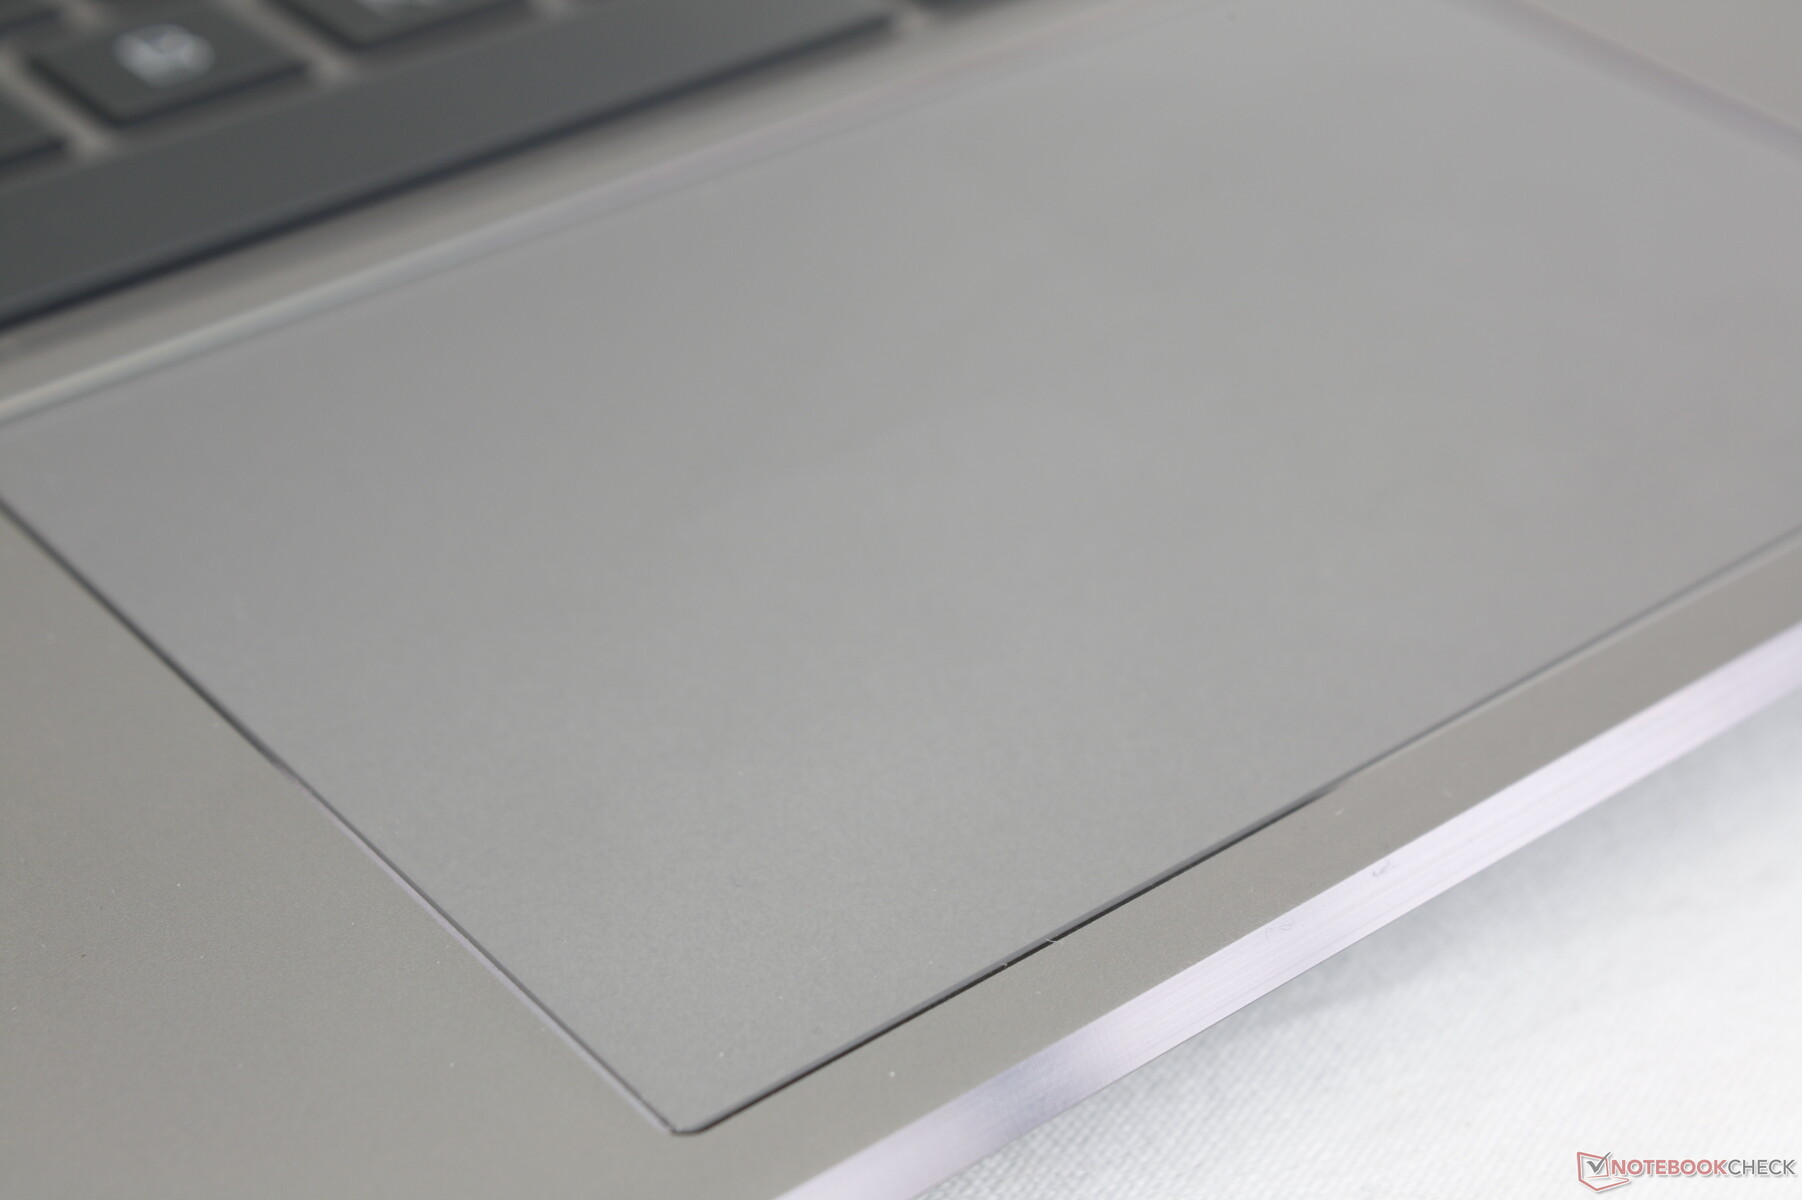
Pavé tactile
Le pavé tactile lisse (11,5 x 7,3 cm) ne comporte pas de boutons dédiés, contrairement aux ZBook Firefly, ZBook Fury et à la plupart des autres stations de travail mobiles traditionnelles. Néanmoins, le pavé tactile n'est pas aussi spongieux que celui du Razer Blade Studio, ce qui permet d'effectuer des clics et des entrées multi-touch plus fiables.

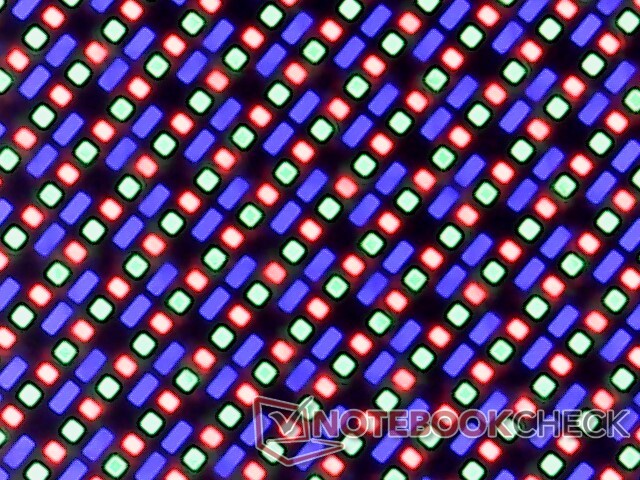
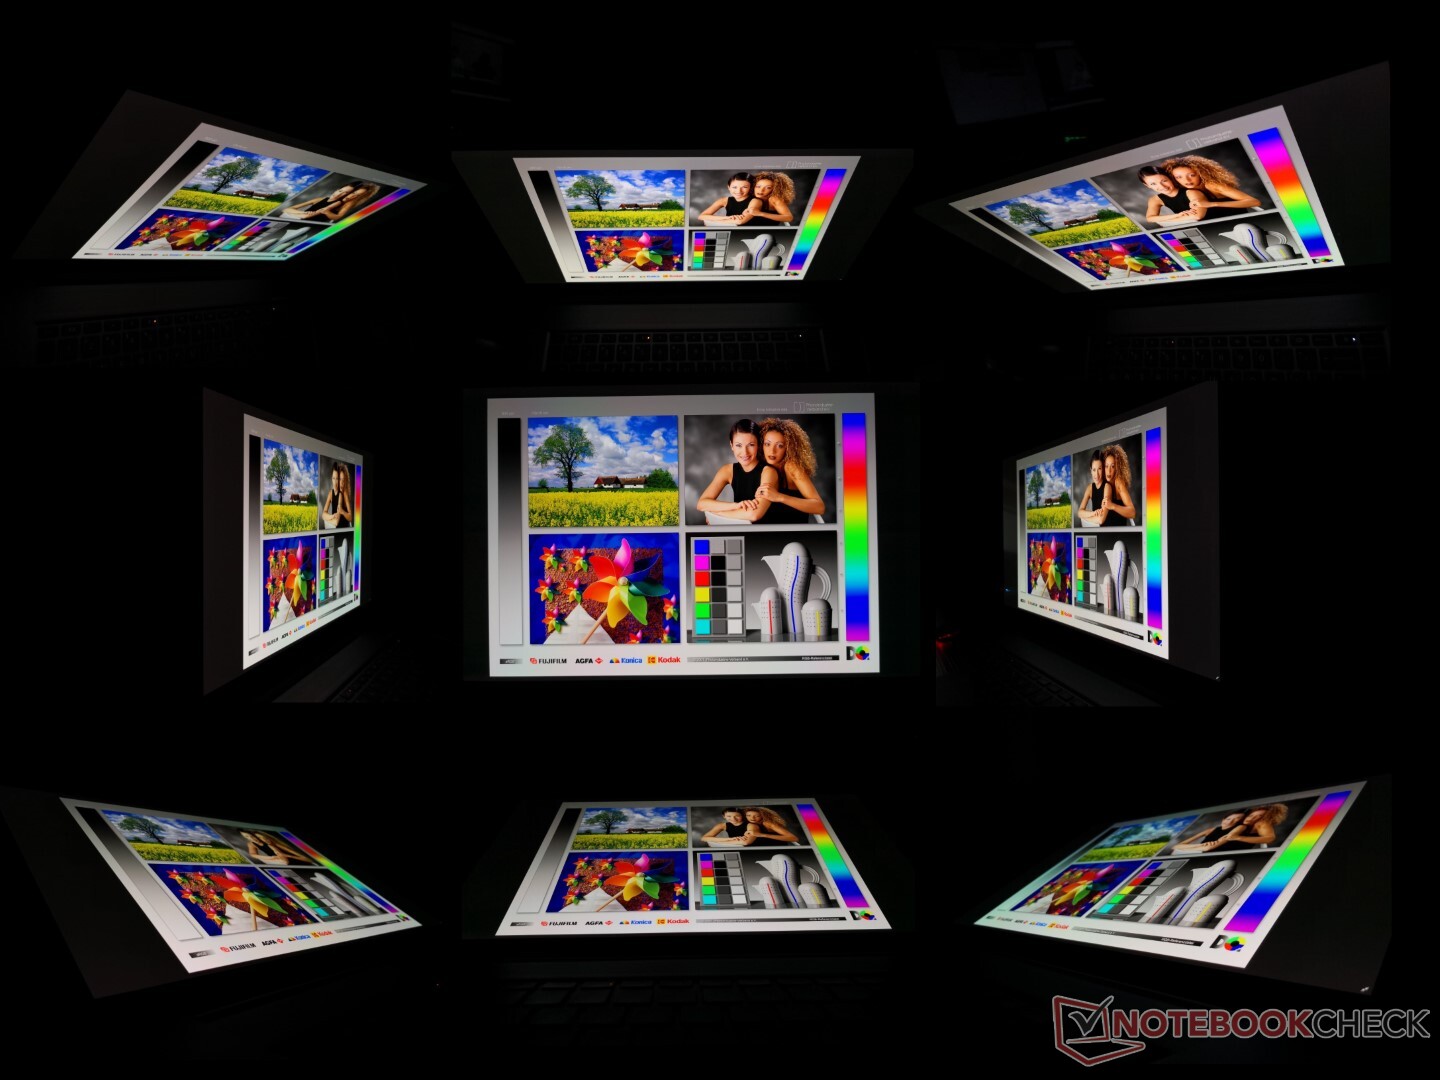
Écran - L'OLED a quelques inconvénients
Alors que HP fait appel à LG pour son option IPS 4K, cette option OLED 4K vient plutôt de Samsung. Les plus grands avantages de l'OLED sont ses niveaux de noir parfaits, sa gamme plus large et ses temps de réponse noir-blanc et gris-gris extrêmement rapides pour des couleurs plus vives et pratiquement aucun effet fantôme.
En revanche, les principaux inconvénients de cette dalle OLED sont sa luminosité de 400 nits, sa fréquence de rafraîchissement de 60 Hz, la présence d'une modulation de largeur d'impulsion et une consommation d'énergie plus élevée que celle de l'IPS. Si une luminosité de 400 nits n'est en aucun cas faible, il s'agit de l'option la plus faible disponible pour ce modèle. De même, le taux de rafraîchissement de 60 Hz n'est pas nécessairement lent, mais HP propose 120 Hz uniquement pour l'IPS. La modulation de la largeur d'impulsion ou le scintillement de l'écran est présent à des fréquences de 240 Hz et 59 Hz à des niveaux de luminosité de 0 à 52 % et 53 % et 99 %, respectivement, ce qui peut provoquer une fatigue oculaire chez certains utilisateurs. Et enfin, la consommation d'énergie plus élevée est un fait connu comme détaillé ici sur d'autres ordinateurs portables qui utilisent une technologie OLED similaire.

| |||||||||||||||||||||||||
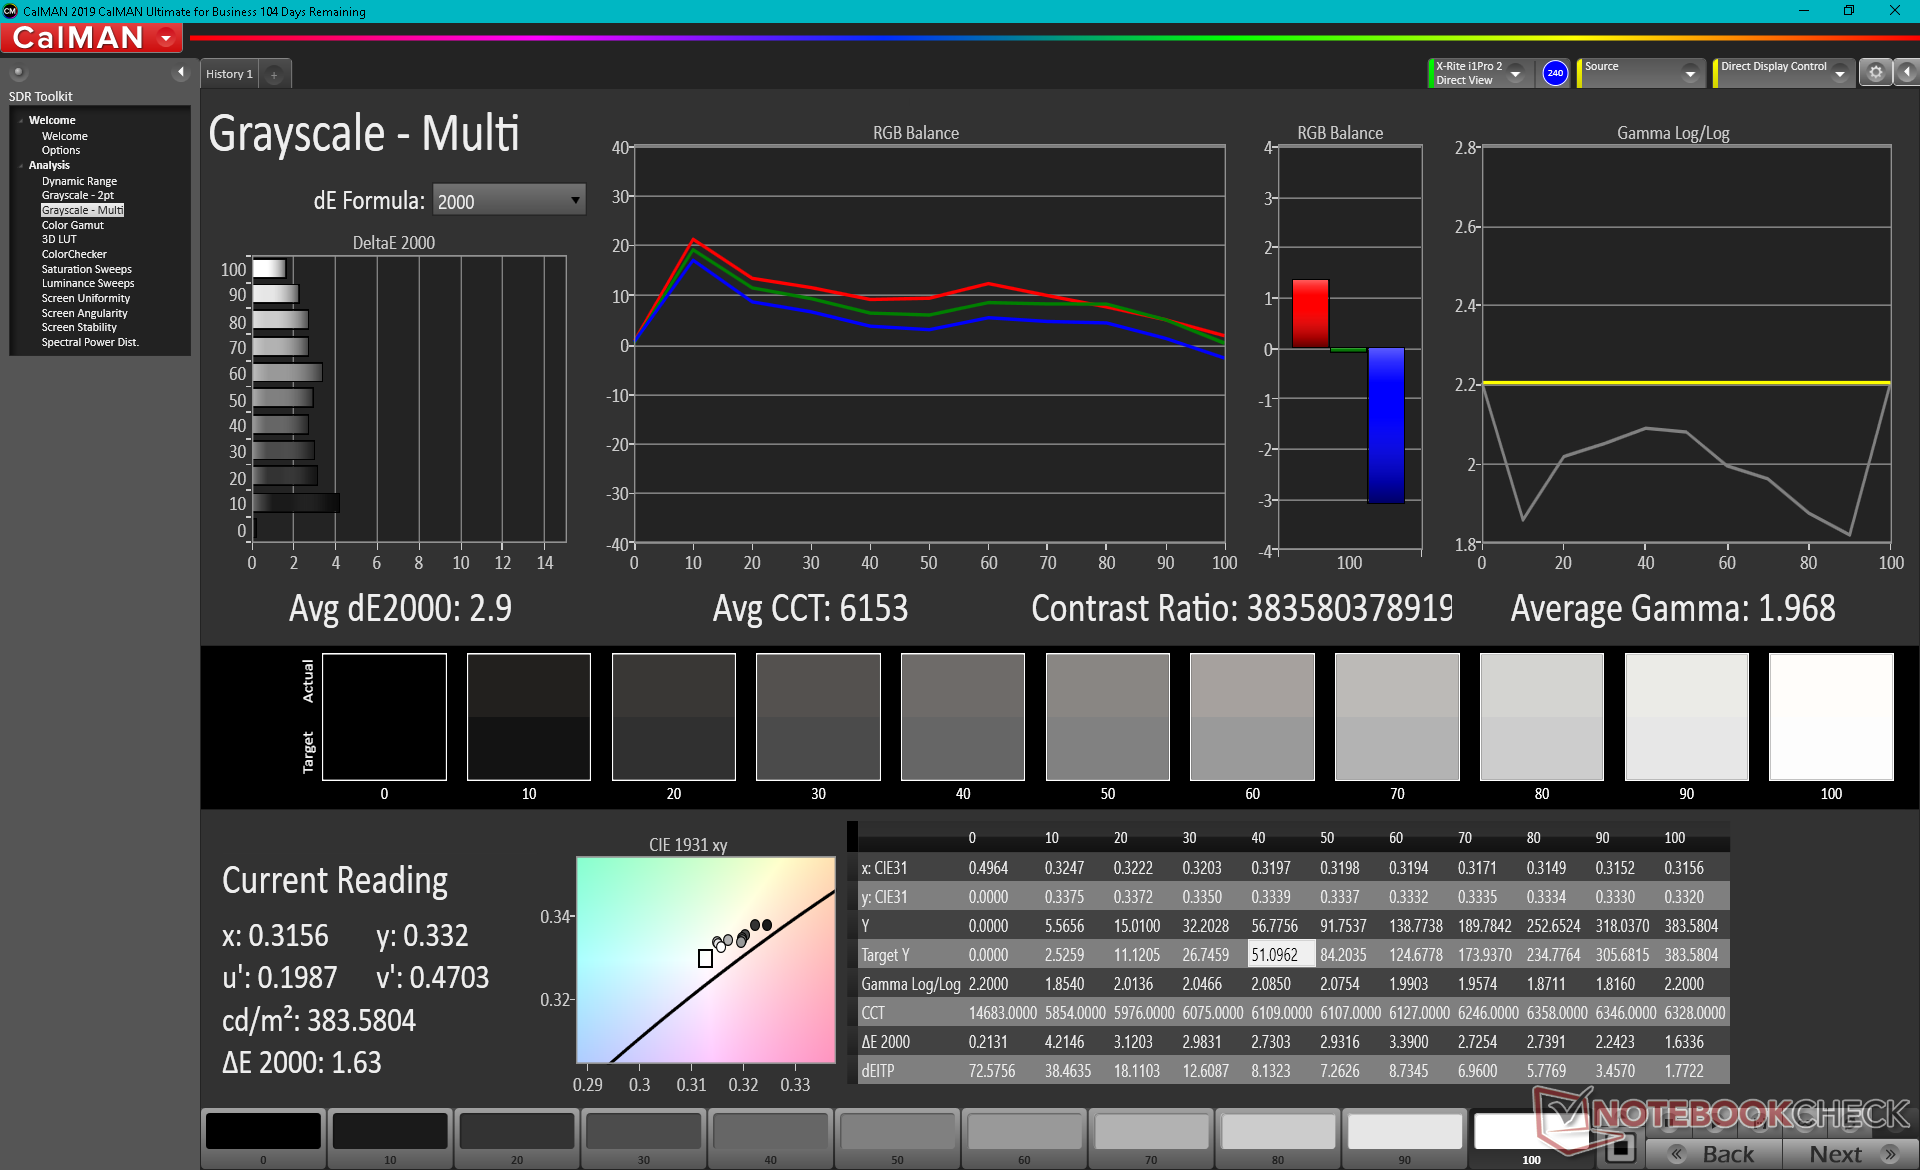
Homogénéité de la luminosité: 95 %
Valeur mesurée au centre, sur batterie: 379.6 cd/m²
Contraste: ∞:1 (Valeurs des noirs: 0 cd/m²)
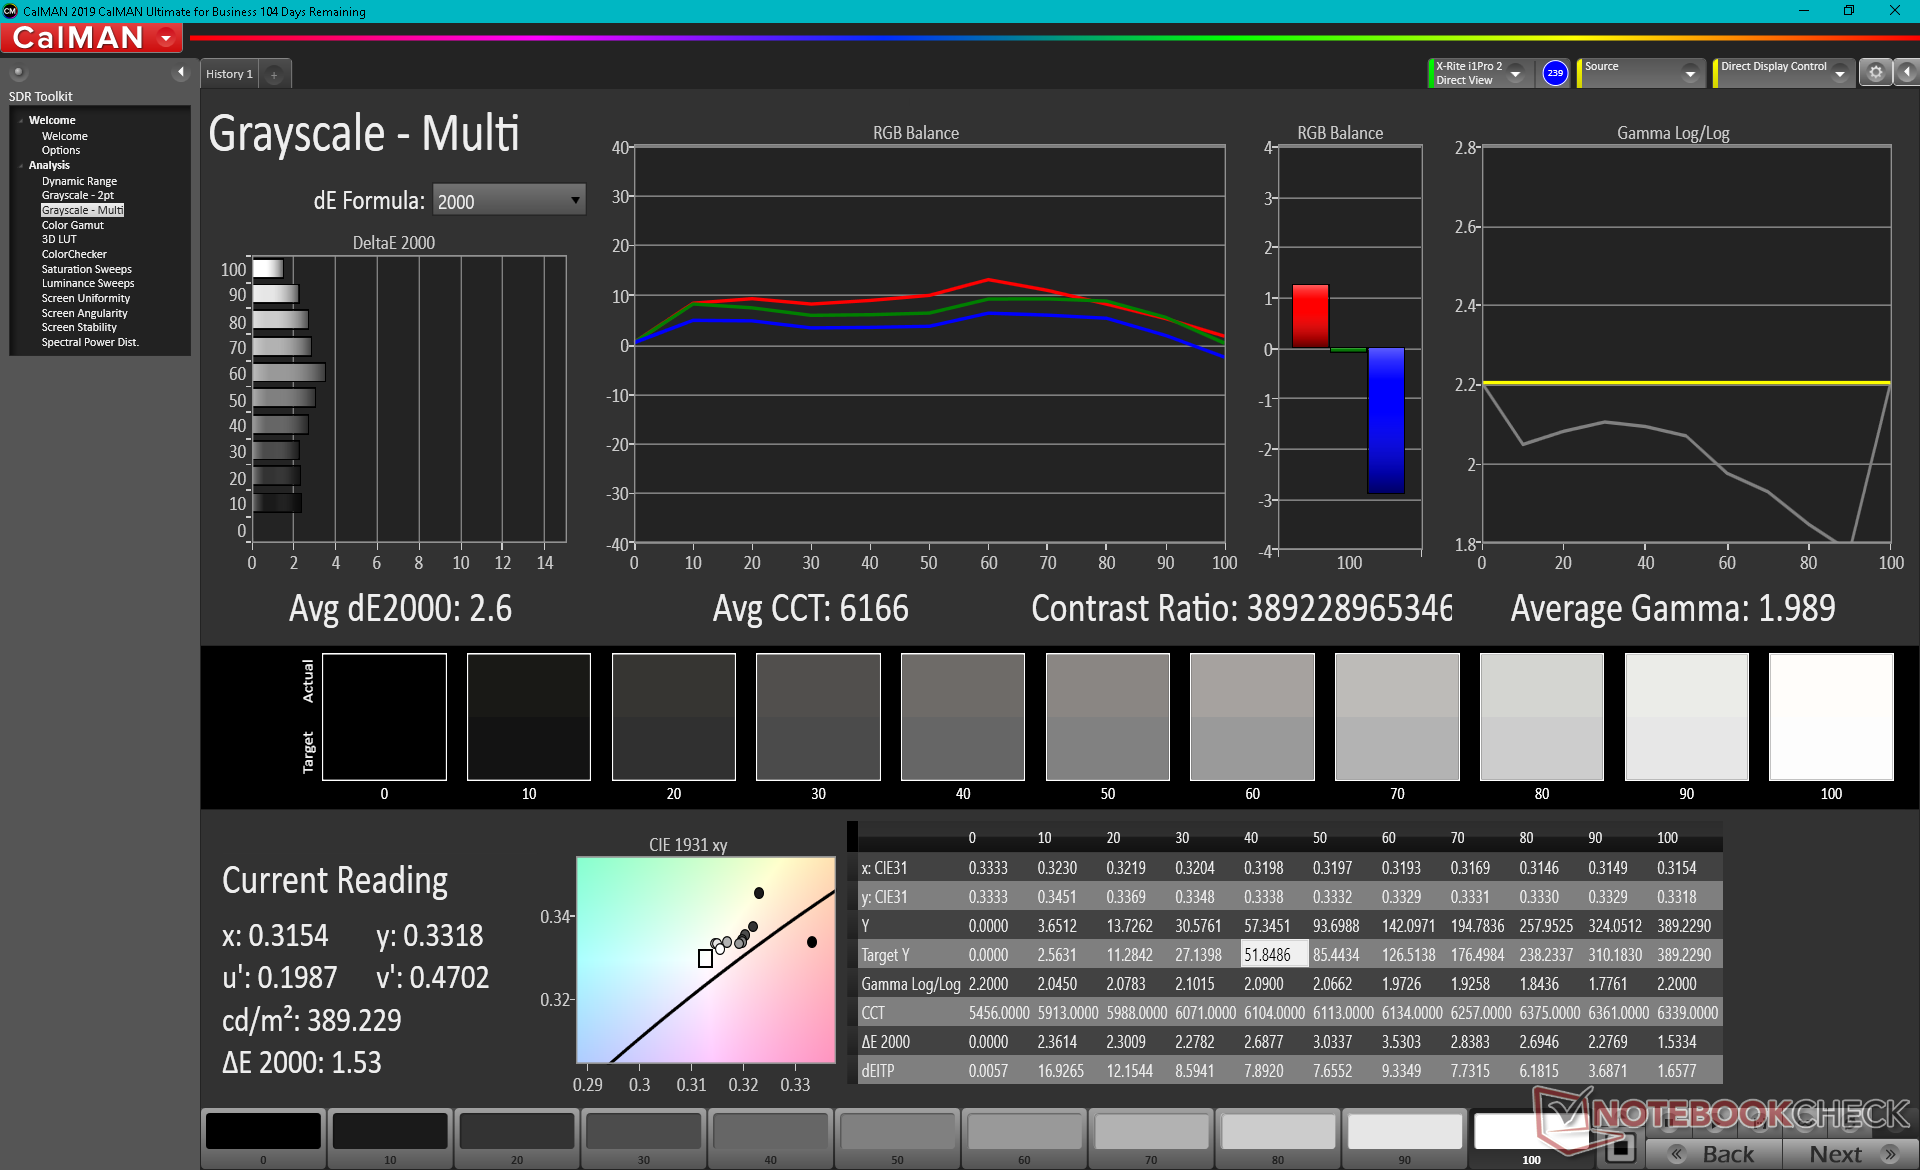
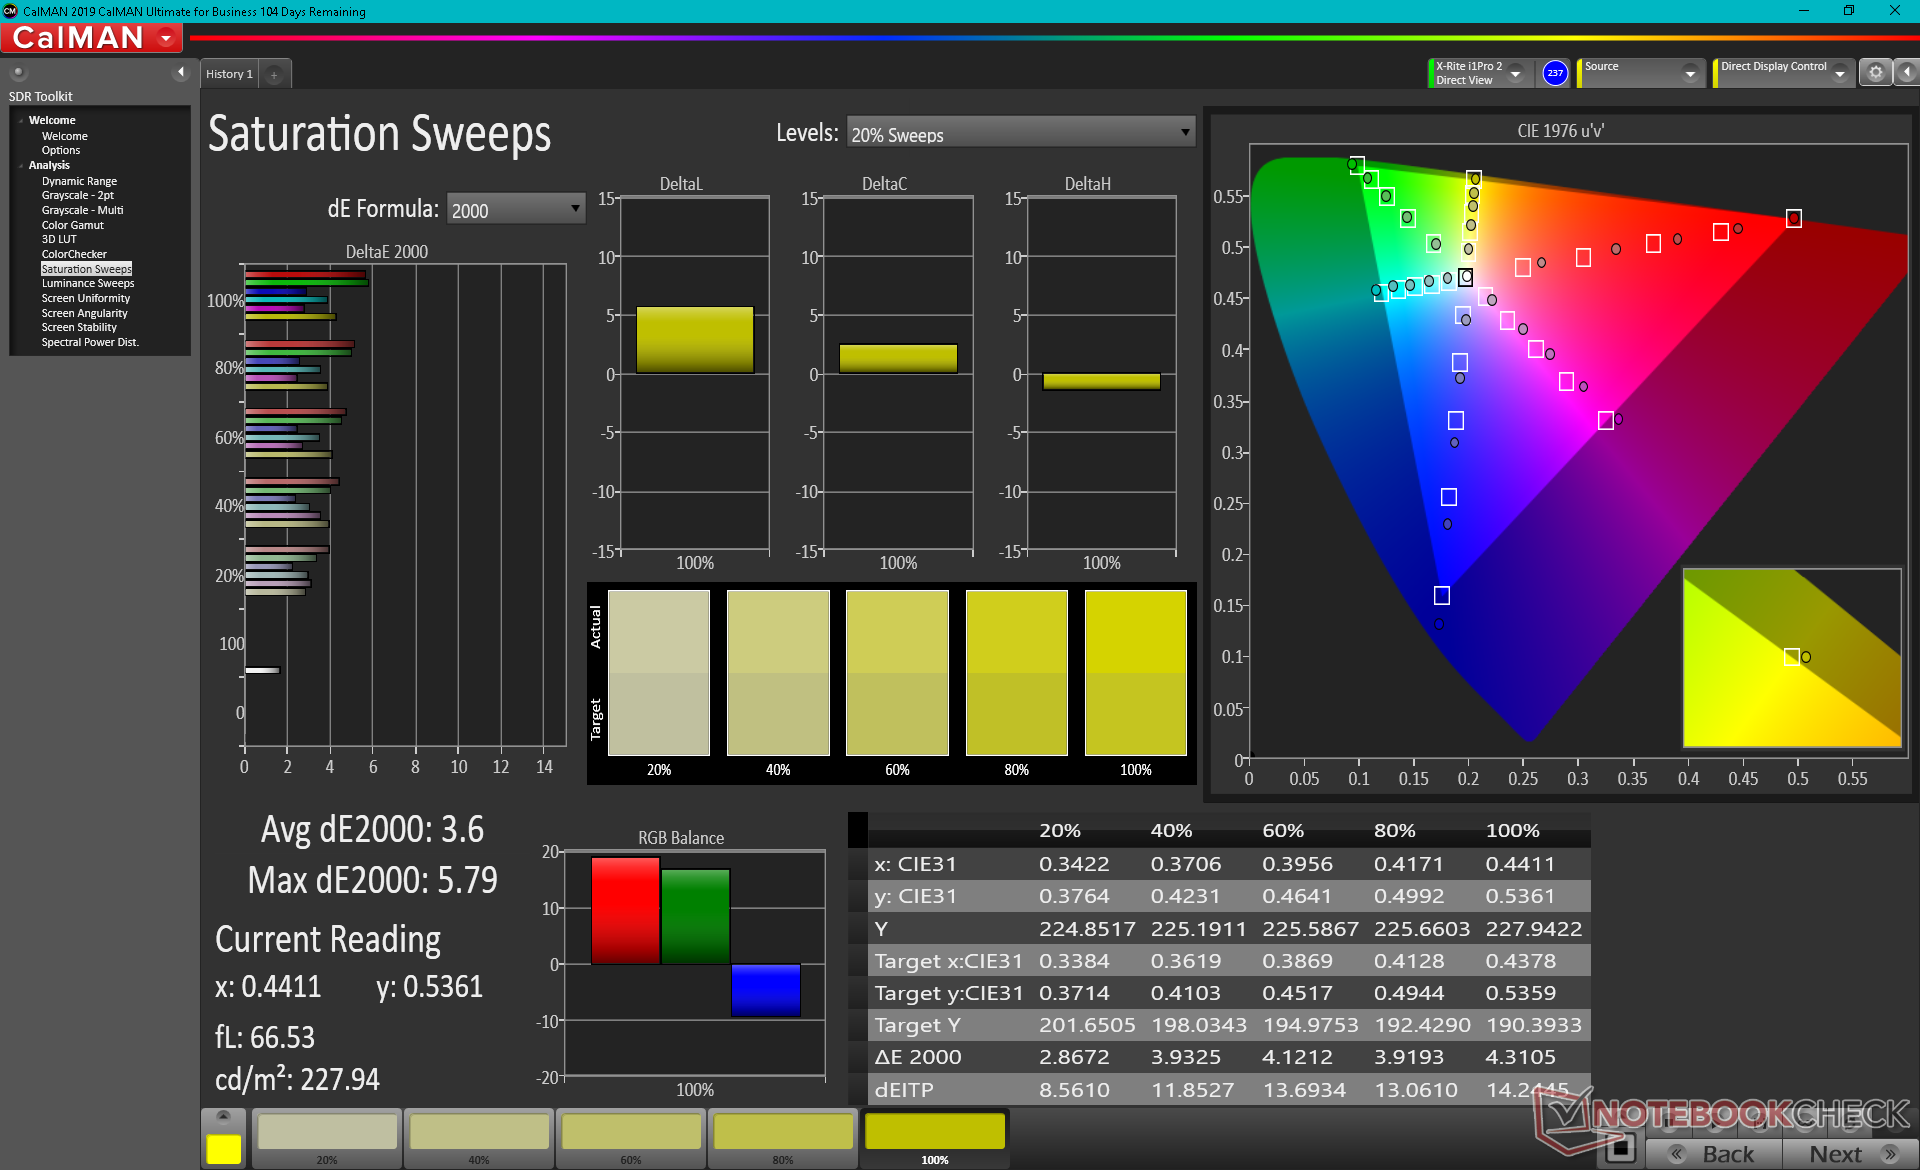
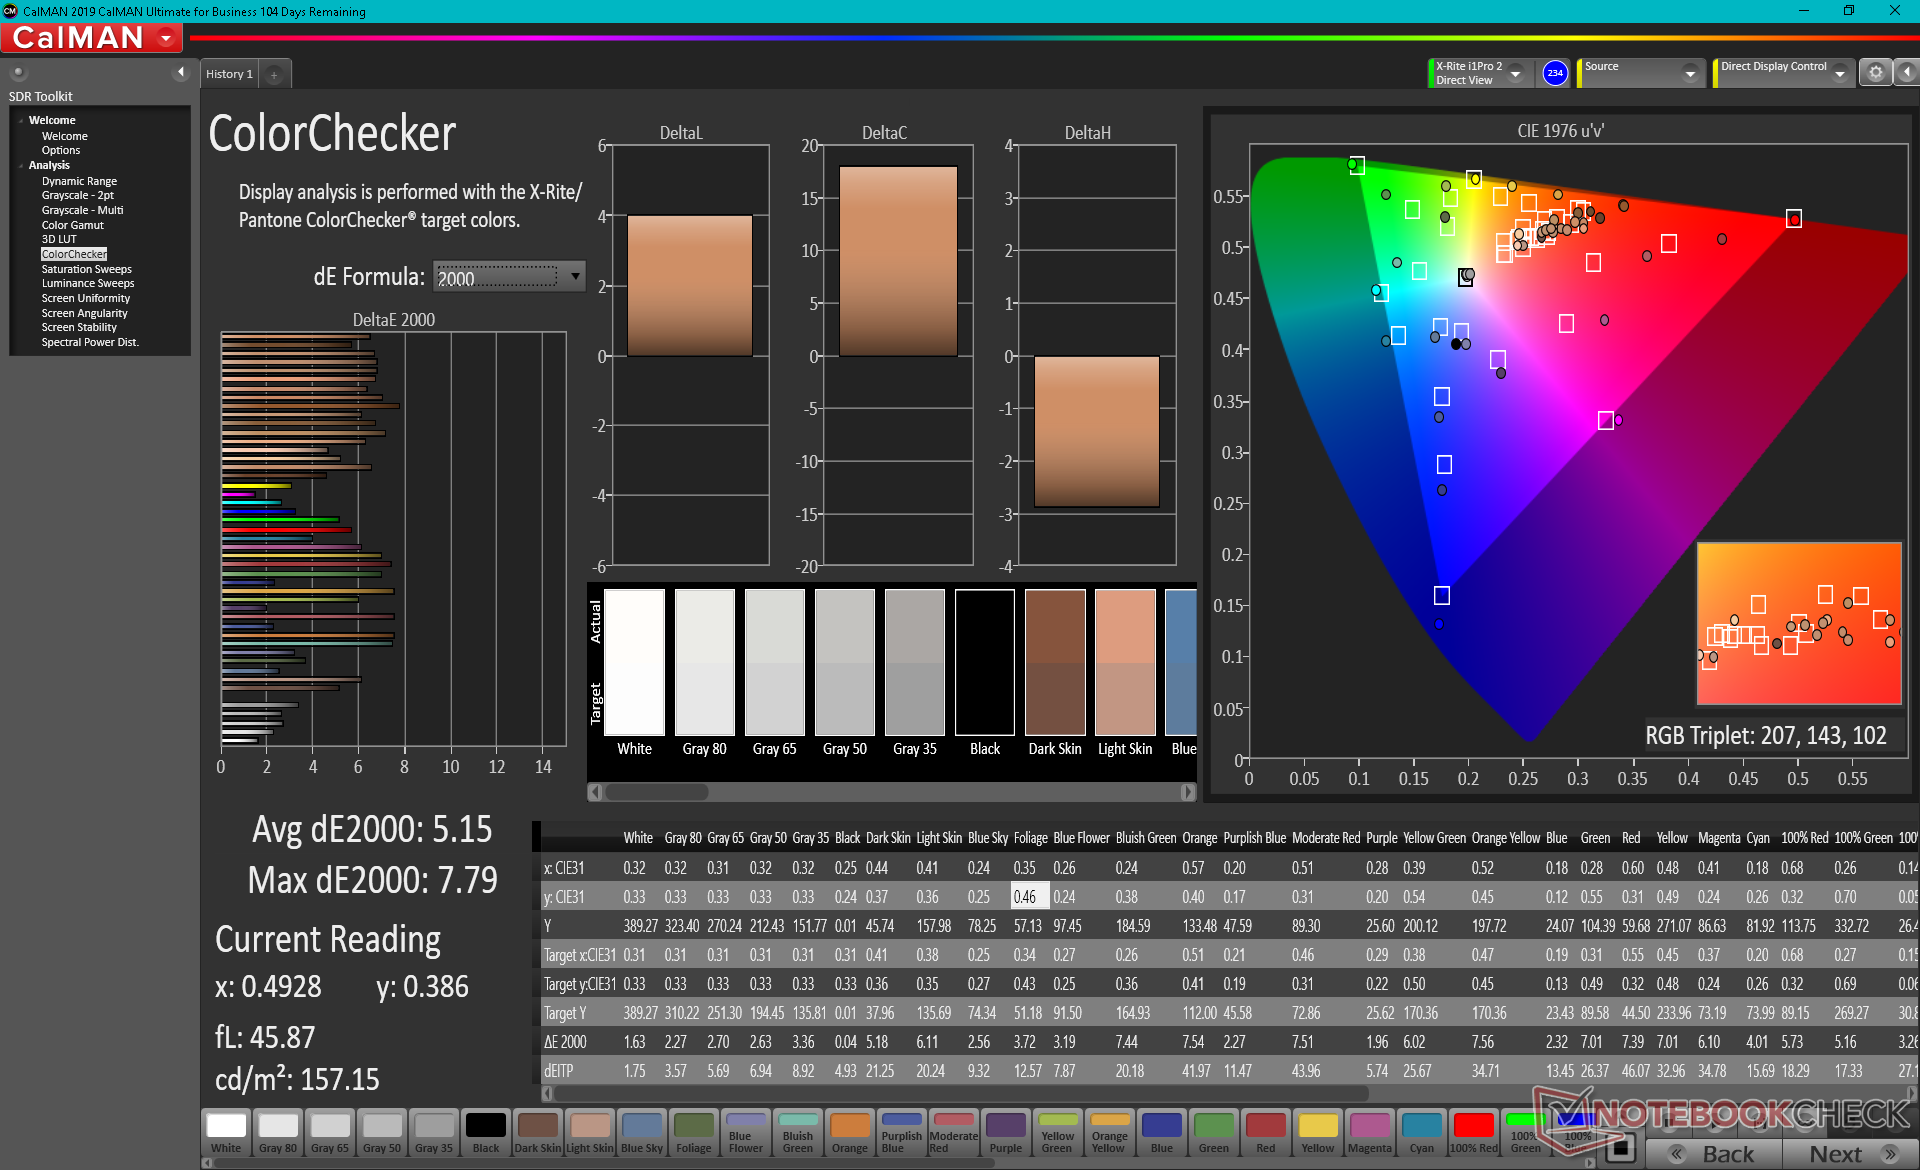
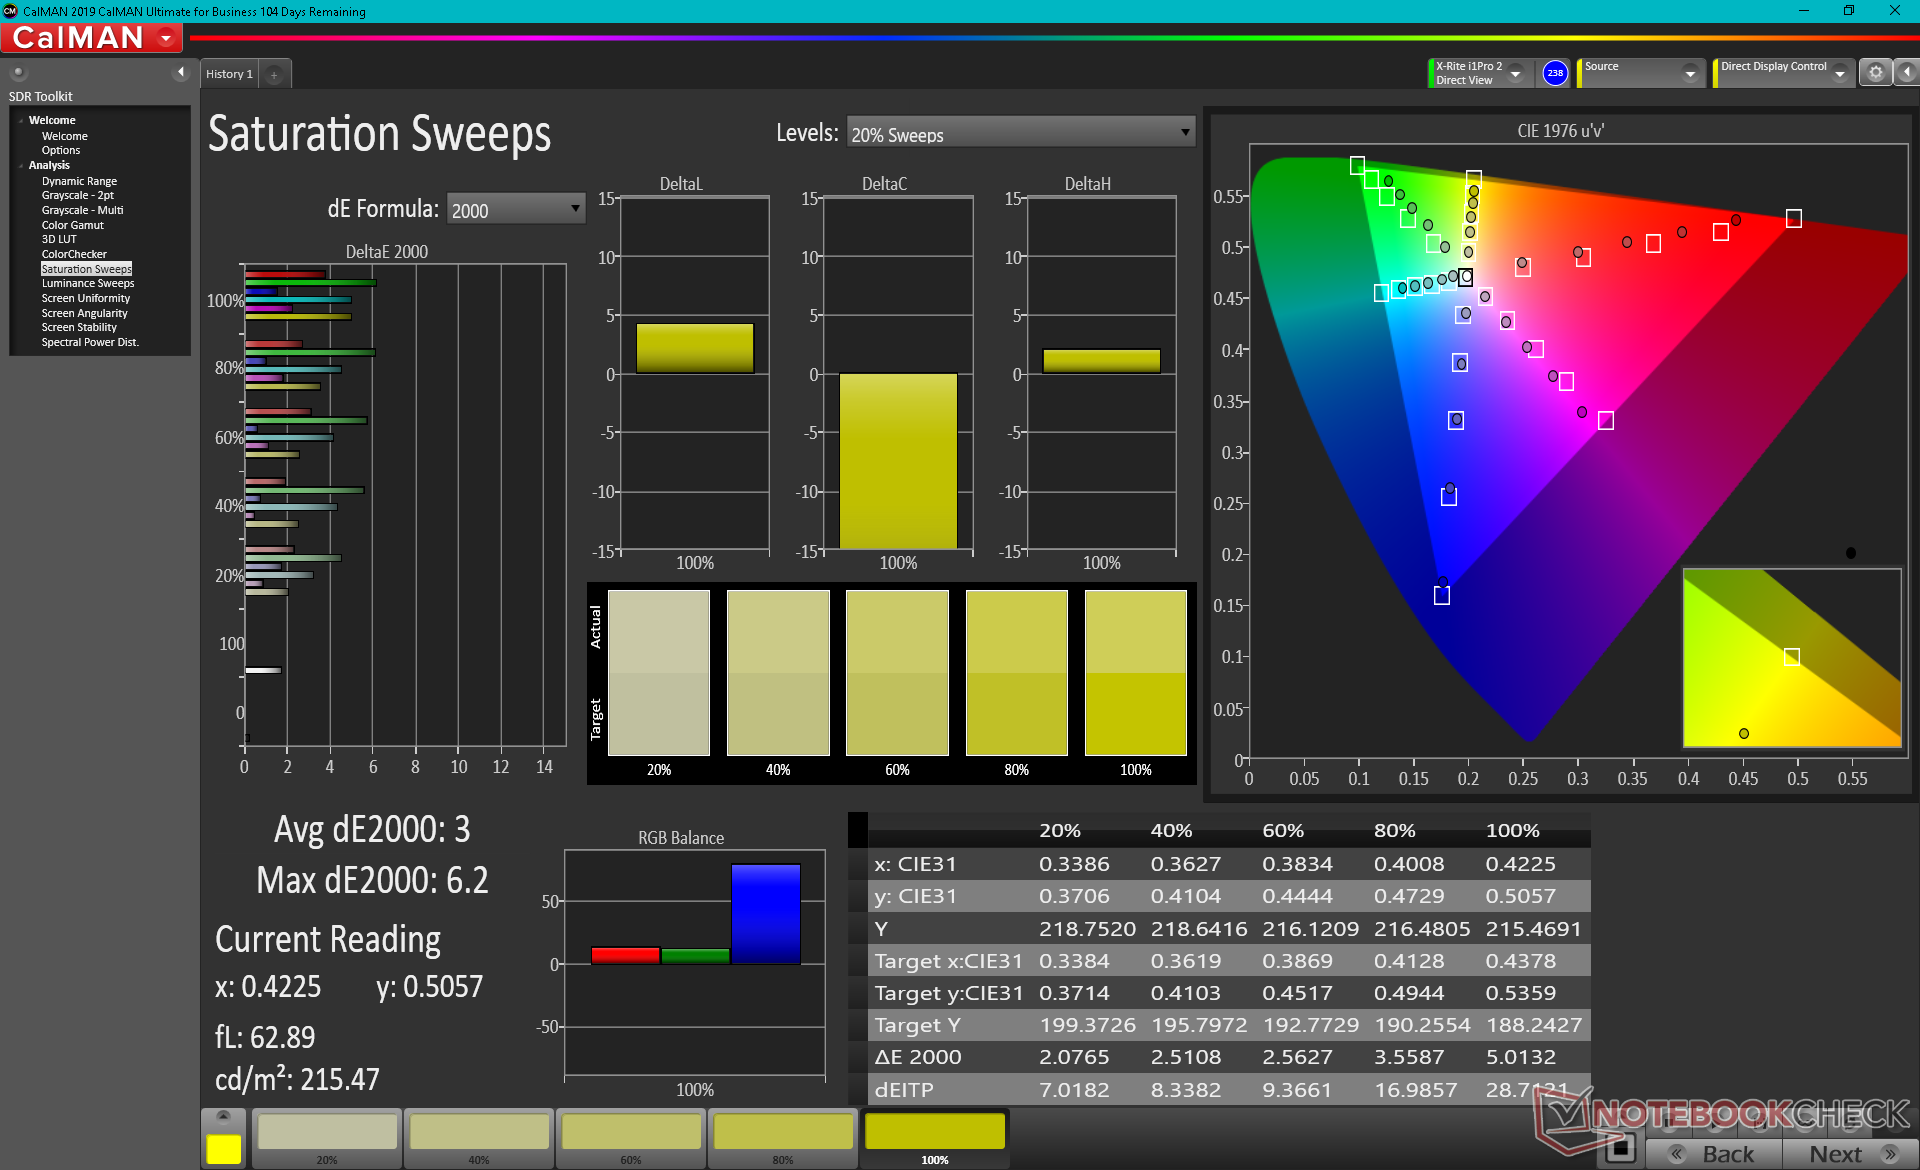
ΔE ColorChecker Calman: 5.15 | ∀{0.5-29.43 Ø4.73}
calibrated: 3.1
ΔE Greyscale Calman: 2.6 | ∀{0.09-98 Ø4.97}
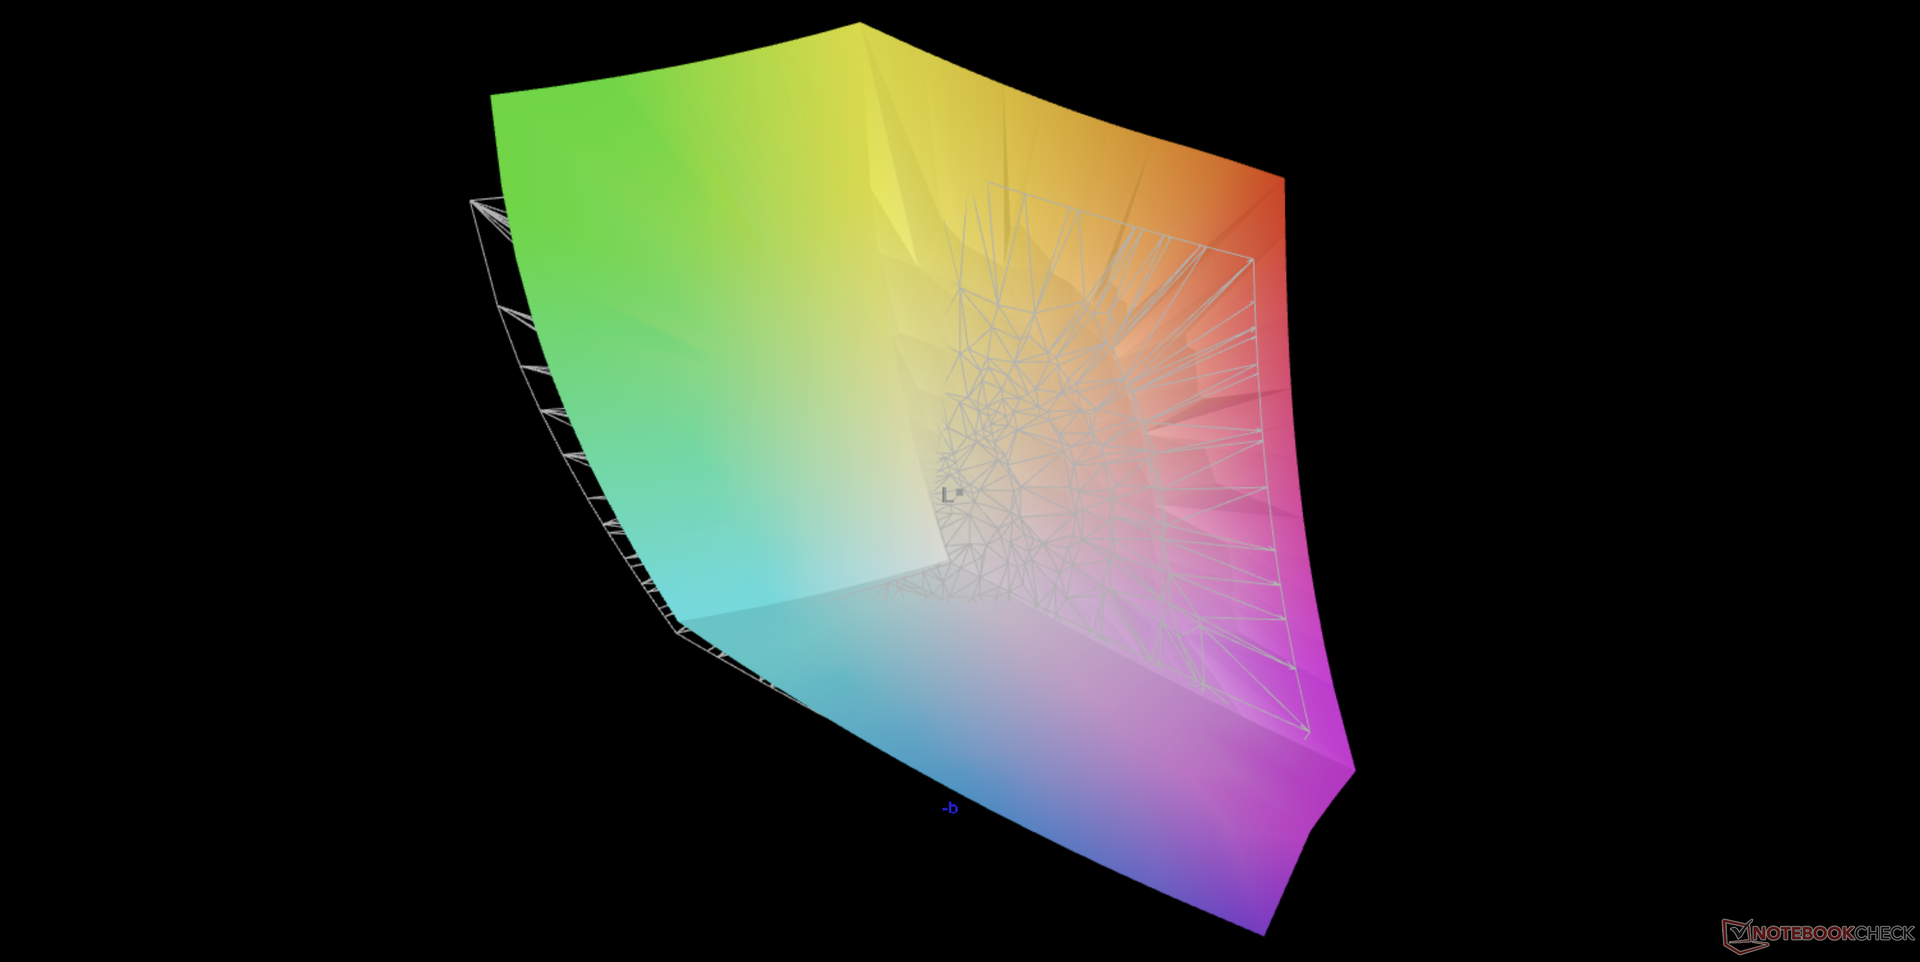
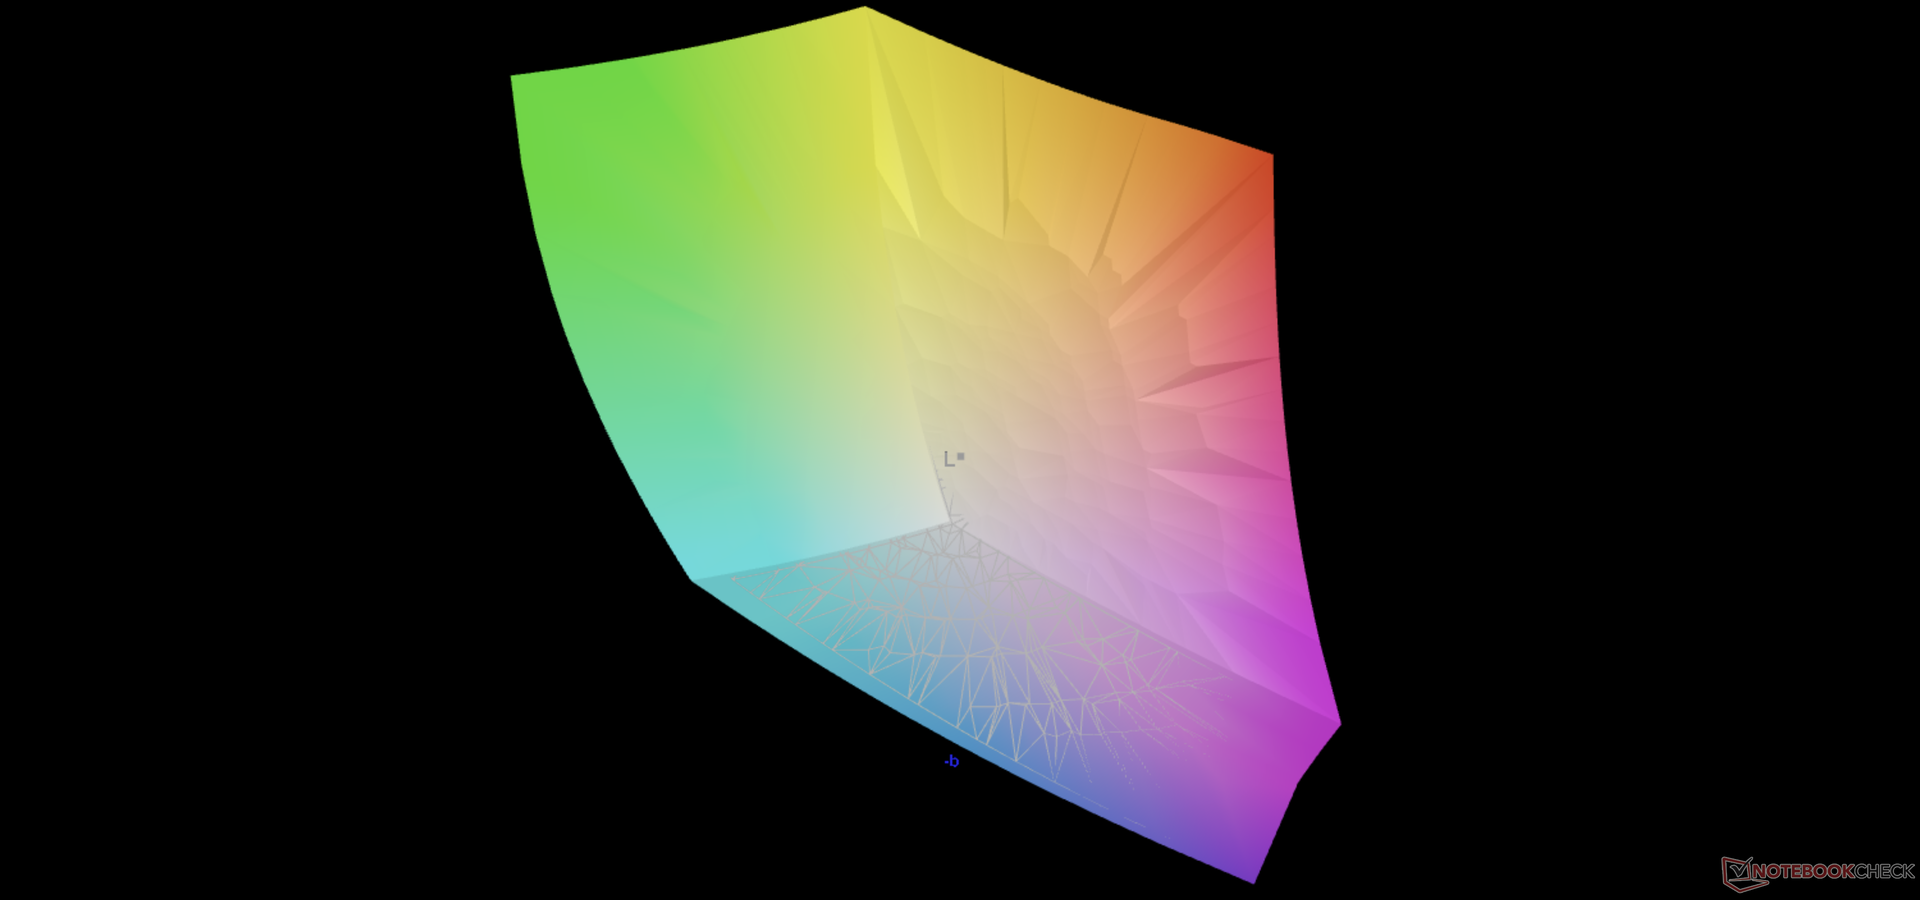
95.3% AdobeRGB 1998 (Argyll 3D)
100% sRGB (Argyll 3D)
99.9% Display P3 (Argyll 3D)
Gamma: 1.99
CCT: 6166 K
| HP ZBook Studio 15 G8 SDC4145, OLED, 15.6", 3840x2160 | HP ZBook Firefly 15 G8 2C9R7EA LGD069B, IPS, 15.6", 1920x1080 | HP ZBook Studio G7 LGD0661, IPS, 15.6", 3840x2160 | Dell Precision 7550 AU Optronics B156ZAN, IPS, 15.6", 3840x2160 | Lenovo ThinkPad P15s Gen2-20W6000GGE MNF601EA1-1, IPS LED, 15.6", 3840x2160 | |
|---|---|---|---|---|---|
| Display | -20% | -4% | -5% | -4% | |
| Display P3 Coverage (%) | 99.9 | 68.6 -31% | 98.2 -2% | 82.1 -18% | 84.5 -15% |
| sRGB Coverage (%) | 100 | 98.5 -1% | 99.9 0% | 99.6 0% | 98.7 -1% |
| AdobeRGB 1998 Coverage (%) | 95.3 | 70 -27% | 86.5 -9% | 96.8 2% | 97.8 3% |
| Response Times | -1733% | -1859% | -1675% | -1217% | |
| Response Time Grey 50% / Grey 80% * (ms) | 2.4 ? | 56 ? -2233% | 56.4 ? -2250% | 51.2 ? -2033% | 40 ? -1567% |
| Response Time Black / White * (ms) | 2.4 ? | 32 ? -1233% | 37.6 ? -1467% | 34 ? -1317% | 23.2 ? -867% |
| PWM Frequency (Hz) | 240.4 ? | ||||
| Screen | -30% | 59% | -11% | 57% | |
| Brightness middle (cd/m²) | 379.6 | 397 5% | 723 90% | 473.5 25% | 604 59% |
| Brightness (cd/m²) | 380 | 402 6% | 707 86% | 461 21% | 609 60% |
| Brightness Distribution (%) | 95 | 84 -12% | 92 -3% | 90 -5% | 91 -4% |
| Black Level * (cd/m²) | 0.13 | 0.35 | 0.55 | 0.34 | |
| Colorchecker dE 2000 * | 5.15 | 5.9 -15% | 1.4 73% | 4.8 7% | 0.9 83% |
| Colorchecker dE 2000 max. * | 7.79 | 9.4 -21% | 2.9 63% | 8.73 -12% | 2.6 67% |
| Colorchecker dE 2000 calibrated * | 3.1 | 1.1 65% | 0.5 84% | 3.08 1% | 0.8 74% |
| Greyscale dE 2000 * | 2.6 | 8.8 -238% | 2 23% | 5.6 -115% | 1.1 58% |
| Gamma | 1.99 111% | 2.47 89% | 2.14 103% | 2.34 94% | 2.15 102% |
| CCT | 6166 105% | 6416 101% | 6484 100% | 7549 86% | 6656 98% |
| Contrast (:1) | 3054 | 2066 | 861 | 1776 | |
| Color Space (Percent of AdobeRGB 1998) (%) | 63.7 | 77.3 | 86.4 | 84.5 | |
| Color Space (Percent of sRGB) (%) | 98.5 | 99.9 | 99.7 | 98.6 | |
| Moyenne finale (programmes/paramètres) | -594% /
-311% | -601% /
-276% | -564% /
-287% | -388% /
-171% |
* ... Moindre est la valeur, meilleures sont les performances
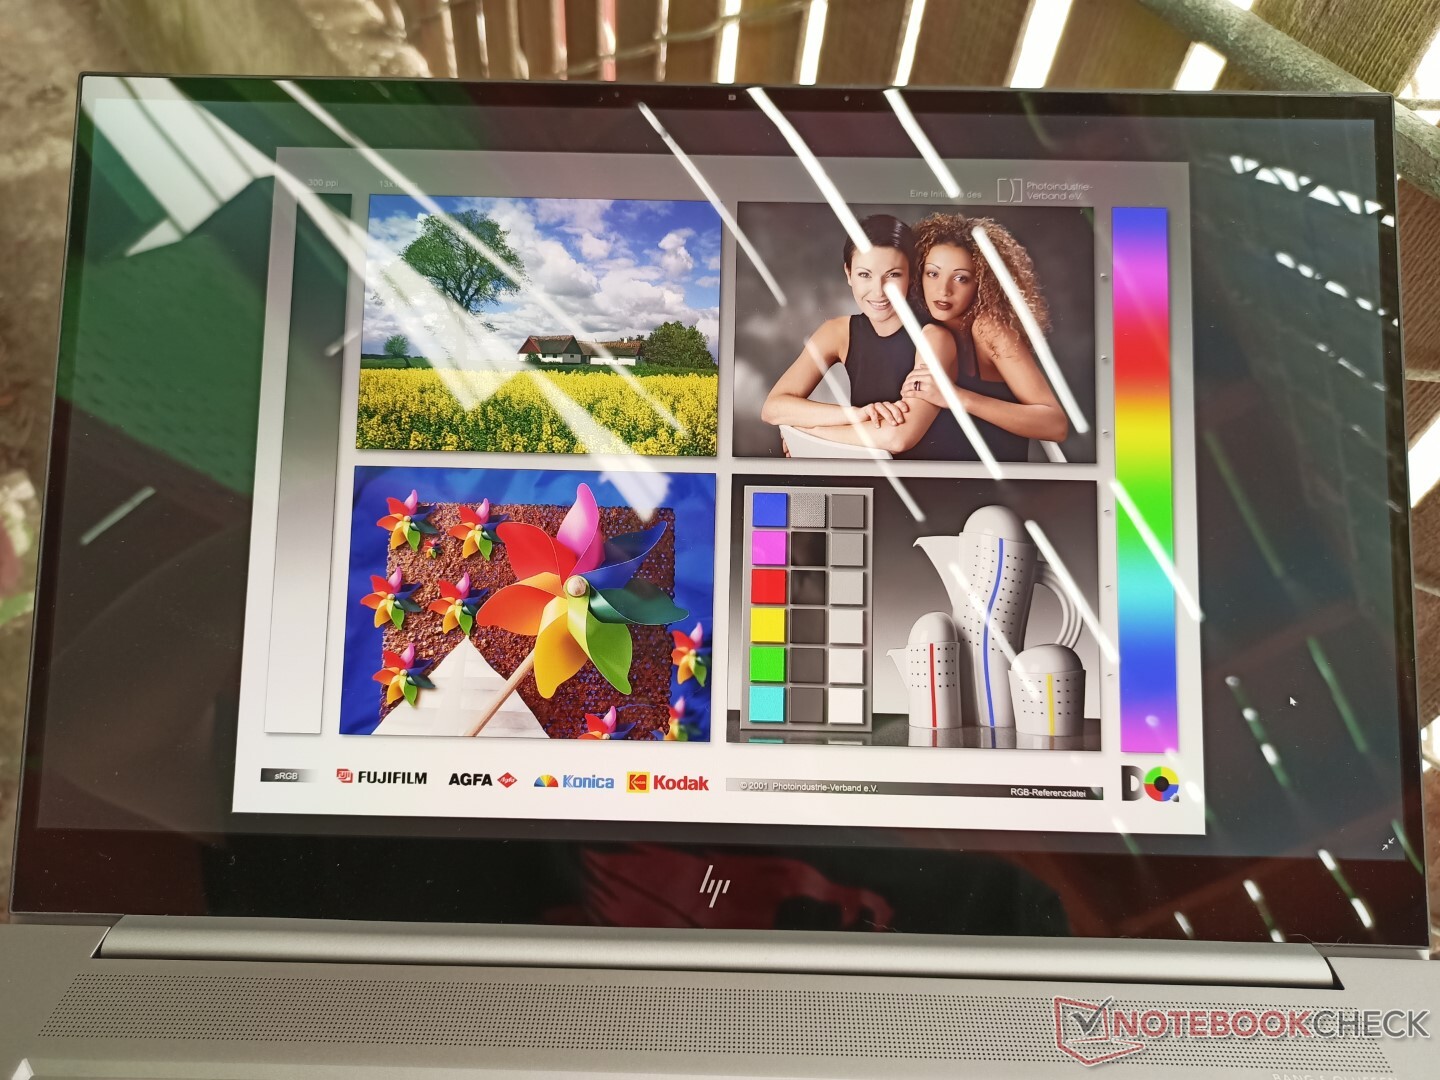
L'OLED offre généralement des couleurs plus profondes que l'IPS et notre ZBook Studio G8 ne fait pas exception. Les utilisateurs bénéficieront d'une couverture DCI-P3 complète, alors que la plupart des panneaux 1080p à faible résolution ne proposent que des couleurs sRGB.
Les mesures du colorimètre X-Rite montrent que la température des couleurs est légèrement chaude, à environ 6200K, au lieu des 6500K habituels sur la plupart des autres écrans calibrés qui ciblent sRGB. Contrairement à la plupart des modèles Dell Precision, HP ne propose pas de logiciel préinstallé conçu spécifiquement pour le réglage des couleurs.
Temps de réponse de l'écran
| ↔ Temps de réponse noir à blanc | ||
|---|---|---|
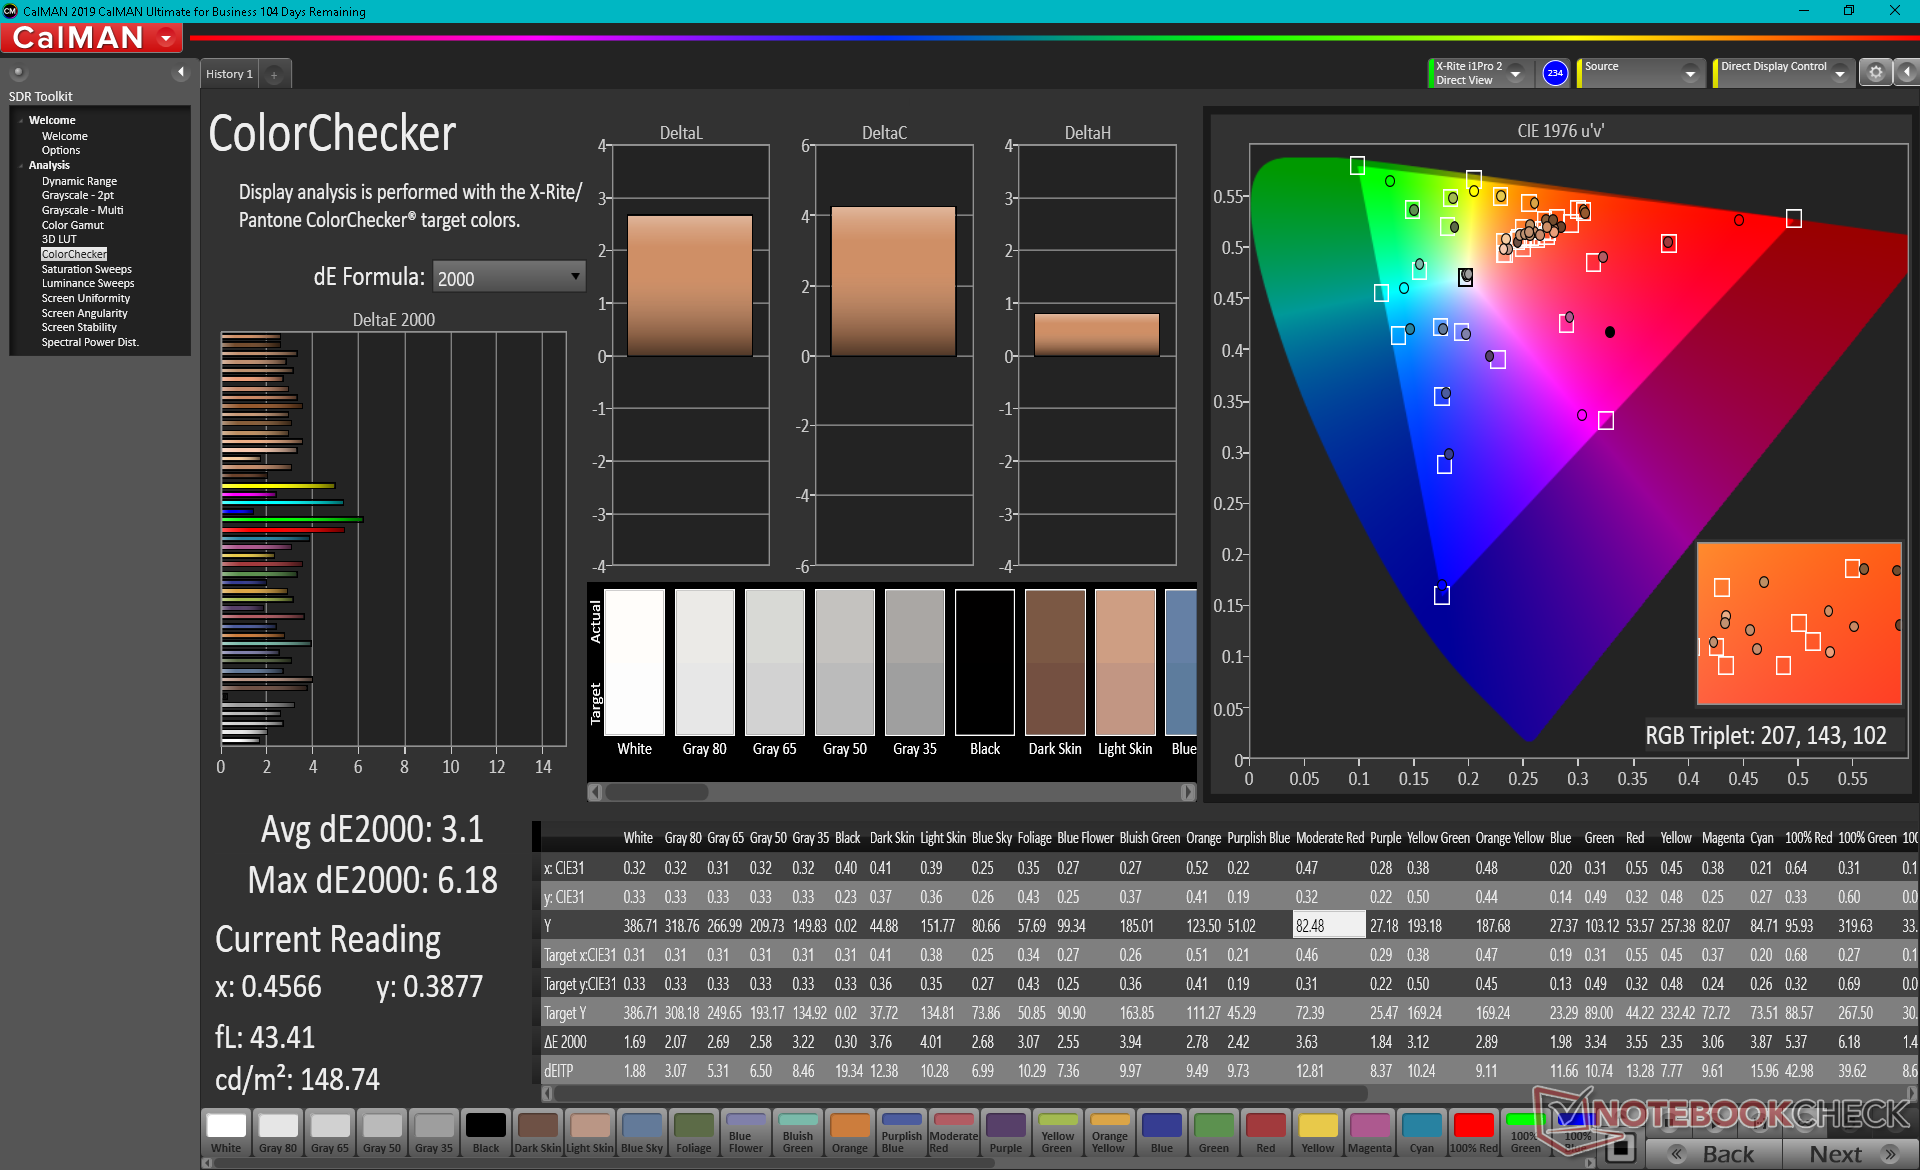
| 2.4 ms ... hausse ↗ et chute ↘ combinées | ↗ 1.1 ms hausse | 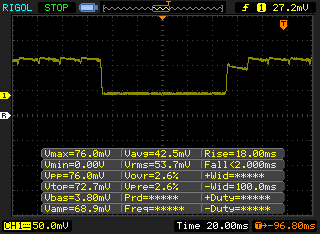 |
| ↘ 1.3 ms chute | ||
| L'écran montre de très faibles temps de réponse, parfait pour le jeu. En comparaison, tous les appareils testés affichent entre 0.1 (minimum) et 240 (maximum) ms. » 12 % des appareils testés affichent de meilleures performances. Cela signifie que les latences relevées sont meilleures que la moyenne (19.9 ms) de tous les appareils testés. | ||
| ↔ Temps de réponse gris 50% à gris 80% | ||
| 2.4 ms ... hausse ↗ et chute ↘ combinées | ↗ 1 ms hausse | 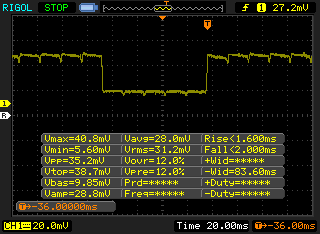 |
| ↘ 1.4 ms chute | ||
| L'écran montre de très faibles temps de réponse, parfait pour le jeu. En comparaison, tous les appareils testés affichent entre 0.165 (minimum) et 636 (maximum) ms. » 11 % des appareils testés affichent de meilleures performances. Cela signifie que les latences relevées sont meilleures que la moyenne (31.1 ms) de tous les appareils testés. | ||
Scintillement / MLI (Modulation de largeur d'impulsion)
| Scintillement / MLI (Modulation de largeur d'impulsion) décelé | 240.4 Hz | ≤ 52 Niveau de luminosité |  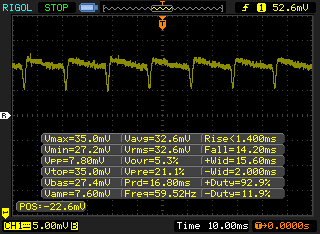 |
Le rétroéclairage de l'écran scintille à la fréquence de 240.4 Hz (certainement du fait de l'utilisation d'une MDI - Modulation de largeur d'impulsion) à un niveau de luminosité inférieur ou égal à 52 % . Aucun scintillement ne devrait être perceptible au-dessus de cette valeur. La fréquence de rafraîchissement de 240.4 Hz est relativement faible, les personnes les plus sensibles devraient percevoir un scintillement et être sujettes à une fatigue oculaire accrue (avec le niveau de luminosité indiqué) En comparaison, 52 % des appareils testés n'emploient pas MDI pour assombrir leur écran. Nous avons relevé une moyenne à 7788 (minimum : 5 - maximum : 343500) Hz dans le cas où une MDI était active. | |||
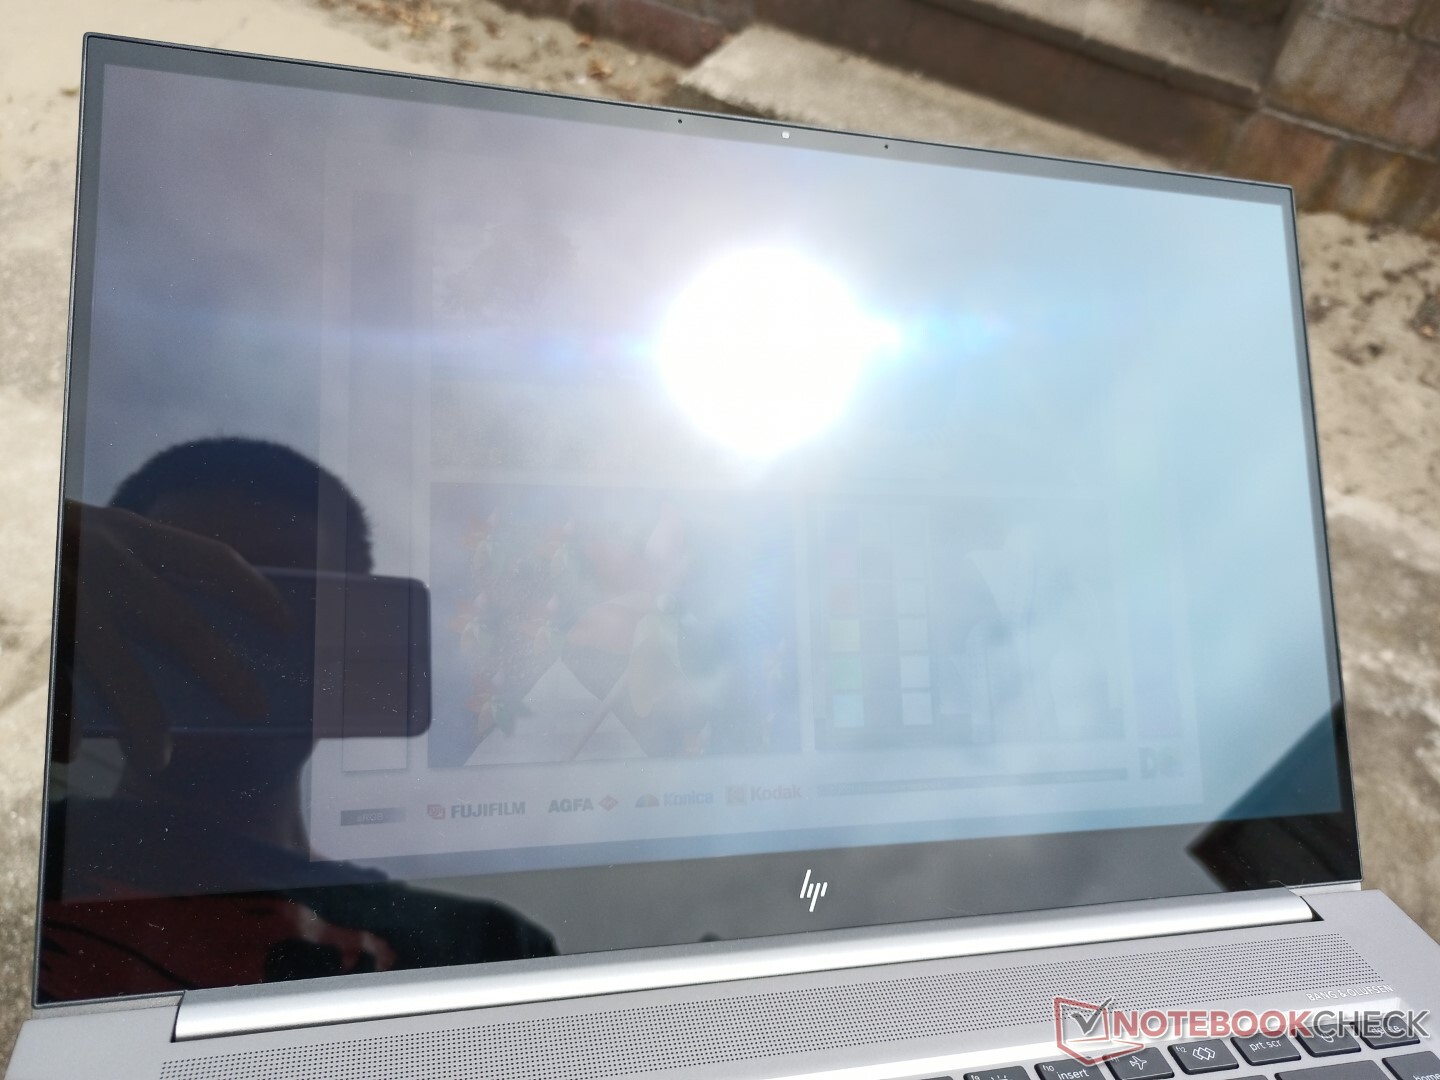
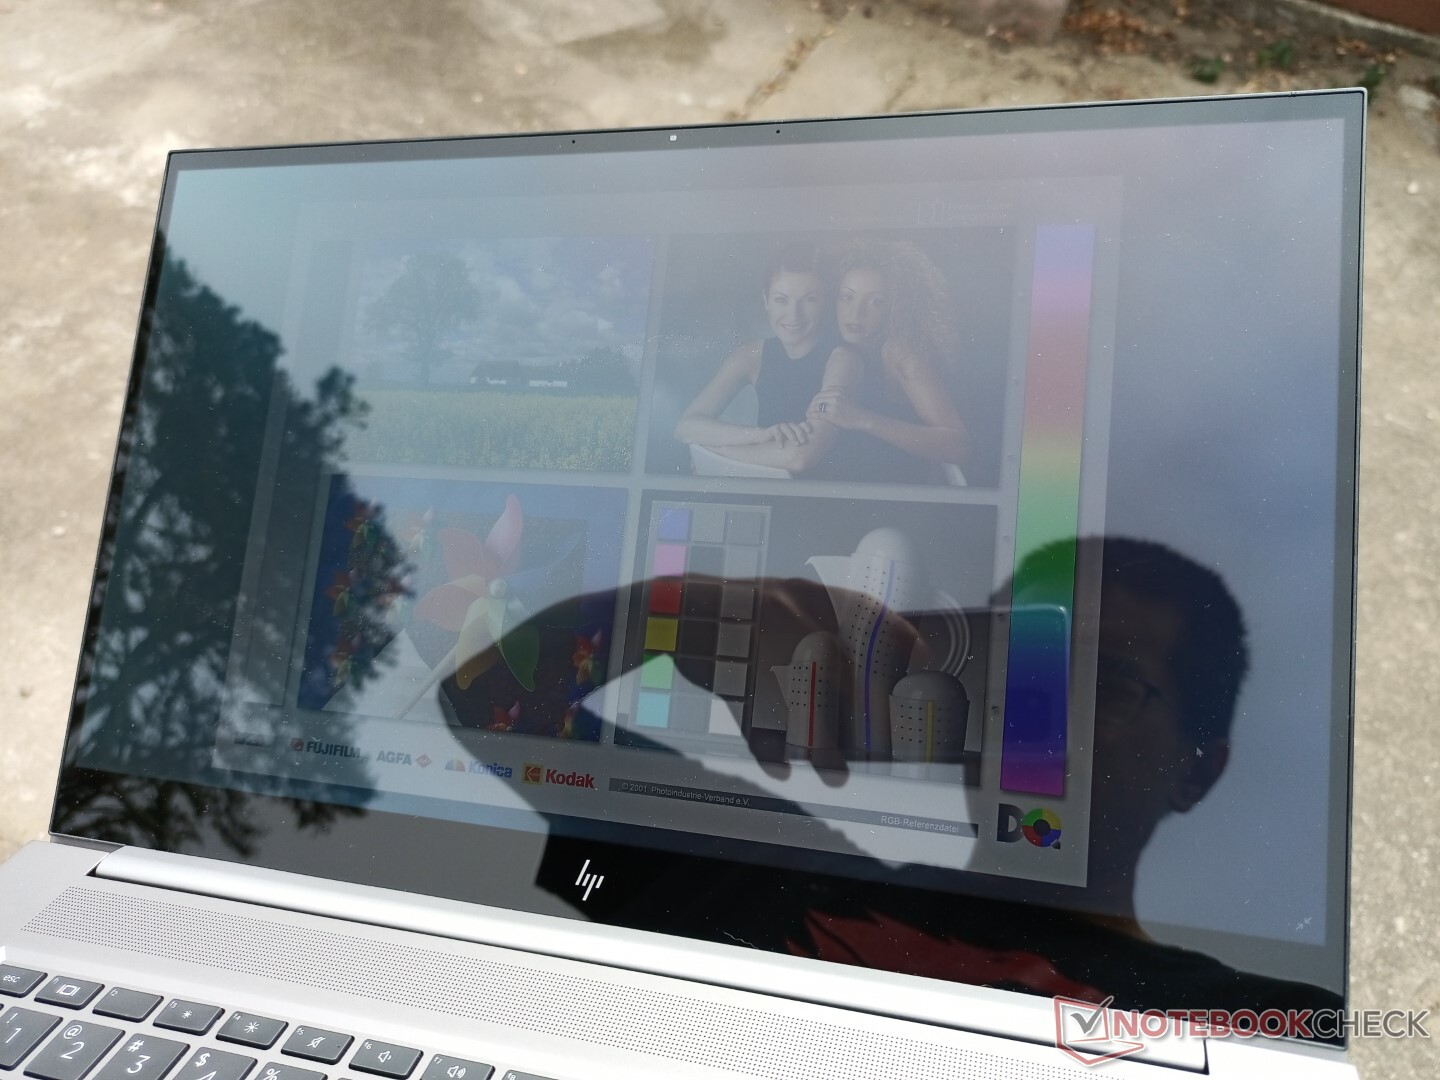
La couche brillante contribue à un éblouissement notable en extérieur, comme le montrent les photos ci-dessous. Les utilisateurs qui prévoient d'utiliser l'ordinateur portable à l'extérieur de manière fréquente devraient envisager de passer à l'option de panneau 1000 nits. D'après notre expérience avec les dalles 1000 nits de HP, la luminosité maximale réelle sera plus proche de 700 nits que de 1000 nits, ce qui serait tout de même près de deux fois plus lumineux que notre dalle 400 nits de base. Cependant, seule la dalle IPS FHD est disponible avec la configuration 1000 nits.
Performances - Un grand choix
Les options de processeurs comprennent les Intel Core i7-11800H ou i9-11900H de 11e génération, ainsi que leurs homologues i7-11850H ou i9-11950H i9-11950H vPro équivalents. Il s'agit de certains des processeurs octa-core de la série H d'Intel les plus rapides du moment, qui rivalisent avec la série Ryzen 9 d'AMD, comme le modèle 5900HX.
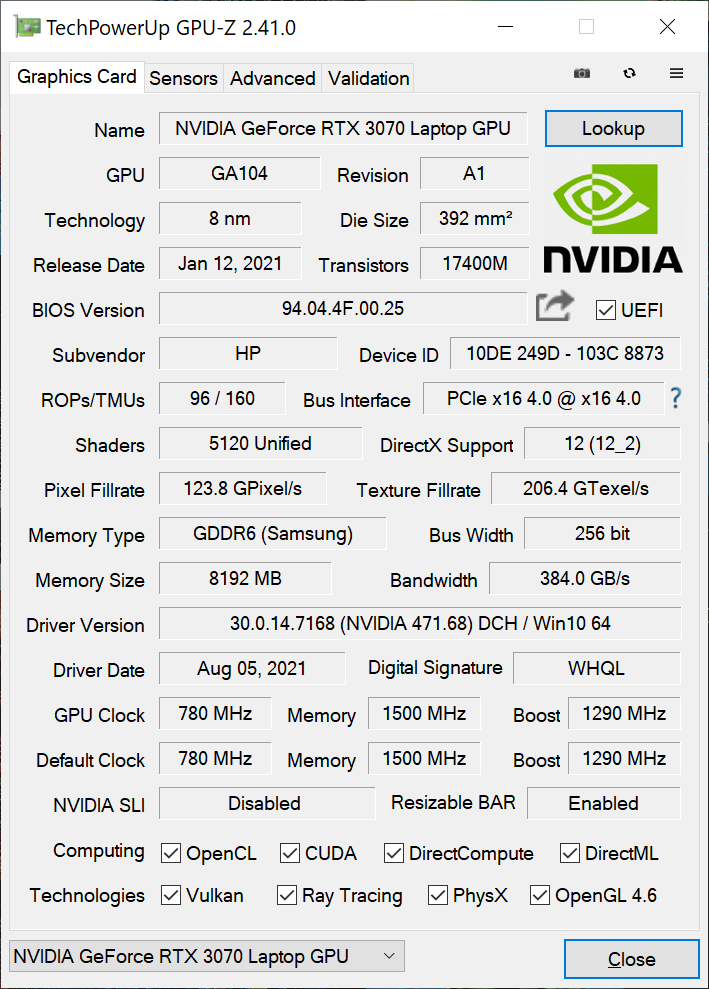
Le GeForce RTX 3070 dans notre système est une variante TGP de 85 W par rapport à la version plus commune de 100 W ou plus sur la plupart des autres ordinateurs portables. Les performances seront donc légèrement plus lentes, ce que nos benchmarks GPU ci-dessous montreront. En fait, il s'agit techniquement d'une partie "Max-Q" selon le panneau de configuration Nvidia. Optimus 1.0 et Resizable Bar sont tous deux pris en charge.
Processeur
Comme prévu, les performances du CPU sont très légèrement inférieures à celles duCore i9-11900H en raison de la surcharge de performance requise pour la prise en charge de vPro. D'une génération à l'autre, les performances brutes multithread sont environ 20 à 25 % plus rapides que celles de l'ancien Core i9-10885H dans le ZBook Studio G7
La durabilité des performances est stable, sans baisse majeure dans le temps, lors de l'exécution de CineBench R15 xT en boucle continue.
Cinebench R15 Multi Loop
Cinebench R23: Multi Core | Single Core
Cinebench R15: CPU Multi 64Bit | CPU Single 64Bit
Blender: v2.79 BMW27 CPU
7-Zip 18.03: 7z b 4 -mmt1 | 7z b 4
Geekbench 5.5: Single-Core | Multi-Core
HWBOT x265 Benchmark v2.2: 4k Preset
LibreOffice : 20 Documents To PDF
R Benchmark 2.5: Overall mean
| Cinebench R23 / Multi Core | |
| Asus ROG Strix Scar 15 G533QS | |
| Asus ROG Zephyrus S17 GX703HSD | |
| Moyenne Intel Core i9-11950H (12048 - 13113, n=4) | |
| HP ZBook Studio 15 G8 | |
| Schenker XMG Core 15 Ampere | |
| Dell XPS 15 9510 11800H RTX 3050 Ti OLED | |
| HP ZBook Studio G7 | |
| Cinebench R23 / Single Core | |
| Moyenne Intel Core i9-11950H (1569 - 1633, n=4) | |
| Asus ROG Zephyrus S17 GX703HSD | |
| HP ZBook Studio 15 G8 | |
| Dell XPS 15 9510 11800H RTX 3050 Ti OLED | |
| Asus ROG Strix Scar 15 G533QS | |
| HP ZBook Studio G7 | |
| Schenker XMG Core 15 Ampere | |
| Geekbench 5.5 / Single-Core | |
| HP ZBook Studio 15 G8 | |
| Moyenne Intel Core i9-11950H (1623 - 1702, n=3) | |
| Asus ROG Zephyrus S17 GX703HSD | |
| Dell XPS 15 9510 11800H RTX 3050 Ti OLED | |
| Asus TUF Gaming A15 FA506QR-AZ061T | |
| HP ZBook Studio G7 | |
| MSI WS66 10TMT-207US | |
| Dell Precision 5550 P91F | |
| Schenker XMG Core 15 Ampere | |
| Geekbench 5.5 / Multi-Core | |
| Asus ROG Zephyrus S17 GX703HSD | |
| Dell Precision 5550 P91F | |
| MSI WS66 10TMT-207US | |
| Dell XPS 15 9510 11800H RTX 3050 Ti OLED | |
| Schenker XMG Core 15 Ampere | |
| Moyenne Intel Core i9-11950H (7286 - 8152, n=3) | |
| HP ZBook Studio G7 | |
| Asus TUF Gaming A15 FA506QR-AZ061T | |
| HP ZBook Studio 15 G8 | |
| HWBOT x265 Benchmark v2.2 / 4k Preset | |
| Asus ROG Zephyrus S17 GX703HSD | |
| Asus ROG Strix Scar 15 G533QS | |
| HP ZBook Studio 15 G8 | |
| Moyenne Intel Core i9-11950H (13.8 - 14.5, n=4) | |
| Schenker XMG Core 15 Ampere | |
| Asus TUF Gaming A15 FA506QR-AZ061T | |
| MSI WS66 10TMT-207US | |
| HP ZBook Studio G7 | |
| Dell XPS 15 9510 11800H RTX 3050 Ti OLED | |
| Dell Precision 5550 P91F | |
| LibreOffice / 20 Documents To PDF | |
| HP ZBook Studio G7 | |
| Schenker XMG Core 15 Ampere | |
| Asus ROG Strix Scar 15 G533QS | |
| Asus TUF Gaming A15 FA506QR-AZ061T | |
| HP ZBook Studio 15 G8 | |
| Moyenne Intel Core i9-11950H (38.6 - 53.2, n=4) | |
| Dell XPS 15 9510 11800H RTX 3050 Ti OLED | |
| Asus ROG Zephyrus S17 GX703HSD | |
| MSI WS66 10TMT-207US | |
| Dell Precision 5550 P91F | |
* ... Moindre est la valeur, meilleures sont les performances
Performance du système
| PCMark 10 / Score | |
| HP ZBook Studio 15 G8 | |
| Dell Precision 7550 | |
| HP ZBook Firefly 15 G8 2C9R7EA | |
| HP ZBook Studio G7 | |
| Lenovo ThinkPad P15s Gen2-20W6000GGE | |
| Asus ProArt StudioBook Pro 15 W500G5T | |
| PCMark 10 / Essentials | |
| HP ZBook Studio 15 G8 | |
| Dell Precision 7550 | |
| Lenovo ThinkPad P15s Gen2-20W6000GGE | |
| HP ZBook Firefly 15 G8 2C9R7EA | |
| Asus ProArt StudioBook Pro 15 W500G5T | |
| HP ZBook Studio G7 | |
| PCMark 10 / Productivity | |
| Lenovo ThinkPad P15s Gen2-20W6000GGE | |
| HP ZBook Firefly 15 G8 2C9R7EA | |
| HP ZBook Studio 15 G8 | |
| Dell Precision 7550 | |
| Asus ProArt StudioBook Pro 15 W500G5T | |
| HP ZBook Studio G7 | |
| PCMark 10 / Digital Content Creation | |
| HP ZBook Studio 15 G8 | |
| Dell Precision 7550 | |
| HP ZBook Studio G7 | |
| HP ZBook Firefly 15 G8 2C9R7EA | |
| Asus ProArt StudioBook Pro 15 W500G5T | |
| Lenovo ThinkPad P15s Gen2-20W6000GGE | |
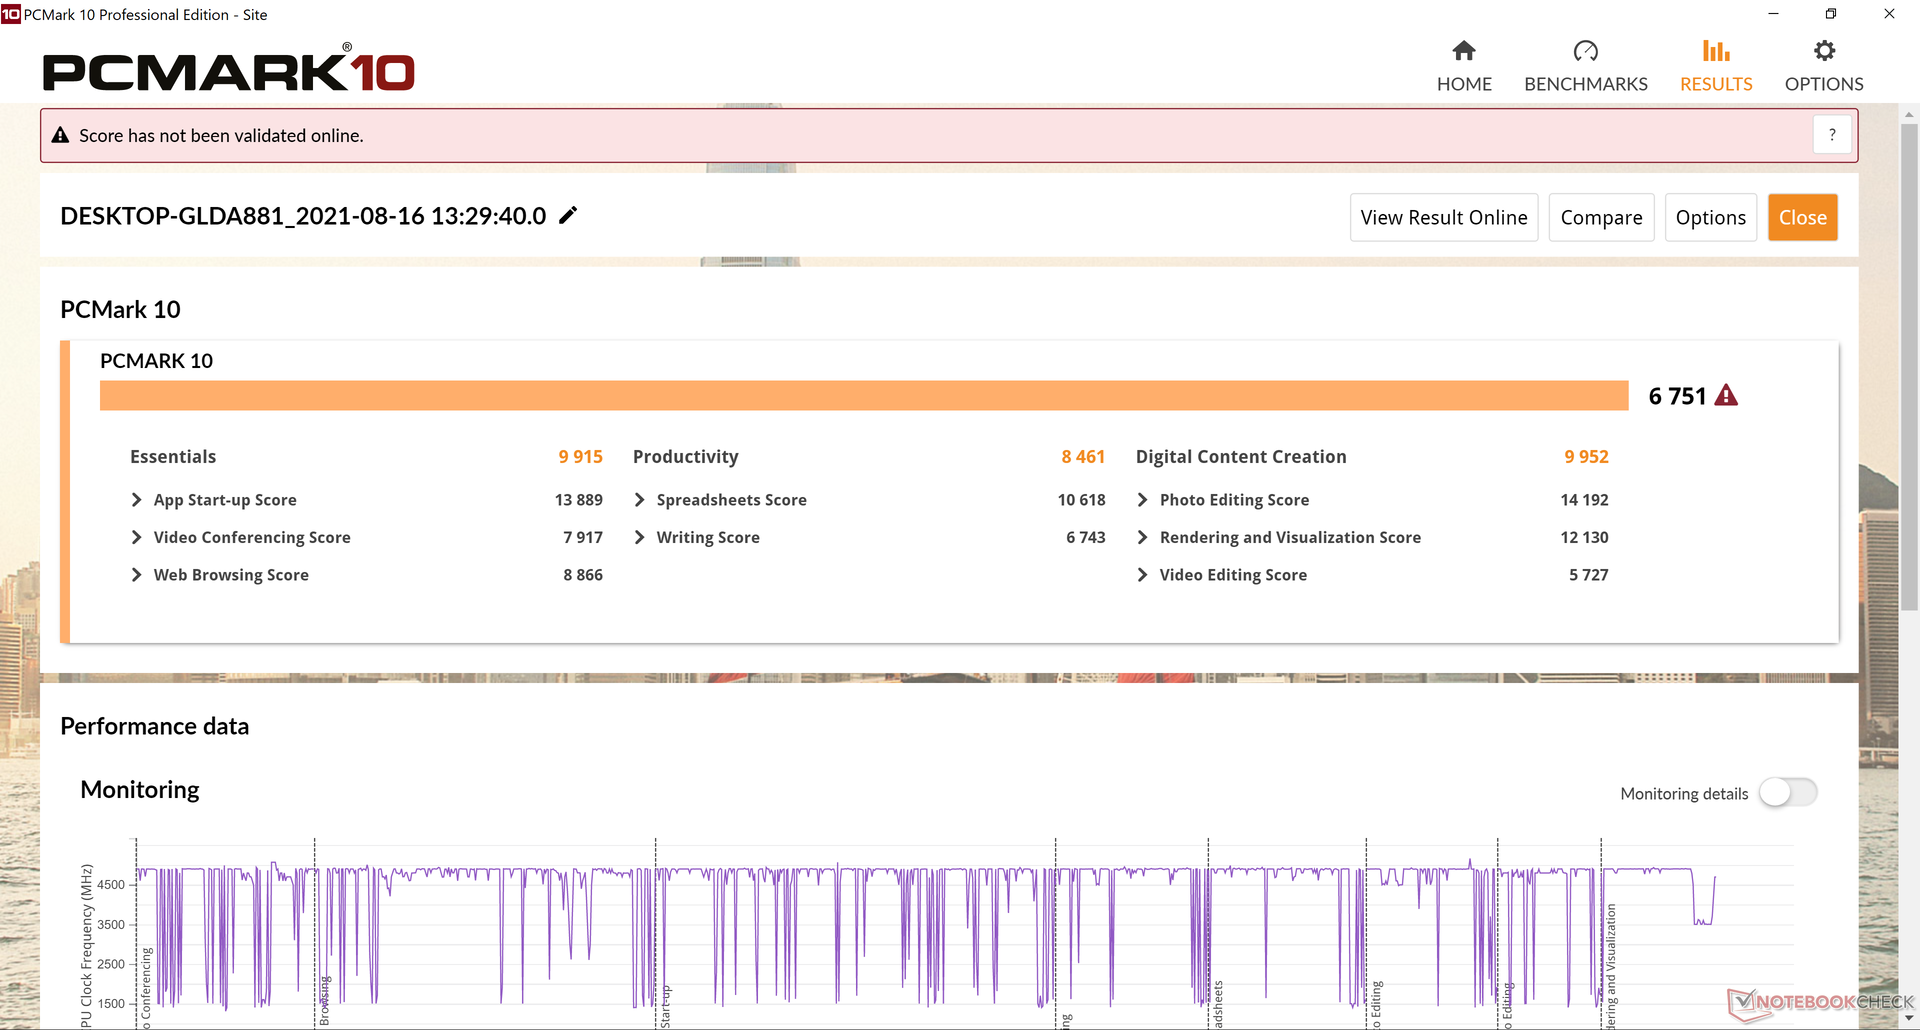
| PCMark 10 Score | 6751 points | |
Aide | ||
Latence DPC
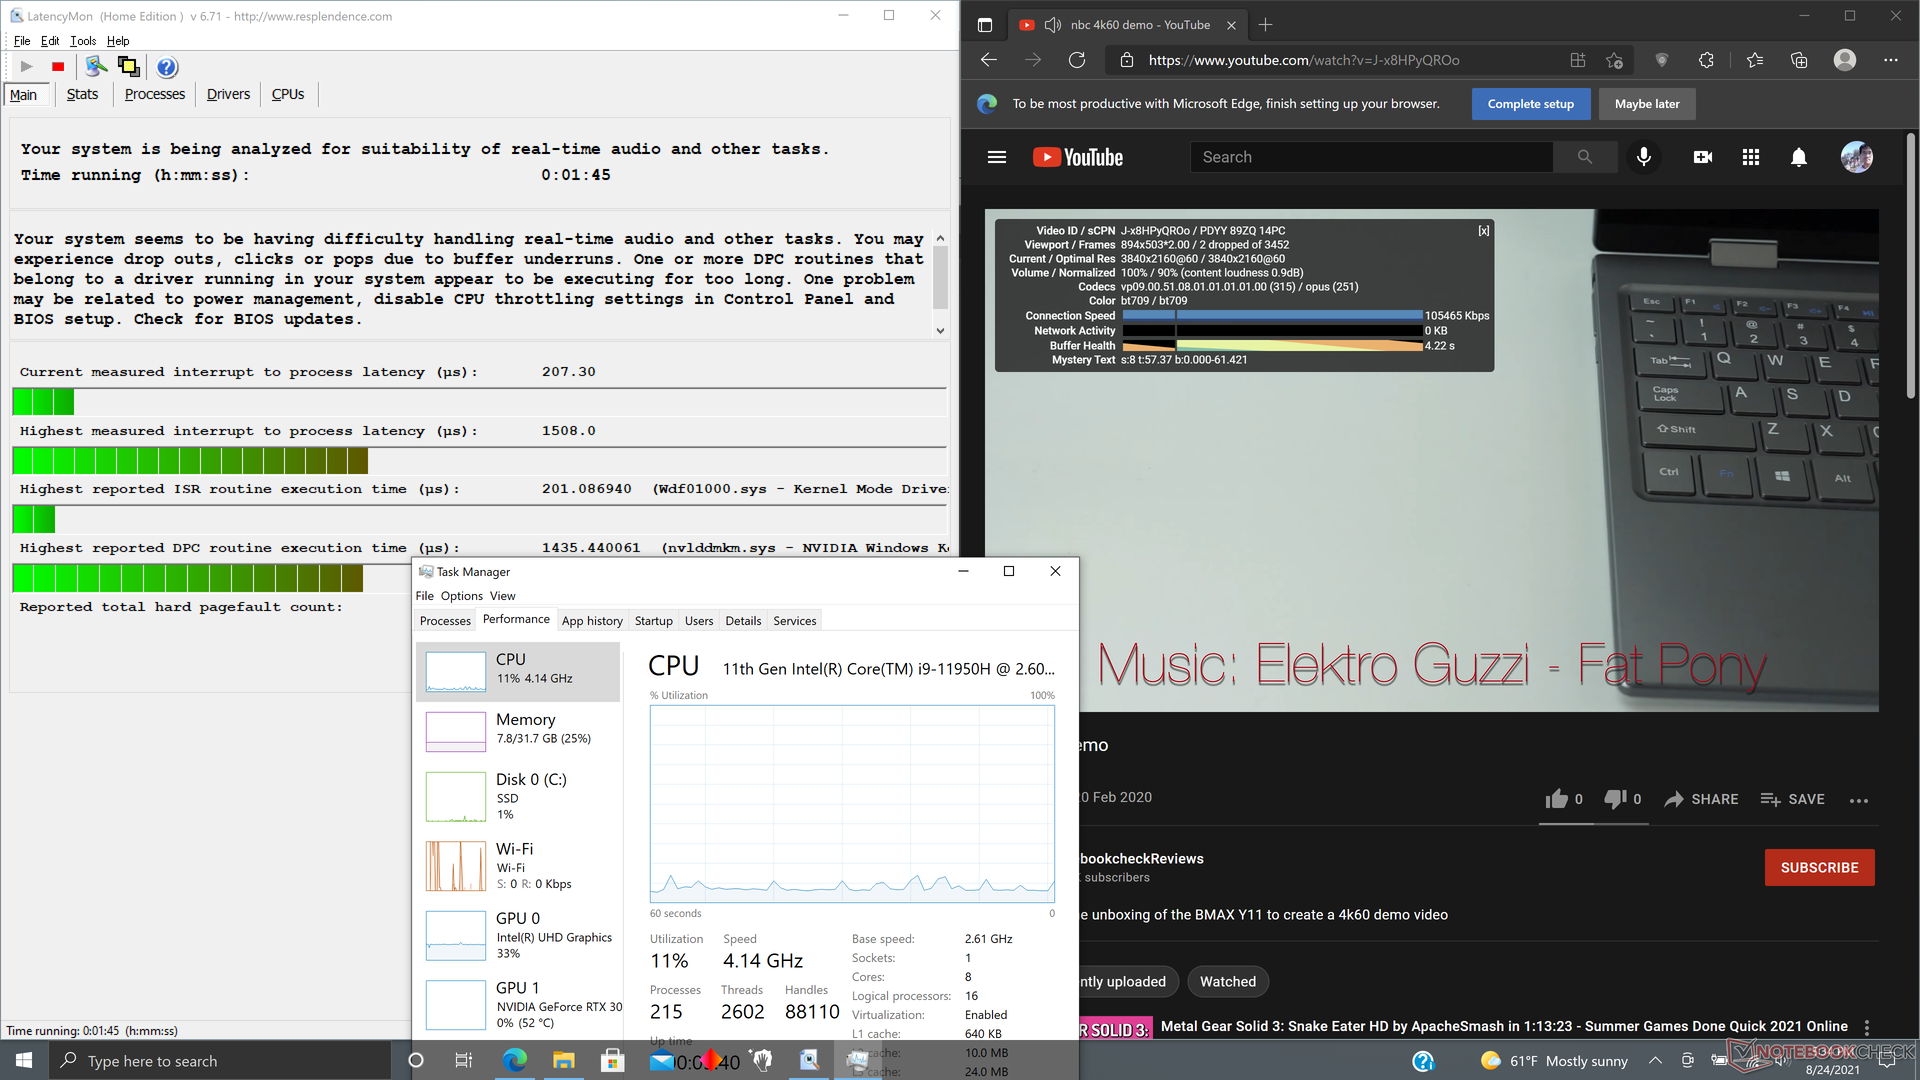
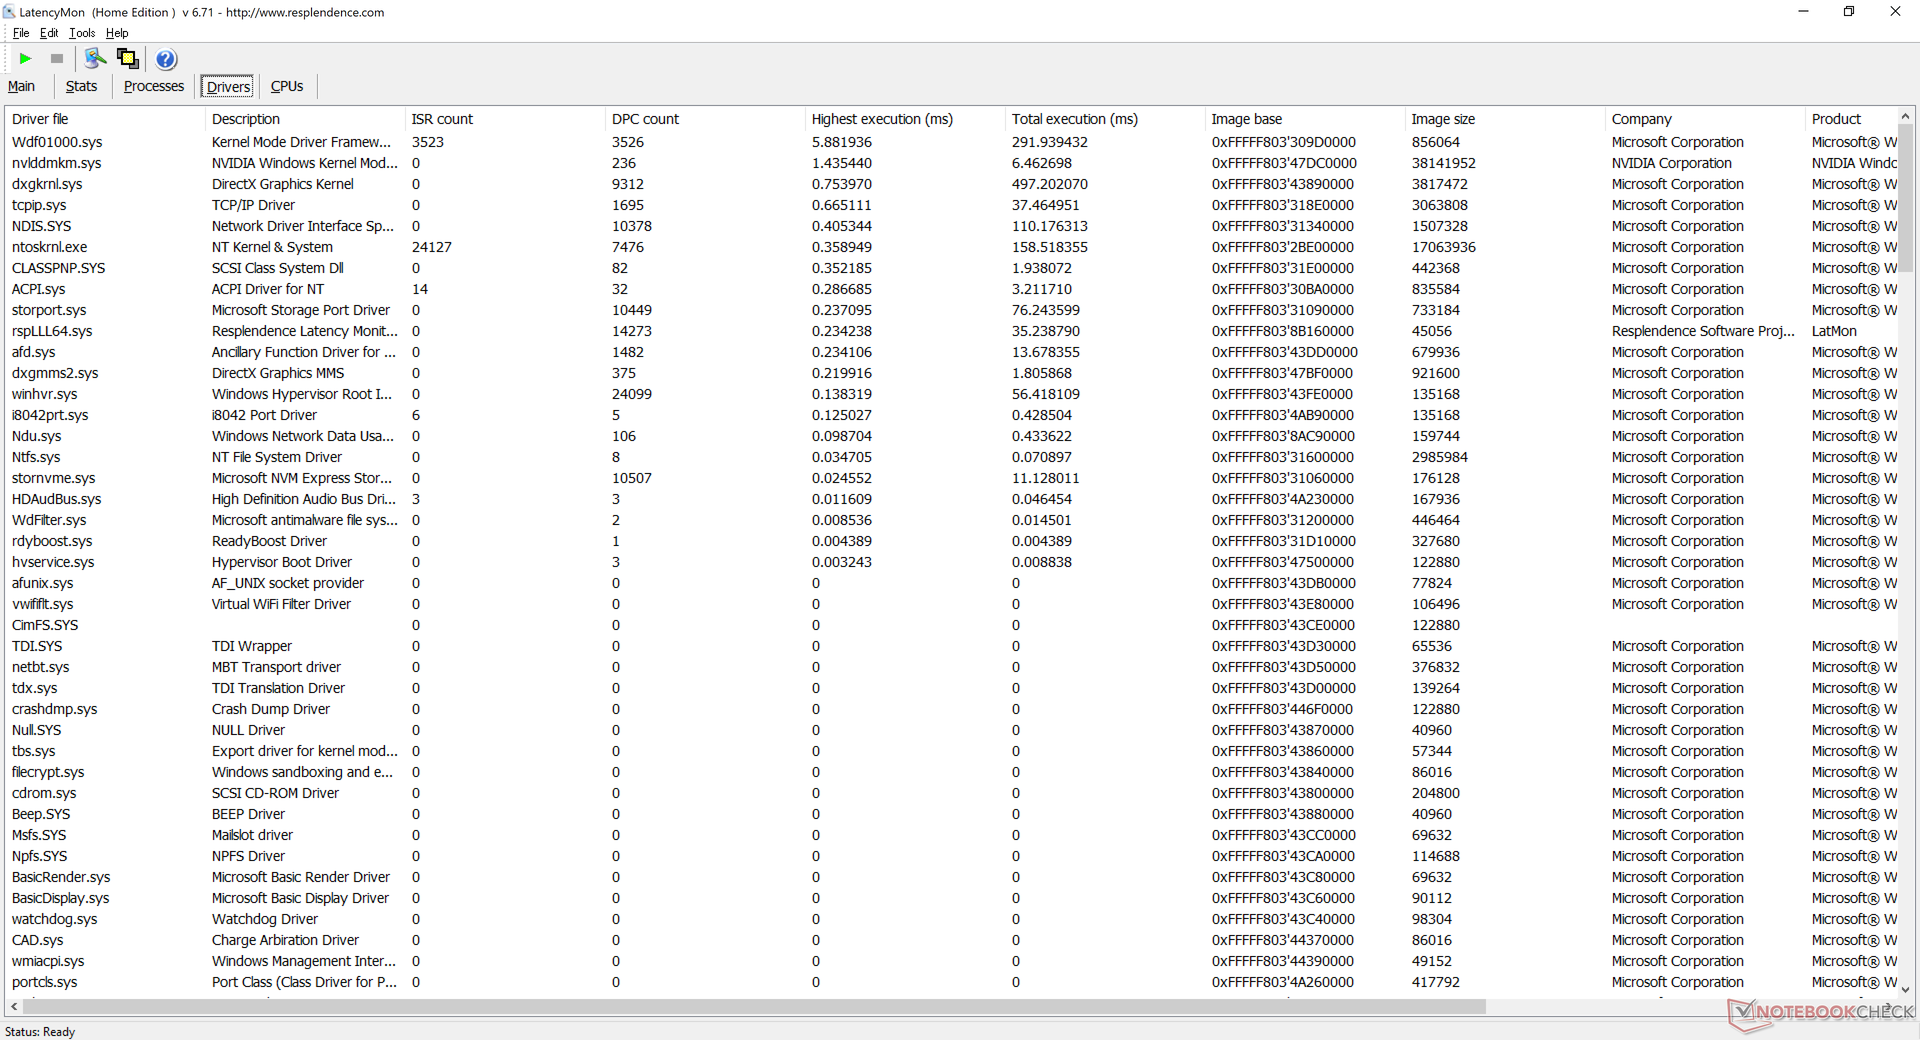
LatencyMon révèle des problèmes de latence lors de l'ouverture de plusieurs onglets de navigateur sur notre page d'accueil et également lors de l'exécution du stress Prime95. La lecture de vidéos 4K à 60 FPS est autrement fluide avec seulement 2 images perdues pendant notre vidéo de test d'une minute.

| DPC Latencies / LatencyMon - interrupt to process latency (max), Web, Youtube, Prime95 | |
| Dell Precision 7550 | |
| HP ZBook Studio G7 | |
| Lenovo ThinkPad P15s Gen2-20W6000GGE | |
| Asus ProArt StudioBook Pro 15 W500G5T | |
| HP ZBook Studio 15 G8 | |
| HP ZBook Firefly 15 G8 2C9R7EA | |
* ... Moindre est la valeur, meilleures sont les performances
Périphériques de stockage
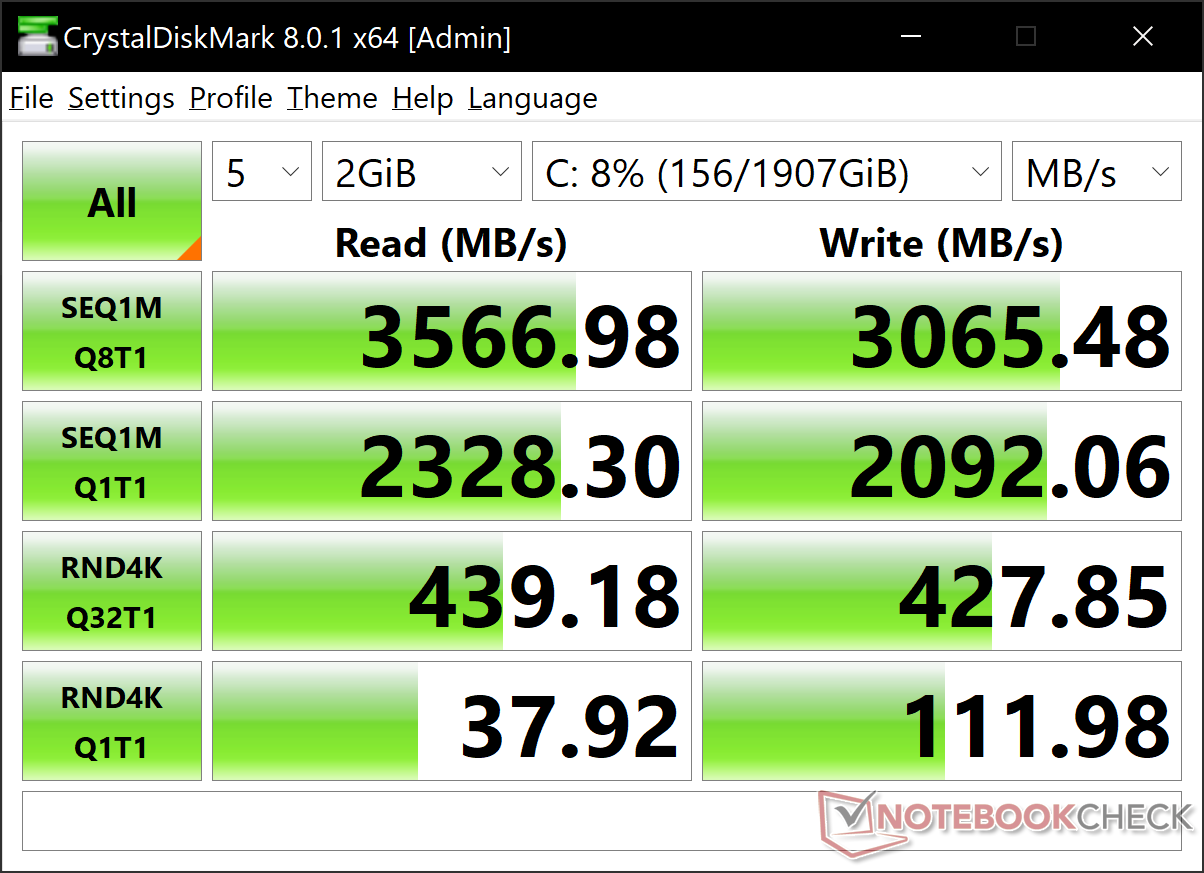
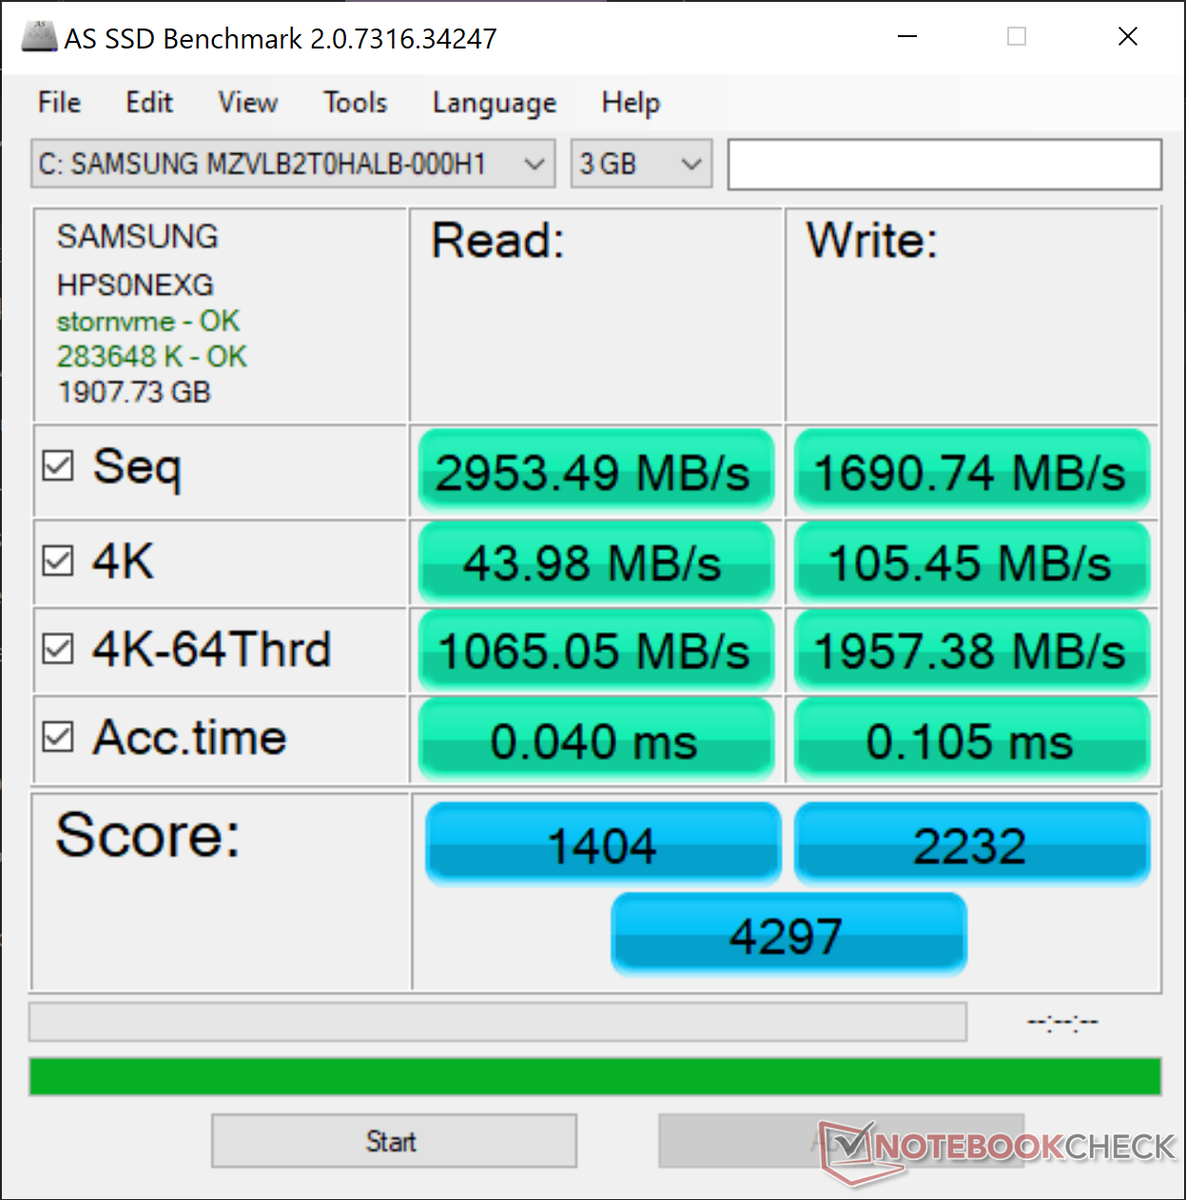
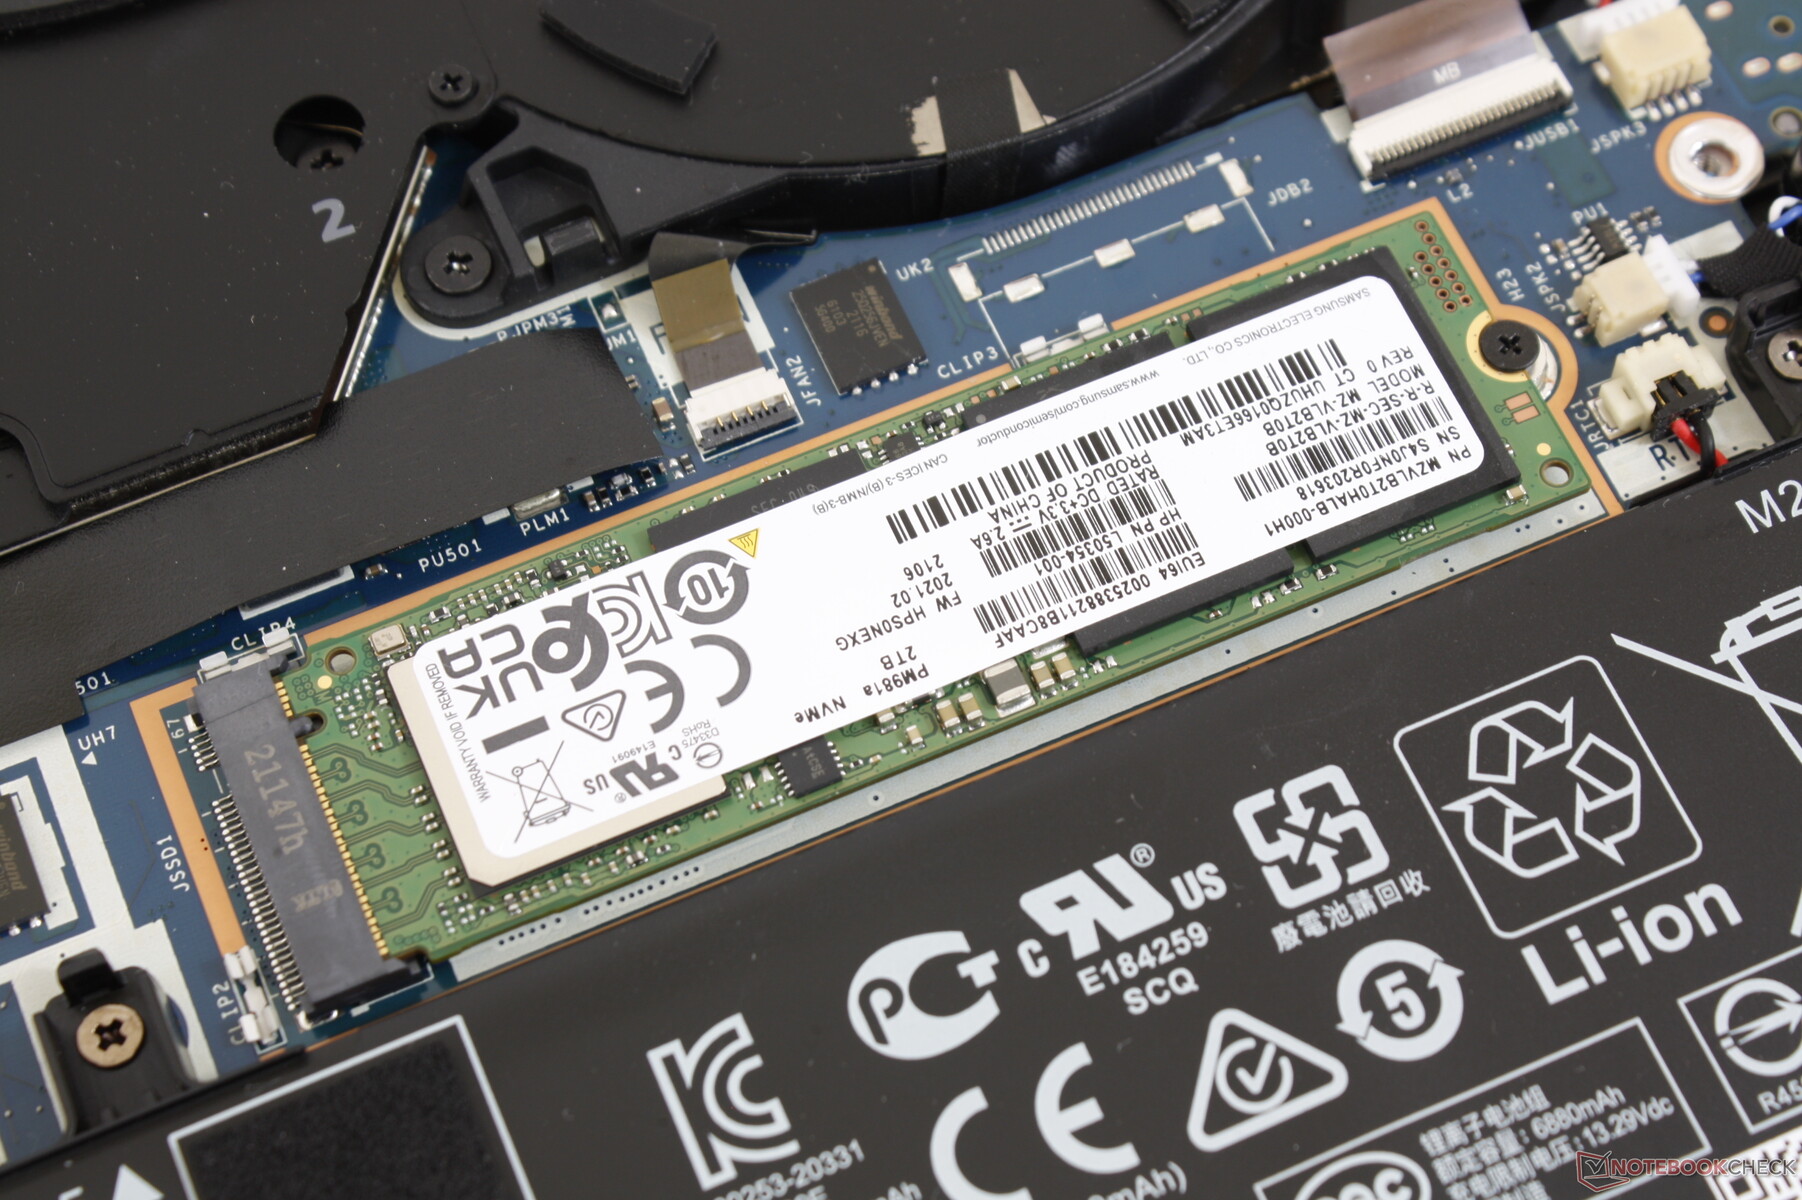
Il n'y a qu'un seul emplacement interne M.2 2280 PCIe 3 x4 sans option secondaire. Bien que nous puissions comprendre l'espace limité disponible, il aurait été génial de voir au moins une mise à niveau vers PCIe 4, surtout pour un système aussi cher. Notre unité de test spécifique est équipée du Samsung MZVLB2T0HALB pour des taux de lecture et d'écriture séquentiels rapides de 3500 Mo/s et 3000 Mo/s, respectivement. HP propose des disques SSD SED en option comme couche de sécurité supplémentaire.
| HP ZBook Studio 15 G8 Samsung PM981a MZVLB2T0HALB | HP ZBook Firefly 15 G8 2C9R7EA Toshiba XG6 KXG60ZNV1T02 | HP ZBook Studio G7 Micron 2300 1TB MTFDHBA1T0TDV | Dell Precision 7550 SK Hynix PC601A NVMe 1TB | Lenovo ThinkPad P15s Gen2-20W6000GGE WDC PC SN720 SDAQNTW-1T00 | Asus ProArt StudioBook Pro 15 W500G5T Samsung SSD PM981 MZVLB1T0HALR | |
|---|---|---|---|---|---|---|
| AS SSD | -1% | -16% | -20% | 11% | 4% | |
| Seq Read (MB/s) | 2953 | 2599 -12% | 2548 -14% | 2028 -31% | 2796 -5% | 2702 -8% |
| Seq Write (MB/s) | 1691 | 1305 -23% | 1312 -22% | 1193 -29% | 2525 49% | 2348 39% |
| 4K Read (MB/s) | 43.98 | 49.65 13% | 45.38 3% | 42.31 -4% | 50.9 16% | 37.59 -15% |
| 4K Write (MB/s) | 105.4 | 128.1 22% | 83 -21% | 105.5 0% | 211.9 101% | 107.1 2% |
| 4K-64 Read (MB/s) | 1065 | 1157 9% | 935 -12% | 1128 6% | 1505 41% | 1491 40% |
| 4K-64 Write (MB/s) | 1957 | 1475 -25% | 2314 18% | 1537 -21% | 949 -52% | 1794 -8% |
| Access Time Read * (ms) | 0.04 | 0.057 -43% | 0.057 -43% | 0.069 -73% | 0.081 -103% | 0.046 -15% |
| Access Time Write * (ms) | 0.105 | 0.03 71% | 0.098 7% | 0.106 -1% | 0.019 82% | 0.034 68% |
| Score Read (Points) | 1404 | 1467 4% | 1235 -12% | 1373 -2% | 1835 31% | 1798 28% |
| Score Write (Points) | 2232 | 1734 -22% | 2528 13% | 1762 -21% | 1413 -37% | 2136 -4% |
| Score Total (Points) | 4297 | 3894 -9% | 4342 1% | 3801 -12% | 4177 -3% | 4835 13% |
| Copy ISO MB/s (MB/s) | 2474 | 3142 27% | 1768 -29% | 2302 -7% | ||
| Copy Program MB/s (MB/s) | 1074 | 126.1 -88% | 627 -42% | 564 -47% | ||
| Copy Game MB/s (MB/s) | 1929 | 477.4 -75% | 1477 -23% | 1336 -31% | ||
| CrystalDiskMark 5.2 / 6 | 1% | -9% | -8% | 22% | 106% | |
| Write 4K (MB/s) | 110.5 | 140.6 27% | 95.5 -14% | 121 10% | 237.6 115% | 1107 902% |
| Read 4K (MB/s) | 51.8 | 52.8 2% | 48.99 -5% | 42.16 -19% | 54.7 6% | 43.38 -16% |
| Write Seq (MB/s) | 2071 | 1844 -11% | 2001 -3% | 2150 4% | 2603 26% | 2387 15% |
| Read Seq (MB/s) | 2505 | 2108 -16% | 1600 -36% | 1755 -30% | 1889 -25% | 2431 -3% |
| Write 4K Q32T1 (MB/s) | 429.8 | 418 -3% | 410.2 -5% | 395.3 -8% | 505 17% | 340.7 -21% |
| Read 4K Q32T1 (MB/s) | 418.3 | 476.8 14% | 394.7 -6% | 381.8 -9% | 606 45% | 397.8 -5% |
| Write Seq Q32T1 (MB/s) | 3060 | 3064 0% | 3148 3% | 2730 -11% | 2795 -9% | 2390 -22% |
| Read Seq Q32T1 (MB/s) | 3539 | 3289 -7% | 3227 -9% | 3468 -2% | 3448 -3% | 3502 -1% |
| Moyenne finale (programmes/paramètres) | 0% /
-0% | -13% /
-13% | -14% /
-16% | 17% /
15% | 55% /
41% |
* ... Moindre est la valeur, meilleures sont les performances

Disk Throttling: DiskSpd Read Loop, Queue Depth 8
Performances du GPU - TGP de 85 W
Les performances graphiques sont de 10 à 15 % inférieures à celles de la moyenne des ordinateurs RTX 3070 dans notre base de données. L'écart est suffisamment important pour que même certains anciens modèles RTX 2070 ou RTX 3060 comme leSchenker XMG Core 15 peuvent parfois surpasser notre système RTX 3070 plus onéreux. Ce n'est pas un ordinateur portable lent, loin de là, mais il aurait certainement pu être plus rapide si l'on en croit notre expérience avec des dizaines d'autres systèmes équipés du même GPU RTX 3070
Les utilisateurs peuvent remplacer le GPU de GeForce par le Quadro RTX A3000 ou A4000 pour optimiser les charges de travail de CAO, de CGI et d'autres stations de travail spécifiques.
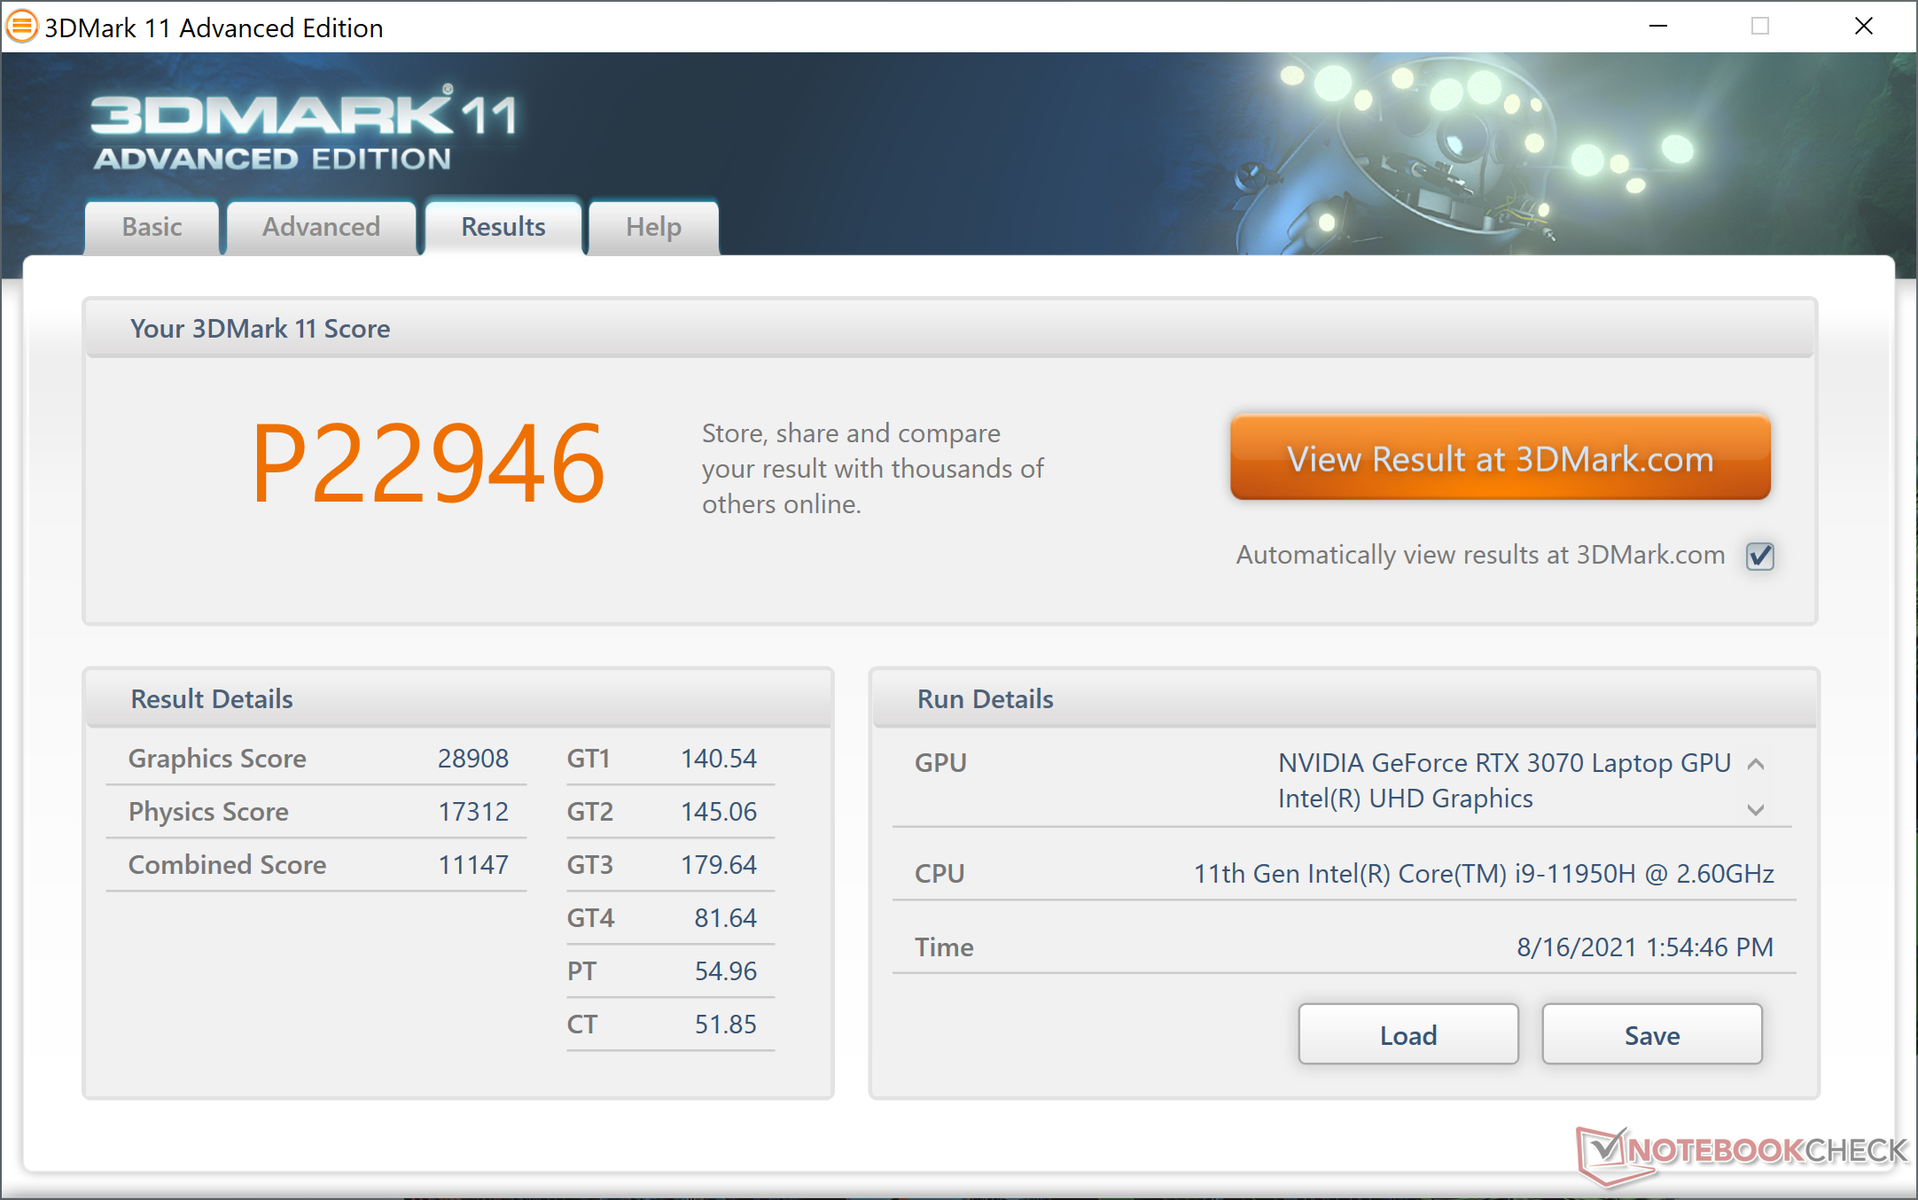
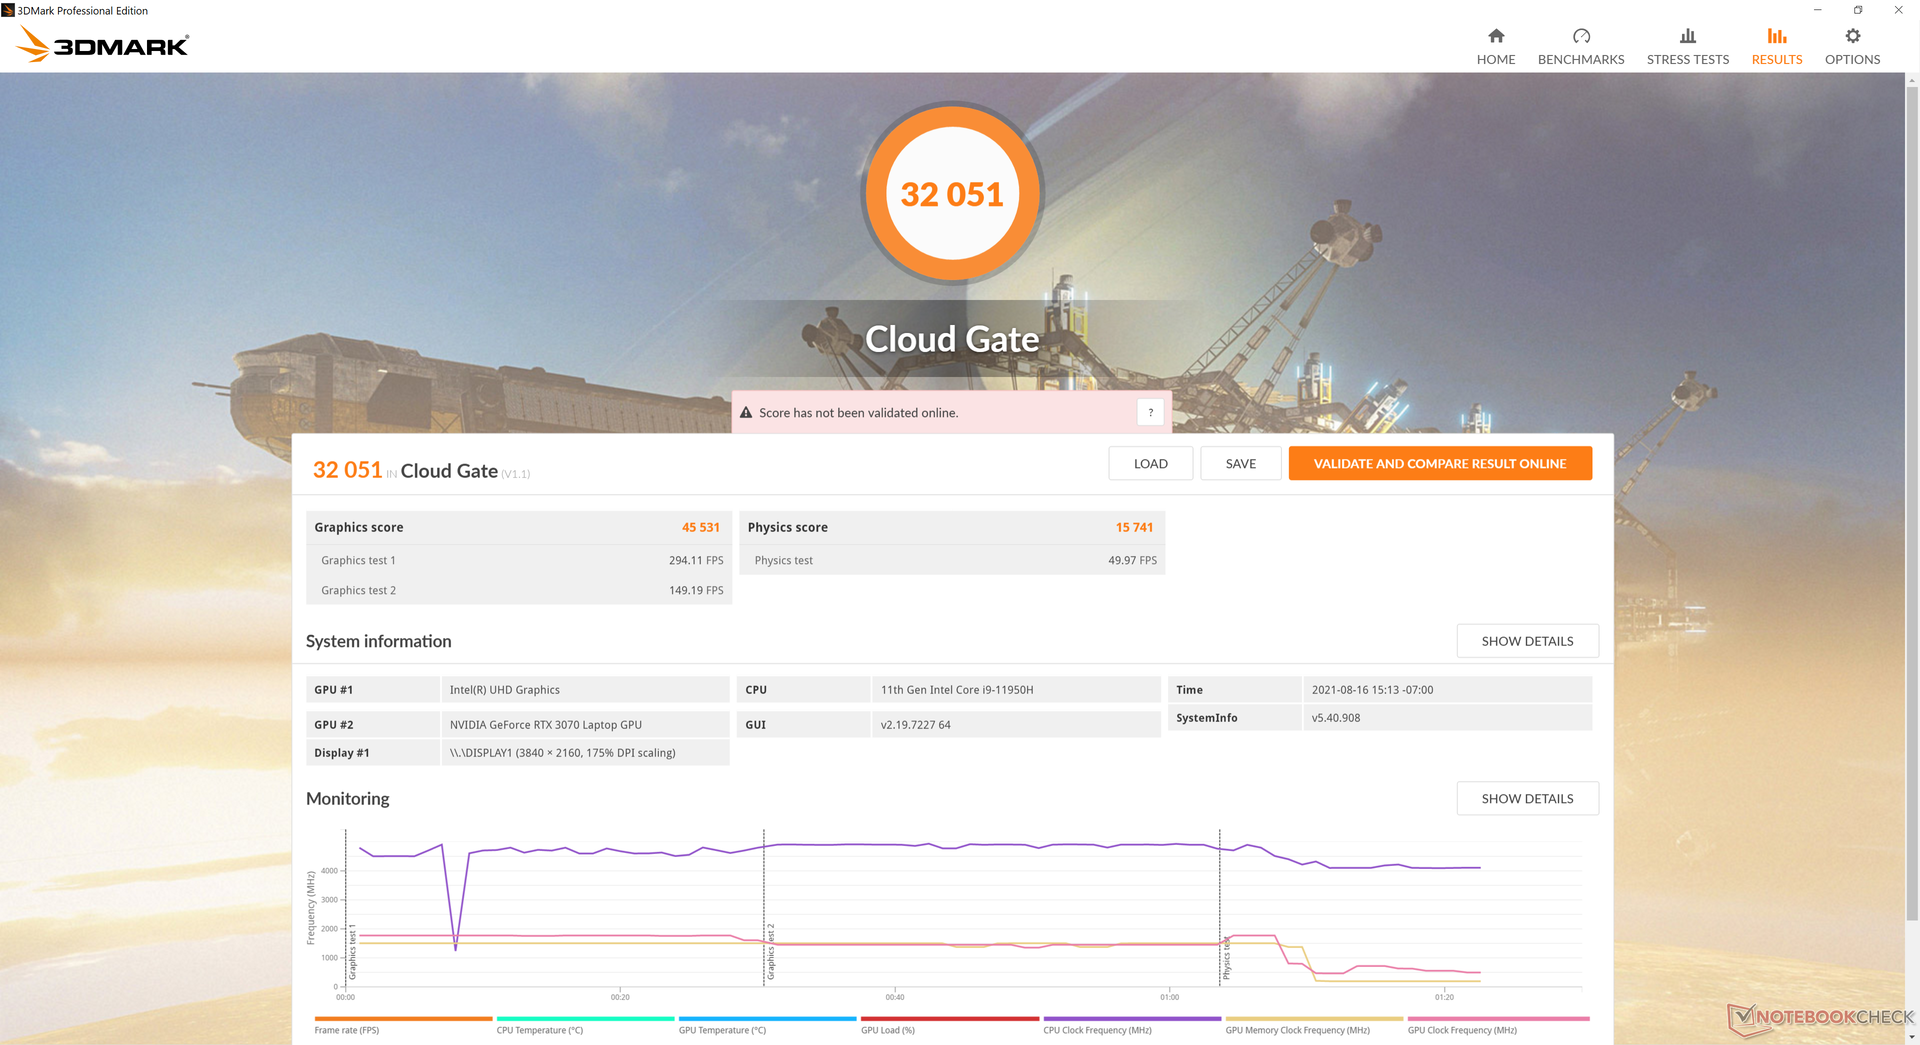
| 3DMark 11 Performance | 22946 points | |
| 3DMark Cloud Gate Standard Score | 32051 points | |
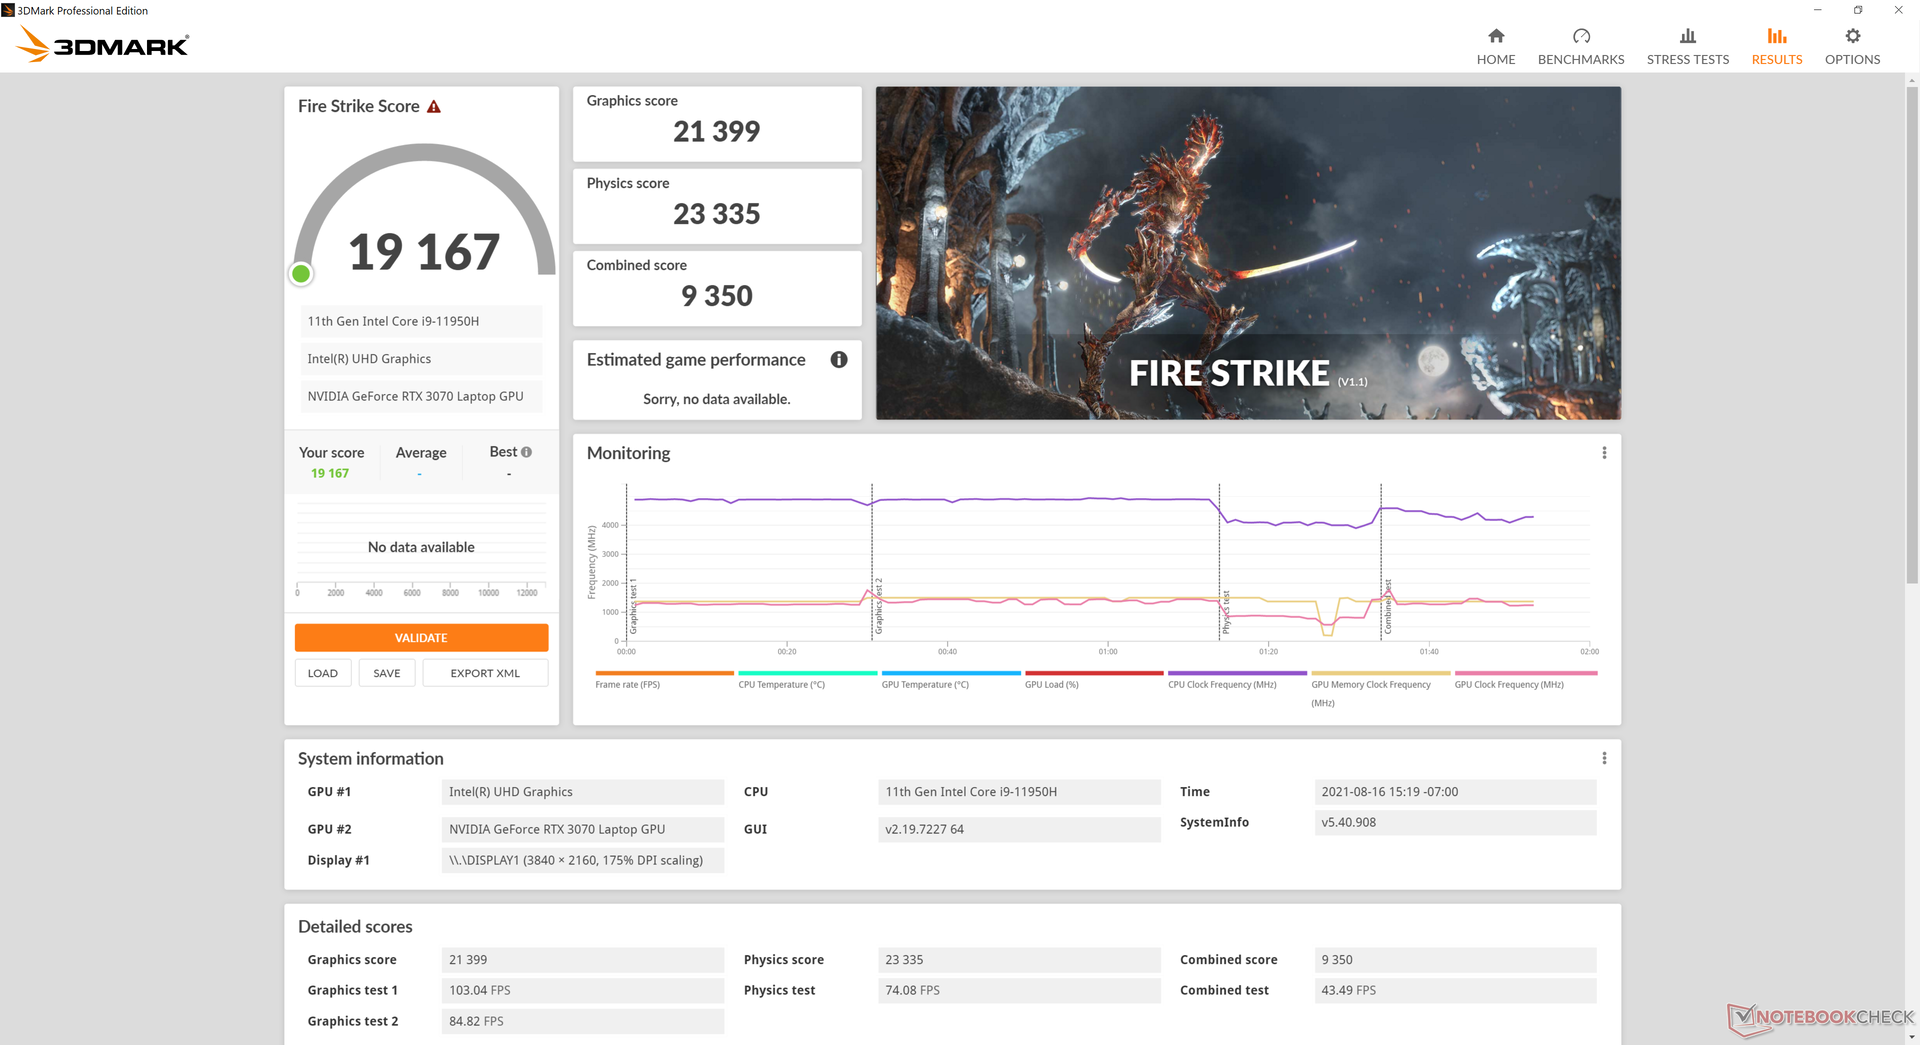
| 3DMark Fire Strike Score | 19167 points | |
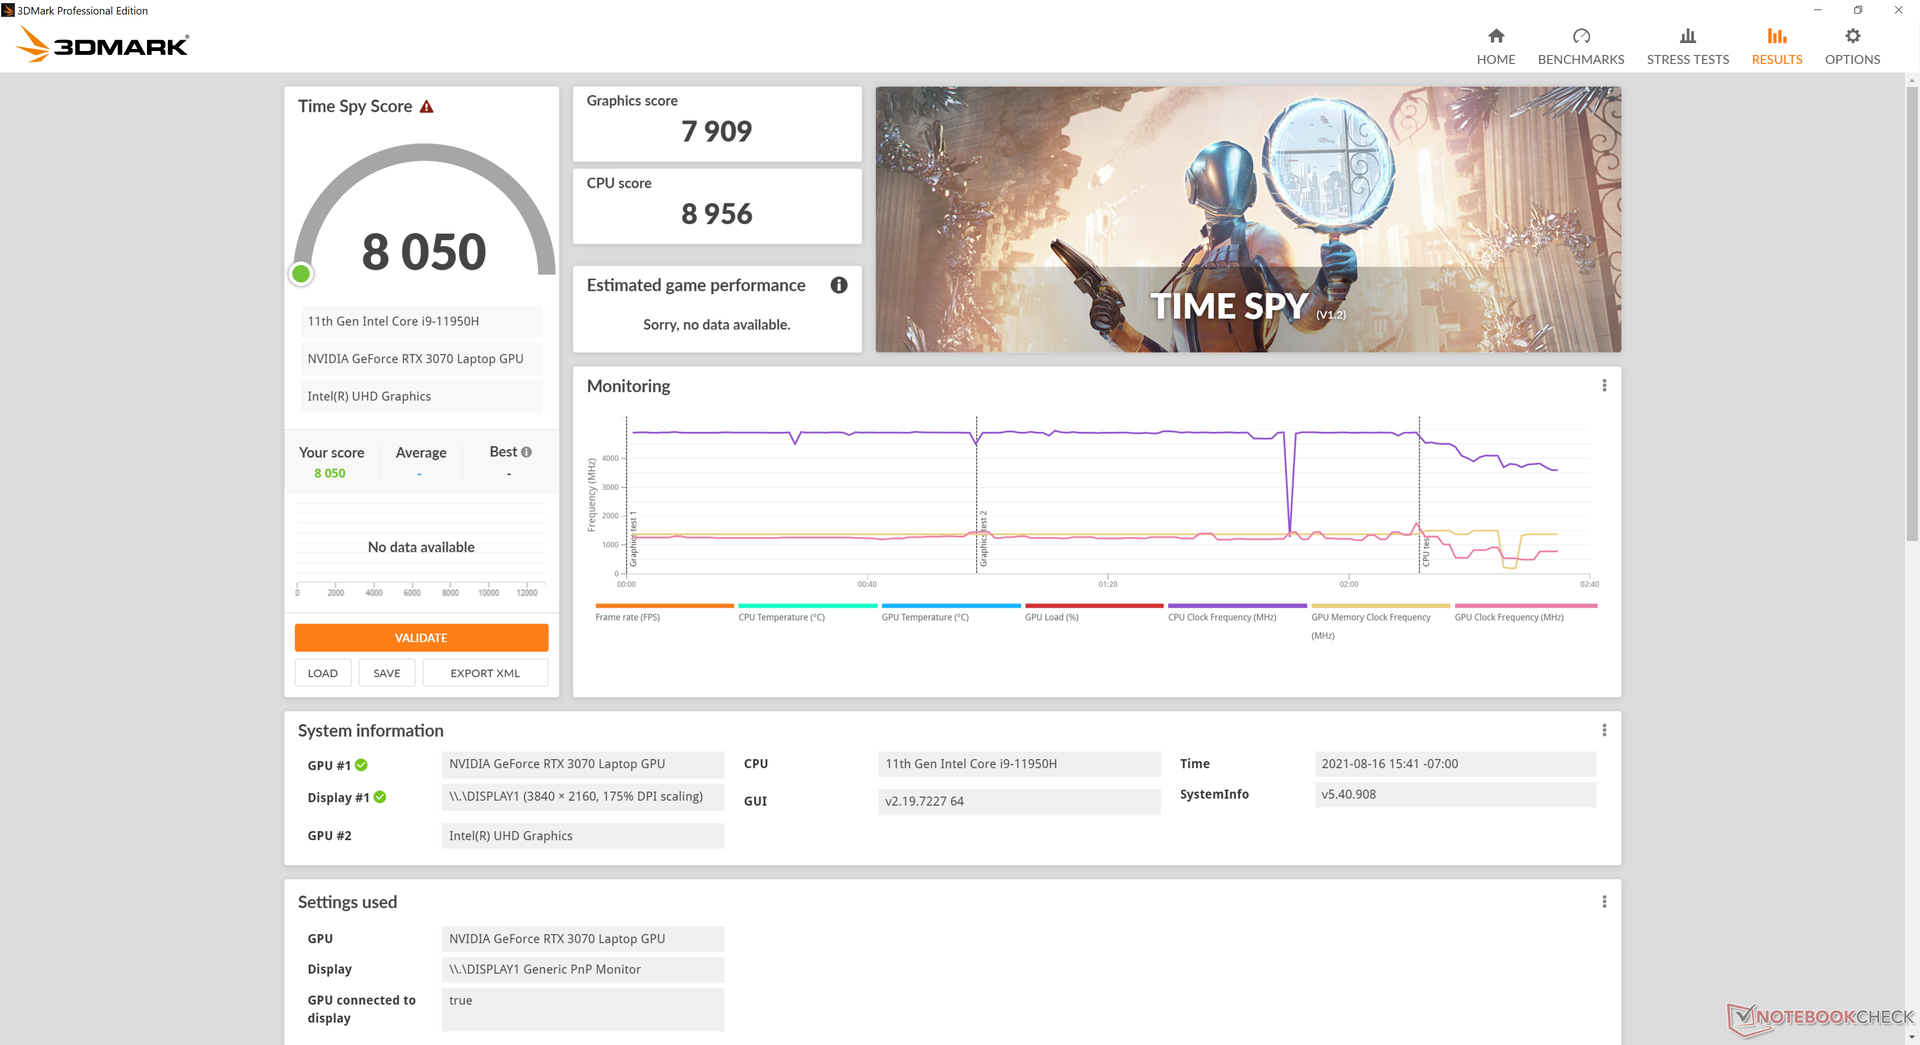
| 3DMark Time Spy Score | 8050 points | |
Aide | ||
Witcher 3 FPS Chart
| Bas | Moyen | Élevé | Ultra | QHD | 4K | |
|---|---|---|---|---|---|---|
| The Witcher 3 (2015) | 365.9 | 252.2 | 154.2 | 81.5 | 40.3 | |
| Dota 2 Reborn (2015) | 162.5 | 144.1 | 135.8 | 116.3 | 93.1 | |
| Final Fantasy XV Benchmark (2018) | 144 | 104 | 78.5 | 61.3 | 36.2 | |
| X-Plane 11.11 (2018) | 120 | 104 | 83.5 | 54.4 | ||
| Far Cry 5 (2018) | 125 | 100 | 93 | 89 | 81 | 44 |
Emissions
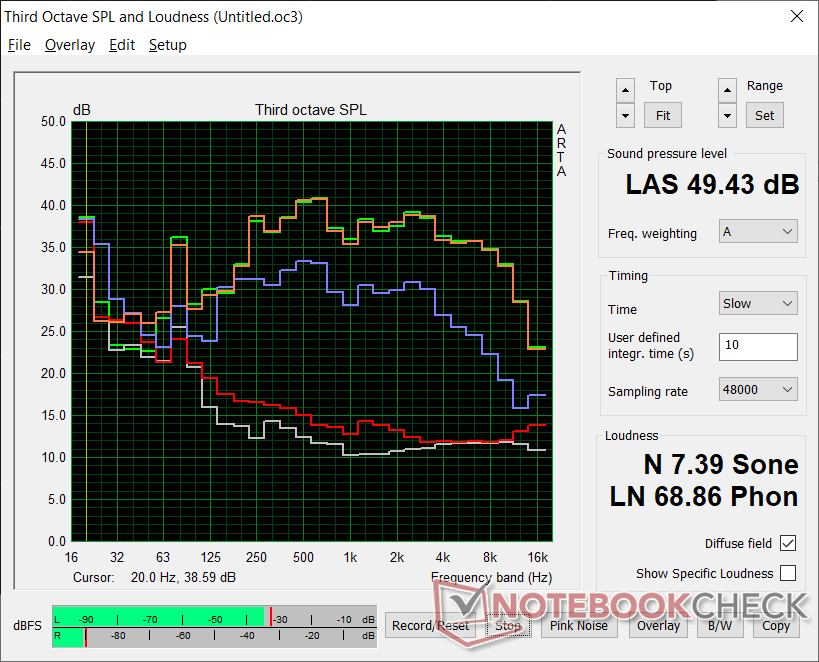
Bruit du système - pas plus silencieux
Entasser des processeurs hautes performances dans un châssis mince conduit inévitablement à des ventilateurs bruyants. Avec presque 50 dB(A) lors de l'exécution de jeux ou d'autres charges élevées, le ZBook G8 peut être plus bruyant que la concurrence, y compris le Razer Blade 15 Studio et le ZBook Studio G7 de l'année dernière. Les ventilateurs ne sont jamais vraiment à l'arrêt, ce qui signifie qu'il y aura toujours un peu de bruit, même lorsque l'ordinateur est au ralenti et qu'aucune application n'est en cours d'exécution. Attendez-vous à un bruit de ventilateur tolérable de 29,3 dB(A) contre un bruit de fond de 23,5 dB(A) pendant des charges peu exigeantes comme le traitement de texte, le streaming vidéo ou la navigation.
| HP ZBook Studio 15 G8 GeForce RTX 3070 Laptop GPU, i9-11950H, Samsung PM981a MZVLB2T0HALB | HP ZBook Firefly 15 G8 2C9R7EA T500 Laptop GPU, i7-1165G7, Toshiba XG6 KXG60ZNV1T02 | HP ZBook Studio G7 Quadro RTX 3000 Max-Q, i9-10885H, Micron 2300 1TB MTFDHBA1T0TDV | Dell Precision 7550 Quadro RTX 5000 Max-Q, W-10885M, SK Hynix PC601A NVMe 1TB | Lenovo ThinkPad P15s Gen2-20W6000GGE T500 Laptop GPU, i7-1165G7, WDC PC SN720 SDAQNTW-1T00 | Asus ProArt StudioBook Pro 15 W500G5T Quadro RTX 5000 Max-Q, i7-9750H, Samsung SSD PM981 MZVLB1T0HALR | |
|---|---|---|---|---|---|---|
| Noise | 11% | 2% | -7% | 6% | -8% | |
| arrêt / environnement * (dB) | 23.5 | 24.1 -3% | 24.4 -4% | 25.8 -10% | 24.3 -3% | 25.2 -7% |
| Idle Minimum * (dB) | 25.3 | 24.1 5% | 24.4 4% | 25.8 -2% | 25.5 -1% | 27.9 -10% |
| Idle Average * (dB) | 25.3 | 24.1 5% | 24.4 4% | 25.8 -2% | 25.5 -1% | 27.9 -10% |
| Idle Maximum * (dB) | 25.3 | 27.1 -7% | 27.9 -10% | 25.9 -2% | 25.5 -1% | 27.9 -10% |
| Load Average * (dB) | 41.2 | 32.8 20% | 38.8 6% | 51.2 -24% | 35.65 13% | 47 -14% |
| Witcher 3 ultra * (dB) | 49.4 | 36.1 27% | 46.3 6% | 51.9 -5% | ||
| Load Maximum * (dB) | 49.4 | 36.1 27% | 46.3 6% | 51.9 -5% | 35.65 28% | 46.9 5% |
* ... Moindre est la valeur, meilleures sont les performances
Degré de la nuisance sonore
| Au repos |
| 25.3 / 25.3 / 25.3 dB(A) |
| Fortement sollicité |
| 41.2 / 49.4 dB(A) |
 | ||
30 dB silencieux 40 dB(A) audible 50 dB(A) bruyant |
||
min: | ||
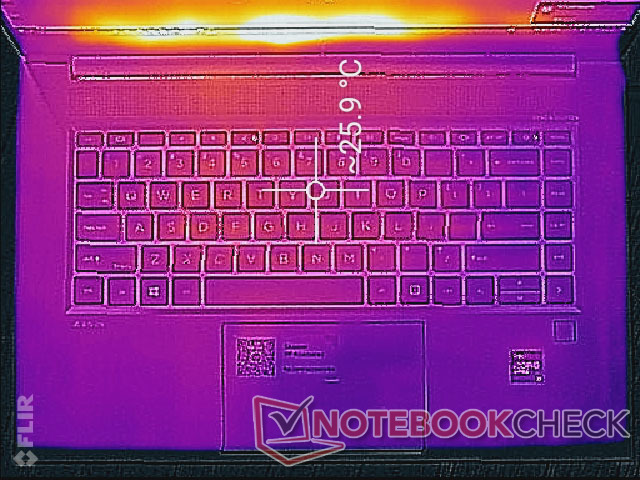
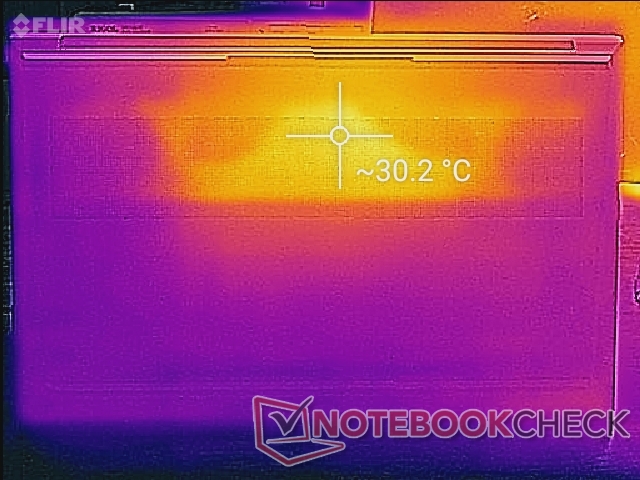
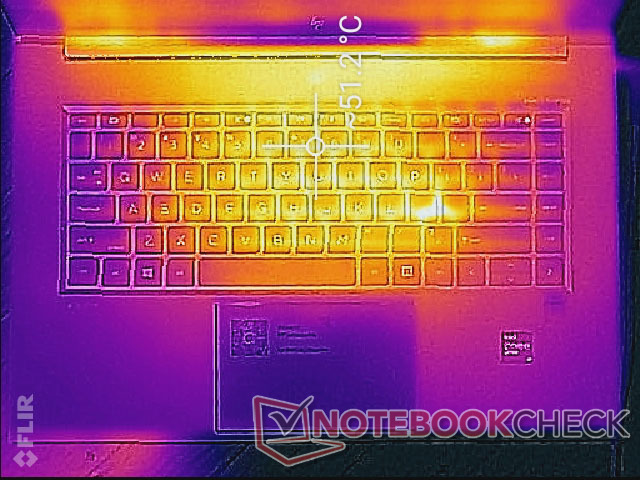
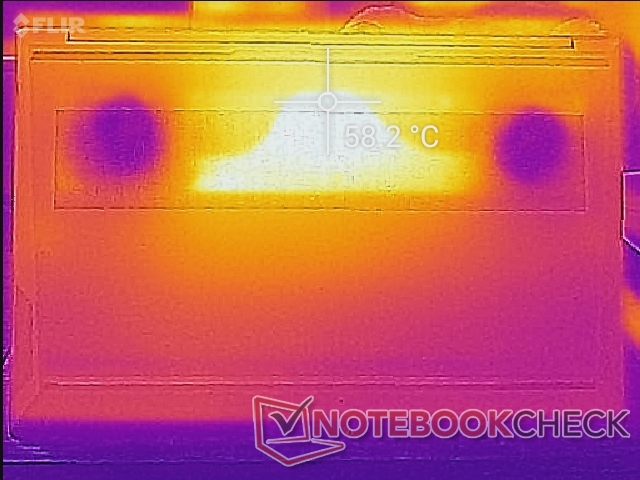
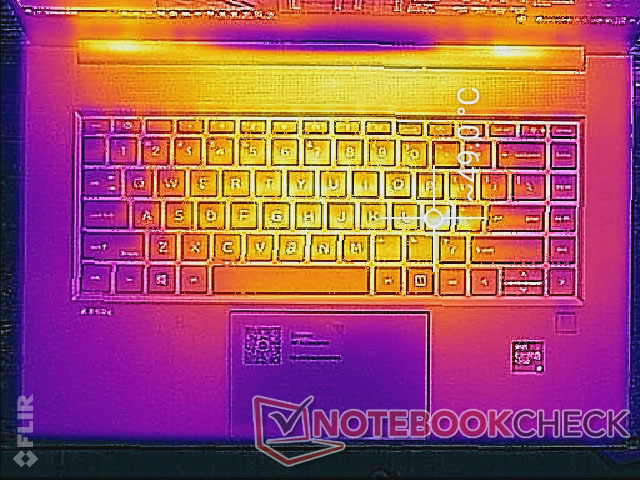
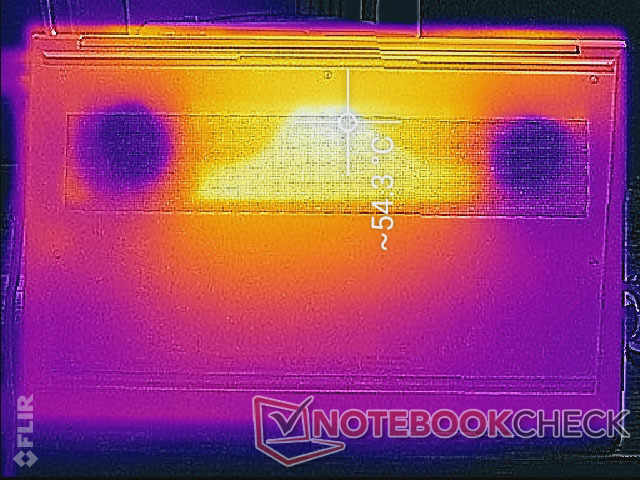
Température - Repose-poignets chauds
Les températures de surface sont symétriques grâce à la solution de refroidissement symétrique intégrée. Le point chaud se trouve près du centre du clavier, où la température peut atteindre plus de 51 °C en cas de charge élevée, contre 49 °C sur le modèle de la Surface Dell Precision 7550. Les repose-poignets peuvent également devenir assez chauds à environ 38 C en raison de la conception dense de la base métallique. Les températures plus chaudes ne sont pas inconfortables pour les mains, mais elles sont certainement perceptibles.
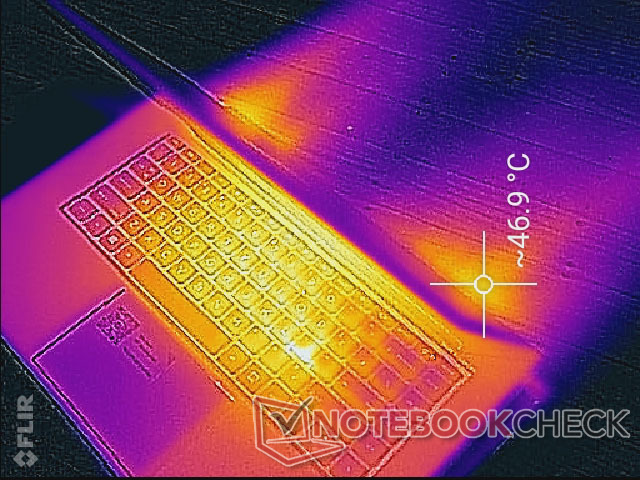
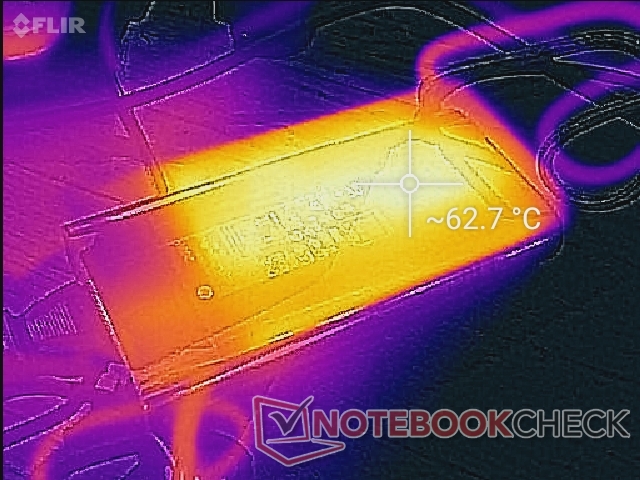
(-) La température maximale du côté supérieur est de 49 °C / 120 F, par rapport à la moyenne de 38.2 °C / 101 F, allant de 22.2 à 69.8 °C pour la classe Workstation.
(-) Le fond chauffe jusqu'à un maximum de 54.2 °C / 130 F, contre une moyenne de 41.1 °C / 106 F
(+) En utilisation inactive, la température moyenne du côté supérieur est de 25.4 °C / 78 F, par rapport à la moyenne du dispositif de 32 °C / 90 F.
(-) En jouant à The Witcher 3, la température moyenne du côté supérieur est de 43.2 °C / 110 F, alors que la moyenne de l'appareil est de 32 °C / 90 F.
(±) Les repose-poignets et le pavé tactile peuvent devenir très chauds au toucher, avec un maximum de 38.4 °C / 101.1# F.
(-) La température moyenne de la zone de l'appui-paume de dispositifs similaires était de 27.8 °C / 82 F (-10.6 °C / #-19.1 F).
Test de stress
Sous l'effet du test Prime95, le processeur monte à 4 GHz pendant seulement une ou deux secondes avant d'atteindre une température de 97°C. Les fréquences d'horloge se stabilisent ensuite entre 2,8 et 3,3 GHz afin d'empêcher la température du cœur de monter encore plus haut. En effectuant ce même test sur le ZBook Fury 15 G7, on obtient des résultats similaires
Le CPU et le GPU se stabiliseraient à 77 C et 70 C, respectivement, lorsqu'ils fonctionnent Witcher 3 ce qui est à peine plus froid que ce que nous avons observé sur le modèle Dell Precision 5750 ou ZBook Fury 15 G7
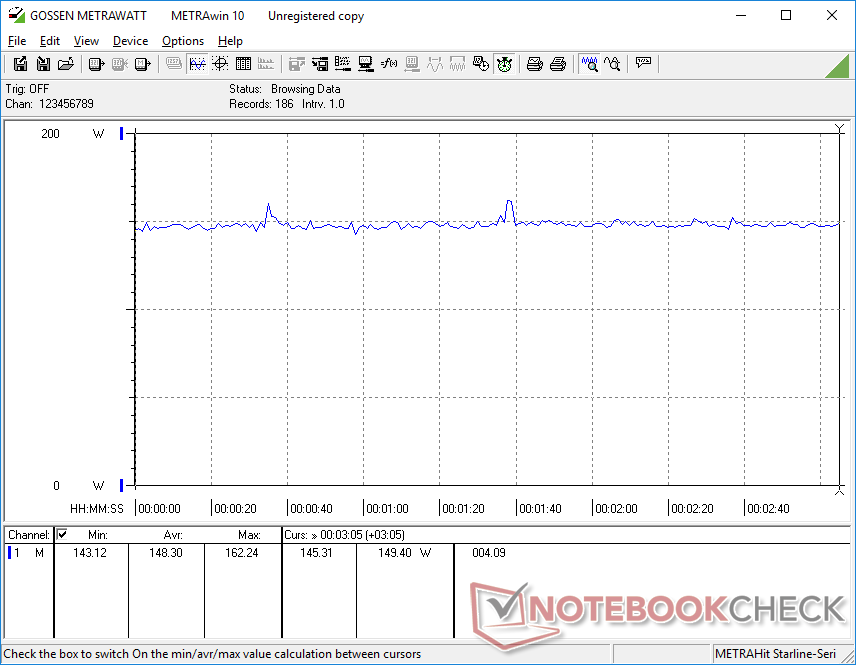
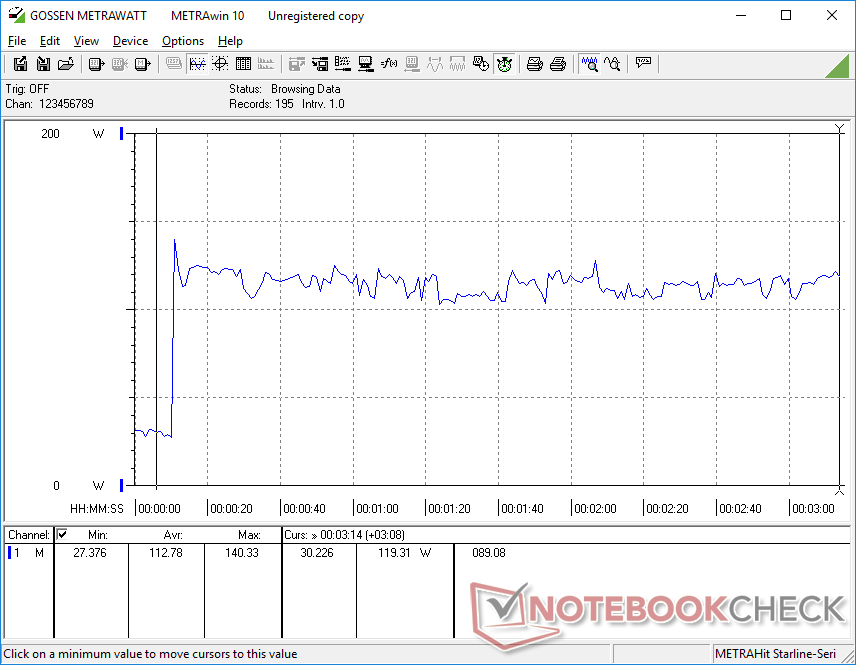
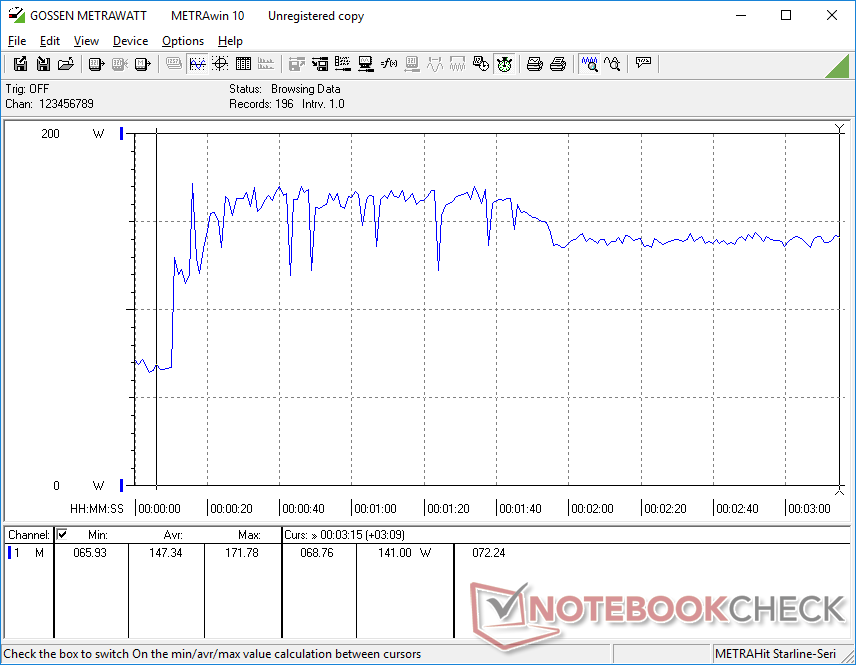
Le fonctionnement sur batterie limitera sévèrement les performances. Un test 3DMark 11 sur batterie donnerait des scores de physique et de graphique de 10388 et 9950, respectivement, contre 17312 et 28908 points sur secteur.
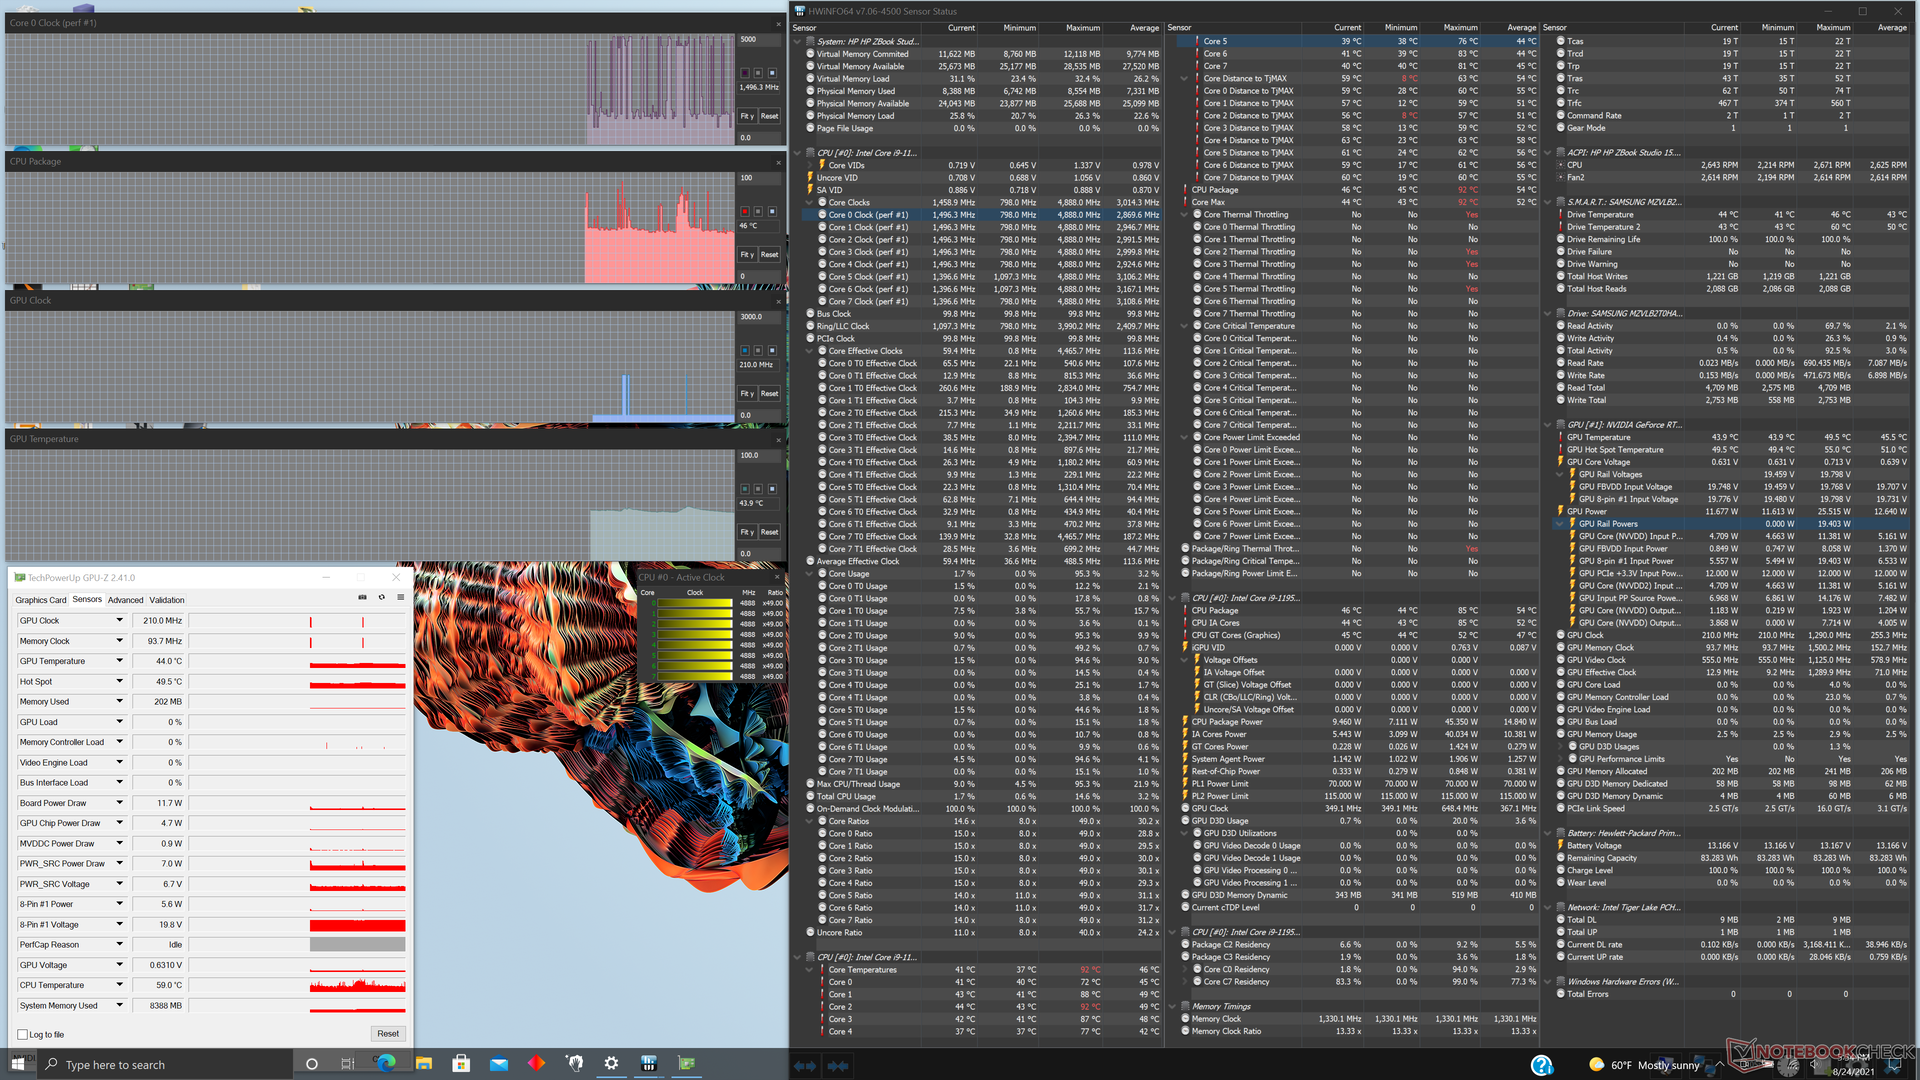
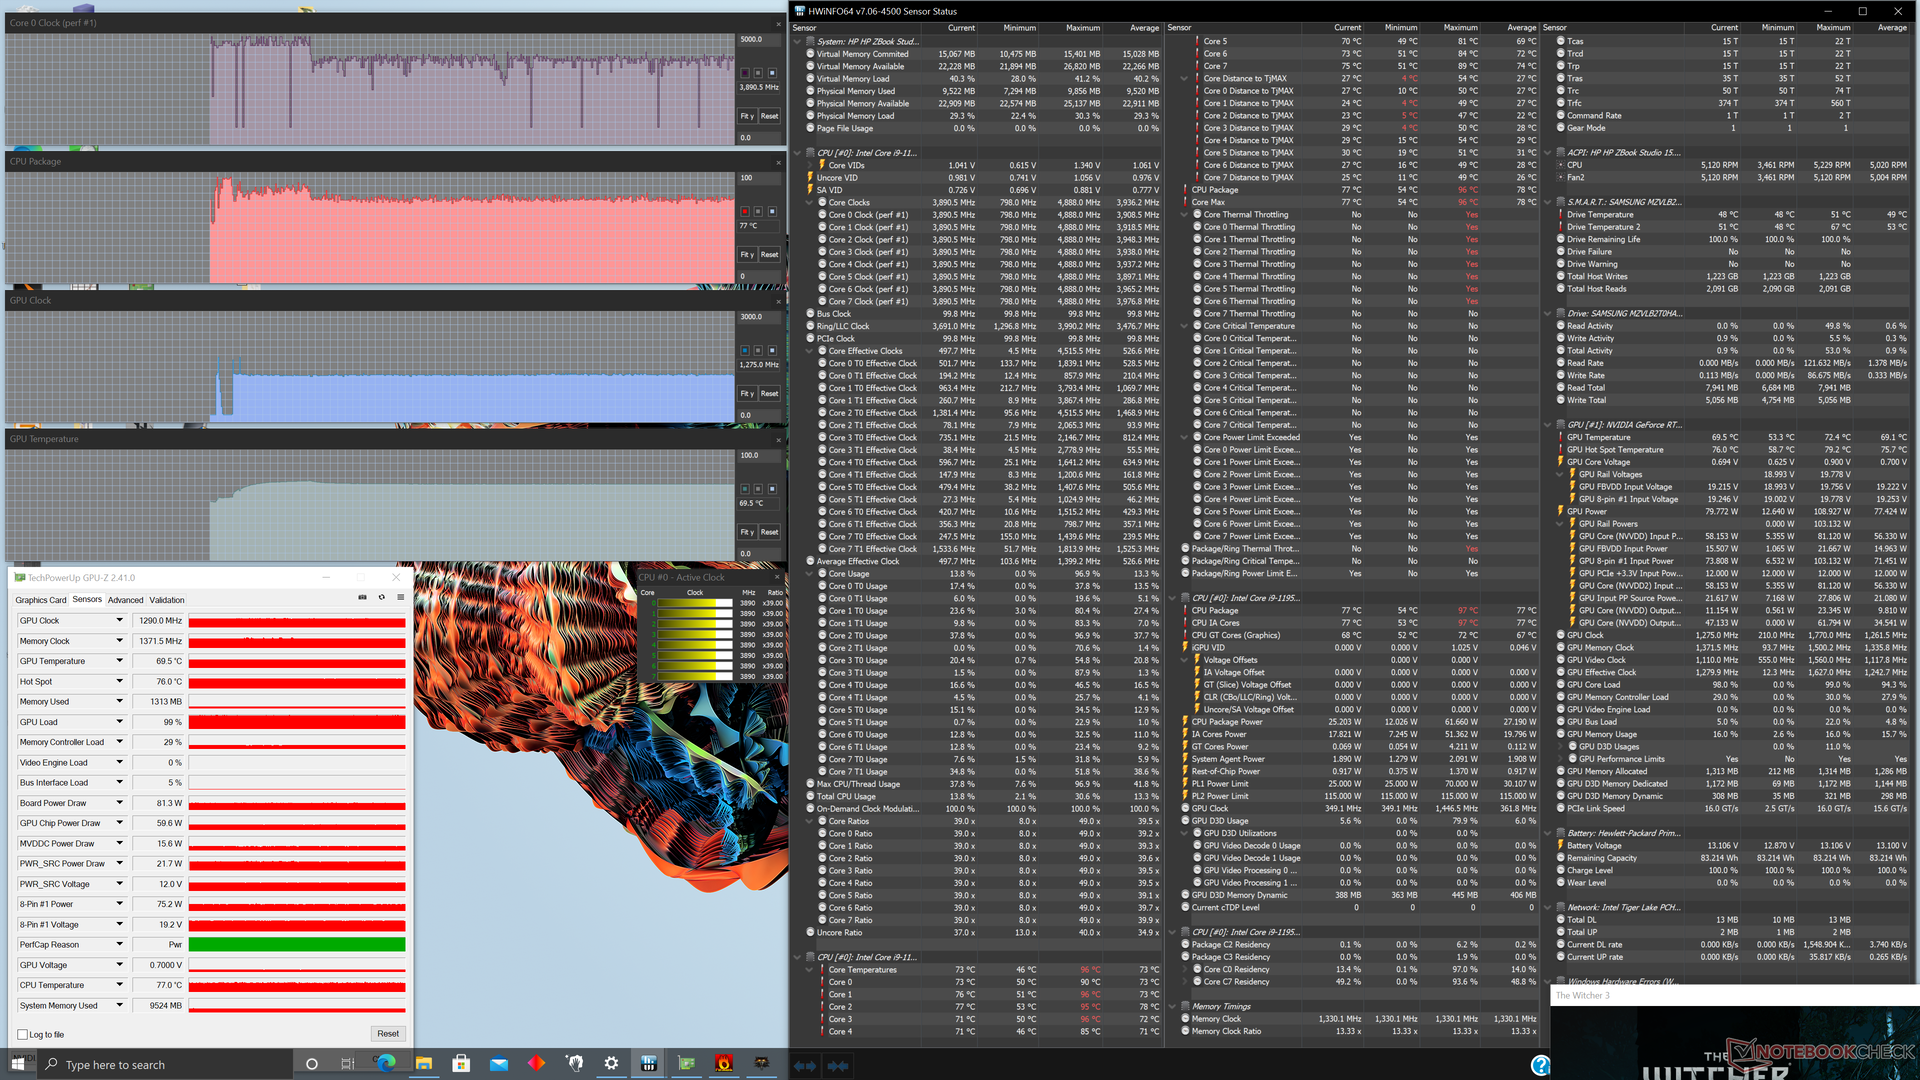
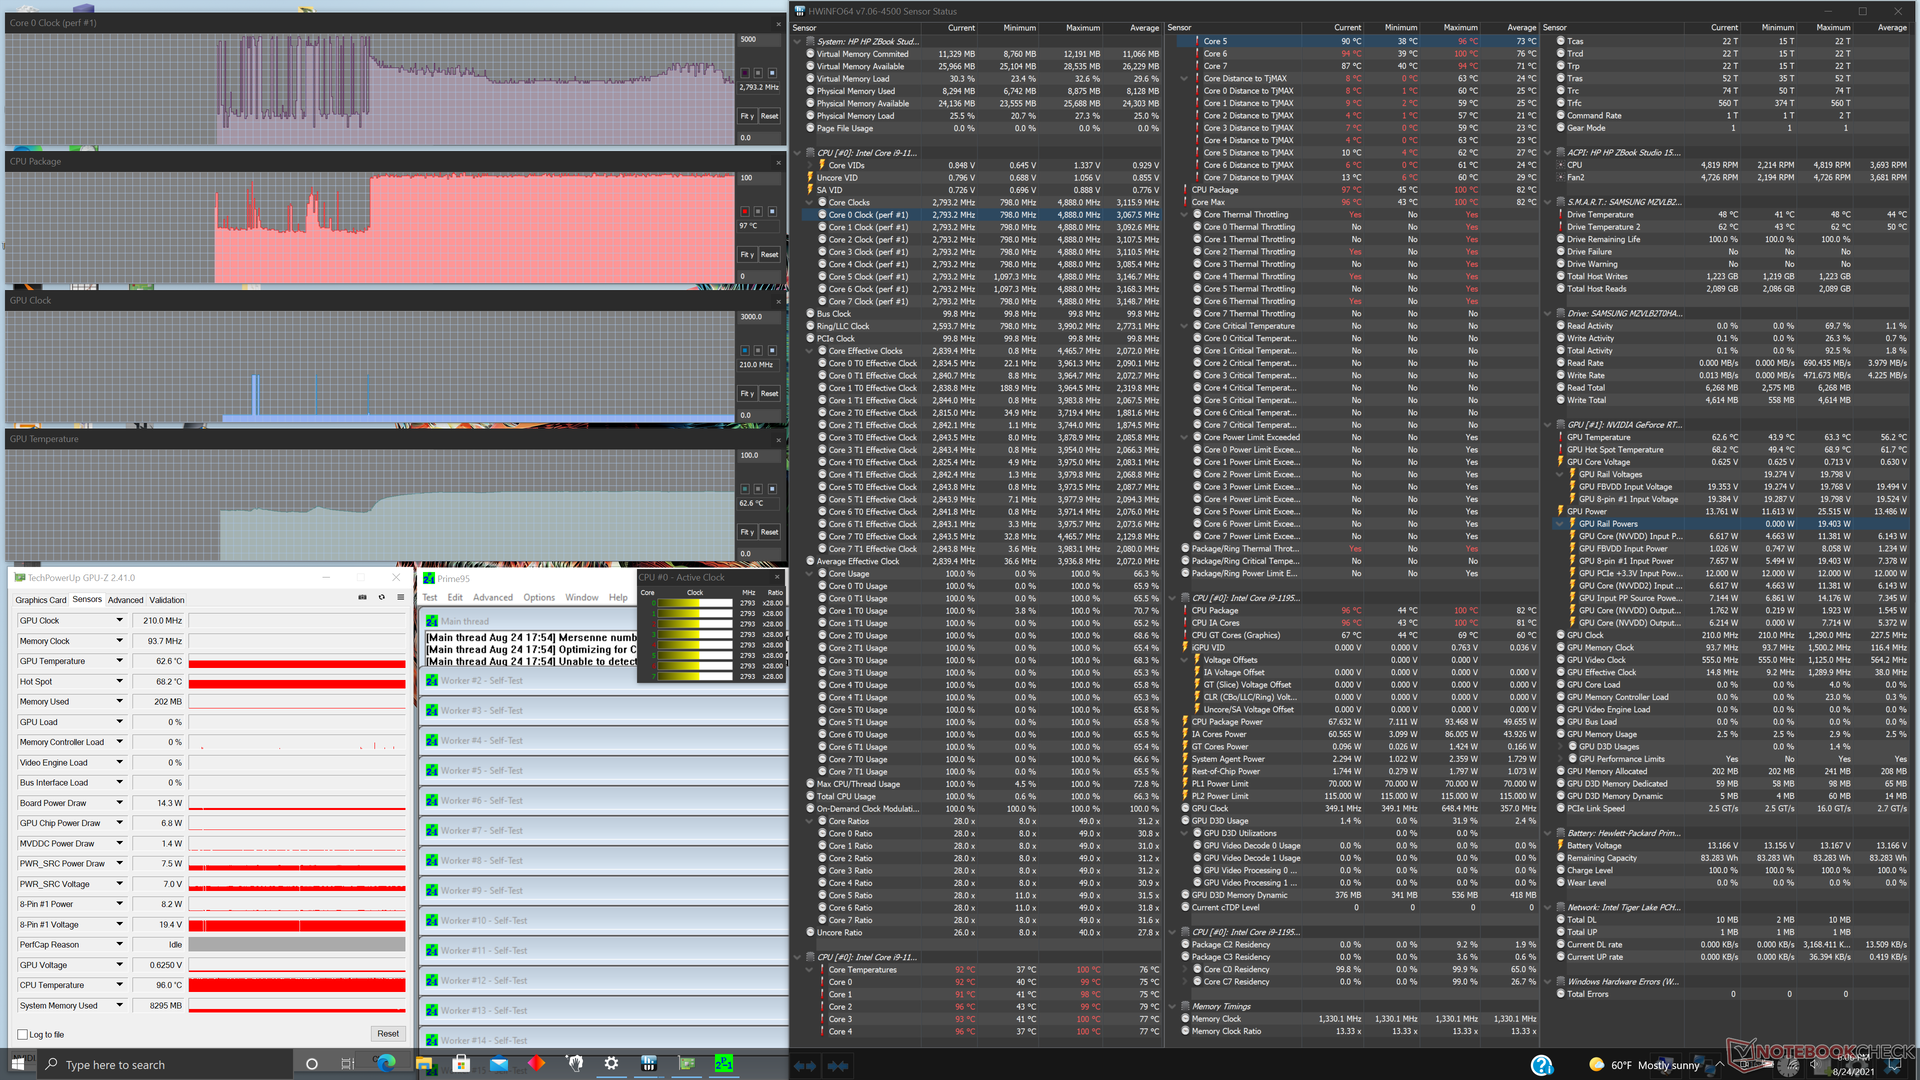
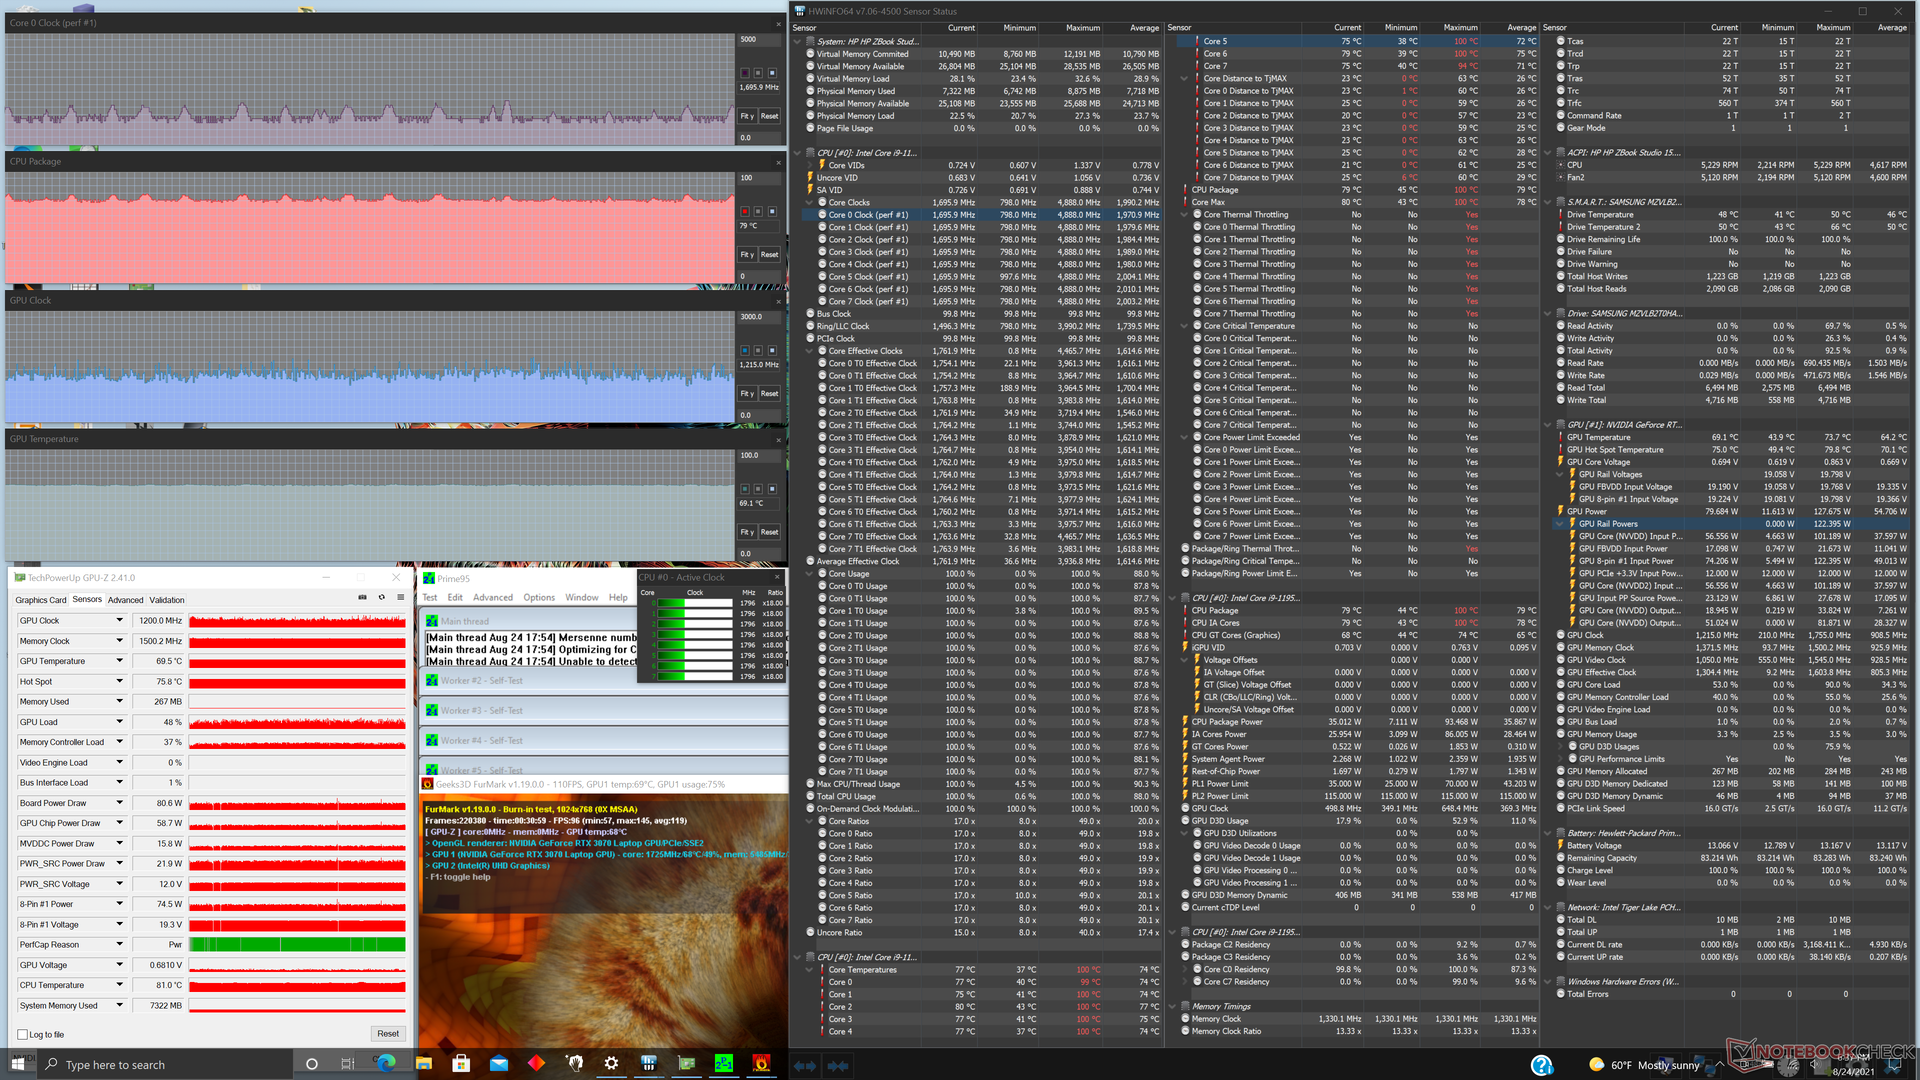
| Fréquence CPU(GHz) | Fréquence GPU(MHz) | Température CPU moyenne(°C) | Température GPUmoyenne(°C) |
| Système au repos | - | - | 46 |
| Prime95 Stress | 2.8 - 3.3 | -- | 98 |
| Prime95+ FurMark Stress | 1.0 - 1.8 | 990 - 1695 | 73 - 81 |
| Witcher 3 Stress | ~3.8 | 1275 | 77 |
Haut-parleurs
Les quadruple haut-parleurs intégrés (2x tweeters + 2x woofers) fournissent un excellent son avec un bon équilibre et une reproduction décente des basses. La qualité pourrait facilement passer sur un ordinateur portable de jeu ou multimédia comme un modèle HP Omen ou MSI série GT.


HP ZBook Studio 15 G8 analyse audio
(+) | les haut-parleurs peuvent jouer relativement fort (85.1# dB)
Basses 100 - 315 Hz
(±) | basse réduite - en moyenne 6% inférieure à la médiane
(±) | la linéarité des basses est moyenne (8.2% delta à la fréquence précédente)
Médiums 400 - 2000 Hz
(+) | médiane équilibrée - seulement 3.8% de la médiane
(+) | les médiums sont linéaires (3.9% delta à la fréquence précédente)
Aiguës 2 - 16 kHz
(+) | des sommets équilibrés - à seulement 3.4% de la médiane
(+) | les aigus sont linéaires (6.5% delta à la fréquence précédente)
Globalement 100 - 16 000 Hz
(+) | le son global est linéaire (8% différence à la médiane)
Par rapport à la même classe
» 1% de tous les appareils testés de cette catégorie étaient meilleurs, 1% similaires, 99% pires
» Le meilleur avait un delta de 7%, la moyenne était de 17%, le pire était de 35%.
Par rapport à tous les appareils testés
» 2% de tous les appareils testés étaient meilleurs, 1% similaires, 98% pires
» Le meilleur avait un delta de 4%, la moyenne était de 24%, le pire était de 134%.
Apple MacBook 12 (Early 2016) 1.1 GHz analyse audio
(+) | les haut-parleurs peuvent jouer relativement fort (83.6# dB)
Basses 100 - 315 Hz
(±) | basse réduite - en moyenne 11.3% inférieure à la médiane
(±) | la linéarité des basses est moyenne (14.2% delta à la fréquence précédente)
Médiums 400 - 2000 Hz
(+) | médiane équilibrée - seulement 2.4% de la médiane
(+) | les médiums sont linéaires (5.5% delta à la fréquence précédente)
Aiguës 2 - 16 kHz
(+) | des sommets équilibrés - à seulement 2% de la médiane
(+) | les aigus sont linéaires (4.5% delta à la fréquence précédente)
Globalement 100 - 16 000 Hz
(+) | le son global est linéaire (10.2% différence à la médiane)
Par rapport à la même classe
» 7% de tous les appareils testés de cette catégorie étaient meilleurs, 2% similaires, 91% pires
» Le meilleur avait un delta de 5%, la moyenne était de 18%, le pire était de 53%.
Par rapport à tous les appareils testés
» 5% de tous les appareils testés étaient meilleurs, 1% similaires, 94% pires
» Le meilleur avait un delta de 4%, la moyenne était de 24%, le pire était de 134%.
Energy Management
Consommation d'énergie
Notre configuration consomme plus d'énergie que la plupart des autres stations de travail de 15,6 pouces, même lorsqu'elle tourne au ralenti sur le bureau, en raison de son panneau OLED. Nous avons prouvé que l'OLED peut être significativement plus gourmand en énergie que l'IPS typique, en particulier lors de l'affichage de couleurs blanches vives. Étant donné que la plupart des contenus en ligne ont des fonds blancs, notre unité OLED peut consommer jusqu'à 2 ou 3 fois plus d'énergie juste en tournant au ralenti sur le réglage de luminosité maximum
L'exécution de charges plus élevées comme les jeux consommera environ 23 % d'énergie en plus que sur le ZBook G7 équipé de la Quadro RTX 3000 Max-Q. Les performances par watt sont toujours supérieures sur notre nouveau modèle G8, puisque les performances brutes du CPU et les performances graphiques sont respectivement supérieures de 25 % et 50 % d'une génération à l'autre
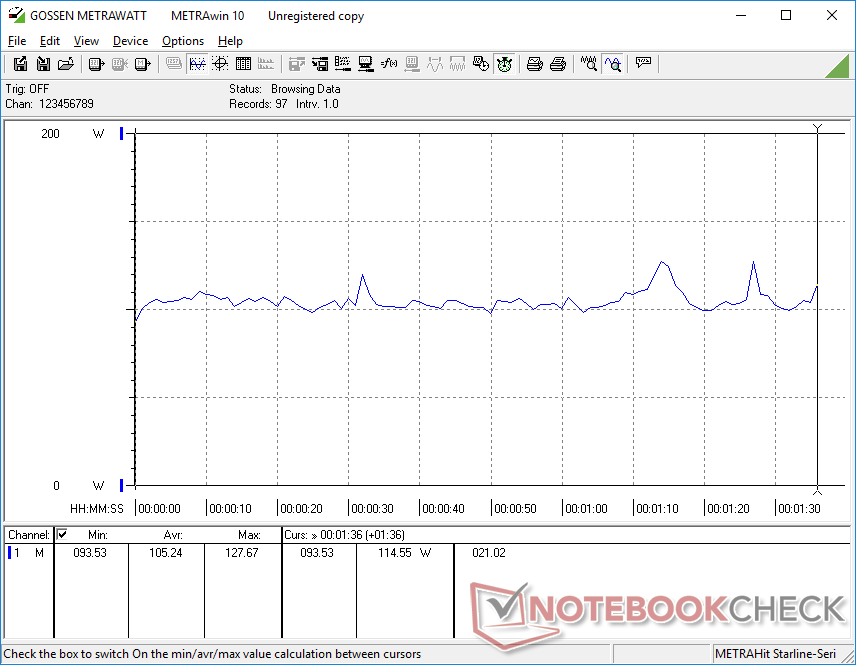
Nous sommes en mesure d'enregistrer une consommation maximale de 172 W à partir de l'adaptateur secteur de taille moyenne (~15,3 x 7,5 x 2,4 cm) 200 W. Le système peut fonctionner avec des charges élevées tout en se rechargeant à un taux décent simultanément, contrairement à la version précédente du Dell version précédente du Dell Precision 5750. Le ZBook G8 sera livré avec un adaptateur CA plus petit de 150 W s'il est configuré avec seulement des graphiques Iris Xe.
| Éteint/en veille | |
| Au repos | |
| Fortement sollicité |
|
Légende:
min: | |
| HP ZBook Studio 15 G8 i9-11950H, GeForce RTX 3070 Laptop GPU, Samsung PM981a MZVLB2T0HALB, OLED, 3840x2160, 15.6" | HP ZBook Firefly 15 G8 2C9R7EA i7-1165G7, T500 Laptop GPU, Toshiba XG6 KXG60ZNV1T02, IPS, 1920x1080, 15.6" | HP ZBook Studio G7 i9-10885H, Quadro RTX 3000 Max-Q, Micron 2300 1TB MTFDHBA1T0TDV, IPS, 3840x2160, 15.6" | Dell Precision 7550 W-10885M, Quadro RTX 5000 Max-Q, SK Hynix PC601A NVMe 1TB, IPS, 3840x2160, 15.6" | Lenovo ThinkPad P15s Gen2-20W6000GGE i7-1165G7, T500 Laptop GPU, WDC PC SN720 SDAQNTW-1T00, IPS LED, 3840x2160, 15.6" | Asus ProArt StudioBook Pro 15 W500G5T i7-9750H, Quadro RTX 5000 Max-Q, Samsung SSD PM981 MZVLB1T0HALR, IPS, 3840x2160, 15.6" | |
|---|---|---|---|---|---|---|
| Power Consumption | 63% | 19% | 2% | 54% | 6% | |
| Idle Minimum * (Watt) | 11 | 3.3 70% | 5.5 50% | 8.2 25% | 5.8 47% | 11.6 -5% |
| Idle Average * (Watt) | 18.8 | 5.6 70% | 13.7 27% | 16.8 11% | 13.3 29% | 19 -1% |
| Idle Maximum * (Watt) | 31.7 | 8.7 73% | 16.6 48% | 24.4 23% | 15.6 51% | 20.6 35% |
| Load Average * (Watt) | 105.2 | 64.4 39% | 118.4 -13% | 131 -25% | 43.2 59% | 102 3% |
| Witcher 3 ultra * (Watt) | 148 | 53 64% | 120 19% | 156.6 -6% | 37.1 75% | |
| Load Maximum * (Watt) | 171.8 | 69 60% | 203.3 -18% | 201.8 -17% | 67.3 61% | 178 -4% |
* ... Moindre est la valeur, meilleures sont les performances
Power Consumption Witcher 3 / Stresstest
Autonomie de la batterie - plus courte à cause de l'OLED
Les temps d'exécution semblent être plus courts que sur le ZBook Studio G7 de l'année dernière, de plusieurs heures. Nous n'avons pu obtenir qu'un peu plus de 6 heures d'utilisation réelle du WLAN, contre presque 8 heures sur le G7, même avec le GPU intégré. La dalle OLED de notre G8, plus gourmande en énergie, est probablement responsable de l'autonomie tronquée.
Le chargement est heureusement rapide, avec environ 90 minutes entre le moment où l'appareil est vide et celui où il atteint sa pleine capacité. Les utilisateurs peuvent également recharger le système via l'USB-C.
| HP ZBook Studio 15 G8 i9-11950H, GeForce RTX 3070 Laptop GPU, 83 Wh | HP ZBook Firefly 15 G8 2C9R7EA i7-1165G7, T500 Laptop GPU, 56 Wh | HP ZBook Studio G7 i9-10885H, Quadro RTX 3000 Max-Q, 83 Wh | Dell Precision 7550 W-10885M, Quadro RTX 5000 Max-Q, 95 Wh | Lenovo ThinkPad P15s Gen2-20W6000GGE i7-1165G7, T500 Laptop GPU, 57 Wh | Asus ProArt StudioBook Pro 15 W500G5T i7-9750H, Quadro RTX 5000 Max-Q, 76 Wh | |
|---|---|---|---|---|---|---|
| Autonomie de la batterie | 49% | 8% | -5% | 15% | -24% | |
| Reader / Idle (h) | 12.9 | 11.1 -14% | ||||
| WiFi v1.3 (h) | 6.2 | 10.5 69% | 7.8 26% | 8.9 44% | 7.7 24% | 4.7 -24% |
| Load (h) | 1.8 | 2.3 28% | 1.6 -11% | 1 -44% | 1.9 6% |
Points positifs
Points négatifs
Verdict : de bons gains pour le CPU, des gains peu inspirants pour le GPU
HP propose actuellement trois modèles ZBook G8 : le ZBook Studio G8, le ZBook Fury G8, et le ZBook Firefly G8. L'épais Fury G8 répond à l'espace traditionnel des stations de travail tandis que le Firefly G8, fin et léger, utilise le logiciel ULV pour une meilleure portabilité. Notre ZBook Studio G8 est la solution intermédiaire pour les utilisateurs qui veulent les performances de la série Core H sans l'encombrement de la Firefly.
Cette solution de milieu de gamme implique de renoncer à certaines fonctionnalités présentes sur le Fury. Le panneau inférieur à ouverture rapide, le pavé numérique, les boutons de la souris, le TrackPoint, les processeurs Xeon, la RAM ECC extensible, l'obturateur de la webcam, etc. sont tous absents du ZBook Studio G8. Les utilisateurs voudront peut-être envisager le modèle Fury, plus épais, si de telles caractéristiques sont souhaitables.
Le ZBook Studio G8, très fiable, fonctionne très bien et a l'air encore mieux malgré son design vieux d'un an. Cependant, la RTX 3070 de GeForce n'est pas à la hauteur, tandis que l'écran OLED présente quelques inconvénients notables par rapport aux options IPS moins chères.
Par rapport à des concurrents plus immédiats comme le MSI WS66 ou Razer Blade 15 Studiole système MSI offre des options Xeon tandis que les deux peuvent accueillir jusqu'à deux SSD M.2 au lieu d'un seul. Les températures du CPU lors de l'exécution de charges élevées pourraient également être beaucoup plus fraîches sur le HP. Même le ZBook Studio G8 a une meilleure qualité de construction que le MSI et un clavier plus confortable que les deux alternatives.
Prix et disponibilité
Le ZBook Studio G8 n'est pas encore largement disponible dans les canaux de vente au détail tiers à ce jour. Les utilisateurs intéressés doivent plutôt commander directement auprès de HP où les options configurables sont nombreuses. Notre configuration spécifique est vendue à environ 4200 $ US.
HP ZBook Studio 15 G8
- 08/31/2022 v7 (old)
Allen Ngo
Price comparison

