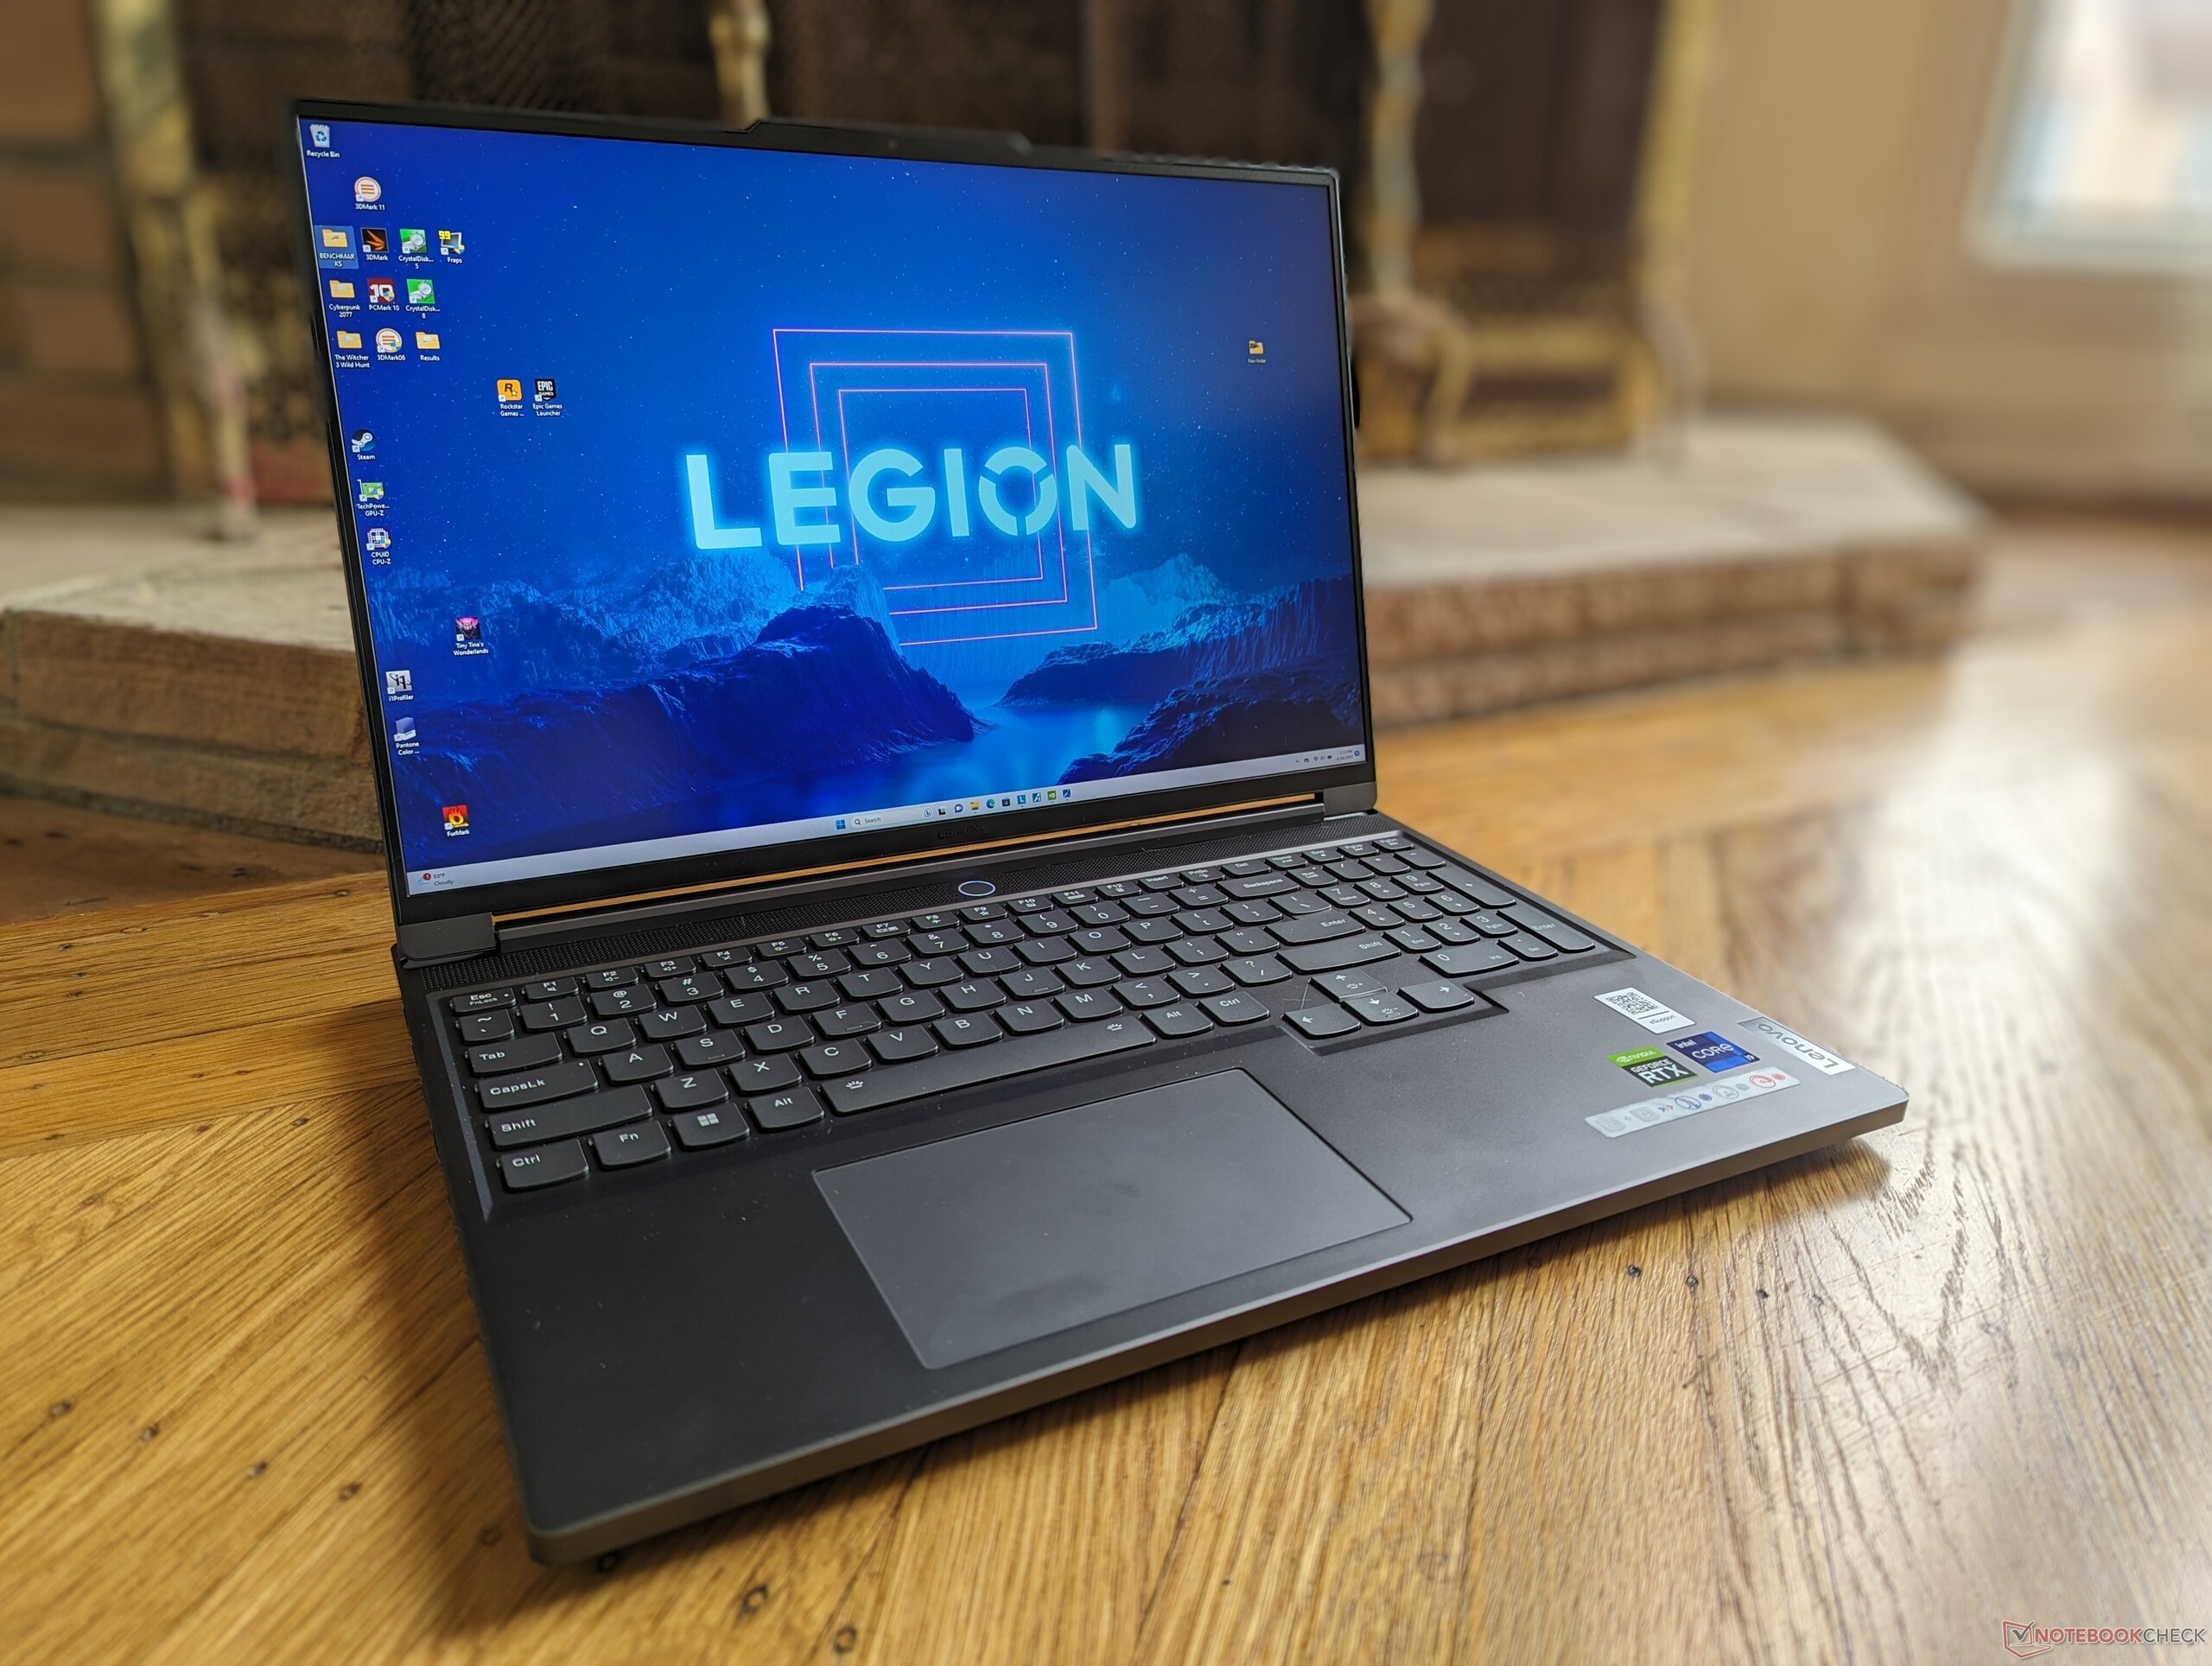
Test du Lenovo Legion Slim 7i 16 Gen 8 : plus fin que le Razer Blade 16

Le Lenovo Legion Slim 7i Gen 8 remplace le modèle de l'année dernière, le Legion Slim 7i Gen 7 avec des processeurs Raptor Lake-H de 13e génération, des GPU Nvidia Ada Lovelace et un nouveau design de châssis. Il vient compléter les ordinateurs plus épais et plus puissants de la série Legion Série Pro 7.
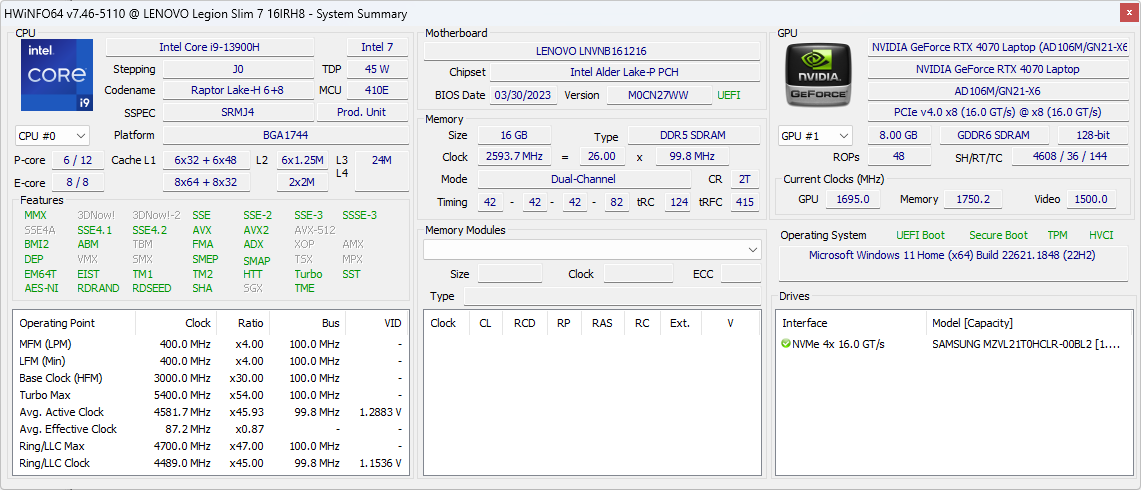
Notre unité de test est une configuration haut de gamme avec le Core i9-13900H, un GPU RTX 4070 de 140 W GeForce et un écran IPS 2560 x 1600 240 Hz pour un prix de détail d'environ $1600 USD. D'autres modèles sont disponibles avec un Core i7-13700H moins puissant, un GPU RTX 4060 ou un écran 3200 x 2000 165 Hz de plus haute résolution à partir d'environ 1500 USD.
Parmi les concurrents du Legion Slim 7i G8, on trouve d'autres ordinateurs portables de jeu de 16 pouces, fins et légers, comme le Razer Blade 16, HP Omen 16, Asus ROG Zephyrus M16ou le Alienware x16 R1.
Plus de commentaires sur Lenovo :
Comparaison avec les concurrents potentiels
Note | Date | Modèle | Poids | Épaisseur | Taille | Résolution | Prix |
|---|---|---|---|---|---|---|---|
| 90 % v7 (old) | 07/23 | Lenovo Legion Slim 7i 16 Gen 8 i9-13900H, GeForce RTX 4070 Laptop GPU | 2.1 kg | 19.9 mm | 16.00" | 2560x1600 | |
| 87.4 % v7 (old) | 07/23 | HP Omen 16-wf000 i7-13700HX, GeForce RTX 4080 Laptop GPU | 2.4 kg | 23.6 mm | 16.10" | 2560x1440 | |
| 88.4 % v7 (old) | 06/23 | Alienware x16 R1 i9-13900HK, GeForce RTX 4080 Laptop GPU | 2.6 kg | 18.57 mm | 16.00" | 2560x1600 | |
| 88.8 % v7 (old) | 06/23 | Lenovo Legion Pro 7 RTX4090 i9-13900HX, GeForce RTX 4090 Laptop GPU | 2.7 kg | 26 mm | 16.00" | 2560x1600 | |
| 88.4 % v7 (old) | 03/23 | Asus ROG Strix G16 G614JZ i9-13980HX, GeForce RTX 4080 Laptop GPU | 2.4 kg | 30.4 mm | 16.00" | 2560x1600 | |
| 91.2 % v7 (old) | 02/23 | Razer Blade 16 Early 2023 i9-13950HX, GeForce RTX 4080 Laptop GPU | 2.4 kg | 21.99 mm | 16.00" | 2560x1600 |
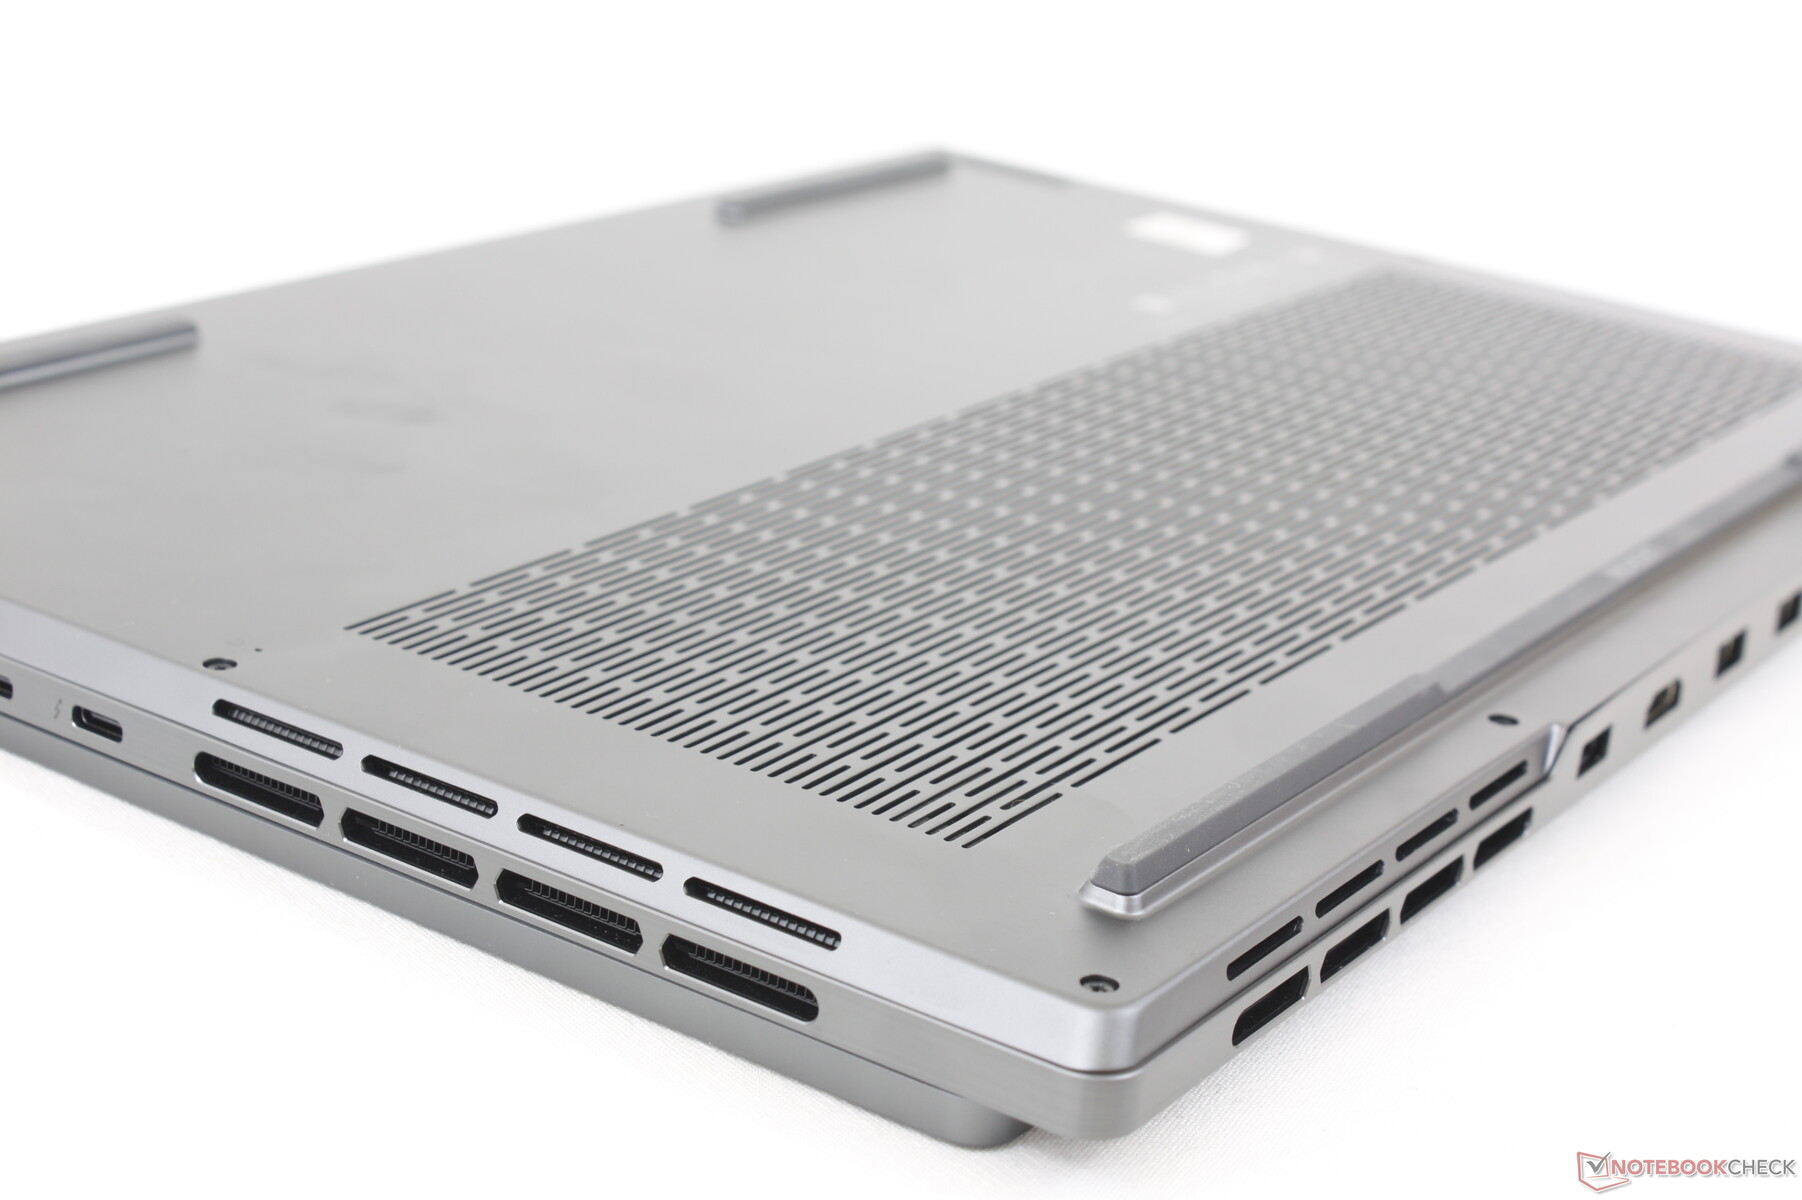
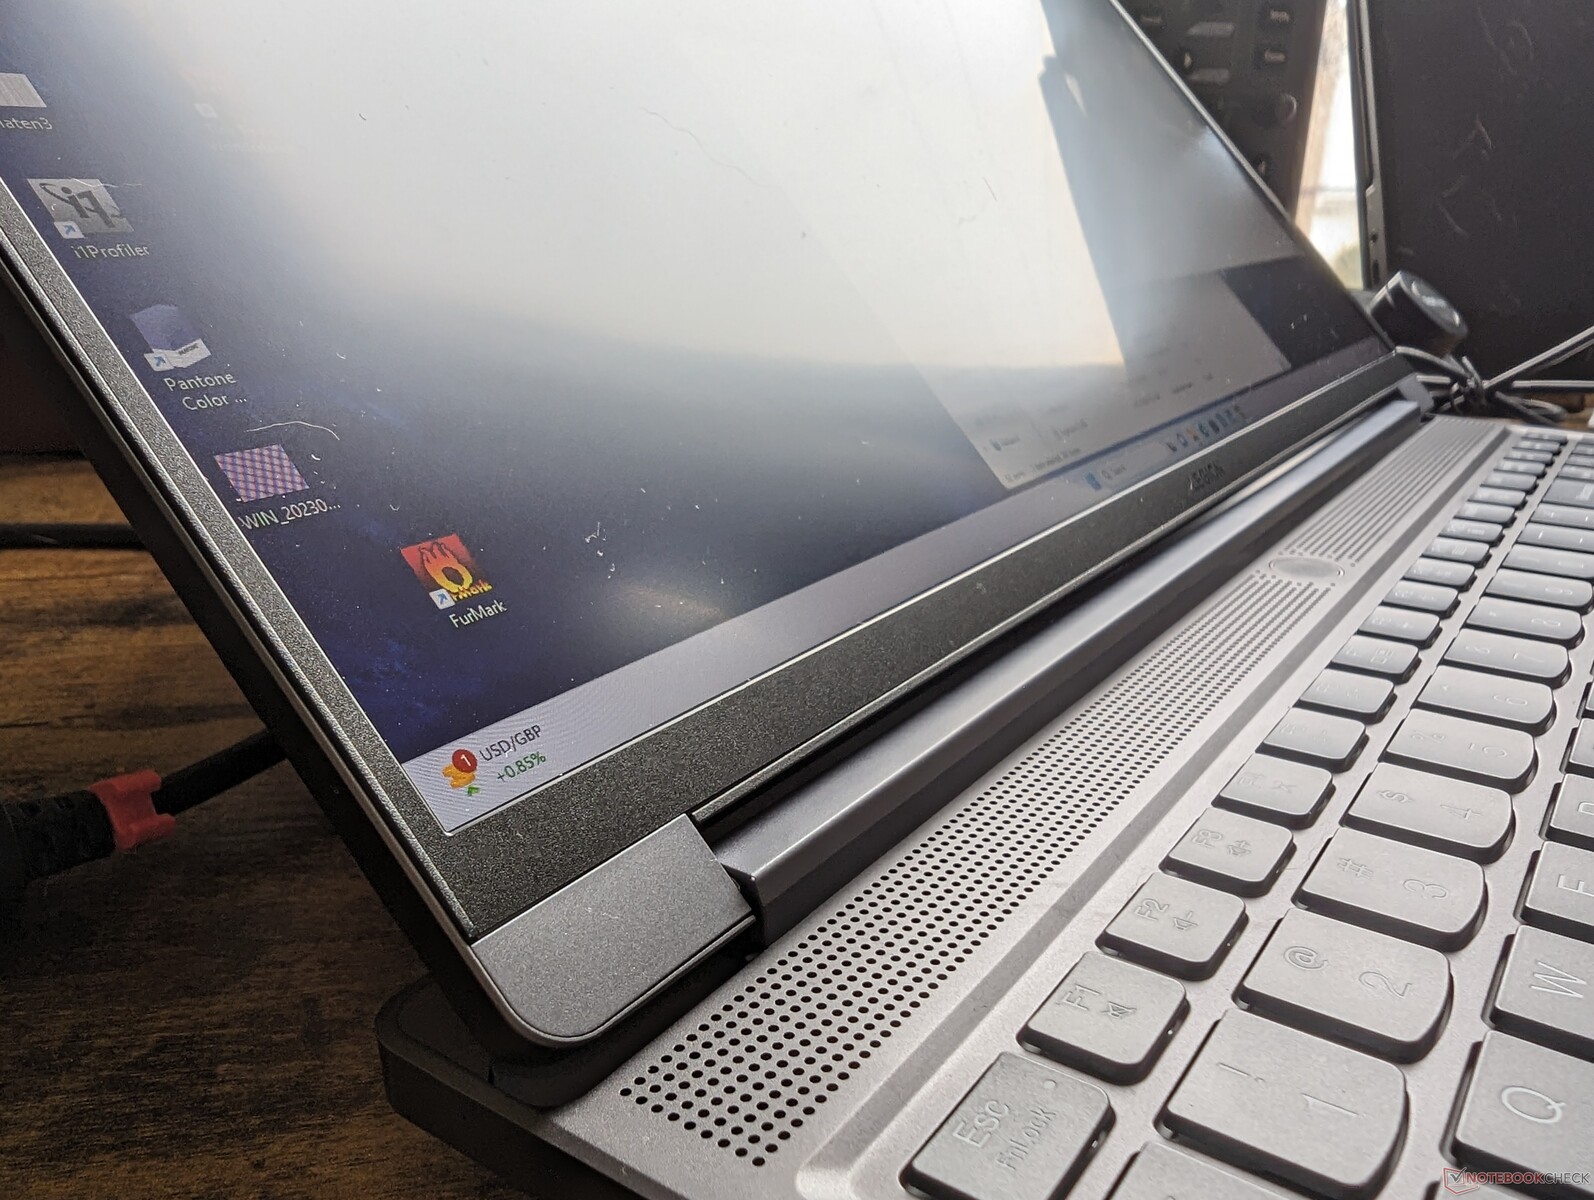
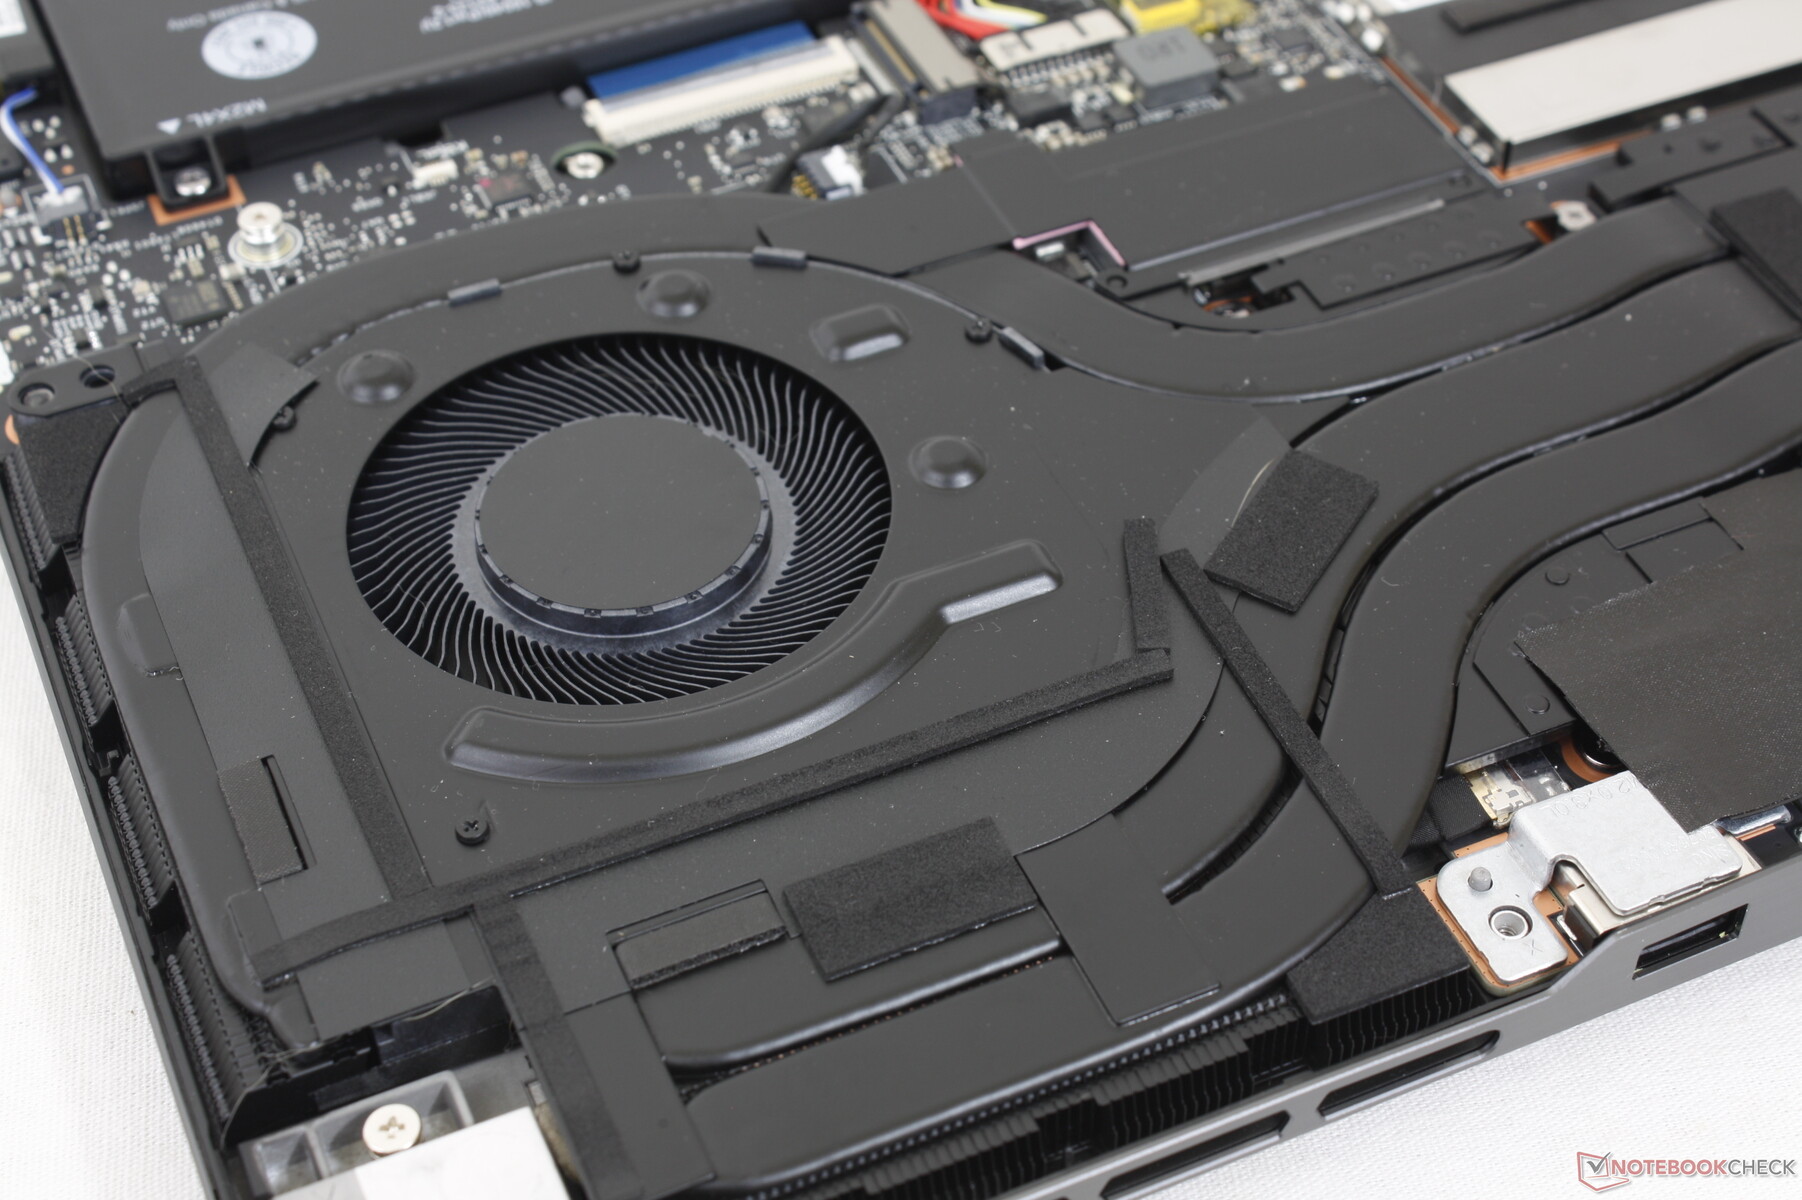
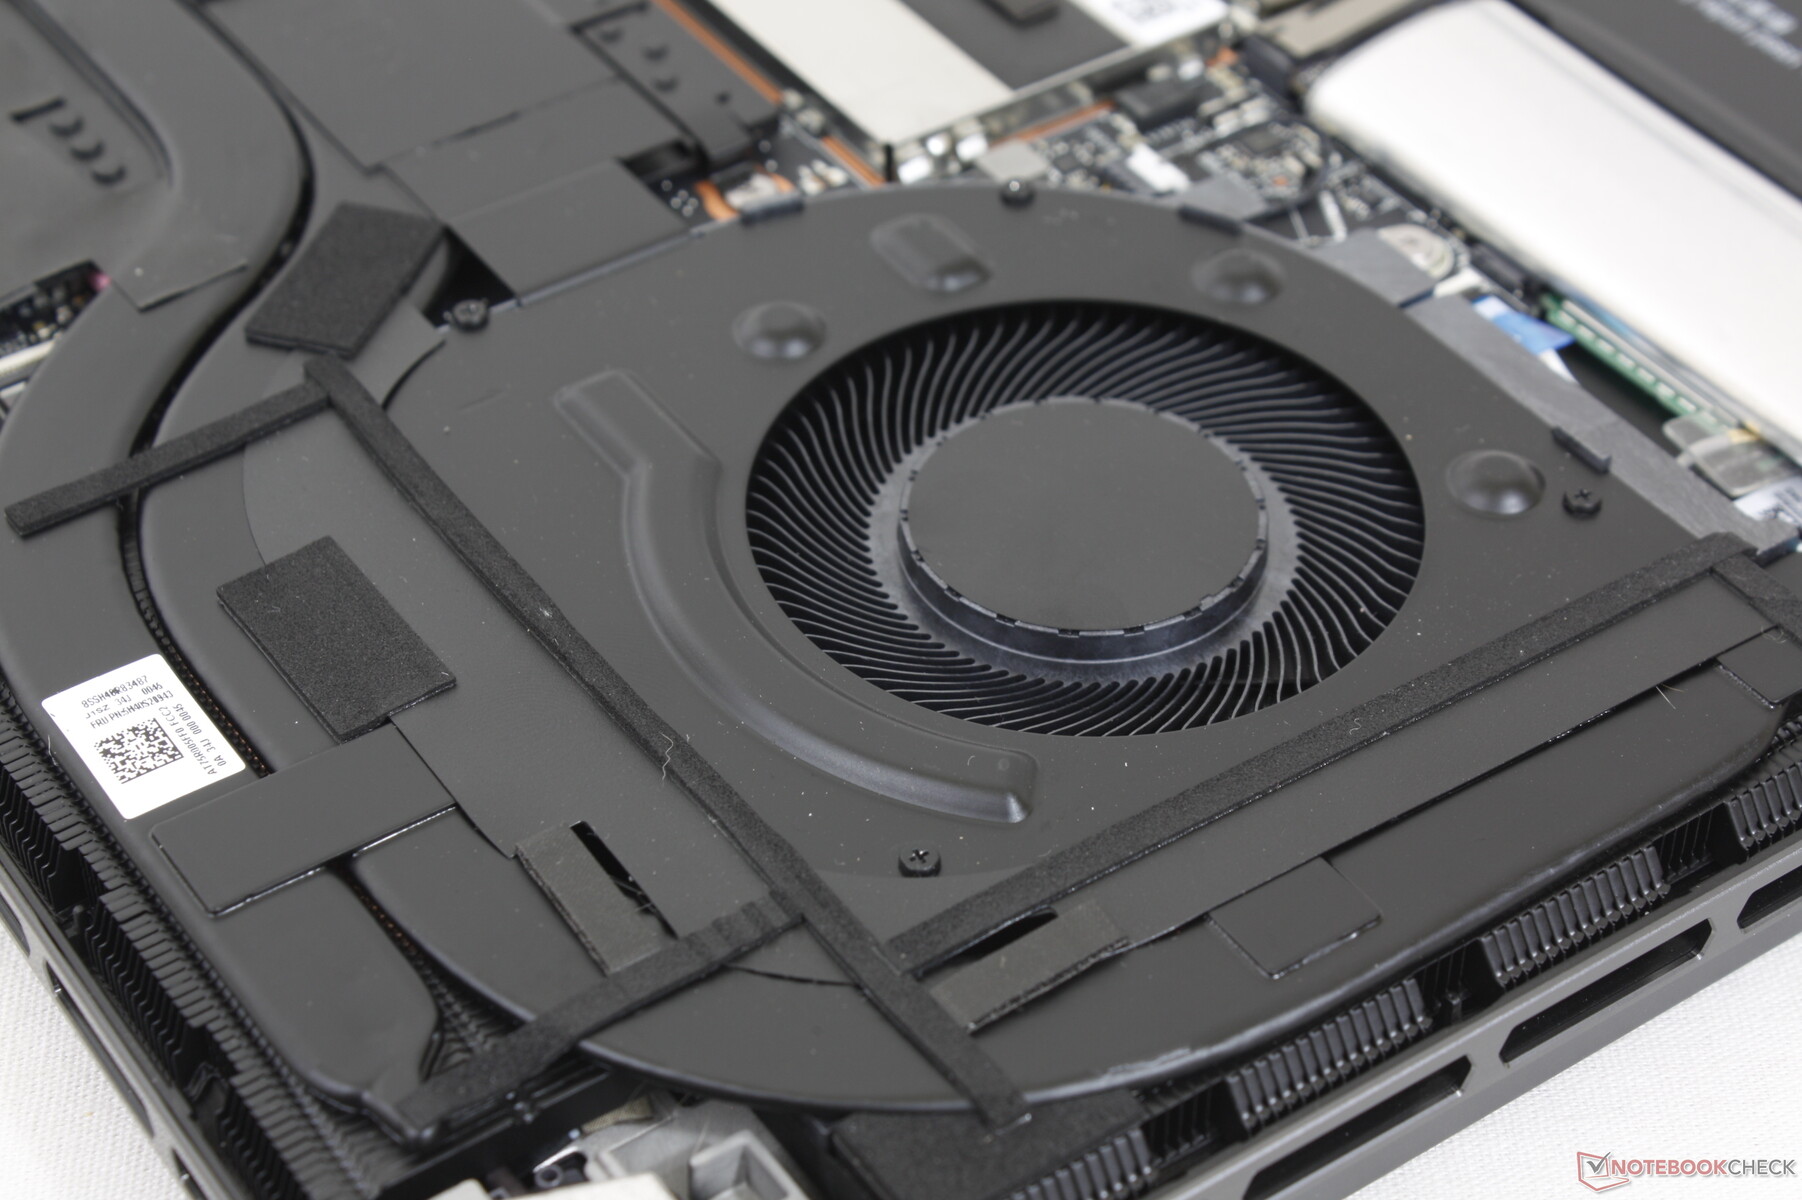
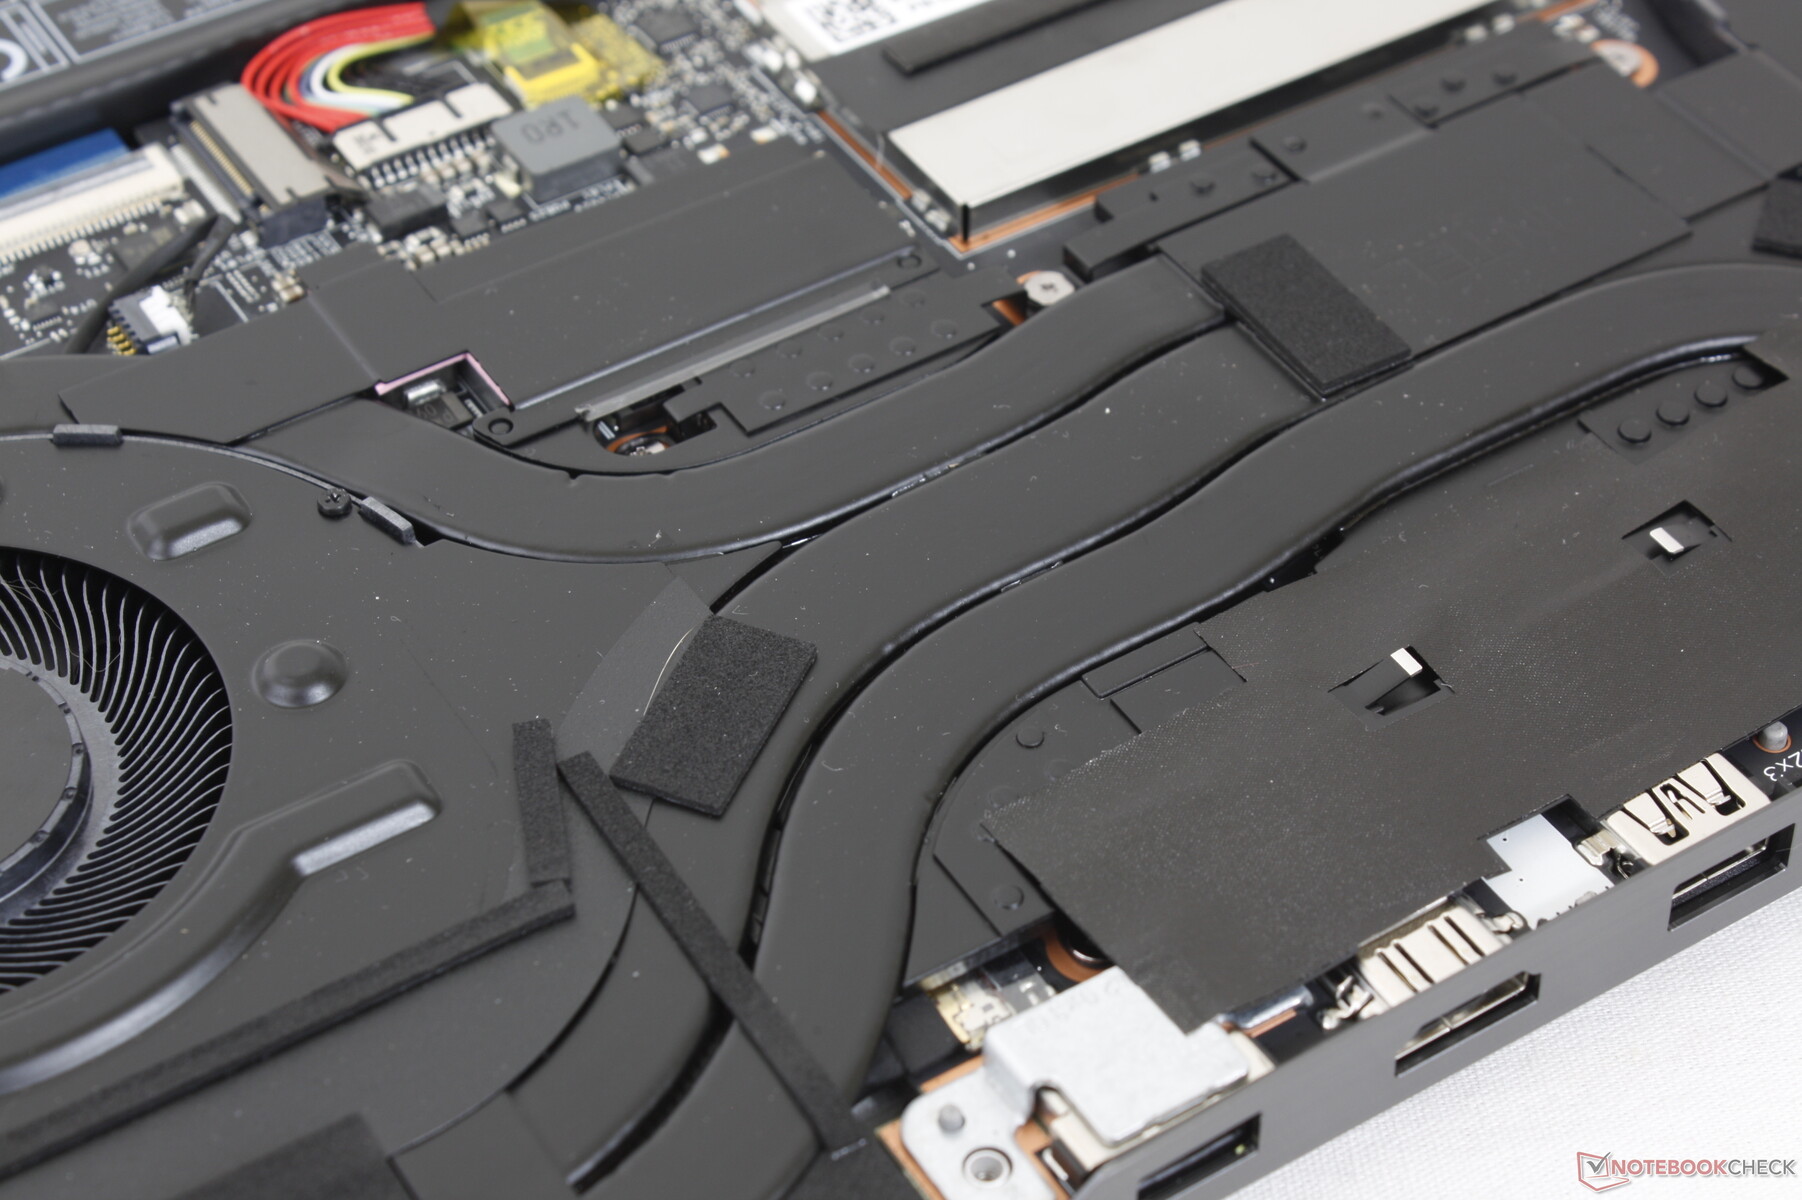
Boîtier - Maintenant avec plus de grilles d'aération
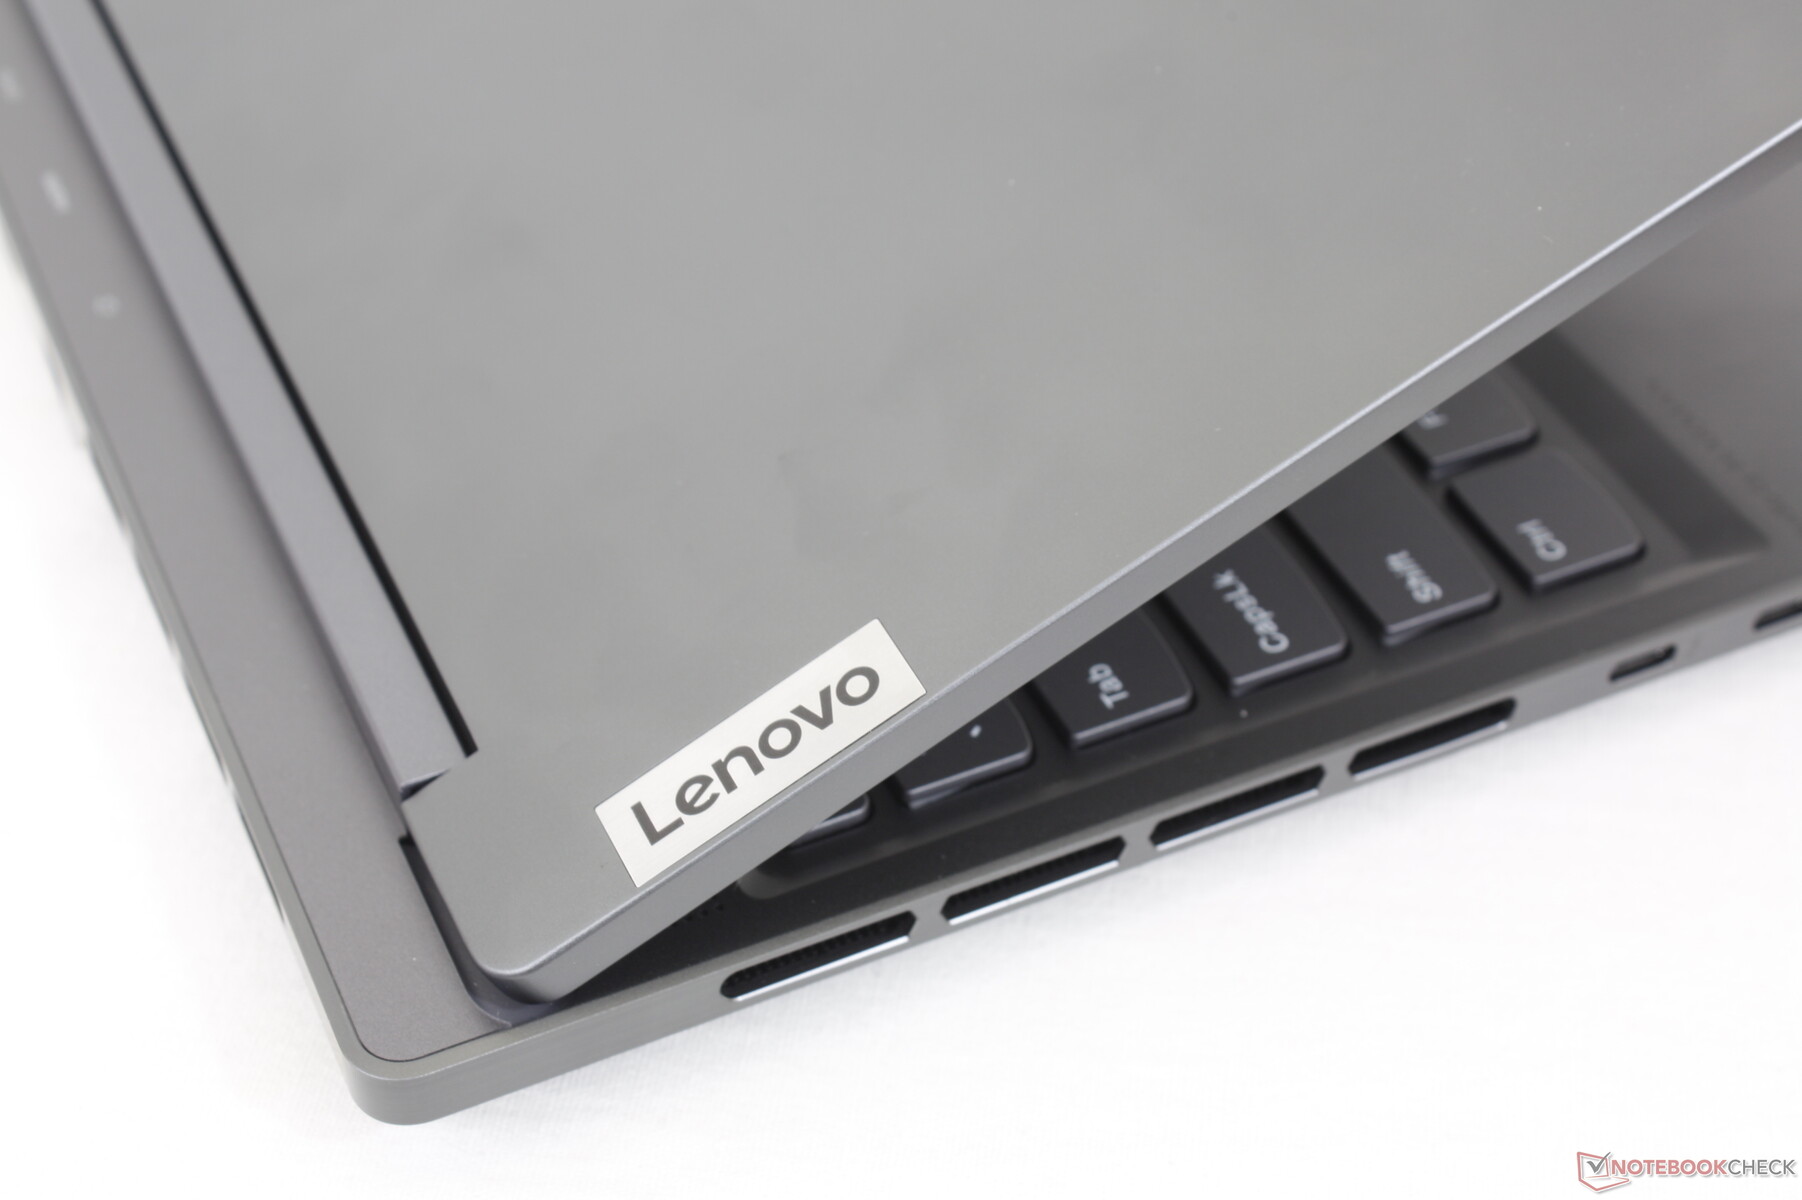
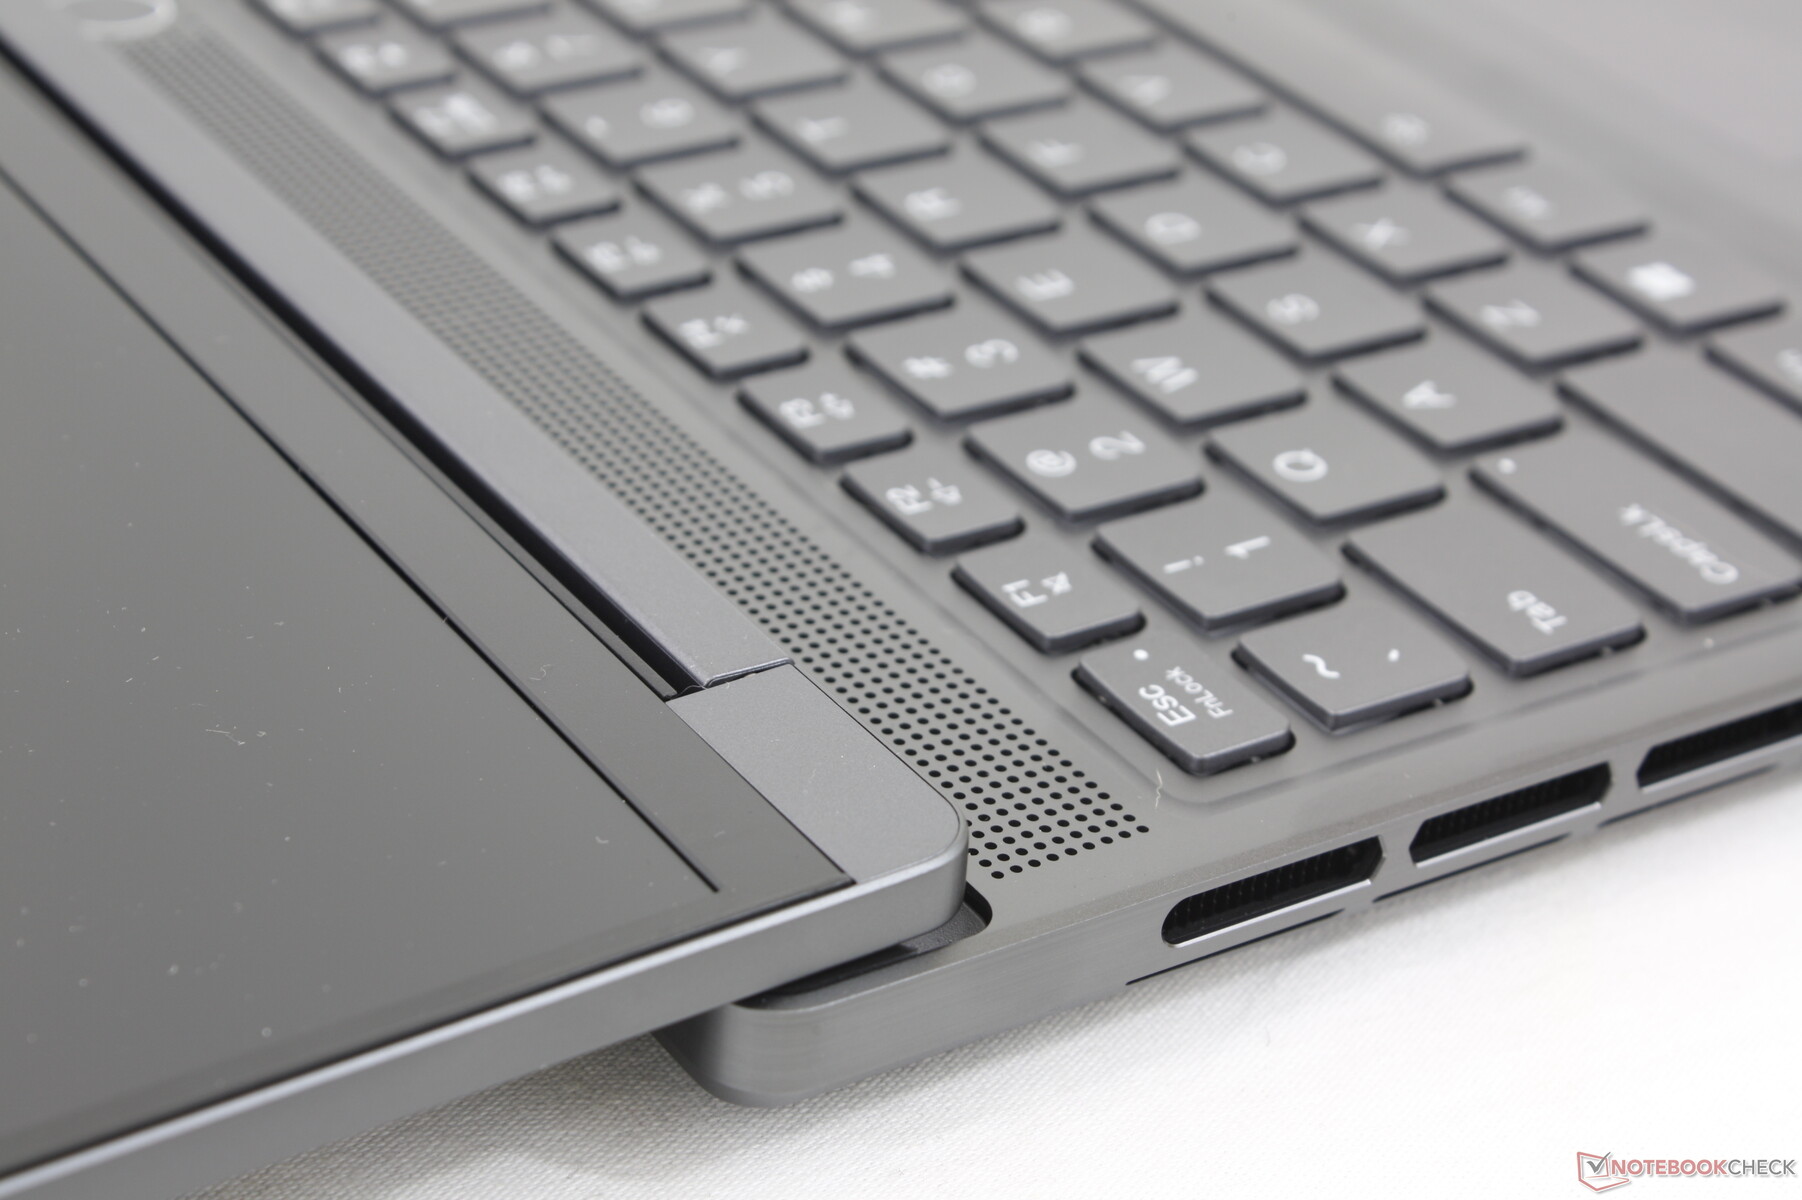
Le châssis peut sembler similaire au Legion Slim 7i 16 G7 de l'année dernière de l'avant, mais la plupart des changements extérieurs se trouvent à l'arrière et sur les côtés inférieurs. Le bord arrière, par exemple, est désormais plat pour un aspect plus net, tandis que les grilles de ventilation sont nettement plus grandes cette fois-ci pour améliorer le refroidissement.
Les matériaux du châssis ont la même finition en aluminium gris et la même sensation que sur les autres modèles Legion 7. La base reste rigide malgré la finesse du profil et le couvercle est lui aussi relativement ferme. Les petites charnières ne sont pas aussi solides que les plus grandes sur le Asus ROG Strix G16mais elles permettent une ouverture à 180 degrés, ce qui n'est pas courant sur les ordinateurs portables de jeu.
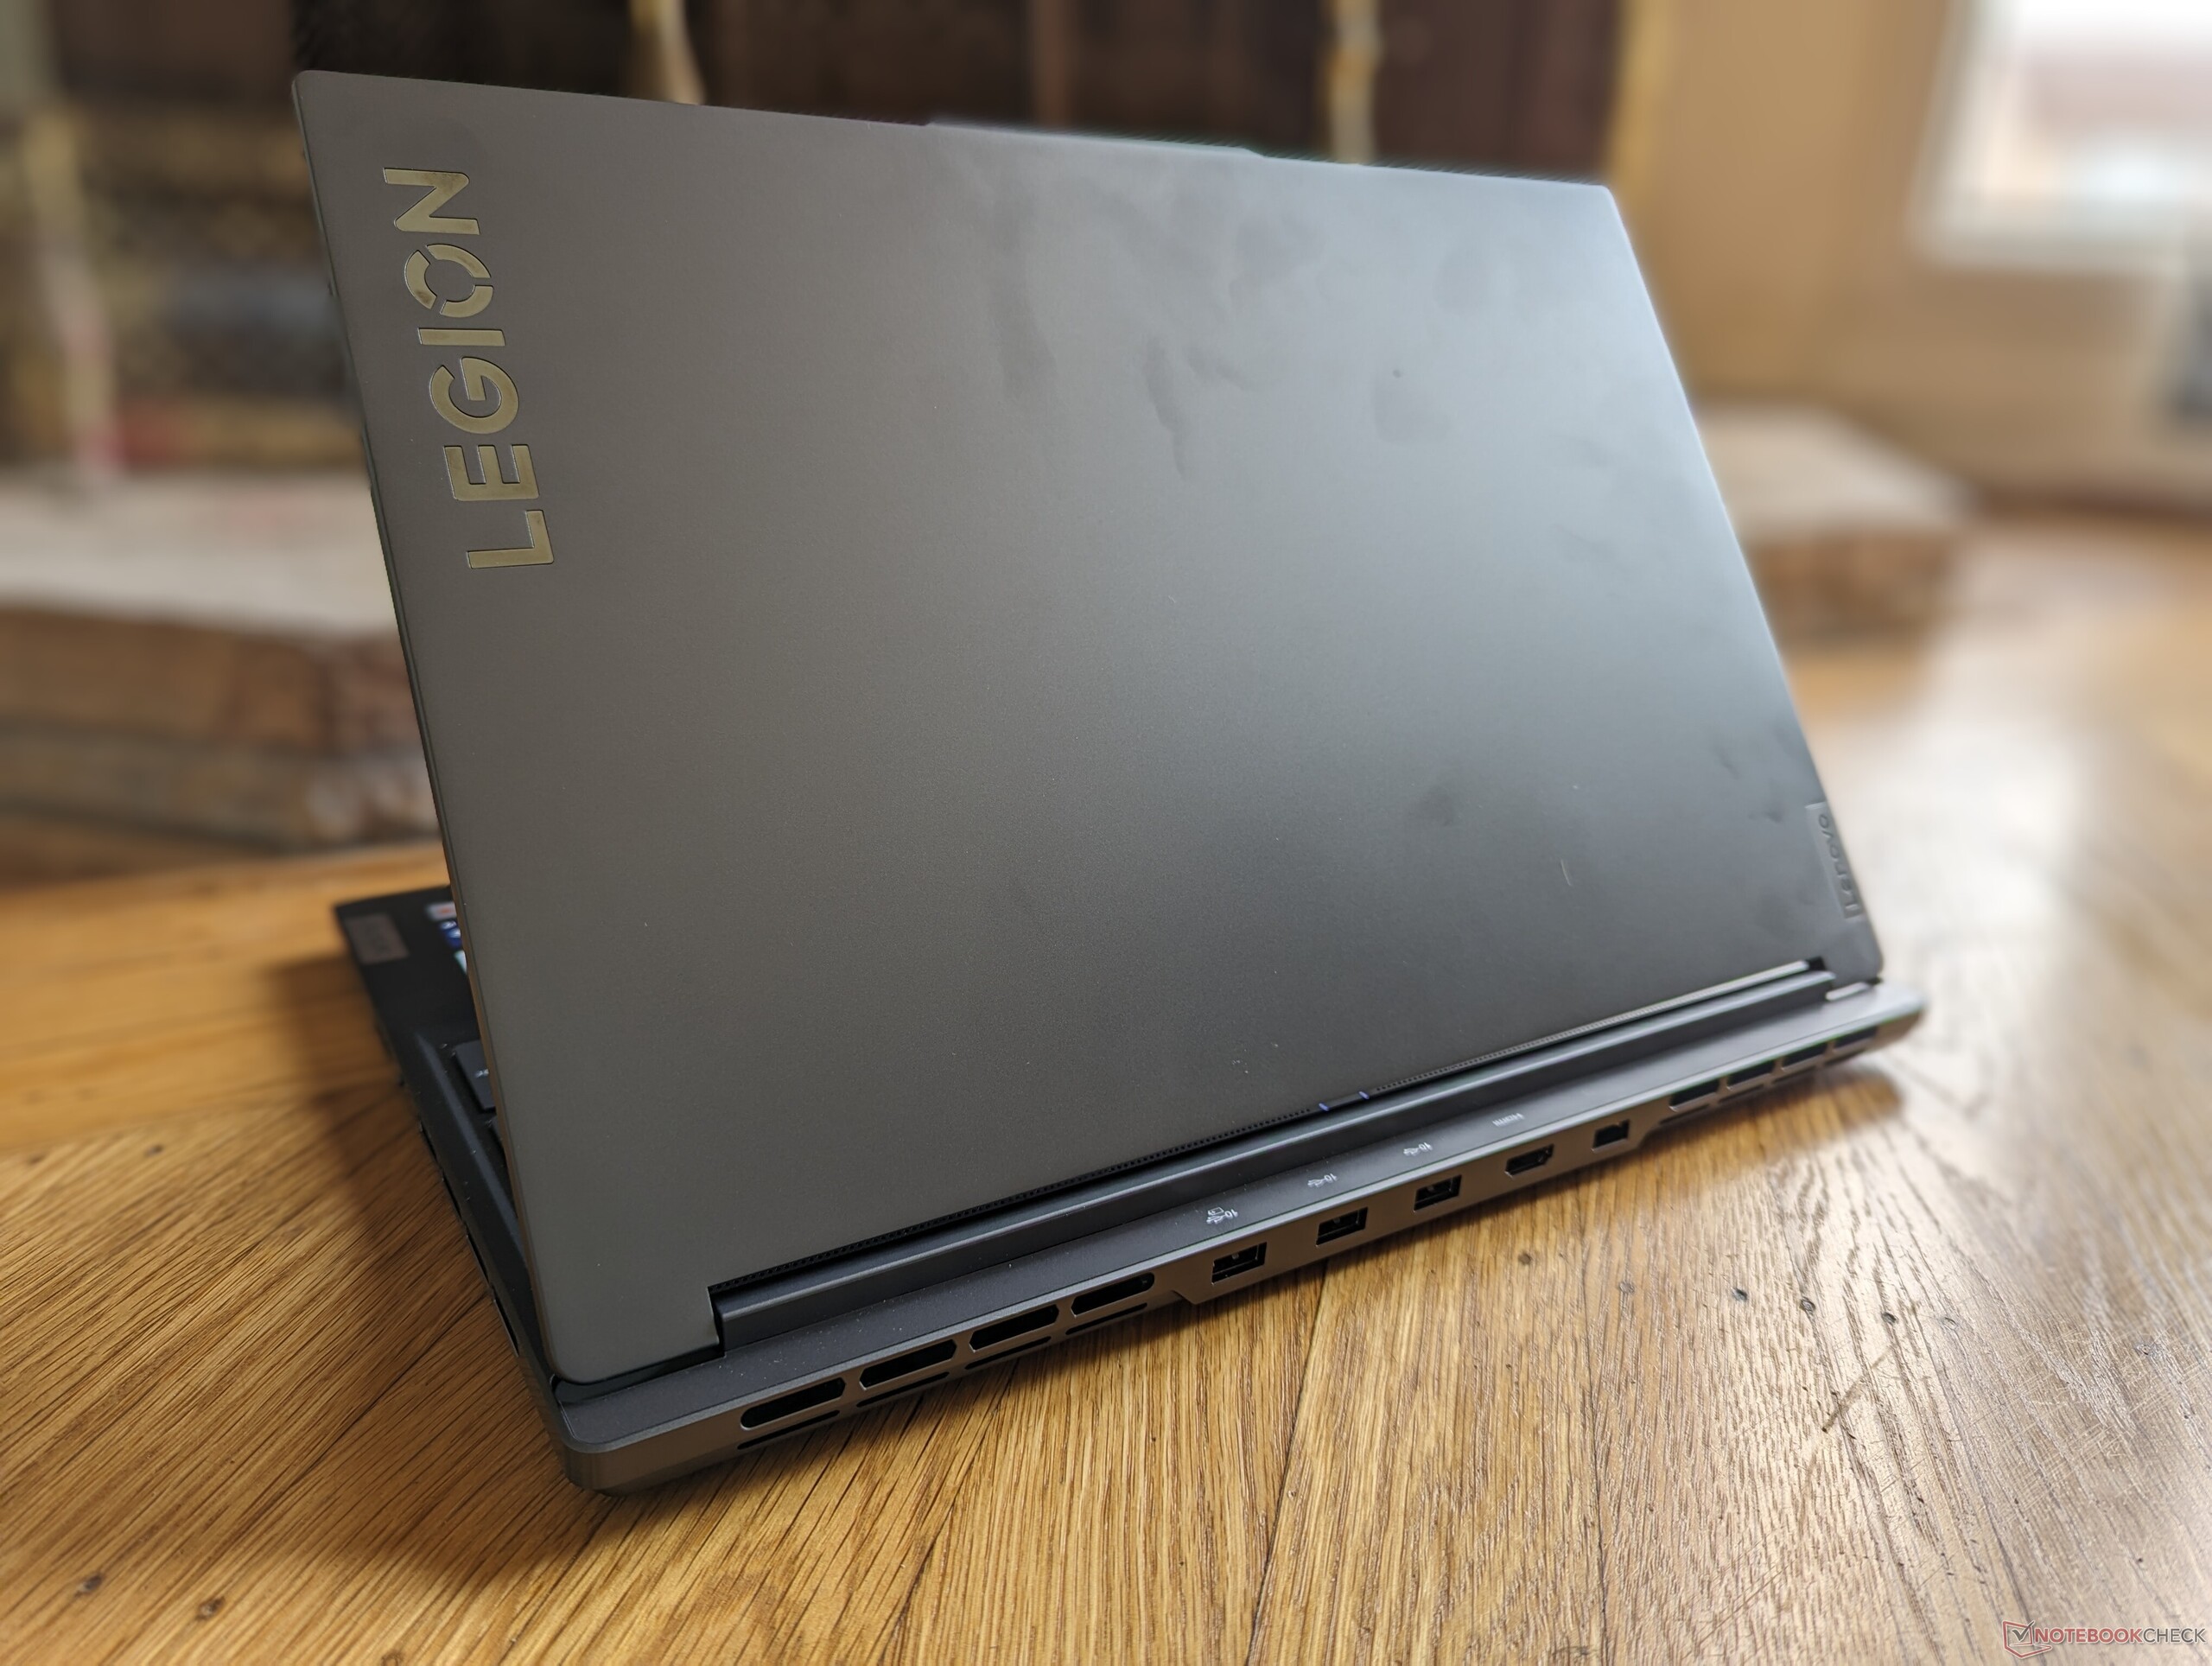
Lenovo ne l'appelle pas Legion Slim 7 pour rien. Par rapport au Legion Pro 7, notre version Slim est nettement plus légère (600 g) et nettement plus fine (plus de 6 mm). En fait, le Legion Slim 7 est l'un des ordinateurs portables de jeu de 16 pouces les plus fins et les plus légers disponibles sur le marché, juste derrière le modèle légèrement plus fin et plus léger MSI GS66.
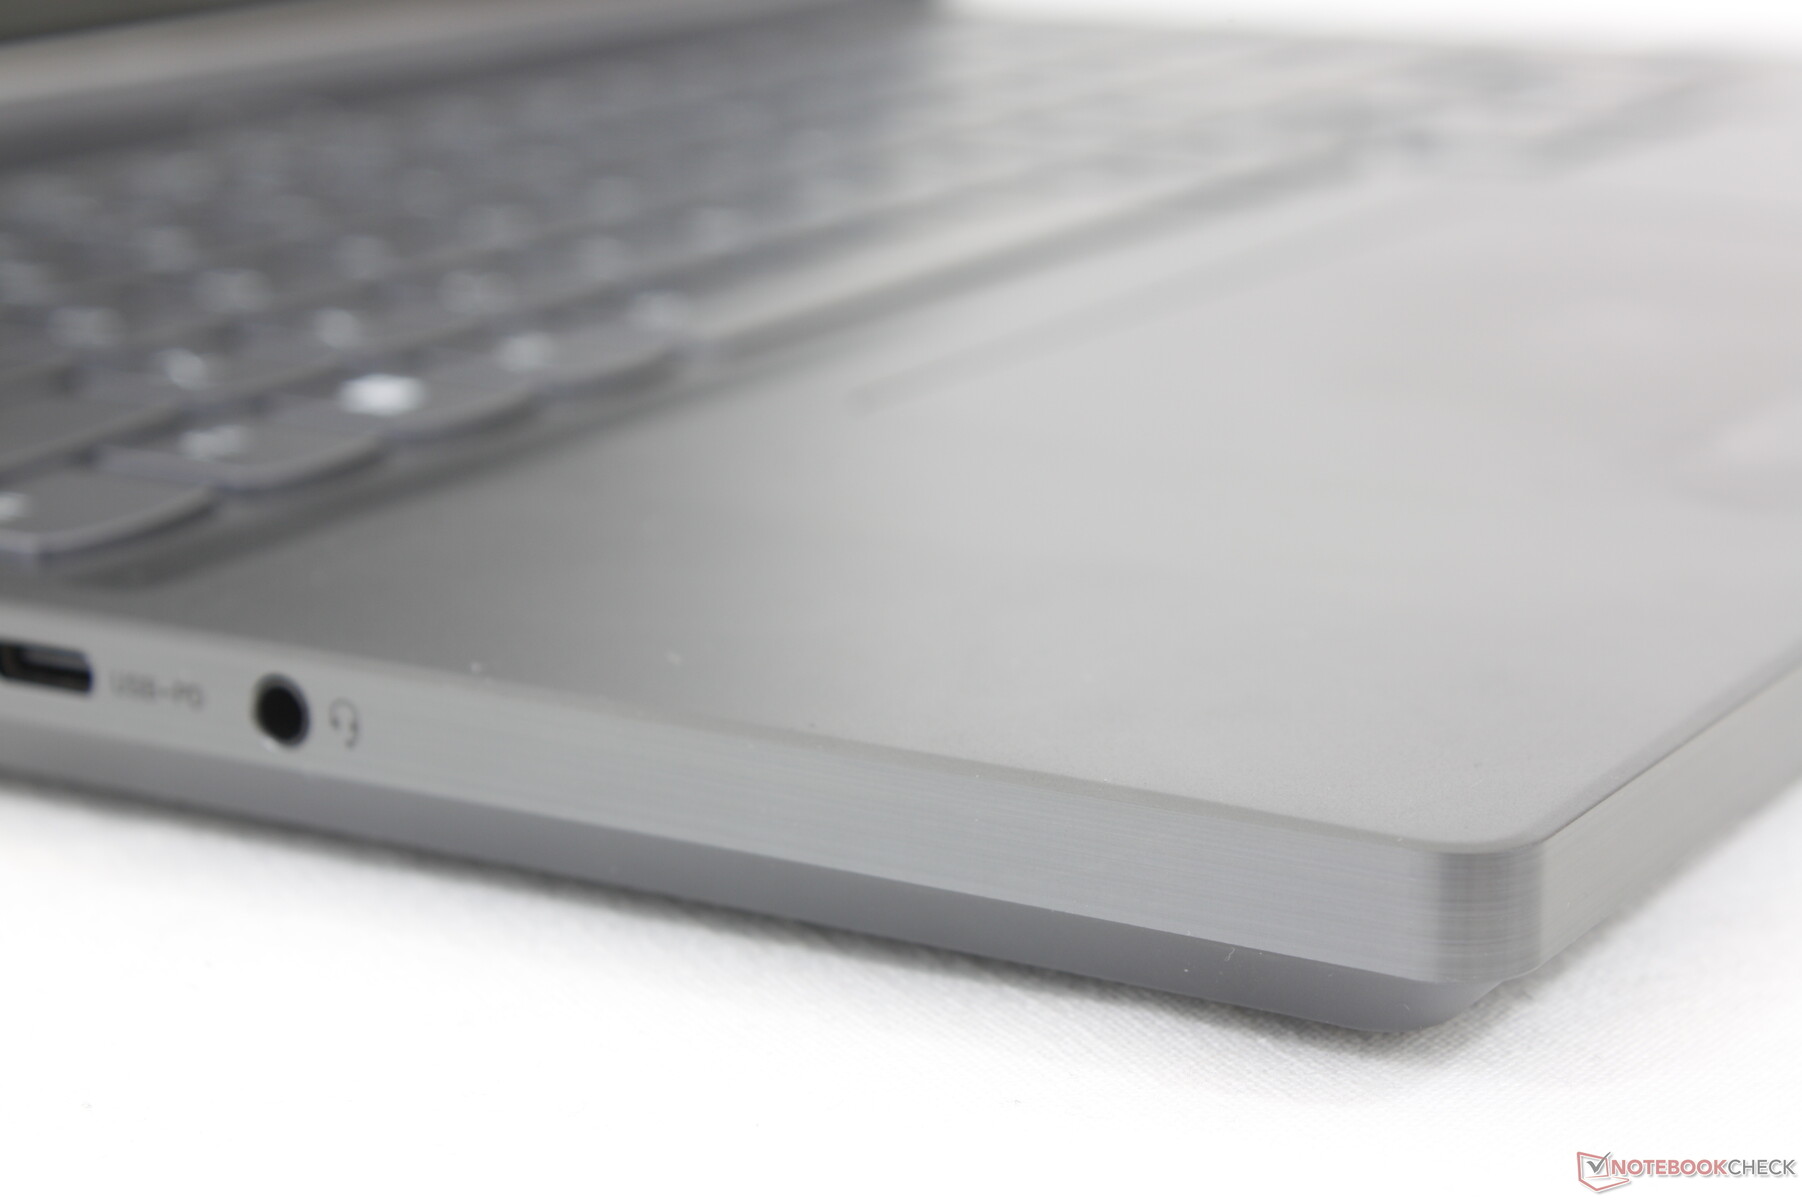
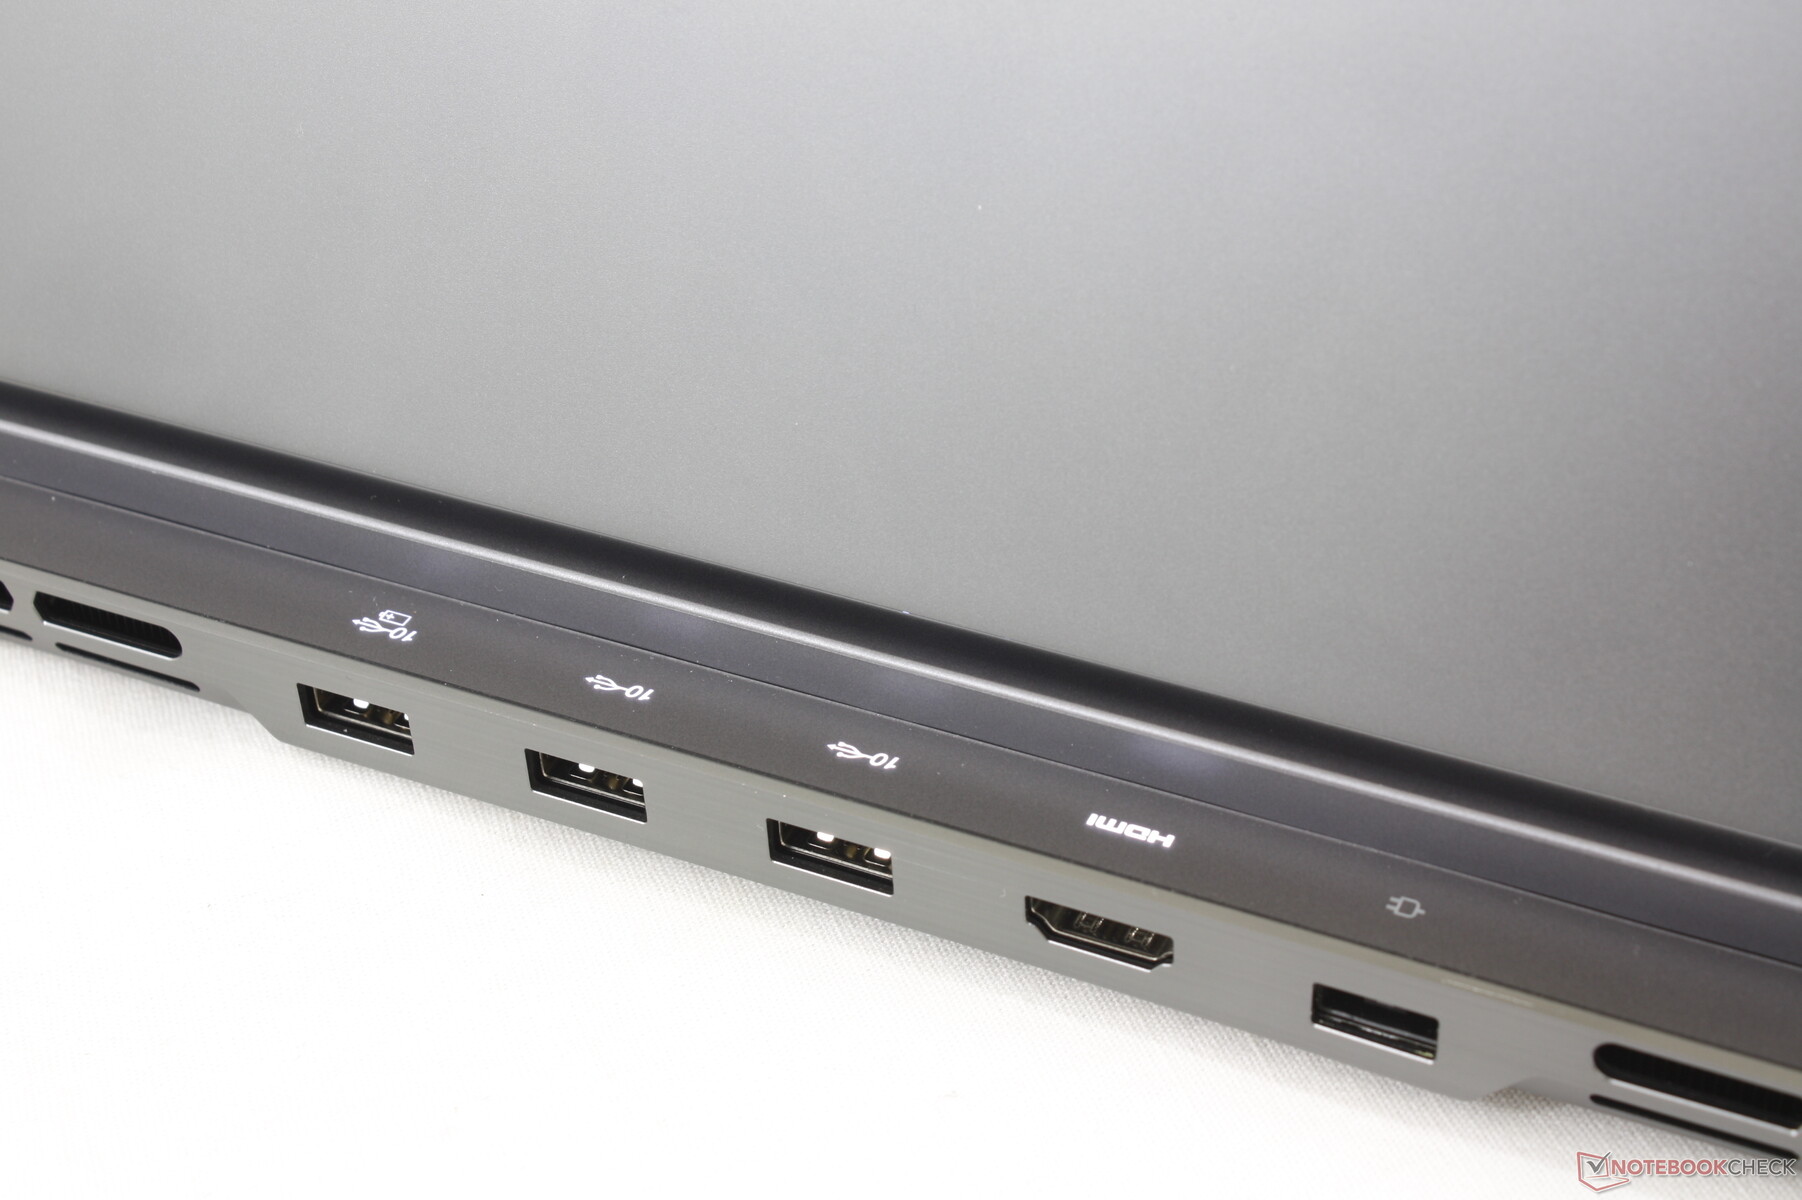
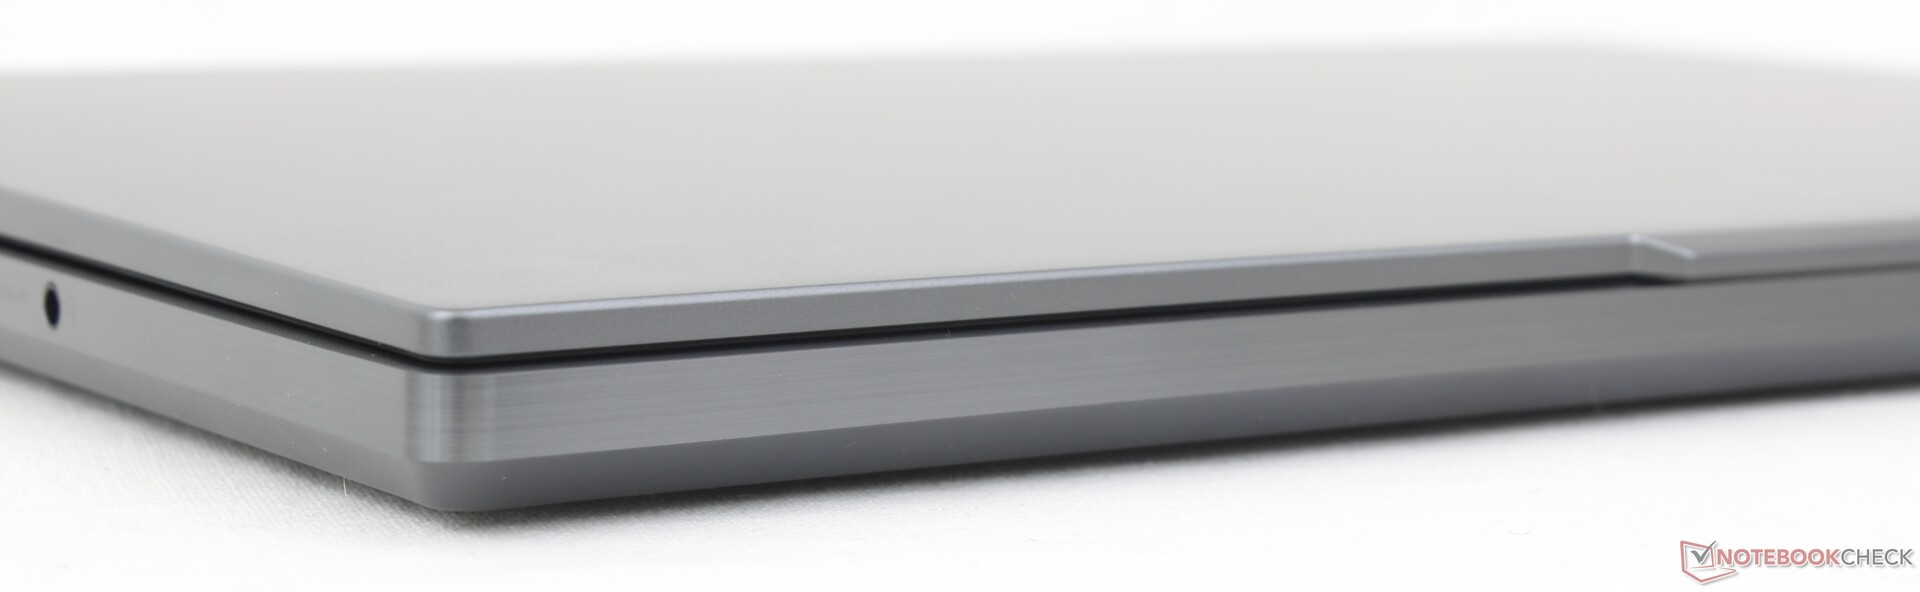
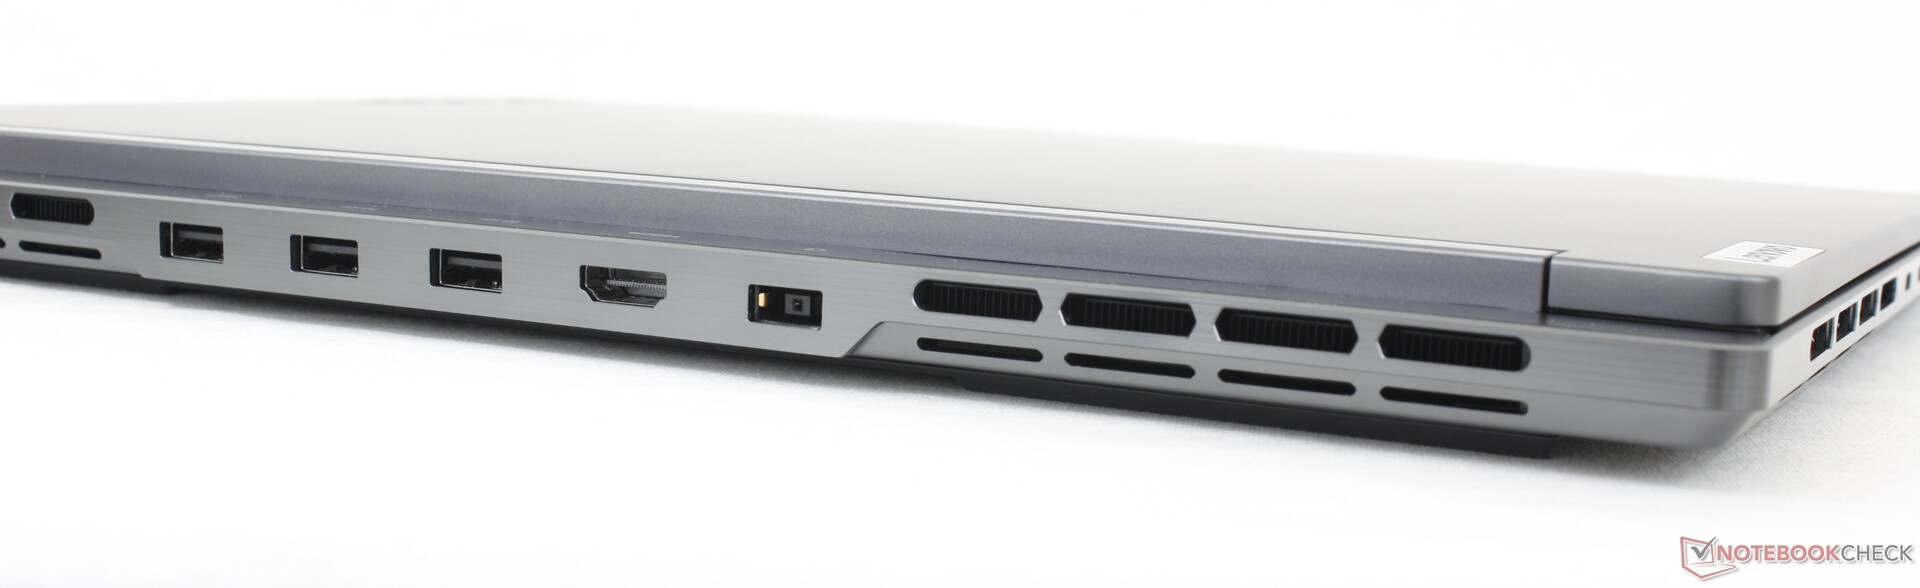
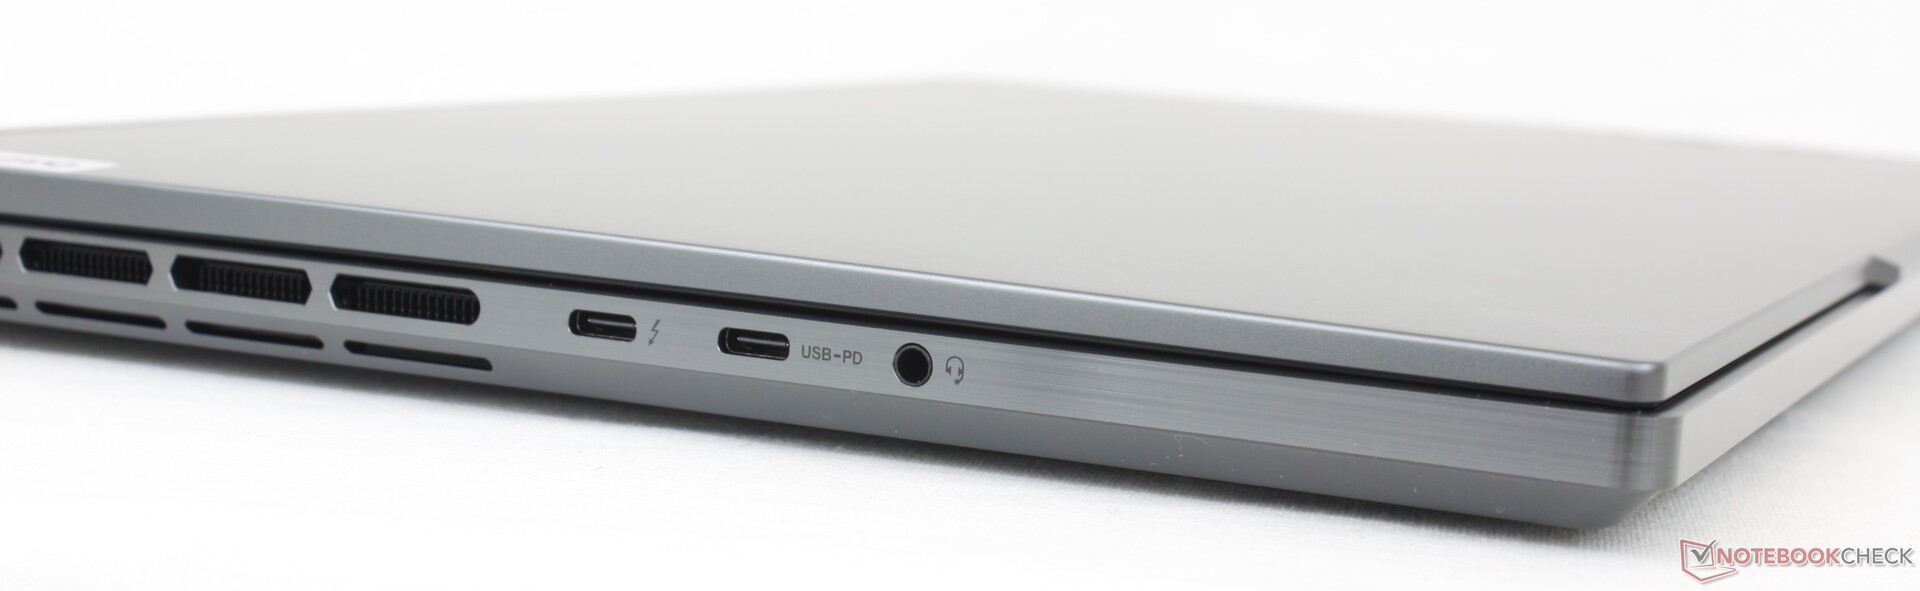
Connectivité - Prise en charge de Thunderbolt 4
Les options de ports sont variées, la plupart se trouvant le long du bord arrière, comme sur la série Alienware. Contrairement à l'Alienware, cependant, les deux ports USB-C de notre Lenovo se trouvent sur le bord gauche pour un accès plus facile.
Notez que seul l'un des deux ports USB-C prend en charge le Thunderbolt 4. Si certains accessoires ne fonctionnent pas sur l'un des ports, il faut donc s'assurer d'essayer l'autre. Notre moniteur externe Lepow, par exemple, fonctionne sur le port USB-C 3.2 mais pas sur le port USB-C Thunderbolt.
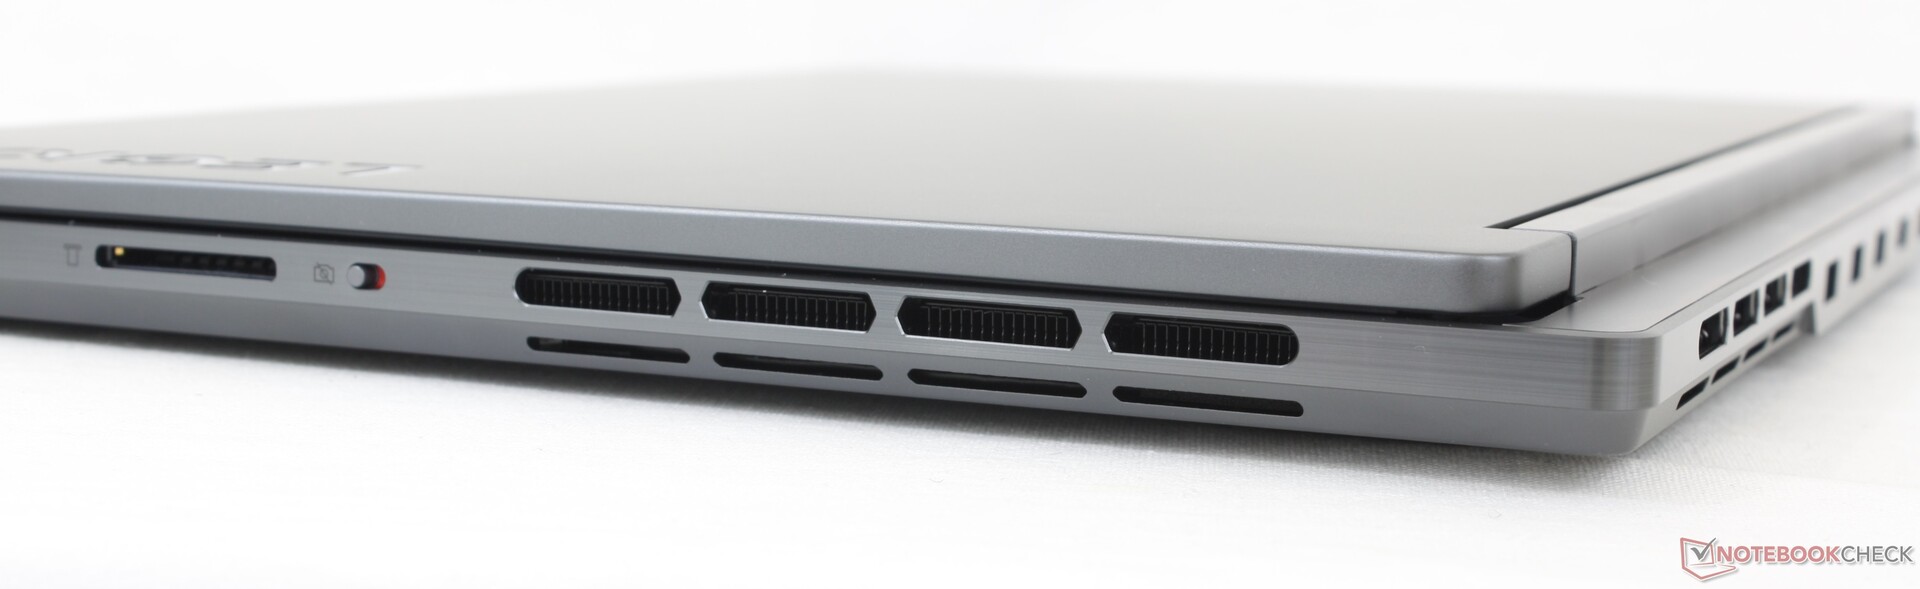
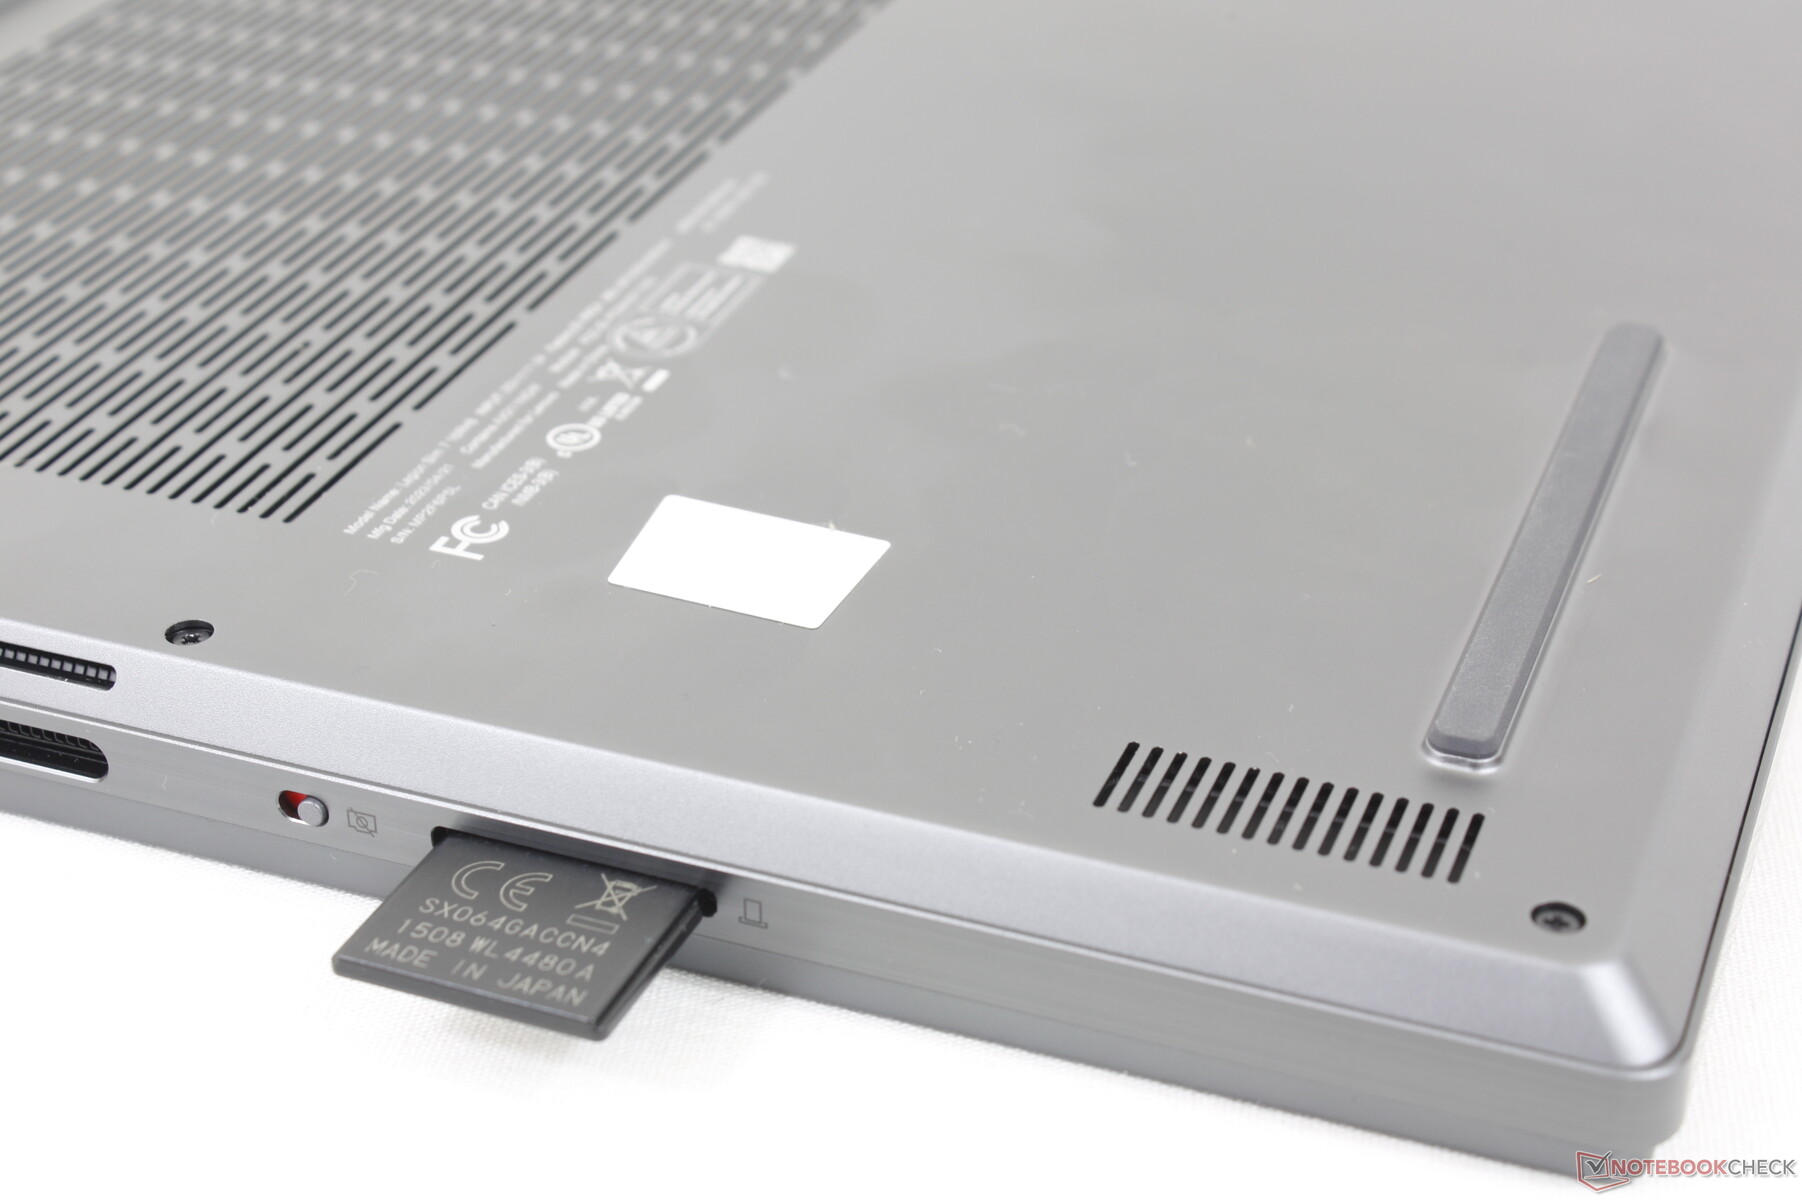
Lecteur de carte SD
Les taux de transfert via le lecteur de carte SD sont en moyenne d'environ 80 Mo/s avec notre carte de test UHS-II, soit environ la moitié de la vitesse du lecteur de carte de la Blade 16.
| SD Card Reader | |
| average JPG Copy Test (av. of 3 runs) | |
| Razer Blade 16 Early 2023 (AV PRO microSD 128 GB V60) | |
| Lenovo Legion Slim 7i 16 Gen 8 (Toshiba Exceria Pro SDXC 64 GB UHS-II) | |
| Alienware x16 R1 (AV PRO microSD 128 GB V60) | |
| maximum AS SSD Seq Read Test (1GB) | |
| Alienware x16 R1 (AV PRO microSD 128 GB V60) | |
| Razer Blade 16 Early 2023 (AV PRO microSD 128 GB V60) | |
| Lenovo Legion Slim 7i 16 Gen 8 (Toshiba Exceria Pro SDXC 64 GB UHS-II) | |
Communication
Un Intel AX211 est fourni en standard pour la connectivité Wi-Fi 6E et Bluetooth 5.3. Les performances sont régulières et fiables lorsqu'elles sont associées à notre réseau Asus AXE11000 de 6 GHz.
| Networking | |
| iperf3 transmit AXE11000 | |
| Lenovo Legion Pro 7 RTX4090 | |
| Asus ROG Strix G16 G614JZ | |
| Razer Blade 16 Early 2023 | |
| Lenovo Legion Slim 7i 16 Gen 8 | |
| HP Omen 16-wf000 | |
| Alienware x16 R1 | |
| iperf3 receive AXE11000 | |
| Lenovo Legion Pro 7 RTX4090 | |
| Asus ROG Strix G16 G614JZ | |
| Razer Blade 16 Early 2023 | |
| Alienware x16 R1 | |
| HP Omen 16-wf000 | |
| Lenovo Legion Slim 7i 16 Gen 8 | |
| iperf3 transmit AXE11000 6GHz | |
| Lenovo Legion Slim 7i 16 Gen 8 | |
| Razer Blade 16 Early 2023 | |
| HP Omen 16-wf000 | |
| Alienware x16 R1 | |
| iperf3 receive AXE11000 6GHz | |
| Lenovo Legion Slim 7i 16 Gen 8 | |
| Razer Blade 16 Early 2023 | |
| HP Omen 16-wf000 | |
| Alienware x16 R1 | |
Webcam
La webcam de 2 mégapixels reste la même que sur le modèle de l'année dernière. Il n'y a pas de prise en charge de l'infrarouge, mais un interrupteur de désactivation de la webcam est fourni en standard.


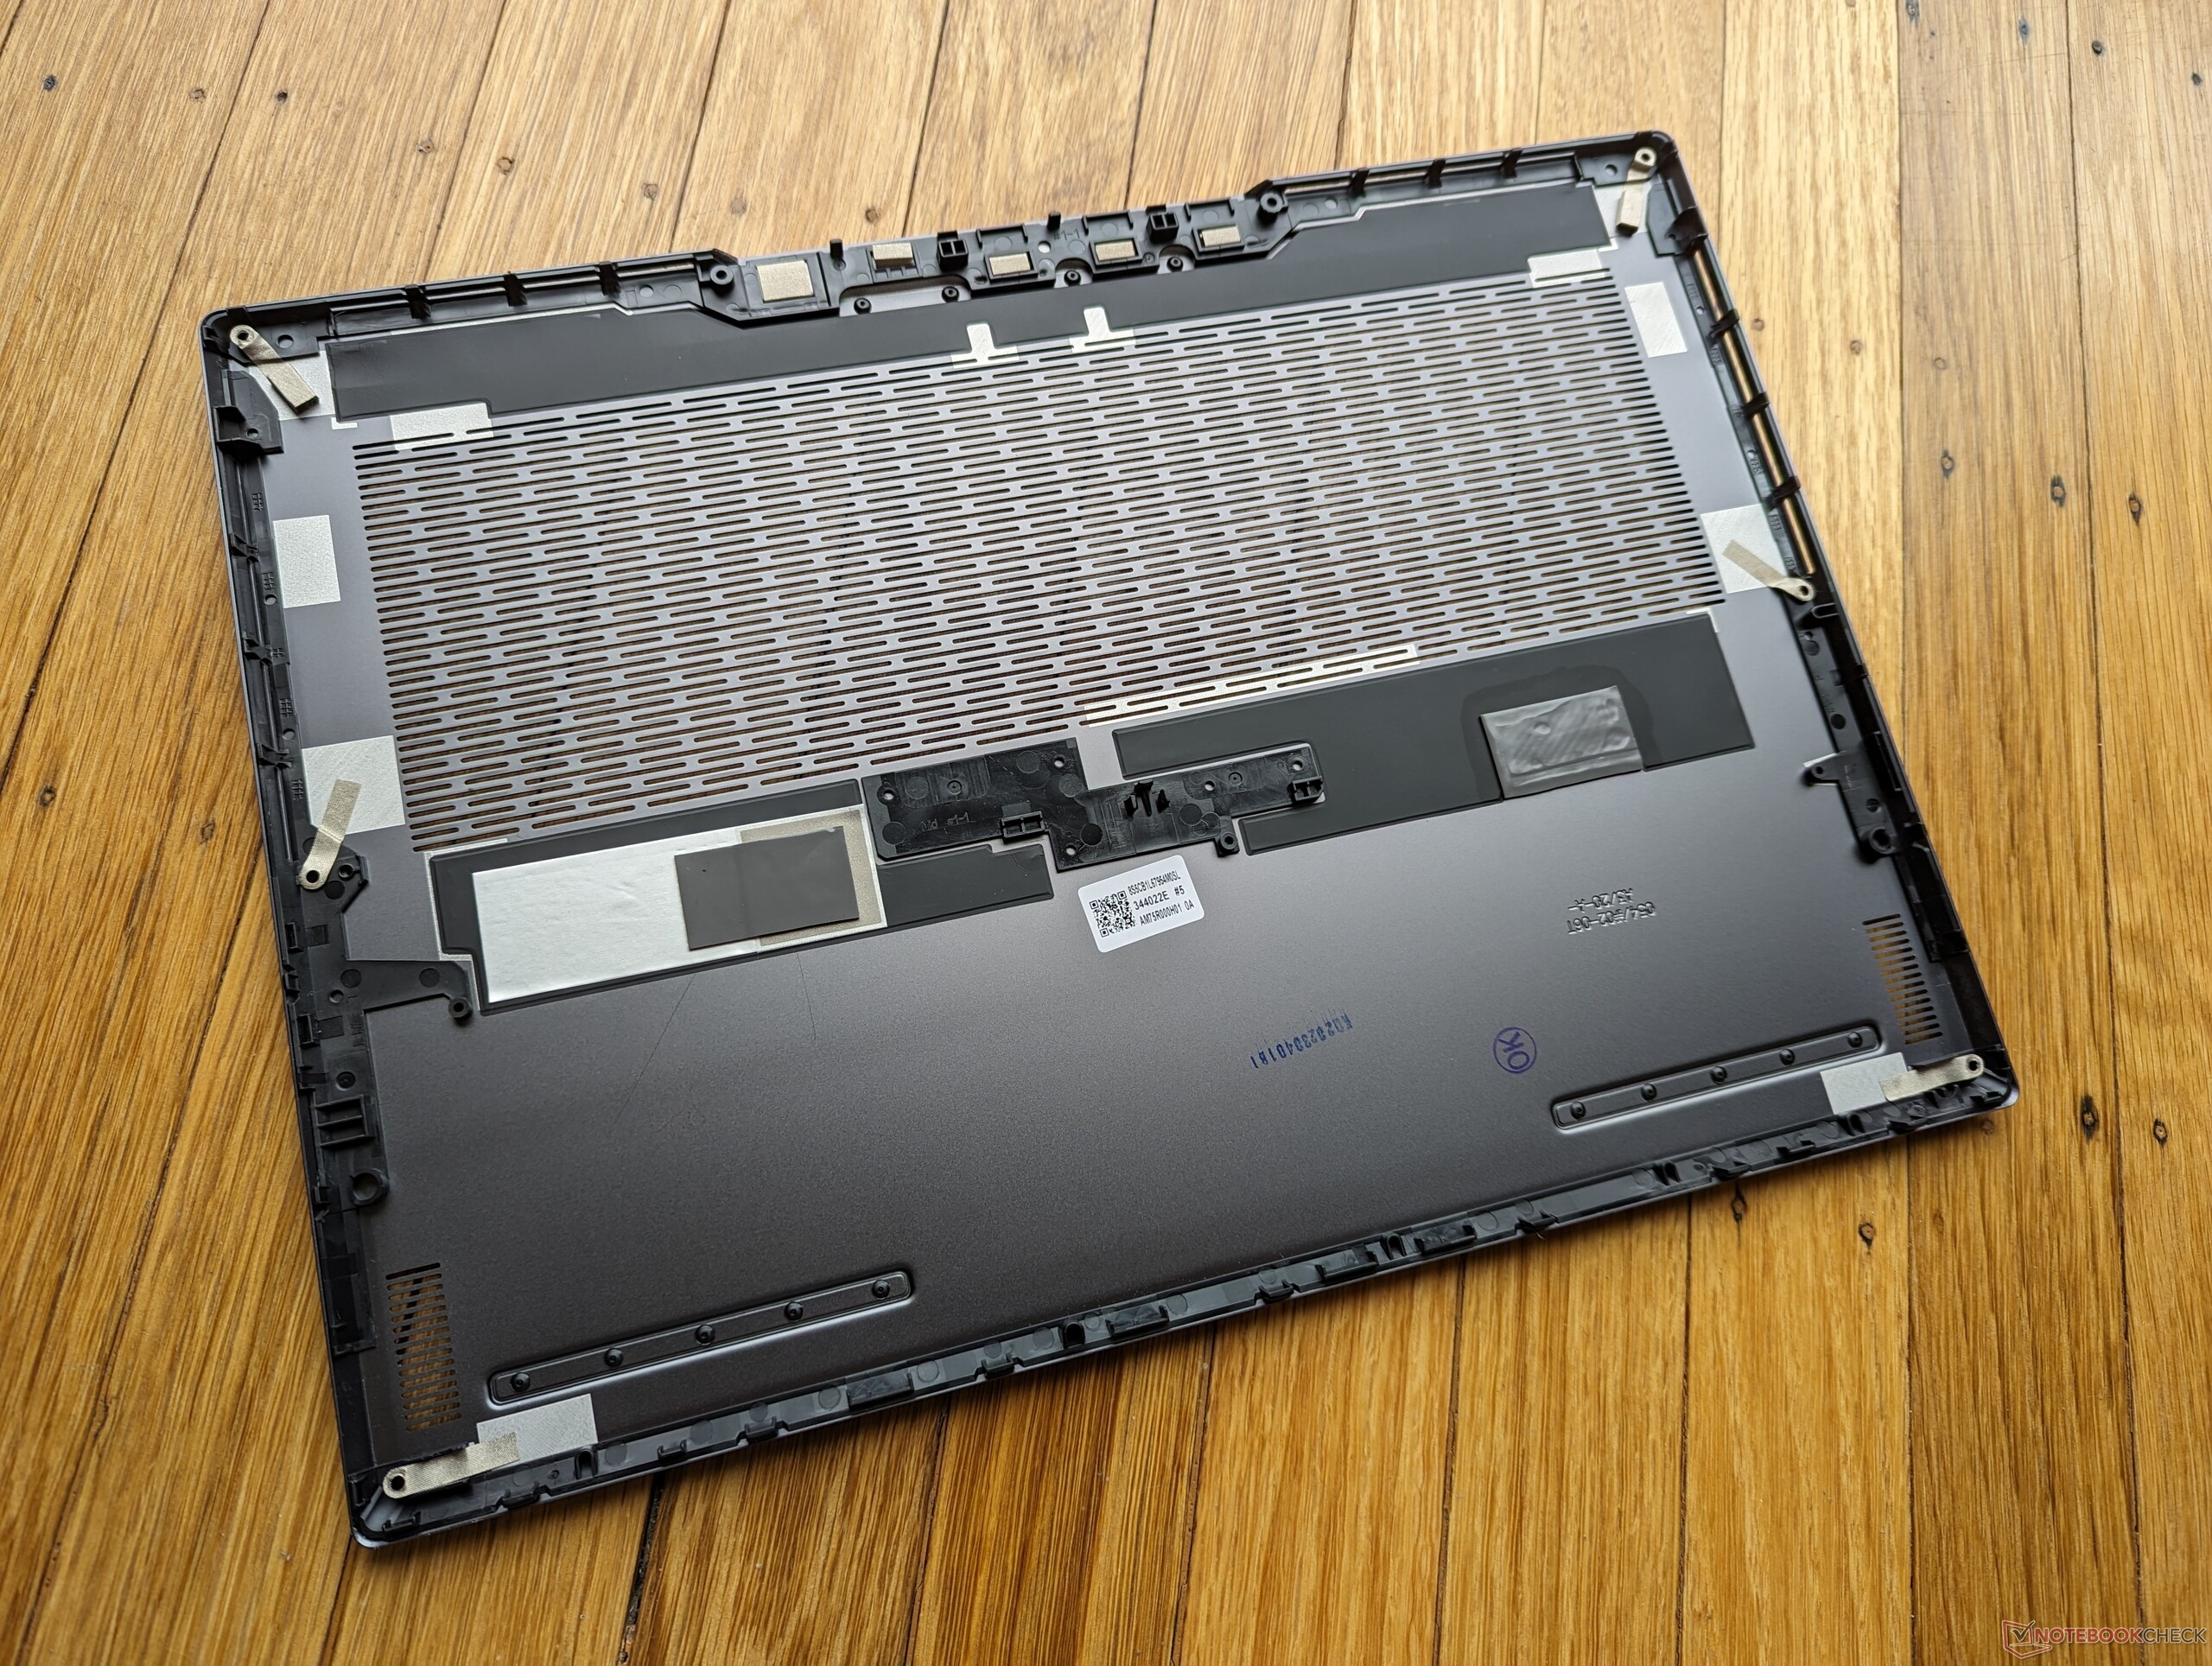
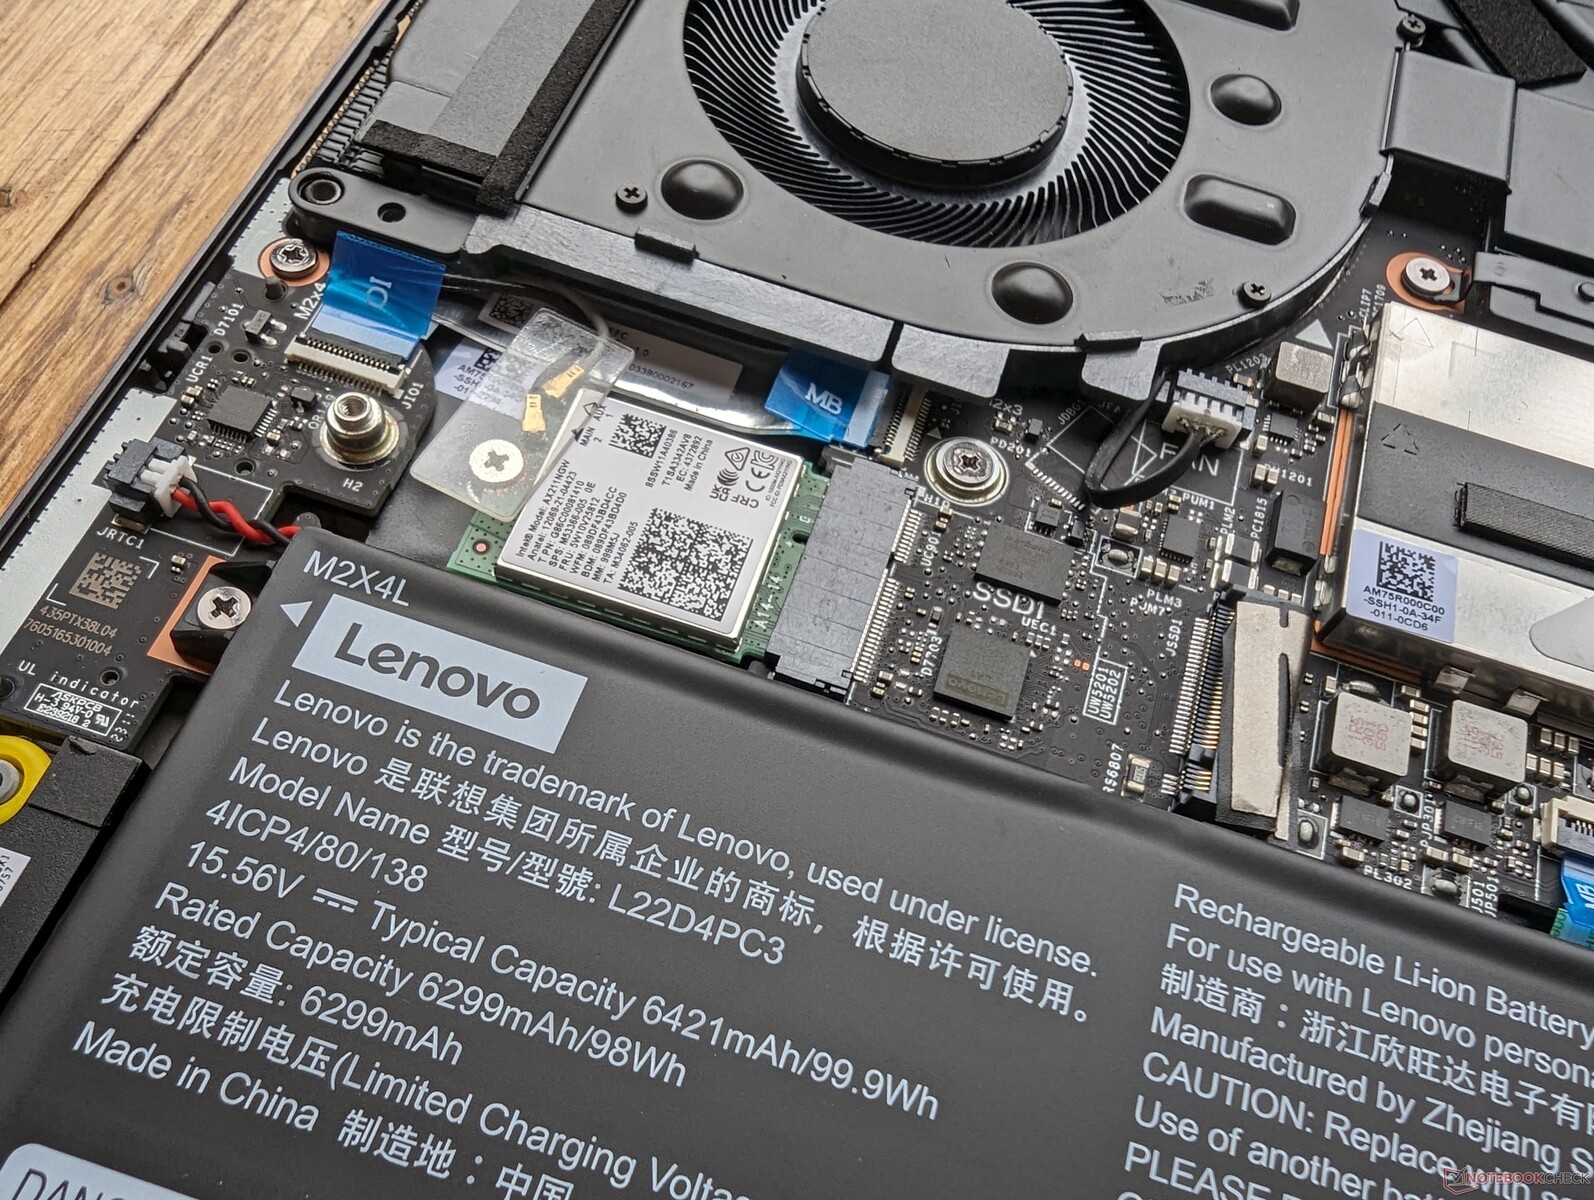
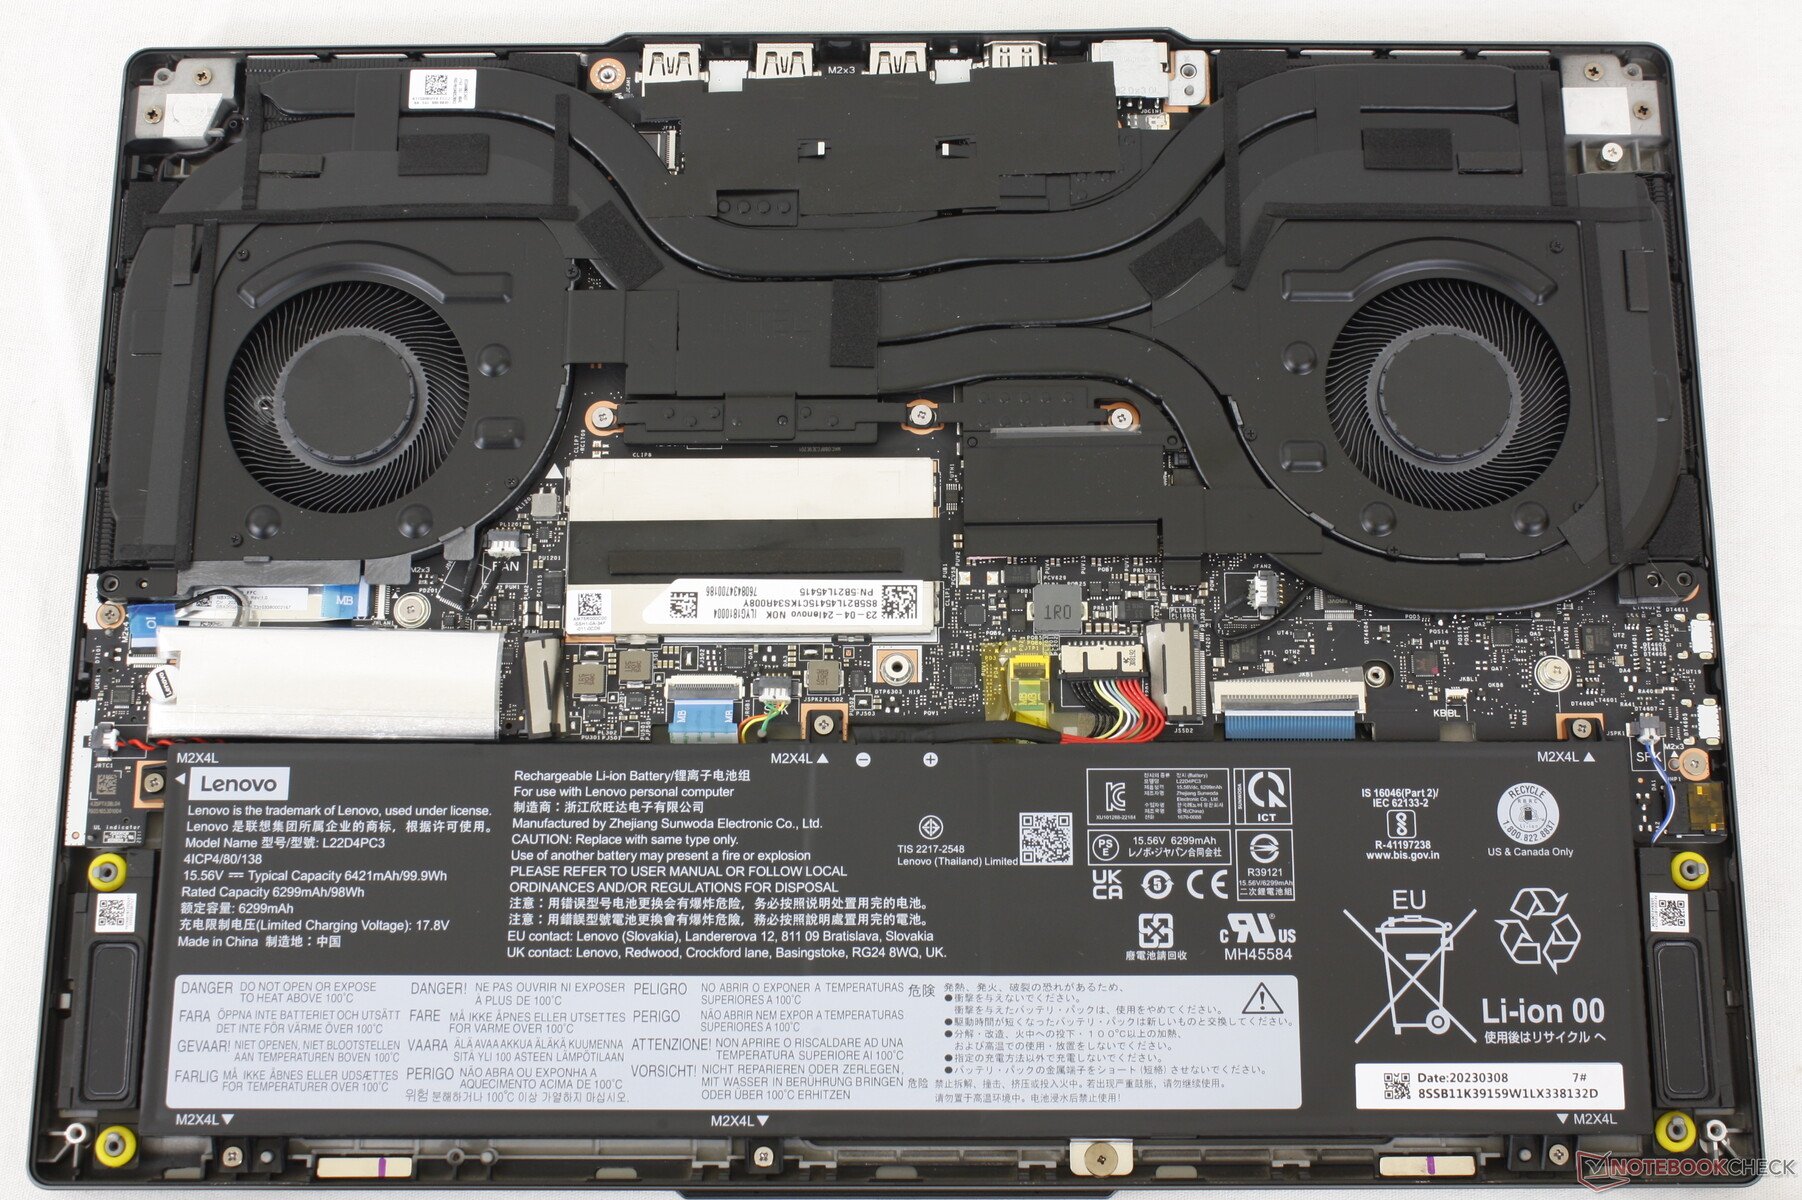
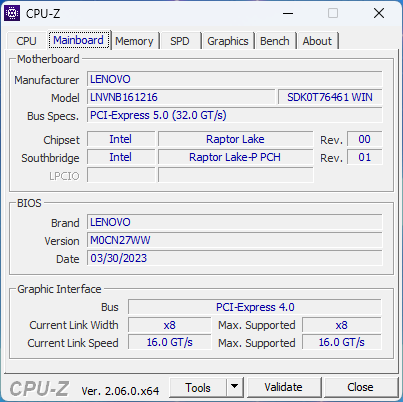
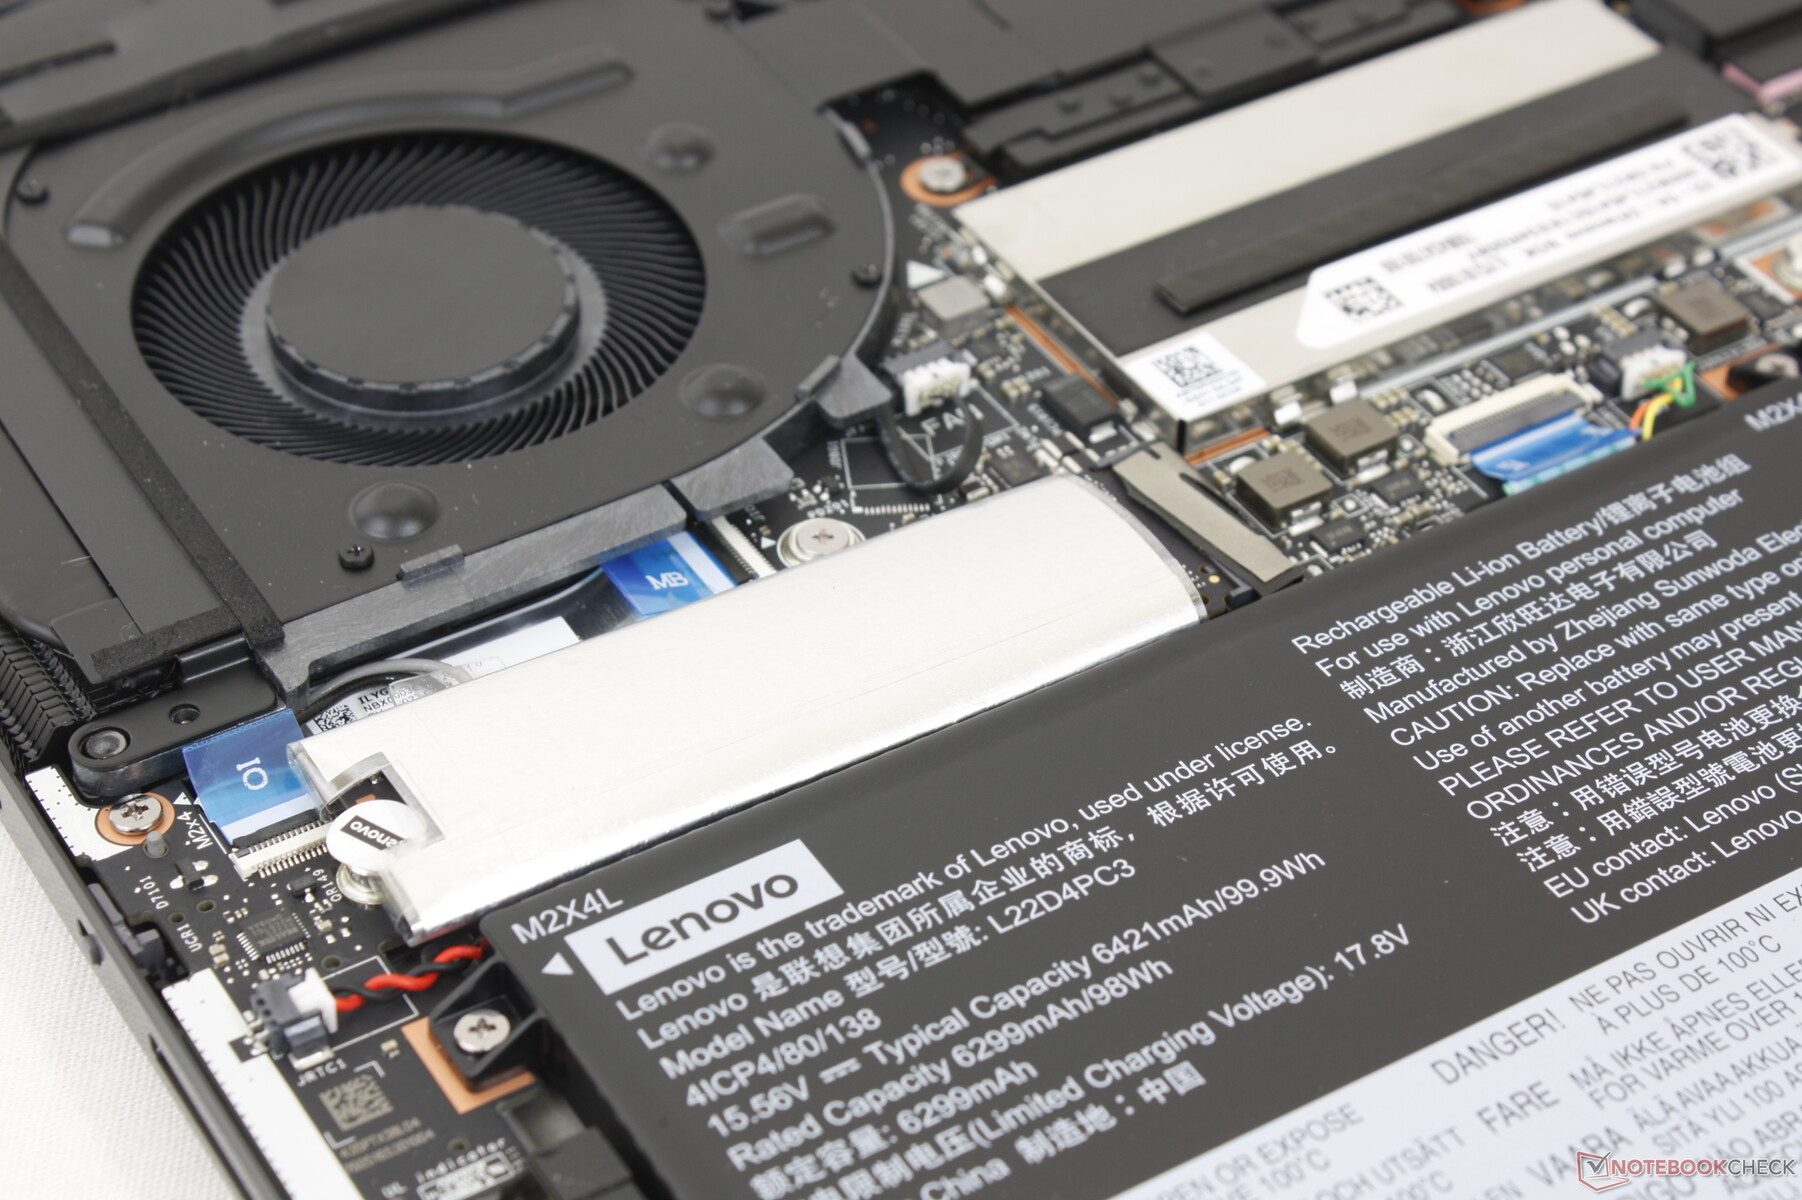
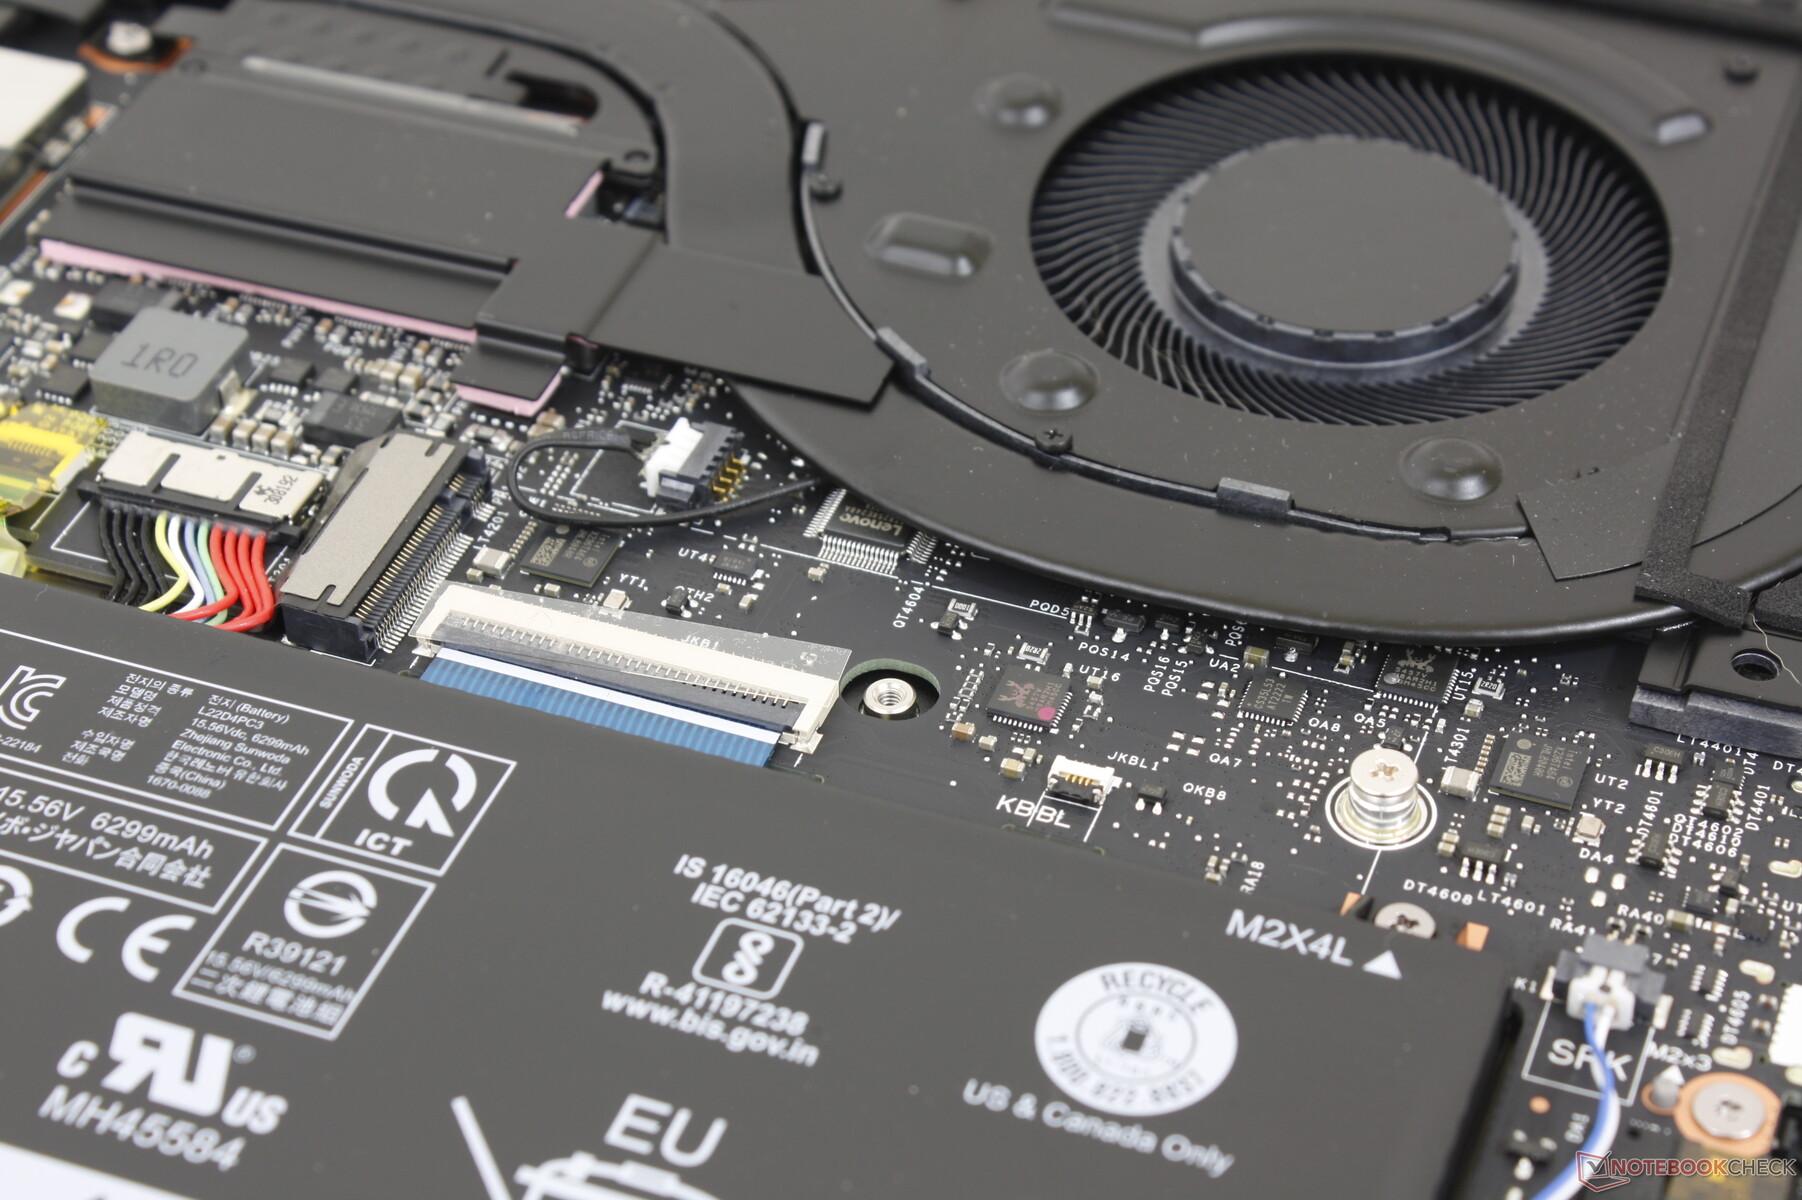
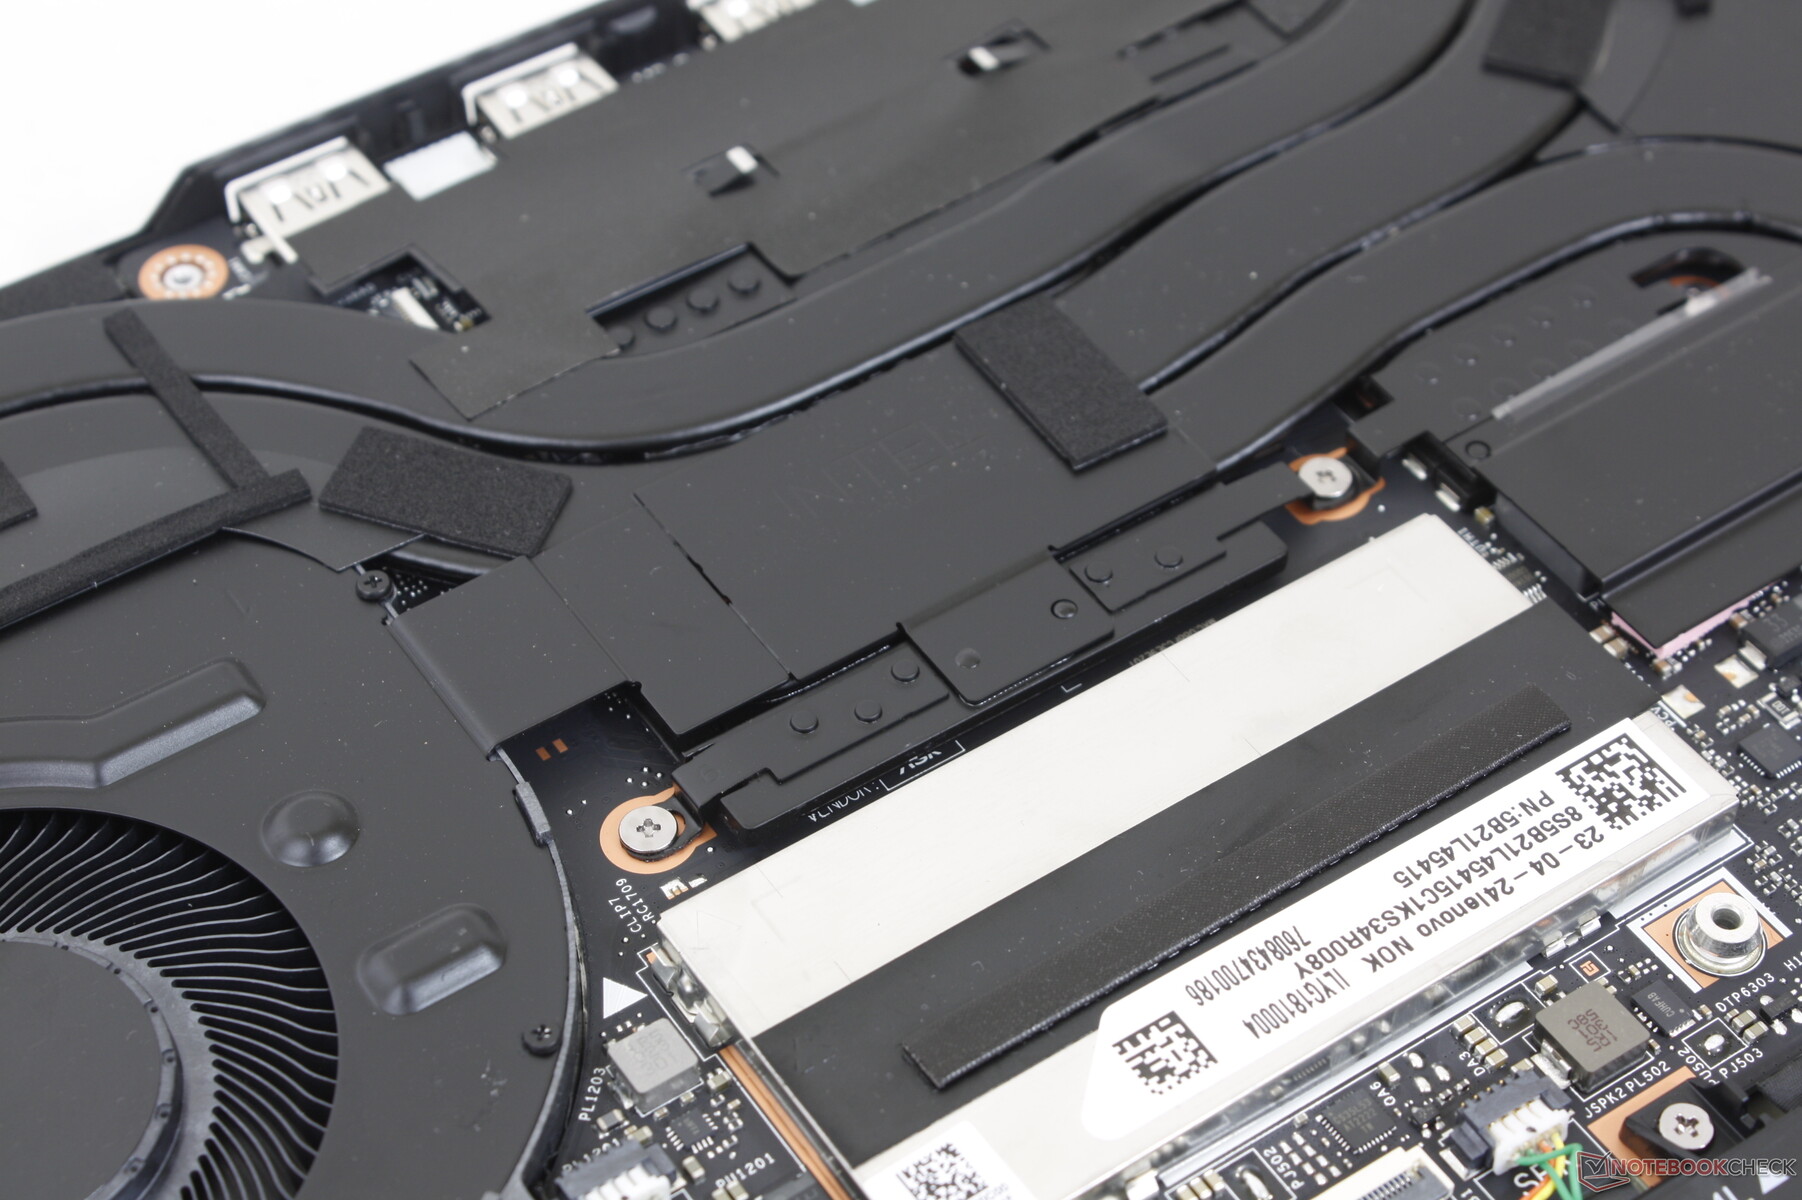
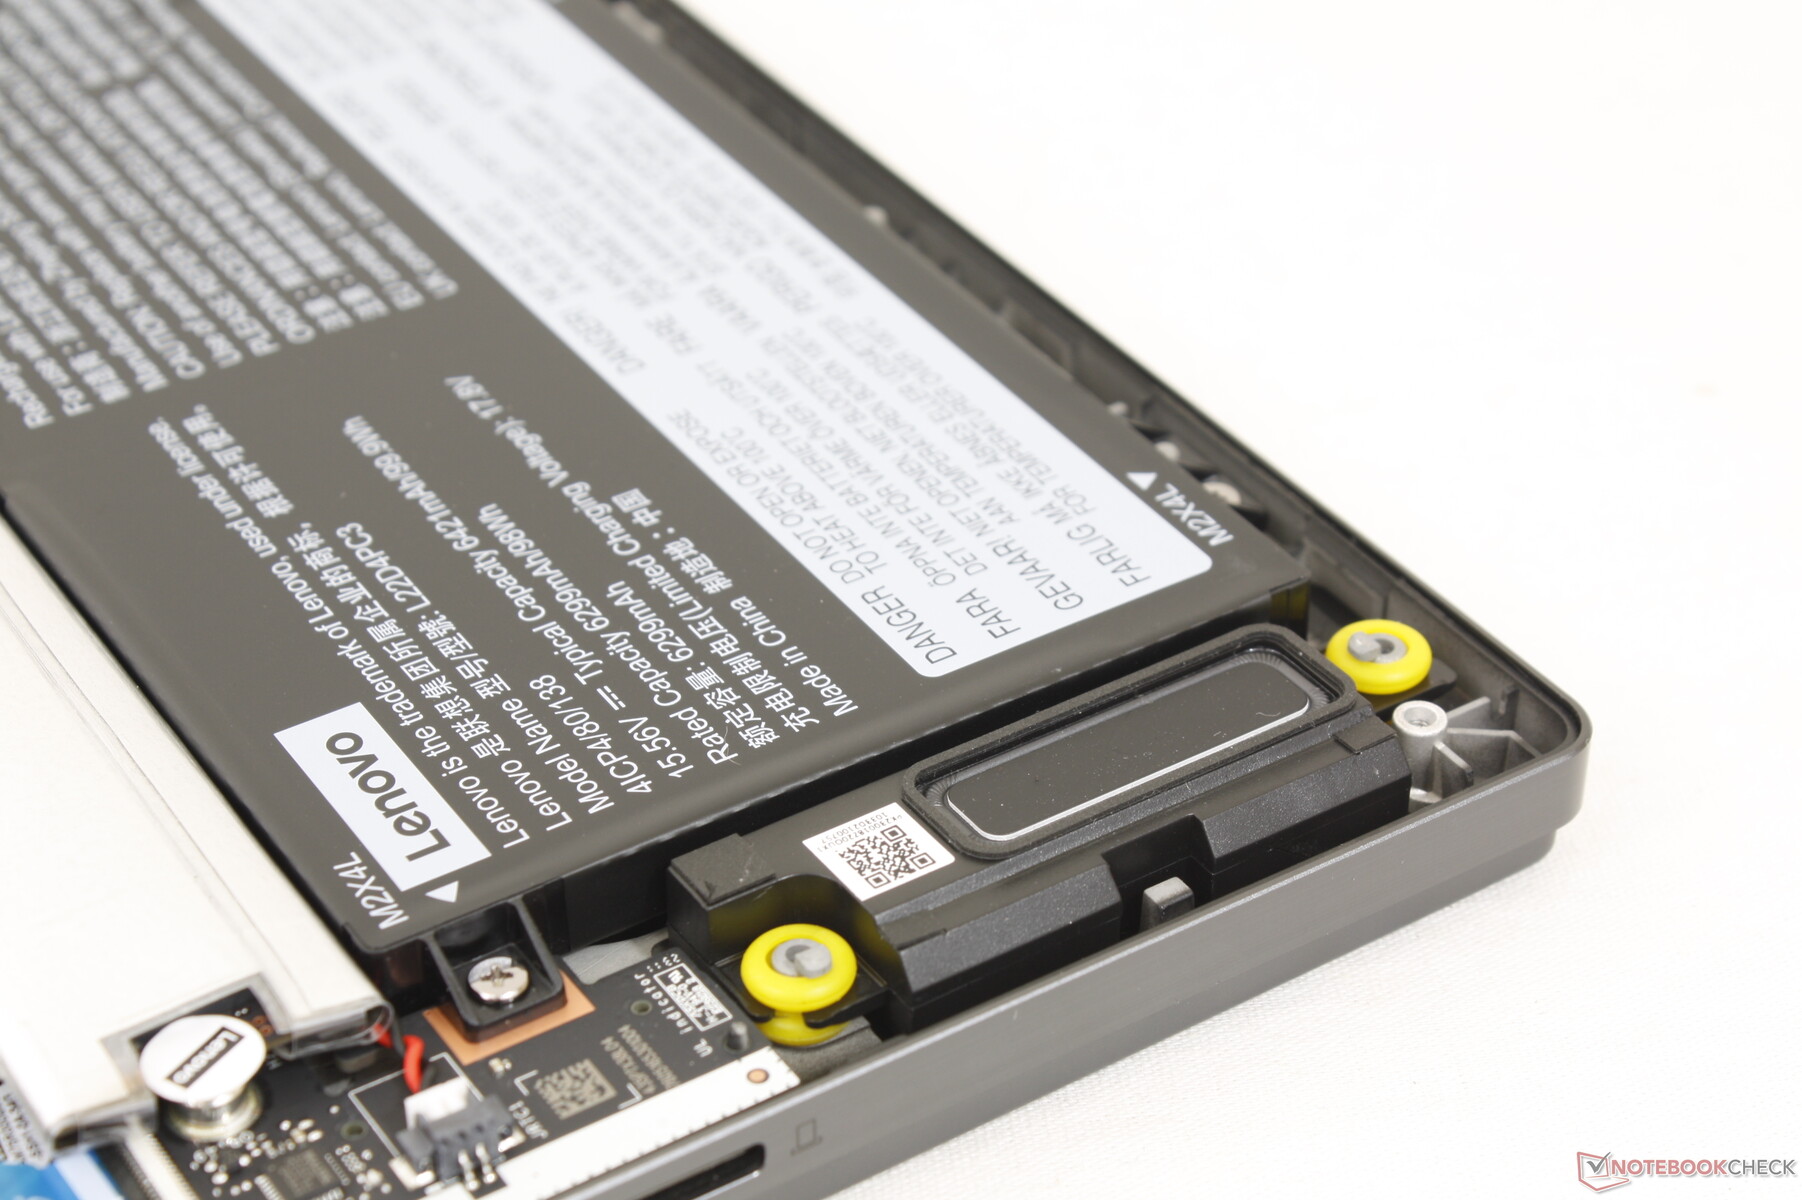
Maintenance
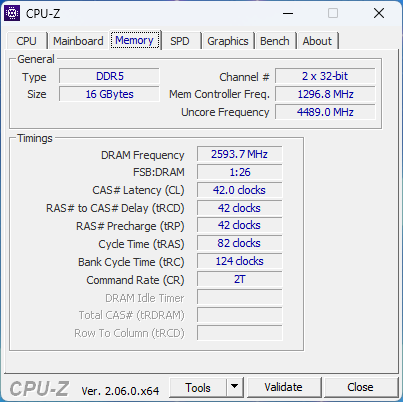
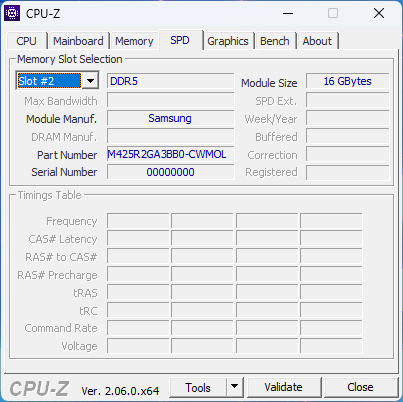
Le panneau inférieur est fixé par huit vis Phillips pour faciliter son retrait. Les propriétaires ont un accès direct aux deux emplacements M.2 2280 PCIe4, au module WLAN et à la batterie. La mémoire vive se compose de 16 Go de DDR5-5200 soudée et d'un emplacement SODIMM extensible situé sous le blindage en aluminium près du centre.
Accessoires et garantie
La boîte ne contient pas d'autres éléments que l'adaptateur secteur et la documentation. La garantie limitée standard d'un an du fabricant s'applique si l'appareil est acheté aux États-Unis.
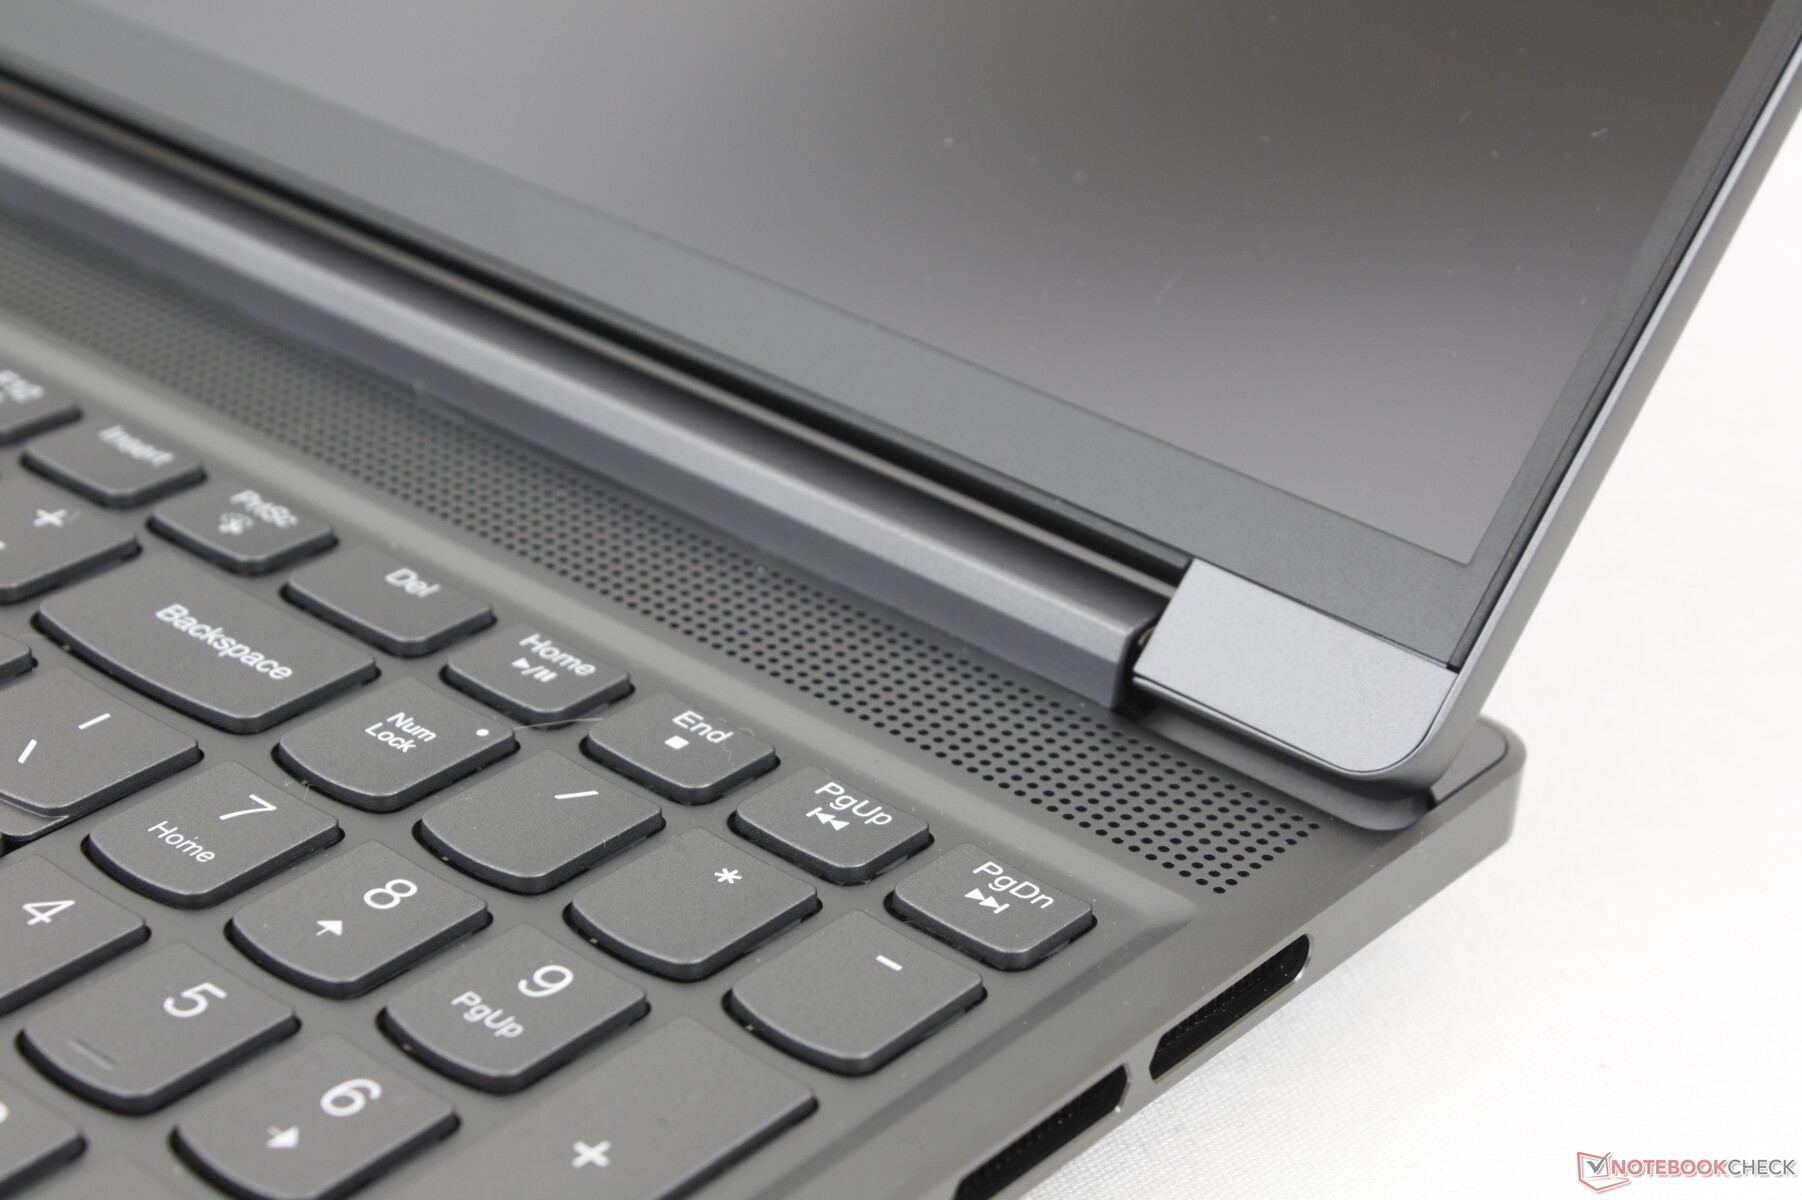
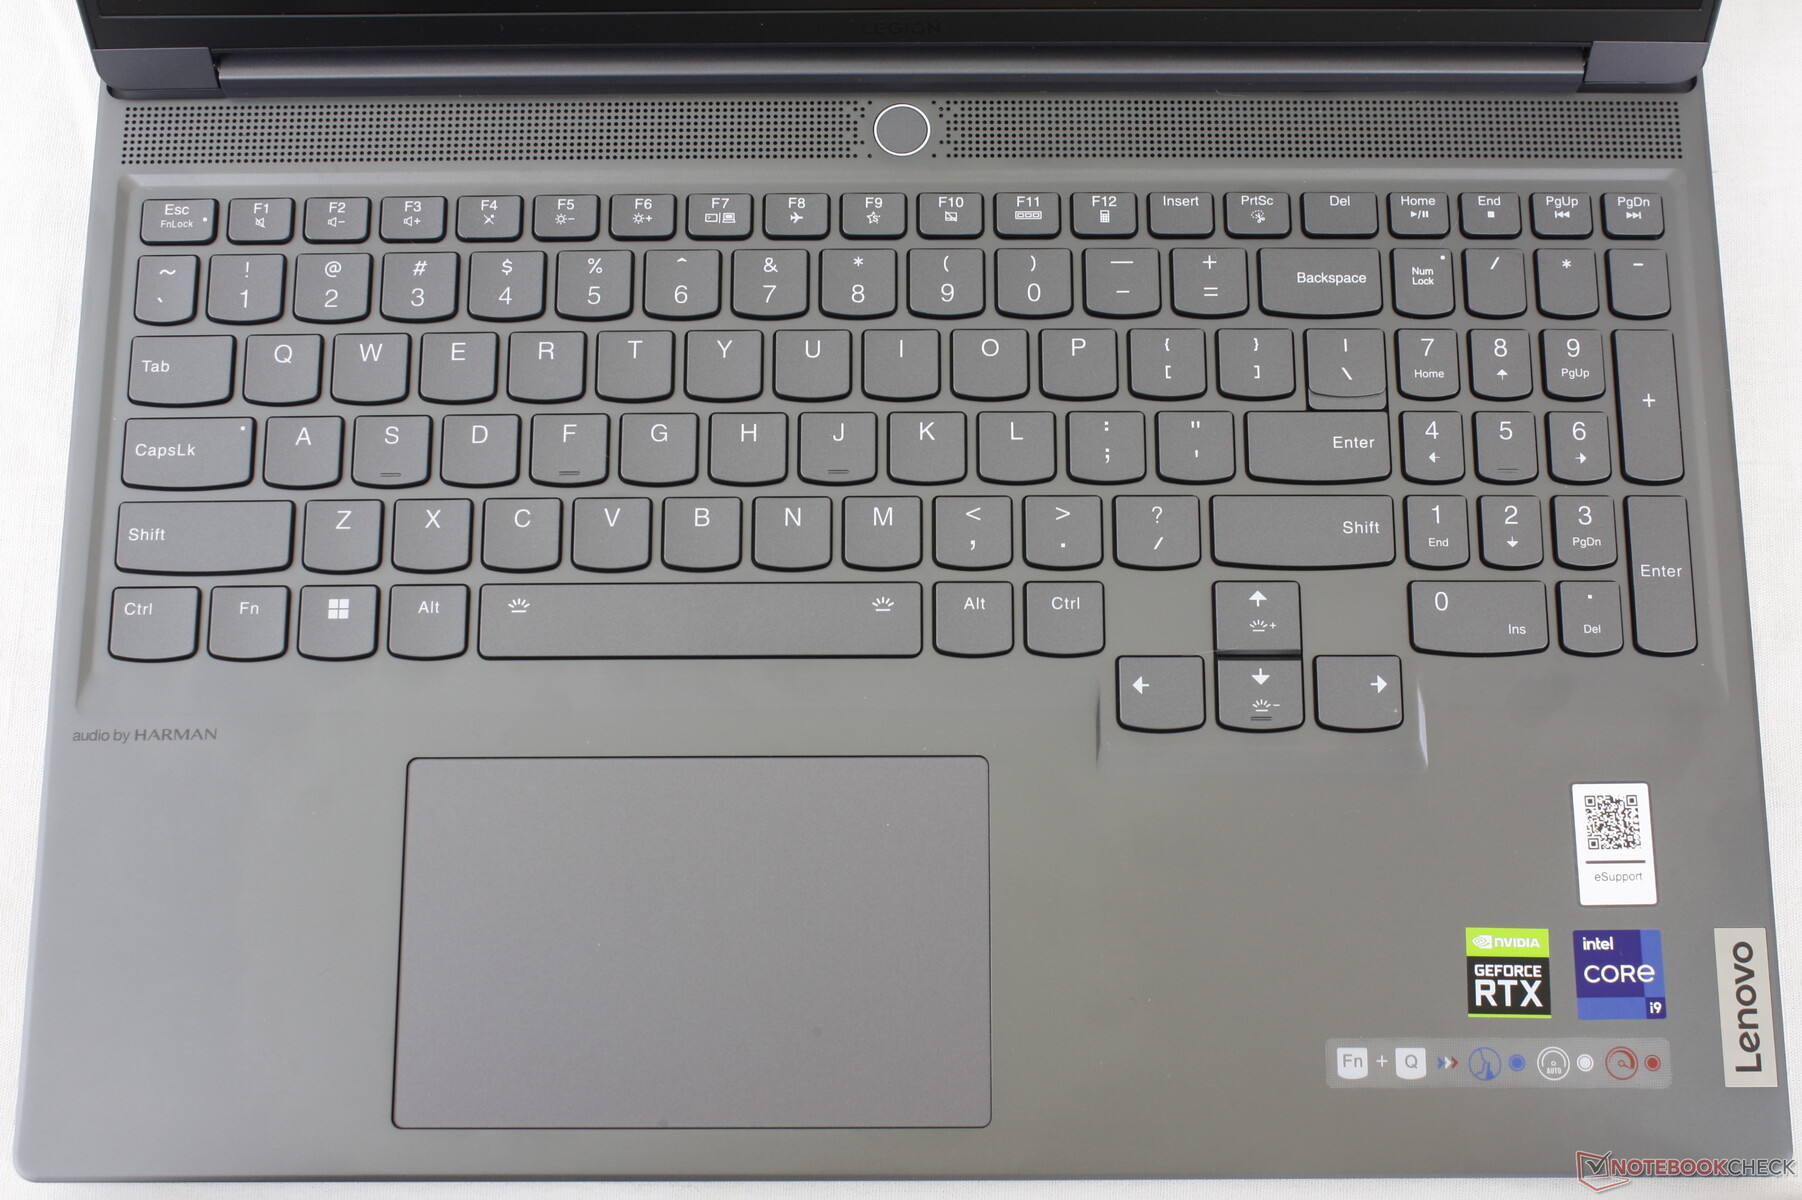
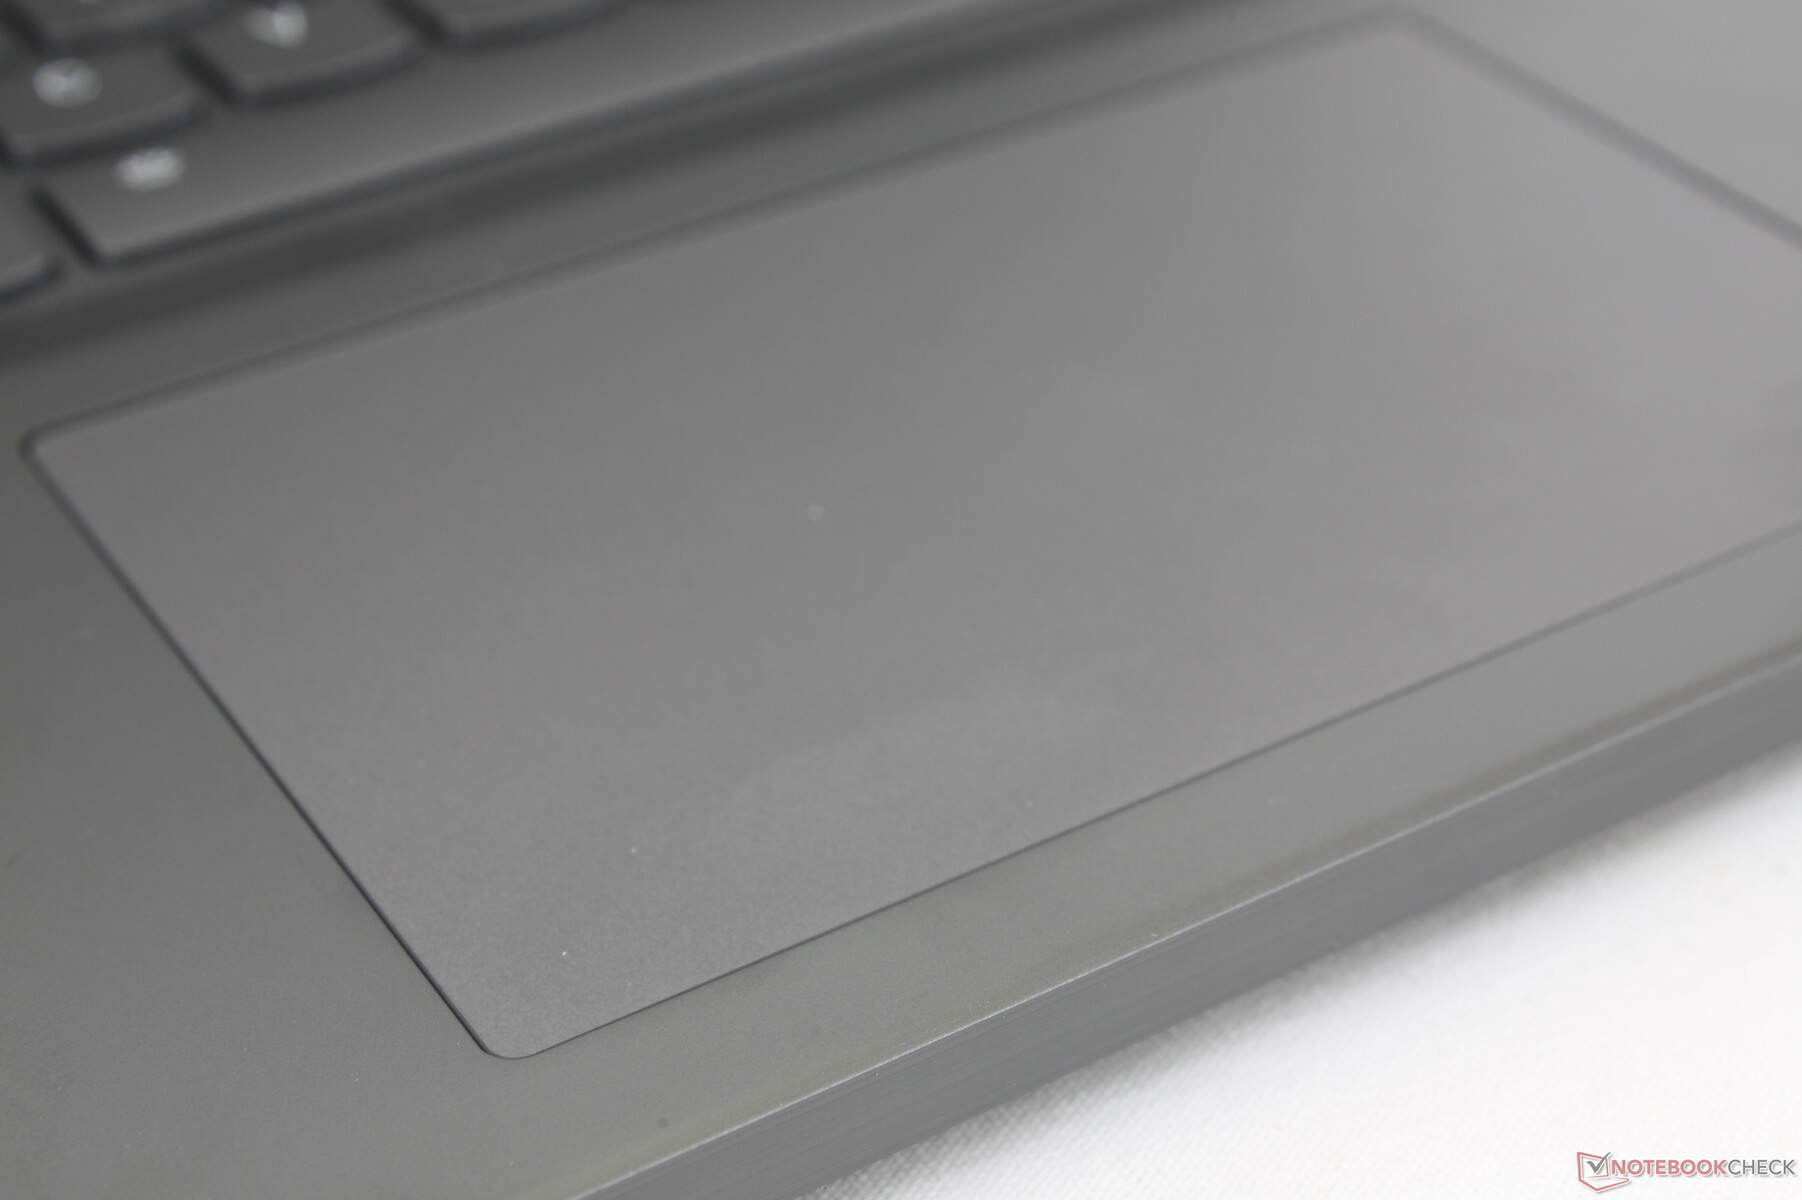
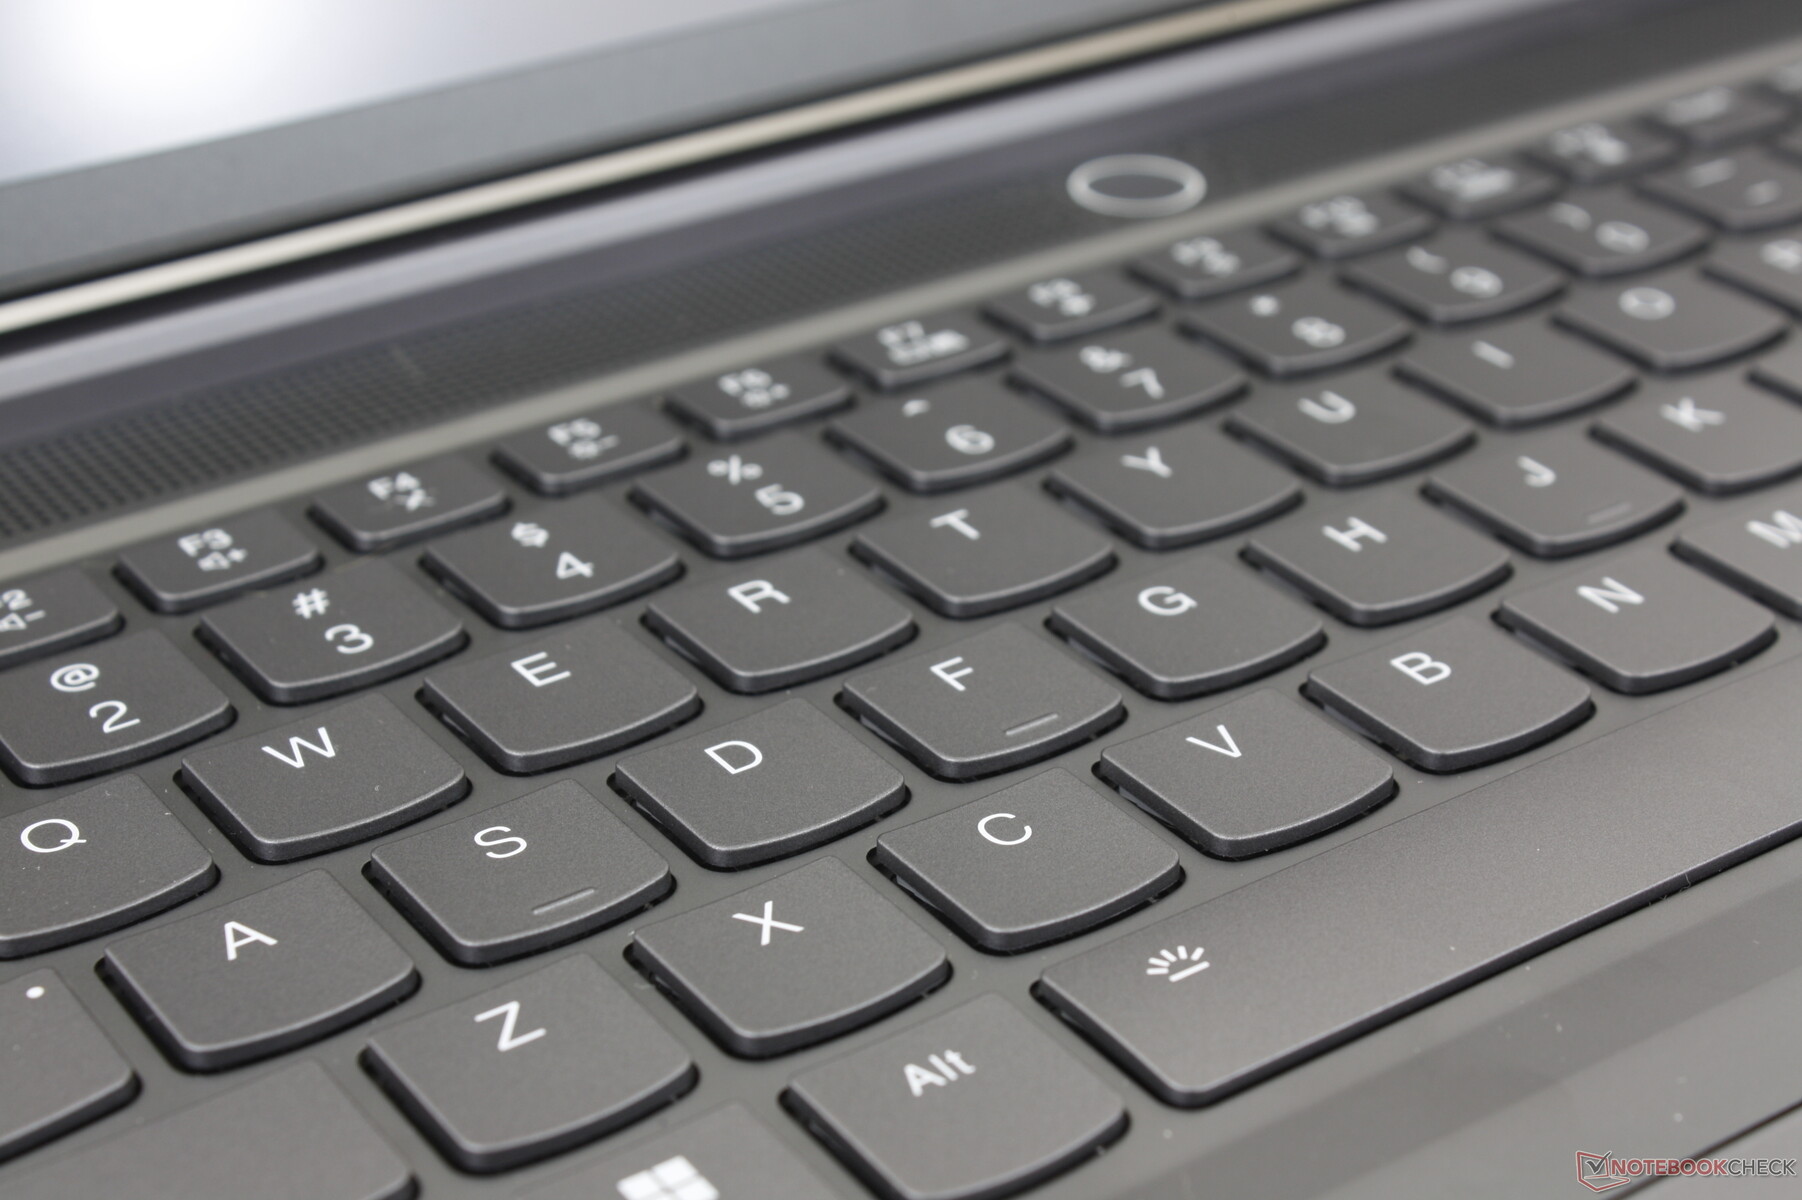
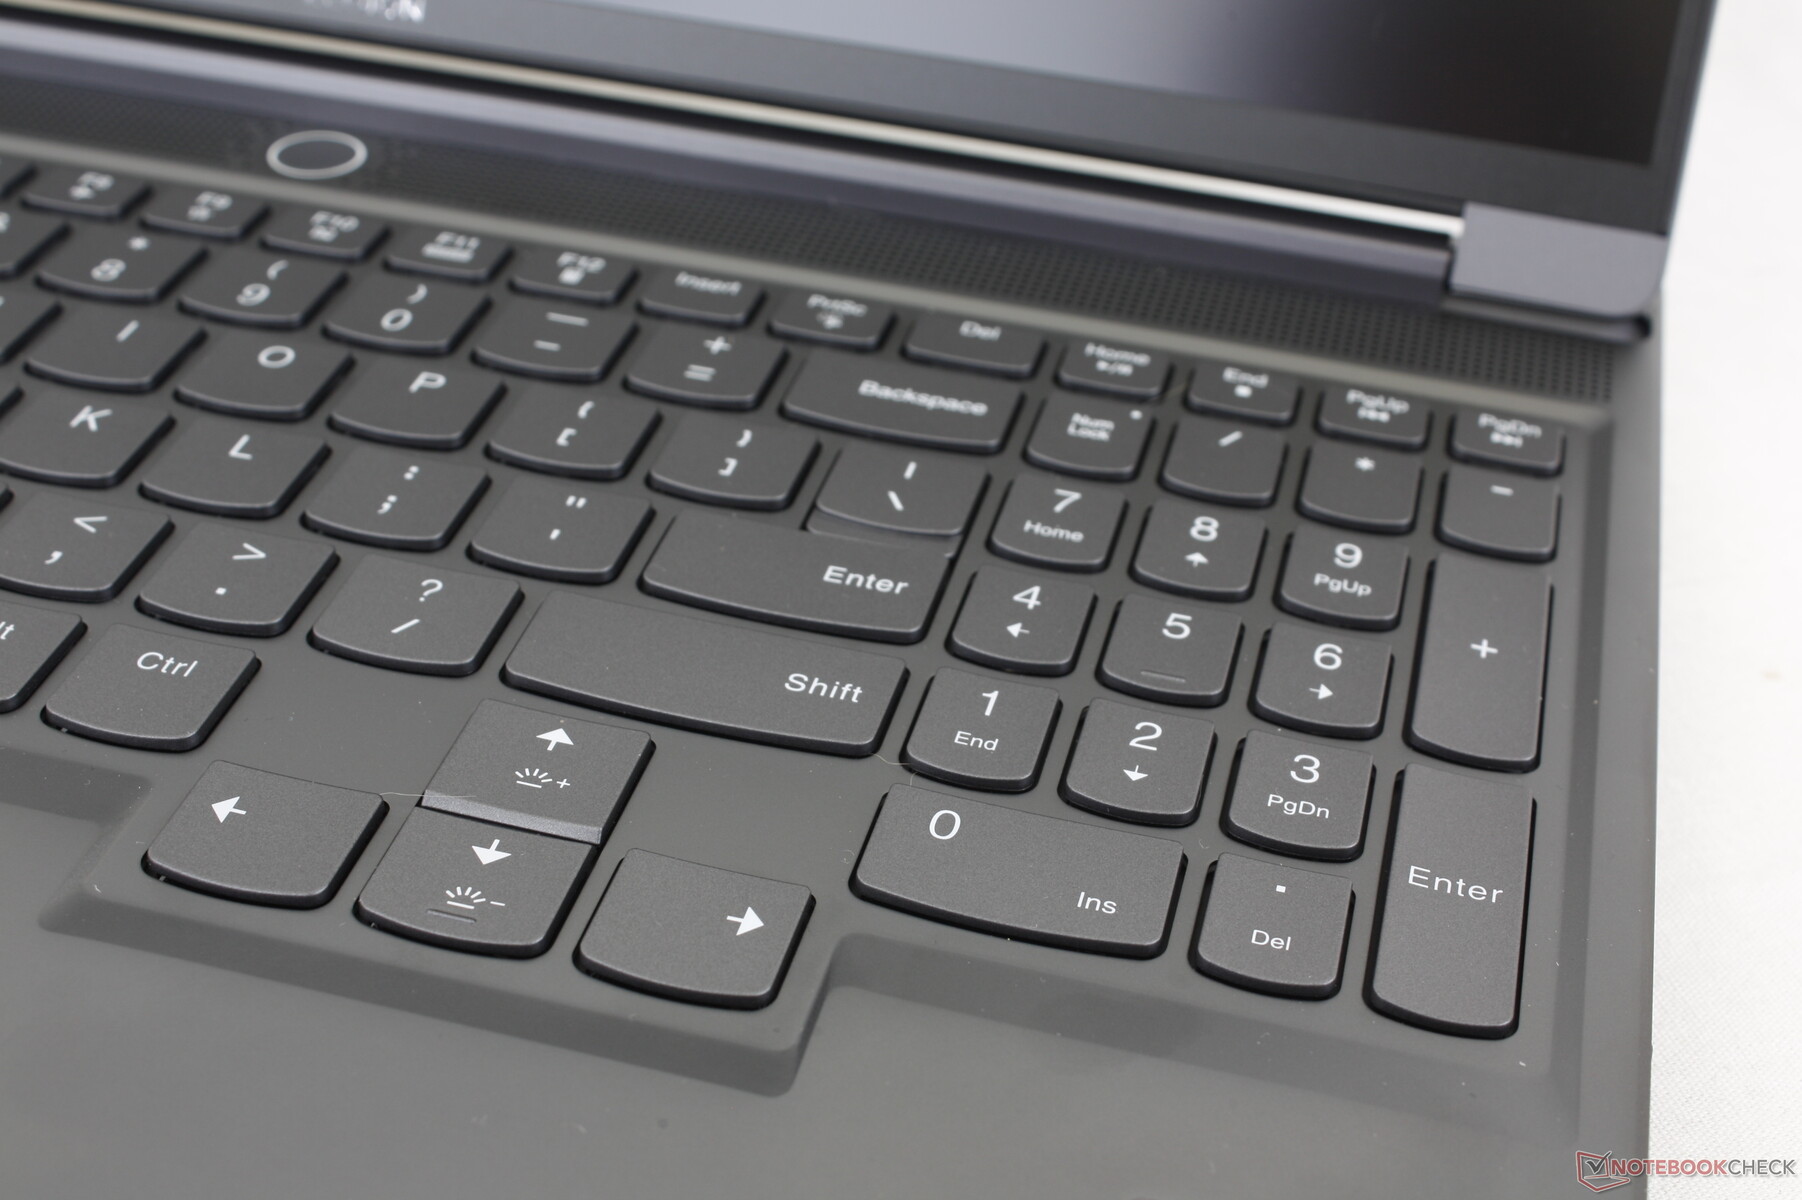
Périphériques d'entrée - Spacieux avec éclairage RVB par touche
Le clavier et le pavé tactile n'ont pas changé par rapport au modèle de l'année dernière Legion Slim 7i G7 de l'année dernière, et l'expérience de l'interface utilisateur reste donc la même. Ce n'est pas nécessairement une mauvaise chose car la course des touches de 1,5 mm et le retour d'information ferme sont toujours plus confortables pour taper que les touches moins profondes du Blade 16. Nous apprécions également les grandes touches fléchées, car ces mêmes touches sont souvent frustrantes et trop petites sur d'autres ordinateurs portables de jeu comme la série des Asus ROG Strix ou la série MSI Pulse.
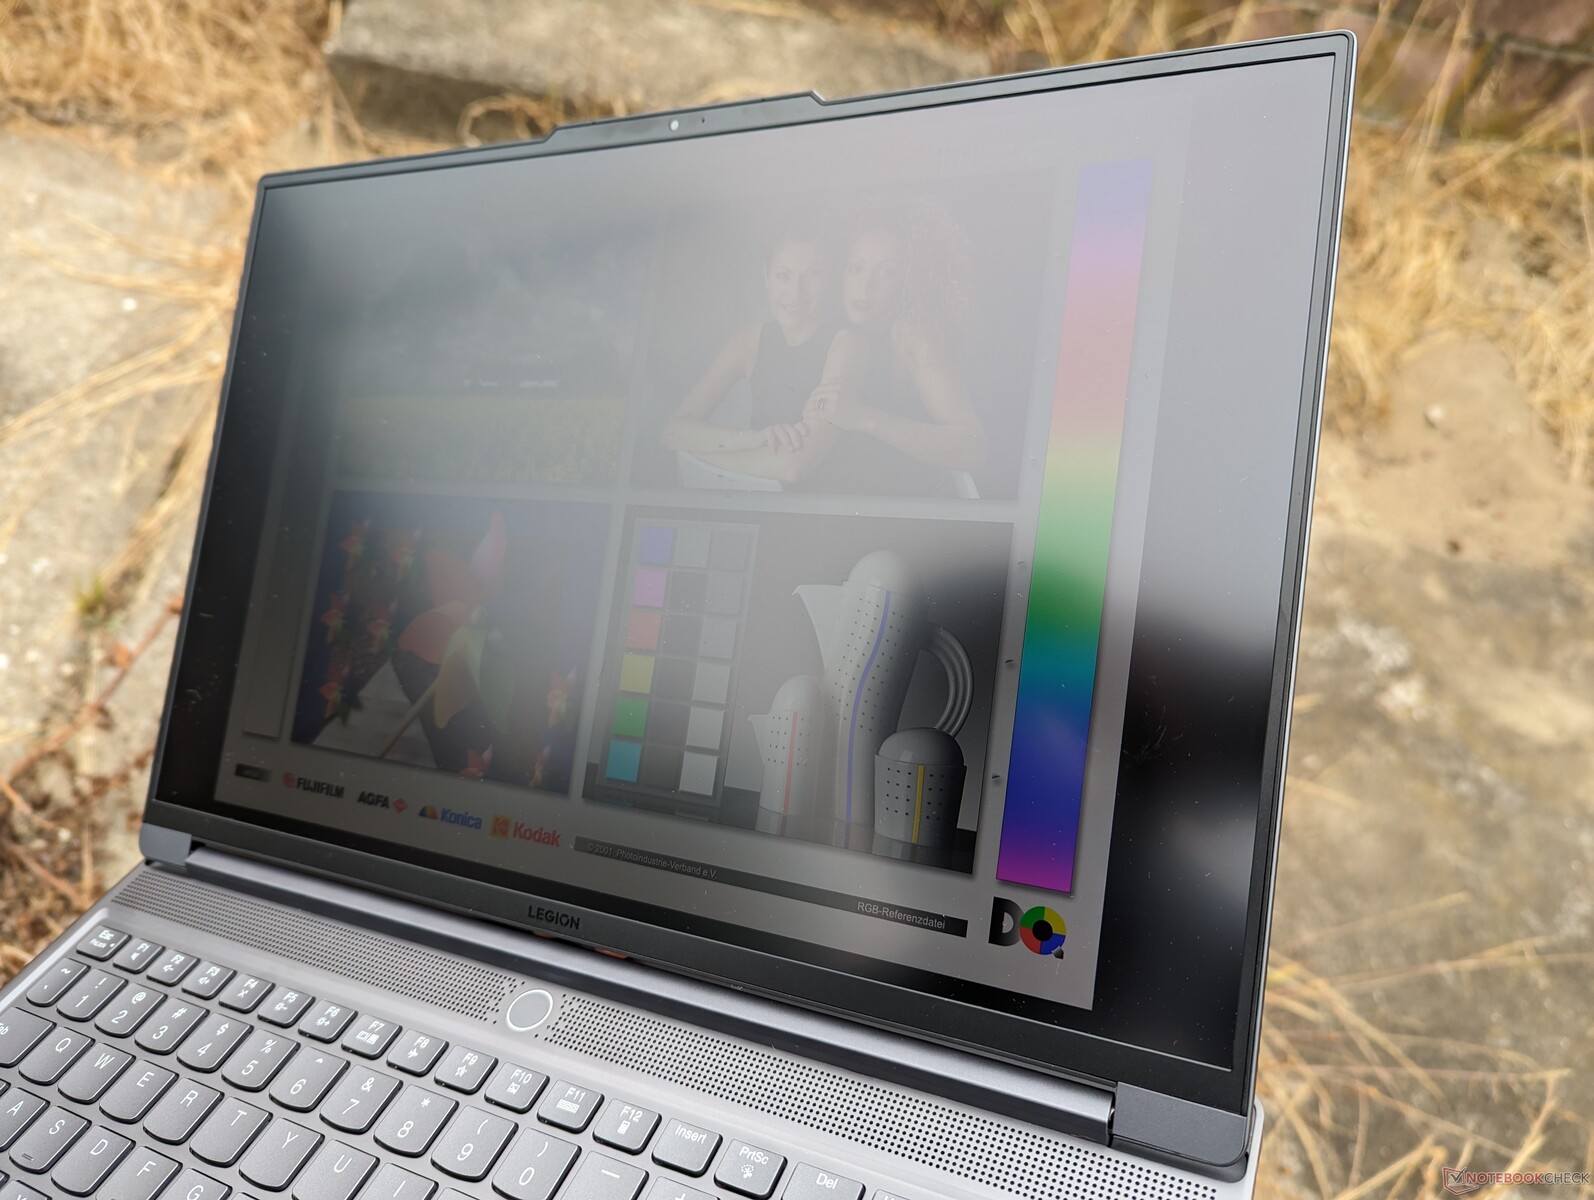
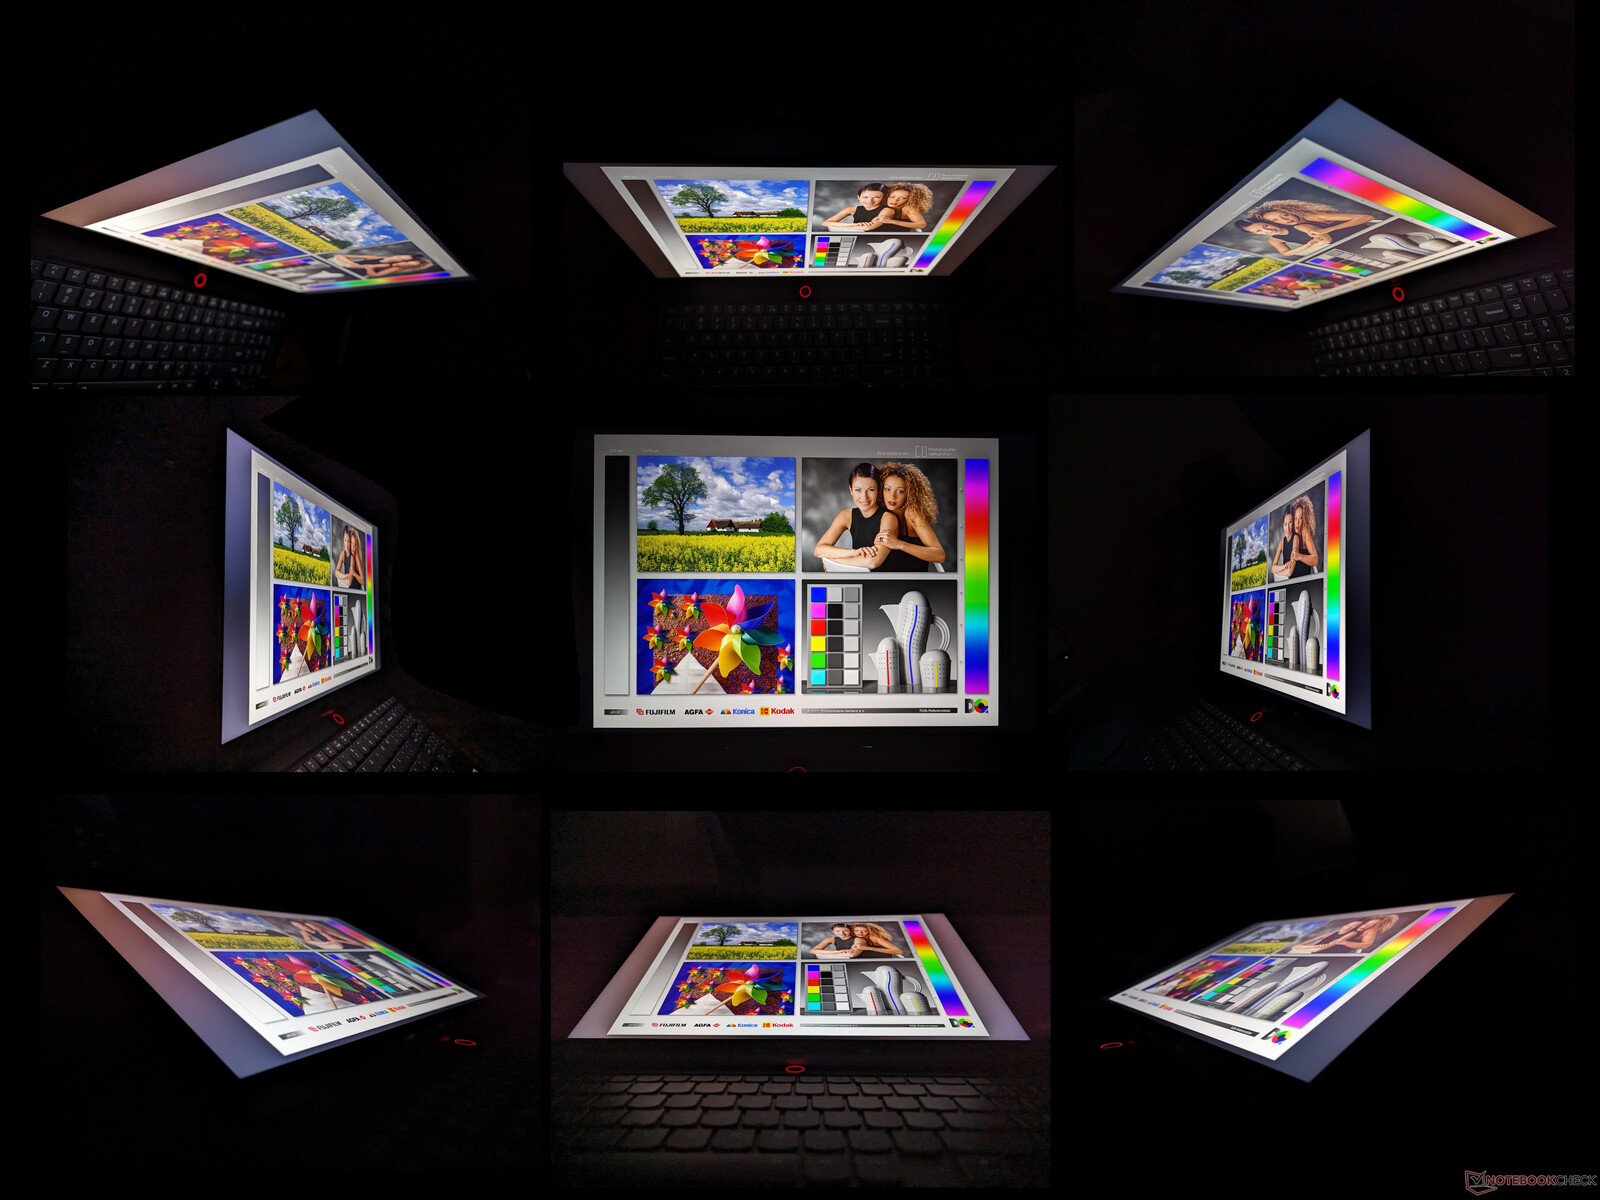
Affichage - Identique à celui du Legion Pro 7
Deux options de panneaux sont disponibles comme suit, toutes deux avec la prise en charge de G-Sync :
- 2560 x 1600, 240 Hz, temps de réponse de 5 ms, 100% sRGB, 500 nits, certifié Pantone
- 3000 x 2000, 165 Hz, temps de réponse de 3 ms, 100% DCI-P3, 430 nits, certifié Pantone
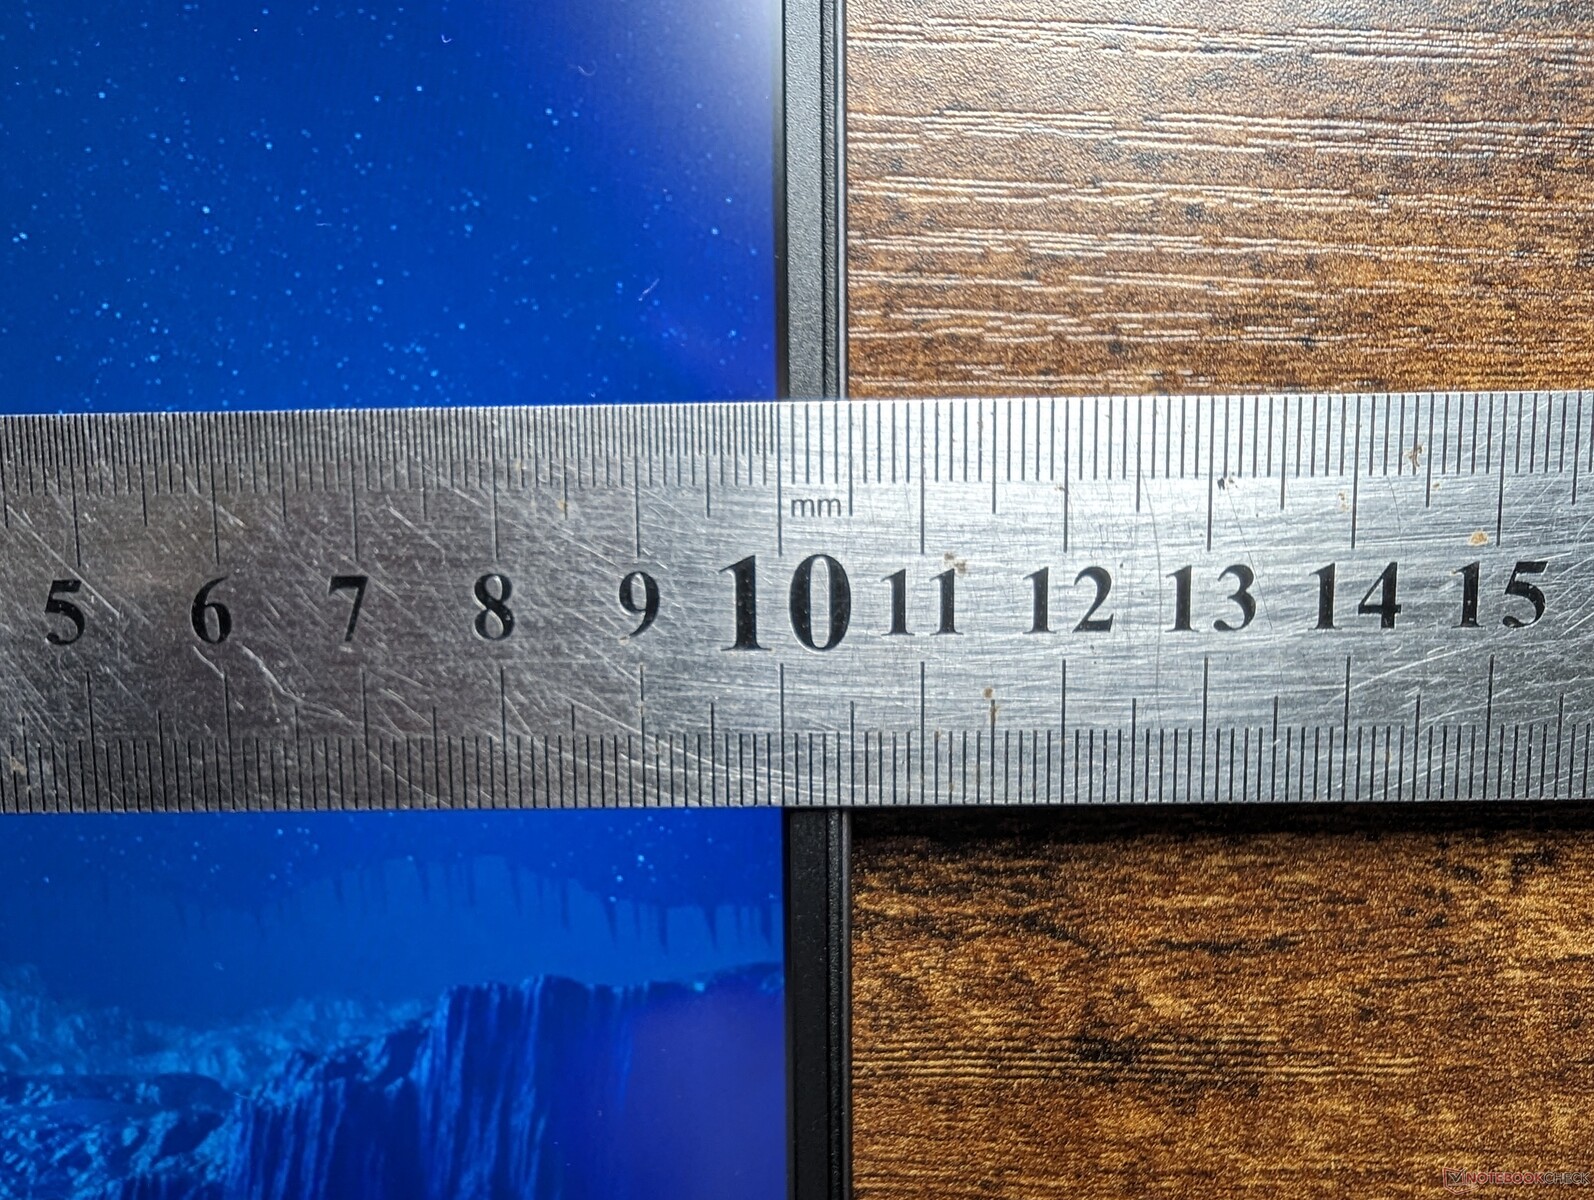
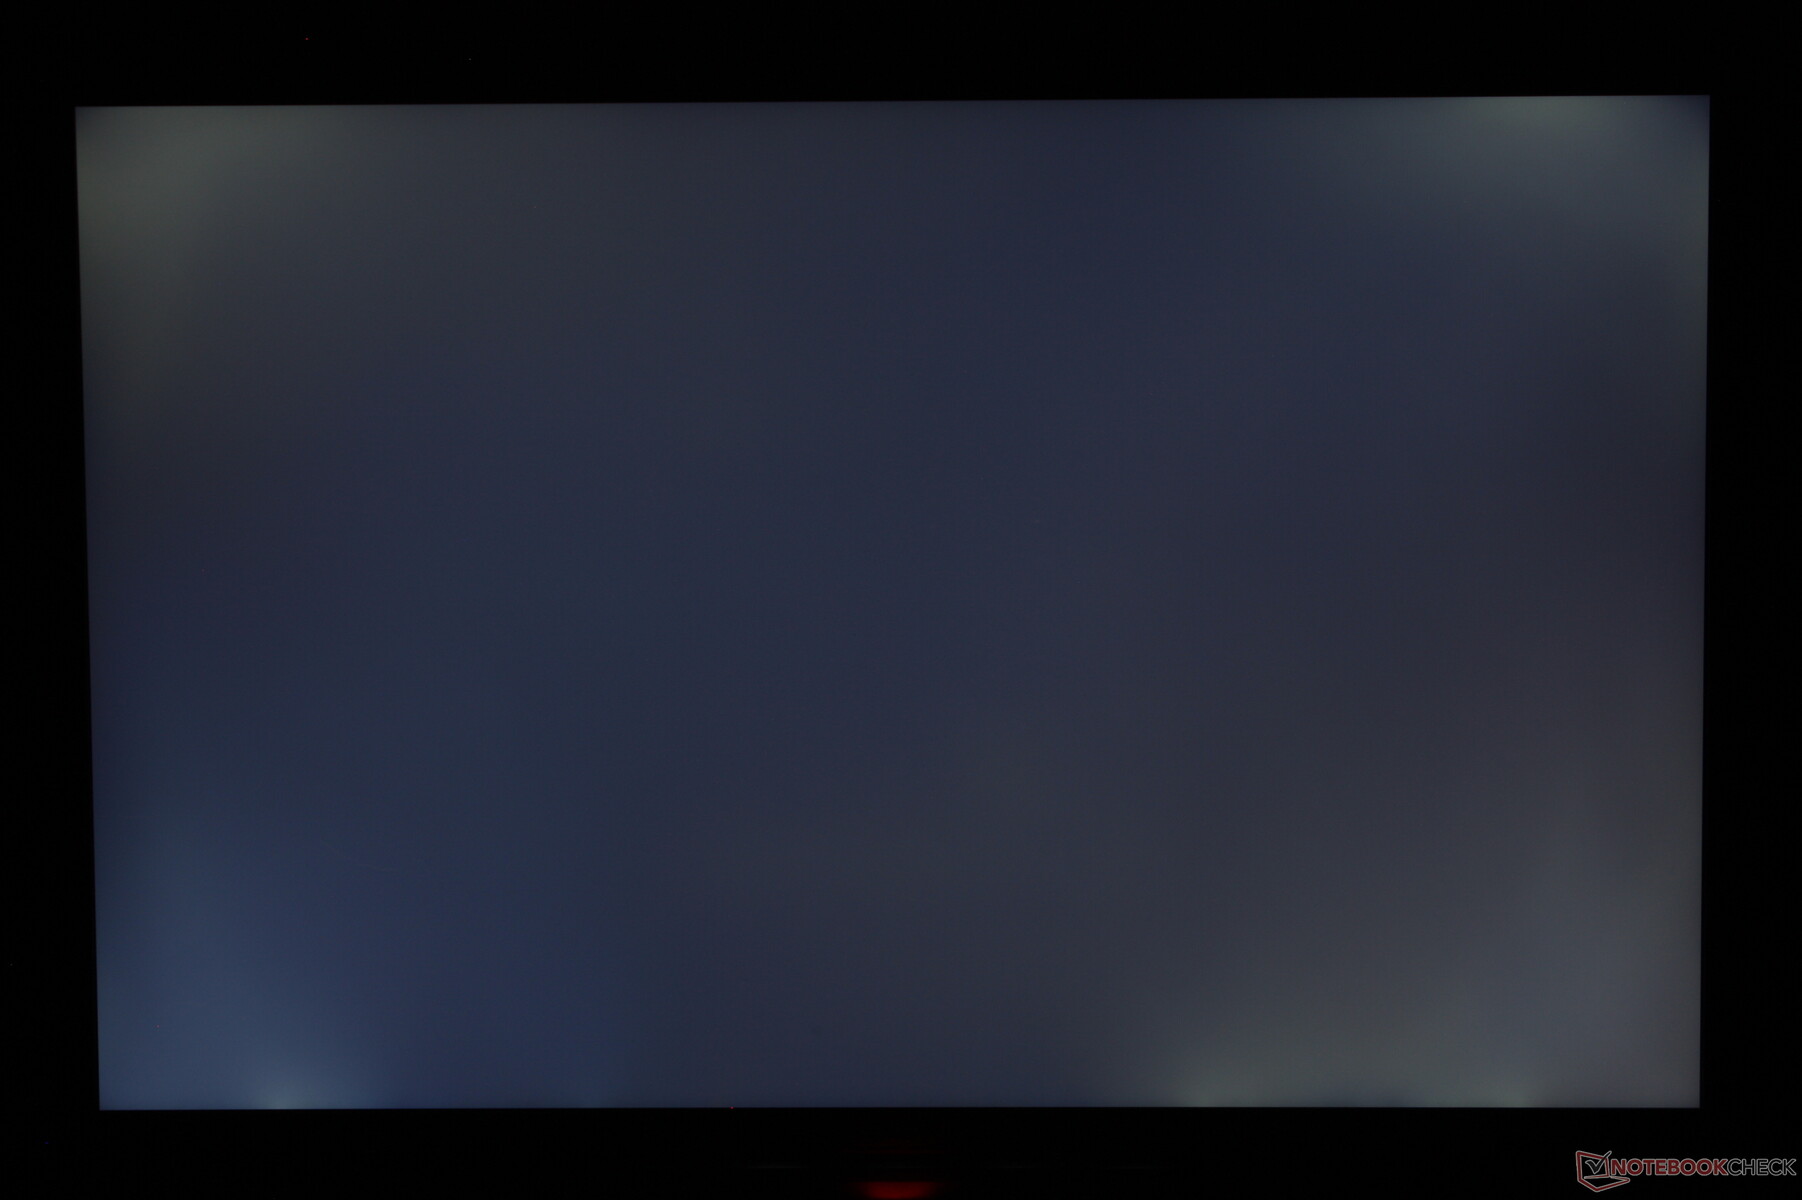
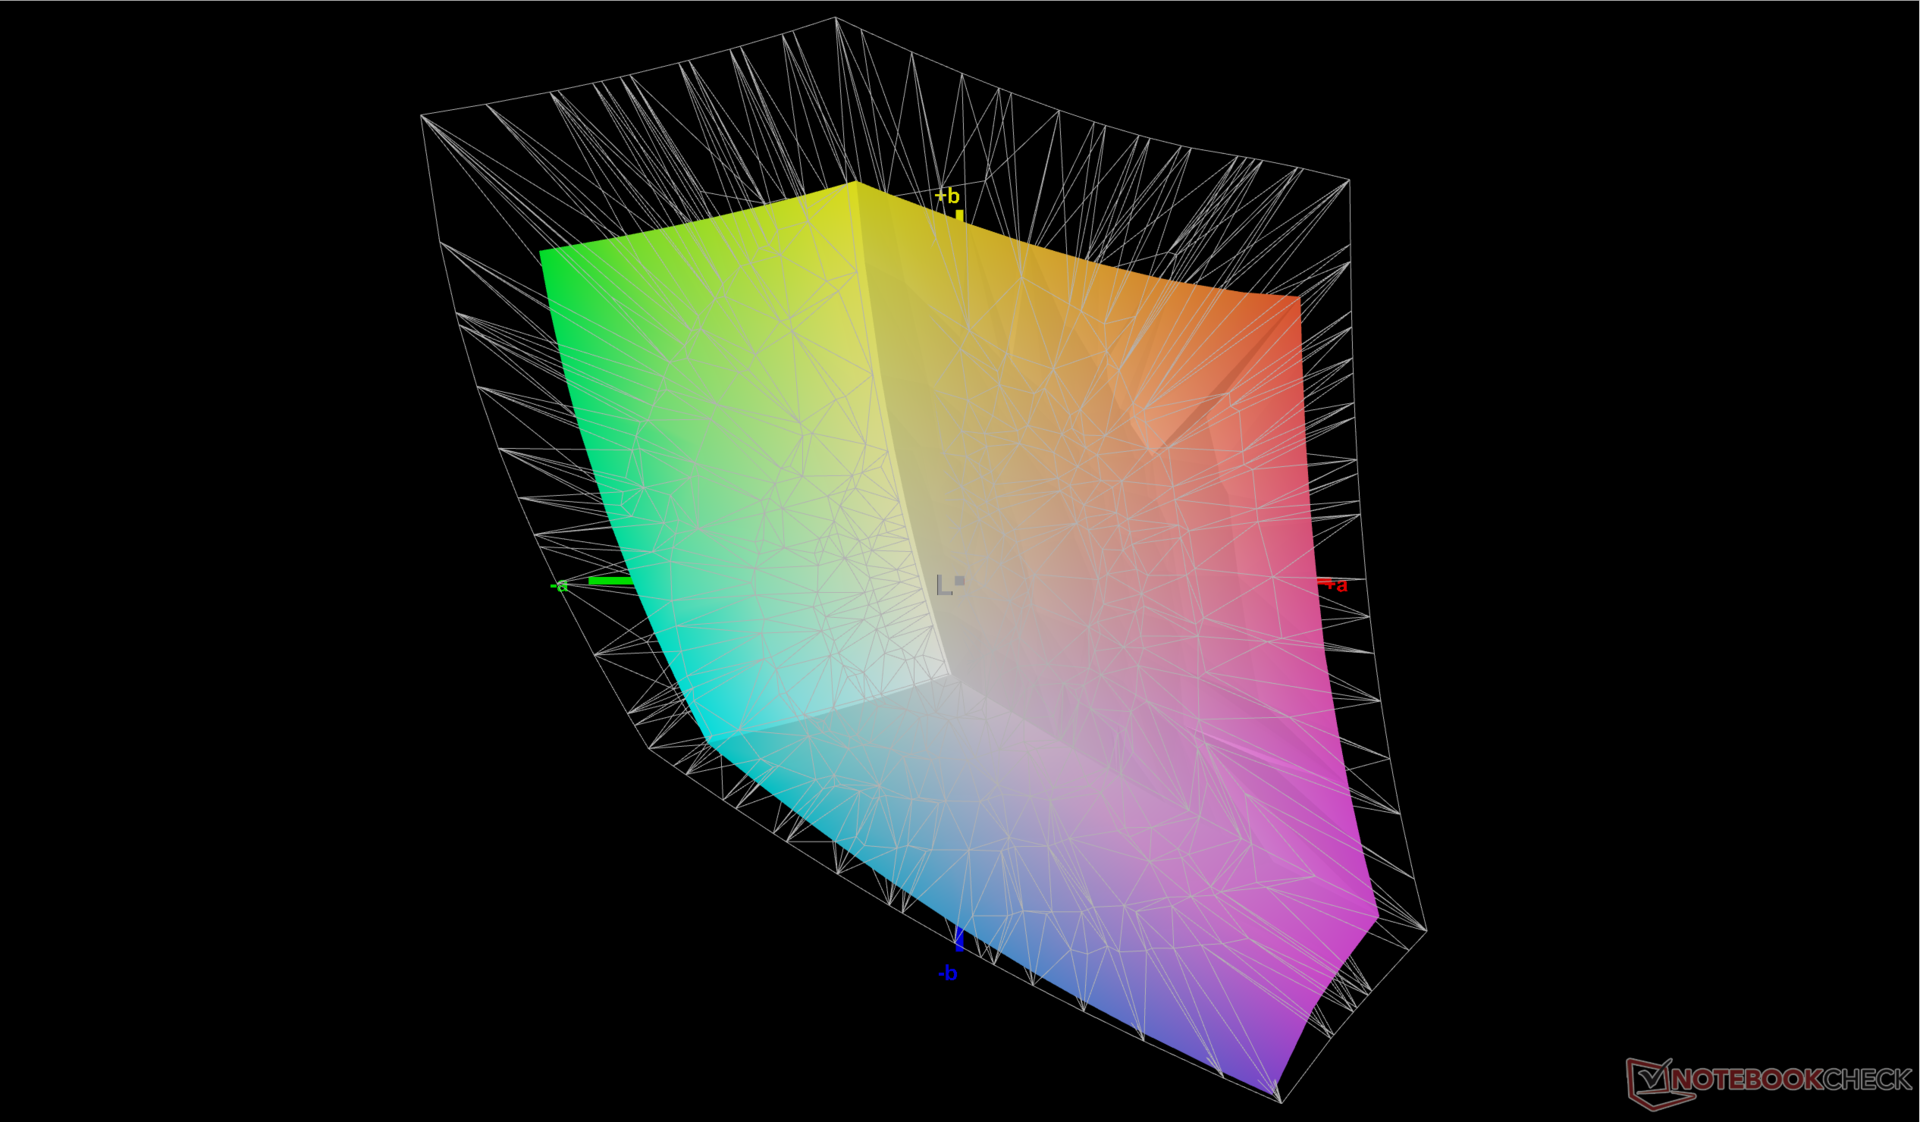
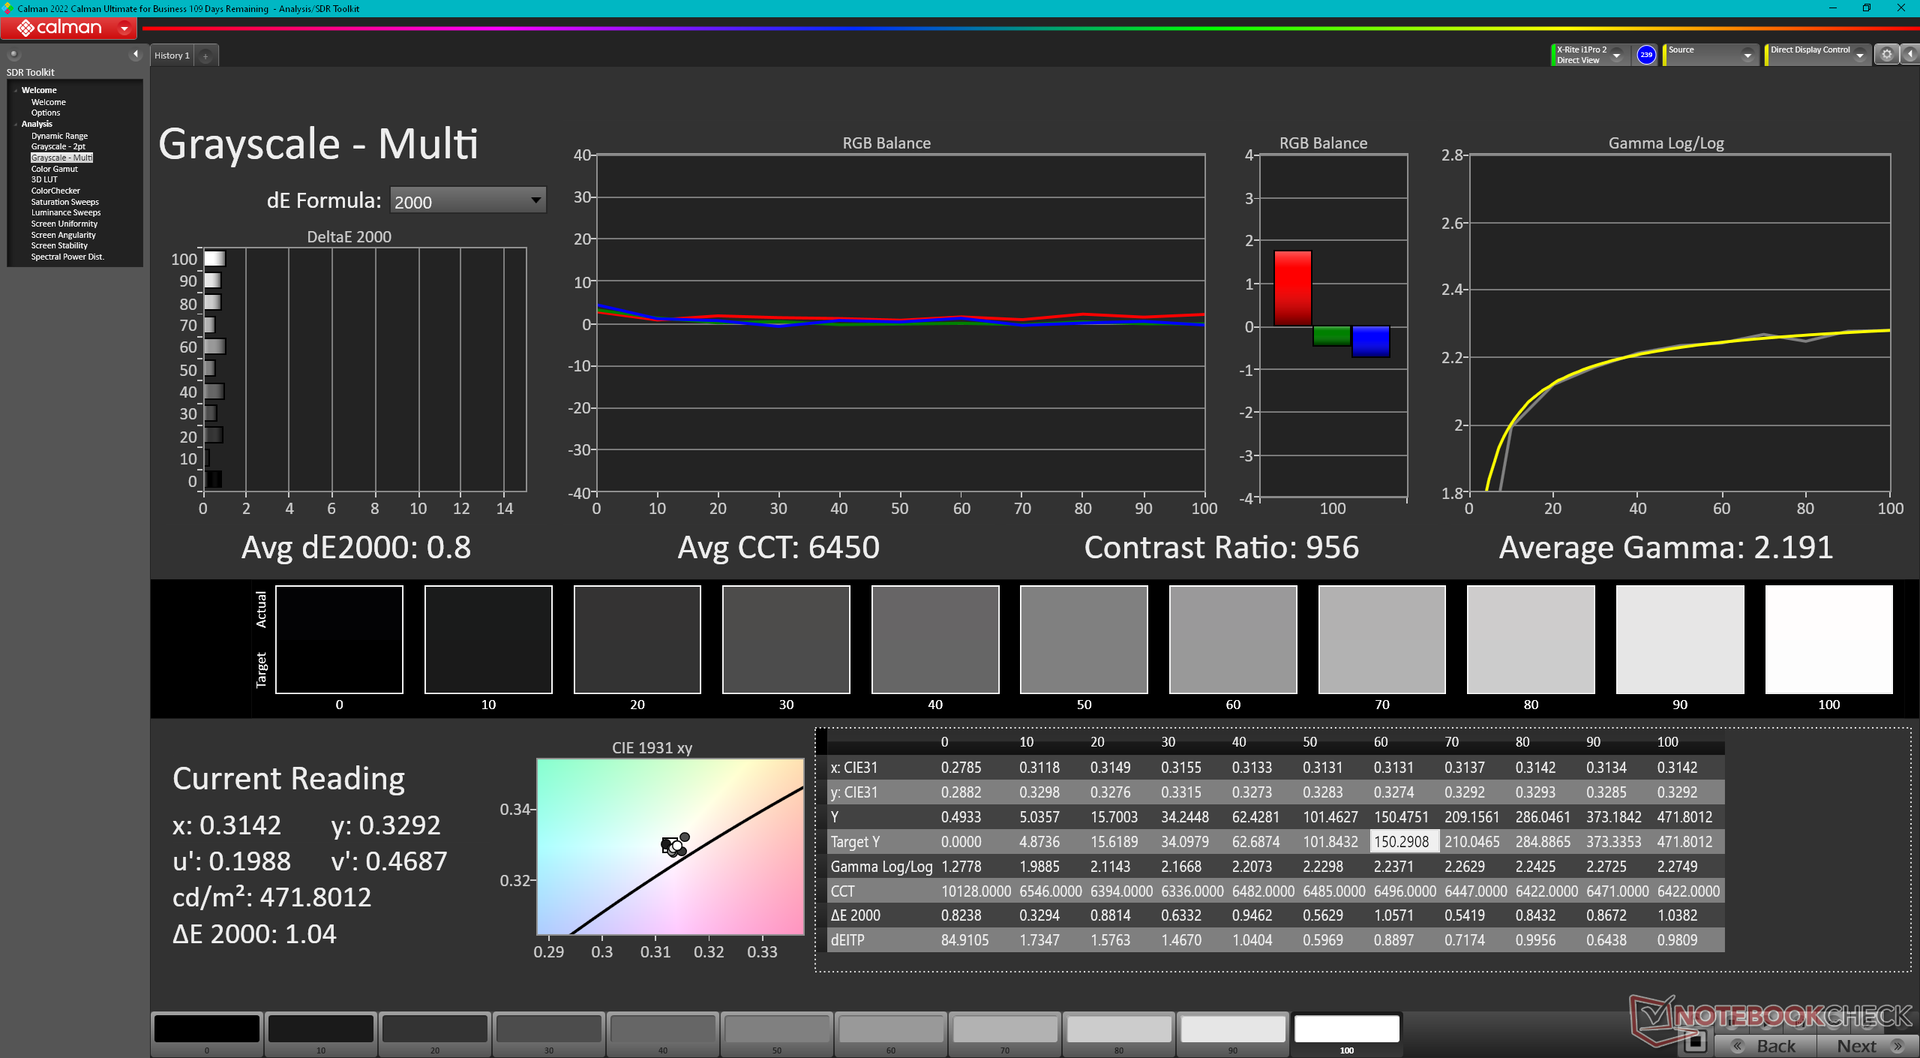
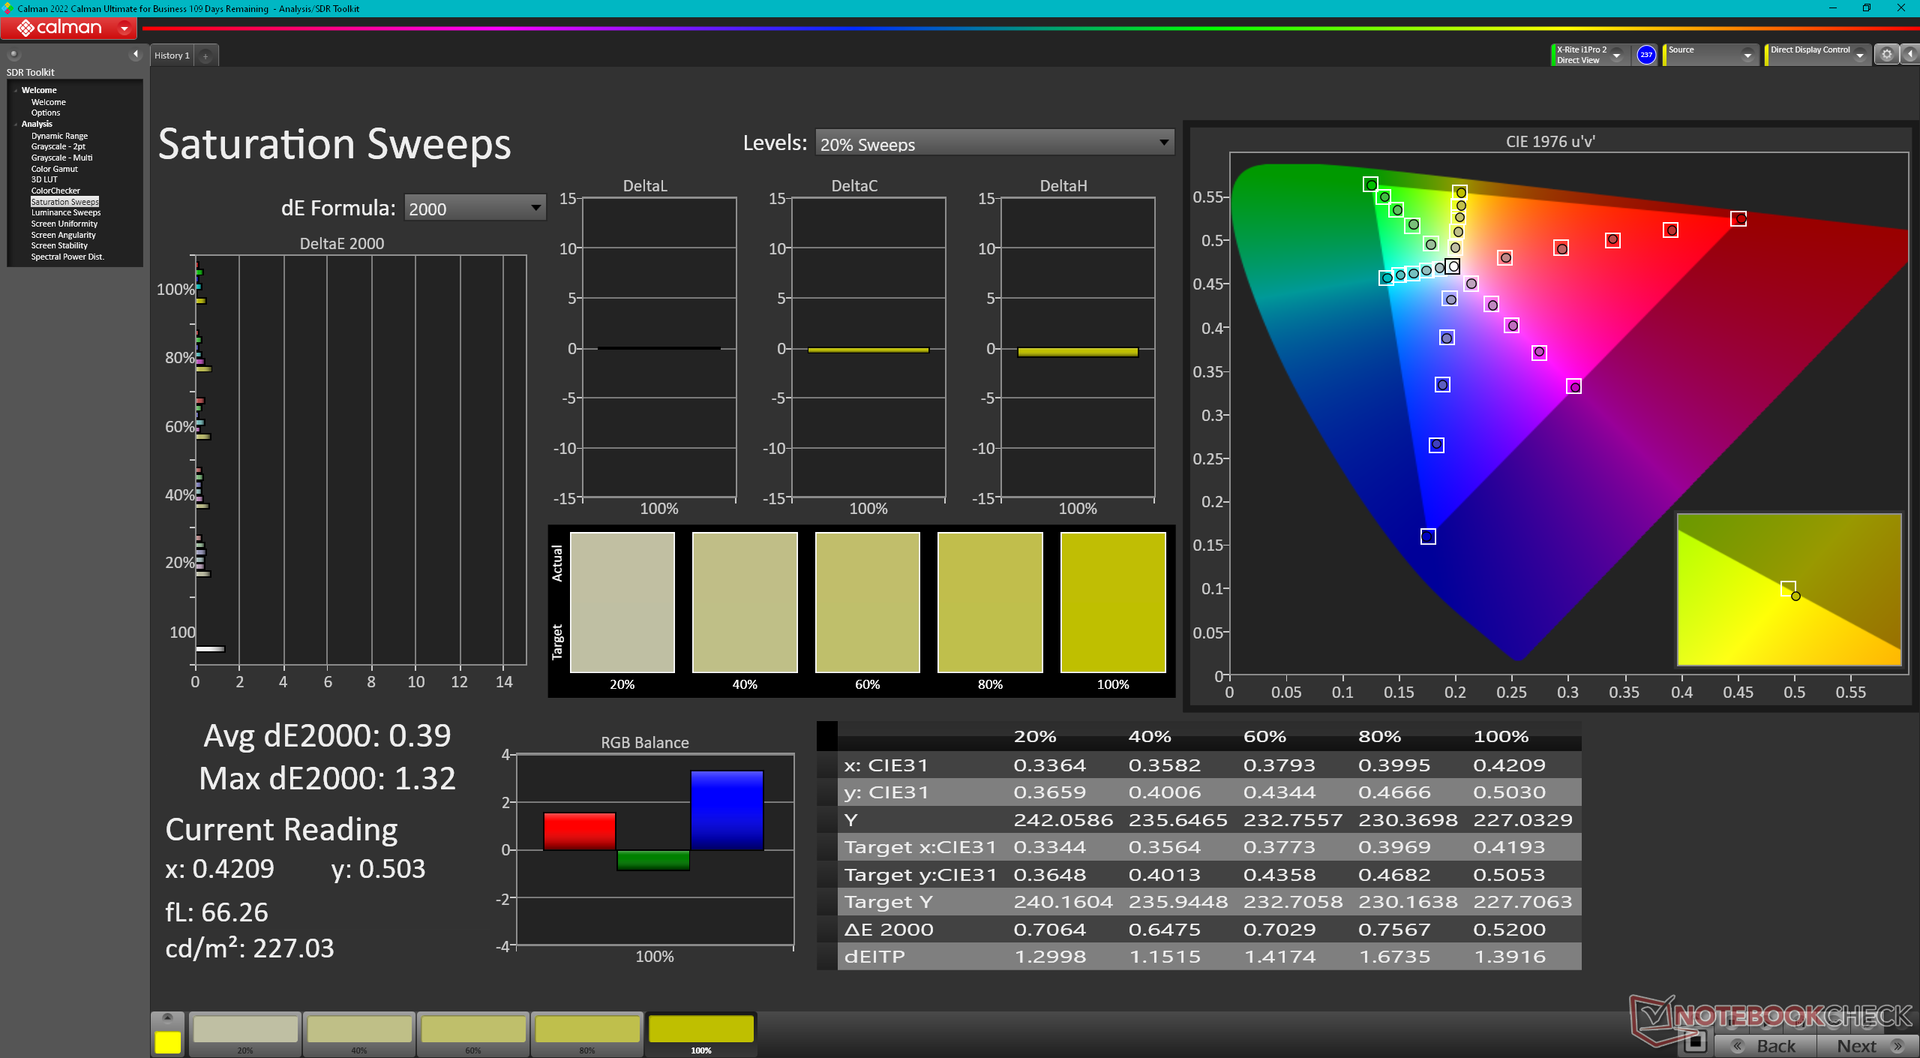
Notre configuration 1600p est équipée de la même dalle IPS MNG007DA2-3 que celle qui équipe les modèles plus grands et plus chers de la série Legion Pro 7 plus grand et plus cher, pour une expérience visuelle identique entre les deux modèles. Il s'agit d'une dalle haut de gamme adaptée aux jeux et à l'édition graphique amateur, même s'il s'agit de l'option de base. Cependant, la perte de rétroéclairage est plus perceptible que nous le souhaiterions, comme le montre la capture d'écran ci-dessous.

| |||||||||||||||||||||||||
Homogénéité de la luminosité: 86 %
Valeur mesurée au centre, sur batterie: 474.6 cd/m²
Contraste: 1217:1 (Valeurs des noirs: 0.39 cd/m²)
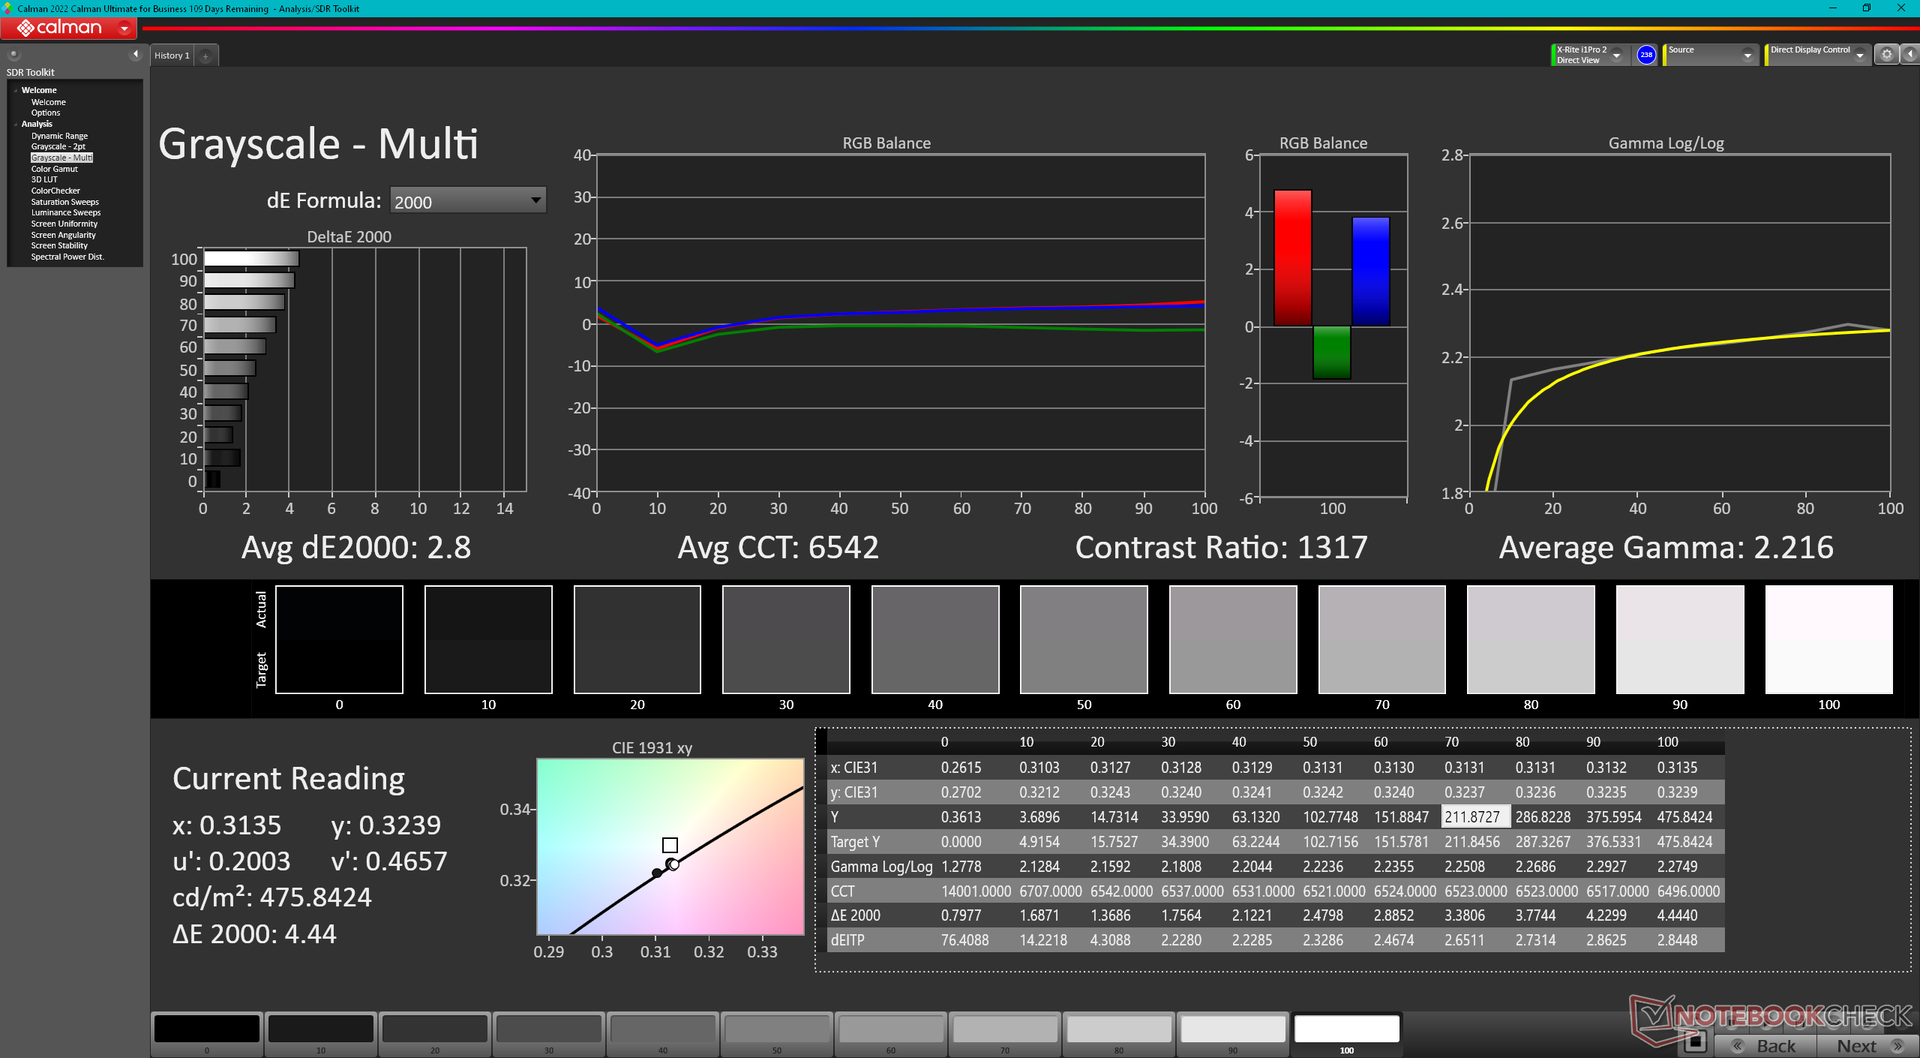
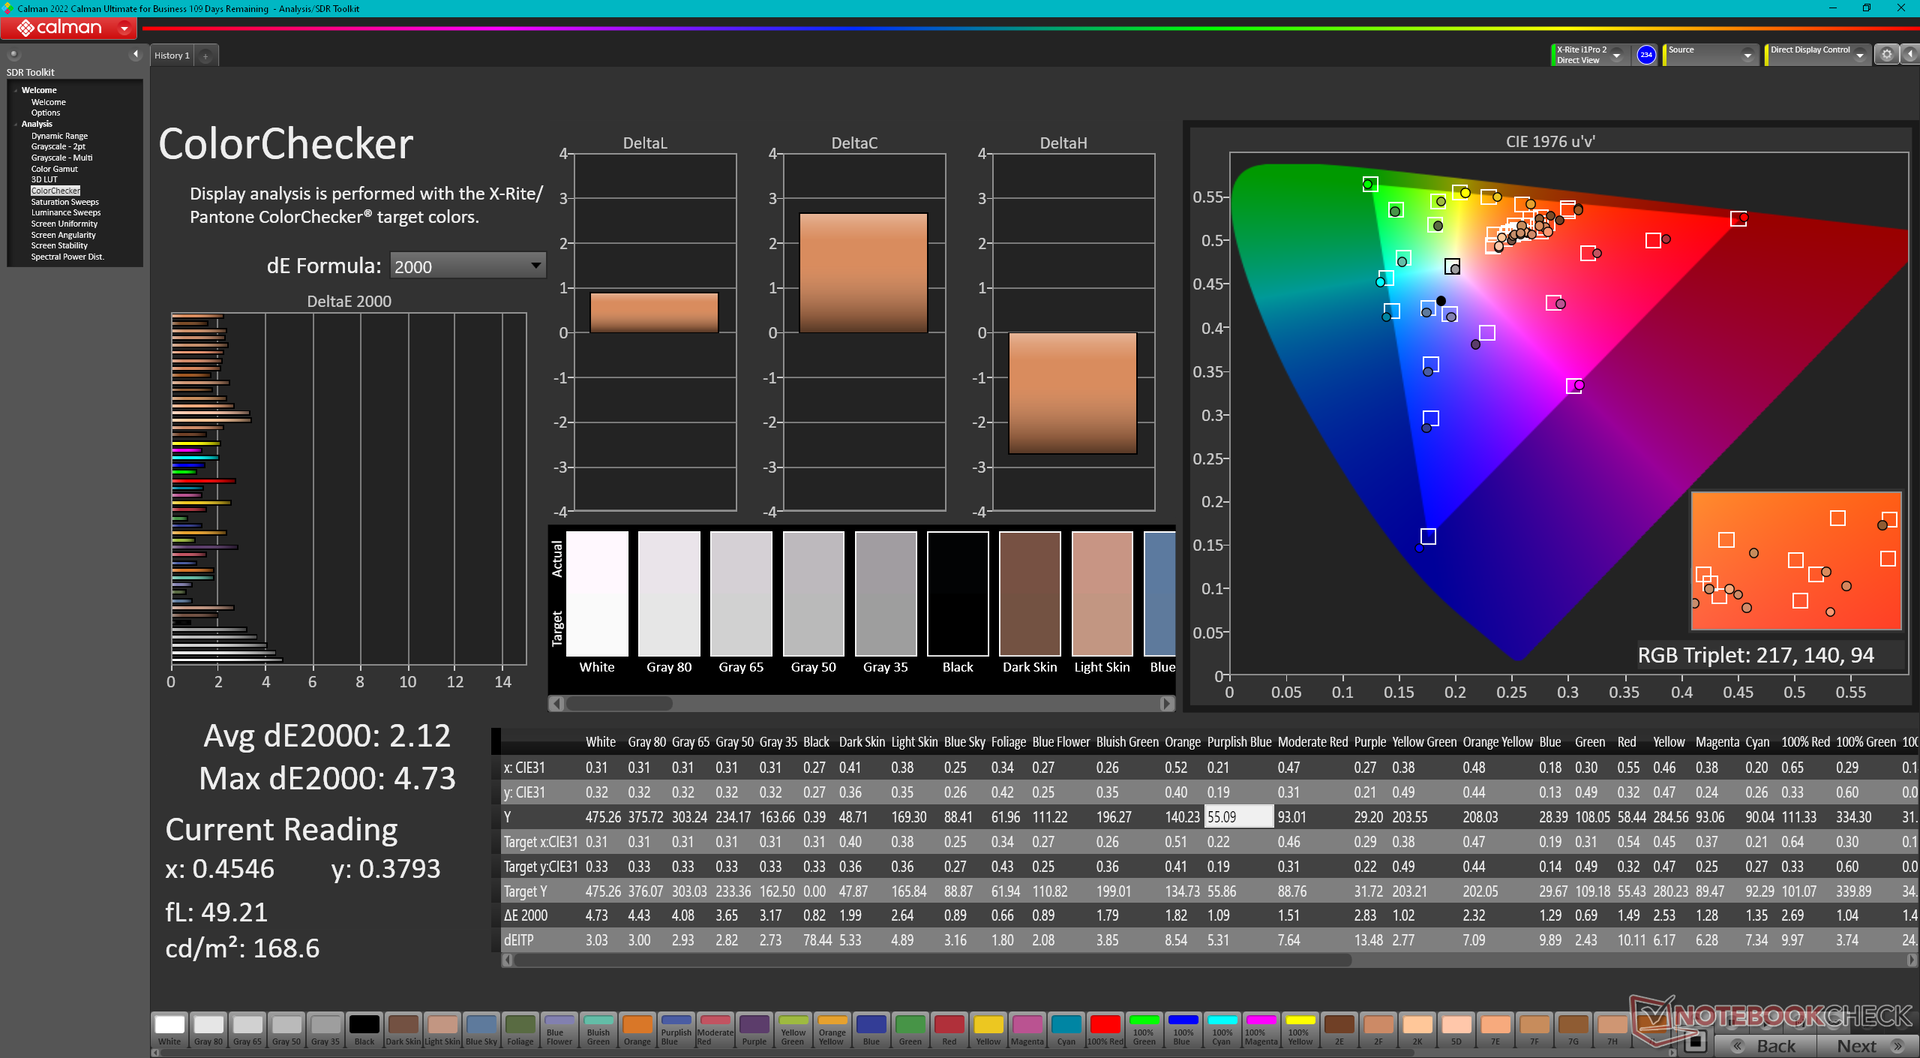
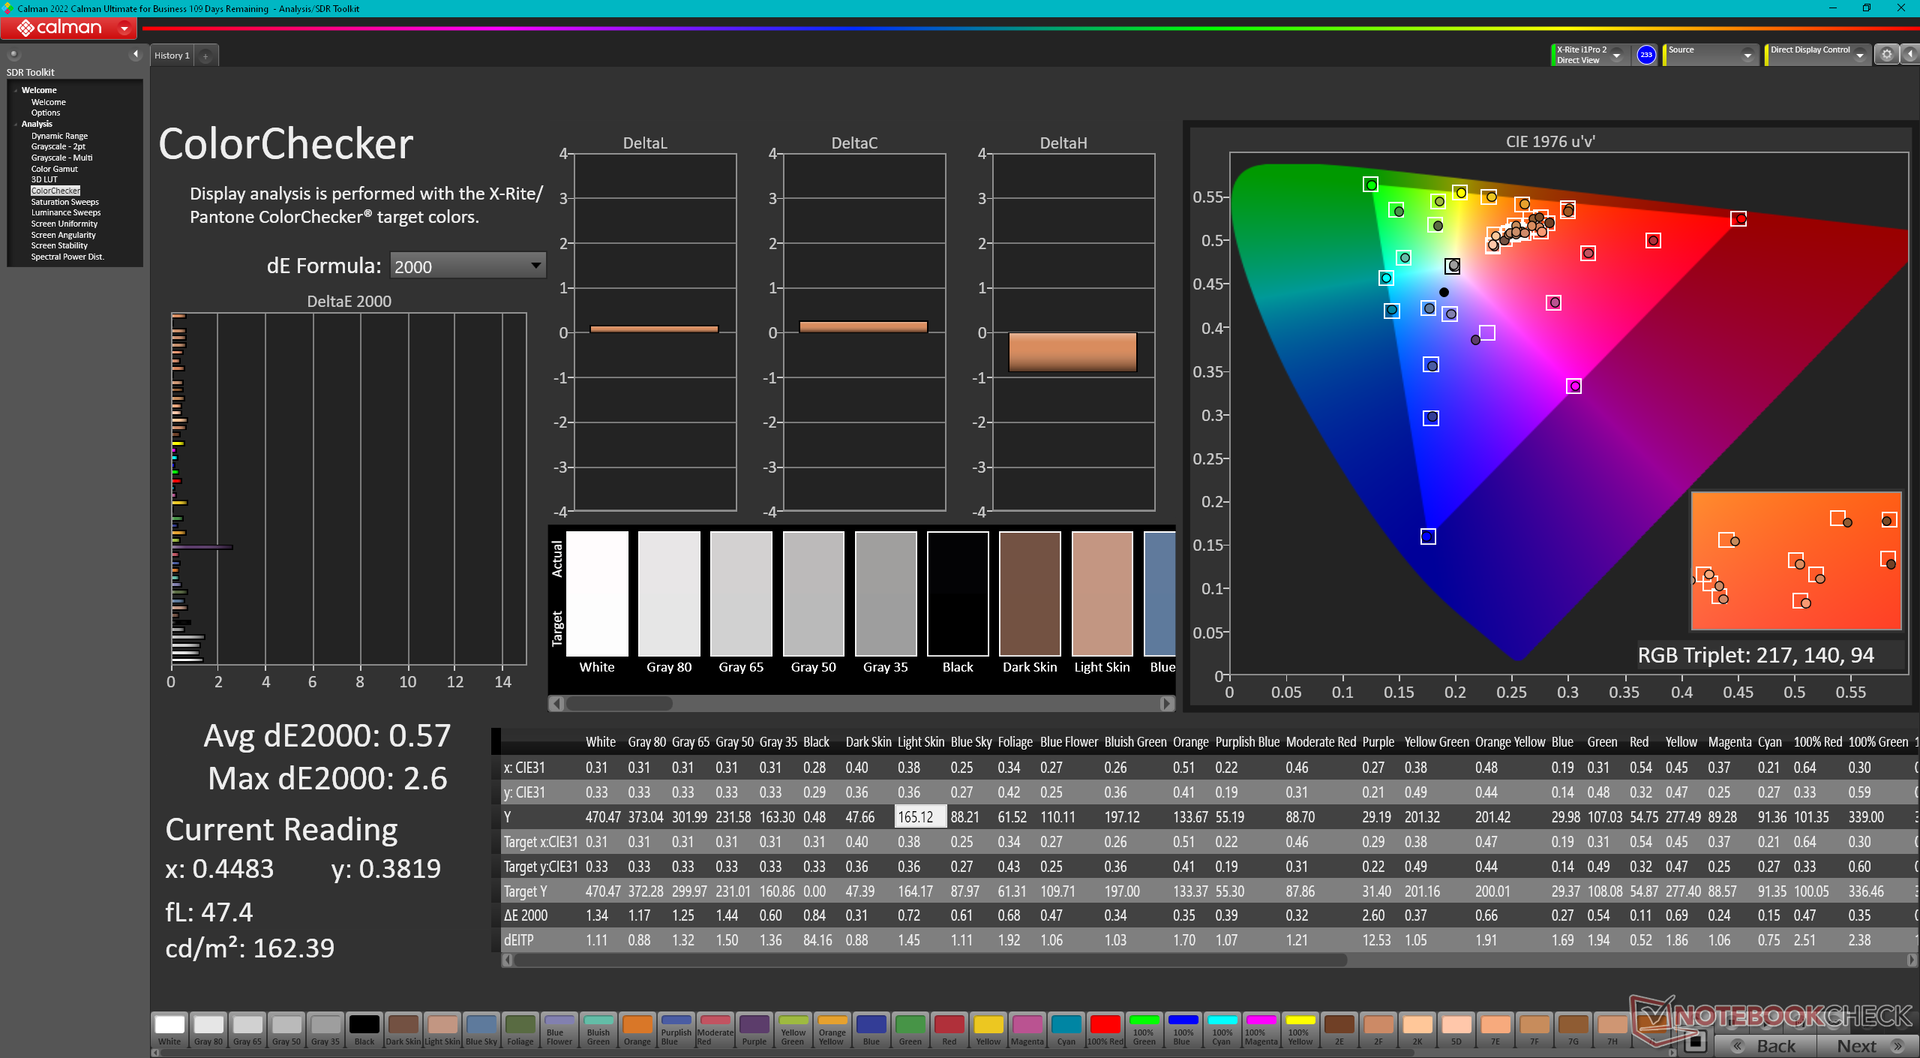
ΔE ColorChecker Calman: 2.12 | ∀{0.5-29.43 Ø4.72}
calibrated: 0.57
ΔE Greyscale Calman: 2.8 | ∀{0.09-98 Ø4.97}
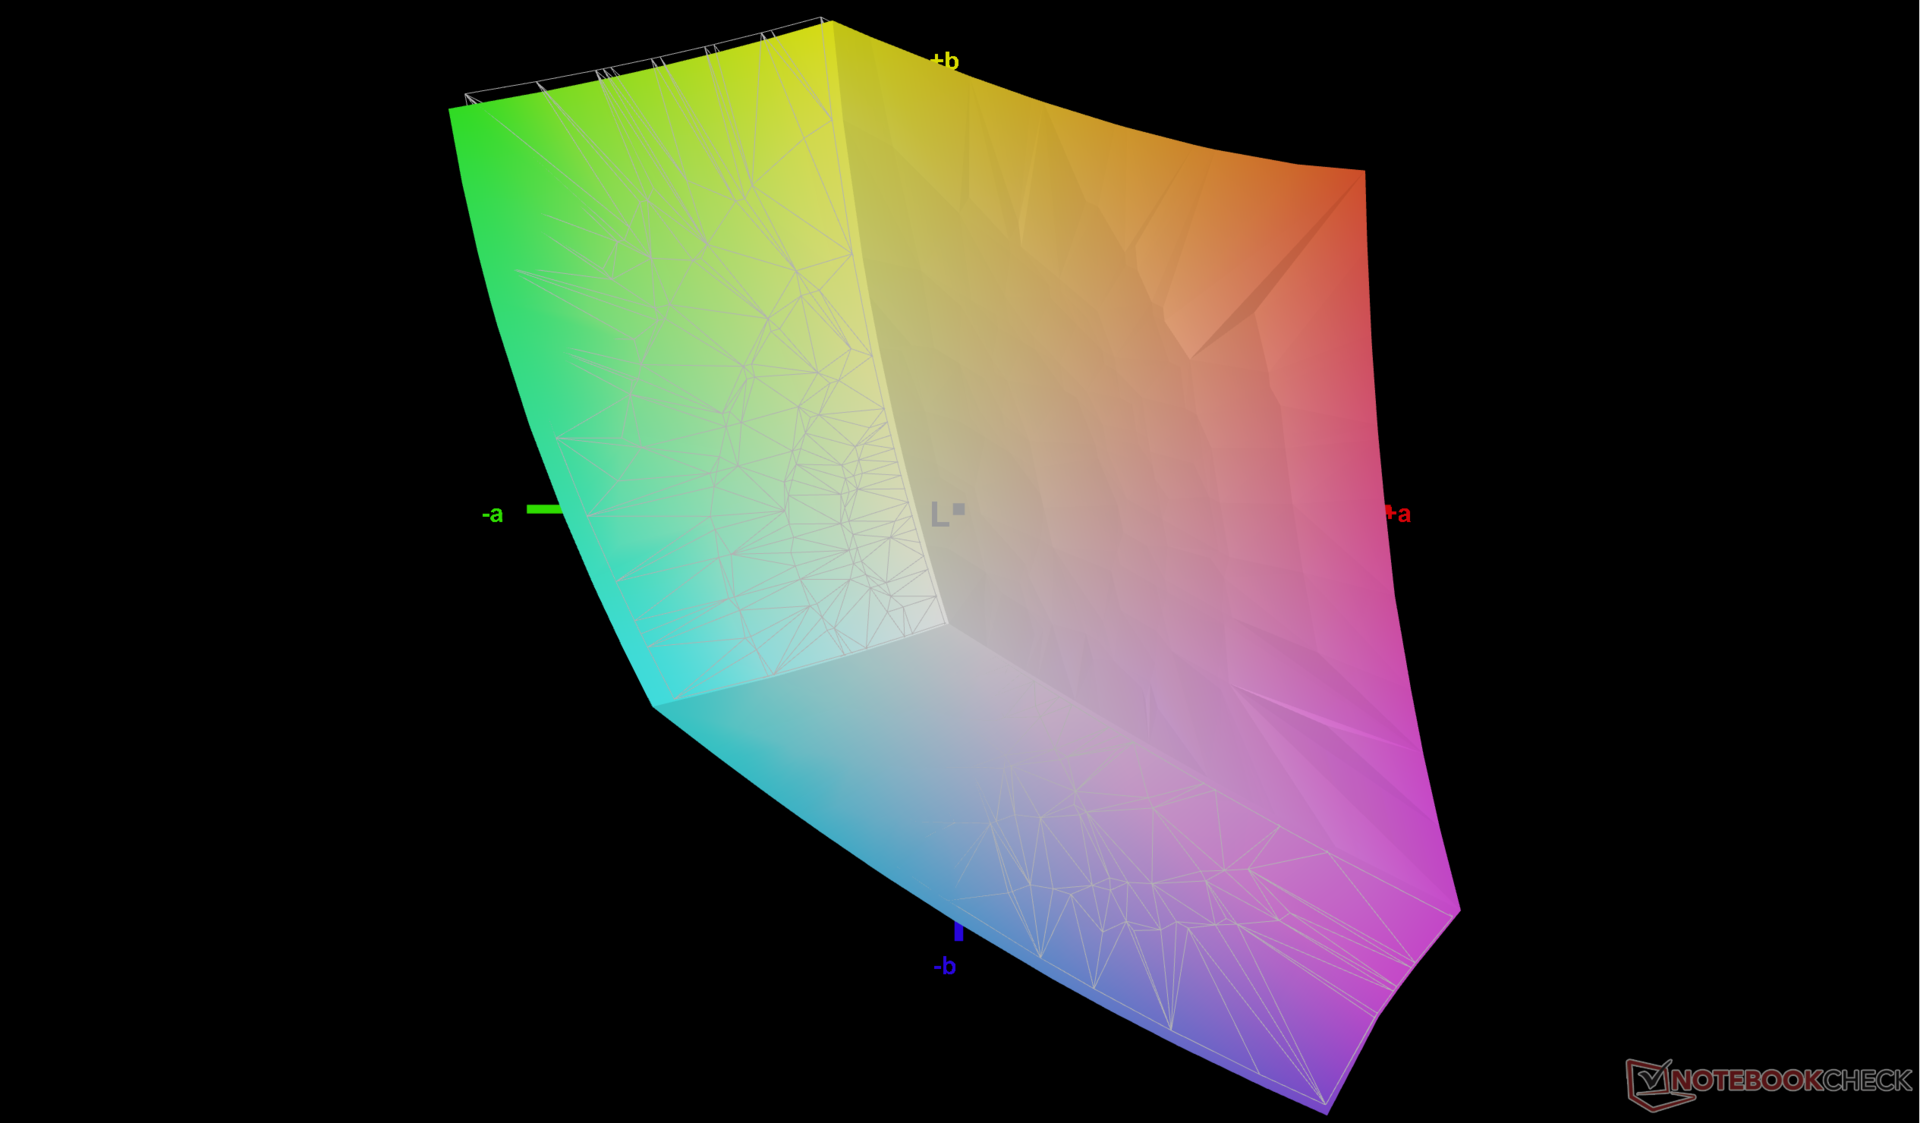
72.5% AdobeRGB 1998 (Argyll 3D)
99.4% sRGB (Argyll 3D)
70.4% Display P3 (Argyll 3D)
Gamma: 2.22
CCT: 6542 K
| Lenovo Legion Slim 7i 16 Gen 8 CSOT T3 MNG007DA2-3, IPS, 2560x1600, 16" | HP Omen 16-wf000 BOE0B7D, IPS, 2560x1440, 16.1" | Alienware x16 R1 BOE NE16NZ4, IPS, 2560x1600, 16" | Lenovo Legion Pro 7 RTX4090 MNG007DA2-3 (CSO1628), IPS, 2560x1600, 16" | Asus ROG Strix G16 G614JZ TL160ADMP03-0, IPS, 2560x1600, 16" | Razer Blade 16 Early 2023 CSOT T3 MNG007DA4-1, IPS, 2560x1600, 16" | |
|---|---|---|---|---|---|---|
| Display | -1% | 21% | -1% | 19% | 22% | |
| Display P3 Coverage (%) | 70.4 | 69 -2% | 99.2 41% | 69.5 -1% | 97 38% | 98.5 40% |
| sRGB Coverage (%) | 99.4 | 99.2 0% | 100 1% | 99.8 0% | 99.9 1% | 100 1% |
| AdobeRGB 1998 Coverage (%) | 72.5 | 71.2 -2% | 88.6 22% | 71.6 -1% | 84.9 17% | 89.7 24% |
| Response Times | 27% | 21% | 29% | 42% | 5% | |
| Response Time Grey 50% / Grey 80% * (ms) | 12 ? | 4.6 ? 62% | 5.1 ? 57% | 10.9 ? 9% | 5.1 ? 57% | 6.6 ? 45% |
| Response Time Black / White * (ms) | 8.9 ? | 9.7 ? -9% | 10.3 ? -16% | 4.6 ? 48% | 6.6 ? 26% | 12 ? -35% |
| PWM Frequency (Hz) | ||||||
| Screen | -5% | -11% | -5% | -4% | -12% | |
| Brightness middle (cd/m²) | 474.6 | 310.9 -34% | 302.2 -36% | 491 3% | 470 -1% | 456.8 -4% |
| Brightness (cd/m²) | 445 | 296 -33% | 285 -36% | 472 6% | 459 3% | 437 -2% |
| Brightness Distribution (%) | 86 | 91 6% | 89 3% | 91 6% | 93 8% | 83 -3% |
| Black Level * (cd/m²) | 0.39 | 0.35 10% | 0.26 33% | 0.4 -3% | 0.42 -8% | 0.35 10% |
| Contrast (:1) | 1217 | 888 -27% | 1162 -5% | 1228 1% | 1119 -8% | 1305 7% |
| Colorchecker dE 2000 * | 2.12 | 2.18 -3% | 1.63 23% | 1.6 25% | 1.86 12% | 3.7 -75% |
| Colorchecker dE 2000 max. * | 4.73 | 3.58 24% | 4.13 13% | 5.15 -9% | 3.87 18% | 6.42 -36% |
| Colorchecker dE 2000 calibrated * | 0.57 | 0.52 9% | 1.17 -105% | 0.97 -70% | 0.93 -63% | 0.66 -16% |
| Greyscale dE 2000 * | 2.8 | 2.8 -0% | 2.5 11% | 3 -7% | 2.7 4% | 2.6 7% |
| Gamma | 2.22 99% | 2.18 101% | 2.23 99% | 2.211 100% | 2.246 98% | 2.3 96% |
| CCT | 6542 99% | 6002 108% | 6590 99% | 6979 93% | 6711 97% | 6108 106% |
| Moyenne finale (programmes/paramètres) | 7% /
0% | 10% /
0% | 8% /
1% | 19% /
7% | 5% /
-3% |
* ... Moindre est la valeur, meilleures sont les performances
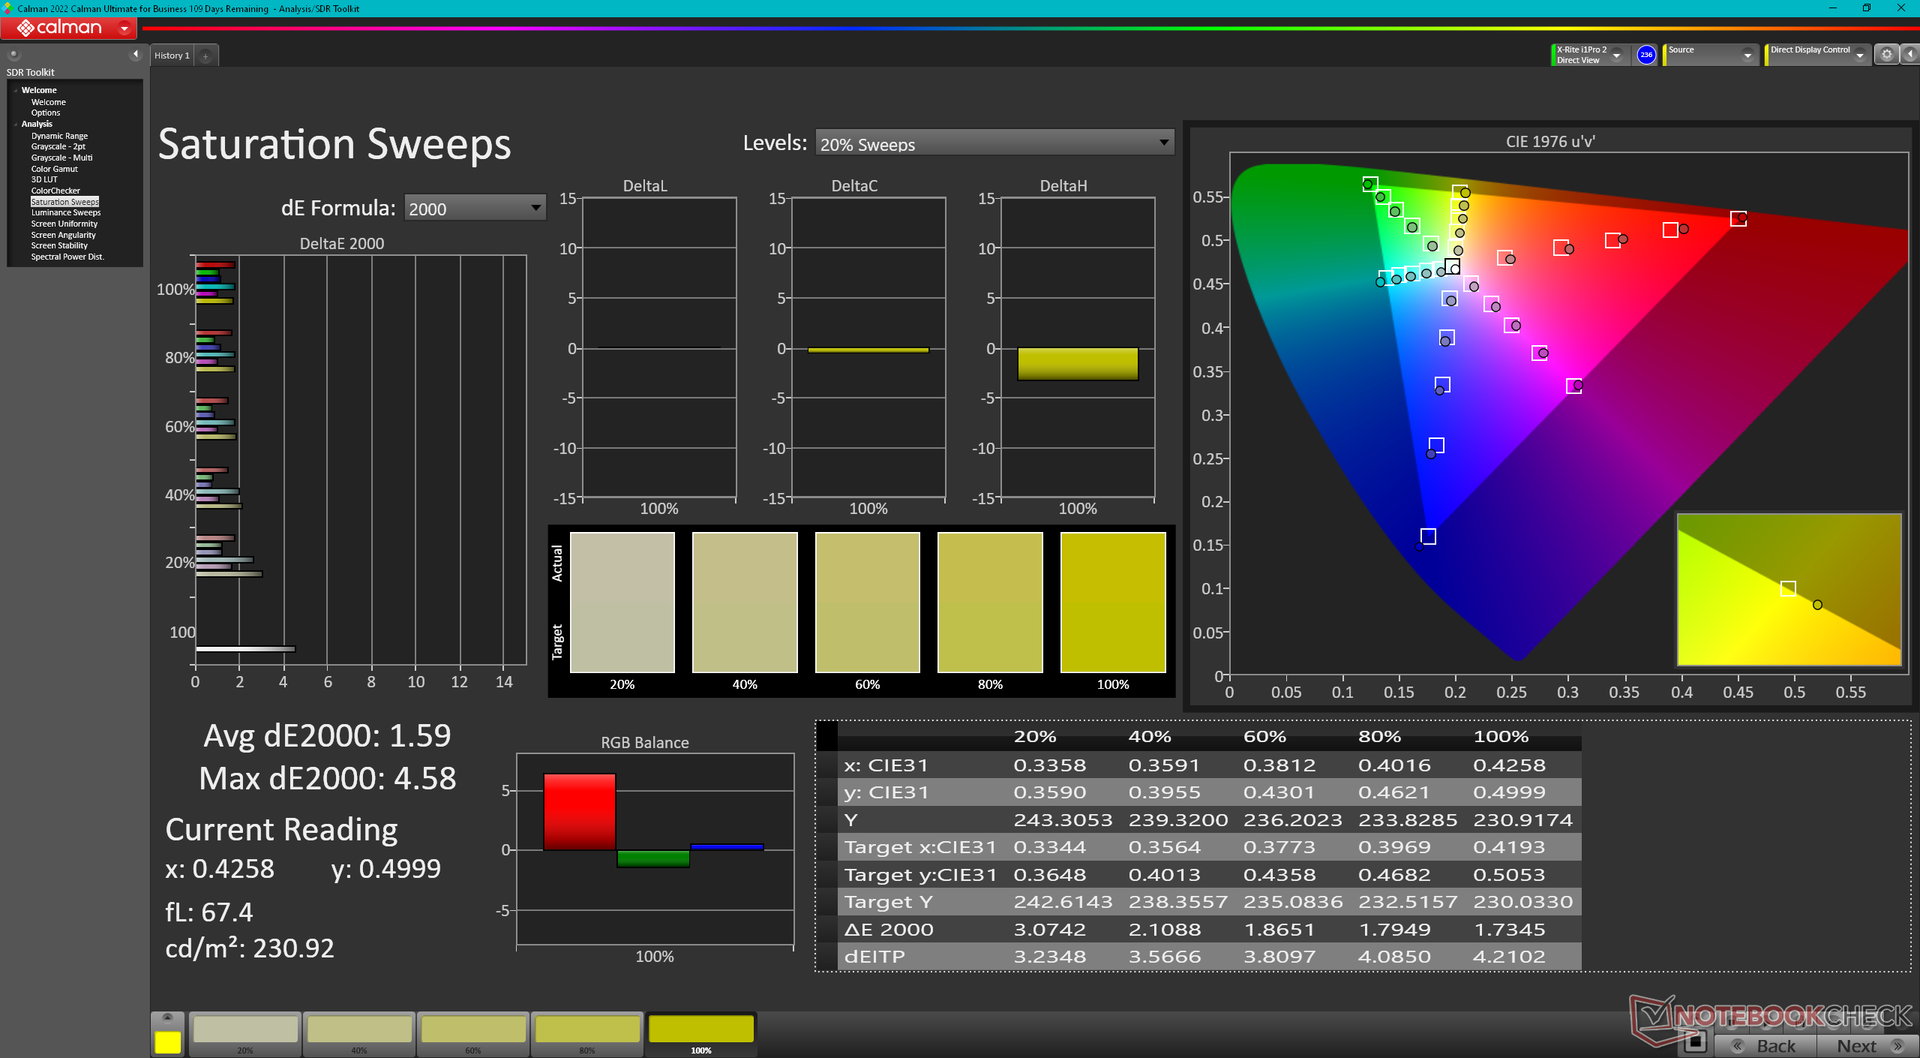
L'écran est pré-calibré avec des valeurs moyennes de deltaE en niveaux de gris et en couleurs de seulement 2,8 et 2,12, respectivement. En l'étalonnant nous-mêmes à l'aide d'un colorimètre X-Rite, nous améliorerions encore ces moyennes, qui atteindraient respectivement 0,8 et 0,57. Un étalonnage par l'utilisateur final n'est donc pas entièrement nécessaire, mais notre profil ICM étalonné est néanmoins disponible gratuitement ci-dessus pour les utilisateurs intéressés.
Temps de réponse de l'écran
| ↔ Temps de réponse noir à blanc | ||
|---|---|---|
| 8.9 ms ... hausse ↗ et chute ↘ combinées | ↗ 5.1 ms hausse | 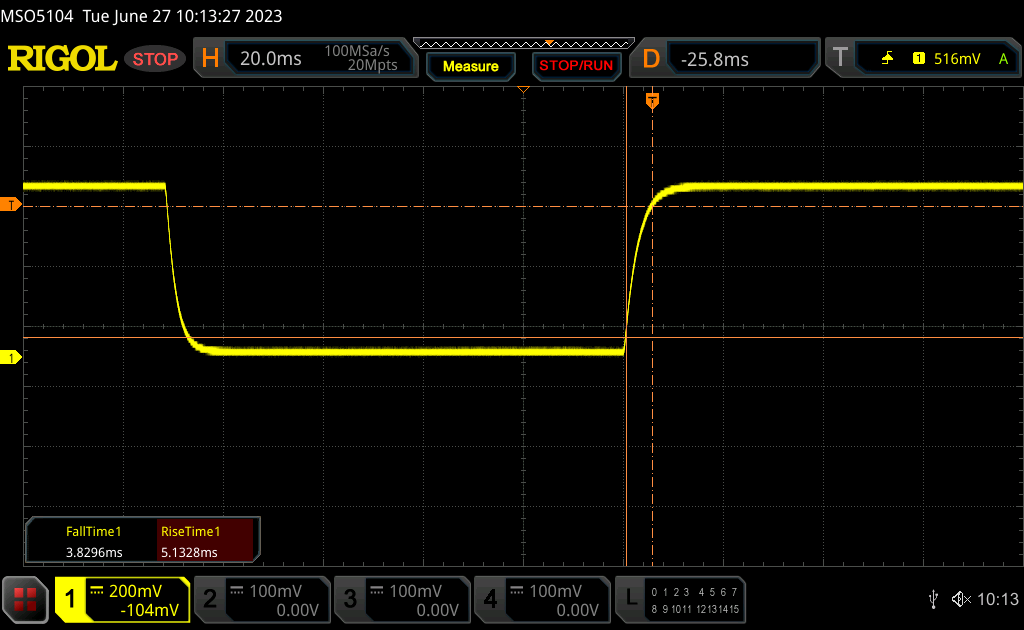 |
| ↘ 3.8 ms chute | ||
| L'écran montre de faibles temps de réponse, un bon écran pour jouer. En comparaison, tous les appareils testés affichent entre 0.1 (minimum) et 240 (maximum) ms. » 25 % des appareils testés affichent de meilleures performances. Cela signifie que les latences relevées sont meilleures que la moyenne (19.8 ms) de tous les appareils testés. | ||
| ↔ Temps de réponse gris 50% à gris 80% | ||
| 12 ms ... hausse ↗ et chute ↘ combinées | ↗ 6 ms hausse | 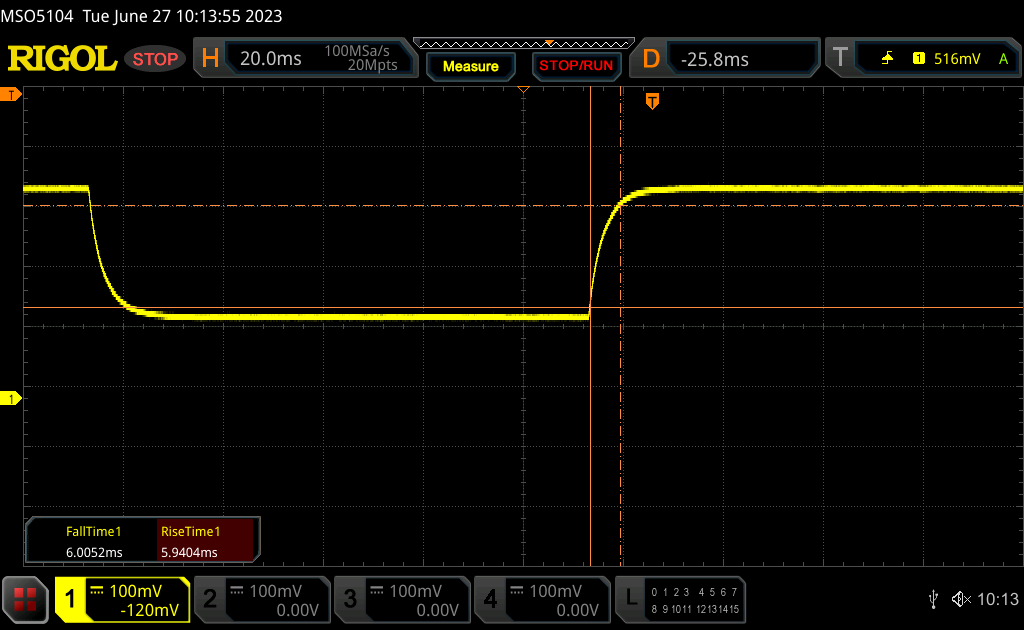 |
| ↘ 6 ms chute | ||
| L'écran montre de bons temps de réponse, mais insuffisant pour du jeu compétitif. En comparaison, tous les appareils testés affichent entre 0.165 (minimum) et 636 (maximum) ms. » 25 % des appareils testés affichent de meilleures performances. Cela signifie que les latences relevées sont meilleures que la moyenne (31 ms) de tous les appareils testés. | ||
Scintillement / MLI (Modulation de largeur d'impulsion)
| Scintillement / MLI (Modulation de largeur d'impulsion) non décelé | 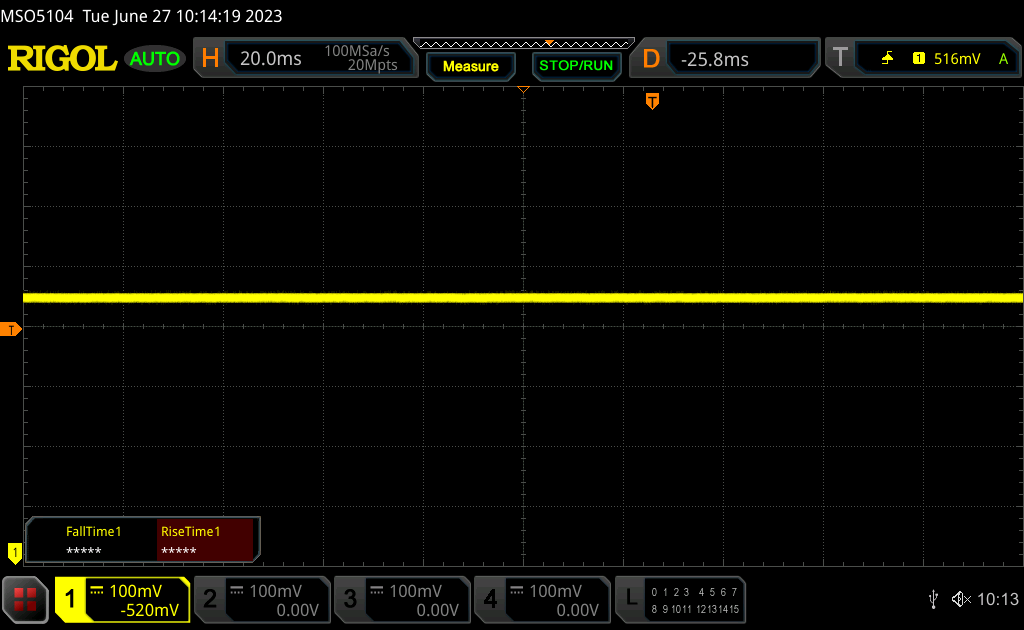 | ||
En comparaison, 52 % des appareils testés n'emploient pas MDI pour assombrir leur écran. Nous avons relevé une moyenne à 7769 (minimum : 5 - maximum : 343500) Hz dans le cas où une MDI était active. | |||
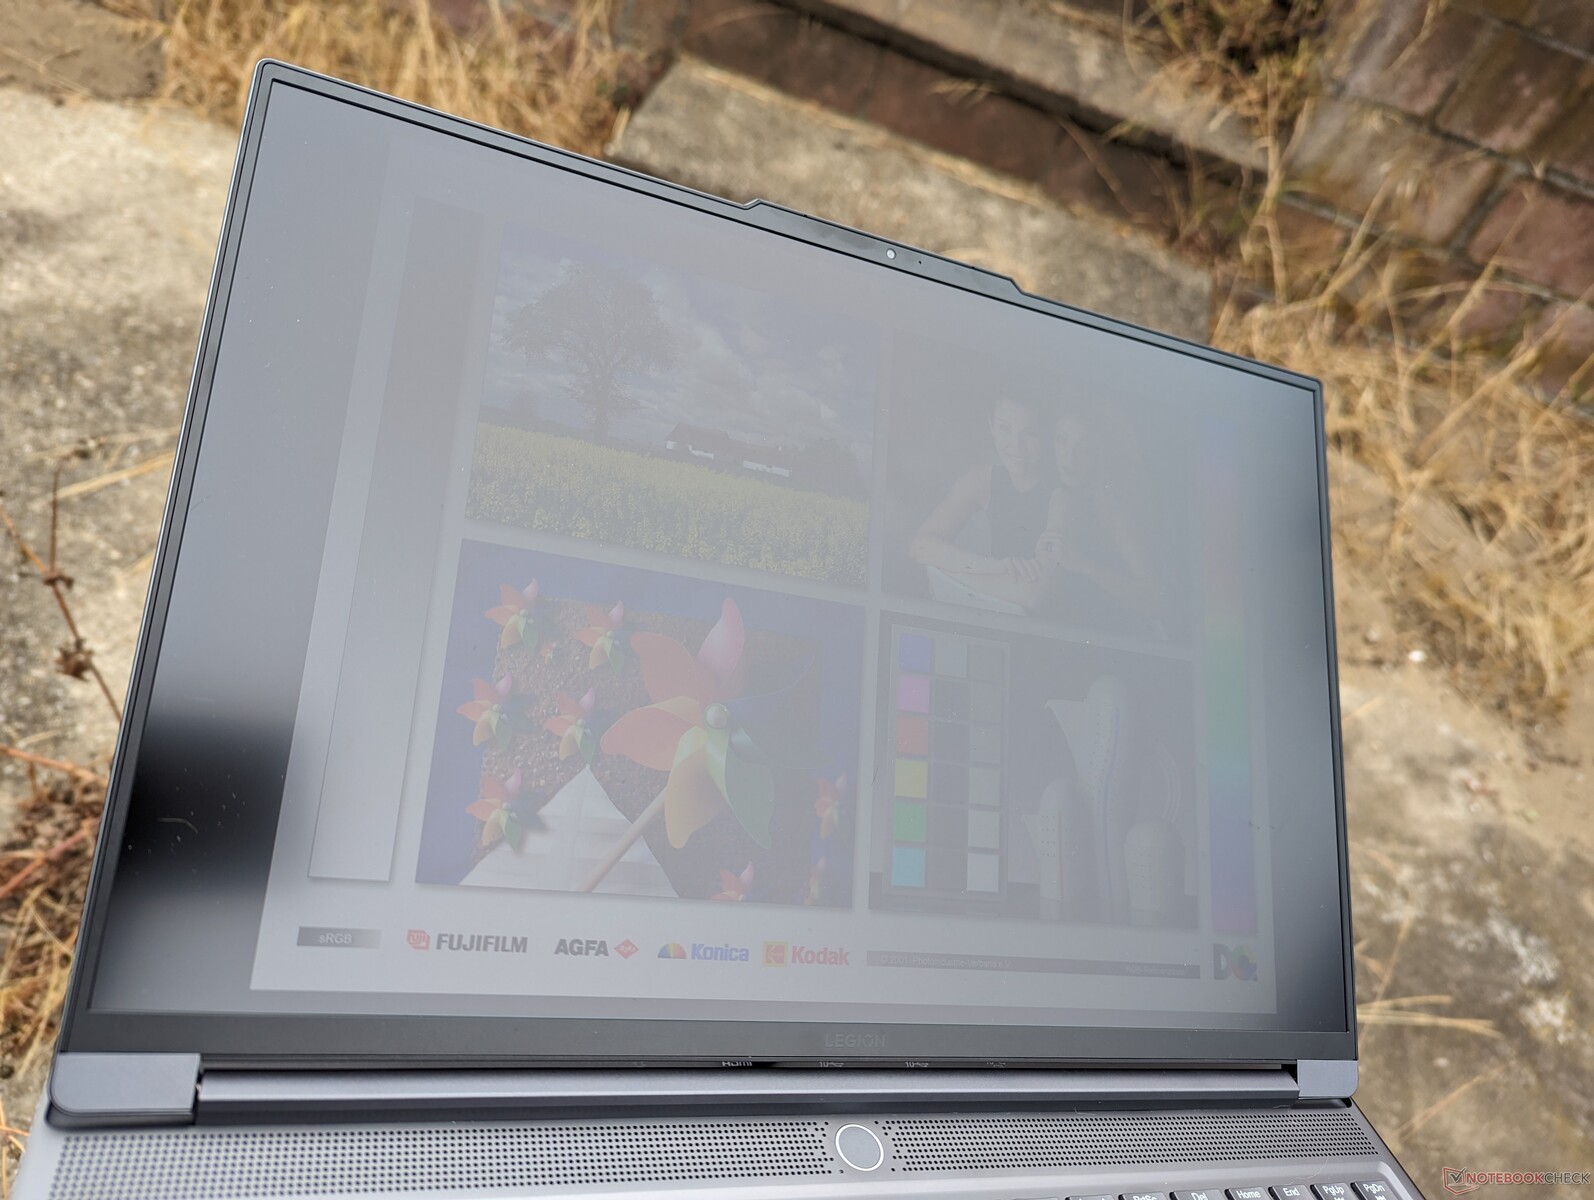
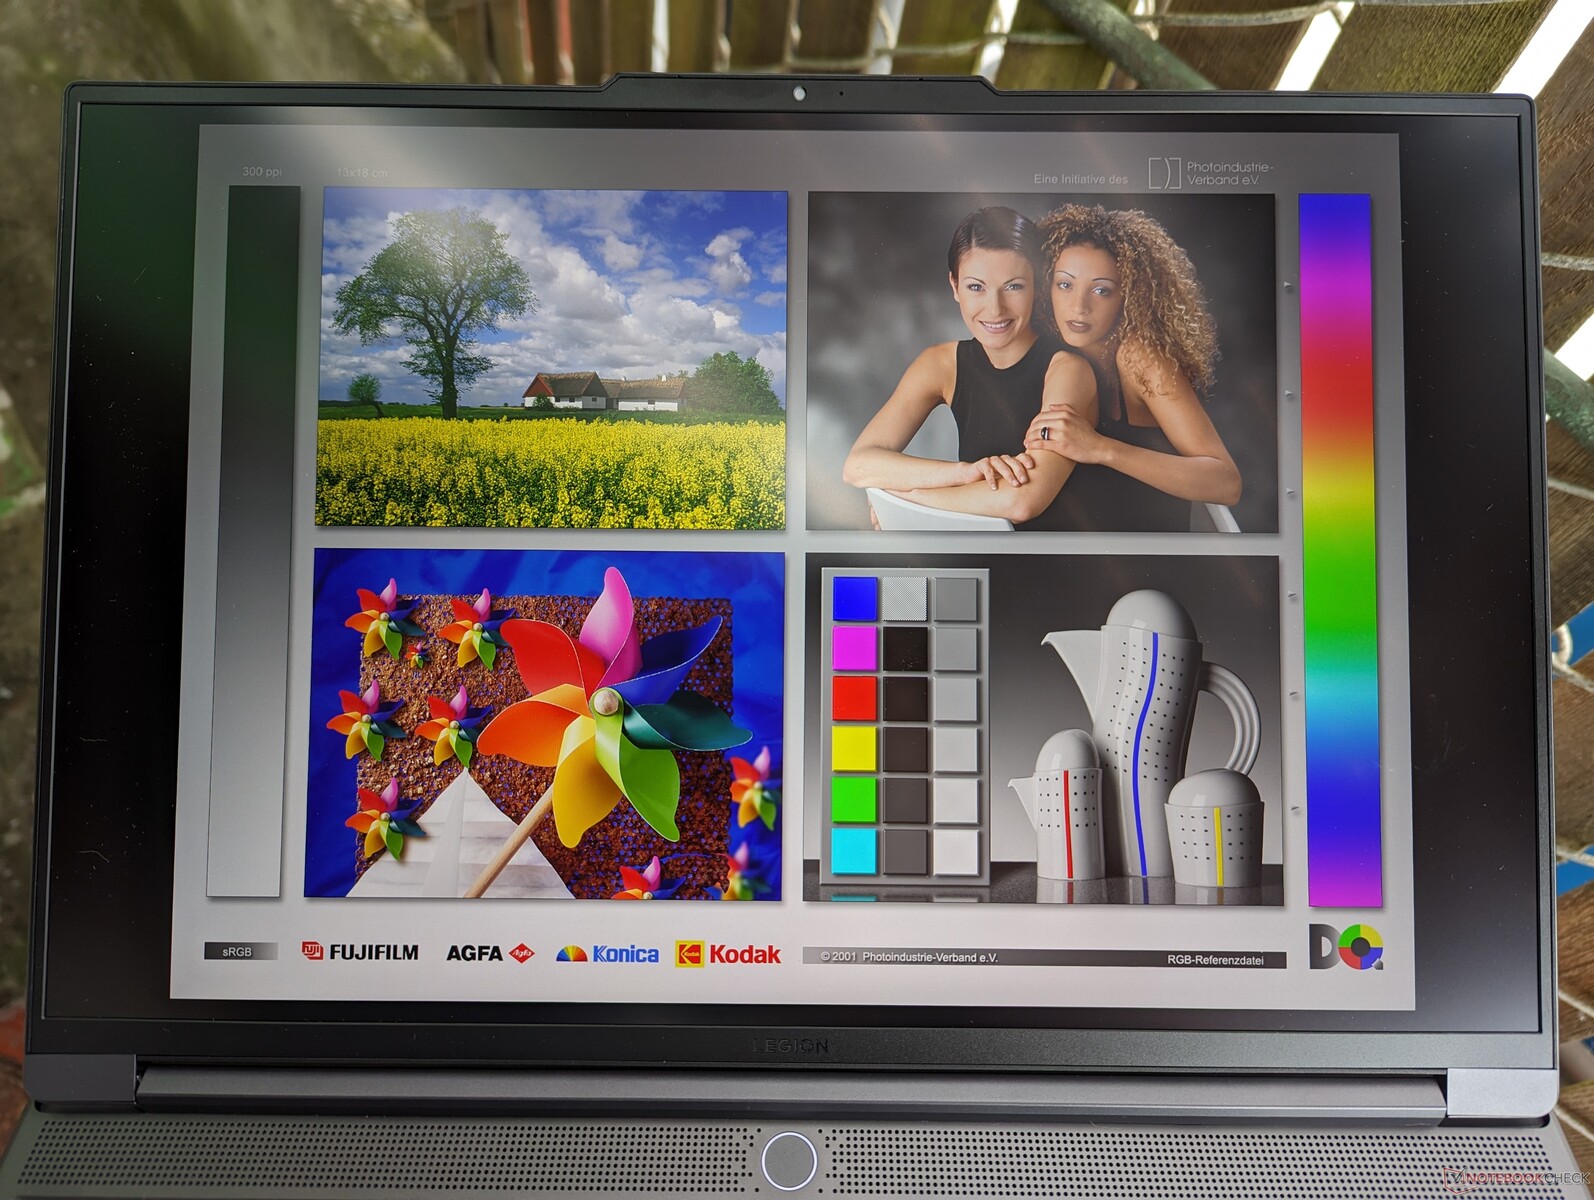
L'écran est nettement plus lumineux que celui duOmen 16 ou Alienware x16 R1 pour une meilleure lisibilité à l'extérieur. En fait, sa luminosité maximale n'est que de 10 % inférieure à celle du MacBook Pro 16.
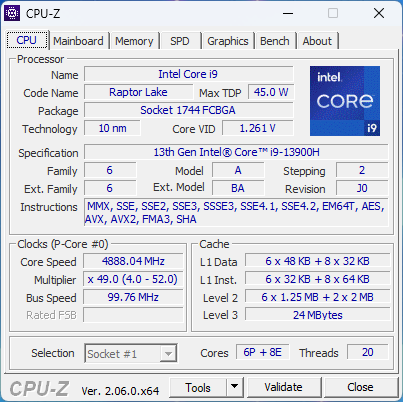
Performances - Core i9 de 13e génération
Conditions d'essai
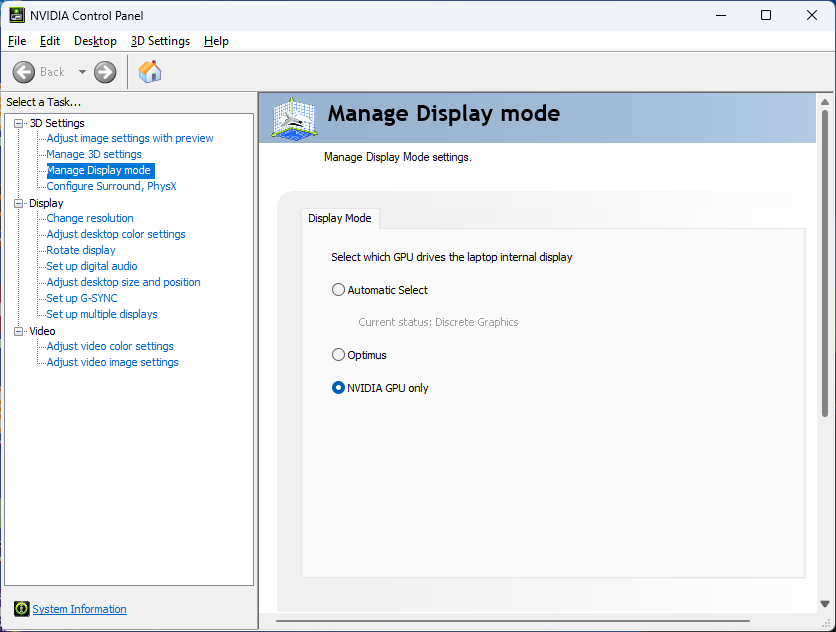
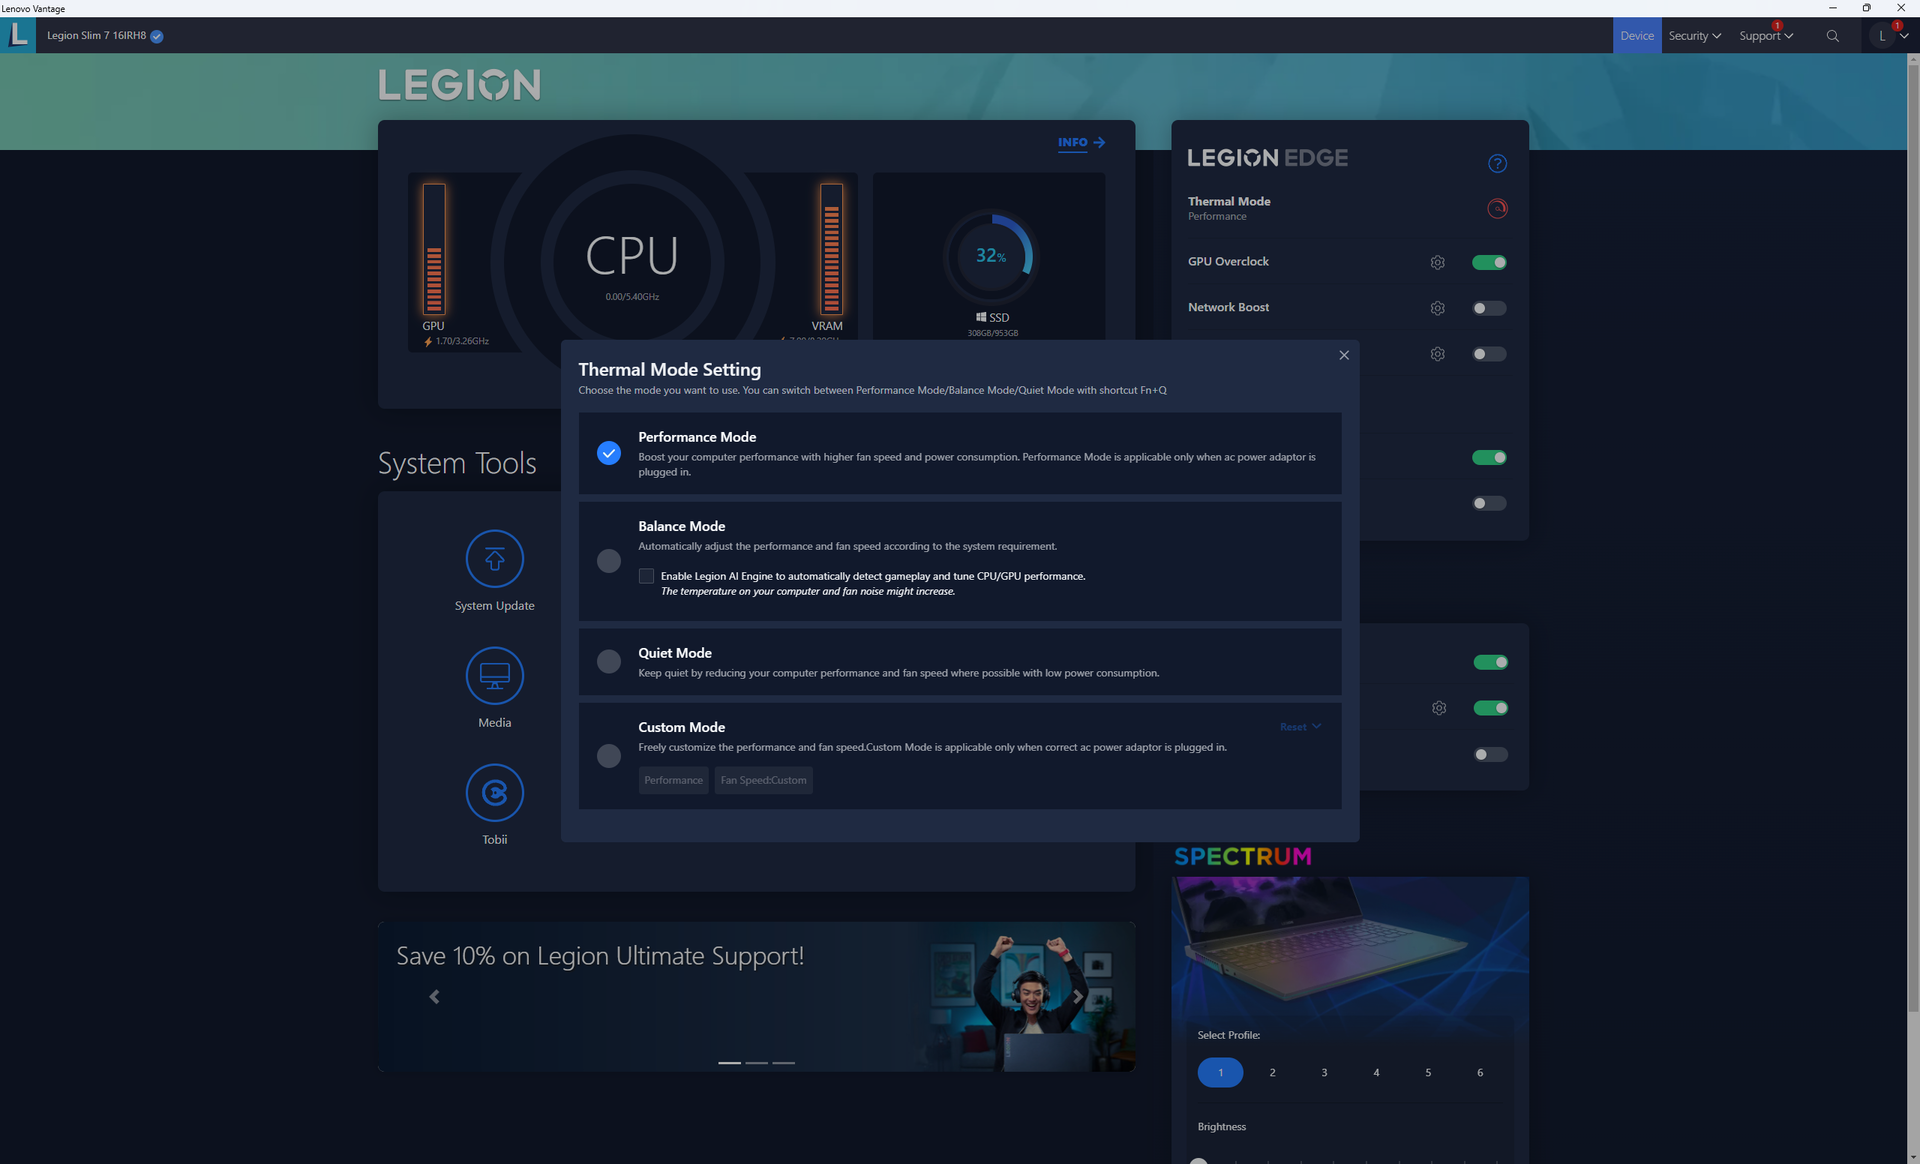
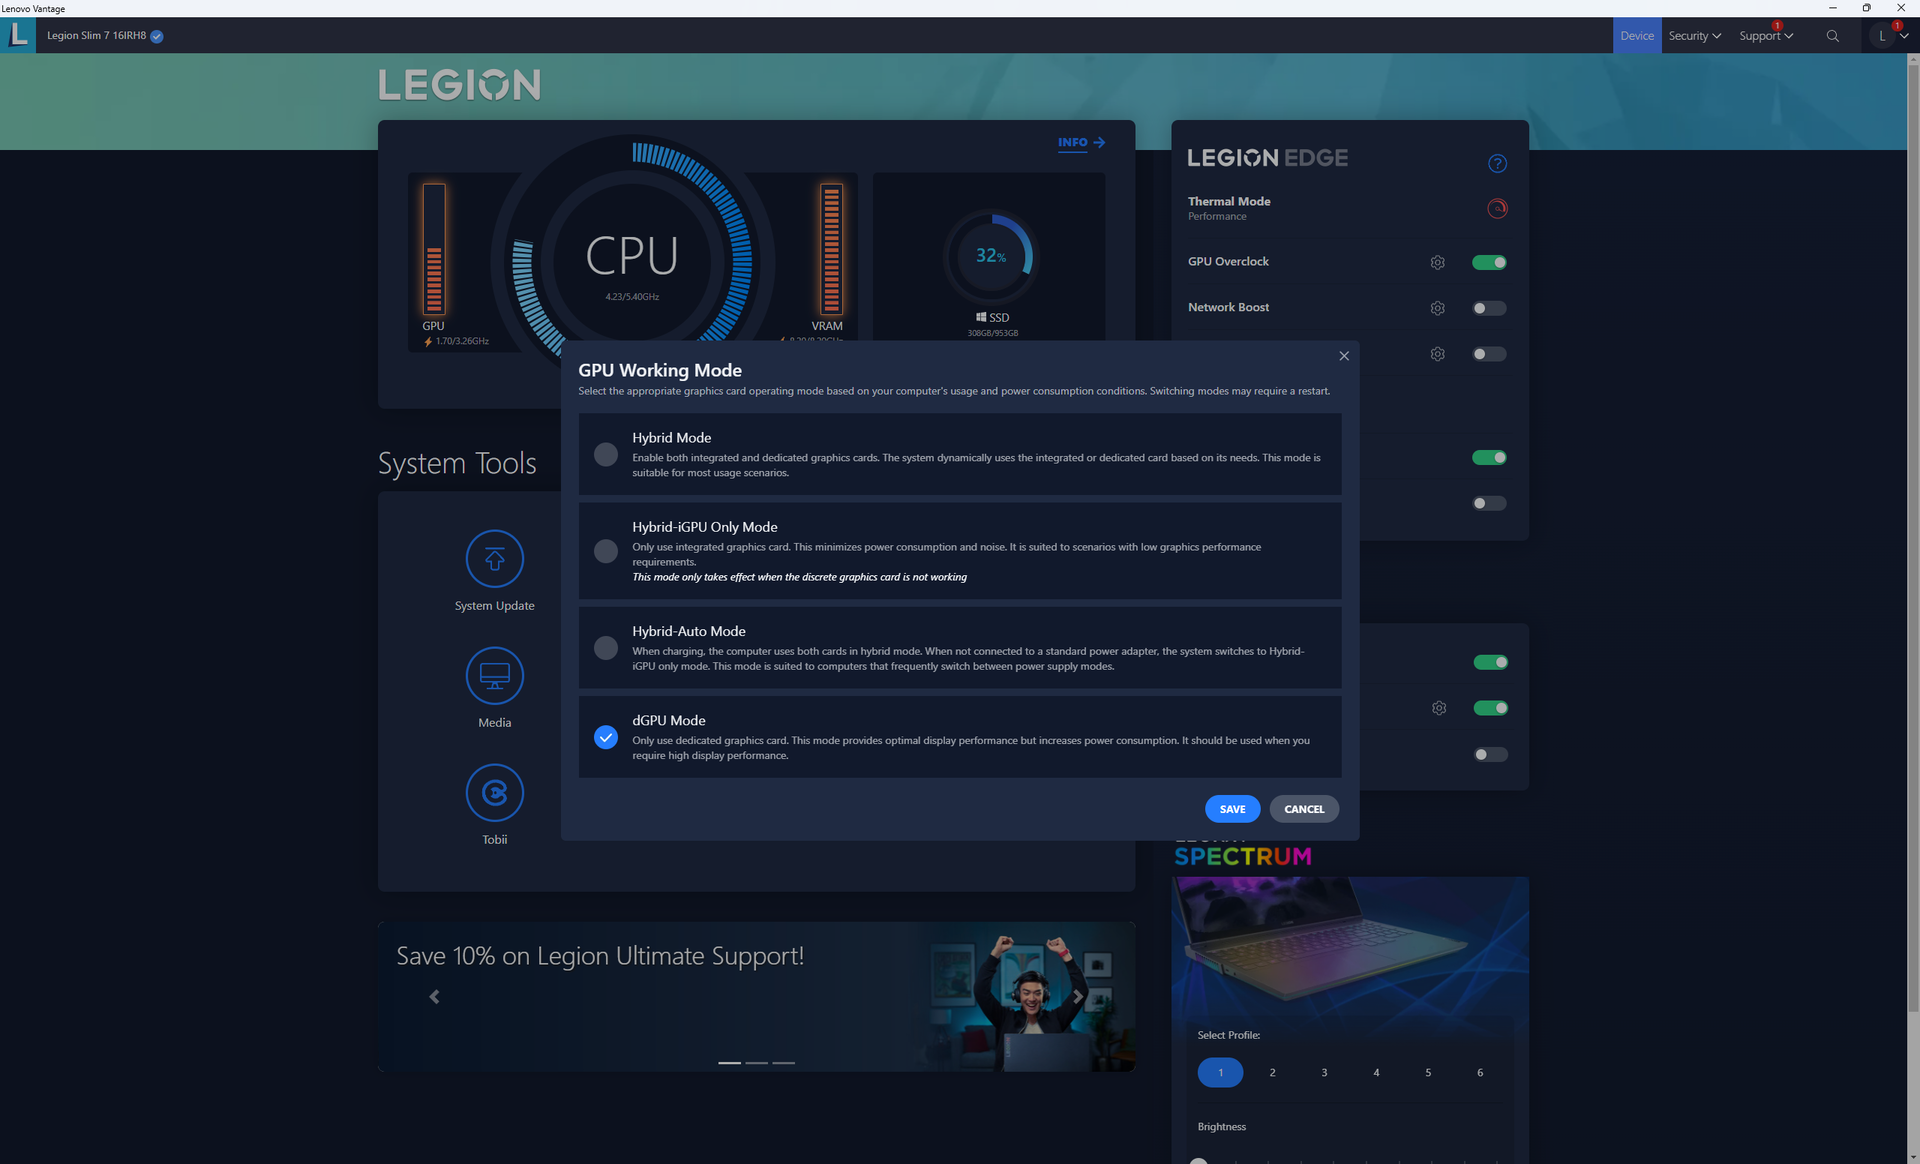
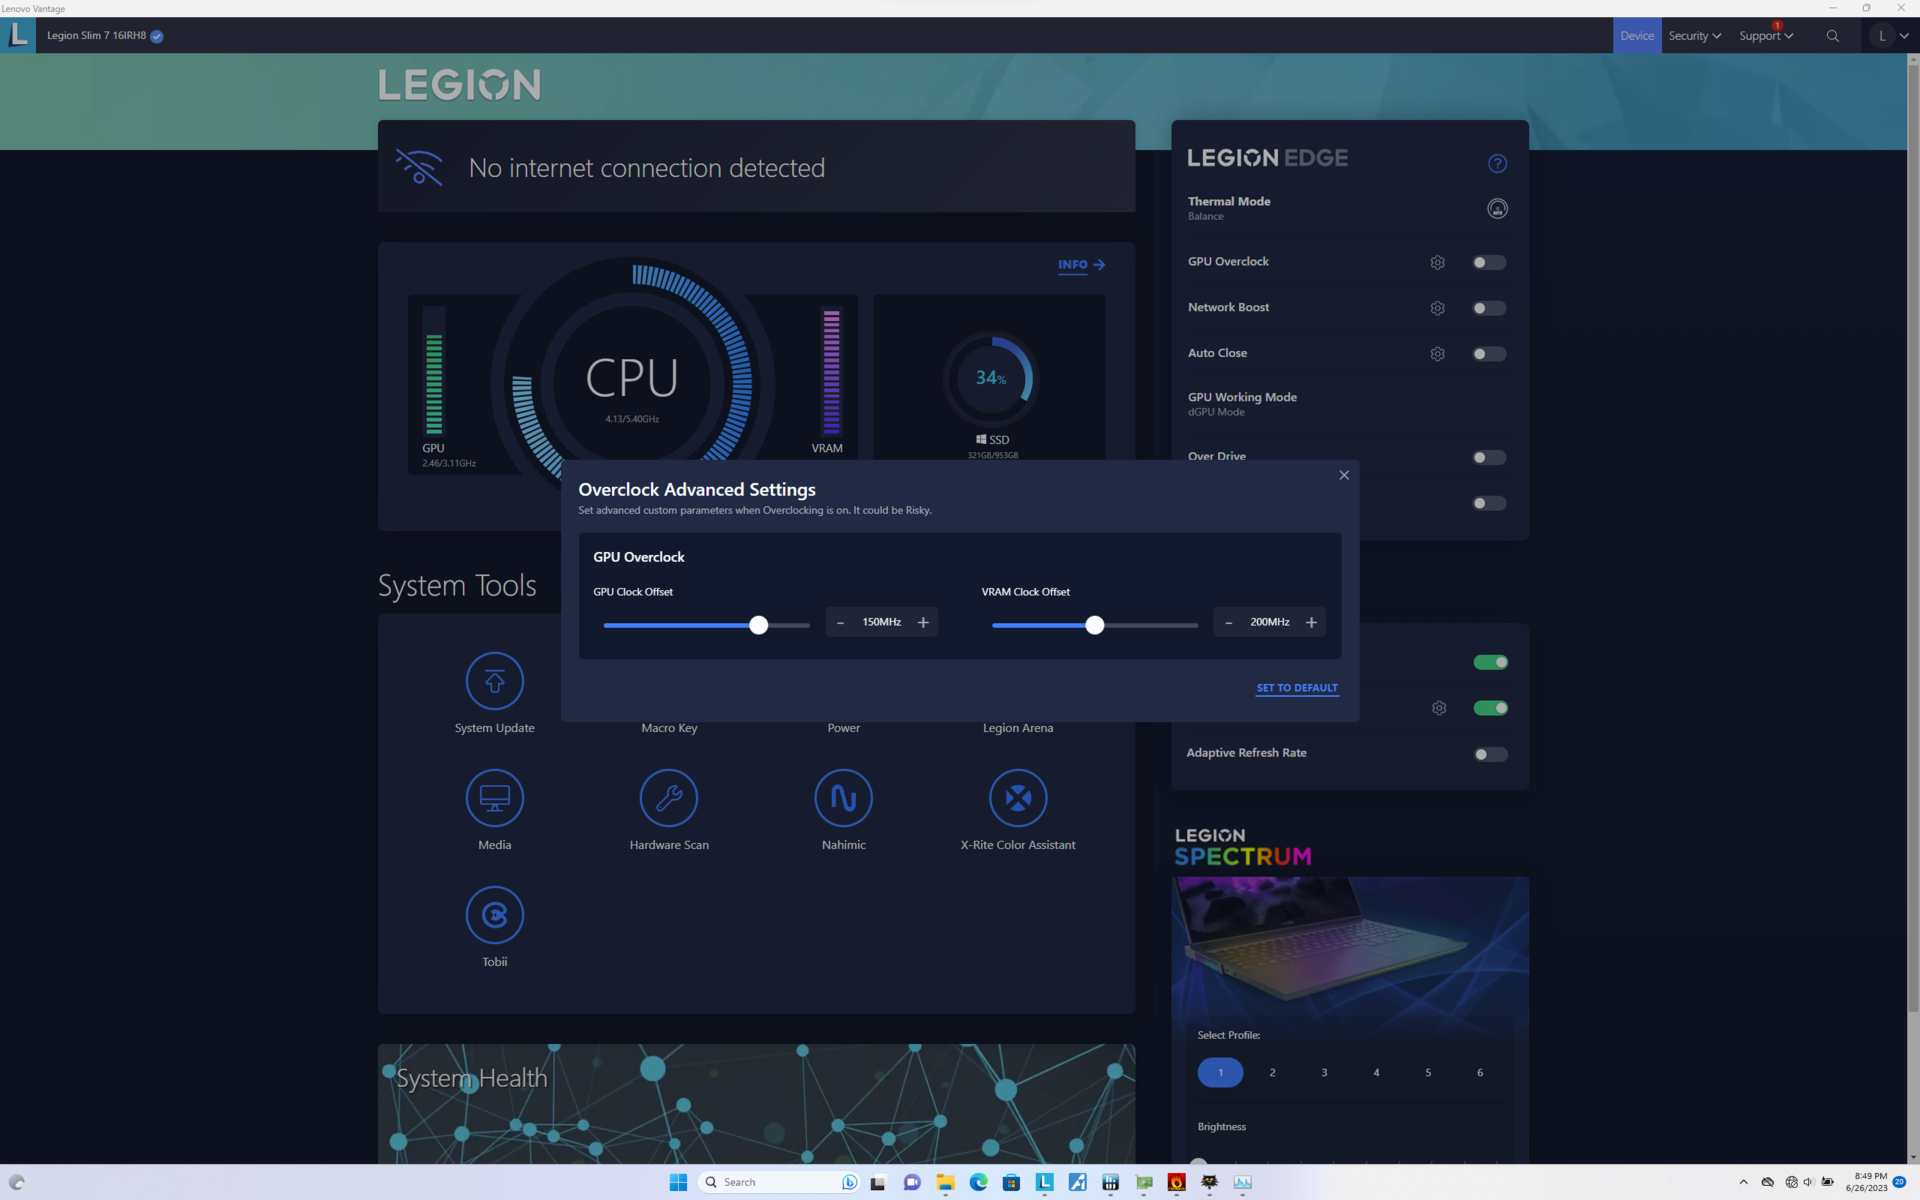
Nous avons réglé notre appareil en mode dGPU et en mode Performance avec l'Overclock GPU et l'Overdrive actifs avant de lancer les benchmarks ci-dessous. Lenovo Vantage est le centre de contrôle permettant d'ajuster les performances, les mises à jour, la garantie, le RGB et d'autres fonctionnalités.
Advanced Optimus ou MUX est pris en charge.
Il est important de noter que notre appareil dispose d'un emplacement SODIMM inoccupé et qu'il fonctionne donc uniquement avec 16 Go de RAM soudée à canal unique. Les résultats du benchmark mémoire AIDA64 sont donc beaucoup plus bas que sur la plupart des autres ordinateurs portables de jeu.
Processeur
Le Raptor Lake-H Core i9-13900H offre une amélioration respectable de 25 % des performances multithread par rapport au Core i9-12900H Alder Lake-H Core i9-12900H. En particulier, ses performances sont pratiquement identiques à celles du Core i7-13700HX plus onéreux.Core i7-13700HX et les Core i9-13900HK Core i9-13900HK. Si vous devez choisir entre l'un de ces trois processeurs de 13e génération, l'option Core i9-13900H est la plus rentable.
En rétrogradant vers le processeur de base Core i7-13700H devrait réduire les performances du processeur d'environ 20 à 25 %.
Cinebench R15 Multi Loop
Cinebench R20: CPU (Multi Core) | CPU (Single Core)
Cinebench R23: Multi Core | Single Core
Cinebench R15: CPU Multi 64Bit | CPU Single 64Bit
Blender: v2.79 BMW27 CPU
7-Zip 18.03: 7z b 4 | 7z b 4 -mmt1
Geekbench 5.5: Multi-Core | Single-Core
HWBOT x265 Benchmark v2.2: 4k Preset
LibreOffice : 20 Documents To PDF
R Benchmark 2.5: Overall mean
* ... Moindre est la valeur, meilleures sont les performances
AIDA64: FP32 Ray-Trace | FPU Julia | CPU SHA3 | CPU Queen | FPU SinJulia | FPU Mandel | CPU AES | CPU ZLib | FP64 Ray-Trace | CPU PhotoWorxx
| Performance rating | |
| Lenovo Legion Pro 7 RTX4090 | |
| Asus ROG Strix G16 G614JZ | |
| Razer Blade 16 Early 2023 | |
| Alienware x16 R1 | |
| HP Omen 16-wf000 | |
| Lenovo Legion Slim 7i 16 Gen 8 | |
| Moyenne Intel Core i9-13900H | |
| AIDA64 / FP32 Ray-Trace | |
| Asus ROG Strix G16 G614JZ | |
| Lenovo Legion Pro 7 RTX4090 | |
| Razer Blade 16 Early 2023 | |
| Razer Blade 16 Early 2023 | |
| Razer Blade 16 Early 2023 | |
| HP Omen 16-wf000 | |
| Alienware x16 R1 | |
| Lenovo Legion Slim 7i 16 Gen 8 | |
| Moyenne Intel Core i9-13900H (6788 - 19557, n=25) | |
| AIDA64 / CPU Queen | |
| Asus ROG Strix G16 G614JZ | |
| Lenovo Legion Pro 7 RTX4090 | |
| Razer Blade 16 Early 2023 | |
| Razer Blade 16 Early 2023 | |
| Lenovo Legion Slim 7i 16 Gen 8 | |
| Alienware x16 R1 | |
| Moyenne Intel Core i9-13900H (65121 - 120936, n=25) | |
| HP Omen 16-wf000 | |
| AIDA64 / FPU SinJulia | |
| Asus ROG Strix G16 G614JZ | |
| Razer Blade 16 Early 2023 | |
| Razer Blade 16 Early 2023 | |
| Razer Blade 16 Early 2023 | |
| Lenovo Legion Pro 7 RTX4090 | |
| HP Omen 16-wf000 | |
| Alienware x16 R1 | |
| Lenovo Legion Slim 7i 16 Gen 8 | |
| Moyenne Intel Core i9-13900H (6108 - 11631, n=25) | |
| AIDA64 / FP64 Ray-Trace | |
| Asus ROG Strix G16 G614JZ | |
| Lenovo Legion Pro 7 RTX4090 | |
| Razer Blade 16 Early 2023 | |
| Razer Blade 16 Early 2023 | |
| Razer Blade 16 Early 2023 | |
| HP Omen 16-wf000 | |
| Alienware x16 R1 | |
| Lenovo Legion Slim 7i 16 Gen 8 | |
| Moyenne Intel Core i9-13900H (3655 - 10716, n=25) | |
| AIDA64 / CPU PhotoWorxx | |
| Razer Blade 16 Early 2023 | |
| Razer Blade 16 Early 2023 | |
| Razer Blade 16 Early 2023 | |
| Lenovo Legion Pro 7 RTX4090 | |
| Alienware x16 R1 | |
| HP Omen 16-wf000 | |
| Moyenne Intel Core i9-13900H (10871 - 50488, n=25) | |
| Asus ROG Strix G16 G614JZ | |
| Lenovo Legion Slim 7i 16 Gen 8 | |
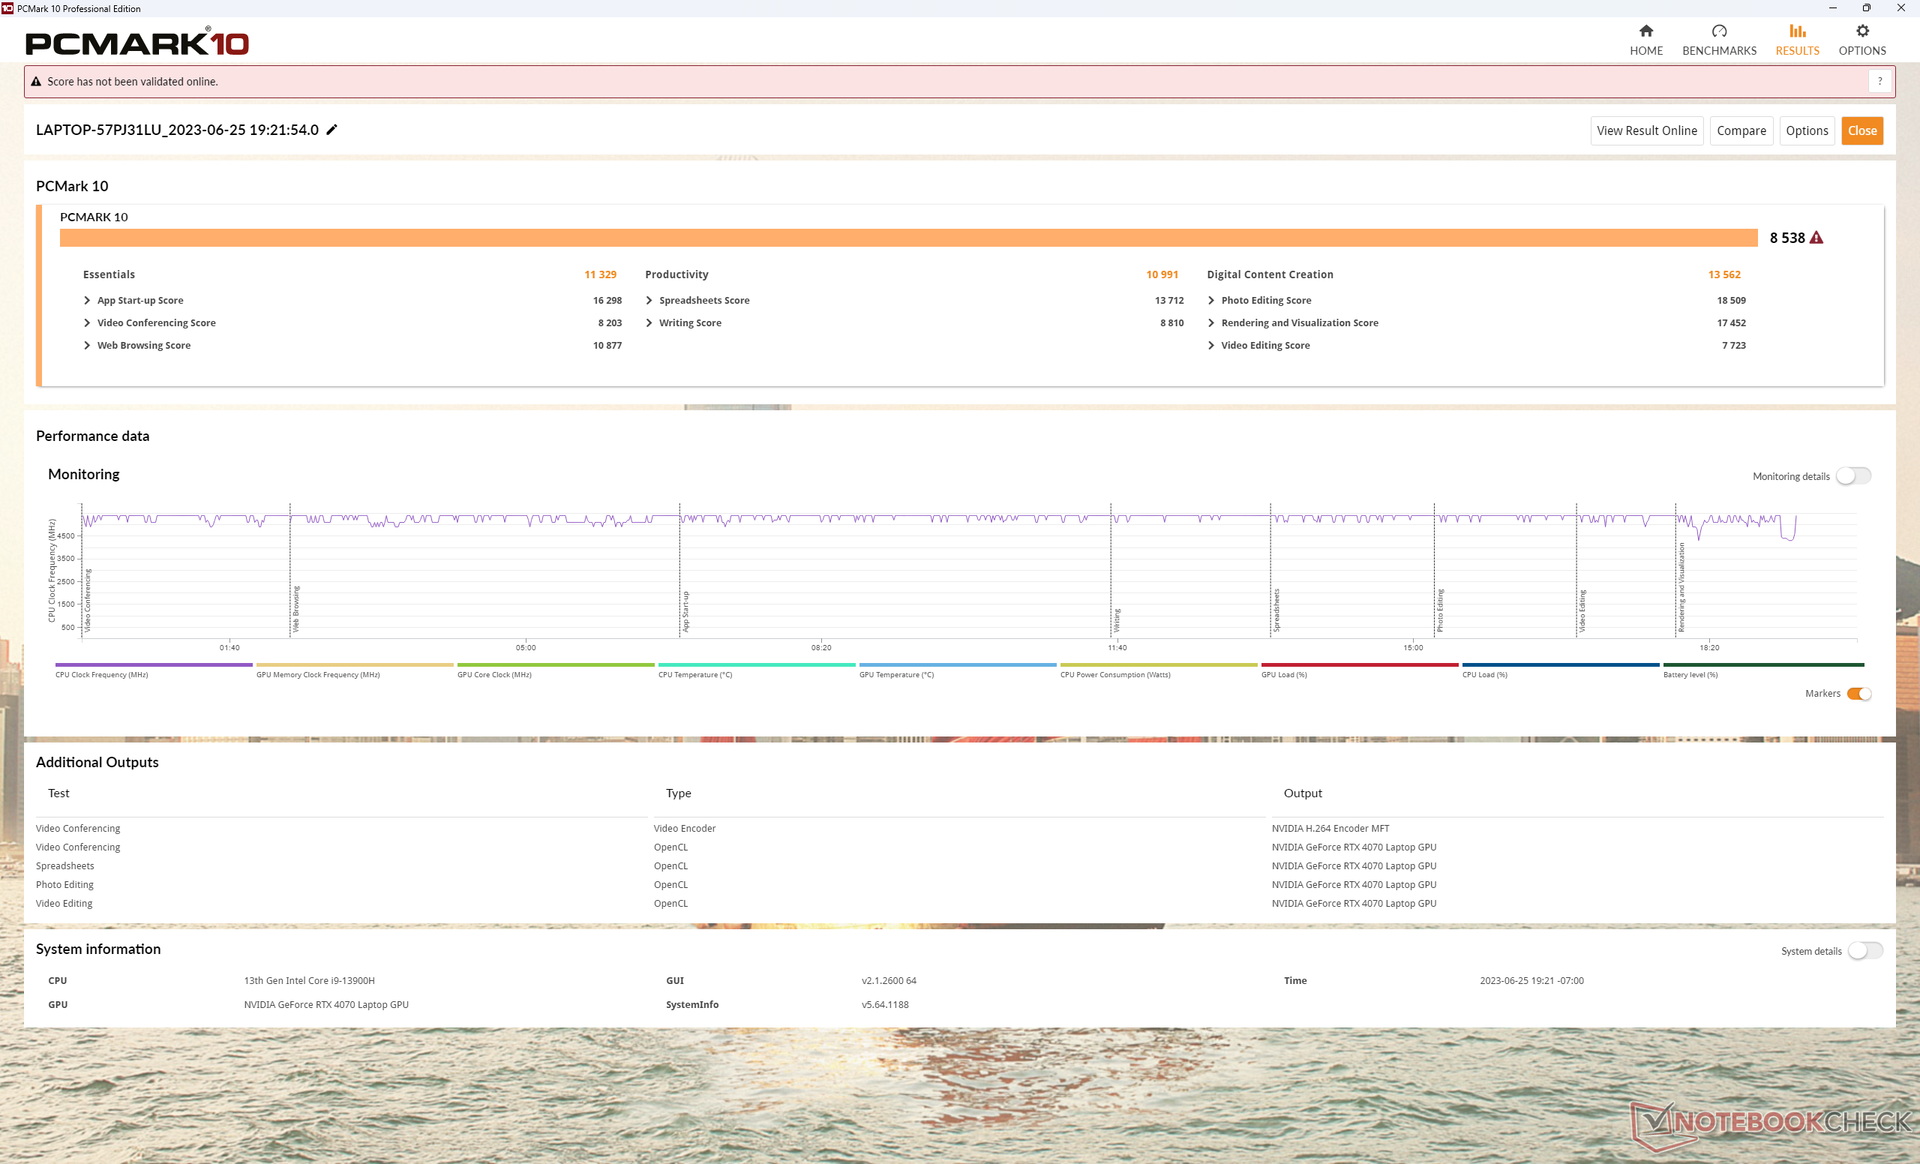
Performance du système
Les résultats de PCMark sont excellents et comparables à ceux d'autres ordinateurs portables de jeu haut de gamme. Cependant, nous avons rencontré des problèmes de sortie de veille : l'écran mettait souvent jusqu'à 10 secondes avant de s'allumer correctement, alors qu'il ne mettait que quelques secondes au maximum sur d'autres ordinateurs portables.
CrossMark: Overall | Productivity | Creativity | Responsiveness
| PCMark 10 / Score | |
| Lenovo Legion Slim 7i 16 Gen 8 | |
| Alienware x16 R1 | |
| Lenovo Legion Pro 7 RTX4090 | |
| Razer Blade 16 Early 2023 | |
| HP Omen 16-wf000 | |
| Moyenne Intel Core i9-13900H, NVIDIA GeForce RTX 4070 Laptop GPU (5855 - 8538, n=8) | |
| Asus ROG Strix G16 G614JZ | |
| PCMark 10 / Essentials | |
| Asus ROG Strix G16 G614JZ | |
| Lenovo Legion Slim 7i 16 Gen 8 | |
| Alienware x16 R1 | |
| Lenovo Legion Pro 7 RTX4090 | |
| Razer Blade 16 Early 2023 | |
| Moyenne Intel Core i9-13900H, NVIDIA GeForce RTX 4070 Laptop GPU (8835 - 11940, n=8) | |
| HP Omen 16-wf000 | |
| PCMark 10 / Productivity | |
| Lenovo Legion Slim 7i 16 Gen 8 | |
| Alienware x16 R1 | |
| Moyenne Intel Core i9-13900H, NVIDIA GeForce RTX 4070 Laptop GPU (7967 - 10991, n=8) | |
| HP Omen 16-wf000 | |
| Lenovo Legion Pro 7 RTX4090 | |
| Razer Blade 16 Early 2023 | |
| Asus ROG Strix G16 G614JZ | |
| PCMark 10 / Digital Content Creation | |
| Lenovo Legion Pro 7 RTX4090 | |
| Razer Blade 16 Early 2023 | |
| Alienware x16 R1 | |
| Lenovo Legion Slim 7i 16 Gen 8 | |
| HP Omen 16-wf000 | |
| Moyenne Intel Core i9-13900H, NVIDIA GeForce RTX 4070 Laptop GPU (7738 - 13575, n=8) | |
| Asus ROG Strix G16 G614JZ | |
| CrossMark / Overall | |
| Asus ROG Strix G16 G614JZ | |
| Lenovo Legion Slim 7i 16 Gen 8 | |
| Alienware x16 R1 | |
| Moyenne Intel Core i9-13900H, NVIDIA GeForce RTX 4070 Laptop GPU (1104 - 1974, n=7) | |
| HP Omen 16-wf000 | |
| Razer Blade 16 Early 2023 | |
| CrossMark / Productivity | |
| Asus ROG Strix G16 G614JZ | |
| Lenovo Legion Slim 7i 16 Gen 8 | |
| Alienware x16 R1 | |
| Moyenne Intel Core i9-13900H, NVIDIA GeForce RTX 4070 Laptop GPU (1058 - 1914, n=7) | |
| HP Omen 16-wf000 | |
| Razer Blade 16 Early 2023 | |
| CrossMark / Creativity | |
| Asus ROG Strix G16 G614JZ | |
| Lenovo Legion Slim 7i 16 Gen 8 | |
| Alienware x16 R1 | |
| Moyenne Intel Core i9-13900H, NVIDIA GeForce RTX 4070 Laptop GPU (1178 - 2254, n=7) | |
| HP Omen 16-wf000 | |
| Razer Blade 16 Early 2023 | |
| CrossMark / Responsiveness | |
| Asus ROG Strix G16 G614JZ | |
| Alienware x16 R1 | |
| Lenovo Legion Slim 7i 16 Gen 8 | |
| Moyenne Intel Core i9-13900H, NVIDIA GeForce RTX 4070 Laptop GPU (1037 - 1952, n=7) | |
| HP Omen 16-wf000 | |
| Razer Blade 16 Early 2023 | |
| PCMark 10 Score | 8538 points | |
Aide | ||
| AIDA64 / Memory Copy | |
| Razer Blade 16 Early 2023 | |
| Razer Blade 16 Early 2023 | |
| Razer Blade 16 Early 2023 | |
| Lenovo Legion Pro 7 RTX4090 | |
| Alienware x16 R1 | |
| HP Omen 16-wf000 | |
| Asus ROG Strix G16 G614JZ | |
| Moyenne Intel Core i9-13900H (37448 - 74486, n=25) | |
| Lenovo Legion Slim 7i 16 Gen 8 | |
| AIDA64 / Memory Read | |
| Lenovo Legion Pro 7 RTX4090 | |
| Razer Blade 16 Early 2023 | |
| Razer Blade 16 Early 2023 | |
| Razer Blade 16 Early 2023 | |
| Asus ROG Strix G16 G614JZ | |
| Alienware x16 R1 | |
| HP Omen 16-wf000 | |
| Moyenne Intel Core i9-13900H (41599 - 75433, n=25) | |
| Lenovo Legion Slim 7i 16 Gen 8 | |
| AIDA64 / Memory Write | |
| Alienware x16 R1 | |
| Razer Blade 16 Early 2023 | |
| Razer Blade 16 Early 2023 | |
| Razer Blade 16 Early 2023 | |
| Lenovo Legion Pro 7 RTX4090 | |
| HP Omen 16-wf000 | |
| Moyenne Intel Core i9-13900H (36152 - 88505, n=25) | |
| Asus ROG Strix G16 G614JZ | |
| Lenovo Legion Slim 7i 16 Gen 8 | |
| AIDA64 / Memory Latency | |
| Alienware x16 R1 | |
| Razer Blade 16 Early 2023 | |
| Razer Blade 16 Early 2023 | |
| Razer Blade 16 Early 2023 | |
| Moyenne Intel Core i9-13900H (75.8 - 102.3, n=25) | |
| Asus ROG Strix G16 G614JZ | |
| HP Omen 16-wf000 | |
| Lenovo Legion Pro 7 RTX4090 | |
| Lenovo Legion Slim 7i 16 Gen 8 | |
* ... Moindre est la valeur, meilleures sont les performances
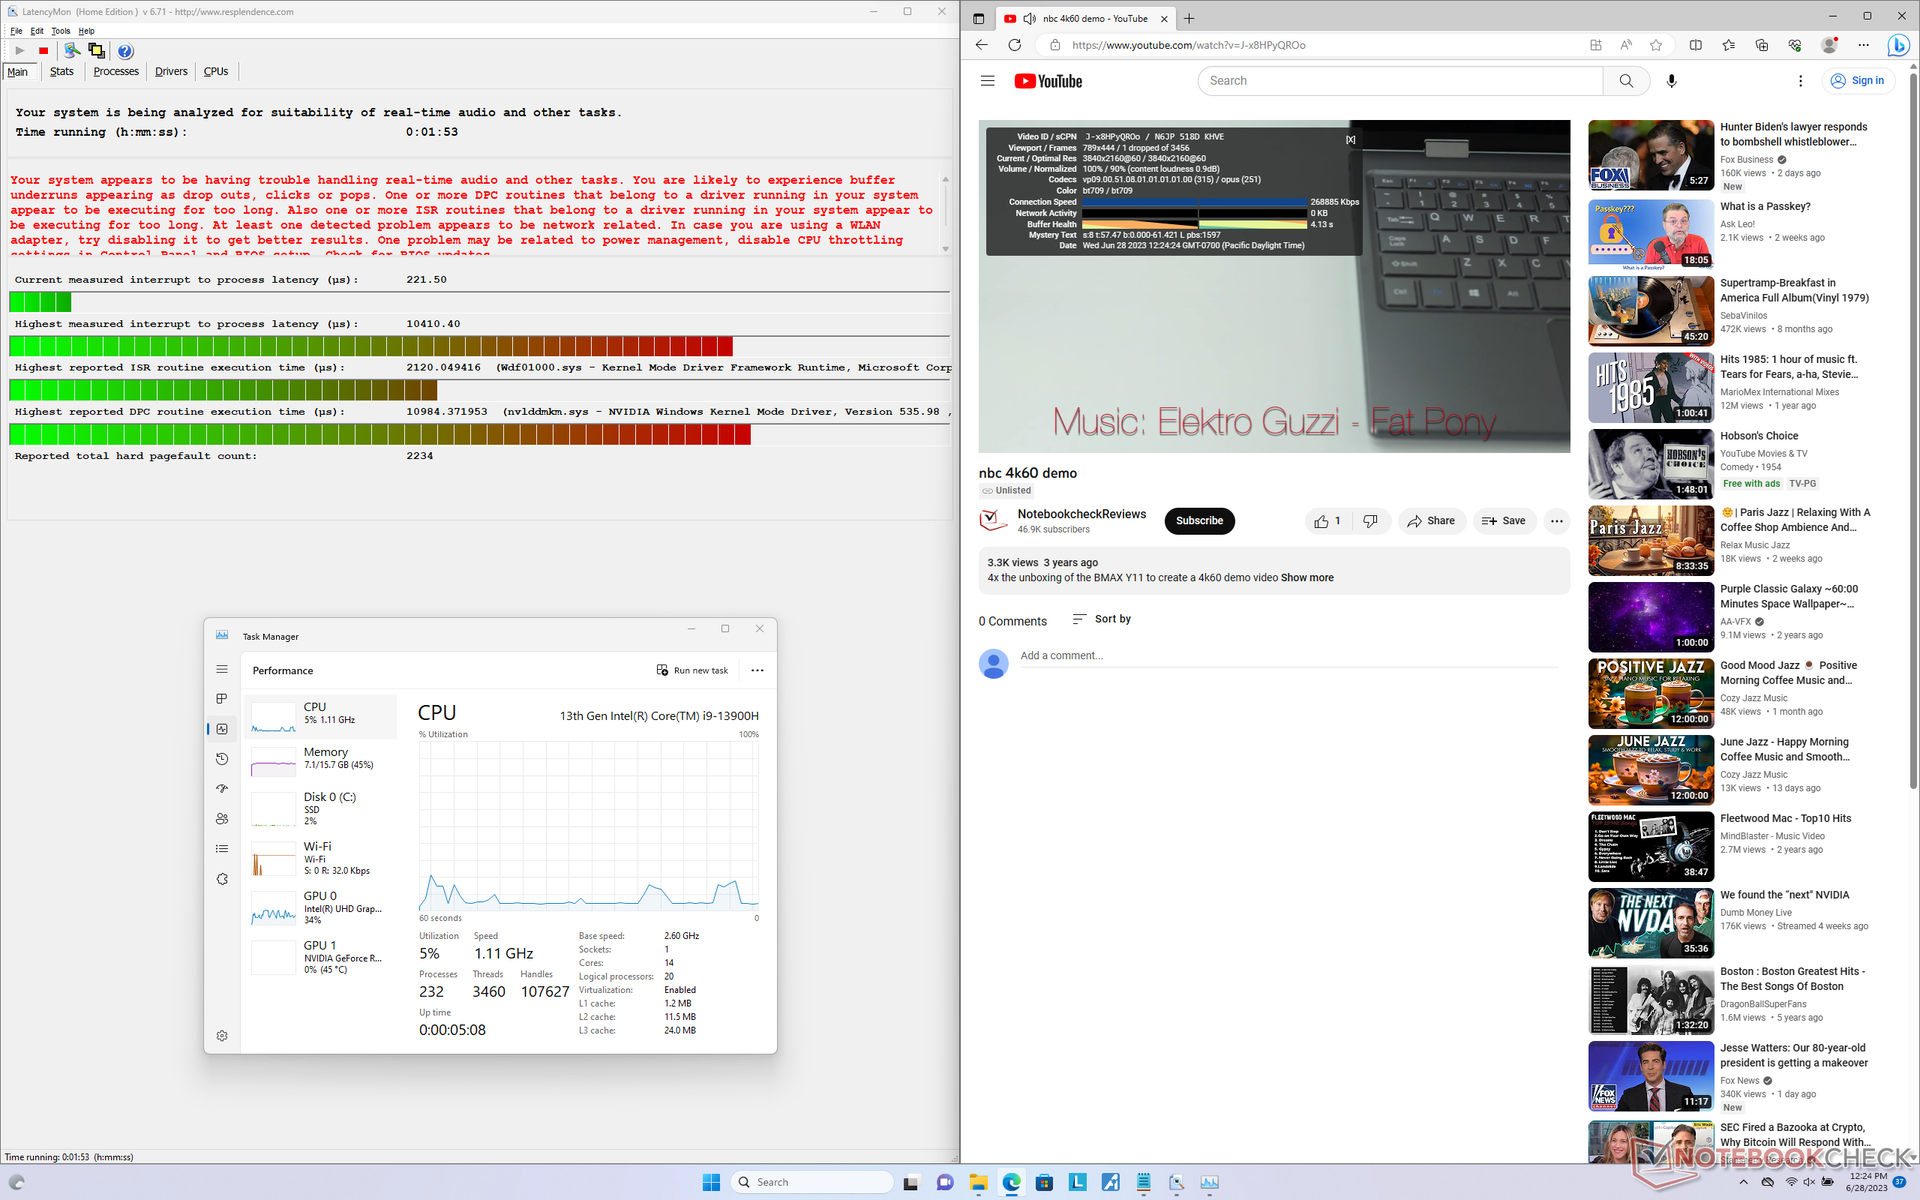
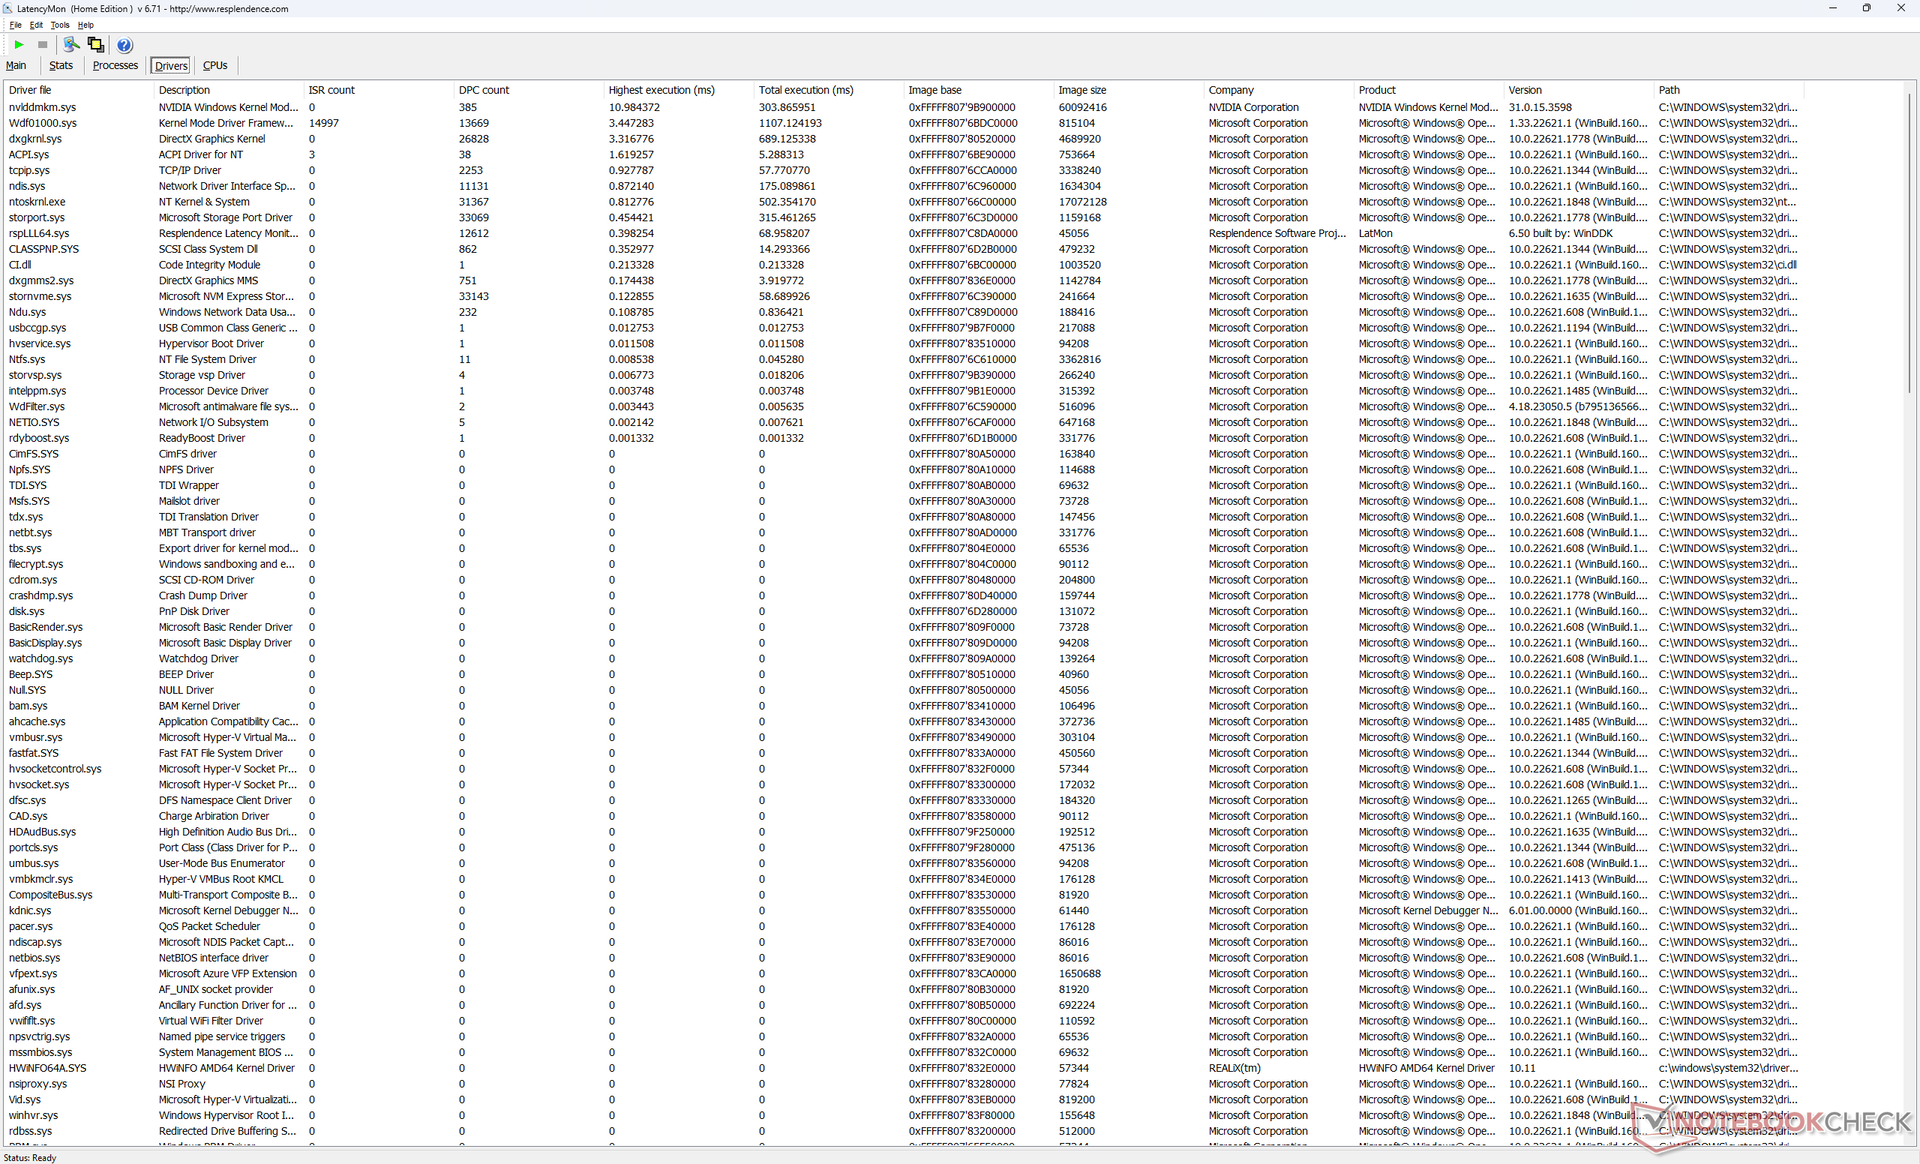
Latence DPC
LatencyMon révèle des problèmes de DPC liés au pilote NVLDDMKM de Nvidia, à l'instar de ce que nous avons observé sur la carte Legion Pro 7 même après plusieurs tentatives. la lecture de vidéos 4K à 60 FPS est presque parfaite, avec une seule image perdue lors de notre test vidéo.
| DPC Latencies / LatencyMon - interrupt to process latency (max), Web, Youtube, Prime95 | |
| Lenovo Legion Pro 7 RTX4090 | |
| Lenovo Legion Slim 7i 16 Gen 8 | |
| HP Omen 16-wf000 | |
| Asus ROG Strix G16 G614JZ | |
| Razer Blade 16 Early 2023 | |
| Alienware x16 R1 | |
* ... Moindre est la valeur, meilleures sont les performances
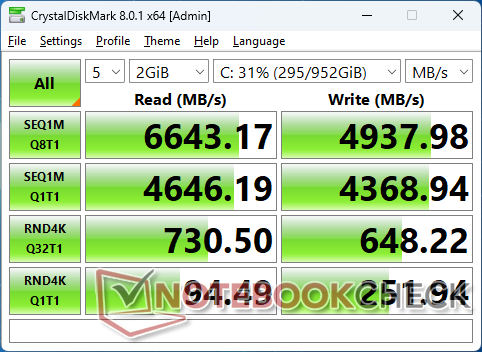
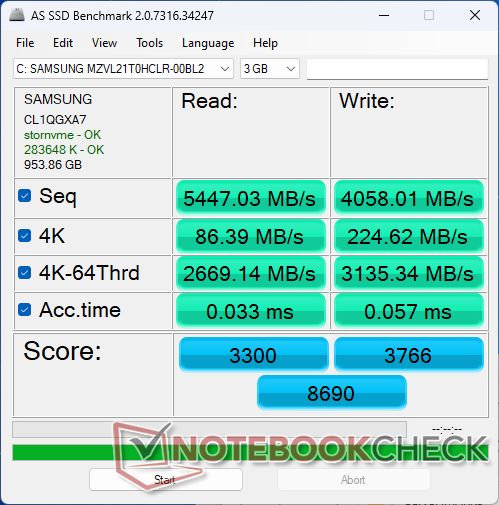
Périphériques de stockage - Jusqu'à deux disques SSD M.2
Notre unité est livrée avec un disque dur de 1 TBSamsung PM9A1 qui est l'un des disques durs PCIe4 x4 les plus rapides disponibles pour le grand public. Malheureusement, les taux de transfert passent de 6700 Mo/s à 3300 Mo/s lorsqu'ils sont sollicités, comme le montre le tableau ci-dessous, ce qui indique une mauvaise dissipation de la chaleur. LeRazer Blade 14 est livré avec le même disque SSD Samsung et ne présente aucun problème de ce type.

| Drive Performance rating - Percent | |
| Alienware x16 R1 | |
| Lenovo Legion Slim 7i 16 Gen 8 | |
| Lenovo Legion Pro 7 RTX4090 | |
| HP Omen 16-wf000 | |
| Razer Blade 16 Early 2023 | |
| Asus ROG Strix G16 G614JZ | |
* ... Moindre est la valeur, meilleures sont les performances
Disk Throttling: DiskSpd Read Loop, Queue Depth 8
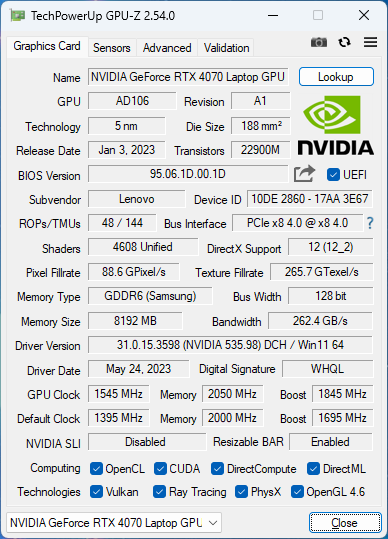
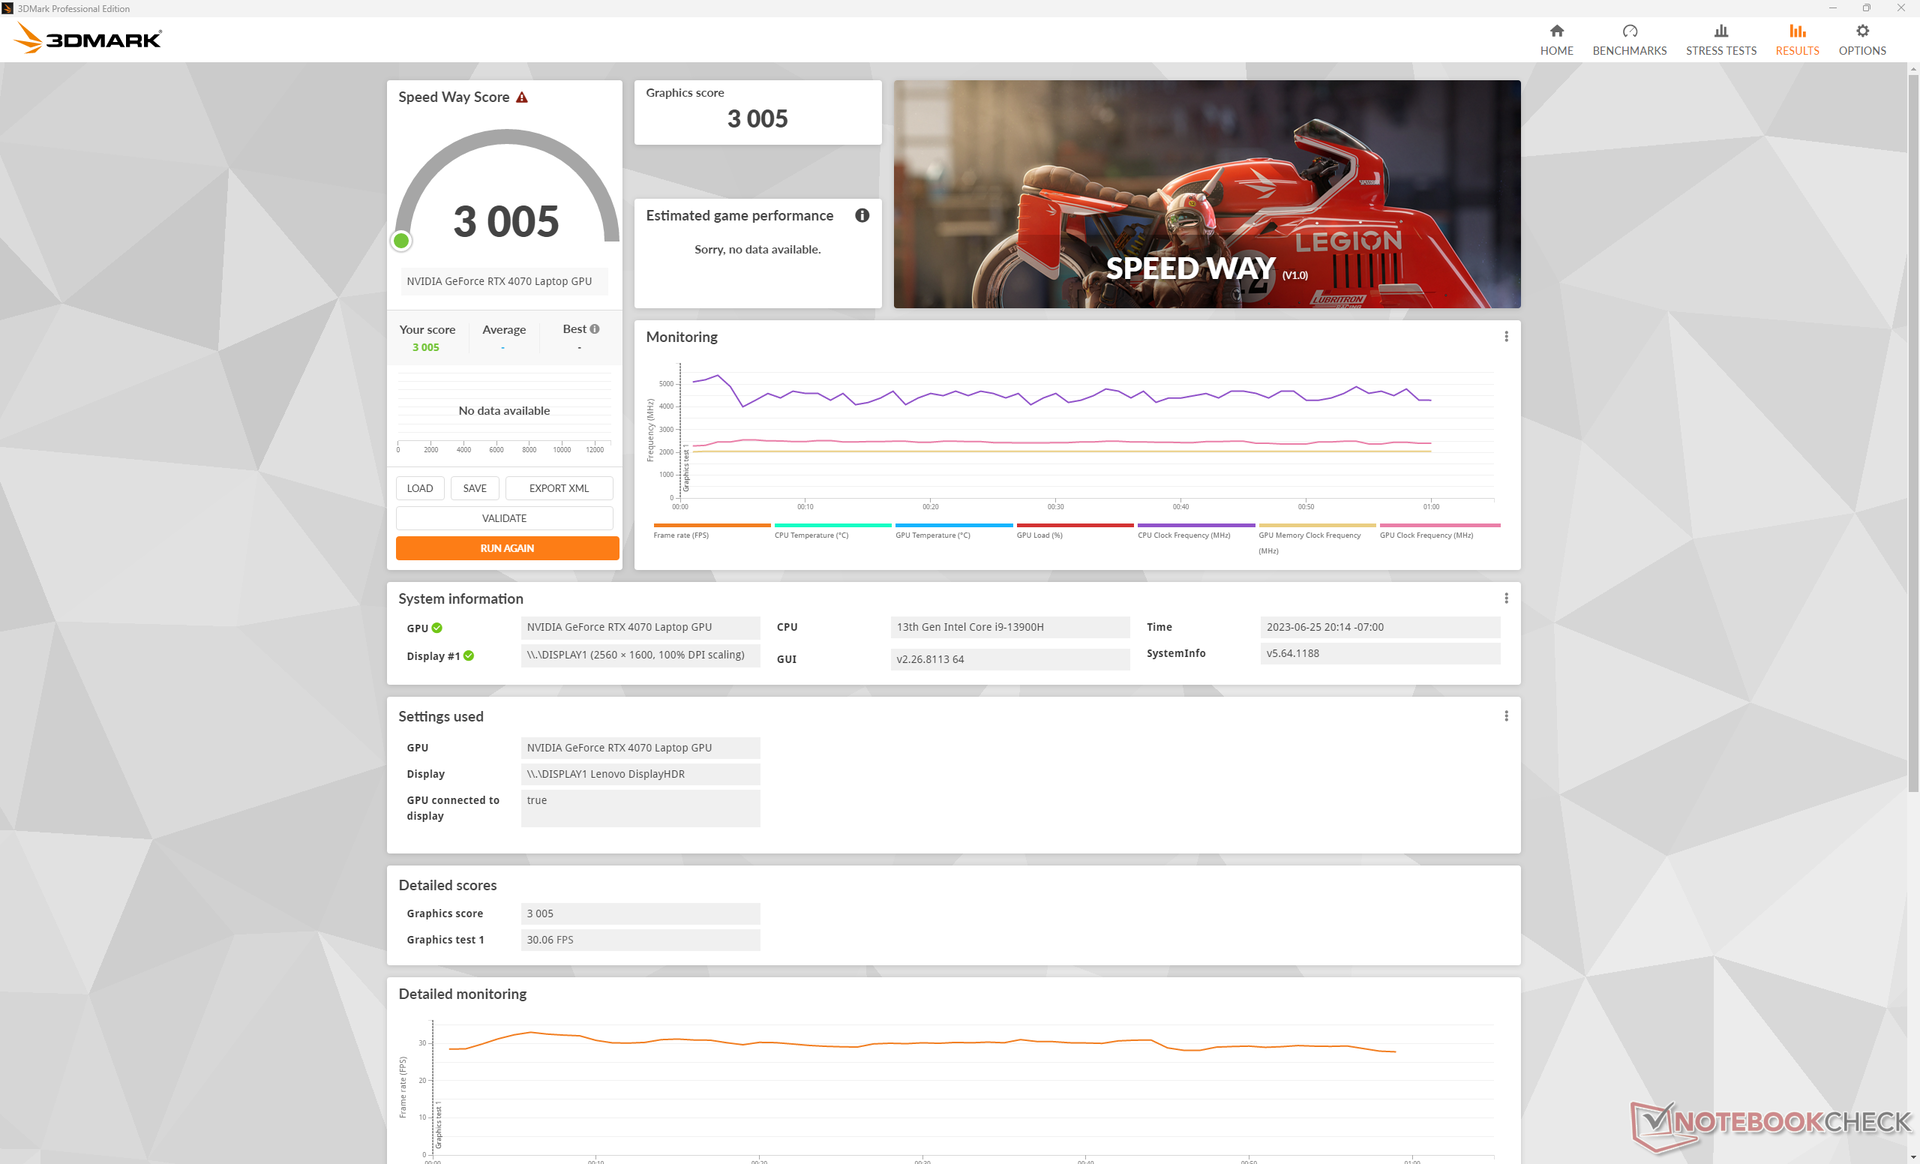
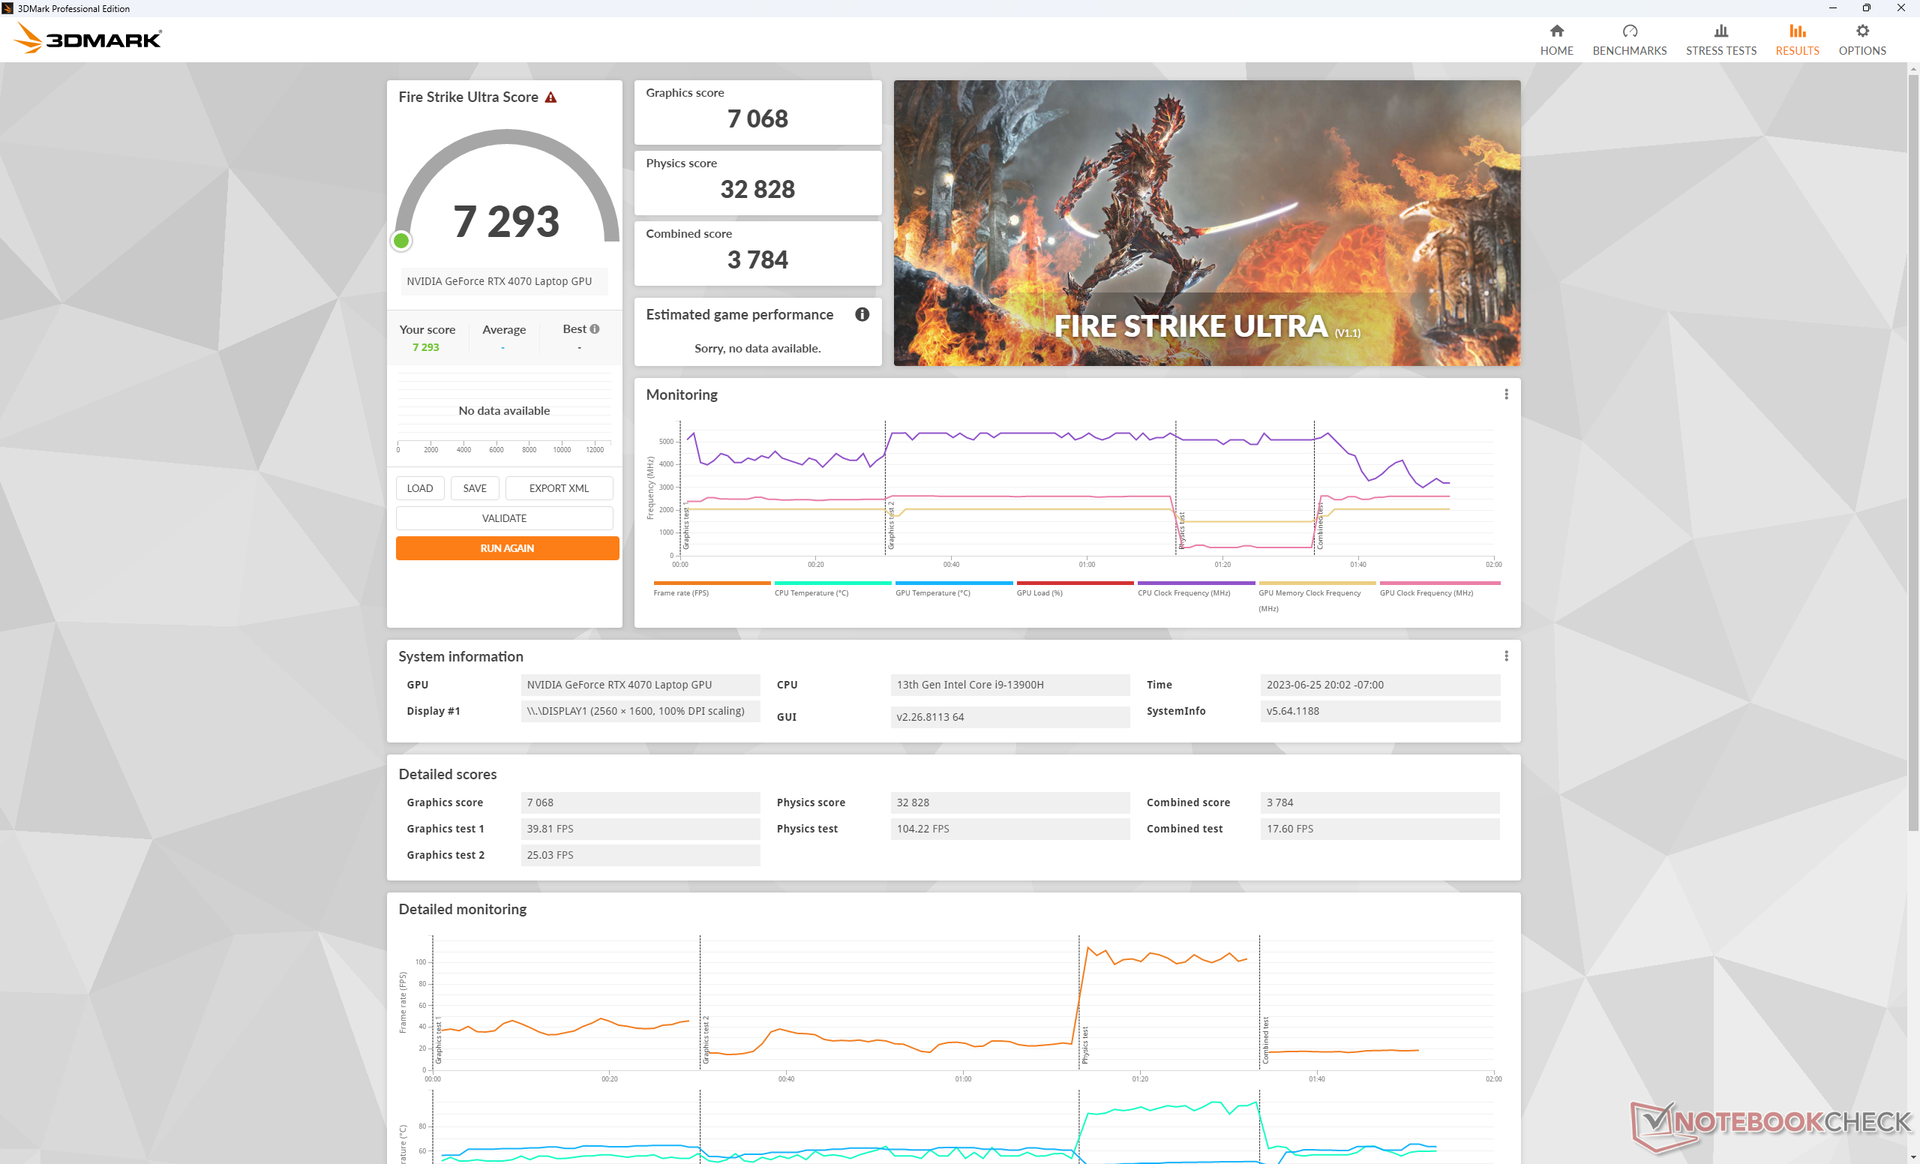
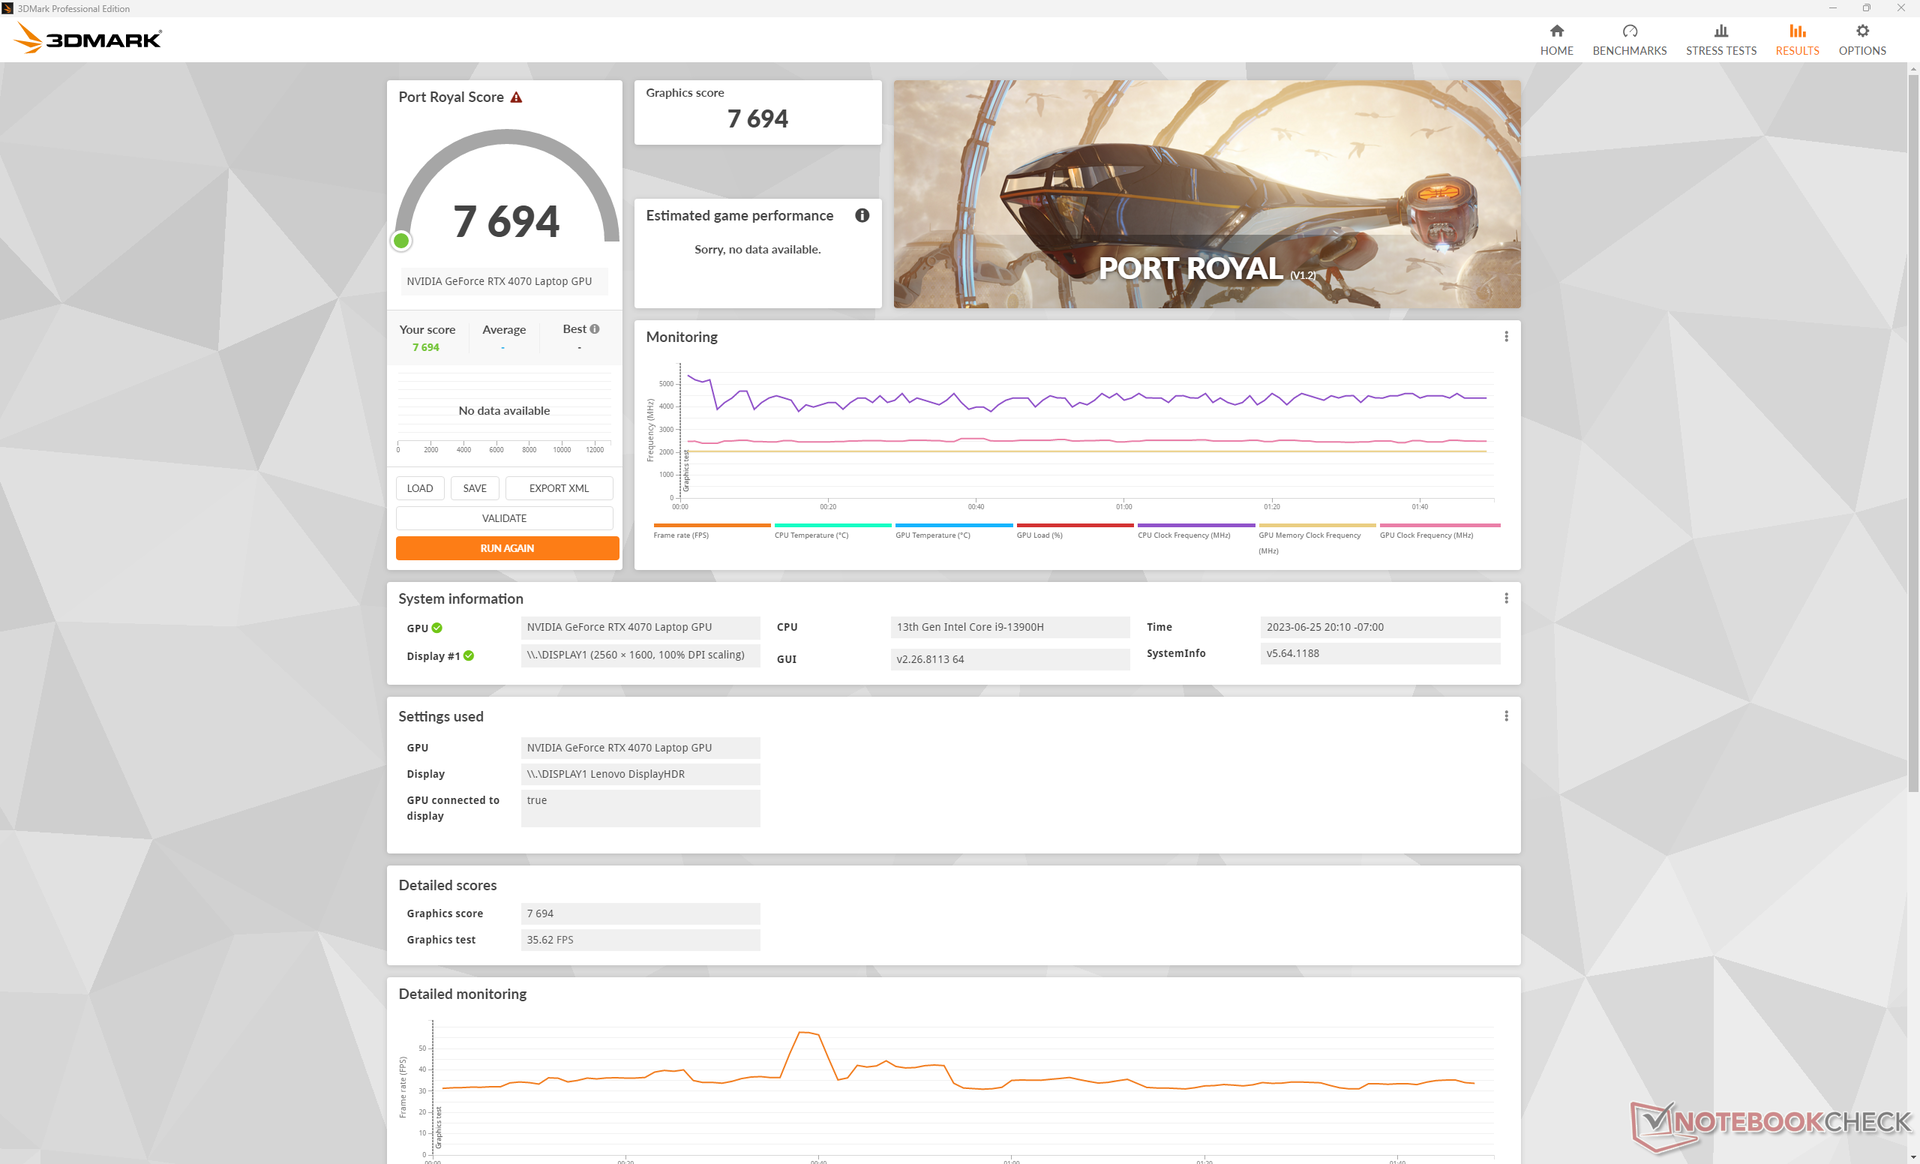
Performance GPU - 140 W RTX Graphics
Les performances graphiques brutes sont environ 5 à 10 % plus rapides que celles d'un ordinateur portable moyen de notre base de données équipé de la même carte RTX 4070 mobile rTX 4070 MOBILE. Les performances globales sont donc à peu près équivalentes à celles de la rTX 3080 Ti.
Les performances du GPU baissent de 5 % si la fonction Overclock est désactivée. En mode équilibré, les performances du CPU et du GPU chutent respectivement de 10 % et 15 %, comme le montre le tableau ci-dessous. Certains utilisateurs préfèrent les ventilateurs plus silencieux du mode équilibré, même si cela se traduit par une baisse des performances.
La rétrogradation vers la RTX 4060 de notre configuration RTX 4070 devrait avoir un impact sur les performances du GPU d'environ 10 à 15 %, d'après notre expérience avec la carte graphique Legion Pro 5 16.
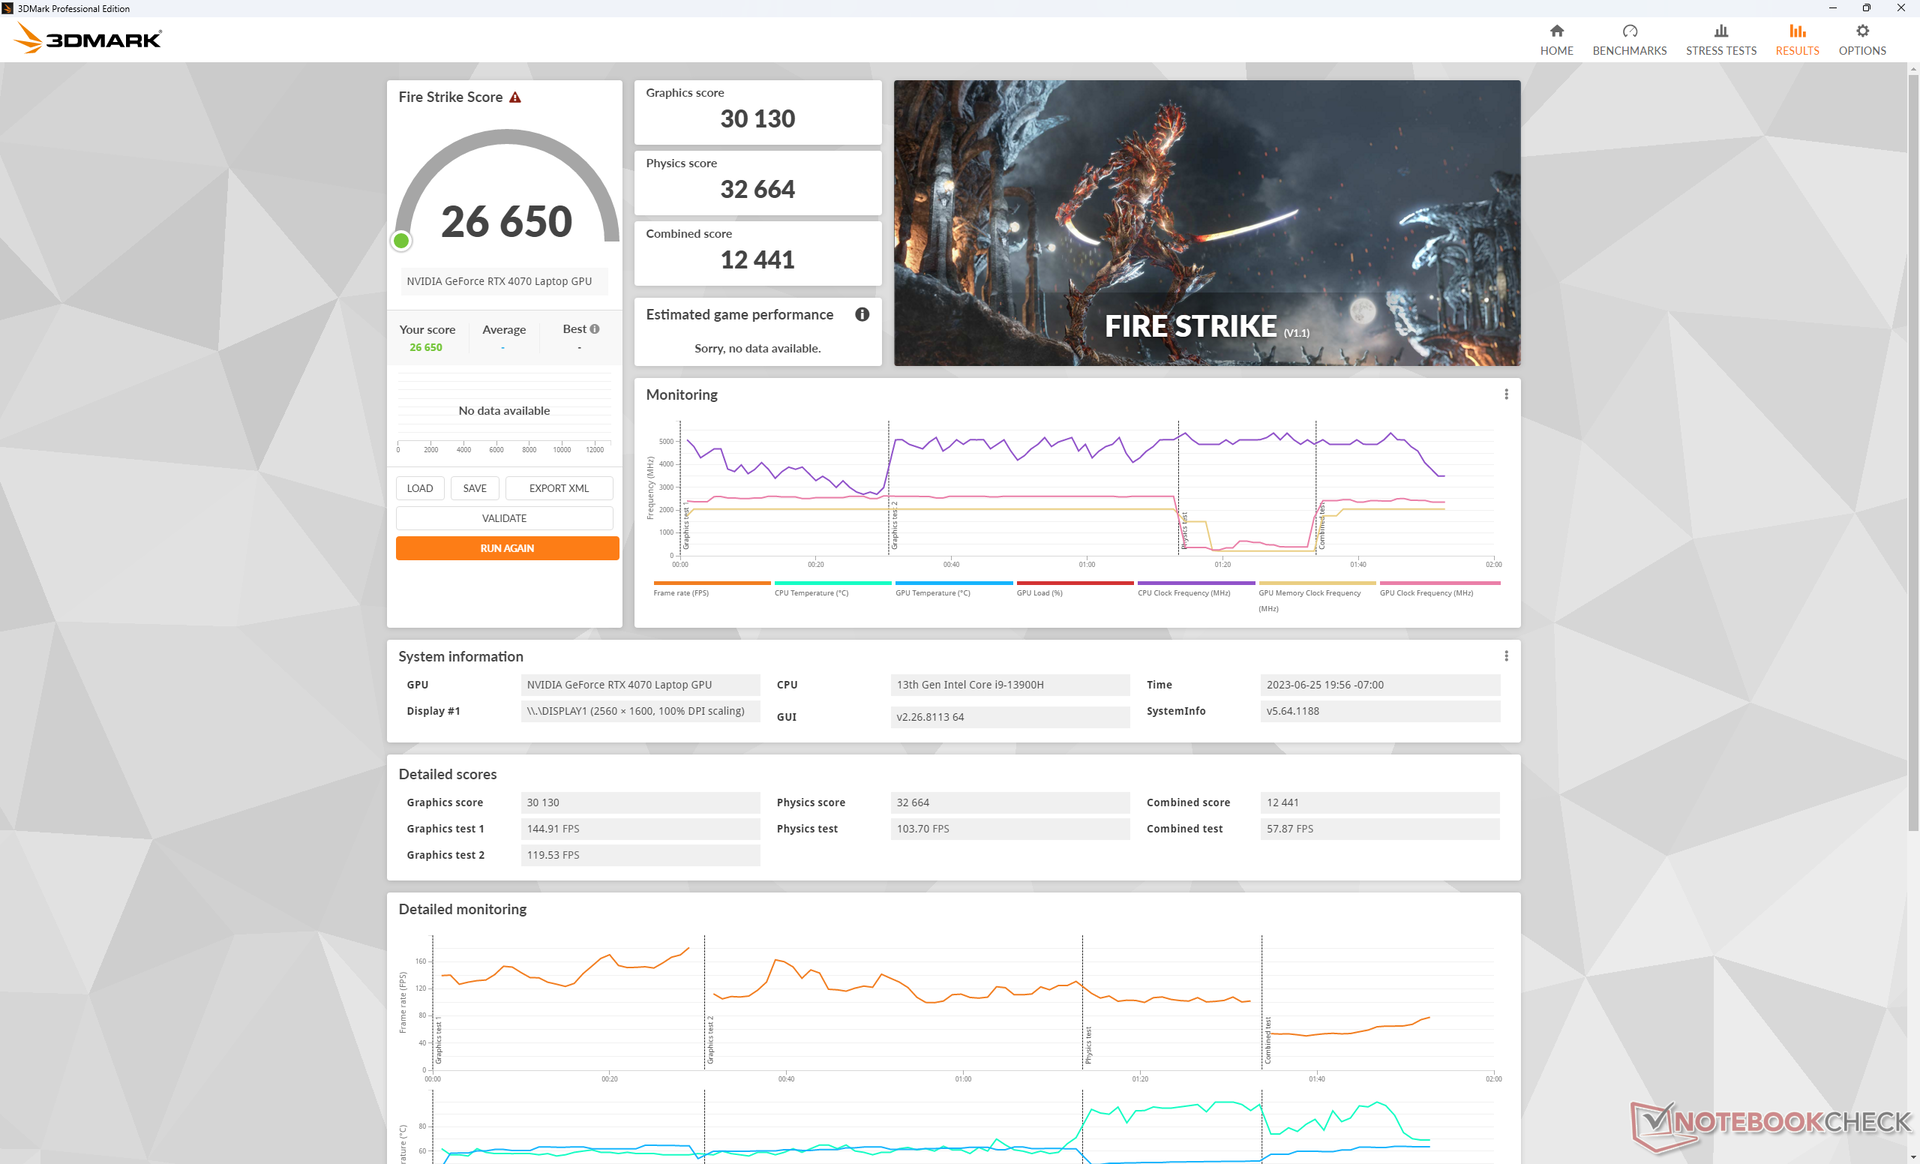
| Paramètres du profil d'alimentation | Fire Strike Score physique | Fire Strike Score GPU | Fire Strike Score combiné |
| Performance + GPU Overclock activé + Overdrive activé | 32664 | 30130 | 12441 |
| Performances + Overclock du GPU activé + Overdrive désactivé | 32439 | 30153 | 13360 |
| Performances + Overclock du GPU désactivé + Overdrive désactivé | 32550 | 28629 (-5%) | 12319 |
| Équilibré | 27499 (-16%) | 27708 (-8%) | 11295 (-9%) |
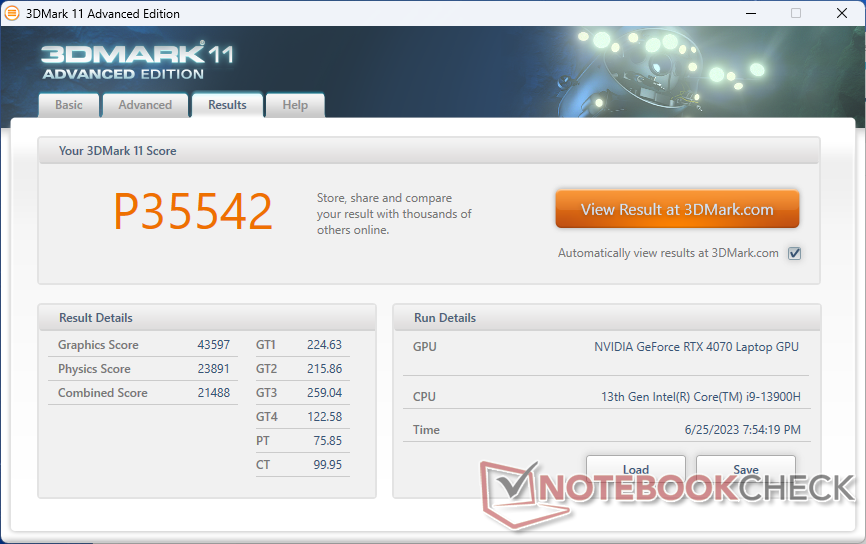
| 3DMark 11 Performance | 35542 points | |
| 3DMark Fire Strike Score | 26650 points | |
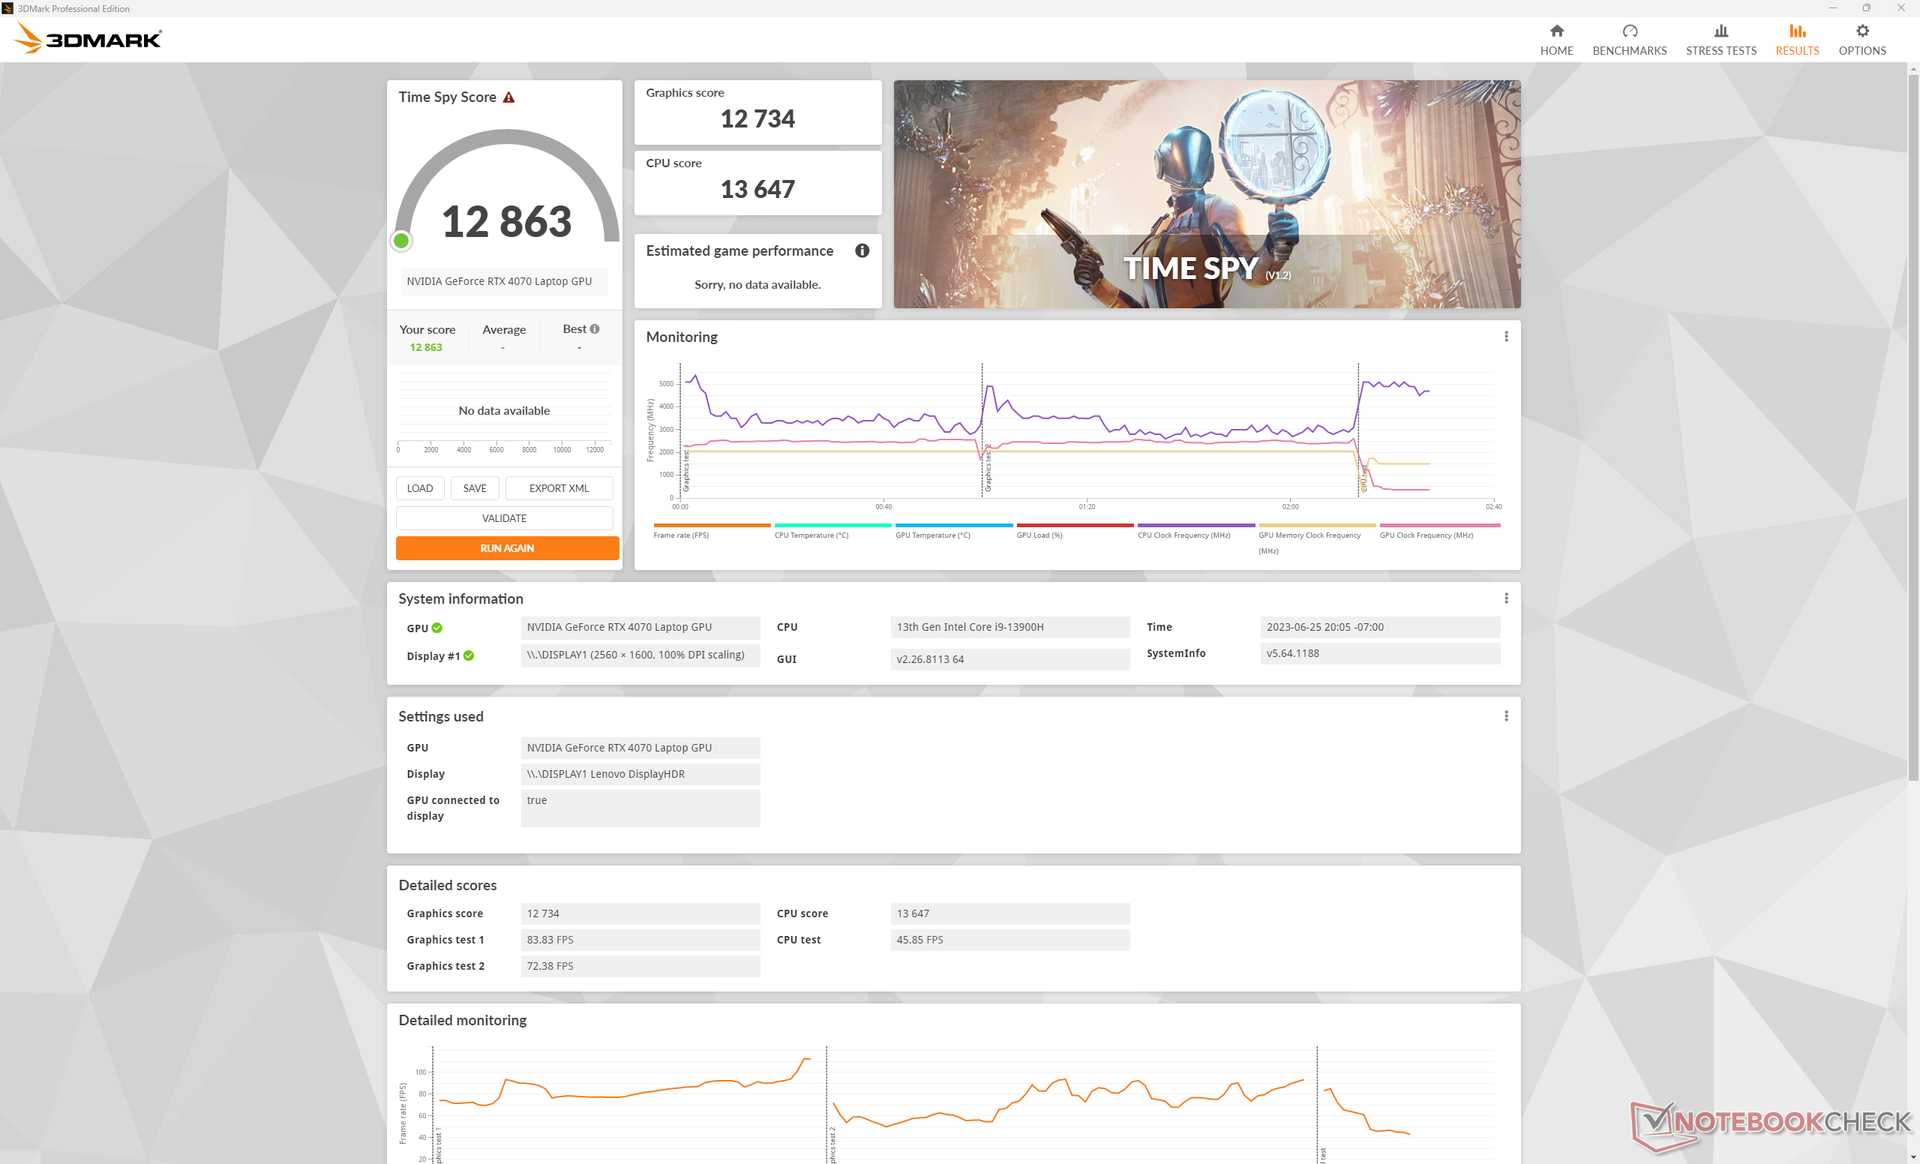
| 3DMark Time Spy Score | 12863 points | |
Aide | ||
* ... Moindre est la valeur, meilleures sont les performances
Performance des jeux
La RTX 4070 mobile fonctionne bien pour viser 1440p/1600p et 60 FPS avec des paramètres élevés, tandis que la RTX 4070 Ti, beaucoup plus rapide, fonctionne pour viser 1440p/1600p et 60 FPS avec des paramètres élevés rTX 4070 Ti beaucoup plus rapide, peut viser des réglages Ultra ou maximum. En faisant tourner Returnal en 1440p avec notre Lenovo, par exemple, nous avons à peine atteint la barre des 50 FPS.
Le DLSS devient beaucoup plus important lorsque la RTX 4070 commence à se sentir sous-puissante. L'exécution de Cyberpunk 2077 en réglages Ultra 4K, par exemple, atteindrait une moyenne de 23 FPS sans DLSS et 38 FPS avec DLSS2 activé.
Witcher 3 FPS Chart
| Bas | Moyen | Élevé | Ultra | QHD | 4K | |
|---|---|---|---|---|---|---|
| GTA V (2015) | 184 | 180.3 | 175 | 115.2 | 94.3 | 98.7 |
| The Witcher 3 (2015) | 459.3 | 356.8 | 225.9 | 117.9 | 70 | |
| Dota 2 Reborn (2015) | 203 | 183.2 | 175.8 | 165.3 | 141.3 | |
| Final Fantasy XV Benchmark (2018) | 213 | 168.8 | 122.7 | 91.4 | 51.5 | |
| X-Plane 11.11 (2018) | 182.9 | 158.7 | 122.4 | 105.7 | ||
| Strange Brigade (2018) | 483 | 316 | 259 | 228 | 149.2 | 75.7 |
| Cyberpunk 2077 1.6 (2022) | 138.3 | 141.9 | 106.1 | 91 | 54.4 | 23.1 |
| Tiny Tina's Wonderlands (2022) | 244.3 | 204.8 | 143.7 | 113.9 | 78.1 | 37 |
| F1 22 (2022) | 258 | 261 | 219 | 81.5 | 46.2 | 25.9 |
| Returnal (2023) | 83 | 81 | 76 | 61 | 52 | 27 |
Émissions
Bruit du système
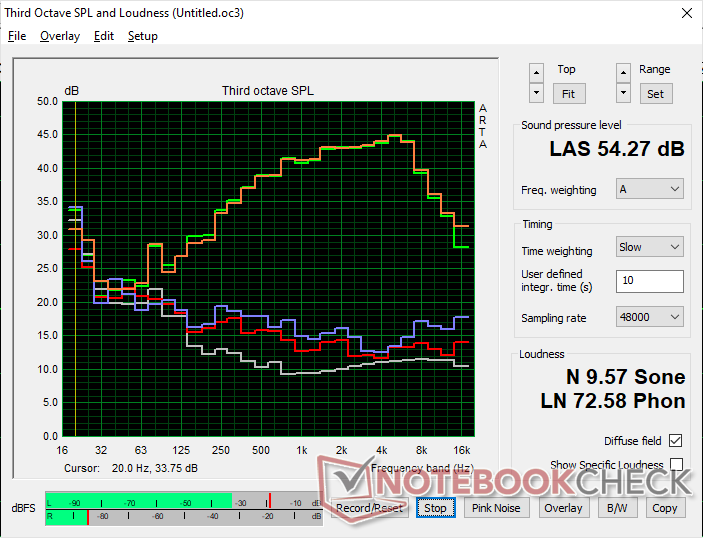
Les ventilateurs internes sont toujours actifs à un peu moins de 26 dB(A) sur un fond silencieux de 23 dB(A). Ce n'est pas assez fort pour être gênant dans la plupart des bureaux ou des conférences et ils font un excellent travail en restant silencieux pendant de longues périodes, même lorsque des charges plus élevées comme 3DMark 06 sont introduites.
Le jeu en mode Performance induit un bruit de ventilateur constant de 54,4 dB(A), ce qui est similaire à l'Alienware x16 R1 mais plus bruyant que sur le Blade 16. En passant en mode équilibré, on perd un peu de performance comme mentionné ci-dessus pour un bruit de ventilateur nettement plus silencieux de 48,9 dB(A).
Degré de la nuisance sonore
| Au repos |
| 23.6 / 23.6 / 25.7 dB(A) |
| Fortement sollicité |
| 27.6 / 54.4 dB(A) |
 | ||
30 dB silencieux 40 dB(A) audible 50 dB(A) bruyant |
||
min: | ||
| Lenovo Legion Slim 7i 16 Gen 8 GeForce RTX 4070 Laptop GPU, i9-13900H, Samsung PM9A1 MZVL21T0HCLR | HP Omen 16-wf000 GeForce RTX 4080 Laptop GPU, i7-13700HX, SK hynix PC801 HFS002TEJ9X101N | Alienware x16 R1 GeForce RTX 4080 Laptop GPU, i9-13900HK, SK hynix PC801 HFS001TEJ9X101N | Lenovo Legion Pro 7 RTX4090 GeForce RTX 4090 Laptop GPU, i9-13900HX, Samsung PM9A1 MZVL21T0HCLR | Asus ROG Strix G16 G614JZ GeForce RTX 4080 Laptop GPU, i9-13980HX, WD PC SN560 SDDPNQE-1T00 | Razer Blade 16 Early 2023 GeForce RTX 4080 Laptop GPU, i9-13950HX, SSSTC CA6-8D1024 | |
|---|---|---|---|---|---|---|
| Noise | -15% | -6% | -25% | -17% | -2% | |
| arrêt / environnement * (dB) | 22.8 | 23 -1% | 22.7 -0% | 25 -10% | 25 -10% | 23 -1% |
| Idle Minimum * (dB) | 23.6 | 29.6 -25% | 23.1 2% | 28 -19% | 26 -10% | 23 3% |
| Idle Average * (dB) | 23.6 | 29.8 -26% | 25.8 -9% | 30 -27% | 28 -19% | 23 3% |
| Idle Maximum * (dB) | 25.7 | 30.4 -18% | 25.8 -0% | 38 -48% | 30 -17% | 23.6 8% |
| Load Average * (dB) | 27.6 | 33.8 -22% | 39.3 -42% | 48 -74% | 48 -74% | 39 -41% |
| Witcher 3 ultra * (dB) | 54.4 | 57 -5% | 49.9 8% | 53 3% | 49 10% | 51.6 5% |
| Load Maximum * (dB) | 54.4 | 58.3 -7% | 54.8 -1% | 55 -1% | 52 4% | 51.3 6% |
* ... Moindre est la valeur, meilleures sont les performances
Température
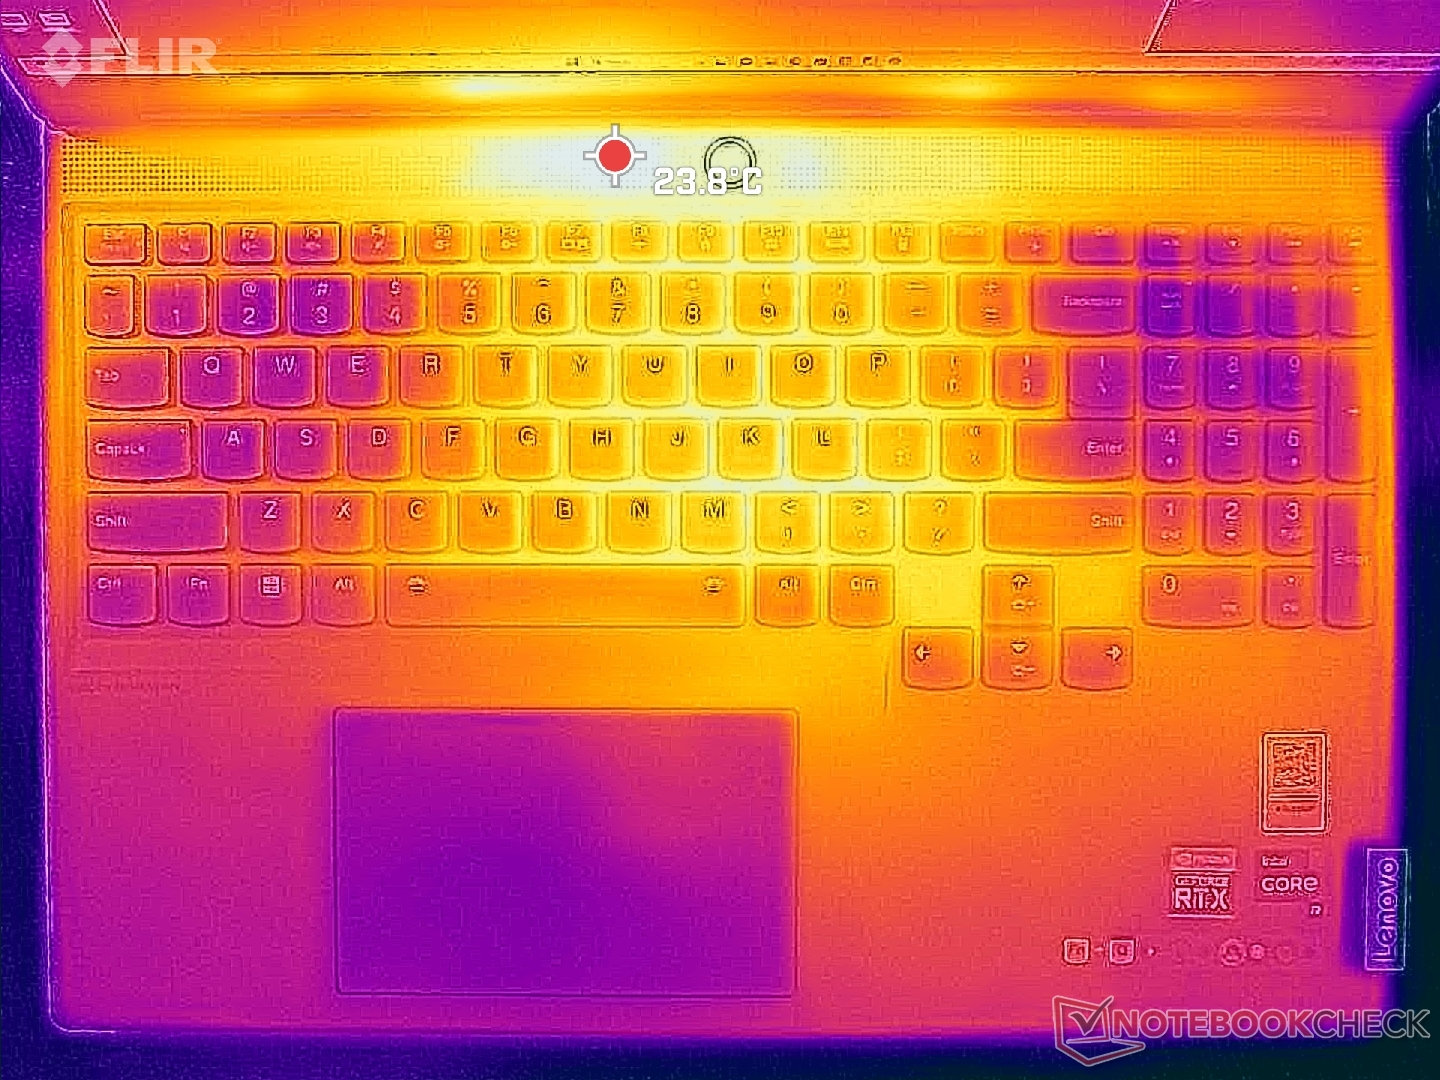
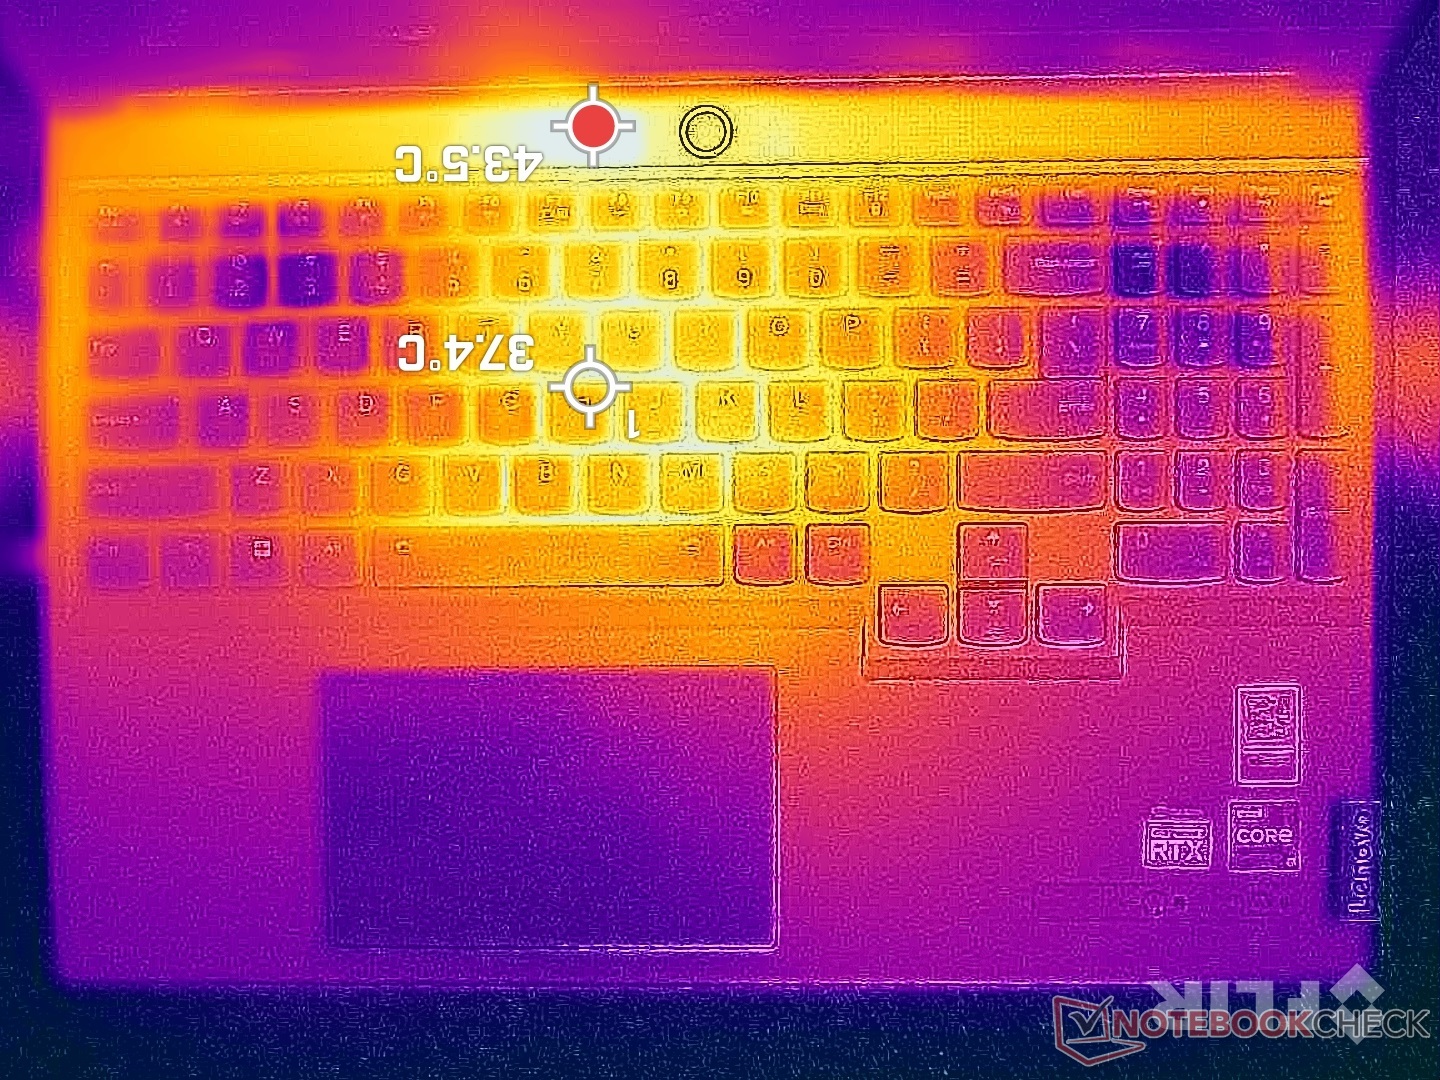
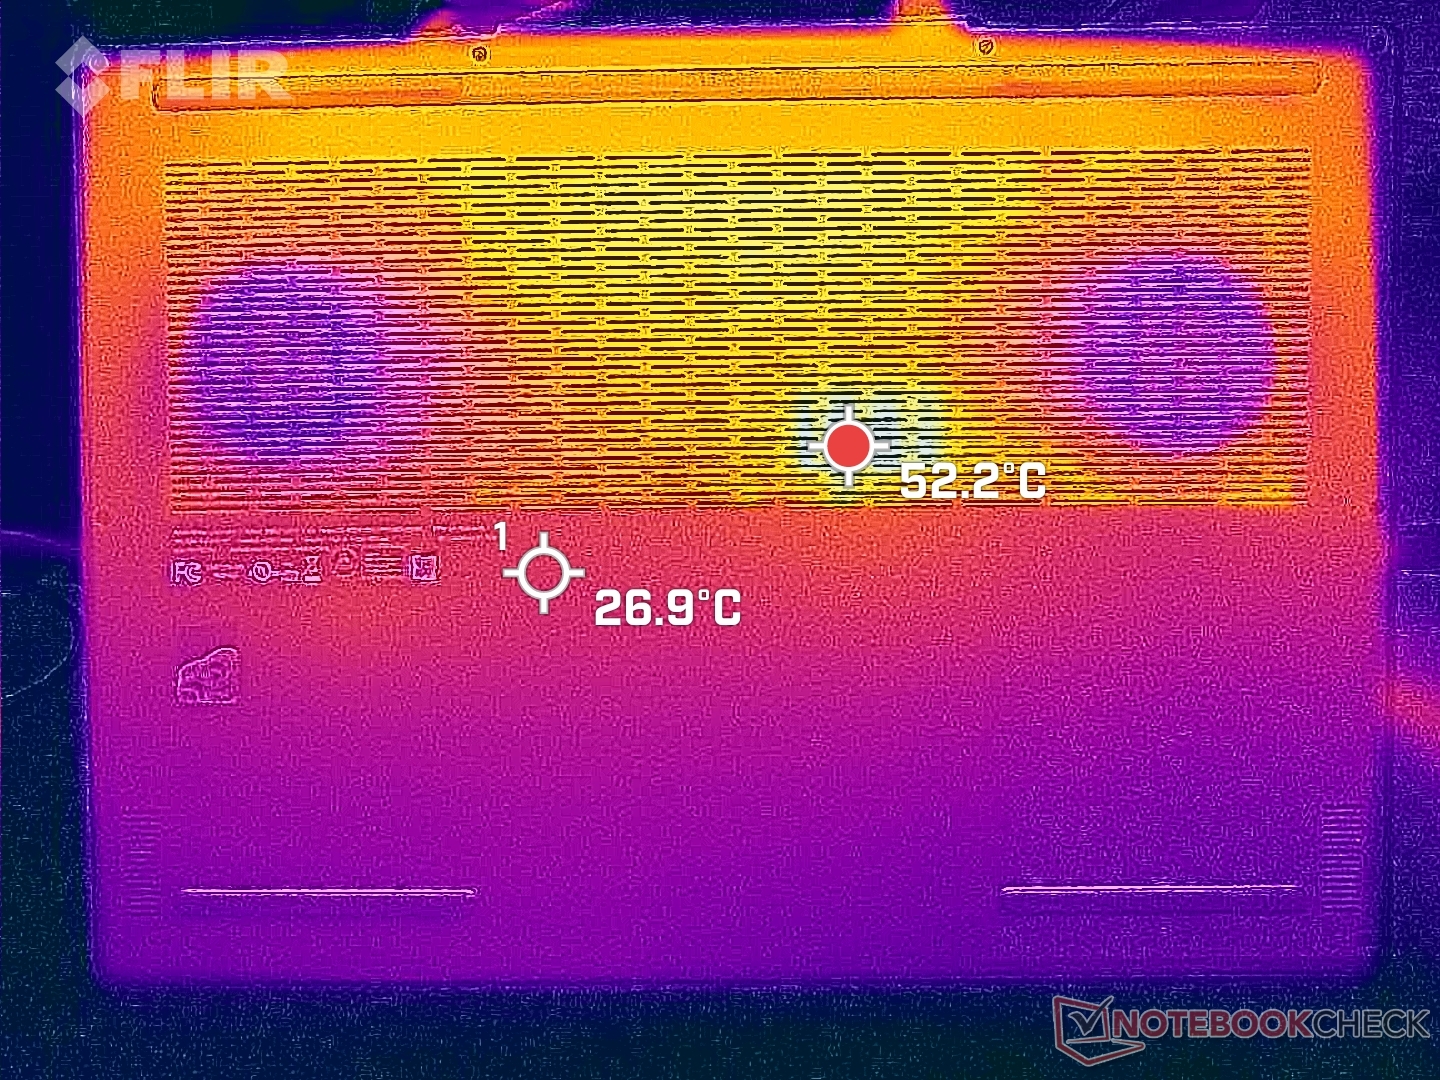
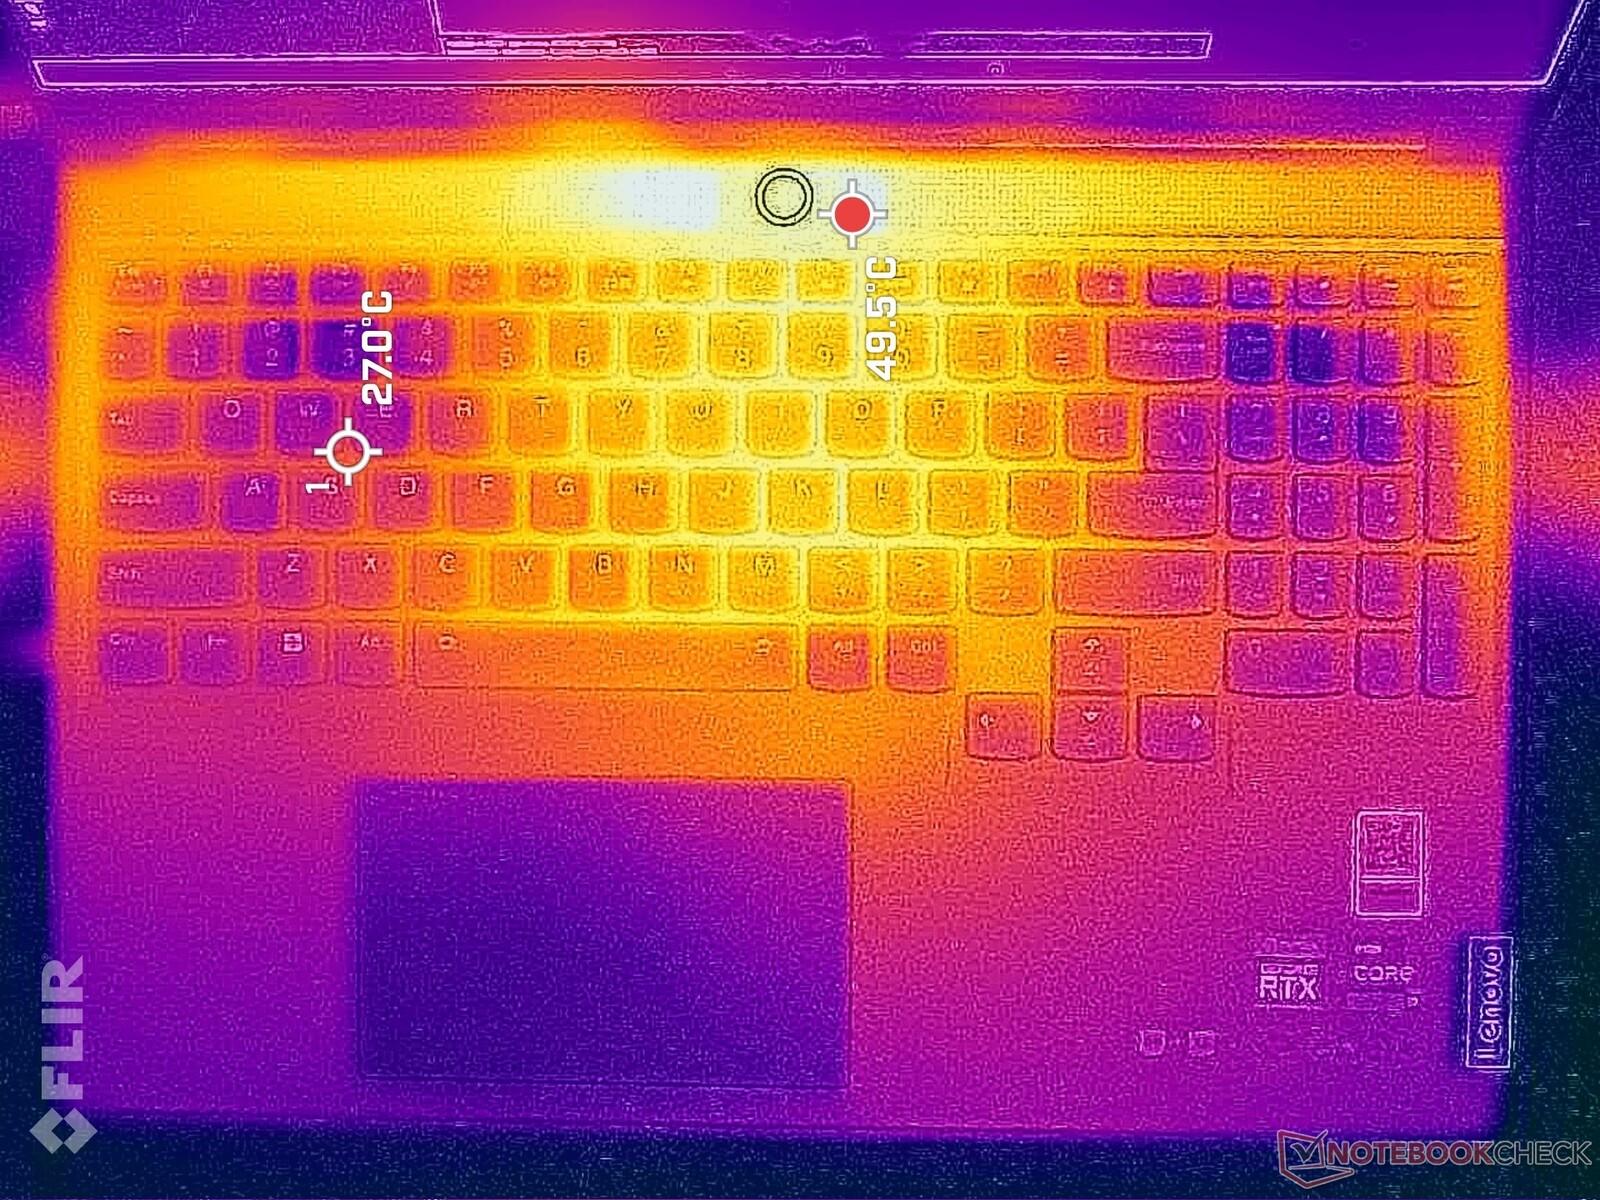
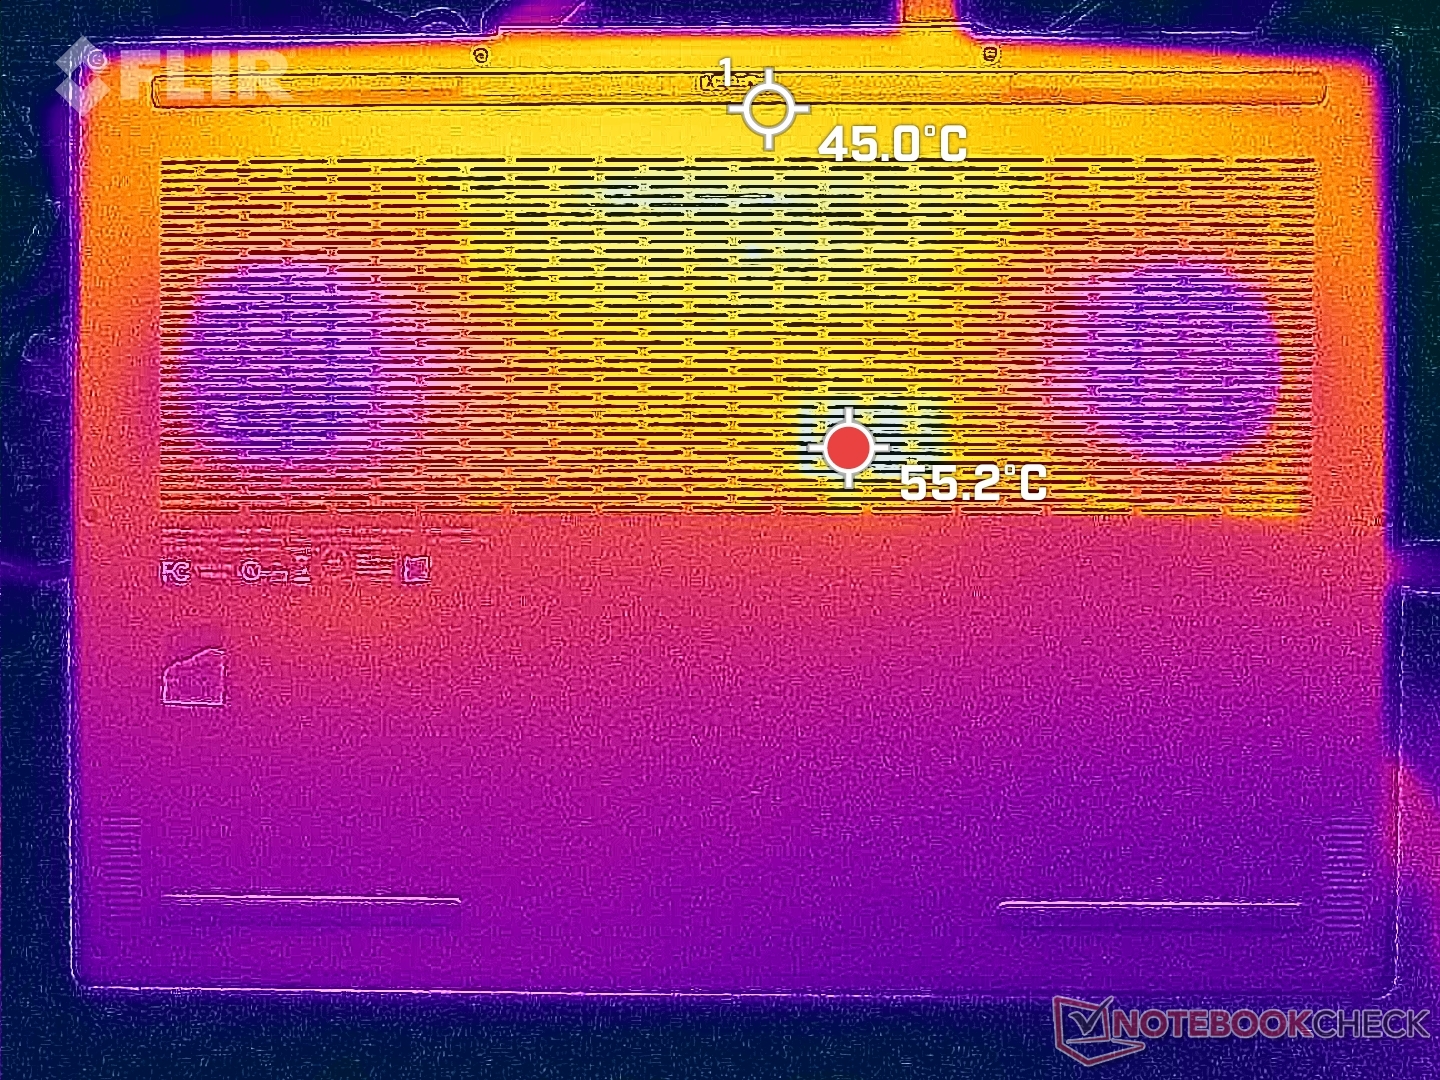
Les points chauds de la température de surface peuvent atteindre jusqu'à 43 C à 50 C, comme dans le cas de l'Alienware x16 R1 Alienware x16 R1 lors de l'exécution de charges exigeantes telles que les jeux. Heureusement, le point chaud est le plus proche du bord arrière et juste au-dessus de la première rangée de touches du clavier, comme le montrent les cartes de température ci-dessous, là où les doigts et la peau ne risquent pas d'entrer en contact. Les repose-poignets et les touches WASD restent plus froids en comparaison.
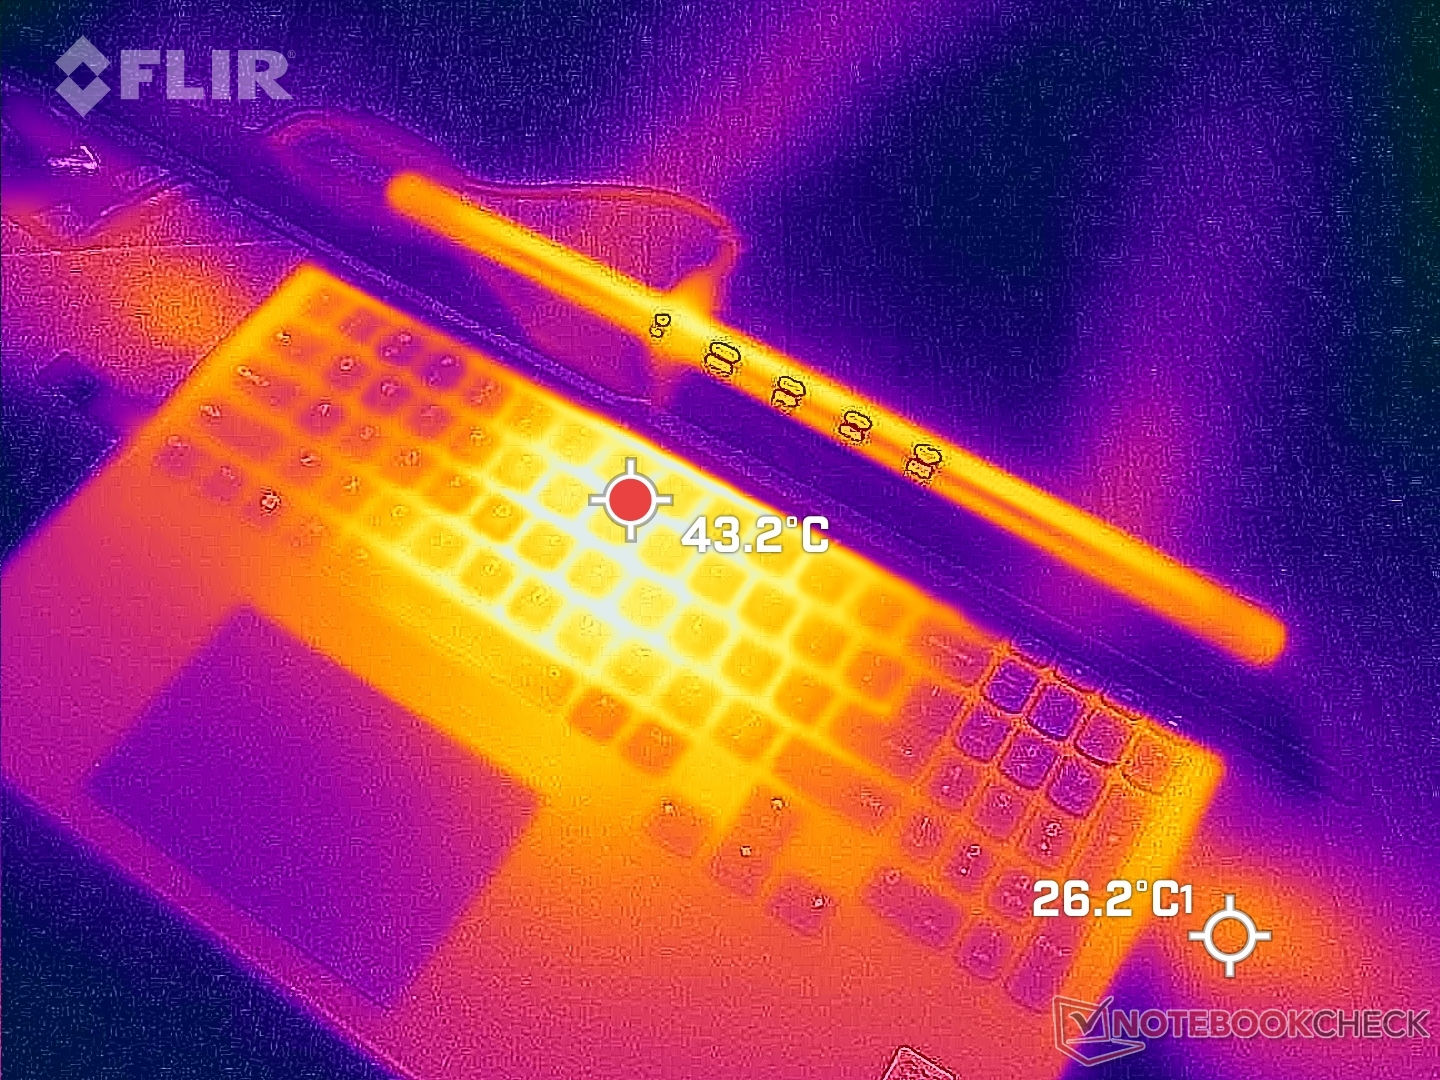
(-) La température maximale du côté supérieur est de 49.8 °C / 122 F, par rapport à la moyenne de 40.4 °C / 105 F, allant de 21.2 à 68.8 °C pour la classe Gaming.
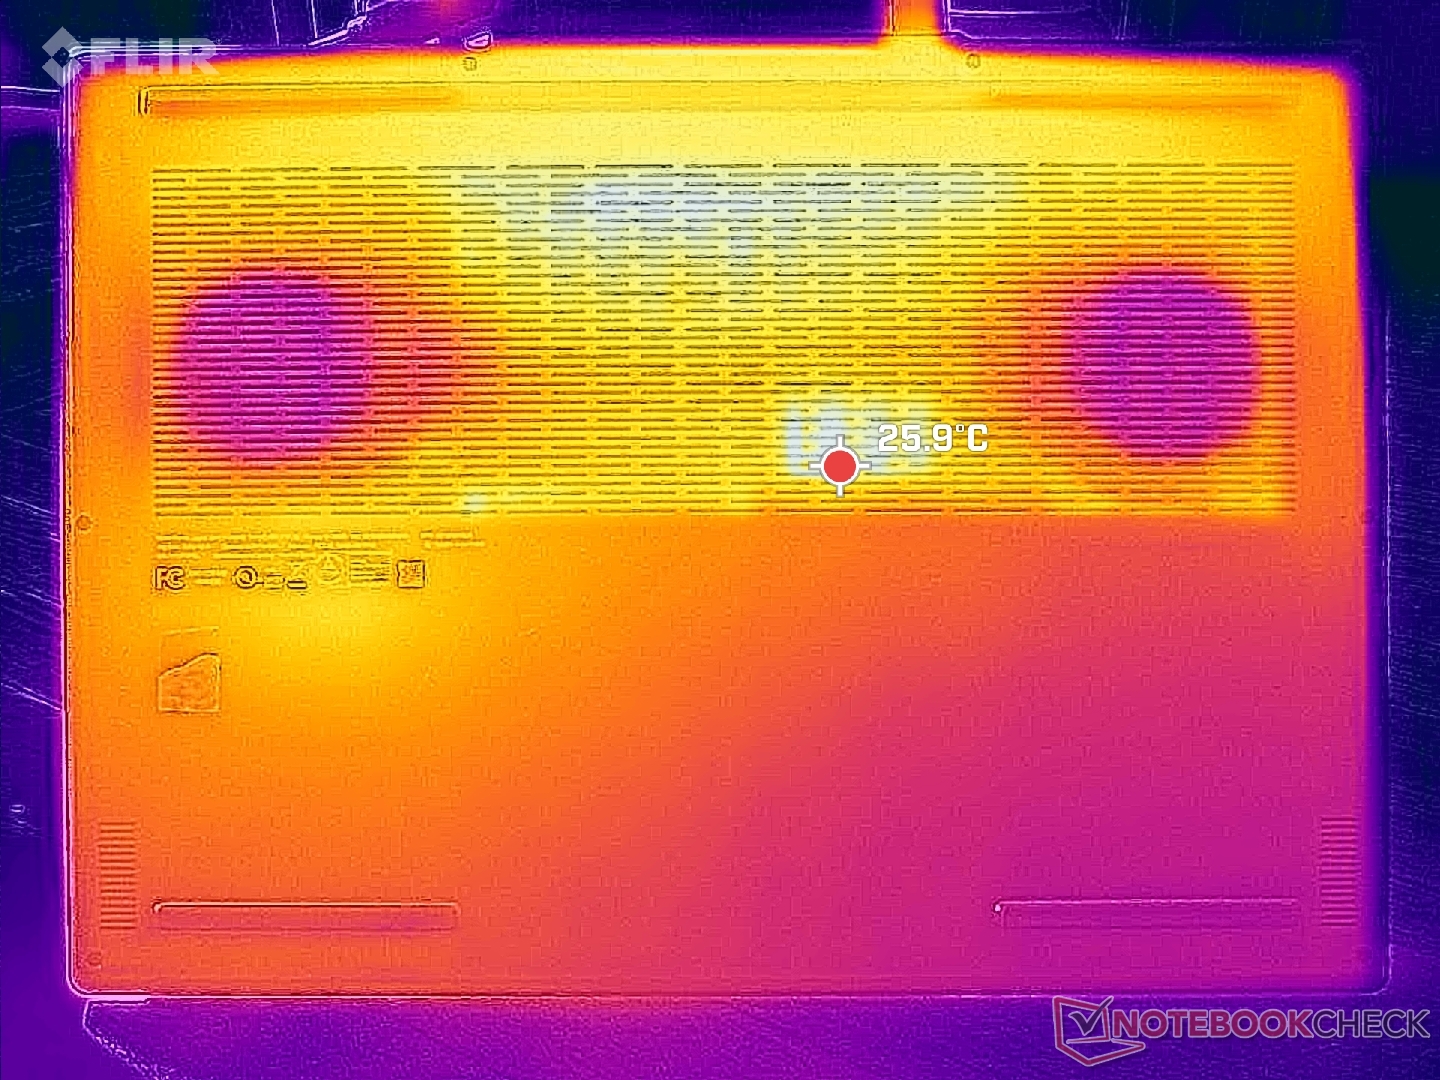
(-) Le fond chauffe jusqu'à un maximum de 48.8 °C / 120 F, contre une moyenne de 43.2 °C / 110 F
(+) En utilisation inactive, la température moyenne du côté supérieur est de 26 °C / 79 F, par rapport à la moyenne du dispositif de 33.9 °C / 93 F.
(±) En jouant à The Witcher 3, la température moyenne du côté supérieur est de 35.1 °C / 95 F, alors que la moyenne de l'appareil est de 33.9 °C / 93 F.
(+) Les repose-poignets et le pavé tactile sont plus froids que la température de la peau avec un maximum de 29.4 °C / 84.9 F et sont donc froids au toucher.
(±) La température moyenne de la zone de l'appui-paume de dispositifs similaires était de 28.8 °C / 83.8 F (-0.6 °C / #-1.1 F).
| Lenovo Legion Slim 7i 16 Gen 8 Intel Core i9-13900H, NVIDIA GeForce RTX 4070 Laptop GPU | HP Omen 16-wf000 Intel Core i7-13700HX, NVIDIA GeForce RTX 4080 Laptop GPU | Alienware x16 R1 Intel Core i9-13900HK, NVIDIA GeForce RTX 4080 Laptop GPU | Lenovo Legion Pro 7 RTX4090 Intel Core i9-13900HX, NVIDIA GeForce RTX 4090 Laptop GPU | Asus ROG Strix G16 G614JZ Intel Core i9-13980HX, NVIDIA GeForce RTX 4080 Laptop GPU | Razer Blade 16 Early 2023 Intel Core i9-13950HX, NVIDIA GeForce RTX 4080 Laptop GPU | |
|---|---|---|---|---|---|---|
| Heat | 4% | -9% | -13% | -8% | 7% | |
| Maximum Upper Side * (°C) | 49.8 | 45 10% | 47.2 5% | 53 -6% | 54 -8% | 40 20% |
| Maximum Bottom * (°C) | 48.8 | 48.8 -0% | 47.8 2% | 59 -21% | 55 -13% | 37.6 23% |
| Idle Upper Side * (°C) | 29.4 | 29.2 1% | 36.8 -25% | 34 -16% | 29 1% | 32.4 -10% |
| Idle Bottom * (°C) | 30 | 28.8 4% | 35.8 -19% | 32 -7% | 33 -10% | 31.4 -5% |
* ... Moindre est la valeur, meilleures sont les performances
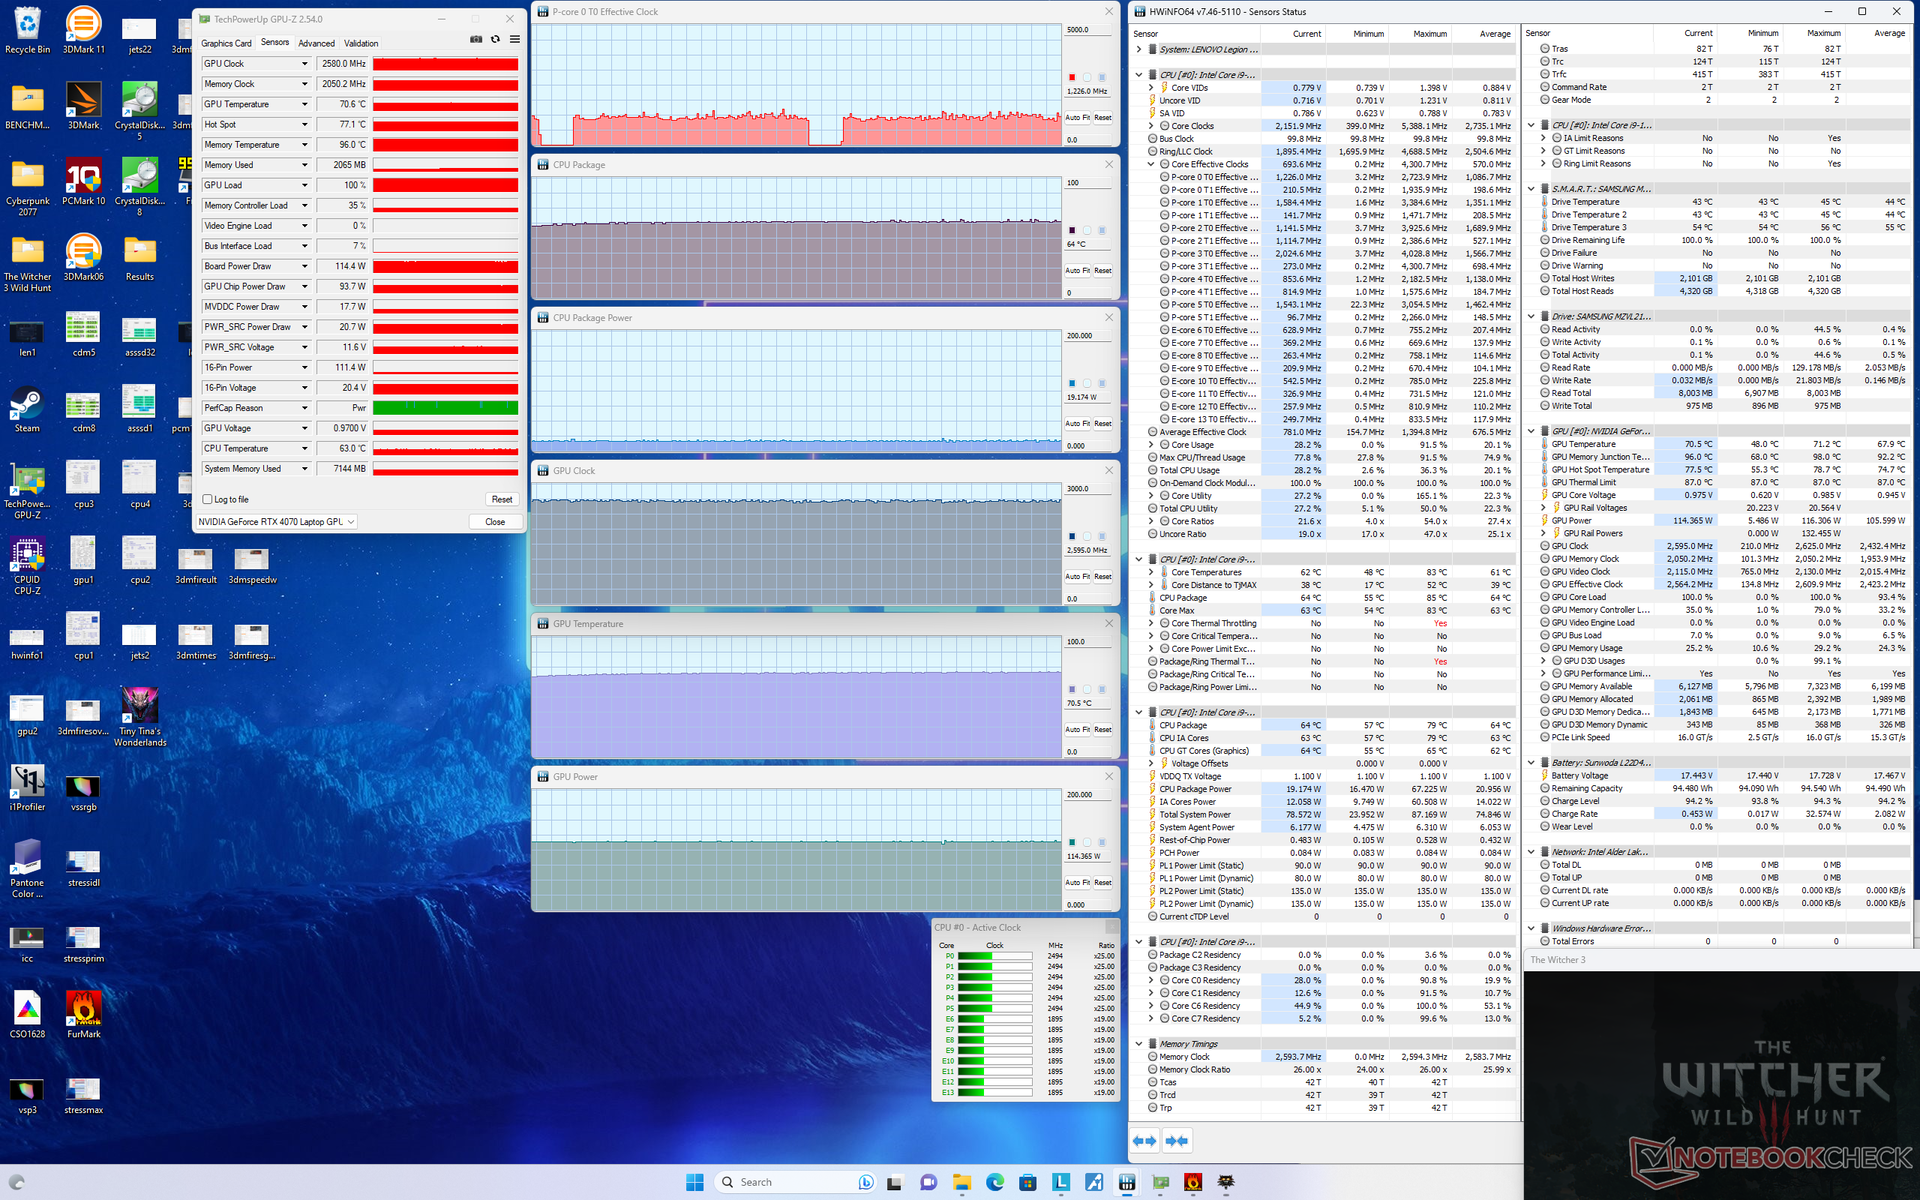
Test de stress
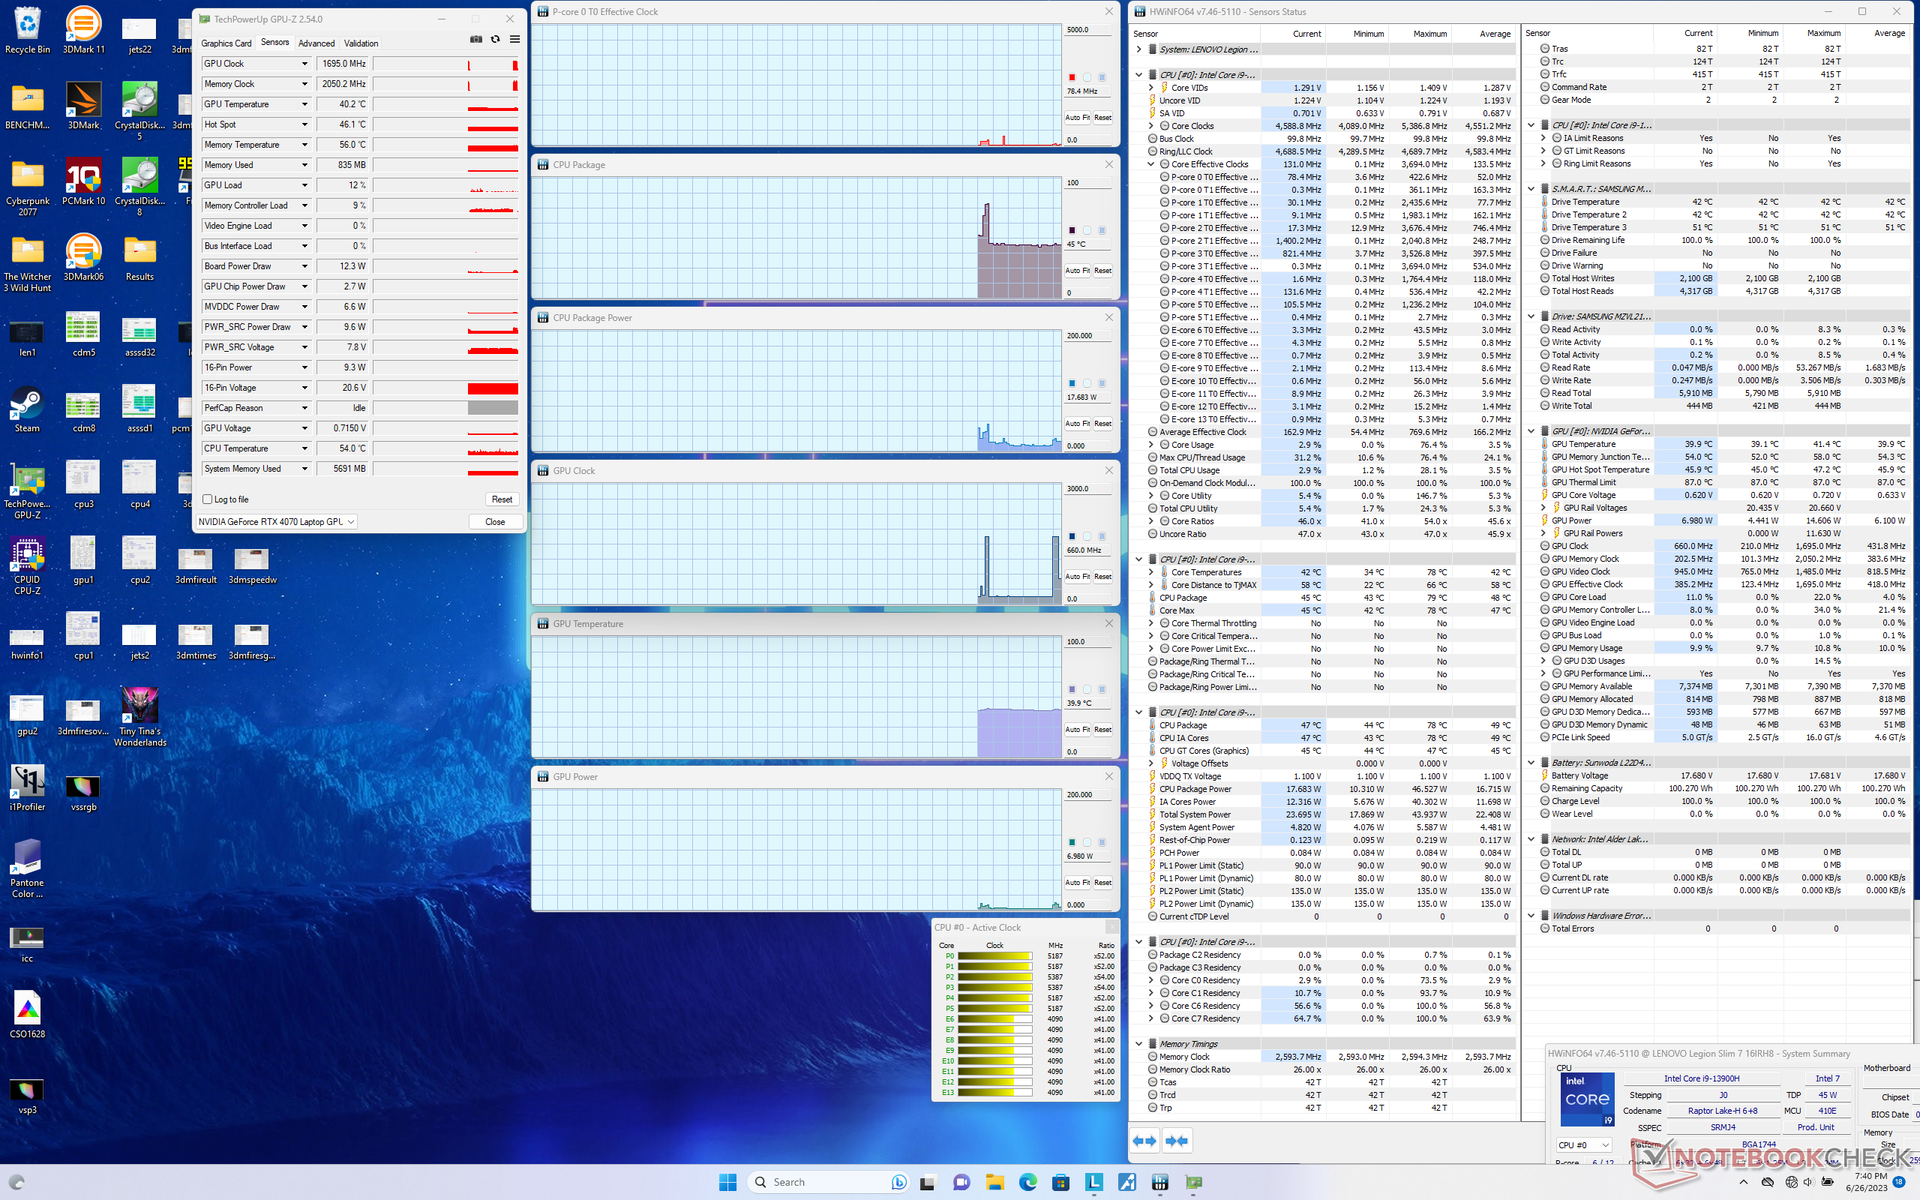
Les fréquences d'horloge du processeur, la température et la consommation d'énergie de la carte lors de l'exécution de Prime95 atteignaient 4,5 GHz, 87 °C et 100 W, respectivement, pendant environ une minute. Le processeur se stabilise ensuite à 3,5 GHz et 80 W afin de maintenir une température raisonnable de 76 °C. En répétant ce même test sur le Blade 16 avec la carte graphique, le processeur se stabilise à 4,5 GHz, 87 °C et 100 W, pendant environ une minute le Blade 16 avec le avec le Core i9-13950HX plus rapide, la température du cœur est plus élevée (82°C).
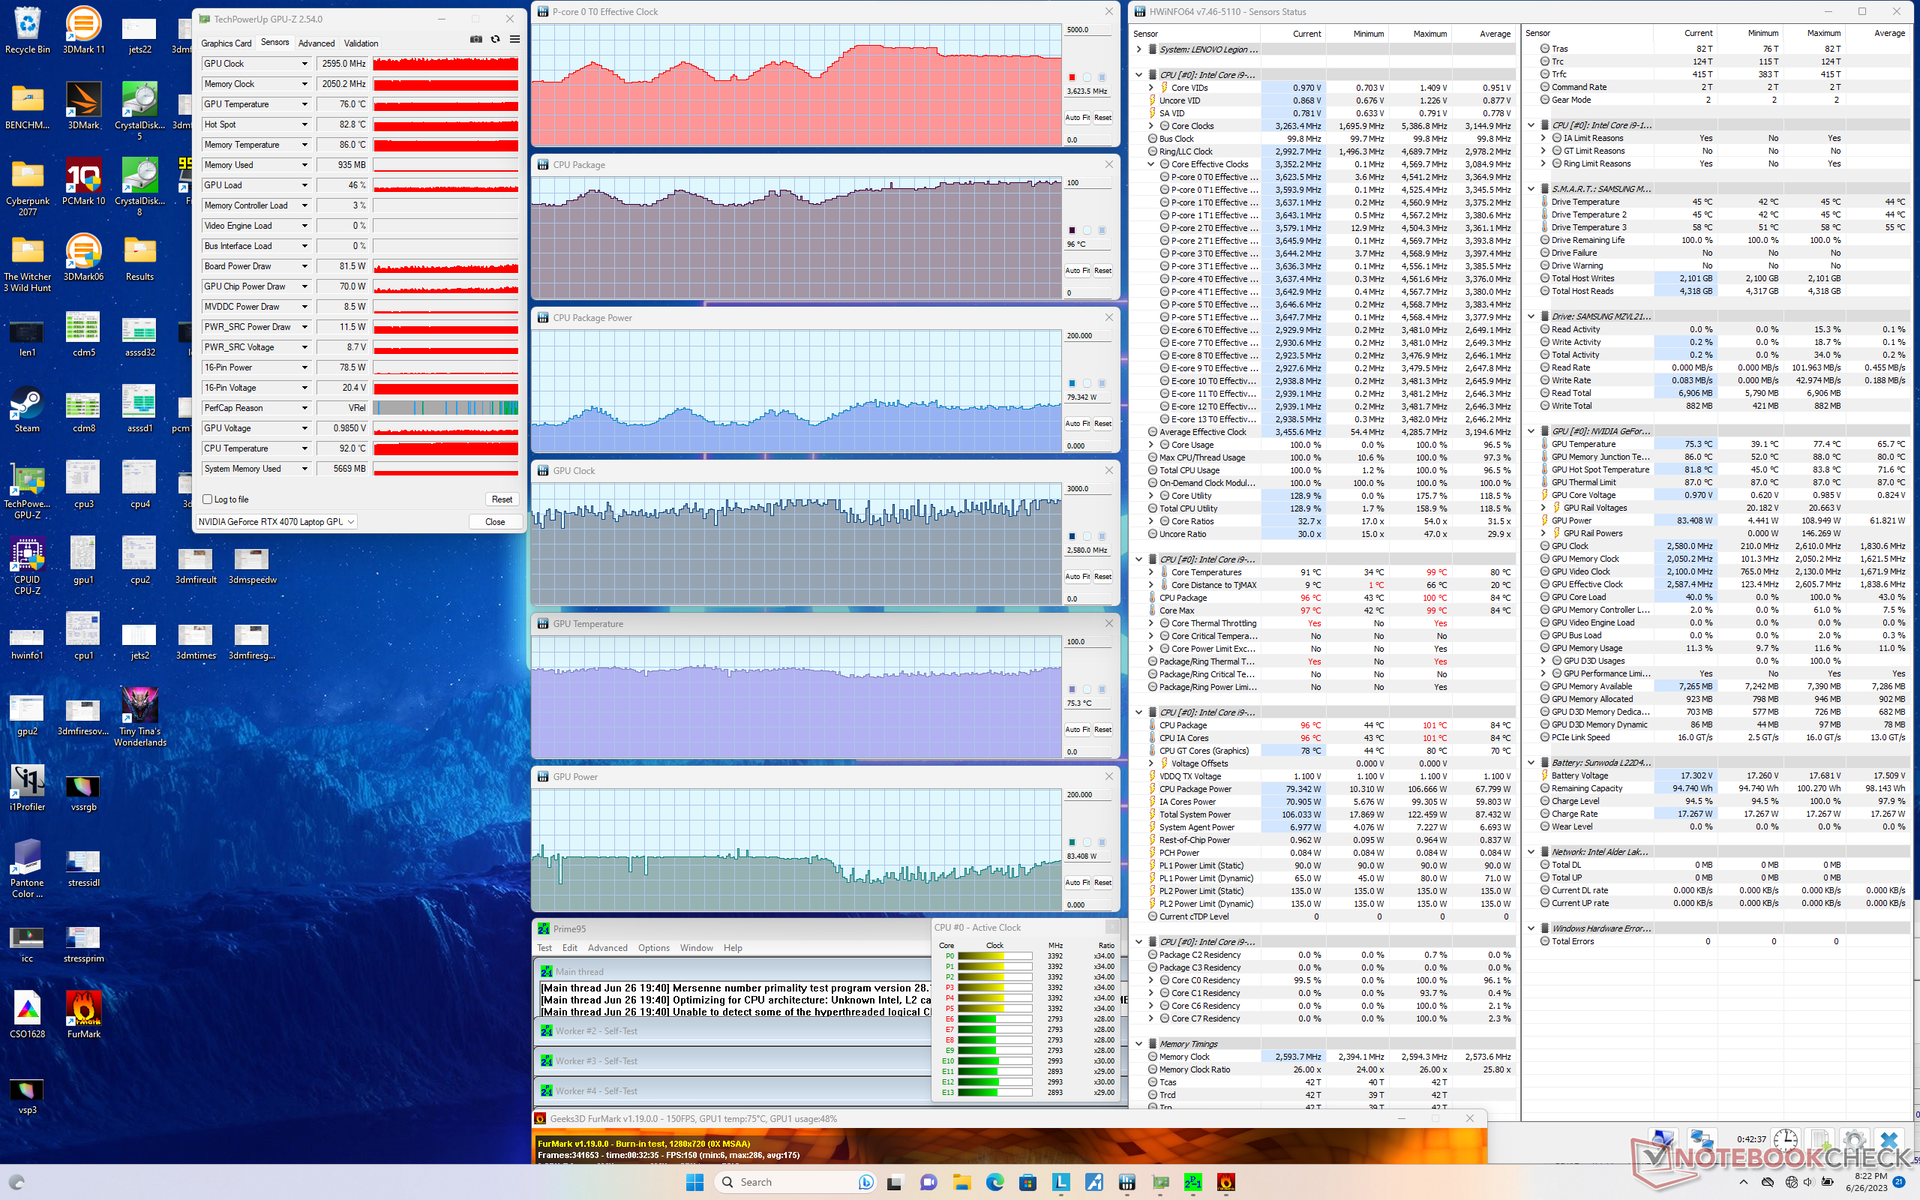
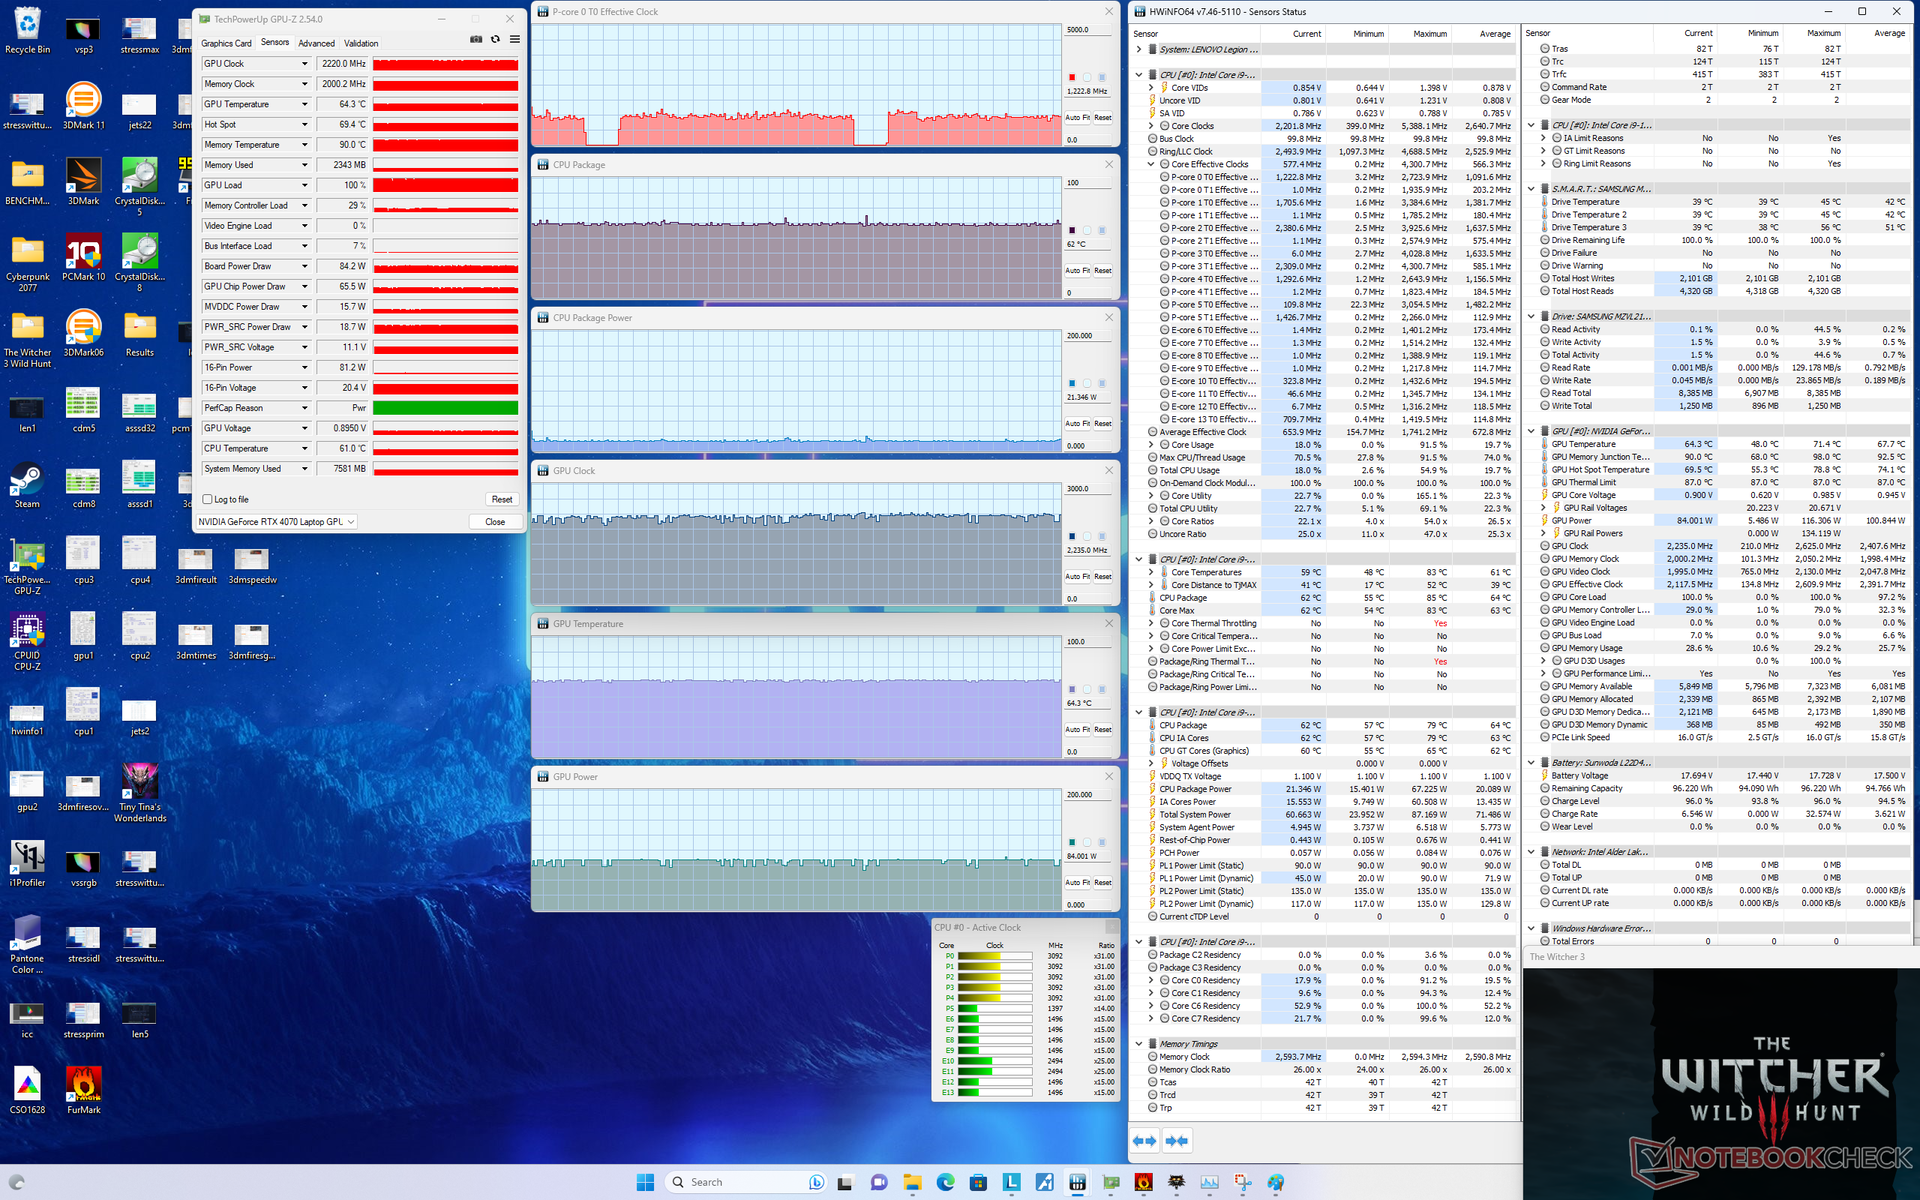
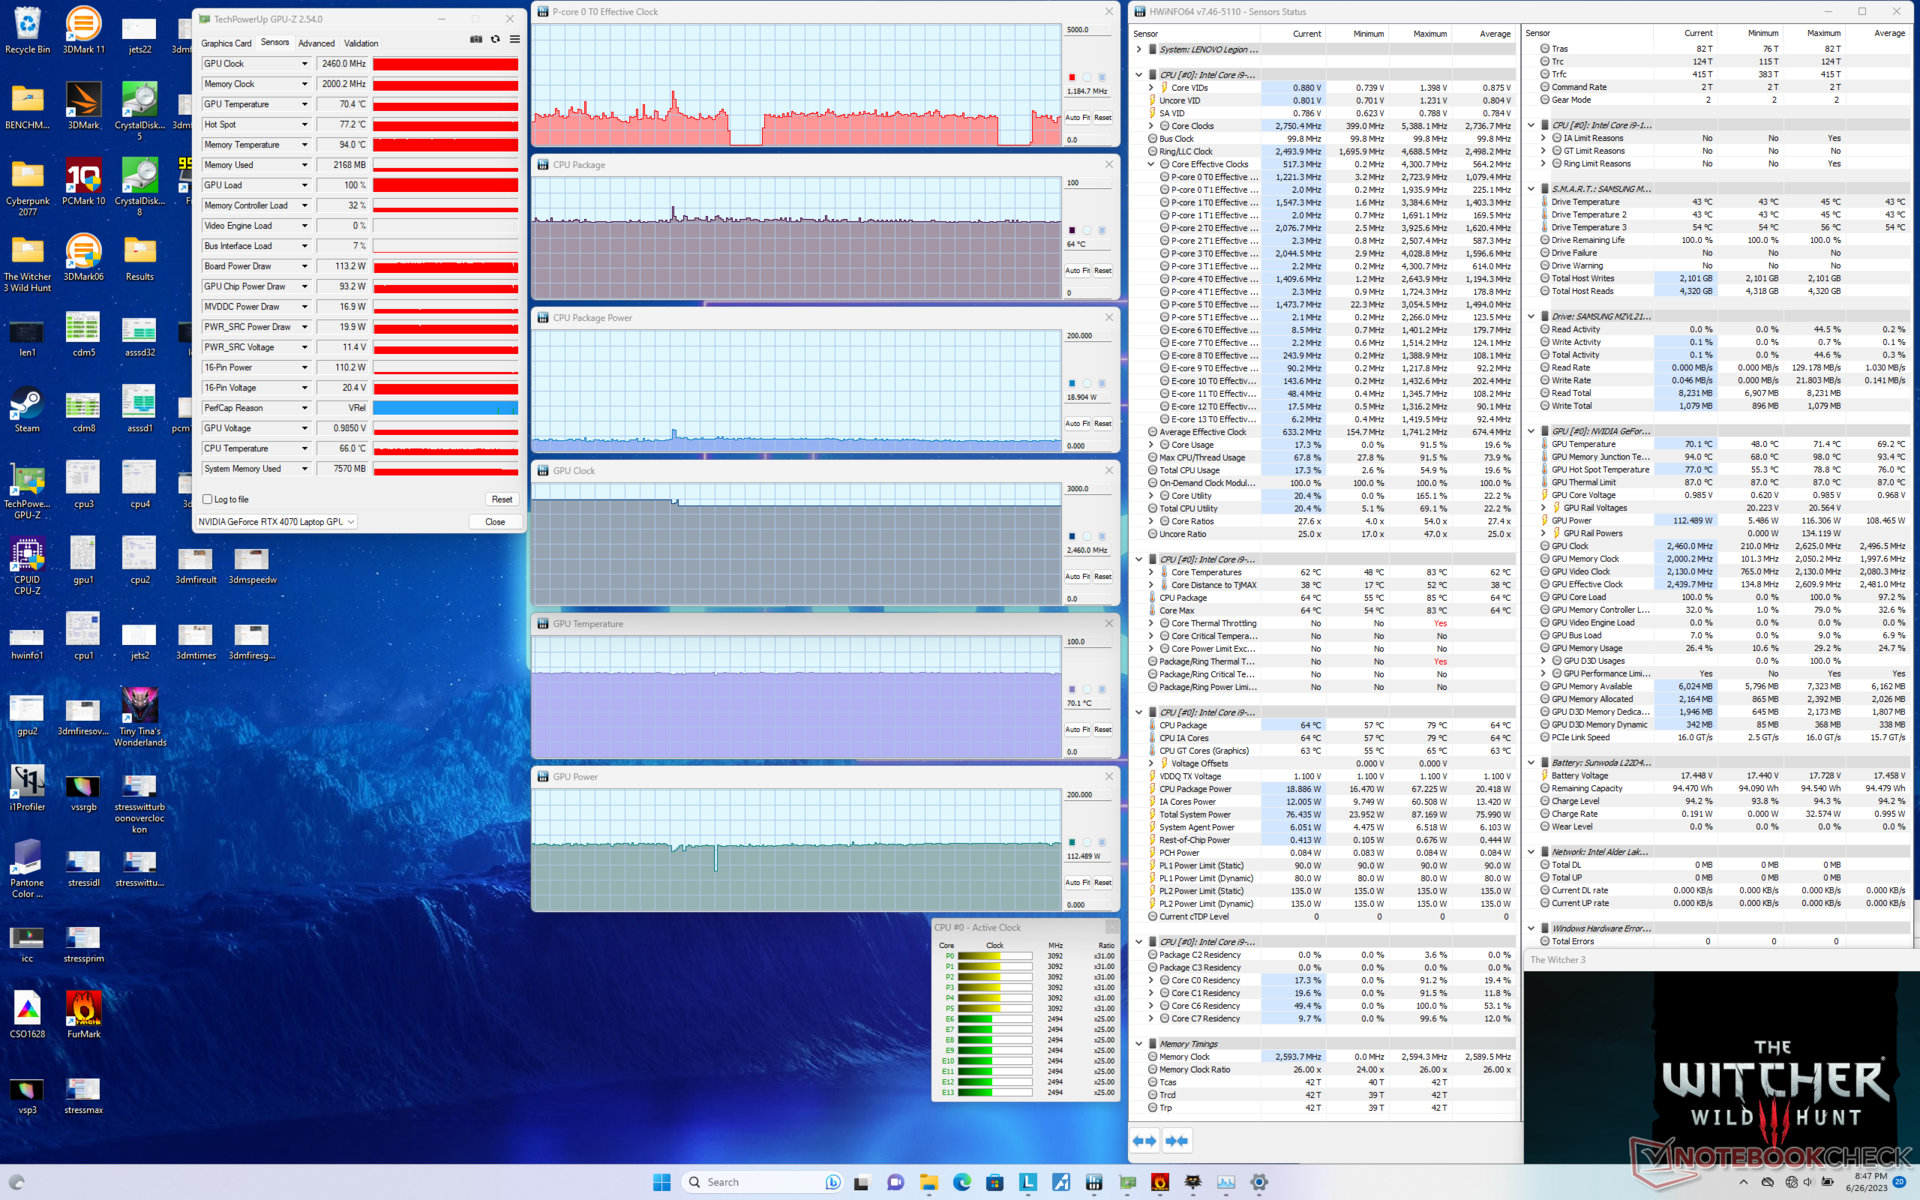
Le GPU Nvidia se stabilise à 2580 MHz, 114 W, et 71 C, respectivement, en mode Performance avec Overdrive et GPU Overclock actifs. Le GPU vise 140 W sur le papier, mais nous n'avons pu atteindre que 123 W même en faisant tourner Cyberpunk 2077. La consommation de la carte et la température du cœur tombent à 84 W et 64 C, respectivement, en mode équilibré. Les températures du cœur sont plutôt basses pour un portable de jeu fin et léger ; les températures du CPU et du GPU sur l'Alienware x16 R1, par exemple, atteindraient 80 à 95°C en jouant aux mêmes jeux.
L'utilisation de la batterie limite les performances, car le profil d'alimentation Performance est grisé. Fire Strike sur batterie donne des scores physiques et graphiques de seulement 25602 et 21049 points, respectivement, par rapport à 32664 et 30130 points sur secteur.
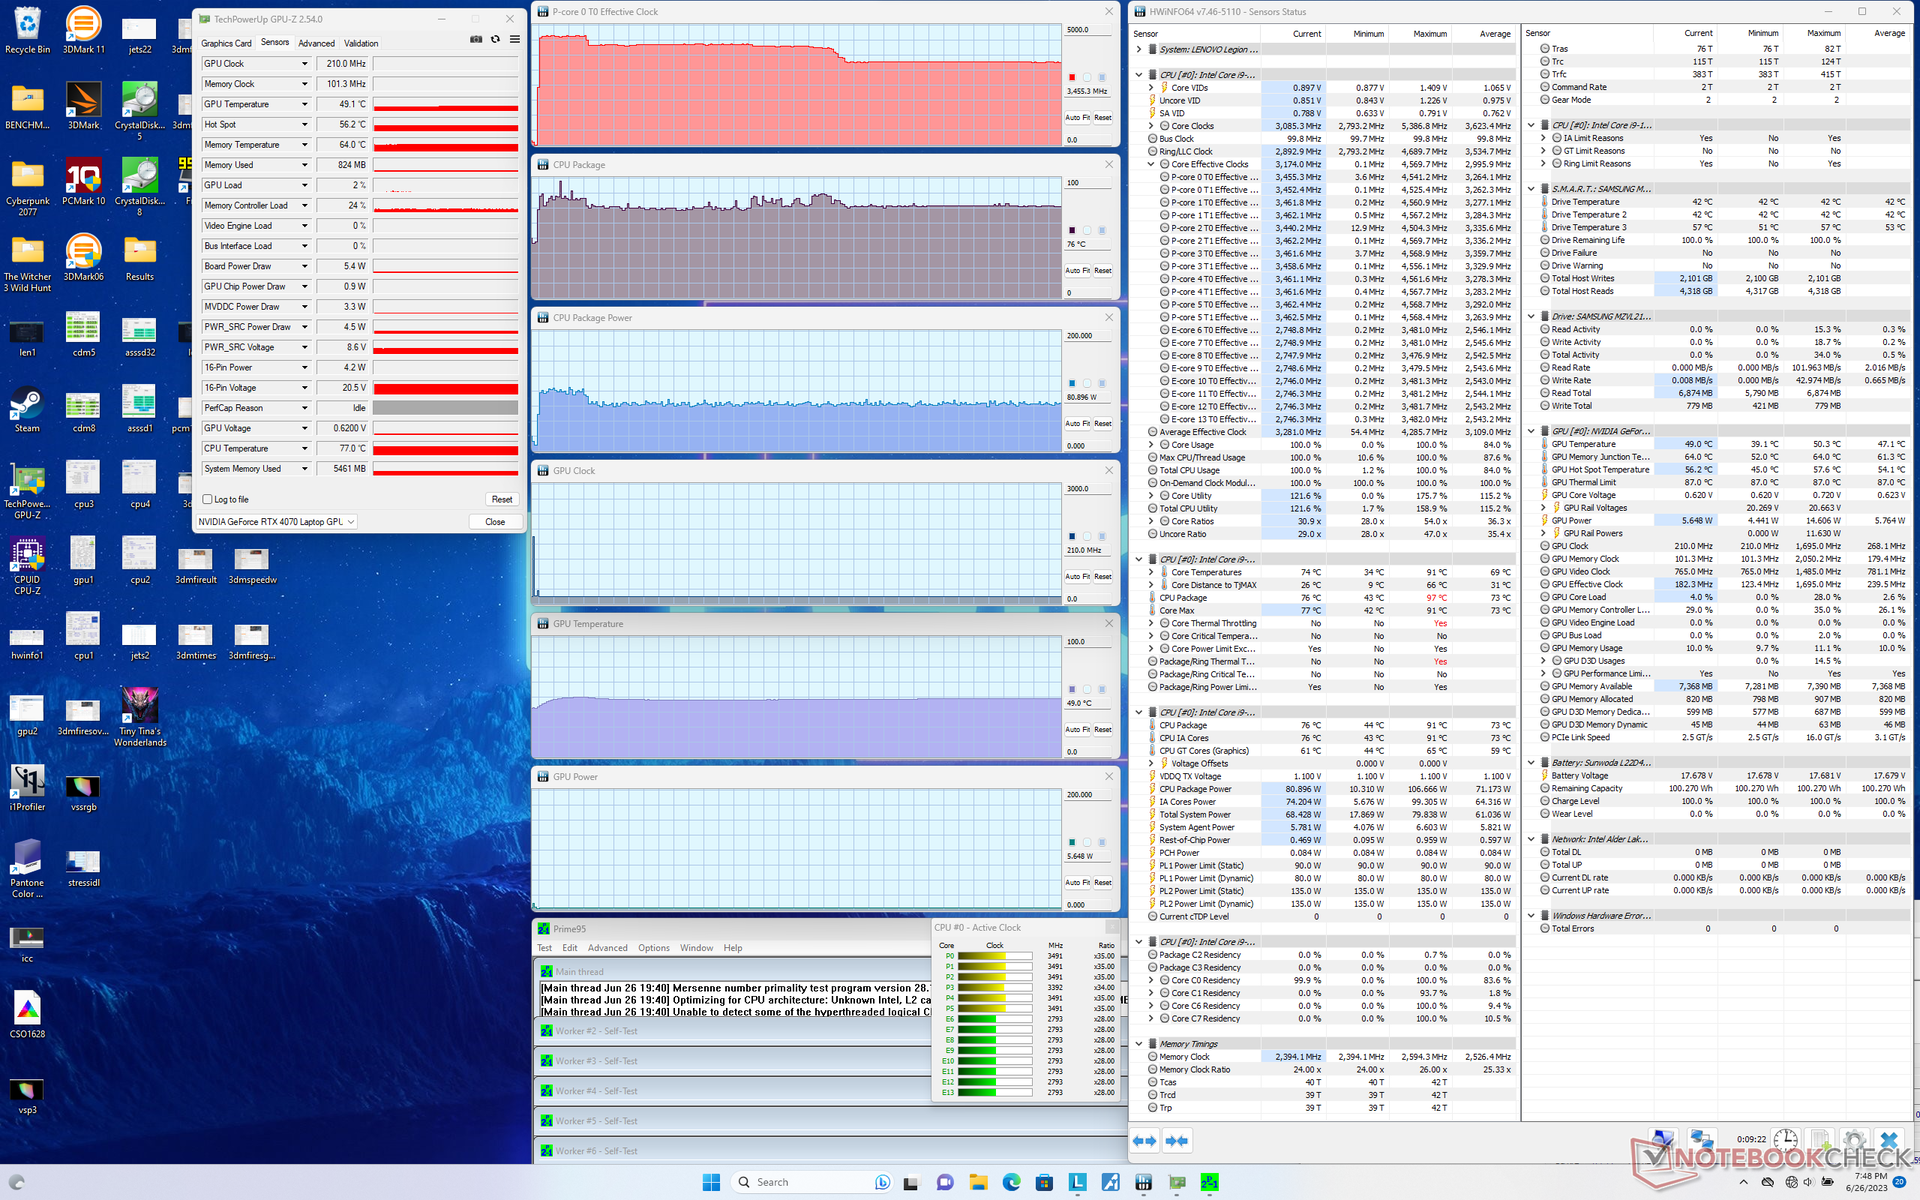
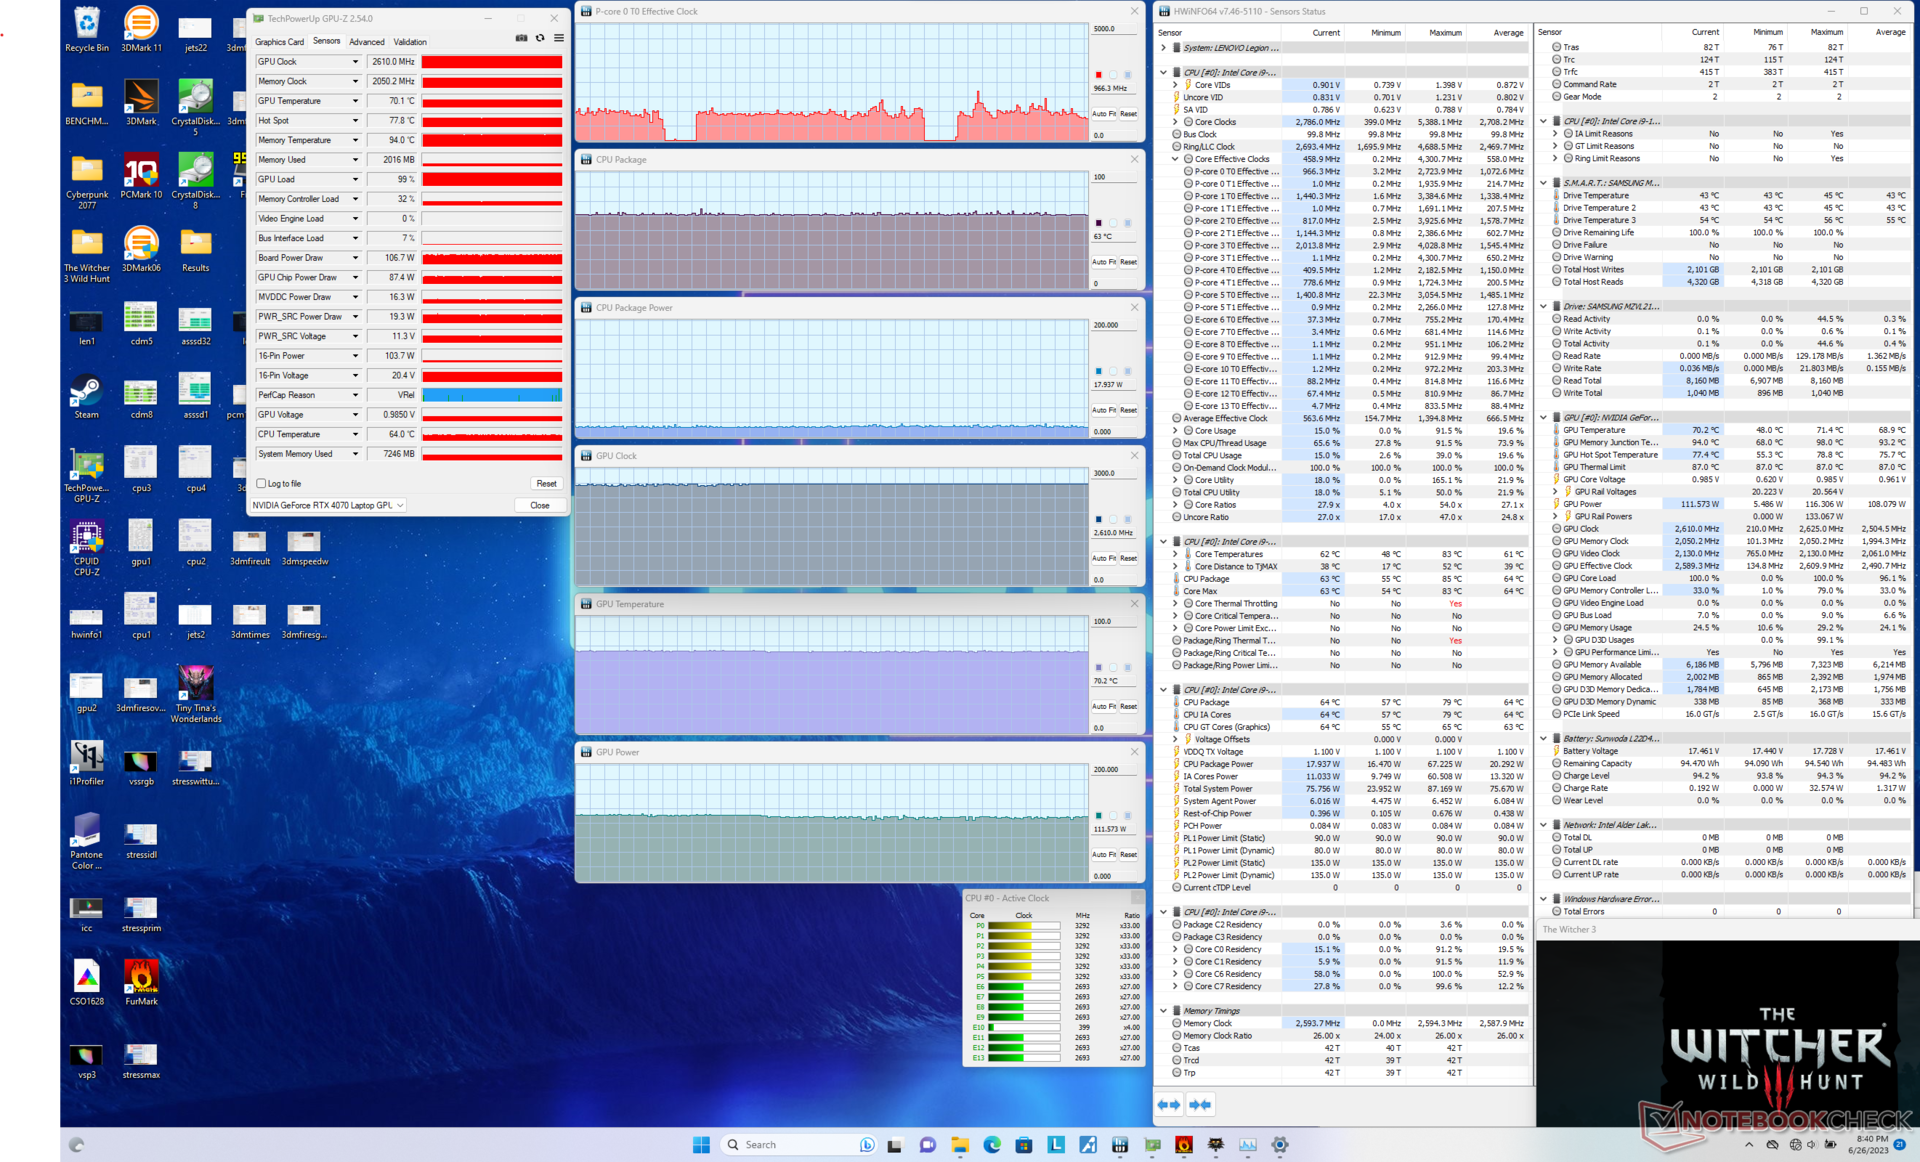
| Horloge du CPU (GHz) | Horloge du GPU (MHz) | Température moyenne du CPU (°C) | Température moyenne du GPU (°C) | |
| Système au repos | -- | -- | 45 | 40 |
| Prime95 Stress | 3.5 | -- | 76 | 49 |
| Prime95 + FurMark Stress | 2.6 - 3.5 | 1920 - 2610 | 77 - 90 | 75 |
| Witcher 3 Stress(mode équilibré) | ~1.2 | 2220 | 62 | 64 |
| Witcher 3 Stress(Performance avec GPU Overclock Off + Overdrive Off) | ~1.2 | 2460 | 64 | 70 |
| Witcher 3 Stress(Performance avec GPU Overclock On + Overdrive Off) | ~1.2 | 2610 | 63 | 70 |
| Witcher 3 Stress (Performance avec GPU Overclock On + Overdrive On) | ~1.2 | 2580 | 64 | 71 |
Intervenants
Avec un maximum d'environ 85 dB(A), les haut-parleurs sont à peu près aussi puissants que ceux de la plupart des autres ordinateurs portables de jeu. La qualité audio et la reproduction des basses n'ont rien d'exceptionnel non plus. Les haut-parleurs sont plus performants en mode équilibré, car les ventilateurs sont moins bruyants.
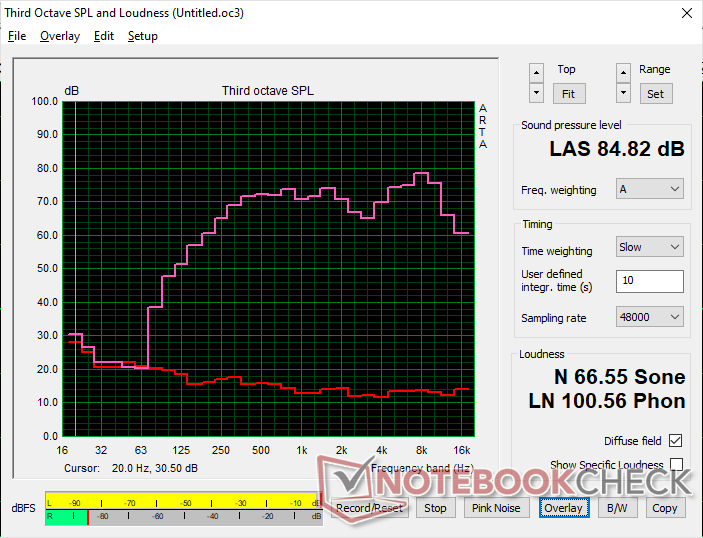
Lenovo Legion Slim 7i 16 Gen 8 analyse audio
(+) | les haut-parleurs peuvent jouer relativement fort (84.8# dB)
Basses 100 - 315 Hz
(±) | basse réduite - en moyenne 12.1% inférieure à la médiane
(±) | la linéarité des basses est moyenne (9% delta à la fréquence précédente)
Médiums 400 - 2000 Hz
(+) | médiane équilibrée - seulement 1.4% de la médiane
(+) | les médiums sont linéaires (3.3% delta à la fréquence précédente)
Aiguës 2 - 16 kHz
(+) | des sommets équilibrés - à seulement 4.4% de la médiane
(+) | les aigus sont linéaires (5.6% delta à la fréquence précédente)
Globalement 100 - 16 000 Hz
(+) | le son global est linéaire (10.5% différence à la médiane)
Par rapport à la même classe
» 6% de tous les appareils testés de cette catégorie étaient meilleurs, 2% similaires, 92% pires
» Le meilleur avait un delta de 6%, la moyenne était de 18%, le pire était de 132%.
Par rapport à tous les appareils testés
» 5% de tous les appareils testés étaient meilleurs, 1% similaires, 93% pires
» Le meilleur avait un delta de 4%, la moyenne était de 24%, le pire était de 134%.
Apple MacBook Pro 16 2021 M1 Pro analyse audio
(+) | les haut-parleurs peuvent jouer relativement fort (84.7# dB)
Basses 100 - 315 Hz
(+) | bonne basse - seulement 3.8% loin de la médiane
(+) | les basses sont linéaires (5.2% delta à la fréquence précédente)
Médiums 400 - 2000 Hz
(+) | médiane équilibrée - seulement 1.3% de la médiane
(+) | les médiums sont linéaires (2.1% delta à la fréquence précédente)
Aiguës 2 - 16 kHz
(+) | des sommets équilibrés - à seulement 1.9% de la médiane
(+) | les aigus sont linéaires (2.7% delta à la fréquence précédente)
Globalement 100 - 16 000 Hz
(+) | le son global est linéaire (4.6% différence à la médiane)
Par rapport à la même classe
» 0% de tous les appareils testés de cette catégorie étaient meilleurs, 0% similaires, 100% pires
» Le meilleur avait un delta de 5%, la moyenne était de 17%, le pire était de 45%.
Par rapport à tous les appareils testés
» 0% de tous les appareils testés étaient meilleurs, 0% similaires, 100% pires
» Le meilleur avait un delta de 4%, la moyenne était de 24%, le pire était de 134%.
Gestion de l'énergie
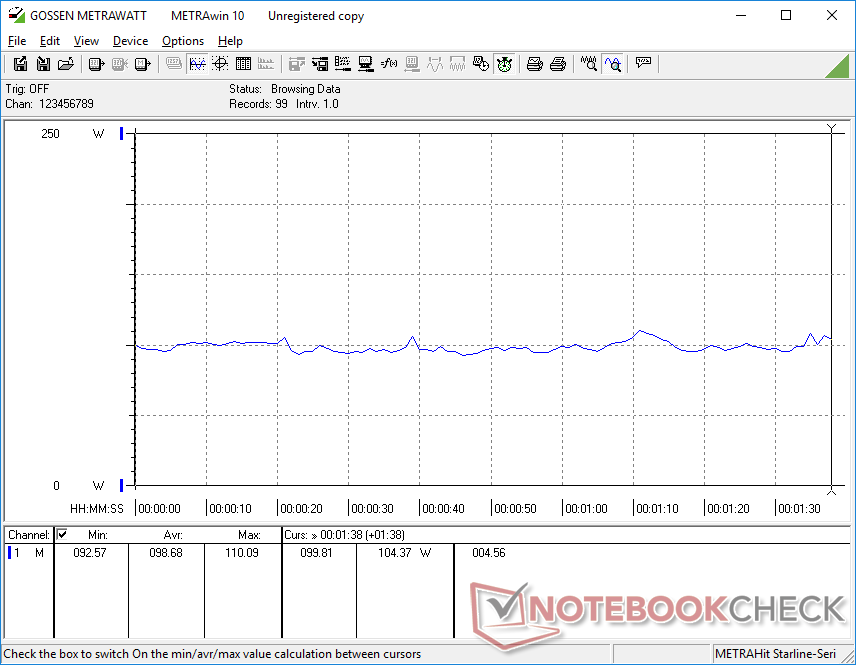
Consommation d'énergie - Taux de ralenti élevés
La consommation d'énergie au ralenti sur le bureau est relativement élevée (22 W), même avec l'économiseur d'énergie et les paramètres de luminosité minimum. Il s'agit là d'un trait commun aux ordinateurs portables de jeu équipés de processeurs Core-H de 13e génération, comme le montre le tableau ci-dessous, qui contribue probablement à la médiocrité de l'autonomie de la batterie. En comparaison, l'ordinateur portable AMD Zen 4 Legion Pro 5 16 peut descendre jusqu'à 8 W dans des conditions similaires.
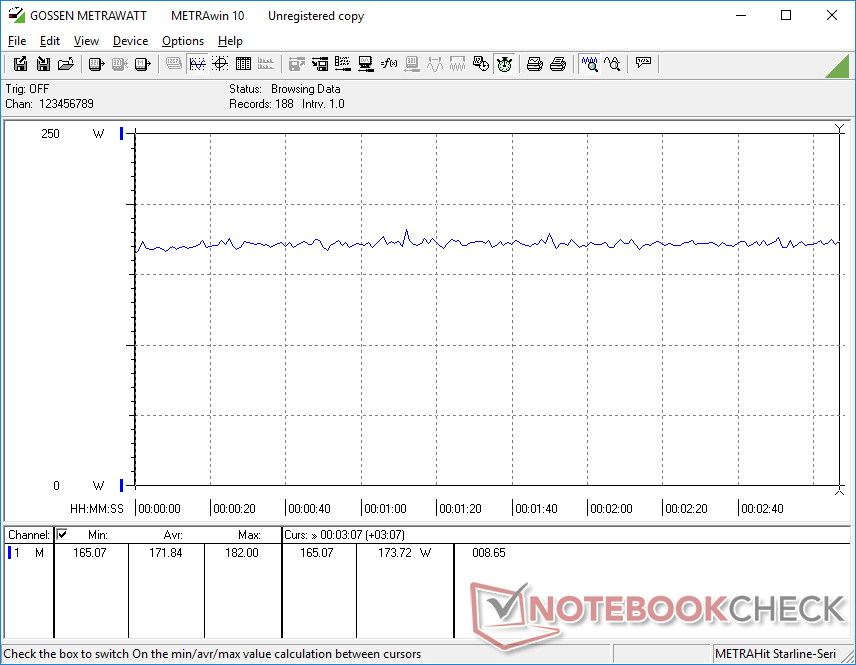
Les jeux consomment environ 172 W, ce qui est très similaire à l'ancien modèle Zephyrus M16 équipé d'un Core i9-12900H et d'une RTX 3070 Ti. Notre Legion Slim 7 est donc capable de fournir des performances graphiques environ 15 % plus rapides sans avoir besoin de consommer plus d'énergie, pour des performances par watt supérieures à celles des anciens ordinateurs portables de jeu alimentés par Ampere.
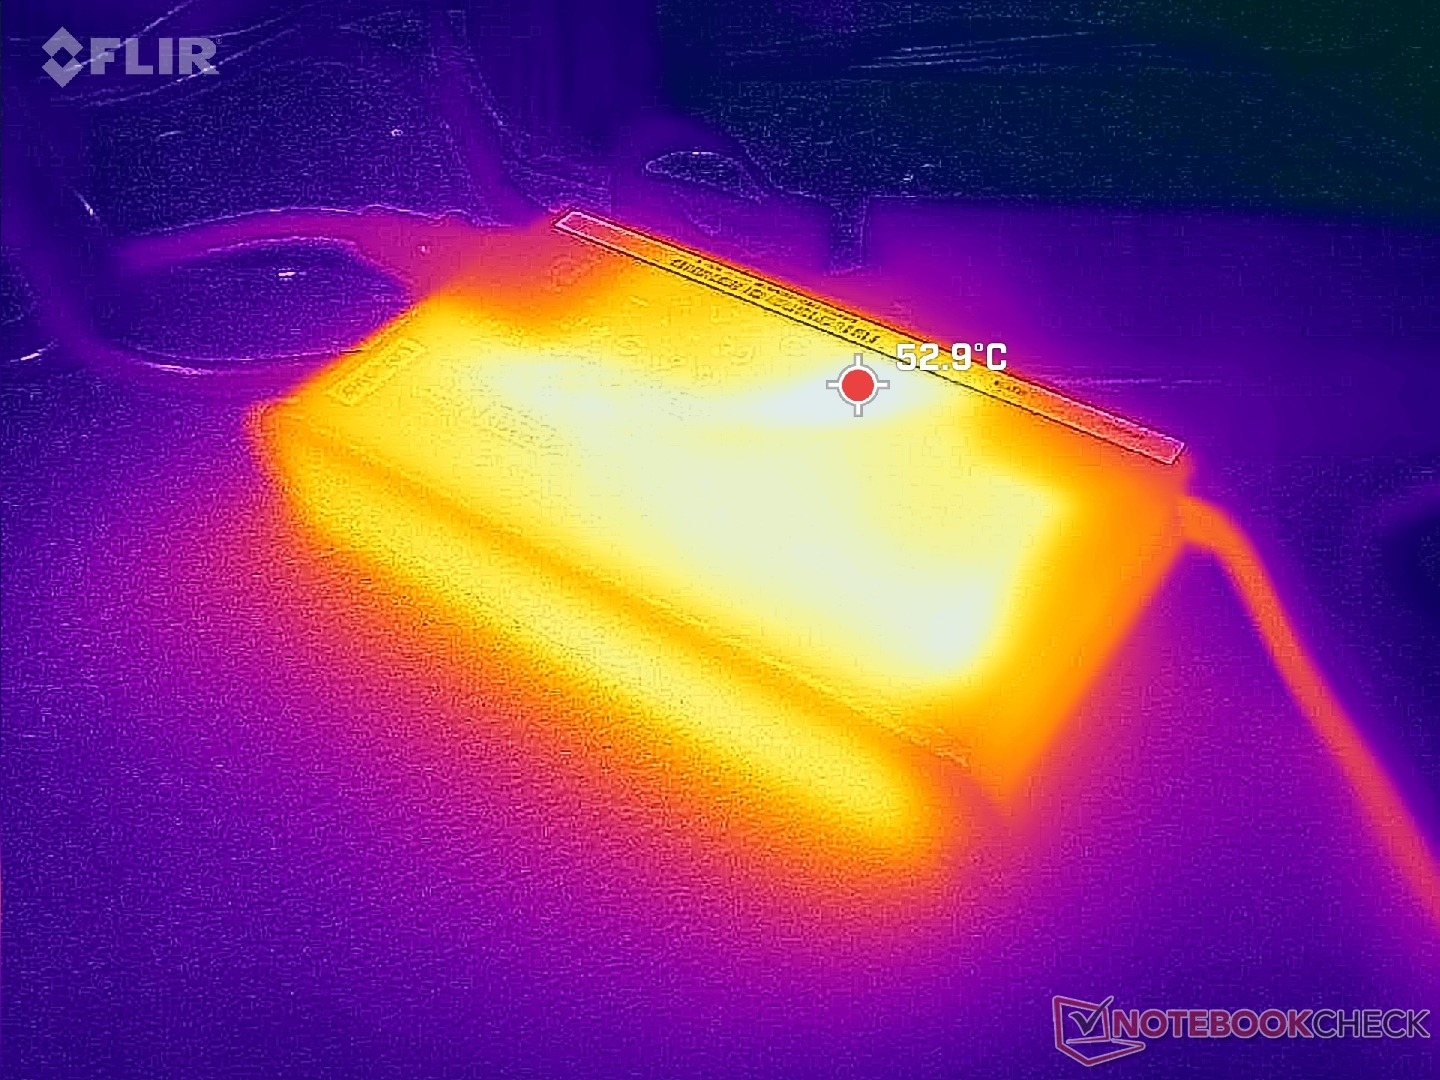
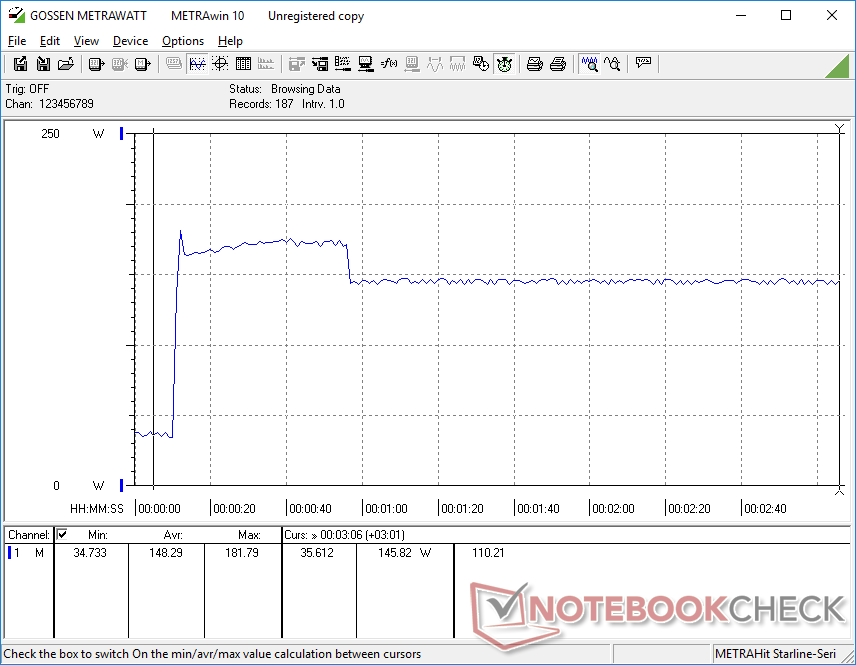
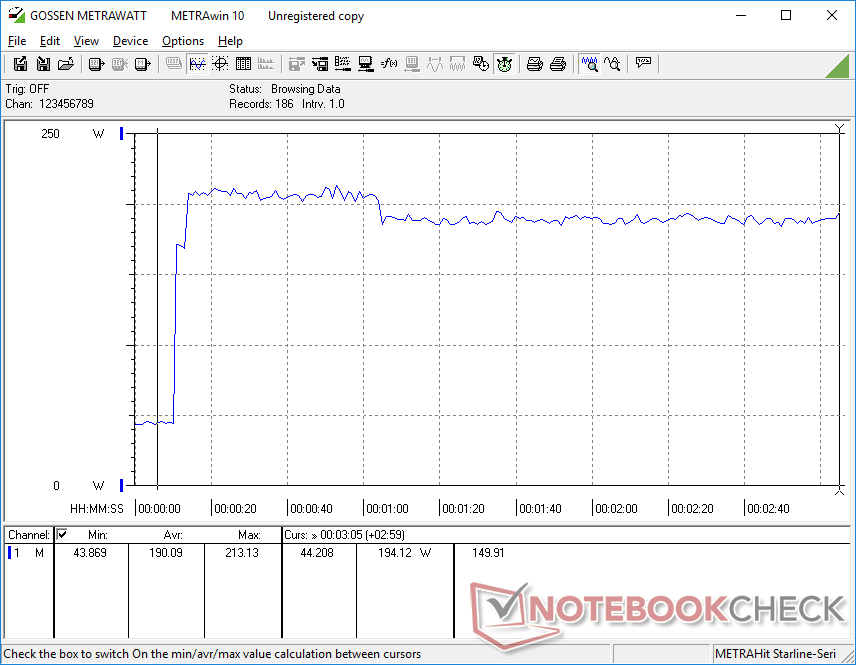
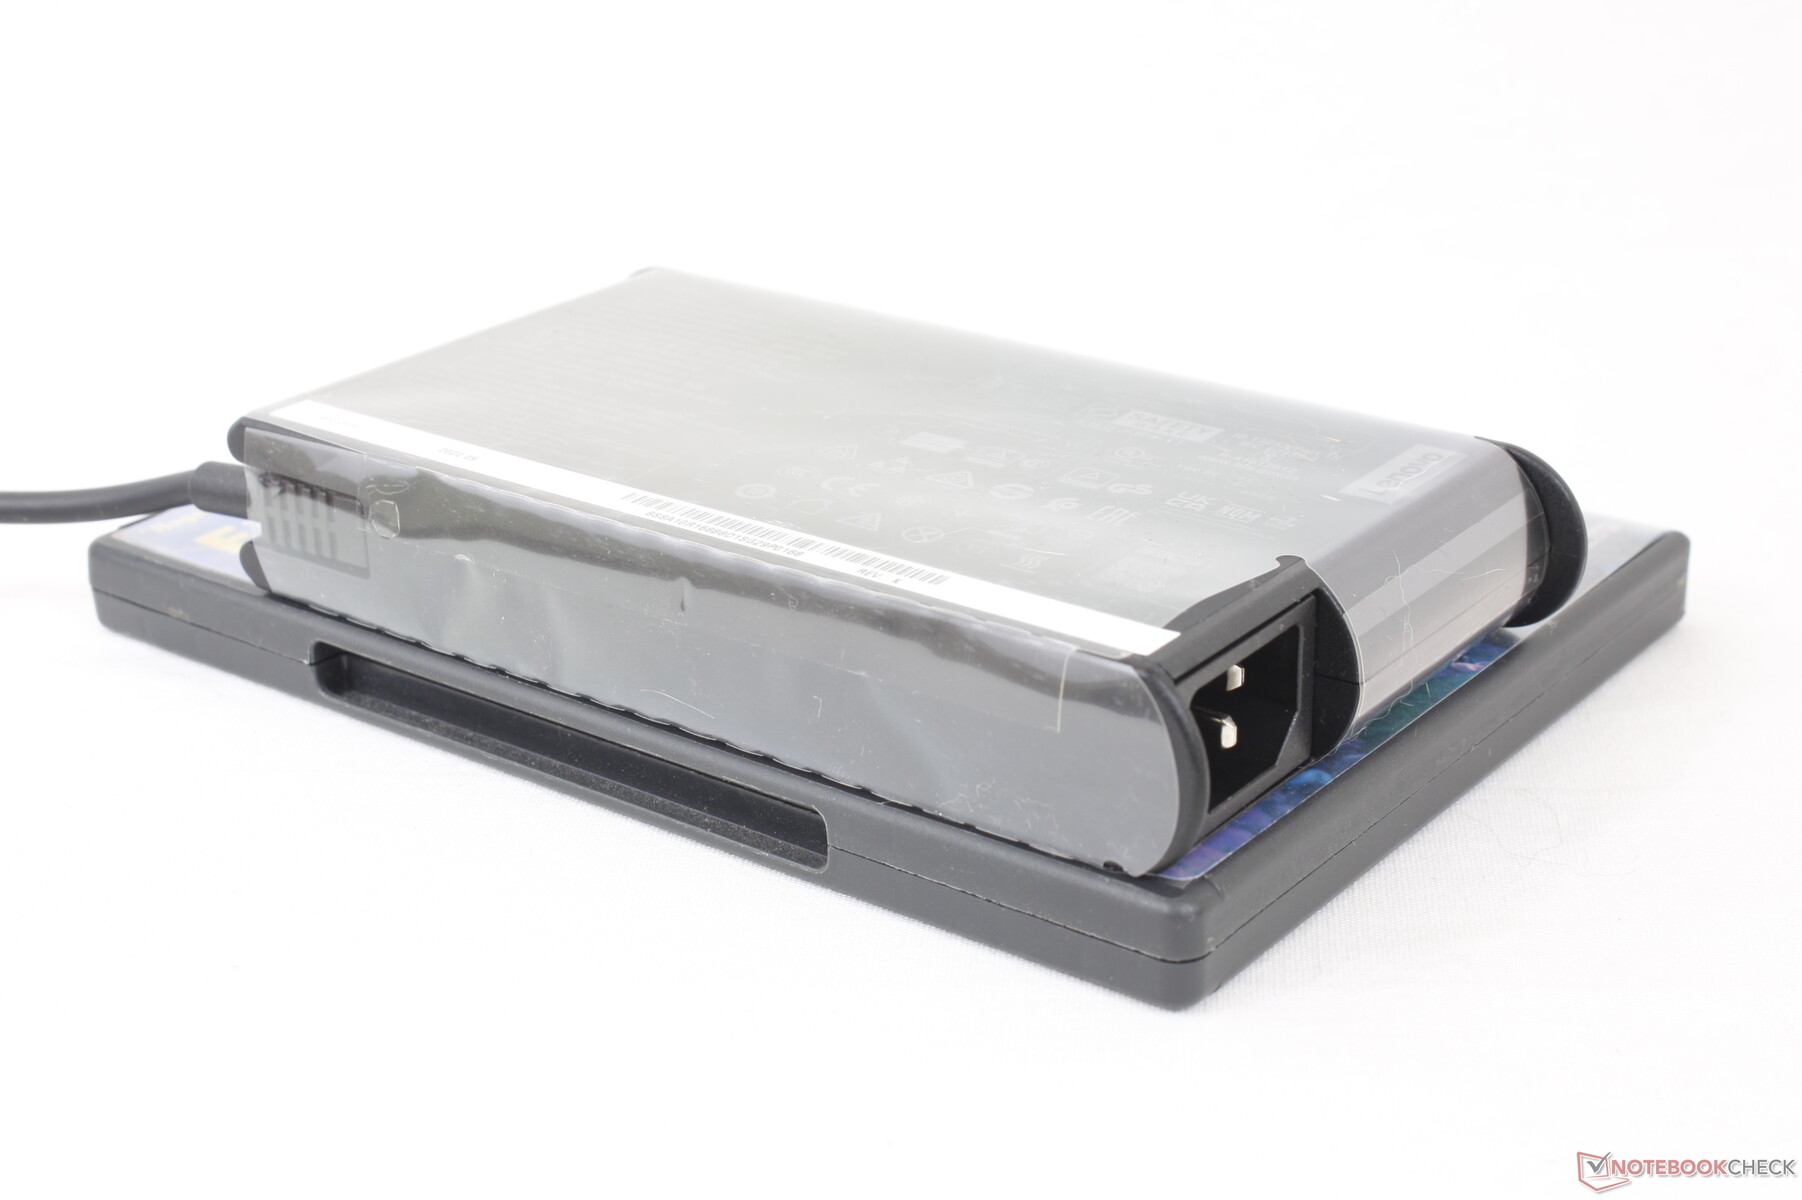
Nous avons pu mesurer une consommation de pointe de 213 W à partir de l'adaptateur secteur de taille moyenne (~16,9 x 8,8 x 2,6 cm) de 230 W. Un adaptateur plus puissant de 330 W est fourni avec l'ordinateur. Un adaptateur plus puissant de 330 W est inclus avec le plus grand Legion Pro 7 qui est livré avec le Core i9-13900HX beaucoup plus puissant et la RTX 4080.
| Éteint/en veille | |
| Au repos | |
| Fortement sollicité |
|
Légende:
min: | |
| Lenovo Legion Slim 7i 16 Gen 8 i9-13900H, GeForce RTX 4070 Laptop GPU, Samsung PM9A1 MZVL21T0HCLR, IPS, 2560x1600, 16" | Acer Predator Helios 16 PH16-71-731Q i7-13700HX, GeForce RTX 4060 Laptop GPU, Micron 3400 1TB MTFDKBA1T0TFH, IPS-LED, 2560x1600, 16" | HP Omen 16-wf000 i7-13700HX, GeForce RTX 4080 Laptop GPU, SK hynix PC801 HFS002TEJ9X101N, IPS, 2560x1440, 16.1" | Lenovo Legion Pro 7 RTX4090 i9-13900HX, GeForce RTX 4090 Laptop GPU, Samsung PM9A1 MZVL21T0HCLR, IPS, 2560x1600, 16" | Alienware x16 R1 i9-13900HK, GeForce RTX 4080 Laptop GPU, SK hynix PC801 HFS001TEJ9X101N, IPS, 2560x1600, 16" | Lenovo Legion Pro 5 16ARX8 R7 7745HX, GeForce RTX 4070 Laptop GPU, Samsung PM9A1 MZVL21T0HCLR, IPS, 2560x1600, 16" | |
|---|---|---|---|---|---|---|
| Power Consumption | 11% | -8% | -20% | -25% | 15% | |
| Idle Minimum * (Watt) | 22 | 15.9 28% | 21.8 1% | 20 9% | 25.2 -15% | 8.1 63% |
| Idle Average * (Watt) | 29 | 20.5 29% | 26 10% | 25 14% | 29.9 -3% | 15.9 45% |
| Idle Maximum * (Watt) | 39.5 | 20.9 47% | 36 9% | 35 11% | 49.8 -26% | 37.2 6% |
| Load Average * (Watt) | 98.7 | 106 -7% | 115.5 -17% | 136 -38% | 105.4 -7% | 90.9 8% |
| Witcher 3 ultra * (Watt) | 171.8 | 175 -2% | 214 -25% | 282 -64% | 263 -53% | 189.6 -10% |
| Load Maximum * (Watt) | 213.2 | 276 -29% | 269.7 -27% | 320 -50% | 313.8 -47% | 263.5 -24% |
* ... Moindre est la valeur, meilleures sont les performances
Power Consumption Witcher 3 / Stresstest
Power Consumption external Monitor
Autonomie de la batterie
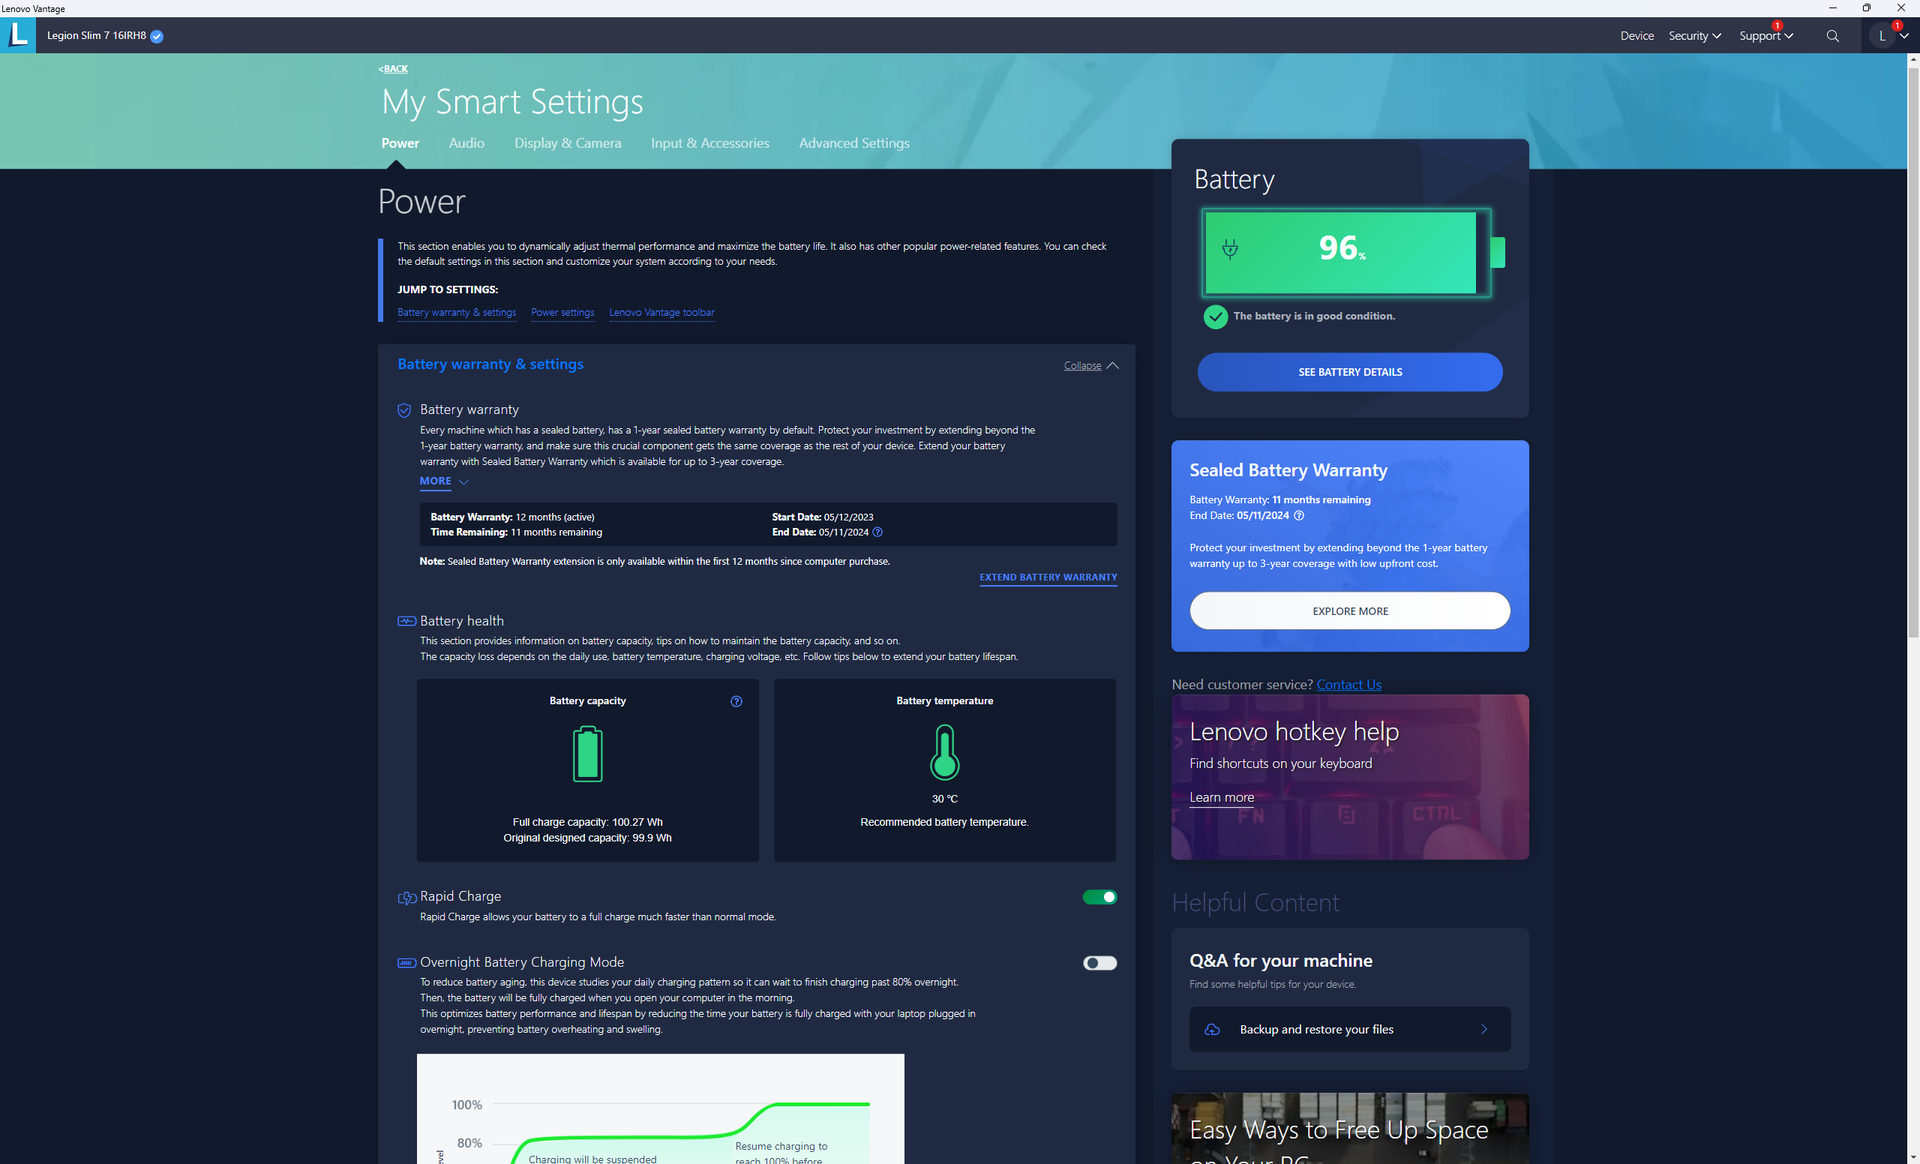
La capacité de la batterie est étonnamment aussi importante que sur le Legion Pro 7 17, malgré le profil plus fin de notre Slim 7i. Néanmoins, l'autonomie de la batterie reste moyenne avec un peu moins de 4,5 heures d'utilisation en navigation réelle. La plupart des autres ordinateurs portables de jeu équipés de processeurs Intel de 13e génération affichent des durées d'autonomie similaires ou plus courtes, y compris le Omen 16 ou l'Alienware x16 R1.
Le chargement de l'ordinateur de la batterie vide à la batterie pleine ne prend que 70 minutes avec la fonction Rapid Charge activée, contre 90 minutes ou plus pour la plupart des autres ordinateurs portables de jeu. Le système peut également être rechargé via USB-C à une puissance maximale de 140 W.
| Lenovo Legion Slim 7i 16 Gen 8 i9-13900H, GeForce RTX 4070 Laptop GPU, 99.9 Wh | HP Omen 16-wf000 i7-13700HX, GeForce RTX 4080 Laptop GPU, 83 Wh | Alienware x16 R1 i9-13900HK, GeForce RTX 4080 Laptop GPU, 90 Wh | Lenovo Legion Pro 7 RTX4090 i9-13900HX, GeForce RTX 4090 Laptop GPU, 99.9 Wh | Asus ROG Strix G16 G614JZ i9-13980HX, GeForce RTX 4080 Laptop GPU, 90 Wh | Razer Blade 16 Early 2023 i9-13950HX, GeForce RTX 4080 Laptop GPU, 95.2 Wh | |
|---|---|---|---|---|---|---|
| Autonomie de la batterie | 15% | -7% | 16% | 71% | 57% | |
| Reader / Idle (h) | 5.1 | 5.5 8% | 7.3 43% | 8.9 75% | ||
| WiFi v1.3 (h) | 4.4 | 5.1 16% | 2.5 -43% | 5.1 16% | 9.7 120% | 6.1 39% |
| Load (h) | 0.9 | 1.1 22% | 0.7 -22% | 1.1 22% | 1.4 56% |
Points positifs
Points négatifs
Verdict - convaincant dans presque tous les domaines
Le Legion Slim 7i 16 Gen 8 est l'un des ordinateurs portables de jeu les plus équilibrés de la famille Legion. Non seulement il est plus fin et plus léger que la plupart des ordinateurs portables de la catégorie des 16 pouces, mais il ne lésine pas sur les options de port, le clavier RGB spacieux par touche, les options d'affichage respectables pour les joueurs et les créateurs de contenu, et même la capacité de la batterie et un lecteur SD. Ce modèle répond à de nombreuses attentes compte tenu de sa finesse.
Le Lenovo Legion Slim 7i 16 G8 sacrifie quelques options de performance pour sa taille plus fine et son poids plus léger, mais le modèle est autrement si bien équilibré en termes de performance et de portabilité que la plupart des joueurs n'y verront pas d'inconvénient.
Quelques fissures commencent à apparaître lorsque l'on plonge plus profondément dans la machine. La configuration de la RAM soudée et extensible, par exemple, n'est pas courante sur les ordinateurs portables de jeu, tandis que le SSD a tendance à s'essouffler lorsqu'il est sollicité. Les options de CPU et de GPU ne comprennent pas le Core i9-13900HX et la RTX 4080, respectivement, qui ne sont disponibles que sur le Legion Pro 7 16, plus épais et plus lourd. Les passionnés qui veulent tout et la cuisine devront donc se contenter d'alternatives plus grandes et plus lourdes comme le Legion Pro 7alienware m16, ou le Razer Blade 16 qui proposent tous des options de processeurs plus rapides.
Prix et disponibilité
Lenovo livre maintenant son Legion Slim 7i 16 Gen 8 à partir de $1500 USD pour la configuration de base Core i7-13700H et RTX 4060 jusqu'à $1800 USD avec notre configuration Core i9-13900H et RTX 4070. La configuration haut de gamme est également disponible chez Best Buy.
Lenovo Legion Slim 7i 16 Gen 8
- 07/03/2023 v7 (old)
Allen Ngo
Transparency
La sélection des appareils à examiner est effectuée par notre équipe éditoriale. L'échantillon de test a été prêté à l'auteur par le fabricant ou le détaillant pour les besoins de cet examen. Le prêteur n'a pas eu d'influence sur cette évaluation et le fabricant n'a pas reçu de copie de cette évaluation avant sa publication. Il n'y avait aucune obligation de publier cet article. En tant que média indépendant, Notebookcheck n'est pas soumis à l'autorité des fabricants, des détaillants ou des éditeurs.
Voici comment Notebookcheck teste
Chaque année, Notebookcheck examine de manière indépendante des centaines d'ordinateurs portables et de smartphones en utilisant des procédures standardisées afin de garantir que tous les résultats sont comparables. Nous avons continuellement développé nos méthodes de test depuis environ 20 ans et avons établi des normes industrielles dans le processus. Dans nos laboratoires de test, des équipements de mesure de haute qualité sont utilisés par des techniciens et des rédacteurs expérimentés. Ces tests impliquent un processus de validation en plusieurs étapes. Notre système d'évaluation complexe repose sur des centaines de mesures et de points de référence bien fondés, ce qui garantit l'objectivité.Price comparison

