 Deutsch
 English
 Español
 Français
 Italiano
 Nederlands
 Polski
 Português
 Русский
 Türkçe
 Svenska
 Chinese
 Magyar
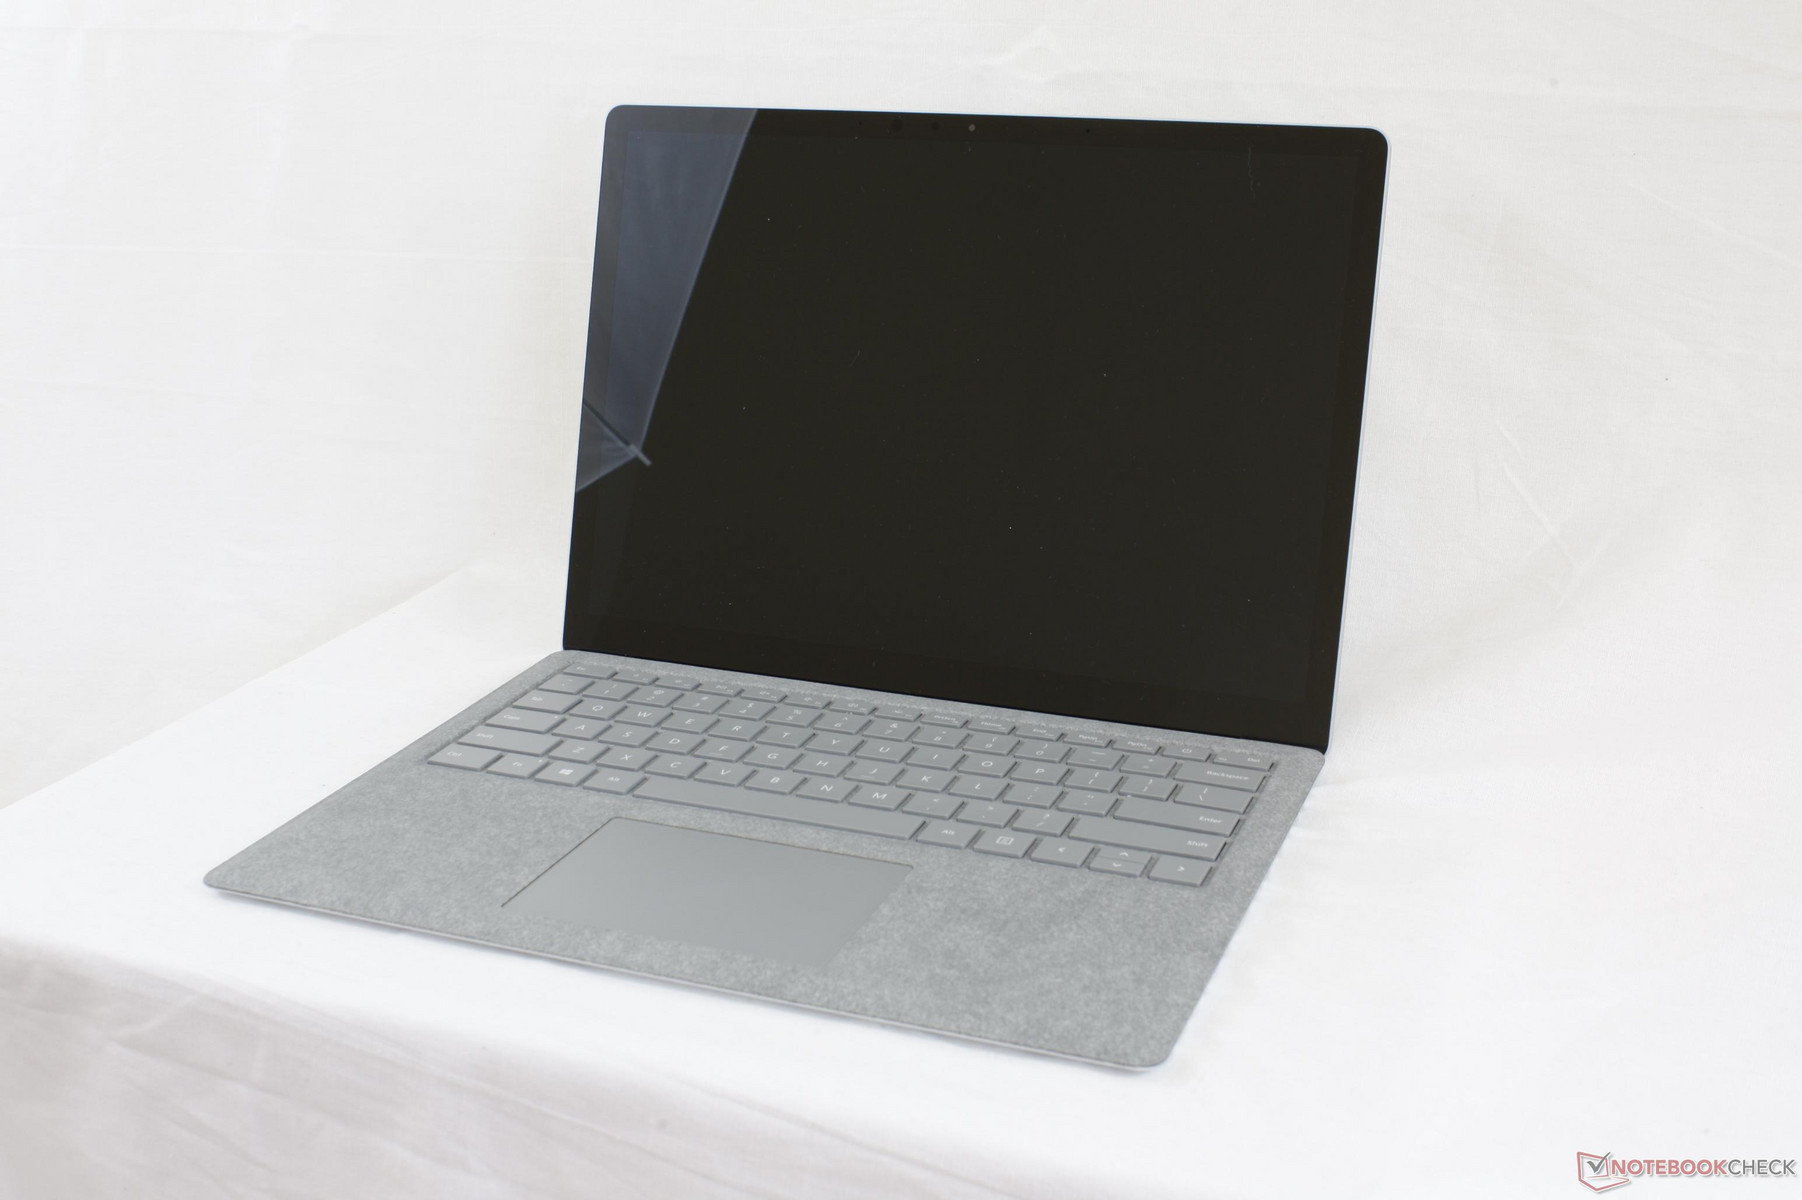
Courte critique du PC portable Microsoft Surface Laptop (i7-7660U)
| |||||||||||||||||||||||||
Homogénéité de la luminosité: 89 %
Valeur mesurée au centre, sur batterie: 398 cd/m²
Contraste: 948:1 (Valeurs des noirs: 0.42 cd/m²)
| Microsoft Surface Laptop i7 ID: MEI96A2, Name: Panasonic VVX14T092N00, , 2256x1504, 13.50 | Microsoft Surface Laptop i5 ID: MEI96A2, Name: Panasonic VVX14T092N00, , 2256x1504, 13.50 | Microsoft Surface Pro (2017) i7 LG Display LP123WQ112604, , 2736x1824, 12.30 | Apple MacBook Pro 13 2017 Touchbar i5 APPA034, , 2560x1600, 13.30 | Dell XPS 13 9360 FHD i7 Iris SHP1449, , 1920x1080, 13.30 | |
|---|---|---|---|---|---|
| Display | |||||
| Display P3 Coverage | 67.8 | 66.6 | 98.6 | 51.6 | |
| sRGB Coverage | 94.3 | 96.5 | 100 | 77.4 | |
| AdobeRGB 1998 Coverage | 69.5 | 67.8 | 86.5 | 53.3 | |
| Response Times | |||||
| Response Time Grey 50% / Grey 80% * | 50.8 ? | 37 ? | 48 ? | 41.2 ? | |
| Response Time Black / White * | 37.2 ? | 25 ? | 33.6 ? | 30 ? | |
| PWM Frequency | 22130 ? | 119000 ? | 19530 ? | ||
| Screen | 4% | 16% | 15% | 43% | |
| Brightness middle | 398 | 384.2 -3% | 482 21% | 551 38% | 461 16% |
| Brightness | 393 | 378 -4% | 466 19% | 514 31% | 418 6% |
| Brightness Distribution | 89 | 90 1% | 92 3% | 88 -1% | 85 -4% |
| Black Level * | 0.42 | 0.36 14% | 0.395 6% | 0.48 -14% | 0.2 52% |
| Contrast | 948 | 1067 13% | 1220 29% | 1148 21% | 2305 143% |
| Colorchecker dE 2000 * | 1.8 | 4 | 0.8 | 5.4 | |
| Colorchecker dE 2000 max. * | 4.2 | 7.2 | 1.4 | 12.2 | |
| Greyscale dE 2000 * | 1.2 | 5.7 | 1 | 5.4 | |
| Gamma | 2.21 100% | 2.28 96% | 2.16 102% | 2.15 102% | |
| CCT | 6708 97% | 7950 82% | 6672 97% | 7258 90% | |
| Color Space (Percent of AdobeRGB 1998) | 63.7 | 62 | 48.6 | ||
| Color Space (Percent of sRGB) | 94.2 | 96 | 76.9 | ||
| Moyenne finale (programmes/paramètres) | 4% /
4% | 16% /
16% | 15% /
15% | 43% /
43% |
* ... Moindre est la valeur, meilleures sont les performances
| PCMark 8 Home Score Accelerated v2 | 4182 points | |
| PCMark 8 Creative Score Accelerated v2 | 5509 points | |
| PCMark 8 Work Score Accelerated v2 | 4700 points | |
| PCMark 10 Score | 3812 points | |
Aide | ||
| Microsoft Surface Laptop i7 Samsung PM971 KUS040202M | Microsoft Surface Laptop i5 Toshiba THNSN0128GTYA | Microsoft Surface Pro (2017) i7 Samsung PM971 KUS040202M | Lenovo ThinkPad P51s 20HB000SGE Samsung SSD PM961 1TB M.2 PCIe 3.0 x4 NVMe (MZVLW1T0) | Dell XPS 13 9360 FHD i7 Iris Toshiba XG4 NVMe (THNSN5512GPUK) | |
|---|---|---|---|---|---|
| CrystalDiskMark 3.0 | -65% | 5% | 47% | 32% | |
| Read Seq | 1021 | 425.6 -58% | 1308 28% | 1189 16% | 1314 29% |
| Write Seq | 973 | 128.2 -87% | 961 -1% | 1138 17% | 617 -37% |
| Read 512 | 253 | 278.5 10% | 227.5 -10% | 782 209% | 1058 318% |
| Write 512 | 778 | 126.7 -84% | 792 2% | 959 23% | 502 -35% |
| Read 4k | 53 | 22.15 -58% | 53.6 1% | 54.8 3% | 37.31 -30% |
| Write 4k | 130.4 | 40.45 -69% | 136.3 5% | 161.4 24% | 133.6 2% |
| Read 4k QD32 | 453.3 | 77.8 -83% | 485.6 7% | 642 42% | 425.1 -6% |
| Write 4k QD32 | 389.7 | 41.18 -89% | 421.5 8% | 549 41% | 431.3 11% |

| 3DMark 11 - 1280x720 Performance GPU | |
| Microsoft Surface Pro (2017) i7 | |
| Microsoft Surface Laptop i7 | |
| Microsoft Surface Laptop i7 | |
| Apple MacBook Pro 13 2017 | |
| Dell XPS 13 9360 FHD i7 Iris | |
| Microsoft Surface Laptop i5 | |
| 3DMark | |
| 1280x720 Cloud Gate Standard Graphics | |
| Apple MacBook Pro 13 2017 | |
| Microsoft Surface Pro (2017) i7 | |
| Dell XPS 13 9360 FHD i7 Iris | |
| Microsoft Surface Laptop i7 | |
| Microsoft Surface Laptop i5 | |
| 1920x1080 Fire Strike Graphics | |
| Apple MacBook Pro 13 2017 | |
| Microsoft Surface Pro (2017) i7 | |
| Dell XPS 13 9360 FHD i7 Iris | |
| Microsoft Surface Laptop i7 | |
| Microsoft Surface Laptop i5 | |
| 3DMark 06 Standard Score | 13164 points | |
| 3DMark 11 Performance | 2561 points | |
| 3DMark Cloud Gate Standard Score | 7558 points | |
| 3DMark Fire Strike Score | 1236 points | |
| 3DMark Time Spy Score | 476 points | |
Aide | ||
| Overwatch | |
| 1920x1080 Epic (Render Scale 100 %) AA:SM AF:16x | |
| Apple MacBook Pro 13 2017 | |
| 1920x1080 High (Render Scale 100 %) AA:SM AF:4x | |
| Apple MacBook Pro 13 2017 | |
| Dell XPS 13 9360 FHD i7 Iris | |
| Microsoft Surface Pro (2017) i7 | |
| 1366x768 Medium (Render Scale 100 %) AA:FX AF:2x | |
| Apple MacBook Pro 13 2017 | |
| Microsoft Surface Pro (2017) i7 | |
| Dell XPS 13 9360 FHD i7 Iris | |
| Microsoft Surface Laptop i7 | |
| 1280x720 Low (Render Scale 100 %) AA:FX AF:1x | |
| Apple MacBook Pro 13 2017 | |
| Microsoft Surface Pro (2017) i7 | |
| Dell XPS 13 9360 FHD i7 Iris | |
| Microsoft Surface Laptop i7 | |
| The Evil Within 2 - 1280x720 Low Preset AA:T | |
| Microsoft Surface Laptop i7 | |
| Middle-earth: Shadow of War - 1280x720 Lowest Preset | |
| Microsoft Surface Laptop i7 | |
| FIFA 18 | |
| 1920x1080 Medium Preset | |
| Microsoft Surface Laptop i7 | |
| 1280x720 Low Preset | |
| Microsoft Surface Laptop i7 | |
| F1 2017 | |
| 1920x1080 Medium Preset AF:4x | |
| Dell XPS 13 9360 FHD i7 Iris | |
| Microsoft Surface Laptop i7 | |
| 1280x720 Ultra Low Preset | |
| Microsoft Surface Laptop i7 | |
| Dell XPS 13 9360 FHD i7 Iris | |
| Team Fortress 2 | |
| 1920x1080 maximum AA:8x MS AF:16x | |
| Microsoft Surface Laptop i7 | |
| 1920x1080 high AF:16x | |
| Microsoft Surface Laptop i7 | |
| 1366x768 medium AF:4x | |
| Microsoft Surface Laptop i7 | |
| Playerunknown's Battlegrounds (PUBG) - 1280x720 Very Low Preset | |
| Microsoft Surface Laptop i7 | |
| Rocket League | |
| 1920x1080 High Quality AA:High FX | |
| Apple MacBook Pro 13 2017 | |
| Microsoft Surface Pro (2017) i7 | |
| Dell XPS 13 9360 FHD i7 Iris | |
| Microsoft Surface Laptop i7 | |
| 1920x1080 Quality AA:Medium FX | |
| Apple MacBook Pro 13 2017 | |
| Microsoft Surface Pro (2017) i7 | |
| Dell XPS 13 9360 FHD i7 Iris | |
| Microsoft Surface Laptop i7 | |
| 1280x720 Performance | |
| Microsoft Surface Pro (2017) i7 | |
| Apple MacBook Pro 13 2017 | |
| Microsoft Surface Laptop i7 | |
| Dell XPS 13 9360 FHD i7 Iris | |
| Titanfall 2 | |
| 1920x1080 High / Enabled AA:TS AF:8x | |
| Apple MacBook Pro 13 2017 | |
| 1366x768 Medium / Disabled AF:4x | |
| Apple MacBook Pro 13 2017 | |
| 1280x720 Low / Disabled AF:Trilinear | |
| Microsoft Surface Laptop i7 | |
| Apple MacBook Pro 13 2017 | |
| Dota 2 Reborn | |
| 1920x1080 ultra (3/3) best looking | |
| Microsoft Surface Laptop i7 | |
| Microsoft Surface Pro (2017) i7 | |
| 1920x1080 high (2/3) | |
| Microsoft Surface Pro (2017) i7 | |
| Microsoft Surface Laptop i7 | |
| 1366x768 med (1/3) | |
| Microsoft Surface Pro (2017) i7 | |
| Microsoft Surface Laptop i7 | |
| 1280x720 min (0/3) fastest | |
| Microsoft Surface Pro (2017) i7 | |
| Microsoft Surface Laptop i7 | |
| Battlefield 1 | |
| 1920x1080 High Preset AA:T | |
| Apple MacBook Pro 13 2017 | |
| Microsoft Surface Pro (2017) i7 | |
| 1366x768 Medium Preset AA:FX | |
| Apple MacBook Pro 13 2017 | |
| Microsoft Surface Pro (2017) i7 | |
| 1280x720 Low Preset | |
| Apple MacBook Pro 13 2017 | |
| Microsoft Surface Laptop i7 | |
| Microsoft Surface Pro (2017) i7 | |
| The Witcher 3 | |
| 1920x1080 Ultra Graphics & Postprocessing (HBAO+) | |
| Apple MacBook Pro 13 2017 | |
| 1366x768 Medium Graphics & Postprocessing | |
| Apple MacBook Pro 13 2017 | |
| 1024x768 Low Graphics & Postprocessing | |
| Microsoft Surface Pro (2017) i7 | |
| Apple MacBook Pro 13 2017 | |
| Dell XPS 13 9360 FHD i7 Iris | |
| Microsoft Surface Laptop i7 | |
| Sims 4 | |
| 1920x1080 Ultra Preset | |
| Microsoft Surface Pro (2017) i7 | |
| Microsoft Surface Laptop i7 | |
| 1920x1080 High Preset | |
| Microsoft Surface Laptop i7 | |
| Diablo III - 1920x1080 High AA:on | |
| Microsoft Surface Laptop i7 | |
| World of Warcraft - 1280x1024 high | |
| Microsoft Surface Laptop i7 | |
| Bas | Moyen | Élevé | Ultra | |
| World of Warcraft (2005) | 28.5 | |||
| Diablo III (2012) | 35.2 | |||
| Sims 4 (2014) | 28.6 | 20.2 | ||
| The Witcher 3 (2015) | 16.4 | |||
| Dota 2 Reborn (2015) | 68 | 55 | 27.6 | 23 |
| Overwatch (2016) | 53.6 | 24.1 | ||
| Battlefield 1 (2016) | 29.2 | |||
| Titanfall 2 (2016) | 45 | |||
| Rocket League (2017) | 96 | 33.9 | 24.9 | |
| Team Fortress 2 (2017) | 99 | 48 | 31.8 | |
| Playerunknown's Battlegrounds (PUBG) (2017) | 22.9 | |||
| F1 2017 (2017) | 38 | 15 | ||
| FIFA 18 (2017) | 69 (some slowdowns in game) | 38 (some slowdowns in game) | ||
| Middle-earth: Shadow of War (2017) | 28 | |||
| The Evil Within 2 (2017) | 13.8 |
Degré de la nuisance sonore
| Au repos |
| 30.9 / 30.9 / 30.9 dB(A) |
| Fortement sollicité |
| 40.2 / 40.2 dB(A) |
 | ||
30 dB silencieux 40 dB(A) audible 50 dB(A) bruyant |
||
min: | ||
(+) La température maximale du côté supérieur est de 37 °C / 99 F, par rapport à la moyenne de 35.9 °C / 97 F, allant de 21.4 à 59 °C pour la classe Subnotebook.
(±) Le fond chauffe jusqu'à un maximum de 40 °C / 104 F, contre une moyenne de 39.4 °C / 103 F
(+) En utilisation inactive, la température moyenne du côté supérieur est de 25.4 °C / 78 F, par rapport à la moyenne du dispositif de 30.7 °C / 87 F.
(+) Les repose-poignets et le pavé tactile sont plus froids que la température de la peau avec un maximum de 30 °C / 86 F et sont donc froids au toucher.
(±) La température moyenne de la zone de l'appui-paume de dispositifs similaires était de 28.3 °C / 82.9 F (-1.7 °C / #-3.1 F).
Microsoft Surface Laptop i7 analyse audio
(±) | le niveau sonore du haut-parleur est moyen mais bon (78# dB)
Bass 100 - 315 Hz
(±) | basse réduite - en moyenne 7.7% inférieure à la médiane
(-) | les basses ne sont pas linéaires (15.9% delta à la fréquence précédente)
Mids 400 - 2000 Hz
(+) | médiane équilibrée - seulement 3.8% de la médiane
(+) | les médiums sont linéaires (4.6% delta à la fréquence précédente)
Aiguës 2 - 16 kHz
(+) | des sommets équilibrés - à seulement 1.6% de la médiane
(+) | les aigus sont linéaires (4.4% delta à la fréquence précédente)
Overall 100 - 16.000 Hz
(+) | le son global est linéaire (11.9% différence à la médiane)
Par rapport à la même classe
» 10% de tous les appareils testés de cette catégorie étaient meilleurs, 4% similaires, 86% pires
» Le meilleur avait un delta de 5%, la moyenne était de 19%, le pire était de 53%.
Par rapport à tous les appareils testés
» 6% de tous les appareils testés étaient meilleurs, 2% similaires, 91% pires
» Le meilleur avait un delta de 4%, la moyenne était de 25%, le pire était de 134%.
Microsoft Surface Laptop i5 analyse audio
(-) | haut-parleurs pas très forts (64.6 dB)
Bass 100 - 315 Hz
(±) | basse réduite - en moyenne 7.1% inférieure à la médiane
(±) | la linéarité des basses est moyenne (11.8% delta à la fréquence précédente)
Mids 400 - 2000 Hz
(+) | médiane équilibrée - seulement 4.1% de la médiane
(+) | les médiums sont linéaires (5.6% delta à la fréquence précédente)
Aiguës 2 - 16 kHz
(+) | des sommets équilibrés - à seulement 1.2% de la médiane
(+) | les aigus sont linéaires (4.7% delta à la fréquence précédente)
Overall 100 - 16.000 Hz
(±) | la linéarité du son global est moyenne (15.6% de différence avec la médiane)
Par rapport à la même classe
» 30% de tous les appareils testés de cette catégorie étaient meilleurs, 5% similaires, 65% pires
» Le meilleur avait un delta de 5%, la moyenne était de 19%, le pire était de 53%.
Par rapport à tous les appareils testés
» 19% de tous les appareils testés étaient meilleurs, 4% similaires, 77% pires
» Le meilleur avait un delta de 4%, la moyenne était de 25%, le pire était de 134%.
Apple MacBook Pro 13 2017 Touchbar i5 analyse audio
(+) | les haut-parleurs peuvent jouer relativement fort (86.2# dB)
Bass 100 - 315 Hz
(±) | basse réduite - en moyenne 11.5% inférieure à la médiane
(±) | la linéarité des basses est moyenne (10.8% delta à la fréquence précédente)
Mids 400 - 2000 Hz
(±) | médiane supérieure - en moyenne 5.2% supérieure à la médiane
(+) | les médiums sont linéaires (6.4% delta à la fréquence précédente)
Aiguës 2 - 16 kHz
(+) | des sommets équilibrés - à seulement 2.2% de la médiane
(+) | les aigus sont linéaires (5.7% delta à la fréquence précédente)
Overall 100 - 16.000 Hz
(+) | le son global est linéaire (11.9% différence à la médiane)
Par rapport à la même classe
» 10% de tous les appareils testés de cette catégorie étaient meilleurs, 4% similaires, 86% pires
» Le meilleur avait un delta de 5%, la moyenne était de 19%, le pire était de 53%.
Par rapport à tous les appareils testés
» 6% de tous les appareils testés étaient meilleurs, 2% similaires, 91% pires
» Le meilleur avait un delta de 4%, la moyenne était de 25%, le pire était de 134%.
| Éteint/en veille | |
| Au repos | |
| Fortement sollicité |
|
| Microsoft Surface Laptop i7 i7-7660U, Iris Plus Graphics 640, Samsung PM971 KUS040202M, IPS, 2256x1504, 13.50 | Microsoft Surface Laptop i5 i5-7200U, HD Graphics 620, Toshiba THNSN0128GTYA, IPS, 2256x1504, 13.50 | Dell XPS 13 9360 FHD i7 Iris i7-7560U, Iris Plus Graphics 640, Toshiba XG4 NVMe (THNSN5512GPUK), IPS, 1920x1080, 13.30 | Microsoft Surface Pro (2017) i7 i7-7660U, Iris Plus Graphics 640, Samsung PM971 KUS040202M, IPS, 2736x1824, 12.30 | Apple MacBook Pro 13 2017 i5-7360U, Iris Plus Graphics 640, Apple SSD AP0128, IPS, 2560x1600, 13.30 | |
|---|---|---|---|---|---|
| Power Consumption | 9% | 6% | -28% | -7% | |
| Idle Minimum * | 2.7 | 3.2 -19% | 3.32 -23% | 4.2 -56% | 3.7 -37% |
| Idle Average * | 7.6 | 6.5 14% | 5.27 31% | 10.1 -33% | 5.2 32% |
| Idle Maximum * | 7.8 | 6.8 13% | 6.32 19% | 14 -79% | 7.6 3% |
| Load Average * | 37.5 | 28.2 25% | 32 15% | 37.4 -0% | 41.6 -11% |
| Witcher 3 ultra * | 31.7 | 38.1 -20% | |||
| Load Maximum * | 41.6 | 36 13% | 45.9 -10% | 34 18% | 50.5 -21% |
* ... Moindre est la valeur, meilleures sont les performances
| Microsoft Surface Laptop i7 i7-7660U, Iris Plus Graphics 640, 45 Wh | Microsoft Surface Laptop i5 i5-7200U, HD Graphics 620, 45 Wh | Dell XPS 13 9360 FHD i7 Iris i7-7560U, Iris Plus Graphics 640, 60 Wh | Microsoft Surface Pro (2017) i7 i7-7660U, Iris Plus Graphics 640, 45 Wh | Apple MacBook Pro 13 2017 i5-7360U, Iris Plus Graphics 640, 54.5 Wh | |
|---|---|---|---|---|---|
| Autonomie de la batterie | 23% | 33% | -4% | 3% | |
| H.264 | 767 | 899 17% | 614 -20% | 683 -11% | |
| WiFi v1.3 | 454 | 602 33% | 655 44% | 489 8% | 681 50% |
| Load | 111 | 124 12% | 154 39% | 112 1% | 78 -30% |
| Reader / Idle | 1351 | 1521 | |||
| Witcher 3 ultra | 115 |
Points positifs
Points négatifs
Ce n’est pas facile de tirer une conclusion définitive à propose du Microsoft Surface Laptop i7. L’intégration de l’Intel Core i7-7660U est à double tranchant : ses résultats en mode Turbo sont décevants, et soulignent ainsi que Microsoft n’a pas appris des erreurs faites avec la Surface Pro i7 (2017).
A cause du throttling, les fréquences les plus élevées de l’Intel Core i7-7660U ne se maintiennent pas en cas de sollicitations continues, et ce alors qu'il faut débourser 350 € de plus pour cette version Core i7 par rapport à la version Core i5-7200U.
Mais il faut noter que deux principaux points faibles du i5 sont maintenant corrigés - le Core i7 n’est pas le seul élément qui a fait grimper le prix. Le SSD Samsung est bien plus rapide que celui de Toshiba, léthargique, de la version Core i5, et la carte graphique Iris Plus Graphics 640, intégrée dans le Core i7-7660U, est bien meilleure pour une utilisation graphique intense - même si elle ne transforme pas l’appareil en un portable de jeu.
Comme pour le modèle i5, la variante i7 manque également d’un port USB C, et d’un lecteur de carte SD, même si les clients n'y feront pas nécessairement attention. La surface Alcantara n’est sans doute pas non plus décisive, mais c’est une alternative originale au plastique. Il n’y a rien à redire à la qualité de construction, le châssis est de très bonne qualité, et laisse une très bonne impression. La mobilité est excellente, grâce à la bonne autonomie. Avec les Surface Laptops, Microsoft cible les étudiants, qui ne devraient pas avoir de problème à passer une journée à l’université avec la version i5 plus abordable.
Pour conclure, notre question initiale se pose toujours, de savoir si cela vaut le coup d’acheter un Surface Laptop i7. De notre point de vue, la seule critique est la baisse de performances après quelques minutes en mode Turbo. Malgré cela, le Laptop i7 reste un appareil plus rapide avec de meilleures performances CPU et GPU que la version i5, même en prenant en compte le throttling. Avec son SSD Samsung plus rapide, le choix d’acheter un Surface Laptop i7 paraît tout à fait raisonnable.
L’intégralité de cette critique est disponible en anglais en suivant ce lien.
Microsoft Surface Laptop i7
-
10/24/2017 v6(old)
Klaus Hinum, Daniel Puschina