Courte critique du convertible Microsoft Surface Pro (2017) (i7, 512 Go, 16 Go)
| |||||||||||||||||||||||||
Homogénéité de la luminosité: 92 %
Valeur mesurée au centre, sur batterie: 482 cd/m²
Contraste: 1220:1 (Valeurs des noirs: 0.395 cd/m²)
ΔE ColorChecker Calman: 4 | ∀{0.5-29.43 Ø4.72}
ΔE Greyscale Calman: 5.7 | ∀{0.09-98 Ø4.97}
98.7% sRGB (Calman 2D)
96% sRGB (Argyll 1.6.3 3D)
62% AdobeRGB 1998 (Argyll 1.6.3 3D)
67.8% AdobeRGB 1998 (Argyll 3D)
96.5% sRGB (Argyll 3D)
66.6% Display P3 (Argyll 3D)
Gamma: 2.28
CCT: 7950 K
| Microsoft Surface Pro (2017) i7 LG Display LP123WQ112604, , 2736x1824, 12.3" | Microsoft Surface Pro (2017) i5 LG Display LP123WQ112604, , 2736x1824, 12.3" | Lenovo Ideapad Miix 720-12IKB AUO B120YAN01 / AUO106F, , 2880x1920, 12" | Asus Transformer 3 Pro T303UA-GN050T BOE BOE06AC (NV126A1M-N51), , 2880x1920, 12.6" | Dell Latitude 12 5285 2-in-1 BOE06DC, , 1920x1280, 12.3" | Acer Switch 5 SW512-52-5819 WST KL.1200w.004, , 2160x1440, 12" | Toshiba Portege X30-D (PT274U-01N001) Toshiba TOS508F, , 1920x1080, 13.3" | |
|---|---|---|---|---|---|---|---|
| Display | 2% | -4% | 15% | -5% | -11% | -2% | |
| Display P3 Coverage (%) | 66.6 | 67.6 2% | 65.2 -2% | 81.8 23% | 62.8 -6% | 58.8 -12% | 66.4 0% |
| sRGB Coverage (%) | 96.5 | 99 3% | 91 -6% | 98.3 2% | 94 -3% | 87.5 -9% | 93.5 -3% |
| AdobeRGB 1998 Coverage (%) | 67.8 | 69.1 2% | 66.1 -3% | 82.2 21% | 64.7 -5% | 60.6 -11% | 66.6 -2% |
| Response Times | -15% | -9% | 2% | -19% | -2% | -9% | |
| Response Time Grey 50% / Grey 80% * (ms) | 37 ? | 42 ? -14% | 45 ? -22% | 30 ? 19% | 42.4 ? -15% | 37 ? -0% | 36.8 ? 1% |
| Response Time Black / White * (ms) | 25 ? | 29 ? -16% | 24 ? 4% | 29 ? -16% | 30.8 ? -23% | 26 ? -4% | 29.6 ? -18% |
| PWM Frequency (Hz) | 22130 ? | 21000 | 200 ? | 210.1 ? | |||
| Screen | 10% | -10% | -4% | 0% | -23% | 5% | |
| Brightness middle (cd/m²) | 482 | 417 -13% | 406 -16% | 316 -34% | 523.2 9% | 369 -23% | 332.6 -31% |
| Brightness (cd/m²) | 466 | 401 -14% | 396 -15% | 307 -34% | 522 12% | 331 -29% | 323 -31% |
| Brightness Distribution (%) | 92 | 88 -4% | 88 -4% | 91 -1% | 88 -4% | 75 -18% | 86 -7% |
| Black Level * (cd/m²) | 0.395 | 0.29 27% | 0.3 24% | 0.29 27% | 0.42 -6% | 0.46 -16% | 0.28 29% |
| Contrast (:1) | 1220 | 1438 18% | 1353 11% | 1090 -11% | 1246 2% | 802 -34% | 1188 -3% |
| Colorchecker dE 2000 * | 4 | 3.63 9% | 5.28 -32% | 3.91 2% | 4 -0% | 5.52 -38% | 2.6 35% |
| Colorchecker dE 2000 max. * | 7.2 | 6.74 6% | 9.83 -37% | 7.9 -10% | 8.6 -19% | 9.29 -29% | 6.7 7% |
| Greyscale dE 2000 * | 5.7 | 2.18 62% | 6.71 -18% | 5.37 6% | 5.5 4% | 6.95 -22% | 2.5 56% |
| Gamma | 2.28 96% | 3.09 71% | 2.29 96% | 2.36 93% | 2.16 102% | 2.58 85% | 2.12 104% |
| CCT | 7950 82% | 6767 96% | 6532 100% | 7812 83% | 7546 86% | 7009 93% | 6720 97% |
| Color Space (Percent of AdobeRGB 1998) (%) | 62 | 63 2% | 59 -5% | 72 16% | 64.86 5% | 56 -10% | 62 0% |
| Color Space (Percent of sRGB) (%) | 96 | 99 3% | 91 -5% | 98 2% | 93.97 -2% | 88 -8% | 94 -2% |
| Moyenne finale (programmes/paramètres) | -1% /
5% | -8% /
-8% | 4% /
1% | -8% /
-3% | -12% /
-18% | -2% /
2% |
* ... Moindre est la valeur, meilleures sont les performances
Temps de réponse de l'écran
| ↔ Temps de réponse noir à blanc | ||
|---|---|---|
| 25 ms ... hausse ↗ et chute ↘ combinées | ↗ 13 ms hausse | 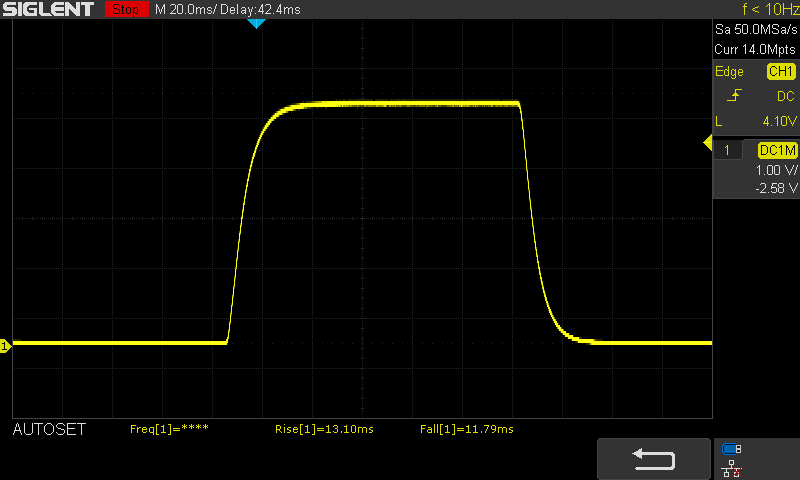 |
| ↘ 12 ms chute | ||
| L'écran souffre de latences relativement élevées, insuffisant pour le jeu. En comparaison, tous les appareils testés affichent entre 0.1 (minimum) et 240 (maximum) ms. » 59 % des appareils testés affichent de meilleures performances. Cela signifie que les latences relevées sont moins bonnes que la moyenne (19.8 ms) de tous les appareils testés. | ||
| ↔ Temps de réponse gris 50% à gris 80% | ||
| 37 ms ... hausse ↗ et chute ↘ combinées | ↗ 16 ms hausse | 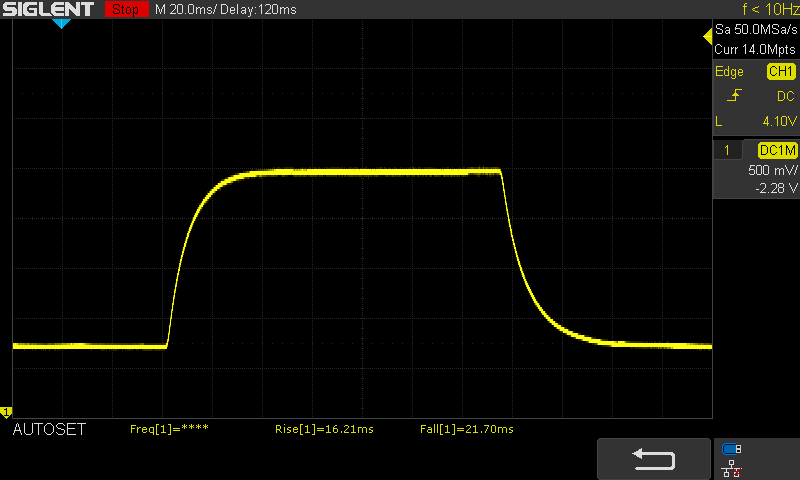 |
| ↘ 21 ms chute | ||
| L'écran souffre de latences très élevées, à éviter pour le jeu. En comparaison, tous les appareils testés affichent entre 0.165 (minimum) et 636 (maximum) ms. » 53 % des appareils testés affichent de meilleures performances. Cela signifie que les latences relevées sont moins bonnes que la moyenne (31 ms) de tous les appareils testés. | ||
Scintillement / MLI (Modulation de largeur d'impulsion)
| Scintillement / MLI (Modulation de largeur d'impulsion) décelé | 22130 Hz | ≤ 55 Niveau de luminosité | 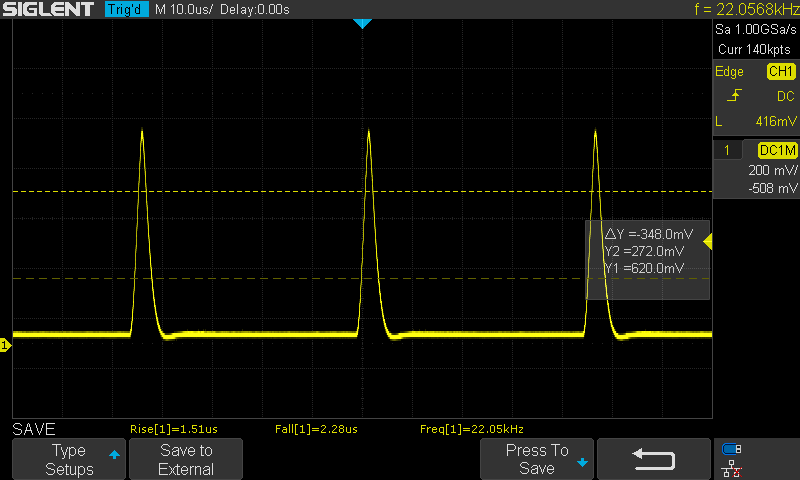 |
Le rétroéclairage de l'écran scintille à la fréquence de 22130 Hz (certainement du fait de l'utilisation d'une MDI - Modulation de largeur d'impulsion) à un niveau de luminosité inférieur ou égal à 55 % . Aucun scintillement ne devrait être perceptible au-dessus de cette valeur. La fréquence de rafraîchissement de 22130 Hz est élevée, la grande majorité des utilisateurs ne devrait pas percevoir de scintillements et être sujette à une fatigue oculaire accrue. En comparaison, 52 % des appareils testés n'emploient pas MDI pour assombrir leur écran. Nous avons relevé une moyenne à 7769 (minimum : 5 - maximum : 343500) Hz dans le cas où une MDI était active. | |||
Cinebench R15 CPU Multi 64 Bit - Surface Pro 2017 i7-7660U cooling fan
Cinebench R15 CPU Multi 64 Bit - Surface Pro 2017 i5-7300U fanless
Cinebench R15 CPU Multi 64 Bit - Switch 5 SW512 i7-7500U Liquid Loop
| Cinebench R15 | |
| CPU Single 64Bit | |
| Microsoft Surface Pro (2017) i7 | |
| Dell Latitude 12 5285 2-in-1 | |
| Acer TravelMate P658-G2-MG-7327 | |
| Acer Switch 5 SW512-52-5819 | |
| Microsoft Surface Pro (2017) i5 | |
| Asus Zenbook UX3430UQ-GV012T | |
| Lenovo Ideapad Miix 720-12IKB | |
| Toshiba Portege X30-D (PT274U-01N001) | |
| Microsoft Surface Pro 4, Core i5, 128GB | |
| Asus Transformer 3 Pro T303UA-GN050T | |
| Huawei MateBook X | |
| Lenovo ThinkPad X1 Tablet Gen 2 | |
| CPU Multi 64Bit | |
| Microsoft Surface Pro (2017) i7 | |
| Acer TravelMate P658-G2-MG-7327 | |
| Asus Zenbook UX3430UQ-GV012T | |
| Toshiba Portege X30-D (PT274U-01N001) | |
| Acer Switch 5 SW512-52-5819 | |
| Microsoft Surface Pro (2017) i5 | |
| Dell Latitude 12 5285 2-in-1 | |
| Huawei MateBook X | |
| Microsoft Surface Pro 4, Core i5, 128GB | |
| Lenovo Ideapad Miix 720-12IKB | |
| Lenovo ThinkPad X1 Tablet Gen 2 | |
| Asus Transformer 3 Pro T303UA-GN050T | |
| PCMark 8 | |
| Home Score Accelerated v2 | |
| Dell Latitude 12 5285 2-in-1 | |
| Microsoft Surface Pro (2017) i7 | |
| Acer Switch 5 SW512-52-5819 | |
| Huawei MateBook X | |
| Lenovo Ideapad Miix 720-12IKB | |
| Lenovo ThinkPad X1 Tablet Gen 2 | |
| Asus Transformer 3 Pro T303UA-GN050T | |
| Microsoft Surface Pro (2017) i5 | |
| Microsoft Surface Pro 4, Core i5, 128GB | |
| Work Score Accelerated v2 | |
| Acer Switch 5 SW512-52-5819 | |
| Microsoft Surface Pro (2017) i7 | |
| Lenovo ThinkPad X1 Tablet Gen 2 | |
| Huawei MateBook X | |
| Lenovo Ideapad Miix 720-12IKB | |
| Microsoft Surface Pro (2017) i5 | |
| Asus Transformer 3 Pro T303UA-GN050T | |
| Microsoft Surface Pro 4, Core i5, 128GB | |
| Dell Latitude 12 5285 2-in-1 | |
| PCMark 8 Home Score Accelerated v2 | 4095 points | |
| PCMark 8 Creative Score Accelerated v2 | 5540 points | |
| PCMark 8 Work Score Accelerated v2 | 4431 points | |
| PCMark 10 Score | 3909 points | |
Aide | ||
| Microsoft Surface Pro (2017) i7 Samsung PM971 KUS040202M | Microsoft Surface Pro (2017) i5 Samsung PM971 KUS030202M | Microsoft Surface Pro 4, Core i5, 128GB Samsung MZFLV128 NVMe | Lenovo Ideapad Miix 720-12IKB Samsung SSD PM961 1TB M.2 PCIe 3.0 x4 NVMe (MZVLW1T0) | Lenovo ThinkPad X1 Tablet Gen 2 Samsung PM961 MZVLW256HEHP | Asus Transformer 3 Pro T303UA-GN050T SK Hynix Canvas SC300 512GB M.2 (HFS512G39MND) | Dell Latitude 12 5285 2-in-1 Samsung PM961 MZVLW256HEHP | Acer Switch 5 SW512-52-5819 Intel SSD 600p SSDPEKKW512G7 | |
|---|---|---|---|---|---|---|---|---|
| CrystalDiskMark 3.0 | -19% | -45% | 90% | 22% | -44% | -5% | 7% | |
| Read Seq (MB/s) | 1308 | 723 -45% | 666 -49% | 2408 84% | 1739 33% | 398.9 -70% | 1294 -1% | 1066 -19% |
| Write Seq (MB/s) | 961 | 853 -11% | 154.2 -84% | 1702 77% | 1259 31% | 402 -58% | 865 -10% | 593 -38% |
| Read 512 (MB/s) | 227.5 | 225 -1% | 266.3 17% | 1301 472% | 698 207% | 303.1 33% | 406 78% | 653 187% |
| Write 512 (MB/s) | 792 | 445 -44% | 154.2 -81% | 1288 63% | 869 10% | 320.3 -60% | 589 -26% | 535 -32% |
| Read 4k (MB/s) | 53.6 | 46 -14% | 28.51 -47% | 53.6 0% | 52.3 -2% | 26.11 -51% | 31.75 -41% | 35.92 -33% |
| Write 4k (MB/s) | 136.3 | 125 -8% | 101.5 -26% | 162.2 19% | 120 -12% | 57.7 -58% | 72.2 -47% | 128.3 -6% |
| Read 4k QD32 (MB/s) | 485.6 | 423 -13% | 368.3 -24% | 504 4% | 247.9 -49% | 245.8 -49% | 493.3 2% | 460.6 -5% |
| Write 4k QD32 (MB/s) | 421.5 | 373 -12% | 153.6 -64% | 420.8 0% | 259 -39% | 253.8 -40% | 434.5 3% | 425.4 1% |

| 3DMark - 1920x1080 Fire Strike Graphics | |
| Asus Zenbook UX3430UQ-GV012T | |
| Microsoft Surface Pro (2017) i7 | |
| Dell Latitude 12 5285 2-in-1 | |
| Acer Switch 5 SW512-52-5819 | |
| Microsoft Surface Pro 4, Core i5, 128GB | |
| Microsoft Surface Pro (2017) i5 | |
| Huawei MateBook X | |
| Toshiba Portege X30-D (PT274U-01N001) | |
| Asus Transformer 3 Pro T303UA-GN050T | |
| Lenovo ThinkPad X1 Tablet Gen 2 | |
| 3DMark 06 Standard Score | 15071 points | |
| 3DMark 11 Performance | 2664 points | |
| 3DMark Cloud Gate Standard Score | 8067 points | |
| 3DMark Fire Strike Score | 1310 points | |
| 3DMark Time Spy Score | 513 points | |
Aide | ||
| The Witcher 3 - 1024x768 Low Graphics & Postprocessing | |
| Asus Zenbook UX3430UQ-GV012T | |
| Lenovo Ideapad 310-15ISK | |
| Microsoft Surface Pro (2017) i7 | |
| Microsoft Surface Pro (2017) i5 | |
| Rise of the Tomb Raider - 1024x768 Lowest Preset | |
| Microsoft Surface Pro (2017) i7 | |
| Asus X302UV-FN016T | |
| Asus Transformer 3 Pro T303UA-GN050T | |
| Acer Switch 5 SW512-52-5819 | |
| Lenovo Ideapad Miix 720-12IKB | |
| Microsoft Surface Pro (2017) i5 | |
| Deus Ex Mankind Divided - 1280x720 Low Preset AF:1x | |
| Microsoft Surface Pro (2017) i7 | |
| Battlefield 1 - 1280x720 Low Preset | |
| Microsoft Surface Pro (2017) i7 | |
| Huawei MateBook X | |
| Rocket League - 1920x1080 High Quality AA:High FX | |
| Microsoft Surface Pro (2017) i7 | |
| Acer Switch 5 SW512-52-5819 | |
| Warhammer 40.000: Dawn of War III - 1280x720 Minimum / Off (100 % Gameplay Resolution) | |
| Acer TravelMate P658-G2-MG-7327 | |
| Microsoft Surface Pro (2017) i7 | |
| For Honor - 1280x720 Low Preset | |
| Microsoft Surface Pro (2017) i7 | |
| Huawei MateBook X | |
| Farming Simulator 17 - 1920x1080 High Preset AA:2xMS AF:2x | |
| Asus Zenbook UX3430UQ-GV012T | |
| Microsoft Surface Pro (2017) i7 | |
| Huawei MateBook X | |
| The Division - 1280x720 Low Preset AF:1x | |
| Asus X302UV-FN016T | |
| Microsoft Surface Pro (2017) i7 | |
| Rainbow Six Siege - 1366x768 Medium Preset AA:T AF:2x | |
| Asus X302UV-FN016T | |
| Microsoft Surface Pro (2017) i7 | |
| Thief - 1024x768 Very Low Preset | |
| Lenovo Ideapad Miix 720-12IKB | |
| Microsoft Surface Pro (2017) i5 | |
| Diablo III - 1366x768 High AA:on | |
| Asus Zenbook UX3430UQ-GV012T | |
| Asus X302UV-FN016T | |
| Bas | Moyen | Élevé | Ultra | |
|---|---|---|---|---|
| Sims 4 (2014) | 20.8 | |||
| GTA V (2015) | 56.7 | 28.9 | 11.8 | |
| The Witcher 3 (2015) | 21.7 | |||
| Dota 2 Reborn (2015) | 92 | 63.7 | 29.5 | 19.8 |
| Rainbow Six Siege (2015) | 45 (windowed) | 30 (windowed) | 16 (windowed) | |
| Rise of the Tomb Raider (2016) | 23.5 | 16.7 | 9.1 | |
| Far Cry Primal (2016) | 28 | 13 | ||
| The Division (2016) | 24.9 | |||
| Overwatch (2016) | 63.3 | 41 | 15.9 | |
| Deus Ex Mankind Divided (2016) | 20.2 | |||
| Battlefield 1 (2016) | 26.6 | 19.6 | 9.2 | |
| Farming Simulator 17 (2016) | 121 | 91 | 31.6 | 17.8 |
| For Honor (2017) | 33.5 | 12.7 | ||
| Ghost Recon Wildlands (2017) | 16 | |||
| Mass Effect Andromeda (2017) | 20.4 | |||
| Warhammer 40.000: Dawn of War III (2017) | 33.8 | |||
| Prey (2017) | 45.4 | 18.1 | ||
| Rocket League (2017) | 103 | 42.6 | 29.3 | |
| Dirt 4 (2017) | 27 |
Degré de la nuisance sonore
| Au repos |
| 29.6 / 29.6 / 29.6 dB(A) |
| Fortement sollicité |
| 33.4 / 34.1 dB(A) |
 | ||
30 dB silencieux 40 dB(A) audible 50 dB(A) bruyant |
||
min: | ||
| Microsoft Surface Pro (2017) i7 Iris Plus Graphics 640, i7-7660U, Samsung PM971 KUS040202M | Microsoft Surface Pro 4, Core i5, 128GB HD Graphics 520, 6300U, Samsung MZFLV128 NVMe | Lenovo Ideapad Miix 720-12IKB HD Graphics 620, i7-7500U, Samsung SSD PM961 1TB M.2 PCIe 3.0 x4 NVMe (MZVLW1T0) | Asus Transformer 3 Pro T303UA-GN050T HD Graphics 520, 6500U, SK Hynix Canvas SC300 512GB M.2 (HFS512G39MND) | Dell Latitude 12 5285 2-in-1 HD Graphics 620, i7-7600U, Samsung PM961 MZVLW256HEHP | Toshiba Portege X30-D (PT274U-01N001) HD Graphics 620, i7-7600U, Samsung PM961 MZVLW256HEHP | |
|---|---|---|---|---|---|---|
| Emissions | ||||||
| Fan Noise (dB(A)) | 36.3 | 37.1 | 38.4 | |||
| Noise | -12% | -6% | -6% | 5% | 1% | |
| arrêt / environnement * (dB) | 29.6 | 30.4 -3% | 30.7 -4% | 28.2 5% | 28.4 4% | |
| Idle Minimum * (dB) | 29.6 | 31.5 -6% | 30.4 -3% | 30.7 -4% | 28.2 5% | 28.4 4% |
| Idle Average * (dB) | 29.6 | 31.5 -6% | 32.4 -9% | 30.7 -4% | 28.2 5% | 28.4 4% |
| Idle Maximum * (dB) | 29.6 | 31.5 -6% | 32.4 -9% | 30.7 -4% | 28.2 5% | 28.4 4% |
| Load Average * (dB) | 33.4 | 40.5 -21% | 36 -8% | 37 -11% | 30.4 9% | 33.2 1% |
| Witcher 3 ultra * (dB) | 33.4 | |||||
| Load Maximum * (dB) | 34.1 | 40.7 -19% | 36.3 -6% | 37.1 -9% | 34 -0% | 37.9 -11% |
| Moyenne finale (programmes/paramètres) | -12% /
-12% | -6% /
-6% | -6% /
-6% | 5% /
5% | 1% /
1% |
* ... Moindre est la valeur, meilleures sont les performances
(±) La température maximale du côté supérieur est de 42 °C / 108 F, par rapport à la moyenne de 35.4 °C / 96 F, allant de 19.6 à 60 °C pour la classe Convertible.
(±) Le fond chauffe jusqu'à un maximum de 42 °C / 108 F, contre une moyenne de 36.9 °C / 98 F
(+) En utilisation inactive, la température moyenne du côté supérieur est de 28.6 °C / 83 F, par rapport à la moyenne du dispositif de 30.3 °C / 87 F.
(±) Les repose-poignets et le pavé tactile peuvent devenir très chauds au toucher, avec un maximum de 38 °C / 100.4# F.
(-) La température moyenne de la zone de l'appui-paume de dispositifs similaires était de 28 °C / 82.4 F (-10 °C / #-18 F).
| Éteint/en veille | |
| Au repos | |
| Fortement sollicité |
|
Légende:
min: | |
| Microsoft Surface Pro (2017) i7 i7-7660U, Iris Plus Graphics 640, Samsung PM971 KUS040202M, IPS, 2736x1824, 12.3" | Microsoft Surface Pro (2017) i5 i5-7300U, HD Graphics 620, Samsung PM971 KUS030202M, IPS, 2736x1824, 12.3" | Microsoft Surface Pro 4, Core i5, 128GB 6300U, HD Graphics 520, Samsung MZFLV128 NVMe, IPS, 2736x1824, 12.3" | Lenovo Ideapad Miix 720-12IKB i7-7500U, HD Graphics 620, Samsung SSD PM961 1TB M.2 PCIe 3.0 x4 NVMe (MZVLW1T0), IPS, 2880x1920, 12" | Asus Transformer 3 Pro T303UA-GN050T 6500U, HD Graphics 520, SK Hynix Canvas SC300 512GB M.2 (HFS512G39MND), IPS, 2880x1920, 12.6" | Dell Latitude 12 5285 2-in-1 i7-7600U, HD Graphics 620, Samsung PM961 MZVLW256HEHP, IPS, 1920x1280, 12.3" | Acer Switch 5 SW512-52-5819 i7-7500U, HD Graphics 620, Intel SSD 600p SSDPEKKW512G7, IPS, 2160x1440, 12" | Huawei MateBook X i5-7200U, HD Graphics 620, LITEON CB1-SD256, , 2160x1440, 13.3" | |
|---|---|---|---|---|---|---|---|---|
| Power Consumption | 27% | 24% | 24% | -3% | 24% | 23% | -3% | |
| Idle Minimum * (Watt) | 4.2 | 3.6 14% | 4.4 -5% | 3.5 17% | 6.7 -60% | 2.85 32% | 3.86 8% | 4.6 -10% |
| Idle Average * (Watt) | 10.1 | 8.1 20% | 9 11% | 7.2 29% | 10.3 -2% | 6.76 33% | 6.4 37% | 11 -9% |
| Idle Maximum * (Watt) | 14 | 8.7 38% | 10.7 24% | 7.9 44% | 13.5 4% | 6.91 51% | 7.17 49% | 12 14% |
| Load Average * (Watt) | 37.4 | 25.5 32% | 19.6 48% | 29.6 21% | 26 30% | 32.88 12% | 30.5 18% | 39.5 -6% |
| Witcher 3 ultra * (Watt) | 38.1 | |||||||
| Load Maximum * (Watt) | 34 | 23.5 31% | 19.9 41% | 30.8 9% | 28.8 15% | 37.41 -10% | 32.4 5% | 34.6 -2% |
* ... Moindre est la valeur, meilleures sont les performances
| Microsoft Surface Pro (2017) i7 i7-7660U, Iris Plus Graphics 640, 45 Wh | Microsoft Surface Pro (2017) i5 i5-7300U, HD Graphics 620, 45 Wh | Microsoft Surface Pro 4, Core i5, 128GB 6300U, HD Graphics 520, 38 Wh | Lenovo Ideapad Miix 720-12IKB i7-7500U, HD Graphics 620, 41 Wh | Lenovo ThinkPad X1 Tablet Gen 2 i5-7Y54, HD Graphics 615, 37 Wh | Asus Transformer 3 Pro T303UA-GN050T 6500U, HD Graphics 520, 39 Wh | Dell Latitude 12 5285 2-in-1 i7-7600U, HD Graphics 620, 42 Wh | Acer Switch 5 SW512-52-5819 i7-7500U, HD Graphics 620, Wh | Huawei MateBook X i5-7200U, HD Graphics 620, 40 Wh | |
|---|---|---|---|---|---|---|---|---|---|
| Autonomie de la batterie | 49% | -7% | -15% | 3% | -44% | -3% | -22% | 5% | |
| H.264 (h) | 10.2 | 3.4 -67% | |||||||
| WiFi v1.3 (h) | 8.2 | 12.4 51% | 7.1 -13% | 5.8 -29% | 7.4 -10% | 3.7 -55% | 8.1 -1% | 5.9 -28% | 5.6 -32% |
| Witcher 3 ultra (h) | 1.9 | ||||||||
| Load (h) | 1.9 | 2.8 47% | 1.9 0% | 1.9 0% | 2.2 16% | 1.7 -11% | 1.8 -5% | 1.6 -16% | 2.7 42% |
| Reader / Idle (h) | 17.6 | 15 | 11.9 | 11 | 7.1 | 17.9 | 11.9 | 8.5 |
Points positifs
Points négatifs
Verdict
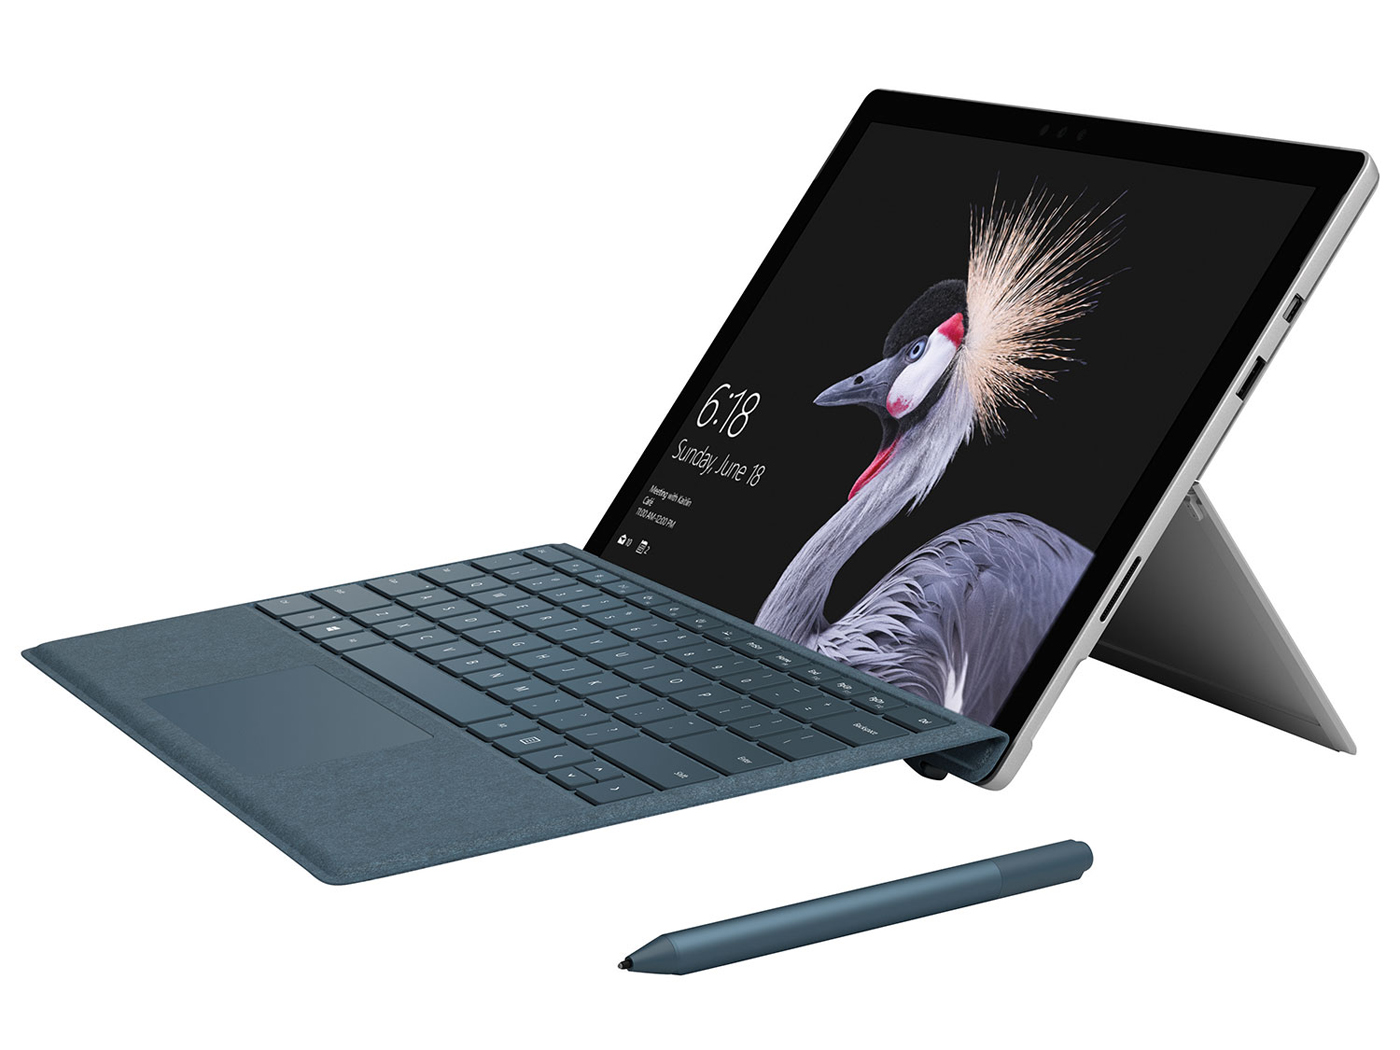
Avec la Surface Pro 2017, Microsoft propose une tablette / convertible qui répond à beaucoup de promesses, mais pas toutes. Qualité de construction, écran et autonomie sont sans aucun doute parmi ce qui se fait de mieux dans le domaine. Sur ces points, les concurrents comme l'Acer Switch 5 ne tiennent pas la comparaison.
D'un point de vue d'une utilisation du convertible comme remplacement de PC portable conventionnel, on note un bridage des performances similaire au cas du modèle avec CPU Core i5 (refroidi passivement). Si le bridage est moins prononcé sur ce modèle (-17 % au premier tour du test contre -33 % pour le modèle avec Core i5), il devient cependant clairement évident dans les benchmarks comme PCMark: La Surface Pro i7 (2017) ne parvient pas à prendre la tête de notre groupe de comparaison, facilement dépassée par les convertibles d'Acer et de Dell.
La Surface Pro i7 obtient malgré tout un bon score de 90 %, car les performances (les points en moins sont en grande partie dus au bridage) ne sont qu'une composante de tous les aspects que nous prenons en considération lors de nos tests. Les nuisances sonores sont faibles malgré la présence d'un ventilateur qui est inactif lorsque le système est au repos. Le convertible dispose de bons haut-parleurs et les périphériques d'entrée (ou plutôt le clavier Type Cover) sont très bons pour un convertible.
Alternatives
Le Dell Latitude 12 5285 offre des performances similaires avec un bridage moins important (-9 %). Son écran est de qualité similaire à celui de la Surface Pro i7 (luminosité, taux de contraste, uniformité de la luminosité, couverture des espaces de couleur), excepté la résolution qui n'est que Full HD. Cependant, le Latitude chauffe beaucoup.
On peut dire de même de l'Acer Switch 5 SW512-52 qui ne perd aussi que 9 % de performances lorsque le bridage intervient. Cependant, son autonomie est nettement inférieure, à tout juste 6 heures. Son écran n'est également pas à la hauteur de celui de la Surface Pro ni celui du Latitude 12 5285, en dépit d'une résolution Quad HD (2160x1440 pixels).
Si vous recherchez une autonomie de plus de 10 heures, il faudrait alors considérer la Surface Pro 2017 avec CPU Core i5, ou même le modèle avec Core m3. Étant donné que dans tous les cas le SoC ne parvient pas à maintenir des performances consistantes en sollicitation prolongée, pourquoi ne pas acquérir alors le modèle Core m3 bien moins cher? Ce dernier pourra surement dépasser facilement les 12 heures et demie d’autonomie en test WiFi du modèle avec Core i5. Nous testons actuellement le modèle avec CPU Core m3 et mettrons à jour les résultats en conséquence.
Pour plus de détails, la version complète de ce test (en anglais) est disponible ici.
Microsoft Surface Pro (2017) i7
- 07/21/2017 v6 (old)
Sebastian Jentsch