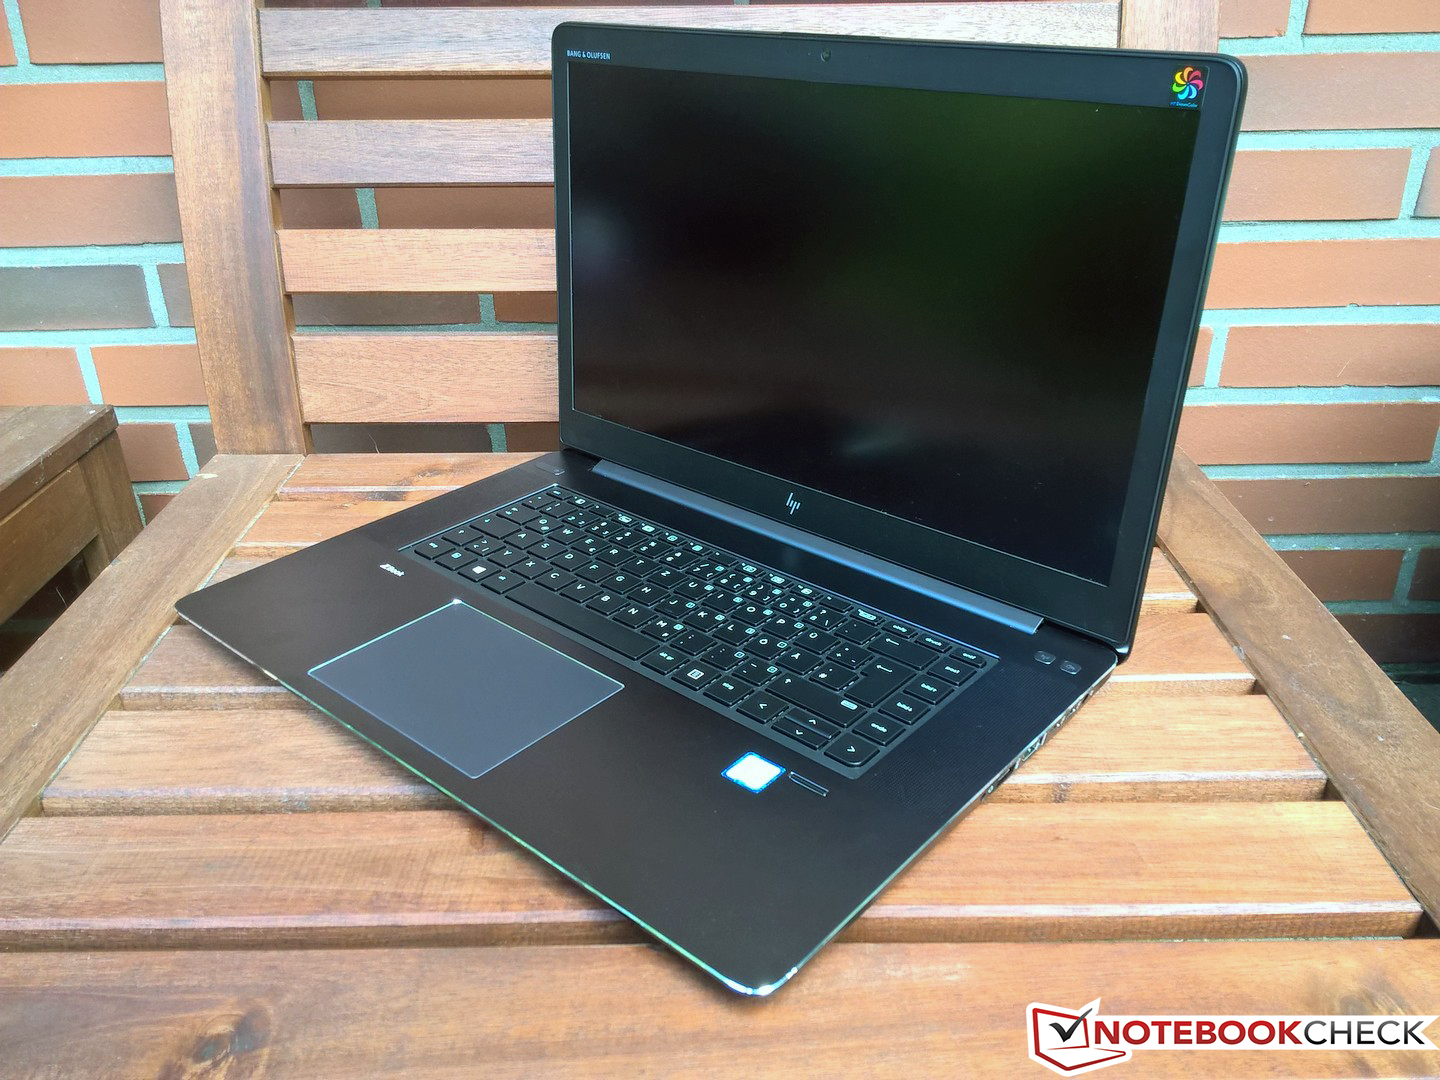
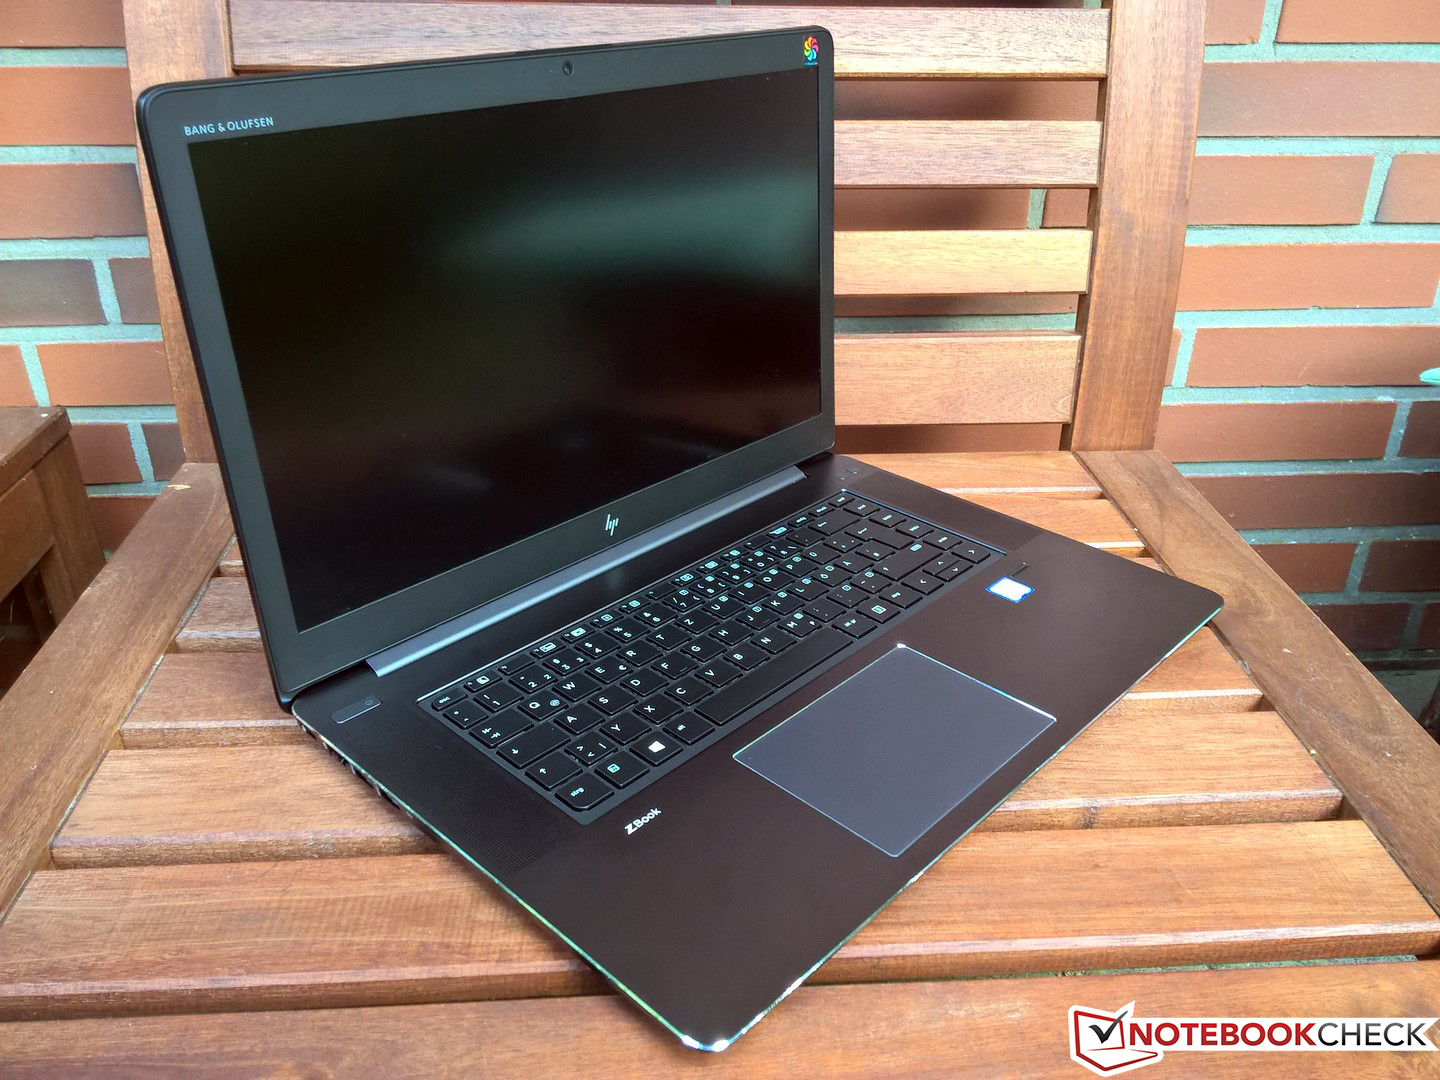
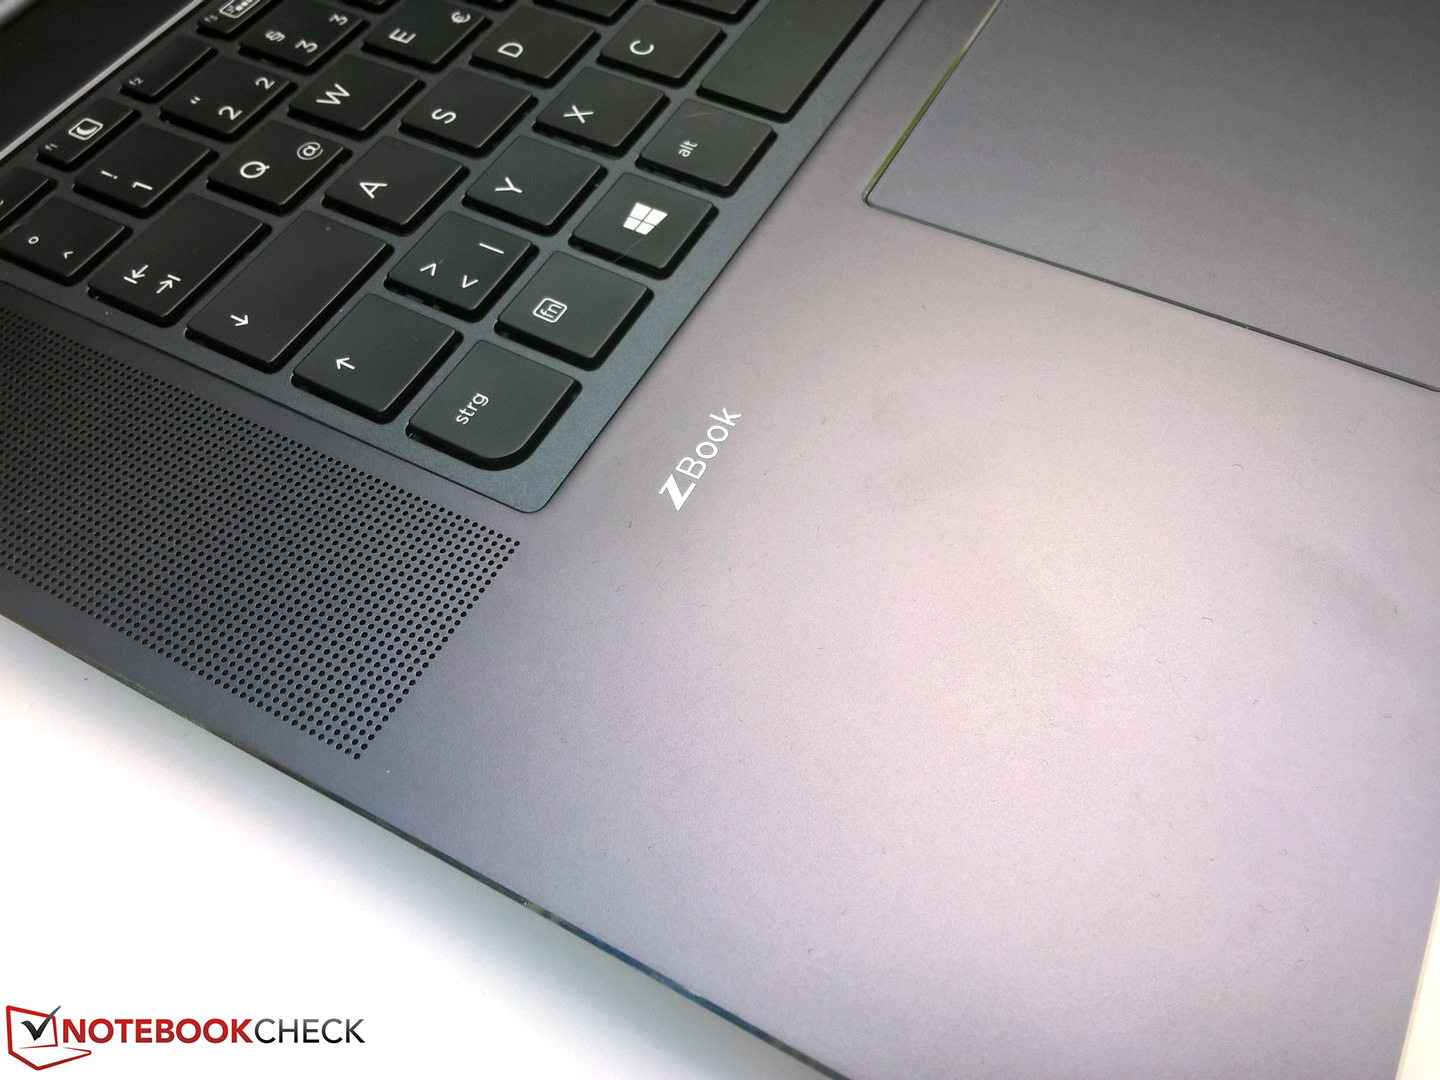
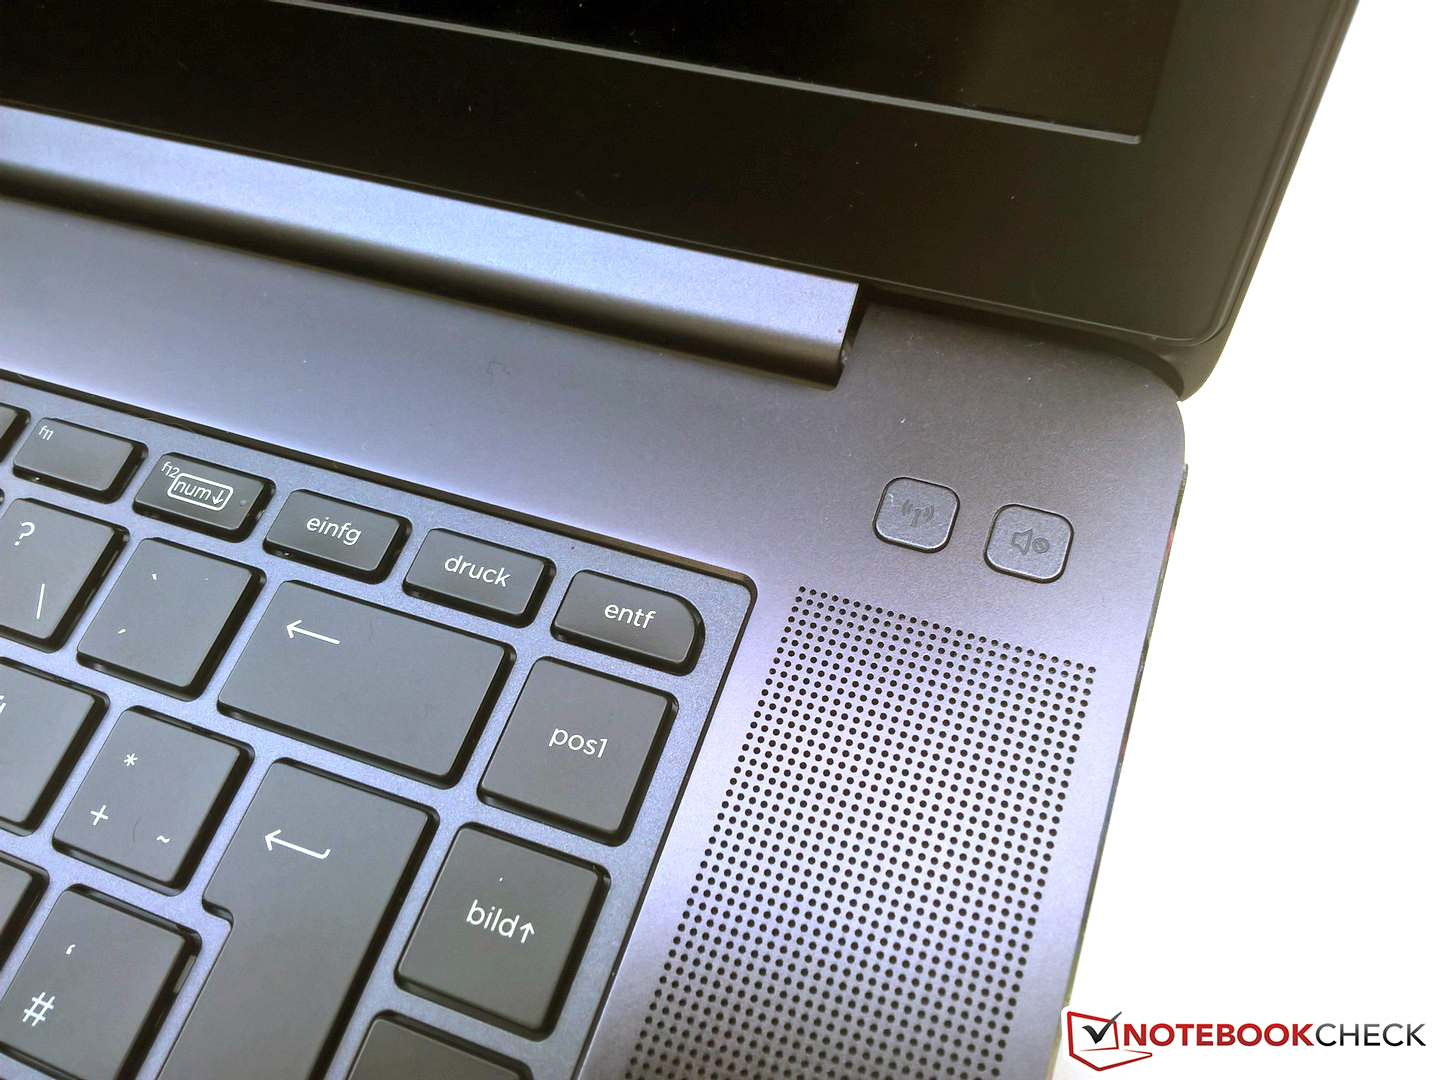
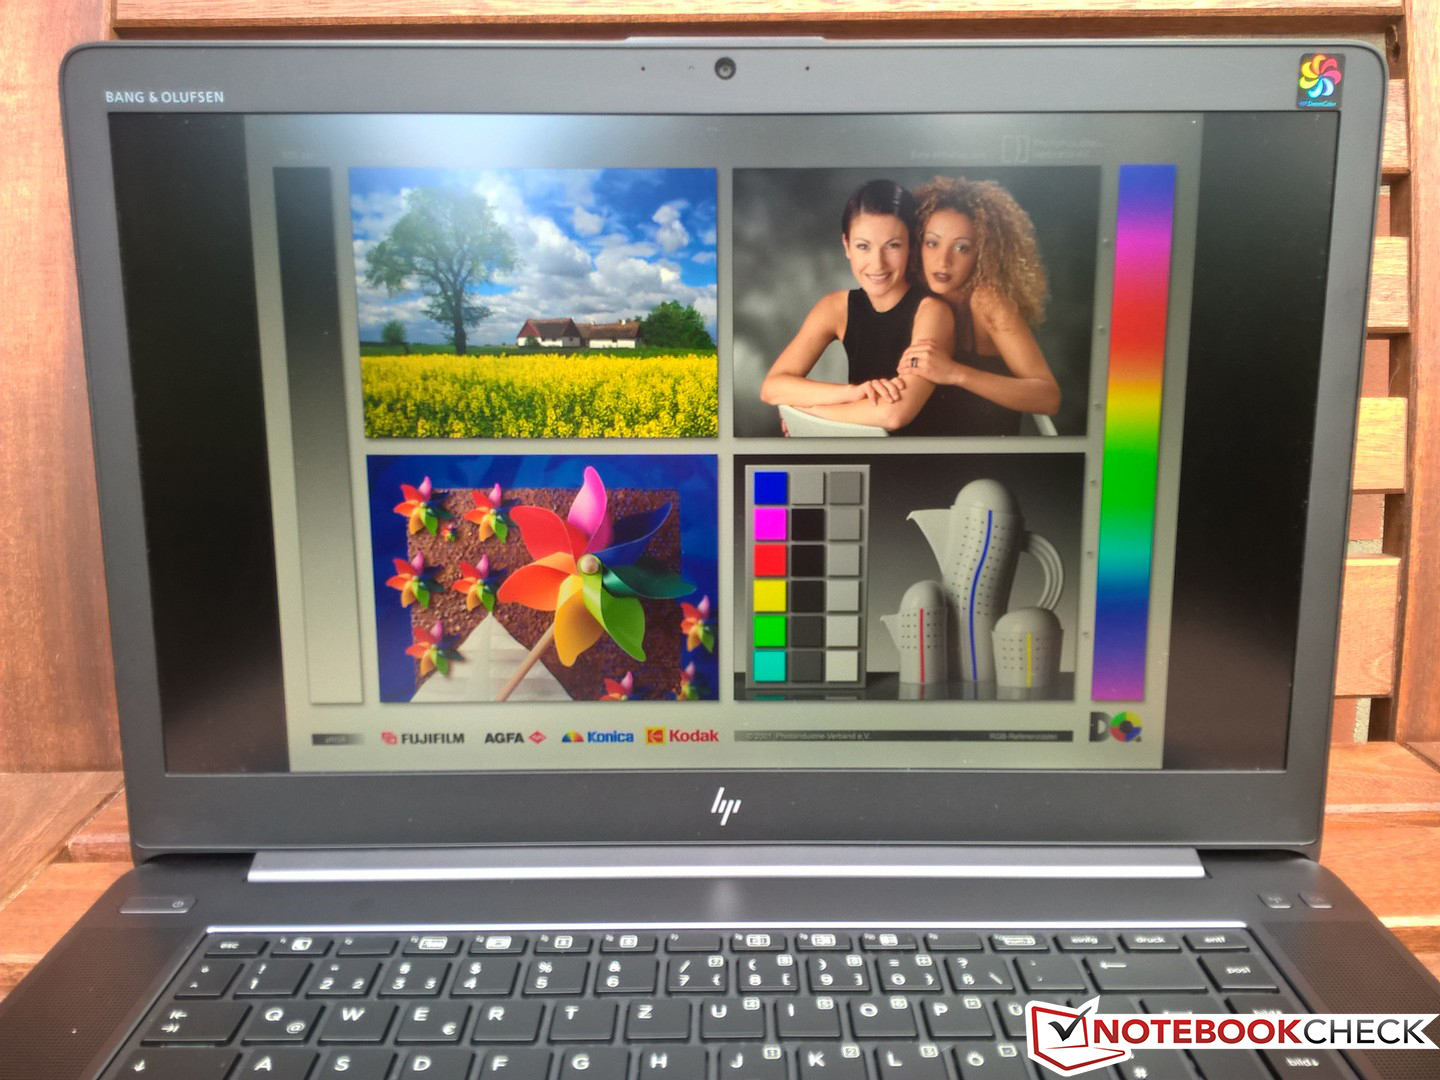
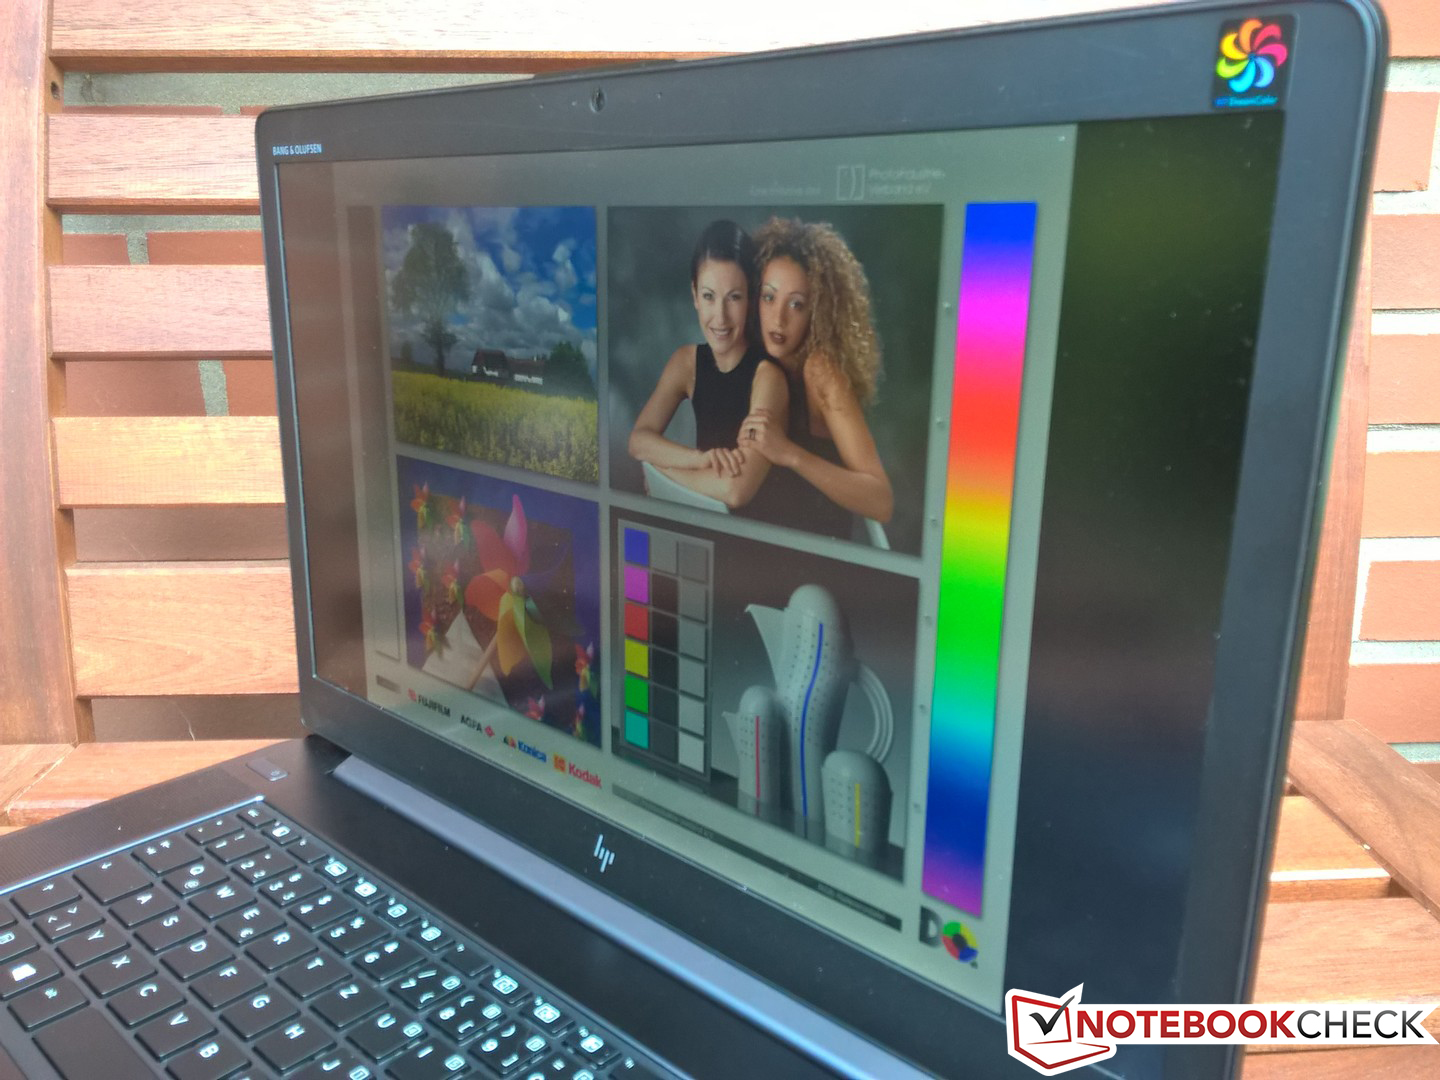
Courte critique de la station de travail HP ZBook Studio G4 (Xeon, Quadro M1200, DreamColor)
| SD Card Reader | |
| average JPG Copy Test (av. of 3 runs) | |
| HP ZBook Studio G4-Y6K17EA (Toshiba Exceria Pro SDXC 64 GB UHS-II) | |
| Dell Precision 5520 UHD (Toshiba Exceria Pro SDXC 64 GB UHS-II) | |
| Lenovo ThinkPad P51 20HH0016GE (Toshiba Exceria Pro SDXC 64 GB UHS-II) | |
| HP ZBook Studio G3 (Toshiba Exceria Pro SDXC 64 GB UHS-II) | |
| Lenovo ThinkPad P51s 20HB000SGE (Toshiba Exceria Pro SDXC 64 GB UHS-II) | |
| maximum AS SSD Seq Read Test (1GB) | |
| Dell Precision 5520 UHD (Toshiba Exceria Pro SDXC 64 GB UHS-II) | |
| Lenovo ThinkPad P51 20HH0016GE (Toshiba Exceria Pro SDXC 64 GB UHS-II) | |
| HP ZBook Studio G3 (Toshiba Exceria Pro SDXC 64 GB UHS-II) | |
| HP ZBook Studio G4-Y6K17EA (Toshiba Exceria Pro SDXC 64 GB UHS-II) | |
| Lenovo ThinkPad P51s 20HB000SGE (Toshiba Exceria Pro SDXC 64 GB UHS-II) | |
| |||||||||||||||||||||||||
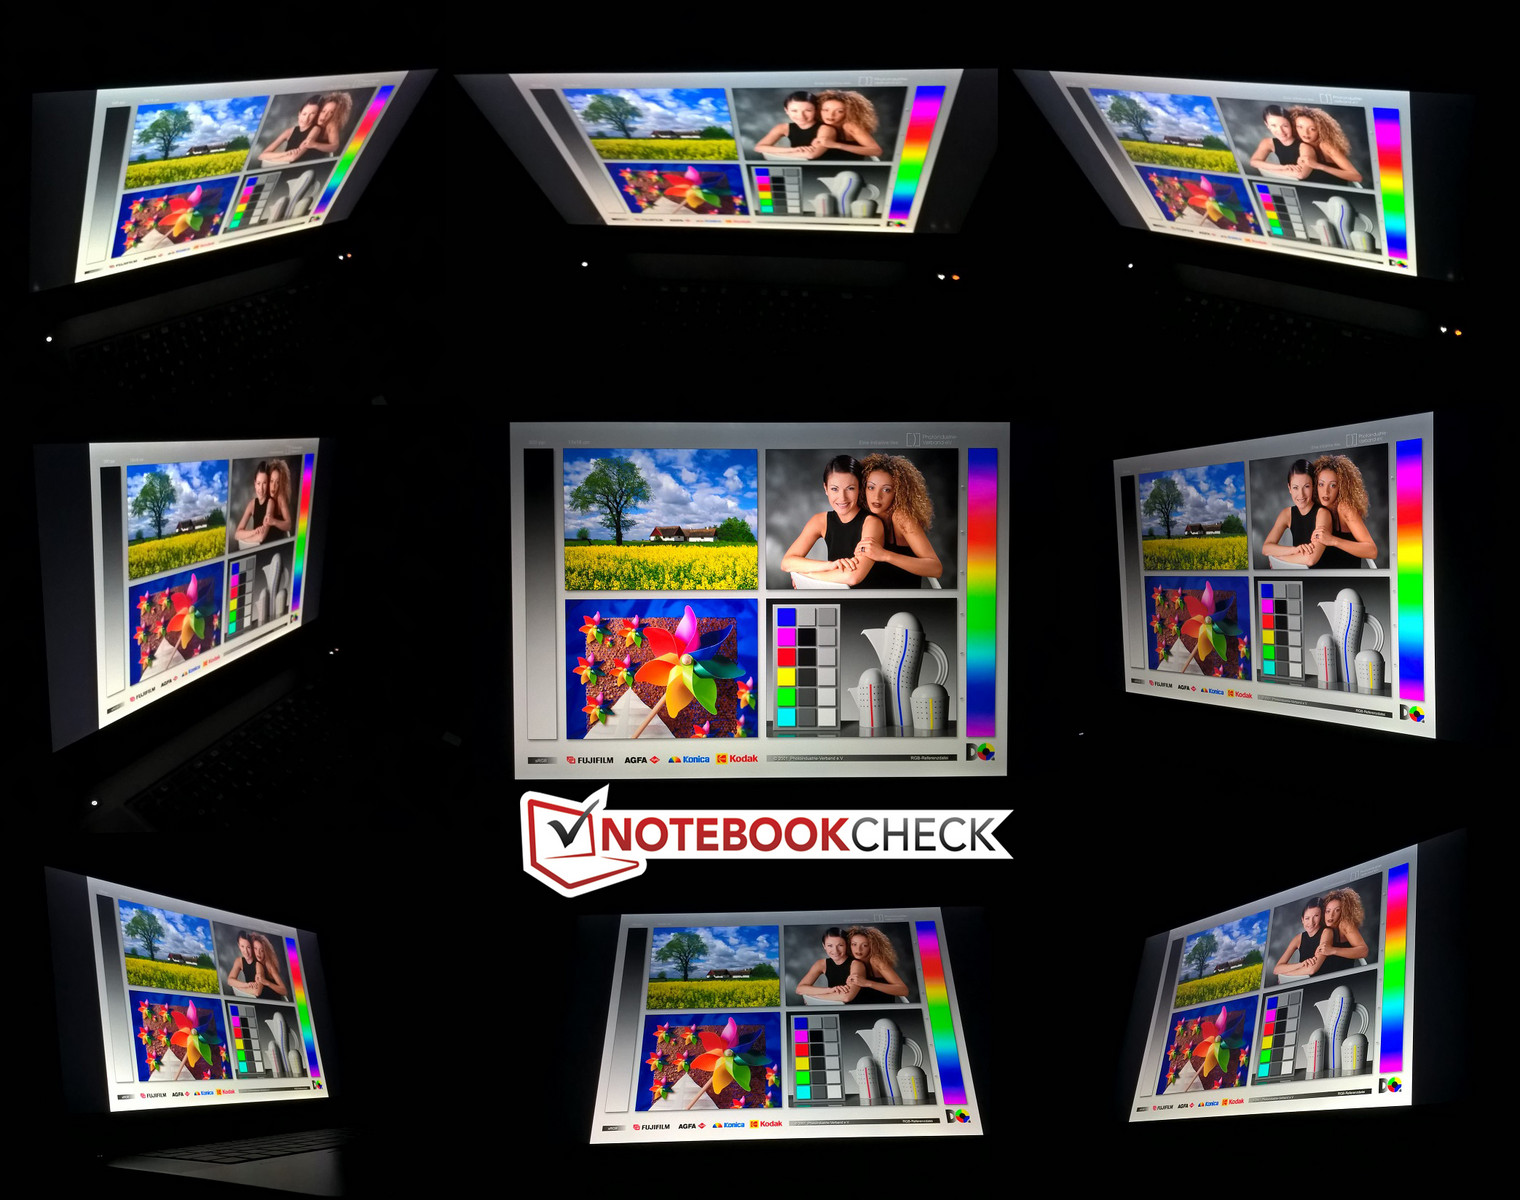
Homogénéité de la luminosité: 78 %
Valeur mesurée au centre, sur batterie: 324 cd/m²
Contraste: 1080:1 (Valeurs des noirs: 0.3 cd/m²)
ΔE ColorChecker Calman: 1.6 | ∀{0.5-29.43 Ø4.71}
ΔE Greyscale Calman: 2.5 | ∀{0.09-98 Ø4.96}
98.9% sRGB (Argyll 1.6.3 3D)
85.7% AdobeRGB 1998 (Argyll 1.6.3 3D)
98% AdobeRGB 1998 (Argyll 3D)
98.9% sRGB (Argyll 3D)
82.6% Display P3 (Argyll 3D)
Gamma: 2.21
CCT: 6273 K
| HP ZBook Studio G4-Y6K17EA SHP1445, , 3840x2160, 15.6" | HP ZBook Studio G3 Sharp SPH1445, , 3840x2160, 15.6" | Dell Precision 5520 UHD SHP1476, , 3840x2160, 15.6" | Lenovo ThinkPad P51 20HH0016GE LEN40BD, B156ZAN02.1, , 3840x2160, 15.6" | Lenovo ThinkPad P51s 20HB000SGE BOE NV156QUM-N44, , 3840x2160, 15.6" | Apple MacBook Pro 15 2017 (2.9 GHz, 560) 2880x1800, 15.4" | |
|---|---|---|---|---|---|---|
| Display | 1% | -16% | 2% | -19% | ||
| Display P3 Coverage (%) | 82.6 | 86 4% | 67.4 -18% | 86.3 4% | 69.7 -16% | |
| sRGB Coverage (%) | 98.9 | 98.9 0% | 98.5 0% | 99.5 1% | 91.2 -8% | |
| AdobeRGB 1998 Coverage (%) | 98 | 98 0% | 68.9 -30% | 99.3 1% | 66.8 -32% | |
| Response Times | 13% | -36% | 13% | 16% | 6% | |
| Response Time Grey 50% / Grey 80% * (ms) | 44.8 ? | 44 ? 2% | 59.2 ? -32% | 40.8 ? 9% | 38.4 ? 14% | 42.4 ? 5% |
| Response Time Black / White * (ms) | 30 ? | 23.2 ? 23% | 41.6 ? -39% | 25.2 ? 16% | 24.8 ? 17% | 28 ? 7% |
| PWM Frequency (Hz) | 1497 ? | 200 ? | 980 ? | |||
| Screen | -53% | -21% | -11% | -30% | 18% | |
| Brightness middle (cd/m²) | 324 | 310 -4% | 372.4 15% | 317 -2% | 317 -2% | 534 65% |
| Brightness (cd/m²) | 338 | 299 -12% | 368 9% | 309 -9% | 290 -14% | 502 49% |
| Brightness Distribution (%) | 78 | 86 10% | 90 15% | 89 14% | 85 9% | 86 10% |
| Black Level * (cd/m²) | 0.3 | 0.29 3% | 0.48 -60% | 0.36 -20% | 0.32 -7% | 0.31 -3% |
| Contrast (:1) | 1080 | 1069 -1% | 776 -28% | 881 -18% | 991 -8% | 1723 60% |
| Colorchecker dE 2000 * | 1.6 | 5.9 -269% | 2.6 -63% | 2.7 -69% | 3.6 -125% | 1.8 -13% |
| Colorchecker dE 2000 max. * | 4.6 | 10.7 -133% | 5.6 -22% | 4.1 11% | 6.6 -43% | 3.8 17% |
| Greyscale dE 2000 * | 2.5 | 5.5 -120% | 3.7 -48% | 3 -20% | 4.2 -68% | 2.4 4% |
| Gamma | 2.21 100% | 2.09 105% | 2.14 103% | 2.27 97% | 2.24 98% | 2.27 97% |
| CCT | 6273 104% | 5980 109% | 7096 92% | 6077 107% | 6740 96% | 6563 99% |
| Color Space (Percent of AdobeRGB 1998) (%) | 85.7 | 85 -1% | 63 -26% | 87.6 2% | 59.5 -31% | 77.92 -9% |
| Color Space (Percent of sRGB) (%) | 98.9 | 99 0% | 99 0% | 99.5 1% | 91.1 -8% | 99.94 1% |
| Moyenne finale (programmes/paramètres) | -13% /
-33% | -24% /
-22% | 1% /
-5% | -11% /
-21% | 12% /
16% |
* ... Moindre est la valeur, meilleures sont les performances
Scintillement / MLI (Modulation de largeur d'impulsion)
| Scintillement / MLI (Modulation de largeur d'impulsion) décelé | 1497 Hz | ≤ 50 Niveau de luminosité | 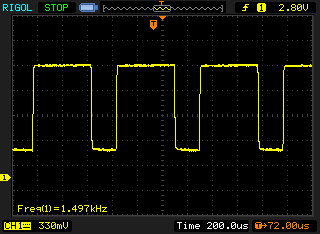 |
Le rétroéclairage de l'écran scintille à la fréquence de 1497 Hz (certainement du fait de l'utilisation d'une MDI - Modulation de largeur d'impulsion) à un niveau de luminosité inférieur ou égal à 50 % . Aucun scintillement ne devrait être perceptible au-dessus de cette valeur. La fréquence de rafraîchissement de 1497 Hz est élevée, la grande majorité des utilisateurs ne devrait pas percevoir de scintillements et être sujette à une fatigue oculaire accrue. En comparaison, 52 % des appareils testés n'emploient pas MDI pour assombrir leur écran. Nous avons relevé une moyenne à 7754 (minimum : 5 - maximum : 343500) Hz dans le cas où une MDI était active. | |||
Temps de réponse de l'écran
| ↔ Temps de réponse noir à blanc | ||
|---|---|---|
| 30 ms ... hausse ↗ et chute ↘ combinées | ↗ 17.2 ms hausse | 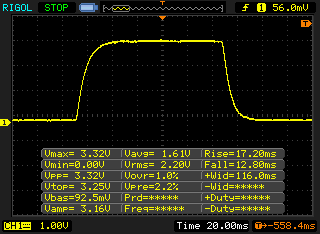 |
| ↘ 12.8 ms chute | ||
| L'écran souffre de latences très élevées, à éviter pour le jeu. En comparaison, tous les appareils testés affichent entre 0.1 (minimum) et 240 (maximum) ms. » 80 % des appareils testés affichent de meilleures performances. Cela signifie que les latences relevées sont moins bonnes que la moyenne (19.8 ms) de tous les appareils testés. | ||
| ↔ Temps de réponse gris 50% à gris 80% | ||
| 44.8 ms ... hausse ↗ et chute ↘ combinées | ↗ 22 ms hausse | 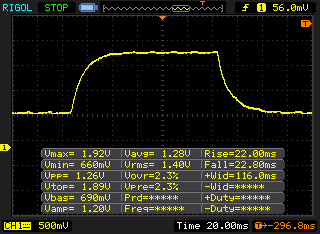 |
| ↘ 22.8 ms chute | ||
| L'écran souffre de latences très élevées, à éviter pour le jeu. En comparaison, tous les appareils testés affichent entre 0.165 (minimum) et 636 (maximum) ms. » 76 % des appareils testés affichent de meilleures performances. Cela signifie que les latences relevées sont moins bonnes que la moyenne (31 ms) de tous les appareils testés. | ||
| PCMark 10 - Score | |
| Apple MacBook Pro 15 2017 (2.9 GHz, 560) | |
| HP ZBook Studio G4-Y6K17EA | |
| PCMark 8 Home Score Accelerated v2 | 4093 points | |
| PCMark 8 Creative Score Accelerated v2 | 5487 points | |
| PCMark 8 Work Score Accelerated v2 | 4408 points | |
| PCMark 10 Score | 4323 points | |
Aide | ||
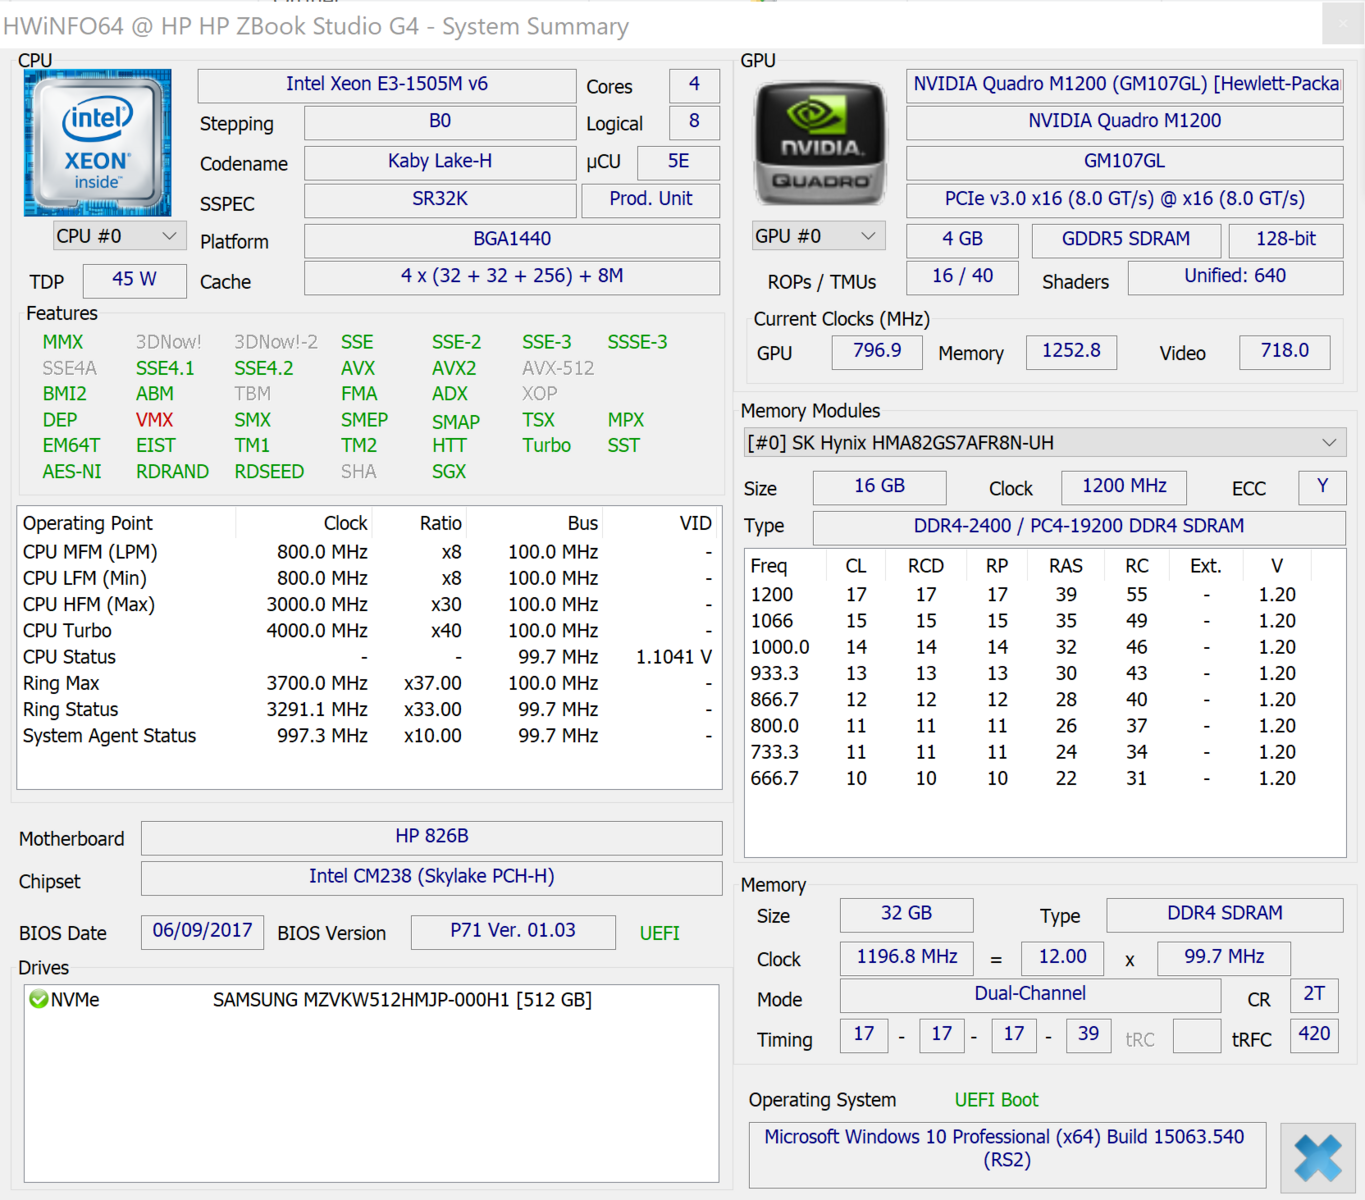
| HP ZBook Studio G4-Y6K17EA Samsung SM961 MZVKW512HMJP m.2 PCI-e | Dell Precision 5520 UHD Samsung SM961 MZVKW512HMJP m.2 PCI-e | Lenovo ThinkPad P51 20HH0016GE Samsung PM961 NVMe MZVLW512HMJP | Lenovo ThinkPad P51s 20HB000SGE Samsung SSD PM961 1TB M.2 PCIe 3.0 x4 NVMe (MZVLW1T0) | HP ZBook Studio G3 Samsung SM951 MZVPV512HDGL m.2 PCI-e | |
|---|---|---|---|---|---|
| AS SSD | 5% | -2% | -23% | -25% | |
| Score Total (Points) | 3693 | 3681 0% | 3424 -7% | 2771 -25% | 2367 -36% |
| Score Write (Points) | 1412 | 1379 -2% | 917 -35% | 1271 -10% | 470 -67% |
| Score Read (Points) | 1544 | 1554 1% | 1690 9% | 990 -36% | 1273 -18% |
| Access Time Write * (ms) | 0.026 | 0.023 12% | 0.025 4% | 0.027 -4% | 0.025 4% |
| Access Time Read * (ms) | 0.053 | 0.038 28% | 0.032 40% | 0.082 -55% | 0.046 13% |
| 4K-64 Write (MB/s) | 1108 | 1055 -5% | 623 -44% | 1018 -8% | 230.6 -79% |
| 4K-64 Read (MB/s) | 1213 | 1223 1% | 1372 13% | 792 -35% | 1050 -13% |
| 4K Write (MB/s) | 145.3 | 155.3 7% | 143.1 -2% | 130.8 -10% | 144.8 0% |
| 4K Read (MB/s) | 51.2 | 51.5 1% | 55.6 9% | 52.8 3% | 51.7 1% |
| Seq Write (MB/s) | 1588 | 1694 7% | 1506 -5% | 1217 -23% | 947 -40% |
| Seq Read (MB/s) | 2799 | 2799 0% | 2624 -6% | 1450 -48% | 1713 -39% |
* ... Moindre est la valeur, meilleures sont les performances

| 3DMark 11 - 1280x720 Performance GPU | |
| Lenovo ThinkPad P51 20HH0016GE | |
| HP ZBook Studio G4-Y6K17EA | |
| Apple MacBook Pro 15 2017 (2.9 GHz, 560) | |
| Lenovo ThinkPad P50 20ENV509PB | |
| Dell Precision 5520 UHD | |
| HP ZBook Studio G3 | |
| Dell Precision 3520 | |
| Lenovo ThinkPad P51s 20HB000SGE | |
| 3DMark - 1920x1080 Fire Strike Graphics | |
| Lenovo ThinkPad P51 20HH0016GE | |
| Lenovo ThinkPad P50 20ENV509PB | |
| Dell Precision 5520 UHD | |
| HP ZBook Studio G4-Y6K17EA | |
| Apple MacBook Pro 15 2017 (2.9 GHz, 560) | |
| HP ZBook Studio G3 | |
| Dell Precision 3520 | |
| Lenovo ThinkPad P51s 20HB000SGE | |
| Unigine Valley 1.0 | |
| 1920x1080 Extreme HD DirectX AA:x8 | |
| HP ZBook Studio G4-Y6K17EA | |
| Lenovo ThinkPad P51 20HH0016GE | |
| HP ZBook Studio G3 | |
| Apple MacBook Pro 15 2017 (2.9 GHz, 560) | |
| Dell Precision 3520 | |
| Lenovo ThinkPad P51s 20HB000SGE | |
| 1920x1080 Extreme HD Preset OpenGL AA:x8 | |
| Lenovo ThinkPad P51 20HH0016GE | |
| HP ZBook Studio G4-Y6K17EA | |
| HP ZBook Studio G3 | |
| Dell Precision 3520 | |
| Lenovo ThinkPad P51s 20HB000SGE | |
| Apple MacBook Pro 15 2017 (2.9 GHz, 560) | |
| 3DMark 11 Performance | 5516 points | |
| 3DMark Cloud Gate Standard Score | 17884 points | |
| 3DMark Fire Strike Score | 3878 points | |
Aide | ||
| Bas | Moyen | Élevé | Ultra | 4K | |
|---|---|---|---|---|---|
| BioShock Infinite (2013) | 224.7 | 130.8 | 113.1 | 42.61 | |
| Thief (2014) | 93.3 | 58.9 | 50.1 | 26.2 | |
| The Witcher 3 (2015) | 73.6 | 45.9 | 26.3 | 13 | |
| Rise of the Tomb Raider (2016) | 88.1 | 49.15 | 28.36 | 23.92 | 9.88 |
Degré de la nuisance sonore
| Au repos |
| 29.7 / 29.7 / 31.6 dB(A) |
| Fortement sollicité |
| 42.3 / 42.3 dB(A) |
 | ||
30 dB silencieux 40 dB(A) audible 50 dB(A) bruyant |
||
min: | ||
| HP ZBook Studio G4-Y6K17EA E3-1505M v6, Quadro M1200 | HP ZBook Studio G3 6820HQ, Quadro M1000M | Dell Precision 5520 UHD E3-1505M v6, Quadro M1200 | Apple MacBook Pro 15 2017 (2.9 GHz, 560) i7-7820HQ, Radeon Pro 560 | Lenovo ThinkPad P51 20HH0016GE E3-1505M v6, Quadro M2200 | Lenovo ThinkPad P51s 20HB000SGE i7-7600U, Quadro M520 | |
|---|---|---|---|---|---|---|
| Noise | -8% | -3% | 3% | 7% | 5% | |
| arrêt / environnement * (dB) | 29.4 | 30 -2% | 28.7 2% | 30.8 -5% | 29.6 -1% | 29.2 1% |
| Idle Minimum * (dB) | 29.7 | 30 -1% | 28.7 3% | 31 -4% | 29.6 -0% | 29.2 2% |
| Idle Average * (dB) | 29.7 | 30 -1% | 32.1 -8% | 31 -4% | 29.6 -0% | 29.2 2% |
| Idle Maximum * (dB) | 31.6 | 30 5% | 32.1 -2% | 31 2% | 29.6 6% | 31.1 2% |
| Load Average * (dB) | 42.3 | 51 -21% | 41.3 2% | 31.3 26% | 32.2 24% | 36.7 13% |
| Witcher 3 ultra * (dB) | 42.3 | 45.5 -8% | ||||
| Load Maximum * (dB) | 42.3 | 52.8 -25% | 45.5 -8% | 41.8 1% | 36.6 13% | 39.4 7% |
* ... Moindre est la valeur, meilleures sont les performances
(-) La température maximale du côté supérieur est de 46.3 °C / 115 F, par rapport à la moyenne de 38.2 °C / 101 F, allant de 22.2 à 69.8 °C pour la classe Workstation.
(-) Le fond chauffe jusqu'à un maximum de 55.4 °C / 132 F, contre une moyenne de 41.1 °C / 106 F
(+) En utilisation inactive, la température moyenne du côté supérieur est de 27.4 °C / 81 F, par rapport à la moyenne du dispositif de 32 °C / 90 F.
(-) En jouant à The Witcher 3, la température moyenne du côté supérieur est de 41.5 °C / 107 F, alors que la moyenne de l'appareil est de 32 °C / 90 F.
(±) Les repose-poignets et le pavé tactile peuvent devenir très chauds au toucher, avec un maximum de 37.7 °C / 99.9# F.
(-) La température moyenne de la zone de l'appui-paume de dispositifs similaires était de 27.8 °C / 82 F (-9.9 °C / #-17.9 F).
| Éteint/en veille | |
| Au repos | |
| Fortement sollicité |
|
Légende:
min: | |
| HP ZBook Studio G4-Y6K17EA E3-1505M v6, Quadro M1200, Samsung SM961 MZVKW512HMJP m.2 PCI-e, IPS, 3840x2160, 15.6" | Dell Precision 5520 UHD E3-1505M v6, Quadro M1200, Samsung SM961 MZVKW512HMJP m.2 PCI-e, IPS, 3840x2160, 15.6" | Apple MacBook Pro 15 2017 (2.9 GHz, 560) i7-7820HQ, Radeon Pro 560, , , 2880x1800, 15.4" | Lenovo ThinkPad P51 20HH0016GE E3-1505M v6, Quadro M2200, Samsung PM961 NVMe MZVLW512HMJP, IPS, 3840x2160, 15.6" | Lenovo ThinkPad P51s 20HB000SGE i7-7600U, Quadro M520, Samsung SSD PM961 1TB M.2 PCIe 3.0 x4 NVMe (MZVLW1T0), IPS, 3840x2160, 15.6" | HP ZBook Studio G3 6820HQ, Quadro M1000M, Samsung SM951 MZVPV512HDGL m.2 PCI-e, IPS, 3840x2160, 15.6" | |
|---|---|---|---|---|---|---|
| Power Consumption | 7% | 31% | 8% | 40% | 18% | |
| Idle Minimum * (Watt) | 12.6 | 8.9 29% | 3.7 71% | 8.6 32% | 5.8 54% | 8.7 31% |
| Idle Average * (Watt) | 17.1 | 13.6 20% | 16.2 5% | 15.9 7% | 10.4 39% | 14.2 17% |
| Idle Maximum * (Watt) | 19.3 | 14.1 27% | 18 7% | 22.1 -15% | 13.5 30% | 14.4 25% |
| Load Average * (Watt) | 88.3 | 100.3 -14% | 58.4 34% | 84.4 4% | 62.4 29% | 85.6 3% |
| Witcher 3 ultra * (Watt) | 74.8 | 100.2 -34% | ||||
| Load Maximum * (Watt) | 147.3 | 126.3 14% | 89.6 39% | 130.6 11% | 73.1 50% | 129.7 12% |
* ... Moindre est la valeur, meilleures sont les performances
| HP ZBook Studio G4-Y6K17EA E3-1505M v6, Quadro M1200, 64 Wh | Dell Precision 5520 UHD E3-1505M v6, Quadro M1200, 97 Wh | Apple MacBook Pro 15 2017 (2.9 GHz, 560) i7-7820HQ, Radeon Pro 560, Wh | Lenovo ThinkPad P51 20HH0016GE E3-1505M v6, Quadro M2200, 90 Wh | Lenovo ThinkPad P51s 20HB000SGE i7-7600U, Quadro M520, 104 Wh | HP ZBook Studio G3 6820HQ, Quadro M1000M, 64 Wh | |
|---|---|---|---|---|---|---|
| Autonomie de la batterie | 42% | 135% | 115% | 371% | 22% | |
| Reader / Idle (h) | 6.8 | 12.1 78% | 16.4 141% | 26.4 288% | 8.5 25% | |
| WiFi v1.3 (h) | 3.4 | 4.2 24% | 11.3 232% | 6.9 103% | 11.9 250% | 3.5 3% |
| Load (h) | 0.8 | 1 25% | 1.1 38% | 1.6 100% | 5.4 575% | 1.1 38% |
| H.264 (h) | 11.4 | 7.6 | 11.7 | 3.8 | ||
| Witcher 3 ultra (h) | 1.3 |
Points positifs
Points négatifs
Le ZBook Studio G4 - similaire aux autres stations de travail de HP - ne connaît qu’une mise à jour mineure cette année. Le châssis étant déjà très bon, ce n’est pas un problème. Au-delà des mises à jour des composants, le fabricant a également prix soin du plus gros problème du Studio G3, la température. Celles-ci étaient en effet en surface très élevées, mais nous sommes maintenant au niveau des autres portables fins. Cette amélioration est avant tout obtenue grâce à des limitations de performances, le CPU étant par défaut bridé à 35 W - niveau qui baisse même en cas de sollicitations soutenues. Le processeur mobile Xeon n’est donc pas le meilleur choix pour ce modèle, puisqu’il ne fait pas mieux que le populaire et plus abordable Core i7-7700HQ.
La gestion des ventilateurs a également été améliorée, et laisse une meilleure impression. L’écran DreamColor est très bon, mais ne parvient pas à nous convaincre dans tous les domaines. La seule différence avec l’écran UHD classique semble être la partie logicielle, mais qui désactive le GPU intégré. Cela affecte automatiquement la consommation et l’autonomie. Ne tenir que 3h30 dans notre test WLAN n’est pas bon pour un appareil mobile. Si vous ne souhaitez pas un châssis fin, vous pouvez vous orienter vers le grand frère ZBook 15 G4, plus gros et plus rapide.
HP améliore le ZBook Studio G4 sur des point importants, mais sacrifie les performances au profit de températures maîtrisées. L’autonomie est malheureusement décevante pour un appareil « élégant, fin et léger ».
Le Studio G4 reste un bon appareil, malgré les problèmes évoqués, tous les constructeurs ayant des difficultés avec les performances du système de refroidissement des machines fines. Le principal concurrent de Dell (le Precision 5520) n’a pas de problème en termes de mobilité, mais en possède d’autres. Nous pensons qu’une autre version du Studio G4 devrait être meilleure, celle équipée du Core i7, d’un écran UHD sans DreamColor mais avec Optimus).
L’intégralité de cette critique est disponible en anglais en suivant ce lien.
HP ZBook Studio G4-Y6K17EA
- 10/19/2017 v6 (old)
Andreas Osthoff, Mike Wobker
Price comparison
